Computational and genetic evidence that different structural conformations of a non-catalytic region...
9
Journal of Experimental Botany, Vol. 65, No. 22 pp. 6645–6653, 2014 doi:10.1093/jxb/eru383 Advance Access publication 26 September, 2014 v This paper is available online free of all access charges (see http://jxb.oxfordjournals.org/open_access.html for further details) RESEARCH PAPER Computational and genetic evidence that different structural conformations of a non-catalytic region affect the function of plant cellulose synthase Erin Slabaugh 1, *, Latsavongsakda Sethaphong 2, *, Chaowen Xiao 3 , Joshua Amick 2 , Charles T. Anderson 3 , Candace H. Haigler 1,† and Yaroslava G. Yingling 2,† 1 Department of Crop Science and Department of Plant and Microbial Biology, North Carolina State University, Raleigh, NC 27695, USA 2 Department of Materials Science and Engineering, North Carolina State University, Raleigh, NC 27695, USA 3 Department of Biology, the Pennsylvania State University, University Park, PA 16802, USA * These authors contributed equally to this manuscript. † To whom correspondence should be addressed. E-mail: [email protected] (for computational aspects); candace_haigler@ncsu. edu (for plant biology aspects) Received 15 April 2014; Revised 19 August 2014; Accepted 26 August 2014 Abstract The β-1,4-glucan chains comprising cellulose are synthesized by cellulose synthases in the plasma membranes of diverse organisms including bacteria and plants. Understanding structure–function relationships in the plant enzymes involved in cellulose synthesis (CESAs) is important because cellulose is the most abundant component in the plant cell wall, a key renewable biomaterial. Here, we explored the structure and function of the region encompassing transmembrane helices (TMHs) 5 and 6 in CESA using computational and genetic tools. Ab initio computational struc- ture prediction revealed novel bi-modal structural conformations of the region between TMH5 and 6 that may affect CESA function. Here we present our computational findings on this region in three CESAs of Arabidopsis thaliana (AtCESA1, 3, and 6), the Atcesa3 ixr1-2 mutant, and a novel missense mutation in AtCESA1. A newly engineered point mutation in AtCESA1 (Atcesa1 F954L ) that altered the structural conformation in silico resulted in a protein that was not fully functional in the temperature-sensitive Atcesa1 rsw1-1 mutant at the restrictive temperature. The combination of computational and genetic results provides evidence that the ability of the TMH5–6 region to adopt specific structural conformations is important for CESA function. Key words: Cellulose biosynthesis, CESA, genetic complementation, protein structural modelling, rsw1 mutant, transmembrane helix. Introduction Cellulose is an essential structural component of plant cell walls, which are renewable biomaterials used in the manufac- ture of many products. Cellulose is produced by land plants, as well as by some algae, bacteria, tunicates, and protists. Cellulose is a linear polysaccharide composed of β-1,4 linked glucan chains that are synthesized by cellulose synthases, called CESAs in plants. In plants, multiple β-1,4 linked glucan chains coalesce into microfibrils, which are then incorporated into the cell wall. Cellulose synthases are membrane-bound inverting glycosyltransferases within glycosyltransferase This is an Open Access article distributed under the terms of the Creative Commons Attribution License (http://creativecommons.org/licenses/by/3.0/), which permits unrestricted reuse, distribution, and reproduction in any medium, provided the original work is properly cited. © The Author 2014. Published by Oxford University Press on behalf of the Society for Experimental Biology. Abbreviations: AIB, aminoisobutyric acid; bc11, brittle culm11; BcsA/B, bacterial cellulose synthaseA/B; CARMSD, C-alpha root-mean-square deviation; c-di-GMP, cyclic-di-GMP; CDS, coding sequence; CESA, cellulose synthase; CSC, cellulose synthesis complex; DCB, 2,6-dichlorobenzonitrile; GT-2, Glycosyltransferase Family 2; IF, interfacial helix; ixr1-2, isoxaben resistant1-2; mre1, multiple response expansion1; REU, ROSETTA energy units; rsw1-1, radial swelling1-1; TMH, transmembrane helix; YFP, yellow fluorescent protein.
Transcript of Computational and genetic evidence that different structural conformations of a non-catalytic region...
Journal of Experimental Botany, Vol. 65, No. 22 pp. 6645–6653, 2014doi:10.1093/jxb/eru383 Advance Access publication 26 September, 2014
vThis paper is available online free of all access charges (see http://jxb.oxfordjournals.org/open_access.html for further details)
ReseaRch PaPeR
Computational and genetic evidence that different structural conformations of a non-catalytic region affect the function of plant cellulose synthase
Erin Slabaugh1,*, Latsavongsakda Sethaphong2,*, Chaowen Xiao3, Joshua Amick2, Charles T. Anderson3, Candace H. Haigler1,† and Yaroslava G. Yingling2,†
1 Department of Crop Science and Department of Plant and Microbial Biology, North Carolina State University, Raleigh, NC 27695, USA2 Department of Materials Science and Engineering, North Carolina State University, Raleigh, NC 27695, USA3 Department of Biology, the Pennsylvania State University, University Park, PA 16802, USA
* These authors contributed equally to this manuscript.† To whom correspondence should be addressed. E-mail: [email protected] (for computational aspects); [email protected] (for plant biology aspects)
Received 15 April 2014; Revised 19 August 2014; Accepted 26 August 2014
Abstract
The β-1,4-glucan chains comprising cellulose are synthesized by cellulose synthases in the plasma membranes of diverse organisms including bacteria and plants. Understanding structure–function relationships in the plant enzymes involved in cellulose synthesis (CESAs) is important because cellulose is the most abundant component in the plant cell wall, a key renewable biomaterial. Here, we explored the structure and function of the region encompassing transmembrane helices (TMHs) 5 and 6 in CESA using computational and genetic tools. Ab initio computational struc-ture prediction revealed novel bi-modal structural conformations of the region between TMH5 and 6 that may affect CESA function. Here we present our computational findings on this region in three CESAs of Arabidopsis thaliana (AtCESA1, 3, and 6), the Atcesa3ixr1-2 mutant, and a novel missense mutation in AtCESA1. A newly engineered point mutation in AtCESA1 (Atcesa1F954L) that altered the structural conformation in silico resulted in a protein that was not fully functional in the temperature-sensitive Atcesa1rsw1-1 mutant at the restrictive temperature. The combination of computational and genetic results provides evidence that the ability of the TMH5–6 region to adopt specific structural conformations is important for CESA function.
Key words: Cellulose biosynthesis, CESA, genetic complementation, protein structural modelling, rsw1 mutant, transmembrane helix.
Introduction
Cellulose is an essential structural component of plant cell walls, which are renewable biomaterials used in the manufac-ture of many products. Cellulose is produced by land plants, as well as by some algae, bacteria, tunicates, and protists. Cellulose is a linear polysaccharide composed of β-1,4 linked
glucan chains that are synthesized by cellulose synthases, called CESAs in plants. In plants, multiple β-1,4 linked glucan chains coalesce into microfibrils, which are then incorporated into the cell wall. Cellulose synthases are membrane-bound inverting glycosyltransferases within glycosyltransferase
This is an Open Access article distributed under the terms of the Creative Commons Attribution License (http://creativecommons.org/licenses/by/3.0/), which permits unrestricted reuse, distribution, and reproduction in any medium, provided the original work is properly cited.
© The Author 2014. Published by Oxford University Press on behalf of the Society for Experimental Biology.
Abbreviations: AIB, aminoisobutyric acid; bc11, brittle culm11; BcsA/B, bacterial cellulose synthaseA/B; CARMSD, C-alpha root-mean-square deviation; c-di-GMP, cyclic-di-GMP; CDS, coding sequence; CESA, cellulose synthase; CSC, cellulose synthesis complex; DCB, 2,6-dichlorobenzonitrile; GT-2, Glycosyltransferase Family 2; IF, interfacial helix; ixr1-2, isoxaben resistant1-2; mre1, multiple response expansion1; REU, ROSETTA energy units; rsw1-1, radial swelling1-1; TMH, transmembrane helix; YFP, yellow fluorescent protein.
6646 | Slabaugh et al.
family 2 (GT-2) (Cantarel et al., 2009), and they contain a conserved GT-A fold (Charnock and Davies, 1999). In both plants and bacteria, the β-1,4 linked glucan must be trans-ported outside the cell (Valla et al., 2009; Saxena and Brown, 2012), a process that remains poorly understood in plants.
Seed plants contain a CESA protein family with six dis-tinct types of isoforms, including three required for the syn-thesis of each of the major types of cell walls. For example, in the model plant Arabidopsis thaliana, AtCESA1, 3, and 6 are associated with cellulose synthesis in expanding primary walls, whereas AtCESA4, 7, and 8 participate in secondary wall formation (Desprez et al., 2007; Persson et al., 2007; Tanaka et al., 2003). In each case, the three CESA isoforms are integrated into a cellulose synthesis complex (CSC) that moves in the plane of the plasma membrane as cellulose fibrils are formed (Paredez et al., 2006; Endler and Persson, 2011).
Although no plant CESA has been crystallized, a com-putational model was generated of the cytosolic domain of GhCESA1 from cotton (Sethaphong et al., 2013). This pre-dicted structure contains a GT-A fold similar to the one in the recently solved crystal structure of BcsA/B from Rhodobacter sphaeroides (Morgan et al., 2013). These new cellulose syn-thase structures have allowed insights into possible mechanis-tic effects of CESA missense mutations (Morgan et al., 2013; Sethaphong et al., 2013; Slabaugh et al., 2013) and may ena-ble structurally informed engineering of cellulose synthase function.
As determined from the recently solved crystal structure of BcsA/B from Rhodobacter sphaeroides, the BcsA cellu-lose synthase contains eight transmembrane helices (TMH) and a large cytosolic domain located between TMH4 and 5 (Morgan et al., 2013). The BcsA/B heterodimer was co-crys-tallized with a putative short glucan chain bound within a central pore formed by TMH3-8 of BcsA, showing that BcsA synthesizes β-1,4 linked glucan while simultaneously trans-porting it across the membrane (Morgan et al., 2013).
Despite similarities in the structure and function of plant CESAs and bacterial BcsA, there are substantial differences between the proteins. For example, only CESA contains an N-terminal zinc finger domain and two ~125 amino acid insertions in the cytosolic domain (Pear et al., 1996), whereas only BcsA contains a C-terminal PilZ domain that is regu-lated by cyclic-di-GMP (c-di-GMP) (Morgan et al., 2013). In addition, the predicted membrane topology of plant CESAs is not consistent with BcsA. Similar to BcsA, plant CESAs are predicted to contain eight TMHs (Fig. 1A) (Jones 1999; Schwacke et al., 2003; Viklund and Elofsson, 2008). However, the catalytically active cytosolic domain lies between TMH2 and 3 of CESAs and between TMH4 and 5 of BcsA (Morgan et al., 2013; Sethaphong et al., 2013). Additionally, BcsA con-tains a cytosolic interfacial helix (IF3) between TMH6 and 7, which is not predicted in plant CESAs by membrane topol-ogy prediction algorithms.
Mutational evidence has been used to argue for a role of the plant transmembrane region, inclusive of TMH5 and 6, in the organization of the nascent cellulose fibril (Harris et al., 2012) or proper CESA trafficking (Zhang et al., 2009). Although we do not know its topology, three missense
mutations in the TMH5–6 region of CESA (Fig. 1A, B) imply that it is functionally important for plant cellulose synthesis. The mre1 mutation is a G916E substitution within TMH5 of AtCESA3 that results in sensitivity to an ethylene inhibitor (aminoisobutyric acid, AIB), an expanded root when grown on high sucrose medium, slightly reduced growth of the rosette and inflorescence stem, and short roots with reduced cellulose (Pysh et al., 2012). The bc11 mutation is a G858R mutation in OsCESA4 (homologous to AtCESA8) that results in a brittle culm, dwarfing, increased arabinoxy-lan to compensate for reduced cellulose, and resistance to a cellulose-synthesis inhibitor (2,6-dichlorobenzonitrile, DCB) (Zhang et al., 2009). The ixr1-2 mutation, which is a T942I substitution in CESA3, results in resistance to the cellulose-synthesis inhibitor isoxaben, reduced cellulose microfibril crystallinity, and increased CESA velocity at the plasma membrane (Scheible et al., 2001; Harris et al 2012).
Despite evidence for the functional importance of the TMH5–6 region in CESA, there was previously no mecha-nistic insight into how the existing missense mutations exert their effects. Here we report a combined computational and genetic approach to obtain more insights into structure–func-tion relationships in the TMH5–6 region. We generated ab initio computational models of the TMH5–6 region in wild-type and mutant Arabidopsis CESAs. Based on in silico evi-dence of two potential conformations for the linker between TMH5 and 6, we engineered a novel missense mutation in AtCESA1 that altered the energy barrier between the two different structural conformations and assessed its effect on CESA function through phenotypic complementation of the temperature-sensitive rsw1-1 mutation in AtCESA1 (Atcesa1rsw1), which causes short roots when plants are grown at the restrictive temperature (Arioli et al., 1998). Taken together, these data provide evidence that CESA function is influenced by the ability of the amino acids between TMH5 and 6 to adopt specific conformational states.
Materials and methods
Simulations and modellingSecondary structure predictions were generated using Psipred (Jones, 1999) and the topology prediction of the TMH region was obtained with the OCTOPUS software utility (Viklund and Elofsson, 2008). Lipophilicity scoring was used to further constrain the predictions (Yarov-Yarovoy et al., 2006), and additional constraints for Rosetta were obtained from the JUFO utility (Meiler and Baker, 2003). Starting coordinates of the amino acid sequence in linear form were generated using the tleap utility of the molecular dynamics software suite AMBER. An in-house script cleaned the resulting coordinate file to be compatible with ROSETTA atom naming conventions.
Three-dimensional structural decoys of the TMH5–6 regions of native and mutant CESAs were generated using the membrane pro-tein folding algorithm of ROSETTA (ver 3.4) (Yarov-Yarovoy et al., 2006) (see Supplementary Table S1 for details). The ROSETTA frag-ment library database used was generated using the 2010 NCBI non-redundant protein database. Optimal structures were relaxed using the ROSETTA ab initio relax method under a weak constraint. As the decoys resulting from production runs did not form a clear fold-ing plot that converged on a low-REU decoy, clustering analysis was employed to select decoys predicted to be near-native (energetically stable) structures. The Durandal algorithm and maximum-entropy
Structural conformations of a non-catalytic region affect CESA function | 6647
based clustering of the top ten percent best scoring decoys were used for the selection of model structures (Berenger et al., 2012).
Origin (OriginLab, Northampton, MA) or Tecplot (Tecplot Inc., Bellevue, WA) were used to generate the folding plots and PyMOL (The PyMOL Molecular Graphics System, Version 1.2r3pre, Schrödinger, LLC) and Discovery Studio (Accelrys Software Inc., San Diego, CA) were used to view and render protein structures. Additional folding plots were generated using a custom shell script and the Durandal software utility that calculated the C-alpha root-mean-square deviation (CARMSD) between all generated decoys against the best scoring structure. ROSETTA does have a scoring utility, but it is significantly slower than Durandal. To obtain decoy densities, frequency counts needed for heatmaps were generated
by binning in areas of 0.5 REU by 1 Å CARMSD. Structures of the region of BcsA corresponding to the TMH5–6 region of plant CESA were taken from the crystal structure (PDB ID: 4HG6) and rendered with PyMOL. A custom batch script that leveraged local installations of all the required utilities and topology prediction engines except for JUFO was created to accomplish this process of linear sequence to initial analysis and automated structure selection.
Molecular cloning and Arabidopsis transformationThe coding sequence (CDS) of CESA1 was obtained from TAIR (www.Arabidopsis.org). Site-directed mutagenesis was performed using overlap PCR to generate the F954L mutation. Primer sequences
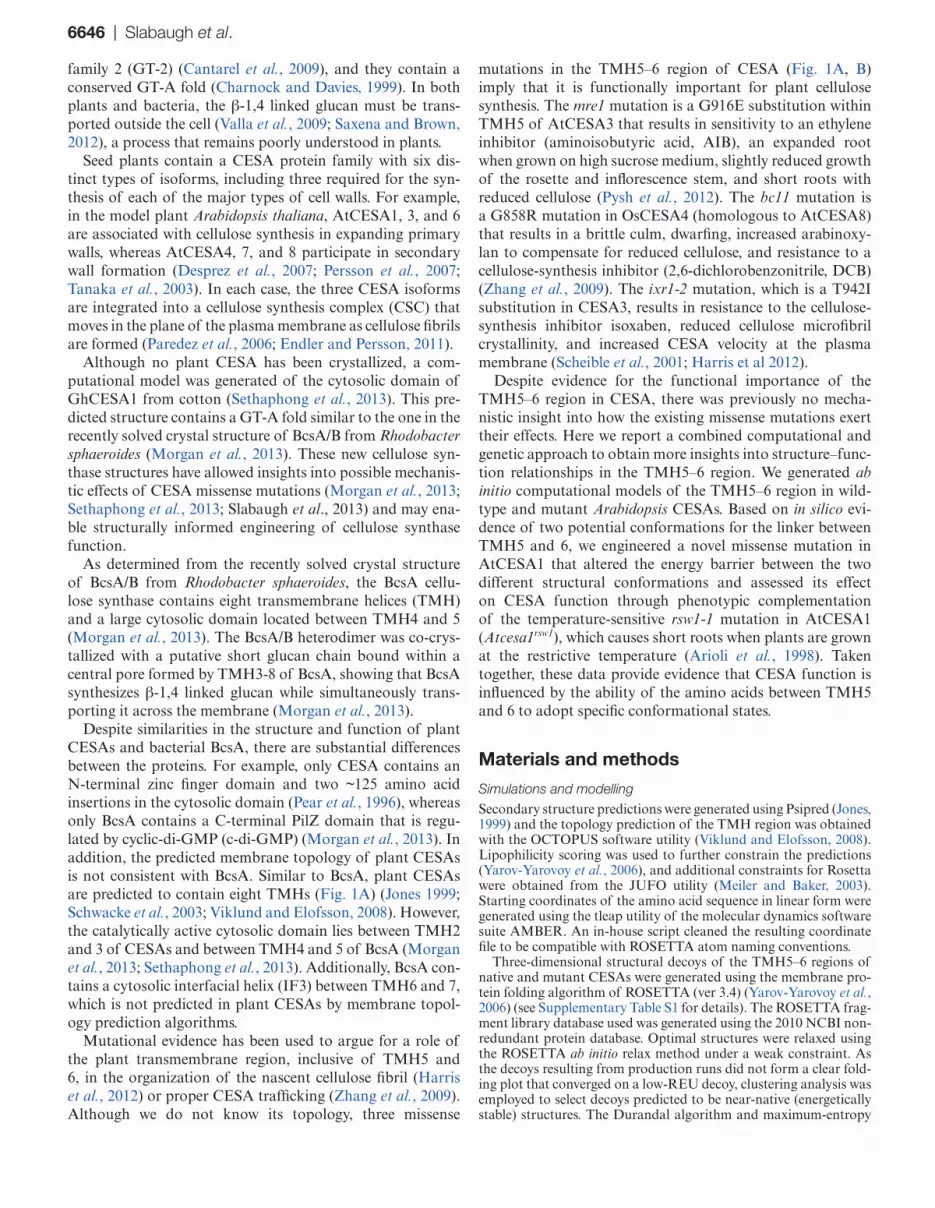
Fig. 1. Schematic of the predicted topology of plant CESAs and protein sequence alignment of the computationally modelled region. (A) Plants CESAs are predicted to have eight transmembrane helices (TMHs) with the cytosolic domain between TMH2 and 3, which contains the active site. The TMH5–6 region, which was modelled, is shown within the black box, including the two TMHs and the amino acids between them. Missense mutations within this region are highlighted with arrows. bc=brittle culm, ixr=isoxaben resistant, mre=multiple response expansion. (B) Protein sequence alignment of the modelled TMH5–6 region of AtCESA1, 3, 6 and BcsA is shown, along with homologous sequences of AtCESA2, 4, 5, 7, 8, and 9. Orange circles indicate the mre1, F954L, and ixr1-2 missense mutations. Blue shading indicates TMHs and green shading represents IF3 in BcsA. (C) A snapshot of GhCESA1 coloured to represent protein sequence conservation based on results from a BLAST search of amino acids 820–890. Blue indicates 100% sequence conservation, white indicates 72% conservation, and red indicates 30% sequence conservation. The snapshot was generated using Chimera software (Pettersen et al., 2004). For a list of protein sequences used to create this snapshot, please see Supplementary Table S2.

6648 | Slabaugh et al.
for mutagenesis that contained a TTC to TTG mutation were: for-ward primer: GGT ATC GAC ACC AAC TTG ACC GTT ACA TC; reverse primer: GAT GTA ACG GTC AAG TTG GTG TCG ATA CC. Foreign gene expression was driven by the native promoter of CESA1. The native promoter sequence, including the 5′ UTR and 1 kb of upstream sequence, was obtained from PlantPromoterDb (http://ppdb.agr.gifu-u.ac.jp/ppdb/cgi-bin/index.cgi). The native promoters and CDSs were cloned into the pFGC5941 binary vector (TAIR: CD3-447), using restriction digest with StuI/XhoI to insert the promoter and AscI/SwaI to insert the CDS. The cauliflower mosaic virus 35S promoter was removed from pFGC5941 using StuI/Xho1 sites. Constructs were transformed into Agrobacterium tumefa-ciens strain GV3101. Stable transformation of Arabidopsis was car-ried out using the floral dip method (Clough and Bent, 1998).
Plant materials and growth conditionsArabidopsis seeds were surfaced sterilized by washing for 30 s each with 10% bleach, twice in sterile water, 70% ethanol, then twice in sterile water. Seeds were completely dried on filter paper and vernalized for at least 24 h at 4 °C before plating on half-strength Murashige and Skoog medium with 1% (w/v) sucrose and 0.4% (w/v) PhytagelTM (Sigma Aldrich; St. Louis, MO). Arabidopsis plants were grown at 23 °C in a 16 h photoperiod under illumination of 100 µmol m–2 s–1 at 50% relative humidity.
Phenotyping Atcesa1rsw1 and Atcesa6prc1 Atcesa1rsw1 YFP–CESA6 linesSeeds were grown on vertical plates at 23 °C (permissive tempera-ture) for 5 d, then transferred to 31 °C (restrictive temperature) for an additional 7 d. Seedlings were grown under continuous light of approximately 100 µmol m–2 s–1 and 50% relative humidity. Primary roots were photographed then analysed using ImageJ (http://rsbweb.nih.gov/ij/). The means for root length were derived from measure-ments of 10–30 individual seedlings per line from at least two inde-pendent experiments.
Confocal microscopyAtcesa6prc1 Atcesa1rsw1 YFP–CESA6 and Atcesa6prc1 Atcesa1rsw1 YFP–CESA6 Atcesa1F954L seeds were surface-sterilized in 30% bleach + 0.1% (w/v) SDS for 20 min, washed four times with sterile water, stored at 4 °C for 2 d, and sown on half-strength Murashige and Skoog medium without sucrose. Plates were exposed to light for 2 h to stimulate germi-nation, then wrapped in two layers of aluminium foil and grown verti-cally for 3 d at 22 °C. For restrictive temperature treatment, plates with three-day-old etiolated seedlings were transferred to a 29 °C incubator for 24 h. For all genotypes, YFP fluorescence was detected in hypocotyl cells just below the apical hook using a 100 mW 488 nm excitation laser at 30% power and a 525/50 nm emission filter on a Zeiss Observer SD spinning disk confocal microscope with a ×100 1.40 NA oil-immer-sion objective and a Photometrics QuantEM 512SC camera (expo-sure time=400 ms, EM gain=1000, readout gain=1). YFP–CESA6 particle density for z series was quantified computationally using the Spot Detection function of Imaris (Bitplane) (Chen et al., 2010). For fluorescence intensity measurements, z series were opened in ImageJ, extraneous z slices were removed using the Substack Maker plugin, maximum projections were generated and background subtracted using a sliding paraboloid radius of 10 pixels, and Integrated Density for the entire image was measured.
Results
Computational modelling of TMH5–6 in Arabidopsis CESA1, 3, and 6
Protein sequence alignment of the region between TMH5–6 indicated high conservation in length, hydrophobicity, and
acidity (Fig. 1B, C and Supplementary Table S2); TMH5–6 is the longest predicted TMH linker (27–29 amino acids) found among CESAs and is predicted to localize to the apoplast in the conventional eight TMH model (Fig. 1A). The hydropho-bic segment of the linker is well-conserved, but the acidic side is less so, owing to aspartic acid substitution for glutamic acid (Fig. 1B).
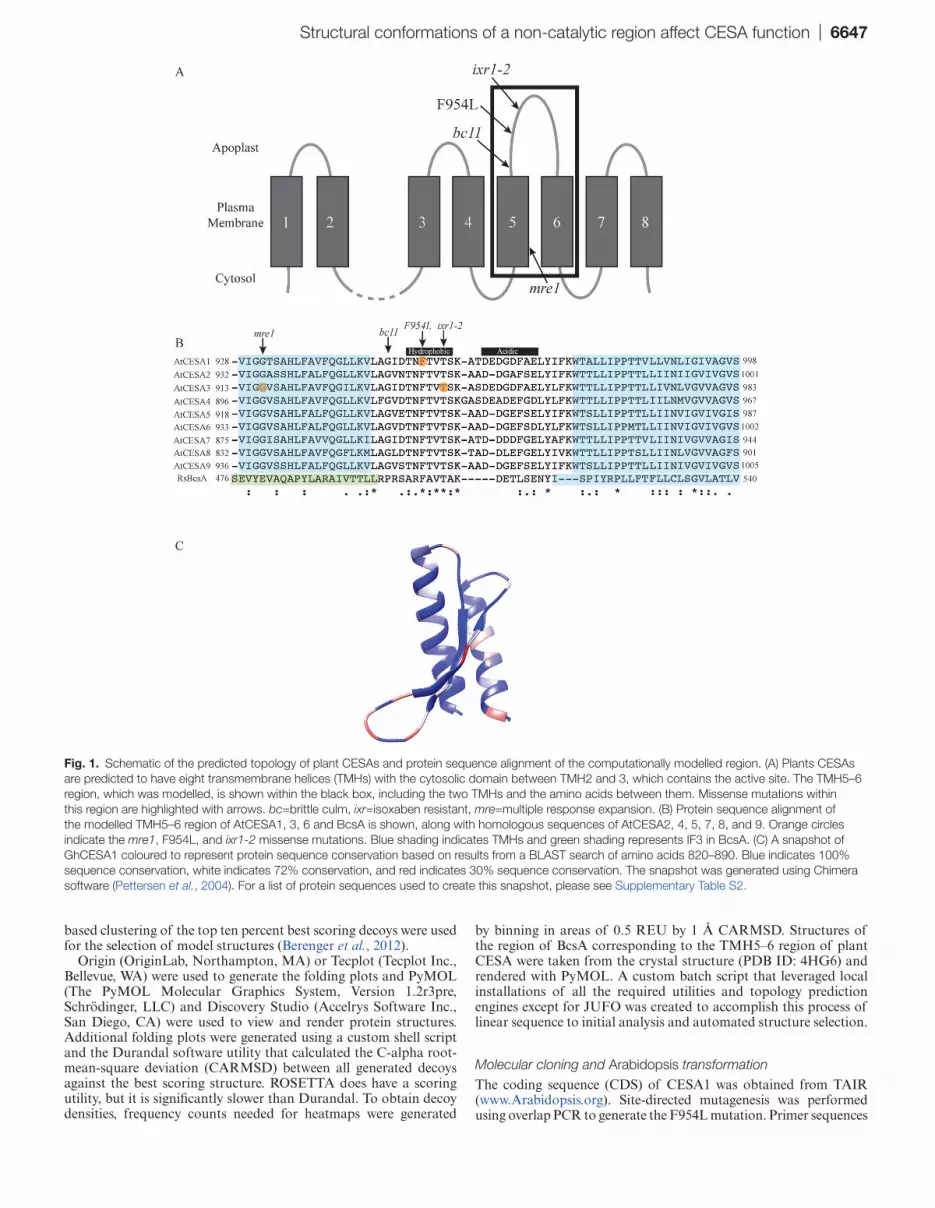
Ab initio computational models of the region encompass-ing TMH5–6 (Fig. 1A) of CESAs from Arabidopsis (Fig. 2) were generated using ROSETTA (Yarov-Yarovoy et al., 2006; Vinothkumar and Henderson, 2010). The largest population of atomistic model structures, known as decoys, were scored as lower than zero Rosetta Energy Units (REU), which corre-sponds to 0.5 kcal mol–1 Gibb’s free energy, indicating allowa-ble energetics for the modelled structures (Das, 2011). Folding plots of the decoys were generated by plotting REU against the conformational space in C-alpha root-mean-square devi-ation (CARMSD) in angstroms (Å). The biphasic nature of the folding plots (Supplementary Fig. S1) suggests that the TMH5–6 linker exhibits conformational entropy (Arkun and Erman, 2010) within which two structures may dominate: (i) an extended conformation (called hereafter the “up” confor-mation); or (ii) a β-hairpin structure parallel to the helical axes of TMH5 and 6 (called hereafter the “down” conforma-tion) (Fig. 2). Given the small energy barrier between these two conformations (approximately 10 kcal mol–1), the linker might adopt either conformation in vivo. Although folding only two of the eight predicted TMHs presents an undercon-strained problem, the small energy difference between the “up” and “down” conformations suggests that there may be a binary state for this region.
To validate our ab initio method, we generated a compu-tational model of the region between IF3 and TMH7 from BcsA and compared it to the published crystal structure (Morgan et al. 2013). This region in BscA (Supplementary Fig. S2A) functions as a gating loop that regulates substrate access into the active site (Morgan et al., 2014). The com-putational model of amino acids 476–540 of BcsA showed a pair of helices and a long coil (Supplementary Fig. S2B, C). Structural alignment showed that the model was similar to the crystal structure (Supplementary Fig. S2D). However, the model of the IF3–TMH7 region of BcsA did not show a biphasic folding plot (Supplementary Fig. S3), as was observed for wild-type AtCESA1, 3, and 6.
Computational modelling of TMH5–6 containing the Atcesa3ixr1-2 and Atcesa1F954L mutations
To explore how missense mutations between TMH5 and 6 may affect CESA function, we compared structural models and folding plots of mutants with those of wild type. Any altered distribution of decoys within the folding plots cor-relates with a possibility that the preferred structural confor-mation of the mutant protein is altered relative to wild-type. Computational models of a CESA3 TMH5–6 region con-taining the T942I (ixr1-2) missense mutation (Scheible et al., 2001) (Fig. 2) showed a biphasic folding plot similar to wild type (Supplementary Fig. S1), suggesting that this muta-tion does not alter the occurrence of two distinct structural
Structural conformations of a non-catalytic region affect CESA function | 6649
conformations. However, more decoys in the largest cluster are located in the region that corresponds to the “up” con-formation compared with wild-type AtCESA3, suggesting that the T942I mutation promotes the “up” conformation (Supplementary Fig. S1). Possibly, this structural change hin-ders interaction with the isoxaben herbicide as well as altering AtCESA3 function in a way that ultimately reduces cellulose crystallinity (Harris et al., 2012).
The F954 residue is highly conserved among plant and bacterial cellulose synthases (Fig. 1B) and is likely to be important for CESA function. To test a potentially more marked alteration of the structure of the TMH5–6 region, we generated a F954L missense mutation in AtCESA1 that replaced the native hydrophobic phenylalanine residue with the smaller hydrophobic leucine residue. The F954L muta-tion changed the predicted structure of the linker between TMH5 and 6 (Fig. 2) and eliminated the bimodal distribution in the computational folding plot (Supplementary Fig. S1). The mutation also resulted in a redistribution of decoys in the largest cluster that favours structures in the “down” confor-mation, compared with wild-type AtCESA1 (Supplementary Fig. S1).
The Atcesa1F954L mutant protein is non-functional in Arabidopsis
To test whether the F954L mutation affects CESA1 func-tion in vivo, we generated stable Arabidopsis transformants in the Atcesa1rsw1 and Atcesa6prc1 Atcesa1rsw1 YFP–CESA6 backgrounds. The rsw1-1 mutant is characterized by an A549V substitution in CESA1. The Atcesa6prc1 Atcesa1rsw1 YFP–CESA6 line also contains the rsw1-1 allele, but the
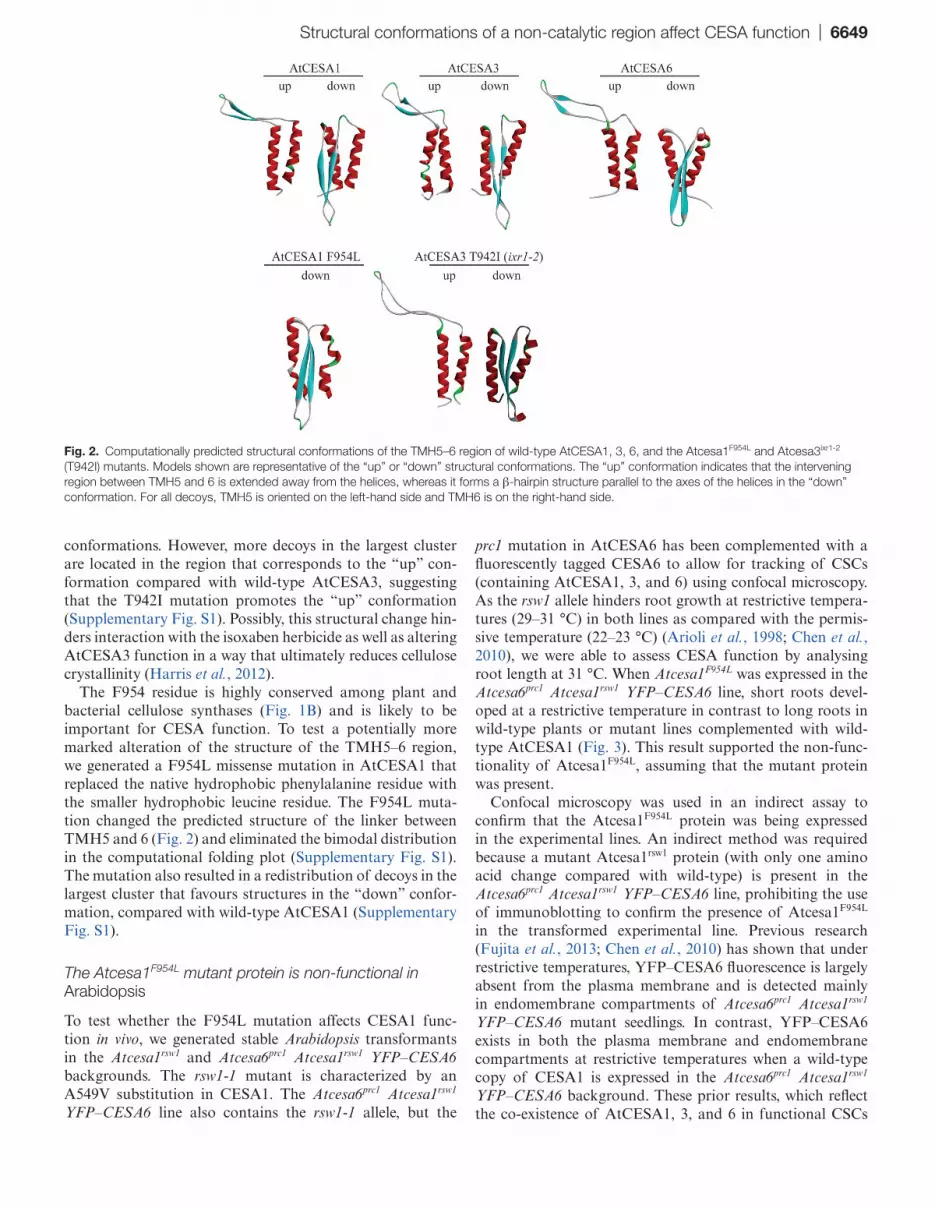
prc1 mutation in AtCESA6 has been complemented with a fluorescently tagged CESA6 to allow for tracking of CSCs (containing AtCESA1, 3, and 6) using confocal microscopy. As the rsw1 allele hinders root growth at restrictive tempera-tures (29–31 °C) in both lines as compared with the permis-sive temperature (22–23 °C) (Arioli et al., 1998; Chen et al., 2010), we were able to assess CESA function by analysing root length at 31 °C. When Atcesa1F954L was expressed in the Atcesa6prc1 Atcesa1rsw1 YFP–CESA6 line, short roots devel-oped at a restrictive temperature in contrast to long roots in wild-type plants or mutant lines complemented with wild-type AtCESA1 (Fig. 3). This result supported the non-func-tionality of Atcesa1F954L, assuming that the mutant protein was present.
Confocal microscopy was used in an indirect assay to confirm that the Atcesa1F954L protein was being expressed in the experimental lines. An indirect method was required because a mutant Atcesa1rsw1 protein (with only one amino acid change compared with wild-type) is present in the Atcesa6prc1 Atcesa1rsw1 YFP–CESA6 line, prohibiting the use of immunoblotting to confirm the presence of Atcesa1F954L in the transformed experimental line. Previous research (Fujita et al., 2013; Chen et al., 2010) has shown that under restrictive temperatures, YFP–CESA6 fluorescence is largely absent from the plasma membrane and is detected mainly in endomembrane compartments of Atcesa6prc1 Atcesa1rsw1 YFP–CESA6 mutant seedlings. In contrast, YFP–CESA6 exists in both the plasma membrane and endomembrane compartments at restrictive temperatures when a wild-type copy of CESA1 is expressed in the Atcesa6prc1 Atcesa1rsw1 YFP–CESA6 background. These prior results, which reflect the co-existence of AtCESA1, 3, and 6 in functional CSCs
Fig. 2. Computationally predicted structural conformations of the TMH5–6 region of wild-type AtCESA1, 3, 6, and the Atcesa1F954L and Atcesa3ixr1-2 (T942I) mutants. Models shown are representative of the “up” or “down” structural conformations. The “up” conformation indicates that the intervening region between TMH5 and 6 is extended away from the helices, whereas it forms a β-hairpin structure parallel to the axes of the helices in the “down” conformation. For all decoys, TMH5 is oriented on the left-hand side and TMH6 is on the right-hand side.
6650 | Slabaugh et al.
in the plasma membrane, are diagrammed in Supplementary Fig. S4 to aid the interpretation of our results on expression of the Atcesa1F954L mutant allele.
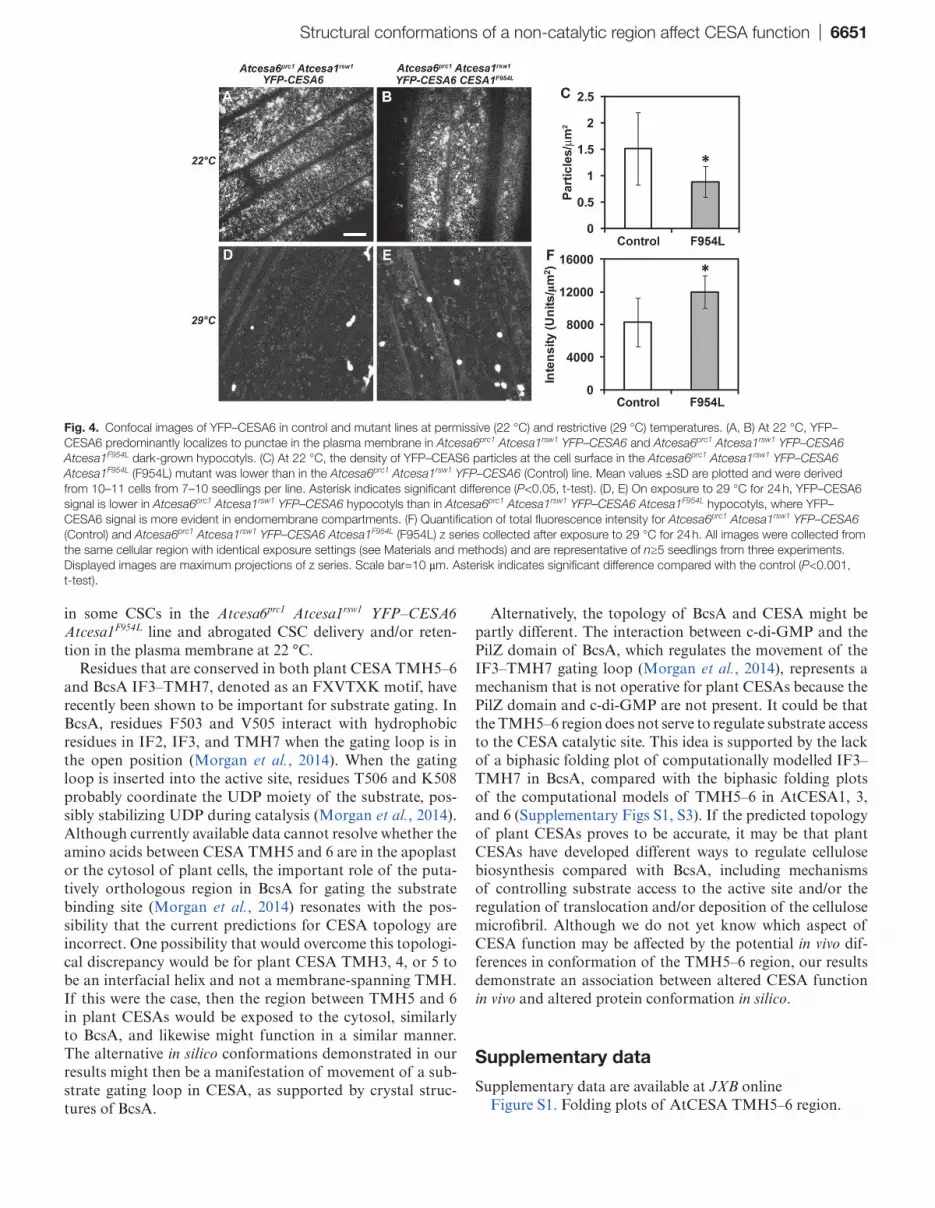
At the permissive temperature (22 °C), we observed small punctate structures in the plasma membrane of both Atcesa6prc1 Atcesa1rsw1 YFP–CESA6 and Atcesa6prc1 Atcesa1rsw1 YFP–CESA6 Atcesa1F954L lines (Fig. 4A, B). These typical results for imaging active CESAs in the plasma membrane (Paredez et al., 2006) occurred despite the expres-sion of the potentially disruptive Atcesa1F954L mutant because the rsw1 allele supports normal CESA function at 22 °C (Arioli et al., 1998; Chen et al., 2010). We also noted that the density of plasma membrane-associated YFP–CESA6 parti-cles in Atcesa6prc1 Atcesa1rsw1 YFP–CESA6 Atcesa1F954L was lower than in the Atcesa6prc1 Atcesa1rsw1 YFP–CESA6 con-trol line at 22 °C (Fig. 4C), a result that is consistent with impaired functionality of Atcesa1F954L (see Discussion). At the restrictive temperature (29 °C), YFP–CESA6 was almost entirely absent from the plasma membrane in the Atcesa6prc1 Atcesa1rsw1 YFP–CESA6 line (Fig. 4D), as expected. When Atcesa1F954L was expressed in the Atcesa6prc1 Atcesa1rsw1 YFP–CESA6 Atcesa1F954L line, the total YFP–CESA6 sig-nal was significantly stronger at 29 °C as compared with the Atcesa6prc1 Atcesa1rsw1 YFP–CESA6 control line (Fig. 4D–F), but was observed mainly in endomembrane compartments in both lines (Fig. 4D, E). These results are consistent with both
the presence and abnormal function of mutant Atcesa1F954L (see Discussion).
Discussion
The results reported here provide computational and genetic evidence that the structural conformation of the amino acids between TMH5 and 6 affects CESA function. The novel F954L mutation prevents the formation of the extended “up” conformation in silico and hinders normal cellulose synthesis in vivo as indicated by short roots at the restrictive tempera-ture of two independent Arabidopsis Atcesa6prc1 Atcesa1rsw1 YFP–CESA6 Atcesa1F954L lines. As the rsw1 allele is a mis-sense mutation and not a null, confocal microscopy was used to demonstrate that the Atcesa1F954L protein was present in the Atcesa6prc1 Atcesa1rsw1 YFP–CESA6 background even though the rsw1 short root phenotype was not rescued. In this case, YFP–CESA6 is used as an indicator of CSCs that must also contain AtCESA1 owing to the non-redundant function and close interactions in the plasma membrane of AtCESA1, 3, and 6 during primary wall cellulose synthesis in growing hypocotyls (Lei et al., 2012).
Conveniently, the rsw1 allele acts as an effective null at the restrictive temperature because mutant CESAs/CSCs disap-pear from the plasma membrane (Arioli et al., 1998; Chen et al., 2010). This presents the opportunity to attempt to retain CESAs/CSCs in the membrane at the restrictive tem-perature by expression of AtCESA1 with engineered mis-sense mutations that may or may not affect CESA function. Available evidence suggests that only functional CSCs are transported to and/or retained in the plasma membrane, whereas non-functional CSCs or chemical perturbations of cellulose synthesis often cause CESA accumulation in endo-membrane compartments (Taylor et al., 2008; Crowell et al., 2009; Gutierrez et al., 2009).
In our experiments to test the effects of the F954L muta-tion on AtCESA1, the data support both the presence of the AtCESA1F954L protein and lack of functionality of the mutant protein. This is shown by stronger YFP–CESA6 fluorescence (mainly in endomembrane compartments) as compared with the control line when Atcesa6prc1 Atcesa1rsw1 YFP–CESA6 Atcesa1F954L seedlings were grown at 29 °C (Fig. 4E, F). The AtCESA1F954L protein can partly compensate for the severe depletion of CSCs caused by the temperature-sensitive rsw1 mutation at 29 °C (Fig. 4D), but the small punctate struc-tures typical of active CSCs in the plasma membrane are sparse compared with the 22 °C permissive temperature (compare images B and E). At 22 °C, a fluorescence pattern typical of active CESAs in the plasma membrane occurred in the Atcesa6prc1 Atcesa1rsw1 YFP–CESA6 Atcesa1F954L line (Fig. 4B), probably because the AtCESA1rsw1 protein was preferentially incorporated into and supported normal CSC behaviour at the permissive temperature. However, the reduced density of CSCs in the plasma membrane as com-pared with the Atcesa6prc1 Atcesa1rsw1 YFP–CESA6 line grown at 22 °C (Fig. 4A, C) suggests that non-functional AtCESA1F954L protein might have displaced AtCESA1rsw1
Fig. 3. The Atcesa1F954L mutation does not rescue the short root phenotype of the Atcesa6prc1 Atcesa1rsw1 YFP–CESA6 mutant. Seedlings were grown for 5 d at a permissive temperature (23 °C), and then transferred to a restrictive temperature (31 °C) for 7 d. After the rsw1 mutation in Atcesa6prc1 Atcesa1rsw1 YFP–CESA6 was rescued with wild-type CESA1, root length was similar to Col-0 because wild-type CESA1 replaced the rsw1 mutant protein. As expected, Atcesa1rsw1 roots were short, as were roots of Atcesa6prc1 Atcesa1rsw1 YFP–CESA6 seedlings that contained only the rsw1 allele of AtCESA1. Two independent Atcesa6prc1 Atcesa1rsw1 YFP–CESA6 lines in which Atcesa1F954L was expressed (Atcesa6prc1 Atcesa1rsw1 YFP–CESA6 Atcesa1F954L-1 and -2) also had short roots, indicating that AtCESA1 is non-functional when the F954L mutation is present. Total root length was measured, error bars represent standard deviation, and asterisks indicate significant differences (P<0.0001, t-test) compared with wild-type Col-0.
Structural conformations of a non-catalytic region affect CESA function | 6651
in some CSCs in the Atcesa6prc1 Atcesa1rsw1 YFP–CESA6 Atcesa1F954L line and abrogated CSC delivery and/or reten-tion in the plasma membrane at 22 °C.
Residues that are conserved in both plant CESA TMH5–6 and BcsA IF3–TMH7, denoted as an FXVTXK motif, have recently been shown to be important for substrate gating. In BcsA, residues F503 and V505 interact with hydrophobic residues in IF2, IF3, and TMH7 when the gating loop is in the open position (Morgan et al., 2014). When the gating loop is inserted into the active site, residues T506 and K508 probably coordinate the UDP moiety of the substrate, pos-sibly stabilizing UDP during catalysis (Morgan et al., 2014). Although currently available data cannot resolve whether the amino acids between CESA TMH5 and 6 are in the apoplast or the cytosol of plant cells, the important role of the puta-tively orthologous region in BcsA for gating the substrate binding site (Morgan et al., 2014) resonates with the pos-sibility that the current predictions for CESA topology are incorrect. One possibility that would overcome this topologi-cal discrepancy would be for plant CESA TMH3, 4, or 5 to be an interfacial helix and not a membrane-spanning TMH. If this were the case, then the region between TMH5 and 6 in plant CESAs would be exposed to the cytosol, similarly to BcsA, and likewise might function in a similar manner. The alternative in silico conformations demonstrated in our results might then be a manifestation of movement of a sub-strate gating loop in CESA, as supported by crystal struc-tures of BcsA.
Alternatively, the topology of BcsA and CESA might be partly different. The interaction between c-di-GMP and the PilZ domain of BcsA, which regulates the movement of the IF3–TMH7 gating loop (Morgan et al., 2014), represents a mechanism that is not operative for plant CESAs because the PilZ domain and c-di-GMP are not present. It could be that the TMH5–6 region does not serve to regulate substrate access to the CESA catalytic site. This idea is supported by the lack of a biphasic folding plot of computationally modelled IF3–TMH7 in BcsA, compared with the biphasic folding plots of the computational models of TMH5–6 in AtCESA1, 3, and 6 (Supplementary Figs S1, S3). If the predicted topology of plant CESAs proves to be accurate, it may be that plant CESAs have developed different ways to regulate cellulose biosynthesis compared with BcsA, including mechanisms of controlling substrate access to the active site and/or the regulation of translocation and/or deposition of the cellulose microfibril. Although we do not yet know which aspect of CESA function may be affected by the potential in vivo dif-ferences in conformation of the TMH5–6 region, our results demonstrate an association between altered CESA function in vivo and altered protein conformation in silico.
Supplementary data
Supplementary data are available at JXB onlineFigure S1. Folding plots of AtCESA TMH5–6 region.
Fig. 4. Confocal images of YFP–CESA6 in control and mutant lines at permissive (22 °C) and restrictive (29 °C) temperatures. (A, B) At 22 °C, YFP–CESA6 predominantly localizes to punctae in the plasma membrane in Atcesa6prc1 Atcesa1rsw1 YFP–CESA6 and Atcesa6prc1 Atcesa1rsw1 YFP–CESA6 Atcesa1F954L dark-grown hypocotyls. (C) At 22 °C, the density of YFP–CEAS6 particles at the cell surface in the Atcesa6prc1 Atcesa1rsw1 YFP–CESA6 Atcesa1F954L (F954L) mutant was lower than in the Atcesa6prc1 Atcesa1rsw1 YFP–CESA6 (Control) line. Mean values ±SD are plotted and were derived from 10–11 cells from 7–10 seedlings per line. Asterisk indicates significant difference (P<0.05, t-test). (D, E) On exposure to 29 °C for 24 h, YFP–CESA6 signal is lower in Atcesa6prc1 Atcesa1rsw1 YFP–CESA6 hypocotyls than in Atcesa6prc1 Atcesa1rsw1 YFP–CESA6 Atcesa1F954L hypocotyls, where YFP–CESA6 signal is more evident in endomembrane compartments. (F) Quantification of total fluorescence intensity for Atcesa6prc1 Atcesa1rsw1 YFP–CESA6 (Control) and Atcesa6prc1 Atcesa1rsw1 YFP–CESA6 Atcesa1F954L (F954L) z series collected after exposure to 29 °C for 24 h. All images were collected from the same cellular region with identical exposure settings (see Materials and methods) and are representative of n≥5 seedlings from three experiments. Displayed images are maximum projections of z series. Scale bar=10 µm. Asterisk indicates significant difference compared with the control (P<0.001, t-test).
6652 | Slabaugh et al.
Figure S2. Computational models of IF3–TMH7 of BcsA compared with the solved crystal structure of BcsA.
Figure S3. Folding plot of the IF3–TMH7 region from BcsA.
Figure S4. Schematic of the subcellular localization of YFP–CESA6 at restrictive temperatures in Atcesa6prc1 Atcesa1rsw1 YFP–CESA6 seedlings without and with trans-formation with wild-type AtCESA1.
Table S1. Table of statistical information describing the computational modelling data.
Table S2. The results from a BLAST search of amino acids 820–890 from GhCESA1 (GenBank Accession P93155) were used to create a visual representation of the evolutionary conservation of the protein sequence of the TMH5–6 region from CESAs depicted in Figure 1C.
AcknowledgementsThis research was supported by The Center for LignoCellulose Structure and Formation, an Energy Frontier Research Center funded by the US Department of Energy, Office of Science, Basic Energy Sciences under award # DE-SC0001090. We would like to thank the Somerville Lab (University of California Berkeley) for kindly providing us with seeds from the Atcesa6prc1 Atcesa1rsw1 YFP–CESA6 line. We would also like to thank Jonathan K. Davis for providing helpful scientific insight and discussion as well as artistic con-tributions to Figure S4.
ReferencesArioli T, Peng L, Betzner AS et al. 1998. Molecular analysis of cellulose biosynthesis in Arabidopsis. Science 279, 717–720.
Arkun Y, Erman B. 2010. Prediction of optimal folding routes of proteins that satisfy the principle of lowest entropy loss: dynamic contact maps and optimal control. PloS One 5, e13275.
Berenger F, Shrestha R, Zhou Y, Simoncini D, Zhang KYJ. 2012. Durandal: fast exact clustering of protein decoys. Journal of Computational Chemistry 33, 471–474.
Cantarel BL, Coutinho PM, Rancurel C, Bernard T, Lombard V, Henrissat B. 2009. The carbohydrate-active enzymes database (CAZy): an expert resource for glycogenomics. Nucleic Acids Research 37, D233–D228.
Charnock SJ, Davies GJ. 1999. Structure of the nucleotide-diphospho-sugar transferase, SpsA from Bacillus subtilis, in native and nucleotide-complexed forms. Biochemistry 38, 6380–6385.
Chen S, Ehrhardt DW, Somerville CR. 2010. Mutations of cellulose synthase (CESA1) phosphorylation sites modulate anisotropic cell expansion and bidirectional mobility of cellulose synthase. Proceedings of the National Academy of Sciences, USA 107, 17188–17193.
Clough SJ, Bent AF. 1998. Floral dip: a simplified method for Agrobacterium-mediated transformation of Arabidopsis thaliana. Plant Journal 16, 735–743.
Crowell EF, Bischoff V, Desprez T, Rolland A, Stierhof Y, Schumacher K, Gonneau M, Hofte H, Vernhettes S. 2009. Pausing of Golgi bodies on microtubules regulates secretion of cellulose synthase complexes in Arabidopsis. The Plant Cell 21, 1141–1154.
Das R. 2011. Four small puzzles that Rosetta doesn’t solve. PloS One 6, e20044.
Desprez T, Juraniec M, Crowell EF, Jouy H, Pochylova Z, Parcy F, Hofte H, Gonneau M, Vernhettes S. 2007. Organization of cellulose synthase complexes involved in primary cell wall synthesis in Arabidopsis thaliana. Proceedings of the National Academy of Sciences, USA 104, 15572–15577.
Endler A, Persson S. 2011. Cellulose synthases and synthesis in Arabidopsis. Molecular Plant 4, 199–211.
Fujita M, Himmelspach R, Ward J et al. 2013. The anisotropy1 D604N mutation in the Arabidopsis cellulose synthase1 catalytic domain reduces
cell wall crystallinity and the velocity of cellulose synthase complexes. Plant Physiology 162, 74–85.
Gutierrez R, Lindeboom JJ, Paredez AR, Emons AMC, Ehrhardt DW. 2009. Arabidopsis cortical microtubules position cellulose synthase delivery to the plasma membrane and interact with cellulose synthase trafficking compartments. Nature Cell Biology 11, 797–806.
Harris DM, Corbin K, Wang T et al. 2012. Cellulose microfibril crystallinity is reduced by mutating C-terminal transmembrane region residues CESA1A903V and CESA3T942I of cellulose synthase. Proceedings of the National Academy of Sciences, USA 109, 4098–4103.
Jones DT. 1999. Protein secondary structure prediction based on position-specific scoring matrices. Journal of Molecular Biology 292, 195–202.
Lei L, Li S, Gu Y. 2012. Cellulose synthase complexes: composition and regulation. Frontiers in Plant Science 3, 75.
Meiler J, Baker D. 2003. Coupled prediction of protein secondary and tertiary structure. Proceedings of the National Academy of Sciences, USA 100, 12105–12110.
Morgan, JLW, McNamara, JT, Zimmer J. 2014. Mechanism of activation of bacterial cellulose synthase by cyclic-di-GMP. Nature Structural & Molecular Biology 21, 489–496.
Morgan JLW, Strumillo J, Zimmer J. 2013. Crystallographic snapshot of cellulose synthesis and membrane translocation. Nature 493, 181–186.
Paredez AR, Somerville CR, Ehrhardt DW. 2006. Visualization of cellulose synthase demonstrates functional association with microtubules. Science 312, 1491–1495.
Pear JR, Kawagoe Y, Schreckengost WE, Delmer DP, Stalker DM. 1996. Higher plants contain homologs of the bacterial celA genes encoding the catalytic subunit of cellulose synthase. Proceedings of the National Academy of Sciences, USA 93, 12637–12642.
Persson S, Paredez A, Carroll A, Palsdottir H, Doblin M, Poindexter P, Khitrov N, Auer M, Somerville CR. 2007. Genetic evidence for three unique components in primary cell-wall cellulose synthase complexes in Arabidopsis. Proceedings of the National Academy of Sciences, USA 104, 15566–15571.
Pettersen EF, Goddard TD, Huang CC, Couch GS, Greenblatt DM, Meng EC, Ferrin TE. 2004. UCSF Chimera—a visualization system for exploratory research and analysis. Journal of Computational Chemistry 25, 1605–1612.
Pysh L, Alexander N, Swatzyna L, Harbert R. 2012. Four alleles of AtCESA3 form an allelic series with respect to root phenotype in Arabidopsis thaliana. Physiologia Plantarum 144, 369–381.
Saxena IM, Brown RM. 2012. Biosynthesis of bacterial cellulose. In: Gama M, Gatenholm P, Klemm D, eds. Bacterial nanocellulose: A sophisticated multifunctional material . Boca Raton: CRC Press, 1–18.
Scheible W, Eshed R, Richmond T, Delmer D, Somerville C. 2001. Modifications of cellulose synthase confer resistance to isoxaben and thiazolidinone herbicides in Arabidopsis Ixr1 mutants. Proceedings of the National Academy of Sciences, USA 98, 10079–10084.
Schwacke R, Schneider A, Graaff EVD, Fischer K, Catoni E, Desimone M, Frommer WB, Flu U, Kunze R, Germany EC. 2003. ARAMEMNON, a novel database for Arabidopsis integral membrane proteins. Plant Physiology 131, 16–26.
Sethaphong L, Haigler CH, Kubicki JD, Zimmer J, Bonetta D, DeBolt S, Yingling YG. 2013. Tertiary model of a plant cellulose synthase. Proceedings of the National Academy of Sciences, USA 110, 7512–7517.
Slabaugh E, Davis JK, Haigler CH, Yingling YG, Zimmer J. 2014. Cellulose synthases: new insights from crystallography and modeling. Trends in Plant Science 19, 99–106.
Tanaka K, Murata K, Yamazaki M, Onosato K, Miyao A, Hirochika H. 2003. Three distinct rice cellulose synthase catalytic subunit genes required for cellulose synthesis in the secondary wall. Plant Physiology 133, 73–83.
Taylor NG. 2008. Cellulose biosynthesis and deposition in higher plants. The New Phytologist 178, 239–252.
Valla S, Ertesvaag H, Tonouchi N, Fjaervik E. 2009. Bacterial cellulose production: biosynthesis and applications. In: Rehm BHA, ed. Microbial

Structural conformations of a non-catalytic region affect CESA function | 6653
Production of Biopolymers and Polymer Precursors: Applications and Perspectives . Norfolk: Caister Academics, 43–77.
Viklund HK, Elofsson A. 2008. OCTOPUS: improving topology prediction by two-track ANN-based preference scores and an extended topological grammar. Bioinformatics 24, 1662–1668.
Vinothkumar KR, Henderson R. 2010. Structures of membrane proteins. Quarterly reviews of Biophysics 43, 65–158.
Yarov-Yarovoy V, Schonbrun J, Baker D. 2006. Multipass membrane protein structure prediction using Rosetta. Proteins 62, 1010–1025.
Zhang B, Deng L, Qian Q, Xiong G, Zeng D, Li R, Guo L, Li J, Zhou Y. 2009. A missense mutation in the transmembrane domain of CESA4 affects protein abundance in the plasma membrane and results in abnormal cell wall biosynthesis in rice. Plant Molecular Biology 71, 509–524.