The Genetics and Transcriptional Profiles of the Cellulose Synthase-Like HvCslF Gene Family in...
13
The Genetics and Transcriptional Profiles of the Cellulose Synthase-Like HvCslF Gene Family in Barley 1[OA] Rachel A. Burton, Stephen A. Jobling, Andrew J. Harvey, Neil J. Shirley, Diane E. Mather, Antony Bacic, and Geoffrey B. Fincher* Australian Centre for Plant Functional Genomics (R.A.B., A.J.H., N.J.S., G.B.F.) and Molecular Plant Breeding Cooperative Research Centre (D.E.M.), School of Agriculture, Food and Wine, University of Adelaide, Waite Campus, Glen Osmond, South Australia 5064, Australia; Commonwealth Scientific and Industrial Research Organization, Food Futures Flagship, Australian Capital Territory 2601, Australia (S.A.J.); and Australian Centre for Plant Functional Genomics, School of Botany, University of Melbourne, Parkville, Victoria 3010, Australia (A.B.) Cellulose synthase-like CslF genes have been implicated in the biosynthesis of (1,3;1,4)-b-D-glucans, which are major cell wall constituents in grasses and cereals. Seven CslF genes from barley (Hordeum vulgare) can be divided into two classes on the basis of intron-exon arrangements. Four of the HvCslF genes have been mapped to a single locus on barley chromosome 2H, in a region corresponding to a major quantitative trait locus for grain (1,3;1,4)-b-D-glucan content. The other HvCslF genes map to chromosomes 1H, 5H, and 7H, and in two cases the genes are close to other quantitative trait loci for grain (1,3;1,4)-b-D-glucan content. Spatial and temporal patterns of transcription of the seven genes have been defined through quantitative polymerase chain reaction. In developing barley coleoptiles HvCslF6 mRNA is most abundant. Transcript levels are maximal in 4- to 5-d coleoptiles, at a time when (1,3;1,4)-b-D-glucan content of coleoptile cell walls also reaches maximal levels. In the starchy endosperm of developing grain, HvCslF6 and HvCslF9 transcripts predominate. Two peaks of transcription are apparent. One occurs just after endosperm cellularization, 4 to 8 d after pollination, while the second occurs much later in grain development, more than 20 d after pollination. Marked varietal differences in transcription of the HvCslF genes are observed during endosperm development. Given the commercial importance of cereal (1,3;1,4)-b-D-glucans in human nutrition, in stock feed, and in malting and brewing, the observation that only two genes, HvCslF6 and HvCslF9, are transcribed at high levels in developing grain is of potential relevance for the future manipulation of grain (1,3;1,4)-b-D-glucan levels. Plant cell walls are chemically complex, diverse structures that are modified throughout the processes of cell division, cell growth, and differentiation, and in response to abiotic and biotic stresses. Primary walls are composed mainly of cellulose and a range of non- cellulosic polysaccharides, together with smaller amounts of proteins and other components (Carpita et al., 2001; Trethewey et al., 2005). Although the chem- ical structures of most wall polysaccharides have been determined (Fincher and Stone, 2004), there is rela- tively little information on the enzymes involved in their biosynthesis. Within the overall glycosyltransfer- ase (GT) class of carbohydrate-modifying enzymes (Coutinho and Henrissat, 1999; http://afmb.cnrs-mrs. fr/CAZY/) two distinct groups of enzymes have been implicated in wall polysaccharide biosynthesis, namely the type I polysaccharide synthases and the type II GTs. Type II GTs are membrane-bound enzymes that generally contain a single transmembrane helix near their NH 2 termini. The type II enzymes were initially believed to transfer glycosyl substituents onto a poly- saccharide backbone from the sugar nucleotide do- nor in a single catalytic event (Farrokhi et al., 2006), as exemplified by the a-D-xylosyltransferases that add single a-D-xylosyl residues to the (1,4)-b-D-glucan backbone of wall xyloglucans (Faik et al., 2002). How- ever, it has been shown recently that GAUT1, a type II galacturonyltransferase of the GT8 family, is capable of mediating the synthesis of the homogalacturonan backbone of pectic polysaccharides (Sterling et al., 2006). Similarly, type II GTs have been implicated in the synthesis of the (1,4)-b-D-xylan backbone of hetero- xylans of the wall (Lee et al., 2007; Mitchell et al., 2007; Pena et al., 2007). The type I polysaccharide synthase group includes enzymes with an action pattern based upon the iter- ative transfer of glycosyl residues from sugar nucleo- tide donors onto main chain backbones of wall polysaccharides (Farrokhi et al., 2006). These are large integral membrane proteins, containing up to 1,000 1 This work was supported by the Australian Research Council, the Grains Research and Development Corporation, the Common- wealth Scientific and Industrial Research Organization Food Futures Flagship program, and the Commonwealth Scientific and Industrial Research Organization Flagship Collaboration Fund. * Corresponding author; e-mail geoff.fi[email protected]. The author responsible for distribution of materials integral to the findings presented in this article in accordance with the policy described in the Instructions for Authors (www.plantphysiol.org) is: Geoffrey B. Fincher (geoff.fi[email protected]). [OA] Open Access articles can be viewed online without a sub- scription. www.plantphysiol.org/cgi/doi/10.1104/pp.107.114694 Plant Physiology, April 2008, Vol. 146, pp. 1821–1833, www.plantphysiol.org Ó 2008 American Society of Plant Biologists 1821 www.plant.org on December 11, 2015 - Published by www.plantphysiol.org Downloaded from Copyright © 2008 American Society of Plant Biologists. All rights reserved.
Transcript of The Genetics and Transcriptional Profiles of the Cellulose Synthase-Like HvCslF Gene Family in...

The Genetics and Transcriptional Profiles of the CelluloseSynthase-Like HvCslF Gene Family in Barley1[OA]
Rachel A. Burton, Stephen A. Jobling, Andrew J. Harvey, Neil J. Shirley, Diane E. Mather,Antony Bacic, and Geoffrey B. Fincher*
Australian Centre for Plant Functional Genomics (R.A.B., A.J.H., N.J.S., G.B.F.) and Molecular PlantBreeding Cooperative Research Centre (D.E.M.), School of Agriculture, Food and Wine, University ofAdelaide, Waite Campus, Glen Osmond, South Australia 5064, Australia; Commonwealth Scientific andIndustrial Research Organization, Food Futures Flagship, Australian Capital Territory 2601, Australia(S.A.J.); and Australian Centre for Plant Functional Genomics, School of Botany, University ofMelbourne, Parkville, Victoria 3010, Australia (A.B.)
Cellulose synthase-like CslF genes have been implicated in the biosynthesis of (1,3;1,4)-b-D-glucans, which are major cell wallconstituents in grasses and cereals. Seven CslF genes from barley (Hordeum vulgare) can be divided into two classes on the basisof intron-exon arrangements. Four of the HvCslF genes have been mapped to a single locus on barley chromosome 2H, in aregion corresponding to a major quantitative trait locus for grain (1,3;1,4)-b-D-glucan content. The other HvCslF genes map tochromosomes 1H, 5H, and 7H, and in two cases the genes are close to other quantitative trait loci for grain (1,3;1,4)-b-D-glucancontent. Spatial and temporal patterns of transcription of the seven genes have been defined through quantitative polymerasechain reaction. In developing barley coleoptiles HvCslF6 mRNA is most abundant. Transcript levels are maximal in 4- to 5-dcoleoptiles, at a time when (1,3;1,4)-b-D-glucan content of coleoptile cell walls also reaches maximal levels. In the starchyendosperm of developing grain, HvCslF6 and HvCslF9 transcripts predominate. Two peaks of transcription are apparent. Oneoccurs just after endosperm cellularization, 4 to 8 d after pollination, while the second occurs much later in grain development,more than 20 d after pollination. Marked varietal differences in transcription of the HvCslF genes are observed duringendosperm development. Given the commercial importance of cereal (1,3;1,4)-b-D-glucans in human nutrition, in stock feed,and in malting and brewing, the observation that only two genes, HvCslF6 and HvCslF9, are transcribed at high levels indeveloping grain is of potential relevance for the future manipulation of grain (1,3;1,4)-b-D-glucan levels.
Plant cell walls are chemically complex, diversestructures that are modified throughout the processesof cell division, cell growth, and differentiation, and inresponse to abiotic and biotic stresses. Primary wallsare composed mainly of cellulose and a range of non-cellulosic polysaccharides, together with smalleramounts of proteins and other components (Carpitaet al., 2001; Trethewey et al., 2005). Although the chem-ical structures of most wall polysaccharides have beendetermined (Fincher and Stone, 2004), there is rela-tively little information on the enzymes involved intheir biosynthesis. Within the overall glycosyltransfer-ase (GT) class of carbohydrate-modifying enzymes
(Coutinho and Henrissat, 1999; http://afmb.cnrs-mrs.fr/CAZY/) two distinct groups of enzymes have beenimplicated in wall polysaccharide biosynthesis, namelythe type I polysaccharide synthases and the type II GTs.
Type II GTs are membrane-bound enzymes thatgenerally contain a single transmembrane helix neartheir NH2 termini. The type II enzymes were initiallybelieved to transfer glycosyl substituents onto a poly-saccharide backbone from the sugar nucleotide do-nor in a single catalytic event (Farrokhi et al., 2006), asexemplified by the a-D-xylosyltransferases that addsingle a-D-xylosyl residues to the (1,4)-b-D-glucanbackbone of wall xyloglucans (Faik et al., 2002). How-ever, it has been shown recently that GAUT1, a type IIgalacturonyltransferase of the GT8 family, is capable ofmediating the synthesis of the homogalacturonanbackbone of pectic polysaccharides (Sterling et al.,2006). Similarly, type II GTs have been implicated inthe synthesis of the (1,4)-b-D-xylan backbone of hetero-xylans of the wall (Lee et al., 2007; Mitchell et al., 2007;Pena et al., 2007).
The type I polysaccharide synthase group includesenzymes with an action pattern based upon the iter-ative transfer of glycosyl residues from sugar nucleo-tide donors onto main chain backbones of wallpolysaccharides (Farrokhi et al., 2006). These are largeintegral membrane proteins, containing up to 1,000
1 This work was supported by the Australian Research Council,the Grains Research and Development Corporation, the Common-wealth Scientific and Industrial Research Organization Food FuturesFlagship program, and the Commonwealth Scientific and IndustrialResearch Organization Flagship Collaboration Fund.
* Corresponding author; e-mail [email protected] author responsible for distribution of materials integral to the
findings presented in this article in accordance with the policydescribed in the Instructions for Authors (www.plantphysiol.org) is:Geoffrey B. Fincher ([email protected]).
[OA] Open Access articles can be viewed online without a sub-scription.
www.plantphysiol.org/cgi/doi/10.1104/pp.107.114694
Plant Physiology, April 2008, Vol. 146, pp. 1821–1833, www.plantphysiol.org � 2008 American Society of Plant Biologists 1821 www.plant.org on December 11, 2015 - Published by www.plantphysiol.orgDownloaded from
Copyright © 2008 American Society of Plant Biologists. All rights reserved.
amino acid residues and up to eight transmembranehelices, and were traditionally believed to catalyze thesynthesis of the backbones of wall homopolysaccha-rides such as cellulose or of wall heteropolysaccharidessuch as heteroxylans, xyloglucans, or glucomannans(Doblin et al., 2002). The type I polysaccharide syn-thases are encoded by members of a large multigenefamily known as the cellulose synthase (CesA) super-family (Richmond and Somerville, 2000). Within theCesA gene superfamily, subgroups can be identifiedthrough sequence alignments. These include the cellu-lose synthase subfamily (CesA) and Cellulose synthase-like (Csl) subfamilies A to H, each of which consists ofmultiple genes (Richmond and Somerville, 2000). Forexample, in rice (Oryza sativa) there are 37 Csl genesin total, while in Arabidopsis (Arabidopsis thaliana) thereare 30 (Hazen et al., 2002; Somerville et al., 2004).Surprisingly few Csl genes have been assigned a spe-cific function in plant cell wall biosynthesis. Membersof the CslA subfamily encode (1,4)-b-D-mannan syn-thases (Dhugga et al., 2004; Liepman et al., 2007), andthe CslC group is believed to encode an enzyme thatdirects the synthesis of the (1,4)-b-D-glucan backbone ofxyloglucans (Cocuron et al., 2007). Using a comparativegenomics approach, Burton et al. (2006) showed thata cluster of the monocot-specific CslF genes in rice islocated in a genomic region corresponding to one con-taining a major quantitative trait locus (QTL) for grain(1,3;1,4)-b-D-glucan content in barley (Hordeum vulgare).Following expression of rice CslF genes in Arabidopsisand the detection of (1,3;1,4)-b-D-glucan in the wallsof transgenic Arabidopsis lines, it was concluded thatthe rice CslF genes encode polysaccharide synthasesthat are essential for the synthesis of the (1,3;1,4)-b-D-glucans of monocot cell walls, although the participa-tion of other enzymes or ancillary proteins could not beprecluded (Burton et al., 2006).
Here, we have examined the CslF gene subfamily ofbarley. Seven HvCslF genes and their correspondingcDNAs have been isolated and sequenced, and thegenes have been assigned positions on genetic mapsfrom a ‘Clipper’ 3 ‘Sahara’ mapping population. Dif-ferential rates of transcription of individual members ofthe gene subfamily have been quantitated in a numberof organ and tissue extracts from barley, and patterns ofgene transcription have been monitored in growingcoleoptiles and during endosperm development.
RESULTS
Cloning Barley HvCslF cDNAs and Genes
National Center for Biotechnology Information ESTdatabases were screened for barley EST sequenceswith the rice full-length CslF deduced amino acidsequences using blastx and the previously isolatedbarley CslF sequences using blastn and blastx. Wherenecessary, EST sequences for wheat (Triticum aestivum)were isolated using the same procedure to extend thepredicted sequences for the barley CslF cDNAs. Given
that homologous genes between wheat and barleyoften show 98% to 99% sequence identity, it was hopedthat this procedure would enable us to design PCRprimers from wheat CslF ESTs where no barley equiv-alent was found. This approach was successful inextending the sequences of both HvCslF6 and HvCslF9.No barley or wheat ESTs corresponding to OsCslF7were present in the public databases so degenerateoligonucleotides (ATCGCCGGSGAGCTCTGGTT andTTSCGGCAGAASGGCACCCA, sense and antisense,respectively) were designed to a region conservedbetween OsCslF1, OsCslF2, OsCslF4, OsCslF6, andOsCslF7 genes and used to amplify sequences fromseedling cDNA. HvCslF7-specific sequences wereidentified and extended to a full-length cDNA using5# and 3# RACE. During 5# RACE experiments prod-ucts were obtained, which upon sequencing did notmatch to any of the previously identified HvCslFcDNAs. Extension of this fragment using furtherrounds of 5# and 3# RACE resulted in the acquisitionof the full-length cDNA encoding HvCslF10.
When the nucleotide sequences of the barley HvCslFcDNAs are aligned, sequence identity values of 53% to69% are observed between the individual barley genes(Table I).
The HvCslF genes corresponding to the sevencDNAs were isolated by screening bacterial artificialchromosome (BAC) libraries or by PCR amplificationfrom genomic DNA preparations, using gene-specificprimers. The BAC clone number P578K13 from ‘Morex’was found to carry two HvCslF genes, which were sub-sequently designated HvCslF3 and HvCslF4, and theBAC clone number P61G5, carried the HvCslF9 gene.The complete sequences for these genes were obtainedfrom cDNA, genomic, and PCR sequencing.
HvCslF Gene Nomenclature
The nomenclature of the barley genes is based on thenomenclature of the likely orthologs from rice, whichwere assigned numbers in the rice genome sequencingproject. The designated, putative orthologs were se-lected on the basis of location on syntenous regions ofrice and barley chromosomes and on sequence simi-larities. An unrooted phylogenetic tree (Fig. 1) indi-cates that barley does not have genes with closesequence similarity with the rice OsCslF1 and OsCslF2genes. As a result, no barley genes are designatedCslF1 or CslF2. However, barley genes that are appar-ently orthologous to the rice OsCslF3, OsCslF4,OsCslF6, OsCslF7, OsCslF8, and OsCslF9 genes wereidentified (Fig. 1). The rice OsCslF5 gene is believed tobe a pseudogene, because it contains an internal stopcodon. No barley gene obviously orthologous to therice OsCslF5 gene was detected. On that basis thebarley HvCslF5 designation has not been used. Barleyhas an additional gene that is designated HvCslF10;this gene is most similar to HvCslF3 (Fig. 1). Overall,the identification of the barley and rice orthologs bygenome location and sequence gave consistent results.
Burton et al.
1822 Plant Physiol. Vol. 146, 2008 www.plant.org on December 11, 2015 - Published by www.plantphysiol.orgDownloaded from
Copyright © 2008 American Society of Plant Biologists. All rights reserved.
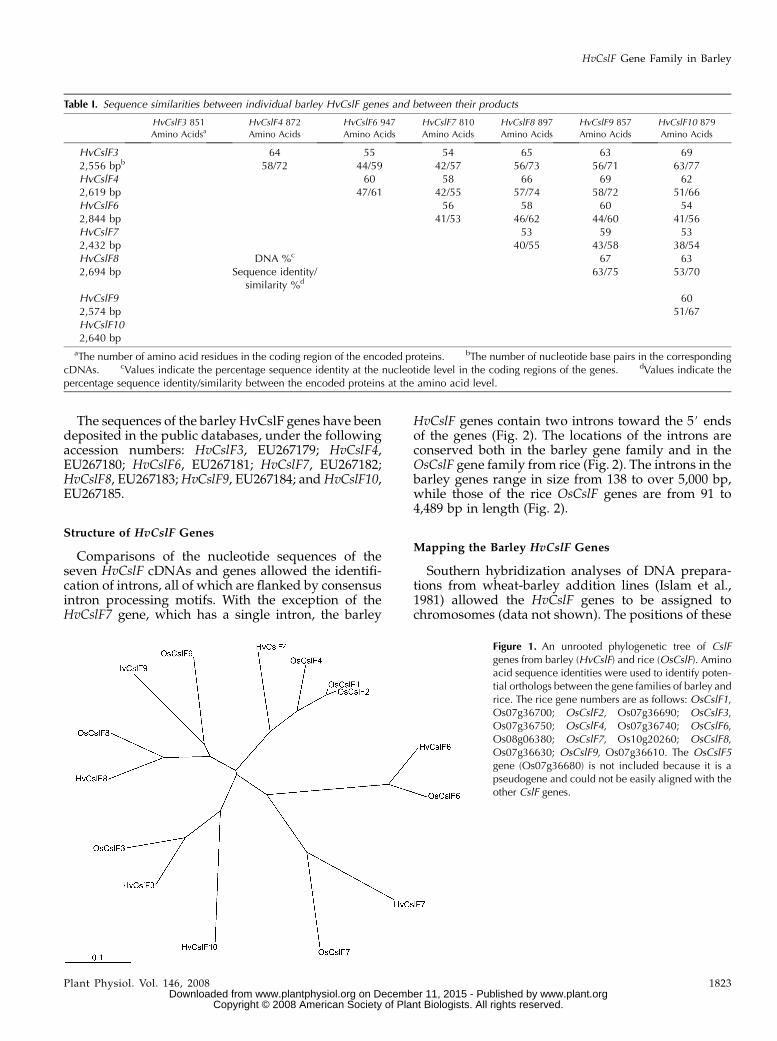
The sequences of the barley HvCslF genes have beendeposited in the public databases, under the followingaccession numbers: HvCslF3, EU267179; HvCslF4,EU267180; HvCslF6, EU267181; HvCslF7, EU267182;HvCslF8, EU267183; HvCslF9, EU267184; and HvCslF10,EU267185.
Structure of HvCslF Genes
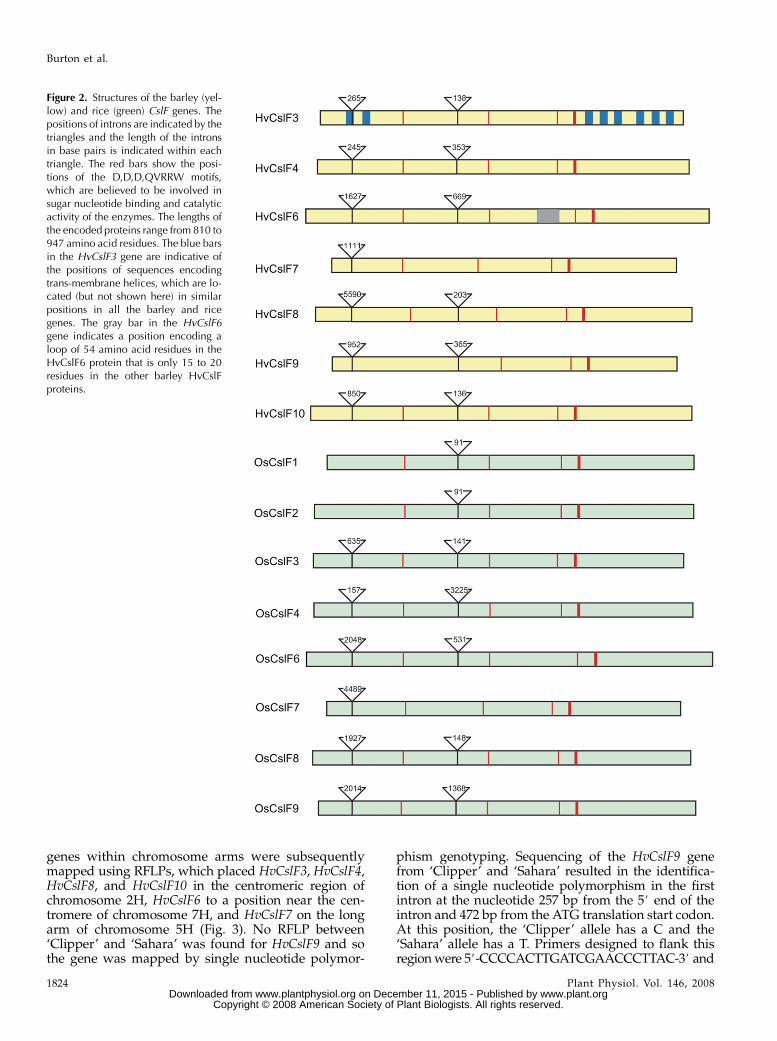
Comparisons of the nucleotide sequences of theseven HvCslF cDNAs and genes allowed the identifi-cation of introns, all of which are flanked by consensusintron processing motifs. With the exception of theHvCslF7 gene, which has a single intron, the barley
HvCslF genes contain two introns toward the 5# endsof the genes (Fig. 2). The locations of the introns areconserved both in the barley gene family and in theOsCslF gene family from rice (Fig. 2). The introns in thebarley genes range in size from 138 to over 5,000 bp,while those of the rice OsCslF genes are from 91 to4,489 bp in length (Fig. 2).
Mapping the Barley HvCslF Genes
Southern hybridization analyses of DNA prepara-tions from wheat-barley addition lines (Islam et al.,1981) allowed the HvCslF genes to be assigned tochromosomes (data not shown). The positions of these
Table I. Sequence similarities between individual barley HvCslF genes and between their products
HvCslF3 851
Amino AcidsaHvCslF4 872
Amino Acids
HvCslF6 947
Amino Acids
HvCslF7 810
Amino Acids
HvCslF8 897
Amino Acids
HvCslF9 857
Amino Acids
HvCslF10 879
Amino Acids
HvCslF32,556 bpb
64 55 54 65 63 6958/72 44/59 42/57 56/73 56/71 63/77
HvCslF42,619 bp
60 58 66 69 6247/61 42/55 57/74 58/72 51/66
HvCslF62,844 bp
56 58 60 5441/53 46/62 44/60 41/56
HvCslF72,432 bp
53 59 5340/55 43/58 38/54
HvCslF82,694 bp
DNA %c 67 63Sequence identity/
similarity %d63/75 53/70
HvCslF92,574 bp
6051/67
HvCslF102,640 bp
aThe number of amino acid residues in the coding region of the encoded proteins. bThe number of nucleotide base pairs in the correspondingcDNAs. cValues indicate the percentage sequence identity at the nucleotide level in the coding regions of the genes. dValues indicate thepercentage sequence identity/similarity between the encoded proteins at the amino acid level.
Figure 1. An unrooted phylogenetic tree of CslFgenes from barley (HvCslF) and rice (OsCslF). Aminoacid sequence identities were used to identify poten-tial orthologs between the gene families of barley andrice. The rice gene numbers are as follows: OsCslF1,Os07g36700; OsCslF2, Os07g36690; OsCslF3,Os07g36750; OsCslF4, Os07g36740; OsCslF6,Os08g06380; OsCslF7, Os10g20260; OsCslF8,Os07g36630; OsCslF9, Os07g36610. The OsCslF5gene (Os07g36680) is not included because it is apseudogene and could not be easily aligned with theother CslF genes.
HvCslF Gene Family in Barley
Plant Physiol. Vol. 146, 2008 1823 www.plant.org on December 11, 2015 - Published by www.plantphysiol.orgDownloaded from
Copyright © 2008 American Society of Plant Biologists. All rights reserved.
genes within chromosome arms were subsequentlymapped using RFLPs, which placed HvCslF3, HvCslF4,HvCslF8, and HvCslF10 in the centromeric region ofchromosome 2H, HvCslF6 to a position near the cen-tromere of chromosome 7H, and HvCslF7 on the longarm of chromosome 5H (Fig. 3). No RFLP between‘Clipper’ and ‘Sahara’ was found for HvCslF9 and sothe gene was mapped by single nucleotide polymor-
phism genotyping. Sequencing of the HvCslF9 genefrom ‘Clipper’ and ‘Sahara’ resulted in the identifica-tion of a single nucleotide polymorphism in the firstintron at the nucleotide 257 bp from the 5# end of theintron and 472 bp from the ATG translation start codon.At this position, the ‘Clipper’ allele has a C and the‘Sahara’ allele has a T. Primers designed to flank thisregion were 5#-CCCCACTTGATCGAACCCTTAC-3# and
Figure 2. Structures of the barley (yel-low) and rice (green) CslF genes. Thepositions of introns are indicated by thetriangles and the length of the intronsin base pairs is indicated within eachtriangle. The red bars show the posi-tions of the D,D,D,QVRRW motifs,which are believed to be involved insugar nucleotide binding and catalyticactivity of the enzymes. The lengths ofthe encoded proteins range from 810 to947 amino acid residues. The blue barsin the HvCslF3 gene are indicative ofthe positions of sequences encodingtrans-membrane helices, which are lo-cated (but not shown here) in similarpositions in all the barley and ricegenes. The gray bar in the HvCslF6gene indicates a position encoding aloop of 54 amino acid residues in theHvCslF6 protein that is only 15 to 20residues in the other barley HvCslFproteins.
Burton et al.
1824 Plant Physiol. Vol. 146, 2008 www.plant.org on December 11, 2015 - Published by www.plantphysiol.orgDownloaded from
Copyright © 2008 American Society of Plant Biologists. All rights reserved.
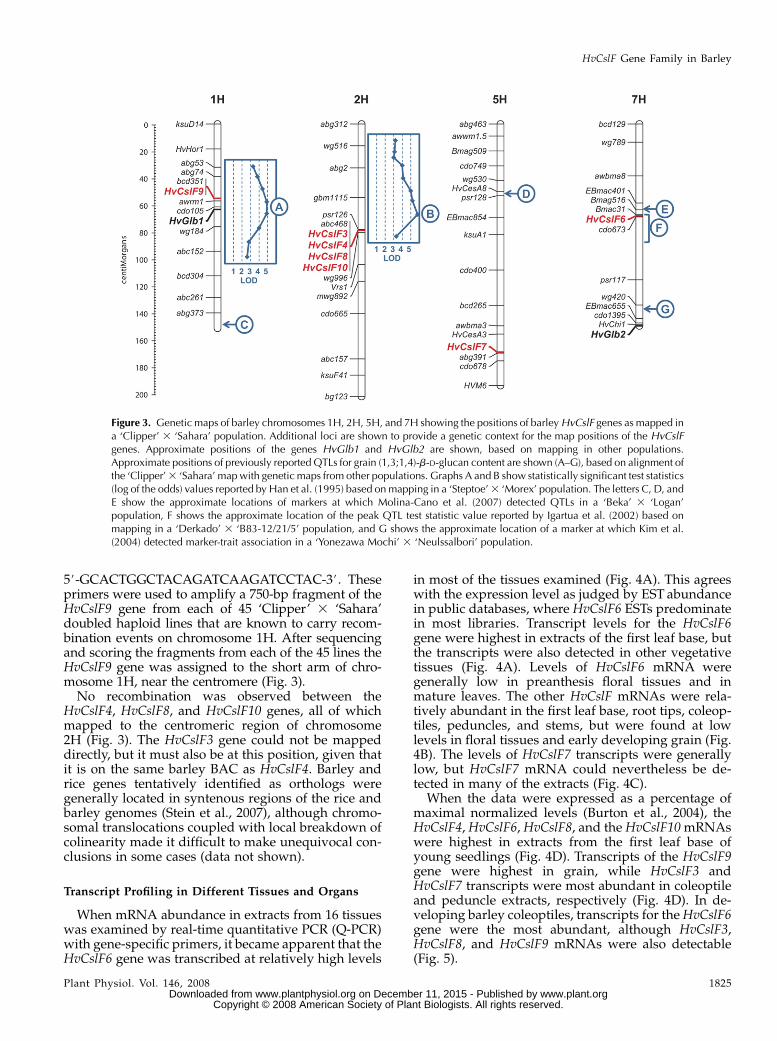
5#-GCACTGGCTACAGATCAAGATCCTAC-3#. Theseprimers were used to amplify a 750-bp fragment of theHvCslF9 gene from each of 45 ‘Clipper’ 3 ‘Sahara’doubled haploid lines that are known to carry recom-bination events on chromosome 1H. After sequencingand scoring the fragments from each of the 45 lines theHvCslF9 gene was assigned to the short arm of chro-mosome 1H, near the centromere (Fig. 3).
No recombination was observed between theHvCslF4, HvCslF8, and HvCslF10 genes, all of whichmapped to the centromeric region of chromosome2H (Fig. 3). The HvCslF3 gene could not be mappeddirectly, but it must also be at this position, given thatit is on the same barley BAC as HvCslF4. Barley andrice genes tentatively identified as orthologs weregenerally located in syntenous regions of the rice andbarley genomes (Stein et al., 2007), although chromo-somal translocations coupled with local breakdown ofcolinearity made it difficult to make unequivocal con-clusions in some cases (data not shown).
Transcript Profiling in Different Tissues and Organs
When mRNA abundance in extracts from 16 tissueswas examined by real-time quantitative PCR (Q-PCR)with gene-specific primers, it became apparent that theHvCslF6 gene was transcribed at relatively high levels
in most of the tissues examined (Fig. 4A). This agreeswith the expression level as judged by EST abundancein public databases, where HvCslF6 ESTs predominatein most libraries. Transcript levels for the HvCslF6gene were highest in extracts of the first leaf base, butthe transcripts were also detected in other vegetativetissues (Fig. 4A). Levels of HvCslF6 mRNA weregenerally low in preanthesis floral tissues and inmature leaves. The other HvCslF mRNAs were rela-tively abundant in the first leaf base, root tips, coleop-tiles, peduncles, and stems, but were found at lowlevels in floral tissues and early developing grain (Fig.4B). The levels of HvCslF7 transcripts were generallylow, but HvCslF7 mRNA could nevertheless be de-tected in many of the extracts (Fig. 4C).
When the data were expressed as a percentage ofmaximal normalized levels (Burton et al., 2004), theHvCslF4, HvCslF6, HvCslF8, and the HvCslF10 mRNAswere highest in extracts from the first leaf base ofyoung seedlings (Fig. 4D). Transcripts of the HvCslF9gene were highest in grain, while HvCslF3 andHvCslF7 transcripts were most abundant in coleoptileand peduncle extracts, respectively (Fig. 4D). In de-veloping barley coleoptiles, transcripts for the HvCslF6gene were the most abundant, although HvCslF3,HvCslF8, and HvCslF9 mRNAs were also detectable(Fig. 5).
Figure 3. Genetic maps of barley chromosomes 1H, 2H, 5H, and 7H showing the positions of barley HvCslF genes as mapped ina ‘Clipper’ 3 ‘Sahara’ population. Additional loci are shown to provide a genetic context for the map positions of the HvCslFgenes. Approximate positions of the genes HvGlb1 and HvGlb2 are shown, based on mapping in other populations.Approximate positions of previously reported QTLs for grain (1,3;1,4)-b-D-glucan content are shown (A–G), based on alignment ofthe ‘Clipper’ 3 ‘Sahara’ map with genetic maps from other populations. Graphs A and B show statistically significant test statistics(log of the odds) values reported by Han et al. (1995) based on mapping in a ‘Steptoe’ 3 ‘Morex’ population. The letters C, D, andE show the approximate locations of markers at which Molina-Cano et al. (2007) detected QTLs in a ‘Beka’ 3 ‘Logan’population, F shows the approximate location of the peak QTL test statistic value reported by Igartua et al. (2002) based onmapping in a ‘Derkado’ 3 ‘B83-12/21/5’ population, and G shows the approximate location of a marker at which Kim et al.(2004) detected marker-trait association in a ‘Yonezawa Mochi’ 3 ‘Neulssalbori’ population.
HvCslF Gene Family in Barley
Plant Physiol. Vol. 146, 2008 1825 www.plant.org on December 11, 2015 - Published by www.plantphysiol.orgDownloaded from
Copyright © 2008 American Society of Plant Biologists. All rights reserved.
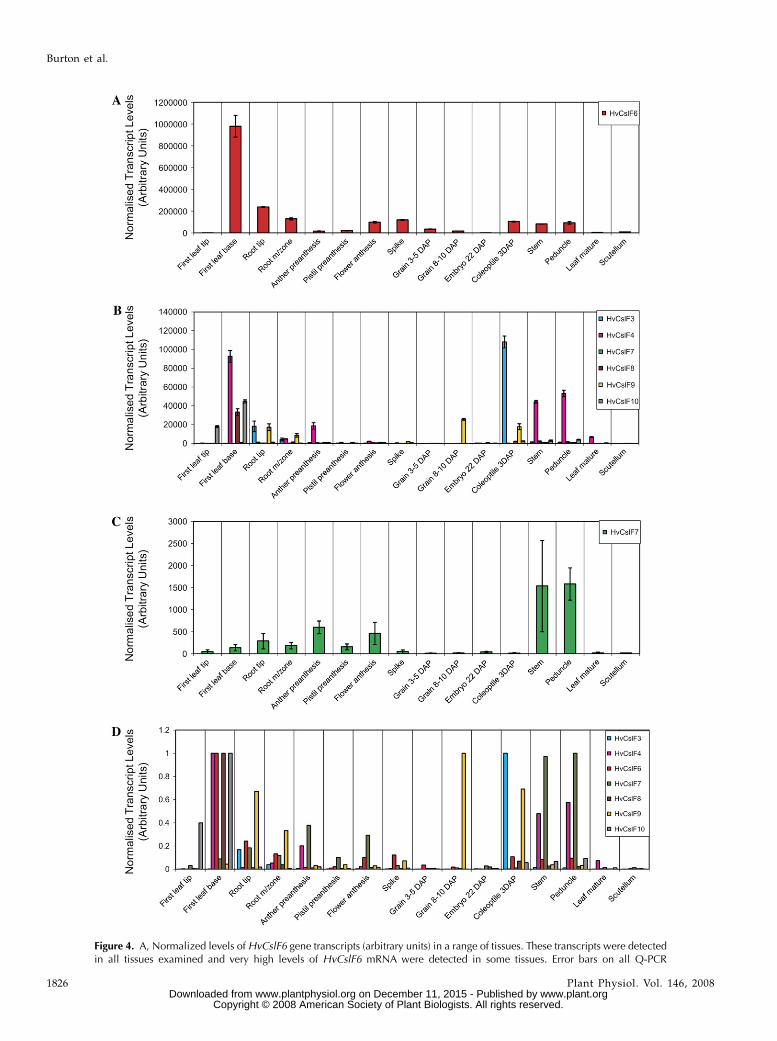
Figure 4. A, Normalized levels of HvCslF6 gene transcripts (arbitrary units) in a range of tissues. These transcripts were detectedin all tissues examined and very high levels of HvCslF6 mRNA were detected in some tissues. Error bars on all Q-PCR
Burton et al.
1826 Plant Physiol. Vol. 146, 2008 www.plant.org on December 11, 2015 - Published by www.plantphysiol.orgDownloaded from
Copyright © 2008 American Society of Plant Biologists. All rights reserved.
Transcript Profiling in Developing Endosperm
The abundance of transcripts for individual mem-bers of the HvCslF gene family were monitored in-dependently during the development of barleyendosperm, and results were compared for two barleyvarieties, namely the elite malting variety ‘Sloop’ andthe hulless barley ‘Himalaya’. Transcripts of theHvCslF9 gene peaked at about 8 d after pollination(DAP), and appeared to be much more abundant inthe variety ‘Sloop’. Transcripts of HvCslF9 decreasedquickly after 8 DAP and were present at very lowlevels after 16 DAP (Fig. 6A). In contrast, relativelyhigher levels of HvCslF6 mRNA were detectablethroughout endosperm development and there was amarked increase in abundance of this mRNA late ingrain development, at 16 to 24 DAP (Fig. 6B). Again,differences between the varieties ‘Sloop’ and ‘Himalaya’were detected (Fig. 6B). Transcripts of other membersof the HvCslF gene family were seen at much lower,but detectable levels during endosperm development(Fig. 6C). Because a major QTL for (1,3;1,4)-b-D-glucancontent of barley grain has been reported close to thegene encoding (1,3;1,4)-b-D-glucan endohydrolase iso-enzyme EI (Han et al., 1995), levels of transcripts forthe corresponding gene, which is designated HvGlb1,were also monitored during endosperm development.A sharp peak in mRNA abundance for HvGlb1 wasdetected at 12 DAP in the variety ‘Sloop’, but lowerlevels were detected in the variety ‘Himalaya’ (Fig.6D). In view of the fact that the developmental patternshown in Figure 6D depends very much on the valueat 12 DAP, the experiment was repeated with thevarieties ‘Sloop’ and ‘Golden Promise’, and similarresults were obtained (data not shown).
Properties of Proteins Encoded by the HvCslF Genes
The near full-length cDNAs revealed that the HvCslFgenes encode family GT2 glycosyl transferase enzymes(Coutinho et al., 2003; http://www.cazy.org/) with 810to 947 amino acid residues. Amino acid sequenceidentity values range from 40% to 63% overall (TableI), although higher identity values are observed in somesegments of the proteins (data not shown). The putativecatalytic site residues D, D, D, QxxRW (Doblin et al.,2002) are evident (Fig. 2) but no obvious signal peptidesor other common peptide motifs are present. Eighttrans-membrane helices are detected, with two locatedtoward the NH2-terminal region of the proteins and sixlocated toward the COOH terminus (Fig. 2).
In general, the deduced amino acid sequences of theproteins align closely, with the exception of HvCslF6and HvCslF7. A region predicted to be a loop ofapproximately 15 to 20 residues found in all othermembers of the family at about position 535 (Fig. 2) isextended in HvCslF6 to over 50 amino acid residues,through the insertion of two additional sequences oneither side of the sequence found in the other sixproteins. In the sequence predicted for HvCslF7, sev-eral relatively short insertions and deletions are de-tected throughout the protein, which is shorter overallthan the other members of the family (Fig. 2).
DISCUSSION
There is emerging evidence that cellulose synthase-like CslF genes mediate the synthesis of (1,3;1,4)-b-D-glucans in the cell walls of the commelinoidmonocotyledon group of land plants (Burton et al.,2006). Here, seven members of the barley HvCslF gene
Figure 4. (Continued.)plots indicate SDs for each mRNA. B, Levels of HvCslF gene transcripts in the different tissues. The values for HvCslF6 mRNA havebeen omitted to more clearly show the relative abundance of other mRNAs from the gene family. C, Levels of the relatively lowabundance HvCslF7 mRNA transcripts in the series of tissues. D, Normalized transcript levels of the seven barley HvCslF genes ina range of tissues, expressed as a ratio of maximal levels observed for the specific gene. Values of 1.0 therefore indicate the tissuein which a particular gene is transcribed at its maximal rate.
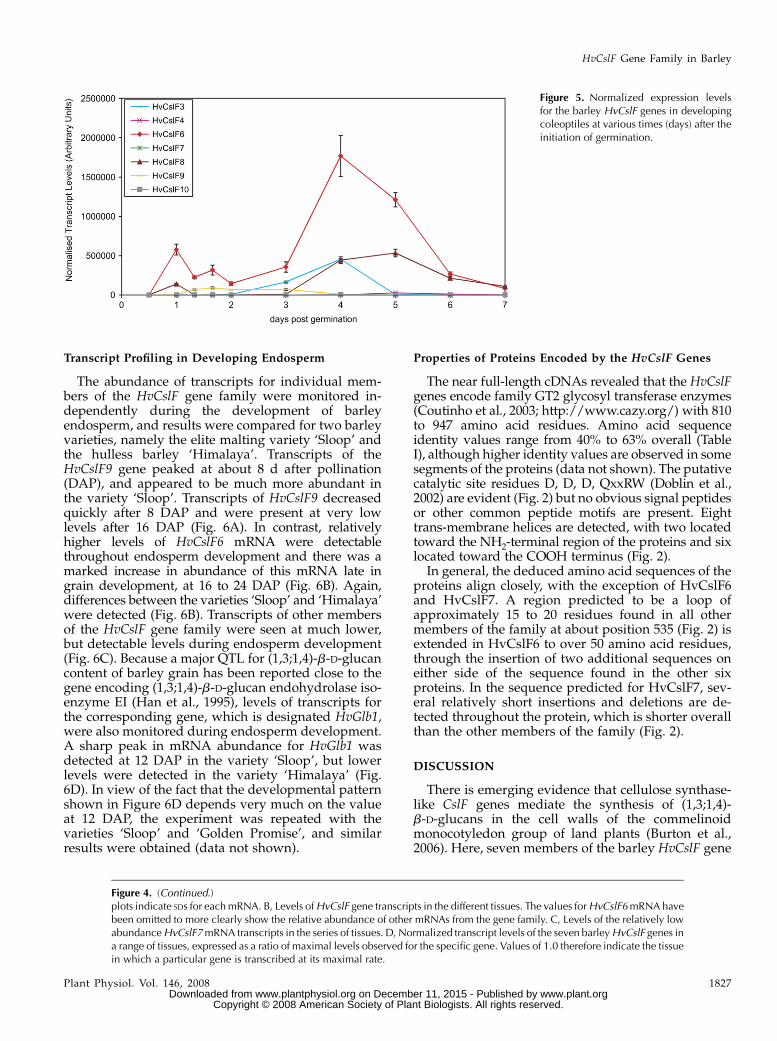
Figure 5. Normalized expression levelsfor the barley HvCslF genes in developingcoleoptiles at various times (days) after theinitiation of germination.
HvCslF Gene Family in Barley
Plant Physiol. Vol. 146, 2008 1827 www.plant.org on December 11, 2015 - Published by www.plantphysiol.orgDownloaded from
Copyright © 2008 American Society of Plant Biologists. All rights reserved.
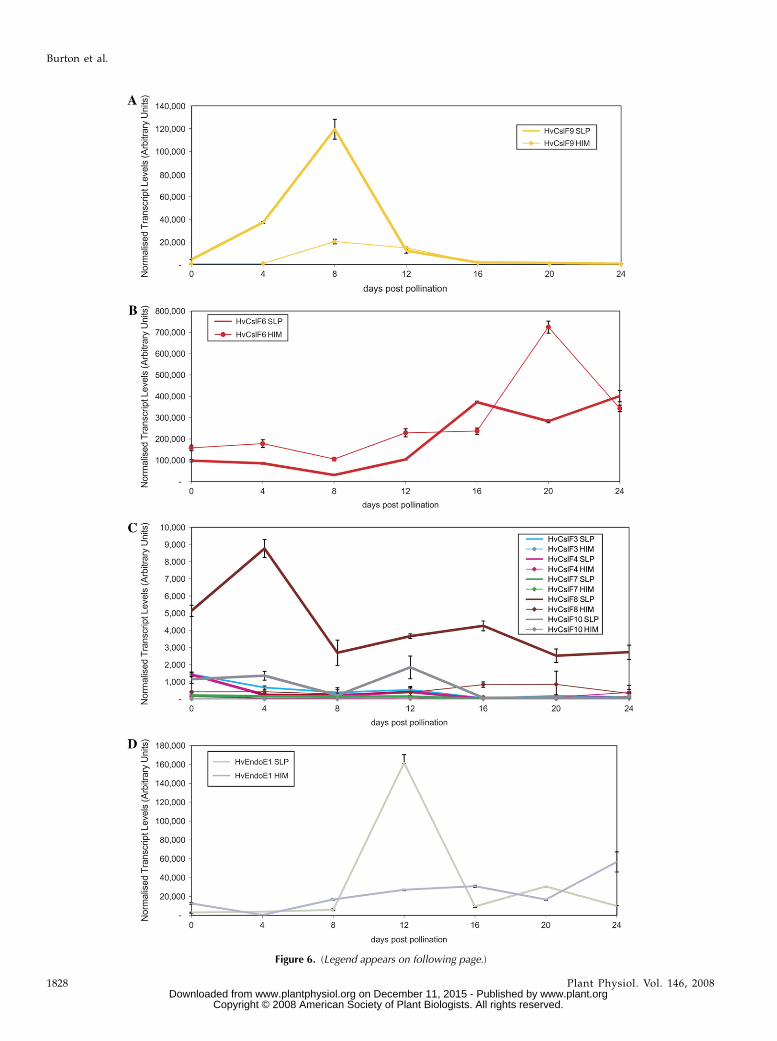
Figure 6. (Legend appears on following page.)
Burton et al.
1828 Plant Physiol. Vol. 146, 2008 www.plant.org on December 11, 2015 - Published by www.plantphysiol.orgDownloaded from
Copyright © 2008 American Society of Plant Biologists. All rights reserved.
family have been sequenced and characterized. Thegenes are 2.5 to 2.8 kb in length and orthologous CslFgenes from barley and rice contain either one or twointrons, located in the same positions (Fig. 2).
The initial identification of the rice OsCslF genes aspotential participants in (1,3;1,4)-b-D-glucan synthesiswas based upon QTL analyses in barley. Molecularmarkers flanking a major QTL on chromosome 2H for(1,3;1,4)-b-D-glucan content in ungerminated barleygrain (Han et al., 1995) were used to locate the syn-tenous region of the rice genome on chromosome 7, inwhich a cluster of six rice OsCslF genes within a 100-kbregion became prime candidates for a role in (1,3;1,4)-b-D-glucan synthesis (Burton et al., 2006). We havenow used gene-specific probes to screen a ‘Clipper’ 3‘Sahara’ barley doubled haploid mapping population(Karakousis et al., 2003) and have placed the individ-ual barley HvCslF genes on a genetic map (Fig. 3). Fourbarley genes, namely HvCslF3, HvCslF4, HvCslF8, andHvCslF10, mapped at the same position as the RFLPmarker abc468, which is in the centromeric region ofchromosome 2H. This map position is syntenouswith the position of the cluster of six OsCslF geneson rice chromosome 7 and falls within a chromosomeregion in which Han et al. (1995) detected a QTL thataccounted for about 19% of the variation in grain(1,3;1,4)-b-D-glucan content in a ‘Steptoe’ 3 ‘Morex’mapping population. No orthologs of the rice OsCslF1and OsCslF2 genes, which are also found in the ricecluster on chromosome 7, were detected in barley (Fig.1) but an additional barley gene, HvCslF10, which wasmost similar to HvCslF3, was located in this region ofbarley chromosome 2H (Fig. 3).
Examination of the nucleotide sequence identities ofthe barley HvCslF genes in the cluster on chromosome2H reveal values in the range of 53% to 69% (Table I).Thus, if the genes arose by duplication of a commonancestral gene in that region of the genome, there ap-pears to have been a high degree of sequence diver-gence. Similarly, the transcription patterns of theHvCslF3, HvCslF4, HvCslF8, and HvCslF10 genes aredivergent (Figs. 4, B and D). Transcript levels for thefour genes are relatively low during endosperm de-velopment, compared with those for HvCslF6 andHvCslF9, which may mean that the products of thegenes on chromosome 2H account for less of the grain(1,3;1,4)-b-D-glucan synthesis than products of thegenes on chromosomes 1H and 7H, or that HvCslFtranscript levels are not always indicative of the activ-ity of encoded enzymes or other cellular componentsthat are required for (1,3;1,4)-b-D-glucan synthesis in
the grain. It must be borne in mind that the QTLsmight also be related to the positions of regulatorygenes that control HvCslF expression.
The other major QTL for (1,3;1,4)-b-D-glucan contentin barley grain identified by Han et al. (1995) waslocated on chromosome 1H and accounted for about15% of the variation in grain (1,3;1,4)-b-D-glucan con-tent. In the ‘Clipper’ 3 ‘Sahara’ population used here,the HvCslF9 gene mapped near the centromere ofchromosome 1H (Fig. 3). In the same region of barleychromosome 1H, Han et al. (1995) detected overlappingQTLs for (1,3;1,4)-b-D-glucan content in ungerminatedbarley grain (Fig. 3), for malt (1,3;1,4)-b-D-glucan con-tent, and for malt (1,3;1,4)-b-D-glucan endohydrolaseactivity. They suggested that all of these QTLs may beattributable to HvGlb1, which encodes barley (1,3;1,4)-b-D-glucan endohydrolase isoenzyme EI (Woodwardand Fincher, 1982; Slakeski et al., 1990). An alternativeexplanation, however, is that grain (1,3;1,4)-b-D-glucancontent is influenced by the expression of HvCslF9during grain development, while malt (1,3;1,4)-b-D-glucan content and malt (1,3;1,4)-b-D-glucanase activityare influenced by expression of the HvGlb1 gene duringgermination. Consistent with this, the test statistics (logof the odds scores) reported by Han et al. (1995) forgrain (1,3;1,4)-b-D-glucan content are statistically sig-nificant across a broad region that encompasses boththe HvCslF9 and HvGlb1 loci (Fig. 3), and the QTL peakfor (1,3;1,4)-b-D-glucan content in grain does not coin-cide with the peaks for (1,3;1,4)-b-D-glucan contentin malt and (1,3;1,4)-b-D-glucanase activity in malt(Han et al., 1995). Nevertheless, it is possible that(1,3;1,4)-b-D-glucan content in grain is influenced bythe expression of both HvCslF9 and HvGlb1 duringgrain development.
If this were the case, one would expect to seetranscripts for both genes in the developing endo-sperm. The data presented in Figure 6, A and D,confirm that both genes are transcribed in developingendosperm, albeit transiently and at different stages ofendosperm development. While we have not tested for(1,3;1,4)-b-D-glucanase activity in these extracts, thereis some evidence from other sources that hydrolyticenzymes might participate in polysaccharide biosyn-thesis during wall assembly. Thus, mutations in theArabidopsis KOR gene, which encodes a (1,4)-b-D-glucanase, lead to large reductions in wall cellulose.The possible point of participation of hydrolytic en-zymes in cellulose synthesis is unknown, but thehydrolase could be involved in trimming or editingnascent cellulose chains (Szyjanowicz et al., 2004), or
Figure 6. A, Normalized transcript levels of the barley HvCslF9 genes in developing endosperm at various times postpollination.The two data sets are for the variety ‘Sloop’ (SLP) and ‘Himalaya’ (HIM). B, Levels of the HvCslF6 gene transcripts in developingendosperm at various times postpollination. The two data sets are for the variety ‘Sloop’ (SLP) and ‘Himalaya’ (HIM). C, Levels ofHvCslF mRNA for genes that are transcribed at lower levels in the developing endosperm. The two data sets are for the variety‘Sloop’ (SLP) and ‘Himalaya’ (HIM). D, Levels of HvGlb1 mRNA transcripts in developing endosperm at various timespostpollination. The HvGlb1 gene encodes barley (1,3;1,4)-b-D-glucan endohydrolase isoenzyme EI. The two data sets are forthe variety ‘Sloop’ (SLP) and ‘Himalaya’ (HIM).
HvCslF Gene Family in Barley
Plant Physiol. Vol. 146, 2008 1829 www.plant.org on December 11, 2015 - Published by www.plantphysiol.orgDownloaded from
Copyright © 2008 American Society of Plant Biologists. All rights reserved.
possibly in releasing newly synthesized chains fromthe biosynthetic enzymes (Farrokhi et al., 2006).
The HvCslF6 gene mapped near the centromere ofchromosome 7H (Fig. 3) in a position that correspondswell with those of previously reported QTLs affectinggrain (1,3;1,4)-b-D-glucan content in a ‘Derkado’ 3‘B83-12/21/5’ mapping population (Igartua et al.,2002) and in a ‘Beka’ 3 ‘Logan’ population (Molina-Cano et al., 2007). A contribution by the HvCslF6 geneto these QTLs is consistent with the relatively highlevels of HvCslF6 gene transcripts in the developingendosperm (Fig. 6B). Kim et al. (2004) have alsoreported QTLs for grain (1,3;1,4)-b-D-glucan contenton chromosome 7H, one of which is close to the HvGlb2gene that encodes (1,3;1,4)-b-D-glucanase isoenzymeEII (Fig. 3). Overall, there is considerable correspon-dence between published QTL map positions and themap positions of the HvCslF genes (Fig. 3).
The levels of (1,3;1,4)-b-D-glucan in cell walls ofdifferent tissues and organs of barley vary from about5% by weight in walls from stems to as much as 70% ormore by weight in walls of the starchy endosperm(Fincher and Stone, 2004). More detailed analyses oftranscript abundance during the growth and develop-ment of barley coleoptiles showed that HvCslF6mRNA was again the most abundant (Fig. 5), althoughsignificant levels of HvCslF8 and HvCslF3 transcriptswere also detected (Fig. 5). The peak in HvCslF6transcript abundance at 4 to 5 d after germinationcorresponds to the time when elongation of the cole-optile ceases, the leaf breaks out of the coleoptile, andmaturation of the coleoptile begins (Gibeaut et al.,2005). It also corresponds to the time at which levels of(1,3;1,4)-b-D-glucan peak in coleoptiles, at about 10mol % of the walls (Gibeaut et al., 2005).
As mentioned above, the most abundant mRNAtranscripts in developing barley endosperm are thosefrom the HvCslF6 and HvCslF9 genes (Fig. 6, A and B).However, transcriptional activities of the two genesvary both with respect to the amount of mRNA and tothe timing of transcription. The transcription of theHvCslF9 gene peaks at about 8 DAP, at a stage whencellularization of the endosperm is complete andstarch deposition has commenced; (1,3;1,4)-b-D-glucan
is detectable in endosperm walls from 5 DAP onward(Wilson et al., 2006). In contrast, HvCslF6 transcriptsare detected at much higher levels throughout endo-sperm development, even before (1,3;1,4)-b-D-glucansappear in the walls (Fig. 6B; Wilson et al., 2006). Fromabout 12 to 20 DAP there are further increases in theabundance of HvCslF6 transcripts (Fig. 6B). The lattertranscriptional patterns are consistent with earlierwork on the development of (1,3;1,4)-b-D-glucan inbarley grain, where a late increase in (1,3;1,4)-b-D-glucan was reported (Coles, 1979). Perhaps not sur-prisingly, variations in transcript levels of the HvCslF6,HvCslF9, and HvCslF8 genes were also observed be-tween different barley varieties (Fig. 6, A, B, and C,respectively), consistent with the fact that QTLs for(1,3;1,4)-b-D-glucan content have been detected inchromosomal regions where these genes are located.Transcript levels of the HvCslF9 gene are much higherin the malting quality variety ‘Sloop’ than in thehulless variety ‘Himalaya’ during the cellularizationstage of initial wall development (Fig. 6A), while levelsof the most abundant mRNA, from the HvCslF6 gene,are higher in ‘Himalaya’ than in ‘Sloop’ during most ofendosperm development, and particularly at 20 DAP(Fig. 6B). These HvCslF6 transcript levels are consistentwith the generally higher levels of (1,3;1,4)-b-D-glucanin ‘Himalaya’, which are typically 6% by weight, thanin ‘Sloop’, where 3% to 4% by weight (1,3;1,4)-b-D-glucanis normally found in mature grain (A.J. Box, R.A.Burton, H.M. Collins, S.A. Jobling, unpublished data).
In making these comparisons, which suggest thatHvCslF transcript abundance is related temporally andspatially to the deposition of (1,3;1,4)-b-D-glucan in arange of organs and tissues, it is important to empha-size again that abundance of transcripts encoding aparticular isoenzyme might not necessarily be a goodindicator of enzyme activity or of (1,3;1,4)-b-D-glucandeposition in the wall. For example, the HvCslF en-zymes encoded by low abundance mRNAs might bejust as important as, or even more important than, theHvCslF6 and HvCslF9 enzymes for the deposition of(1,3;1,4)-b-D-glucan in developing grain. This possibilityis exemplified by the observation that one starchbranching isoenzyme (SBEII) makes up only 2% of the
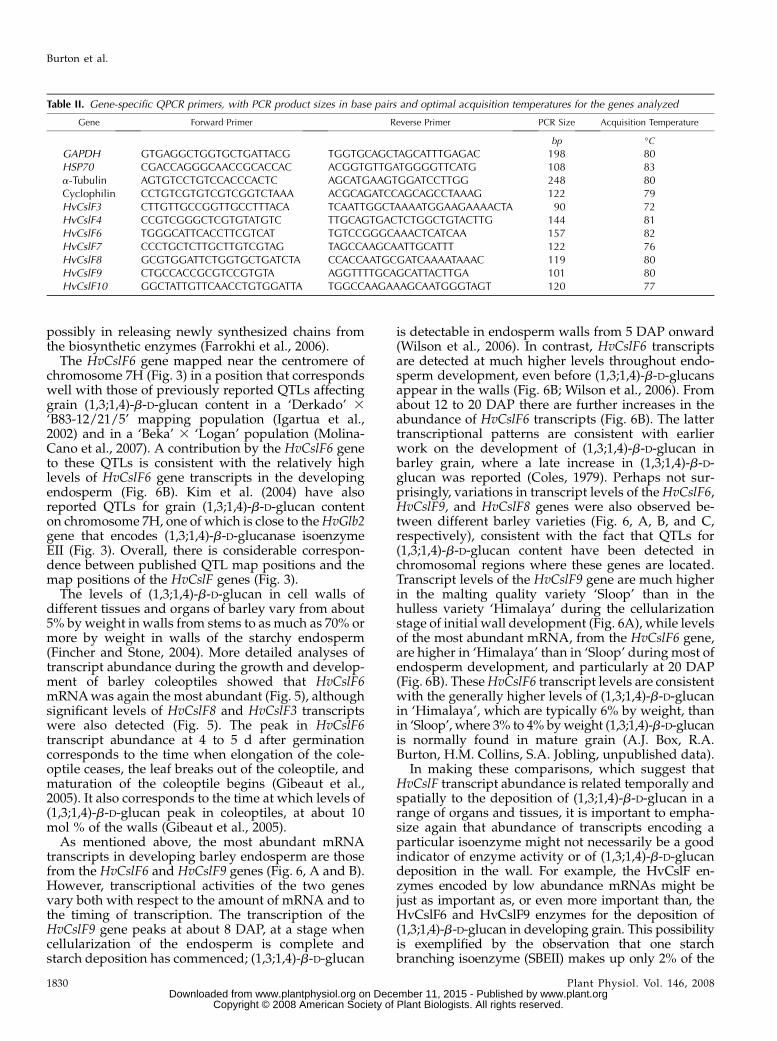
Table II. Gene-specific QPCR primers, with PCR product sizes in base pairs and optimal acquisition temperatures for the genes analyzed
Gene Forward Primer Reverse Primer PCR Size Acquisition Temperature
bp �CGAPDH GTGAGGCTGGTGCTGATTACG TGGTGCAGCTAGCATTTGAGAC 198 80HSP70 CGACCAGGGCAACCGCACCAC ACGGTGTTGATGGGGTTCATG 108 83a-Tubulin AGTGTCCTGTCCACCCACTC AGCATGAAGTGGATCCTTGG 248 80Cyclophilin CCTGTCGTGTCGTCGGTCTAAA ACGCAGATCCAGCAGCCTAAAG 122 79HvCslF3 CTTGTTGCCGGTTGCCTTTACA TCAATTGGCTAAAATGGAAGAAAACTA 90 72HvCslF4 CCGTCGGGCTCGTGTATGTC TTGCAGTGACTCTGGCTGTACTTG 144 81HvCslF6 TGGGCATTCACCTTCGTCAT TGTCCGGGCAAACTCATCAA 157 82HvCslF7 CCCTGCTCTTGCTTGTCGTAG TAGCCAAGCAATTGCATTT 122 76HvCslF8 GCGTGGATTCTGGTGCTGATCTA CCACCAATGCGATCAAAATAAAC 119 80HvCslF9 CTGCCACCGCGTCCGTGTA AGGTTTTGCAGCATTACTTGA 101 80HvCslF10 GGCTATTGTTCAACCTGTGGATTA TGGCCAAGAAAGCAATGGGTAGT 120 77
Burton et al.
1830 Plant Physiol. Vol. 146, 2008 www.plant.org on December 11, 2015 - Published by www.plantphysiol.orgDownloaded from
Copyright © 2008 American Society of Plant Biologists. All rights reserved.

total SBE enzymes in potato (Solanum tuberosum) tubers,but has a major effect on amylose content (Jobling et al.,1999). It has also been reported that the (1,3;1,4)-b-D-glucan content of barley grain is affected in large degreeby environmental factors, in particular by dry condi-tions toward the end of grain maturation (Fastnaughtet al., 1996; Hang et al., 2007). In contrast to the situationwith barley HvCesA genes, which appear to be cotran-scribed to form enzyme complexes that might consist ofthree different HvCesA isoenzymes (Burton et al., 2004),at this stage we have not been able to detect any cor-relations in the transcript levels of different HvCslF genes.
Although the rice OsCslF genes appear to be in-volved in (1,3;1,4)-b-D-glucan synthesis (Burton et al.,2006) and the QTL analyses performed here (Fig. 3)support a similar role for the HvCslF genes in barley, itremains possible or even likely that the biosynthesis of(1,3;1,4)-b-D-glucan requires a multienzyme complexand that an individual CslF isoenzyme represents justone component of such a complex. Furthermore, thereare a number of fine structural features of cereal(1,3;1,4)-b-D-glucans that have not yet been character-ized at the biosynthetic level. In particular, the(1,3;1,4)-b-D-glucans of the commelinoid monocotyle-dons consist of a backbone of (1,3)- and (1,4)-linkedb-D-glucosyl residues that are not arranged at random,but nevertheless have a degree of structural order(Staudte et al., 1983). The (1,3;1,4)-b-D-glucans frombarley usually have two or three adjacent (1,4)-linkedb-D-glucosyl residues separated by a single (1,3)-linked b-D-glucosyl residue. The molecules have there-fore been likened to a polymer of cellotriosyl andcellotetraosyl residues linked by single (1,3)-b-linkages.The irregular distribution of the (1,3)-b-linkages alongthe polysaccharide chain (Staudte et al., 1983) meansthat there is no strictly repeating structure (Fincherand Stone, 2004). In addition, a small proportion of muchlonger blocks of adjacent (1,4)-linked b-D-glucosylresidues are found in the polysaccharide. The com-plexity of this structure can be related to the functionof (1,3;1,4)-b-D-glucans in cell walls (Fincher and Stone,2004), and is also suggestive of a similar complexity inthe enzymology of (1,3;1,4)-b-D-glucan biosynthesis(Buckeridge et al., 2001), where one might again inferthat multiple enzymes are required.
To further confirm the participation of HvCslF genesin (1,3;1,4)-b-D-glucan synthesis, we are attempting tomanipulate levels of (1,3;1,4)-b-D-glucan, in both vege-tative tissues and grain, through transgenic approaches.Altering the levels of (1,3;1,4)-b-D-glucan in walls ofcereals and grasses could find applications in humanand animal nutrition, or in the malting and brewingindustries. Barley (1,3;1,4)-b-D-glucans are beneficial tohuman health, where they represent soluble dietaryfiber and appear to reduce the risks of colorectal cancer,high serum cholesterol, and cardiovascular disease,obesity, and non-insulin-dependent diabetes (Brennanand Cleary, 2005). On the other hand, (1,3;1,4)-b-D-glucans are considered to be antinutritive in feedformulations for monogastric animals and have unde-
sirable effects in cereal processing applications such asmalting and brewing (Brennan and Cleary, 2005). Theavailability of information on the HvCslF gene family,together with the transcriptional profiles presentedhere, have allowed the identification of target genesfor manipulation, depending on whether the objectiveis to increase or decrease (1,3;1,4)-b-D-glucan levels ingrains, or in vegetative tissues. It should now be pos-sible to exploit this information in breeding programs,either through a transgenic approach, or through theanalysis of natural variation in HvCslF gene structure,HvCslF gene transcription rates, and (1,3;1,4)-b-D-glucan levels in mapping and mutant populations, orin germplasm collections.
MATERIALS AND METHODS
Plant Material
Barley (Hordeum vulgare) ‘Golden Promise’, ‘Himalaya’, and ‘Sloop’ were
grown under standard glasshouse conditions as described in Burton et al.
(2004). ‘Golden Promise’ is a malting cultivar adapted to the northern United
Kingdom, ‘Himalaya’ is a hulless variety that has been used extensively in
studies of grain germination, and ‘Sloop’ is an elite Australian malting variety.
The tissue series cDNAs used for Q-PCR were prepared as described by
Burton et al. (2004). The RNA extracts from coleoptiles were prepared from
young seedlings grown in vermiculite in the dark at room temperature
(Gibeaut et al., 2005). Coleoptiles were dissected away from seedling leaves
1 to 7 d after imbibition of the grain. To collect endosperm from developing
grain, spikes were hand pollinated and bagged at anthesis, and the develop-
ing caryopses collected at regular intervals after pollination. Conditions were
maintained as described previously to ensure that the transcript analyses
could be related to specific stages of grain development, as defined by high-
resolution electron microscopy (Wilson et al., 2006). The entire caryopsis was
collected at anthesis for the 0-DAP sample. The liquid endosperm was
squeezed out of the developing caryopses up to 6 DAP, after excising the
embryo with a scalpel blade. The endosperm was collected with a fine pipette
tip and frozen in liquid nitrogen. The cellularized endosperm was collected
from 6 DAP onward after removing the maternal pericarp and the embryo.
Multiple endosperms from grain on at least three different spikes were
collected and combined before RNA extraction.
RNA Isolation and cDNA Synthesis
Total RNA was extracted from all tissue homogenates using a phenol-
guanidine reagent, treated with the DNA-free kit (Ambion), and used as the
template for cDNA synthesis as described in Burton et al. (2004) except that
Superscript III reverse transcriptase (Invitrogen) was used in preference to
Superscript II and the reaction was incubated at 50�C.
SMART RACE PCR, cDNA Cloning, and Sequencing
Total RNA extracted from various tissues as described above was used as
the template to make both 3# and 5# SMART cDNA populations using a
SMART RACE kit according to the manufacturer’s instructions (Clontech).
Aliquots of the cDNA were used in PCR reactions with a universal primer
(Clontech), gene-specific primers, and the BD Advantage2 Taq polymerase,
according to the manufacturer’s guidelines, to amplify fragments from the 3#or 5# ends of the cDNA. Products were either purified using Macherey Nagel
Nucleospin columns and sequenced on an Applied Biosystems 3700 at the
Australian Genome Research Facility, or cloned into pGEM-TEasy (Pro-
mega). Plasmids containing inserts were prepared using a plasmid kit
(QIAGEN) according to the manufacturer’s instructions and sequenced.
SMART cDNA populations synthesized from RNAs extracted from the
various tissues were also used as templates for the eventual isolation of
full-length cDNAs, using gene-specific primers designed to the 5# and 3#untranslated regions.
HvCslF Gene Family in Barley
Plant Physiol. Vol. 146, 2008 1831 www.plant.org on December 11, 2015 - Published by www.plantphysiol.orgDownloaded from
Copyright © 2008 American Society of Plant Biologists. All rights reserved.

Contig Assembly and Bioinformatics
EST sequences, RACE fragments, and genomic sequences were assembled
into contigs (contiguous sequences) using the program ContigExpress, which
is part of the Vector NTI Advance 9.1.0 (Invitrogen) suite of programs.
Pairwise sequence alignments were performed using the EMBOSS Pair-
wise Alignment Algorithm at the EMBL-EBI Web site (http://www.ebi.ac.uk/
emboss/align/) with the EMBOSSTneedle (global) method and default
settings selected. Full-length amino acid sequences of all barley and rice
(Oryza sativa) CslF proteins were aligned and a phylogenetic tree generated
using the program ClustalX (Thompson et al., 1997). The phylogenetic tree
was visualized using Treeview 1.6.6 (Page, 1996). Transmembrane helices
were predicted using the program TMHMM (http://www.cbs.dtu.dk/services/
TMHMM-2.0/; Krogh et al., 2001).
BAC Sequencing and Genomic Cloning
Three BACs carrying inserts of the barley genomic DNA from ‘Morex’
were identified after hybridization of the BAC library with a consensus barley
HvCslF probe, using standard BAC library screening methods. The BAC
clones were sequenced to 33 coverage and the sequences were aligned by the
Beijing Genomics Institute, China. Contiguous sequences were assembled
using Contig Express in the VectorNTI suite of programs (Invitrogen). Full-
length genomic clones of HvCsl3, HvCsl4, HvCsl6, HvCsl7, HvCsl8, HvCsl9, and
HvCsl10 were amplified from genomic DNA and sequenced on an Applied
Biosystems 3700 sequencer at the Australian Genome Resource Facility,
Brisbane.
Genetic Mapping
All the HvCslF genes were assigned to chromosomes using wheat-barley
addition lines (Islam et al., 1981). Filters of digested genomic DNA for
Southern hybridization analyses of the barley doubled haploid mapping
population ‘Clipper’ 3 ‘Sahara’ (Karakousis et al., 2003) were hybridized with
probes derived from either the promoter or the 3# untranslated regions of each
HvCslF gene. This revealed polymorphisms between ‘Clipper’ and ‘Sahara’
for the HvCslF4, HvCsl6, HvCsl7, HvCsl8, and HvCsl10 genes. All genes were
mapped using Map Manager QT version 0.30 (Manly et al., 2001).
Real-Time Q-PCR
Real-time Q-PCR was carried out essentially as outlined in Burton et al.
(2004) with the following modifications. To provide a template for the
standard curve, between four and six 20-mL PCR reaction mixtures were
combined for purification by HPLC using a HELIX DNA DVB 50- 3 3.0-mm
monolithic polymer reversed-phase column (Varian). Chromatography was
performed using buffer A (100 mM triethylammonium acetate [Applied
Biosystems] and 0.1 mM EDTA) and buffer B (100 mM triethylammonium
acetate, 0.1 mM EDTA and 75% acetonitrile). The gradient was as follows: time
0 min, 10% buffer B; time 6 min, 21.5% buffer B; time 7 min, 21.5% buffer B;
time 8 min, 10% buffer B; time 12 min, 10% buffer B. The flow rate was 0.45
mL/min and the temperature was 50�C. Three replicates of each of the seven
standard concentrations were included with every Q-PCR experiment to-
gether with a minimum of three no-template controls. Q-PCR experiments
were assembled by the liquid-handling robot CAS-1200 robot (Corbett Ro-
botics). Three replicate PCRs for each of the cDNAs were included in every
run containing: 2 mL of cDNA solution, the diluted standard, or water was
used in a reaction containing 5 mL of IQ SYBR Green PCR reagent (Bio-rad
Laboratories), 1.2 mL of each of the forward and reverse primers at 4 mM, 0.3
mL of 103 SYBR Green in water, and 0.3 mL of water. The total volume of the
PCR reactions was 10 mL. Reactions were performed in an RG 6000 Rotor-
Gene real-time thermal cycler (Corbett Research): 3 min at 95�C followed by 45
cycles of 1 s at 95�C, 1 s at 55�C, 30 s at 72�C, and 15 s at the optimal acquisition
temperature described in Table II. The transcript levels of genes encoding
glyceraldehyde 3-phosphate dehydrogenase, heat shock protein 70, cyclo-
philin, and a-tubulin were used as controls (Table II), and these correspond to
those listed in table IV of Burton et al. (2004). Normalization was carried out
using multiple control genes as described by Burton et al. (2004) and the final
concentrations of mRNAs of the genes of interest are expressed as arbitrary
units that represent the numbers of copies per microliter of cDNA, normalized
against the geometric means of the three control genes that vary the least with
respect to each other (Vandesompele et al., 2002).
Sequence data from this article can be found in the GenBank/EMBL data
libraries under accession numbers EU267179 to EU267185.
ACKNOWLEDGMENTS
We are grateful to Jacinda Rethus, Anne Medhurst, and Robin Chapple for
their assistance in various aspects of the work, to Ursula Langridge for her
expertise in plant care, and to Margie Pallotta for her ongoing assistance with
the genetic mapping of genes.
Received December 13, 2007; accepted January 31, 2008; published February 7,
2008.
LITERATURE CITED
Brennan CS, Cleary LJ (2005) The potential use of (1/3,1/4)-b-D-glucans
as functional food ingredients. J Cereal Sci 42: 1–13
Buckeridge MS, Vergara CE, Carpita NC (2001) Insight into multi-site
mechanisms of glycosyl transfer in (1/4)-beta-D-glycans provided by
the cereal mixed-linkage (1/3),(1/4)beta-D-glucan synthase. Phyto-
chemistry 57: 1045–53
Burton RA, Shirley NJ, King BJ, Harvey AJ, Fincher GB (2004) The CesA
gene family of barley (Hordeum vulgare): quantitative analysis of tran-
scripts reveals two groups of co-expressed genes. Plant Physiol 134:
224–236
Burton RA, Wilson SM, Hrmova M, Harvey AJ, Shirley NJ, Medhurst A,
Stone BA, Newbigin EJ, Bacic A, Fincher GB (2006) Cellulose synthase-
like CslF genes mediate the synthesis of cell wall (1,3;1,4)-b-D-glucans.
Science 311: 1940–1942
Carpita NC, Defernez M, Findlay K, Wells B, Shoue DA, Catchpole G,
Wilson RH, McCann MC (2001) Cell wall architecture of the elongating
maize coleoptile. Plant Physiol 127: 551–565
Cocuron JC, Lerouxel O, Drakakaki G, Alonso AP, Liepman AH, Keegstra
K, Raikhel N, Wilkerson CG (2007) A gene from the cellulose synthase-
like C family encodes a beta-1,4 glucan synthase. Proc Natl Acad Sci
USA 104: 8550–8555
Coles G (1979) Relationship of mixed link beta-glucan accumulation to
accumulation of free sugars and other glucans in the developing barley
endosperm. Carlsberg Res Commun 44: 439–453
Coutinho PM, Henrissat B (1999) Carbohydrate-active enzymes: an inte-
grated database approach. In HJ Gilbert, GJ Davies, B Henrissat, B
Svensson, eds, Recent Advances in Carbohydrate Bioengineering:
Carbohydrate-Active Enzymes: An Integrated Database Approach.
The Royal Society of Chemistry, Cambridge, UK, pp 3–12
Coutinho PM, Deleury E, Davies GJ, Henrissat B (2003) An evolving
hierarchical family classification for glycosyltransferases. J Mol Biol 328:
307–317
Dhugga KS, Barreiro R, Whitten B, Stecca K, Hazebroek J, Randhawa GS,
Dolan M, Kinney AJ, Tomes D, Nichols S, et al (2004) Guar seed beta-
mannan synthase is a member of the cellulose synthase super gene
family. Science 303: 363–366
Doblin MS, Kurek I, Jacob-Wilk D, Delmer DP (2002) Cellulose biosyn-
thesis in plants: from genes to rosettes. Plant Cell Physiol 43: 1407–1420
Faik A, Price N, Raikhel N, Keegstra K (2002) An Arabidopsis gene
encoding an alpha-xylosyltransferase involved in xyloglucan biosyn-
thesis. Proc Natl Acad Sci USA 28: 7797–7802
Farrokhi N, Burton RA, Brownfield L, Hrmova M, Wilson SM, Bacic A,
Fincher GB (2006) Plant cell wall biosynthesis: genetic, biochemical and
functional genomics approaches to the identification of key genes. Plant
Biotechnol J 4: 145–167
Fastnaught CE, Berglund PT, Helm ET, Fox GJ (1996) Genetic and envi-
ronmental variation in beta-glucan content and quality parameters of
barley for food. Crop Sci 36: 941–946
Fincher GB, Stone BA (2004) Chemistry of non-starch polysaccharides
from cereal grains. In C Wrigley, H Corke, CE Walker, eds, Encyclopedia
of Grain Science, Vol 1. Elsevier Academic Press, Oxford, pp 206–223
Gibeaut DM, Pauly M, Bacic A, Fincher GB (2005) Changes in cell wall
composition in developing barley (Hordeum vulgare) coleoptiles. Planta
221: 729–738
Han F, Ullrich S, Chirat S, Menteur S, Jestin L, Sarrafi A, Hayes P, Jones B,
Blake T, Wesenberg D, et al (1995) Mapping of beta-glucan content and
Burton et al.
1832 Plant Physiol. Vol. 146, 2008 www.plant.org on December 11, 2015 - Published by www.plantphysiol.orgDownloaded from
Copyright © 2008 American Society of Plant Biologists. All rights reserved.

beta-glucanase activity loci in barley grain and malt. Theor Appl Genet
91: 921–927
Hang A, Obert D, Gironella AIN, Burton CS (2007) Barley amylose and
beta-glucan: their relationships to protein, agronomic traits, and envi-
ronmental factors. Crop Sci 47: 1754–1760
Hazen S, Scott-Craig J, Walton J (2002) Cellulose synthase-like genes of
rice. Plant Physiol 128: 336–340
Igartua E, Hayes PM, Thomas WTB, Meyer R, Mather DE (2002) Genetic
control of quantitative grain and malt quality traits in barley. J Crop
Prod 5: 131–164
Islam AKMR, Shepherd KW, Sparrow DHB (1981) Isolation and charac-
terization of euplasmic wheat-barley chromosome addition lines.
Heredity 46: 161–174
Jobling SA, Schwall GP, Westcott RJ, Sidebottom CM, Debet M, Gidley
MJ, Jeffcoat R, Safford R (1999) A minor form of starch branching
enzyme in potato (Solanum tuberosum L.) tubers has a major effect on
starch structure: cloning and characterisation of multiple forms of SBE
A. Plant J 18: 163–71
Karakousis A, Gustafson JP, Chalmers KJ, Barr AR, Langridge P (2003) A
consensus map of barley integrating SSR, RFLP and AFLP markers.
Aust J Agric Res 54: 1173–1185
Kim HS, Park KG, Baek SB, Son YG, Lee CW, Kim JC, Kim JG, Nam JH
(2004) Inheritance of (1-3)(1-4)-beta-D-glucan content in barley (Hordeum
vulgare L.). Proc 9th Int Barley Genet Symp Brno, Czech Republic, pp 543–548
Krogh A, Larsson B, von Heijne G, Sonnhammer ELL (2001) Predicting
transmembrane protein topology with a hidden Markov model: appli-
cation to complete genomes. J Mol Biol 305: 567–580
Lee C, O’Neill MA, Tsumuraya Y, Darvill AG, Ye ZH (2007) The irregular
xylem9 mutant is deficient in xylan xylosyltransferase activity. Plant
Cell Physiol 48: 1624–1634
Liepman AH, Nairn CJ, Willats WG, Sørensen I, Roberts AW, Keegstra K
(2007) Functional genomic analysis supports conservation of function
among cellulose synthase-like a gene family members and suggests
diverse roles of mannans in plants. Plant Physiol 143: 1881–1893
Manly KF, Cudmore RH, Jr., Meer JM (2001) Map Manager QTX, cross-
platform software for genetic mapping. Mamm Genome 12: 930–932
Mitchell RA, Dupree P, Shewry PR (2007) A novel bioinformatics ap-
proach identifies candidate genes for the synthesis and feruloylation of
arabinoxylan. Plant Physiol 144: 43–53
Molina-Cano JL, Moralejo M, Elia M, Munoz P, Russell JR, Perez-
Vendrell AM, Ciudad F, Swanston JS (2007) QTL analysis of a cross
between European and North American malting barleys reveals a
putative candidate gene for beta-glucan content on chromosome 1H.
Mol Breed 19: 275–284
Page RDM (1996) TREEVIEW: an application to display phylogenetic trees
on personal computers. Comput Appl Biosci 12: 357–358
Pena MJ, Zhong R, Zhou GK, Richardson EA, O’Neill MA, Darvill AG,
York WS, Ye ZH (2007) Arabidopsis irregular xylem8 and irregular
xylem9: implications for the complexity of glucuronoxylan biosynthe-
sis. Plant Cell 19: 549–563
Richmond T, Somerville C (2000) The cellulose synthase superfamily.
Plant Physiol 124: 495–498
Slakeski N, Baulcombe DC, Devos KM, Ahluwalia B, Doan DNP, Fincher GB
(1990) Structure and tissue-specific regulation of genes encoding barley
(1/3,1/4)-b-glucan endohydrolases. Mol Gen Genet 224: 437–449
Somerville C, Bauer S, Brininstool G, Facette M, Hamann T, Milne J,
Osborne E, Paredez A, Persson S, Raab T, et al (2004) Toward a systems
approach to understanding plant cell walls. Science 306: 2206–2211
Staudte RG, Woodward JR, Fincher GB, Stone BA (1983) Water-soluble
(1/3),(1)4)-b-D-glucans from barley (Hordeum vulgare) endosperm.
III. Distribution of cellotriosyl and cellotetraosyl residues. Carbohydr
Polym 3: 299–312
Stein N, Prasad M, Scholz U, Thiel T, Zhang H, Wolf M, Kota R, Varshney
RK, Perovic D, Grosse I, et al (2007) A 1,000-loci transcript map of the
barley genome: new anchoring points for integrative grass genomics.
Theor Appl Genet 114: 823–839
Sterling JD, Atmodjo MA, Inwood SE, Kumar Kolli VS, Quigley HF,
Hahn MG, Mohnen D (2006) Functional identification of an Arabidop-
sis pectin biosynthetic homogalacturonan galacturonosyltransferase.
Proc Natl Acad Sci USA 28: 5236–5241
Szyjanowicz PM, McKinnon I, Taylor NG, Gardiner J, Jarvis MC,
Turner SR (2004) The irregular xylem 2 mutant is an allele of korrigan
that affects the secondary cell wall of Arabidopsis thaliana. Plant J 37:
730–740
Thompson JD, Gibson TJ, Plewniak F, Jeanmougin F, Higgins DG (1997)
The ClustalX windows interface: flexible strategies for multiple se-
quence alignment aided by quality analysis tools. Nucleic Acids Res 25:
4876–4882
Trethewey JAK, Campbell LM, Harris PJ (2005) (1/3),(1/4)-beta-D-
glucans in the cell walls of the Poales (sensu lato): an immunogold
labeling study using a monoclonal antibody. Am J Bot 92: 1660–1674
Vandesompele J, De Preter K, Pattyn F, Poppe B, Van Roy N, De Paepe A,
Speleman F (2002) Accurate normalization of real-time quantitative
RTPCR data by geometric averaging of multiple internal control genes.
Genome Biol 3: 1–11
Wilson SM, Burton RA, Doblin MS, Stone BA, Newbigin EJ, Fincher GB,
Bacic A (2006) Temporal and spatial appearance of wall polysaccharides
during cellularization of barley (Hordeum vulgare) endosperm. Planta
224: 655–667
Woodward JR, Fincher GB (1982) Purification and chemical properties of
two 1,3:1,4-b-glucan endohydrolases from germinating barley. Eur J
Biochem 121: 663–669
HvCslF Gene Family in Barley
Plant Physiol. Vol. 146, 2008 1833 www.plant.org on December 11, 2015 - Published by www.plantphysiol.orgDownloaded from
Copyright © 2008 American Society of Plant Biologists. All rights reserved.