COMPREHENSIVE LONG TERM MODELING OF THE DYNAMICS OF INVESTMENT AND GROWTH IN ELECTRIC POWER SYSTEMS
10
PRESENTED AT THE 2004 EPNES WORKSHOP, MAYAGUEZ, PUERTO RICO, JULY 12-14, 2004. COMPREHENSIVE LONG TERM MODELING OF THE DYNAMICS OF INVESTMENT AND GROWTH IN ELECTRIC POWER SYSTEMS A. Dimitrovski, M. Gebremicael and K. Tomsovic, School of Electrical Engineering and Computer Science A. Ford and K. Vogstad, Program in Environmental Sciences and Regional Planning Washington State University, Pullman ABSTRACT This paper discusses our recent research on the interplay between the economic, technical, social and environmental factors that influence the production, transmission and consumption of electric energy. We are developing computer models of these interactions suitable for use by both policy makers and researchers. The main effort is focused on the development of simulation models, which extend beyond traditional disciplinary boundaries. Such models will enable us to simulate short-term behavior, such as, electricity prices and congestion in the near term, and long-term behavior, such as, investment in new generation and transmission. Our emphasis in this report is on models for tradeable green certificates, transmission network models in system dynamic studies and our benchmark systems for the Western US and West African electric power systems. KEY WORDS Interdisciplinary modeling, power plant construction, power system planning, system dynamics, transmission congestion, tradeable green certificates. 1 INTRODUCTION Arguments of the benefit for the deregulation of the electric power system have been largely based on conventional and general wisdom regarding separate topics such as competition, service reliability, economic efficiency and environmental protection. Few have looked carefully at the interplay between the economic, technical, social and environmental factors that influence the production, transmission and consumption of electric energy. Further, no one has carefully investigated the long term dynamics of the process that includes an understanding of the necessary engineering. Our research is developing models to study the long terms effects of deregulation, including interactions between regulatory policy, investor behavior, environmental impact and system engineering. We have developed models with data from the Western power grid (WECC) and under a supplemental award a West African Power Pool system, which we have selected as our Benchmark Test Systems. This paper outlines our recent work on the long term interactions between financial markets and electric power system development. Figure 1 shows the spatial and temporal boundaries of our research on modeling the electric system. The system security modeling is represented by the 1 st of three boxes located at the base of the diagram. The security model represents the power flow and system dynamics, which operate in seconds on a spatially complex grid system. Loads are described at the level of sub-stations, while the scope of the model extends to cover the entire WECC. The model calculates power flows, real and reactive reserves and system limits for a specified scenario. The grid structure of the WECC is represented in explicit fashion, so the system security model provides the foundation for proposed research on power networks. We highlight the system security “box” in Figure 1 with a double boundary to emphasize the extra challenges of representing the grid network in explicit fashion. Our demand size research is depicted as the 2 nd of three boxes. The research was launched to explain the response of California electricity consumers during 2000 and 2001. The study makes use of billing data from distribution companies to determine the extent and factors behind the surprising reduction in electricity consumption in the summer of 2001. Figure 1 depicts the spatial dimension ranging from individual service areas to cover an entire state. This work is not being expanded under EPNES but is shown here for completeness.
-
Upload
independent -
Category
Documents
-
view
3 -
download
0
Transcript of COMPREHENSIVE LONG TERM MODELING OF THE DYNAMICS OF INVESTMENT AND GROWTH IN ELECTRIC POWER SYSTEMS
PRESENTED AT THE 2004 EPNES WORKSHOP, MAYAGUEZ, PUERTO RICO, JULY 12-14, 2004.
COMPREHENSIVE LONG TERM MODELING OF THE DYNAMICS OF INVESTMENT AND GROWTH IN ELECTRIC POWER SYSTEMS
A. Dimitrovski, M. Gebremicael and K. Tomsovic, School of Electrical Engineering and Computer Science
A. Ford and K. Vogstad, Program in Environmental Sciences and Regional Planning Washington State University, Pullman
ABSTRACT This paper discusses our recent research on the interplay between the economic, technical, social and environmental factors that influence the production, transmission and consumption of electric energy. We are developing computer models of these interactions suitable for use by both policy makers and researchers. The main effort is focused on the development of simulation models, which extend beyond traditional disciplinary boundaries. Such models will enable us to simulate short-term behavior, such as, electricity prices and congestion in the near term, and long-term behavior, such as, investment in new generation and transmission. Our emphasis in this report is on models for tradeable green certificates, transmission network models in system dynamic studies and our benchmark systems for the Western US and West African electric power systems.
KEY WORDS Interdisciplinary modeling, power plant construction, power system planning, system dynamics, transmission congestion,
tradeable green certificates.
1 INTRODUCTION Arguments of the benefit for the deregulation of the electric power system have been largely based on conventional and general wisdom regarding separate topics such as competition, service reliability, economic efficiency and environmental protection. Few have looked carefully at the interplay between the economic, technical, social and environmental factors that influence the production, transmission and consumption of electric energy. Further, no one has carefully investigated the long term dynamics of the process that includes an understanding of the necessary engineering. Our research is developing models to study the long terms effects of deregulation, including interactions between regulatory policy, investor behavior, environmental impact and system engineering. We have developed models with data from the Western power grid (WECC) and under a supplemental award a West African Power Pool system, which we have selected as our Benchmark Test Systems. This paper outlines our recent work on the long term interactions between financial markets and electric power system development.
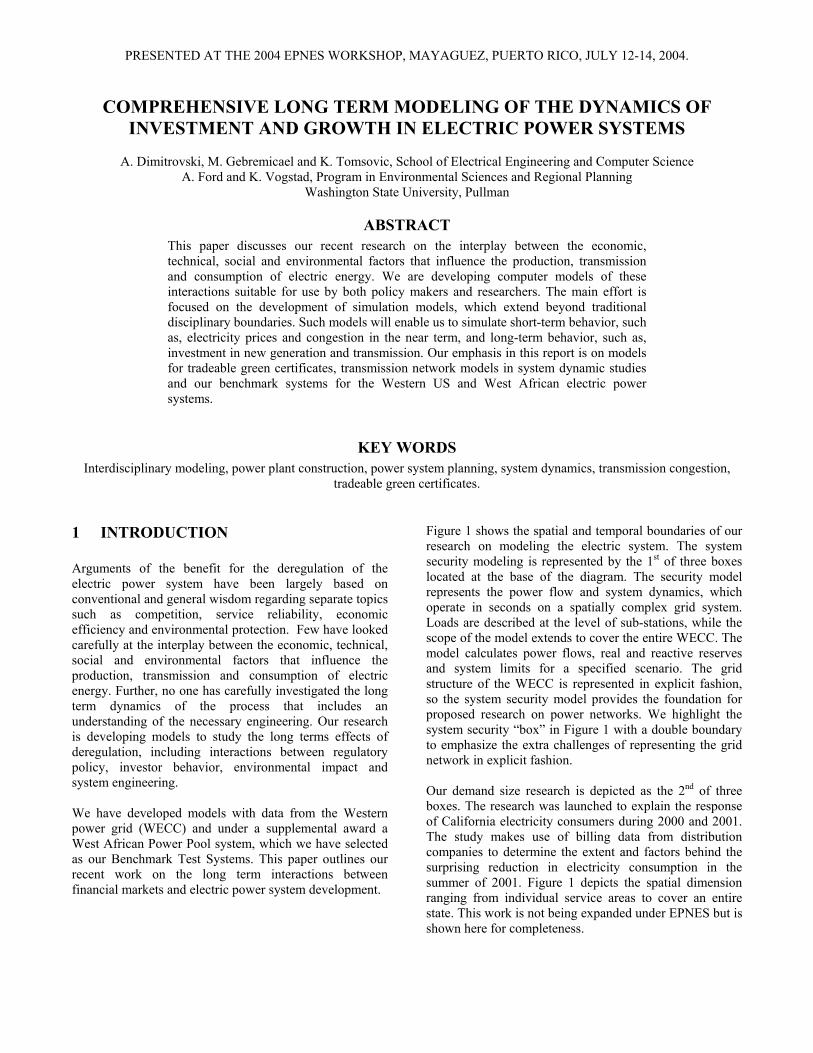
Figure 1 shows the spatial and temporal boundaries of our research on modeling the electric system. The system security modeling is represented by the 1st of three boxes located at the base of the diagram. The security model represents the power flow and system dynamics, which operate in seconds on a spatially complex grid system. Loads are described at the level of sub-stations, while the scope of the model extends to cover the entire WECC. The model calculates power flows, real and reactive reserves and system limits for a specified scenario. The grid structure of the WECC is represented in explicit fashion, so the system security model provides the foundation for proposed research on power networks. We highlight the system security “box” in Figure 1 with a double boundary to emphasize the extra challenges of representing the grid network in explicit fashion. Our demand size research is depicted as the 2nd of three boxes. The research was launched to explain the response of California electricity consumers during 2000 and 2001. The study makes use of billing data from distribution companies to determine the extent and factors behind the surprising reduction in electricity consumption in the summer of 2001. Figure 1 depicts the spatial dimension ranging from individual service areas to cover an entire state. This work is not being expanded under EPNES but is shown here for completeness.
PRESENTED AT THE 2004 EPNES WORKSHOP, MAYAGUEZ, PUERTO RICO, JULY 12-14, 2004.
The 3rd box in Figure 1 depicts the WSU model of the western electricity market. The model operates with load and resource data from the four regions of the WECC. The model simulates hourly operations for a typical 24 hour day in each quarter of a year. We assume adequate interconnections between all loads and all resources in the west, so the wholesale market is treated as a single market. The simulations begin in 1998 and run for a decade or more to allow sufficient time to see the patterns of power plant construction. These models are being constructed using basic concepts from system dynamics, a simulation method pioneered by Forrester [1] and explained in texts by Ford [2] and Sterman [3]. System dynamics has its origins in control theory and has been defined by [4] as that branch of control theory which deals with socio-economic systems and that branch of management science which deals with problems of controllability. Such an approach is valuable in a rapidly changing electric industry with high uncertainty and high risk [5]. 2 SUMMARY OF RESEARCH RESULTS The discussion in this paper focuses on the following areas: 1. Study of Tradeable Green Certificates (TGC) as an
incentive for investment in renewable resources;
2. Development of computer models suitable for use by both policy makers and researchers to study the impact of transmission systems on electric energy supply;
3. Creation of test systems for the Western US and a Western Africa Power Pool system.
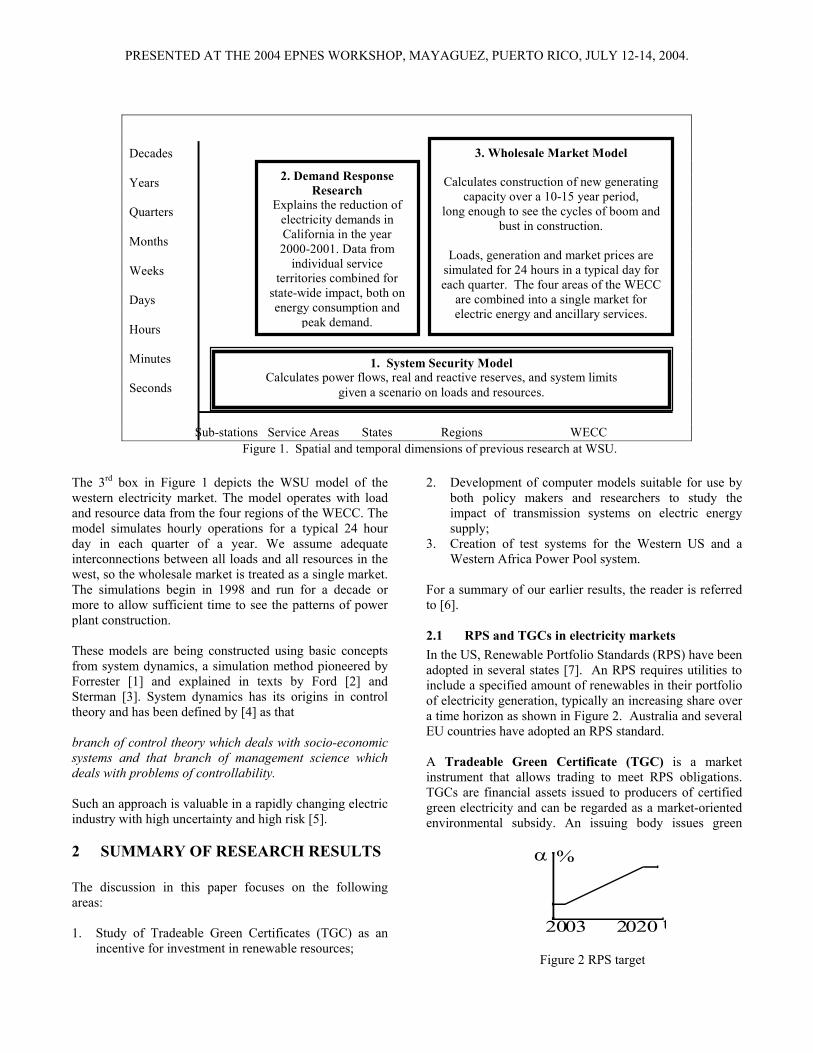
For a summary of our earlier results, the reader is referred to [6]. 2.1 RPS and TGCs in electricity markets In the US, Renewable Portfolio Standards (RPS) have been adopted in several states [7]. An RPS requires utilities to include a specified amount of renewables in their portfolio of electricity generation, typically an increasing share over a time horizon as shown in Figure 2. Australia and several EU countries have adopted an RPS standard. A Tradeable Green Certificate (TGC) is a market instrument that allows trading to meet RPS obligations. TGCs are financial assets issued to producers of certified green electricity and can be regarded as a market-oriented environmental subsidy. An issuing body issues green
2020
%
t2003
α
Figure 2 RPS target
Decades Years Quarters Months Weeks Days Hours Minutes Seconds Sub-stations Service Areas States Regions WECC Figure 1. Spatial and temporal dimensions of previous research at WSU.
2. Demand Response Research
Explains the reduction of electricity demands in California in the year 2000-2001. Data from
individual service territories combined for
state-wide impact, both on energy consumption and
peak demand.
3. Wholesale Market Model
Calculates construction of new generating capacity over a 10-15 year period,
long enough to see the cycles of boom and bust in construction.
Loads, generation and market prices are
simulated for 24 hours in a typical day for each quarter. The four areas of the WECC
are combined into a single market for electric energy and ancillary services.
1. System Security Model Calculates power flows, real and reactive reserves, and system limits
given a scenario on loads and resources.
PRESENTED AT THE 2004 EPNES WORKSHOP, MAYAGUEZ, PUERTO RICO, JULY 12-14, 2004.
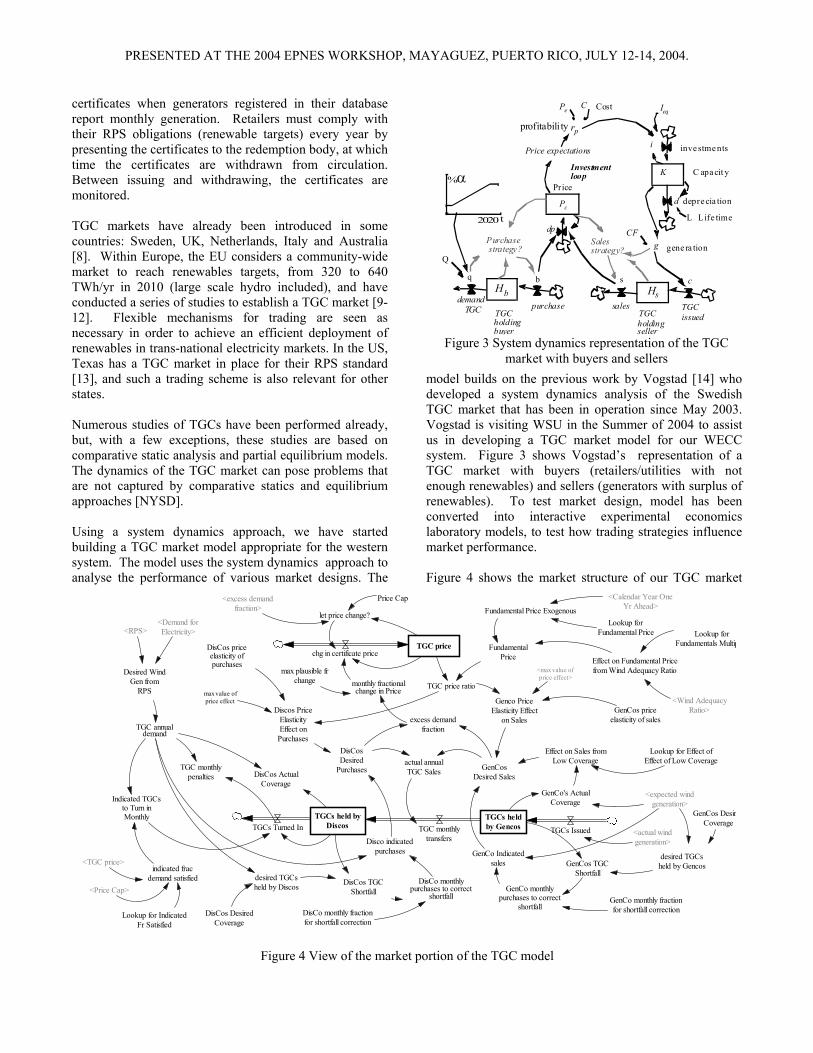
certificates when generators registered in their database report monthly generation. Retailers must comply with their RPS obligations (renewable targets) every year by presenting the certificates to the redemption body, at which time the certificates are withdrawn from circulation. Between issuing and withdrawing, the certificates are monitored. TGC markets have already been introduced in some countries: Sweden, UK, Netherlands, Italy and Australia [8]. Within Europe, the EU considers a community-wide market to reach renewables targets, from 320 to 640 TWh/yr in 2010 (large scale hydro included), and have conducted a series of studies to establish a TGC market [9-12]. Flexible mechanisms for trading are seen as necessary in order to achieve an efficient deployment of renewables in trans-national electricity markets. In the US, Texas has a TGC market in place for their RPS standard [13], and such a trading scheme is also relevant for other states. Numerous studies of TGCs have been performed already, but, with a few exceptions, these studies are based on comparative static analysis and partial equilibrium models. The dynamics of the TGC market can pose problems that are not captured by comparative statics and equilibrium approaches [NYSD]. Using a system dynamics approach, we have started building a TGC market model appropriate for the western system. The model uses the system dynamics approach to analyse the performance of various market designs. The
model builds on the previous work by Vogstad [14] who developed a system dynamics analysis of the Swedish TGC market that has been in operation since May 2003. Vogstad is visiting WSU in the Summer of 2004 to assist us in developing a TGC market model for our WECC system. Figure 3 shows Vogstad’s representation of a TGC market with buyers (retailers/utilities with not enough renewables) and sellers (generators with surplus of renewables). To test market design, model has been converted into interactive experimental economics laboratory models, to test how trading strategies influence market performance. Figure 4 shows the market structure of our TGC market
2020
%
t
Pc
SalesPurchase strategy ? strategy?
salespurchaseTGC TGC
g
i
K
d
CF
HsHbb sq
Q
α
inve stme nts
C apa cit y
depre cia tion
gene ra tion
L
issuedholdingseller
dp
Price
Price expectations
Pe
profitabili ty rp
C Cost
Investmentloop
demandTGC TGC
holdingbuyer
c
Life time
Ieq
Figure 3 System dynamics representation of the TGC
market with buyers and sellers
TGC price
TGCs heldby GencosTGC monthly
transfersTGCs Issued
GenCosDesired Sales
GenCos priceelasticity of sales
chg in certificate price
TGCs held byDiscosTGCs Turned In
Genco PriceElasticity Effect
on Sales
TGC price ratio
Discos PriceElasticityEffect on
Purchases
DisCos priceelasticity ofpurchases
DisCosDesired
Purchases
excess demandfractionTGC annual
demand
GenCos DesirCoverage
desired TGCsheld by Gencos
DisCos DesiredCoverage
desired TGCsheld by Discos DisCos TGC
Shortfall
Desired WindGen from
RPS
<expected windgeneration>
<actual windgeneration>
<Demand forElectricity>
actual annualTGC Sales
FundamentalPrice
Price Cap
let price change?
<excess demandfraction>
Effect on Fundamental Pricefrom Wind Adequacy Ratio
Lookup forFundamentals Multip
<Wind AdequacyRatio>
Fundamental Price Exogenous
Lookup for IndicatedFr Satisfied
indicated fracdemand satisfied
TGC monthlypenalties DisCos Actual
Coverage
<RPS>
monthly fractionalchange in Price
Lookup forFundamental Price
<Calendar Year OneYr Ahead>
max value ofprice effect
GenCo's ActualCoverage
DisCo monthlypurchases to correct
shortfall
DisCo monthly fractionfor shortfall correction
Disco indicatedpurchases
GenCos TGCShortfall
GenCo monthly fractionfor shortfall correction
GenCo monthlypurchases to correct
shortfall
GenCo Indicatedsales
<max value ofprice effect>
max plausible frchange
Effect on Sales fromLow Coverage
Lookup for Effect ofEffect of Low Coverage
<TGC price>
<Price Cap>
Indicated TGCsto Turn inMonthly
Figure 4 View of the market portion of the TGC model
PRESENTED AT THE 2004 EPNES WORKSHOP, MAYAGUEZ, PUERTO RICO, JULY 12-14, 2004.
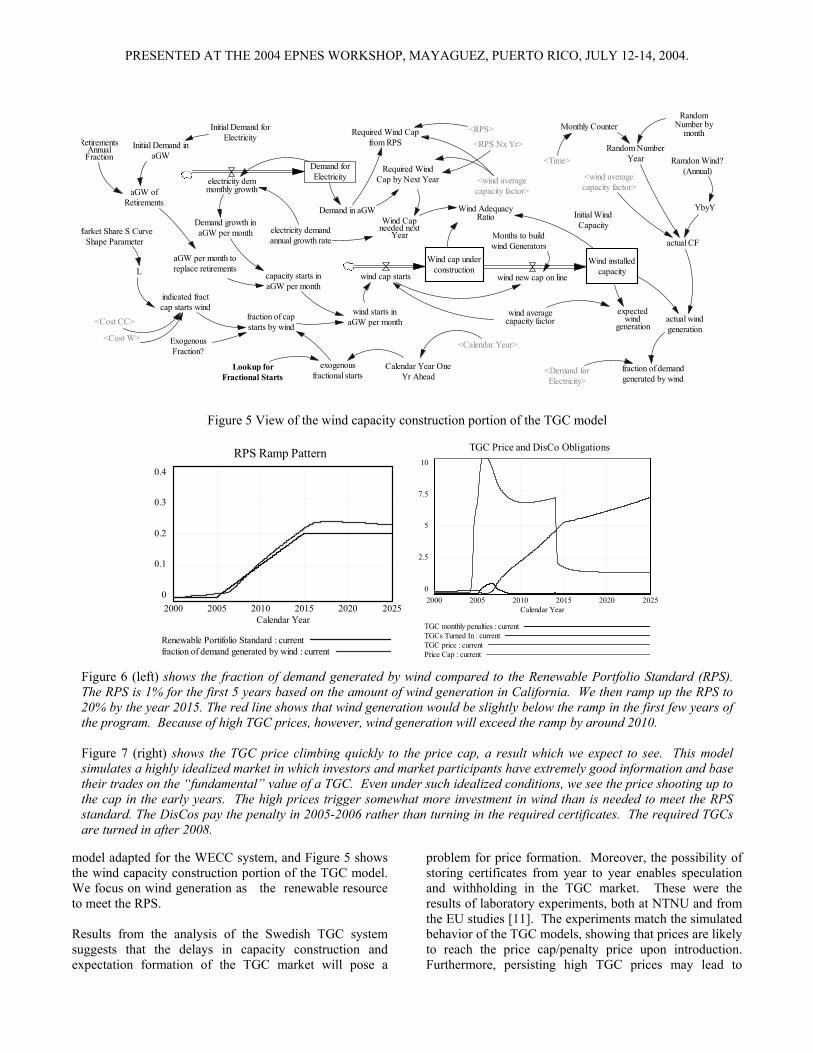
model adapted for the WECC system, and Figure 5 shows the wind capacity construction portion of the TGC model. We focus on wind generation as the renewable resource to meet the RPS. Results from the analysis of the Swedish TGC system suggests that the delays in capacity construction and expectation formation of the TGC market will pose a
problem for price formation. Moreover, the possibility of storing certificates from year to year enables speculation and withholding in the TGC market. These were the results of laboratory experiments, both at NTNU and from the EU studies [11]. The experiments match the simulated behavior of the TGC models, showing that prices are likely to reach the price cap/penalty price upon introduction. Furthermore, persisting high TGC prices may lead to
Wind installedcapacity
expectedwind
generationactual windgeneration
Wind cap underconstruction
Months to buildwind Generators
indicated fractcap starts wind
Initial WindCapacity
actual CF
Demand forElectricityelectricity dem
monthly growth
electricity demandannual growth rate
Demand in aGWDemand growth inaGW per month
capacity starts inaGW per month
wind starts inaGW per monthfraction of cap
starts by windwind average
capacity factor
wind cap starts wind new cap on line
Required WindCap by Next Year <wind average
capacity factor>
Wind Capneeded next
Year
Wind AdequacyRatio
Market Share S CurveShape Parameter
L
<RPS Nx Yr>
<Demand forElectricity>
fraction of demandgenerated by wind
<Cost CC>
<Cost W>
Lookup forFractional Starts
exogenousfractional starts
<Calendar Year>
Calendar Year OneYr Ahead
<RPS>Required Wind Capfrom RPS
ExogenousFraction?
Initial Demand forElectricity
Initial Demand inaGW
RetirementsAnnual
Fraction
aGW ofRetirements
aGW per month toreplace retirements
RandomNumber by
monthMonthly Counter
Random NumberYear<Time>
<wind averagecapacity factor>
Ramdon Wind?(Annual)
YbyY
Figure 5 View of the wind capacity construction portion of the TGC model
RPS Ramp Pattern0.4
0.3
0.2
0.1
02000 2005 2010 2015 2020 2025
Calendar Year
Renewable Portifolio Standard : currentfraction of demand generated by wind : current
TGC Price and DisCo Obligations10
7.5
5
2.5
02000 2005 2010 2015 2020 2025
Calendar Year
TGC monthly penalties : currentTGCs Turned In : currentTGC price : currentPrice Cap : current
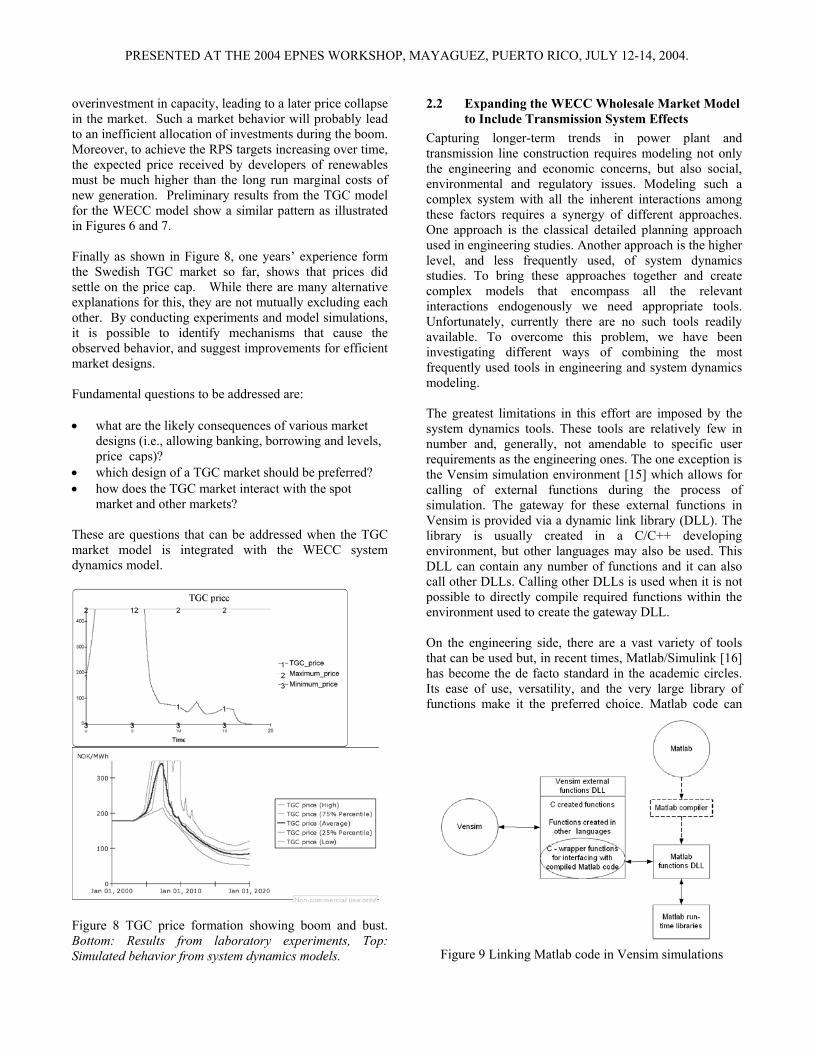
Figure 6 (left) shows the fraction of demand generated by wind compared to the Renewable Portfolio Standard (RPS). The RPS is 1% for the first 5 years based on the amount of wind generation in California. We then ramp up the RPS to 20% by the year 2015. The red line shows that wind generation would be slightly below the ramp in the first few years of the program. Because of high TGC prices, however, wind generation will exceed the ramp by around 2010. Figure 7 (right) shows the TGC price climbing quickly to the price cap, a result which we expect to see. This model simulates a highly idealized market in which investors and market participants have extremely good information and base their trades on the “fundamental” value of a TGC. Even under such idealized conditions, we see the price shooting up to the cap in the early years. The high prices trigger somewhat more investment in wind than is needed to meet the RPS standard. The DisCos pay the penalty in 2005-2006 rather than turning in the required certificates. The required TGCs are turned in after 2008.
PRESENTED AT THE 2004 EPNES WORKSHOP, MAYAGUEZ, PUERTO RICO, JULY 12-14, 2004.
overinvestment in capacity, leading to a later price collapse in the market. Such a market behavior will probably lead to an inefficient allocation of investments during the boom. Moreover, to achieve the RPS targets increasing over time, the expected price received by developers of renewables must be much higher than the long run marginal costs of new generation. Preliminary results from the TGC model for the WECC model show a similar pattern as illustrated in Figures 6 and 7. Finally as shown in Figure 8, one years’ experience form the Swedish TGC market so far, shows that prices did settle on the price cap. While there are many alternative explanations for this, they are not mutually excluding each other. By conducting experiments and model simulations, it is possible to identify mechanisms that cause the observed behavior, and suggest improvements for efficient market designs. Fundamental questions to be addressed are: • what are the likely consequences of various market
designs (i.e., allowing banking, borrowing and levels, price caps)?
• which design of a TGC market should be preferred? • how does the TGC market interact with the spot
market and other markets? These are questions that can be addressed when the TGC market model is integrated with the WECC system dynamics model.
Figure 8 TGC price formation showing boom and bust. Bottom: Results from laboratory experiments, Top: Simulated behavior from system dynamics models.
2.2 Expanding the WECC Wholesale Market Model to Include Transmission System Effects
Capturing longer-term trends in power plant and transmission line construction requires modeling not only the engineering and economic concerns, but also social, environmental and regulatory issues. Modeling such a complex system with all the inherent interactions among these factors requires a synergy of different approaches. One approach is the classical detailed planning approach used in engineering studies. Another approach is the higher level, and less frequently used, of system dynamics studies. To bring these approaches together and create complex models that encompass all the relevant interactions endogenously we need appropriate tools. Unfortunately, currently there are no such tools readily available. To overcome this problem, we have been investigating different ways of combining the most frequently used tools in engineering and system dynamics modeling. The greatest limitations in this effort are imposed by the system dynamics tools. These tools are relatively few in number and, generally, not amendable to specific user requirements as the engineering ones. The one exception is the Vensim simulation environment [15] which allows for calling of external functions during the process of simulation. The gateway for these external functions in Vensim is provided via a dynamic link library (DLL). The library is usually created in a C/C++ developing environment, but other languages may also be used. This DLL can contain any number of functions and it can also call other DLLs. Calling other DLLs is used when it is not possible to directly compile required functions within the environment used to create the gateway DLL. On the engineering side, there are a vast variety of tools that can be used but, in recent times, Matlab/Simulink [16] has become the de facto standard in the academic circles. Its ease of use, versatility, and the very large library of functions make it the preferred choice. Matlab code can
Figure 9 Linking Matlab code in Vensim simulations
PRESENTED AT THE 2004 EPNES WORKSHOP, MAYAGUEZ, PUERTO RICO, JULY 12-14, 2004.
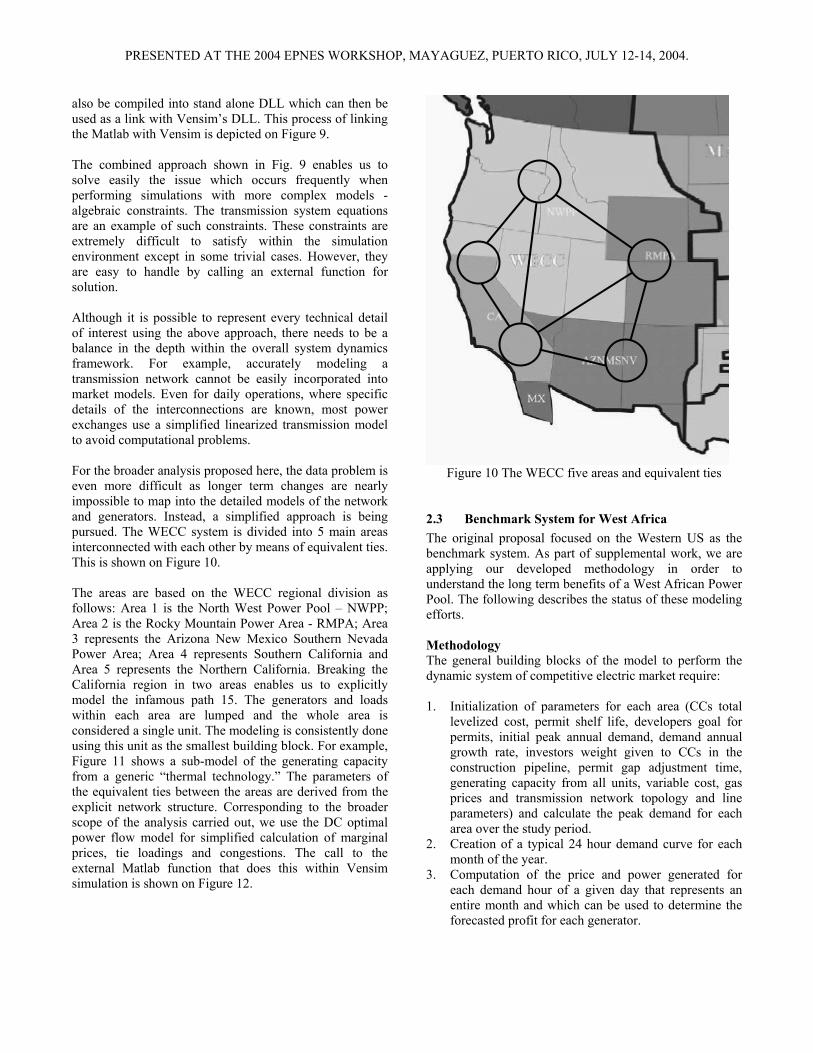
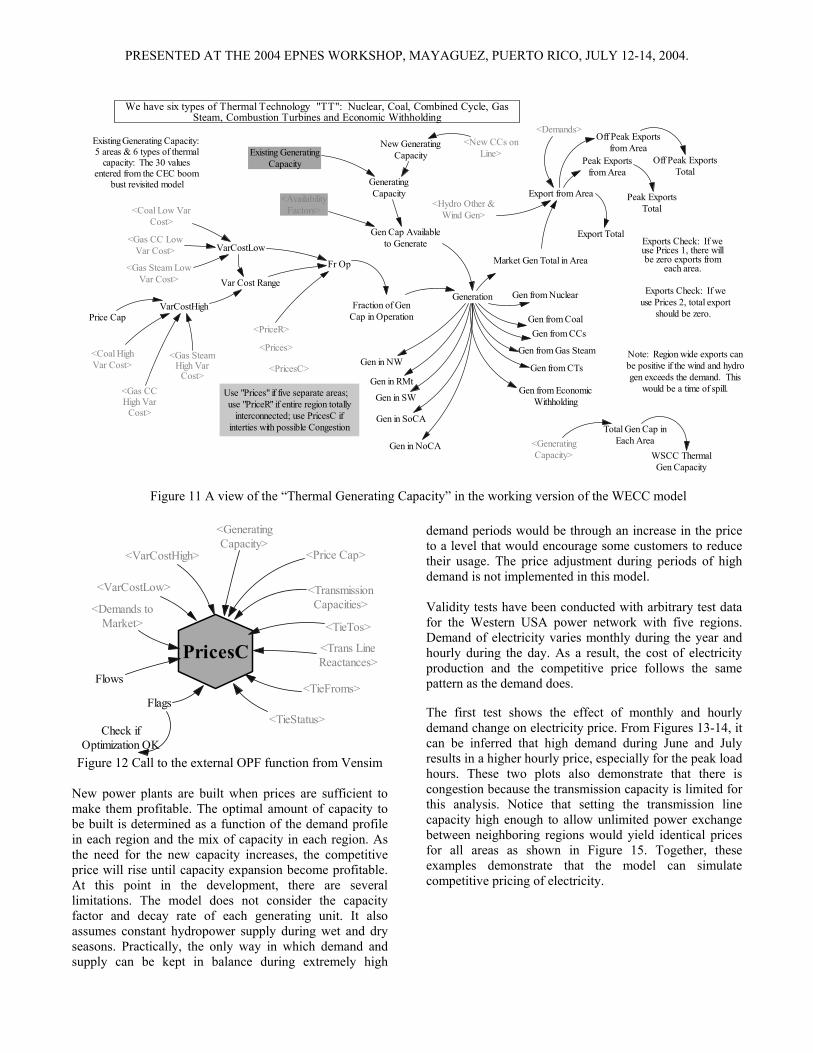
also be compiled into stand alone DLL which can then be used as a link with Vensim’s DLL. This process of linking the Matlab with Vensim is depicted on Figure 9. The combined approach shown in Fig. 9 enables us to solve easily the issue which occurs frequently when performing simulations with more complex models - algebraic constraints. The transmission system equations are an example of such constraints. These constraints are extremely difficult to satisfy within the simulation environment except in some trivial cases. However, they are easy to handle by calling an external function for solution. Although it is possible to represent every technical detail of interest using the above approach, there needs to be a balance in the depth within the overall system dynamics framework. For example, accurately modeling a transmission network cannot be easily incorporated into market models. Even for daily operations, where specific details of the interconnections are known, most power exchanges use a simplified linearized transmission model to avoid computational problems. For the broader analysis proposed here, the data problem is even more difficult as longer term changes are nearly impossible to map into the detailed models of the network and generators. Instead, a simplified approach is being pursued. The WECC system is divided into 5 main areas interconnected with each other by means of equivalent ties. This is shown on Figure 10. The areas are based on the WECC regional division as follows: Area 1 is the North West Power Pool – NWPP; Area 2 is the Rocky Mountain Power Area - RMPA; Area 3 represents the Arizona New Mexico Southern Nevada Power Area; Area 4 represents Southern California and Area 5 represents the Northern California. Breaking the California region in two areas enables us to explicitly model the infamous path 15. The generators and loads within each area are lumped and the whole area is considered a single unit. The modeling is consistently done using this unit as the smallest building block. For example, Figure 11 shows a sub-model of the generating capacity from a generic “thermal technology.” The parameters of the equivalent ties between the areas are derived from the explicit network structure. Corresponding to the broader scope of the analysis carried out, we use the DC optimal power flow model for simplified calculation of marginal prices, tie loadings and congestions. The call to the external Matlab function that does this within Vensim simulation is shown on Figure 12.
Figure 10 The WECC five areas and equivalent ties
2.3 Benchmark System for West Africa The original proposal focused on the Western US as the benchmark system. As part of supplemental work, we are applying our developed methodology in order to understand the long term benefits of a West African Power Pool. The following describes the status of these modeling efforts. Methodology The general building blocks of the model to perform the dynamic system of competitive electric market require: 1. Initialization of parameters for each area (CCs total
levelized cost, permit shelf life, developers goal for permits, initial peak annual demand, demand annual growth rate, investors weight given to CCs in the construction pipeline, permit gap adjustment time, generating capacity from all units, variable cost, gas prices and transmission network topology and line parameters) and calculate the peak demand for each area over the study period.
2. Creation of a typical 24 hour demand curve for each month of the year.
3. Computation of the price and power generated for each demand hour of a given day that represents an entire month and which can be used to determine the forecasted profit for each generator.
PRESENTED AT THE 2004 EPNES WORKSHOP, MAYAGUEZ, PUERTO RICO, JULY 12-14, 2004.
<VarCostLow>
<VarCostHigh>
<GeneratingCapacity>
<Price Cap>
<Demands toMarket>
PricesC
<TieFroms>
<TieTos>
<Trans LineReactances>
<TransmissionCapacities>
<TieStatus>
Flows
Flags
Check ifOptimization OK
Figure 12 Call to the external OPF function from Vensim New power plants are built when prices are sufficient to make them profitable. The optimal amount of capacity to be built is determined as a function of the demand profile in each region and the mix of capacity in each region. As the need for the new capacity increases, the competitive price will rise until capacity expansion become profitable. At this point in the development, there are several limitations. The model does not consider the capacity factor and decay rate of each generating unit. It also assumes constant hydropower supply during wet and dry seasons. Practically, the only way in which demand and supply can be kept in balance during extremely high
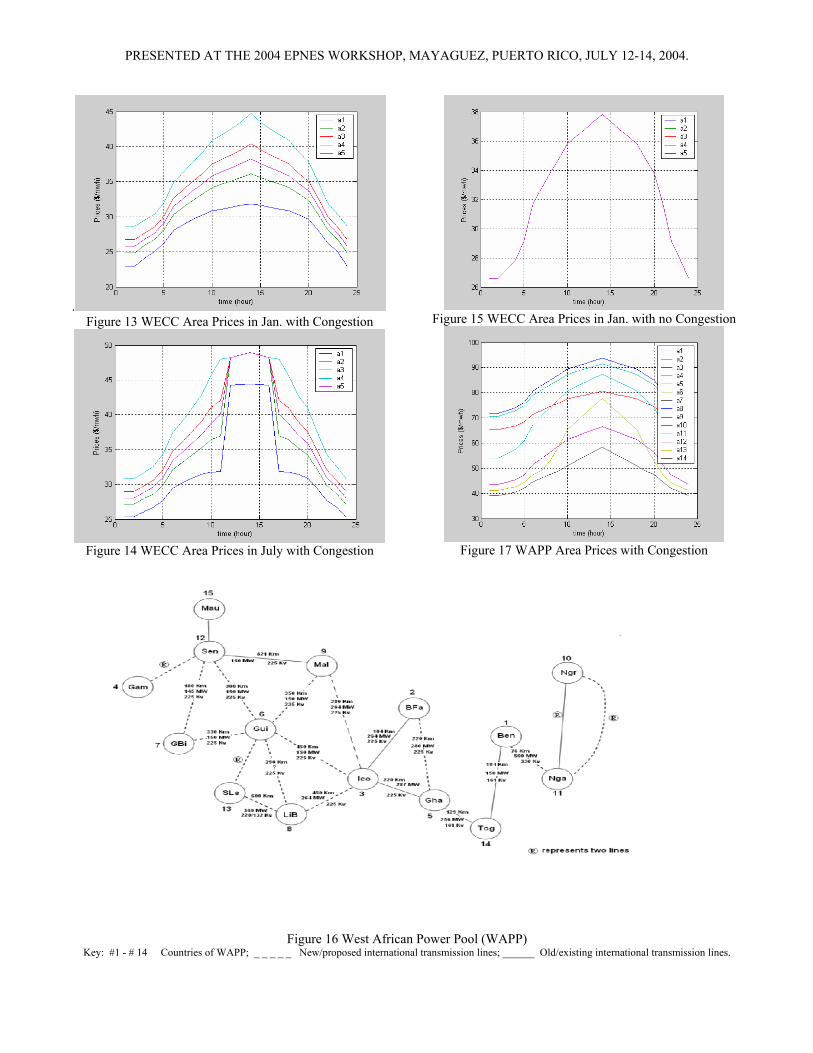
demand periods would be through an increase in the price to a level that would encourage some customers to reduce their usage. The price adjustment during periods of high demand is not implemented in this model. Validity tests have been conducted with arbitrary test data for the Western USA power network with five regions. Demand of electricity varies monthly during the year and hourly during the day. As a result, the cost of electricity production and the competitive price follows the same pattern as the demand does. The first test shows the effect of monthly and hourly demand change on electricity price. From Figures 13-14, it can be inferred that high demand during June and July results in a higher hourly price, especially for the peak load hours. These two plots also demonstrate that there is congestion because the transmission capacity is limited for this analysis. Notice that setting the transmission line capacity high enough to allow unlimited power exchange between neighboring regions would yield identical prices for all areas as shown in Figure 15. Together, these examples demonstrate that the model can simulate competitive pricing of electricity.
We have six types of Thermal Technology "TT": Nuclear, Coal, Combined Cycle, GasSteam, Combustion Turbines and Economic Withholding
VarCostLow
VarCostHigh
New GeneratingCapacity
GeneratingCapacity
Existing GeneratingCapacity
<New CCs onLine>
Price CapFraction of Gen
Cap in Operation
Generation Gen from Nuclear
Gen from CoalGen from CCs
Gen from Gas Steam
Gen from CTs
Gen from EconomicWithholding
Gen in NW
Gen in SW
Gen in RMt
Gen in SoCA
Gen in NoCA
Var Cost Range
Fr Op
<Prices>
Existing Generating Capacity: 5 areas & 6 types of thermal
capacity: The 30 valuesentered from the CEC boom
bust revisited model
<Coal Low VarCost>
<Coal HighVar Cost>
<Gas CC LowVar Cost>
<Gas Steam LowVar Cost>
<Gas SteamHigh Var
Cost><Gas CCHigh Var
Cost>
<PriceR>
Use "Prices" if five separate areas; use "PriceR" if entire region totally
interconnected; use PricesC ifinterties with possible Congestion
<Demands>
Export from Area
Export Total
Market Gen Total in Area
Peak Exportsfrom Area
<Hydro Other &Wind Gen>
Peak ExportsTotal
Exports Check: If weuse Prices 2, total export
should be zero.
Exports Check: If weuse Prices 1, there willbe zero exports from
each area.
Off Peak Exportsfrom Area
Off Peak ExportsTotal
Note: Region wide exports canbe positive if the wind and hydrogen exceeds the demand. This
would be a time of spill.
<GeneratingCapacity>
Total Gen Cap inEach Area
WSCC ThermalGen Capacity
<PricesC>
Gen Cap Availableto Generate
<AvailabilityFactors>
Figure 11 A view of the “Thermal Generating Capacity” in the working version of the WECC model
PRESENTED AT THE 2004 EPNES WORKSHOP, MAYAGUEZ, PUERTO RICO, JULY 12-14, 2004.
. Figure 13 WECC Area Prices in Jan. with Congestion
Figure 14 WECC Area Prices in July with Congestion
Figure 15 WECC Area Prices in Jan. with no Congestion
Figure 17 WAPP Area Prices with Congestion
Figure 16 West African Power Pool (WAPP)
Key: #1 - # 14 Countries of WAPP; _ _ _ _ _ New/proposed international transmission lines; ______ Old/existing international transmission lines.
PRESENTED AT THE 2004 EPNES WORKSHOP, MAYAGUEZ, PUERTO RICO, JULY 12-14, 2004.
WAPP (West Africa Power Pool) Our model can be adapted to any number of areas and any possible power network interconnections with simple modifications (this is quite different than a typical system dynamics implementation). Fourteen countries of the WAPP system are being treated as a separate area as shown in Figure 16. Since the available data for WAPP dose not have a pattern of hourly distribution the parameter for hourly distribution is adapted from the Western US model. Simulating the model for prices in each area with specific information is shown in Figure 17. 3 EDUCATION IMPACTS We have learned in previous experiments with computer based learning systems that students can spend valuable lab time learning the basic protocol of the experimental system. Some students may arrive in the lab ready for serious experimentation and reflection; others may arrive with a few minutes of preparation. One response to the uneven preparation of students is to allow them to work in asynchronous fashion and assume that they will all eventually learn some of the lessons from the experimental system. In previous research at the WSU Center for Teaching and Learning, we have discovered that web-based tutorial materials can be used to bring the students to a minimum level of understanding. This idea was tested with “The Idagon”, a computer simulation model of a hypothetical river [17]. The Idagon website provides students with visual and technical information to learn the names, units, jargon and concepts of a complex river system that is to be managed to serve multiple and conflicting objectives. We plan to develop a similar web-based preparation system to provide students with the requisite introductory material. We will include interactive tests, so the participants can verify that they are sufficiently informed to begin experimentation with the simulation model. The preparatory materials will require significant time and effort, but the time is well spent if the participants are to have a meaningful experience in the lab. The attention to preparations will help ensure the validity of our proposed assessment process since we can require a certain minimum level of understanding before proceeding into the course materials. Our plan is for students to study the preparatory material on the web and experiment with the interactive simulation model on separate computers in asynchronous fashion. The asynchronous operation allows students to operate at different speeds and has proven useful in student simulations of fishery management and promotion of electric vehicles [17] and in executives’ experiments with models of electricity markets [18]. However, several groups report useful experiments in which subjects operate simulated markets from a web-based model. These include the Cornell University’s PowerWeb [19], the experiments
at the Norwegian University of Science and Technology in TGCs [14], and the work by the experimental economics group at the University of Arizona [20]. We will select appropriate ideas from these experimental electricity markets for inclusion in our courses. Our teaching modules will be designed for integration into syllabi for senior/graduate level courses in environmental science and engineering. At this stage, students from engineering have been taking courses within environmental science but our plan is to develop teaching modules that will be used with students from several disciplines learning in the same classroom. The supplemental grant to support research cooperation with a group of West African scholars will also lead to interesting insights on systems in developing countries where weak transmission systems exacerbate the difficulty of designing functioning electricity markets. 4 FURTHER WORK The proposed modeling approach needs further developments in several areas that will be supported by case studies in order to highlight the value of the work. Specifically, the following is planned: • completion of the TGC model and integration into
WECC system models, • full integration of transmission line model into the
system dynamic models, • studies of various transmission investment incentives
and the impact on boom-and-bust cycles, • incorporation of uncertainty into modeling [21-22], • detailed study of the benefits of the WAPP on electric
power system development in West Africa, and • major modification of senior power systems analysis
course in Electrical Engineering and graduate course modeling course in Environmental Science.
ACKNOWLEDGEMENT The work reported in this paper has been supported in part by the NSF and the Office of Naval Research under the NSF grant ECS-0224810.
REFERENCES1 [1] Jay W. Forrester, Industrial Dynamics, Pegasus
Communications, Waltham, MA. [2] Andrew Ford, Modeling the Environment, Island
Press. [3] John Sterman, Business Dynamics, Irwin McGraw-
Hill, 2000. [4] Geoffrey Coyle, Management System Dynamics,
John Wiley, 1977.
1 Papers marked by an asterisk indicate publications supported under this EPNES project.
PRESENTED AT THE 2004 EPNES WORKSHOP, MAYAGUEZ, PUERTO RICO, JULY 12-14, 2004.
[5] Isaac Dyner and Erik Larsen, “From Planning to Strategy in the Electricity Industry,” Energy Policy, Vol 29, 2001, pp. 1145-1154.
[6] *A. Bose, K. Casavant, A. Dimitrovski, A. Ford, L. Lutzenhiser, and K. Tomsovic, “Modeling the Interaction between the Technical, Social, Economic and Environmental Components of Large Scale Electric Power Systems,” 2003 EPNES Workshop, Orlando, FL, Oct. 2003.
[7] L. Bird, M. Bolinger, T. Gagliano, R. Wiser, M. Brown and B. Parson, “Policies and market factors driving wind power development in the United States”, Energy Policy, in press.
[8] T. Berry and M. Jaccard, “The renewable portfolio standard: design considerations and implementation survey,” Energy Policy, Vol. 29, 2001, pp. 263-277.
[9] REBUS 2001, “Renewable Energy Burden Sharing: Effects of burden sharing and certificate trade on the renewable electricity market in Europe,” EU Project, ECN-C-01-030, 2001.
[10] ADMIRE REBUS, “Renewable electricity market developments in the EU; Final Report of the ADMIRE REBUS project,” 2003. Available online www.admire-rebus.net.
[11] RECerT, “The European Renewable Electricity Certificate Trading Project,” 2001. Available online http://recert.energyprojects.net.
[12] ] G.J Schaeffer and J. Sonnemans, “The influence of banking and borrowing under different penalty regimes in tradeable green certificate markets - results from an experimental economics laboratory experiment,” Energy & Environment, 11, 2000, pp. 407-420.
[13] O. Langniss and R. Wiser, “The renewables portfolio standard in Texas: an early assessment”, Energy Policy 31, 2003, pp. 527-535.
[14] K. Vogstad, I. Kristensen and O. Wolfgang, “Tradeable Green Certificates: The Dynamics of Coupled Electricity Markets,” Proceedings of the International System Dynamics Conference, New York City, July 2004.
[15] Vensim: Venata Simulation Environment, Vensim Version 5 User’s Guide, Ventana Systems Inc.
[16] Simulink: Dynamic System Simulation for MATLAB, Simulink Version 3, The MATHWORKS Inc.
[17] A. Ford, Modeling the Environment, Island Press, 1999. (The Idagon preparatory materials may be viewed at http:/www.wsu.edu/~forda/AAIda.html).
[18] F. Graves, A. Ford and S. Thumb, “Prospects for Boom/Bust in the US Electric Power Industry,” Technical Report 1000635, Electric Power Research Institute, 2000.
[19] R. Zimmerman, R. Thomas, D. Gan and C. Murillo-Sanchez, “A Web-Based Platform for Experimental Investigation of Electric Power Auctions,” Decision Support Systems, 24, 3&4, January 1999, 193-205.
[20] S. Rassenti, V. Smith and B. Wilson, “Using Experiments to Inform the Privatization/Deregulation Movement in Electricity,” CATO Journal, 21, 3, Winter 2002, 515-544.
[21] *A. Dimitrovski and K. Tomsovic, "Risk Assessment using Boundary Load Flow Solutions," Proceedings of the 2003 International Conference on Intelligent System Applications to Power Systems, Lemnos, Greece, Sept. 2003, pp. 1-6, and Journal of Engineering Intelligent Systems, in press, (selected paper).
[22] *A. Dimitrovski and K. Tomsovic, "Slack Bus Treatment in Load Flow Solutions with Uncertain Nodal Powers," Proceedings of the 8th International Conference on Probabilistic Methods in Power Systems (PMAPS) - 2004, Ames, Iowa, Sept. 2004.
TABLE OF ACRONYMS DLL Dynamic Link Library NWPP North West Power Pool NTNU Norwegian University of Science and
Technology OPF Optimal Power Flow RMPA Rocky Mountain Power Area RPS Renewable Portfolio Standard TGC Tradeable Green Certificate WAPP West Africa Power Pool WECC Western Electricity Coordinating Council, WSU Washington State University