Comprehensive evaluation of association measures for fault localization
11
Singapore Management University Institutional Knowledge at Singapore Management University Research Collection School of Information Systems School of Information Systems 9-2010 Comprehensive Evaluation of Association Measures for Fault Localization Lucia Lucia SMU, [email protected] David LO SMU, [email protected] Lingxiao JIANG SMU, [email protected] Aditya Budi SMU This Conference Paper is brought to you for free and open access by the School of Information Systems at Institutional Knowledge at Singapore Management University. It has been accepted for inclusion in Research Collection School of Information Systems by an authorized administrator of Institutional Knowledge at Singapore Management University. For more information, please email [email protected]. Citation Lucia, Lucia; LO, David; JIANG, Lingxiao; and Budi, Aditya, "Comprehensive Evaluation of Association Measures for Fault Localization" (2010). Research Collection School of Information Systems. Paper 1330. http://ink.library.smu.edu.sg/sis_research/1330
-
Upload
independent -
Category
Documents
-
view
2 -
download
0
Transcript of Comprehensive evaluation of association measures for fault localization
Singapore Management UniversityInstitutional Knowledge at Singapore Management UniversityResearch Collection School of InformationSystems School of Information Systems
9-2010
Comprehensive Evaluation of AssociationMeasures for Fault LocalizationLucia LuciaSMU, [email protected]
David LOSMU, [email protected]
Lingxiao JIANGSMU, [email protected]
Aditya BudiSMU
This Conference Paper is brought to you for free and open access by the School of Information Systems at Institutional Knowledge at SingaporeManagement University. It has been accepted for inclusion in Research Collection School of Information Systems by an authorized administrator ofInstitutional Knowledge at Singapore Management University. For more information, please email [email protected].
CitationLucia, Lucia; LO, David; JIANG, Lingxiao; and Budi, Aditya, "Comprehensive Evaluation of Association Measures for FaultLocalization" (2010). Research Collection School of Information Systems. Paper 1330.http://ink.library.smu.edu.sg/sis_research/1330
Comprehensive Evaluation of Association Measuresfor Fault LocalizationLucia, David Lo, Lingxiao Jiang, Aditya Budi
School of Information Systems, Singapore Management UniversityEmails: {lucia.2009,davidlo,lxjiang,adityabudi}@smu.edu.sg
Abstract—In statistics and data mining communities, therehave been many measures proposed to gauge the strength ofassociation between two variables of interest, such as oddsratio, confidence, Yule-Y, Yule-Q, Kappa, and gini index. Theseassociation measures have been used in various domains, forexample, to evaluate whether a particular medical practice isassociated positively to a cure of a disease or whether a particularmarketing strategy is associated positively to an increase inrevenue, etc. This paper models the problem of locating faultsas association between the execution or non-execution of par-ticular program elements with failures. There have been specialmeasures, termed as suspiciousness measures, proposed for thetask. Two state-of-the-art measures are Tarantula and Ochiai,which are different from many other statistical measures. To thebest of our knowledge, there is no study that comprehensivelyinvestigates the effectiveness of various association measures inlocalizing faults. This paper fills in the gap by evaluating 20 well-known association measures and compares their effectiveness infault localization tasks with Tarantula and Ochiai. Evaluationon the Siemens programs show that a number of associationmeasures perform statistically comparable as Tarantula andOchiai.
I. INTRODUCTION
Software debugging is a difficult and expensive activityto perform. When a program failure occurs in a programexecution, the execution traces may be long and containfailure-irrelevant information. Locating the root cause of thefailure, which may be far away from the failure point, is non-trivial. Often, full execution traces are not even available fordebugging if programs fail in the field. US National Instituteof Standards and Technology in 2002 has stated that softwarebugs cost US economy 59.5 billion dollars annually [46], andtesting and debugging activities account for 30 to 90 percentof labor expended for a project [8].
Many approaches have been proposed to help in automatingdebugging processes, especially in localizing root causes offailures (i.e., faults) in programs [20], [27], [29], [31], [33],[34], [36], [38], [51]. One common kind of approaches isspectrum-based fault localization [1], [11], [14], [27], [31],where program traces or abstractions of traces (called programspectra) are used to represent program behaviors and thespectra of correct executions and failed executions are com-pared. The comparison often employs statistical analysis, andprogram elements (e.g., statements, basic blocks, functions,components, etc.) that are observed more often in failedexecutions than in correct executions (or statistically correlatewith failures) are located and deemed as suspicious and thenpresented to developers.
Spectrum-based fault localization techniques are promisingas they are often lightweight and have good accuracy. Amongspectrum-based fault localization techniques, two state-of-the-art techniques are Tarantula [26], [27] and Ochiai [1]–[3].Both approaches propose suspiciousness measures that aimto associate the execution of a particular program elementwith program failures. A suspiciousness score is inferred foreach program element based on the suspiciousness measures,and program elements are ranked and investigated for faultsaccording to their suspiciousness scores.
We observe that a certain program failure could be asso-ciated with a non-execution of a particular program element.A bug in the controlling program element (e.g. wrong condi-tion in an if statement) could cause the non-execution ofa particular program element that will induce the programfailure. Therefore, we would like to model the association,as the following question:
What is the association between the execution ornon-execution of a particular program elementwith the occurrences of a failure?
Based on this view, a general solution for fault localizationcan naturally emerge: measure the association of programelements with failures and the stronger association an elementhas with failures the more likely it is a fault.
Tarantula and Ochiai have been used as measures for faultlocalization. In the data mining and statistics community, thereare various association measures, such as odds ratio [6], YuleQ [47], and Yule Y [48]. They are proposed to measure thestrength of association of two variables. For example, onemight be interested in the association between the applicationof a particular medical treatment with the recovery from anillness, or in the association between a business strategy withthe revenue change. Unfortunately, there has not been anystudy that investigates the effectiveness of the rich varietiesof association measures for fault localization.
This paper aims to fill this research gap by investigating theeffectiveness of 20 popular association measures for the pur-pose of fault localization and comparing them with Tarantulaand Ochiai. In particular, we are interested in answering thefollowing research questions (RQs):
RQ 1. Are vanilla or off-the-shelf association measures ac-curate enough in localizing faults?
RQ 2. Which of the off-the-shelf association measures pro-vide better accuracy for fault localization?
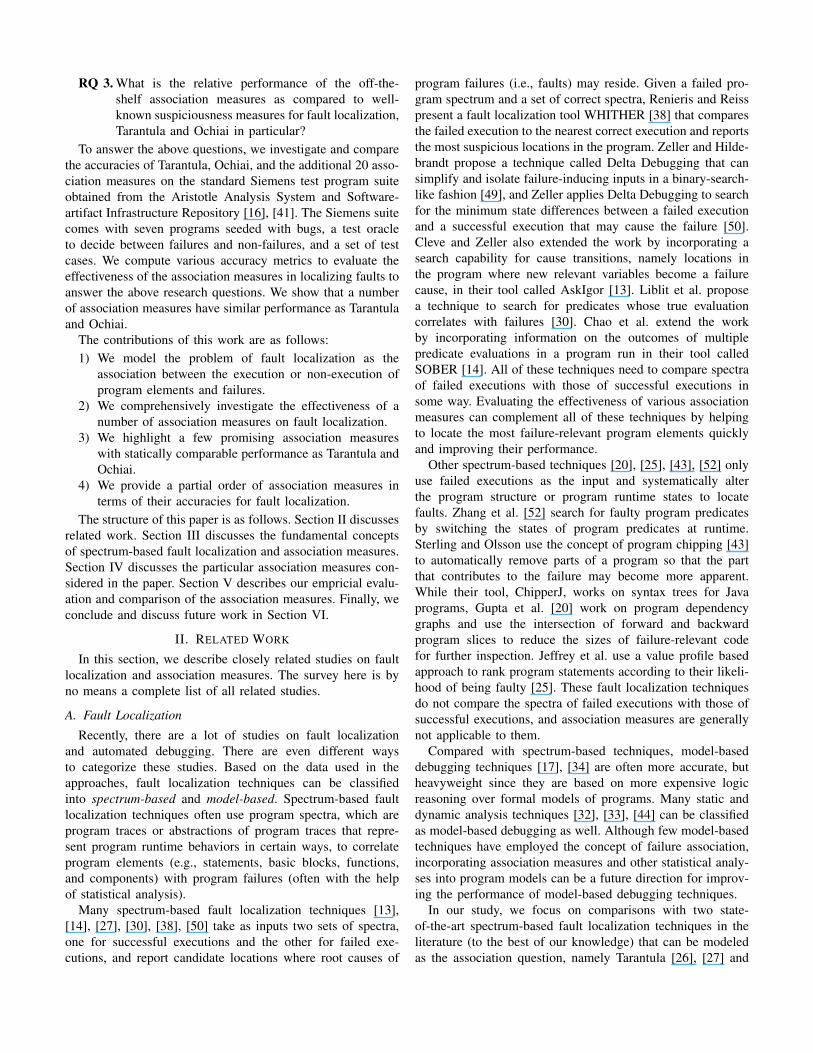
RQ 3. What is the relative performance of the off-the-shelf association measures as compared to well-known suspiciousness measures for fault localization,Tarantula and Ochiai in particular?
To answer the above questions, we investigate and comparethe accuracies of Tarantula, Ochiai, and the additional 20 asso-ciation measures on the standard Siemens test program suiteobtained from the Aristotle Analysis System and Software-artifact Infrastructure Repository [16], [41]. The Siemens suitecomes with seven programs seeded with bugs, a test oracleto decide between failures and non-failures, and a set of testcases. We compute various accuracy metrics to evaluate theeffectiveness of the association measures in localizing faults toanswer the above research questions. We show that a numberof association measures have similar performance as Tarantulaand Ochiai.
The contributions of this work are as follows:1) We model the problem of fault localization as the
association between the execution or non-execution ofprogram elements and failures.
2) We comprehensively investigate the effectiveness of anumber of association measures on fault localization.
3) We highlight a few promising association measureswith statically comparable performance as Tarantula andOchiai.
4) We provide a partial order of association measures interms of their accuracies for fault localization.
The structure of this paper is as follows. Section II discussesrelated work. Section III discusses the fundamental conceptsof spectrum-based fault localization and association measures.Section IV discusses the particular association measures con-sidered in the paper. Section V describes our empricial evalu-ation and comparison of the association measures. Finally, weconclude and discuss future work in Section VI.
II. RELATED WORK
In this section, we describe closely related studies on faultlocalization and association measures. The survey here is byno means a complete list of all related studies.
A. Fault Localization
Recently, there are a lot of studies on fault localizationand automated debugging. There are even different waysto categorize these studies. Based on the data used in theapproaches, fault localization techniques can be classifiedinto spectrum-based and model-based. Spectrum-based faultlocalization techniques often use program spectra, which areprogram traces or abstractions of program traces that repre-sent program runtime behaviors in certain ways, to correlateprogram elements (e.g., statements, basic blocks, functions,and components) with program failures (often with the helpof statistical analysis).
Many spectrum-based fault localization techniques [13],[14], [27], [30], [38], [50] take as inputs two sets of spectra,one for successful executions and the other for failed exe-cutions, and report candidate locations where root causes of
program failures (i.e., faults) may reside. Given a failed pro-gram spectrum and a set of correct spectra, Renieris and Reisspresent a fault localization tool WHITHER [38] that comparesthe failed execution to the nearest correct execution and reportsthe most suspicious locations in the program. Zeller and Hilde-brandt propose a technique called Delta Debugging that cansimplify and isolate failure-inducing inputs in a binary-search-like fashion [49], and Zeller applies Delta Debugging to searchfor the minimum state differences between a failed executionand a successful execution that may cause the failure [50].Cleve and Zeller also extended the work by incorporating asearch capability for cause transitions, namely locations inthe program where new relevant variables become a failurecause, in their tool called AskIgor [13]. Liblit et al. proposea technique to search for predicates whose true evaluationcorrelates with failures [30]. Chao et al. extend the workby incorporating information on the outcomes of multiplepredicate evaluations in a program run in their tool calledSOBER [14]. All of these techniques need to compare spectraof failed executions with those of successful executions insome way. Evaluating the effectiveness of various associationmeasures can complement all of these techniques by helpingto locate the most failure-relevant program elements quicklyand improving their performance.
Other spectrum-based techniques [20], [25], [43], [52] onlyuse failed executions as the input and systematically alterthe program structure or program runtime states to locatefaults. Zhang et al. [52] search for faulty program predicatesby switching the states of program predicates at runtime.Sterling and Olsson use the concept of program chipping [43]to automatically remove parts of a program so that the partthat contributes to the failure may become more apparent.While their tool, ChipperJ, works on syntax trees for Javaprograms, Gupta et al. [20] work on program dependencygraphs and use the intersection of forward and backwardprogram slices to reduce the sizes of failure-relevant codefor further inspection. Jeffrey et al. use a value profile basedapproach to rank program statements according to their likeli-hood of being faulty [25]. These fault localization techniquesdo not compare the spectra of failed executions with those ofsuccessful executions, and association measures are generallynot applicable to them.
Compared with spectrum-based techniques, model-baseddebugging techniques [17], [34] are often more accurate, butheavyweight since they are based on more expensive logicreasoning over formal models of programs. Many static anddynamic analysis techniques [32], [33], [44] can be classifiedas model-based debugging as well. Although few model-basedtechniques have employed the concept of failure association,incorporating association measures and other statistical analy-ses into program models can be a future direction for improv-ing the performance of model-based debugging techniques.
In our study, we focus on comparisons with two state-of-the-art spectrum-based fault localization techniques in theliterature (to the best of our knowledge) that can be modeledas the association question, namely Tarantula [26], [27] and

Ochiai [1]–[3]. Our study extends the work by Tarantulaand Ochiai in the sense that we systematically apply andevaluate more than 20 association measures and find promisingmeasures for the task of fault localization.
B. Studies On Association Measures
There have been a number of studies proposed in thestatistics and data mining community on measures of asso-ciation between variables since the early 20th century. Theseinclude measures such as Yule’s Q and Yule’s Y [47], [48].Other measures, such as odds ratio [6], are also commonlyconsidered and utilized in various domains, such as medi-cal [7] and social science [23]. In the data mining community,Agrawal and Srikant have proposed the work on associationrule mining which aims to infer associations from two itemsetsin a transaction dataset in the early 90’s [5]. In that work themetrics of support and confidence for measuring the strengthof an association are proposed. Various other metrics, such asinterest and collective strength, are proposed later. We describethese measures in detail in Section IV for our evaluations.
Tan et al. investigate various association measures, comparetheir properties, and outline the benefits and limitations ofeach from a computation point of view [45]. The measuresare revisited by Geng and Hamilton by including measuresfor aggregated data summaries [18]. In this paper, we extendtheir work in the specific domain of fault localization bycomparing the measures based on their ability to provide highsuspiciousness for buggy program elements.
III. CONCEPTS & DEFINITIONS
In this section we formally introduce the problem ofspectrum-based fault localization as an association question.Next, we describe the concept of dichotomy matrix that willbe used to calculate the strength of the association betweentwo variables.
A. Spectrum-Based Fault Localization
This problem starts with a faulty program, a set of test cases,and a test oracle. The set of test cases are run over the faultyprogram and observations of how the program runs on eachof the test cases are recorded as program spectra. A programspectrum [22], [39] is simply a set of data or values collectedat runtime; each value could be a program state, or a counteror a flag for a program element. A test oracle is available tolabel whether a particular output or execution of a test case iscorrect or wrong. Wrong executions are classified as programfailures. The task of a fault localization tool is to find theprogram elements that are responsible for the failures (i.e.,the faults or the root causes) based on the program spectra ofboth correct and wrong executions.
Definition 3.1 (Association Question): Given a programP = {e1, ..., en} and a set of program spectra T = Ts ∪ Tf
for P , where P is comprised of n elements e1, ..., en and Tis comprised of the spectra for correct executions Ts and thespectra for wrong executions Tf , the association question isto measure (1) the strength of the association between the
Block ID Program Elements T15 T16 T17 T18 1 int count; • • • •
int n; Ele *proc; List *src_queue, *dest_queue;
if (prio >= MAXPRIO) /*maxprio=3*/ 2
{return;} • • • 3 src_queue = prio_queue[prio]; • • • •
dest_queue = prio_queue[prio+1];
count = src_queue->mem_count; if (count > 1) /* Bug- supposed : count>0*/ {
4 n = (int) (count*ratio + 1); • • proc = find_nth(src_queue, n); if (proc) {
5 src_queue = del_ele(src_queue, proc); • • proc->priority = prio; dest_queue = append_ele(dest_queue, proc); } }}
Pass/Fail of Test Case Execution : Pass Pass Pass Fail Fig. 1. Example of block-hit program spectra
execution of each ei and the program failures and (2) thestrength of the association between the non-execution of eachei and the program failures, and (3) assign a quantitative scoreto each ei to indicate the likelihood that ei is a fault. We callthe score for each ei the suspiciousness score.
There have been various spectra proposed in the litera-ture [1], [22], but we are particularly interested in block-hitprogram spectra, each of which consists of a set of flags toindicate whether each basic block is executed or not in eachtest case.1 An example of block-hit program spectra is shownin Figure 1. The second column is a code excerpt from theSiemens test programs; the “Block ID” column indicates theID of the containing basic block of the statements. A bug liesin the if condition in Block 3, causing Blocks 4–5 to beskipped when the variable count is 1. The other columnsindicate whether each basic block is executed in each of testcases 15, 16, 17, and 18 along with the information whetherthe test case is pass or fail. In this example, • denotes a basicblock is executed by a test case and an empty cell denotes theblock is not executed by the test case.
There are also various ways to calculate the associationstrengths based on various association measures. Evaluatingthese association measures is the focus of this paper and ispresented in the following sections. In addition, transform-ing association strengths into suspiciousness scores for eican be done in different ways. However, the transformationfunctions involved in this step can often be very simple(e.g., an identity function or a maximum function) as longas the association measures can provide accurate associationstrengths with failures for each ei. Separating the calculationof suspiciousness scores from association strengths allowsmore flexible combinations of the two association strengthsfor each ei, but it is not our focus in this purpose to evaluatedifferent combinations.
1) Tarantula: Jones and Harrold propose Tarantula [27] torank program elements based on their suspiciousness measure.Intuitively, a program element is more suspicious if it appears
1We acknowledge that different spectra may have different effects in faultlocalization. We use block-hit program spectra in this paper mainly forestablishing the same ground for comparison with Tarantula and Ochiai. Aninteresting future work will be to evaluate the applicability and effectivenessof various association measures on different kinds of program spectra.
in failed executions more frequently than in correct executions.Now we introduce the following common notations which areused in the association and suspiciousness measures in the restof the paper: Given a program P and a test suite for P , n isthe total number of test cases in the test suite; n(e) is thenumber of test cases that run through a particular element ein P ; ns is the number of test cases that succeed; nf is thenumber of test cases that fail; ns(e) is the number of test casesthat run through a particular element e and succeed; nf (e) isthe number of test cases that run through a particular elemente and fail.
Then, the suspiciousness score introduced by Tarantula foreach element e can be represented as the following:
suspiciousness(e) =
nf (e)nf
ns(e)ns
+nf (e)nf
Based on block-hit program spectra in Figure 1, the suspi-ciousness score of Block 3 that contains the bug is 1/1
3/3+1/1 =0.5. Block 1 also has the same suspiciousness score. Inter-estingly, Block 2 receives the highest suspiciousness score:
1/12/3+1/1 = 0.6. Following the same calculation, Blocks 4 and5 are not suspicious. There is no fail test case that executesthese blocks and hence Tarantula returns 0 score. The bug inBlock 3 can be localized after inspecting 3 blocks accordingto the ranks of the scores and the source code order.
2) Ochiai: Abreu et al. [2] suggest Ochiai metric as thesuspiciousness score for a program element:
suspiciousness(e) =nf (e)√
nf (nf (e) + ns(e))=
nf (e)√nfn(e)
Similar to Tarantula, Ochiai considers an element moresuspicious if it occurs more frequently in failed executionsthan in correct executions (the
√nf (e)n(e) part). Using the same
example in Figure 1, Blocks 1 and 3 receive a suspicious-ness score: 1/
√1 ∗ (1 + 3) = 0.50. Similar to Tarantula,
Ochiai also returns Block 2 as the most suspicious block:1/√1 ∗ (1 + 2) = 0.58, while the remaining blocks are not
suspicious. Same as Tarantula, Ochiai can help to localize thebug after inspecting through 3 blocks. In our study, we areinterested to look for other measures that can localize the bugearlier, and Section IV shows one such example.
B. Dichotomous Association
A common characteristics of the association measures eval-uated in this paper is that they are all defined based on di-chotomy matrices. The following are the necessary definitions.
Definition 3.2 (Dichotomy): A dichotomous outcome is anoutcome whose values could be split into two categories,e.g., wrong or correct, executed or skipped, and married orunmarried, etc. A dichotomous variable is a variable having adichotomous outcome. A dichotomy matrix is a 2× 2 matrixthat tries to associate two dichotomous variables in the form ofa 2×2 contingency table which records the bivariate frequencydistribution of the two variables.
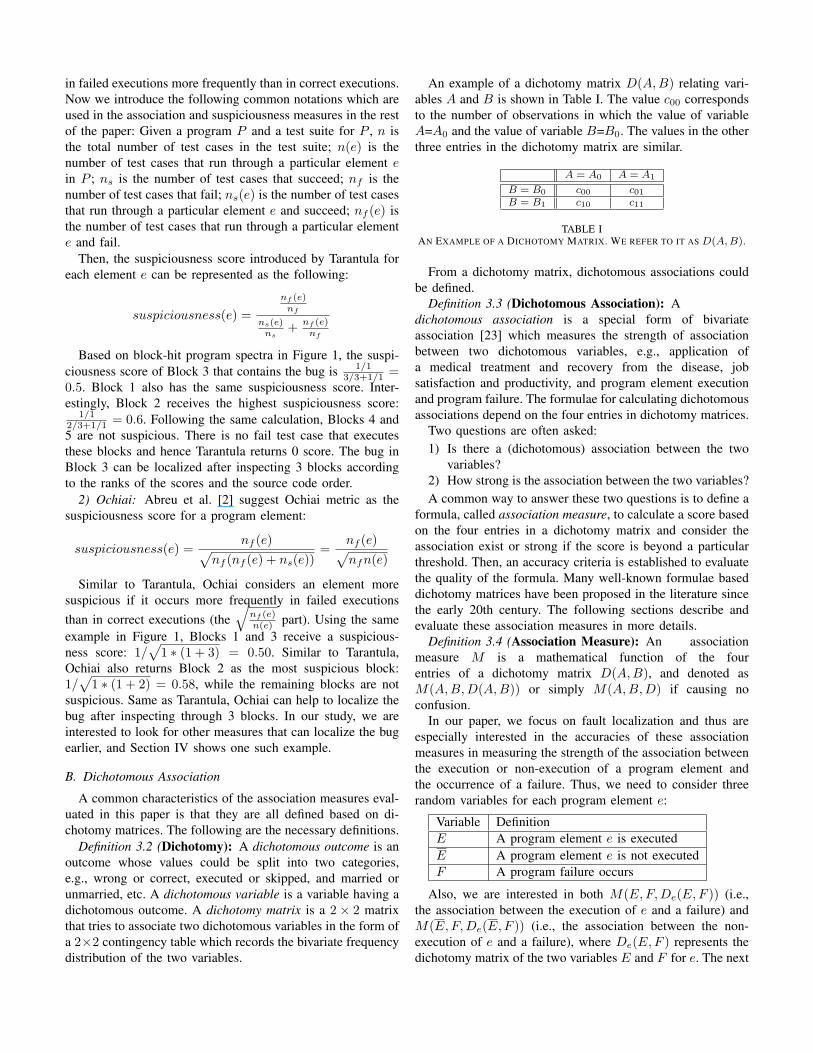
An example of a dichotomy matrix D(A,B) relating vari-ables A and B is shown in Table I. The value c00 correspondsto the number of observations in which the value of variableA=A0 and the value of variable B=B0. The values in the otherthree entries in the dichotomy matrix are similar.
A = A0 A = A1
B = B0 c00 c01B = B1 c10 c11
TABLE IAN EXAMPLE OF A DICHOTOMY MATRIX. WE REFER TO IT AS D(A,B).
From a dichotomy matrix, dichotomous associations couldbe defined.
Definition 3.3 (Dichotomous Association): Adichotomous association is a special form of bivariateassociation [23] which measures the strength of associationbetween two dichotomous variables, e.g., application ofa medical treatment and recovery from the disease, jobsatisfaction and productivity, and program element executionand program failure. The formulae for calculating dichotomousassociations depend on the four entries in dichotomy matrices.
Two questions are often asked:1) Is there a (dichotomous) association between the two
variables?2) How strong is the association between the two variables?A common way to answer these two questions is to define a
formula, called association measure, to calculate a score basedon the four entries in a dichotomy matrix and consider theassociation exist or strong if the score is beyond a particularthreshold. Then, an accuracy criteria is established to evaluatethe quality of the formula. Many well-known formulae baseddichotomy matrices have been proposed in the literature sincethe early 20th century. The following sections describe andevaluate these association measures in more details.
Definition 3.4 (Association Measure): An associationmeasure M is a mathematical function of the fourentries of a dichotomy matrix D(A,B), and denoted asM(A,B,D(A,B)) or simply M(A,B,D) if causing noconfusion.
In our paper, we focus on fault localization and thus areespecially interested in the accuracies of these associationmeasures in measuring the strength of the association betweenthe execution or non-execution of a program element andthe occurrence of a failure. Thus, we need to consider threerandom variables for each program element e:
Variable DefinitionE A program element e is executedE A program element e is not executedF A program failure occurs
Also, we are interested in both M(E,F,De(E,F )) (i.e.,the association between the execution of e and a failure) andM(E,F,De(E,F )) (i.e., the association between the non-execution of e and a failure), where De(E,F ) represents thedichotomy matrix of the two variables E and F for e. The next
section presents the construction of the dichotomy matricesand it should be easy to see that De(E,F ) and De(E,F ) areactually the same since E and E are mutually exclusive.
IV. ASSOCIATION MEASURES
We investigate the effectiveness of 20 association measuresin fault localization and compare them against Tarantula andOchiai. In this section, we first introduce how we establishthe dichotomy matrices. We then describe the 20 associationmeasures computed from the dichotomy matrices. Finally,we describe how we transform the association measures tosuspiciousness scores for fault localization.
A. Constructing a Dichotomy Matrix
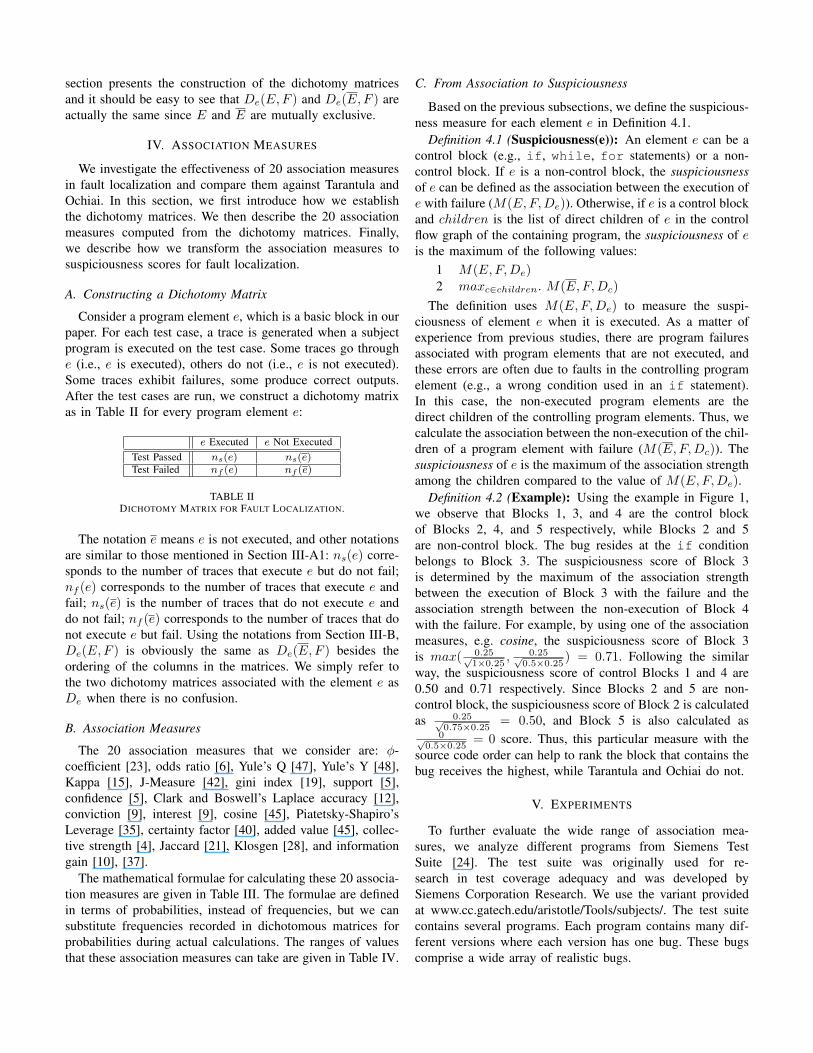
Consider a program element e, which is a basic block in ourpaper. For each test case, a trace is generated when a subjectprogram is executed on the test case. Some traces go throughe (i.e., e is executed), others do not (i.e., e is not executed).Some traces exhibit failures, some produce correct outputs.After the test cases are run, we construct a dichotomy matrixas in Table II for every program element e:
e Executed e Not ExecutedTest Passed ns(e) ns(e)Test Failed nf (e) nf (e)
TABLE IIDICHOTOMY MATRIX FOR FAULT LOCALIZATION.
The notation e means e is not executed, and other notationsare similar to those mentioned in Section III-A1: ns(e) corre-sponds to the number of traces that execute e but do not fail;nf (e) corresponds to the number of traces that execute e andfail; ns(e) is the number of traces that do not execute e anddo not fail; nf (e) corresponds to the number of traces that donot execute e but fail. Using the notations from Section III-B,De(E,F ) is obviously the same as De(E,F ) besides theordering of the columns in the matrices. We simply refer tothe two dichotomy matrices associated with the element e asDe when there is no confusion.
B. Association Measures
The 20 association measures that we consider are: ϕ-coefficient [23], odds ratio [6], Yule’s Q [47], Yule’s Y [48],Kappa [15], J-Measure [42], gini index [19], support [5],confidence [5], Clark and Boswell’s Laplace accuracy [12],conviction [9], interest [9], cosine [45], Piatetsky-Shapiro’sLeverage [35], certainty factor [40], added value [45], collec-tive strength [4], Jaccard [21], Klosgen [28], and informationgain [10], [37].
The mathematical formulae for calculating these 20 associa-tion measures are given in Table III. The formulae are definedin terms of probabilities, instead of frequencies, but we cansubstitute frequencies recorded in dichotomous matrices forprobabilities during actual calculations. The ranges of valuesthat these association measures can take are given in Table IV.
C. From Association to Suspiciousness
Based on the previous subsections, we define the suspicious-ness measure for each element e in Definition 4.1.
Definition 4.1 (Suspiciousness(e)): An element e can be acontrol block (e.g., if, while, for statements) or a non-control block. If e is a non-control block, the suspiciousnessof e can be defined as the association between the execution ofe with failure (M(E,F,De)). Otherwise, if e is a control blockand children is the list of direct children of e in the controlflow graph of the containing program, the suspiciousness of eis the maximum of the following values:
1 M(E,F,De)2 maxc∈children. M(E,F,Dc)
The definition uses M(E,F,De) to measure the suspi-ciousness of element e when it is executed. As a matter ofexperience from previous studies, there are program failuresassociated with program elements that are not executed, andthese errors are often due to faults in the controlling programelement (e.g., a wrong condition used in an if statement).In this case, the non-executed program elements are thedirect children of the controlling program elements. Thus, wecalculate the association between the non-execution of the chil-dren of a program element with failure (M(E,F,Dc)). Thesuspiciousness of e is the maximum of the association strengthamong the children compared to the value of M(E,F,De).
Definition 4.2 (Example): Using the example in Figure 1,we observe that Blocks 1, 3, and 4 are the control blockof Blocks 2, 4, and 5 respectively, while Blocks 2 and 5are non-control block. The bug resides at the if conditionbelongs to Block 3. The suspiciousness score of Block 3is determined by the maximum of the association strengthbetween the execution of Block 3 with the failure and theassociation strength between the non-execution of Block 4with the failure. For example, by using one of the associationmeasures, e.g. cosine, the suspiciousness score of Block 3is max( 0.25√
1×0.25, 0.25√
0.5×0.25) = 0.71. Following the similar
way, the suspiciousness score of control Blocks 1 and 4 are0.50 and 0.71 respectively. Since Blocks 2 and 5 are non-control block, the suspiciousness score of Block 2 is calculatedas 0.25√
0.75×0.25= 0.50, and Block 5 is also calculated as
0√0.5×0.25
= 0 score. Thus, this particular measure with thesource code order can help to rank the block that contains thebug receives the highest, while Tarantula and Ochiai do not.
V. EXPERIMENTS
To further evaluate the wide range of association mea-sures, we analyze different programs from Siemens TestSuite [24]. The test suite was originally used for re-search in test coverage adequacy and was developed bySiemens Corporation Research. We use the variant providedat www.cc.gatech.edu/aristotle/Tools/subjects/. The test suitecontains several programs. Each program contains many dif-ferent versions where each version has one bug. These bugscomprise a wide array of realistic bugs.
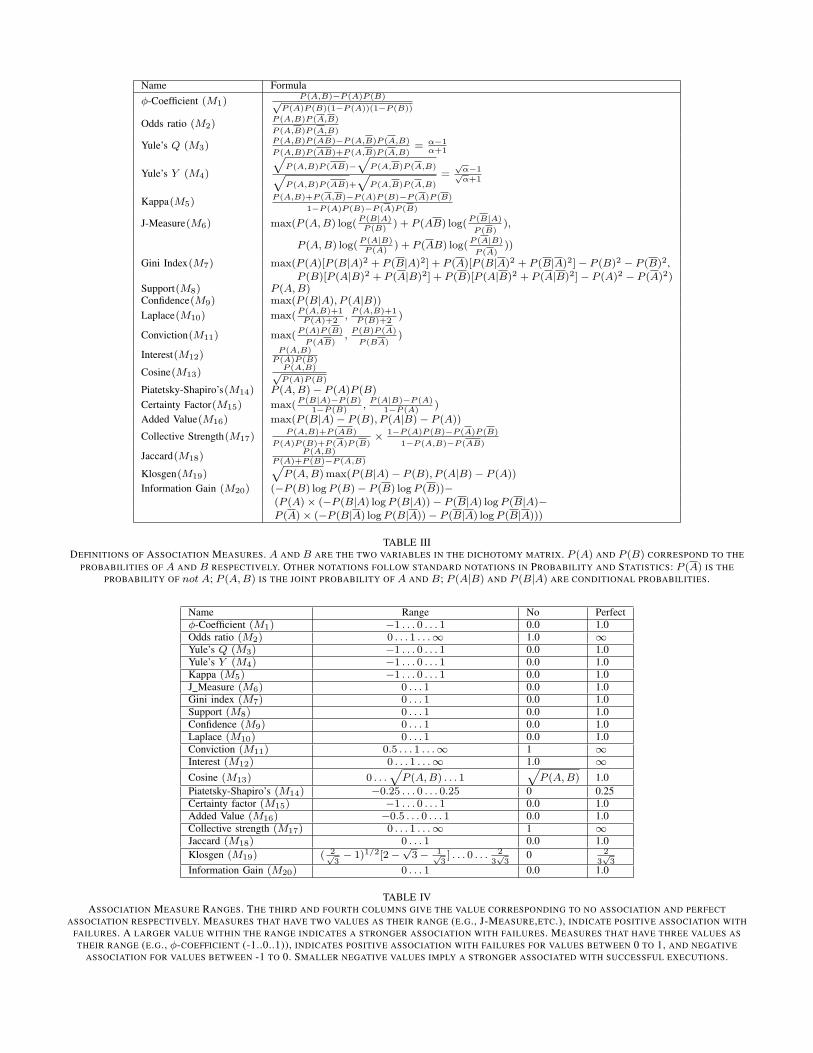
Name Formulaϕ-Coefficient (M1)
P (A,B)−P (A)P (B)√P (A)P (B)(1−P (A))(1−P (B))
Odds ratio (M2)P (A,B)P (A,B)
P (A,B)P (A,B)
Yule’s Q (M3)P (A,B)P (AB)−P (A,B)P (A,B)
P (A,B)P (AB)+P (A,B)P (A,B)= α−1
α+1
Yule’s Y (M4)
√P (A,B)P (AB)−
√P (A,B)P (A,B)√
P (A,B)P (AB)+
√P (A,B)P (A,B)
=√
α−1√α+1
Kappa(M5)P (A,B)+P (A,B)−P (A)P (B)−P (A)P (B)
1−P (A)P (B)−P (A)P (B)
J-Measure(M6) max(P (A,B) log(P (B|A)P (B)
) + P (AB) log(P (B|A)
P (B)),
P (A,B) log(P (A|B)P (A)
) + P (AB) log(P (A|B)
P (A)))
Gini Index(M7) max(P (A)[P (B|A)2 + P (B|A)2] + P (A)[P (B|A)2 + P (B|A)2]− P (B)2 − P (B)2,P (B)[P (A|B)2 + P (A|B)2] + P (B)[P (A|B)2 + P (A|B)2]− P (A)2 − P (A)2)
Support(M8) P (A,B)Confidence(M9) max(P (B|A), P (A|B))
Laplace(M10) max(P (A,B)+1P (A)+2
,P (A,B)+1P (B)+2
)
Conviction(M11) max(P (A)P (B)
P (AB),P (B)P (A)
P (BA))
Interest(M12)P (A,B)
P (A)P (B)
Cosine(M13)P (A,B)√P (A)P (B)
Piatetsky-Shapiro’s(M14) P (A,B)− P (A)P (B)
Certainty Factor(M15) max(P (B|A)−P (B)
1−P (B),P (A|B)−P (A)
1−P (A))
Added Value(M16) max(P (B|A)− P (B), P (A|B)− P (A))
Collective Strength(M17)P (A,B)+P (AB)
P (A)P (B)+P (A)P (B)× 1−P (A)P (B)−P (A)P (B)
1−P (A,B)−P (AB)
Jaccard(M18)P (A,B)
P (A)+P (B)−P (A,B)
Klosgen(M19)√
P (A,B)max(P (B|A)− P (B), P (A|B)− P (A))
Information Gain (M20) (−P (B) logP (B)− P (B) logP (B))−(P (A)× (−P (B|A) logP (B|A))− P (B|A) logP (B|A)−P (A)× (−P (B|A) logP (B|A))− P (B|A) logP (B|A)))
TABLE IIIDEFINITIONS OF ASSOCIATION MEASURES. A AND B ARE THE TWO VARIABLES IN THE DICHOTOMY MATRIX. P (A) AND P (B) CORRESPOND TO THE
PROBABILITIES OF A AND B RESPECTIVELY. OTHER NOTATIONS FOLLOW STANDARD NOTATIONS IN PROBABILITY AND STATISTICS: P (A) IS THEPROBABILITY OF not A; P (A,B) IS THE JOINT PROBABILITY OF A AND B; P (A|B) AND P (B|A) ARE CONDITIONAL PROBABILITIES.
Name Range No Perfectϕ-Coefficient (M1) −1 . . . 0 . . . 1 0.0 1.0Odds ratio (M2) 0 . . . 1 . . .∞ 1.0 ∞Yule’s Q (M3) −1 . . . 0 . . . 1 0.0 1.0Yule’s Y (M4) −1 . . . 0 . . . 1 0.0 1.0Kappa (M5) −1 . . . 0 . . . 1 0.0 1.0J Measure (M6) 0 . . . 1 0.0 1.0Gini index (M7) 0 . . . 1 0.0 1.0Support (M8) 0 . . . 1 0.0 1.0Confidence (M9) 0 . . . 1 0.0 1.0Laplace (M10) 0 . . . 1 0.0 1.0Conviction (M11) 0.5 . . . 1 . . .∞ 1 ∞Interest (M12) 0 . . . 1 . . .∞ 1.0 ∞Cosine (M13) 0 . . .
√P (A,B) . . . 1
√P (A,B) 1.0
Piatetsky-Shapiro’s (M14) −0.25 . . . 0 . . . 0.25 0 0.25Certainty factor (M15) −1 . . . 0 . . . 1 0.0 1.0Added Value (M16) −0.5 . . . 0 . . . 1 0.0 1.0Collective strength (M17) 0 . . . 1 . . .∞ 1 ∞Jaccard (M18) 0 . . . 1 0.0 1.0Klosgen (M19) ( 2√
3− 1)1/2[2−
√3− 1√
3] . . . 0 . . . 2
3√
30 2
3√
3Information Gain (M20) 0 . . . 1 0.0 1.0
TABLE IVASSOCIATION MEASURE RANGES. THE THIRD AND FOURTH COLUMNS GIVE THE VALUE CORRESPONDING TO NO ASSOCIATION AND PERFECT
ASSOCIATION RESPECTIVELY. MEASURES THAT HAVE TWO VALUES AS THEIR RANGE (E.G., J-MEASURE,ETC.), INDICATE POSITIVE ASSOCIATION WITHFAILURES. A LARGER VALUE WITHIN THE RANGE INDICATES A STRONGER ASSOCIATION WITH FAILURES. MEASURES THAT HAVE THREE VALUES ASTHEIR RANGE (E.G., ϕ-COEFFICIENT (-1..0..1)), INDICATES POSITIVE ASSOCIATION WITH FAILURES FOR VALUES BETWEEN 0 TO 1, AND NEGATIVE
ASSOCIATION FOR VALUES BETWEEN -1 TO 0. SMALLER NEGATIVE VALUES IMPLY A STRONGER ASSOCIATED WITH SUCCESSFUL EXECUTIONS.
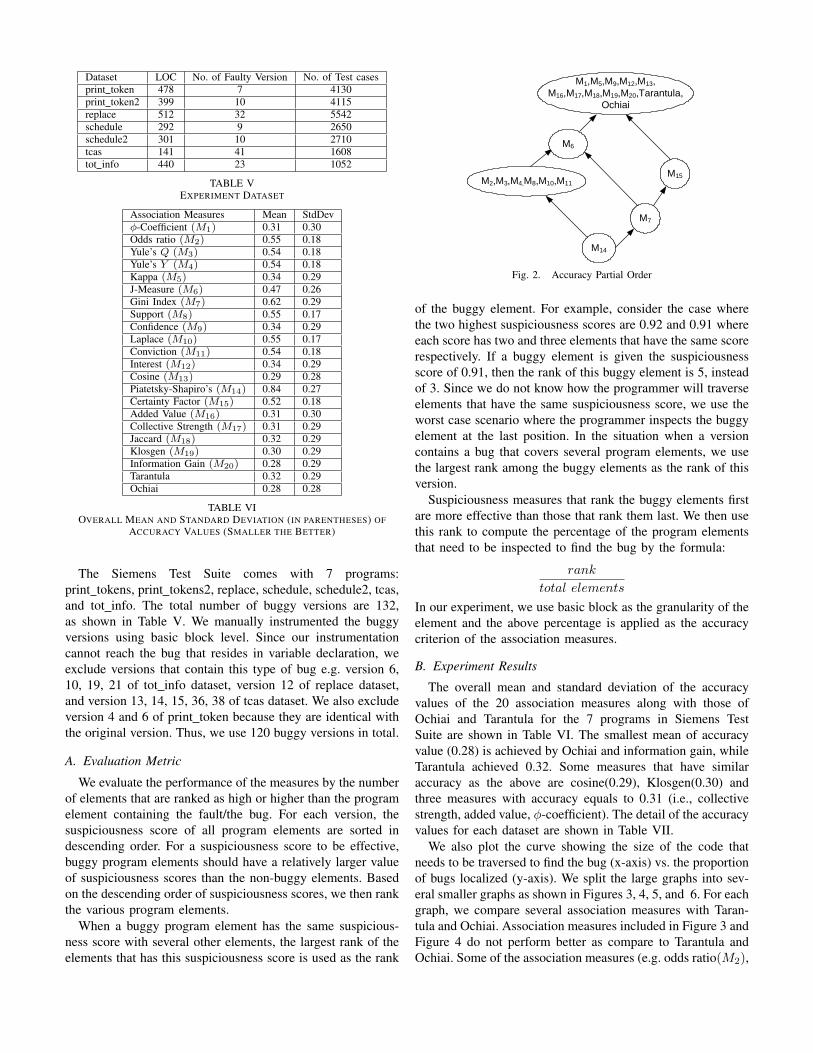
Dataset LOC No. of Faulty Version No. of Test casesprint token 478 7 4130print token2 399 10 4115replace 512 32 5542schedule 292 9 2650schedule2 301 10 2710tcas 141 41 1608tot info 440 23 1052
TABLE VEXPERIMENT DATASET
Association Measures Mean StdDevϕ-Coefficient (M1) 0.31 0.30Odds ratio (M2) 0.55 0.18Yule’s Q (M3) 0.54 0.18Yule’s Y (M4) 0.54 0.18Kappa (M5) 0.34 0.29J-Measure (M6) 0.47 0.26Gini Index (M7) 0.62 0.29Support (M8) 0.55 0.17Confidence (M9) 0.34 0.29Laplace (M10) 0.55 0.17Conviction (M11) 0.54 0.18Interest (M12) 0.34 0.29Cosine (M13) 0.29 0.28Piatetsky-Shapiro’s (M14) 0.84 0.27Certainty Factor (M15) 0.52 0.18Added Value (M16) 0.31 0.30Collective Strength (M17) 0.31 0.29Jaccard (M18) 0.32 0.29Klosgen (M19) 0.30 0.29Information Gain (M20) 0.28 0.29Tarantula 0.32 0.29Ochiai 0.28 0.28
TABLE VIOVERALL MEAN AND STANDARD DEVIATION (IN PARENTHESES) OF
ACCURACY VALUES (SMALLER THE BETTER)
The Siemens Test Suite comes with 7 programs:print tokens, print tokens2, replace, schedule, schedule2, tcas,and tot info. The total number of buggy versions are 132,as shown in Table V. We manually instrumented the buggyversions using basic block level. Since our instrumentationcannot reach the bug that resides in variable declaration, weexclude versions that contain this type of bug e.g. version 6,10, 19, 21 of tot info dataset, version 12 of replace dataset,and version 13, 14, 15, 36, 38 of tcas dataset. We also excludeversion 4 and 6 of print token because they are identical withthe original version. Thus, we use 120 buggy versions in total.
A. Evaluation Metric
We evaluate the performance of the measures by the numberof elements that are ranked as high or higher than the programelement containing the fault/the bug. For each version, thesuspiciousness score of all program elements are sorted indescending order. For a suspiciousness score to be effective,buggy program elements should have a relatively larger valueof suspiciousness scores than the non-buggy elements. Basedon the descending order of suspiciousness scores, we then rankthe various program elements.
When a buggy program element has the same suspicious-ness score with several other elements, the largest rank of theelements that has this suspiciousness score is used as the rank
M1,M5,M9,M12,M13, M16,M17,M18,M19,M20,Tarantula,
Ochiai
M15M2,M3,M4,M8,M10,M11
M7
M14
M6
Fig. 2. Accuracy Partial Order
of the buggy element. For example, consider the case wherethe two highest suspiciousness scores are 0.92 and 0.91 whereeach score has two and three elements that have the same scorerespectively. If a buggy element is given the suspiciousnessscore of 0.91, then the rank of this buggy element is 5, insteadof 3. Since we do not know how the programmer will traverseelements that have the same suspiciousness score, we use theworst case scenario where the programmer inspects the buggyelement at the last position. In the situation when a versioncontains a bug that covers several program elements, we usethe largest rank among the buggy elements as the rank of thisversion.
Suspiciousness measures that rank the buggy elements firstare more effective than those that rank them last. We then usethis rank to compute the percentage of the program elementsthat need to be inspected to find the bug by the formula:
rank
total elements
In our experiment, we use basic block as the granularity of theelement and the above percentage is applied as the accuracycriterion of the association measures.
B. Experiment Results
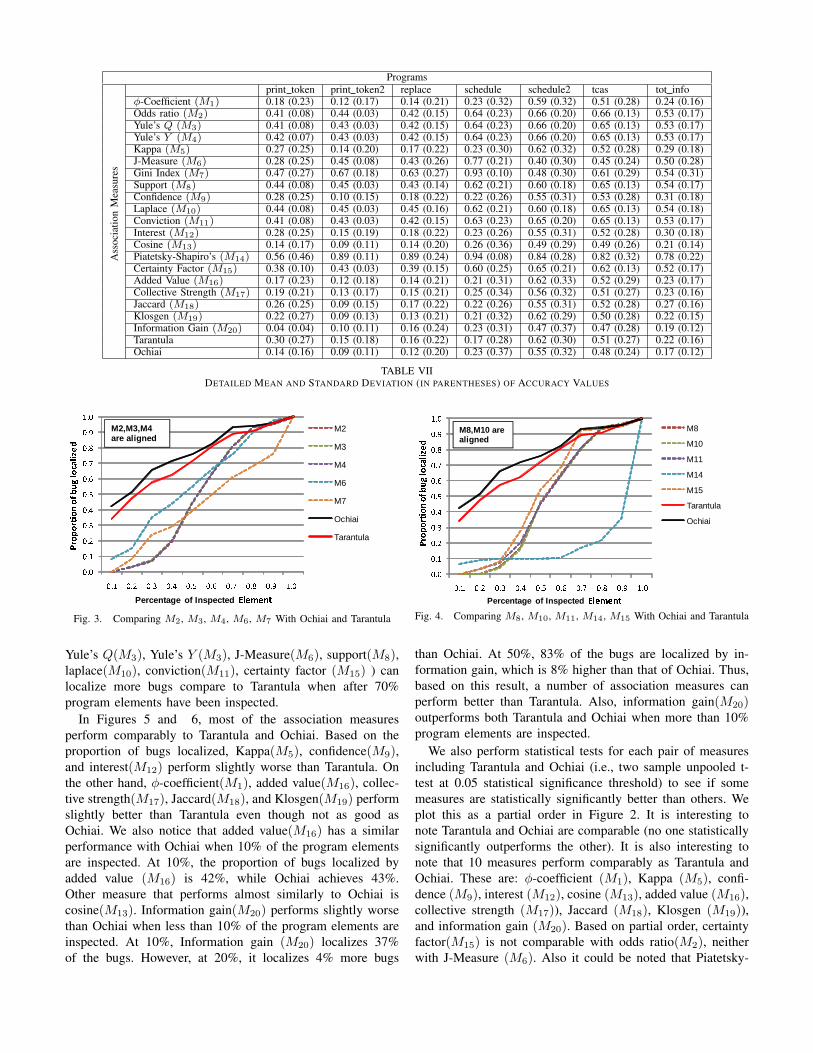
The overall mean and standard deviation of the accuracyvalues of the 20 association measures along with those ofOchiai and Tarantula for the 7 programs in Siemens TestSuite are shown in Table VI. The smallest mean of accuracyvalue (0.28) is achieved by Ochiai and information gain, whileTarantula achieved 0.32. Some measures that have similaraccuracy as the above are cosine(0.29), Klosgen(0.30) andthree measures with accuracy equals to 0.31 (i.e., collectivestrength, added value, ϕ-coefficient). The detail of the accuracyvalues for each dataset are shown in Table VII.
We also plot the curve showing the size of the code thatneeds to be traversed to find the bug (x-axis) vs. the proportionof bugs localized (y-axis). We split the large graphs into sev-eral smaller graphs as shown in Figures 3, 4, 5, and 6. For eachgraph, we compare several association measures with Taran-tula and Ochiai. Association measures included in Figure 3 andFigure 4 do not perform better as compare to Tarantula andOchiai. Some of the association measures (e.g. odds ratio(M2),
Programs
Ass
ocia
tion
Mea
sure
s
print token print token2 replace schedule schedule2 tcas tot infoϕ-Coefficient (M1) 0.18 (0.23) 0.12 (0.17) 0.14 (0.21) 0.23 (0.32) 0.59 (0.32) 0.51 (0.28) 0.24 (0.16)Odds ratio (M2) 0.41 (0.08) 0.44 (0.03) 0.42 (0.15) 0.64 (0.23) 0.66 (0.20) 0.66 (0.13) 0.53 (0.17)Yule’s Q (M3) 0.41 (0.08) 0.43 (0.03) 0.42 (0.15) 0.64 (0.23) 0.66 (0.20) 0.65 (0.13) 0.53 (0.17)Yule’s Y (M4) 0.42 (0.07) 0.43 (0.03) 0.42 (0.15) 0.64 (0.23) 0.66 (0.20) 0.65 (0.13) 0.53 (0.17)Kappa (M5) 0.27 (0.25) 0.14 (0.20) 0.17 (0.22) 0.23 (0.30) 0.62 (0.32) 0.52 (0.28) 0.29 (0.18)J-Measure (M6) 0.28 (0.25) 0.45 (0.08) 0.43 (0.26) 0.77 (0.21) 0.40 (0.30) 0.45 (0.24) 0.50 (0.28)Gini Index (M7) 0.47 (0.27) 0.67 (0.18) 0.63 (0.27) 0.93 (0.10) 0.48 (0.30) 0.61 (0.29) 0.54 (0.31)Support (M8) 0.44 (0.08) 0.45 (0.03) 0.43 (0.14) 0.62 (0.21) 0.60 (0.18) 0.65 (0.13) 0.54 (0.17)Confidence (M9) 0.28 (0.25) 0.10 (0.15) 0.18 (0.22) 0.22 (0.26) 0.55 (0.31) 0.53 (0.28) 0.31 (0.18)Laplace (M10) 0.44 (0.08) 0.45 (0.03) 0.45 (0.16) 0.62 (0.21) 0.60 (0.18) 0.65 (0.13) 0.54 (0.18)Conviction (M11) 0.41 (0.08) 0.43 (0.03) 0.42 (0.15) 0.63 (0.23) 0.65 (0.20) 0.65 (0.13) 0.53 (0.17)Interest (M12) 0.28 (0.25) 0.15 (0.19) 0.18 (0.22) 0.23 (0.26) 0.55 (0.31) 0.52 (0.28) 0.30 (0.18)Cosine (M13) 0.14 (0.17) 0.09 (0.11) 0.14 (0.20) 0.26 (0.36) 0.49 (0.29) 0.49 (0.26) 0.21 (0.14)Piatetsky-Shapiro’s (M14) 0.56 (0.46) 0.89 (0.11) 0.89 (0.24) 0.94 (0.08) 0.84 (0.28) 0.82 (0.32) 0.78 (0.22)Certainty Factor (M15) 0.38 (0.10) 0.43 (0.03) 0.39 (0.15) 0.60 (0.25) 0.65 (0.21) 0.62 (0.13) 0.52 (0.17)Added Value (M16) 0.17 (0.23) 0.12 (0.18) 0.14 (0.21) 0.21 (0.31) 0.62 (0.33) 0.52 (0.29) 0.23 (0.17)Collective Strength (M17) 0.19 (0.21) 0.13 (0.17) 0.15 (0.21) 0.25 (0.34) 0.56 (0.32) 0.51 (0.27) 0.23 (0.16)Jaccard (M18) 0.26 (0.25) 0.09 (0.15) 0.17 (0.22) 0.22 (0.26) 0.55 (0.31) 0.52 (0.28) 0.27 (0.16)Klosgen (M19) 0.22 (0.27) 0.09 (0.13) 0.13 (0.21) 0.21 (0.32) 0.62 (0.29) 0.50 (0.28) 0.22 (0.15)Information Gain (M20) 0.04 (0.04) 0.10 (0.11) 0.16 (0.24) 0.23 (0.31) 0.47 (0.37) 0.47 (0.28) 0.19 (0.12)Tarantula 0.30 (0.27) 0.15 (0.18) 0.16 (0.22) 0.17 (0.28) 0.62 (0.30) 0.51 (0.27) 0.22 (0.16)Ochiai 0.14 (0.16) 0.09 (0.11) 0.12 (0.20) 0.23 (0.37) 0.55 (0.32) 0.48 (0.24) 0.17 (0.12)
TABLE VIIDETAILED MEAN AND STANDARD DEVIATION (IN PARENTHESES) OF ACCURACY VALUES
0.00.10.20.30.40.50.60.70.80.91.0
0.1 0.2 0.3 0.4 0.5 0.6 0.7 0.8 0.9 1.0M2
M3
M4
M6
M7
Ochiai
Tarantula
Percentage of Inspected ElementProportionof bug localized M2,M3,M4
are aligned
Fig. 3. Comparing M2, M3, M4, M6, M7 With Ochiai and Tarantula
Yule’s Q(M3), Yule’s Y (M3), J-Measure(M6), support(M8),laplace(M10), conviction(M11), certainty factor (M15) ) canlocalize more bugs compare to Tarantula when after 70%program elements have been inspected.
In Figures 5 and 6, most of the association measuresperform comparably to Tarantula and Ochiai. Based on theproportion of bugs localized, Kappa(M5), confidence(M9),and interest(M12) perform slightly worse than Tarantula. Onthe other hand, ϕ-coefficient(M1), added value(M16), collec-tive strength(M17), Jaccard(M18), and Klosgen(M19) performslightly better than Tarantula even though not as good asOchiai. We also notice that added value(M16) has a similarperformance with Ochiai when 10% of the program elementsare inspected. At 10%, the proportion of bugs localized byadded value (M16) is 42%, while Ochiai achieves 43%.Other measure that performs almost similarly to Ochiai iscosine(M13). Information gain(M20) performs slightly worsethan Ochiai when less than 10% of the program elements areinspected. At 10%, Information gain (M20) localizes 37%of the bugs. However, at 20%, it localizes 4% more bugs
0.00.10.20.30.40.50.60.70.80.91.0
0.1 0.2 0.3 0.4 0.5 0.6 0.7 0.8 0.9 1.0
M8
M10
M11
M14
M15
Tarantula
Ochiai
Percentage of Inspected ElementProportionof bug localized M8,M10 are
aligned
Fig. 4. Comparing M8, M10, M11, M14, M15 With Ochiai and Tarantula
than Ochiai. At 50%, 83% of the bugs are localized by in-formation gain, which is 8% higher than that of Ochiai. Thus,based on this result, a number of association measures canperform better than Tarantula. Also, information gain(M20)outperforms both Tarantula and Ochiai when more than 10%program elements are inspected.
We also perform statistical tests for each pair of measuresincluding Tarantula and Ochiai (i.e., two sample unpooled t-test at 0.05 statistical significance threshold) to see if somemeasures are statistically significantly better than others. Weplot this as a partial order in Figure 2. It is interesting tonote Tarantula and Ochiai are comparable (no one statisticallysignificantly outperforms the other). It is also interesting tonote that 10 measures perform comparably as Tarantula andOchiai. These are: ϕ-coefficient (M1), Kappa (M5), confi-dence (M9), interest (M12), cosine (M13), added value (M16),collective strength (M17)), Jaccard (M18), Klosgen (M19)),and information gain (M20). Based on partial order, certaintyfactor(M15) is not comparable with odds ratio(M2), neitherwith J-Measure (M6). Also it could be noted that Piatetsky-
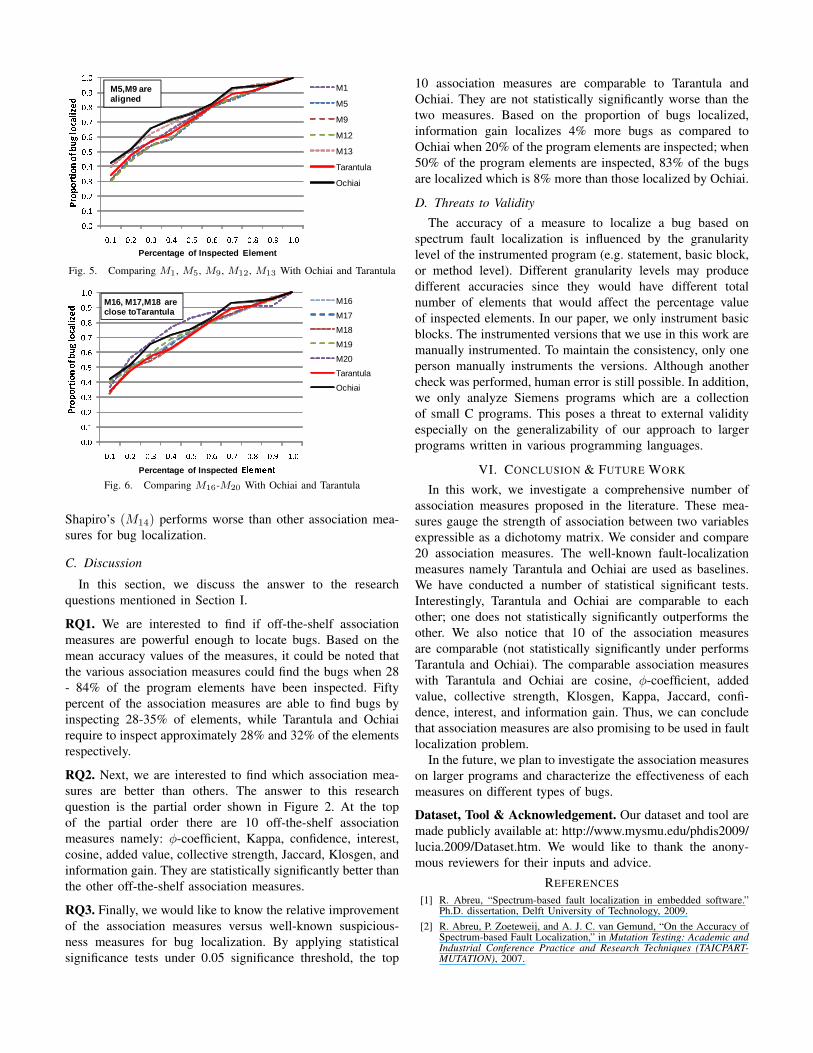
0.00.10.20.30.40.50.60.70.80.91.0
0.1 0.2 0.3 0.4 0.5 0.6 0.7 0.8 0.9 1.0
M1
M5
M9
M12
M13
Tarantula
OchiaiProportionof bug localized
Percentage of Inspected Element
M5,M9 are aligned
Fig. 5. Comparing M1, M5, M9, M12, M13 With Ochiai and Tarantula
0.00.10.20.30.40.50.60.70.80.91.0
0.1 0.2 0.3 0.4 0.5 0.6 0.7 0.8 0.9 1.0
M16
M17
M18
M19
M20
Tarantula
OchiaiProportionof bug localized M16, M17,M18 are
close toTarantula
Percentage of Inspected ElementFig. 6. Comparing M16-M20 With Ochiai and Tarantula
Shapiro’s (M14) performs worse than other association mea-sures for bug localization.
C. Discussion
In this section, we discuss the answer to the researchquestions mentioned in Section I.
RQ1. We are interested to find if off-the-shelf associationmeasures are powerful enough to locate bugs. Based on themean accuracy values of the measures, it could be noted thatthe various association measures could find the bugs when 28- 84% of the program elements have been inspected. Fiftypercent of the association measures are able to find bugs byinspecting 28-35% of elements, while Tarantula and Ochiairequire to inspect approximately 28% and 32% of the elementsrespectively.
RQ2. Next, we are interested to find which association mea-sures are better than others. The answer to this researchquestion is the partial order shown in Figure 2. At the topof the partial order there are 10 off-the-shelf associationmeasures namely: ϕ-coefficient, Kappa, confidence, interest,cosine, added value, collective strength, Jaccard, Klosgen, andinformation gain. They are statistically significantly better thanthe other off-the-shelf association measures.
RQ3. Finally, we would like to know the relative improvementof the association measures versus well-known suspicious-ness measures for bug localization. By applying statisticalsignificance tests under 0.05 significance threshold, the top
10 association measures are comparable to Tarantula andOchiai. They are not statistically significantly worse than thetwo measures. Based on the proportion of bugs localized,information gain localizes 4% more bugs as compared toOchiai when 20% of the program elements are inspected; when50% of the program elements are inspected, 83% of the bugsare localized which is 8% more than those localized by Ochiai.
D. Threats to Validity
The accuracy of a measure to localize a bug based onspectrum fault localization is influenced by the granularitylevel of the instrumented program (e.g. statement, basic block,or method level). Different granularity levels may producedifferent accuracies since they would have different totalnumber of elements that would affect the percentage valueof inspected elements. In our paper, we only instrument basicblocks. The instrumented versions that we use in this work aremanually instrumented. To maintain the consistency, only oneperson manually instruments the versions. Although anothercheck was performed, human error is still possible. In addition,we only analyze Siemens programs which are a collectionof small C programs. This poses a threat to external validityespecially on the generalizability of our approach to largerprograms written in various programming languages.
VI. CONCLUSION & FUTURE WORK
In this work, we investigate a comprehensive number ofassociation measures proposed in the literature. These mea-sures gauge the strength of association between two variablesexpressible as a dichotomy matrix. We consider and compare20 association measures. The well-known fault-localizationmeasures namely Tarantula and Ochiai are used as baselines.We have conducted a number of statistical significant tests.Interestingly, Tarantula and Ochiai are comparable to eachother; one does not statistically significantly outperforms theother. We also notice that 10 of the association measuresare comparable (not statistically significantly under performsTarantula and Ochiai). The comparable association measureswith Tarantula and Ochiai are cosine, ϕ-coefficient, addedvalue, collective strength, Klosgen, Kappa, Jaccard, confi-dence, interest, and information gain. Thus, we can concludethat association measures are also promising to be used in faultlocalization problem.
In the future, we plan to investigate the association measureson larger programs and characterize the effectiveness of eachmeasures on different types of bugs.
Dataset, Tool & Acknowledgement. Our dataset and tool aremade publicly available at: http://www.mysmu.edu/phdis2009/lucia.2009/Dataset.htm. We would like to thank the anony-mous reviewers for their inputs and advice.
REFERENCES
[1] R. Abreu, “Spectrum-based fault localization in embedded software.”Ph.D. dissertation, Delft University of Technology, 2009.
[2] R. Abreu, P. Zoeteweij, and A. J. C. van Gemund, “On the Accuracy ofSpectrum-based Fault Localization,” in Mutation Testing: Academic andIndustrial Conference Practice and Research Techniques (TAICPART-MUTATION), 2007.
[3] R. Abreu, P. Zoeteweij, and A. J. van Gemund, “Spectrum-BasedMultiple Fault Localization,” in IEEE/ACM International Conferenceon Automated Software Engineering, Auckland, New Zealand, 2009.
[4] C. Aggarwal and P. S. Yu, “A new framework for itemset generation.”in Symposium on Principles of Database Systems (PODS), 1998.
[5] R. Agrawal and R. Srikant, “Fast algorithms for mining associationrules,” in Proc. of Int. Conf. on Very Large Data Bases, 1994.
[6] A. Agresti, An Introduction to Categorical Data Analysis. John Wiley& Sons, 1996.
[7] R. B. Altman and T. E. Klein, “Challenges for biomedical informaticsand pharmacogenomics,” Annu. Rev. Pharmacol. Toxicol., vol. 42, pp.113–133, 2002.
[8] B. Beizer, Software Testing Techniques, 2nd ed. Boston: InternationalThomson Computer Press, 1990.
[9] S. Brin, R. Motwani, J. D. Ullman, and S. Tsur, “Dynamic itemsetcounting and implication rules for market basket analysis,” in SIGMOD,1997, pp. 255–264.
[10] H. Cheng, D. Lo, Y. Zhou, X. Wang, and X. Yan, “Identifying bugsignatures using discriminative graph mining,” in ISSTA, 2009.
[11] T. M. Chilimbi, B. Liblit, K. Mehra, A. V. Nori, and K. Vaswani,“Holmes: Effective statistical debugging via efficient path profiling,” inICSE, 2009, pp. 34–44.
[12] P. Clark and R. Boswell, “Rule induction with cn2: Some recentimprovements.” in In Machine Learning - EWSL-91, 1991, p. 151163.
[13] H. Cleve and A. Zeller, “Locating causes of program failures,” in ICSE,2005, pp. 342–351.
[14] C.Liu, X. Yan, L. Fei, J. Han, and S. Midkiff, “Sober: Statistical model-based bug localization,” in ESEC/FSE, Lisbon, Portugal, Sep. 2005.
[15] J. Cohen, “A coefficient of agreement for nominal scales,” Educationaland Psychological Measurement, vol. 20, no. 1, pp. 37–46, 1960.
[16] H. Do, S. G. Elbaum, and G. Rothermel, “Supporting controlled exper-imentation with testing techniques: An infrastructure and its potentialimpact.” Empirical Software Engineering: An International Journal,vol. 10, no. 4, pp. 405–435, 2005.
[17] A. Feldman and A. van Gemund, “A two-step hierarchical algorithm formodel-based diagnosis,” in Proceedings of the 21st National Conferenceon On Artificial Intelligence. Boston, Massachusetts: AAAI Press, 2006,pp. 827–833.
[18] L. Geng and H. Hamilton, “Interestingness measures for data mining:A survey.” in ACM Computing Surveys, 2006.
[19] C. Gini, “Variability and mutability, contribution to the study of sta-tistical distributions and relations.” Studi Economico-Giuricici della R.Universita de Cagliari, vol. 3(part 2), no. i-iii, pp. 3–159, 1912.
[20] N. Gupta, H. He, X. Zhang, and R. Gupta, “Locating faulty code usingfailure-inducing chops,” in ASE, 2005, pp. 263–272.
[21] D. J. Hand, H. Mannila, and P. Smyth, Principles of Data Mining. MITPress, 2001.
[22] M. Harrold, G. Rothermel, K. Sayre, R. Wu, and L. Yi, “An empiricalinvestigation of the relationship between spectra differences and regres-sion faults.” Software Testing, Verification and Reliability, vol. 10, no. 3,pp. 171–194, 2000.
[23] J. F. Healey, Statistics: A Tool for Social Research, 8th ed.Wadsworth Publishing, 2008. [Online]. Available: http://www.amazon.com/Statistics-Research-Joseph-F-Healey/dp/0495096555
[24] M. Hutchins, H. Foster, T. Goradia, and T. Ostrand, “Experiments of theeffectiveness of dataflow- and controlflow-based test adequacy criteria,”in Proc. of ICSE, 1994, pp. 191–200.
[25] D. Jeffrey, N. Gupta, and R. Gupta, “Fault localization using valuereplacement,” in International Symposium on Software Testing andAnalysis, 2008.
[26] J. Jones, M. Harrold, and J. Stasko, “Visualization of test information toassist fault detection,” in Proc. of Internation Conference on SoftwareEngineering, Orlando, Florida, May. 2002, pp. 467–477.
[27] J. Jones and M. Harrold, “Empirical evaluation of the tarantula automaticfault-localization technique,” in Proc. of International Conference onAutomated Software Engineering, 2005.
[28] W. Klosgen, “Explora: A multipattern and multistrategy discoveryassistant.” in Advances in Knowledge Discovery and Data Mining, 1996.
[29] A. J. Ko and B. A. Myers, “Debugging reinvented:asking and answeringwhy and why not questions about program behavior,” in International
Conference on Software Engineering, 2008.[30] B. Liblit, A. Aiken, A. X. Zheng, and M. I. Jordan, “Bug isolation
via remote program sampling,” in Proc. ACM SIGPLAN 2003 Conf.Programming Language Design and Implementation (PLDI 2003), SanDiego, CA, June 2003, pp. 141–154.
[31] B. Liblit, M. Naik, A. X. Zheng, A. Aiken, and M. I. Jordan, “Scalablestatistical bug isolation,” in Proc. ACM SIGPLAN 2005 Int. Conf.Programming Language Design and Implementation (PLDI’05), June2005.
[32] B. Liblit and A. Aiken, “Building a better backtrace: Techniques forpostmortem program analysis,” UC Berkeley, Tech. Rep. CSD-02-1203,2002.
[33] R. Manevich, M. Sridharan, S. Adams, M. Das, and Z. Yang, “PSE:Explaining program failures via postmortem static analysis,” in FSE,2004. [Online]. Available: citeseer.ist.psu.edu/manevich04pse.html
[34] W. Mayer and M. Stumptner, “Model-Based Debugging – State of theArt And Future Challenges,” Electronic Notes in Theoretical ComputerScience (ENTCS), vol. 174, no. 4, 2007.
[35] G. Piatetsky-Shapiro, “Discovery, analysis, and presentation of strongrules.” in KDD, 1991.
[36] D. Qi, A. Roychoudhury, Z. Liang, and K. Vaswani, “Darwin: Anapproach for debugging evolving programs,” in ESEC / SIGSOFT FSE’09. Amsterdam, The Netherlands: ACM, 2009.
[37] J. Quinlan, C4.5: Programs for Machine Learning. Morgan Kaufmann,1993.
[38] M. Renieris and S. Reiss, “Fault localization with nearest neighborqueries,” in Proc. of Int. Conf. on Automated Software Engineering,2003, pp. 141–154.
[39] T. Reps, T. Ball, M. Das, and J. Larus, “The use of program profilingfor software maintenance with applications to the year 2000 problem.”in ESEC/FSE, 1997.
[40] E. Shortliffe and B. Buchanan, “A model of inexact reasoning inmedicine.” Mathematical Biosciences, vol. 23, p. 351379, 1975.
[41] Siemens, M. J. Harrold, and G. Rothermel, AristotleAnalysis System – Siemens Programs, HR Variants,http://www.cc.gatech.edu/aristotle/Tools/subjects/.
[42] P. Smyth and R. Goodman, “An information theoretic approach to ruleinduction from databases,” IEEE Trans. Knowledge and Data Eng.,vol. 4, no. 4, pp. 301–316, 1992.
[43] C. D. Sterling and R. A. Olsson, “Automated bug isolation via programchipping,” Software: Practice and Experience (SP&E), vol. 37, no. 10,pp. 1061–1086, August 2007, john Wiley & Sons, Inc.
[44] S. Tallam, C. Tian, and R. Gupta, “Dynamic slicing of multithreadedprograms for race detection.” in Proc. of ICSM, 2008.
[45] P.-N. Tan, V. Kumar, and J. Srivastava, “Selecting the right interesting-ness measure for association patterns,” in KDD, 2002, pp. 32–41.
[46] G. Tassey, “The economic impacts of inadequate infrastructure for soft-ware testing.” National Institute of Standards and Technology. PlanningReport 02-3.2002, 2002.
[47] G. U. Yule, “On the association of attributes in statistics,” PhilosophicalTranscriptions of the Royal Society, vol. A194, pp. 257–319, 1900.
[48] ——, “On the methods of measuring association between two attributes,”Journal of the Royal Statistical Society, vol. 75, pp. 579–642, 1912.
[49] A. Zeller and R. Hildebrandt, “Simplifying and isolating failure-inducinginput,” IEEE Transaction on Software Engineering, vol. 28, pp. 183–200,2002.
[50] A. Zeller, “Isolating cause-effect chains from computer programs,” inFSE, 2002, pp. 1–10.
[51] ——, Why Programs Fail: A Guide to Systematic Debugging, 2nd ed.,T. Cox, Ed. Morgan Kaufmann, 2009.
[52] X. Zhang, N. Gupta, and R. Gupta, “Locating faults through automatedpredicate switching,” in ICSE, 2006.