Component-based model of buckling panels of steel beams at ...
50
This is a repository copy of Component-based model of buckling panels of steel beams at elevated temperatures. White Rose Research Online URL for this paper: http://eprints.whiterose.ac.uk/92894/ Version: Accepted Version Article: Quan, G., Huang, S. and Burgess, I. (2016) Component-based model of buckling panels of steel beams at elevated temperatures. Journal of Constructional Steel Research, 118. pp. 91-104. ISSN 0143-974X https://doi.org/10.1016/j.jcsr.2015.10.024 Article available under the terms of the CC-BY-NC-ND licence (https://creativecommons.org/licenses/by-nc-nd/4.0/) [email protected] https://eprints.whiterose.ac.uk/ Reuse Unless indicated otherwise, fulltext items are protected by copyright with all rights reserved. The copyright exception in section 29 of the Copyright, Designs and Patents Act 1988 allows the making of a single copy solely for the purpose of non-commercial research or private study within the limits of fair dealing. The publisher or other rights-holder may allow further reproduction and re-use of this version - refer to the White Rose Research Online record for this item. Where records identify the publisher as the copyright holder, users can verify any specific terms of use on the publisher’s website. Takedown If you consider content in White Rose Research Online to be in breach of UK law, please notify us by emailing [email protected] including the URL of the record and the reason for the withdrawal request.
-
Upload
khangminh22 -
Category
Documents
-
view
0 -
download
0
Transcript of Component-based model of buckling panels of steel beams at ...

This is a repository copy of Component-based model of buckling panels of steel beams at elevated temperatures.
White Rose Research Online URL for this paper:http://eprints.whiterose.ac.uk/92894/
Version: Accepted Version
Article:
Quan, G., Huang, S. and Burgess, I. (2016) Component-based model of buckling panels ofsteel beams at elevated temperatures. Journal of Constructional Steel Research, 118. pp. 91-104. ISSN 0143-974X
https://doi.org/10.1016/j.jcsr.2015.10.024
Article available under the terms of the CC-BY-NC-ND licence (https://creativecommons.org/licenses/by-nc-nd/4.0/)
[email protected]://eprints.whiterose.ac.uk/
Reuse
Unless indicated otherwise, fulltext items are protected by copyright with all rights reserved. The copyright exception in section 29 of the Copyright, Designs and Patents Act 1988 allows the making of a single copy solely for the purpose of non-commercial research or private study within the limits of fair dealing. The publisher or other rights-holder may allow further reproduction and re-use of this version - refer to the White Rose Research Online record for this item. Where records identify the publisher as the copyright holder, users can verify any specific terms of use on the publisher’s website.
Takedown
If you consider content in White Rose Research Online to be in breach of UK law, please notify us by emailing [email protected] including the URL of the record and the reason for the withdrawal request.


Component-Based Model of Buckling Panels of Steel
Beams at Elevated Temperatures
Guan Quan, Shan-Shan Huang, Ian Burgess
University of Sheffield, Department of Civil and Structural Engineering, UK
Abstract
Both bottom-flange buckling and beam-web shear buckling have been observed in
many full-scale fire tests in the vicinity of beam-to-column connections. These
phenomena can influence the load redistribution within the adjacent connections
and the global structural behaviour, detrimentally affecting the structural overall fire
resistance. However, existing models for bottom-flange buckling overestimate the
structural resistance when the beam is slender. In this work, a new analytical model
has been created to predict both of these types of buckling behaviour in steel beams
in the vicinity of beam-to-column connections at elevated temperatures. The model
considers the individual effects of both buckling modes, as well as their interaction.
It is capable of predicting the force-deflection relationship of the buckling zone from
the initial elastic loading stage to run-away failure. The new analytical model has
been compared with the existing Dharmaげs model and a range of 3D finite element
simulations created using the ABAQUS software. Comparisons have shown that the
proposed method gives better predictions than Dharmaげゲ model. A component-
based model of the buckling zone has been created on the basis of this new analysis.
The component-based model can provide sufficient accuracy, and will be

implemented in the software Vulcan for performance-based global structural fire
analysis.
Keywords: Shear Buckling; Bottom-Flange Buckling; Component-Based Model; Fire.

Notation:
b flange width
c half flange width
d depth of a beam web
f width of one strut in compression zone
F vertical shear force at the end of the buckling zone
Fmax maximum reaction force
Fp,T reaction force when plastic bending moment resistance is reached
hc height of the area resisting axial force in a strut
k1 the stiffness of the compressive spring in the flange buckling component
k2 the stiffness of the compressive spring in the shear buckling component
kE ヴWS┌Iデキラミ a;Iデラヴ aラヴ ┞ラ┌ミェげゲ マラS┌ノ┌ゲ ;デ WノW┗;デWS デWマヮWヴ;デures
ky reduction factor for yield stress at elevated temperatures
M bending moment at the end of the buckling zone
Mp bending moment resistance of one beam-web compressive strut
Pc axial force resistance of one beam-web compressive strut
tf thickness of the flange
tw thickness of the beam web
g the angle between tensile strips and the deformed upper flange
g1 the angle between a yield line and vertical direction
∆1 out-of-plane deflection of one strut
∆vs the vertical movement of the right edge of the shear panel
il,し limiting strain for yield strength at elevated temperatures
ip,し strain at the proportional limit at elevated temperatures
iu,し ultimate strain of steel at elevated temperatures
iy,し yield strain of steel at elevated temperatures
し1 the rotation caused by bottom-flange buckling
し2 the rotation caused by shear buckling
jc compressive stress in the compressive strips
jcf compressive stress in the flange along beam length
jeq yield strength of the flange considering reduction caused by axial stresses
and shear stresses
jeq1 yield strength of the flange considering reduction caused by axial stress
parallel to yield lines
jp,し stress at the proportional limit at elevated temperatures
jr stress normal to the yield lines
jt tensile stress in the tensile strips
jtf tensile stress in the flange along beam length
jy yield strength of steel at ambient temperature
jy,し yield strength of steel at elevated temperatures
jyf,し yield strength of the flange without considering reduction at elevated
temperatures
jyw,し yield strength of steel web at elevated temperatures
kr shear force parallel to the yield lines
1. Introduction
TエW Iラノノ;ヮゲW ラa デエW けΑ WラヴノS Tヴ;SWげ H┌キノSキミェ キミ NW┘ Yラヴニ Cキデ┞ [1] indicates that the
progressive collapse of the whole building was initially triggered by the failure of
beam-to-column connections. Connection failure was also observed on many other
occasions, including the well-known full-scale Cardington series of Fire Tests [2].
Beam-to-column connections have been among the key elements for the
investigation of the robustness of steel structures in fire. It has traditionally been
assumed that connections have sufficient fire resistance, because of their lower
temperatures and slower rates of heating compared with the members to which
they are connected. However, connections are actually under complicated and
extreme force combinations transferred from the connected members; these forces
are not usually considered in ambient-temperature design. A number of previous
research studies [3-6] have shed light on the performance of beam-to-column
connections in fire, and have further proved that connections are potentially the
most vulnerable parts of a steel-framed structure in fire.
The Cardington Fire Tests [7] indicated that combinations of beam-web shear
buckling and flange buckling are very prevalent under fire conditions. This
phenomenon can significantly influence the internal forces in the connections.
Flange buckling can raise the neutral axis, which changes the force distribution in the
IラミミWIデキラミげゲ components. Although at early stages of heating the top bolt rows
would logically experience higher tensile force without flange buckling than when it
has occurred, this situation may be reversed in the high-temperature catenary stage
when, without a significant connection moment, most of the catenary force may be

carried by these rows. Local buckling at the beam ends will also have an effect on the
deflection of the beam, and therefore influence the net tying force within the
connection. The increased beam deflection during the heating phase of the fire will
significantly increase the tension force on the connection during the cooling down
period. However, the contribution of the combination of beam-web shear buckling
and flange buckling in the vicinity of beam ends has not been taken into
consideration by almost any of the existing research.
The behaviour of structural elements in real frames observed in the full-scale
Cardington Fire Tests [2, 8-10] was very different from that observed in furnace tests
on isolated elements. This indicates the importance of performance-based design,
which sufficiently considers the interactions between various members of the
structure. However, full-scale structural testing is expensive. To carry out finite-
element modelling of an entire structure, including detailed representation of the
connections, is computationally demanding, and is therefore not feasible for
practical design. A practical alternative approach, component-based modelling of
connections, has been proposed [11, 12].
The component-based method considers different parts of each connection as an
assembly of individual nonlinear springs with predefined force-deformation
characteristics. This method has been used to establish a connection element, which
has been integrated into the software Vulcan [13], which was developed by the
Structural Fire Engineering Research Group at the University of Sheffield. Vulcan is a
three-dimensional program, allowing engineers to conduct three-dimensional
structural robustness assessments. A variety of elements (beam-column,

connections, shear connector and slab) has already been implemented. Recently,
Sun et al. [14, 15] developed a static-dynamic solution procedure for Vulcan. This
procedure is able to capture re-stabilization after initial instability caused by local
failure. For instance, this can be used to track the sequential failure of different
connection components during progressive collapse of a whole structure. Sufficient
validation [8, 9, 16-18] has been carried out to demonstrate that Vulcan is an
accurate and computationally-efficient software to be used in performance-based
fire engineering design.
Elghazouli et al. [19] implemented a local-buckling model within a frame analysis
program to investigate the influence of local buckling at the beam ends on the fire
response of frame members and sub-assemblies. This study indicated that, although
local buckling at the beam ends may not directly trigger overall structural collapse, it
can have detrimental effects on the deflections of, and load re-distributions between,
structural elements. This will influence the fire resistance of the structure. However,
デエW ノラI;ノ H┌Iニノキミェ マラSWノ ヮヴWゲWミデWS キミ Eノェエ;┣ラ┌ノキげゲ ┘ラヴニ キゲ H;ゲWS ラミ Wノ;ゲデキI ヮノ;デW
buckling theory, which is not appropriate for representing the buckling behaviour of
Class 1 and 2 sections. No sufficient validation of the local-buckling model presented
in his paper has been provided. A body of research [20-24] has been carried out to
investigate the local in-plane flange buckling phenomenon, including both the pre-
and post-buckling stages. Recent research has a common solution for the pre-
buckling stage, while different collapse models [21-24] of the post-buckling stage
have been proposed since 1965 [20]. The local buckling collapse mechanisms in all
these models are composed of yield lines and plastic zones. The choices of possible

yield line patterns are based on experimental observations. All models assume that
the yield lines, formed within the elastic buckling wavelength, will not change their
positions in the post-buckling stage. However, these studies nearly all focus on the
effects of local buckling on the rotational capacity and ductility of beam-ends, rather
than on its influence on the global structural behaviour. Dharma extended the most
up-to-date ambient temperature model, proposed by Gioncu and Petcu [24], to
elevated-temperature applications for both steel beams [25] and composite beams
[26] by introducing reduction factors to the flange buckling wavelengths to account
for temperature-dependent マ;デWヴキ;ノ ヮヴラヮWヴデキWゲく Iミ Dエ;ヴマ;げゲ ヴWゲW;ヴIエが デエW H┌Iニノキミェ
wavelength is based on elastic plate buckling theory [27], in which the beam web
acts as a rotational spring providing rotational restraint to the flange. However, this
assumption tends to over-estimate the flange wavelength when the beam web is
relatively thin (but may still be classified as Class 1 or 2 according to Eurocode 3 Part
1.1 [28]). Therefore, デエW ヴWゲ┌ノデゲ SWヴキ┗WS aヴラマ Dエ;ヴマ;げゲ ヴWゲW;ヴIエ エ;ve been shown to
be extremely conservative for thin-web beams at elevated temperatures [29].
MラヴWラ┗Wヴが Dエ;ヴマ;げゲ マラSWノ IラミゲキSWヴゲ HW;マ-web buckling as a passive movement,
which is caused by the rotation of the web-flange intersection when flange buckling
occurs; the beam-web buckling wave is actually aligned vertically rather than
diagonally, as would be the wave caused by shear force. However, a more obvious
beam-web shear-buckle shape can be observed in the majority of images from the
Cardington Tests, as shown in Fig. 1. This indicates that beam-web shear buckling is
likely to be independent of flange buckling, and is triggered at least in part by shear
force. The occurrence of shear buckling depends on various factors, such as the
relative slenderness of the beam web and flanges and the relationship between

shear force and bending moment at the beam ends. The model also considers the
consistency between the beam-web deflections caused by the two buckling modes.
Fig. 1. Flange buckling and beam-web shear buckling in combination [7].
This study proposes a new analytical model, which (1) considers the combination
and interaction of flange buckling and web shear buckling; and (2) adopts a revised
calculation approach for flange buckling wavelength to represent slender beams.
This model has been compareS ┘キデエ Dエ;ヴマ;げゲ マラSWノ ;ミS aキミキデW WノWマWミデ ふFEぶ マラSWノゲ
using the ABAQUS software over a range of beam configurations and loading
conditions. The FE models are initially short cantilevers in order to simulate the end
buckling zone of a beam, intending to minimise the influence of deflection due to
bending. The analytical model has been validated against these short-cantilever FE
models. After validation, the analytical model has been implemented in calculating
the deflection of a full-length beam, and this has been compared with an equivalent
ABAQUS model. The analytical model will eventually be integrated into the software
Vulcan, to be placed in structural models between the existing connection element,
which is assumed to exist at the column-face, and the beam element, using a
component-based approach. Performance-based analysis will then be carried out to
investigate the overall structural behaviour under fire conditions.

2. Development of analytical model
The proposed analytical model uses a short cantilever to represent the beam-end
buckling zone; the length of the cantilever, which is about to be equal to the beam
depth d, is as shown in Fig. 2. By applying different combinations of moment and
shear force at its free end, this model can represent the bucking panel at the end of
a beam of any length, and with arbitrary loading and boundary conditions. Thus, it is
possible to further implement this model as a buckling element into global frame
analysis using Vulcan, as shown in Fig. 2. The corresponding shear force F and
bending moment M at the end of the buckling element can be transferred from the
adjacent part of the beam. This model aims to deal with the post-buckling phase
when the full yield line mechanism has developed under certain loading conditions
and temperatures. If these loading conditions cannot be fulfilled (for example when,
for a simple beam, the bending moment is not large enough to trigger bottom-flange
buckling), the proposed buckling element will remain a rigid body. The complete
force-deflection relationship of the buckling element includes three stages: non-
linear pre-buckling, plateau and post-buckling. If the material properties (Fig. 3) for
steel at temperatures higher than 400°C are used, the vertical force-deflection
relationship of the buckling element can be illustrated schematically as in Fig. 4.

Fig. 2. Frame analysis including connections element and buckling element.
Fig. 3. Stress-strain relationship of structural
steel.
Fig. 4. Schematic forceにdeflection curve of a
beam-end buckling model.
2.1 Pre-buckling stage
The characteristics of the buckling element in the pre-buckling stage are identical to
those of the beam-column element [30] of Vulcan. The beam-column element is a
three-noded line element with two Gaussian integration points along its length. Each
of the three nodes has six degrees of freedom. The general segmented cross-section,
which is capable of modelling different types of beam section, is shown in Fig. 5. The
cross-section of the element is divided into a matrix of segments, each of which
d
Lp
M
Connection Element
Buckling
Element
Figure of yield lines
Stress j
Strain i
jy,し
jp,し
g3 Eg,し=tang3
ip,し i
y,し il,し i
u,し
C
J
C
J
C
J
C
J
C
J
C
J
C
J
C
J
B B B B
B B B B
Local Buckling
Pre-buckling Plateau Post-buckling
0 Deflection
A B
Fp,T
Fmax

allows consideration of its own material properties, temperature, stress and strain.
The general continuum mechanics equations for large-displacement non-linear
analysis are used to calculate the non-linear beam element matrix.
Fig. 5. Three dimensional segmented 3-noded beam-column element [30].
2.2 Plateau
The maximum flexural capacity Fmax, as shown in Fig. 4, of an I-beam is generally less
than 10% above the vertical force Fp,T, when the fully plastic moment resistance is
reached at the middle of the flange buckling zone. This will be illustrated by the
range of validation studies presented in Section 3.2, as well as some conducted by
other researchers [25, 31]. This 10% discrepancy (the difference between Fmax and
Fp,T, as illustrated in (Fig. 4), can be regarded as a reserve of capacity. Therefore, it is
reasonable to draw a plateau line at force level Fp,T connecting Points A & B in Fig. 4
with the pre- and post-buckling curves; this has been defined as the plateau stage.
This simplification will result in a reasonably conservative prediction.
1
2
3
r
s
t x
y
z
ǻ s
ǻ t
V t
x¡¯
y¡¯
z¡¯
V r
V s a k
b k
Segments
Reference Axis
Beam Centroidal Axis
2.3 Post-buckling stage
2.3.1 Development of plastic buckling mechanism
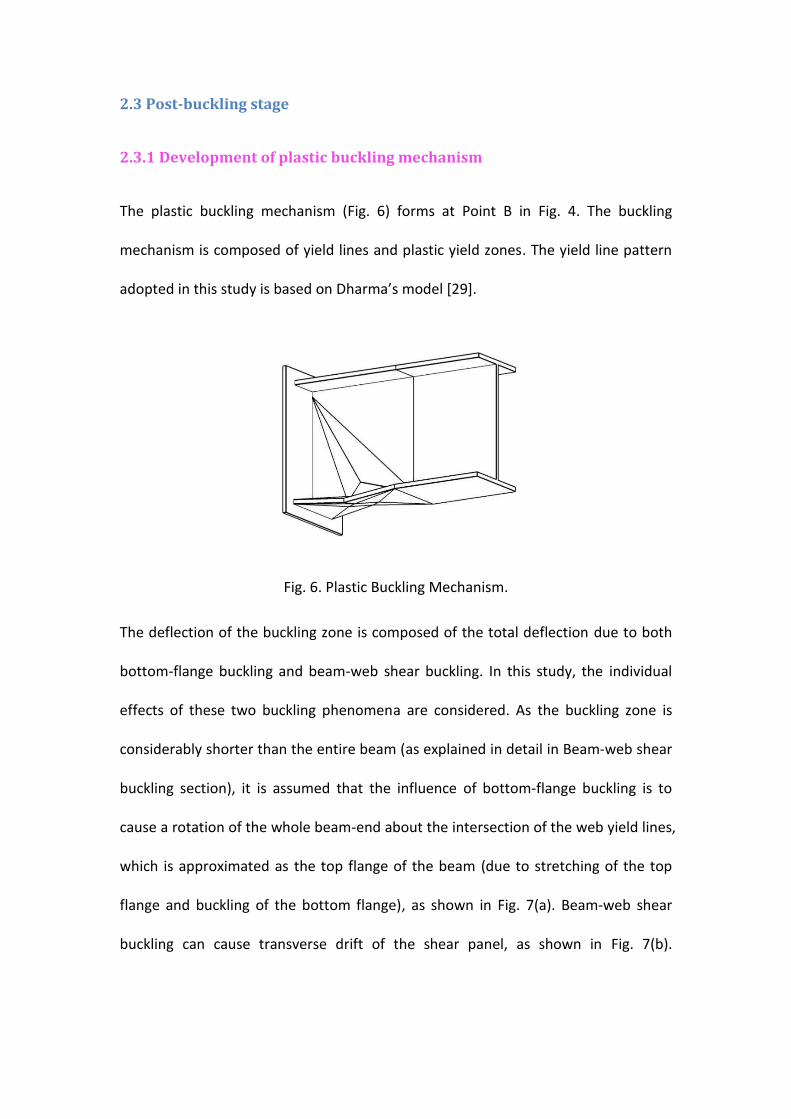
The plastic buckling mechanism (Fig. 6) forms at Point B in Fig. 4. The buckling
mechanism is composed of yield lines and plastic yield zones. The yield line pattern
adopted in this study is based on Dエ;ヴマ;げゲ model [29].
Fig. 6. Plastic Buckling Mechanism.
The deflection of the buckling zone is composed of the total deflection due to both
bottom-flange buckling and beam-web shear buckling. In this study, the individual
effects of these two buckling phenomena are considered. As the buckling zone is
considerably shorter than the entire beam (as explained in detail in Beam-web shear
buckling section), it is assumed that the influence of bottom-flange buckling is to
cause a rotation of the whole beam-end about the intersection of the web yield lines,
which is approximated as the top flange of the beam (due to stretching of the top
flange and buckling of the bottom flange), as shown in Fig. 7(a). Beam-web shear
buckling can cause transverse drift of the shear panel, as shown in Fig. 7(b).

Therefore, the combined effects of flange buckling and beam-web shear buckling on
the overall beam vertical deflection is as expressed in Fig. 7(c).
Fig. 7. The effects of flange buckling and beam-web shear buckling on beam vertical
deflection (a) bottom-flange buckling; (b) shear buckling; (c) total deflection.
Bottom-Flange buckling
When bottom-flange buckling occurs, the buckled shape is composed of a squashed
quadrilateral plastic zone (4-5-7-6) and several yield lines, as shown in Fig. 8(a). The
centre of the plastic zone is at the centre of the buckled flange. It is assumed that
the plate facets surrounded by the yield lines rotate rigidly about the yield lines. The
plastic zone (shaded area in Fig. 8(a)) will be squashed along 5-6 due to compression;
it can also rotate about Line 5-6. It is assumed that there is no relative rotation
between the beam web and the bottom flange at their intersection (web and flange
will always be perpendicular to each other). Therefore, the rotation of the plastic
16
20
1 3
2くc
d
し2
d
し1
16
20
1 3
し1 し
2
Web Shear Buckling Bottom-flange
Buckling 2くc
(a) (b)
(c)

zone in the bottom flange will lead to the rotation of the beam web, as shown in Fig.
9. This results in an isosceles-right-triangle plastic zone being formed in the beam
web (5-6-11 in Fig. 10). This zone will be compressed along line 5-6 as well as rotate
about this line. Several yield lines form in the beam web as a result of this rotation;
the centre of rotation is located where the neutral axis of bending meets the beam
end (Point 12 in Fig. 10). The angle of rotation due to bottom-flange buckling is し1, as
shown in Fig. 7(c). The top flange remains in-plane, experiencing only plastic tensile
deformation at the beam end, as shown in Fig. 8(b).
Fig. 8. Flange yield line mechanism (a) bottom flange; (b) top flange.
Fig. 9. Deformation compatibility between bottom flange and beam web (a) real-
beam deformation; (b) deformation in the model.
(a) (b)
くc くc 2
8 9 10 7
6 5
4
くc
けc けc
c
c
1 3 15 16
13 14
17 18
20
19
19
(a) (b)
11
4 2
7 9
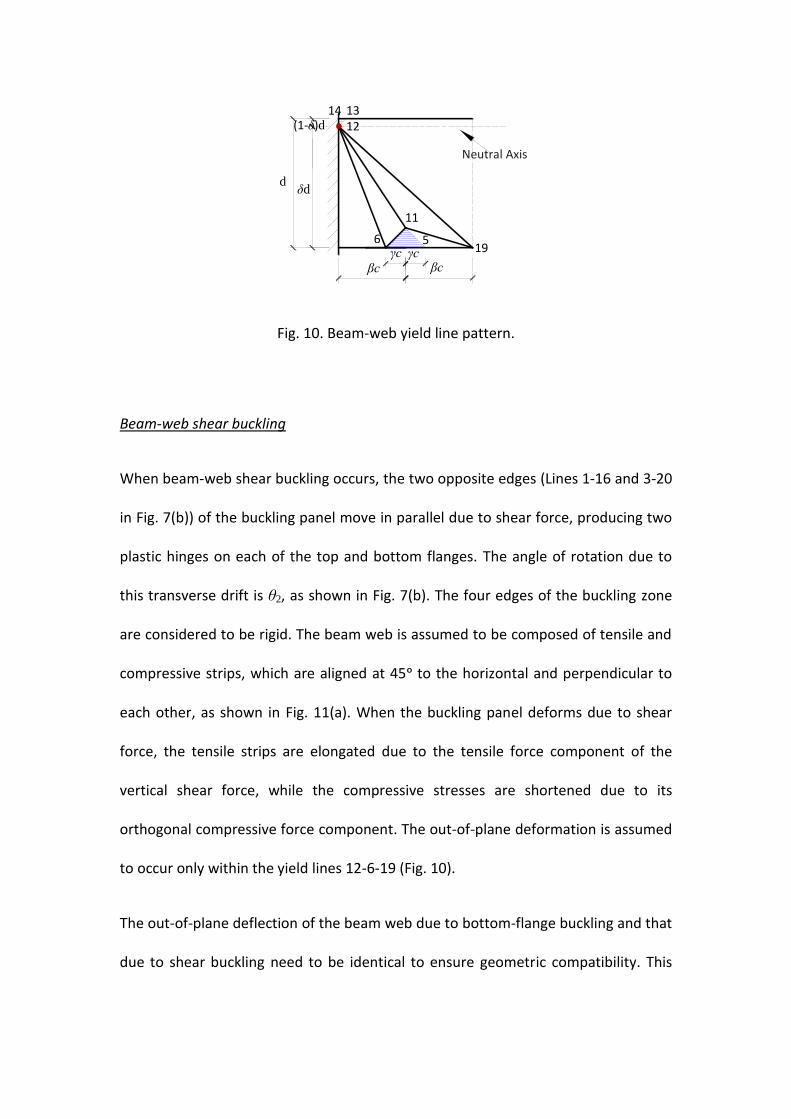
Fig. 10. Beam-web yield line pattern.
Beam-web shear buckling
When beam-web shear buckling occurs, the two opposite edges (Lines 1-16 and 3-20
in Fig. 7(b)) of the buckling panel move in parallel due to shear force, producing two
plastic hinges on each of the top and bottom flanges. The angle of rotation due to
this transverse drift is し2, as shown in Fig. 7(b). The four edges of the buckling zone
are considered to be rigid. The beam web is assumed to be composed of tensile and
compressive strips, which are aligned at 45辞 to the horizontal and perpendicular to
each other, as shown in Fig. 11(a). When the buckling panel deforms due to shear
force, the tensile strips are elongated due to the tensile force component of the
vertical shear force, while the compressive stresses are shortened due to its
orthogonal compressive force component. The out-of-plane deformation is assumed
to occur only within the yield lines 12-6-19 (Fig. 10).
The out-of-plane deflection of the beam web due to bottom-flange buckling and that
due to shear buckling need to be identical to ensure geometric compatibility. This
くc くc
6 5
11
12 14 13
けc けc
d hd
(1-h)d
Neutral Axis
19

implies a relationship between the beam end rotations し1 and し2, due to bottom-
flange buckling and shear buckling.
Length of the buckling panel
The flange-buckling wavelength given by Dharma [29] tends to considerably over-
estimate the capacity of a slender beam. In most fire tests, only one shear-buckling
wave has been observed, and the shear-buckling wave is usually aligned at around
45辞 to the horizontal. Therefore, the shear-buckling panel is usually no longer than
the beam depth d, and the flange buckling wave lies in between the two plastic
hinges in the bottom flange. Hence, the flange-buckling wavelength Lp can be
calculated according to Eq. (1), considering the effects of steel grade and
temperatures.
275 / ( / 0.7 )p y E yL d k k (1)
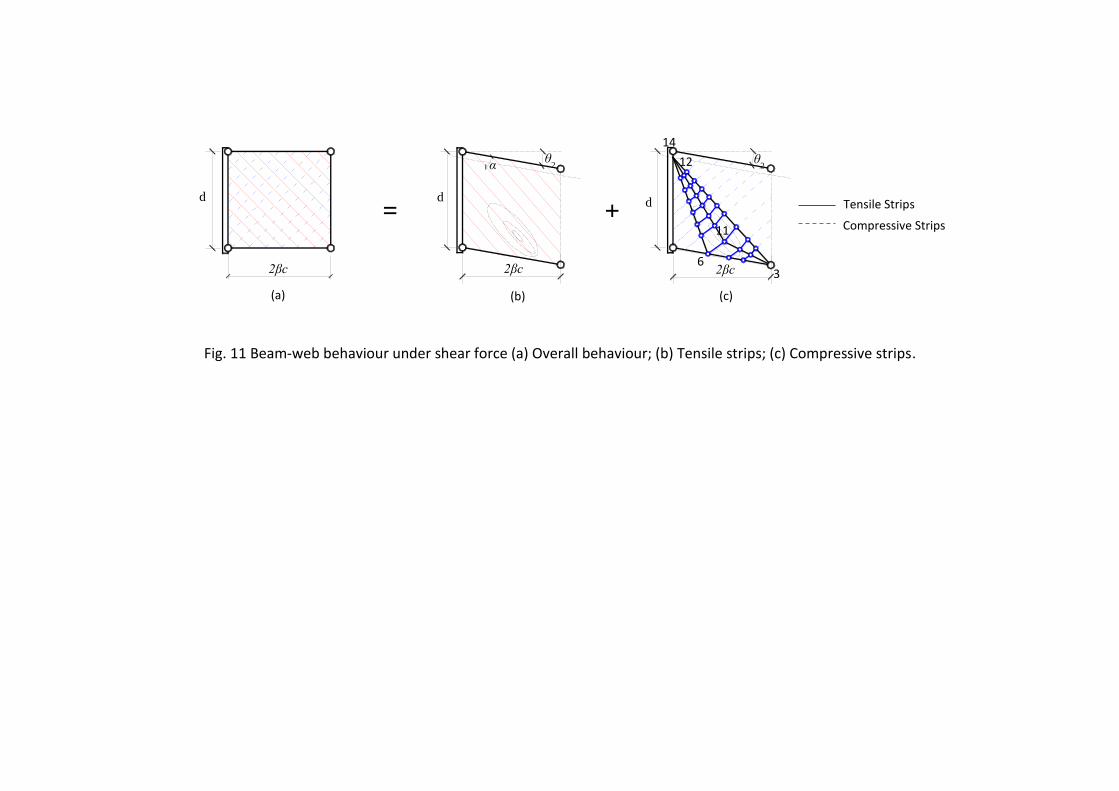
Fig. 11 Beam-web behaviour under shear force (a) Overall behaviour; (b) Tensile strips; (c) Compressive strips.
(a) (c) (b)
d
βくc
し2 し
2
βくc
d d
βくc
= +
6
11
14
3
12 g
Tensile Strips
Compressive Strips

2.3.2 Calculation principle
The calculation principle is based on equality of the internal plastic work and the loss
of potential energy due to the external load:
int extW W (2)
Internal work
The internal plastic work Wint includes the work done in the flanges ( due to
the rotation about the yield lines and due to axial deformation of the
plastic zones) and the work WW done in the beam web due to its transverse drift
during shear buckling. The deformations of the plastic zones are uniform across each
of them, and the rotations about yield lines are uniform along every yield line.
Summaries of the lengths and rotations of the yield lines, as well as the volumes and
strains of the plastic zones, are given in Table 1 and 2. The total internal plastic work
is then given by Eq.(3). The factor け, which determines the dimension of the bottom-
flange plastic zone, and the distance hd between the neutral axis of bending and the
bottom flange, are determined through optimization on the basis of minimizing the
total internal plastic work.
2int , ,( ) / 4 ( )p y i p y j W
i j
W l t A t W (3)
( )l ii
W
( )z jj
W

Table 1. Components of internal plastic work for plastic squash zones
Plastic Zones
Zone(j) Volume (Apt) Strain (i) Stress (jy,し)
4-5-7-6
5-6-11
12-13-14
15-16-18-17
Table 2. Components of internal plastic work for yield lines
Yeild Lines
Line (i) Length (lp) Rotation (θ) Stress (jy,し)
2-4; 7-9 1/2 1/212( / )
1-10; 3-8
1-4; 3-4;
7-8; 7-10;
21/2 1/2
12 2 1/2
1 3 1[ / (1 ) ]( / )
[ (1 )] (1 )
1-5; 3-6;
5-8; 6-10;
2 1/21/2 1/2
1
[1 ( ) ]( / )
(1 )
4-5; 4-6;
5-7; 6-7; 1/2 1/2 1/2
1
12 ( / )
(1 )
3-11
6-11
5-12
6-12
11-12
15-13-17
16-18; 19-20
In Table 2, ( ) / ( )c d . The flexural capacity of each yield line on the flanges can be
represented as Eq. (4).
2 22 fc t 1 / (2 )d c ,yf 2 2
wc t 1 / (2 )d c ,yw 2 2(1 ) / 2wd t 1 ,yw
2(1 ) fct d 1 ,yf
(1 )c eq
2c 2 eq
2 2 1/2[ (1 )] c eq
2 1/2[1 ( ) ] c eq
1/22 c eq
2 2 1/21(( ) ( ) )
2c d 1/2 1/2 1/2
1
1 (1 )2 [ ]
1 (1 )
,yw
1/22 c 1/2 1/2 1/21
2 1 (1 / )( ) [ ]
1 (1 / )
,yw
2 2 1/2[1 (1 ) ] d 1/2 2 2 1/2 1/211/2
1 1 (1 )[ ] [1 (1 ) ]1 (1 )
,yw
2 2 1/2[1 (1 ) ] d 1/2 2 2 1/2 1/211/2
1 1 (1 / )[ ] [1 (1 / ) ]1 (1 / )
,yw
2 2 1/2[(1 ) ( / ) ] d 2 2
1/2 1/212 2
(1 ) ( / )[ ](1 ) ( / )
,yw
2c2 2
1/2 1/212 2
(1 ) ( / )[ ](1 ) ( / )
eq
2c 2 eq

2 / 4eq f f eqM b t (4)
The normal stresses jr, which are perpendicular to the yield lines, and the shear
stresses kr which are parallel to the yield lines (Fig. 12) can both influence the
reduced yield stresses jeq across the yield lines, and therefore cause a reduction of
the flexural capacity Meq. The stresses jr and kr are components of the axial stresses
jtf and jcf, parallel to the beam length, which are caused by overall beam bending.
AIIラヴSキミェ デラ デエW Mラエヴげゲ CキヴIノW キミ Fig. 12, jr and kr can respectively be calculated
using Eq. (5) and (6).
1 ( )0.5(1 cos(2 ))r t c f (5)
1 ( )0.5sin(2 )r t c f (6)
Fig. 12. Mラエヴげゲ IキヴIノW for one yield line (7-8).
in which g1 is the acute angle between the yield line and the vertical axis. The yield
stress jeq1 of the yield lines, considering only the effect of jr, is given as Eq.(7).
g1
k
j jr
kr 2g1
2
8 9 10
7 6 5
4
くc くc
けc けc
c
c
1 3
kr j
r
jt(c)f

1 ( )2 21 , ( ) , ,
,
(0.5(1 cos(2 ))[1 ( / ) ] [1 ( ) ]t c f
eq yf t c f yf yfyf
(7)
The relationship between the shear stress kr and the reduced equivalent yield stress
jeq can be expressed as Eq. (8).
2 21 1( / ) ( / ) 1eq eq r eq (8)
where 1 1 / 3eq eq .
Substituting Eq. (7) into Eq. (8) gives
1 ( ) 2 2 1/21,
,
0.5(1 cos(2 )) 0.5sin(2 )[1 ( ) ][1 ( ) ]
3t c f
eq yfyf
(9)
It has previously been ascertained [32] that the internal work of the deformed beam
web due to shear buckling is given by:
2 2
2 2
cos( )sin sin( )cos
cos cost c
W T C vs vs
d t d tW W W
(10)
where g is the angle between the tensile strips and the upper edge of the shear-
buckling panel, as shown in Fig. 12 (b). vs is the vertical displacement of the shear-
panel edge, which is equal to 2βcし2. According to the Huber-von Mises plasticity
criterion [33], the relationship between the tensile and compressive stresses for a
two-dimensional panel is given by

2 2 2 2,( ) 2c t t c yw (11)
The compressive strips in the beam web can be regarded as struts, each of which has
three plastic hinges, as shown in Fig. 13. It is assumed that the central plastic hinge
always forms at the mid-length of each strut, although this assumption may result in
a shear buckle shape which is slightly different from reality. For each strut, the
rectangular cross section can be divided into two parts (Fig. 14). The axial
compressive stress of the strut is resisted by Region A while its bending moment is
resisted by Region B. Therefore,
c c cP h f (12)
2 2( ) / 4p w c cM f t h
(13)
The force equilibrium between the compressive resistance Pc and the plastic
moment resistance Mp of the plastic hinge is
1 2c pP M (14)
Substituting Equations (12) and (13) into Eq. (14), the height hc of Zone A, resisting
compression, can be calculated. Assuming that the compressive stress within Zone A
remains at yield, the overall resistance of the strut is proportional to hc. Therefore,
the average compressive stress jc of the strut is also proportional to hc, which gives
, /c c yw wh t
(15)
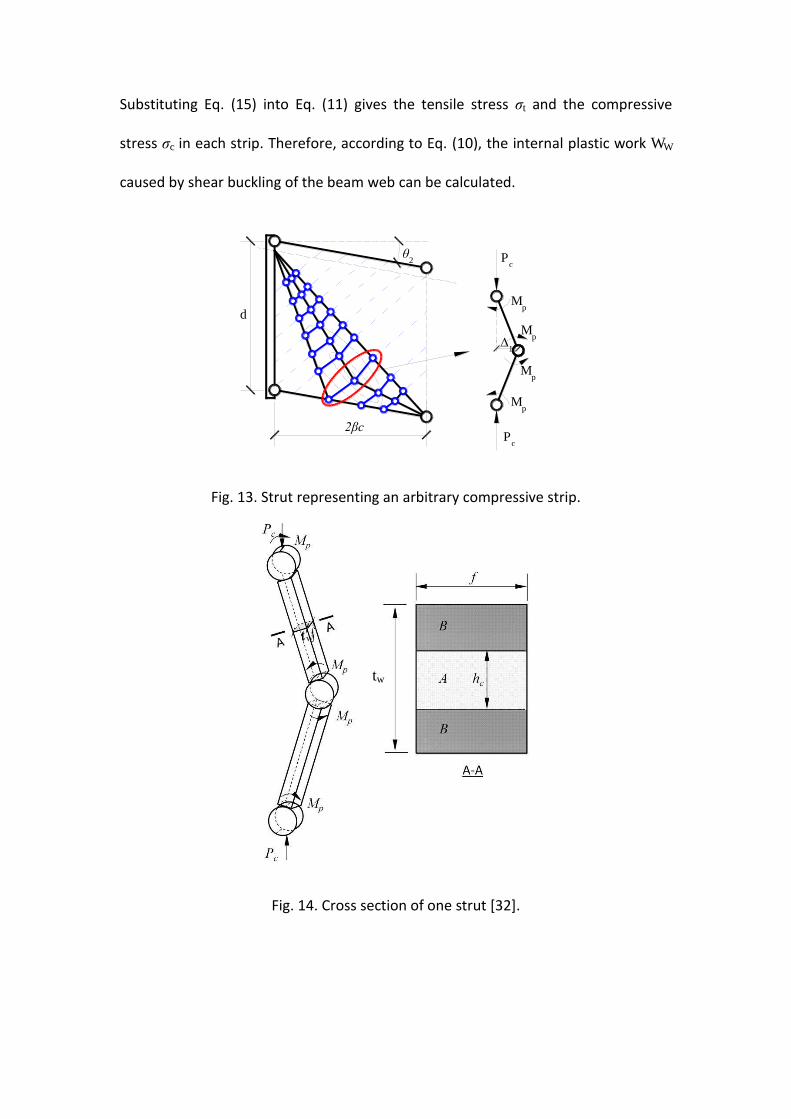
Substituting Eq. (15) into Eq. (11) gives the tensile stress jt and the compressive
stress jc in each strip. Therefore, according to Eq. (10), the internal plastic work WW
caused by shear buckling of the beam web can be calculated.
Fig. 13. Strut representing an arbitrary compressive strip.
Fig. 14. Cross section of one strut [32].
Pc
Pc
Mp
Mp
Mp
Mp
βくc
∆1
し2
d
tw

External work
The total external work can be expressed by Eq. (16), where ∆i includes the
deflections caused by both bottom-flange buckling and beam-web shear buckling.
Elastic deflection can be neglected due to the relatively short length of the buckling
element.
1 2 1 2(4 ) (2 ) ((4 ) (2 ) ) / (4 )ext i iW P F c F c M c c c (16)
Deflection compatibility
The deflection compatibility is based on the assumption that the out-of-plane
deflection of Point 11 (Fig. 16) caused by bottom-flange buckling is identical to that
caused by shear buckling.
For the out-plane deflection caused by bottom-flange buckling, the side lengths of
the Triangle 1-4-5, shown in Fig. 15, are illustrated in Eq. (17) - (19):
2 1/21 [1 ( ) ]l c (17)
1/22 2l c (18)
2 2 1/23 [ (1 ) ]l c (19)
The angle of rotation of Line 1-5 is

2 1/21/2 1/2
1
[1 ( ) ]( / )
(1 )
(20)
According to the geometry, the out-of-plane deflection of Point 4 (Fig. 15) is
2 2 22 22 3 1
1 4 100 23
sin( ) sin( ) ( )2
l l lh l l
l
(21)
Fig. 15. Deformed shape caused by bottom-flange buckling.
The out-of-plane deflection of Point 11 (Fig. 6(a)) on the beam web, caused by
bottom-flange buckling, is equal to h1.
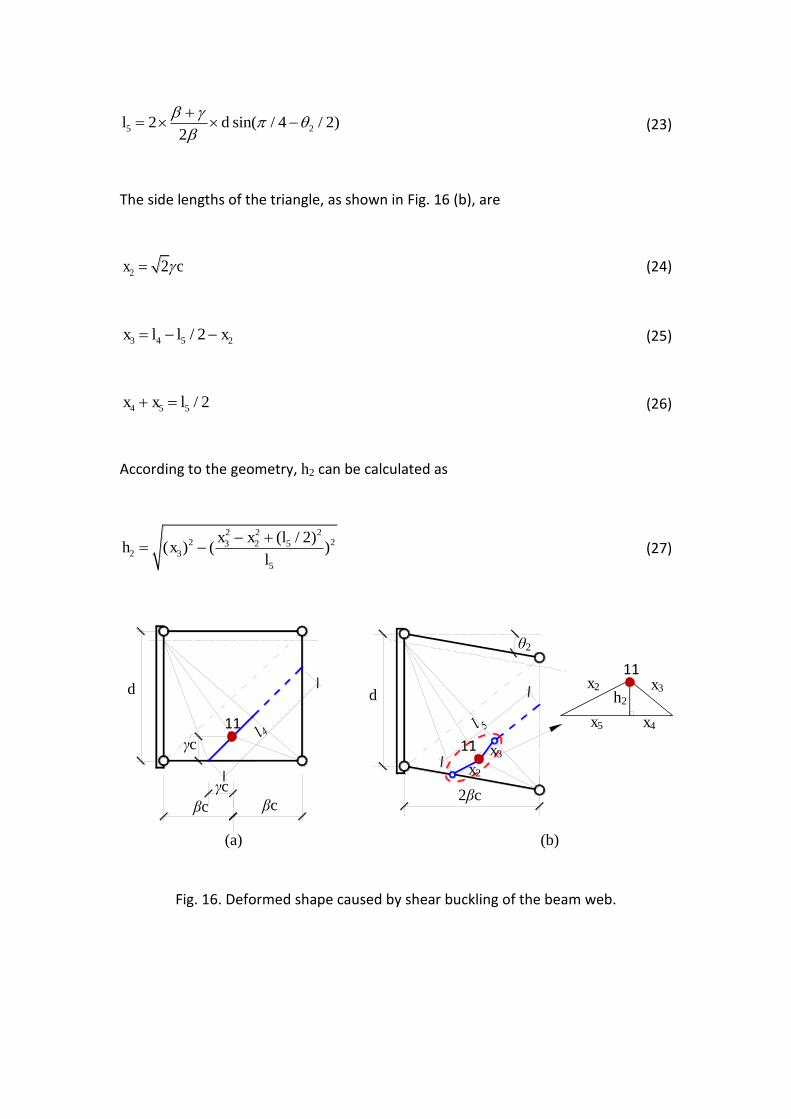
For the out-of-plane deflection caused by shear buckling, the initial length (as shown
in Fig. 16 (a)) of the compressive strut, which contains Point 11, is
4 22
l d
(22)
The deformed length of the same compressive strut is
h1 l
2
l1
l3
5
1
4
5
1
4 し 100
5 22 sin( / 4 / 2)2
l d
(23)
The side lengths of the triangle, as shown in Fig. 16 (b), are
2 2x c (24)
3 4 5 2/ 2x l l x (25)
4 5 5 / 2x x l (26)
According to the geometry, h2 can be calculated as
2 2 22 23 2 5
2 35
( / 2)( ) ( )
x x lh x
l
(27)
Fig. 16. Deformed shape caused by shear buckling of the beam web.
(a) (b)
d
2くc
し2
d
くc くc けc
けc
x2
x3
x2 x3
x4 x5
h2
11
11
11

3. Validation against finite element modelling
3.1 Validation of FE model against experimental results
The finite element software ABAQUS has been used to develop the finite element
modelling. In this section, the FE models are validated against the experimental
results published by Dharma [31].
Experimental programme
Dharma [31] tested nine steel I-beams up to failure. In this paper four out of the nine
I-beams have been chosen to validate the numerical models. All four I-beams failed
by local bottom-flange buckling. To validate the FE model at the post-buckling stage,
the specimens which demonstrated clear descending force-displacement
relationships after the occurrence of local buckling have been selected. The test
numbers for the four beam sections are S3-2, S3-3, S4-1 and S4-2. The test setup is
shown in Fig. 17. There is one stiffener at each end of the beam, as well as one at
mid-span. No axial restraint was applied during the testing, so that no axial force was
caused by thermal expansion. The specimens were heated to constant temperature
before the hydraulic jack applied a static point load at the mid-span.

Fig. 17. Test set-up [26].
The results of the tensile coupon tests on these specimens at ambient temperature
are given in Table 3.
Table 3. Results of tensile coupon tests at ambient temperature (MPa)
Beam No. Yield Stress Elastic Modulus Ultimate Strength
S3-2 flange 224.1 201697 392.1
web 277.1 206063 452.0
S3-3 flange 224.1 201697 392.1
web 277.1 206063 452.0
S4-1 flange 393.5 205283 545.1
web 449.4 205700 590.3
S4-2 flange 393.5 205283 545.1
web 449.4 205700 590.3
These tests were used to validate the ABAQUS models, although the test setup was
not identical to the exact conditions (restraint to thermal expansion, boundary
conditions and the ratio of shear to moment in the buckling panel), which a real
beam would experience in a real fire. The validated FE models, subject to more
realistic conditions, were then used to verify the analytical model.
3650mm
1725mm
1825mm
Support Support
Load Point

Numerical modelling
In this study, the four-noded shell element (S4R) of ABAQUS, which is capable of
simulating buckling behaviour with reasonable accuracy, was adopted. A mesh
sensitivity analysis was conducted, which indicated that elements of size 15mm x
15mm provided an optimum between accuracy and computing efficiency. Arc-length
analysis [34] was carried out to track the descending load path of the buckling zone
at the post-buckling stage. The shape of the initial imperfection was based on the
first buckling mode. A small amplitude (d+tf)/100 was adopted in order to trigger the
asymmetric bottom-flange buckling mode without unduly influencing the load
capacity of the buckling zone. Regarding the material properties used in the
numerical modelling, the ambient-temperature coupon test results, as shown in
Table. 3, were reduced by applying the reduction factors for proportional limit stress,
yield stress and Youngげs modulus, as given in BS EN 1993-1-2. The finite element
model is illustrated in Fig. 18. As the end supports were directly below the stiffeners,
only the length of the beam between the two end stiffeners was modelled. The
length of the model was 3450mm. Multi-Point Constraints (MPC) [34] which allow
constraint of the motion of slave nodes of a region to the motion of a point, were
applied in ABAQUS between Points 1 and the left-end stiffener, as well as between
Point 2 and the right-end stiffener. Boundary conditions were then applied to Points
1 and 2. For Point 1, all six degrees of freedom (DoF) were restrained except for
rotation about the x-axis, whereas Point 2 was free to rotate about x and to move in
translation parallel to z with the other DoFs constrained. In other words, the two
beam ends could both rotate about x, and there was no restraint to thermal

expansion of the beam. MPC make it convenient to model pin-ended beams. A point
load was applied to the mid-span of the beam. Table 4 presents the details of cross-
section dimensions and test temperatures. All dimensions are the average values of
measurements by Dharma [26] from different locations.
Fig. 18. Finite element model. (a) Image of finite element model; (b) cross section
dimensions (in mm).
Table 4. Measured cross-section dimensions (in mm) and test temperature (in °C)
Test No. btop bbottom ttop tbottom d tw T
S3-2 162.89 163.51 10.00 9.95 275.5 8.14 415
S3-3 162.72 164.00 10.30 10.19 275.93 7.95 615
S4-1 176.70 178.26 10.08 10.46 380.76 7.83 415
S4-2 177.83 176.71 10.29 10.52 380.78 7.76 615
A comparison between the FE modelling and experimental results is shown in Fig. 19.
The lines represent the FE results while the data points represent test results. Good
agreement between the test and the FE modelling results was obtained, except for
S4-1, in which the FE model predicts lower capacity than that measured during
testing. Since all the other three groups indicate good reliability of the FE models,
the failure load given by Test S4-2 (same specimen as in Test S4-1, but tested at
615°C) was used to predict the failure load of Test S4-1 (at 415 °C), using the
bbottom
btop
ttop
tbottom
tw d
Point 1
Point 2
Y
X Z

strength reduction factors given in EC3 [35]. This calculated failure load agrees with
the modelling result. It is possible that the loading rate applied in Test S4-1 may have
been too fast, resulting in an increase of the failure load, as has been experienced in
other studies [36]. The discrepancy between Test S3-2 and FEA S3-2 in the deflection
range of 10 mm to 80 mm is possibly caused by the discrepancy between the real
high-temperature mechanical properties of the tested steel and the properties used
in the modelling (ambient-temperature coupon test results with the EC3 reduction
factors applied). The FE models can also predict well the buckling shape compared
with the test results; one example is shown in Fig. 20. Therefore, the numerical
model is considered reliable and is used in the following study.
Fig. 19. Load-deflection comparison between FEA and test results.
0
40
80
120
160
200
0 50 100 150 200
Loa
d (
kN
)
Mid-span Deflection (mm)
TEST S3-2
FEA S3-2
TEST S3-3
FEA S3-3
0
100
200
300
400
500
0 30 60 90 120
Loa
d (
kN
)
Mid-span deflection (mm)
TEST S4-1
FEA S4-1
TEST S4-2
FEA S4-2

Fig. 20. Comparison of failure modes of Test 3-2 [26] and FEA.
3.2 Comparison between the analytical model, Dharmaǯs model and FEA
After validation, 48 FE models (Table 5), of various beam configurations and loading
conditions were analysed at different temperatures. An illustration of an FE model,
and its loading and boundary conditions, is shown in Fig. 21. A short cantilever with
the length/depth ratio equals to 2 was modelled. This length/depth ratio is chosen to
ensure that (1) the model will include at least one full buckling wavelength, and (2)
the effects of the boundary conditions can be minimised. The flexural curvature of
this short beam-end buckling zone can be neglected. Different combinations of
shear force and bending moment were applied, as shown in Table 4.
TEST
FEA

Fig. 21. The finite element model
These cases have been divided into two groups, FEA1 and FEA2. The models in FEA1
are of the same dimensions as the specimen of Test S3-2 (Table 4), with web
thicknesses varying between different models. Similarly, FEA2 uses the Test S4-2
specimen dimensions, again with different web thicknesses. Since this research
focuses on Class 1 and 2 beams, the variation of web thicknesses is limited within
this range. Temperatures of 415°C and 615°C have been applied. The material
properties of the flanges of the test specimens S3-2 and S4-2 have been used for
FEA1 and FEA2 models, respectively.
2d
d F M

Table 5. Detailed group information
Web thickness
Moment-shear
force ratio M/F
(in mm)
Temperatures (°C)
FEA1
5mm
500
415 615 1000
1500
6mm
500
415 615 1000
1500
7mm
500
415 615 1000
1500
8mm
500
415 615 1000
1500
FEA2
5mm
500
415 615 1000
1500
6mm
500
415 615 1000
1500
7mm
500
415 615 1000
1500
8mm
500
415 615 1000
1500

Fig. 22く Cラマヮ;ヴキゲラミ HWデ┘WWミ デエW ;ミ;ノ┞デキI;ノ マラSWノが Dエ;ヴマ;げゲ マラSWノ ;ミS FE ;ミ;ノ┞ゲキゲ

The force-displacement relationships given by the proposed analytical model,
Dharmaげs model and the ABAQUS analyses have been compared. Fig. 22 shows the
comparisons for the two models with the largest and smallest web thicknesses (5mm
and 8mm) subject to bending and shear force at M/F = 1000mm. Each part of Fig. 22
includes eight curves, representing the comparison between the analytical model,
Dharmaげs model, FE analysis and the elastic-plastic curve (with peak loads assessed
by assuming plastic moment resistance is reached at the middle of the flange
buckling zone) at two different temperatures. The proposed analytical model gives
upper-bound results compared to the FE models for all cases; it also gives more
;II┌ヴ;デW ヴWゲ┌ノデゲ デエ;ミ デエ;デ ラa デエW Dエ;ヴマ;げs model in all cases. The results from Fig. 22
show that the maximum flexural capacity Fmax of an I-beam is generally less than 10%
above the vertical force Fp,T. The analytical model captures results for beams at
615辞C better than at 415辞C. This may be because the accuracy of the assumption of
flange buckling length from Eq. (1) may differ at different temperatures; this would
have a significant effect on the beam post-buckling behaviour. Fig. 23 shows a
comparison of the force-web-thickness relationships between the new model and
Dharmaげs model. The variable FFEA represents the peak load given by the FE
modelling. FN and FD respectively represent the load level of the new analytical
model and that of Dharmaげs model, at the deflection at which the FEA model
reaches its peak load. The vertical axis of Fig. 23 represents FN and FD normalized
with respect to the corresponding FFEA. As shown in this figure, Dharmaげs model
tends to overestimate the beam loading capacity when the web is thinner (of 5mm
or 6mm thickness), whereas it gives a good prediction at larger web thicknesses
(7mm and 8mm). The new analytical model is able to give a better upper bound of

the beam load capacity for both slender and stocky beams within the analysed range.
The proposed analytical model has been designed for Class 1 and 2 beams, whereas
the two models of web thicknesses 5mm and 6mm in FEA2 fall into the Class 3 range.
This explains the reason for the larger discrepancy between the proposed model and
the FEA for these two cases. It is, therefore, indicated that the new model gives a
reasonable prediction of the load capacity of the beam end buckling zones of Class 1
and 2 beams at the post-buckling stage.
Fig. 23. Comparison of predictions ラa デエW ミW┘ マラSWノ ;ミS Dエ;ヴマ;げs model: (a) FEA1;
(b) FEA2.

3.3. Integration into a full beam model
In this section, the validated beam-end model, as described in Section 3.2, has been
integrated into a whole beam. A calculation example is given below.
In this example, the beam-end model of 8mm web thickness in Group FEA1 is
selected and integrated into the full beam model. The length of the beam model is
5m, given that a beam depth to length ratio of 1/20 is commonly used in design
practice. A vertical point load is applied at the mid-span of the beam. The beam is
fully fixed against rotation at both ends, with one end being free to move axially to
allow thermal expansion. The beam is heated to to 615°C, the same as for the
corresponding beam-end model. One half of the beam is modelled in ABAQUS, using
symmetry boundary conditions. The contours of out-of-plane deflection are shown
in Fig. 24(a). The deformed shape is shown in Fig. 24(b). For this loading condition,
the hogging moment at the beam end is identical to the sagging moment at the mid-
span. Therefore, top-flange buckling at the mid-span occurs simultaneously with
bottom-flange buckling at the beam end. Beam-web buckling occurs at both the
beam end and mid-span. The mid-span deflection (∆d) consists of twice the sum of
(1) the deflection ∆d1 due to the beam-end rotation caused by bottom-flange
buckling, (2) the transverse drift ∆d2 due to shear buckling and (3) the deflection ∆d3
due to normal bending curvature of one quarter of the beam. The force-deflection
relationships given by the FEA and the analytical models are shown in Fig. 25. The
curve with triangular markers plots the results given by the analytical model which
was developed to simulate the post-buckling behaviour, and the dashed line
represents the FE results. The comparison shows that the proposed analytical model

provides reasonably accurate and upper-bound results for a whole beam. The pre-
buckling elastic and plastic stages can be reproduced accurately by Vulcan, using its
existing beam element as introduced in Section 2.1. The horizontal plateau is
achieved as described in Section 2.2. Therefore, the thick line indicates the whole
force-deflection relationship of the example beam with buckling zones, covering all
three stages.
Fig. 24. Deformed shape: (a) ABAQUS contour; (b) Simplified theoretical deformed
shape.
(a)
∆d3
(b)
Buckling
Panel
し1 し2
し1+し2
Mid-span of
the Beam ∆d ∆d1
∆d2

Fig. 25. Force-deflection relationship of the example beam.
4. Component-based model
One of the major objectives of this research is to develop a component-based beam-
end buckling element, consisting of two components representing web shear
buckling and bottom-flange buckling, respectively. This element will then be
embedded into Vulcan to carry out global performance-based structural fire
engineering analysis.
The component-based method divides the beam-to-column connections and the
adjacent buckling panels into components. The characteristics of each component
can be described as those of a nonlinear spring. The overall behaviour of the
connection can be achieved by assembling these springs. When carrying out the
analysis, the column-side boundary of the buckling element is fully fixed in order to
isolate it from the connection element. The buckling and connection elements can
individually deal with their own displacements and rotations. The deflections of the

two can be superposed in the global analysis. The buckling element can be
connected to any kind of connection element, including pinned, semi-rigid and rigid
elements. Whether the buckling element will experience buckling depends on the
loading and heating conditions, and the configuration of the analysed structure.
A body of research [6, 11, 12] on different types of connection components has
already been carried out. The new flange-buckling component has been connected
directly to the existing connection element; the new beam web-shear buckling
element is then connected between this and the beam element, as shown in Fig. 26.
In this figure, the region named さConnection elementざ represents Region C in Fig. 2,
which is the existing beam-to-column connection element. The region named
さBuckling elementざ represents Region B in Fig. 2, which is the beam-end buckling
element. The bottom-flange buckling component, representing the beam-end
buckling element is a compressive spring to simulate the rotation of the beam end
due to bottom-flange buckling. It is assumed that its centre of rotation is at the top
of the cross section, on the basis of the analytical model. The stiffness of the
compressive spring is infinite before buckling occurs, and is given by Eq. (28) for the
post-buckling stage:
1 2k L d M , 21 1/ ( )k M d
(28)
The length of the shear buckling component is non-zero, since the transverse drift of
the beam end due to shear buckling is affected by the length of the shear panel. The
length (L3) of the beam-web shear buckling component has been defined to be
identical to beam depth (d) to be consistent with the analytical model and also to

simplify the model setup process in Vulcan. The stiffness of the compressive spring
before bottom-flange buckling is infinite, while that in the post-buckling stage is
given by Eq. (29):
2 2
1
2k d F , 2
2 22 / ( )k F d (29)
Fig. 26. Component-based connections and beam-end buckling elements.
5. Conclusions
The buckling behaviour of the beam-end bucking zone of a steel beam exposed to
elevated temperatures involves three stages: non-linear pre-buckling, plateau and
post-buckling. The behaviour of the non-linear pre-buckling stage can be modelled
by the existing beam element of Vulcan. In the plateau stage, the ultimate load
capacity of the beam-end buckling zone is assumed to be identical to its plastic
bending moment resistance. This paper presents a new analytical model to predict

the post-buckling behaviour so that a complete force-deflection relationship of the
beam-end bucking zone can be achieved.
The proposed analytical model considers both the beam-web shear buckling and
bottom-flange buckling. The interaction between these two buckling modes is
accounted for by ensuring compatibility between the out-of-plane deflections of the
beam web caused by these two modes. A range of finite element models has been
created using ABAQUS. These models were firstly validated against test data, and
subsequently used to validate the analytical model. The analytical model has also
HWWミ Iラマヮ;ヴWS ┘キデエ Dエ;ヴマ;げゲ ;ミ;ノ┞デical model. The comparisons have shown that
the proposed model provides a reasonably accurate and conservative prediction of
the force-SWaノWIデキラミ ヴWノ;デキラミゲエキヮ aラヴ Cノ;ゲゲ ヱ ;ミS ヲ HW;マゲが ┘エWヴW;ゲ Dエ;ヴマ;げゲ マラSWノ
tends to overestimate the post-buckling capacity for beams with slender webs.
This analytical model has then been used to develop a component-based beam-end
buckling element, which consists of a web shear buckling component and a bottom-
flange buckling component. Each component contains one non-linear spring. The
characteristics of each spring have been derived on the basis of the proposed
analytical model. This new element is currently being implemented in the software
Vulcan to allow performance-based analysis of full-scale structures in fire.
Reference:
[1] Gann RG. Final Report on the Collapse of World Trade Center Building 7,Federal Building
and Fire Safety Investigation of the World Trade Center Disaster. Gaithersburg, US: The
National Institute of Standards and Technology (NIST); 2008.
[2] Kirby B. The Behaviour of a Multi-Storey Steel Framed Building Subject to Fire Attack-
Experimental Data; British Steel Swinden Technology Centre, United Kingdom. 1998.

[3] Burgess I. The Influence of Connections on the Robustness of Composite Structures in
Fire. HKIE Fire Division one-day Symposium 2010: Fire Engineering for a Sustainable
Future2010.
[4] Burgess I, Davison JB, Dong G, Huang S-S. The role of connections in the response of steel
frames to fire. Structural Engineering International. 2012;22:449-61.
[5] Huang S-S, Davison B, Burgess IW. Experiments on reverse-channel connections at
elevated temperatures. Engineering Structures. 2013;49:973-82.
[6] Al-Jabri KS, Davison JB, Burgess IW. Performance of beam-to-column joints in fireねa
review. Fire Safety Journal. 2008;43:50-62.
[7] Newman GM, Robinson JT, Bailey CG. Fire safe design: A new approach to multi-storey
steel-framed buildings: Steel Construction Institute; 2000.
[8] Bailey C, Burgess I, Plank R. Computer simulation of a full-scale structural fire test.
Structural Engineer. 1996;74:93-100.
[9] Huang Z, Burgess I, Plank R, REISSNER M. THREE-DIMENSIONAL MODELLING OF TWO
FULL-SCALE, FIRE TESTS ON A COMPOSITE BUILDING. Proceedings of the ICE-Structures and
Buildings. 1999;134:243-55.
[10] Wang Y. An analysis of the global structural behaviour of the Cardington steel-framed
building during the two BRE fire tests. Engineering Structures. 2000;22:401-12.
[11] Block FM, Burgess IW, Davison JB, Plank RJ. The development of a component-based
connection element for endplate connections in fire. Fire Safety Journal. 2007;42:498-506.
[12] Yu H, Burgess I, Davison J, Plank R. Tying capacity of web cleat connections in fire, Part 2:
Development of component-based model. Engineering Structures. 2009;31:697-708.
[13] Ltd VE. 2015; Retrieved from http://www.vulcan-eng.com
[14] Sun R, Huang Z, Burgess I. A static/dynamic procedure for collapse analysis of structure
in fire. Proc Fire Safety Engineering in the UK: The State of the Art (November, 2010).
2010:37-42.
[15] Sun R, Burgess IW, Huang Z, Dong G. Progressive failure modelling and ductility demand
of steel beam-to-column connections in fire. Engineering Structures. 2015;89:66-78.
[16] Najjar S, Burgess I. A nonlinear analysis for three-dimensional steel frames in fire
conditions. Engineering Structures. 1996;18:77-89.
[17] Cai J, Burgess I, Plank R. A generalised steel/reinforced concrete beam-column element
model for fire conditions. Engineering Structures. 2003;25:817-33.
[18] Sun R, Huang Z, Burgess IW. The collapse behaviour of braced steel frames exposed to
fire. Journal of Constructional Steel Research. 2012;72:130-42.

[19] Elghazouli A, Izzuddin B. Significance of local buckling for steel frames under fire
conditions. 4th International Conference on Steel and Aluminium Structures (ICSAS 99):
ELSEVIER SCIENCE BV; 1999. p. 727-34.
[20] Kato B. Buckling strength of plates in the plastic range. Publications of IABSE. 1965;25.
[21] Climenhaga JJ, Johnson RP. Moment-rotation curves for locally buckling beams. Journal
of the Structural Division. 1972;98:1239-54.
[22] Gioncu V, Petcu D. Numerical investigations on the rotation capacity of beams and
beam-columns. Proceedings of International Colloquim Stability of Steel Structures Further
Direction in Stability Research and Design, European Session. 1995;1:163-74.
[23] Gioncu V, Petcu D. Available rotation capacity of wide-flange beams and beam-columns
Part 1. Theoretical approaches. Journal of Constructional Steel Research. 1997;43:161-217.
[24] Gioncu V, Mazzolani F. Ductility of seismic-resistant steel structures: CRC Press; 2003.
[25] Dharma RB, Tan K-H. Rotational capacity of steel I-beams under fire conditions Part II:
Numerical simulations. Engineering Structures. 2007;29:2403-18.
[26] Dharma R, Tan K. Experimental and numerical investigation on ductility of composite
beams in the Hogging moment regions under fire conditions. Journal of structural
engineering. 2008;134:1873-86.
[27] Timoshenko SP, Gere JM. Theory of elastic stability. 1961. McGraw-Hill, New York; 1961.
[28] CEN. BS EN 1993-1-1. Design of steel structures. Part 1.1: General structural rules. UK:
British Standards Institution; 2005.
[29] Dharma RB. Buckling behaviour of steel and composite beams at elevated temperatures
2007.
[30] Huang Z, Burgess IW, Plank RJ. 3D Modelling of Beam-columns with General Cross-
sections in Fire. Paper S6-5, Third International Workshop on Structures in Fire, Ottawa,
Canada2004. p. p323-34.
[31] Dharma RB, Tan K-H. Rotational capacity of steel I-beams under fire conditions Part I:
Experimental study. Engineering Structures. 2007;29:2391-402.
[32] Quan G, Huang S-S, Burgess I. An analytical approach to modelling shear panels in steel
beams at elevated temperatures. Engineering Structures. 2015;85:73-82.
[33] Hencky H. Zur Theorie plastischer Deformationen und der hierdurch im Material
hervorgerufenen Nachspannungen. ZAMM ハ Journal of Applied Mathematics and
Mechanics/Zeitschrift für Angewandte Mathematik und Mechanik. 1924;4:323-34.
[34] Hibbit D, Karlsson B, Sorenson P. ABAQUS reference manual 6.7. Pawtucket: ABAQUS
Inc; 2005.

[35] CEN. BS EN 1993-1-2. Design of steel structures. Part 1.2: General rules ね Structural
Fire Design. UK: British Standards Institution; 2005.
[36へ TラヴキJ Nが “┌ミ ‘‘が B┌ヴェWゲゲ IWく TWゲデキミェ デエW ;IIWヮデ;Hキノity of different creep strain
calculation models in structural fire analysis. 8th International Conference on Structures in
Fire2014.

List of Tables
Table 1. Components of internal plastic work for plastic squash zones.
Table 2. Components of internal plastic work for yield lines.
Table 3. Results of tensile coupon tests at ambient temperature (MPa).
Table 4. Measured cross-section dimensions (in mm) and test temperature (in °C)
Table 5. Detailed group information
List of Figure Captions
Fig. 1. Flange buckling and beam-web shear buckling in combination.
Fig. 2. Frame analysis including connections element and buckling element.
Fig. 3. Stress-strain relationship of structural steel.
Fig. 4. Schematic forceにdeflection curve of a beam-end buckling model.
Fig. 5. Three dimensional segmented 3-noded beam-column element
Fig. 6. Plastic Buckling Mechanism.
Fig. 7. The effects of flange buckling and beam-web shear buckling on beam vertical
deflection (a) bottom-flange buckling; (b) shear buckling; (c) total deflection.
Fig. 8. Flange yield line mechanism (a) bottom flange; (b) top flange.
Fig. 9. Deformation compatibility between bottom flange and beam web (a) real-
beam deformation; (b) deformation in the model.
Fig. 10. Beam-web yield line pattern.
Fig. 11 Beam-web behaviour under shear force (a) Overall behaviour; (b) Tensile
strips; (c) Compressive strips.
Fig. 12. Mラエヴげゲ IキヴIノW for one yield line (7-8).
Fig. 13. Strut representing an arbitrary compressive strip.
Fig. 14. Cross section of one strut.
Fig. 15. Deformed shape caused by bottom-flange buckling.
Fig. 16. Deformed shape caused by shear buckling of the beam web.
Fig. 17. Test set-up
Fig. 18. Finite element model. (a) Image of finite element model; (b) cross section
dimensions (in mm).

Fig. 19. Load-deflection comparison between FEA and test results.
Fig. 20. Comparison of failure modes of Test 3-2 [26] and FEA.
Fig. 21. The finite element model
Fig. 22く Cラマヮ;ヴキゲラミ HWデ┘WWミ デエW ;ミ;ノ┞デキI;ノ マラSWノが Dエ;ヴマ;げゲ マラSWノ ;ミS FE ;ミ;ノ┞ゲキゲ
Fig.23. Comparison of predictions ラa デエW ミW┘ マラSWノ ;ミS Dエ;ヴマ;げs model: (a) FEA1;
(b) FEA2.
Fig. 24. Deformed shape: (a) ABAQUS contour; (b) Simplified theoretical deformed
shape.
Fig. 25. Force-deflection relationship of the example beam.
Fig. 26. Component-based connections and beam-end buckling elements.