Bioremediation of aflatoxin B1-contaminated maize by king oyster ...

�������� ����� ��
Complex regulation of the aflatoxin biosynthesis gene cluster of Aspergillusflavus in relation to various combinations of water activity and temperature
Markus Schmidt-Heydt, Ahmed Abdel-Hadi, Naresh Magan, Rolf Geisen
PII: S0168-1605(09)00369-9DOI: doi: 10.1016/j.ijfoodmicro.2009.07.026Reference: FOOD 4826
To appear in: International Journal of Food Microbiology
Received date: 17 March 2009Revised date: 15 July 2009Accepted date: 19 July 2009
Please cite this article as: Schmidt-Heydt, Markus, Abdel-Hadi, Ahmed, Magan, Naresh,Geisen, Rolf, Complex regulation of the aflatoxin biosynthesis gene cluster of Aspergillusflavus in relation to various combinations of water activity and temperature, InternationalJournal of Food Microbiology (2009), doi: 10.1016/j.ijfoodmicro.2009.07.026
This is a PDF file of an unedited manuscript that has been accepted for publication.As a service to our customers we are providing this early version of the manuscript.The manuscript will undergo copyediting, typesetting, and review of the resulting proofbefore it is published in its final form. Please note that during the production processerrors may be discovered which could affect the content, and all legal disclaimers thatapply to the journal pertain.

ACC
EPTE
D M
ANU
SCR
IPT
ACCEPTED MANUSCRIPT
1
1
2
3
Complex regulation of the aflatoxin biosynthesis gene cluster of Aspergillus 4
flavus in relation to various combinations of water activity and temperature 5
6
7
8
Markus Schmidt-Heydta, Ahmed Abdel-Hadib Naresh Maganb and Rolf Geisena 9
10
11
12
a Max Rubner Institute, Haid-und-Neu-Str. 9, 76131 Karlsruhe, Germany 13
b Applied Mycology Group, Cranfield Health, Cranfield University, Silsoe, Bedford, 14
U.K. MK45 4DT, U.K. 15
16
17
18
19
Corresponding author 20
21
Rolf Geisen 22
Max Rubner Institute Karlsruhe 23
Haid und Neu Str. 9, 76131 Karlsruhe, Germany 24
tel.:0049(0)721-6625-450; fax:0049(0)721-6625-453 25

ACC
EPTE
D M
ANU
SCR
IPT
ACCEPTED MANUSCRIPT
2
Abstract 27
28
A microarray analysis was performed to study the effect of varying combinations of 29
water activity and temperature on the activation of aflatoxin biosynthesis genes in A. 30
flavus grown on YES medium. Generally A. flavus showed expression of the aflatoxin 31
biosynthetic genes at all parameter combinations tested. Certain combinations of aw 32
and temperature, especially combinations which imposed stress on the fungus 33
resulted in a significant reduction of the growth rate. At these conditions induction of 34
the whole aflatoxin biosynthesis gene cluster occurred, however the produced 35
aflatoxin B1 was low. At all other combinations (25 °C/0.95 and 0.99; 30 °C/0.95 and 36
0.99; 35 °C/0.95 and 0.99) a reduced basal level of cluster gene expression occurred. 37
At these combinations a high growth rate was obtained as well as high aflatoxin 38
production. When single genes were compared, two groups with different expression 39
profiles in relation to water activity/temperature combinations occurred. These two 40
groups were co-ordinately localized within the aflatoxin gene cluster. The ratio of 41
aflR/aflJ expression was correlated with increased aflatoxin biosynthesis. 42
43
Keywords: aflatoxin; gene expression; microarray; water activity; temperature; stress; 44
aflS; aflR; aflatoxin cluster 45
46
47
48
49
50
51
52

ACC
EPTE
D M
ANU
SCR
IPT
ACCEPTED MANUSCRIPT
3
1. Introduction 53
54
Aflatoxins are produced by Aspergillus flavi group species and are thought to 55
be one of the most cancerous natural substances known. Economically and 56
biologically the most important fungal species able to produce the aflatoxins are A. 57
flavus and A. parasiticus (Bhatnagar et al., 2002). The aflatoxin biosynthesis gene 58
cluster of A. parasiticus has been completely elucidated (Yu et al., 2004). Moreover 59
the genome of A. flavus is known and a whole genome microarray of A. flavus is 60
available and has been used to study the regulation of aflatoxin biosynthesis genes 61
(O´Brian et al., 2003). Generally, the aflatoxin biosynthesis genes of A. flavus and A. 62
parasiticus are highly homologous and the order of the genes within the cluster being 63
the same (Yu et al., 1995). A. flavus usually produces only aflatoxin B1 and B2. Not all 64
of the strains of A. flavus isolated from the natural habitat are able to produce these 65
metabolites at least under laboratory conditions. On the other hand, A. parasiticus is 66
a strong and consistent aflatoxin producing species (Bennett and Christensen, 1983; 67
Vaamonde et al., 2003). Most strains of this species are able to produce the 68
aflatoxins B1, B2, G1, and G2. 69
The biosynthesis of aflatoxins, as all secondary metabolites, is strongly 70
dependent on growth conditions such as substrate composition (Luchese and 71
Harrigan, 1993) or physical factors like pH, water activity, temperature or modified 72
atmospheres (Ellis et al., 1993; Molina and Gianuzzi, 2002; Ribeiro et al., 2006; 73
Giorni et al., 2008). Depending on the particular combination of external growth 74
parameters the biosynthesis of aflatoxin can either be completely inhibited, albeit 75
normal growth is still possible or the biosynthesis pathway can be fully activated. 76
Knowledge about these relationships enables an assessment of which parameter 77
combinations can control aflatoxin biosynthesis or which are conducive to phenotypic 78

ACC
EPTE
D M
ANU
SCR
IPT
ACCEPTED MANUSCRIPT
4
aflatoxin production. A mathematical model which delineates the relationship 79
between pH, propionic acid concentration and temperature on aflatoxin biosynthesis 80
by A. parasiticus was described by Molina and Giannuzzi (2002). Sweeney et al. 81
(2000) developed a reverse transcription polymerase chain reaction to analyse the 82
expression of the aflR and aflQ gene of the aflatoxin pathway in relation to various 83
nutritional media. Xu et al. (2000) monitored the expression of the aflD gene after 84
growth of A. parasiticus on peanut pods by a reporter gene approach. Mayer et al. 85
(2003) showed that expression of the aflD gene and the biosynthesis of aflatoxin in 86
wheat are directly coupled. Recently Price et al. (2005) used a whole genome 87
microarray approach to analyse the influence of substrate composition and pH on the 88
activation of aflatoxin biosynthesis genes. With a pathway specific microarray and by 89
Real Time PCR the influence of physical parameters like water activity, temperature 90
and pH on the expression of ochratoxin A-, trichothecene- and aflatoxin biosynthesis 91
genes have been analysed and a common expression profile was found (Schmidt-92
Heydt and Geisen, 2007). The published data show a correlation between external 93
parameters and gene expression, however no comprehensive systematic analysis of 94
this in relation to aflatoxin production has been performed. Recently Georgianna and 95
Payne (2009) summarized the current knowledge of the regulation of aflatoxin 96
biosynthesis in relation to external factors. 97
98
In the current work the influence of various combinations of the most important 99
physical parameters, temperature and aw, on the regulation of the aflatoxin 100
biosynthesis genes of A. flavus was systematically analysed. A basic model was 101
generated to visualize the correlation between parameter combinations and cluster 102
gene activation. This type of study is required to elucidate the pivotal role of 103
environmental factors in the activation of the aflatoxin biosynthesis genes. 104

ACC
EPTE
D M
ANU
SCR
IPT
ACCEPTED MANUSCRIPT
5
2. Materials and methods 105
106
2.1 Strains and growth conditions 107
108
A. flavus SRKC-G1907 produces aflatoxin B1 when grown under permissive 109
conditions. This strain produces high amounts of aflatoxin after growth on YES agar 110
(20 g/l yeast extract, 150 g/l sucrose, 15 g/l agar) at 25 to 30 °C for 5 days. For 111
expression and toxin analysis the agar plates were overlayed with sterile 8.5 112
cellophane sheets (P400, Cannings, Bristol, U.K.) and then single point inoculated 113
centrally by applying 10 µl of a spore suspension (107 spores in TWS (0.5 % tween 114
80, 0.85 g/l NaCl)). The water activity of the media was adjusted with glycerol by 115
using glycerol/water mixtures. The following amounts were used per litre (108 ml, 116
0.99; 13.1 ml, 0.98; 19.9 ml, 0.95; 24.5 ml, 0.93; 31.3 ml, 0.90). The water activity of 117
the medium was verified by using an Aqua Lab Lite water activity meter (Graintec Pty 118
Ltd). The plates were inoculated at the temperature indicated (15 – 42 °C). 119
120
2.2 Growth assessment 121
122
For measurement of the diametric mycelial growth rate, the diameter of the 123
colony was measured in two directions at right angles to each other. The increase in 124
colony radius was plotted and the linear regression lines for the linear phase were 125
used to obtain the relative growth rates (cm/7days). The biomass was removed from 126
the cellophane surface for extraction and molecular and aflatoxin analysis. All 127
experiments were carried out with 3-4 replicates and some temperature treatments 128
repeated for confirmation of results. 129
130

ACC
EPTE
D M
ANU
SCR
IPT
ACCEPTED MANUSCRIPT
6
2.3 Isolation of RNA from samples 131
132
To perform microarray experiments RNA was isolated using the RNAeasy 133
Plant Mini kit (Qiagen, Hilden, Germany). An amount of 1 g of the mycelium was 134
ground with a mortar and pestel in liquid nitrogen. About 250 mg of the resulting 135
powder was used for isolation of total RNA. The powder was resuspended in 750 µl 136
lysis buffer, mixed with 7.5 µl β-mercaptoethanol and 100 glass beads with a 137
diameter of 1 mm (B. Braun Biotech International GmbH, Melsungen, Germany) in a 138
2 ml RNase free micro reaction tube. The extracts were mixed thoroughly and 139
incubated for 15 min at 55 °C and 42 kHz in an S10H ultrasonic bath (Elma, Singen, 140
Germany). All further procedures were essentially the same as suggested by the 141
manufacturer of the kit. 142
143
2.4 Microarray experiments 144
145
cDNA synthesis and labelling were performed using the Micromax Direct 146
Labeling kit (Perkin Elmer Life And Analytical Sciences, Inc. Boston, USA). For this 147
purpose an amount of 50 µg of the DNase I treated total RNA was used according to 148
the specifications of the kit. After cDNA synthesis and labelling, the cDNA was 149
purified with the QiaQuick Min Elute kit (Qiagen, Hilden, Germany). The labelled and 150
purified cDNA was brought to dryness in a vacuum concentrator (Speed Vac, Savant 151
Instruments, Farmingdale, USA), resuspended in 60 µl hybridization buffer (Scienion, 152
Berlin, Germany), heated for 2 min. at 95 °C, place d on ice to prevent strand 153
rearrangement and hybridized for 18 h at 42 °C to t he microarray by using an 154
automatic hybridization station (Perkin Elmer, Boston, USA). After hybridization the 155
array was scanned with a confocal laser system (Scanarray lite, Perkin Elmer) at a 156

ACC
EPTE
D M
ANU
SCR
IPT
ACCEPTED MANUSCRIPT
7
resolution of 5 µm. The analysis of the results was performed using the Scanarray 157
software (Perkin Elmer, Boston, USA). The results were normalized using the 158
Lowess algorithm (locally weighted scatter plot smoothing) together with subtraction 159
of the background signal. As control, the β-tubulin gene was used. 160
161
2.5 Quantitative determination of aflatoxin B1 by HPLC 162
163
Detection and quantitative determination of aflatoxin B1 from fungal colonies 164
were performed on a high-pressure gradient system from Shimadzu (Duisburg, 165
Germany) equipped with an auto injector and a fluorescence detector. For this 166
purpose 100 mg of the fungal colony were extracted under shaking conditions in 500 167
µl chloroform at room temperature for 30 min. The residue was discarded and the 168
chloroform was evaporated to dryness in a vacuum concentrator (Speed Vac, Savant 169
Instruments, Farmingdale, USA). The residue was then redissolved in 200 µl 170
methanol and subjected to HPLC analysis (20 µl). 171
Separation was carried out on a Prontosil (250 mm x 4.6 mm i.d., particle size 172
3 µm) reversed-phase column (Bischoff, Leonberg, Germany). The solvent system 173
consisted of 0.1 % formic acid in water (pH = 3) (A) and acetonitrile (B). Elution was 174
effected using a linear gradient from 30 % to 90 % B in 30 min. The flow rate was 0.8 175
ml/min. The fluorescence detector settings were an excitation wavelength of 365 nm 176
and an emission wavelength of 440 nm. 177
178
179
180
181
182
ACC
EPTE
D M
ANU
SCR
IPT
ACCEPTED MANUSCRIPT
8
3. Results 183
184
3.1 Expression profile of the aflatoxin biosynthesis genes of A. flavus in relation to the 185
parameter combinations temperature x water activity 186
187
In order to analyse the influence of combinations of the external parameters 188
temperature x aw on aflatoxin gene activation A. flavus was grown for 7 days on YES 189
medium adjusted to the respective aw at the temperatures as indicated. After this time 190
the activation of the aflatoxin biosynthesis gene cluster was determined by 191
microarray analysis. In parallel at each parameter combination the colony growth as 192
well as the aflatoxin B1 produced was determined. The results obtained are shown in 193
Figure 1. 194
195
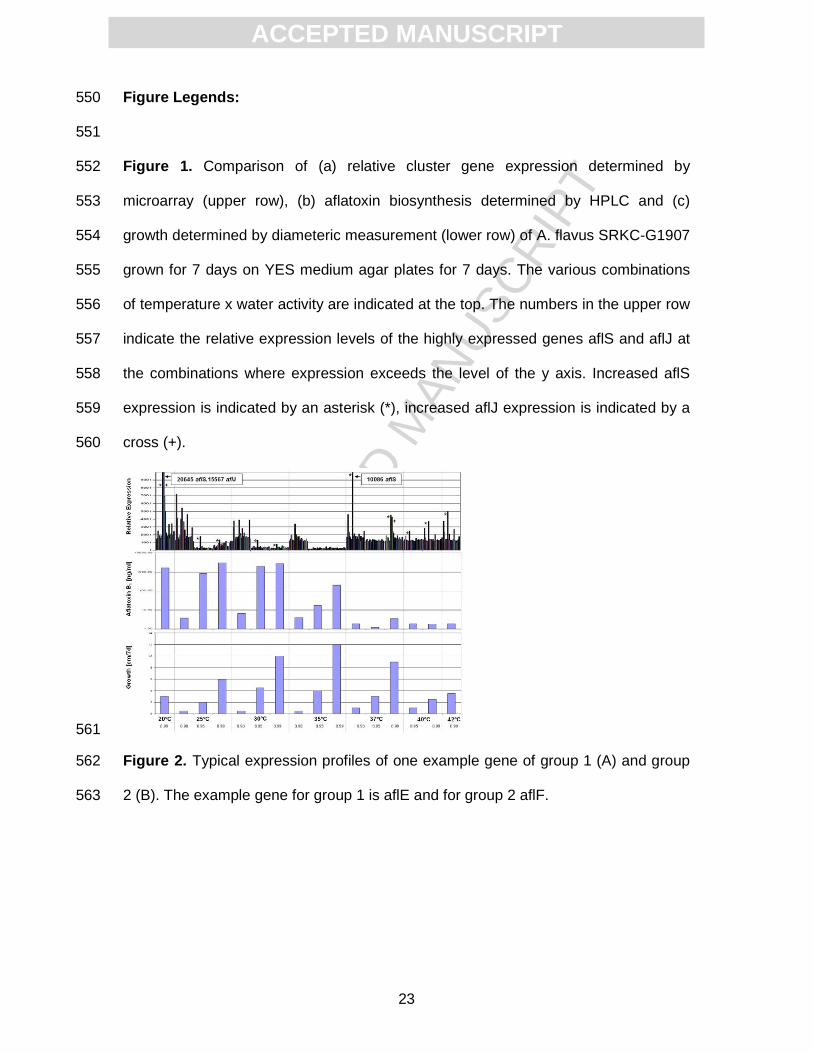
The growth rates follow a general pattern. At each temperature growth 196
increased as aw was increased from 0.90 to 0.99. The growth optimum for this strain 197
was at 37°C. At 25, 30 and 35 °C the biosynthesis p attern of aflatoxin followed the 198
growth rate and was high at 0.99 aw and low at 0.90 aw. Highest amounts of aflatoxin 199
were produced between 25 and 30 °C, but also at 20 °C. Very low amounts were 200
produced at ≥37 °C and at a w of 0.90. 201
202
The expression profiles of the aflatoxin cluster genes were co-ordinately 203
changed in response to the environmental conditions and were partly inversely 204
related to the growth rate and also to aflatoxin biosynthesis. At intermediate 205
combinations of temperature x aw (25 °C/0.95 and 0.99; 30 °C/0.95 and 0.99; 206
35 °C/0.95 and 0.99) a high production of aflatoxin B1 was observed despite the fact 207
that the cluster genes are transcribed only to a certain basal level. At these 208

ACC
EPTE
D M
ANU
SCR
IPT
ACCEPTED MANUSCRIPT
9
combinations growth was moderate or close to the optimum. At combinations of 209
temperature x aw which are less favourable for growth due to low aw or high 210
temperature (25 °C/0.90; 30 °C/0.90; 37 °C/0.90 and 0.95 and 0.99; 40 °C/0.90 and 211
0.95 and 0.99; 42 °C/0.99) the overall cluster gene s are induced when compared to 212
the basal level. Interestingly most of the cluster genes are activated nearly to the 213
same level for all these combinations except of some single genes which are 214
expressed at a significantly higher level. Generally growth was significantly 215
decreased at these stress conditions with an exception at 37°C/0.99 where growth 216
was at an intermediate level. Under these inducing conditions only very low amounts 217
of aflatoxin were produced. Even after prolonged incubation of A. flavus no increase 218
in aflatoxin concentration occurred (data not shown). An even more pronounced 219
induction of several genes of the cluster could be observed at only one specific 220
condition, e.g. 20°C/0.99. At this condition, altho ugh growth is moderate high 221
amounts of aflatoxin were produced. At combinations of 20 °C/0.95 and 0.90 growth 222
was practically inhibited and analysis was not possible. 223
224
3.2 Expression of specific genes 225
226
It was noticeable that the expression of some genes was much higher than the 227
general cluster gene expression level under certain parameter combinations. This 228
was especially true for the aflS gene. The aflS (formerly aflJ) gene is a regulatory 229
gene which interacts and activates aflR, the major regulatory gene, which than 230
activates the aflatoxin structural genes (Chang, 2003). At most conditions with a 231
temperature >37°C the aflS gene expression was highly increased especially at 232
37°C/0.90. At certain other parameter combinations at 20, 25 and 30°C the 233
expression of the aflS gene was also increased when compared to the other genes of 234
ACC
EPTE
D M
ANU
SCR
IPT
ACCEPTED MANUSCRIPT
10
the cluster. This was often accompanied by an increased biosynthesis of aflatoxin 235
compared to the neighbouring conditions. At conditions <37°C a reduction of the a w 236
to 0.90 did not lead to an increased expression of the aflS gene compared to the 237
other cluster genes. This lower activity of the aflS gene was always accompanied by 238
a lower biosynthesis of aflatoxin (see Figure 1). At 20°C/0.99 a w the aflS gene was 239
very high expressed relative to the other genes and accompanied by a similar 240
activation of the aflJ (formerly estA) gene. Under these conditions growth was 241
moderate and aflatoxin biosynthesis high. At all analysed conditions the aflR gene 242
was not prominently expressed and followed the general expression of the cluster 243
genes. However the ratio of expression between the aflS and aflR gene seemed to 244
be critical for aflatoxin biosynthesis (Table 1). At conditions with low aw (0.90) the 245
ration is far below 1. At these conditions low amounts of aflatoxin are produced. At 246
moderate conditions the ratio is more than 1. At these conditions high amounts of 247
aflatoxin are produced. 248
249
3.3 Differences in the regulation of the single cluster genes in relation to 250
combinations of temperature and water activity 251
252
In order to compare the expression profiles of single genes in relation to both 253
parameters all expression data of the single genes were plotted against temperature 254
and aw (Figure 2). Based on the expression profiles, two groups of genes could be 255
identified. The expression profile of group 1 is shown in Figure 2A. The following 256
genes belonged to this group and all showed a very similar profile: aflM, aflE, aflH, 257
aflJ, aflN, aflR, aflS, aflU, aflQ, aflX. The expression profile of the second group 258
(group 2) of genes is shown in Figure 2B. The following genes belong to this group: 259
aflG, aflT, aflP, aflD, aflL, aflO, aflC, aflF, aflA, aflB, aflK, aflV, aflW, aflY. Also in this 260

ACC
EPTE
D M
ANU
SCR
IPT
ACCEPTED MANUSCRIPT
11
group the expression patterns of all the genes were very similar and resembled the 261
profile which is shown in Figure 2B. The genes aflS and aflJ, which were highly 262
expressed under certain conditions, were both in group 1. When the two gene groups 263
are assigned to the cluster all of the group 1 genes are adjacently located covering 264
the region from aflR to aflN. The other group is split and comprises the regions from 265
the aflF to the aflA gene and from the aflG to the aflY gene. The only exception is the 266
aflU gene, which belongs to the expression profile of group 1. The data suggests that 267
different mechanisms are involved in the regulation of the two groups in relation to 268
environmental changes and that co-localization within the cluster might facilitate this 269
different behaviour (Fig. 3). 270
271
3.4 Matrix of aflatoxin cluster gene activation in relation to water activity and 272
temperature 273
274
Based on the expression data obtained during this systematic analysis a 275
matrix of aflatoxin cluster gene expression in relation to aw and temperature could be 276
generated (Fig. 4). This matrix plots the level of induction versus certain 277
combinations of aw levels and temperatures. Three sets of parameter combinations 278
could be identified in this analysis. First parameter combinations which allow a basal 279
level of expression (Fig. 3, white squares) in the temperature range of 25-37°C at a w 280
levels >0.90 (e. g. aw 0.95 and 0.99). These conditions support moderate to good 281
growth of A. flavus and are usually accompanied by high production levels of 282
aflatoxin. A general activation level of the whole gene cluster with high expression of 283
certain genes could be identified at all temperatures in combination with low aw (0.90) 284
or at temperatures >37°C (Fig. 3, light grey square s). These conditions impose stress 285
on the fungus, growth is significantly reduced and very low amounts of aflatoxin are 286

ACC
EPTE
D M
ANU
SCR
IPT
ACCEPTED MANUSCRIPT
12
produced. Finally an activation level at which certain genes are very highly expressed 287
(aflS) could be identified at one unique combination only (20 °C/0.99; Fig. 3, dark 288
grey square). At this condition moderate growth is possible suggesting moderate 289
stress. Also at this condition high amounts of aflatoxin are produced. The reason why 290
the expression behaviour at the combination 37°C/0. 90 was not included in this last 291
group is because despite the quite high induction of the aflS gene, which was about 292
half of that at 20°C/0.99, no increase in aflatoxin production occurred. These results 293
suggest that the stress level applied is due to these differences. Both situations are at 294
the margins of the window for growth because adjacent combinations are no longer 295
supportive for growth (e.g. 20°C/0.95 and 40°C/0.90 ). 296
297
4. Discussion 298
299
In this study the regulation of the aflatoxin cluster genes of A. flavus in relation 300
to changing environmental parameters, especially temperature x aw combinations 301
have been analysed using a toxin gene cluster microarray. Three types of cluster 302
gene expression could be observed, which appeared to be related to the level of 303
abiotic stress imposed. The involvement of abiotic stress in the activation of 304
mycotoxin biosynthetic genes have been described in several studies (Schmidt-Heydt 305
et al., 2008; Jayashree and Subramanyam, 2000; Jurado et al., 2008; Kim et al., 306
2005; Ochiai et al., 2007; Kohut et al., 2009). In conditions favourable for growth of A. 307
flavus the cluster genes are expressed at a basal level with the strain producing high 308
amounts of aflatoxin. Under mild stress conditions (20 °C/0.99) several of the cluster 309
genes, in particular aflS and aflJ were very highly induced concomitant with high 310
levels of phenotypic aflatoxin production. Under increased stress conditions (0.90 aw 311
and >37 °C) the whole cluster was induced, with the aflS expression being prominent 312

ACC
EPTE
D M
ANU
SCR
IPT
ACCEPTED MANUSCRIPT
13
at certain parameter combinations (>37 °C), however much less compared to the 313
former situation. Under these conditions, surprisingly very low amounts of aflatoxin 314
were produced. Similar behaviour was recently obtained for patulin biosynthesis 315
(Baert et al., 2007). These authors showed that mild stress imposed by abiotic factors 316
induced patulin production, but higher stress was inhibitory. Similar effects were also 317
reported by Schmidt-Heydt et al. (2008) and Jurado et al. (2008) for mycotoxigenic 318
Fusarium and Penicillium species. It may be that although the gene cluster is 319
expressed above the basal level other posttranscriptional mechanisms impair 320
aflatoxin biosynthesis. This mechanism might act at the stage of transcription, e. g. a 321
reduction of transcription or at the protein level, e. g. an inhibition of enzyme activity 322
by some kind of protein modification. Alternatively at the metabolic level the 323
concentration of precursors or other metabolites required might be suboptimal. For 324
example, even at the combination of 37°C/0.90 where a high activation of the aflS 325
gene occurred, similar to that at 20 °C/0.99, only very low aflatoxin production was 326
observed. Interestingly, both conditions are at the growth-no growth boundary where 327
conditions are very marginal for growth (no growth at 20°C/0.95 and 40°C/0.90). 328
Similar observations were made in other studies, in which low production of aflatoxin 329
was observed, despite the fact that the cluster genes were actively transcribed 330
(Georgianna and Payne, 2009). 331
332
O´Brian et al. (2007) recently used a microarray analysis to study the influence 333
of temperature on expression of the aflatoxin biosynthesis genes. They found a 334
reduced expression and no production at 37°C for th eir strain. However, a strong 335
induction of the genes occurred at 28°C which was p aralleled by high aflatoxin 336
biosynthesis. Most of their data fits very nicely to the data presented here. Also in the 337
current analysis a high production between 25 and 30 °C could be seen. At 338

ACC
EPTE
D M
ANU
SCR
IPT
ACCEPTED MANUSCRIPT
14
temperatures beyond or at 37 °C very scarce amounts of aflatoxin were produced. 339
However differences were observed for the expression of the aflatoxin cluster genes. 340
O´Brian et al. (2007) found a high level of expression at optimal production 341
temperature (28 °C) and a low level at 37 °C. Durin g this analysis only a basal level 342
of expression was found between 25 and 30 °C as lon g as the water activity was 343
above 0.90, but an induced level at temperatures above 37 °C. In the current study 344
the fungus were incubated on solid YES medium for 7 days. In the study of O’Brian et 345
al. (2007) A. flavus was grown in liquid A & M medium for 7 days which might 346
account for these differences. Moreover the water activity was not controlled in the 347
former study. 348
349
O’Brian et al. (2007) observed a difference between the level of aflR and aflS 350
expression and aflatoxin biosynthesis. They found that both regulatory genes were 351
highly expressed at 37°C, conditions under which th e strain of A. flavus produced no 352
aflatoxin. The present study also found a strong expression of the aflS gene at 353
temperatures >37°C at nearly all a w values tested. Despite this high activation of the 354
aflS gene, low amounts of aflatoxin were produced under these conditions, which is 355
supported by the data of O,Brian et al. (2007). A slight increased expression of the 356
aflS gene was also found at certain moderate parameter combinations at 30, 25 and 357
20 °C where the cluster is expressed at the basal l evel. Interestingly, at all these 358
combinations, high amounts of aflatoxin were produced when the aflS expression 359
was elevated. At temperatures <37 °C, when a w leads to cluster gene activation (at 360
0.90 aw) no enhanced expression of the aflS was observed, paralleled by a low 361
biosynthesis of aflatoxin. These results indicate that the increased activation of this 362
regulatory gene is inhibited by low aw levels. No increased aflR expression could be 363
observed under the current conditions, which however was shown by O´Brain et al 364

ACC
EPTE
D M
ANU
SCR
IPT
ACCEPTED MANUSCRIPT
15
(2007). Instead the aflR expression paralleled the general cluster gene expression. 365
Interestingly the ratio of expression of aflS:aflR is high when high amounts of 366
aflatoxin are produced, except at temperatures above 37 °C where the ratio is still 367
high, but only scarce amounts of toxin are produced. The expression ratio however is 368
low at water activities of 0.90 when only minor amounts of toxin are produced. The 369
fact that under certain conditions only low amounts of aflatoxin were produced might 370
be due to an unknown post-transcriptional mechanism as discussed above. 371
Two groups of cluster genes could be identified based on plotting of the 372
expression profile of the single genes against temperature and aw. Interestingly, 373
when these groups were allocated to the cluster, they suggest a division into three 374
homogenous parts of the cluster consisting of genes of the same group. Genes with 375
expression profile 2 are located within the cluster region between aflF and aflA 376
followed by a region completely covered by genes of the expression profile 1 (aflR to 377
aflN) again followed by group 2 genes from aflG to aflY. It has long been observed 378
that the physical order of the genes is similar to the order of enzyme reactions 379
catalysed by their gene products (Trail et al., 1995; Roze et al., 2007). This 380
organization seems to be reflected here, dividing the cluster into early, middle and 381
late genes based on the expression profile. Based on these results it seems that the 382
middle genes may be regulated differently compared to the early and late groups of 383
genes. The only exception is the aflU gene, which lies in the group of early genes, 384
but has the same expression profile as group 1. According to Ehrlich et al. (2004) this 385
gene is important in A. parasiticus for the biosynthesis of the G type aflatoxins and 386
this gene together with the aflF gene is often non-functional in A. flavus due to 387
deletions. In a recent publication Carbone et al. (2007) showed that the aflatoxin 388
cluster of A. parasiticus is comprised of 5 distinct recombination blocks which seem 389
to play a role in the evolution of the cluster. Interestingly block 2 and 3 of the analysis 390

ACC
EPTE
D M
ANU
SCR
IPT
ACCEPTED MANUSCRIPT
16
of Carbone et al. (2007) contains the same genes as group 1 of the current analysis 391
of A. flavus. This suggests that also the cluster of A. flavus consist of evolutionary 392
building blocks and that the blocks determine differential expression in relation to 393
environmental parameters. 394
395
The results described here demonstrate activity of the aflatoxin gene cluster 396
over the whole range of analysed abiotic factors. It appears that at the basal level of 397
expression, high amounts of aflatoxin are produced. Under mild stress conditions 398
(20 °C/0.99) a burst of gene induction occurred whi ch at the end resulted in the same 399
amounts of aflatoxin. This may seem contradictory, however it has to be kept in mind 400
that the aflatoxin production values are accumulated values and the microarray data 401
are snapshots of total expression activity over time. Moreover the aflatoxin reaches a 402
saturation level, e. g., the saturation can either be reached due to growth under basal 403
level expression for a longer time or under high expression levels over a shorter time. 404
This possibility might explain the fact that the amount of aflatoxin produced is the 405
same for both conditions. Additionally regulatory events beyond transcription can 406
explain the facts described here. This possibility is also discussed by Georgianna and 407
Payne (2009). 408
409
The influence of aflS seems to be different under various abiotic stress 410
conditions. In the case of temperature stress and at moderate temperatures and aw 411
levels aflS is highly expressed when compared to the other cluster genes and high 412
amounts of aflatoxin are produced if temperature stress is not too high (< 37 °C). In 413
the case of aw stress aflS expression was not increased over the other genes of the 414
cluster and aflatoxin biosynthesis greatly reduced. The ratio between aflS expression 415
and general cluster gene expression or aflR seems to be more important for aflatoxin 416

ACC
EPTE
D M
ANU
SCR
IPT
ACCEPTED MANUSCRIPT
17
biosynthesis than the overall expression level. At temperatures >37°C this might also 417
be true but a unknown post-transcriptional mechanisms might prevent aflatoxin 418
biosynthesis. 419
Again, in this analysis what was previously shown for ochratoxin A 420
biosynthesis in P. verrucosum, trichothecene biosynthesis in F. culmorum and 421
aflatoxin biosynthesis in A. parasiticus has been demonstrated now for A. flavus. 422
High amounts of the toxin are produced at conditions slightly lower than those at 423
which growth is optimal, but in addition biosynthesis is also activated at the edges of 424
the growth window, when growth is retarded (Schmidt-Heydt et al., 2008). 425
From a food safety point of view the data can be used to optimize certain food 426
technological processes, e. g. the drying of susceptible products like for example 427
fruits like figs or dates. These products are very often sun dried at temperatures 428
between 30 – 37 °C which is inducive for aflatoxin biosynthesis. If the products are 429
instead immediately dried in a heater at temperatures above 37 °C (repressive for 430
ochratoxin A biosynthesis) until a water activity of 0.9 is reached (repressive for 431
ochratoxin biosynthesis) the process should be safe according the data presented 432
here. The water activity of 0.9 is about the water activity of the final product which 433
corresponds to a moisture content of < 25 %. 434
The current study shows that stress applied by external abiotic factors has a 435
complex influence on aflatoxin gene regulation. This study using a mycotoxin gene 436
cluster array gives a first insight into this sophisticated regulatory network. 437
438
Acknowledgements 439
440
Parts of this work were supported by the EU-project "Development of cost-441
effective control and prevention strategies for emerging and future foodborne 442

ACC
EPTE
D M
ANU
SCR
IPT
ACCEPTED MANUSCRIPT
18
pathogenic microorganisms throughout the food chain" (Pathogen Combat), FOOD-443
CT-2005-07081 and by the EU-project “Novel integrated strategies for worldwide 444
mycotoxin reduction in the food and feed chains” (No. 222690). The A. flavus strain 445
was a gift from Deepak Bhatnagar. We would like to thank Katja Kramer for skilful 446
technical assistance. A. Abdel-Hadi gratefully thanks the Assuit Al-AzharUniversity 447
and the Egyptian Higher Education Ministry for support. 448
449
References 450
451
Baert, K., Devlieghere, F., Flyps, H., Oosterlinck, M., Ahmed, M.M., Verlinden, B., 452
Nicolai, B., Debevere,J., De Meulenaer, B., 2007. Influence of storage 453
conditions of apples on growth and patulin production by Penicillium 454
expansum. International Journal of Food Microbiology 119, 170-181. 455
Bennett, J.W., Christensen, S.B., 1983. New perspectives on aflatoxin biosynthesis. 456
Advances in Applied Microbiology 29, 53-92. 457
Bhatnagar, D., Yu, J., Ehrlich, K.C., 2002. Toxins of filamentous fungi. In Fungal 458
Allergy and Pathogenicity, pp. 167-206. (Eds M. Breitenbach, R. Crameri and 459
S. B. Lehrer). Basel, Karger: Chem. Immunol. 460
Carbone, I., Jakobek, J. L., Ramirez-Prado, J. H., Horn, B., 2007. Recombination, 461
balancing selection and adaptive evolution in the aflatoxin gene cluster of 462
Aspergillus parasiticus. Molecular Ecology 16, 4401-4417 463
Chang., P. K., 2003. The Aspergillus parasiticus protein AFLJ interacts with the 464
aflatoxin-pathway specific regulator AFLR. Molecular and General Genomics 465
268, 711-719 466

ACC
EPTE
D M
ANU
SCR
IPT
ACCEPTED MANUSCRIPT
19
Ehrlich, K.C., Chang, P.-K., Yu, J., Cotty, P.J., 2004. Aflatoxin biosynthesis cluster 467
gene cypA is required for G aflatoxin formation. Applied and Environmental 468
Microbiology 70, 6518-6524. 469
Ellis, W.O., Smith, P.J., Simpson, B.K., Khanizadeh, S., Oldham, J.H., 1993. Control 470
of growth and aflatoxin production of Aspergillus flavus under modified 471
atmosphere packaging conditions. Food Microbiology 10, 9-21. 472
Georgianna, D.R., Payne, G., 2009. Genetic regulation of aflatoxin biosynthesis: 473
From gene to genome. Fungal Genetics and Biology 26, 113-125. 474
Giorni, P., Battilani, P., Pietri, A., Magan, N., 2008. Effect of aw and CO2 level of 475
Aspergillus flavus growth and aflatoxin production in high moisture maize post-476
harvest. International Journal of Food Microbiology 122, 109-113. 477
Jayashree, T., Subramanyam, C., 2000. Oxidative stress as a prerequisite for 478
aflatoxin production by Aspergillus parasiticus. Free Radicals in Biology and 479
Medicine 29, 981-985. 480
Jurado, M., Marín, P., Magan, N., González-Jaén, M.T., 2008. Relationship between 481
solute and matric potential stress, temperature, growth, and FUM1 gene 482
expression in two Fusarium verticillioides strains from spain. Applied and 483
Environmental Microbiology 74, 2032-2036. 484
Kim, J.H., Campbell, B.C., Yu, J., Mahoney, N., Chan, K.L., Molyneux, R.J., 485
Bhatnagar, D., Cleveland, T.E., 2005. Examination of fungal stress response 486
genes using Saccharomyces cerevisiae as a model system: targeting genes 487
affecting aflatoxin biosynthesis by Aspergillus flavus Link. Applied 488
Microbiology and Biotechnology 67, 807-815. 489

ACC
EPTE
D M
ANU
SCR
IPT
ACCEPTED MANUSCRIPT
20
Kohut, G., Ádám, A. L., Fazekas, B., Hornok, L. 2009. N-starvation stress induced 490
FUM gene expression and fumonisin production is mediated via the HOG-type 491
MAPK pathway in Fusarium proliferatum. International Journal of Food 492
Microbiology, 130: 65-69 493
Luchese, R.H., Harrigan, W.F., 1993. Biosynthesis of aflatoxin-the role of nutritional 494
factors. Journal of Applied Bacteriology 74, 5-14. 495
Mayer, Z., Bagnara, A., Färber, P., Geisen, R., 2003. Quantification of the copy 496
number of nor-1, a gene of the aflaxtoxin biosynthetic pathway by real-time 497
PCR, and its correlation to the cfu of Aspergillus flavus in foods. International 498
Journal of Food Microbiology 82, 143-151. 499
Molina, M., Giannuzzi, L., 2002. Modelling of aflatoxin production by Aspergillus 500
parasiticus in a solid medium at different temperatures, pH and propionic acid 501
concentrations. Food Research International 35, 585-594. 502
Ochiai, N., Tokai, T., Nishiuchi, T., Takahashi-Ando, N., Fujimura, M., Kimura, M., 503
2007. Involvement of the osmo sensor histidine kinase and osmotic stress-504
activated protein kinases in the regulation of secondary metabolism in 505
Fusarium graminearum. Biochemical and Biophysical Research 506
Communication 363, 639-644. 507
O´Brian, G.R., Fakhoury, M., Payne, G.A., 2003. Identification of genes differentially 508
expressed during aflatoxin biosynthesis in Aspergillus flavus and Aspergillus 509
parasiticus. Fungal Genetics and Biology 39, 118-127. 510
O´Brian, G.R., Georgianna, D.R., Wilkinson, J.R., Yu, J., Abbas, H.K., Bhatnagar, D., 511
Cleveland, T.E., Nierman, W., Payne, G.A., 2007. The effect of elevated 512

ACC
EPTE
D M
ANU
SCR
IPT
ACCEPTED MANUSCRIPT
21
temperature on gene transcription and aflatoxin biosynthesis. Mycologia 99, 513
232-239. 514
Price, M.S., Conners, S.B., Tachdjian, S., Kelly, R.M., Payne, G.A., 2005. Aflatoxin 515
conducive and non-conducive growth conditions reveal new gene associations 516
with aflatoxin production. Fungal Genetics and Biology 42, 506-518. 517
Ribeiro, J.M.M., Cavaglieri, L.R., Fraga, M.E., Direito, G.M., Dalcero, A.M., 518
Rosa,C.A.R., 2006. Influence of water activity, temperature and time on 519
mycotoxins production on barley rootlets. Letters of Applied Microbiology 42, 520
179-184. 521
Roze, L.V., Arthur, A.E., Hong, S.J.; Chanda, A., Linz, J.E., 2007. The initiation and 522
pattern of spread of histone H4 acetylation parallel the order of transcriptional 523
activation of genes in the aflatoxin cluster. Molecular Microbiology 66, 713-726 524
Schmidt-Heydt, M., Geisen, R., 2007. A microarray for monitoring the production of 525
mycotoxins in food. International Journal of Food Microbiology 117, 131-140. 526
Schmidt-Heydt, M., Magan, N., Geisen, R., 2008. Stress induction of mycotoxin 527
biosynthesis genes by abiotic factors. FEMS Microbiology Letters 284, 142-528
149. 529
Sweeney, M.J., Pamies, P., Dobson, A.D.W., 2000. The use of reverse transcription-530
polymerase chain reaction (RT-PCR) for monitoring aflatoxin production in 531
Aspergillus parasiticus 439. International Journal of Food Microbiology 56, 97-532
103. 533
Trail, F., Mahanti, N., Linz, J., 1995. Molecular biology of aflatoxin biosynthesis. 534
Microbiology 141, 755-765. 535

ACC
EPTE
D M
ANU
SCR
IPT
ACCEPTED MANUSCRIPT
22
Vaamonde, G., Patriarca, A., Fernández Pinto, V., Comerio, R., Degrossi, C., 2003. 536
Variability of aflatoxin and cyclopiazonic acid production by Aspergillus section 537
flavi from different substrates in Argentina. International Journal of Food 538
Microbiology 79-84. 539
Xu, H., Annis, S., Linz, J., Trail, F., 2000. Infection and colonization of peanut pods 540
by Aspergillus parasiticus and the expression of the aflatoxin biosynthetic 541
gene, nor-1, in infection hyphae. Physiological and Molecular Plant Pathology 542
56, 185-196. 543
Yu, J., Bhatnagar, D., Cleveland, T.E., 2004. Completed sequence of aflatoxin 544
pathway gene cluster in Aspergillus parasiticus. FEBS Letters 564, 126-130. 545
Yu, J., Chang, P.K., Cary, J.W., Wright, M., Bhatnagar, D., Cleveland, T.E., Payne, 546
G.A., Linz, J., 1995. Comparative mapping of aflatoxin pathway gene clusters 547
in Aspergillus parasiticus and Aspergillus flavus. Applied and Environmental 548
Microbiology 61, 2365-2371. 549
ACC
EPTE
D M
ANU
SCR
IPT
ACCEPTED MANUSCRIPT
23
Figure Legends: 550
551
Figure 1. Comparison of (a) relative cluster gene expression determined by 552
microarray (upper row), (b) aflatoxin biosynthesis determined by HPLC and (c) 553
growth determined by diameteric measurement (lower row) of A. flavus SRKC-G1907 554
grown for 7 days on YES medium agar plates for 7 days. The various combinations 555
of temperature x water activity are indicated at the top. The numbers in the upper row 556
indicate the relative expression levels of the highly expressed genes aflS and aflJ at 557
the combinations where expression exceeds the level of the y axis. Increased aflS 558
expression is indicated by an asterisk (*), increased aflJ expression is indicated by a 559
cross (+). 560
561
Figure 2. Typical expression profiles of one example gene of group 1 (A) and group 562
2 (B). The example gene for group 1 is aflE and for group 2 aflF. 563

ACC
EPTE
D M
ANU
SCR
IPT
ACCEPTED MANUSCRIPT
24
564
565
Figure 3. Allocation of the biosynthesis genes, grouped according to their expression 566
profile at various temperature x water activity combinations, to the gene cluster. 567
Genes of expression profile group 1 are light grey; genes of expression group 2 are 568
dark grey. 569
570

ACC
EPTE
D M
ANU
SCR
IPT
ACCEPTED MANUSCRIPT
25
Figure 4. Matrix of the expression level of the cluster genes in relation to various 571
combinations of temperature x water activity. Basal expression level, white squares; 572
medium induced expression level, light gray squares; highly induced expression level 573
(dark gray squares). The crosses indicate marginal growth. It was not possible to use 574
these colonies for further analysis. 575
576
Table 1: Ratio of aflS/aflR in relation to aflatoxin biosynthesis and different 577 parameter combinations 578 579
Parameter combination Ratio aflS/aflR Aflatoxin [ng/g]
25°C/0.90 0.5 3.66
35°C/0.90 0.3 4.67
25°C/0.95 7.4 830.24
30°C/0.95 7.1 3016.94
25°C/0.99 1.5 1957.25
30°C/0.99 2.7 2758.74
Copyright © 2022 FDOKUMEN