Morphological Characterization and Determination of Aflatoxin ...
14
agriculture Article Morphological Characterization and Determination of Aflatoxin-Production Potentials of Aspergillus flavus Isolated from Maize and Soil in Kenya Matome Gabriel Thathana 1 , Hunja Murage 2 , Akebe Luther King Abia 3 ID and Michael Pillay 1, * 1 Department of Biotechnology, Vaal University of Technology, Private Bag X021, Vanderbijlpark 1911, South Africa; [email protected] 2 Department of Horticulture, Jomo Kenyatta University of Agriculture and Technology, P.O. Box 62000-00200, Juja 0561, Kenya; [email protected] 3 AMBIO Environmental Management, Department of Biotechnology, Vaal University of Technology, Private Bag X021, Vanderbijlpark 1911, South Africa; [email protected] * Correspondence: [email protected]; Tel.: +27-(0)16-950-9614 Received: 3 July 2017; Accepted: 7 September 2017; Published: 21 September 2017 Abstract: This study aimed at morphologically identifying Aspergillus flavus in soil and maize and at determining their aflatoxin-producing potentials. Five hundred and fourteen isolates obtained from maize and soil in Kenya were cultivated on Czapeck Dox Agar, Malt Extract Agar, Sabouraud Dextrose Agar, Potato Dextrose Agar, and Rose-Bengal Chloramphenicol Agar. Isolates were identified using macro-morphological characteristics. Micromorphological characteristics were determined using slide cultures. Aflatoxin production was determined by direct visual determination of the UV fluorescence of colonies on Coconut Agar Medium, Yeast Extract Sucrose agar, and Yeast Extract Cyclodextrin Sodium Deoxycholate agar and by Thin Layer Chromatography. Forty-three presumptive A. flavus isolates were identified; aflatoxin was detected in 23% of the isolates by UV fluorescence screening and in 30% by Thin-Layer Chromatography (TLC). The aflatoxins produced were: aflatoxin B 1 (AFB 1 ), aflatoxin B 2 (AFB 2 ), and aflatoxin G 1 (AFG 1 ); some isolates produced only AFB 1 , whereas others produced either AFB 1 and AFB 2 or AFB 1 and AFG 1 . The highest incidence of A. flavus (63%) and aflatoxin production (28%) was recorded in samples from Makueni District. Isolates from Uasin Gishu (21%) and Nyeri (5%) were non-aflatoxigenic. Bungoma District recorded 11% positive isolates of which 2% were aflatoxin producers. The occurrence of aflatoxin-producing A. flavus emphasises the need for measures to eliminate their presence in food crops. Keywords: Aflatoxins; Aspergillus flavus; morphological characterization; Thin Layer Chromatography; UV Fluorescence 1. Introduction Aspergillus flavus is a ubiquitous and cosmopolitan filamentous fungus known to proliferate in a wide range of environmental conditions [1]. It is both a saprophytic and an opportunistic pathogen and thrives abundantly on many organic nutrient sources with monosaccharides and disaccharides [2]. According to Hell and Mutegi [3] and Yu [4], species of the Aspergillus section Flavi have the ability to survive temperatures ranging from 12 ◦ C to 48 ◦ C, with the optimal growth temperature ranging from 28 ◦ C to 37 ◦ C, with a high humidity of above 80%. Although encountered mostly as a storage mold on plant products, A. flavus invades and infects developing maize seeds in the field before harvest and mature seeds during harvest and in storage [5]. Members of the genus Aspergillus, the taxonomy of which is complex and continuously evolving, are characterized by vesicle-bearing conidiophore [6]. Several taxonomic keys and guidelines have Agriculture 2017, 7, 80; doi:10.3390/agriculture7100080 www.mdpi.com/journal/agriculture
-
Upload
khangminh22 -
Category
Documents
-
view
0 -
download
0
Transcript of Morphological Characterization and Determination of Aflatoxin ...

agriculture
Article
Morphological Characterization and Determinationof Aflatoxin-Production Potentials of Aspergillusflavus Isolated from Maize and Soil in Kenya
Matome Gabriel Thathana 1, Hunja Murage 2, Akebe Luther King Abia 3 ID and Michael Pillay 1,*1 Department of Biotechnology, Vaal University of Technology, Private Bag X021, Vanderbijlpark 1911,
South Africa; [email protected] Department of Horticulture, Jomo Kenyatta University of Agriculture and Technology, P.O. Box 62000-00200,
Juja 0561, Kenya; [email protected] AMBIO Environmental Management, Department of Biotechnology, Vaal University of Technology,
Private Bag X021, Vanderbijlpark 1911, South Africa; [email protected]* Correspondence: [email protected]; Tel.: +27-(0)16-950-9614
Received: 3 July 2017; Accepted: 7 September 2017; Published: 21 September 2017
Abstract: This study aimed at morphologically identifying Aspergillus flavus in soil and maize and atdetermining their aflatoxin-producing potentials. Five hundred and fourteen isolates obtained frommaize and soil in Kenya were cultivated on Czapeck Dox Agar, Malt Extract Agar, SabouraudDextrose Agar, Potato Dextrose Agar, and Rose-Bengal Chloramphenicol Agar. Isolates wereidentified using macro-morphological characteristics. Micromorphological characteristics weredetermined using slide cultures. Aflatoxin production was determined by direct visual determinationof the UV fluorescence of colonies on Coconut Agar Medium, Yeast Extract Sucrose agar, and YeastExtract Cyclodextrin Sodium Deoxycholate agar and by Thin Layer Chromatography. Forty-threepresumptive A. flavus isolates were identified; aflatoxin was detected in 23% of the isolates byUV fluorescence screening and in 30% by Thin-Layer Chromatography (TLC). The aflatoxinsproduced were: aflatoxin B1 (AFB1), aflatoxin B2 (AFB2), and aflatoxin G1 (AFG1); some isolatesproduced only AFB1, whereas others produced either AFB1 and AFB2 or AFB1 and AFG1. The highestincidence of A. flavus (63%) and aflatoxin production (28%) was recorded in samples fromMakueni District. Isolates from Uasin Gishu (21%) and Nyeri (5%) were non-aflatoxigenic. BungomaDistrict recorded 11% positive isolates of which 2% were aflatoxin producers. The occurrenceof aflatoxin-producing A. flavus emphasises the need for measures to eliminate their presence infood crops.
Keywords: Aflatoxins; Aspergillus flavus; morphological characterization; Thin Layer Chromatography;UV Fluorescence
1. Introduction
Aspergillus flavus is a ubiquitous and cosmopolitan filamentous fungus known to proliferate in awide range of environmental conditions [1]. It is both a saprophytic and an opportunistic pathogenand thrives abundantly on many organic nutrient sources with monosaccharides and disaccharides [2].According to Hell and Mutegi [3] and Yu [4], species of the Aspergillus section Flavi have the ability tosurvive temperatures ranging from 12 ◦C to 48 ◦C, with the optimal growth temperature ranging from28 ◦C to 37 ◦C, with a high humidity of above 80%. Although encountered mostly as a storage moldon plant products, A. flavus invades and infects developing maize seeds in the field before harvest andmature seeds during harvest and in storage [5].
Members of the genus Aspergillus, the taxonomy of which is complex and continuously evolving,are characterized by vesicle-bearing conidiophore [6]. Several taxonomic keys and guidelines have
Agriculture 2017, 7, 80; doi:10.3390/agriculture7100080 www.mdpi.com/journal/agriculture

Agriculture 2017, 7, 80 2 of 14
been developed for the elucidation of the morphological features of Aspergillus species. Seriation,the shape and size of the vesicle, conidia, and stipe, the presence of Hülle cells, and the morphology ofcleistothecia and ascospores are the microscopic features used for species characterization, while themacroscopic features include conidial and mycelial colour, colony diameter, colony reverse colour,the production of exudates and soluble pigments, and the presence of sclerotia and cleistothecia [7–9].
The growth of A. flavus and the subsequent production of aflatoxins on crops have adversehealth implications for humans and animals [10]. Aflatoxin B1 (AFB1), aflatoxin B2 (AFB2), aflatoxinG1 (AFG1), and aflatoxin G2 (AFG2) are the most important of the 18 aflatoxins known [11].Their consumption results in chronic effects such as immune suppression, impaired child growth,abnormal foetal development, and cancer and acute effects such as hepatitis and jaundice,abnormal swellings, and even death [2].
Cases of human and animal aflatoxicosis have been reported in Africa as a result of theconsumption of food and feed contaminated with aflatoxins [12]. In Kenya, aflatoxin contaminationof maize, the country’s most dominant subsistence and commercial crop, has repeatedly resulted inserious health implications. Of the recurrent outbreaks of human aflatoxicosis reported between 1978and 2008, the most severe one was in 2004, during which 317 cases and 125 deaths were reported [12,13].To date, aflatoxin contamination continues to be a problem for subsistence farmers in Kenya becauseno precautionary measures are routinely adopted to keep in check the fungal infection of crops.Therefore, continuous monitoring of crops intended for food and feed is highly important. The mainobjective of this study was to identify and determine the aflatoxin production potential of A. flavusisolated from maize and soil in Kenya.
2. Materials and Methods
2.1. Morphological Characterization of Aspergillus flavus
Five hundred and fourteen pure cultures of fungal isolates were obtained from the Jomo KenyattaUniversity of Agriculture and Technology in Kenya. They were previously isolated from maize andsoil obtained from maize farms and rural households in the Makueni, Nyeri, Bungoma, and UasinGishu districts of Kenya, as described by Odhiambo et al. [14]. The samples were received as sporesuspensions in 2 mL sterile microfuge tubes. Upon receipt, the isolates were cultivated on Czapeck DoxAgar (CZA), Malt Extract Agar (MEA), Sabouraud Dextrose Agar (SDA), Potato Dextrose Agar (PDA),and Rose Bengal Chloramphenicol Agar (RBCA). Ten microliters of each of the isolate’s sporesuspensions were aseptically inoculated in triplicates at the centre of Petri plates containing each of theculture media. The plates were then incubated at 27 ◦C for seven days in the dark. The key descriptionsof Klich [8] and Clayton [15] were then employed for further verification of their morphologicalcharacteristics. Macroscopic characteristics such as colony growth, colony colour, colony texture, colonyreverse, and the presence of exudates were studied. For microscopic analysis, characteristics such asconidiophores, vesicles, matulae, phialides, and conidia were examined. Riddell’s classic slide culturemethod [16] and a method described by Diba et al. [9] were used for the cultivation of the isolateson the microscopic slides. Once prepared, the slides were then examined under a Motic BA210 BasicBiological Light Microscope (Motic Instruments Inc., Richmond, BC, Canada) using the immersion oil(100×) objective.
2.2. Determination of Aflatoxin-Production Potential of A. flavus
2.2.1. Cultural Screening for Aflatoxin Production
Coconut Agar Medium (CAM), Yeast Extract Sucrose agar (YES) and Yeast Extract CyclodextrinSodium Deoxycholate agar (YCSD) were used to screen for the isolates’ ability to produce aflatoxinsin order to differentiate between the aflatoxin-producing and non-producing isolates. YES, YCSD,and CAM were prepared in glass Petri dishes, as described by Davis et al. [17], Fente et al. [18],

Agriculture 2017, 7, 80 3 of 14
and Davis et al. [19], respectively. Ten microliters of each of the isolate’s spore suspension wasaseptically inoculated in triplicates at the centre of Petri plates containing each of these media.The plates were then incubated at 27 ◦C for seven days in the dark. Following incubation, the plateswere then observed under UV light (365 nm) in the dark for fluorescence screening of aflatoxins,and the results were recorded.
2.2.2. Aflatoxin Extraction and Thin Layer Chromatography
After fluorescence screening for aflatoxin production on YES, YCSD, and CAM, the wholecontent of each Petri dish (agar, mycelia, and spores) was cut into pieces and aflatoxin extractionwas performed following the methods described by Younis and Malik [20] and Ramesh et al. [21].Then, 5 µL of the aflatoxin extracts were spotted on thin-layer chromatography silica gel 60 F254
plates (Merck, Darmstadt, Germany). The plates were developed in mobile phase consisting ofchloroform: acetone solution (85:15) for 60 min. They were then left to air dry for 5 min and visualizedunder long wavelength ultraviolet (UV) light (365 nm) for the presence of blue (AFB1 and AFB2)and green (AFG1 and AFG2) fluorescent spots. The retardation factor (Rf) values were calculated andcompared to the Rf values of the aflatoxin standards previously obtained by Younis and Malik [20].One morphologically characterized Penicillium sp. was used as a negative control in the experiment.
3. Results
3.1. Identification of Aspergillus flavus Isolates
Forty-three A. flavus isolates were identified from the fungal cultures previously isolated frommaize kernels and soil in Kenya. They were identified through the examination of their morphologicalfeatures as per the key descriptions recommended by Klich [8] and Clayton [15]. The percentagedetections of the isolates in Makueni, Uasin Gishu, Bungoma, and Nyeri were 63%, 21%, 11%,and 5%, respectively.
3.2. Phenotypic Characterization of the Aspergillus flavus Isolates
3.2.1. Macroscopic Characteristics of the Isolates on PDA
The colony morphology of A. flavus on the different culture media is shown in Figure 1.
Agriculture 2017, 7, 80 3 of 14
suspension was aseptically inoculated in triplicates at the centre of Petri plates containing each of these media. The plates were then incubated at 27 °C for seven days in the dark. Following incubation, the plates were then observed under UV light (365 nm) in the dark for fluorescence screening of aflatoxins, and the results were recorded.
2.2.2. Aflatoxin Extraction and Thin Layer Chromatography
After fluorescence screening for aflatoxin production on YES, YCSD, and CAM, the whole content of each Petri dish (agar, mycelia, and spores) was cut into pieces and aflatoxin extraction was performed following the methods described by Younis and Malik [20] and Ramesh et al. [21]. Then, 5 µL of the aflatoxin extracts were spotted on thin-layer chromatography silica gel 60 F254 plates (Merck, Darmstadt, Germany). The plates were developed in mobile phase consisting of chloroform: acetone solution (85:15) for 60 min. They were then left to air dry for 5 min and visualized under long wavelength ultraviolet (UV) light (365 nm) for the presence of blue (AFB1 and AFB2) and green (AFG1 and AFG2) fluorescent spots. The retardation factor (Rf) values were calculated and compared to the Rf values of the aflatoxin standards previously obtained by Younis and Malik [20]. One morphologically characterized Penicillium sp. was used as a negative control in the experiment.
3. Results
3.1. Identification of Aspergillus flavus Isolates
Forty-three A. flavus isolates were identified from the fungal cultures previously isolated from maize kernels and soil in Kenya. They were identified through the examination of their morphological features as per the key descriptions recommended by Klich [8] and Clayton [15]. The percentage detections of the isolates in Makueni, Uasin Gishu, Bungoma, and Nyeri were 63%, 21%, 11%, and 5%, respectively.
3.2. Phenotypic Characterization of the Aspergillus flavus Isolates
3.2.1. Macroscopic Characteristics of the Isolates on PDA
The colony morphology of A. flavus on the different culture media is shown in Figure 1.
(A) (B)
(C) (D)
Figure 1. Cont.

Agriculture 2017, 7, 80 4 of 14Agriculture 2017, 7, 80 4 of 14
(E)
Figure 1. Colony morphology of isolate EM1811 on (A) Potato Dextrose Agar (PDA); (B) Sabouraud Dextrose Agar (SDA); (C) Rose Bengal Chloramphenicol Agar (RBCA); (D) Malt Extract Agar (MEA); and (E) Czapeck Dox Agar (CZA).
Figure 1A gives a representation of the colony characteristics of A. flavus on PDA. Initially, the isolates acquired the white colour of the mycelia. After three days, the isolates produced olive and dark green conidia, which then dominated colony appearance. They were commonly plain and flat at the edges but were raised in the centre and wrinkled in an almost cerebriform pattern. All the isolates produced exudates (droplets of liquid), which were either uncoloured or brown. The sclerotia, which are the compact mass of hardened fungal mycelia, were produced in 16 isolates and were deep brown in color. The colonies were encircled by a white border, and the colony diameter ranged between 65 and 75 mm. The undersides of the colonies were slightly pale.
3.2.2. Macroscopic Characteristics of the Isolates on SDA
The colonies on SDA (Figure 1B) were initially white and had a soft velvety surface. After four days of growth, the colonies became raised and turned floccose at the centre, with some isolates deeply floccose. During sporulation, the colonies produced yellowish-green and olive conidia. The conidia covered the entire surface of the colonies except for the edges, where a white border was produced. The white border then disappeared as the colonies became larger and produced more conidia. Sclerotia were produced and were initially white and turned deep brown on the sixth day of incubation. No exudates were produced. The reverse sides of the colonies were furrowed and slightly pale brown. The colony diameter on SDA ranged between 55 and 75 mm.
3.2.3. Macroscopic Characteristics of the Isolates on RBCA
On RBCA (Figure 1C), the isolates first produced white floccose mycelia, which were smooth and raised. They then produced dull yellow conidia, which turned olive and dark green after six days. No sclerotia were produced. Exudates were produced and appeared as tiny uncoloured liquid droplets embedded within the mycelia. The isolates did not produce any soluble pigments, and the reverse sides of the colonies on RBCA were uncoloured. The diameter of the colonies ranged between 50 and 70 mm.
3.2.4. Macroscopic Characteristics of the Isolates on MEA
Cultivation of the isolates on MEA resulted in colonies that had variable shapes and sizes (Figure 1D). Colony growth started with the production of smooth white mycelia. During sporulation, the isolates produced olive and dark green conidia. Sclerotia were produced in nine isolates and were white and deep brown. The isolates also produced uncoloured exudates, which were especially visible at the centre of the colonies. No soluble pigments were produced, and the undersides of the colonies were pale or light brown.
Figure 1. Colony morphology of isolate EM1811 on (A) Potato Dextrose Agar (PDA); (B) SabouraudDextrose Agar (SDA); (C) Rose Bengal Chloramphenicol Agar (RBCA); (D) Malt Extract Agar (MEA);and (E) Czapeck Dox Agar (CZA).
Figure 1A gives a representation of the colony characteristics of A. flavus on PDA. Initially,the isolates acquired the white colour of the mycelia. After three days, the isolates produced oliveand dark green conidia, which then dominated colony appearance. They were commonly plain andflat at the edges but were raised in the centre and wrinkled in an almost cerebriform pattern. All theisolates produced exudates (droplets of liquid), which were either uncoloured or brown. The sclerotia,which are the compact mass of hardened fungal mycelia, were produced in 16 isolates and weredeep brown in color. The colonies were encircled by a white border, and the colony diameter rangedbetween 65 and 75 mm. The undersides of the colonies were slightly pale.
3.2.2. Macroscopic Characteristics of the Isolates on SDA
The colonies on SDA (Figure 1B) were initially white and had a soft velvety surface. After fourdays of growth, the colonies became raised and turned floccose at the centre, with some isolatesdeeply floccose. During sporulation, the colonies produced yellowish-green and olive conidia.The conidia covered the entire surface of the colonies except for the edges, where a white borderwas produced. The white border then disappeared as the colonies became larger and produced moreconidia. Sclerotia were produced and were initially white and turned deep brown on the sixth day ofincubation. No exudates were produced. The reverse sides of the colonies were furrowed and slightlypale brown. The colony diameter on SDA ranged between 55 and 75 mm.
3.2.3. Macroscopic Characteristics of the Isolates on RBCA
On RBCA (Figure 1C), the isolates first produced white floccose mycelia, which were smoothand raised. They then produced dull yellow conidia, which turned olive and dark green after six days.No sclerotia were produced. Exudates were produced and appeared as tiny uncoloured liquid dropletsembedded within the mycelia. The isolates did not produce any soluble pigments, and the reverse sidesof the colonies on RBCA were uncoloured. The diameter of the colonies ranged between 50 and 70 mm.
3.2.4. Macroscopic Characteristics of the Isolates on MEA
Cultivation of the isolates on MEA resulted in colonies that had variable shapes and sizes(Figure 1D). Colony growth started with the production of smooth white mycelia. During sporulation,the isolates produced olive and dark green conidia. Sclerotia were produced in nine isolates and werewhite and deep brown. The isolates also produced uncoloured exudates, which were especially visibleat the centre of the colonies. No soluble pigments were produced, and the undersides of the colonieswere pale or light brown.

Agriculture 2017, 7, 80 5 of 14
3.2.5. Macroscopic Characteristics of the Isolates on CZA
When cultivated on CZA, the isolates produced white mycelia, which were flat and inconspicuous(Figure 1E). The isolates produced very few conidia, which were dull yellow and olive. After sporulation,some isolates produced large raised tufted wool of white mycelia. The colonies of all isolates appeareddry, and exudates and sclerotia were not produced. No soluble pigments were observed, and theundersides of the colonies were uncoloured.
3.3. Microscopic Characteristics of the A. flavus Isolates
To ascertain their precise identification, the microscopic characteristics (conidiophores, vesicles,metulae, phialides, and conidia) of these isolates were also examined (Figure 2).
Agriculture 2017, 7, 80 5 of 14
3.2.5. Macroscopic Characteristics of the Isolates on CZA
When cultivated on CZA, the isolates produced white mycelia, which were flat and inconspicuous (Figure 1E). The isolates produced very few conidia, which were dull yellow and olive. After sporulation, some isolates produced large raised tufted wool of white mycelia. The colonies of all isolates appeared dry, and exudates and sclerotia were not produced. No soluble pigments were observed, and the undersides of the colonies were uncoloured.
3.3. Microscopic Characteristics of the A. flavus Isolates
To ascertain their precise identification, the microscopic characteristics (conidiophores, vesicles, metulae, phialides, and conidia) of these isolates were also examined (Figure 2).
(A) (B)
(C) (D)
(E)
Figure 2. Microscopic characteristics of A. flavus isolates (A) EM167; (B–D) EM184; and (E) EM213 under the 100× objective of the Motic BA210 Basic Biological Light Microscope.
The conidiophores were uncoloured, thick walled, and coarsely roughened or pitted and were vesicle bearing. Their diameter ranged between 800 and 1200 µm. The vesicles were subglobose in some isolates and globose in others and were also variable in diameter, ranging between 1800 and 2000 µm. The cells were either uniseriate or biseriate or both. For biseriate cells, the phialides were borne on the metuale, and, in uniseriate cells, they were attached directly to the vesicles. The metulae covered nearly the entire surface of the vesicles and radiated from the vesicles in all directions. The conidia were globose with thin walls, which were slightly roughened and ranged between 250 and 450 µm in diameter.
Figure 2. Microscopic characteristics of A. flavus isolates (A) EM167; (B–D) EM 184; and (E) EM 213under the 100× objective of the Motic BA210 Basic Biological Light Microscope.
The conidiophores were uncoloured, thick walled, and coarsely roughened or pitted and werevesicle bearing. Their diameter ranged between 800 and 1200 µm. The vesicles were subglobose insome isolates and globose in others and were also variable in diameter, ranging between 1800 and 2000µm. The cells were either uniseriate or biseriate or both. For biseriate cells, the phialides were borne onthe metuale, and, in uniseriate cells, they were attached directly to the vesicles. The metulae coverednearly the entire surface of the vesicles and radiated from the vesicles in all directions. The conidiawere globose with thin walls, which were slightly roughened and ranged between 250 and 450 µmin diameter.

Agriculture 2017, 7, 80 6 of 14
3.4. Fluorescence Screening of Aflatoxins
Figure 3 is a representation of the results obtained from the UV fluorescence screening of theA. flavus, showing both fluorescent and non-fluorescent isolates on YES (A and D), YCSD (B and E),and CAM (C and F).
Agriculture 2017, 7, 80 6 of 14
3.4. Fluorescence Screening of Aflatoxins
Figure 3 is a representation of the results obtained from the UV fluorescence screening of the A. flavus, showing both fluorescent and non-fluorescent isolates on YES (A and D), YCSD (B and E), and CAM (C and F).
(A) (B) (C)
(D) (E) (F)
Figure 3. Colonies of aflatoxigenic (fluorescent) and non-aflatoxigenic (non-fluorescent) strains of A. flavus observed under UV light (365 nm) after seven days of growth on (A,D) Yeast Extract Sucrose agar (YES); (B,E) Yeast Extract Cyclodextrin Sodium Deoxycholate agar (YCSD); and (C,F) Coconut Agar Medium (CAM).
It was found that 10 (23%) of the 43 isolates fluoresced blue on YES, YCSD, and CAM when exposed to UV light (365 nm), indicating their ability to produce aflatoxins. No fluorescence was detected in 33 (77%) isolates, and this implied that they were non-aflatoxigenic.
3.5. Thin-Layer Chromatography Detection of Aflatoxins
The aflatoxin-producing ability of the A. flavus isolates in this study was further analysed using TLC. Using this chromatographic method, it was found that 13 (30%) of the 43 isolates were aflatoxin producers, while the remaining 30 (70%) isolates did not have aflatoxin-production potentials (Table 1). Of these 13 isolates, 10 were isolates that tested positive for aflatoxin production during fluorescence screening on YES, YCSD, and CAM.
The distribution of aflatoxigenic and non-aflatoxigenic A. flavus isolates in four maize-growing districts of Kenya are presented in Figure 4.
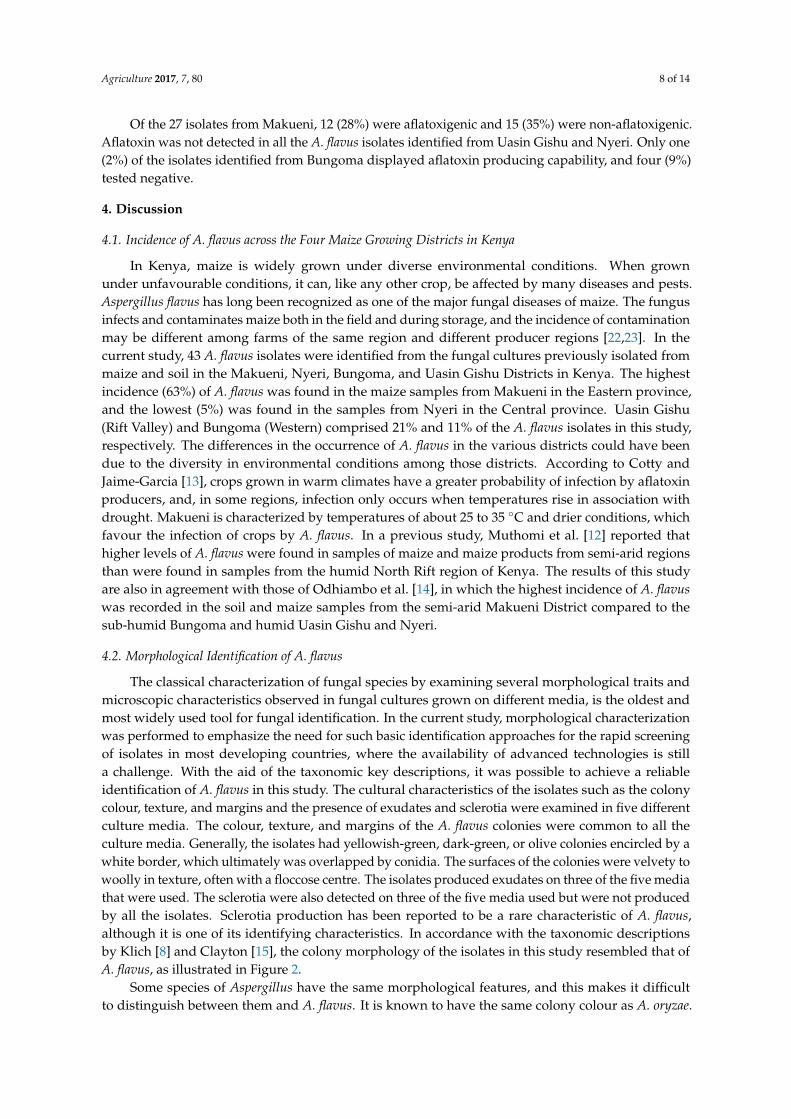
Of the 27 isolates from Makueni, 12 (28%) were aflatoxigenic and 15 (35%) were non-aflatoxigenic. Aflatoxin was not detected in all the A. flavus isolates identified from Uasin Gishu and Nyeri. Only one (2%) of the isolates identified from Bungoma displayed aflatoxin producing capability, and four (9%) tested negative.
Figure 3. Colonies of aflatoxigenic (fluorescent) and non-aflatoxigenic (non-fluorescent) strains ofA. flavus observed under UV light (365 nm) after seven days of growth on (A,D) Yeast Extract Sucroseagar (YES); (B,E) Yeast Extract Cyclodextrin Sodium Deoxycholate agar (YCSD); and (C,F) CoconutAgar Medium (CAM).
It was found that 10 (23%) of the 43 isolates fluoresced blue on YES, YCSD, and CAM whenexposed to UV light (365 nm), indicating their ability to produce aflatoxins. No fluorescence wasdetected in 33 (77%) isolates, and this implied that they were non-aflatoxigenic.
3.5. Thin-Layer Chromatography Detection of Aflatoxins
The aflatoxin-producing ability of the A. flavus isolates in this study was further analysedusing TLC. Using this chromatographic method, it was found that 13 (30%) of the 43 isolates wereaflatoxin producers, while the remaining 30 (70%) isolates did not have aflatoxin-production potentials(Table 1). Of these 13 isolates, 10 were isolates that tested positive for aflatoxin production duringfluorescence screening on YES, YCSD, and CAM.
Table 1. Identification of aflatoxin production through UV fluorescence screening and Thin-Layer Chromatography.
Isolate UV Fluorescence TLC
ID * No. YES YCSD CAM Aflatoxin Rf Value Type
EM 184 1 + + + + 0.60 B1EM 156 2 − − − − n/a n/aEM 323 3 − − − + 0.60 B1BS 042 4 − − − − n/a n/aNS 102 5 − − − − n/a n/aEM 167 6 − − − + 0.60; 0.55 B1; B2EM 213 7 + + + + 0.60 B1EM 291 8 − − − + 0.60; 0.55 B1; B2EM 214 9 + + + + 0.60; 0.50 B1; G1EM 232 10 + + + + 0.60; 0.50 B1; G1EM 257 11 + + + + 0.60; 0.50 B1; G1

Agriculture 2017, 7, 80 7 of 14
Table 1. Cont.
Isolate UV Fluorescence TLC
ID * No. YES YCSD CAM Aflatoxin Rf Value Type
EM 189 12 − − − − n/a n/aEM 262 13 − − − − n/a n/aEM 1811 14 − − − − n/a n/aEM 141 15 − − − − n/a n/aEM 014 16 − − − − n/a n/aEM 112 17 − − − − n/a n/aEM 164 18 − − − − n/a n/aEM 301 19 − − − − n/a n/aEM 256 20 − − − − n/a n/aEM 226 21 − − − − n/a n/aEM 165 22 + + + + 0.60; 0.50 B1; G1EM 263 23 − − − − n/a n/aEM 324 24 − − − − n/a n/aBM 092 25 − − − − n/a n/aRM 187 26 − − − − n/a n/aEM 251 27 − − − − n/a n/aBS 033 28 − − − − n/a n/aEM 126 29 + + + + 0.60; 0.50 B1; G1RS 022 30 − − − − n/a n/aBS 116 31 + + + + 0.60; 0.55 B1; B2EM 181 32 + + + + 0.60 B1BS 142 33 − − − − n/a n/aRS 174 34 − − − − n/a n/aBS 023 35 − − − − n/a n/aRS 043 36 − − − − n/a n/aRS 061 37 − − − − n/a n/aNS 182 38 − − − − n/a n/aRS 013 39 − − − − n/a n/aRS 063 40 − − − − n/a n/aEM 223 41 + + + + 0.60 B1EM 265 42 − − − − n/a n/aRS 114 43 − − − − n/a n/a
RS 062 ** 44 − − − − n/a n/a
* Sample types: M = Maize and S = Soil; Sampling site: E = Eastern (Makueni), R = Rift Valley (Uasin Gishu),B = Bungoma, and N = Nyeri. ** Negative control.
The distribution of aflatoxigenic and non-aflatoxigenic A. flavus isolates in four maize-growingdistricts of Kenya are presented in Figure 4.Agriculture 2017, 7, 80 8 of 14
Figure 4. The occurrence of A. flavus and the distribution of aflatoxin production in four maize-growing districts in Kenya.
4. Discussion
4.1. Incidence of A. flavus across the Four Maize Growing Districts in Kenya
In Kenya, maize is widely grown under diverse environmental conditions. When grown under unfavourable conditions, it can, like any other crop, be affected by many diseases and pests. Aspergillus flavus has long been recognized as one of the major fungal diseases of maize. The fungus infects and contaminates maize both in the field and during storage, and the incidence of contamination may be different among farms of the same region and different producer regions [22,23]. In the current study, 43 A. flavus isolates were identified from the fungal cultures previously isolated from maize and soil in the Makueni, Nyeri, Bungoma, and Uasin Gishu Districts in Kenya. The highest incidence (63%) of A. flavus was found in the maize samples from Makueni in the Eastern province, and the lowest (5%) was found in the samples from Nyeri in the Central province. Uasin Gishu (Rift Valley) and Bungoma (Western) comprised 21% and 11% of the A. flavus isolates in this study, respectively. The differences in the occurrence of A. flavus in the various districts could have been due to the diversity in environmental conditions among those districts. According to Cotty and Jaime-Garcia [13], crops grown in warm climates have a greater probability of infection by aflatoxin producers, and, in some regions, infection only occurs when temperatures rise in association with drought. Makueni is characterized by temperatures of about 25 to 35 °C and drier conditions, which favour the infection of crops by A. flavus. In a previous study, Muthomi et al. [12] reported that higher levels of A. flavus were found in samples of maize and maize products from semi-arid regions than were found in samples from the humid North Rift region of Kenya. The results of this study are also in agreement with those of Odhiambo et al. [14], in which the highest incidence of A. flavus was recorded in the soil and maize samples from the semi-arid Makueni District compared to the sub-humid Bungoma and humid Uasin Gishu and Nyeri.
4.2. Morphological Identification of A. flavus
The classical characterization of fungal species by examining several morphological traits and microscopic characteristics observed in fungal cultures grown on different media, is the oldest and most widely used tool for fungal identification. In the current study, morphological characterization was performed to emphasize the need for such basic identification approaches for the rapid
2763%
921%
511%
25%
1228%
00%
12%
00%
1535%
921% 4
9%2
5%0%
10%
20%
30%
40%
50%
60%
70%
Makueni Uasin Gishu Bungoma Nyeri
Perc
enta
ge o
f iso
late
s
Districts
Total Aflatoxigenic Non-aflatoxigenic
Figure 4. The occurrence of A. flavus and the distribution of aflatoxin production in four maize-growingdistricts in Kenya.
Agriculture 2017, 7, 80 8 of 14
Of the 27 isolates from Makueni, 12 (28%) were aflatoxigenic and 15 (35%) were non-aflatoxigenic.Aflatoxin was not detected in all the A. flavus isolates identified from Uasin Gishu and Nyeri. Only one(2%) of the isolates identified from Bungoma displayed aflatoxin producing capability, and four (9%)tested negative.
4. Discussion
4.1. Incidence of A. flavus across the Four Maize Growing Districts in Kenya
In Kenya, maize is widely grown under diverse environmental conditions. When grownunder unfavourable conditions, it can, like any other crop, be affected by many diseases and pests.Aspergillus flavus has long been recognized as one of the major fungal diseases of maize. The fungusinfects and contaminates maize both in the field and during storage, and the incidence of contaminationmay be different among farms of the same region and different producer regions [22,23]. In thecurrent study, 43 A. flavus isolates were identified from the fungal cultures previously isolated frommaize and soil in the Makueni, Nyeri, Bungoma, and Uasin Gishu Districts in Kenya. The highestincidence (63%) of A. flavus was found in the maize samples from Makueni in the Eastern province,and the lowest (5%) was found in the samples from Nyeri in the Central province. Uasin Gishu(Rift Valley) and Bungoma (Western) comprised 21% and 11% of the A. flavus isolates in this study,respectively. The differences in the occurrence of A. flavus in the various districts could have beendue to the diversity in environmental conditions among those districts. According to Cotty andJaime-Garcia [13], crops grown in warm climates have a greater probability of infection by aflatoxinproducers, and, in some regions, infection only occurs when temperatures rise in association withdrought. Makueni is characterized by temperatures of about 25 to 35 ◦C and drier conditions, whichfavour the infection of crops by A. flavus. In a previous study, Muthomi et al. [12] reported thathigher levels of A. flavus were found in samples of maize and maize products from semi-arid regionsthan were found in samples from the humid North Rift region of Kenya. The results of this studyare also in agreement with those of Odhiambo et al. [14], in which the highest incidence of A. flavuswas recorded in the soil and maize samples from the semi-arid Makueni District compared to thesub-humid Bungoma and humid Uasin Gishu and Nyeri.
4.2. Morphological Identification of A. flavus
The classical characterization of fungal species by examining several morphological traits andmicroscopic characteristics observed in fungal cultures grown on different media, is the oldest andmost widely used tool for fungal identification. In the current study, morphological characterizationwas performed to emphasize the need for such basic identification approaches for the rapid screeningof isolates in most developing countries, where the availability of advanced technologies is stilla challenge. With the aid of the taxonomic key descriptions, it was possible to achieve a reliableidentification of A. flavus in this study. The cultural characteristics of the isolates such as the colonycolour, texture, and margins and the presence of exudates and sclerotia were examined in five differentculture media. The colour, texture, and margins of the A. flavus colonies were common to all theculture media. Generally, the isolates had yellowish-green, dark-green, or olive colonies encircled by awhite border, which ultimately was overlapped by conidia. The surfaces of the colonies were velvety towoolly in texture, often with a floccose centre. The isolates produced exudates on three of the five mediathat were used. The sclerotia were also detected on three of the five media used but were not producedby all the isolates. Sclerotia production has been reported to be a rare characteristic of A. flavus,although it is one of its identifying characteristics. In accordance with the taxonomic descriptionsby Klich [8] and Clayton [15], the colony morphology of the isolates in this study resembled that ofA. flavus, as illustrated in Figure 2.
Some species of Aspergillus have the same morphological features, and this makes it difficultto distinguish between them and A. flavus. It is known to have the same colony colour as A. oryzae.

Agriculture 2017, 7, 80 9 of 14
This renders the need for comprehensive scrutiny using microscopic and macroscopic characteristics forcorrect identification and classification. However, there is a consensus that, even microscopically, somecharacteristics are common amongst the Aspergillus isolates. The characteristics of the conidiophores,vesicles, sterigmata, and conidia were evaluated in this study. The peculiar characteristics for A. flavuswere the globose vesicles with radiate sterigmata and rough conidiophore walls. Another importantdiagnostic feature was the relatively thin walls of the globose conidia, which were fine to moderatelyrough. These characteristics, shown in Figure 1, and the macroscopic characteristics, were in harmonywith the A. flavus characteristics previously described [6,9].
In this study, the use of RBCA, CZA, PDA, MEA, and SDA provided adequate growth andsporulation, which allowed sufficient assessment of the macroscopic and microscopic characteristics ofthe fungal isolates. Using these growth media, A. flavus isolates were successfully identified. A reviewof the literature reveals that these and other differential growth media have primarily been employedfor the morphological characterization and identification of Aspergillus species. Aspergillus specieswere identified from maize kernels through their morphological characterization on CZA, MEA,and PDA [24]. Using CZA and MEA, Reddy et al. [25] identified and distinguished five Aspergillusspecies isolated from rice grains in South Asia. Similarly, species of the Aspergillus section Flavi isolatedfrom maize in North-eastern China were identified following the assessment of their macroscopic andmicroscopic characteristics on CZA and MEA [26]. Diba et al. [9] successfully identified Aspergillusspecies from environmental and clinical specimens by examining their morphological characteristicsand reported that the use of potato dextrose, malt extract, or similar sporulation agars as primaryisolation media for Aspergillus might accelerate the growth rate and the production of conidia.Morphological methods were employed for the identification of Aspergillus species from the soils ofthe Fars and Kerman provinces of Iran [27] and the soil of the Larkana district in Pakistan [28].
Aspergillus flavus has been divided into two strains based on the size of sclerotia; the L strain,which produces large sclerotia, and the S strain, which produces small sclerotia. The correlationbetween sclerotial production/size and aflatoxigenicity has been studied, and published dataare contradictory. While Cotty [29] reported a direct correlation between high aflatoxin production andthe presence of small sclerotia, Abbas et al. [30] found that the highest levels of aflatoxins were producedin isolates with large sclerotia. Some studies found no correlation between sclerotial production/sizeand aflatoxigenicity [31,32]. In this study, the size of sclerotia was not determined and aflatoxins werenot quantified, and, as a result, no correlation was made between aflatoxigenicity and sclerotial type.Notwithstanding, in Kenya, the S strain is reportedly more prevalent than the L strain and hasbeen associated with the repeated outbreaks of severe maize contamination and deaths in humanpopulations, especially in Eastern Kenya [13,33,34].
4.3. Discrimination between Aflatoxin-Producing and Non-Producing Isolates and Identification of Aflatoxins
The screening for aflatoxin production was carried out based on the fluorescence of positivecolonies upon exposure to UV radiation at 365 nm. When exposed to UV light, aflatoxin-producingisolates exhibited a blue fluorescence on the undersides of the colonies, whereas the non-producingisolates did not produce any fluorescence (Figure 3). Using YES, YSCD, and CAM, it was possible todiscriminate between aflatoxin-producing and non-aflatoxin-producing A. flavus isolates in this study.These culture media showed similar patterns in terms of the total number of colonies showingfluorescence upon exposure to UV radiation. Fluorescence was detected in 10 of the 43 isolates understudy, indicating aflatoxin-producing potential.
In many developing countries, where the determination of aflatoxin production could be impededby the lack of advanced discriminative tools, culture-dependent approaches could be useful for therapid screening of isolates. Inexpensive and relatively simple as they are, however, cultural methodsfor aflatoxin detection have been reported to be less sensitive and are commonly used in conjunctionwith chromatographic methods [35]. In this study, TLC was used for the confirmation of aflatoxinproduction by the isolates and the identification of the aflatoxins. TLC is one of the most widely

Agriculture 2017, 7, 80 10 of 14
used separation techniques in aflatoxin analysis. The aflatoxins are well suited for analysis by TLCsince most of the compounds fluoresce strongly under long-wave UV light [36]. With TLC, aflatoxin,observed under UV light as blue fluorescent spots on the developed silica gel plates, was detected in13 (30%) of the 43 A. flavus isolates in this study. Of these 13 aflatoxigenic isolates, ten tested positivefor aflatoxin production during UV fluorescence screening on YES, YSCD, and CAM. Althoughisolates EM323, EM167, and EM291 tested negative for aflatoxin production during UV fluorescencescreening, they were found to produce aflatoxin when analysed with TLC. This suggests that theseisolates did not produce a high enough amount of aflatoxin to be detected by fluorescence screening.This suggestion is based on the findings by Abbas et al. [37], who, when comparing cultural andanalytical methods, discovered that cultural methods are generally not as sensitive as chromatographicmethods. Abbas et al. [37] reported that TLC could detect an aflatoxin concentration as low as 2.5 ng/g,while, with fluorescence, aflatoxin can only be detected in cultures capable of producing greater than61 ng/g. According to Afsah-Hejri et al. [38], it has repeatedly been reported that the results from theUV fluorescence screening on media do not always correspond to the results of aflatoxin detectionby chromatography.
Studies conducted in the United States revealed that all members of A. flavus lack the abilityto produce G aflatoxins due to some deletion in the aflatoxin biosynthesis gene cluster [39].However, in Africa, an unnamed taxon (called strain SBG) capable of producing both B and G aflatoxinsexists and is morphologically similar to but phylogenetically divergent from the B aflatoxin-producingA. flavus S strains [40]. This taxon was commonly implicated in contamination events in West Africa [40],but no literature exists that associates the taxon with the contamination events in East Africa. Inthis study, three aflatoxin types, AFB1, AFB2, and AFG1, were identified with TLC. Isolates EM 184,EM 323, EM 213, EM 181, and EM 223 produced only AFB1, while isolates EM 267, EM291, andBS116 and isolates EM 124, EM 232, EM 257, EM 165 produced AFB2 and AFG1 in addition to AFB1,respectively (Table 1). According to Probst et al. [41], the maize growing regions in several districts ofthe Eastern Province of Kenya are dominated by the AFB1-producing A. flavus S strain. It is reportedthat this strain, although phylogenetically distinct from the USA and Asian A. flavus S strains andmore closely related to the West African B and G aflatoxin-producing taxon, is incapable of producingG aflatoxins. According to Okun et al. [42], DNA-based phylogenies revealed strain SBG to be adistinct species, ancestral to both A. flavus and A. parasiticus. It is possible that this taxon is extant inthe soils of the Eastern Kenya. Further research is necessary to confirm this hypothesis.
Notwithstanding the positive results obtained in the current study, some drawbacks wereencountered during the identification of aflatoxins on TLC. When identifying aflatoxins on TLC,the Rf values of the samples are normally compared, with the Rf values of the aflatoxin standardbeing prepared with the same solvent used for the sample extract and developed side by side on oneTLC plate. However, in this study, due to the unavailability of standards, the Rf values of the sampleswere compared to the Rf values of the standards reported by Younis and Malik [20]. In this study, the Rfvalues of AFB1, AFB2, and AFG1 were 0.60, 0.55, and 0.50, respectively, while Younis and Malik [20]obtained 0.55 for AFB1, 0.50 for AFB2, and 0.45 for AFG1. It has been reported that, when similarcompounds are extracted using the same extraction method and developed on TLC using the samestationary and mobile phase, they are likely to have the same Rf values [43]. The difference in theRf values could be because the aflatoxin extracts in the current study were not further purified andconcentrated before being developed on TLC.
It should be noted, however, that, although the methods used in the current study couldidentify the aflatoxin-producing potential of the isolates, they are not sensitive enough for the detailidentification and quantification of the toxins and therefore should be used more specifically forinitial screening. For accurate quantification of the aflatoxins produced, a more sensitive and reliablemethod like high-performance liquid chromatography with fluorescence detection (HPLC-FLD) will beneeded [44]. Similarly, although it has been reported that some strains of A. flavus could produce bothB and G aflatoxins [45], recent classifications of Aspergillus section Flavi have noted that such strains,

Agriculture 2017, 7, 80 11 of 14
though morphologically similar to A. flavus, were completely novel species [46,47]. These findingspoint to the fact that advanced molecular techniques are needed to characterize the various Aspergillusspp. conclusively.
4.4. Distribution of Aflatoxin Production across the Selected Districts
Aflatoxin was detected in 28% of the isolates from Makueni and in only 2% of the isolates fromBungoma and was not detected in the isolates from Nyeri and Uasin Gishu (Figure 4). These findingssuggest that the inocula of the aflatoxin-producing A. flavus are more prevalent in Eastern Kenya andthat the conditions in the semi-arid region of the Eastern Province are more conducive for aflatoxinformation than the conditions in the humid regions of the Central, Rift Valley, and Western Provinces.These findings are corroborated by the fact that the Eastern Province of Kenya has experienced severaloutbreaks of acute aflatoxicosis since 1978, and, according to the literature, the recent and most severeoutbreak was caused by A. flavus communities with the highest aflatoxin-producing potential everreported [34].
No aflatoxin was detected in the samples from the Central and Rift Valley Provinces in this study.However, this does not indicate that the toxigenic strains of A. flavus are not present in theseprovinces. In the Central Province, aflatoxicosis outbreaks have previously been reported in Thika,a district adjacent to the ‘aflatoxin hotspot’ districts of the Eastern Province [48]. Toxigenic strainsof A. flavus have also been detected previously in maize samples from the Rift Valley Province [49].Aspergillus flavus has multiple strains that differ in their aflatoxin-producing capacity. Therefore, maizein different regions may become contaminated with different strains, resulting in different aflatoxincontamination frequencies.
5. Conclusions
In conclusion, the culture media and the taxonomic keys used in this study allowed for the preciseand reliable identification of A. flavus. The macroscopic and microscopic characteristics were like thosedescribed in published research. The use of UV fluorescence screening and TLC for the detection andidentification of aflatoxins provides a quick and reliable means to distinguish between the aflatoxigenicand non-aflatoxigenic strains of A. flavus. The relatively low proportion of aflatoxin-producing isolatesobtained in the current study, compared to other studies, could be due to the sensitivity of themethods used, and this could result in the underestimation of the actual population of aflatoxigenicspecies in a given area. Nevertheless, given the high toxicity of the aflatoxins, especially AFB1,the study showed that traditional methods could be used for earlier detection of Aspergilli in crops,especially in less economically developed African countries, where advanced techniques are notreadily available or accessible. The high incidences of A. flavus and aflatoxins in maize from Makueniin this study support the many reports of the prevalence of the highly toxic strains of A. flavus inEastern Kenya. This further reinforces the need for measures to prevent the fungal contamination ofmaize and emphasises the paramount importance of field interventions aimed at curbing agriculturalsoil contamination by these fungi.
Acknowledgments: The authors would like to thank Hubs and Spokes, the National Research Foundation (NRF),and the Vaal University of Technology (VUT) for financial support in the form of a scholarship. We also thank theVUT for providing the necessary laboratory space and equipment for carrying out the study. However, the opinionsexpressed and the conclusions arrived at are those of the authors and are not necessarily to be attributed to Hubsand Spokes, the NRF, or the VUT.
Author Contributions: M.G.T. and H.M. were involved in the laboratory work. All the authors contributedequally to the writing of this paper.
Conflicts of Interest: The authors declare that they have no conflicts of interest.

Agriculture 2017, 7, 80 12 of 14
References
1. Abbas, H.; Wilkinson, J.; Zablotowicz, R.; Accinelli, C.; Abel, C.; Bruns, H.; Weaver, M. Ecology of Aspergillusflavus, regulation of aflatoxin production, and management strategies to reduce aflatoxin contaminationof corn. Toxin Rev. 2009, 28, 142–153. [CrossRef]
2. Amaike, S.; Keller, N.P. Aspergillus flavus. Annu. Rev. Phytopathol. 2011, 49, 107–133. [CrossRef] [PubMed]3. Hell, K.; Mutegi, C. Aflatoxin control and prevention strategies in key crops of Sub-Saharan Africa. Afr. J.
Microbiol. Res. 2011, 5, 459–466.4. Yu, J. Current understanding on aflatoxin biosynthesis and future perspective in reducing aflatoxin contamination.
Toxins 2012, 4, 1024–1057. [CrossRef] [PubMed]5. Klueken, A.; Borgemeister, C.; Hau, B. Field release of a non-toxigenic Aspergillus flavus L strain in Central Benin.
J. Plant Dis. Prot. 2009, 116, 17–22. [CrossRef]6. Rodrigues, P.; Soares, C.; Kozakiewicz, Z.; Paterson, R.R.M.; Lima, N. Identification and characterization
of Aspergillus flavus and aflatoxins. In Communicating Current Research and Educational Topics and Trends inApplied MIcrobiology; Méndez-Vilas, A., Ed.; FORMATEX: Badajoz, Spain, 2007; pp. 527–534.
7. Cardwell, K.F.; Cotty, P.J. Distribution of Aspergillus section Flavi among field soils from the fouragroecological zones of the Republic of Bénin, West Africa. Plant Dis. 2002, 86, 434–439. [CrossRef]
8. Klich, M.A. Identification of Common Aspergillus Species; Centraalbureau voor Schimmelcultures: Utrecht,The Netherlands, 2002; pp. 426–432.
9. Diba, K.; Rezaie, S.; Mahmoudi, M.; Kordbacheh, P.; Diba, C.K. Identification of Aspergillus species usingmorphological characteristics. Pak. J. Med. Sci. 2007, 23, 867–872.
10. Yu, J.; Bhatnagar, D.; Ehrlich, K.C. Aflatoxin biosynthesis. Rev. Iberoam. Micol. 2002, 19, 191–200. [PubMed]11. Cotty, P.J.; Mellon, J.E. Ecology of aflatoxin-producing fungi and biocontrol of aflatoxin contamination.
Mycotoxin Res. 2006, 22, 110–117. [CrossRef] [PubMed]12. Muthomi, J.; Mureithi, B.; Chemining’wa, G.; Gathumbi, J.; Mutit, E. Aspergillus species and Aflatoxin b1 in
soil, maize grain and flour samples from semi-arid and humid regions of Kenya. Int. J. Agric. Sci. 2012, 2,22–34.
13. Probst, C.; Njapau, H.; Cotty, P.J. Outbreak of an acute aflatoxicosis in Kenya in 2004: Identification of thecausal agent. Appl. Environ. Microbiol. 2007, 73, 2762–2764. [CrossRef] [PubMed]
14. Odhiambo, B.O.; Murage, H.; Wagara, I.N. Isolation and characterisation of aflatoxigenic Aspergillus speciesfrom maize and soil samples from selected counties of Kenya. Afr. J. Microbiol. Res. 2013, 7, 4379–4388.
15. Clayton, Y.M. Medically Important Fungi: A Guide to Identification. Proc. R. Soc. Med. 1977, 70, 359.16. Riddell, R.W. Permanent stained mycological preparations obtained by slide culture. Mycologia 1950, 40,
265–270. [CrossRef]17. Davis, N.D.; Diener, U.L.; Eldridge, W. Production of aflatoxins B1 and G1 by Aspergillus flavus in a
semisynthetic medium. Appl. Environ. Microbiol. 1966, 14, 378–380.18. Fente, C.A.; Ordaz, J.J.; Vazquez, B.I.; Franco, C.M.; Cepeda, A. New additive for culture media for rapid
identification of aflatoxin-producing Aspergillus strains. Appl. Environ. Microbiol. 2001, 67, 4858–4862.[CrossRef] [PubMed]
19. Davis, N.; Iyer, S.; Diener, U. Improved method of screening for aflatoxin with a coconut. Appl. Environ. Microbiol.1987, 53, 1593–1595. [PubMed]
20. Younis, Y.M.H.; Malik, K.M. TLC and HPLC assays of aflatoxin contamination in Sudanese peanuts andpeanut products. Kuwait J. Sci. Eng. 2003, 30, 79–94.
21. Ramesh, J.; Sarathchandra, G.; Sureshkumar, V. Analysis of feed samples for aflatoxin B1 contamination byHPTLC: A validated method. Int. J. Curr. Microbiol. Appl. Sci. 2013, 2, 373–377.
22. Da Gloria, M.E. Aflatoxin contamination distribution among grains and nuts. In Aflatoxins–Detection,Measurement and Control; Torres-Pacheco, I., Ed.; InTech: Rijeka, Croatia, 2011; pp. 75–90.
23. Cotty, P.J.; Jaime-Garcia, R. Influences of climate on aflatoxin-producing fungi and aflatoxin contamination.Int. J. Food Microbiol. 2007, 119, 109–115. [CrossRef] [PubMed]
24. Askun, T. Investigation of fungal species of maize kennels. J. Biol. Sci. 2006, 6, 275–281. [CrossRef]25. Reddy, K.R.N.; Abbas, H.K.; Abel, C.A.; Shier, W.T.; Salleh, B. Mycotoxin Contamination of Beverages:
Occurrence of Patulin in Apple Juice and Ochratoxin A in Coffee, Beer and Wine and Their Control Methods.Toxins 2010, 2, 229–261. [CrossRef]

Agriculture 2017, 7, 80 13 of 14
26. Gao, J.; Liu, Z.; Yu, J. Identification of Aspergillus section Flavi in maize in northeastern China. Mycopathologia2007, 164, 91–95. [CrossRef] [PubMed]
27. Mohammadi, A.H.; Banihashemi, Z.; Haghdel, M. Identification and prevalence of Aspergillus species in soilsof fars and Kerman provinces of Iran and evaluation of their aflatoxin production. Rostanilha 2009, 10, 23.
28. Afzal, H.; Shazad, S.; Qamar, S.; Nisa, U. Morphological identification of Aspergillus species from the soil ofLarkana District (Sindh, Pakistan). Asian J. Agric. Biotechnol. 2013, 1, 105–117.
29. Cotty, P.J. Virulence and cultural characteristics of two Aspergillus flavus strains pathogenic on cotton.Phytopathology 1989, 79, 808–814. [CrossRef]
30. Abbas, H.K.; Weaver, M.A.; Zablotowicz, R.M.; Horn, B.W.; Shier, W.T. Relationships between aflatoxinproduction and sclerotia formation among isolates of Aspergillus section Flavi from the Mississippi Delta.Eur. J. Plant Pathol. 2005, 112, 283–287. [CrossRef]
31. Giorni, P.; Magan, N.; Pietri, A.; Bertuzzi, T.; Battilani, P. Studies on Aspergillus section Flavi isolated frommaize in northern Italy. Int. J. Food Microbiol. 2007, 113, 330–338. [CrossRef] [PubMed]
32. Baquião, A.C.; De Oliveira, M.M.M.; Reis, T.A.; Zorzete, P.; Diniz Atayde, D.; Correa, B. Polyphasic approachto the identification of Aspergillus section Flavi isolated from Brazil nuts. Food Chem. 2013, 139, 1127–1132.
33. Probst, C.; Schulthess, F.; Cotty, P.J. Impact of Aspergillus section Flavi community structure on thedevelopment of lethal levels of aflatoxins in Kenyan maize ( Zea mays ). J. Appl. Microbiol. 2010, 108,600–610. [CrossRef] [PubMed]
34. Probst, C.; Bandyopadhyay, R.; Price, L.E.; Cotty, P.J. Identification of atoxigenic Aspergillus flavus isolates toreduce aflatoxin contamination of maize in Kenya. Plant Dis. 2011, 95, 212–218. [CrossRef]
35. Abbas, H.K.; Shier, W.T.; Horn, B.W.; Weaver, M.A. Cultural methods for aflatoxin detection. J. Toxicol.Toxin Rev. 2004, 23, 295–315. [CrossRef]
36. Wacoo, A.P.; Wendiro, D.; Vuzi, P.C.; Hawumba, J.F. Methods for detection of aflatoxins in agriculturalfood crops. J. Appl. Chem. 2014, 2014, 1–15. [CrossRef]
37. Abbas, H.K.; Zablotowicz, R.M.; Weaver, M.A.; Horn, B.W.; Xie, W.; Shier, W.T. Comparison of culturaland analytical methods for determination of aflatoxin production by Mississippi Delta Aspergillus isolates.Can. J. Microbiol. 2004, 50, 193–199. [CrossRef] [PubMed]
38. Afsah-Hejri, L.; Jinap, S.; Radu, S. Occurrence of aflatoxins and aflatoxigenic Aspergillus in peanuts. J. FoodAgric. Environ. 2013, 11, 228–234.
39. Ehrlich, K.C.; Chang, P.-K.; Yu, J.; Cotty, P.J. Aflatoxin biosynthesis cluster gene cypA is required for Gaflatoxin formation. Appl. Environ. Microbiol. 2004, 70, 6518–6524. [CrossRef] [PubMed]
40. Atehnkeng, J.; Ojiambo, P.S.; Donner, M.; Ikotun, T.; Sikora, R.A.; Cotty, P.J.; Bandyopadhyay, R. Distributionand toxigenicity of Aspergillus species isolated from maize kernels from three agro-ecological zones inNigeria. Int. J. Food Microbiol. 2008, 122, 74–84. [CrossRef] [PubMed]
41. Probst, C.; Callicott, K.A.; Cotty, P.J. Deadly strains of Kenyan Aspergillus are distinct from otheraflatoxin producers. Eur. J. Plant Pathol. 2012, 132, 419–429. [CrossRef]
42. Okun, D.O.; Khamis, F.M.; Muluvi, G.M.; Ngeranwa, J.J.; Ombura, F.O.; Yongo, M.O.; Kenya, E.U.Distribution of indigenous strains of atoxigenic and toxigenic Aspergillus flavus and Aspergillus parasiticus inmaize and peanuts agro-ecological zones of Kenya. Agric. Food Secur. 2015, 4, 14. [CrossRef]
43. Hussain, I. Aflatoxin Measurement and Analysis. In Aflatoxins–Detection, Measurement and Control;Torres-Pacheco, I., Ed.; InTech: Rijeka, Croatia, 2011; pp. 183–203.
44. Di Stefano, V.; Pitonzo, R.; Avellone, G.; Di Fiore, A.; Monte, L.; Ogorka, A.Z.T. Determination of aflatoxinsand ochratoxins in Sicilian sweet wines by high-performance liquid chromatography with fluorometricdetection and immunoaffinity cleanup. Food Anal. Methods 2015, 8, 569–577. [CrossRef]
45. Takahashi, H.; Kamimura, H.; Ichinoe, M. Distribution of aflatoxin-producing Aspergillus flavus andAspergillus parasiticus in sugarcane fields in the southernmost islands of Japan. J. Food Prot. 2004, 67,90–95. [CrossRef] [PubMed]
46. Varga, J.; Frisvad, J.C.; Samson, R.A. Two new aflatoxin producing species, and an overview of Aspergillussection Flavi. Stud. Mycol. 2011, 69, 57–80. [CrossRef] [PubMed]
47. Pildain, M.B.; Frisvad, J.C.; Vaamonde, G.; Cabral, D.; Varga, J.; Samson, R.A. Two novel aflatoxin-producingAspergillus species from Argentinean peanuts. Int. J. Syst. Evol. Microbiol. 2008, 58, 725–735. [CrossRef][PubMed]

Agriculture 2017, 7, 80 14 of 14
48. Centers for Disease Control and Prevention (CDC). Outbreak of aflatoxin poisoning—Eastern andcentral provinces, Kenya, January–July 2004. MMWR 2004, 53, 790–793.
49. Okoth, S.; Nyongesa, B.; Ayugi, V.; Kan’gethe, E.; Korhonen, H.; Joutsjoki, V. Toxigenic potential of Aspergillusspecies occurring on maize kernels from two agro-ecological zones in Kenya. Toxins 2012, 4, 991–1007.[CrossRef] [PubMed]
© 2017 by the authors. Licensee MDPI, Basel, Switzerland. This article is an open accessarticle distributed under the terms and conditions of the Creative Commons Attribution(CC BY) license (http://creativecommons.org/licenses/by/4.0/).