Complete Issue (PDF) - American Journal of Neuroradiology
191
MAY 2019 AJNR VOLUME 40 • PP 757–926
-
Upload
khangminh22 -
Category
Documents
-
view
0 -
download
0
Transcript of Complete Issue (PDF) - American Journal of Neuroradiology

MA
Y2019
AJN
RV
OLU
ME
40•
PP757–926

Predicting motor outcome in acute intracerebral hemorrhage
Intravoxel incoherent motion MR imaging of pediatricintracranial tumors
Lumbar stenosis severity and response to epiduralcorticosteroid versus lidocaine injections
Official Journal ASNR • ASFNR • ASHNR • ASPNR • ASSR
M A Y 2 0 1 9
V O L U M E 4 0
N U M B E R 5
W W W . A J N R . O R G
T H E J O U R N A L O F D I A G N O S T I C A N DI N T E R V E N T I O N A L N E U R O R A D I O L O G Y

INDICATIONS FOR USE:
The WEB Aneurysm Embolization System is indicated for use at the middle cerebral artery (MCA) bifurcation, internal carotid artery (ICA) terminus, anterior communicating artery (AComm) complex, or basilar artery apex for the endovascular treatment of adult patients with saccular, wide neck bifurcation intracranial aneurysms with dome diameter from 3 mm to 10 mm and either neck size 4 mm or greater or the dome-to-neck ratio is greater than 1 and less than 2.
The WEB Aneurysm Embolization System is contraindicated for patients with known bacterial infection that may interfere with or negatively affect the implantation procedure and patients with known hypersensitivity to nickel. For complete indications, contraindications, potential complications, warnings, precautions, and instructions, see instructions for use (IFU provided with the device).
The VIA® Catheter is intended for the introduction of non-liquid interventional devices (such as stents/_ ow diverters) and infusion of diagnostic (such as contrast media) or non-liquid therapeutic agents into the neuro, peripheral, and coronary vasculature. The VIA Catheter is contraindicated for use with liquid embolic materials, such as n-butyl 2-cyanoacrylate or ethylene vinyl alcohol & DMSO (dimethyl sulfoxide). The VIA Catheter is contraindicated for use in the pediatric population (<22 yrs of age).
Caution: Federal law restricts these devices to sale by or on the order of a physician.
NE ANDDONE

MicroVention WorldwideInnovation Center PH +1.714.247.800035 EnterpriseAliso Viejo, CA 92656 USAMicroVention UK Limited PH +44 (0) 191 258 6777MicroVention Europe, S.A.R.L. PH +33 (1) 39 21 77 46MicroVention Deutschland GmbH PH +49 211 210 798-0microvention.com
Contact a MicroVention sales associate to learn more about integrating the WEB® device into your practice.
MICROVENTION® is a registered trademark of MicroVention, Inc. WEB® and VIA® are registered trademarks of Sequent Medical, Inc. in the United States ©2019 MicroVention, Inc. MM854 US 02/19
MicroVention® delivers the first intrasaccular solutionfor wide neck bifurcation aneurysms.
The world leader and first
PMA-approved device in an
important new category of intrasaccular
flow disruptors.
SLS Device
SL Device
The WEB® System is a safe and effective single-device solution for treating wide neck bifurcation aneurysms.

Copyright © 2018 StrykerAP002078 v1.0
The Trevo Retriever is the only device cleared to reduce disability in stroke patients up to 24 hours from time last seen well.
For more information, visit strykerneurovascular.com/trevo24hours
Now you have 24 hours to make a lifetime of difference in stroke patients like Nora

Copyright © 2018 StrykerAP002078 v1.0 | Page 2 of 2
Trevo® XP ProVue RetrieversSee package insert for complete indications, complications, warnings and instructions for use.
INDICATIONS FOR USE1. The Trevo Retriever is indicated for use to restore blood flow in the
neurovasculature by removing thrombus for the treatment of acute ischemic stroke to reduce disability in patients with a persistent, proximal anterior circulation, large vessel occlusion, and smaller core infarcts who have first received intravenous tissue plasminogen activator (IV t-PA). Endovascular therapy with the device should start within 6 hours of symptom onset.
2. The Trevo Retriever is intended to restore blood flow in the neurovasculature by removing thrombus in patients experiencing ischemic stroke within 8 hours of symptom onset. Patients who are ineligible for intravenous tissue plasminogen activator (IV t-PA) or who fail IV t-PA therapy are candidates for treatment.
3. The Trevo Retriever is indicated for use to restore blood flow in the neurovasculature by removing thrombus for the treatment of acute ischemic stroke to reduce disability in patients with a persistent, proximal anterior circulation, large vessel occlusion of the internal carotid artery (ICA) or middle cerebral artery (MCA)-M1 segments with smaller core infarcts (0-50cc for age < 80 years, 0-20cc for age ≥ 80 years). Endovascular therapy with the device should start within 6-24 hours of time last seen well in patients who are ineligible for intravenous tissue plasminogen activator (IV t-PA) or who fail IV t-PA therapy.
COMPLICATIONSProcedures requiring percutaneous catheter introduction should not be attempted by physicians unfamiliar with possible complications which may occur during or after the procedure. Possible complications include, but are not limited to, the following: air embolism; hematoma or hemorrhage at puncture site; infection; distal embolization; pain/headache; vessel spasm, thrombosis, dissection, or perforation; emboli; acute occlusion; ischemia; intracranial hemorrhage; false aneurysm formation; neurological deficits including stroke; and death.
COMPATIBILITY3x20mm retrievers are compatible with Trevo® Pro 14 Microcatheters (REF 90231) and Trevo® Pro 18 Microcatheters (REF 90238). 4x20mm retrievers are compatible with Trevo® Pro 18 Microcatheters (REF 90238). 4x30mm retrievers
are compatible with Excelsior® XT-27® Microcatheters (150cm x 6cm straight REF 275081) and Trevo® Pro 18 Microcatheters (REF 90238). 6x25mm Retrievers are compatible with Excelsior® XT-27® Microcatheters (150cm x 6cm straight REF 275081). Recommended minimum vessel ID for all Retriever sizes is 2.5mm. Compatibility of the Retriever with other microcatheters has not been established. Performance of the Retriever device may be impacted if a different microcatheter is used. Balloon Guide Catheters (such as Merci® Balloon Guide Catheter and FlowGate® Balloon Guide Catheter) are recommended for use during thrombus removal procedures. Retrievers are compatible with the Abbott Vascular DOC® Guide Wire Extension (REF 22260). Retrievers are compatible with Boston Scientific Rotating Hemostatic Valve (Ref 421242).
SPECIFIC WARNINGS FOR INDICATION 1• The safety and effectiveness of the Trevo Retrievers in reducing disability
has not been established in patients with large core infarcts (i.e. ASPECTS ≤ 7). There may be increased risks, such as intracerebral hemorrhage, in these patients.
• The safety and effectiveness of the Trevo Retrievers in reducing disability has not been established or evaluated in patients with occlusions in the posterior circulation (e.g., basilar or vertebral arteries) or for more distal occlusions in the anterior circulation.
SPECIFIC WARNINGS FOR INDICATION 2• To reduce risk of vessel damage, take care to appropriately size Retriever to
vessel diameter at intended site of deployment.
SPECIFIC WARNINGS FOR INDICATION 3• The safety and effectiveness of the Trevo Retrievers in reducing disability
has not been established in patients with large core infarcts (i.e., ASPECTS ≤ 7). There may be increased risks, such as intracerebral hemorhage, in these patients.
• The safety and effectiveness of the Trevo Retrievers in reducing disabillity has not been established or evaluated in patients with occlusions in the posterior circulation (e.g., basilar or vertebral arteries) or for more distal occlusions in the anterior circulation.
• Users should validate their imaging software analysis techniques to ensure
robust and consistent results for assessing core infarct size.
WARNINGS APPLIED TO ALL INDICATIONS• Administration of IV t-PA should be within the FDA-approved window (within 3
hours of stroke symptom onset).• To reduce risk of vessel damage, adhere to the following recommendations:
– Do not perform more than six (6) retrieval attempts in same vessel using Retriever devices.
– Maintain Retriever position in vessel when removing or exchanging Microcatheter.
• To reduce risk of kinking/fracture, adhere to the following recommendations: – Immediately after unsheathing Retriever, position Microcatheter tip marker just proximal to shaped section. Maintain Microcatheter tip marker just proximal to shaped section of Retriever during manipulation and withdrawal.
– Do not rotate or torque Retriever. – Use caution when passing Retriever through stented arteries.
• The Retriever is a delicate instrument and should be handled carefully. Before use and when possible during procedure, inspect device carefully for damage. Do not use a device that shows signs of damage. Damage may prevent device from functioning and may cause complications.
• Do not advance or withdraw Retriever against resistance or significant vasospasm. Moving or torquing device against resistance or significant vasospasm may result in damage to vessel or device. Assess cause of resistance using fluoroscopy and if needed resheath the device to withdraw.
• If Retriever is difficult to withdraw from the vessel, do not torque Retriever. Advance Microcatheter distally, gently pull Retriever back into Microcatheter, and remove Retriever and Microcatheter as a unit. If undue resistance is met when withdrawing the Retriever into the Microcatheter, consider extending the Retriever using the Abbott Vascular DOC guidewire extension (REF 22260) so that the Microcatheter can be exchanged for a larger diameter catheter such as a DAC® Catheter. Gently withdraw the Retriever into the larger diameter catheter.
• Administer anti-coagulation and anti-platelet medications per standard institutional guidelines.
• Users should take all necessary precautions to limit X-radiation doses to patients and themselves by using sufficient shielding, reducing
fluoroscopy times, and modifying X-ray technical factors where possible.
PRECAUTIONS• Prescription only – device restricted to use by or on order of a physician.• Store in cool, dry, dark place.• Do not use open or damaged packages.• Use by “Use By” date.• Exposure to temperatures above 54°C (130°F) may damage device and
accessories. Do not autoclave.• Do not expose Retriever to solvents.• Use Retriever in conjunction with fluoroscopic visualization and proper
anti-coagulation agents.• To prevent thrombus formation and contrast media crystal formation,
maintain a constant infusion of appropriate flush solution between guide catheter and Microcatheter and between Microcatheter and Retriever or guidewire.
• Do not attach a torque device to the shaped proximal end of DOC® Compatible Retriever. Damage may occur, preventing ability to attach DOC® Guide Wire Extension.
DOC is a trademark of Abbott Laboratories.
Stryker Neurovascular47900 Bayside ParkwayFremont, CA 94538
strykerneurovascular.com
Date of Release: APR/2018
EX_EN_US
Neuroform Atlas® Stent System See package insert for complete indications, contraindications, warnings and instructions for use.Humanitarian Device. Authorized by Federal law for use with neurovascular embolic coils in patients who are ≥ 18 years of age for the treatment of wide neck, intracranial, saccular aneurysms arising from a parent vessel with a diameter of ≥ 2 mm and ≤ 4.5 mm that are not amenable to treatment with surgical clipping. Wide neck aneurysms are defined as having a neck ≥ 4 mm or a dome-to-neck ratio < 2. The effectiveness of this device for this use has not been demonstrated.
INDICATIONS FOR USEThe Neuroform Atlas® Stent System is indicated for use with neurovascular embolic coils in patients who are ≥ 18 years of age for the treatment of wide neck, intracranial, saccular aneurysms arising from a parent vessel with a diameter of ≥ 2 mm and ≤ 4.5 mm that are not amenable to treatment with surgical clipping. Wide neck aneurysms are defined as having a neck ≥ 4 mm or a dome-to-neck ratio of < 2.
CONTRAINDICATIONSPatients in whom antiplatelet and/or anticoagulation therapy is contraindicated.
POTENTIAL ADVERSE EVENTSThe potential adverse events listed below, as well as others, may be associated with the use of the Neuroform Atlas® Stent System or with the procedure:Allergic reaction to nitinol metal and medications, Aneurysm perforation or rupture, Coil herniation through stent into parent vessel, Death, Embolus, Headache, Hemorrhage, In-stent stenosis, Infection, Ischemia, Neurological deficit/intracranial sequelae, Pseudoaneurysm, Stent fracture, Stent migration/embolization, Stent misplacement, Stent thrombosis, Stroke, Transient ischemic attack, Vasospasm, Vessel occlusion or closure, Vessel perforation/rupture, Vessel dissection, Vessel trauma or damage, Vessel thrombosis, Visual impairment, and other procedural complications including but not limited to anesthetic and contrast media risks, hypotension, hypertension, access site complications.
WARNINGS • Contents supplied STERILE using an ethylene oxide (EO) process. Do not use if sterile barrier is damaged.
If damage is found, call your Stryker Neurovascular representative.• For single use only. Do not reuse, reprocess or resterilize. Reuse, reprocessing or resterilization may
compromise the structural integrity of the device and/or lead to device failure which, in turn, may result in patient injury, illness or death. Reuse, reprocessing or resterilization may also create a risk of contamination of the device and/or cause patient infection or cross-infection, including, but not limited to, the transmission of infectious disease(s) from one patient to another. Contamination of the device may lead to injury, illness or death of the patient.
• After use, dispose of product and packaging in accordance with hospital, administrative and/or local government policy.
• This device should only be used by physicians who have received appropriate training in interventional neuroradiology or interventional radiology and preclinical training on the use of this device as established by Stryker Neurovascular.
• Select a stent size (length) to maintain a minimum of 4 mm on each side of the aneurysm neck along the parent vessel. An incorrectly sized stent may result in damage to the vessel or stent migration. Therefore, the stent is not designed to treat an aneurysm with a neck greater than 22 mm in length.
• If excessive resistance is encountered during the use of the Neuroform Atlas® Stent System or any of its components at any time during the procedure, discontinue use of the stent system. Continuing to move the stent system against resistance may result in damage to the vessel or a system component.
• Persons allergic to nickel titanium (Nitinol) may suffer an allergic response to this stent implant.• Purge the system carefully to avoid the accidental introduction of air into the stent system.• Confirm there are no air bubbles trapped anywhere in the stent system.
CAUTIONS / PRECAUTIONS• Federal Law (USA) restricts this device to sale by or on the order of a physician.• Use the Neuroform Atlas Stent System prior to the “Use By” date printed on the package• Carefully inspect the sterile package and Neuroform Atlas Stent System prior to use to verify that neither
has been damaged during shipment. Do not use kinked or damaged components; contact your Stryker Neurovascular representative.
• The stent delivery microcatheter and the Neuroform Atlas Stent delivery wire should not be used to recapture the stent.
• Exercise caution when crossing the deployed stent with adjunctive devices.• After deployment, the stent may foreshorten from up to 6.3%.• The max OD of the coiling microcatheter should not exceed the max OD of the stent delivery
microcatheter.• Standard interventional devices with distal tips > 1.8 F may not be able to pass through the interstices
of the stent.• Safety of the Neuroform Atlas Stent System in patients below the age of 18 has not been established.• In cases where multiple aneurysms are to be treated, start at the most distal aneurysm first.
MAGNETIC RESONANCE IMAGING (MRI)Safety Information Magnetic Resonance ConditionalNon-clinical testing and analysis have demonstrated that the Neuroform Atlas Stent is MR Conditional alone, or when overlapped with a second stent, and adjacent to a Stryker Neurovascular coil mass. A patient with the Neuroform Atlas Stent can be safely scanned immediately after placement of this implant, under the following conditions:• Static magnetic field of 1.5 and 3.0 Tesla• Maximum spatial gradient field up to 2500 Gauss/cm (25 Tesla/m)• Maximum MR system reported whole body averaged specific absorption rate of 2 W/kg (Normal
Operating Mode) and head averaged specific absorption rate of 3.2 W/kg.Under the scan conditions defined above, the Neuroform Atlas Stent is expected to produce a maximum temperature rise of 4°C after 15 minutes of continuous scanning. The Neuroform Atlas Stent should not migrate in this MRI environment.In non-clinical testing, the image artifact caused by the device extends approximately 2 mm from the Neuroform Atlas Stent when imaged with a spin echo pulse sequence and 3 Tesla MRI System. The artifact may obscure the device lumen. It may be necessary to optimize MR imaging parameters for the presence of this implant.
Excelsior® XT-17™ MicrocatheterSee package insert for complete indications, contraindications, warnings and instructions for use.
INTENDED USE / INDICATIONS FOR USEStryker Neurovascular’s Excelsior XT-17 Microcatheters are intended to assist in the delivery of diagnostic agents, such as contrast media, and therapeutic agents, such as occlusion coils, into the peripheral, coronary and neuro vasculature.
CONTRAINDICATIONSNone known.
POTENTIAL ADVERSE EVENTS Potential adverse events associated with the use of microcatheters or with the endovascular procedures include, but are not limited to: access site complications, allergic reaction, aneurysm perforation, aneurysm rupture, death, embolism (air, foreign body, plaque, thrombus), hematoma, hemorrhage, infection, ischemia, neurological deficits, pseudoaneurysm, stroke, transient ischemic attack, vasospasm, vessel dissection, vessel occlusion, vessel perforation, vessel rupture, vessel thrombosis
WARNINGS• The accessories are not intended for use inside the human body.• Limited testing has been performed with solutions such as contrast media, saline and suspended
embolic particles. The use of these microcatheters for delivery of solutions other than the types that have been tested for compatibility is not recommended. Do not use with glue or glue mixtures.
• Carefully inspect all devices prior to use. Verify shape, size and condition are suitable for the specific procedure.
• Exchange microcatheters frequently during lengthy procedures that require extensive guidewire manipulation or multiple guidewire exchanges.
• Never advance or withdraw an intravascular device against resistance until the cause of the resistance is determined by fluoroscopy. Movement of the microcatheter or guidewire against resistance could dislodge a clot, perforate a vessel wall, or damage microcatheter and guidewire. In severe cases, tip separation of the microcatheter or guidewire may occur.
• Contents supplied STERILE using an ethylene oxide (EO) process. Do not use if sterile barrier is damaged. If damage is found, call your Stryker Neurovascular representative.
• For single use only. Do not reuse, reprocess or resterilize. Reuse, reprocessing or resterilization may compromise the structural integrity of the device and/or lead to device failure which, in turn, may result in patient injury, illness or death. Reuse, reprocessing or resterilization may also create a risk of contamination of the device and/or cause patient infection or cross-infection, including, but not limited to, the transmission of infectious disease(s) from one patient to another. Contamination of the device may lead to injury, illness or death of the patient.
• After use, dispose of product and packaging in accordance with hospital, administrative and/or local government policy.
• These devices are intended for use only by physicians trained in performing endovascular procedures.• Inspect product before use for any bends, kinks or damage. Do not use a microcatheter that has been
damaged. Damaged microcatheters may rupture causing vessel trauma or tip detachment during steering maneuvers.
• The shaping mandrel is not intended for use inside the human body.• Discontinue use of microcatheter for infusion if increased resistance is noted. Resistance indicates
possible blockage. Remove and replace blocked microcatheter immediately. DO NOT attempt to clear blockage by over-pressurization. Doing so may cause the microcatheter to rupture, resulting in vascular damage or patient injury.
• Do not exceed 2,070 kPa (300 psi) infusion pressure. Excessive pressure could dislodge a clot, causing thromboemboli, or could result in a ruptured microcatheter or severed tip, causing vessel injury.
CAUTIONS / PRECAUTIONS• To reduce the probability of coating damage in tortuous vasculature, use a guide catheter with a
minimum internal diameter as specified in Table 1 above, and is recommended for use with Stryker Neurovascular hydrophilically coated microcatheters.
• To control the proper introduction, movement, positioning and removal of the microcatheter within the vascular system, users should employ standard clinical angiographic and fluoroscopic practices and techniques throughout the interventional procedure.
• Exercise care in handling of the microcatheter during a procedure to reduce the possibility of accidental breakage, bending or kinking.
• Use the product prior to the “Use By” date printed on the label.• Limited testing indicates that Excelsior XT-17 Microcatheter is compatible with Dimethyl Sulfoxide
(DMSO). The compatibility of Excelsior XT-17 Microcatheter with individual agents suspended in DMSO has not been established.
• Federal Law (USA) restricts this device to sale by or on the order of a physician.• Wet dispenser coil or packaging tray and hydrophilically coated outer shaft of microcatheters prior to
removal from packaging tray. Once the microcatheter has been wetted, do not allow to dry.• The packaging mandrel is not intended for reuse. The packaging mandrel is not intended for use inside
the human body.• Check that all fittings are secure so that air is not introduced into guide catheter or microcatheter during
continuous flush.• In order to achieve optimal performance of Stryker Neurovascular Microcatheters and to maintain the
lubricity of the Hydrolene® Coating surface, it is critical that a continuous flow of appropriate flush solution be maintained between the Stryker Neurovascular Microcatheter and guide catheter, and the microcatheter and any intraluminal device. In addition, flushing aids in preventing contrast crystal formation and/or clotting on both the intraluminal device and inside the guide catheter and/or the microcatheter lumen.
• Do not position microcatheter closer than 2.54 cm (1 in) from the steam source. Damage to the microcatheter may result.
• Excessive tightening of a hemostatic valve onto the microcatheter shaft may result in damage to the microcatheter. Removing the peel away introducer without a guidewire inserted in the microcatheter lumen might result in damage to the microcatheter shaft.
• To facilitate microcatheter handling, the proximal portion of the microcatheter does not have the hydrophilic surface. Greater resistance may be encountered when this section of the microcatheter is advanced into the RHV.
Excelsior® SL-10® MicrocatheterSee package insert for complete indications, contraindications, warnings and instructions for use.
INTENDED USE / INDICATIONS FOR USEStryker Neurovascular Excelsior SL-10 Microcatheter is intended to assist in the delivery of diagnostic agents, such as contrast media, and therapeutic agents, such as occlusion coils, into the peripheral, coronary, and neurovasculature.
CONTRAINDICATIONSNone known.
POTENTIAL ADVERSE EVENTSPotential adverse events associated with the use of microcatheters or with the endovascular procedures include, but are not limited to: access site complications, allergic reaction, aneurysm perforation, aneurysm rupture, death, embolism (air, foreign body, plaque, thrombus), hematoma, hemorrhage, infection, ischemia, neurological deficits, pseudoaneurysm, stroke, transient ischemic attack, vessel dissection, vessel occlusion, vessel perforation, vessel rupture, vessel thrombosis.
WARNINGS• Contents supplied STERILE using an ethylene oxide (EO) process. Do not use if sterile barrier is damaged.
If damage is found, call your Stryker Neurovascular representative.• For single patient use only. Do not reuse, reprocess or resterilize. Reuse, reprocessing or resterilization
may compromise the structural integrity of the device and/or lead to device failure which, in turn, may result in patient injury, illness or death. Reuse, reprocessing or resterilization may also create a risk of contamination of the device and/or cause patient infection or cross-infection, including, but not limited to, the transmission of infectious disease(s) from one patient to another. Contamination of the device may lead to injury, illness or death of the patient.
• After use, dispose of product and packaging in accordance with hospital, administrative and/or local government policy.
• These devices are intended for use only by physicians trained in performing endovascular procedures.
• Limited testing has been performed with solutions such as contrast media, saline and suspended embolic particles. The use of these catheters for delivery of solutions other than the types that have been tested for compatibility is not recommended. Do not use with glue or glue mixtures.
• The accessories are not intended for use inside the human body.• Carefully inspect all devices prior to use. Verify shape, size and condition are suitable for the specific
procedure.• Exchange microcatheters frequently during lengthy procedures that require extensive guidewire
manipulation or multiple guidewire exchanges.• Never advance or withdraw an intravascular device against resistance until the cause of the resistance
is determined by fluoroscopy. Movement of the microcatheter or guidewire against resistance could dislodge a clot, perforate a vessel wall, or damage microcatheter and guidewire. In severe cases, tip separation of the microcatheter or guidewire may occur.
• Inspect product before use for any bends, kinks or damage. Do not use a microcatheter that has been damaged. Damaged microcatheters may rupture causing vessel trauma or tip detachment during steering maneuvers.
• Shaping mandrel is not intended for use inside the human body.• Discontinue use of microcatheter for infusion if increased resistance is noted. Resistance indicates
possible blockage. Remove and replace blocked microcatheter immediately. DO NOT attempt to clear blockage by over-pressurization. Doing so may cause the microcatheter to rupture, resulting in vascular damage or patient injury.
• Do not exceed 2,070 kPa (300 psi) infusion pressure. Excessive pressure could dislodge a clot, causing thromboemboli, or could result in a ruptured microcatheter or severed tip, causing vessel injury.
CAUTIONS / PRECAUTIONS• Federal Law (USA) restricts this device to sale by or on the order of a physician.• To facilitate microcatheter handling, the proximal portion of the microcatheter does not have the
hydrophilic surface. Greater resistance may be encountered when this section of the microcatheter is advanced into the RHV.
• Exercise care in handling of the microcatheter during a procedure to reduce the possibility of accidental breakage, bending or kinking.
• To reduce the probability of coating damage in tortuous vasculature, use a guide catheter with a minimum internal diameter that is ≥ 1.00 mm (0.038 in) and is recommended for use with Stryker Neurovascular hydrophilically coated microcatheters.
• To control the proper introduction, movement, positioning and removal of the microcatheter within the vascular system, users should employ standard clinical angiographic and fluoroscopic practices and techniques throughout the interventional procedure.
• Flush dispenser coil of hydrophilically coated microcatheters prior to removal from dispenser coil. Once the microcatheter has been wetted, do not allow to dry. Do not reinsert the microcatheter into dispenser coil.
• Do not position microcatheter closer than 2.54 cm (1 in) from the steam source. Damage to the microcatheter may result.
• Check that all fittings are secure so that air is not introduced into guide catheter or microcatheter during continuous flush.
• In order to achieve optimal performance of Stryker Neurovascular Microcatheters and to maintain the lubricity of the Hydrolene® Coating surface, it is critical that a continuous flow of appropriate flush solution be maintained between the Stryker Neurovascular Microcatheter and guide catheter, and the microcatheter and any intraluminal device. In addition, flushing aids in preventing contrast crystal formation and/or clotting on both the intraluminal device and inside the guide catheter and/or the microcatheter lumen.
• Excessive tightening of a hemostatic valve onto the microcatheter shaft may result in damage to the microcatheter.
Copyright © 2019 StrykerAP002413 v1.0 | Page 2 of 2
Stryker Neurovascular47900 Bayside ParkwayFremont, CA 94538
strykerneurovascular.com
Date of Release: FEB/2019
EX_EN_US

The Editors of AJNR are pleased to announce the annual Lucien Levy Best Research Article Award has been presented to
“ Deep-Learning Convolutional Neural Networks Accurately Classify Genetic Mutations in Gliomas” by P. Chang, J. Grinband, B.D. Weinberg, M. Bardis, M. Khy, G. Cadena, M.-Y. Su, S. Cha, C.G. Filippi, D. Bota, P. Baldi, L.M. Poisson, R. Jain, and D. Chow
AJNRAMERICAN JOURNAL OF NEURORADIOLOGY
2018 LUCIEN LEVY BEST RESEARCH ARTICLE AWARD WINNER AND NOMINEES NAMED
Other nominated papers were:
“ Hybrid 3D/2D Convolutional Neural Network for Hemorrhage Evaluation on Head CT” by P.D. Chang, E. Kuoy, J. Grinband, B.D. Weinberg, M. Thompson, R. Homo, J. Chen, H. Abcede, M. Shafie, L. Sugrue, C.G. Filippi, M.-Y. Su, W. Yu, C. Hess, and D. Chow
“ Contrast-Enhanced 3D-FLAIR Imaging of the Optic Nerve and Optic Nerve Head: Novel Neuroimaging Findings of Idiopathic Intracranial Hypertension” by E. Golden, R. Krivochenitser, N. Mathews, C. Longhurst, Y. Chen, J.-P.J. Yu, and T.A. Kennedy
“ Quantitative Susceptibility Mapping after Sports-Related Concussion” by K.M. Koch, T.B. Meier, R. Karr, A.S. Nencka, L.T. Muftuler, and M. McCrea
“ Diagnosing Early Ischemic Changes with the Latest-Generation Flat Detector CT: A Comparative Study with Multidetector CT” by I.L. Maier, J.R. Leyhe, I. Tsogkas, D. Behme, K. Schregel, M. Knauth, M. Schnieder, J. Liman, and M.-N. Psychogios
“ Predictors and Clinical Impact of Delayed Stent Thrombosis after Thrombectomy for Acute Stroke with Tandem Lesions” by R. Pop, I. Zinchenko, V. Quenardelle, D. Mihoc, M. Manisor, J.S. Richter, F. Severac, M. Simu, S. Chibbaro, O. Rouyer, V. Wolff, and R. Beaujeux
“ Aberrant Structural Brain Connectivity in Adolescents with Attentional Problems Who Were Born Prematurely” by O. Tymofiyeva, D. Gano, R.J. Trevino Jr, H.C. Glass, T. Flynn, S.M. Lundy, P.S. McQuillen, D.M. Ferriero, A.J. Barkovich, and D. Xu
This award is named for the late AJNR Senior Editor who championed its establishment and recognizes the best original research paper accepted in 2018. The winning paper was published electronically on May 10, 2018 and appeared in the July print issue. It was selected by a vote of the Journal’s Editor-in-Chief and Senior Editors.

IMPORTANT SAFETY INFORMATION1
Gadolinium-based contrast agents (GBCAs) increase the risk for NSF among patients with impaired elimination of the drugs. Avoid use of GBCAs in these patients unless the diagnostic information is essential and not available with non-contrasted MRI or other modalities. NSF may result in fatal or debilitating fibrosis affecting the skin, muscle and internal organs.
• The risk for NSF appears highest among patients with: – Chronic, severe kidney disease (GFR < 30 mL/min/1.73m2), or – Acute kidney injury.
• Screen patients for acute kidney injury and other conditions that may reduce renal function. For patients at risk for chronically reduced renal function (e.g. age > 60 years, hypertension, diabetes), estimate the glomerular filtration rate (GFR) through laboratory testing.
• For patients at highest risk for NSF, do not exceed the recommended DOTAREM dose and allow a sufficient period of time for elimination of the drug from the body prior to any re-administration.
WARNING: NEPHROGENIC SYSTEMIC FIBROSIS (NSF)
INDICATIONS AND USAGEDOTAREM® (gadoterate meglumine) injection is a prescription gadolinium-based contrast agent indicated for intravenous use with magnetic resonance imaging (MRI) in brain (intracranial), spine and associated tissues in adult and pediatric patients (including term neonates) to detect and visualize areas with disruption of the blood brain barrier (BBB) and/or abnormal vascularity.
CONTRAINDICATIONS
History of clinically important hypersensitivity reactions to DOTAREM.
WARNINGS AND PRECAUTIONS • Hypersensitivity Reactions: Anaphylactic and anaphylactoid reactions have
been reported with DOTAREM, involving cardiovascular, respiratory, and/or cutaneous manifestations. Some patients experienced circulatory collapse and died. In most cases, initial symptoms occurred within minutes of DOTAREM administration and resolved with prompt emergency treatment.
• Before DOTAREM administration, assess all patients for any history of a reaction to contrast media, bronchial asthma and/or allergic disorders. These patients may have an increased risk for a hypersensitivity reaction to DOTAREM.
• Administer DOTAREM only in situations where trained personnel and therapies are promptly available for the treatment of hypersensitivity reactions, including personnel trained in resuscitation.
• Gadolinium Retention: Gadolinium is retained for months or years in several organs. The highest concentrations have been identified in the bone, followed by brain, skin, kidney, liver and spleen. The duration of retention also varies by tissue, and is longest in bone. Linear GBCAs cause more retention than macrocyclic GBCAs.
• Consequences of gadolinium retention in the brain have not been established. Adverse events involving multiple organ systems have been reported in patients with normal renal function without an established causal link to gadolinium retention.
• Acute Kidney Injury: In patients with chronically reduced renal function, acute kidney injury requiring dialysis has occurred with the use of GBCAs. The risk of acute kidney injury may increase with increasing dose of the contrast agent; administer the lowest dose necessary for adequate imaging.
• Extravasation and Injection Site Reactions: Ensure catheter and venous patency before the injection of DOTAREM. Extravasation into tissues during DOTAREM administration may result in tissue irritation.
ADVERSE REACTIONS • The most common adverse reactions associated with DOTAREM in clinical
trials were nausea, headache, injection site pain, injection site coldness and rash.
• Serious adverse reactions in the Postmarketing experience have been reported with DOTAREM. These serious adverse reactions include but are not limited to: arrhythmia, cardiac arrest, respiratory arrest, pharyngeal edema, laryngospasm, bronchospasm, coma and convulsion.
USE IN SPECIFIC POPULATIONS• Pregnancy: GBCAs cross the human placenta and result in fetal
exposure and gadolinium retention. Use only if imaging is essential during pregnancy and cannot be delayed.
• Lactation: There are no data on the presence of gadoterate in human milk, the effects on the breastfed infant, or the effects on milk production. However, published lactation data on other GBCAs indicate that 0.01 to 0.04% of the maternal gadolinium dose is present in breast milk.
• Pediatric Use: The safety and efficacy of DOTAREM at a single dose of 0.1 mmol/kg has been established in pediatric patients from birth (term neonates ≥ 37 weeks gestational age) to 17 years of age based on clinical data. The safety of DOTAREM has not been established in preterm neonates. No cases of NSF associated with DOTAREM or any other GBCA have been identified in pediatric patients age 6 years and younger.
You are encouraged to report negative side effects of prescription drugs to the FDA. Visit www.fda.gov/medwatch or call 1-800-FDA-1088.
Please see the full Prescribing Information, including the patient Medication Guide, for additional important safety information.
References: 1. Dotarem [package insert]. Princeton, NJ: Guerbet LLC; Apr 2018. 2. Maravilla K et al. Comparison of Gadoterate Meglumine and Gadobutrol in the Diagnosis of Primary Brain Tumors: A Double-Blind Randomized Controlled Intraindividual Crossover Study (the REMIND Study). 2017 June 29. doi: 10:3174/ajnr.A5316. [Epub ahead of print]. 3. de Kerviler E et al. Adverse reactions to gadoterate meglumine: review of ov¬oer 25 years of clinical use and more than 50 million doses. Invest Radiol 2016;51:544–51 CrossRef Medline. 4. Endrikat J et al. Safety of gadobutrol: results from 42 clinical phase II to IV studies and postmarketing surveillance after 29 million applications. Invest Radiol 2016;51: 537–43 CrossRef Medline. 5. Port M et al. Efficiency,thermodynamic and kinetic stability of marketed gadolinium chelates and their possible clinical consequences: a critical review. Biometals. 2008;21:469-90. 6. Frenzel T et al. Stability of gadolinium-based magnetic resonance imaging contrast agents in human serum at 37°C. Invest Radiol. 2008;43:817-828.
DOTAREM® is a registered trademark of Guerbet LLC, and is available by prescription only.
Gadavist® is a registered trademark of the Bayer group of companies, and is available by prescription only.
GU07181128

Learn more atRemindStudy.com
Comparison of Dotarem® to Gadavist® for Overall Visualization and Characterization in the MRI Diagnosis of Primary Brain Tumors
This study “demonstrates the non-inferiority of gadoterate meglumine [Dotarem®] versus gadobutrol [Gadavist®] for overall
visualization and characterization of primary brain tumors”.2 Additionally, there was no preference of the readers for either contrast agent, in most cases, regarding border delineation, internal morphology, and the qualitative degree of contrast
enhancement, despite quantitative mean lesion percentage enhancement being higher with gadoburtol.2
• visualization and characterization with either Dotarem® or Gadavist®.2
• The REMIND Study also demonstrated a low incidence of immediate reported AEs with Dotarem® and with Gadavist®, as shown in multiple previous studies.
• Dotarem® is the only imaging contrast with macrocyclic and ionic structure for high thermodynamic and kinetic stability.
• Dotarem® is not only trusted for high molecular stability as Gadavist® for MRI diagnosis of primary brain tumors.2
Please see Important Safety information on opposite page. For more information on Dotarem®, please see Full Prescribing Information including Boxed Warning and Medication Guide.
Observed Between Dotarem® and Gadavist®2
as demonstrated by the REMIND Study, a multicenter, double-blind, randomized, controlled intraindividual crossover study.2

Bending expectations of conformability and stability.Enhanced conformabilityThe hybrid cell structure is designed to enhance stent opening and conformability in bifurcations and tight curves.
Ease of useAll sizes of the Neuroform Atlas Stent are deliverable through Excelsior® SL-10® and Excelsior XT-17™ Microcatheters.
Higher deployment accuracyThe Neuroform Atlas Stent is designed to have very low foreshortening, which enables very high deployment accuracy.
The Neuroform Atlas Stent System is authorized under a Humanitarian Device Exemption (HDE). IRB approval is required prior to use.
Copyright © 2019 StrykerAP002413 v1.0 | Page 1 of 2

Balt USA 29 Parker, Irvine, CA 92618 tel 949.788.1443 fax 949.788.1444
balt-usa.com©2019 BALT USA MKTG-132 Rev. A
UNIQUE OPTIONS FOR COMPLEX ANATOMIESAvailable in .007”, .008” and .012/.014”
Visit Our Products Page at www.balt-USA.com to Learn More.

757 PERSPECTIVES M.T. Kruger, et al.
REVIEW ARTICLE
758 Non-Contrast-Enhancing Tumor: A New Frontier in GlioblastomaResearch A. Lasocki, et al.
ADULT BRAIN
PRACTICE VIGNETTE
766 Chimeric Antigen Receptor T-Cell Therapy: What the NeuroradiologistNeeds to Know H.A. Valand, et al.
GENERAL CONTENTS
769 Predicting Motor Outcome in Acute Intracerebral HemorrhageJ. Puig, et al.
ADULT BRAINFUNCTIONAL
776 The Central Vein Sign in Radiologically Isolated SyndromeS. Suthiphosuwan, et al.
ADULT BRAIN
784 Increased Water Content in Periventricular Caps in Patients withoutAcute Hydrocephalus T. Sichtermann, et al.
ADULT BRAIN
788 GJA1 Variants Cause Spastic Paraplegia Associated with CerebralHypomyelination L. Saint-Val, et al.
ADULT BRAINPEDIATRICS
792 Susceptibility-Weighted Angiography for the Follow-Up of BrainArteriovenous Malformations Treated with Stereotactic RadiosurgeryS. Finitsis, et al.
ADULT BRAIN
798 Image Processing to Improve Detection of Mesial Temporal Sclerosis inAdults F. Dahi, et al.
ADULT BRAIN
802 Visualization of Aneurysmal Neck and Dome after Coiling with 3DMultifusion Imaging of Silent MRA and FSE-MR CisternographyT. Satoh, et al.
INTERVENTIONAL
808 Usefulness of Silent MR Angiography for Intracranial AneurysmsTreated with a Flow-Diverter Device H. Oishi, et al.
INTERVENTIONAL
815 Pointwise Encoding Time Reduction with Radial Acquisition withSubtraction-Based MRA during the Follow-Up of Stent-Assisted CoilEmbolization of Anterior Circulation Aneurysms Y.J. Heo, et al.
INTERVENTIONAL
A JNRAMERICAN JOURNAL OF NEURORADIOLOGYM A Y 2 0 1 9V O L U M E 4 0N U M B E R 5W W W . A J N R . O R G
Publication Preview at www.ajnr.org features articles released in advance of print.Visit www.ajnrblog.org to comment on AJNR content and chat with colleaguesand AJNR’s News Digest at http://ajnrdigest.org to read the stories behind thelatest research in neuroimaging.
AJNR (Am J Neuroradiol ISSN 0195– 6108) is a journal published monthly, owned and published by the American Society of Neuroradiology (ASNR),800 Enterprise Drive, Suite 205, Oak Brook, IL 60523. Annual dues for the ASNR include $170.00 for journal subscription. The journal is printed byCadmus Journal Services, 5457 Twin Knolls Road, Suite 200, Columbia, MD 21045; Periodicals postage paid at Oak Brook, IL and additional mailingoffices. Printed in the U.S.A. POSTMASTER: Please send address changes to American Journal of Neuroradiology, P.O. Box 3000, Denville, NJ 07834,U.S.A. Subscription rates: nonmember $410 ($480 foreign) print and online, $320 online only; institutions $470 ($540 foreign) print and basic online,$935 ($1000 foreign) print and extended online, $380 online only (basic), extended online $825; single copies are $35 each ($40 foreign). Indexed byPubMed/Medline, BIOSIS Previews, Current Contents (Clinical Medicine and Life Sciences), EMBASE, Google Scholar, HighWire Press, Q-Sensei,RefSeek, Science Citation Index, SCI Expanded, Meta/CZI and ReadCube. Copyright © American Society of Neuroradiology.

820 Treatment of Wide-Neck Intracranial Aneurysms with the WovenEndoBridge Device Associated with Stenting: A Single-CenterExperience F. Cagnazzo, et al.
INTERVENTIONAL
827 Image Quality of Low-Dose Cerebral Angiography and Effectiveness ofClinical Implementation on Diagnostic and NeurointerventionalProcedures for Intracranial Aneurysms J. Choi, et al.
INTERVENTIONAL
834 Differences in Cerebral Aneurysm Rupture Rate According to ArterialAnatomies Depend on the Hemodynamic Environment S. Fukuda, et al.
INTERVENTIONAL
840 Impact of Balloon-Guiding Catheter Location on Recanalization inPatients with Acute Stroke Treated by Mechanical ThrombectomyD.E. Jeong, et al.
INTERVENTIONAL
845 Angiographic and Clinical Features of Noninvoluting CongenitalHemangiomas A. Patel, et al.
INTERVENTIONALPEDIATRICS
849 Reduced Jet Velocity in Venous Flow after CSF Drainage: AssessingHemodynamic Causes of Pulsatile Tinnitus H. Haraldsson, et al.
HEAD & NECK
855 The Black Turbinate Sign, A Potential Diagnostic Pitfall: Evaluation ofthe Normal Enhancement Patterns of the Nasal Turbinates Q. Han, et al.
HEAD & NECK
862 Neuroimaging Findings in Moebius Sequence D.A. Herrera, et al. PEDIATRICS
866 Comparison of Iterative Model Reconstruction versus Filtered Back-Projection in Pediatric Emergency Head CT: Dose, Image Quality, andImage-Reconstruction Times R.N. Southard, et al.
PEDIATRICS
872 Pediatric Atypical Teratoid/Rhabdoid Tumors of the Brain:Identification of Metabolic Subgroups Using In Vivo 1H-MRSpectroscopy B. Tamrazi, et al.
PEDIATRICS
878 Intravoxel Incoherent Motion MR Imaging of Pediatric Intracranial Tumors:Correlation with Histology and Diagnostic Utility K. Kikuchi, et al.
PEDIATRICS
885 Brain and CSF Volumes in Fetuses and Neonates with AntenatalDiagnosis of Critical Congenital Heart Disease: A Longitudinal MRIStudy N.H.P. Claessens, et al.
PEDIATRICS
892 Focal Cortical Dysplasia and Refractory Epilepsy: Role of MultimodalityImaging and Outcome of Surgery S. Jayalakshmi, et al.
PEDIATRICS
899 Persisting Embryonal Infundibular Recess in Morning Glory Syndrome:Clinical Report of a Novel Association A. D’Amico, et al.
PEDIATRICSHEAD & NECK
903 Oculodentodigital Dysplasia: A Hypomyelinating Leukodystrophy witha Characteristic MRI Pattern of Brain Stem Involvement I. Harting, et al.
PEDIATRICS
908 Lumbar Spinal Stenosis Severity by CT or MRI Does Not PredictResponse to Epidural Corticosteroid versus Lidocaine InjectionsF.A. Perez, et al.
SPINE
916 It Is Not Necessary to Discontinue Seizure Threshold–LoweringMedications Prior to Myelography M. Krupa, et al.
SPINEINTERVENTIONAL
920 Assessing Vascularity of Osseous Spinal Metastases with Dual-EnergyCT-DSA: A Pilot Study Compared with Catheter AngiographyY.-C. Huang, et al.
SPINE
926 35 YEARS AGO IN AJNR

ONLINE FEATURES
LETTERS
E20 Use of Balanced Steady-State Free Precession Sequences in Evaluationof Drop Metastases A. Vossough, et al.
E21 Reply K. Buch, et al.
E22 Across the Pons and to the Milky Way: Where Are the NeuroradiologyPublications? V.T. Lehman
E24 Radiogenomics in Medulloblastoma: Can the Human Brain Competewith Artificial Intelligence and Machine Learning? A. Dasgupta, et al.
BOOK REVIEWS R.M. Quencer, Section EditorPlease visit www.ajnrblog.org to read and comment on Book Reviews.
T2-weighted MRIand spectra ofsupratentorial AT/RTwith ASCL1 expression(upper), a posteriorfossa AT/RT withASCL1 expression(middle), and posteriorfossa AT/RT withoutASCL1 expression (lower).Cr, Cho, and mIns arereadily detectable inthe spectra ofsupratentorial andposterior fossaASCL1-expressing AT/RTs,whereas only Chois clearly detectablein the ASCL1-nonexpressingposterior fossa AT/RT.
Indicates Editor’sChoices selection
Indicates Fellows’Journal Club selection
Indicates open access to non-subscribers at www.ajnr.org
Indicates article withsupplemental on-line table
Indicates article withsupplemental on-line photo
Indicates article withsupplemental on-line video
Evidence-BasedMedicine Level 1
Evidence-BasedMedicine Level 2

AJNR AMERICAN JOURNAL OF NEURORADIOLOGYPublication Preview at www.ajnr.org features articles released in advance of print.Visit www.ajnrblog.org to comment on AJNR content and chat with colleaguesand AJNR’s News Digest at http://ajnrdigest.org to read the stories behind thelatest research in neuroimaging.
MAY 2019 • VOLUME 40 • NUMBER 5 • WWW.AJNR.ORG
Official Journal:American Society of Neuroradiology
American Society of Functional NeuroradiologyAmerican Society of Head and Neck Radiology
American Society of Pediatric NeuroradiologyAmerican Society of Spine Radiology
EDITOR-IN-CHIEF
Jeffrey S. Ross, MDProfessor of Radiology, Department of Radiology,
Mayo Clinic College of Medicine, Phoenix, AZ
SENIOR EDITORS
Harry J. Cloft, MD, PhDProfessor of Radiology and Neurosurgery,
Department of Radiology, Mayo Clinic College ofMedicine, Rochester, MN
Thierry A.G.M. Huisman, MDRadiologist-in-Chief, Texas Children’s Hospital,
Houston, TX
Yvonne W. Lui, MDAssociate Professor of Radiology,
Chief of Neuroradiology,New York University School of Medicine,
New York, NY
C.D. Phillips, MD, FACRProfessor of Radiology, Weill Cornell MedicalCollege, Director of Head and Neck Imaging,New York-Presbyterian Hospital, New York, NY
Lubdha M. Shah, MDAssociate Professor of Radiology and Director ofSpine Imaging, University of Utah Department of
Radiology and Imaging Sciences, Salt Lake City, UT
Charles M. Strother, MDProfessor of Radiology, Emeritus, University of
Wisconsin, Madison, WI
STATISTICAL SENIOR EDITOR
Bryan A. Comstock, MSSenior Biostatistician,
Department of Biostatistics,University of Washington, Seattle, WA
ARTIFICIAL INTELLIGENCE DEPUTY EDITOR
Christopher G. Filippi, MDProfessor and Vice Chair of Biomedical and
Translational Science,Donald and Barbara Zucker School of Medicine at
Hofstra/Northwell,Lenox Hill Hospital and Greenwich Village
Healthplex, New York, NY
EDITORIAL BOARDAshley H. Aiken, Atlanta, GALea M. Alhilali, Phoenix, AZKubilay Aydin, Istanbul, TurkeyJohn D. Barr, Dallas, TXAri Blitz, Baltimore, MDBarton F. Branstetter IV, Pittsburgh, PAJonathan L. Brisman, Lake Success, NYKeith Cauley, Danville, PAJames Y. Chen, San Diego, CAAsim F. Choudhri, Memphis, TNDaniel Chow, Irvine, CAJ. Matthew Debnam, Houston, TXSeena Dehkharghani, New York, NYYonghong Ding, Rochester, MNClifford J. Eskey, Hanover, NHSaeed Fakhran, Phoenix, AZMassimo Filippi, Milan, ItalyReza Forghani, Montreal, Quebec, CanadaNils D. Forkert, Calgary, Alberta, CanadaWende N. Gibbs, Los Angeles, CAChristine M. Glastonbury, San Francisco, CAJohn L. Go, Los Angeles, CAPhilipp Gölitz, Erlangen, GermanyAllison Grayev, Madison, WIBrent Griffith, Detroit, MIAjay Gupta, New York, NYRakesh Kumar Gupta, Haryana, IndiaLotfi Hacein-Bey, Sacramento, CAChristopher P. Hess, San Francisco, CAAndrei Holodny, New York, NYBenjamin Huang, Chapel Hill, NCMahesh V. Jayaraman, Providence, RIValerie Jewells, Chapel Hill, NCChristof Karmonik, Houston, TXTimothy J. Kaufmann, Rochester, MNHillary R. Kelly, Boston, MAToshibumi Kinoshita, Akita, JapanKennith F. Layton, Dallas, TXAlexander Lerner, Los Angeles, CAMichael Lev, Boston, MAKarl-Olof Lovblad, Geneva, SwitzerlandFranklin A. Marden, Chicago, ILJoseph C. McGowan, Merion Station, PAStephan Meckel, Freiburg, GermanyChristopher J. Moran, St. Louis, MOTakahisa Mori, Kamakura City, JapanSuresh Mukherji, Ann Arbor, MIAlexander J. Nemeth, Chicago, ILRenato Hoffmann Nunes, Sao Paulo, BrazilSasan Partovi, Cleveland, OHLaurent Pierot, Reims, FranceJay J. Pillai, Baltimore, MDWhitney B. Pope, Los Angeles, CAJoana Ramalho, Lisbon, PortugalOtto Rapalino, Boston, MA
Alex Rovira-Canellas, Barcelona, SpainPaul M. Ruggieri, Cleveland, OHAmit M. Saindane, Atlanta, GAErin Simon Schwartz, Philadelphia, PALubdha M. Shah, Salt Lake City, UTMaksim Shapiro, New York, NYTimothy Shepherd, New York, NYMark S. Shiroishi, Los Angeles, CABruno P. Soares, Baltimore, MDMaria Vittoria Spampinato, Charleston, SCKhin Khin Tha, Sapporo, Hokkaido, JapanKrishnamoorthy Thamburaj, Hershey, PACheng Hong Toh, Taipei, TaiwanAquilla S. Turk, Greenville, SCAnja G. van der Kolk, Utrecht, the NetherlandsWillem Jan van Rooij, Tilburg, NetherlandsArastoo Vossough, Philadelphia, PAElysa Widjaja, Toronto, Ontario, CanadaMax Wintermark, Stanford, CARonald L. Wolf, Philadelphia, PAKei Yamada, Kyoto, JapanCarlos Zamora, Chapel Hill, NCVahe M. Zohrabian, New Haven, CT
EDITORIAL FELLOWAlireza Radmanesh, New York, NY
SPECIAL CONSULTANTS TO THE EDITORAJNR Blog EditorNeil Lall, Denver, COCase of the Month EditorNicholas Stence, Aurora, COCase of the Week EditorsJuan Pablo Cruz, Santiago, ChileSapna Rawal, Toronto, Ontario, CanadaClassic Case EditorSandy Cheng-Yu Chen, Taipei, TaiwanHealth Care and Socioeconomics EditorPina C. Sanelli, New York, NYPhysics EditorGreg Zaharchuk, Stanford, CAPodcast EditorWende N. Gibbs, Los Angeles, CATwitter EditorJennifer McCarty, Houston, TX
Founding EditorJuan M. TaverasEditors Emeriti
Mauricio Castillo, Robert I. Grossman,Michael S. Huckman, Robert M. Quencer
Managing EditorKaren HalmAssistant Managing EditorLaura WilhelmCommunications CoordinatorRebecca ArtzExecutive Director, ASNRMary Beth Hepp

PERSPECTIVES
Title: Deep Brain Stimulation. This is an artistically modified illustration based on a real patient dataset. It depicts functional structures such as nuclei and white matterfibers as well as the human being itself. By stimulating these deep structures in the brain, an improvement of the quality of life can be achieved for many patients. Theillustration was painted using Procreate software on an iPad Pro, based on a dataset from the Brainlab Elements software (Brainlab, Munich, Germany).
Marie T. Kruger, MD, and Peter C. Reinacher, MD, Freiburg Medical Center and Faculty of Medicine, University of Freiburg, Freiburg, Germany
AJNR Am J Neuroradiol 40:757 May 2019 www.ajnr.org 757

REVIEW ARTICLE
Non-Contrast-Enhancing Tumor: A New Frontier inGlioblastoma Research
X A. Lasocki and X F. Gaillard
ABSTRACTSUMMARY: There is a growing understanding of the prognostic importance of non-contrast-enhancing tumor in glioblastoma, and recentattempts at more aggressive management of this component using neurosurgical resection and radiosurgery have been shown to prolongsurvival. Optimizing these therapeutic strategies requires an understanding of the features that can distinguish non-contrast-enhancingtumor from other processes, in particular vasogenic edema; however, the limited and heterogeneous manner in which it has been definedin the literature limits clinical translation. This review covers pertinent literature on our growing understanding of non-contrast-enhancingtumor and focuses on key conventional MR imaging features for improving its delineation. Such features include subtle differences in thedegree of FLAIR hyperintensity, gray matter involvement, and focal mass effect. Improved delineation of tumor from edema will facilitatemore aggressive management of this component and potentially realize associated survival benefits.
ABBREVIATIONS: CET � contrast-enhancing tumor; FET � [18F]-fluoroethyl-L-tyrosine; GBM � glioblastoma; nCET � non-contrast-enhancing tumor
The molecular characterization of gliomas has been the focus of
recent glioma research. While our growing understanding of
the genetics of gliomas, now reflected in the updated World
Health Organization classification, provides great hope, it is easy
to forget that currently, this does not substantially affect treat-
ment options. For example, glioblastomas (GBMs) have recently
been subclassified into those with a mutation in the isocitrate
dehydrogenase (IDH) gene and those without a mutation
(known as IDH wild-type).1 While IDH mutant GBMs have a
significantly better prognosis than IDH wild-type tumors,1,2 con-
ventional treatment for both subtypes currently remains the
same.3 Unlike the treatment of many extracranial malignancies,
which has been revolutionized by the development of immuno-
therapy4 and monoclonal antibodies against key drivers of tumor-
igenesis,5 progress in the treatment of diffuse gliomas has been
slower and they remain largely incurable. Until new treatment
options enter clinical practice, it is, therefore, important to opti-
mize existing therapies. This is arguably of greater importance
now than ever before because with longer survival, also comes the
growing prospect of living long enough to benefit from new
emerging therapeutic options.
GBM is the most aggressive—and, unfortunately, most
common—form of diffuse glioma.1 The treatment of GBM typi-
cally consists of maximal safe neurosurgical resection followed by
adjuvant chemoradiotherapy.3 Gross macroscopic resection of
the contrast-enhancing tumor (CET) component of GBMs is as-
sociated with longer survival6-8 and thus represents the neurosur-
gical standard of care. Despite satisfactory resection and adjuvant
chemoradiotherapy, however, local recurrence of GBM is almost
inevitable due to tumor cells infiltrating beyond the CET compo-
nent.9 Often, at least a portion of the tumor extending beyond the
contrast-enhancing margin is visible with MR imaging and is
known as non-contrast-enhancing tumor (nCET), usually best
visualized on T2-weighted FLAIR imaging.
The frequency with which complete or near-complete resec-
tion of the CET component can be achieved is increasing due to
technologic advances, including neuronavigation techniques, flu-
orescence-guided surgery, and intraoperative MR imaging, which
are translating into improved survival.10-12 The potential gains
from improved resection of the CET component are thus plateau-
ing, increasing the importance of residual nCET. Historically,
nCET in the context of a GBM has been thought to be of a lower
grade. This view is being refuted because such nCET frequently
progresses faster than one would expect purely on the basis of
Received December 8, 2018; accepted after revision February 5, 2019.
From the Department of Cancer Imaging (A.L.), Peter MacCallum Cancer Centre,Melbourne, Victoria, Australia; Sir Peter MacCallum Departments of Oncology(A.L.) and Radiology (F.G.), University of Melbourne, Parkville, Victoria, Australia;and Department of Radiology (F.G.), Royal Melbourne Hospital, Parkville, Victoria,Australia.
Paper previously presented, in part, at: Annual Meeting of the European Society ofNeuroradiology, September 19 –23, 2018; Rotterdam, the Netherlands.
Please address correspondence to Arian Lasocki, MD, Department of Cancer Imag-ing, Peter MacCallum Cancer Centre, Grattan St, Melbourne, Victoria, Australia3000; e-mail: [email protected]
Indicates open access to non-subscribers at www.ajnr.org
http://dx.doi.org/10.3174/ajnr.A6025
758 Lasocki May 2019 www.ajnr.org

imaging appearances, with even distant areas of nCET rapidly
evolving to CET in patients with IDH wild-type GBM.13 The high
malignant potential of the nCET component is supported by our
growing understanding of the genetics of gliomas, with IDH wild-
type grade II and III tumors typically behaving more like GBMs
than their IDH mutant counterparts of equivalent grade,1 leading
to the colloquial term “stealth glioblastomas.” If anything, the
nCET component of a GBM could be expected to be more ad-
vanced genetically than in lower grade IDH wild-type tumors be-
cause dedifferentiation has already occurred in another portion of
the tumor. The nCET component is also typically highly cellular.
Eidel et al14 recently showed that nCET had the highest content of
viable tumor cells— higher than that present within the CET or
necrotic components.
Non-Contrast-Enhancing Tumor Affects PrognosisIt is increasingly being recognized that the nCET component of a
GBM affects prognosis. Jain et al15 showed that both nCET cross-
ing the midline and elevated relative cerebral blood volume
within the nCET component are associated with shorter survival.
Similarly, Lasocki et al16 found that those with peripheral GBMs
with substantial cortical nCET (a subset of the total nCET) have
shorter survival than those with peripheral tumors without this
component. These findings are supported by studies assessing the
postoperative residual nCET component. Grabowski et al17
found that T2/FLAIR residual volume was a significant predictor
of survival on both univariate and multivariate analysis. These
results have recently been validated by a multicenter study show-
ing that high postoperative residual nonenhancing volume con-
veyed a worse prognosis.18
IDH wild-type GBMs are much more common than their IDH
mutant counterparts1 and almost certainly accounted for most
tumors in the above studies. Thus, prognostic significance can
most confidently be attached to residual nCET for an IDH wild-
type GBM, but it is less clear for IDH mutant GBMs. The associ-
ation between a greater proportion of nCET and the presence of
an IDH mutation was first described by Carrillo et al.19 Substantial
nCET is more common in IDH mutant GBMs, though also relatively
common in IDH wild-type GBMs, limiting the strength of this asso-
ciation.20 Specifically, IDH mutations are present in only about 5% of
all glioblastomas,2 while substantial (�33%) nCET is present in
about 21% of IDH wild-type glioblastomas.20 Thus, a glioblastoma
with substantial nCET is nevertheless more likely to be IDH wild-
type than IDH mutant.20 Knowledge of the IDH status is, therefore,
important in determining the significance of nCET. While greater
residual nCET generally conveys a worse prognosis provided it is not
simply related to IDH mutant status, the survival benefit conferred by
an IDH mutation is likely to substantially outweigh the detrimental
effect of greater residual nCET.
The Effect of Antiangiogenic TherapyAntiangiogenic agents such as bevacizumab and cediranib often
produce a rapid decrease in the degree of contrast enhancement as
a result of reconstitution of the disrupted blood-brain barrier.
This does not represent a true response, however; thus, the phe-
nomenon is known as a pseudoresponse.21 Assessment of CET is
less reliable in these patients, and monitoring nCET takes on
greater importance. This is reflected in the updated Response As-
sessment in Neuro-Oncology criteria,22 and inclusion of T2/
FLAIR imaging in patients treated with bevacizumab has been
shown to improve the prediction of survival beyond that achieved
by assessment based solely on postcontrast imaging.23,24 Because
T2 hyperintensity can have many contributors, assessment of
nCET requires determining that the increase in T2 hyperintensity
is attributable to tumor progression.24 Thus, knowledge of the
features of nCET is critical. The morphology of nCET in patients
treated with antiangiogenic agents may also be important, with
Nowosielski et al25 having shown that a circumscribed pattern of
progressive T2 hyperintensity in patients treated with bevaci-
zumab is associated with shorter survival compared with a diffuse
pattern.
Neurosurgical Resection of Non-Contrast-EnhancingTumorA growing appreciation of the importance of nCET in GBM has
led some authors to suggest extending the surgical resection to the
nCET component, rather than solely focusing on CET.15,16 The
goal, at this stage, remains to delay progression and the develop-
ment of symptomatic recurrence rather than provide a cure. A
similar strategy was successfully used in grade II gliomas by
Yordanova et al,26 who performed “supratotal resection” in 15
cases. This was defined as extension of the resection beyond the
area of signal abnormality visible on MR imaging, compared
with confining the resection to the region of abnormal signal.26
This cohort had a lower rate of anaplastic transformation and a
lower rate of requiring adjuvant treatment compared with a
control cohort.26
Recent effort to more aggressively resect nCET in GBM has
also shown additional prognostic benefit over that achieved by
gross macroscopic resection of the CET component alone. Li et
al27 showed that in patients in whom total resection of the CET
component was achieved, resection of �53.21% of the surround-
ing FLAIR abnormality conveyed an additional survival benefit.
These patients had a median survival of 20.7 months, compared
with 15.5 months when �53.21% of the surrounding FLAIR ab-
normality was resected.27 Pessina et al28 had similar results,
though they examined the extent of resection differently. Patients
who had undergone supratotal resection, namely those in whom
the entirety of the CET component and the surrounding FLAIR
hyperintensity were resected, had an impressive median survival
of 29 months.28 Of note, this definition varies from that used by
Yordanova et al26 because they did not aim to extend the resection
beyond the area of FLAIR hyperintensity.28 In contrast, patients
with gross total resection (defined as �90%) of the CET compo-
nent and variable resection of the infiltrative tumor component
had a median survival of 16 months. For patients with gross total
resection of the CET component, 45% resection of the infiltrative
tumor component was the threshold that conveyed a survival
benefit, achieving a 2-year survival rate of 54% compared with
12% when resection of the infiltrative component was less exten-
sive.28 The thresholds identified by these authors are somewhat
arbitrary, and in practice, the extent will be limited by the neuro-
surgeon’s ability to visualize and safely resect the nCET compo-
nent. Most interesting, Beiko et al29 found that greater resection
AJNR Am J Neuroradiol 40:758 – 65 May 2019 www.ajnr.org 759

of nCET was associated with improved prognosis only in IDH
mutant malignant astrocytomas (grades III and IV), but not in
IDH wild-type tumors of the same grades.
Although the results of these neurosurgical studies are impres-
sive, the limited and heterogeneous manner in which the nCET
component was defined in these studies raises questions. The def-
inition of Li et al27 was simply that of the “surrounding FLAIR
abnormality,” and this is overly simplistic on the basis of our
knowledge of gliomas. GBMs are typically associated with at least
some surrounding edema; thus, it is difficult to determine how
much of the nCET component was truly resected, and this will
have been dependent on the relative contributions of nCET and
edema to the overall area of FLAIR abnormality. While one can
assume that some effort was made to target areas that were
thought to represent nCET, presumably based on the MR imaging
appearances, the limited description of the methods of Li et al
limits translation into clinical practice. The description provided
by Pessina et al28 is similarly unclear. While they do discuss the
surrounding FLAIR abnormality representing infiltrative tumor,
there is no indication as to how or if this was differentiated from
vasogenic edema.
Similar limitations are present in the aforementioned studies
assessing postoperative residual FLAIR hyperintensity. Grabowski et
al17 acknowledged that a portion of the residual FLAIR hyperin-
tensity may represent edema, both persisting after resection of the
tumor (because this takes a variable time to resolve) and related to
the surgery itself. The possibility of persistent edema is also rele-
vant to the association with prognosis because Pope et al30 have
shown that more pronounced edema at diagnosis is associated
with worse survival. Thus, unless effort has been made to specif-
ically distinguish nCET from edema, part of the worse prognosis
related to a greater amount of residual FLAIR hyperintensity post-
operatively could simply relate to a tumor that induces more
edema, rather than necessarily residual nCET.
The patterns of nCET vary substantially among patients,31
though the literature on this topic is limited. These patterns them-
selves may have prognostic implications31 that have not been ac-
counted for in the above studies. For example, nCET having a
masslike morphology or preferentially involving the gray matter
may be associated with a better prognosis than a pattern infiltrat-
ing the white matter.31 These more favorable morphologies are
also generally easier to delineate, which is important if one is
planning more aggressive resection. Furthermore, their typically
more superficial location (compared with nCET involving the
white matter) is likely to be associated with less surgical morbid-
ity, again assisting surgical resection. There is thus the potential
for selection bias in the above neurosurgical studies because more
aggressive resection may have been facilitated by the nCET having
a morphology that, in itself, conveyed an improved prognosis,
compared with patients with a more infiltrative—and thus more
difficult to resect—pattern of nCET.
Such considerations are supported by the results of Baldock
et al,32 who divided GBMs into “nodular” and “diffuse” based on
a mathematic calculation of “relative invasiveness.” This study
found that nodular tumors received a significant survival benefit
from gross total resection of CET over subtotal resection or bi-
opsy, but diffuse tumors did not. While this study examined re-
section of CET rather than nCET, the morphologic patterns as-
sessed are equally relevant to nCET. Similarly, IDH mutant
malignant astrocytomas (grades III and IV) have been shown to
be more amenable to complete resection of CET than their IDH
wild-type counterparts.29 IDH status was not disclosed in the
study by Li et al27; thus, a component of the improved prognosis
attributed to more extensive resection could have related to a
greater proportion of IDH mutant tumors, which will in itself
have conveyed a better prognosis. Nevertheless, the effect of the
potential for a greater proportion of IDH mutant tumors is likely
to have been small, given the low frequency of IDH mutations in
glioblastoma,2 well-demonstrated by the cohort of Pessina et al28
(with only 3.2% of tumors being IDH mutant).
Despite these potential confounders, the size of the survival ben-
efit described is such that there is nevertheless likely to be true benefit
to more aggressive resection, and this benefit is intuitive given our
knowledge of the growth patterns of GBM. The same neurosurgical
advances aiding resection of CET, as briefly outlined above, will also
facilitate more aggressive resection of nCET. As a result, the identifi-
cation and delineation of nCET are likely to become an increasingly
important element of the preoperative MR imaging assessment of all
diffuse gliomas, irrespective of grade.
New Avenues in Radiation OncologyAggressive resection of CET is not always possible, however, for
example, due to the proximity to eloquent structures and the as-
sociated risks of operative morbidity. Such considerations are am-
plified if aiming to extend the resection to nCET because func-
tioning brain tissue is potentially embedded with the nCET
component. This feature highlights the important role of optimal
adjuvant radiation therapy. Postoperative radiation therapy, ac-
cording to the protocol of Stupp et al,33 has been the standard of
care for GBM for many years, though tumor recurrence remains
largely inevitable. This has prompted investigation into more ag-
gressive management of the nCET component with radiation
therapy, and this has also been shown to convey a survival bene-
fit.34 Duma et al34 have described a technique of performing ra-
diosurgery to the “leading edge” of a GBM, namely the migratory
white matter pathways adjacent to and leading away from the CET
component. The patients in their series had a median overall sur-
vival of 23 months, which is substantially longer than that in other
comparable series.33,34 These results provide further evidence
supporting aggressive management of nCET in GBMs and again
highlight the importance of not only high-quality pretreatment
imaging but also careful re-imaging shortly before commencing
radiation therapy. Edema related to CET may have receded, aid-
ing delineation of nCET. Volumetric FLAIR imaging is likely to be
of particular value in this context.
Identification of Non-Contrast-Enhancing TumorTo facilitate more aggressive management of nCET, there is a
need to improve its accurate identification. In the preoperative
setting, the main contributors to the FLAIR hyperintensity sur-
rounding the CET component of a glioma are nCET and vaso-
genic edema. It is well-accepted that there is some overlap of these
2 etiologies, in particular adjacent to the CET component, but
often a confident distinction of the dominant process is possible
760 Lasocki May 2019 www.ajnr.org

for at least a portion of the signal abnormality. We aimed, there-
fore, to provide and illustrate criteria that can help distinguish
nCET and edema. Confirming that an abnormality on MR imag-
ing correlates with nCET histopathologically is problematic be-
cause it is frequently not resected or separately biopsied. Even a
comprehensive postmortem examination is limited by difficulties
with coregistration and sampling error. As a result, these imaging
criteria have been developed, in part, on the basis of knowledge of
the imaging appearances and evolution, but they are nevertheless
well accepted as evidenced by the description of similar strategies
in the widely used Visually Accessible Rembrandt Images set of
MR imaging features of glioma.35 As technology improves, these
principles are increasingly being validated by studies correlating
imaging-guided biopsies with colocalized MR imaging metrics.
Although advanced MR imaging techniques such as MR spec-
troscopy and perfusion have value in determining the extent of
nCET preoperatively, they are not universally available and are
time-consuming and operator-dependent. These practical con-
siderations are particularly relevant given the increasing use of
intraoperative MR imaging because
assessment of residual nCET intraoper-
atively is based on conventional se-
quences. Even when advanced se-
quences are used preoperatively, it is
useful to correlate these with the appear-
ance on conventional sequences. For ex-
ample, if CBV is elevated outside the
CET component, there may be correla-
tive features on T2WI and FLAIR.
Edema has several characteristic fea-
tures. Edema is typically confined to the
white matter, sparing the cortical ribbon
and thus producing the characteristic
fingerlike appearance (Fig 1).30 Corre-
lating with standard T2WI is useful for
identifying this appearance because the
cortex is usually better visualized.16,30
Similar gray matter sparing of deep gray
matter nuclei is also seen, with edema
extending along the internal and exter-
nal capsules (Fig 2). In contrast, gliomas
frequently involve gray matter,16,36-38
and such involvement can be confidently
diagnosed as nCET (Figs 3 and 4).16
The white matter involvement of
edema is typically relatively concentric
around the enhancing lesions, otherthan where hindered by the relativebarrier afforded by the gray matter. Incontrast, eccentric extension of FLAIRhyperintensity, not accounted for by an-atomic constraints, is highly suggestiveof nCET. Wallerian degeneration is themain differential to consider for FLAIRhyperintensity along the course of thecorticospinal tract, but this is most com-
monly seen in the context of a resection
cavity or large necrotic tumor involving
the precentral gyrus. There is also usually appreciable volume loss,
aiding the distinction. Parenchymal expansion, conversely, is a
useful feature to confirm nCET, particularly in the corpus callo-
sum (Fig 4).
Another useful differentiating feature is that edema is typically
associated with more marked T2 and FLAIR hyperintensity than
nCET,30 often fading somewhat toward the periphery of the
edema. In contrast, FLAIR hyperintensity related to nCET is usu-
ally more subtle. The relatively mild FLAIR hyperintensity of
nCET is well-demonstrated in the gray matter where the distinc-
tion is simpler but can also be seen in the white matter, for exam-
ple with an eccentric tongue of nCET extending beyond an area
that has the typical appearance of edema. This finding has recently
been supported by a study correlating radiographically localized
biopsies with multiparametric MR imaging, which found that T2
FLAIR was inversely correlated with cell density.39 These results
support mild FLAIR hyperintensity being a feature of nCET, while
greater hyperintensity indicates that edema dominates.
FIG 1. FLAIR imaging (A) showing edema around the CET component (B) sparing the cortex(arrowhead), producing the characteristic fingerlike appearance.
FIG 2. FLAIR imaging (A) showing edema extending around the left lentiform nucleus. The CETcomponent is shown in B.
AJNR Am J Neuroradiol 40:758 – 65 May 2019 www.ajnr.org 761
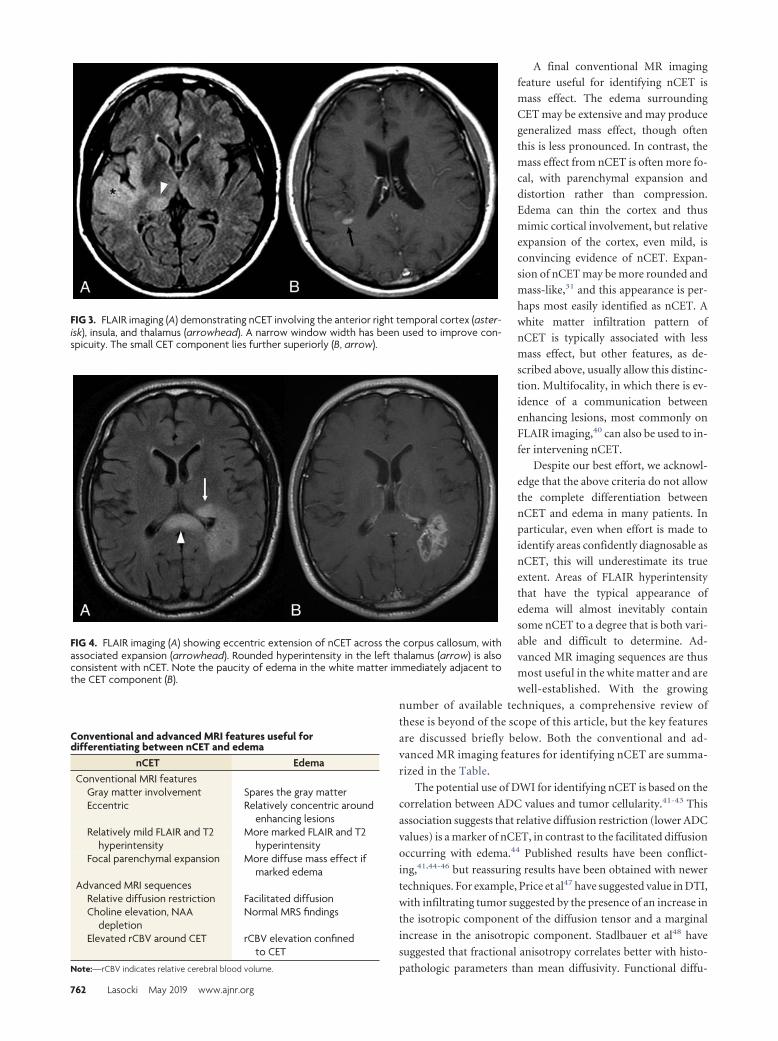
A final conventional MR imaging
feature useful for identifying nCET is
mass effect. The edema surrounding
CET may be extensive and may produce
generalized mass effect, though often
this is less pronounced. In contrast, the
mass effect from nCET is often more fo-
cal, with parenchymal expansion and
distortion rather than compression.
Edema can thin the cortex and thus
mimic cortical involvement, but relative
expansion of the cortex, even mild, is
convincing evidence of nCET. Expan-
sion of nCET may be more rounded and
mass-like,31 and this appearance is per-
haps most easily identified as nCET. A
white matter infiltration pattern of
nCET is typically associated with less
mass effect, but other features, as de-
scribed above, usually allow this distinc-
tion. Multifocality, in which there is ev-
idence of a communication between
enhancing lesions, most commonly on
FLAIR imaging,40 can also be used to in-
fer intervening nCET.
Despite our best effort, we acknowl-
edge that the above criteria do not allow
the complete differentiation between
nCET and edema in many patients. In
particular, even when effort is made to
identify areas confidently diagnosable as
nCET, this will underestimate its true
extent. Areas of FLAIR hyperintensity
that have the typical appearance of
edema will almost inevitably contain
some nCET to a degree that is both vari-
able and difficult to determine. Ad-
vanced MR imaging sequences are thus
most useful in the white matter and are
well-established. With the growing
number of available techniques, a comprehensive review of
these is beyond of the scope of this article, but the key features
are discussed briefly below. Both the conventional and ad-
vanced MR imaging features for identifying nCET are summa-
rized in the Table.
The potential use of DWI for identifying nCET is based on the
correlation between ADC values and tumor cellularity.41-43 This
association suggests that relative diffusion restriction (lower ADC
values) is a marker of nCET, in contrast to the facilitated diffusion
occurring with edema.44 Published results have been conflict-
ing,41,44-46 but reassuring results have been obtained with newer
techniques. For example, Price et al47 have suggested value in DTI,
with infiltrating tumor suggested by the presence of an increase in
the isotropic component of the diffusion tensor and a marginal
increase in the anisotropic component. Stadlbauer et al48 have
suggested that fractional anisotropy correlates better with histo-
pathologic parameters than mean diffusivity. Functional diffu-
FIG 3. FLAIR imaging (A) demonstrating nCET involving the anterior right temporal cortex (aster-isk), insula, and thalamus (arrowhead). A narrow window width has been used to improve con-spicuity. The small CET component lies further superiorly (B, arrow).
FIG 4. FLAIR imaging (A) showing eccentric extension of nCET across the corpus callosum, withassociated expansion (arrowhead). Rounded hyperintensity in the left thalamus (arrow) is alsoconsistent with nCET. Note the paucity of edema in the white matter immediately adjacent tothe CET component (B).
Conventional and advanced MRI features useful fordifferentiating between nCET and edema
nCET EdemaConventional MRI features
Gray matter involvement Spares the gray matterEccentric Relatively concentric around
enhancing lesionsRelatively mild FLAIR and T2
hyperintensityMore marked FLAIR and T2
hyperintensityFocal parenchymal expansion More diffuse mass effect if
marked edemaAdvanced MRI sequences
Relative diffusion restriction Facilitated diffusionCholine elevation, NAA
depletionNormal MRS findings
Elevated rCBV around CET rCBV elevation confinedto CET
Note:—rCBV indicates relative cerebral blood volume.
762 Lasocki May 2019 www.ajnr.org
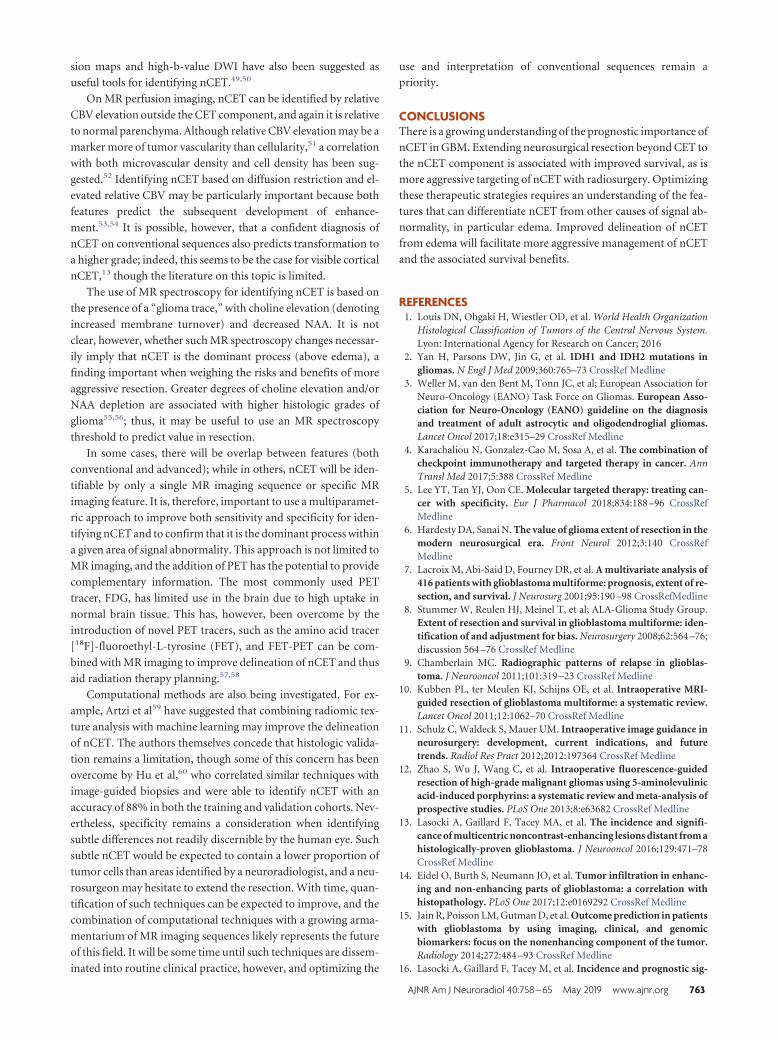
sion maps and high-b-value DWI have also been suggested as
useful tools for identifying nCET.49,50
On MR perfusion imaging, nCET can be identified by relative
CBV elevation outside the CET component, and again it is relative
to normal parenchyma. Although relative CBV elevation may be a
marker more of tumor vascularity than cellularity,51 a correlation
with both microvascular density and cell density has been sug-
gested.52 Identifying nCET based on diffusion restriction and el-
evated relative CBV may be particularly important because both
features predict the subsequent development of enhance-
ment.53,54 It is possible, however, that a confident diagnosis of
nCET on conventional sequences also predicts transformation to
a higher grade; indeed, this seems to be the case for visible cortical
nCET,13 though the literature on this topic is limited.
The use of MR spectroscopy for identifying nCET is based on
the presence of a “glioma trace,” with choline elevation (denoting
increased membrane turnover) and decreased NAA. It is not
clear, however, whether such MR spectroscopy changes necessar-
ily imply that nCET is the dominant process (above edema), a
finding important when weighing the risks and benefits of more
aggressive resection. Greater degrees of choline elevation and/or
NAA depletion are associated with higher histologic grades of
glioma55,56; thus, it may be useful to use an MR spectroscopy
threshold to predict value in resection.
In some cases, there will be overlap between features (both
conventional and advanced); while in others, nCET will be iden-
tifiable by only a single MR imaging sequence or specific MR
imaging feature. It is, therefore, important to use a multiparamet-
ric approach to improve both sensitivity and specificity for iden-
tifying nCET and to confirm that it is the dominant process within
a given area of signal abnormality. This approach is not limited to
MR imaging, and the addition of PET has the potential to provide
complementary information. The most commonly used PET
tracer, FDG, has limited use in the brain due to high uptake in
normal brain tissue. This has, however, been overcome by the
introduction of novel PET tracers, such as the amino acid tracer
[18F]-fluoroethyl-L-tyrosine (FET), and FET-PET can be com-
bined with MR imaging to improve delineation of nCET and thus
aid radiation therapy planning.57,58
Computational methods are also being investigated. For ex-
ample, Artzi et al59 have suggested that combining radiomic tex-
ture analysis with machine learning may improve the delineation
of nCET. The authors themselves concede that histologic valida-
tion remains a limitation, though some of this concern has been
overcome by Hu et al,60 who correlated similar techniques with
image-guided biopsies and were able to identify nCET with an
accuracy of 88% in both the training and validation cohorts. Nev-
ertheless, specificity remains a consideration when identifying
subtle differences not readily discernible by the human eye. Such
subtle nCET would be expected to contain a lower proportion of
tumor cells than areas identified by a neuroradiologist, and a neu-
rosurgeon may hesitate to extend the resection. With time, quan-
tification of such techniques can be expected to improve, and the
combination of computational techniques with a growing arma-
mentarium of MR imaging sequences likely represents the future
of this field. It will be some time until such techniques are dissem-
inated into routine clinical practice, however, and optimizing the
use and interpretation of conventional sequences remain a
priority.
CONCLUSIONSThere is a growing understanding of the prognostic importance of
nCET in GBM. Extending neurosurgical resection beyond CET to
the nCET component is associated with improved survival, as is
more aggressive targeting of nCET with radiosurgery. Optimizing
these therapeutic strategies requires an understanding of the fea-
tures that can differentiate nCET from other causes of signal ab-
normality, in particular edema. Improved delineation of nCET
from edema will facilitate more aggressive management of nCET
and the associated survival benefits.
REFERENCES1. Louis DN, Ohgaki H, Wiestler OD, et al. World Health Organization
Histological Classification of Tumors of the Central Nervous System.Lyon: International Agency for Research on Cancer; 2016
2. Yan H, Parsons DW, Jin G, et al. IDH1 and IDH2 mutations ingliomas. N Engl J Med 2009;360:765–73 CrossRef Medline
3. Weller M, van den Bent M, Tonn JC, et al; European Association forNeuro-Oncology (EANO) Task Force on Gliomas. European Asso-ciation for Neuro-Oncology (EANO) guideline on the diagnosisand treatment of adult astrocytic and oligodendroglial gliomas.Lancet Oncol 2017;18:e315–29 CrossRef Medline
4. Karachaliou N, Gonzalez-Cao M, Sosa A, et al. The combination ofcheckpoint immunotherapy and targeted therapy in cancer. AnnTransl Med 2017;5:388 CrossRef Medline
5. Lee YT, Tan YJ, Oon CE. Molecular targeted therapy: treating can-cer with specificity. Eur J Pharmacol 2018;834:188 –96 CrossRefMedline
6. Hardesty DA, Sanai N. The value of glioma extent of resection in themodern neurosurgical era. Front Neurol 2012;3:140 CrossRefMedline
7. Lacroix M, Abi-Said D, Fourney DR, et al. A multivariate analysis of416 patients with glioblastoma multiforme: prognosis, extent of re-section, and survival. J Neurosurg 2001;95:190 –98 CrossRefMedline
8. Stummer W, Reulen HJ, Meinel T, et al; ALA-Glioma Study Group.Extent of resection and survival in glioblastoma multiforme: iden-tification of and adjustment for bias. Neurosurgery 2008;62:564 –76;discussion 564 –76 CrossRef Medline
9. Chamberlain MC. Radiographic patterns of relapse in glioblas-toma. J Neurooncol 2011;101:319 –23 CrossRef Medline
10. Kubben PL, ter Meulen KJ, Schijns OE, et al. Intraoperative MRI-guided resection of glioblastoma multiforme: a systematic review.Lancet Oncol 2011;12:1062–70 CrossRef Medline
11. Schulz C, Waldeck S, Mauer UM. Intraoperative image guidance inneurosurgery: development, current indications, and futuretrends. Radiol Res Pract 2012;2012:197364 CrossRef Medline
12. Zhao S, Wu J, Wang C, et al. Intraoperative fluorescence-guidedresection of high-grade malignant gliomas using 5-aminolevulinicacid-induced porphyrins: a systematic review and meta-analysis ofprospective studies. PLoS One 2013;8:e63682 CrossRef Medline
13. Lasocki A, Gaillard F, Tacey MA, et al. The incidence and signifi-cance of multicentric noncontrast-enhancing lesions distant from ahistologically-proven glioblastoma. J Neurooncol 2016;129:471–78CrossRef Medline
14. Eidel O, Burth S, Neumann JO, et al. Tumor infiltration in enhanc-ing and non-enhancing parts of glioblastoma: a correlation withhistopathology. PLoS One 2017;12:e0169292 CrossRef Medline
15. Jain R, Poisson LM, Gutman D, et al. Outcome prediction in patientswith glioblastoma by using imaging, clinical, and genomicbiomarkers: focus on the nonenhancing component of the tumor.Radiology 2014;272:484 –93 CrossRef Medline
16. Lasocki A, Gaillard F, Tacey M, et al. Incidence and prognostic sig-
AJNR Am J Neuroradiol 40:758 – 65 May 2019 www.ajnr.org 763

nificance of non-enhancing cortical signal abnormality in glioblas-toma. J Med Imaging Radiat Oncol 2016;60:66 –73 CrossRef Medline
17. Grabowski MM, Recinos PF, Nowacki AS, et al. Residual tumor vol-ume versus extent of resection: predictors of survival after surgeryfor glioblastoma. J Neurosurg 2014;121:1115–23 CrossRef Medline
18. Kotrotsou A, Elakkad A, Sun J, et al. Multi-center study finds post-operative residual non-enhancing component of glioblastoma as anew determinant of patient outcome. J Neurooncol 2018;139:125–33CrossRef Medline
19. Carrillo JA, Lai A, Nghiemphu PL, et al. Relationship between tumorenhancement, edema, IDH1 mutational status, MGMT promotermethylation, and survival in glioblastoma. AJNR Am J Neuroradiol2012;33:1349 –55 CrossRef Medline
20. Lasocki A, Tsui A, Gaillard F, et al. Reliability of noncontrast-en-hancing tumor as a biomarker of IDH1 mutation status in glioblas-toma. J Clin Neurosci 2017;39:170 –75 CrossRef Medline
21. Hygino da Cruz LC Jr, Rodriguez I, Domingues RC, et al. Pseudopro-gression and pseudoresponse: imaging challenges in the assess-ment of posttreatment glioma. AJNR Am J Neuroradiol 2011;32:1978 – 85 CrossRef Medline
22. Wen PY, Macdonald DR, Reardon DA, et al. Updated response as-sessment criteria for high-grade gliomas: Response Assessment inNeuro-Oncology Working Group. J Clin Oncol 2010;28:1963–72CrossRef Medline
23. Boxerman JL, Zhang Z, Safriel Y, et al. Prognostic value of contrastenhancement and FLAIR for survival in newly diagnosed glioblas-toma treated with and without bevacizumab: results from ACRIN6686. Neuro Oncol 2018;20:1400 –10 CrossRef Medline
24. Huang RY, Rahman R, Ballman KV, et al. The impact of T2/FLAIRevaluation per RANO criteria on response assessment of recurrentglioblastoma patients treated with bevacizumab. Clin Cancer Res2016;22:575– 81 CrossRef Medline
25. Nowosielski M, Wiestler B, Goebel G, et al. Progression types afterantiangiogenic therapy are related to outcome in recurrent glio-blastoma. Neurology 2014;82:1684 –92 CrossRef Medline
26. Yordanova YN, Moritz-Gasser S, Duffau H. Awake surgery for WHOgrade II gliomas within “noneloquent” areas in the left dominanthemisphere: toward a “supratotal” resection: clinical article. J Neu-rosurg 2011;115:232–39 CrossRef Medline
27. Li YM, Suki D, Hess K, et al. The influence of maximum safe resec-tion of glioblastoma on survival in 1229 patients: can we do betterthan gross-total resection? J Neurosurg 2016;124:977– 88 CrossRefMedline
28. Pessina F, Navarria P, Cozzi L, et al. Maximize surgical resectionbeyond contrast-enhancing boundaries in newly diagnosed glio-blastoma multiforme: is it useful and safe? A single institution ret-rospective experience. J Neurooncol 2017;135:129 –39 CrossRefMedline
29. Beiko J, Suki D, Hess KR, et al. IDH1 mutant malignant astrocyto-mas are more amenable to surgical resection and have a survivalbenefit associated with maximal surgical resection. Neuro Oncol2014;16:81–91 CrossRef Medline
30. Pope WB, Sayre J, Perlina A, et al. MR imaging correlates of survivalin patients with high-grade gliomas. AJNR Am J Neuroradiol 2005;26:2466 –74 Medline
31. Lasocki A, Gaillard F, Tacey M, et al. Morphologic patterns of non-contrast-enhancing tumor in glioblastoma correlate with IDH1mutation status and patient survival. J Clin Neurosci 2018;47:168 –73 CrossRef Medline
32. Baldock AL, Ahn S, Rockne R, et al. Patient-specific metrics of inva-siveness reveal significant prognostic benefit of resection in a pre-dictable subset of gliomas. PLoS One 2014;9:e99057 CrossRefMedline
33. Stupp R, Mason WP, van den Bent MJ, et al; European Organisationfor Research and Treatment of Cancer Brain Tumor and Radiother-apy Groups, National Cancer Institute of Canada Clinical TrialsGroup. Radiotherapy plus concomitant and adjuvant temozolo-
mide for glioblastoma. N Engl J Med 2005;352:987–96 CrossRefMedline
34. Duma CM, Kim BS, Chen PV, et al. Upfront boost gamma knife“leading-edge” radiosurgery to FLAIR MRI-defined tumor migra-tion pathways in 174 patients with glioblastoma multiforme: a 15-year assessment of a novel therapy. J Neurosurg 2016;125(Suppl 1):40 – 49 CrossRef Medline
35. Wiki for the VASARI feature set. The National Cancer Institute.2015. https://wiki.cancerimagingarchive.net/display/Public/VASARI�Research�Project. Accessed November 22, 2018
36. Muccio CF, Tarantino A, Esposito G, et al. Differential diagnosis byunenhanced FLAIR T2-weighted magnetic resonance images be-tween solitary high grade gliomas and cerebral metastases appear-ing as contrast-enhancing cortico-subcortical lesions. J Neurooncol2011;103:713–17 CrossRef Medline
37. Stuckey SL, Wijedeera R. Multicentric/multifocal cerebral lesions:can fluid-attenuated inversion recovery aid the differentiation be-tween glioma and metastases? J Med Imaging Radiat Oncol 2008;52:134 –39 CrossRef Medline
38. Tang YM, Ngai S, Stuckey S. The solitary enhancing cerebral lesion:can FLAIR aid the differentiation between glioma and metastasis?AJNR Am J Neuroradiol 2006;27:609 –11 Medline
39. Chang PD, Malone HR, Bowden SG, et al. A multiparametric modelfor mapping cellularity in glioblastoma using radiographically lo-calized biopsies. AJNR Am J Neuroradiol 2017;38:890 –98 CrossRefMedline
40. Lasocki A, Gaillard F, Tacey M, et al. Multifocal and multicentricglioblastoma: improved characterisation with FLAIR imaging andprognostic implications. J Clin Neurosci 2016;31:92–98 CrossRefMedline
41. Brandao LA, Shiroishi MS, Law M. Brain tumors: a multimodalityapproach with diffusion-weighted imaging, diffusion tensor imag-ing, magnetic resonance spectroscopy, dynamic susceptibility con-trast and dynamic contrast-enhanced magnetic resonance imaging.Magn Reson Imaging Clin N Am 2013;21:199 –239 CrossRef Medline
42. Guo AC, Cummings TJ, Dash RC, et al. Lymphomas and high-gradeastrocytomas: comparison of water diffusibility and histologiccharacteristics. Radiology 2002;224:177– 83 CrossRef Medline
43. Kono K, Inoue Y, Nakayama K, et al. The role of diffusion-weightedimaging in patients with brain tumors. AJNR Am J Neuroradiol2001;22:1081– 88 Medline
44. Tien RD, Felsberg GJ, Friedman H, et al. MR imaging of high-gradecerebral gliomas: value of diffusion-weighted echoplanar pulse se-quences. AJR Am J Roentgenol 1994;162:671–77 CrossRef Medline
45. Castillo M, Smith JK, Kwock L, et al. Apparent diffusion coefficientsin the evaluation of high-grade cerebral gliomas. AJNR Am J Neu-roradiol 2001;22:60 – 64 Medline
46. Holodny AI, Makeyev S, Beattie BJ, et al. Apparent diffusion coeffi-cient of glial neoplasms: correlation with fluorodeoxyglucose-pos-itron-emission tomography and gadolinium-enhanced MR imag-ing. AJNR Am J Neuroradiol 2010;31:1042– 48 CrossRef Medline
47. Price SJ, Jena R, Burnet NG, et al. Improved delineation of gliomamargins and regions of infiltration with the use of diffusion tensorimaging: an image-guided biopsy study. AJNR Am J Neuroradiol2006;27:1969 –74 Medline
48. Stadlbauer A, Ganslandt O, Buslei R, et al. Gliomas: histopathologicevaluation of changes in directionality and magnitude of water dif-fusion at diffusion-tensor MR imaging. Radiology 2006;240:803–10CrossRef Medline
49. Ellingson BM, Malkin MG, Rand SD, et al. Validation of functionaldiffusion maps (fDMs) as a biomarker for human glioma cellular-ity. J Magn Reson Imaging 2010;31:538 – 48 CrossRef Medline
50. Zeng Q, Ling C, Shi F, et al. Glioma infiltration sign on high b-valuediffusion-weighted imaging in gliomas and its prognostic value. JMagn Reson Imaging 2018 Mar 1. [Epub ahead of print] CrossRefMedline
51. Price SJ, Green HA, Dean AF, et al. Correlation of MR relative cere-bral blood volume measurements with cellular density and prolif-
764 Lasocki May 2019 www.ajnr.org

eration in high-grade gliomas: an image-guided biopsy study. AJNRAm J Neuroradiol 2011;32:501– 06 CrossRef Medline
52. Sadeghi N, D’Haene N, Decaestecker C, et al. Apparent diffusioncoefficient and cerebral blood volume in brain gliomas: relation totumor cell density and tumor microvessel density based on stereo-tactic biopsies. AJNR Am J Neuroradiol 2008;29:476 – 82 CrossRefMedline
53. Gupta A, Young RJ, Karimi S, et al. Isolated diffusion restrictionprecedes the development of enhancing tumor in a subset of pa-tients with glioblastoma. AJNR Am J Neuroradiol 2011;32:1301– 06CrossRef Medline
54. Danchaivijitr N, Waldman AD, Tozer DJ, et al. Low-grade gliomas:do changes in rCBV measurements at longitudinal perfusion-weighted MR imaging predict malignant transformation? Radiology2008;247:170 –78 CrossRef Medline
55. Stadlbauer A, Gruber S, Nimsky C, et al. Preoperative grading ofgliomas by using metabolite quantification with high-spatial-reso-lution proton MR spectroscopic imaging. Radiology 2006;238:958 – 69 CrossRef Medline
56. Castillo M, Smith JK, Kwock L. Correlation of myo-inositol levelsand grading of cerebral astrocytomas. AJNR Am J Neuroradiol 2000;21:1645– 49 Medline
57. Nowosielski M, DiFranco MD, Putzer D, et al. An intra-individualcomparison of MRI, [18F]-FET and [18F]-FLT PET in patients withhigh-grade gliomas. PLoS One 2014;9:e95830 CrossRef Medline
58. Lopez WO, Cordeiro JG, Albicker U, et al. Correlation of (18)F-fluoroethyl tyrosine positron-emission tomography uptake valuesand histomorphological findings by stereotactic serial biopsy innewly diagnosed brain tumors using a refined software tool. OncoTargets Ther 2015;8:3803–15 CrossRef Medline
59. Artzi M, Liberman G, Blumenthal DT, et al. Differentiation betweenvasogenic edema and infiltrative tumor in patients with high-gradegliomas using texture patch-based analysis. J Magn Reson Imaging2018 Jan 3. [Epub ahead of print] CrossRef Medline
60. Hu LS, Ning S, Eschbacher JM, et al. Multi-parametric MRI andtexture analysis to visualize spatial histologic heterogeneity and tu-mor extent in glioblastoma. PLoS One 2015;10:e0141506 CrossRefMedline
AJNR Am J Neuroradiol 40:758 – 65 May 2019 www.ajnr.org 765

PRACTICE VIGNETTE
Chimeric Antigen Receptor T-Cell Therapy: What theNeuroradiologist Needs to Know
X H.A. Valand, X F. Huda, and X R.K. Tu
ABSTRACTSUMMARY: Chimeric antigen receptor T-cell therapy is an exciting and rapidly emerging “fifth pillar” treatment for hematologic cancers.Unique treatment-related toxicities and cost remain a major hindrance to its widespread application. The commonly faced challenges withthis innovative therapy, its neurotoxicity, and manifestation on neuroimaging studies, are reviewed.
ABBREVIATIONS: CAR � chimeric antigen receptor; CRS � cytokine release syndrome; CRES � CAR-T-cell–related encephalopathy syndrome
WHAT ARE CHIMERIC ANTIGEN RECEPTOR T-CELLS?Two major types of immunotherapies have been developed dur-
ing the past decade; 1) monoclonal antibodies agents specific to
target tumor, and 2) adoptive T-cell therapy, agents that mount
an immune response against tumor cells. Chimeric antigen recep-
tor (CAR) T-cells are the adoptive T-cell therapy agents that are
genetically engineered to produce an immune response against
tumor cells.1,2
WHO BENEFITS FROM CAR T-CELL THERAPY?Since 2017, the US Food and Drug Administration has approved
2 CAR T-cell agents for 3 indications: 1) axicabtagene ciloleucel
for relapsed/refractory diffuse large B-cell lymphoma, 2) tisagen-
lecleucel for pediatric and young adult leukemia, and 3) tisagen-
lecleucel for adult non-Hodgkin lymphoma. These therapies tar-
get, bind, and destroy cluster of differentiation 19 antigen,
predominantly found in B-cell tumors.3-6
HOW IS CAR T-CELL THERAPY DELIVERED TOPATIENTS?Manufacturing of CAR T-cells involves 5 phases: 1) extraction of
T-cells with an apheresis technique; 2) reprogramming of T-cells
by disarmed virus vectors, which genetically modify T-cells to
produce artificial protein receptors called chimeric antigen recep-
tors, used to locate and bind the targeted tumor; 3) expansion and
mass production of CAR T-cells and freezing when sufficient
numbers are produced; 4) lymphodepletion, a reduction of the
white blood cell load, making space for incoming reprogrammed
CAR T-cells; and 5) infusion/treatment with CAR T-cells, in
which cells multiply and mount an immune response against the
targeted cancer cells. According to the current guidelines, patients
are required to stay in the hospital from a few days to several weeks
depending on their adverse effects profile. Posttreatment recovery
time is approximately 2–3 months.7-10
WHAT ARE THE MAJOR TOXICITIES OF CAR T-CELLTHERAPY AND HOW ARE THEY GRADED?Cytokine release syndrome (CRS) is the most commonly occur-
ring toxicity in patients receiving CAR T-cell therapy followed by
CAR-T-cell–related encephalopathy syndrome (CRES).
CRS results from immune activation resulting in elevated in-
flammatory cytokines. CRS-associated symptoms can range from
fever, malaise, anorexia, and myalgias to end-organ dysfunction.
There are 4 grades of CRS toxicity. Grade 1 comprises constitu-
tional symptoms. Grade 2 includes hypotension that responds to
fluids or low-dose vasopressors, hypoxia that responds to �40%
O2, and grade 2 organ toxicities. Grade 3 encompasses hypoten-
sion requiring high-dose vasopressors, hypoxia requiring �40%
O2, and grades 3 and 4 organ toxicities. Grade 4 also includes
hypoxia requiring mechanical ventilation and grade 4 organ tox-
icities.11,12 Severe CRS toxicity can rarely progress into fulminant
hemophagocytic lymphohistiocytosis.12
CRES-associated symptoms can range from mild neurotoxic-
ity to more severe forms such as seizures, paralysis, raised intra-
cranial pressure (ICP), papilledema, and cerebral edema. CRES is
Received February 17, 2019; accepted after revision March 6.
From the American University of Integrative Sciences (H.A.V.), Brampton, Ontario,Canada; Department of Radiology (F.H.), George Washington University Hospital,Washington, DC; and Progressive Radiology (R.K.T.), George Washington University,Washington, DC.
Please address correspondence to Raymond K. Tu, MD, MS, FACR, Progressive Ra-diology, George Washington University, United Medical Center, 2121 K St NW,Suite 100, Washington, DC 20037; e-mail: [email protected];@RayTu10
http://dx.doi.org/10.3174/ajnr.A6042
766 Valand May 2019 www.ajnr.org
categorized into 4 grades based on neurologic assessment (orien-
tation, naming of objects, ability to write a standard sentence, and
counting backwards), raised ICP, and the presence of seizures or
motor weakness. Grading of neurologic assessment is as follows:
mild (grade 1), moderate (grade 2), severe (grade 3), and critical/
obtunded (grade 4). The presence of raised ICP, seizures, or mo-
tor weakness comprise grades 3 and 4.13-15
A study conducted by Gofshteyn et al16 concluded that the
incidence of neurotoxicity in pediatric and young adult popula-
tions (�45%) is similar to that found in the adult population
(�40%– 42%). The study demonstrated that the occurrence of
life-threatening neurotoxicity was lower in comparison with
adults and all patients had neurologic recovery with no fatal
outcomes.
WHAT ARE THE NEURORADIOLOGIC FINDINGS INPATIENTS RECEIVING CAR T-CELL THERAPY?A study conducted by Davila et al17 at the National Institutes of
Health showed that patients who underwent neuroimaging had
unremarkable examination findings.
Santomasso et al13 described 2 forms of neurotoxicity: mild
and severe. Mild neurotoxicity comprises delirium, tremor, and
headaches. Severe neurotoxicity ranges among disorientation,
loss of attention, partial-to-global aphasia, myoclonus, and sei-
zures. All patients with mild neurotoxicity had unremarkable MR
imaging findings of the brain. In addition, of the 14 patients with
severe neurotoxicity, 9 patients also had unremarkable changes.
Patients with positive MR imaging findings showed a nonspecific
pattern of predominantly white matter involvement extending to
the brain stem. These nonspecific changes can also be seen with
migraines and chronic microvascular ischemia resulting from
common conditions such as hypertension among others.18 Fol-
lowing symptom resolution, 2 of the remaining 5 patients with
MR imaging–positive findings had reversal of the MR imaging
changes.
WHAT ARE THE NEURORADIOLOGICRECOMMENDATIONS IN PATIENTS RECEIVING CART-CELL THERAPY?Given the wide range of nonspecific brain findings and etiologies,
the authors suggest a baseline pretreatment MR imaging to doc-
ument any treatment-related changes. Given their immunocom-
promised state, these patients are prone to infections, which can
result in the release of septic emboli into the bloodstream. This
can lead to cerebritis and could further progress to abscess, advo-
cating the use of contrast-enhanced MR imaging.19
WHAT ARE THE CHALLENGES IN IMPLEMENTING CART-CELL THERAPY?Despite its promising treatment response, health plan coverage
and drug costs are barriers to access CAR T-cell therapy. Axi-
cabtagene ciloleucel and tisagenlecleucel treatment costs are esti-
mated at $373,000 and $475,000, respectively.20,21 The nondrug
costs due to adverse effects, apheresis, and lymphodepletion ther-
apy are not part of these drug regimens and can cost from $30,000
to $56,000.22 In addition, the facility costs to process and produce
the final product, along with the use of cell therapy experts are
enormous; treatment delivery, risk assessment, and legal counsel-
ing teams are important, costly, and essential.23 Currently, CAR
T-cell therapy is not approved for Medicare patients. However,
recently the US Centers for Medicare and Medicaid Services has
proposed comprehensive nationwide coverage for CAR T-cell
therapy.24
REFERENCES1. Sathyanarayanan V, Neelapu SS. Cancer immunotherapy: strategies
for personalization and combinatorial approaches. Mol Oncol 2015;9:2043–53 CrossRef Medline
2. Khalil DN, Smith EL, Brentjens RJ, et al. The future of cancertreatment: immunomodulation, CARs and combination immuno-therapy. Nat Rev Clin Oncol 2016;13:273–90 CrossRef Medline
3. Ruella M, Xu J, Barrett DM, et al. Induction of resistance to chimericantigen receptor T cell therapy by transduction of a single leukemicB cell. Nat Med 2018;24:1499 –1503 CrossRef Medline
4. U.S. Food and Drug Administration. STN: BL 125646/0. https://www.fda.gov/downloads/BiologicsBloodVaccines/CellularGeneTherapyProducts/ApprovedProducts/UCM574106.pdf. AccessedJanuary 30, 2019
5. U.S. Food and Drug Administration. BL 125646/76. https://www.fda.gov/downloads/BiologicsBloodVaccines/CellularGeneTherapyProducts/ApprovedProducts/UCM606523.pdf. Accessed January 28,2019
6. U.S. Food and Drug Administration. BL 125643/0 https://www.fda.gov/downloads/BiologicsBloodVaccines/CellularGeneTherapyProducts/ApprovedProducts/UCM581259.pdf. Accessed January 28,2019
7. Chemical & Engineering News. Controlling CAR-T: How scientistsplan to make the engineered T cell therapy safer, and work for morecancers. https://cen.acs.org/pharmaceuticals/oncology/Controlling-CAR-T-scientists-plan/96/i19. Accessed February 5, 2019
8. Leukemia and Lymphoma Society. Chimeric Antigen Receptor (CAR)T-Cell Therapy. https://www.lls.org/treatment/types-of-treatment/im-munotherapy/chimeric-antigen-receptor-car-t-cell-therapy. AccessedFebruary 6, 2019
9. National Cancer Institute. NCI Dictionary of Cancer Terms. https://www.cancer.gov/publications/dictionaries/cancer-terms/def/car-t-cell-therapy. Accessed February 6, 2019
10. Dana Farber Cancer Institute. How CAR T-cell works. https://www.dana-farber .org/cel lular-therapies-program/car-t-cell-therapy/how-car-t-cell-therapy-works/. Accessed February 6,2019
11. Lee DW, Gardner R, Porter DL, et al. Current concepts in the diag-nosis and management of cytokine release syndrome. Blood 2014;124:188 –95 CrossRef Medline
12. Neelapu SS, Tummala S, Kebriaei P, et al. Chimeric antigen receptorT-cell therapy: assessment and management of toxicities. Nat RevClin Oncol 2018;15:47– 62 CrossRef Medline
13. Santomasso BD, Park JH, Salloum D, et al. Clinical and biologicalcorrelates of neurotoxicity associated with CAR T-cell therapy inpatients with B-cell acute lymphoblastic leukemia. Cancer Discov2018;8:958 –71 CrossRef Medline
14. Gust J, Hay KA, Hanafi LA, et al. Endothelial activation and blood-brain barrier disruption in neurotoxicity after adoptive immuno-therapy with CD19 CAR-T cells. Cancer Discov 2017;7:1404 –19CrossRef Medline
15. MD Anderson Cancer Center. Chimeric Antigen Receptor (CAR)Cell Therapy Toxicity Assessment and Management—Adult.https://www.mdanderson.org/documents/for-physicians/algorithms/clinical-management/clin-management-cytokine-release-web-algorithm.pdf. Accessed February 18, 2019
16. Gofshteyn JS, Shaw PA, Teachey DT, et al. Neurotoxicity afterCTL019 in a pediatric and young adult cohort. Ann Neurol 2018;84:537– 46 CrossRef Medline
17. Davila ML, Riviere I, Wang X, et al. Efficacy and toxicity manage-
AJNR Am J Neuroradiol 40:766 – 68 May 2019 www.ajnr.org 767

ment of 19 –28z CAR T cell therapy in B cell acute lymphoblasticleukemia. Sci Transl Med 2014;6:224ra25 CrossRef Medline
18. Trauninger A, Leel-Ossy E, Kamson DO, et al. Risk factors of migraine-related brain white matter hyperintensities: an investigation of 186 pa-tients. J Headache Pain 2011;12:97–103 CrossRef Medline
19. Smirniotopoulos JG, Murphy FM, Rushing EJ, et al. Patterns of con-trast enhancement in the brain and meninges. Radiographics 2007;27:525–51 CrossRef Medline
20. Lin JK, Lerman BJ, Barnes JI, et al. Cost effectiveness of chimericantigen receptor T-cell therapy in relapsed or refractory pediatricB-cell acute lymphoblastic leukemia. J Clin Oncol 2018 Sep 13.[Epub ahead of print] CrossRef Medline
21. Hao Y, Eldjerou LK, Yang H, et al. Cost-effectiveness analysis ofCTL019 for the treatment of pediatric and young adult patientswith relapsed or refractory B-cell acute lymphoblastic leukemia in
the United States. In: Proceedings of the American Society of Hematol-ogy Annual Meeting and Exposition, Atlanta, Georgia. December9 –12, 2017; abstract 609
22. Hernandez I, Prasad V, Gellad WF. Total costs of chimeric antigenreceptor T-cell immunotherapy. JAMA Oncol 2018;4:994 –96CrossRef Medline
23. Managed Health Care Executive. CAR T-cell therapy life-saving treat-ment, huge price tag. https://www.managedhealthcareexecutive.com/sites/default/files/legacy/mm/digital/media/mhe1118_ezine_R1.pdf.Accessed February 6, 2019
24. Centers for Medicare & Medicaid Services. Proposed Decision Memo forChimeric Antigen Receptor (CAR) T-cell Therapy for Cancers (CAG-00451N). Last Updated February 15, 2019. https://www.cms.gov/medicare-coverage-database/details/nca-proposed-decision-memo.aspx?NCAId�291. Accessed February 15, 2019
768 Valand May 2019 www.ajnr.org

ORIGINAL RESEARCHADULT BRAIN
Predicting Motor Outcome in Acute Intracerebral HemorrhageX J. Puig, X G. Blasco, X M. Terceno, X P. Daunis-i-Estadella, X G. Schlaug, X M. Hernandez-Perez, X V. Cuba, X G. Carbo, X J. Serena,
X M. Essig, X C.R. Figley, X K. Nael, X C. Leiva-Salinas, X S. Pedraza, and X Y. Silva
ABSTRACT
BACKGROUND AND PURPOSE: Predicting motor outcome following intracerebral hemorrhage is challenging. We tested whether thecombination of clinical scores and DTI-based assessment of corticospinal tract damage within the first 12 hours of symptom onset afterintracerebral hemorrhage predicts motor outcome at 3 months.
MATERIALS AND METHODS: We prospectively studied patients with motor deficits secondary to primary intracerebral hemorrhagewithin the first 12 hours of symptom onset. Patients underwent multimodal MR imaging including DTI. We assessed intracerebral hemor-rhage and perihematomal edema location and volume, and corticospinal tract involvement. The corticospinal tract was consideredaffected when the tractogram passed through the intracerebral hemorrhage or/and the perihematomal edema. We also calculatedaffected corticospinal tract-to-unaffected corticospinal tract ratios for fractional anisotropy, mean diffusivity, and axial and radial diffu-sivities. Motor impairment was graded by the motor subindex scores of the modified NIHSS. Motor outcome at 3 months was classifiedas good (modified NIHSS 0 –3) or poor (modified NIHSS 4 – 8).
RESULTS: Of 62 patients, 43 were included. At admission, the median NIHSS score was 13 (interquartile range � 8 –17), and the medianmodified NIHSS score was 5 (interquartile range � 2– 8). At 3 months, 13 (30.23%) had poor motor outcome. Significant independentpredictors of motor outcome were NIHSS and modified NIHSS at admission, posterior limb of the internal capsule involvement byintracerebral hemorrhage at admission, intracerebral hemorrhage volume at admission, 72-hour NIHSS, and 72-hour modified NIHSS. Thesensitivity, specificity, and positive and negative predictive values for poor motor outcome at 3 months by a combined modified NIHSS of�6 and posterior limb of the internal capsule involvement in the first 12 hours from symptom onset were 84%, 79%, 65%, and 92%,respectively (area under the curve � 0.89; 95% CI, 0.78 –1).
CONCLUSIONS: Combined assessment of motor function and posterior limb of the internal capsule damage during acute intracerebralhemorrhage accurately predicts motor outcome.
ABBREVIATIONS: CST � corticospinal tract; FA � fractional anisotropy; ICC � intraclass correlation coefficient; ICH � intracerebral hemorrhage; IQR �interquartile range; PHE � perihematomal edema; PLIC � posterior limb of the internal capsule; rFA � FA ratio
More than half of patients with intracerebral hemorrhage
(ICH) have residual motor deficits at 6-month follow-up.1
Although the severity of the initial motor deficit is one of the most
important determinants of motor recovery after stroke, growing
evidence shows that motor outcome after stroke is heavily depen-
dent on the integrity of the corticospinal tract (CST).2-8 Outcome
predictions after ICH might be more difficult compared with
outcome after ischemic stroke because the damage from ICH in-
cludes not only the mass effect but also inflammation and perihe-
matomal edema (PHE), leading to fiber deformations, demyeli-Received December 18, 2018; accepted after revision March 15, 2019.
From the Department of Radiology (J.P., M.E., C.R.F.), University of Manitoba. Win-nipeg, Manitoba, Canada; Department of Radiology (J.P., G.B., V.C., G.C., S.P.), Bio-medical Research Institute Imaging Research Unit, Diagnostic Imaging Institute, DrJosep Trueta University Hospital, Girona, Spain; Department of Neurology (M.T.,J.S., Y.S.), Girona Biomedical Research Institute, Dr Josep Trueta University Hospital,Girona, Spain; Department of Computer Science (P.D.-i.-E.), Applied Mathematicsand Statistics, University of Girona, Girona, Spain; Neuroimaging and Stroke Re-covery Laboratory (G.S.), Department of Neurology, Beth Israel Deaconess MedicalCenter and Harvard Medical School, Boston, Massachusetts; Department of Neu-rosciences (M.H.-P.), Germans Trias i Pujol University Hospital, Autonomous Uni-versity of Barcelona, Badalona, Spain; Department of Radiology (K.N.), Icahn Schoolof Medicine at Mount Sinai, New York; and Department of Radiology (C.L.-S.), Uni-versity of Missouri, Columbia, Missouri.
This work was partially supported by a grant from the Spanish Ministry of Health,Instituto de Investigacion Carlos III (grant No. 367823–764)
Please address correspondence to Josep Puig, MD, PhD, Department of Radiology,University of Manitoba, 820 Sherbrook St GA216, Winnipeg, MB R3T 2N2, Canada;e-mail: [email protected]
Indicates open access to non-subscribers at www.ajnr.org
Indicates article with on-line tables.
http://dx.doi.org/10.3174/ajnr.A6038
AJNR Am J Neuroradiol 40:769 –75 May 2019 www.ajnr.org 769

nation, and axonal shearing.9 Wallerian degeneration in the CST
both near and remote from the hematoma is common following
ICH.10 Whereas conventional MR imaging sequences such as
FLAIR and gradient recalled-echo can show the hemorrhage and
PHE, DTI depicts and quantifies white matter microstructure by
measuring the diffusion of water in tissue.11 Lower fractional an-
isotropy (FA) values along the affected CST remote from the in-
farct, interpreted as Wallerian degeneration, are associated with
greater motor deficit 2– 4 weeks after the onset of symptoms and
worse motor outcome.12-14 Damage to specific CST regions on
diffusion tensor tractography can predict limb motor outcome:
Involvement of the posterior limb of the internal capsule (PLIC)
within the first 12 hours after symptom onset is strongly associ-
ated with unfavorable motor outcome at 3 months.15 Moreover,
the degree of motor deficit correlates higher with lesion-CST
overlap than with the lesion size per se.7
Although several studies have examined whether DTI-derived
data can predict motor outcome in patients with ICH, the results
are inconsistent.16-22 Both the FA ratio (rFA) remote from the
lesion and the integrity of the CST in the subacute-to-chronic
period of ICH have been associated with functional motor out-
come.19-23 An accurate method to individually predict motor out-
come within a few hours after ICH would enable realistic goal
setting and efficient resource allocation by clinicians, patients,
and families, providing them with information that might help
choose more efficient rehabilitation programs. Given the lack
of studies in the acute phase, we aimed to determine whether
combining clinical scores or motor impairment and DTI-de-
rived data of tissue impairment from the first 12 hours after
symptom onset allows prediction of motor outcome in pa-
tients with ICH.
MATERIALS AND METHODSPatientsWe studied consecutive patients with spontaneous primary ICH
admitted to the Stroke Unit of Dr. Josep Trueta University Hos-
pital from January 2012 through December 2014. Inclusion crite-
ria were the following: 1) patient older than 18 years, 2) first-ever
stroke, 3) supratentorial primary intraparenchymal hematoma,
4) presence of motor deficit, 5) MR imaging performed within 12
hours from symptom onset, and 6) clinical follow-up at 90 days.
Exclusion criteria were the following: 1) secondary ICH due to
vascular malformation, cranial trauma, or tumor; 2) poor pre-
morbid functional status (mRS � 2); 3) dementia or terminal
illness; 4) coma; 5) poor image quality; 6) primary intraventricu-
lar hemorrhage; or 7) infratentorial hemorrhage; 8) any contra-
indications for MR imaging; and 9) surgical treatment. All pa-
tients were managed according to recent published guidelines.24
Standard rehabilitation programs were initiated once patients
were clinically stable. Our institutional ethics committee ap-
proved the study, and all patients or their relatives provided writ-
ten informed consent.
Clinical ExaminationA senior certified staff neurologist used the NIHSS to assess clin-
ical deficits at admission, day 3, and 3 months. Limb motor per-
formance was evaluated by the mNIHSS subindex (5a, 5b, 6a, 6b).
The scores were summed and defined with paresis grading rang-
ing from zero, no motor weakness, to 8, hemiplegia in 2 limbs.
Motor outcome at 3 months was classified as good (mNIHSS 0 –3)
or poor (mNIHSS 4 – 8).20 The mRS was used to measure patients’
functional disability at 3 months. Poor functional outcome was
defined as mRS � 2.25 All clinical assessments were blinded to the
MR imaging findings.
MR Imaging ProtocolAll scans were performed with a whole-body 1.5T MR imaging
system (Gyroscan Intera; Philips Healthcare, Best, the Nether-
lands) with a sensitivity encoding head coil. The protocol in-
cluded FLAIR, gradient recalled-echo, TOF angiography, axial
trace DWI, and DTI sequences. DTI was performed using a single-
shot echo-planar imaging sequence with the sensitivity encoding
parallel-imaging scheme (acceleration factor, 2) after contrast agent
administration for angiography. A single diffusion-weighted B0 ac-
quisition was obtained, and diffusion-sensitized gradients were ap-
plied along 15 noncollinear directions with a b-value of 1000 s/mm2.
Other acquisition parameters were the following: TR/TE, 6795/72
ms; FOV, 230 � 230 mm; matrix size, 112 � 112. DTI voxel size
was 2.05 � 2.0 � 3 mm. Forty sections covering the brain were
obtained parallel to the bicommissural line without intersection
gaps. DTI acquisition took 3 minutes 10 seconds. Parameters for
FLAIR were the following: TR/TE, 7569/115 ms; flip angle, 90°;
section thickness, 5 mm; intersection gap, 1 mm; FOV, 230 � 180
mm; and brain coverage, 120 mm. Parameters for gradient re-
called echo were TR/TE, 1000/30 ms; and the others were the same
as for FLAIR.
Diffusion Tensor Tractography Processing andAssessment of CST Involvement by ICHDeterministic diffusion tensor tractography was performed using
Philips Research Integrated Development Environment (PRIDE;
Philips Healthcare) software. Anisotropy maps were obtained us-
ing orientation-independent FA, and color FA maps were gener-
ated following the standard convention (red, left-right; green, an-
teroposterior; and blue, superoinferior). Tractography was based
on a diffusion tensor deflection algorithm.26 The threshold for
stopping fiber propagation was FA � 0.2 and angle � 70°. The
seeding method put 1 starting seed randomly inside each voxel
with an FA of �0.4. To reconstruct the CST, we placed ROIs at the
level of the cerebral peduncle and around the corona radiata in the
direction-coded color axial sections. Fiber tracts passing through
both ROIs were designated as tracts of interest. Exclusion ROIs
were drawn around the superior and middle cerebellar peduncles
to exclude fibers to the cerebellum, and around a midline sagittal
section covering the brain stem and corpus callosum to exclude
interhemispheric fibers.15,27 The CST depicted was validated us-
ing landmarks from neuroanatomy atlases.28 To determine which
structures had ICH and PHE, we evaluated the centrum semi-
ovale, corona radiata, and PLIC on tractograms superimposed on
gradient recalled-echo and FLAIR. The CST was considered af-
fected only when the tractogram passed through the ICH or/and
PHE (Fig 1). In those patients in whom the tractogram was bent
over or displaced by the ICH, the CST was considered not af-
fected. These regions were scored on 2 separate occasions 8 weeks
770 Puig May 2019 www.ajnr.org

apart by 1 rater with 14 years’ experience and once by 2 raters (14
and 5 years’ experience); all raters were blinded to the clinical
data. Discordant ratings were resolved by consensus.
Measurement of the CST DTIDiffusion-sensitized image sets were analyzed off-line. One reader
with 5 years’ experience blinded to the clinical scores used Olea
Sphere, Version 3.0 software (Olea Medical, La Ciotat, France) to
calculate the following DTI measures on 2 separate occasions 4
weeks apart: radial diffusivity, axial diffusivity, mean diffusivity,
and FA. The ipsilesional-to-contralesional CST ratios were calcu-
lated on axial sections of affected and unaffected CST at the level
of the PLIC and at the level of the rostral pons (rDTI-Metric �
DTI-Metricaffected side/DTI-Metricunaffected side). In each patient,
the DTI measures of the CST were derived from the mean value of
3 contiguous sections. The results of the 2 assessments were aver-
aged. Analyzing diffusion tensor tractography took 4 minutes and
30 seconds on average.
Measurement of the ICH and PHE VolumesTwo independent raters blinded to the clinical data measured
ICH and PHE volumes on baseline MR imaging and 72-hour
post-ICH CT scans using a semiautomated method (Olea
Sphere, Version 3.0). At admission, ICH and PHE volumes
were outlined on gradient recalled-echo sequences and FLAIR,
respectively.29 At 72 hours, PHE was delineated with the addi-
tional guideline that it should be more hypodense than the
corresponding area in the contralateral hemisphere and most
hypodense immediately surrounding the ICH.30 Figure 2 de-
picts a representative example of a patient’s ICH and PHE
measurements. The results of the 2 assessments were averaged.
Statistical AnalysisDescriptive statistics are expressed as medians (interquartile
range [IQR]) for continuous variables and as frequencies (per-
centages) for categoric variables. We compared baseline data,
clinical variables at admission and at 72 hours, volumes of ICH
and PHE, and DTI data between patients with good-versus-
poor motor outcome at 3-month follow-up and between pa-
tients with mRS � 2 and mRS � 2. For univariate comparison,
we used t tests for numeric data and the �2 test for proportions.
We used receiver operating characteristic curves to determine
cutoffs for variables discriminating motor outcome. Multiple
logistic regression was used to define independent predictors
of motor outcome (mNIHSS score at 3 months). Several com-
binations of independent variables were analyzed on the basis
of significant univariate P values to ascertain the value of add-
ing CST involvement to the mNIHSS score. We used the Cohen
� coefficient to assess intraobserver and interobserver reliabil-
ity for the assessment of CST involvement by ICH. Intra- and
interobserver agreement was classified as slight (� � 0.0 –
0.20), fair (� � 0.21– 0.40), moderate (� � 0.41– 0.60), sub-
stantial (� � 0.61– 0.80), or almost perfect (� � 0.81–1.00)
according to the scale proposed by Landis and Koch.31 To
compare first and second measurements of DTI measures, we
used the intraclass correlation coefficient (ICC). The level of
intra- and interobserver consistency was classified as fair
FIG 1. Assessing corticospinal tract involvement with diffusion tensor tractography superimposed on gradient recalled echo and FLAIR images.In the upper row, the corticospinal tract was affected by ICH (passes through it) at the level of the corona radiata and posterior limb of theinternal capsule. Note that in lower row, the corticospinal tract was displaced slightly forward but preserved around the intracerebral hema-toma. Vol indicates volume.
AJNR Am J Neuroradiol 40:769 –75 May 2019 www.ajnr.org 771

(ICC � 0.5– 0.7), good (0.7– 0.9), or almost perfect (�0.90).
All statistical analyses were performed with R, Version 3.0.2
(http://www.r-project.org/).
RESULTSPatientsAmong 62 consecutive patients admitted with supratentorial
primary ICH conforming to our inclusion criteria, 6 were ex-
cluded for not having motor deficits at admission; 6, for poor
image quality due to motion artifacts; and 7 died within 72
hours of symptom onset. Therefore, the study population con-
sisted of 43 patients (31 men; mean age 68 years; IQR � 57–76
years).
Clinical and Neuroimaging CharacteristicsOn-line Table 1 summarizes patients’ clinical and imaging data
according to motor outcomes at 3 months. There were no differ-
ences in sex, age, presence of vascular risk factors, and laboratory
parameters between 2 groups. At admission, most patients had
moderate-to-severe neurologic deficits (NIHSS � 13, IQR �
8 –17), and 26 (60.46%) of these had moderate-severe motor def-
icits (mNIHSS � 4 – 8). At 3 months, 13 (30.23%) patients had
poor motor outcome. Time from ICH onset to MR imaging was
407 minutes (IQR � 238 –559 minutes). The most frequent ICH
location was the lenticulostriate territory (88.1%). The premor-
bid mRS was 0 for all patients. CST affected by ICH was present in
24 (55.8%) patients; and the PLIC, in 14 (32.5%) of these patients.
All patients with CST affected by ICH had motor deficits at ad-
mission. Intrarater and interrater agreement about the CST-in-
volvement region was almost perfect (� � 0.89 and � � 0.82,
respectively). The intraobserver consistency showed good agree-
ment for CST DTI measures (ICC � 0.81; 95% CI, 0.78 – 0.86).
For ICH and PHE volume assessment, all interrater ICCs
were almost perfect at both baseline and 72-hour follow-up
(ICCICH-baseline � 0.96; 95% CI, 0.94 –
1.00; ICCPHE-baseline � 0.95; 95% CI,
0.92–1.00; ICCICH-72 hours � 0.98; 95%
CI, 0.96 –1.00; ICCPHE-72 hours � 0.98;
95% CI, 0.97–1.00).
Analysis of Variables Associatedwith Clinical OutcomeIn the 13 patients with poor motor out-
come at 3 months, NIHSS and mNIHSS
scores were higher at admission and at
72 hours than for patients with a good
motor outcome (On-line Table 1). Pa-
tients with poor motor outcome had
higher ICH volume at admission (10.45
mL; IQR � 5.07–15.74 mL versus 22.74
mL; IQR � 10.3–30; P � .034) (On-line
Table 1). At admission, ICH involved
the CST in 11 (84.61%) patients
with poor motor outcome and in 13
(43.33%) patients with good motor out-
come (P � .016); ICH involved the PLIC
in 9 (69.23%) patients with poor motor
outcome (P � .001). Poor motor out-
come at 3 months correlated with functional outcome (mRS) at 3
months (P � .001). Patients with poor functional outcome had
higher NIHSS and mNIHSS scores at admission and follow-up
than patients with good outcome, as well as higher volumes of
ICH (On-line Table 2). Poor functional outcome was also associ-
ated with CST affected by ICH. CST affected by PHE and quanti-
tative DTI measures did not influence a patient’s outcome (On-
line Tables 1 and 2).
Predictive Models for Functional Motor OutcomeThe best model was obtained by combining the mNIHSS score at
72 hours and PLIC affected by ICH at �12 hours (Table). The
sensitivity, specificity, and positive and negative predictive values
for poor motor outcome at 3 months by combined 72-hour
mNIHSS scores of �3 and PLIC affected by ICH at �12 hours
were 92%, 86%, 75%, and 96%, respectively (area under the
curve � 0.94; 95% CI, 0.86 –1.00). Additionally, the sensitivity,
specificity, and positive and negative predictive values for poor
motor outcome at 3 months by combined acute mNIHSS of �6
and PLIC involvement of �12 hours were 84%, 79%, 65%, and
92%, respectively (area under the curve � 0.89; 95% CI, 0.78 –1).
DISCUSSIONIn this observational study, we analyzed DTI datasets acquired in
patients with ICH within 12 hours of symptom onset. We tested
whether the combination of clinical scores and DTI-based assess-
ment of CST damage predicts motor function at 3 months in
acute ICH. In the first 12 hours of symptom onset, our results
suggest that patients with mNIHSS scores of �6 and any PLIC
affected by ICH will most probably have poor motor outcome.
Kuzu et al20 demonstrated that an mNIHSS score of �6 was a
strong predictor of motor outcome at 3 months and suggested
that patients with an mNIHSS score of �6 might be considered
FIG 2. Example of ROI object maps used to measure intracerebral hematoma (blue) and perihe-matomal edema (yellow) volumes.
772 Puig May 2019 www.ajnr.org

for surgical evacuation of the hematoma. They also reported that
absolute FA values of the cerebral peduncle at day 3 were 9% lower
in patients with poor-rather than-good recovery. However, they
did not combine the 2 variables to better predict motor outcome.
On the other hand, Tao et al27 recently demonstrated that the
prognostic value of the ICH score surpassed that of FA values in
the CST at the cerebral peduncle within the first 4 days after symp-
tom onset. Combining the FA data with the ICH score did not
improve prognostication, probably because 4 days are not enough
to detect early Wallerian degeneration in the cerebral peduncle.32
We found that ICH volume was a poor predictor of motor
outcome at day 90, and motor deficit was present only when crit-
ical motor regions were involved, suggesting that large lesions do
not necessarily predict poor motor outcome. Thus, growing evi-
dence shows that the preservation and recovery of the CST are
crucial for good functional motor outcome. However, we noted
that some patients with CST involvement had no motor deficits,
presumably due to compensation by alternate motor fibers that
contribute to motor control.8 In ischemic stroke, functional out-
come correlates with the extent of Wallerian degeneration remote
from the lesion. In the subacute and the chronic phases of isch-
emic stroke, FA in the ipsilateral CST decreases progressively in
correlation with motor functional outcome. A few studies have
demonstrated that reductions in FA values in the acute phase
correlate with clinical signs and can predict functional outcome in
ICH.19-22 Unlike other authors, we found no changes in anisot-
ropy in the cerebral peduncle. Kusano et al16 reported that rFA in
the cerebral peduncle correlated negatively with paresis grade and
differed significantly at 2 days between patients with good and
poor motor outcomes at 28 days. One explanation for these dis-
crepancies is that we examined changes in diffusivity in the first
few hours and this time window was too short to detect early signs
of Wallerian degeneration.31 A recent meta-analysis showed that
the studies reported so far on the correlation between FA values
and upper extremity motor recovery in patients with ICH are few
with small sample sizes.33 This meta-analysis found a strong cor-
relation between FA and upper extremity motor recovery, though
the authors concluded that further well-designed prospective
studies with larger sample sizes are needed to confirm these
findings.33
Several limitations warrant comment. This single-center study
included too few patients to draw definite conclusions. Future
studies with larger samples will enable regression analyses to as-
sess associations in greater detail. We considered clinical fol-
low-up at 3 months because motor recovery seems to occur pre-
dominantly in the first few months after stroke; however, some
patients with ICH may show further recovery in later phases.2
However, an advantage of using a relatively short follow-up is to
reduce the possibility of losing patients. The NIHSS is widely used
for evaluating patients with acute stroke but might not be good for
a fine-grained assessment of motor impairment. The DTI metrics
would be difficult to assess, especially when ICH or PHE or both
compress the CST, and this may result in variability in location,
size, and shape. DTI reflects the averaged water diffusion property
within a voxel, which is considered an indirect indicator of the
axons; therefore, this model may oversimplify axonal structures.
More diffusion gradients would reduce artifacts and increase sig-
nal-to-noise ratios. However, increasing the number of directions
would have increased the scanning time and decreased the num-
ber of patients with a DTI scan without motion artifacts. The
diffusion properties of tissues are independent of magnetic field
strength. However, the field strength affects the signal-to-noise
ratio and artifacts of diffusion-weighted images, which influence
the quantitative and spatial accuracy of DTI.
The increased SNR at 3T may be useful for obtaining more
accurate diffusion measurements, shortening examination times,
Functional motor outcome prediction: summary of class performance and odds ratios for univariate and multivariate analyses atadmission and at 72 hr
Variables Cutoff AUC (95% CI) Sensitivity Specificity
PositivePredictive
Value
NegativePredictive
ValueP
ValueOdds
Ratio (95% CI)NIHSS score at admission 15 0.77 (0.62–0.93) 0.69 0.77 0.56 0.85 .011 1.23 (1.05–1.43)mNIHSS score at admission 6 0.79 (0.64–0.94) 0.77 0.77 0.59 0.88 .007 1.65 (1.15–2.36)ICH volume at admission 17.08 0.71 (0.54–0.90) 0.38 0.86 0.50 0.80 .047 1.05 (1.00–1.10)CST involvement by ICH at
admissionPresent 0.70 (0.56–0.84) 0.84 0.55 0.46 0.89 .025 6.77 (1.27–36.14)
PLIC involvement by ICH atadmission
Present 0.76 (0.61–0.91) 0.69 0.83 0.64 0.86 .002 10.80 (2.36–49.46)
NIHSS score at 72 hr 8 0.88 (0.77–0.99) 0.92 0.67 0.54 0.95 �.001 1.31 (1.12–1.52)mNIHSS score at 72 hr 5 0.91 (0.82–1.00) 0.92 0.83 0.71 0.96 �.001 2.10 (1.36–3.26)NIHSS score at admission,
PLIC involvement by ICHat admission
16Present
0.87 (0.75–0.98) 0.85 0.86 0.73 0.93 .014.005
1.25 (1.05–1.49),14.21 (2.23–90.60)
mNIHSS score at admission,PLIC involvement by ICHat admission
6Present
0.89 (0.78–1.00) 0.84 0.79 0.65 0.92 .009.005
1.86 (1.17–2.94),20.99 (2.52–174.80)
NIHSS score at 72 hr,PLIC involvement by ICHat admission
14Present
0.93 (0.84–1.00) 0.85 0.93 0.85 0.93 .003.017
1.32 (1.10- 1.58),13.73 (1.60–117.65)
mNIHSS score at 72 hr,PLIC involvement by ICHat admission
3Absent
0.94 (0.86–1.00) 0.92 0.86 0.75 0.96 .005.020
2.08 (1.25–3.50),17.04 (1.56–186.18)
Note:—AUC indicates area under the curve.
AJNR Am J Neuroradiol 40:769 –75 May 2019 www.ajnr.org 773

or improving the spatial resolution. Along this line, DTI studies at
3T using parallel imaging have provided significantly improved
DTI measurements relative to studies at 1.5T.34 Deterministic fi-
ber-tracking methods use a linear propagation approach, pro-
ceeding according to the principal eigenvector direction.35 This
method has poor sensitivity to reconstruct the tracts through re-
gions of crossing fibers.36 The presence of the ICH and/or the
PHE could affect the appearance of the CST. By means of proba-
bilistic approaches, the CST would be delineated more exten-
sively.37 In fact, the streamline method provides a single estimate
of a virtual fiber tract without incorporating the uncertainty in-
troduced by noise, whereas probabilistic approaches attempt to
address this limitation by providing a confidence measure. Prob-
abilistic methods provide an arbitrary number of virtual fiber
tracts that are reconstructed.38 Combining other imaging modal-
ities, such as functional MR imaging or transcranial magnetic
stimulation, would increase the accuracy of assessing the neural
tracts, therefore, compensating for the limitations of DTI.
We did not assess the impact of the CST distortion of its nat-
ural course or whether the additional bending of the CST affected
the DTI measures. Secondary lesions due to local intracranial hy-
pertension could be omitted in early DTI scans. Therefore, delin-
eation of the mass effect of PHE and ICH on a later scan per-
formed at around 1 week and used as a covariable could help limit
this problem in further studies.
CONCLUSIONSCombining mNIHSS and PLIC affected by ICH in the first 12
hours of onset can accurately predict motor outcome. The reli-
ability of DTI in denoting very early damage to the CST could
make it a prognostic biomarker useful for determining manage-
ment strategies to improve outcome in the hyperacute stage. Our
approach eliminates the need for advanced postprocessing tech-
niques that are time-consuming and require greater specializa-
tion, so it can be applied more widely and benefit more patients.
Prospective large-scale studies are warranted to validate these
findings and determine whether this information could be used to
stratify risk in patients with ICH.
Disclosures: Chase R. Figley—UNRELATED: Employment: University of Manitoba;Grants/Grants Pending: Brain Canada, Health Sciences Centre Foundation, MSSociety of Canada, Natural Sciences and Engineering Research Council of CanadaDiscovery.* Kambiz Nael—UNRELATED: Board Membership: Olea Medical,Comments: Medical Advisory Board. Salvador Pedraza—RELATED: Grant: Fondode Inversion Sanitaria. Spanish government.* Yolanda Silva—RELATED: Grant:Academia de Ciencies Mediques de Girona, Comments: I received a grant for€6000 from the Academia de Ciencies Mediques de Girona. Josep Puig—RELATED:Grant: Spanish Ministry of Health, Instituto de Investigacion Carlos III, Comments: Thiswork was partially supported by a grant from the Spanish Ministry of Health, Instituto deInvestigacion Carlos III (grant No. 367823–764).* Mikel Terceno—RELATED: Grant:Academia Ciencies Mediques.* *Money paid to the institution.
REFERENCES1. Daverat P, Castel JP, Dartigues JF, et al. Death and functional out-
come after spontaneous intracerebral hemorrhage: a prospectivestudy of 166 cases using multivariate analysis. Stroke 1991;22:1– 6CrossRef Medline
2. Hendricks HT, van Limbeek J, Geurts AC, et al. Motor recovery afterstroke: a systematic review of the literature. Arch Phys Med Rehabil2002;83:1629 –37 CrossRef Medline
3. Feng W, Wang J, Chhatbar PY, et al. Corticospinal tract lesion load:
an imaging biomarker for stroke motor outcomes. Ann Neurol2015;78:860 –70 CrossRef Medline
4. Byblow WD, Stinear CM, Barber PA, et al. Proportional recoveryafter stroke depends on corticomotor integrity. Ann Neurol 2015;78:848 –59 CrossRef Medline
5. Pineiro R, Pendlebury ST, Smith S, et al. Relating MRI changes tomotor deficit after ischemic stroke by segmentation of functionalmotor pathways. Stroke 2000;31:672–79 CrossRef Medline
6. Pendlebury ST, Blamire AM, Lee MA, et al. Axonal injury in theinternal capsule correlates with motor impairment after stroke.Stroke 1999;30:956 – 62 CrossRef Medline
7. Zhu LL, Lindenberg R, Alexander MP, et al. Lesion load of the corti-cospinal tract predicts motor impairment in chronic stroke. Stroke2010;41:910 –15 CrossRef Medline
8. Lindenberg R, Renga V, Zhu LL, et al. Structural integrity of corti-cospinal motor fibers predicts motor impairment in chronicstroke. Neurology 2010;74:280 – 87 CrossRef Medline
9. Zhou Y, Wang Y, Wang J, el al. Inflammation in intracerebralhemorrhage: from mechanisms to clinical translation. Prog Neuro-biol 2014;115:25– 44 CrossRef Medline
10. Venkatasubramanian C, Kleinman JT, Fischbein NJ, et al. Naturalhistory and prognostic value of corticospinal tract Wallerian de-generation in intracerebral hemorrhage. J Am Heart Assoc 2013;2:e000090 CrossRef Medline
11. Chaudhary N, Pandey AS, Gemmete JJ, et al. Diffusion tensor imag-ing in hemorrhagic stroke. Exp Neurol 2015;272:88 –96 CrossRefMedline
12. Puig J, Pedraza S, Blasco G, et al. Wallerian degeneration in thecorticospinal tract evaluated by diffusion tensor imaging correlateswith motor deficit 30 days after middle cerebral artery ischemicstroke. AJNR Am J Neuroradiol 2010;31:1324 –30 CrossRef Medline
13. Thomalla G, Glauche V, Weiller C, et al. Time course of Walleriandegeneration after ischaemic stroke revealed by diffusion tensorimaging. J Neurol Neurosurg Psychiatry 2005;76:266 – 68 CrossRefMedline
14. Lindenberg R, Zhu LL, Ruber T, et al. Predicting functional motorpotential in chronic stroke patients using diffusion tensor imaging.Hum Brain Mapp 2012;33:1040 –51 CrossRef Medline
15. Puig J, Pedraza S, Blasco G, et al. Acute damage to the posterior limbof the internal capsule on diffusion tensor tractography as an earlyimaging predictor of motor outcome after stroke. AJNR Am J Neu-roradiol 2011;32:857– 63 CrossRef Medline
16. Kusano Y, Seguchi T, Horiuchi T, et al. Prediction of functionaloutcome in acute cerebral hemorrhage using diffusion tensor im-aging at 3T: a prospective study. AJNR Am J Neuroradiol 2009;30:1561– 65 CrossRef Medline
17. Yoshioka H, Horikoshi T, Aoki S, et al. Diffusion tensor tractog-raphy predicts motor functional outcome in patients with spon-taneous intracerebral hemorrhage. Neurosurgery 2008;62:97–103CrossRef Medline
18. Wang DM, Li J, Liu JR, et al. Diffusion tensor imaging predictslong-term motor functional outcome in patients with acute supra-tentorial intracranial hemorrhage. Cerebrovasc Dis 2012;34:199 –205 CrossRef Medline
19. Cheng CY, Hsu CY, Huang YC, et al. Motor outcome of deep intra-cerebral haemorrhage in diffusion tensor imaging: comparison ofdata from different locations along the corticospinal tract. NeurolRes 2015;37:774 – 81 CrossRef Medline
20. Kuzu Y, Inoue T, Kanbara Y, et al. Prediction of motor functionoutcome after intracerebral hemorrhage using fractional anisot-ropy calculated from diffusion tensor imaging. Cerebrovasc Dis2012;33:566 –73 CrossRef Medline
21. Koyama T, Tsuji M, Miyake H, et al. Motor outcome for patientswith acute intracerebral hemorrhage predicted using diffusion ten-sor imaging: an application of ordinal logistic modeling. J StrokeCerebrovasc Dis 2012;21:704 –11 CrossRef Medline
22. Koyama T, Uchiyama Y, Domen K. Associations of diffusion-tensorfractional anisotropy and FIM outcome assessments after intrace-
774 Puig May 2019 www.ajnr.org

rebral hemorrhage. J Stroke Cerebrovasc Dis. 2018;27:2869 –76CrossRef Medline
23. Koyama T, Tsuji M, Nishimura H, et al. Diffusion tensor imaging forintracerebral hemorrhage outcome prediction: comparison usingdata from the corona radiata/internal capsule and the cerebral pe-duncle. J Stroke Cerebrovasc Dis 2013;22:72–79 CrossRef Medline
24. Steiner T, Al-Shahi Salman R, Beer R, et al; European Stroke Organi-sation. European Stroke Organisation (ESO) guidelines for themanagement of spontaneous intracerebral hemorrhage. Int J Stroke2014;9:840 –55 CrossRef Medline
25. Sulter G, Steen C, De Keyser J. Use of the Barthel index and modifiedRankin scale in acute stroke trials. Stroke 1999;30:1538 – 41 CrossRefMedline
26. Lazar M, Weinstein DM, Tsuruda JS, et al. White matter tractogra-phy using diffusion tensor deflection. Hum Brain Mapp 2003;18:306 –21 CrossRef Medline
27. Tao WD, Wang J, Schlaug G, et al. A comparative study of fractionalanisotropy measures and ICH score in predicting functional out-comes after intracerebral hemorrhage. Neurocrit Care 2014;21:417–25 CrossRef Medline
28. Wakana S, Jiang H, Nagae-Poetscher LM, et al. Fiber tract-basedatlas of human white matter anatomy. Radiology 2004;230:77– 87CrossRef Medline
29. Martin RM, Wright MJ, Lutkenhoff ES, et al. Traumatic hemor-rhagic brain injury: impact of location and resorption on cognitiveoutcome. J Neurosurg 2017;126:796 – 804 CrossRef Medline
30. Urday S, Beslow LA, Goldstein DW, et al. Measurement of PHE inintracerebral hemorrhage. Stroke 2015;46:1116 –19 CrossRefMedline
31. Landis JR, Koch GG. The measurement of observer agreement forcategorical data. Biometrics 1977;33:159 –74 CrossRef Medline
32. Doughty C, Wang J, Feng W, et al. Detection and predictive value offractional anisotropy changes of the corticospinal tract in the acutephase of a stroke. Stroke 2016;47:1520 –26 CrossRef Medline
33. Kumar P, Yadav AK, Misra S, et al. Prediction of upper extremitymotor recovery after subacute intracerebral hemorrhage throughdiffusion tensor imaging: a systematic review and meta-analysis.Neuroradiology 2016;58:1043–50 CrossRef Medline
34. Alexander AL, Lee JE, Wu YC, et al. Comparison of diffusion tensorimaging measurements at 3.0 T versus 1.5 T with and without par-allel imaging. Neuroimaging Clin N Am 2006;16:299 –309, xiCrossRef Medline
35. Mori S. Fiber tracking: principles and strategies—a technical re-view. NMR Biomed 2002;15:468 – 80 CrossRef Medline
36. Mandelli ML, Berger MS, Bucci M, et al. Quantifying accuracy andprecision of diffusion MR tractography of the corticospinal tract inbrain tumors. J Neurosurg 2014;121:349 –58 CrossRef Medline
37. Chung S, Lu Y, Henry RG. Comparison of bootstrap approaches forestimation of uncertainties of DTI parameters. Neuroimage 2006;33:531– 41 CrossRef Medline
38. Alexander AL, Lee JE, Lazar M, et al. Diffusion tensor imaging of thebrain. Neurotherapeutics 2007;4:316 –29 CrossRef Medline
AJNR Am J Neuroradiol 40:769 –75 May 2019 www.ajnr.org 775

ORIGINAL RESEARCHADULT BRAIN
The Central Vein Sign in Radiologically Isolated SyndromeX S. Suthiphosuwan, X P. Sati, X M. Guenette, X X. Montalban, X D.S. Reich, X A. Bharatha, and X J. Oh
ABSTRACT
BACKGROUND AND PURPOSE: Radiologically isolated syndrome describes asymptomatic individuals with incidental radiologic abnor-malities suggestive of multiple sclerosis. Recent studies have demonstrated that �40% of white matter lesions in MS (and often substan-tially more) have visible central veins on MR imaging. This “central vein sign” reflects perivenous inflammatory demyelination and can assistin differentiating MS from other white matter disorders. We therefore hypothesized that �40% of white matter lesions in cases ofradiologically isolated syndrome would show the central vein sign.
MATERIALS AND METHODS: We recruited 20 participants diagnosed with radiologically isolated syndrome after evaluation by a neu-rologist. We performed 3T MR imaging of the brain and cervical spinal cord. White matter lesions were analyzed for the central vein sign.
RESULTS: Of 391 total white matter lesions, 292 (75%) demonstrated the central vein sign (central vein sign�). The median proportion ofcentral vein sign� lesions per case was 87% (range, 29%–100%). When the “40% rule” that has been proposed to distinguish MS from otherdisorders was applied, of 20 participants, 18 cases of radiologically isolated syndrome (90%) had �40% central vein sign� lesions (range,55%–100%). Two participants (10%) had �40% central vein sign� lesions (29% and 31%). When the simpler “rule of 6” was applied, 19participants (95%) met these criteria. In multivariable models, the number of spinal cord and infratentorial lesions was associated with ahigher proportion of central vein sign� lesions (P � .002; P � .06, respectively).
CONCLUSIONS: Most cases of radiologically isolated syndrome had a high proportion of central vein sign� lesions, suggesting thatlesions in these individuals reflect perivenous inflammatory demyelination. Moreover, we found correlations between the proportion ofcentral vein sign� lesions and spinal cord lesions, a known risk factor for radiologically isolated syndrome progressing to MS. These findingsraise the possibility, testable prospectively, that the central vein sign may have prognostic value in distinguishing patients with radiolog-ically isolated syndrome at risk of developing clinical MS from those with white matter lesions of other etiologies.
ABBREVIATIONS: CVS � central vein sign; RIS � radiologically isolated syndrome
Multiple sclerosis is an inflammatory demyelinating disease
of the central nervous system characterized by relapsing or
progressive neurologic symptoms and focal white matter lesions.1
Histopathologic studies have shown that these WM lesions, when
they first form, arise from inflammatory infiltrates around small
veins, or “perivascular cuffs.”2 On conventional MR imaging, MS
lesions typically manifest as focal areas of high signal on T2-
weighted images of the brain and spinal cord. However, focal
T2-hyperintense WM lesions can be seen in a variety of settings,
including normal aging, migraines, microangiopathy, and CNS
vasculitis. Misinterpretation of such lesions is the most common
cause of incorrect MS diagnosis,3 and partly to address this issue,
one can only apply the current MS diagnostic criteria in the setting
of typical clinically isolated syndrome.4-6 Diagnosing MS when
such a syndrome is not present is therefore challenging.
Recent studies using high-resolution, susceptibility-based MR
imaging sequences have demonstrated an identifiable vein inside
Received January 28, 2019; accepted after revision March 25.
From the Division of Neuroradiology (S.S., A.B.), Division of Neurology (S.S., M.G.,X.M., J.O.), Department of Medicine, and Division of Neurosurgery (A.B.), Departmentof Surgery, St. Michael’s Hospital, University of Toronto, Toronto, Ontario, Canada;Translational Neuroradiology Section (P.S., D.S.R.), National Institute of NeurologicalDisorders and Stroke, National Institutes of Health, Bethesda, Maryland; and Depart-ment of Neurology (D.S.R., J.O.), Johns Hopkins University, Baltimore, Maryland.
This work was supported by the MS Society of Canada and the St. Michael’s Hos-pital Foundation Love/Barford Endowment.
The funders had no role in the design and conduct of the study; collection, man-agement, analysis, and interpretation of the data; preparation, review, or approvalof the manuscripts; and the decision to submit the manuscript for publication.
Paper previously presented at: American Society of Neuroradiology Annual Meet-ing and the Foundation of the ASNR Symposium, June 2–7, 2018, Vancouver, BritishColumbia, Canada (abstract No. O-70).
Please address correspondence to Jiwon Oh, MD, FRCPC, PhD, 30 Bond St, Shuter3– 019, Toronto, ON, M4K 1Z1 Canada; e-mail: [email protected]
http://dx.doi.org/10.3174/ajnr.A6045
776 Suthiphosuwan May 2019 www.ajnr.org

WM lesions, called the “central vein sign” (CVS).3,7-21 On these
scans, the CVS is typically visible as a hypointense line that is
centered within the lesion; the hypointensity reflects the presence
of a paramagnetic substance, either deoxyhemoglobin or, in some
circumstances, a gadolinium-based contrast agent.9,11,12 Previous
studies assessing the CVS in MS have reported that a high fre-
quency of WM lesions in MS demonstrate the CVS compared
with WM lesions seen in microangiopathic disease, migraines,
CNS inflammatory vasculopathies, and neuromyelitis optica
spectrum disorders. 3,8,10,13-17,19-23 On the basis of these studies, a
cutoff threshold of 40% (in which �40% of WM lesions demon-
strate the CVS) has been proposed to distinguish MS from
non-MS disease.8 More recent studies have proposed more sim-
plified criteria, such as the “rule of 6,” whereby if �6 WM lesions
demonstrate the CVS, MS can be distinguished from other WM
disorders.10,21,23
Radiologically isolated syndrome (RIS) describes asymptom-
atic individuals or those with neurologic symptoms that are not
typical of MS, whose MR imaging scans show abnormalities typ-
ical of those seen in clinical MS.24 Individuals with RIS have an
increased risk of eventually developing clinical MS, but long-term
prospective studies are lacking. The largest, multicenter, retro-
spective study has shown that 34% of patients with RIS eventually
manifest clinically definite MS during 4.4 years.25 Factors that
increase the risk of conversion to MS include the following: male
sex, younger age (younger than 37 years of age), and the presence
of �1 spinal cord lesion on MR imaging.25,26 Another study dem-
onstrated that among individuals with RIS who develop MS,
11.7% develop primary-progressive MS, and these individuals are
more likely to be older and male and have spinal cord lesions.27
These data suggest that at least a portion of patients with RIS have
a subclinical form of MS; of these, many may never develop clin-
ical MS.
Currently, there is no consensus on the optimal clinical man-
agement of RIS because the natural history remains unclear and
there are no evidence-based treatment or management guide-
lines. Moreover, the current diagnostic criteria for RIS24 likely
result in a heterogeneous group of participants being designated
as such, including those who are at risk of developing MS and
those who have a minimal risk. This result is likely because the
diagnostic criteria for RIS are based entirely on lesion number and
distribution (Barkhof28 criteria for dissemination in space), crite-
ria that were originally intended to be applied to individuals with
symptomatology clinically suggestive of demyelinating dis-
ease. As a result, the current RIS criteria24 have limited ability
to reflect underlying subclinical demyelinating pathology,
which represents individuals at high risk of developing MS.29
Accordingly, assessing the CVS in WM lesions of RIS may be
helpful to better evaluate the underlying pathologic processes
of this entity and determine which individuals are at risk of
eventually developing clinical MS.30 To date, the presence of
the CVS has not been evaluated in RIS, to our knowledge.
Therefore, the objective of this study was to determine whether
adults with RIS have similar proportions of lesions positive for
CVS (CVS� lesions) compared with those previously reported
in clinical MS.
MATERIALS AND METHODSStandard Protocol Approvals, Registrations, and PatientConsentThis study was approved by the institutional review board of St.
Michael’s Hospital. All participants provided written informed
consent.
ParticipantsTwenty adults diagnosed with RIS by a neurologist at the St. Mi-
chael’s Hospital MS Clinic were recruited for prospective clinical
and MR imaging evaluation between July 2017 and December
2017. Because RIS is a rare entity31 and the central vein sign has
not yet been evaluated in RIS, we were not able to perform sample
size calculations of power analyses. Inclusion criteria were 18
years of age and older and meeting previously published clin-
ical and MR imaging criteria for RIS,24 which include the pres-
ence of asymptomatic WM abnormalities that are ovoid, well-
circumscribed, �3 mm in maximal diameter, and fulfilling 3 of
4 Barkhof criteria28 for dissemination in space (lesions in the
periventricular, juxtacortical, infratentorial, or spinal cord re-
gions). Brain MRIs were reviewed by experienced neuroradi-
ologists (S.S. and A.B.) and a neurologist (J.O.) to confirm
inclusion criteria. Individuals who had vascular risk factors
and a history of substance abuse or toxic exposure were
excluded.24
Clinical AssessmentWithin 30 days of MR imaging, study participants underwent an
examination by a neurologist. None of the participants experi-
enced a clinical relapse or neurologic symptoms suggestive of MS
between recruitment and the study visit.
MR ImagingMR imaging was performed on a 3T scanner (Magnetom Skyra;
Siemens, Erlangen, Germany) with a 20-channel head-neck coil
and a 16-channel spine-array coil.
Brain MR ImagingThe following parameters were used for brain sequences—3D T1-
weighted MPRAGE: TR/TE/flip angle � 1900/2.52 ms/9°, num-
ber of averages � 1, slice thickness � 1 mm, in-plane resolution �
1 � 1 mm2, and number of slices � 176; 3D T2-FLAIR: TR/TE/
TI/flip angle � 4800/353/1800 ms/120°, number of averages � 1,
slice thickness � 1 mm, in-plane resolution � 1 � 1 mm2, and
number of slices � 176; sagittal 3D T2*-weighted multishot echo-
planar imaging:9 TR/TE/flip angle � 64/35 ms/10°, number of
averages � 1, slice thickness � 0.65 mm, in-plane resolution �
0.65 � 0.65 mm2, and number of slices � 265.
Cervical Spinal Cord MR ImagingThe following parameters were used for cervical spinal cord se-
quences—sagittal 2D-T1-weighted phase-sensitive inversion re-
covery of the cervical spine:32 TR/TE/TI � 2400/9.4/400 ms,
number of averages � 2, slice thickness � 3 mm, in-plane reso-
lution � 0.7 � 0.7 mm2, and number of slices � 15. A T2-
weighted sequence of the cervical spine was not performed.
AJNR Am J Neuroradiol 40:776 – 83 May 2019 www.ajnr.org 777

Image AnalysisImages were evaluated for the presence of the CVS by 3 reviewers:
a neuroradiologist (S.S.), a medical physicist (P.S.), and a neurol-
ogist (J.O.). All reviewers completed training in CVS assessment
according to the consensus criteria of the North America Imaging
in Multiple Sclerosis Cooperative.11
White Matter Lesion Evaluation3D-T1-MPRAGE and 3D-T2-FLAIR images were evaluated for
the number, location, and size of WM lesions by a neuroradiolo-
gist (S.S.). WM lesion locations were classified into 4 typical loca-
tions of MS-related lesions in the brain, including cortical/juxta-
cortical (involving or touching the cortex), subcortical/deep,
periventricular (touching 1 of the ventricles), and infratentorial.
The size of the WM lesion was determined by assessing the largest
diameter of the lesion across all planes. The WM lesions with
hypointense signal lower than that on the cortex on T1-MPRAGE,
so called T1 black holes, were recorded.The Multi-Atlas Cortical Reconstruction Using Implicit Surface
Evolution33 was used to acquire volumes of brain substructures, total
lesion volume, and intracranial volume. The cerebral volume frac-
tion was calculated by dividing total brain volume by intracranial
volume.
CVS Assessment3D-T2* EPI magnitude images with multiplanar reconstruction
were viewed in 3 orthogonal planes to assess the presence of the
CVS using recently published guidelines.11 Specifically, identified
central veins had to meet the following criteria: have a small ap-
parent diameter (�2 mm); appear as a thin hypointense line or
small hypointense dot; be visible in at least 2 perpendicular planes
and appear as a thin hypointense line in 1 plane, run partially or
entirely through the lesion; and be positioned approximately in
the center of the WM lesion. WM lesions of �3 mm in maximum
diameter, confluent or contiguous lesions, lesions containing �1
vein, and poorly visible lesions were excluded from this analysis.
Two reviewers (S.S. and P.S.) independently evaluated brain
MRIs and assessed each WM lesion that was designated as being
positive for the CVS (CVS�), or not. If there was discordance be-
tween the 2 reviewers, a third reviewer (J.O.) assessed the lesion and a
consensus was reached by discussion. The proportion of CVS� WM
lesions in each participant was expressed as a percentage of the total
WM lesions in each participant. The CVS assessment was performed
blinded to the presence of spinal cord lesions and clinical information.
We applied 2 previously published criteria using the CVS
to distinguish MS from other WM disorders: the “40% rule,”
whereby a diagnosis of MS is likely if an individual has �40%
CVS� WM lesions;9 and the “rule of 6,” whereby a diagnosis of
MS is likely if an individual has �6 CVS� WM lesions. For the
rule of 6, if an individual has fewer than 6 CVS� WM lesions, but
CVS� WM lesions outnumber non-CVS WM lesions, a diagnosis
of MS can still be considered. If neither of these conditions is met,
the diagnosis of MS is unlikely.10
Cervical Spinal Cord Lesion CountSagittal 2D phase-sensitive inversion recovery images of the cer-
vical spine,32 which have been shown to have higher sensitivity for
cervical spinal cord lesions over T2-based imaging,32,34 were used
to assess for cervical spinal cord lesions. Phase-sensitive inversion
recovery images were reviewed by 1 reviewer (S.S.), and the num-
ber of the cervical spinal cord lesions was evaluated, while the
reviewer was blinded to the CVS analysis and clinical information.
Statistical AnalysisStatistical calculations were performed using SPSS (Version 23.0;
IBM, Armonk, New York). Univariable and multivariable linear
regression was used to identify independent variables associated
with the proportion of CVS� WM lesions. Statistical significance
was defined as P � .05.
RESULTSClinical Characteristics of Participants with RISThis study included 20 adults with RIS. Fifteen participants (75%)
were women. and the mean age was 46.3 years (range, 25– 62
years). None of the participants had any current or prior neuro-
logic symptoms suggestive of demyelinating disease. The neuro-
logic examination findings were normal in all except 4 subjects:
Three had a mildly diminished vibration sensation in the distal
lower limbs, and 1 subject had mild horizontal gaze-evoked nys-
tagmus without diplopia. Headache was the most common rea-
son (9/20, 45%) for the initial brain MR imaging being per-
formed. CSF studies were available in 6 of 20 participants with
RIS, and CSF-specific oligoclonal bands were detected in 5 partic-
ipants. Alternative diagnoses were clinically excluded by the treat-
ing neurologist and included a negative systemic autoimmune
screen in 18 of 20 participants. None of the subjects had under-
gone disease-modifying treatment used in MS. Table 1 summa-
rizes clinical and MR imaging characteristics, and Table 2 lists the
reasons for the initial brain MR imaging.
MR Imaging Findings
White Matter Lesions. A total of 997 WM lesions were identified.
The median number of WM lesions per participant with RIS was
33 (range, 9 –165). Two hundred six WM lesions (21%) were T1
black holes. The number of WM lesions in specific brain regions
was as follows: 193 cortical/juxtacortical lesions (19%), 562 sub-
cortical/deep WM lesions (56%), 203 periventricular WM lesions
(20%), and 39 infratentorial lesions (4%).
Nine participants with RIS (45%) had lesions in the infraten-
torial brain. There were 16 participants with RIS (80%) who had
WM lesions involving the corpus callosum (49 WM lesions). T1
black hole lesions were found in 15 participants with RIS (75%).
Automated brain segmentation33 was performed in 18 partic-
ipants with RIS. The median brain volume was 1208 cm3 (range,
1066 –1468 cm3), the median total brain lesion volume was 3.9
cm3 (range, 0.3–17.9 cm3), and the median cerebral volume frac-
tion was 0.9 (range, 0.88 – 0.91). Of note, the automated brain
segmentation34 failed in 2 cases (Table 1).
Cervical Spinal Cord Lesions. Thirteen participants (65%) had
at least 1 lesion in the cervical spinal cord. The median number
of lesions within the cervical spinal cord was 1 (range, 0 – 4)
(Table 1).
Central Vein Sign Assessment. Of 997 WM lesions, 606 (61%)
were excluded from analysis according to previously published
778 Suthiphosuwan May 2019 www.ajnr.org

CVS criteria,11 leaving 391 WM lesions (39%) for analysis. Of
these, 292 (75%) were CVS�, whereas 99 (25%) did not demon-
strate the CVS.
One hundred fourteen of 391 assessed WM lesions were T1
black holes. Of these, 106 T1 black hole lesions (93%) were CVS�.
Conversely, 106 of 292 CVS� WM lesions (36%) were T1 black
holes.
The median proportion of CVS� WM lesions per participant
was 87% (range, 29%–100%). When we applied the 40% rule,8 18
(90%) had �40% CVS� WM lesions (range: 55%–100%) and 2
(10%) had �40% CVS� WM lesions (29% and 31%) (Figs 1
and 2). Of note, the 2 individuals who did not meet the 40% rule
did not have any visible infratentorial lesions or spinal cord le-
sions. These 2 individuals underwent initial brain MR imaging for
work-up of pituitary adenoma and headache, which allowed
identification of the WM lesions. When the WM lesions in these 2
individuals were scrutinized retrospectively, most were small (�3
mm), punctate, rarely confluent, and located predominantly in
the anterior subcortical and deep WM. Furthermore, these indi-
viduals did not have WM lesions with T1
black holes or WM lesions involving the
corpus callosum.
Nineteen individuals with RIS (95%)
fulfilled the rule of 6 criteria.10 The sin-
gle individual who did not meet the rule
of 6 also failed to meet the 40% rule
(CVS� WM lesions, 31%). There was 1
participant who fulfilled the rule of 6 but
failed to meet 40% rule (CVS� WM le-
sions � 29%) (Table 3).
All the infratentorial lesions evalu-
ated were CVS� (13/13, 100%). Ninety-
three percent (56/60) of periventricular
WM lesions were CVS�, 78% (70/90)
of cortical/juxtacortical WM lesions
were CVS�, and 67% (153/228) of sub-
cortical/deep WM lesions were CVS�
(Fig 3).
Correlations between theProportion of CVS � WM Lesionsand Clinical/MR Imaging VariablesUnivariable regression analyses showed
that the number of cervical spinal cord
lesions was associated with a higher pro-
portion of CVS� WM lesions (P � .04).
In multivariable regression models, including age, sex, number of
brain WM lesions, cervical spinal cord lesions, and infratentorial
lesions, age and the number of cervical spinal cord lesions showed
a significant relationship with the proportion of CVS� WM le-
sions (P � .01 and .002, respectively), and the number of infraten-
torial lesions showed a trend toward a significant relationship
(P � .06). On the other hand, the total number of baseline WM
lesions did not show a significant association with the proportion
of CVS� WM lesions (P � .29) (Table 4).
DISCUSSIONIn this study, we found that nearly all participants with RIS in our
cohort had a high proportion of CVS� WM lesions, similar to
that previously been reported in MS.3,8,13-23,35 Furthermore, a
large proportion of our RIS cohort (18/20, 90%) met the 40% rule
(Fig 1 and Table 3),8 which has previously been proposed to dis-
tinguish WM lesions observed in MS from other WM disorders.8
This is the first study assessing those with the CVS in RIS, a
valuable population to evaluate because RIS is currently the ear-
liest detectable stage of MS. Historically, asymptomatic inflam-
matory demyelinating lesions have been identified in postmortem
series, with the estimated prevalence ranging from 0.08% to
0.2%.36-38 However, the true prevalence and natural history of
RIS remain unknown, making this entity challenging to manage
from a clinical perspective. The largest retrospective study to date
suggests that 34% of individuals with RIS develop clinical MS
during a follow-up of �5 years.25
This study suggests that most MR imaging–visible lesions in
RIS are consistent with perivenous demyelination, corroborating
the notion that most of these individuals have typical MS pathol-
Table 1: Clinical and MRI characteristics of RIS participantsClinical Characteristics
Participants (No.) 20Age (mean) (SD) (yr) 46 (11)Female (No.) (%) 15 (75%)No. of cases with positive oligoclonal band (No.) (%)a 5 (83%)
MRI characteristicsBrain lesions
Total brain lesion count (No.) 997No. of brain lesions per case (median) (range) 33 (9–165)Total brain lesion volume (median) (range) (cm3)b 3.9 (0.3–17.9)No. of cases with T1 black hole lesions (No.) (%) 15 (75%)No. of T1 black hole lesion count 206 (21%)No. of T1 black hole lesions per case (median) (range) 3.5 (0–43)No. of brain lesions included in the analysis (No.) (%) 391 (39%)No. of brain lesions excluded from analysis (No.) (%) 606 (61%)Brain volume (median) (range) (cm3)b 1208 (1066–1468)Cerebral volume fraction (median) (range)b 0.90 (0.88–0.91)
No. of assessed brain lesion/total brain lesion by region (%)Cortical/juxtacortical 90/193 (47%)Subcortical/deep 228/562 (40%)Periventricular 60/203 (30%)Infratentorial 13/39 (33%)
Cervical spinal cord lesionsNo. of cases with spinal cord lesions (No.) (%) 13 (65%)Total spinal cord lesion count 30
No. of spinal cord lesions per case (median) (range) 1 (0–4)a CSF analysis for oligoclonal bands was available in 6 of 20 cases.b Automated brain lesion volume measurements were obtained from 18 cases (n � 18). Automated brain segmentationfailed in 2 cases.
Table 2: Reasons for performing initial brain MRIReasons (No.) (%)
Headache 9 (45%)Work-up for pituitary adenoma 2 (10%)Transient paraphasic symptoms atypical for
demyelinating disease2 (10%)
Intermittent subjective cognitive symptoms 1 (5%)Intermittent nocturnal tremor 1 (5%)Pars planitis 1 (5%)Sinusitis 1 (5%)Back pain 1 (5%)Dental pain 1 (5%)Tinnitus 1 (5%)
AJNR Am J Neuroradiol 40:776 – 83 May 2019 www.ajnr.org 779

ogy and are at risk of converting to MS. Identifying large propor-
tions of CVS� WM lesions may have significant clinical implica-
tions for monitoring these participants and potentially initiating
disease-modifying treatment. Prospective follow-up of this co-
hort will test the hypothesis that the proportion of CVS� WM
lesions in RIS has (either positive or negative) prognostic value.
Furthermore, we also found T1 black holes in most subjects, and
most T1 black holes demonstrated the CVS, suggesting that the
observed WM lesions include destructive axonal pathology. It will
also be of interest to evaluate the prognostic value of T1 black
holes in RIS prospectively.
Current diagnostic criteria for MS emphasize lesion location
as a helpful factor in the differential diagnosis of clinically isolated
syndrome. When the WM lesions in our participants with RIS
were classified by location, we found that the posterior fossa had
the highest frequency of CVS� lesions, followed by periventricu-
lar and cortical/juxtacortical locations. On the other hand, sub-
cortical and deep WM lesions had the lowest frequency of CVS�
lesions (Fig 3). Previous studies that assessed only supratentorial
lesions8,35 found that the periventricular location had a high prev-
alence of CVS� lesions. Our observation of a very high propor-
tion of CVS� lesions in the infratentorial region is of interest and
is likely because lesions in the infratentorial region are not com-
monly seen with microangiopathy or migraines, common mimics
of MS on MR imaging scans. The high prevalence of infratentorial
CVS� lesions observed in our study highlights the importance of
assessing lesions in this region of the brain when evaluating RIS
and in patients in whom the diagnosis of MS is a possibility.
We found a significant correlation between the number of
spinal cord lesions and the proportion of CVS� WM lesions (Ta-
ble 4). Given that previous studies have shown that the presence of
a spinal cord lesion is one of the strongest predictors of RIS con-
verting to MS,25,26,39 this finding raises the possibility that the
proportion of CVS� WM lesions may similarly be a predictor of
RIS conversion to MS. In addition, the number of infratentorial
lesions in participants with RIS also showed a trend toward cor-
relating with the proportion of CVS� WM lesions, which, to-
gether with the observation that the infratentorial region has the
highest proportion of CVS� lesions, suggests that assessing le-
sions in this region for the CVS may be of value from a prognostic
standpoint. Given the cross-sectional nature of this study, how-
ever, these observations simply raise plausible hypotheses. Pro-
spective follow-up of this cohort will be important to test these
hypotheses before any definitive conclusions can be drawn.
A small proportion (2/20, 10%) of our RIS cohort had a low
proportion of CVS� WM lesions and
failed to meet the 40% rule (Fig 1 and
Table 3).8 Notably, both of these indi-
viduals had no observable infratentorial
or cervical spinal cord lesions identified
on MR imaging (Fig 2D–F). Taken to-
gether, these findings suggest that the
WM lesions observed in these patients
lack perivenous demyelination and that
there is therefore a lower risk of develop-
ing clinical MS. Although these individ-
uals were considered to have RIS based
on the applied consensus criteria, in ret-
rospect, the imaging pattern was more
“nonspecific”: Few lesions had the typi-
cal ovoid configuration of MS lesions.
This finding highlights an important ca-
veat of current RIS criteria, that lesions
be typical of MS in the eyes of an expert
observer. The determination of “typi-
cal” is necessarily subjective and ex-
plains why RIS cohorts may be heteroge-
neous.40,41 In other words, it is not
surprising, given current criteria, that
some individuals diagnosed with RIS
FIG 1. Proportion of white matter lesions demonstrating the centralvein sign per case and the 40% rule. Eighteen patients with RIS (90%)met the 40% rule, whereas 2 did not.
FIG 2. White matter lesions with evident central vein signs in 2 different radiologically isolatedsyndrome cases, as seen on axial reconstructed 3D-T2*-weighted segmented echo-planar imag-ing sequences and 3D-T2-weighted FLAIR sequences of the brain, and sagittal T1-weighted phase-sensitive inversion recovery of the cervical spinal cord. A 50-year-old woman in whom most (90%)of the white matter lesions demonstrate the central vein sign (A, arrows). This individual also hasevident infratentorial (B, arrows) and cervical spinal cord lesions (C, arrow). A 53-year-old womanwith a small proportion (29%) of white matter lesions demonstrating the central vein sign (D,arrow). This individual did not have any infratentorial (E) or cervical spinal cord lesions (F).
780 Suthiphosuwan May 2019 www.ajnr.org

may, in fact, have WM lesions related to other entities, such as
migraines, microangiopathy related to vascular risk factors, or
even other inflammatory disorders of the central nervous system.
Recent studies that have evaluated the CVS in other inflammatory
disorders, including neuromyelitis optica23 and central nervous
system inflammatory vasculopathies,22 have shown a significantly
higher proportion of CVS� WM lesions in MS. Thus, the avail-
ability of an imaging sign that is pathologically specific for MS-
type lesions, such as the CVS, should improve the diagnosis of RIS
and allow appropriate identification of individuals who are truly
at risk of developing MS, rather than other disorders.
The other studies have proposed other cutoff thresholds, in-
cluding 45%,10,21 50%,22 and 54%,23 of which the proportion of
CVS� WM lesions �45%, �50%, and �54% can be used to
distinguished MS from non-MS dis-
eases, respectively. Because the lowest
proportion of these 18 participants with
RIS with �40% CVS� WM lesions was
55%, applying either the 45% or 50%
rule led to the same observation, high-
lighting that most participants with RIS
had high CVS� WM lesions similar to
those in MS.
When we applied the rule of 6,10 the
more simplified method to assess the
CVS to our cohort, similar results were
observed with most RIS participants,
with the exception of 1 case. Only 1 case
did not fulfill the rule of 6, and this case
similarly failed to meet the 40% rule.
However, there was 1 case that failed to
meet the 40% rule but met the rule of 6.
On further scrutiny, this participant had
16 CVS� WM lesions of the 61 WM le-
sions (29%). By way of comparison, the
individual who did not meet both sets of
criteria had 5 CVS� WM lesions of a
total 16 WM lesions (31%).10 These ob-servations suggest that although there isgeneral agreement between the 2 sets ofcriteria, the 40% rule may be more spe-cific to individuals at risk of developingMS and the rule of 6 may need to beapplied with caution in individuals witha large number of WM lesions. In linewith this observation, another recentstudy in MS has shown that the rule of 6
has lower specificity for MS.21 Although
applying the rule of 6 has the benefit of
efficiency and simplicity over the 40%
rule, in cases with high WM lesion loads,
applying the 40% rule may prevent false-positive conclusions. Given the practicaldifficulty of computing the CVS propor-
tion in such cases, future directions may
include the development of automated
CVS detection algorithms42 that can be
rapidly applied in clinical settings. A re-cent study reported a promising automated CVS-detection pro-gram that was able to distinguish MS from non-MS disease; how-ever, the sensitivity and specificity of this program were lowerthan those in manually obtained CVS proportions, suggesting
that refinements need to be made before such programs can be
practically used in clinical settings.
This study has a number of limitations. First, the sample sizewas relatively small because RIS is a rare entity. Second, a signifi-cant proportion of WM lesions were excluded from CVS analysis
in our RIS cohort (61%), which is in accordance with current CVS
identification criteria.11 In addition, due to the potential risks of
gadolinium (ie, gadolinium retention and nephrogenic systemic
fibrosis), our MR imaging protocol did not include a gadolinium-
based contrast agent, which has been demonstrated to increase
FIG 3. White matter lesions demonstrating the central vein sign in different brain regions, using3D-T2*-weighted echo-planar imaging. A, Infratentorial. B, Deep white matter. C, Periventricular.D, juxtacortical.
Table 3: Comparison of CVS criteria for MS diagnosis in the RIS cohort
MS Diagnostic CriteriaUsing the CVS
No. of RIS Participants
Positive for CVS Negative for CVS40% rule 18 (90%) 2 (10%)Rule of 6 19 (95%) 1 (5%)
Table 4: Relationships between the proportion of white matter lesions demonstrating thecentral vein sign and demographic and MRI variables in cases of RIS
VariablesUnivariable
Regression (P Value)Multivariable
Regression (P Value)Age .27 .01Sex .30 .12Total No. of brain lesions .33 .29No. of infratentorial lesions .21 .06No. of cervical spinal cord lesions .04 .002
AJNR Am J Neuroradiol 40:776 – 83 May 2019 www.ajnr.org 781

visualization of central veins within small WM lesions on the 3D-
T2* EPI sequence due to its paramagnetic properties.9,11,12 Nev-
ertheless, the observed prevalence of CVS in our RIS individuals
was high, and in light of our detailed findings in the 2 individuals
with �40% CVS� lesions, the administration of gadolinium would
not likely have changed our conclusions. Furthermore, we were not
able to compare the CVS in RIS with that in a healthy control group
or with a group of patients with WM disorders other than MS; this
comparison would have been of interest. However, a number of prior
studies using similar methodologies have clearly demonstrated that
the CVS is rarely found in healthy controls9,23,35,43 and to a much
lower proportion in other WM disorders.3,8,11,15,21-23 Because this
study was performed using sequences identical to those in recent
studies and the CVS was evaluated by experienced investigators who
coauthored prior studies,3,9,11,12,15,21,22,42,43 the lack of a control
group would probably not have changed our conclusions. Finally,
due to the cross-sectional nature of this study, we were unable to
evaluate the prognostic value of the CVS in RIS. However, prospec-
tive follow-up of this cohort is planned, which will be informative
and may eventually help guide clinical management.
CONCLUSIONSIn this study, we found that most individuals with RIS based on
current diagnostic criteria have a high proportion of lesions dem-
onstrating the CVS, similar to that seen in clinical MS. This find-
ing suggests that most patients with RIS have perivenous demy-
elinating pathology typical of MS. Moreover, we found significant
correlations between the proportion of CVS� WM lesions and
spinal cord lesions in RIS, suggesting, by inference, that the CVS
may have prognostic value in RIS. This raises the possibility that
the CVS may be useful to distinguish patients with RIS at high risk
of developing clinical MS from those with truly nonspecific WM
lesions and therefore at minimal risk of developing clinical symp-
toms. Prospective follow-up of this cohort is planned, which will
enable a better understanding of the diagnostic and predictive
value of the CVS in RIS and of the natural history of RIS.
Disclosures: Suradech Suthiphosuwan—UNRELATED: Grants/Grants Pending:Sanofi Genzyme, Comments: I received fellowship educational support from anunrestricted educational grant. Xavier Montalban–UNRELATED: X.M. Consultancy:Biogen, Celgene, Sanofi Genzyme, Merck, Novartis, Roche and Teva Pharmaceutical.Daniel S. Reich—UNRELATED: Expert Testimony: Leventhal & Puga, P.C. Jiwon Oh—RELATED: Grant: MS Society of Canada and Love/Barford Endowment*; UNRELAT-ED: Consultancy: Biogen Idec, Roche, EMD Serono, Sanofi Genzyme, Celgene;Grants: Brain Canada, MS Society of Canada, Biogen Idec, Roche.* *Money paid tothe institution.
REFERENCES1. Thompson AJ, Baranzini SE, Geurts J, et al. Multiple sclerosis. Lancet
2018;391:1622–36 CrossRef Medline2. Adams CW, Abdulla YH, Torres EM, et al. Periventricular lesions in
multiple sclerosis: their perivenous origin and relationship togranular ependymitis. Neuropathol Appl Neurobiol 1987;13:141–52CrossRef Medline
3. Solomon AJ, Schindler MK, Howard DB, et al. “Central vessel sign”on 3T FLAIR* MRI for the differentiation of multiple sclerosis frommigraine. Ann Clin Transl Neurol 2016;3:82– 87 CrossRef Medline
4. Polman CH, Reingold SC, Edan G, et al. Diagnostic criteria for mul-tiple sclerosis: 2005 revisions to the “McDonald Criteria.” Ann Neu-rol 2005;58:840 – 46 CrossRef Medline
5. Polman CH, Reingold SC, Banwell B, et al. Diagnostic criteria for
multiple sclerosis: 2010 revisions to the McDonald criteria. AnnNeurol 2011;69:292–302 CrossRef Medline
6. Thompson AJ, Banwell BL, Barkhof F, et al. Diagnosis of multiplesclerosis: 2017 revisions of the McDonald criteria. Lancet Neurol2018;17:162–73 CrossRef Medline
7. Tallantyre EC, Brookes MJ, Dixon JE, et al. Demonstrating theperivascular distribution of MS lesions in vivo with 7-Tesla MRI.Neurology 2008;70:2076 –78 CrossRef Medline
8. Tallantyre EC, Dixon JE, Donaldson I, et al. Ultra-high-field imagingdistinguishes MS lesions from asymptomatic white matter lesions.Neurology 2011;76:534 –39 CrossRef Medline
9. Sati P, Thomasson DM, Li N, et al. Rapid, high-resolution, whole-brain, susceptibility-based MRI of multiple sclerosis. Mult Scler2014;20:1464 –70 CrossRef Medline
10. Mistry N, Abdel-Fahim R, Samaraweera A, et al. Imaging centralveins in brain lesions with 3-T T2*-weighted magnetic resonanceimaging differentiates multiple sclerosis from microangiopathicbrain lesions. Mult Scler 2016;22:1289 –96 CrossRef Medline
11. Sati P, Oh J, Constable RT, et al. The central vein sign and its clinicalevaluation for the diagnosis of multiple sclerosis: a consensus state-ment from the North American Imaging in Multiple Sclerosis Co-operative. Nat Rev Neurol 2016;12:714 –22 CrossRef Medline
12. Sati P, George IC, Shea CD, et al. FLAIR*: a combined MR contrasttechnique for visualizing white matter lesions and parenchymalveins. Radiology 2012;265:926 –32 CrossRef Medline
13. Kau T, Taschwer M, Deutschmann H, et al. The “central vein sign”:is there a place for susceptibility weighted imaging in possible mul-tiple sclerosis? Eur Radiol 2013;23:1956 – 62 CrossRef Medline
14. Samaraweera AP, Clarke MA, Whitehead A, et al. The central veinsign in multiple sclerosis lesions is present irrespective of the T2*sequence at 3 T. J Neuroimaging 2017;27:114 –21 CrossRef Medline
15. Solomon AJ, Watts R, Ontaneda D, et al. Diagnostic performance ofcentral vein sign for multiple sclerosis with a simplified three-le-sion algorithm. Mult Scler 2018;24:750 –57 CrossRef Medline
16. Sparacia G, Agnello F, Gambino A, et al. Multiple sclerosis: high preva-lence of the ‘central vein’ sign in white matter lesions on susceptibility-weighted images. Neuroradiol J 2018;31:356–61 CrossRef Medline
17. Miller AE, Calabresi PA. Central vein sign in multiple sclerosis:ready for front and center? Neurology 2018;90:631–32 CrossRefMedline
18. Inglese M, Fleysher L, Oesingmann N, et al. Clinical applications ofultra-high field magnetic resonance imaging in multiple sclerosis.Expert Rev Neurother 2018;18:221–30 CrossRef Medline
19. Hosseini Z, Matusinec J, Rudko DA, et al. Morphology-specific dis-crimination between MS white matter lesions and benign whitematter hyperintensities using ultra-high-field MRI. AJNR Am JNeuroradiol 2018;39:1473–79 CrossRef Medline
20. Lamot U, Avsenik J, Sega S, et al. Presence of central veins and sus-ceptibility weighted imaging for evaluating lesions in multiple scle-rosis and leukoaraiosis. Mult Scler Relat Disord 2017;13:67–72CrossRef Medline
21. Campion T, Smith RJP, Altmann DR, et al. FLAIR* to visualize veinsin white matter lesions: a new tool for the diagnosis of multiplesclerosis? Eur Radiol 2017;27:4257– 63 CrossRef Medline
22. Maggi P, Absinta M, Grammatico M, et al. Central vein sign differ-entiates multiple sclerosis from central nervous system inflamma-tory vasculopathies. Ann Neurol 2018;83:283–94 CrossRef Medline
23. Cortese R, Magnollay L, Tur C, et al. Value of the central vein sign at3T to differentiate MS from seropositive NMOSD. Neurology 2018;90:e1183–90 CrossRef Medline
24. Okuda DT, Mowry EM, Beheshtian A, et al. Incidental MRI anoma-lies suggestive of multiple sclerosis: the radiologically isolated syn-drome. Neurology 2009;72:800 – 05 CrossRef Medline
25. Okuda DT, Siva A, Kantarci O, et al; Radiologically Isolated Syn-drome Consortium (RISC), Club Francophone de la Sclerose enPlaques (CFSEP). Radiologically isolated syndrome: 5-year risk foran initial clinical event. PLoS One 2014;9:e90509 CrossRef Medline
26. Okuda DT, Mowry EM, Cree BA, et al. Asymptomatic spinal cord
782 Suthiphosuwan May 2019 www.ajnr.org

lesions predict disease progression in radiologically isolated syn-drome. Neurology 2011;76:686 –92 CrossRef Medline
27. Kantarci OH, Lebrun C, Siva A, et al. Primary progressive multiplesclerosis evolving from radiologically isolated syndrome. Ann Neu-rol 2016;79:288 –94 CrossRef Medline
28. Barkhof F, Filippi M, Miller DH, et al. Comparison of MRI criteria atfirst presentation to predict conversion to clinically definite multi-ple sclerosis. Brain 1997;120(Pt 11):2059 – 69 CrossRef Medline
29. Filippi M, Rocca MA, Ciccarelli O, et al; MAGNIMS Study Group.MRI criteria for the diagnosis of multiple sclerosis: MAGNIMS con-sensus guidelines. Lancet Neurol 2016;15:292–303 CrossRef Medline
30. De Stefano N, Giorgio A, Tintore M, et al. Radiologically isolatedsyndrome or subclinical multiple sclerosis: MAGNIMS consensusrecommendations. Mult Scler 2018;24:214 –21 CrossRef Medline
31. Forslin Y, Granberg T, Jumah AA, et al. Incidence of radiologicallyisolated syndrome: a population-based study. AJNR Am J Neurora-diol 2016;37:1017–22 CrossRef Medline
32. Alcaide-Leon P, Pauranik A, Alshafai L, et al. Comparison of sagittalFSE T2, STIR, and T1-weighted phase-sensitive inversion recoveryin the detection of spinal cord lesions in MS at 3T. AJNR Am J Neu-roradiol 2016;37:970 –75 CrossRef Medline
33. Huo Y, Carass A, Resnick SM, et al. Combining multi-atlas segmen-tation with brain surface estimation. Proc SPIE Int Soc Opt Eng 2016;9784 Medline
34. Nair G, Absinta M, Reich DS. Optimized T1-MPRAGE sequence forbetter visualization of spinal cord multiple sclerosis lesions at 3T.AJNR Am J Neuroradiol 2013;34:2215–22 CrossRef Medline
35. Kilsdonk ID, Lopez-Soriano A, Kuijer JP, et al. Morphological fea-
tures of MS lesions on FLAIR* at 7 T and their relation to patientcharacteristics. J Neurol 2014;261:1356 – 64 CrossRef Medline
36. Engell T. A clinical patho-anatomical study of clinically silent mul-tiple sclerosis. Acta Neurol Scand 1989;79:428 –30 CrossRef Medline
37. Gilbert JJ, Sadler M. Unsuspected multiple sclerosis. Arch Neurol1983;40:533–36 CrossRef Medline
38. Castaigne P, Lhermitte F, Escourolle R, et al. Asymptomatic multiplesclerosis: 3 cases (author’s transl) [in French]. Rev Neurol (Paris)1981;137:729 –39 Medline
39. Granberg T, Martola J, Kristoffersen-Wiberg M, et al. Radiologicallyisolated syndrome: incidental magnetic resonance imaging find-ings suggestive of multiple sclerosis—a systematic review. MultScler 2013;19:271– 80 CrossRef Medline
40. Labiano-Fontcuberta A, Benito-Leon J. Radiologically isolatedsyndrome: an update on a rare entity. Mult Scler 2016;22:1514 –21CrossRef Medline
41. Liu S, Kullnat J, Bourdette D, et al. Prevalence of brain magneticresonance imaging meeting Barkhof and McDonald criteria for dis-semination in space among headache patients. Mult Scler 2013;19:1101– 05 CrossRef Medline
42. Dworkin JD, Sati P, Solomon A, et al. Automated integration ofmultimodal MRI for the probabilistic detection of the central veinsign in white matter lesions. AJNR Am J Neuroradiol 2018;39:1806 –13 CrossRef Medline
43. Gaitn MI, de Alwis MP, Sati P, et al. Multiple sclerosis shrinks in-tralesional, and enlarges extralesional, brain parenchymal veins.Neurology 2013;80:145–51 CrossRef Medline
AJNR Am J Neuroradiol 40:776 – 83 May 2019 www.ajnr.org 783

ORIGINAL RESEARCHADULT BRAIN
Increased Water Content in Periventricular Caps in Patientswithout Acute Hydrocephalus
X T. Sichtermann, X J.K. Furtmann, X S. Dekeyzer, X G. Gilmour, X A.M. Oros-Peusquens, X J.P. Bach, X M. Wiesmann, X N.J. Shah,and X O. Nikoubashman
ABSTRACT
BACKGROUND AND PURPOSE: Periventricular caps are a common finding on MR imaging and are believed to reflect focally increasedinterstitial water content due to dysfunctional transependymal transportation rather than ischemic-gliotic changes. We compared thequantitative water content of periventricular caps and microvascular white matter lesions, hypothesizing that periventricular caps asso-ciated with increased interstitial fluid content display higher water content than white matter lesions and are therefore differentiable frommicrovascular white matter lesions by measurement of the water content.
MATERIALS AND METHODS: In a prospective study, we compared the water content of periventricular caps and white matter lesions in50 patients using a quantitative multiple-echo, gradient-echo MR imaging water-mapping sequence.
RESULTS: The water content of periventricular caps was significantly higher than that of white matter lesions (P � .002). Compared withnormal white matter, the mean water content of periventricular caps was 17% � 5% higher and the mean water content of white matterlesions was 11% � 4% higher. Receiver operating characteristic analysis revealed that areas in which water content was 15% higher comparedwith normal white matter correspond to periventricular caps rather than white matter lesions, with a specificity of 93% and a sensitivity of60% (P � .001). There was no significant correlation between the water content of periventricular caps and whole-brain volume (P � .275),white matter volume (P � .243), gray matter volume (P � .548), lateral ventricle volume (P � .800), white matter lesion volume (P � .081),periventricular cap volume (P � .081), and age (P � .224).
CONCLUSIONS: Quantitative MR imaging allows differentiation between periventricular caps and white matter lesions. Water contentquantification of T2-hyperintense lesions may be a useful additional tool for the characterization and differentiation of T2-hyperintensediseases.
ABBREVIATIONS: iNPH � idiopathic normal pressure hydrocephalus; PVC � periventricular cap; WML � white matter lesions
Periventricular caps (PVCs), smooth T2-hyperintense areas
around the lateral ventricles (mostly the frontal and posterior
horns, Fig 1), are a common finding on cranial MR imaging,
especially in elderly patients. Pathologic studies have shown that
PVCs do not correspond to ischemic-gliotic changes, but rather to
an area of finely textured myelin associated with denudation of
the ventricular ependymal lining.1 Because the ependyma pro-
vides a bidirectional barrier and transport system for CSF and
interstitial fluid exchange, age-related ependymal denudation
might impair normal transportation of interstitial fluid into the
ventricles, leading to an accumulation of interstitial fluid, which
converges from the surrounding white matter, around the frontal
horns of both lateral ventricles.1 According to this theory, the
increased T2 signal intensity in PVCs would reflect, at least in part,
edematous rather than pure gliotic white matter changes. How-
ever, gliotic white matter changes caused by microvascular disease
are also a frequent occurrence in the general population.2 Because
conventional T2-weighted sequences do not allow one to differ-
entiate between those 2 types of lesions, alternative imaging se-
quences are necessary to differentiate these 2 pathologies. Quan-
titative MR imaging allows the quantification of water content of
brain lesions within a clinically acceptable acquisition time of a
few minutes.3,4 For instance, it has been shown that quantitative
water mapping allows one to detect an increase in cerebral water
content in hepatic encephalopathy and to evaluate the surround-
ing edema in brain tumors.5,6
Received January 9, 2019; accepted after revision March 11.
From the Departments of Diagnostic and Interventional Neuroradiology (T.S., J.K.F.,S.D., G.G., M.W., O.N.) and Neurology (J.P.B., N.J.S.), University Hospital, RWTHAachen University, Aachen, Germany; Department of Radiology (S.D.), AntwerpUniversity Hospital (UZA), Antwerp, Belgium; and Institute of Neuroscience andMedicine (A.M.O.-P., N.J.S.), Julich, Germany.
Please address correspondence to Thorsten Sichtermann, MD, Klinik fur Diagnos-tische und Interventionelle Neuroradiologie, Universitatsklinikum Aachen, Pau-welsstr 30, 52074 Aachen, Germany; e-mail: [email protected]
http://dx.doi.org/10.3174/ajnr.A6033
784 Sichtermann May 2019 www.ajnr.org

We hypothesized that quantitative MR imaging allows differ-
entiation between PVCs and microvascular white matter lesions
(WML). Hence, the aim of this study was to investigate whether
PVCs, representing interstitial fluid due to dysfunctional tran-
sependymal transportation, contain an increased water content
compared with gliotic microvascular deep white matter lesions,
using a quantitative water-mapping sequence.
MATERIALS AND METHODSAfter approval from our local ethics board (faculty of medi-
cine, RWTH Aachen University), we prospectively scanned all
patients who presented with neurovascular symptoms between
May 2014 and February 2017 and who agreed to participate in our
study (n � 177). For this analysis, we included all patients who
had both PVCs and WML with a volume of at least .1 cm3. This
cutoff was chosen to address lesions that are clearly assessable on
clinical MR imaging with a typical slice thickness of 3–5 mm,
thereby reducing partial volume effects on our measurements. We
excluded patients with acute or subacute stroke adjacent to the
investigated areas and patients with pathologies other than PVCs
and WML, such as brain tumors or inflammation. This exclusion
left 50 patients included in our study. No patient had clinical or
radiologic signs of acute hydrocephalus or idiopathic normal
pressure hydrocephalus (iNPH).
Our standard MR imaging protocol consisted, among others,
of the following MR imaging sequences: DWI, FLAIR, T2*-
weighted, T2-weighted (sagittal), and T1-weighted (coronal). All
MR images were acquired on a 3T scanner (Magnetom Prisma;
Siemens; Erlangen, Germany).
Specifications of our T2-FLAIR sequence were as follows: TR,
9000 ms; TE, 98 ms; flip angle, 150°; FOV, 230 mm; section thick-
ness, 3 mm; matrix, 256 � 192; acquisition time, 3 minutes and
2 seconds.
For quantitative water content measurements, we used the man-
ufacturer’s 2D multiple-echo gradient-echo sequence acquired with
TR � 5000 ms and a nominal flip angle of 25°. By using an accelera-
tion factor for parallel imaging of integrated Parallel Acquisition
Techniques (“iPAT” � 2), the acquisition time (TA) for whole-brain
coverage was 4 minutes and 12 seconds. Other relevant parameters
were the following: TE1, 3.34 ms; deltaTE, 2.85 ms; 12 echoes; reso-
lution, 1 � 1 � 1.5 mm (50% slice gap); bandwidth, 510 Hz/px;
partial Fourier factor, 6/8; number of slices, 84.3
AnalysisTo delineate PVCs and WML, we used a semiautomatic segmen-
tation approach to allow objective segmentation. Initially, we
used the open-source deep learning framework DeepMedic (Ver-
sion 0.6.1; https://biomedia.doc.ic.ac.uk/software/deepmedic/),
which is used for automated segmentation, to segment the hyper-
intensities in the T2-FLAIR sequence.7 We trained the neural net-
work with 30 cases of voxelwise manually annotated ROIs as
“PVCs” and “WML,” depending on their morphology and loca-
tion. We defined PVCs as smooth periventricular caps at the fron-
tal and posterior horns of the lateral ventricles (grade 1 PVCs
according to Thomas et al8), whereas irregular T2-hyperintense
periventricular regions were not regarded as PVCs. WML were
defined as patchy or confluent T2-hyperintense areas in the deep
cerebral white matter. Areas where we could not clearly distin-
guish PVCs and WML were excluded altogether from our analy-
sis. For our final analysis, 2 independent observers examined all
segmented areas and adjusted the ROIs manually in a consensus
reading, for example, to modify ROIs contiguous with the ventri-
cles that could have been affected by partial volume effects. The
final ROIs were then used in the water-mapping acquisitions to
measure the quantitative water content of PVCs and WML. In
addition, we investigated whether there was a gradient of water
content from central periventricular white matter to more pe-
ripheral subcortical white matter by measuring 3 ROIs in the
periventricular white matter, the centrum semiovale, and the sub-
cortical white matter. Thus, we manually placed 3 respective ROIs
in normal white matter on 1 axial slice adjacent to the examined
T2 hyperintensities.
Statistical AnalysisAfter testing for data distribution with a Shapiro-Wilk test, we
performed a paired Student t test to determine whether the water
content between areas of PVCs and WML differed significantly.
We conducted an ANOVA to assess whether there was a gradient
between the central and peripheral water content. We performed
a receiver operating characteristic analysis to determine the sen-
sitivity and specificity of water content measurements for PVCs
and WML distinction. We examined correlations between PVC
water content and brain volume, lateral ventricle volume, lesion
volume, and age using the Pearson correlation coefficient. Con-
tinuous parametric variables are presented as mean � SD, and P
values with an � level �.05 were considered statistically signifi-
FIG 1. MR imaging acquisitions and segmentations. Exemplary T2-FLAIR (left) and water mapping (right) acquisitions and final segmen-tation (white ROIs). Periventricular caps (A and B) and gliotic whitematter lesions (C and D) in 2 different patients.
AJNR Am J Neuroradiol 40:784 – 87 May 2019 www.ajnr.org 785

cant. All statistical analyses were calculated using the SPSS soft-
ware package, Version 25 (IBM, Armonk, New York).
RESULTSThe mean age of our 50 patients (21 women) was 74 � 10 years
(median, 74 years; range, 45–94 years). The average volume of the
measured PVC ROIs was 2.3 � 1.5 cm3 (median, 1.9 cm3; range,
.6 –7.3 cm3). The average volume of the measured white matter
lesion ROIs was 4.6 � 7.6 cm3 (median, 2.0 cm3; range, .2– 46.3
cm3). The mean water content of healthy white matter was 69% �
2% (median, 69.6%; range 65%–74%). There was no gradient
between central and peripheral water content in healthy white
matter, with a water content of 70% � 3% (median, 70%; range,
65%– 80%) in the periventricular white matter, 69% � 2% (me-
dian, 69%; range, 64%–73%) at the centrum semiovale, and
69% � 3% (median, 69%; range, 63%–74%) in the subcortical
white matter (P � .122).
The absolute water content and the relative increase of water
content of PVCs was significantly higher than that of WML (P �
.002). The mean absolute water content in PVCs was 81% � 2%
(median, 81%; range, 77%– 85%). The water content in PVCs was
17% � 5% (median, 16%; range, 7%–26%) higher than that of
normal white matter (Fig 2). The mean absolute water content in
WML was 77% � 2% (median, 77%; range, 71%– 81%). The
water content in WML was 11% � 4% (median, 11%; range,
5%–19%) higher than that of normal white matter (Fig 2). The
water content of PVCs was higher than that of WML in all pa-
tients. Lesion volume had no significant impact on water content
in PVCs and WML (P � .953). Receiver operating characteristic
analysis revealed that a 15% higher water content corresponded to
PVCs rather than WML with a specificity of 93% and a sensitivity
of 60% (P � .001, area under the curve � .842).
There was no significant correlation between the water con-
tent of PVCs and whole-brain volume (P � .275), white matter
volume (P � .243), gray matter volume (P � .548), lateral ventri-
cle volume (P � .800), WML volume (P � .081), PVC volume
(P � .081), and age (P � .224).
DISCUSSIONThe microscopic nature of PVCs in patients without acute hydro-
cephalus is not fully understood. The literature suggests that
PVCs might be secondary to dysfunctional transependymal trans-
portation of interstitial fluid into the ventricles; thus, accordingly,
it is expected that PVCs show higher water content compared
with gliotic deep white matter lesions.1
In our study, we found that the water content of PVCs was
indeed significantly higher than that of deep WML. Our receiver
operating characteristic analysis revealed that a lesion with a 15%
or higher water content compared with normal white matter cor-
responds to PVCs rather than deep WML, with an acceptable
sensitivity and specificity. There was no significant correlation
between the water content of PVCs and brain volume, lateral ven-
tricle volume, lesion volume, and age. Because PVCs are located
around the ventricles and WML are located peripherally, we in-
vestigated whether the water content difference was due to a water
content gradient in healthy white matter with high water content
in the periventricular areas and low content in the periphery. We
assessed the water content in the respective regions and did not
detect any such gradient, suggesting that the high water content in
PVCs is, in fact, evidence of a histopathologic difference between
deep WML and PVCs. Our study does not allow determining the
exact pathophysiology of PVCs, in particular because our study
lacks longitudinal imaging that could elucidate the etiology of
PVCs. Hence, water content serves as a surrogate imaging marker
that confirms pathologic studies that showed that there is in-
creased water content accumulating from white matter surround-
ings or the intense venous network in this region.9,10 This work,
therefore, serves as an in vivo validation of previous pathologic
studies.
The results of this study may be translated to patients with
iNPH and may help understand the pathophysiology of that dis-
ease: For instance, it is still unclear whether periventricular
changes in patients with iNPH represent transependymal edema
or ischemic gliosis. In fact, it has been suggested that iNPH is
primarily driven by gliotic white matter infarction, which dimin-
ishes brain tissue compliance, especially because iNPH is associ-
ated with vascular risk factors such as diabetes and arterial hyper-
tension.11-13 On the other hand, abnormalities of CSF circulation
are believed to be the primary cause of iNPH,14-16 supported by
the fact that clinical symptoms and the degree of white matter
lesions improve in some patients after ventricular shunting, the
latter possibly depending on whether these lesions were gliotic or
edematous.17-19 Theoretically, quantitative water mapping could
be used in these patients to distinguish periventricular gliotic-
ischemic from edematous white matter changes in an attempt to
elucidate the underlying nature of these changes and eventually
predict shunt-responsiveness.
LimitationsA major limitation of our study is the lack of an in vivo criterion
standard for the distinction between gliotic and edematous T2
FIG 2. Relative increase of water content. The boxplot illustrates therelative increase of water content for periventricular caps and glioticwhite matter lesions.
786 Sichtermann May 2019 www.ajnr.org

hyperintensities, which leads, to some extent, to a speculative in-
terpretation of our data. In addition, it is not evident whether the
presumably gliotic WML in our included patients are, in fact,
caused by ischemia. To address this issue, we included only pa-
tients in whom microvascular ischemic gliosis was the most prob-
able cause for their WML. Due to the study design, our study
population consists solely of patients with neurovascular symp-
toms; inclusion of healthy, asymptomatic controls or patients
presenting a wider range of symptoms would allow a better gen-
eralization of the findings. A strength of our study is the inclusion
of patients with both PVCs and WML, which allows an intraindi-
vidual analysis. The fact that the water content of PVCs surpassed
the water content of WML in every single patient underlines that
averaging effects had no major impact on our results.
CONCLUSIONSWe found that the water content of periventricular caps was sig-
nificantly higher than that of deep white matter lesions; the latter
were most probably of microvascular origin. Our results show
that a lesion with a 15% or higher water content compared with
normal white matter corresponds to PVCs rather than WML.
Inversely, this finding also implies that it is possible to use quan-
titative water mapping to distinguish gliotic white matter lesions
from other T2-hyperintense lesions. Quantifying the water con-
tent of periventricular T2-hyperintense white matter changes may
be a useful additional tool for the differentiation of T2 hyperin-
tensities in iNPH or other diseases such as multiple sclerosis.
Disclosures: Martin Wiesmann—UNRELATED: Consultancy: Stryker Neurovascular;Grants/Grants Pending: Stryker Neurovascular*; Payment for Lectures IncludingService on Speakers Bureaus: Bracco Imaging, Medtronic, Siemens, Stryker Neuro-vascular; Payment for Development of Educational Presentations: Abbott, ab med-ica, Acandis, Bayer Healthcare AG, Bracco Imaging, B. Braun Medical, Codman Neu-rovascular, Kaneka Pharma, Medtronic, Dahlhausen, MicroVention, Nvidia,Penumbra, phenox, Philips Healthcare, Route 92 Medical, Siemens, Silk Road Medical,St. Jude, Stryker Neurovascular.* *Money paid to the institution.
REFERENCES1. Schmidt R, Schmidt H, Haybaeck J, et al. Heterogeneity in age-re-
lated white matter changes. Acta Neuropathol 2011;122:171– 85CrossRef Medline
2. Jones DK, Lythgoe D, Horsfield MA, et al. Characterization of whitematter damage in ischemic leukoaraiosis with diffusion tensorMRI. Stroke 1999;30:393–97 CrossRef Medline
3. Oros-Peusquens AM, Loucao R, Zimmermann M, et al. Methods formolecular imaging of brain tumours in a hybrid MR-PET context:
water content, T2*, diffusion indices and FET-PET. Methods 2017;130:135–51 CrossRef Medline
4. Shah NJ, Ermer V, Oros-Peusquens AM. Measuring the absolutewater content of the brain using quantitative MRI. Methods Mol Biol2011;711:29 – 64 CrossRef Medline
5. Shah NJ, Neeb H, Kircheis G, et al. Quantitative cerebral water con-tent mapping in hepatic encephalopathy. Neuroimage 2008;41:706 –17 CrossRef Medline
6. Neeb H, Zilles K, Shah NJ. A new method for fast quantitative map-ping of absolute water content in vivo. Neuroimage 2006;31:1156 – 68 CrossRef Medline
7. Kamnitsas K, Ledig C, Newcombe VFJ, et al. Efficient multi-scale 3DCNN with fully connected CRF for accurate brain lesion segmenta-tion. Med Image Anal 2017;36:61–78 CrossRef Medline
8. Thomas AJ, O’Brien JT, Barber R, et al. A neuropathological study ofperiventricular white matter hyperintensities in major depression.J Affect Disord 2003;76:49 –54 CrossRef Medline
9. Fazekas F, Kleinert R, Offenbacher H, et al. Pathologic correlates ofincidental MRI white matter signal hyperintensities. Neurology1993;43:1683– 89 CrossRef Medline
10. Sze G, De Armond SJ, Brant-Zawadzki M, et al. Foci of MRI signal(pseudo lesions) anterior to the frontal horns: histologic correla-tions of a normal finding. AJR Am J Roentgenol 1986;147:331–37CrossRef Medline
11. Krauss JK, Regel JP, Vach W, et al. Vascular risk factors and arterio-sclerotic disease in idiopathic normal-pressure hydrocephalus ofthe elderly. Stroke 1996;27:24 –29 CrossRef Medline
12. Silverberg GD. Normal pressure hydrocephalus (NPH): ischaemia,CSF stagnation or both. Brain 2004;127:947– 48 CrossRef Medline
13. Silverberg GD, Mayo M, Saul T, et al. Alzheimer’s disease, normal-pressure hydrocephalus, and senescent changes in CSF circulatoryphysiology: a hypothesis. Lancet Neurol 2003;2:506 –11 CrossRefMedline
14. Bradley WG Jr, Whittemore AR, Watanabe AS, et al. Association of deepwhite matter infarction with chronic communicating hydrocephalus:implications regarding the possible origin of normal-pressure hydro-cephalus. AJNR Am J Neuroradiol 1991;12:31–39 Medline
15. Symon L, Dorsch NW. Use of long-term intracranial pressure mea-surement to assess hydrocephalic patients prior to shunt surgery.J Neurosurg 1975;42:258 –73 CrossRef Medline
16. Bradley WG Jr, Scalzo D, Queralt J, et al. Normal-pressurehydrocephalus: evaluation with cerebrospinal fluid flow measure-ments at MR imaging. Radiology 1996;198:523–29 CrossRef Medline
17. Tullberg M, Jensen C, Ekholm S, et al. Normal pressurehydrocephalus: vascular white matter changes on MR images mustnot exclude patients from shunt surgery. AJNR Am J Neuroradiol2001;22:1665–73 Medline
18. Krauss JK, Droste DW, Vach W, et al. Cerebrospinal fluid shuntingin idiopathic normal-pressure hydrocephalus of the elderly: effectof periventricular and deep white matter lesions. Neurosurgery1996;39:292–99; discussion 299 –300 CrossRef Medline
19. Damasceno BP. Neuroimaging in normal pressure hydrocephalus.Dement Neuropsychol 2015;9:350 –55 CrossRef Medline
AJNR Am J Neuroradiol 40:784 – 87 May 2019 www.ajnr.org 787

CLINICAL REPORTADULT BRAIN
GJA1 Variants Cause Spastic Paraplegia Associated withCerebral Hypomyelination
X L. Saint-Val, X T. Courtin, X P. Charles, X C. Verny, X M. Catala, X R. Schiffmann, X O. Boespflug-Tanguy, and X F. Mochel
ABSTRACTSUMMARY: Oculodentodigital dysplasia is an autosomal dominant disorder due to GJA1 variants characterized by dysmorphic features.Neurologic symptoms have been described in some patients but without a clear neuroimaging pattern. To understand the pathophysi-ology underlying neurologic deficits in oculodentodigital dysplasia, we studied 8 consecutive patients presenting with hereditary spasticparaplegia due to GJA1 variants. Clinical disease severity was highly variable. Cerebral MR imaging revealed variable white matter abnor-malities, consistent with a hypomyelination pattern, and bilateral hypointense signal of the basal ganglia on T2-weighted images and/ormagnetic susceptibility sequences, as seen in neurodegeneration with brain iron accumulation diseases. Patients with the more prominentbasal ganglia abnormalities were the most disabled ones. This study suggests that GJA1-related hereditary spastic paraplegia is a complexneurodegenerative disease affecting both the myelin and the basal ganglia. GJA1 variants should be considered in patients with hereditaryspastic paraplegia presenting with brain hypomyelination, especially if associated with neurodegeneration and a brain iron accumulationpattern.
ABBREVIATIONS: Cx43 � connexin 43; Cx47 � connexin 47; ODDD � oculodentodigital dysplasia
Oculodentodigital dysplasia (ODDD, Online Mendelian In-
heritance in Man, No. 164200) is an autosomal dominant
disorder due to GJA1 variants1 and characterized by dysmorphic
features involving the eyes (microphthalmia and microcornea),
the nose (narrow, pinched nose with hypoplastic alae nasi), the
teeth (small and carious), and limb extremities (syndactyly,
camptodactyly). Some patients may present with neurosensory
deficits such as spastic paraplegia, ataxia, decreased visual acuity,
and hearing loss, possibly associated with white matter and/or
basal ganglia signal abnormalities on brain MR imaging.2,3 How-
ever, there is no comprehensive overview of the neuroimaging
features of ODDD besides isolated case reports. Therefore, to im-
prove the accuracy of clinical diagnosis and better understand the
pathophysiology underlying neurologic symptoms in ODDD, we
wished to define key brain imaging findings in 8 consecutive pa-
tients presenting with spastic paraplegia due to GJA1 variants.
MATERIALS AND METHODSWe retrospectively studied 8 patients from 5 families presenting
with hereditary spastic paraplegia. Patients were referred to refer-
ence centers for neurogenetic and neurometabolic diseases. Pa-
tients were informed and gave their consent to this study.
GJA1 variants were suspected on the basis of the co-occur-
rence of hereditary spastic paraplegia with dysmorphic features in
all patients. These dysmorphic features included ocular abnor-
malities (short palpebral fissures, microphthalmia), nasal abnor-
malities (long and narrow nose, hypoplastic alae nasi), dental ab-
normalities (microdontia, abnormal coloration of the enamel,
multiple caries), and bone extremity abnormalities (syndactyly of
the fourth and fifth fingers, clinodactyly, camptodactyly, and
aphalangia). Clinical examination was performed by experts in
rare neurologic diseases (P.C., C.V., M.C., and F.M.). Disease se-
verity was estimated by a disability stage index: 0, no functional
handicap; 1, no functional handicap but signs at examination; 2,
Received November 26, 2018; accepted after revision February 27, 2019.
From the Department of Genetics (L.S.-V., T.C., P.C., F.M.), Reference Center forAdult Neurometabolic Diseases (F.M.), and Department of Neurology (M.C.), Assis-tance Publique-Hopitaux de Paris, La Pitie-Salpetriere University Hospital, Paris,France; Department of Neurology and Reference Center for Neurogenetic Dis-eases (C.V.), Angers University Hospital, Angers, France; Sorbonne Universite (M.C.),Centre National de la Recherche Scientifique UMR 7622, Institut National de laSante et de la Recherche Medicale ERL 1156, Institut de Biologie Paris-Seine, Paris,France; Baylor Scott & White Research Institute (R.S.), Dallas, Texas; Department ofNeuropediatrics and Reference Center for Leukodystrophy and Leukoencephalop-athy (O.B.-T.), Assistance Publique–Hopitaux de Paris, Robert-Debre UniversityHospital, Paris, France; Groupe de Recherche Clinique No. 13, Neurometabolisme(F.M.), Sorbonne Universite, Paris, France; and Sorbonne Universite (F.M.), UniversitePierre-et-Marie-Curie–Paris 6, UMR S 1127 and Institut National de la Sante et de laRecherche Medicale U 1127, and Centre National de la Recherche Scientifique UMR7225, and Brain and Spine Institute, F-75013, Paris, France.
Please address correspondence to Fanny Mochel, MD, Reference Center forAdult Neurometabolic Diseases, Department of Genetics, La Pitie-SalpetriereUniversity Hospital, 47 Boulevard de l’Hopital 75013 Paris, France; e-mail:[email protected]
Indicates article with supplemental on-line photo.
http://dx.doi.org/10.3174/ajnr.A6036
788 Saint-Val May 2019 www.ajnr.org

mild, able to run, walking unlimited; 3, moderate, unable to run,
limited walking without aid; 4, severe, walking with 1 cane; 5,
walking with 2 canes; 6, unable to walk, requiring a wheelchair; 7,
confined to bed.
MR imaging was performed with a 1.5T (patients 1, 3, 5, 7, 8)
or 3T (patients 2, 4, and 6) magnetic field and included at least 1
axial T1- and T2-weighted sequence and 1 sagittal sequence. CT
scans were obtained in all patients except patients 1 and 3. Cere-
bral MR imaging and CT scans were qualitatively reviewed by 3
leukodystrophy experts (R.S., O.B.-T., and F.M.). Visual, brain
stem auditory, and somatosensory and motor-evoked potentials
were available for 4 patients.
RESULTSClinical findings are presented in Table 1. Most patients were
women (6/8) and had a family history of the disease (5/8). The age
at onset was variable, from 14 to 50 years of age, and symptoms at
onset were gait difficulties (4/8) and urinary dysfunction (4/8).
Disease severity was highly variable with a disability stage index
ranging from 1 to 6. All patients presented with spastic paraplegia
associated with reduced muscle strength in 4 patients and de-
creased vibration sense, more pronounced in the lower limbs, in 6
patients. Six patients presented with signs of neurogenic bladder
with variable severity: mild (1/8), moderate (3/8), and severe (2/
8). One patient required self-catheterization several times a day
(patient 3), and 1 had a cystectomy with enterocystoplasty (pa-
tient 4). Five patients had mild cerebellar signs.
Cerebral MR imaging revealed white matter abnormalities in
all patients, consisting mainly of mild-to-moderate symmetric
and diffuse hyperintensities of the corticospinal tracts on T2- and
FLAIR-weighted sequences associated with hyper- or isointense
T1-weighted signal (Table 2 and Fig 1), consistent with a hypo-
myelination pattern.4 Most patients also presented with variable
degrees of cerebral and cerebellar atrophy (Table 2 and Fig 1).
Furthermore, all patients presented with basal ganglia abnormal-
ities—that is, bilateral T2-hypointense signal of the pallidum and,
in some instances, substantia nigra, red nucleus, and dentate nu-
cleus, associated with bilateral hypointense signal of the pallidum
on T2*- or magnetic susceptibility-weighted images (Table 2, Fig
2, and On-line Figure) as seen in neurodegeneration with brain
iron accumulation diseases. One patient presented with a central
region of hyperintensity within the T2-weighted hypointense sig-
nal in the globus pallidus, the so-called eye of the tiger sign (Table
2 and Fig 2). CT showed bilateral or unilateral calcifications of the
basal ganglia in 2 of 5 patients (Table 2 and Fig 2). Patients with
the more prominent basal ganglia abnormalities were the most
disabled ones. When performed, visual, brain stem auditory, and
somatosensory and motor-evoked potentials showed diffuse and
pronounced central conduction anomalies (4/4), compatible with
a hypomyelinating process.
Molecular analyses revealed 4 previously reported GJA1 vari-
ants (c.93T�G, c.412G�A, c.428G�A, and c.443G�A)5 and one
novel heterozygous GJA1 variant (c.634T�A). Of note, the
mother of patient 4 carried the heterozygous c.428 G�A variant
but without any ODDD symptoms, including normal bone
extremities.
DISCUSSIONThis series of 8 patients with ODDD presenting with hereditary
spastic paraplegia shows that the neurologic symptoms associated
with GJA1 variants are related to a complex neurodegenerative
process affecting both the white matter and the basal ganglia.
Therefore, GJA1 variants should be considered in all patients with
hereditary spastic paraplegia presenting with brain hypomyelina-
tion, especially when associated with neurodegeneration with a
brain iron accumulation pattern. The early occurrence of urinary
symptoms in more than half of the patients suggests an ascending
process affecting the corticospinal tracts. Of note, most patients
were female, while men presented with a later onset of disease.
Indeed, the GJA1 gene encodes connexin 43 (Cx43), a trans-
membrane protein acting in intercellular communication.1 Cx43
is expressed in astrocytes and plays a role in astrocyte-oligoden-
drocyte communication by heterotypic Cx43/connexin 47 (Cx47)
channels. Some studies have suggested that Cx43/Cx47 channels
Table 1: Clinical and molecular characteristics of 8 patients with GJA1 variantsa
Patient 1# Patient 2# Patient 3 Patient 4* Patient 5* Patient 6* Patient 7 Patient 8Sex/age at examination (yr) Male/64 Female/34 Female/25 Female/49 Female/22 Female/19 Female/49 Male/56Family history Dominant Dominant None Dominant Dominant Dominant None DominantODDD dysmorphia Yes Yes Yes Yes Yes Yes Yes YesAge (yr)/symptom at onset 50/Gait 28/Gait 18/Urinary 14/Urinary 14/Urinary 16/Urinary 15/Gait 50/GaitCurrent disability stage 1 3 3 3 1 1 6 1LL reduced strength None Prox. Prox. Prox. None None Prox./dist. NoneLL spasticity Yes Yes Yes Yes No No Yes YesUL/LL reflexes 1/1 1/1 1/1 1/1 1/1 1/1 1/1 1/1Plantar reflexes Indifferent Extensor Extensor Extensor Extensor Extensor Extensor ExtensorUL/LL vibration sense N/2 N/2 N/2 2/2 N/N N/N N/2 N/2Romberg sign No Yes Yes No No No Yes NoOculomotor signs Hypermetric
saccadesSaccadic
pursuitNone Saccadic
pursuitHypermetric
saccadesNone None Saccadic
pursuitDysmetria/dysarthria Yes/No Yes/No No/No Yes/No Yes/No No/No No/No No/NoUrinary symptoms No � ��� ��� �� �� �� NoCognition Dysexec. Normal Normal Normal Normal Normal Normal NormalGJA1 variant c.93T�G c.93T�G c.443G�A c.428G�A c.428G�A c.428G�A c.412G�A c.634T�AAmino acid change p.I31M p.I31M p.R148Q p.G143D p.G143D p.G143D p.G138S p.F212I
Note:—* and # indicate patients belonging to the same family; UL, upper limbs; LL, lower limbs; Prox., proximal; dist., distal;1, increased;2, decreased; Dysexec., dysexecutivesyndrome; N, normal; �, mild; ��, moderate; ���, severe.a Disability stage index: 1, no functional handicap but signs at examination; 3, moderate, unable to run, limited walking without aid; 6, unable to walk, requiring wheelchair.
AJNR Am J Neuroradiol 40:788 –91 May 2019 www.ajnr.org 789

participate in myelin maintenance.6,7 Cx47, encoded by GJA12, is
deficient in Pelizaeus-Merzbacher-like disease,8 a hypomyelinat-
ing disorder characterized by nystagmus, delayed psychomotor
development, and cerebellospastic signs. Some data suggest that
the total loss of function of Cx47/Cx43 is implicated in the patho-
physiology of part of GJA12 variants.6,7 Similarities among
neurologic and imaging characteristics between Pelizaeus-
Merzbacher-like disease and ODDD could underlie common
molecular mechanisms involving the Cx43/Cx47 channels. How-
ever, unlike most hypomyelinating disorders such as Pelizaeus-
Merzbacher-like disease, the perception of neurologic symptoms
by patients with GJA1 variants usually occurs in adulthood, which
Table 2: Brain imaging characteristics of 8 patients with GJA1 variantsa
Patient 1 Patient 2 Patient 3 Patient 4 Patient 5 Patient 6 Patient 7 Patient 8Age (yr)/disability stage 64/1 34/3 25/3 49/3 22/1 19/1 49/6 56/1WM T1 signal (relative to the cortex
gray matter)Iso Hyper Hyper Iso Iso Hyper Iso Hyper
WM T2-hyperintense signalPeriventricular � �� � �� � � �� �Internal capsule (posterior limb) � � � � � �/� � �Corpus callosum � � � � � � � �Cerebellar peduncles � � � � � � � �Ventral pons � � � � � � � �
Globus pallidusHypointensity on T2*-/susceptibility-
weighted imagingND �� � �� �/� � �� �
Eye of the tiger � � � � � � � �Calcifications ND � ND � (Unilat.) � � �� (Bilat.) �
AtrophyVentricle/subarachnoid space ���/��� ��/� ��/� �/� �/� �/� ���/�� ���/�Corpus callosum �� �� �/� � � �/� ��� �Cerebellar vermis/hemisphere �/� ��/� �/� �/� �/� �/� ��/� ��/�
Note:—Iso indicates isointense; Hyper, hyperintense; ND, not done; Unilat., unilateral; Bilat., bilateral; �, absence of abnormalities; �/�, very mild; �, mild; ��, moderate;���, severe.a Disability stage index: 1, no functional handicap but signs at examination; 3, moderate, unable to run, limited walking without aid; 6, unable to walk, requiring wheelchair.
FIG 1. Axial scans of patients 8 (A–C) and 7 (E and F) show isointense-to-mild hyperintense T1-weighted signal (A and E) associated withmild-to-moderate hyperintense T2- (B and F) and FLAIR-weighted (C) signal of the white matter, especially the internal capsules (arrows) andoptic radiations (arrowheads). Sagittal T1-weighted image of patient 8 (D) shows atrophy of the corpus callosum and the vermis. T2-weightedimages of patients 2 (G) and 4 (H) show mild hyperintense signal of the corticospinal tract in the ventral pons (arrows) and cerebellar peduncles(arrowheads).
790 Saint-Val May 2019 www.ajnr.org
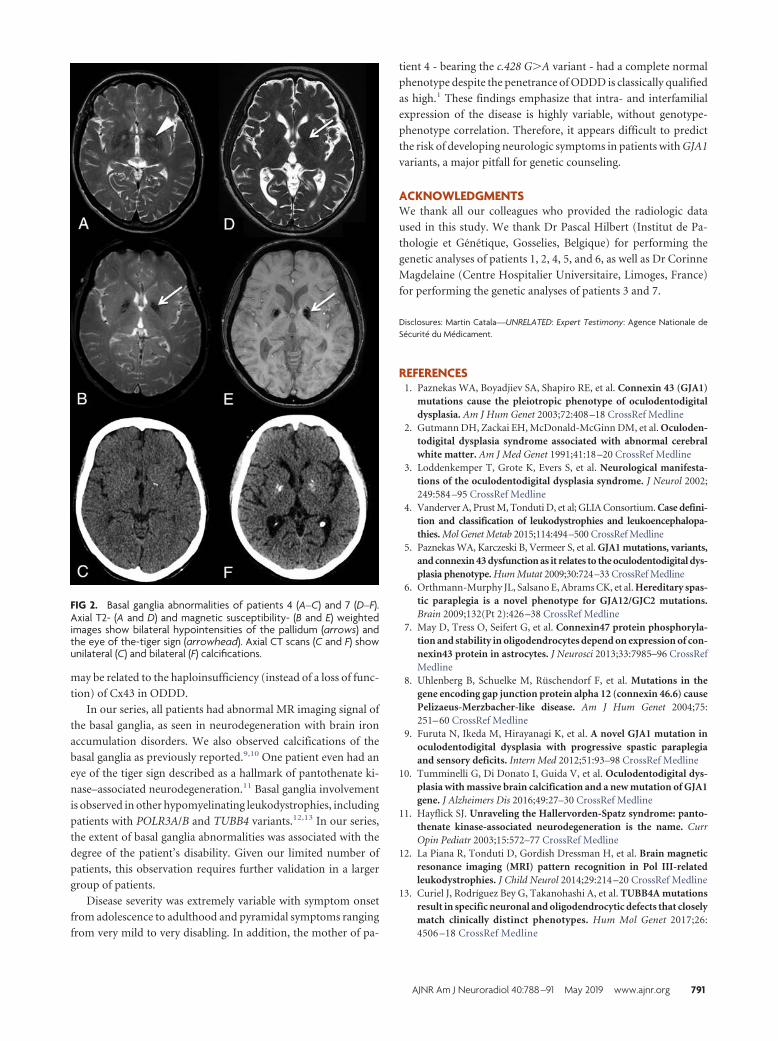
may be related to the haploinsufficiency (instead of a loss of func-
tion) of Cx43 in ODDD.
In our series, all patients had abnormal MR imaging signal of
the basal ganglia, as seen in neurodegeneration with brain iron
accumulation disorders. We also observed calcifications of the
basal ganglia as previously reported.9,10 One patient even had an
eye of the tiger sign described as a hallmark of pantothenate ki-
nase–associated neurodegeneration.11 Basal ganglia involvement
is observed in other hypomyelinating leukodystrophies, including
patients with POLR3A/B and TUBB4 variants.12,13 In our series,
the extent of basal ganglia abnormalities was associated with the
degree of the patient’s disability. Given our limited number of
patients, this observation requires further validation in a larger
group of patients.
Disease severity was extremely variable with symptom onset
from adolescence to adulthood and pyramidal symptoms ranging
from very mild to very disabling. In addition, the mother of pa-
tient 4 - bearing the c.428 G�A variant - had a complete normal
phenotype despite the penetrance of ODDD is classically qualified
as high.1 These findings emphasize that intra- and interfamilial
expression of the disease is highly variable, without genotype-
phenotype correlation. Therefore, it appears difficult to predict
the risk of developing neurologic symptoms in patients with GJA1
variants, a major pitfall for genetic counseling.
ACKNOWLEDGMENTSWe thank all our colleagues who provided the radiologic data
used in this study. We thank Dr Pascal Hilbert (Institut de Pa-
thologie et Genetique, Gosselies, Belgique) for performing the
genetic analyses of patients 1, 2, 4, 5, and 6, as well as Dr Corinne
Magdelaine (Centre Hospitalier Universitaire, Limoges, France)
for performing the genetic analyses of patients 3 and 7.
Disclosures: Martin Catala—UNRELATED: Expert Testimony: Agence Nationale deSecurite du Medicament.
REFERENCES1. Paznekas WA, Boyadjiev SA, Shapiro RE, et al. Connexin 43 (GJA1)
mutations cause the pleiotropic phenotype of oculodentodigitaldysplasia. Am J Hum Genet 2003;72:408 –18 CrossRef Medline
2. Gutmann DH, Zackai EH, McDonald-McGinn DM, et al. Oculoden-todigital dysplasia syndrome associated with abnormal cerebralwhite matter. Am J Med Genet 1991;41:18 –20 CrossRef Medline
3. Loddenkemper T, Grote K, Evers S, et al. Neurological manifesta-tions of the oculodentodigital dysplasia syndrome. J Neurol 2002;249:584 –95 CrossRef Medline
4. Vanderver A, Prust M, Tonduti D, et al; GLIA Consortium. Case defini-tion and classification of leukodystrophies and leukoencephalopa-thies. Mol Genet Metab 2015;114:494–500 CrossRef Medline
5. Paznekas WA, Karczeski B, Vermeer S, et al. GJA1 mutations, variants,and connexin 43 dysfunction as it relates to the oculodentodigital dys-plasia phenotype. Hum Mutat 2009;30:724–33 CrossRef Medline
6. Orthmann-Murphy JL, Salsano E, Abrams CK, et al. Hereditary spas-tic paraplegia is a novel phenotype for GJA12/GJC2 mutations.Brain 2009;132(Pt 2):426 –38 CrossRef Medline
7. May D, Tress O, Seifert G, et al. Connexin47 protein phosphoryla-tion and stability in oligodendrocytes depend on expression of con-nexin43 protein in astrocytes. J Neurosci 2013;33:7985–96 CrossRefMedline
8. Uhlenberg B, Schuelke M, Ruschendorf F, et al. Mutations in thegene encoding gap junction protein alpha 12 (connexin 46.6) causePelizaeus-Merzbacher-like disease. Am J Hum Genet 2004;75:251– 60 CrossRef Medline
9. Furuta N, Ikeda M, Hirayanagi K, et al. A novel GJA1 mutation inoculodentodigital dysplasia with progressive spastic paraplegiaand sensory deficits. Intern Med 2012;51:93–98 CrossRef Medline
10. Tumminelli G, Di Donato I, Guida V, et al. Oculodentodigital dys-plasia with massive brain calcification and a new mutation of GJA1gene. J Alzheimers Dis 2016;49:27–30 CrossRef Medline
11. Hayflick SJ. Unraveling the Hallervorden-Spatz syndrome: panto-thenate kinase-associated neurodegeneration is the name. CurrOpin Pediatr 2003;15:572–77 CrossRef Medline
12. La Piana R, Tonduti D, Gordish Dressman H, et al. Brain magneticresonance imaging (MRI) pattern recognition in Pol III-relatedleukodystrophies. J Child Neurol 2014;29:214 –20 CrossRef Medline
13. Curiel J, Rodríguez Bey G, Takanohashi A, et al. TUBB4A mutationsresult in specific neuronal and oligodendrocytic defects that closelymatch clinically distinct phenotypes. Hum Mol Genet 2017;26:4506 –18 CrossRef Medline
FIG 2. Basal ganglia abnormalities of patients 4 (A–C) and 7 (D–F).Axial T2- (A and D) and magnetic susceptibility- (B and E) weightedimages show bilateral hypointensities of the pallidum (arrows) andthe eye of the-tiger sign (arrowhead). Axial CT scans (C and F) showunilateral (C) and bilateral (F) calcifications.
AJNR Am J Neuroradiol 40:788 –91 May 2019 www.ajnr.org 791

BRIEF/TECHNICAL REPORTADULT BRAIN
Susceptibility-Weighted Angiography for the Follow-Up ofBrain Arteriovenous Malformations Treated with Stereotactic
RadiosurgeryX S. Finitsis, X R. Anxionnat, X B. Gory, X S. Planel, X L. Liao, and X S. Bracard
ABSTRACTSUMMARY: The criterion standard for assessing brain AVM obliteration postradiosurgery is DSA. To explore the value of susceptibility-weighted angiography, we followed 26 patients with brain AVMs treated by radiosurgery using susceptibility-weighted angiography andDSA. Studies were evaluated by 2 independent readers for residual nidi. Susceptibility-weighted angiography demonstrated good inter-modality (� � 0.71) and interobserver (� � 0.64) agreement, and good sensitivity (85.7%) and specificity (85.7%). Susceptibility-weightedangiography is a useful radiation- and contrast material–free technique to follow-up brain AVM obliteration postradiosurgery.
ABBREVIATIONS: bAVM � brain AVM; SRS � stereotactic radiosurgery; SWAN � susceptibility-weighted angiography
Brain AVMs (bAVMs) may be treated by either surgical resec-
tion, embolization, or radiosurgery. Following treatment,
confirmation of complete obliteration is imperative because the
risk of bleeding in incompletely obliterated lesions persists.1-3 Af-
ter AVM radiosurgery, occlusion is usually achieved after 2– 4
years, with regular imaging follow-up performed every 6 –12
months until complete bAVM obliteration is documented.1,2
The criterion standard for evaluating post-stereotactic radio-
surgery (SRS) bAVM obliteration is DSA because of its high spa-
tial and temporal resolution.4,5 However, DSA is a high-cost,
invasive procedure involving radiation and contrast media exposure,
with a 1% morbidity.6-9 Noninvasive alternatives such as 3D-TOF-
MRA, 3D contrast-enhanced MRA,10-12 and, lately, 4D time-re-
solved MRA11,13,14 have shown inferior diagnostic accuracy com-
pared to DSA. Moreover, most entail intravenous administration of
contrast material with additional cost and potential toxicity.15,16
Susceptibility-weighted angiography (SWAN) is a promising
new technology that indirectly evaluates the amount of oxygen
within blood vessels. As bAVMs shunt oxygenated blood from
arteries to veins, bAVM draining veins appear hyperintense,17
while normal veins containing deoxygenated blood appear hy-
pointense.18,19 SWAN demonstrates high spatial resolution that
allows small normal draining veins with a diameter inferior to the
size of the voxel to be visualized and is highly sensitive to small,
low-flow shunts.19 Moreover, SWAN does not require adminis-
tration of intravenous contrast material. We aimed to evaluate the
performance of SWAN for the follow-up of patients with bAVMs
treated with SRS.
MATERIALS AND METHODSInclusion CriteriaAfter institutional review board approval, all patients with
bAVMs treated with SRS at the University Hospital of Nancy,
France were prospectively included in a database. For the present
study, patients imaged between March 2012 and May 2018 were
included if they met the following criteria: 1) They had a bAVM
treated by embolization and radiosurgery or radiosurgery only, 2)
they were imaged during follow-up with SWAN at 1.5T or 3T and
DSA, 3) both examinations were performed within a time interval
of �6 months and without another treatment session in between,
and 4) both examinations were performed at least 12 months after
SRS.
The treatment strategy for each patient was based on multidis-
ciplinary decisions involving neurosurgeons, radiotherapists, and
neuroradiologists. For each patient, demographics, bleeding his-
tory, comorbidities, location of the nidus, Spetzler-Martin grade,
previous treatment history, clinical symptoms, and radiosurgical
parameters were recorded in a prospective database. The time
intervals between SRS and SWAN imaging, SWAN imaging and
DSA control were also recorded.
ImagingAfter SRS treatment, each patient underwent clinical evaluation
and MR imaging at 6-month intervals on either 1.5T or 3T scan-
Received December 17, 2018; accepted after revision March 10, 2019.
From the Department of Neuroradiology (R.A., B.G., S.P., L.L., S.B.), Centre Hospital-ier Universitaire de Nancy, Nancy, France; and AHEPA Hospital (S.F.), Aristotle Uni-versity of Thessaloniki, Thessaloniki, Greece.
Please address correspondence to Stephanos Finitsis, MD, AHEPA Hospital,Aristotle University of Thessaloniki, Thessaloniki, Greece; e-mail:[email protected]; @StephanosFinits
http://dx.doi.org/10.3174/ajnr.A6053
792 Finitsis May 2019 www.ajnr.org

ners (Signa 1.5T and 3T; GE Healthcare, Milwaukee, Wisconsin).
The MR imaging SWAN protocol was fairly consistent: At 1.5T,
the SWAN scanning parameters were the following: flip angle,
12°; TE, 80 ms; TR, 78.3 ms; slice thickness, 2.4 mm; FOV, 24 cm.
At 3T, the SWAN scanning parameters were the following: flip
angle, 15°; TE, 25 ms; number of echoes, 6; TR, minimum; slice
thickness, 0.8 mm reconstructed in 2-mm MIP; FOV, 24 cm. DSA
was performed on a biplane angiography unit (Innova; GE
Healthcare) with selective contrast injections of intracranial ves-
sels in standard projections.
Image AnalysisTwo independent senior readers (S.B. and R.A.), with �20 years
of experience in diagnostic and interventional neuroradiology
each, reviewed the axial SWAN examinations randomly and con-
firmed the presence or absence of a remaining arteriovenous
shunt, that is, the presence of hypersignal within the nidus or a
draining vein. Readers were blinded to baseline and follow-up
clinical data, DSA imaging, bAVM location, and treatments
received. In case of disagreement, consensus was reached by a
third senior neuroradiologist (S.F.). Results were recorded
separately and used to determine interobserver and intermo-
dality agreement.
DSA studies were reviewed in consensus by 2 other senior
readers. Total obliteration of the bAVM was defined as the com-
plete absence of the nidus, normalization of the afferent and ef-
ferent vessels, and a normal circulation time. Any remaining ni-
dus, regardless of its size, was considered “patent,” including the
existence of early-filling draining veins.
Statistical AnalysisQuantitative variables were described as median and interquartile
ranges, whereas qualitative variables were described as numbers
and percentages. Intermodality and interobserver agreement was
calculated using the � statistic. All analyses were completed using
commercial statistical software (SPSS, Version 23.0; IBM, Ar-
monk, New York).
RESULTSTwenty-six patients fulfilled the inclusion criteria (Fig 1). Pa-
tient demographics are shown in Table 1. Two patients under-
went 2 sets of imaging at different time points that were in-
cluded in the analysis. Before SRS, 23 patients were embolized
with a mixture of n-BCA and glue; and 1, with Onyx (Covidien,
Irvine, California).
Interobserver AgreementFor SWAN examinations, the 2 observers agreed on the existence
of a residual nidus in 23 of 28 cases (82.1%), resulting in good
interobserver agreement (� � 0.64; 95% CI, 0.36 – 0.92) (Figs 2
and 3). Table 2 shows the interpretations according to the 2 read-
ers and the consensus reading. Two disagreements corresponded
to nidus remnants of millimetric size. Three more disagreements
corresponded to occluded nidi that contained faint hyperintense
spots.
Intermodality AgreementThe consensus reading for SWAN showed agreement regarding
residual nidi in 24/28 (85.7%) cases, resulting in good intermo-
dality agreement (� � 0.71; 95% CI, 0.455– 0.974). Two unseen
nidi (false-negative cases) were very small (Fig 4). One false-pos-
itive case was due to a large intranidal calcification that was obvi-
ous on plain CT (Fig 5). Another false-positive case was a corpus
FIG 1. Patient flow chart.
Table 1: Characteristics of the 26 patientsa
CharacteristicsAge (yr) 33 (22–42)Sex, male 17 (65.4%)bAVM location
Supratentorial 24 (92.3%)Infratentorial 2 (7.7%)
Spetzler-Martin grade I (I–II)Presentation
Hemorrhage 20 (76.9%)Seizure 4 (15.4%)Headache 5 (19.2%)Neurologic symptoms 1 (3.8%)
Type of treatmentEmbolization then radiosurgery 22 (84.6%)Radiosurgery 2 (7.7%)Surgery then embolization then radiosurgery 2 (7.7%)
Time intervalsDelay between last treatment and SWAN (mo)b 34 (27.7–46.8)Delay between SWAN and DSA (days)b 3 (3–65)
a Continuous variables are presented as proportion and percentage; categoric vari-ables are described as median and first and third quartiles.b Calculated for 28 datasets because 2 patients had 2 separate SWAN/DSA follow-ups.
AJNR Am J Neuroradiol 40:792–97 May 2019 www.ajnr.org 793

callosum AVM with multiple adjacent arteries that gave the im-
pression of hyperintense draining veins (Fig 6). Univariate statis-
tics failed to show any association between false diagnostic results
and Spetzler-Martin grade (P � .6), AVM location (P � .6), pre-
vious hemorrhage (P � 1), and previous embolization (P � .27).
Diagnostic Value of SWANThe diagnostic accuracy of SWAN for a residual nidus reached a
sensitivity of 85.7%, a specificity of 85.7%, a positive predictive
value of 85.7%, and a negative predictive value of 85.7%.
DISCUSSIONThe role of SWAN in the post-SRS fol-
low-up of bAVMs has not been studied,
to our knowledge. Our results show that
SWAN has good intermodality (� �
0.71; 95% CI, 0.45– 0.97) and interob-
server (� � 0.64; 95% CI, 0.37– 0.92)
agreement compared with DSA, with a
sensitivity of 85.7%, specificity of 85.7%,
positive predictive value of 85.7%, and
negative predictive value of 85.7%.
Although SWAN has good diagnos-
tic accuracy, given its actual limitations,
a negative SWAN finding cannot assert
with certainty whether a bAVM is com-
pletely obliterated. However, it may
guide imaging follow-up of patients
with bAVMs treated with SRS without the need for intravenous
injection of gadolinium and may potentially help avoid some un-
necessary DSA examinations. After bAVM SRS, SWAN may be
performed annually until the findings become negative (ie, until
there is no residual shunt visible) and the final result can be con-
firmed by DSA.
Using SWAN, we found spots of increased signal intensity for
residual arteriovenous shunts and patent draining veins in 12 of
14 (85.7%) residual nidi diagnosed by DSA (Fig 2). This hyperin-
tense pattern has been noted in previous SWAN studies of non-
treated bAVMs. At high blood velocities, the hypersignal within
the nidus and the venous drainage are partially related to an in-
herent TOF effect of SWAN at 1.5T and 3T.19,20 At lower blood
velocities, higher blood-oxygen levels and a lack of paramagnetic
phase shift linked to direct arterial-to-venous shunt inside the
nidus appears to be mainly responsible for the hyperintensity.19
False-negative diagnoses of a residual nidus on SWAN oc-
curred in 2 cases of residual nidi of millimetric size (Fig 4). False-
positive diagnoses of a nidus remnant occurred in 2 patients. In
one, a hyperintense signal in a fully occluded nidus was produced
by susceptibility artifacts from a large calcified area visible on
plain CT (Fig 5). In the other patient, multiple hyperintense nor-
mal vessels near the occluded bAVM that proved to be normal
arteries gave the false impression of hyperintense small draining
veins (Fig 6). This pitfall may be avoided by the use of multiplanar
reformations to distinguish draining veins and arteries.19
In the present study, 20 of 26 (76.9%) bAVMs had previously
bled and contained hemosiderin. However, this was not found to
be detrimental to the diagnosis of a residual bAVM nidus (P � 1).
n-BCA glue was used as an embolic agent in 23 of 26 bAVMs
before SRS. When injected, n-BCA glue is mixed with Lipiodol
(Guerbet, Roissy, France), an oil-based contrast agent that could
exhibit high signal on T1- and T2-weighted images. However, in
the present series, previous embolization was not related to the
false diagnosis of a nidus remnant (P � .27). One patient had been
embolized with Onyx, but the remaining bAVM nidus was cor-
rectly diagnosed as patent. Previous embolizations could obscure
the margin of the nidus or result in a fragmented nidus and
thereby mislead to a false negative diagnosis. Although, in the
present series, glue did not interfere with the diagnostic accuracy
FIG 2. A 42-year-old man with a left cerebellar AVM, partially embolized with glue. A, SWANimaging 3 years after SRS shows hyperintense vessels (white arrow) in the posterior part of thenidus that correspond to a nidal remnant confirmed by DSA (black arrow, B).
FIG 3. A 19-year-old woman with a right posterior frontal AVM withhemorrhagic presentation, partially embolized with glue. SWAN im-aging 2.5 years after SRS shows the complete occlusion of the nidus(white arrow) confirmed by DSA (not shown).
794 Finitsis May 2019 www.ajnr.org

of SWAN, the potential for diagnostic pitfalls related to the use of
ethylene copolymer– based embolic agents should be investigated
in larger series.
Lee et al21 assessed the diagnostic accuracy of 3D-TOF and T1
postcontrast MR imaging for the diagnosis of residual post-SRS
treated bAVMs and found sensitivities ranging from 76.7% to
84.9% and specificities from 88.9% to 95%. Other authors have
studied the accuracy of time-resolved MRA and have found sen-
Table 2: Detection of nidus remnant on SWAN compared with DSAa
DSA
SWAN Reader 1 SWAN Reader 2 Consensus Reading
Patent Obliterated Patent Obliterated Patent ObliteratedPatent (n � 14) 11 3 11 2 12 2Obliterated (n � 14) 5 9 3 12 2 12Sensitivity (%) 68.7 78.6 85.7Specificity (%) 75 85.7 85.7PPV (%) 78.6 84.6 85.7NPV (%) 64.3 80 85.7
Note:—PPV indicates positive predictive value; NPV, negative predictive value.a Prevalence of nidus remnant after SRS for bAVM.
FIG 4. A 32-year-old man with a right parietal AVM with hemorrhagic presentation, partially embolized with glue. SWAN imaging 3.5 years afterSRS (white arrow, A) fails to show a very small residual nidus that was depicted by DSA (black arrow, B).
FIG 5. A 60-year-old man with a left parietal AVM with hemorrhagic presentation that was partially embolized with glue. A, SWAN imaging 4years after SRS shows an amorphous area of hyperintensity within the nidus (white arrow) that was diagnosed as a nidus remnant, but the DSAfindings were negative. B, CT shows extensive calcification (white arrow) inside the AVM scar.
AJNR Am J Neuroradiol 40:792–97 May 2019 www.ajnr.org 795

sitivities, specificities, positive and negative predictive values
ranging from 64.3% to 79.6%, 90.6% to 100%, 84.6% to 100%,
and 78.3% to 90% respectively.11,21 The clear advantage of SWAN
compared to these techniques is the absence of contrast material
administration, which represents added cost and entails potential
toxicity.15,16 Compared to 3D-TOF techniques or the detection of
T2-weighted flow voids, SWAN has the potential to be more sen-
sitive to small, slow-flow shunts.19 Nevertheless, a head-to-head
comparison with these techniques is warranted.
SWAN is a susceptibility weighted imaging technique avail-
able exclusively on GE scanners. Therefore, caution should be
used when extrapolating the present findings to susceptibility
weighted imaging sequences of other MR imaging machine ven-
dors, where venous drainage may appear hypointense22-24 or
hyperintense.17,25
During the study period, a substantial number of patients did
not undergo SWAN. This may have introduced bias in our study.
Also, studies were performed on MR imaging machines with 2
different field strengths (1.5T and 3T). However, follow-up pro-
tocols were consistent. Moreover, readers were not allowed to use
MIP or reformatted images, or consult baseline SWAN or DSA
studies which, if available, may have improved diagnostic
accuracy.
CONCLUSIONSSWAN is a useful radiation- and contrast material–free technique
for the follow-up of patients with brain AVMs treated by SRS. It
has the potential to reduce the number of DSA controls after SRS.
However, given the actual limitations of SWAN, DSA remains
mandatory for the final assessment of brain AVM cure.
REFERENCES1. Pierot L, Cognard C, Spelle L. Cerebral arteriovenous
malformations: evaluation of the hemorrhagic risk and its mor-bidity [in French]. J Neuroradiol 2004;31:369 –75 CrossRefMedline
2. Novakovic RL, Lazzaro MA, Castonguay AC, et al. The diagnosis andmanagement of brain arteriovenous malformations. Neurol Clin2013;31:749 – 63 CrossRef Medline
3. Maruyama K, Kawahara N, Shin M, et al. The risk of hemorrhage
after radiosurgery for cerebral arteriovenous malformations.N Engl J Med 2005;352:146 –53 CrossRef Medline
4. Oppenheim C, Meder JF, Trystram D, et al. Radiosurgery of cerebralarteriovenous malformations: is an early angiogram needed? AJNRAm J Neuroradiol 1999;20:475– 81 Medline
5. Steiner L, Lindquist C, Adler JR, et al. Clinical outcome of radiosur-gery for cerebral arteriovenous malformations. J Neurosurg 1992;77:1– 8 CrossRef Medline
6. Dawkins AA, Evans AL, Wattam J, et al. Complications of cerebralangiography: a prospective analysis of 2,924 consecutive proce-dures. Neuroradiology 2007;49:753–59 CrossRef Medline
7. Heiserman JE, Dean BL, Hodak JA, et al. Neurologic complicationsof cerebral angiography. AJNR Am J Neuroradiol 1994;15:1401– 07;discussion 1408 –11 Medline
8. Earnest F 4th, Forbes G, Sandok BA, et al. Complications of cerebralangiography: prospective assessment of risk. AJR Am J Roentgenol1984;142:247–53 Medline
9. Bendszus M, Koltzenburg M, Burger R, et al. Silent embolism indiagnostic cerebral angiography and neurointerventionalprocedures: a prospective study. Lancet 1999;354:1594 –97CrossRef Medline
10. Heidenreich JO, Schilling AM, Unterharnscheidt F, et al. Assessmentof 3D-TOF-MRA at 3.0 Tesla in the characterization of the angio-architecture of cerebral arteriovenous malformations: a prelimi-nary study. Acta Radiol 2007;48:678 – 86 CrossRef Medline
11. Lim HK, Choi CG, Kim SM, et al. Detection of residual brain arte-riovenous malformations after radiosurgery: diagnostic accuracyof contrast-enhanced four-dimensional MR angiography at 3.0 T.Br J Radiol 2012;85:1064 – 69 CrossRef Medline
12. Unlu E, Temizoz O, Albayram S, et al. Contrast-enhanced MR 3Dangiography in the assessment of brain AVMs. Eur J Radiol 2006;60:367–78 CrossRef Medline
13. Soize S, Bouquigny F, Kadziolka K, et al. Value of 4D MR angiogra-phy at 3T compared with DSA for the follow-up of treated brainarteriovenous malformation. AJNR Am J Neuroradiol 2014;35:1903– 09 CrossRef Medline
14. Hadizadeh DR, Kukuk GM, Steck DT, et al. Noninvasive evaluationof cerebral arteriovenous malformations by 4D-MRA for preoper-ative planning and postoperative follow-up in 56 patients: compar-ison with DSA and intraoperative findings. AJNR Am J Neuroradiol2012;33:1095–101 CrossRef Medline
15. Kanda T, Ishii K, Kawaguchi H, et al. High signal intensity in thedentate nucleus and globus pallidus on unenhanced T1-weighted MR images: relationship with increasing cumulativedose of a gadolinium-based contrast material. Radiology 2014;270:834 – 41 CrossRef Medline
FIG 6. A 19-year-old man with a left frontal AVM with hemorrhagic presentation that was partially embolized with glue. A, SWAN imaging 5 yearsafter SRS shows hyperintense vessels (white arrow) near the AVM that were mistakenly diagnosed as a nidus remnant. B, Digital subtractionangiography findings were negative.
796 Finitsis May 2019 www.ajnr.org

16. Mawad H, Laurin LP, Naud JF, et al. Changes in urinary and serumlevels of novel biomarkers after administration of gadolinium-based contrast agents. Biomark Insights 2016;11:91–94 CrossRefMedline
17. Jagadeesan BD, Delgado Almandoz JE, Moran CJ, et al. Accuracy ofsusceptibility-weighted imaging for the detection of arteriovenousshunting in vascular malformations of the brain. Stroke 2011;42:87–92 CrossRef Medline
18. Hodel J, Rodallec M, Gerber S, et al. Susceptibility weighted mag-netic resonance sequences “SWAN, SWI and VenoBOLD”: techni-cal aspects and clinical applications [in French]. J Neuroradiol 2012;39:71– 86 CrossRef Medline
19. Hodel J, Blanc R, Rodallec M, et al. Susceptibility-weighted angiog-raphy for the detection of high-flow intracranial vascular lesions:preliminary study. Eur Radiol 2013;23:1122–30 CrossRef Medline
20. Schmitz BL, Aschoff AJ, Hoffmann MHK, et al. Advantages and pit-falls in 3T MR brain imaging: a pictorial review. AJNR Am J Neuro-radiol 2005;26:2229 –37 Medline
21. Lee KE, Choi CG, Choi JW, et al. Detection of residual brain arte-riovenous malformations after radiosurgery: diagnostic accuracy
of contrast-enhanced three-dimensional time of flight MR angiog-raphy at 3.0 Tesla. Korean J Radiol 2009;10:333–39 CrossRef Medline
22. Saini J, Thomas B, Bodhey NK, et al. Susceptibility-weighted imag-ing in cranial dural arteriovenous fistulas. AJNR Am J Neuroradiol2009;30:E6 CrossRef Medline
23. Noguchi K, Kuwayama N, Kubo M, et al. Intracranial dural arterio-venous fistula with retrograde cortical venous drainage: use of sus-ceptibility-weighted imaging in combination with dynamic suscep-tibility contrast imaging. AJNR Am J Neuroradiol 2010;31:1903–10CrossRef Medline
24. Gasparetto EL, Pires CE, Domingues RC. Susceptibility-weightedMR phase imaging can demonstrate retrograde leptomeningeal ve-nous drainage in patients with dural arteriovenous fistula. AJNRAm J Neuroradiol 2011;32:E54 CrossRef Medline
25. Letourneau-Guillon L, Krings T. Simultaneous arteriovenousshunting and venous congestion identification in dural arterio-venous fistulas using susceptibility-weighted imaging: initialexperience. AJNR Am J Neuroradiol 2012;33:301– 07 CrossRefMedline
AJNR Am J Neuroradiol 40:792–97 May 2019 www.ajnr.org 797

BRIEF/TECHNICAL REPORTADULT BRAIN
Image Processing to Improve Detection of Mesial TemporalSclerosis in Adults
X F. Dahi, X M.S. Parsons, X H.L.P. Orlowski, X A. Salter, X S. Dahiya, and X A. Sharma
ABSTRACTSUMMARY: In this retrospective case-control study, we investigated whether an image-processing algorithm designed to exaggerate theintensity of diseased hippocampi on FLAIR images can improve the diagnostic accuracy and interobserver reliability of radiologists indetecting mesial temporal sclerosis–related hippocampal signal alteration. Herein, we share the results of this study that showed that theimage processing improved the confidence of radiologists in detecting mesial temporal sclerosis–related signal alteration, allowing animproved sensitivity, specificity, and interobserver reliability.
ABBREVIATIONS: MTS � mesial temporal sclerosis; SI � signal intensity
A confident identification of mesial temporal sclerosis (MTS)
based on hippocampal volume loss, signal abnormality, and
architectural distortion on MR imaging is important for timely
surgical management of refractory epilepsy.1-4 Because signal ab-
normalities may precede volume loss in MTS, improved detection
of hippocampal signal abnormalities may help in its early diagno-
sis and treatment.5 Recently, an image-processing algorithm us-
ing correlative properties of neighboring pixels has shown prom-
ise in selectively enhancing the visual conspicuity of diseased
hippocampi.6,7 Here we share the results of a retrospective case-
control study testing whether this image processing could trans-
late into an improved diagnostic performance of radiologists in
detecting MTS in adults.
MATERIALS AND METHODSImage Processing and ReviewA blinded coinvestigator processed coronal FLAIR images from
51 subjects with MTS and 51 healthy controls (Table 1) with a
proprietary image-processing algorithm (Correlative Image En-
hancement) using a custom plug-in for OsiriX Lite (https://www.
downloadthat.com/windows/search/osirix_lite_for_windows).
The algorithm exaggerated the hippocampal signal intensity (SI)
if it was considerably higher than that of the normal gray matter as
defined by an ROI drawn over the normal-appearing insular cor-
tex. Processed images were saved as a separate DICOM series. Six
readers with varied experience levels reviewed baseline and pro-
cessed images separately, rating the SI of each hippocampus on a
5-point scale: 1, definitely normal; 2, probably normal; 3, possibly
normal; 4, probably abnormal; and 5, definitely abnormal. They
also indicated whether the hippocampal SI was unusually high,
suggesting the effect of processing.
Data AnalysisDifferences among the median SI ratings across all readers for
baseline and processed images were computed and compared
using a paired t test or signed rank test. If one considered the SI
ratings of 1–3 as normal and 4 –5 as abnormal, the effects of
processing on the sensitivity, specificity, positive predictive
value, negative predictive value, and accuracy of each reader
and for all readers were assessed. Sensitivity was additionally
assessed for a subgroup of patients in whom the MR imaging
findings were originally reported as normal. The effect of pro-
cessing on the interobserver reliability of identifying hip-
pocampal signal abnormality (SI ratings) was computed using
a model-based measure of agreement, which is robust to the
underlying disease prevalence.8
RESULTSAll readers reported confluent areas of markedly increased signal
(Fig 1) in processed images of 37 (72.5%) diseased hippocampi.
Individual readers reported processing-related foci of markedly
Received October 26, 2018; accepted after revision January 18, 2019.
From the Progressive Physicians Association (F.D), Bethlehem, Pennsylvania; andMallinckrodt Institute of Radiology (M.S.P., H.L.P.O., A.Sharma), Department ofBiostatistics (A.Salter), and Department of Pathology and Immunology (S.D.), Wash-ington University School of Medicine, Washington University in St Louis, St Louis,Missouri.
Please address correspondence to Matthew Parsons, MD, Mallinckrodt Institute ofRadiology, Washington University School of Medicine, Campus Box 8131, 510 SKingshighway Blvd, St. Louis, MO 63110; e-mail: [email protected];@MattParsonsMD
http://dx.doi.org/10.3174/ajnr.A6022
798 Dahi May 2019 www.ajnr.org
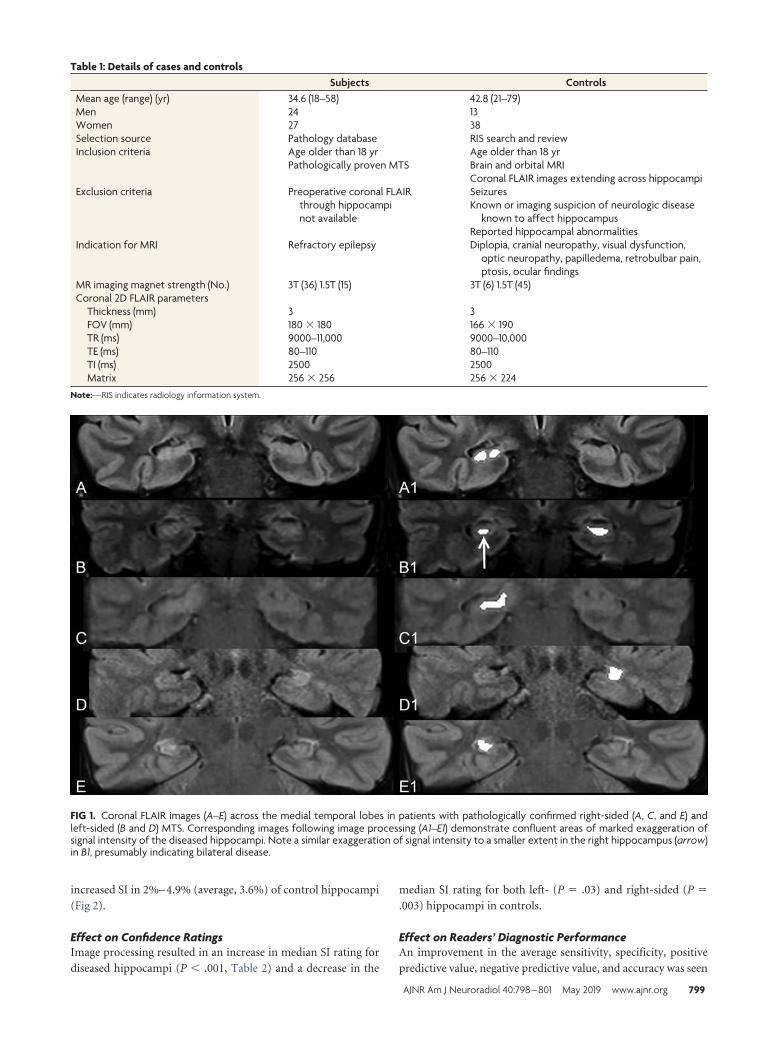
increased SI in 2%– 4.9% (average, 3.6%) of control hippocampi
(Fig 2).
Effect on Confidence RatingsImage processing resulted in an increase in median SI rating for
diseased hippocampi (P � .001, Table 2) and a decrease in the
median SI rating for both left- (P � .03) and right-sided (P �
.003) hippocampi in controls.
Effect on Readers’ Diagnostic PerformanceAn improvement in the average sensitivity, specificity, positive
predictive value, negative predictive value, and accuracy was seen
FIG 1. Coronal FLAIR images (A–E) across the medial temporal lobes in patients with pathologically confirmed right-sided (A, C, and E) andleft-sided (B and D) MTS. Corresponding images following image processing (A1–E1) demonstrate confluent areas of marked exaggeration ofsignal intensity of the diseased hippocampi. Note a similar exaggeration of signal intensity to a smaller extent in the right hippocampus (arrow)in B1, presumably indicating bilateral disease.
Table 1: Details of cases and controlsSubjects Controls
Mean age (range) (yr) 34.6 (18–58) 42.8 (21–79)Men 24 13Women 27 38Selection source Pathology database RIS search and reviewInclusion criteria Age older than 18 yr Age older than 18 yr
Pathologically proven MTS Brain and orbital MRICoronal FLAIR images extending across hippocampi
Exclusion criteria Preoperative coronal FLAIRthrough hippocampinot available
SeizuresKnown or imaging suspicion of neurologic disease
known to affect hippocampusReported hippocampal abnormalities
Indication for MRI Refractory epilepsy Diplopia, cranial neuropathy, visual dysfunction,optic neuropathy, papilledema, retrobulbar pain,ptosis, ocular findings
MR imaging magnet strength (No.) 3T (36) 1.5T (15) 3T (6) 1.5T (45)Coronal 2D FLAIR parameters
Thickness (mm) 3 3FOV (mm) 180 � 180 166 � 190TR (ms) 9000–11,000 9000–10,000TE (ms) 80–110 80–110TI (ms) 2500 2500Matrix 256 � 256 256 � 224
Note:—RIS indicates radiology information system.
AJNR Am J Neuroradiol 40:798 – 801 May 2019 www.ajnr.org 799

after processing (Table 3). The average sensitivity increased by
�10% (Table 3), and readers were able to detect hippocampal
signal abnormality in 4/10 (40%) cases reported as having normal
findings on the original clinical reports.
Effect on Interobserver ReliabilityProcessing resulted in an improvement in the interobserver
agreement in SI ratings for cases of MTS from moderate (Fleiss
� � 0.4; 95% CI, 0.2– 0.56) to almost perfect (Fleiss � � 0.88; 95%
CI, 0.80 – 0.97).9 For control hippocampi, interobserver agree-
ment improved from slight to moderate.9
DISCUSSIONIn our study, an easily recognizable increase in the contrast-to-
noise ratio of diseased hippocampi by the image processing6,7
translated into substantial improvement in sensitivity when
present and slight improvement in specificity when absent.
Our results indicate that this processing may help detect MTS
in some patients with focal epilepsy with otherwise normal MR
imaging findings,10 thereby allowing earlier diagnosis and
treatment. An improvement in interobserver agreement may
make this processing particularly helpful for nonexpert read-
ers, prompting a timely referral to experts.
Unlike volumetry-based techniques,11,12 the image pro-
cessing used in our study relies on highlighting MTS-related
signal abnormality. Thus, it is similar to other techniques such
as T2 relaxometry and automated FLAIR analysis but may be
more generalizable because it does not require comparison
with normative data.13-16
CONCLUSIONSThe image-processing algorithm tested by us can improve detec-
tion of MTS on MR imaging. In view of a small possibility of
false-positive effects of processing, this technique should serve as
a complement to a complete epilepsy protocol MR imaging, in-
terpreted in the context of clinical history.
Disclosures: Amber Salter—UNRELATED: Consultancy: Circulation CardiovascularImaging. Aseem Sharma—RELATED: Other: Correlative Enhancement LLC, Com-ments: I hold the intellectual property rights to the image-processing algorithms
FIG 2. Representative postprocessed coronal FLAIR images acrossthe medial temporal lobes of 5 controls without seizures. Process-ing did not result in any alteration of hippocampal signal (A and B)for most control hippocampi. While punctate (C and D) foci ofsignal exaggeration were noted in some control hippocampi,false-positive confluent regions of increased intensity mimickingMTS (E) were observed in the bilateral hippocampi of 1 (2%)control.
Table 2: Effect of image processing on signal intensity ratings for subjects with MTS, right-sided control hippocampi, and left-sidedcontrol hippocampi on a 5-point scalea
Median Minimum25th
Percentile75th
Percentile Maximum PSubjects 4.00 1.00 1.00 2.00 4.00 �.001Subjects (processed) 5.00 1.00 1.00 2.00 5.00Controls (R) 1.00 1.00 1.00 1.50 3.50 �.01Controls (R, processed) 1.00 1.00 1.00 1.00 5.00Controls (L) 1.00 1.00 1.00 1.50 2.00 .03Controls (L, processed) 1.00 1.00 1.00 1.00 5.00
Note:—R indicates right; L, left.a 1, Definitely normal; 2, probably normal; 3, possibly normal; 4, probably abnormal; 5, definitely abnormal.
Table 3: Diagnostic performance of 6 blinded readers indetection of MTS-related hippocampal signal alterationbefore and after image processing with a proprietaryalgorithm
Reader Sensitivity Specificity PPV NPV AccuracyBefore processing
R1 72.55 98.04 97.37 78.13 0.85R2 60.78 98.04 96.88 71.43 0.79R3 43.14 100.00 100.00 63.75 0.72R4 58.82 92.16 88.24 69.12 0.75R5 86.27 80.39 81.48 85.42 0.83R6 66.67 100.00 100.00 75.00 0.83Mean (SD) 64.71 (14.46) 94.77 (7.61) 93.99 (7.50) 73.81 (7.53) 0.80 (0.05)
After ProcessingR1 74.51 96.08 95.00 79.03 0.85R2 78.43 98.04 97.56 81.97 0.88R3 72.55 98.04 97.37 78.13 0.85R4 78.43 92.16 90.91 81.03 0.85R5 72.55 98.04 97.37 78.13 0.85R6 74.51 98.04 97.44 79.37 0.86Mean (SD) 75.16 (2.68) 96.73 (2.37) 95.94 (2.65) 79.61 (1.57) 0.86 (0.01)
Note:—R1 and R2 indicate radiology residents; R3 and R4, neuroradiology fellows; R5 andR6, attending neuroradiologists; PPV, positive predictive value; NPV, negative predictivevalue.
800 Dahi May 2019 www.ajnr.org

used in this study. I have founded a company (Correlative Enhancement LLC) withthe aim of future commercialization of this intellectual property. I am the soleproprietor of the company, and since the inception of the company until now(including the time during which I processed the images for this study), this companyhas not received funding from any external source. While I used the algorithms toprocess the images for this study, I did not participate in patient selection, imagereview, image analysis, or the subsequent statistical analysis; UNRELATED: Consul-tancy: Biomedical Systems, Comments: As a consultant, I serve as an independentreviewer for imaging studies performed for research by third parties; Patents(Planned, Pending or Issued): I have been issued the patent for the method of imageprocessing used in this and other studies; Stock/Stock Options: GE Healthcare, Com-ments: I hold approximately $10,000 worth of publicly traded GE stocks. SonikaDahiya—UNRELATED: Employment: Washington University School of Medicine.
REFERENCES1. Kuzniecky RI, Bilir E, Gilliam F, et al. Multimodality MRI in mesial
temporal sclerosis: relative sensitivity and specificity. Neurology1997;49:774 –78 CrossRef Medline
2. Janszky J, Janszky I, Schulz R, et al. Temporal lobe epilepsy withhippocampal sclerosis: predictors for long-term surgical outcome.Brain 2005;128:395– 404 Medline
3. Thom M, Mathern GW, Cross JH, et al. Mesial temporal lobeepilepsy: how do we improve surgical outcome? Ann Neurol 2010;68:424 –34 CrossRef Medline
4. Malmgren K, Thom M. Hippocampal sclerosis– origins and imag-ing. Epilepsia 2012;53(Suppl 4):19 –33 CrossRef Medline
5. Provenzale JM, Barboriak DP, VanLandingham K, et al. Hippocam-pal MRI signal hyperintensity after febrile status epilepticus is pre-dictive of subsequent mesial temporal sclerosis. AJR Am J Roent-genol 2008;190:976 – 83 CrossRef Medline
6. Parsons MS, Sharma A, Hildebolt C. Using correlative properties ofneighboring pixels to enhance contrast-to-noise ratio of abnormalhippocampus in patients with intractable epilepsy and mesial tem-
poral sclerosis. Acad Radiol 2018 Jun 12. [Epub ahead of print]CrossRef Medline
7. Orlowski HL, Smyth MD, Parsons MS, et al. Enhancing contrast tonoise ratio of hippocampi affected with mesial temporal sclerosis: acase-control study in children undergoing epilepsy surgeries. ClinNeurol Neurosurg 2018;174:144 – 48 CrossRef Medline
8. Nelson KP, Edwards D. Measures of agreement between many rat-ers for ordinal classifications. Stat Med 2015;34:3116 –32 CrossRefMedline
9. Landis JR, Koch GG. An application of hierarchical kappa-type sta-tistics in the assessment of majority agreement among multiple ob-servers. Biometrics 1977;33:363–74 CrossRef Medline
10. Kwan P, Brodie MJ. Early identification of refractory epilepsy.N Engl J Med 2000;342:314 –19 CrossRef Medline
11. Guzman Perez-Carrillo GJ, Owen C, Schwetye KE, et al. The use ofhippocampal volumetric measurements to improve diagnostic ac-curacy in pediatric patients with mesial temporal sclerosis. J Neu-rosurg Pediatr 2017;19:720 –28 CrossRef Medline
12. Silva G, Martins C, Moreira da Silva N, et al. Automated volumetry ofhippocampus is useful to confirm unilateral mesial temporal scle-rosis in patients with radiologically positive findings. Neuroradiol J2017;30:318 –23 CrossRef Medline
13. Huppertz HJ, Wagner J, Weber B, et al. Automated quantitativeFLAIR analysis in hippocampal sclerosis. Epilepsy Res 2011;97:146 –56 CrossRef Medline
14. Bernasconi A, Bernasconi N, Caramanos Z, et al. T2 relaxometry canlateralize mesial temporal lobe epilepsy in patients with normalMRI. Neuroimage 2000;12:739 – 46 CrossRef Medline
15. Pell GS, Briellmann RS, Waites AB, et al. Voxel-based relaxometry: anew approach for analysis of T2 relaxometry changes in epilepsy.Neuroimage 2004;21:707–13 CrossRef Medline
16. Focke NK, Bonelli SB, Yogarajah M, et al. Automated normalizedFLAIR imaging in MRI-negative patients with refractory focal epi-lepsy. Epilepsia 2009;50:1484 –90 CrossRef Medline
AJNR Am J Neuroradiol 40:798 – 801 May 2019 www.ajnr.org 801

ORIGINAL RESEARCHINTERVENTIONAL
Visualization of Aneurysmal Neck and Dome after Coilingwith 3D Multifusion Imaging of Silent MRA and
FSE-MR CisternographyX T. Satoh, X T. Hishikawa, X M. Hiramatsu, X K. Sugiu, and X I. Date
ABSTRACT
BACKGROUND AND PURPOSE: Our aim was to visualize the precise configuration of the aneurysmal neck and dome with/withoutremnants combined with a coiled dome after coiling treatment for cerebral aneurysms. We developed 3D multifusion imaging of silentMRA and FSE-MR cisternography.
MATERIALS AND METHODS: We examined 12 patients with 3D multifusion imaging by composing 3D images reconstructed fromTOF-MRA, silent MRA, and FSE-MR cisternography. The influence of magnetic susceptibility artifacts caused by metal materials affectingthe configuration of the aneurysmal complex with coiling was assessed in a single 3D image.
RESULTS: In all cases, TOF-MRA failed to depict the aneurysmal neck complex precisely due to metal artifacts, whereas silent MRAdelineated the neck and parent arteries at the coiled regions without serious metal artifacts. FSE-MR cisternography depicted the shapeof the coiled aneurysmal dome and parent artery complex together with the brain parenchyma. With the 3D multifusion images of silentMRA and FSE-MR cisternography, the morphologic status of the coiled neck and parent arteries was clearly visualized with the shape of thedome in a single 3D image.
CONCLUSIONS: Silent MRA is a non-contrast-enhanced form of MRA. It depicts the coiled neck complex without serious metal artifacts.FSE-MR cisternography can delineate the shape of the coiled dome. In this small feasibility study, 3D multifusion imaging of silent MRA andFSE-MR cisternography allowed good visualization of key features of coiled aneurysms. This technique may be useful in the follow-up ofcoiled aneurysms.
ABBREVIATIONS: AComA � anterior communicating artery; MRC � MR cisternography
In the follow-up after the endovascular treatment of a cere-
bral aneurysm, the precise visualization of the shape of the
neck and dome with/without remnants from coiling is neces-
sary.1-11 X-ray DSA is a reference standard to examine the
above-described configuration, but it is invasive and presents
certain risks related to the catheter procedure, contrast media,
and radiation.2,5-7,9,10 As a noninvasive substitute for DSA, 3D
TOF-MRA with/without contrast media is widely used, but
this method presents some difficulty regarding magnetic sus-
ceptibility artifacts from the coils.2,4,5,7-11
With some recent advances in MR imaging, it has been spec-
ulated that silent MRA with zero-TE and arterial spin-labeling
tagging may overcome the above problems by delineating
flowing blood at the neck with minimal artifacts from metal
substances.2,7,9,10,12 In addition, MR cisternography (MRC) with
a heavily T2-weighted 3D FSE sequence can depict the shape of the
aneurysmal dome together with perianeurysmal anatomic struc-
tures, including the brain parenchyma and cranial nerves.13-15 In the
present study, we used 3D multifusion imaging with silent MRA—
instead of TOF-MRA—and FSE-MRC to delineate the configuration
of the aneurysmal neck and dome after coiling treatment of cerebral
aneurysms. To the best of our knowledge, the delineation of the
coiled neck with 3D silent MRA and the dome with 3D FSE-MRC,
and 3D multifusion imaging of these structures in a single 3D image
has not been described.
Received December 8, 2018; accepted after revision March 11, 2019.
From the Department of Neurological Surgery (T.S.), Ryofukai Satoh NeurosurgicalHospital, Fukuyama, Hiroshima, Japan; and Department of Neurological Surgery(T.H., M.H., K.S., I.D.), Okayama University Graduate School of Medicine, Okayama,Okayama, Japan.
Paper previously presented, in part, at: Scientific Conference on NeurosurgicalTopics of Okayama University Neurosurgical Alumni Association, November 11,2017; Okayama, Japan; and the Chugoku-Shikoku Scientific Meeting of the JapanNeurosurgical Society, December 8, 2018; Ehime, Japan.
Please address correspondence to Toru Satoh, MD, Department of NeurologicalSurgery, Ryofukai Satoh Neurosurgical Hospital, 5-23-23 Matsunaga, Fukuyama,Hiroshima 729-0104, Japan; e-mail: [email protected]
Indicates open access to non-subscribers at www.ajnr.org
Indicates article with supplemental on-line table.
http://dx.doi.org/10.3174/ajnr.A6026
802 Satoh May 2019 www.ajnr.org

MATERIALS AND METHODSThis retrospective study was approved by the ethics committee of
Ryofukai Satoh Neurosurgical Hospital. Informed consent was
obtained from all patients for the use of their clinical data.
Patient PopulationBetween July 2017 and June 2018, twelve patients were examined by
TOF-MRA, silent MRA, and FSE-MRC for the follow-up of endo-
vascular treatment of a ruptured and/or unruptured cerebral aneu-
rysm at Ryofukai Satoh Neurosurgical Hospital and Okayama Uni-
versity Hospital (On-line Table). The aneurysm location was the
anterior communicating artery (AComA) in 5 patients, the distal
anterior cerebral artery in 1 patient, the internal carotid–posterior
communicating artery in 1 patient, the internal carotid–anterior
choroidal artery in 1 patient, the middle cerebral artery in 1 patient,
and the top of the basilar artery in 3 patients.
Imaging ProceduresThe imaging by TOF-MRA, silent MRA, and FSE-MRC was per-
formed in the same session on a 3T unit (Signa Pioneer; GE
Healthcare, Milwaukee, Wisconsin). The TOF-MRA was per-
formed with the following parameters: TR/TE, 25/3.4 ms; flip
angle, 20°; FOV, 180 � 180 mm; matrix, 288 � 192; section thick-
ness, 1.2 mm; NEX, 1; bandwidth, 35.71 kHz; acquisition time, 5
minutes 41 seconds. A total of 144 continuous axial source images
were acquired.
The silent MRA was performed by a silent scan with the fol-
lowing parameters: TR/TE, 880/0.016 ms; flip angle, 5°; FOV,
180 � 180 mm; matrix, 200 � 200; spokes per segment, 320;
section thickness, 1.0 mm; NEX, 1.5; bandwidth, 31.25 kHz; ac-
quisition time, 12 minutes 48 seconds. A total of 400 continuous
axial source images were acquired.
The heavily T2-weighted 3D FSE-MRC was performed with
the following parameters: TR/TE, 1900/100 ms; FOV, 180 � 180
mm; matrix, 356 � 256; section thickness, 1.2 mm; NEX, 1; band-
width, 31.25 kHz; echo-train length, 128; acquisition time, 5 min-
utes 53 seconds. A total of 60 continuous axial source images were
acquired.
Image ProcessingVolumetric datasets from the source images of the TOF-MRA,
silent MRA, and FSE-MRC were transferred to a workstation
(Ziostation-2; Ziosoft/AMIN, Tokyo, Japan) as described by Sa-
toh et al.13-15 For the 3D TOF-MRA and silent MRA, the vessel
configurations were reconstructed by a perspective volume-ren-
dering algorithm, and the arterial lumen was selected from the
opacity chart of the datasets with higher MR signal intensity of
arteries (threshold, �400 for TOF-MRA and �300 for silent
MRA, respectively) compared with the background. Thus, the 3D
image of parent arteries and aneurysmal neck after coiling was
depicted by the 2 types of MRA.
The perspective volume-rendering image of the 3D FSE-MRC
was reconstructed from the entire dataset with a lower signal in-
tensity of CSF (threshold, �1200) so that the shape of the coiled
aneurysmal dome and parent artery complex was delineated with
its perianeurysmal anatomic structures, including the brain pa-
renchyma and cranial nerves.
To visualize the 2 types of MRA images in combination with
MRC images in a single 3D image, we used 3D multifusion imag-
ing by compositing the above-described reconstructed 3D images
of TOF-MRA, silent MRA, and FSE-MRC. The overall time re-
quired to reconstruct a picture of 3D multifusion imaging was
within 120 seconds per image. We were thus able to directly com-
pare the shape of the aneurysmal neck complex with/without neck
remnants depicted by the 2 types of MRA combined with the
coiled dome shown by MRC. The difference between the TOF-
MRA and silent MRA, in combination with FSE-MRC, was di-
rectly compared in each case.
Image-Quality Analysis of TOF-MRA and Silent MRAThe source images, MIP, 3D perspective volume-rendering, and
3D multifusion images between the TOF-MRA and the silent
MRA combined with FSE-MRC were compared with respect to
the configuration of the coiled aneurysmal complex depicted by
DSA obtained after the completion of the coiling. The 2 types of
MRA images were independently reviewed by 2 board-certified
neurosurgeons (T.H. and M.H.). The quality of the visualization
of the coiled aneurysmal complex including the neck and parent
arteries obtained by the TOF-MRA and silent MRA in conjunc-
tion with the FSE-MRC was rated subjectively on the following
4-point scale: 1, not visible (no signal or gap in the parent artery or
the neck); 2, poor (visible, but incomplete with artifacts); 3, good
(good quality with minimal artifacts); 4, excellent (excellent qual-
ity without artifacts). The scores obtained by the 2 observers were
averaged for each of the 2 types of MRA, and the statistical analysis
was performed by a Wilcoxon signed rank test. A P value � .05
was considered significant. Interobserver agreement between the
2 observers’ scores for each type of MRA was tested by intraclass
correlation coefficient statistics.
Size and Volume Analysis of Coiled AneurysmsWe measured the maximum size (x, y, z) of the aneurysmal neck
remnants based on the source images obtained by TOF-MRA and
silent MRA and the dome from FSE-MRC in each case. The volume
of the remnant was calculated on the basis of ROIs drawn on the
source images of TOF-MRA and silent MRA, where the contours of
each remnant were respectively serially masked. The voxel vol-
ume was determined by a pixel size on the source image and the slice
pitch, and the number of voxels within the masked region was
counted. The volume of the masked region was then calculated as the
number of voxels multiplied by the volume of voxels within the re-
gion using a workstation. Similarly, the volume of the dome was
calculated on the source images of FSE-MRC. Each numeric value
was determined as the mean of 3 measurements performed by the
senior author (T.S.).
RESULTSQuality AssessmentThe On-line Table provides the data of the 12 patients, including
age (62.8 � 8.9 years; range, 51–78 years) and sex (4 men and 8
women), location of aneurysms, symptoms, time interval be-
tween DSA and MRA (8.5 � 4.4 months; range, 3–12 months),
and the scores for TOF-MRA and silent MRA (TOF/silent MRAs)
obtained by the 2 observers. In all cases, the Wilcoxon signed rank
AJNR Am J Neuroradiol 40:802– 07 May 2019 www.ajnr.org 803

test revealed that the visualization score of parent arteries and
neck status for the silent MRA (3.75 � 0.5) was significantly
higher than that for TOF-MRA (1.5 � 1.25) (P � .01). The inter-
observer agreement tested by the intraclass correlation coefficient
was 0.955 for TOF-MRA and 0.941 for silent MRA and was inter-
preted as excellent.
3D Visualization of the Aneurysmal Neck and DomeComplexWith the use of TOF-MRA, the coiled neck and parent arteries
were depicted but not precisely visualized, apparently due to
metal artifacts. In contrast, the silent MRA clearly delineated
the aneurysmal neck with/without remnants and afferent and
efferent parent arteries without serious metal artifacts. Addi-
tionally, the shape of the dome treated and packed by coils was
depicted by the FSE-MRC with perianeurysmal anatomic
structures including the brain parenchyma and cranial nerves.
With the 3D multifusion images reconstructed and com-
posed of 3D silent MRA and 3D FSE-MRC, the morphologic
status of the neck and parent arteries of the coiled aneurysm
was visualized with the dome, together
with adjacent brain parenchyma (Figs
1–3).
Size and Volume of the NeckRemnants and Coiled DomesThe On-line Table also provides the size
and volume of the neck remnants ob-
tained by TOF-MRA and silent MRA
and the coiled domes from FSE-MRC.
With TOF-MRA, the sizes of the rem-
nants were not measured accurately due
to an incomplete depiction of the neck
or parent arteries due to metal artifacts.
In contrast, the size and volume of the
remnants were obtained by silent MRA,
and the size and volume of the domes
were obtained by FSE-MRC. Although
potential remodeling after coiling dur-
ing the mean time interval between the
MRA/MRC and the DSA (8.5 � 4.4
months) may have affected the findings,
the neck and dome complex was not
visualized identically but was similar
to that provided by the DSA obtained
at the time of coiling. Neck remnants
were depicted in 10 of the 12 cases, and
we calculated the percentage of the
remnant volume (ie, the residual fill-
ing volume at the neck) measured by
the silent MRA to the dome volume
(the whole volume of the coiled dome)
by the FSE-MRC in each case: 2.3%–
36.7%. The clinical results showed
complete cure in 2 patients, follow-up
with remnants in 8 patients, and re-
treatment in 2 patients.
DISCUSSIONEndovascular treatment involving coil embolization has been
performed widely for cerebral aneurysms, but coil compaction
and the recanalization of a coiled aneurysm frequently occur after
this treatment.1,5,6,8 The remnants of the dome may be at risk of
growing, and they thus require long-term vascular follow-up.1,3,8
When retreatment is being considered, the clear visualization of
the neck remnants and the dome configuration is necessary in the
follow-up examination.3,4,6,8,11
In the present study, we used silent MRA for the follow-up
in patients with coil treatment for cerebral aneurysms. Silent
MRA may provide a clear depiction of flowing blood within the
vessels (eg, the aneurysmal neck with/without remnants and
parent arteries) with minimal artifacts caused by metal sub-
stances so that the aneurysmal complex can be delineated with-
out serious susceptibility artifacts.2,7,9,10,12 With the currently
available imaging software, the entire shape of an aneurysm
(including the neck, parent arteries, and dome) treated by coil-
ing can be reconstructed and depicted in a single 3D image by
FIG 1. A 69-year-old woman (patient 10) treated by coiling for a large unruptured top of thebasilar artery (BA-top) aneurysm. A, Axial minimum intensity projection (MinIP) image of postcoil-ing FSE-MRC. The encircled arrow indicates the viewing position for the following 3D images. B,Axial MIP image of postcoiling TOF-MRA. C, Axial MIP image of postcoiling silent MRA. D, Post-coiling 3D FSE-MRC image. E, Postcoiling 3D TOF-MRA image. Note the gap (asterisk) of the parentartery and irregularity of the neck. F, Postcoiling 3D silent MRA image. Parent arteries and the coiledneck are clearly visualized. G, DSA image at the completion of coiling. Note that the configuration ofthe neck complex with remnants and parent arteries is depicted with the shadow of the coiled dome.H, A 3D multifusion image of postcoiling TOF-MRA and FSE-MRC. I, A 3D multifusion image of post-coiling silent MRA and FSE-MRC. Note that the coiled neck complex with remnants is clearly visualizedtogether with the coiled dome and adjacent brain parenchyma. P1 indicates the first segment ofposterior cerebral artery; Lt, left; Rt, right; AP, anteroposterior; An, aneurysm.
804 Satoh May 2019 www.ajnr.org
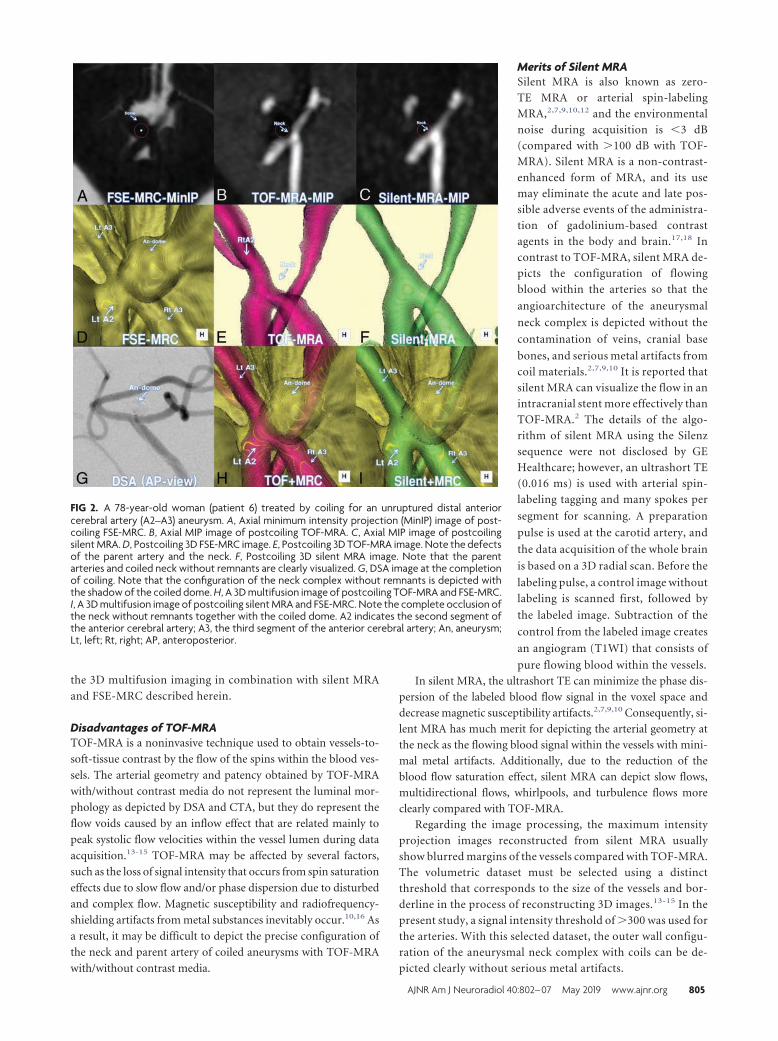
the 3D multifusion imaging in combination with silent MRA
and FSE-MRC described herein.
Disadvantages of TOF-MRATOF-MRA is a noninvasive technique used to obtain vessels-to-
soft-tissue contrast by the flow of the spins within the blood ves-
sels. The arterial geometry and patency obtained by TOF-MRA
with/without contrast media do not represent the luminal mor-
phology as depicted by DSA and CTA, but they do represent the
flow voids caused by an inflow effect that are related mainly to
peak systolic flow velocities within the vessel lumen during data
acquisition.13-15 TOF-MRA may be affected by several factors,
such as the loss of signal intensity that occurs from spin saturation
effects due to slow flow and/or phase dispersion due to disturbed
and complex flow. Magnetic susceptibility and radiofrequency-
shielding artifacts from metal substances inevitably occur.10,16 As
a result, it may be difficult to depict the precise configuration of
the neck and parent artery of coiled aneurysms with TOF-MRA
with/without contrast media.
Merits of Silent MRASilent MRA is also known as zero-
TE MRA or arterial spin-labeling
MRA,2,7,9,10,12 and the environmental
noise during acquisition is �3 dB
(compared with �100 dB with TOF-
MRA). Silent MRA is a non-contrast-
enhanced form of MRA, and its use
may eliminate the acute and late pos-
sible adverse events of the administra-
tion of gadolinium-based contrast
agents in the body and brain.17,18 In
contrast to TOF-MRA, silent MRA de-
picts the configuration of flowing
blood within the arteries so that the
angioarchitecture of the aneurysmal
neck complex is depicted without the
contamination of veins, cranial base
bones, and serious metal artifacts from
coil materials.2,7,9,10 It is reported that
silent MRA can visualize the flow in an
intracranial stent more effectively than
TOF-MRA.2 The details of the algo-
rithm of silent MRA using the Silenz
sequence were not disclosed by GE
Healthcare; however, an ultrashort TE
(0.016 ms) is used with arterial spin-
labeling tagging and many spokes per
segment for scanning. A preparation
pulse is used at the carotid artery, and
the data acquisition of the whole brain
is based on a 3D radial scan. Before the
labeling pulse, a control image without
labeling is scanned first, followed by
the labeled image. Subtraction of the
control from the labeled image creates
an angiogram (T1WI) that consists of
pure flowing blood within the vessels.
In silent MRA, the ultrashort TE can minimize the phase dis-
persion of the labeled blood flow signal in the voxel space and
decrease magnetic susceptibility artifacts.2,7,9,10 Consequently, si-
lent MRA has much merit for depicting the arterial geometry at
the neck as the flowing blood signal within the vessels with mini-
mal metal artifacts. Additionally, due to the reduction of the
blood flow saturation effect, silent MRA can depict slow flows,
multidirectional flows, whirlpools, and turbulence flows more
clearly compared with TOF-MRA.
Regarding the image processing, the maximum intensity
projection images reconstructed from silent MRA usually
show blurred margins of the vessels compared with TOF-MRA.
The volumetric dataset must be selected using a distinct
threshold that corresponds to the size of the vessels and bor-
derline in the process of reconstructing 3D images.13-15 In the
present study, a signal intensity threshold of �300 was used for
the arteries. With this selected dataset, the outer wall configu-
ration of the aneurysmal neck complex with coils can be de-
picted clearly without serious metal artifacts.
FIG 2. A 78-year-old woman (patient 6) treated by coiling for an unruptured distal anteriorcerebral artery (A2–A3) aneurysm. A, Axial minimum intensity projection (MinIP) image of post-coiling FSE-MRC. B, Axial MIP image of postcoiling TOF-MRA. C, Axial MIP image of postcoilingsilent MRA. D, Postcoiling 3D FSE-MRC image. E, Postcoiling 3D TOF-MRA image. Note the defectsof the parent artery and the neck. F, Postcoiling 3D silent MRA image. Note that the parentarteries and coiled neck without remnants are clearly visualized. G, DSA image at the completionof coiling. Note that the configuration of the neck complex without remnants is depicted withthe shadow of the coiled dome. H, A 3D multifusion image of postcoiling TOF-MRA and FSE-MRC.I, A 3D multifusion image of postcoiling silent MRA and FSE-MRC. Note the complete occlusion ofthe neck without remnants together with the coiled dome. A2 indicates the second segment ofthe anterior cerebral artery; A3, the third segment of the anterior cerebral artery; An, aneurysm;Lt, left; Rt, right; AP, anteroposterior.
AJNR Am J Neuroradiol 40:802– 07 May 2019 www.ajnr.org 805

Merits of FSE-MRCWe did not use so-called T2 high-resolution images such as the
FIESTA sequence for MRC.19 Because all the intracisternal
anatomic structures are uniformly depicted as low signal in-
tensity, it may be difficult to distinguish the boundary of an
aneurysmal dome from the adjacent brain parenchyma and
cranial nerves.
In the present study, we used FSE-MRC, a traditional heavily
T2-weighted 3D FSE sequence, with a relatively short TR/TE
(1900/100 ms). FSE-MRC obtained by a 3T unit with a wide band-
width can depict the outer wall configuration of the intracisternal
aneurysmal complex and perianeurysmal anatomic structures
with thin sections and a high signal-to-noise ratio.13-15 An aneu-
rysmal dome and parent arteries are depicted as a heavily dark
area, and brain parenchyma and cranial nerves are depicted as a
moderately dark area. These are well-contrasted to the surround-
ing CSF as a profoundly bright area. With FSE-MRC, the entire
aspect of the aneurysmal dome and neck complex treated by coils
is clearly visualized without metal artifacts. The contour of the
coiled dome can thus be distinguished from the surrounding
structures including adjacent brain pa-
renchyma and cranial nerves.
Merits of 3D Multifusion Imagingwith Silent MRA and FSE-MRCInstead of using TOF-MRA and FIES-
TA-MRC, we reconstructed and com-
bined silent MRA and FSE-MRC images
by means of 3D multifusion imag-
ing.13-15 Because the anatomic structure
of a coiled aneurysm is complicated, it
may be difficult to acquire a precise un-
derstanding of the architecture of the
aneurysmal neck and parent arteries by
simply reviewing �1 of the source im-
ages displayed in 2D. Silent MRA may
depict the coiled neck with/without
remnants, and FSE-MRC delineates the
dome and adjacent brain parenchyma
after coiling treatment for cerebral
aneurysms. The 3D reconstruction of
silent MRA in combination with FSE-
MRC may provide the clear visualiza-
tion of the aneurysmal complex with
the coiled neck and dome in a single
3D image.
Our present results indicate that 3D
multifusion images with silent MRA and
FSE-MRC can provide the residual filling
volume at the neck (remnant) with respect
to the whole volume of the coiled dome
(dome volume). This finding could be
used in the decision regarding whether to
conduct re-embolization. The size and
volume of the remnant together with the
coiled dome may also distinguish coil
compaction from regrowth of the aneu-
rysm. Consequently, visualization of the
neck and dome with this imaging is useful for follow-up evaluations
of patients treated with coiling for cerebral aneurysms.
Limitations and Perspectives Regarding 3D MultifusionImaging with Silent MRA and FSE-MRCSeveral limitations may exist in the application of 3D multifusion
imaging with silent MRA and FSE-MRC. The sample size in the
present study was small (n � 12), and the cases were limited to
those of simple coil embolization. Cases with various types of
stent- or flow-diverter-assisted coil embolization should be
tested. In addition, silent MRA can depict the coiled aneurysmal
neck complex with minimal metal artifacts via an ultrashort TE.
However, a potential limitation is the occurrence of magnetic
susceptibility and radiofrequency-shielding artifacts due to cer-
tain materials containing pure ferromagnetic substances such as a
platinum alloy.7,11,16
Moreover, in the process of reconstructing 3D multifusion
imaging, the size and volume of the neck and dome rendered for
each 3D image may change according to the threshold value se-
FIG 3. A 58-year-old man (patient 3) treated by endovascular coiling for an unruptured AComAaneurysm. A, Axial minimum intensity projection (MinIP) image of postcoiling FSE-MRC. B, AxialMIP image of postcoiling TOF-MRA. C, Axial MIP image of postcoiling silent MRA. D, Postcoiling3D FSE-MRC image. E, Postcoiling 3D TOF-MRA image. Note the minor defects at the parentartery and the neck. F, Postcoiling 3D silent MRA image. Note that the parent arteries and coiledneck are clearly visualized. G, DSA image at the completion of coiling. Note the configuration ofthe neck complex with the shadow of the coiled dome. H, A 3D multifusion image of postcoilingTOF-MRA and FSE-MRC. I, A 3D multifusion image of postcoiling silent MRA and FSE-MRC. Notethe clear visualization of the coiled neck complex with remnants, together with the coiled domeand adjacent brain parenchyma. Rt indicates right; Lt, left; AP, anteroposterior.
806 Satoh May 2019 www.ajnr.org

lected from an opacity chart of the datasets.13-15 It may be difficult
to decide the optimal threshold values for the geometry of the
aneurysmal neck for silent MRA and the dome for FSE-MRC in
each individual subject. In this study, we determined the shape of
arteries using the signal intensity threshold of �300 for silent
MRA, �400 for TOF-MRA, and �1200 for FSE-MRC. By means
of 3D multifusion imaging, an appropriate threshold for each
TOF-MRA, silent MRA, and FSE-MRC can be determined by
adjusting the shape of the objects, including parent arteries, neck,
and dome of the coiled aneurysm by fusing 3 different images. In
addition to the images of simple TOF-MRA, silent MRA, and
FSE-MRC, 3D multifusion imaging may make a contribution by
allowing the incorporation of all the views in a single 3D fused
image.
Prospectively, we suggest that 3D multifusion imaging obtain-
ing the pre- and posttreatment images with silent MRA and FSE-
MRC may be useful to confirm the initial success of coiling for
cerebral aneurysms. Additionally, sequential follow-ups may de-
pict changes in the shape of the coiled neck and dome, which may
inform the timing of retreatment. More research is required to
refine and validate the imaging techniques described herein.
CONCLUSIONSSilent MRA can depict the configuration of the coiled neck and
parent arteries without serious susceptibility artifacts. FSE-MRC
can delineate the shape of the coiled dome together with adjacent
brain parenchyma. In this small feasibility study, 3D multifusion
imaging of silent MRA and FSE-MRC provided good visualiza-
tion of key features of coiled aneurysms. This technique may be
useful in the follow-up of coiled aneurysms.
ACKNOWLEDGMENTSWe thank Ms Megumi Sasaki, radiologic technician, and Ms Kana
Murakami, laboratory technologist, Ryofukai Satoh Neurosurgi-
cal Hospital, for conducting the MR imaging examinations.
REFERENCES1. Binning MJ, Veznedaroglu E. Aneurysm remnants after coiling and
clipping: considerations in surgical and endovascular treatmentoptions. Neurosurgery 2015;62:103– 06 CrossRef Medline
2. Irie R, Suzuki M, Yamamoto M, et al. Assessing blood flow in anintracranial stent: a feasibility study of MR angiography using asilent scan after stent-assisted coil embolization for anterior circu-lation aneurysms. AJNR Am J Neuroradiol 2015;36:967–70 CrossRefMedline
3. Jabbarli R, Pierscianek D, Wrede K, et al. Aneurysm remnant afterclipping: the risks and consequences. J Neurosurg 2016;125:1249 –55CrossRef Medline
4. Kaufmann TJ, Huston J 3rd, Cloft HJ, et al. A prospective trial of 3Tand 1.5T time-of-flight and contrast-enhanced MR angiography inthe follow-up of coiled intracranial aneurysms. AJNR Am J Neuro-radiol 2010;31:912–18 CrossRef Medline
5. Pierot L, Portefaix C, Gauvrit JY, et al. Follow-up of coiled intracra-nial aneurysms: comparison of 3D time-of-flight MR angiographyat 3T and 1.5T in a large prospective series. AJNR Am J Neuroradiol2012;33:2162– 66 CrossRef Medline
6. Serafin Z, Strzesniewski P, Lasek W, et al. Comparison of remnantsize in embolized intracranial aneurysms measured at follow-upwith DSA and MRA. Neuroradiology 2012;54:1381– 88 CrossRefMedline
7. Shang S, Ye J, Luo X, et al. Follow-up assessment of coiled intracra-nial aneurysms using zTE MRA as compared with TOF MRA: a pre-liminary image quality study. Eur Radiol 2017;27:4271– 80 CrossRefMedline
8. Shankar JJS, Lum C, Parikh N, et al. Long-term prospective fol-low-up of intracranial aneurysms treated with endovascular coil-ing using contrast-enhanced MR angiography. AJNR Am J Neuro-radiol 2010;31:1211–15 CrossRef Medline
9. Takano N, Suzuki M, Irie R, et al. Usefulness of non– contrast-en-hanced MR angiography using a silent scan for follow-up after Y-configuration stent-assisted coil embolization for basilar tip aneu-rysms. AJNR Am J Neuroradiol 2017;38:577– 81 CrossRef Medline
10. Takano N, Suzuki M, Irie R, et al. Non-contrast-enhanced silent scanMR angiography of intracranial anterior circulation aneurysmstreated with a low-profile visualized intraluminal support device.AJNR Am J Neuroradiol 2017;38:1610 –16 CrossRef Medline
11. Wallace RC, Karis JP, Partovi S, et al. Noninvasive imaging of treatedcerebral aneurysms, Part I: MR angiographic follow-up of coiledaneurysms. AJNR Am J Neuroradiol 2007;28:1001– 08 CrossRefMedline
12. Alibek S, Vogel M, Sun W, et al. Acoustic noise reduction in MRIusing silent scan: an initial experience. Diagn Interv Radiol 2014;20:360 – 63 CrossRef Medline
13. Satoh T, Onoda K, Tsuchimoto S. Visualization of intraaneurysmalflow patterns with transluminal flow images of 3D MR angiogramsin conjunction with aneurysmal configurations. AJNR Am J Neuro-radiol 2003;24:1436 – 45 Medline
14. Satoh T, Omi M, Osako C, et al. Visualization of aneurysmal con-tours and perianeurysmal environment with conventional andtransparent 3D MR cisternography. AJNR Am J Neuroradiol 2005;26:313–18 Medline
15. Satoh T, Omi M, Osako C, et al. Influence of perianeurysmal envi-ronment on the deformation and bleb formation of the unrupturedcerebral aneurysm: assessment with fusion imaging of 3D MR cis-ternography and 3D MR angiography. AJNR Am J Neuroradiol 2005;26:2010 –18 Medline
16. McFadden JT. Magnetic resonance imaging and aneurysm clips: areview. J Neurosurg 2012;117:1–11 CrossRef Medline
17. Kanda T, Ishii K, Kawaguchi H, et al. High signal intensity in thedentate nucleus and globus pallidus on unenhanced T1-weighted MR images: relationship with increasing cumulativedose of a gadolinium-based contrast material. Radiology 2014;270:834 – 41 CrossRef Medline
18. Quattrocchi CC, van der Molen AJ. Gadolinium retention in thebody and brain: is it time for an international joint research effort?Radiology 2017;282:12–16 CrossRef Medline
19. Chavez GC, De Salles AAF, Solberg TD, et al. Three-dimensional fastimaging employing steady-state acquisition magnetic resonanceimaging for stereotactic radiosurgery of trigeminal neuralgia. Neu-rosurgery 2005;56:E628 CrossRef Medline
AJNR Am J Neuroradiol 40:802– 07 May 2019 www.ajnr.org 807

ORIGINAL RESEARCHINTERVENTIONAL
Usefulness of Silent MR Angiography for IntracranialAneurysms Treated with a Flow-Diverter Device
X H. Oishi, X T. Fujii, X M. Suzuki, X N. Takano, X K. Teranishi, X K. Yatomi, X T. Kitamura, X M. Yamamoto, X S. Aoki, and X H. Arai
ABSTRACT
BACKGROUND AND PURPOSE: The flow-diverter device has been established as a treatment procedure for large unruptured intracranialaneurysms. The purpose of this study was to compare the usefulness of Silent MR angiography and time-of-flight MRA to assess the parentartery and the embolization state of the aneurysm after a flow-diverter placement.
MATERIALS AND METHODS: Seventy-eight large, unruptured internal carotid aneurysms in 78 patients were the subjects of this study.After 6 months of treatment, they underwent follow-up digital subtraction angiography, Silent MRA, and TOF-MRA, performed simulta-neously. All images were independently reviewed by 2 neurosurgeons and 1 radiologist and rated on a 4-point scale from 1 (not visible) to4 (excellent) to evaluate the parent artery. The aneurysmal embolization status was assessed with 2 ratings: complete or incompleteocclusion.
RESULTS: The mean scores of Silent MRA and TOF-MRA regarding the parent artery were 3.18 � 0.72 and 2.31 � 0.86, respectively, showinga significantly better score with Silent MRA (P � .01). In the assessment of the embolization of aneurysms on Silent MRA and TOF-MRAcompared with DSA, the percentages of agreement were 91.0% and 80.8%, respectively.
CONCLUSIONS: Silent MRA is superior for visualizing blood flow images inside flow-diverter devices compared with TOF-MRA. Further-more, Silent MRA enables the assessment of aneurysmal embolization status. Silent MRA is useful for assessing the status of large and giantunruptured internal carotid aneurysms after flow-diverter placement.
The advancement of endovascular treatment devices for intra-
cranial aneurysms has been remarkable. In the treatment of
large and giant intracranial aneurysms, a flow-diverter device
with a high metal coverage ratio is placed in the parent artery so
that it decreases blood flow into aneurysms, promotes thrombo-
sis, and thereby prevents rupture. The usefulness of the flow-di-
verter device has become apparent by various large-scale studies,
and its adoption is consistently increasing.1-6 However, due to the
characteristics of the device, which divert the blood flow and pro-
mote thrombosis, careful radiologic follow-up observation is re-
quired, and periodic checkups on the status of the aneurysmal
embolization and patency of the parent artery are essential. The
standard test of follow-up for endovascular treatment of intracra-
nial aneurysms is digital subtraction angiography. Because DSA
itself is invasive and involves the risk of complications and adverse
effects caused by contrast agents and radiation exposure, less in-
vasive and simple examination procedures are warranted.7-10 In
recent years, the usefulness of contrast-enhanced MR angiogra-
phy has often been reported,11,12 though using gadolinium carries
the risk of serious complications such as nephrogenic systemic
fibrosis.13 Therefore, time-of-flight MRA has been gaining atten-
tion as a viable imaging procedure without having to use a con-
trast agent.14,15 However, there have been some skeptical views
regarding its accuracy.11,12
We have reported the usefulness of Silent MRA (GE Health-
care, Milwaukee, Wisconsin) as a radiologic follow-up procedure
after coil embolization for intracranial aneurysms.16-18 Silent
MRA is a procedure using an ultrashort TE and arterial spin-
labeling techniques, which efficiently visualizes the status after the
treatment of intracranial aneurysms. In Silent MRA, the 3D image
is reconstructed by subtracting the control image from the image
obtained by the labeling pulse. At the beginning of its develop-
ment, although it was a procedure that literally silences the noise
of the MR imaging, Silent MRA was attracting attention because
its imaging capability after endovascular treatment is superior to
Received February 1, 2019; accepted after revision March 25.
From the Departments of Neuroendovascular Therapy (H.O., T.F., T.K.), Neurosur-gery (H.O., K.T., K.Y., M.Y., H.A.), and Radiology (M.S., N.T., S.A.), Juntendo UniversityFaculty of Medicine, Tokyo, Japan.
This work was supported by Medtronic.
Please address correspondence to Takashi Fujii, MD, Department of Neuroendo-vascular Therapy, Juntendo University Faculty of Medicine, 2-1-1 Hongo, Bunkyo-ku,Tokyo 113-8421, Japan; e-mail: [email protected]
http://dx.doi.org/10.3174/ajnr.A6047
808 Oishi May 2019 www.ajnr.org

that of other modalities. To date, there have been several reports
on the comparison of the assessment procedures between TOF-
MRA and contrast-enhanced MRA after flow-diverter placement
therapy.12,19,20 To our knowledge, this is the first study of the
comparison of Silent MRA and TOF-MRA after flow-diverter
placement in intracranial aneurysms, in as much as we searched
medical search engines using the key words “Silent MRA,” “TOF-
MRA” and “flow diverter.” We report here the posttreatment as-
sessment of flow-diverter therapy by Silent MRA in a study with a
population of 78 patients along with the bibliographic consider-
ation of the relevant literature.
MATERIALS AND METHODSPatient and Aneurysm CharacteristicsWe retrospectively studied aneurysms treated with 1 flow-di-
verter device (Pipeline Flex Embolization Device; Covidien, Ir-
vine, California) between June 2015 and February 2018. The pa-
tients treated with �2 flow-diverter devices were excluded to
avoid the effects of excess metal artifacts. Among the 128 patients
treated with flow-diverter devices during the study, there were 78
patients, excluding 39 patients who were treated with �2 flow
diverter devices, 7 patients who did not undergo Silent MRA at
the 6-month follow-up, 2 patients who were not examined due to
postoperative death, 1 patient who needed additional treatment,
and 1 patient who dropped out of the study for personal reasons
(Fig 1).
Because this study was noninvasive and retrospective, pa-
tients’ informed consent was not required. We obtained approval
for this study from the ethics review board.
The patients’ characteristics are summarized in Table 1. We
evaluated all patients on the basis of Silent MRA, TOF-MRA, and
DSA, which were undergone postoperatively at approximately 6
months. DSA was performed for endovascular treatment and for
postoperative assessment using the Artis Q BA Twin biplane sys-
tem (Siemens, Erlangen, Germany).
Endovascular ProcedurePreoperative loading of antiplatelet agents began at least 10 days
before with a dose of 100 mg of aspirin and 50 –75 mg of clopi-
dogrel, with the dose determined according to body weight. For
patients who might possibly have late-onset rupture of intracra-
nial aneurysms, additional coil embolization was performed to
promote thrombosis.21-23 Additional in-stent percutaneous
transluminal angioplasty was performed if the patients were
found to have poor adhesion of the Pipeline Flex from the results
of intraoperative DSA and conebeam CT. All the patients contin-
uously received postoperative administration of dual-antiplatelet
therapy until the 6-month Silent MRA follow-up was performed.
All treatments for all patients were performed by one of the au-
thors (H.O.), who has �20 years of experience conducting endo-
vascular procedures.
MRA Scan ParametersTOF-MRA and Silent MRA were performed with 3T MRA (Dis-
covery MR750w; GE Healthcare). Imaging parameters for Silent
MRA were the following: TR/TE, 642.8/0.016 ms; flip angle, 5°;
FOV, 180 � 180 mm; matrix, 150 � 150; section thickness, 1.0
mm; NEX, 1; bandwidth, �31.2 kHz; acquisition time, 12 min-
utes 13 seconds. Imaging parameters for TOF-MRA were the fol-
lowing: TR/TE, 20/2.9 ms; flip angle, 18°; FOV, 200 � 200 mm;
matrix, 416 � 224; section thickness, 1.0 mm; NEX, 1; bandwidth,
�41.7 kHz; acquisition time, 4 minutes 45 seconds. Although the
detailed algorithm for Silent MRA has not been disclosed, the
arterial spin-labeling technique was used as a preparation pulse,
and data were obtained by a 3D radial scan.24
Image AnalysisImages in DSA, Silent MRA, and TOF-MRA before treatment and
after 6 months were reviewed independently by 2 neurosurgeons
(H.O. and T.F.) and 1 radiologist (M.S.). Assessment parameters
were location of the aneurysm, size, and neck diameter. The per-
FIG 1. A flowchart of eligible patients assessed by Silent MR angiog-raphy after Pipeline Flex placement for intracranial aneurysms.
Table 1: Characteristics of the patients assessed by DSA, SilentMRA, and TOF-MRA after placement of flow-diverter devices
Parameters DataAge (mean) (range) (yr) 61.4 � 13.3 (19–82)Sex (M/F) 6:72Side (R/L) 36:42Location (cavernous segment/paraclinoid segment) 52:26Aneurysmal size (mean) (range) (mm) 14.8 � 5.5 (10.0–32.5)Aneurysmal neck diameter (mean) (range) (mm) 6.5 � 2.2 (2.8–15.3)Symptomatic cases (No.) (%) 23 (29.5%)Additional coiling (No.) (%) 39 (50%)Pipeline diameter (mean) (range) (mm) 4.2 � 0.6 (3–5)Pipeline length (mean) (range) (mm) 21.8 � 6.3 (16–35)In-stent percutaneous transluminal angioplasty (No.) (%) 52 (66.7%)In-stent stenosis (No.) (%)
None (0%) 28 (38.9%)Mild (0–25%) 41 (52.6%)Moderate (�25%) 9 (11.5%)
Duration of follow-up (mean) (range) (mo) 6.1 � 0.6 (4–8)
Note:—R indicates right; L, left.
AJNR Am J Neuroradiol 40:808 –14 May 2019 www.ajnr.org 809

centage of in-stent stenosis was measured at the narrowest site in
DSA. It was classified into 3 levels: none (0%), mild (0%–25%),
and moderate (25%–50%). In-stent blood flow was rated on a
4-point scale: 1, not visible (signal alteration not detected or can-
not be assessed); 2, poor (blood flow slightly visible, but not ade-
quate for diagnosis); 3, acceptable (blood flow roughly visible,
diagnosable images); and 4, excellent (images almost equal to
DSA). Scores of in-stent signals were calculated as the mean of
those assessed by the 3 observers. Mean scores of the high- and the
low-score groups were �2 and �2, respectively. Scores for Silent
MRA and TOF-MRA were assessed. The percentage of agreement
of scores by 3 observers was also assessed. The status of emboliza-
tion of aneurysms observed by DSA, Silent MRA, and TOF-MRA
was assessed with a 2-point rating scale: 1, incomplete occlusion
(intra-aneurysmal signal alteration recognized); and 2, complete
occlusion (no intra-aneurysmal signal alterations recognized). In
case of discrepancy among the 3 observers, the images were re-
viewed by 3 other observers (K.T., K.Y., and M.Y.) to confirm the
embolization status of all the aneurysms, determining whether
complete or incomplete occlusion was achieved by rechecking the
DSA, Silent MRA, and TOF-MRA. The rate of agreement of the
embolization status between DSA and Silent MRA and TOF-
MRA was also assessed.
Thrombosis after Pipeline Flex PlacementWhen an intra-aneurysmal signal alteration after the treatment of
an aneurysm was not observed by Silent MRA, but was observed
by TOF-MRA, the status was interpreted as intra-aneurysmal
thrombosis after the Pipeline Flex placement. Thrombosis was
reported as a region showing a high-intensity signal on both TOF-
MRA and a T1-weighted image25; and it was confirmed that in all
cases, the signal in the aneurysm was a high-intensity signal on a
T1-weighted image. It has been reported that assessment of the
status of the parent artery and intra-aneurysmal status revealed on
TOF-MRA are more difficult in the event of an intra-aneurysmal
thrombosis.12,17 Aneurysms treated with Pipeline Flex placement
were divided into 2 groups, those with and those without throm-
boses. The assessment items were the following: location, aneu-
rysmal size and neck diameter, presence or absence of additional
coiling, diameter and length of Pipeline Flex, and the difference in
the scores between Silent MRA and TOF-MRA.
Statistical AnalysisEach value was expressed by mean � SD and range. The difference
between 2 groups was assessed by a t test or the �2 test. P � .05 was
considered to indicate statistical significance. The rate of agreement
among the 3 observers was expressed by the Fleiss � coefficient.
RESULTSThe patients’ characteristics are summarized in Table 1.
The mean score of Silent MRA, 3.18 � 0.72, was significantly
higher than that of TOF-MRA, 2.31 � 0.86 (P � .01). The Fleiss �
coefficient was 0.408. In Tables 2 and 3, correlation between Silent
MRA and TOF-MRA was shown from the viewpoint of parame-
ters in the groups with high (�2) and low (�2) mean scores. The
scores of Silent MRA were not influenced by any of these param-
eters, whereas the scores of TOF-MRA were statistically signifi-
cantly low when the aneurysmal size and neck diameter were large
and the aneurysm was located in the cavernous segment.
Comparisons of the correlation between Silent MRA and TOF-
MRA from the viewpoint of intra-aneurysmal thrombosis after Pipe-
line Flex placement are summarized in Table 4. Thrombosis oc-
curred frequently after Pipeline Flex placement in a statistically
significant manner under the following conditions: Aneurysms were
located in the cavernous segment, the aneurysm was large, there was
an absence of additional coiling, and the Pipeline was long.
Embolization of aneurysms was assessed in comparisons of
DSA, Silent MRA, and TOF-MRA by dividing the patients with
complete or incomplete occlusion of aneurysms (Table 5). The
rate of agreement between Silent MRA and DSA and TOF-MRA
and DSA was 91.0% and 80.8%, respectively.
DISCUSSIONIn the present study, we used the flow-diverter device, Pipeline
Flex, with a high metal coverage ratio.
Consequently, Silent MRA was better in
terms of visualizing in-stent blood flow
and the embolic state of aneurysms
compared with TOF-MRA in a statisti-
cally significant manner. Particularly,
Silent MRA showed superior visualiza-
tion regardless of the maximum size of
the aneurysmal diameter, diameter and
length of the Pipeline Flex itself, the lo-
cation of the aneurysms, the degree of
Table 2: Comparison of correlations between Silent MRA andTOF-MRA from the viewpoint of all parameters for Silent MRA(3.18 � 0.72)
High Score(>2, n = 66)
Low Score(≤2, n = 12)
PValue
Aneurysmal size (mean) (mm) 14.8 � 5.4 15.0 � 6.6 .91Aneurysmal neck diameter (mean) (mm) 6.5 � 2.2 6.4 � 2.3 .79Pipeline diameter (mean) (mm) 4.3 � 0.6 4.1 � 0.6 .27Pipeline length (mean) (mm) 21.7 � 6.3 22.0 � 6.8 .90In-stent stenosis (No.) (%) 42/66 (63.6%) 8/12 (66.7%) .84Location (paraclinoid/cavernous) 44:22 8:4 1.00Additional coiling (No.) (%) 33/66 (50.0%) 7/12 (58.3%) .60
Table 3: Comparison of correlations between Silent MRA andTOF-MRA from the viewpoint of all parameters for TOF-MRA(2.31 � 0.86)
High Score(>2, n = 44)
Low Score(≤2, n = 34)
PValue
Aneurysmal size (mean) (mm) 13.5 � 4.3 16.6 � 6.5 �.05Aneurysmal neck diameter (mean) (mm) 6.0 � 1.6 7.2 � 2.7 �.05Pipeline diameter (mean) (mm) 4.2 � 0.6 4.3 � 0.5 .61Pipeline length (mean) (mm) 20.8 � 5.8 23.0 � 6.9 .13In-stent stenosis (No.) (%) 28/44 (63.6%) 22/34 (65.9%) .92Location (paraclinoid/cavernous) 35:9 17:17 �.01Additional coiling (No.) (%) 26/44 (59.1%) 14/34 (41.2%) .12
Table 4: Comparison of correlation between Silent MRA and TOF-MRA from the viewpointof intra-aneurysmal thrombosis after flow-diverter device placement
Intra-AneurysmalThrombosis (+) (n = 13)
Intra-AneurysmalThrombosis (−) (n = 65)
PValue
Location (paraclinoid segment/cavernous segment) 2:11 63:2 �.01Aneurysmal size (mean) (range) (mm) 21.7 � 5.3 (12.6–32.5) 13.4 � 4.4 (8.1–28.7) �.01Aneurysmal neck diameter (mean) (range) (mm) 7.8 � 3.1 (2.8–15.3) 6.3 � 1.9 (3.3–13.9) �.05Additional coiling (No.) (%) 2 (15.4%) 37 (56.9%) �.01Pipeline diameter (mean) (range) (mm) 4.21 � 0.5 (3–5) 4.23 � 0.6 (3–5) .91Pipeline length (mean) (range) (mm) 27.5 � 7.2 (18–35) 20.6 � 5.4 (16–35) �.01Silent MRA score (mean) 3.5 � 0.5 3.1 � 0.7 .10TOF-MRA score (mean) 2.0 � 0.8 2.3 � 0.8 .20
Note:—� indicates present; �, absent.
810 Oishi May 2019 www.ajnr.org

in-stent stenosis, and the presence or absence of additional coil-
ing. On the other hand, TOF-MRA showed significantly poor
visualization of large aneurysms and those located in the cavern-
ous segment (Fig 2).
With TOF-MRA, it has become known that within an artery,
such as in the cavernous segment with considerable bends and
meandering, there are often signal losses due to turbulent and/or
slow flow.26-29 The TOF-MRA score tended to be lower when the
neck diameter was larger and the Pipeline Flex was longer, though
it was not statistically significant. One of the causes of these results
was the effect of the metal artifacts of the Pipeline Flex. On the
other hand, although artifacts due to additional coiling were spec-
ulated to be the cause of poor imaging, such an effect was not
observed. The cause was thought to be that during the Pipeline
placement, because the purpose of coil embolization was not
complete occlusion but to promote thrombosis, coiling induced
only rough packing, and consequently the metal surface area was
small.
In the present study, in TOF-MRA images after Pipeline Flex
placement, there were cases in which occlusion of the parent ar-
tery was difficult and which were mistakenly diagnosed as incom-
plete intra-aneurysmal occlusion due to the intra-aneurysmal
thrombosis signals (Fig 3). The aneurysm will be completely oc-
cluded by promoting intra-aneurysmal thrombosis after flow-di-
verter placement. It is reported that TOF-MRA shows a high-
intensity signal from an acute-to-subacute phase of thrombus
formation.25 The thrombosis signal change of TOF-MRA was
particularly frequent in the cavernous segment, the segment in
which additional coiling was not required, presumably because
the thrombosis occurred slowly and it was easy to pick up the
signal change in TOF-MRA. The Silent MRAs and the 3D images
were reconstituted by subtraction of data from the control image
of those obtained by labeling pulse, signals of thrombosis after the
flow-diverter placement can be removed. This means that Silent
MRA does not pick up a thrombosis signal, but, like DSA, it shows
only a blood flow signal into the aneurysm as a signal change.
Similarly, in contrast-enhanced MRA, signals of thrombosis can
be eliminated by the subtraction between control and contrast-
enhanced images. However, it is possible that false-positive alter-
ations of intra-aneurysmal signals such as venous contamination
and enhancement of the aneurysmal wall were observed with con-
trast-enhanced MRA.30 In any event, postoperative assessment of
a flow-diverter device that promotes aneurysmal thrombosis may
be difficult by TOF-MRA. In the present study, signal alterations
due to thrombosis were examined in chronologic order (Fig 3).
Immediately after the treatment, there was no area with high-
intensity signals on the T1-weighted image. Six months later, sig-
nals due to thrombosis reached a peak, and 1 year later the signals
slightly decreased. Immediately after the treatment, Silent MRA
visualized intra-aneurysmal signal alteration due to the remaining
blood, while at 6 months and again at 1 year later, no signal alter-
ations were observed. Furthermore, it was found that the percent-
age of agreement in the assessment of intra-aneurysmal emboli-
zation on Silent MRA was higher than that on TOF-MRA.
FIG 2. A, An 82-year-old woman. Flow-diverter placement in the left internal carotid artery cavernous segment aneurysm (20.1 � 6.3 mm) wasperformed with the Pipeline Flex (4.5 � 25 mm). B, Digital subtraction angiography shows the location of the Pipeline Flex by conebeam CT. C,The 6-month follow-up DSA shows complete occlusion of the aneurysm. D, This Silent MRA shows an excellent signal flow in the Pipeline Flex(arrow) but no intra-aneurysmal signal. E, This time-of-flight MRA almost lost the signal in the Pipeline Flex (double arrows) and has a faint signalin the aneurysm. The scores of the Silent MRA by 3 observers were 4, 3, and 4, and those of the TOF-MRA were 2, 2, and 2.
Table 5: Comparison of embolization assessment among DSA,Silent MRA, and TOF-MRA after flow-diverter device placement
DSA
CO (n = 55) IO (n = 23)Silent MRA CO (n � 58) 53 5
IO (n � 20) 2 18TOF-MRA CO (n � 52) 47 7
IO (n � 26) 8 16
Note:—CO indicates complete occlusion; IO, incomplete occlusion.
AJNR Am J Neuroradiol 40:808 –14 May 2019 www.ajnr.org 811

Especially, intra-aneurysmal thrombosis was likely to contribute
to the high rate of false-positive signals on TOF-MRA.
In the present study, there were 2 cases in which TOF-MRA
showed significantly better images than Silent MRA (Fig 4). In 1
patient, a 65-year-old woman, the images were not clear, probably
due to artifacts caused by the woman’s denture. Because the arte-
rial spin-labeling technique was used for Silent MRA, a labeling
pulse was performed through the patient’s cervical region. There-
fore, although Silent MRA is useful even if there are intracranial
metal artifacts, cervical artifacts such as a denture could possibly
influence the image. The other case was that of a 73-year-old
woman. This patient was claustrophobic and could not stay still
during the MR imaging examination. As a result, visualization
was poor due to motion artifacts. Silent MRA imaging takes 12
minutes 13 seconds, which is significantly longer than the 4 min-
utes 45 seconds needed for a TOF-MRA. Therefore, for claustro-
phobic patients, children, or elderly and postoperatively restless
patients, TOF-MRA is preferable.
There are some limitations to the present study. First, we
have not assessed contrast-enhanced MRA. There have been
some studies that report that contrast-enhanced MRA is excel-
lent for the postoperative assessment of stent placement and
flow-diverter placement. Although Silent MRA was found to
be superior to TOF-MRA in the present study, comparison
with contrast-enhanced MRA is warranted. Second, the pres-
ent assessment was limited to internal carotid aneurysms. Re-
cently, flow-diverter devices for the posterior circulation have
been developed, and their usefulness has been demonstrated.31
In the future, the assessment of the posterior circulation
should be performed. Third, the present study was retrospec-
tive. A prospective study with a high level of evidence-based
medicine would be desirable.
FIG 3. A 75-year-old woman. A, The aneurysm (26.2 � 6.1 mm) was located in the left internal carotid artery paraclinoid segment. B, A 6-monthfollow-up DSA shows almost complete occlusion of the aneurysm. C, The MRA T1-weighted image immediately after the operation shows anintra-aneurysmal isointensity signal (arrow). D and E, Both Silent MRA and TOF-MRA show an intra-aneurysmal signal that had a negativeinfluence on the parent artery assessment. F, A 6-month follow-up T1-weighted image shows an intra-aneurysmal high-intensity signal, whichmeans thrombosis (double arrows). G, A 6-month follow-up, Silent MRA shows excellent signal flow in the Pipeline Flex. H, A 6-month follow-upTOF-MRA shows that the image could not be assessed by the intra-aneurysmal thrombosed signal. I, The 1-year follow-up T1-weighted MR imageshows a lower intra-aneurysmal high-intensity signal decrease than at the 6-month follow-up (triple arrows). J, The 1-year follow-up findingson the Silent MRA signal flow were the same as at the 6-month follow-up. K, The 1-year follow-up on TOF-MRA shows a better signal flow thanat the 6-month follow-up TOF-MRA (arrowhead) by improvement of the thrombosed aneurysm (double arrowheads), but the signal flow onthe Silent MRA is better than that on the TOF-MRA. The scores of the 6-month follow-up Silent MRA by 3 independent observers were 4, 4, and4. The scores of the TOF-MRA were 1, 1, and 1.
812 Oishi May 2019 www.ajnr.org
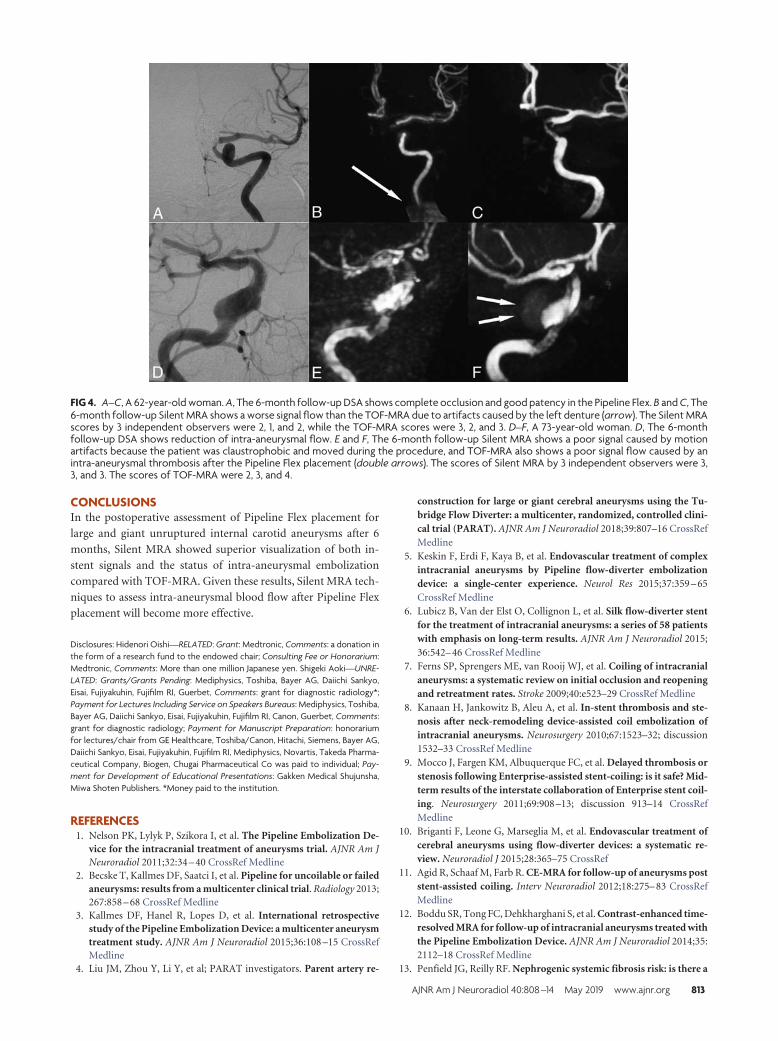
CONCLUSIONSIn the postoperative assessment of Pipeline Flex placement for
large and giant unruptured internal carotid aneurysms after 6
months, Silent MRA showed superior visualization of both in-
stent signals and the status of intra-aneurysmal embolization
compared with TOF-MRA. Given these results, Silent MRA tech-
niques to assess intra-aneurysmal blood flow after Pipeline Flex
placement will become more effective.
Disclosures: Hidenori Oishi—RELATED: Grant: Medtronic, Comments: a donation inthe form of a research fund to the endowed chair; Consulting Fee or Honorarium:Medtronic, Comments: More than one million Japanese yen. Shigeki Aoki—UNRE-LATED: Grants/Grants Pending: Mediphysics, Toshiba, Bayer AG, Daiichi Sankyo,Eisai, Fujiyakuhin, Fujifilm RI, Guerbet, Comments: grant for diagnostic radiology*;Payment for Lectures Including Service on Speakers Bureaus: Mediphysics, Toshiba,Bayer AG, Daiichi Sankyo, Eisai, Fujiyakuhin, Fujifilm RI, Canon, Guerbet, Comments:grant for diagnostic radiology; Payment for Manuscript Preparation: honorariumfor lectures/chair from GE Healthcare, Toshiba/Canon, Hitachi, Siemens, Bayer AG,Daiichi Sankyo, Eisai, Fujiyakuhin, Fujifilm RI, Mediphysics, Novartis, Takeda Pharma-ceutical Company, Biogen, Chugai Pharmaceutical Co was paid to individual; Pay-ment for Development of Educational Presentations: Gakken Medical Shujunsha,Miwa Shoten Publishers. *Money paid to the institution.
REFERENCES1. Nelson PK, Lylyk P, Szikora I, et al. The Pipeline Embolization De-
vice for the intracranial treatment of aneurysms trial. AJNR Am JNeuroradiol 2011;32:34 – 40 CrossRef Medline
2. Becske T, Kallmes DF, Saatci I, et al. Pipeline for uncoilable or failedaneurysms: results from a multicenter clinical trial. Radiology 2013;267:858 – 68 CrossRef Medline
3. Kallmes DF, Hanel R, Lopes D, et al. International retrospectivestudy of the Pipeline Embolization Device: a multicenter aneurysmtreatment study. AJNR Am J Neuroradiol 2015;36:108 –15 CrossRefMedline
4. Liu JM, Zhou Y, Li Y, et al; PARAT investigators. Parent artery re-
construction for large or giant cerebral aneurysms using the Tu-bridge Flow Diverter: a multicenter, randomized, controlled clini-cal trial (PARAT). AJNR Am J Neuroradiol 2018;39:807–16 CrossRefMedline
5. Keskin F, Erdi F, Kaya B, et al. Endovascular treatment of complexintracranial aneurysms by Pipeline flow-diverter embolizationdevice: a single-center experience. Neurol Res 2015;37:359 – 65CrossRef Medline
6. Lubicz B, Van der Elst O, Collignon L, et al. Silk flow-diverter stentfor the treatment of intracranial aneurysms: a series of 58 patientswith emphasis on long-term results. AJNR Am J Neuroradiol 2015;36:542– 46 CrossRef Medline
7. Ferns SP, Sprengers ME, van Rooij WJ, et al. Coiling of intracranialaneurysms: a systematic review on initial occlusion and reopeningand retreatment rates. Stroke 2009;40:e523–29 CrossRef Medline
8. Kanaan H, Jankowitz B, Aleu A, et al. In-stent thrombosis and ste-nosis after neck-remodeling device-assisted coil embolization ofintracranial aneurysms. Neurosurgery 2010;67:1523–32; discussion1532–33 CrossRef Medline
9. Mocco J, Fargen KM, Albuquerque FC, et al. Delayed thrombosis orstenosis following Enterprise-assisted stent-coiling: is it safe? Mid-term results of the interstate collaboration of Enterprise stent coil-ing. Neurosurgery 2011;69:908 –13; discussion 913–14 CrossRefMedline
10. Briganti F, Leone G, Marseglia M, et al. Endovascular treatment ofcerebral aneurysms using flow-diverter devices: a systematic re-view. Neuroradiol J 2015;28:365–75 CrossRef
11. Agid R, Schaaf M, Farb R. CE-MRA for follow-up of aneurysms poststent-assisted coiling. Interv Neuroradiol 2012;18:275– 83 CrossRefMedline
12. Boddu SR, Tong FC, Dehkharghani S, et al. Contrast-enhanced time-resolved MRA for follow-up of intracranial aneurysms treated withthe Pipeline Embolization Device. AJNR Am J Neuroradiol 2014;35:2112–18 CrossRef Medline
13. Penfield JG, Reilly RF. Nephrogenic systemic fibrosis risk: is there a
FIG 4. A–C, A 62-year-old woman. A, The 6-month follow-up DSA shows complete occlusion and good patency in the Pipeline Flex. B and C, The6-month follow-up Silent MRA shows a worse signal flow than the TOF-MRA due to artifacts caused by the left denture (arrow). The Silent MRAscores by 3 independent observers were 2, 1, and 2, while the TOF-MRA scores were 3, 2, and 3. D–F, A 73-year-old woman. D, The 6-monthfollow-up DSA shows reduction of intra-aneurysmal flow. E and F, The 6-month follow-up Silent MRA shows a poor signal caused by motionartifacts because the patient was claustrophobic and moved during the procedure, and TOF-MRA also shows a poor signal flow caused by anintra-aneurysmal thrombosis after the Pipeline Flex placement (double arrows). The scores of Silent MRA by 3 independent observers were 3,3, and 3. The scores of TOF-MRA were 2, 3, and 4.
AJNR Am J Neuroradiol 40:808 –14 May 2019 www.ajnr.org 813

difference between gadolinium-based contrast agents? Semin Dial2008;21:129 –34 CrossRef Medline
14. Cho WS, Kim SS, Lee SJ, et al. The effectiveness of 3T time-of-flightmagnetic resonance angiography for follow-up evaluations afterthe stent-assisted coil embolization of cerebral aneurysms. Acta Ra-diol 2014;55:604 –13 CrossRef Medline
15. Cho YD, Kim KM, Lee WJ, et al. Time-of-flight magnetic resonanceangiography for follow-up of coil embolization with Enterprisestent for intracranial aneurysm: usefulness of source images. Ko-rean J Radiol 2014;15:161– 68 CrossRef Medline
16. Irie R, Suzuki M, Yamamoto M, et al. Assessing bold flow in anintracranial stent: a feasibility study of MR angiography using aSilent scan after stent-assisted coil embolization for anterior circu-lation aneurysms. AJNR Am J Neuroradiol 2015;36:967–70 CrossRefMedline
17. Takano N, Suzuki M, Irie R, et al. Usefulness of non-contrast-en-hanced MR angiography using a Silent scan for follow-up after Y-configuration stent-assisted coil embolization for basilar tip aneu-rysms. AJNR Am J Neuroradiol 2017;38:577– 81 CrossRef Medline
18. Takano N, Suzuki M, Irie R, et al. Non-contrast-enhanced Silentscan MR angiography of intracranial anterior circulation aneu-rysms treated with a low-profile visualized intraluminal supportdevice. AJNR Am J Neuroradiol 2017;38:1610 –16 CrossRef Medline
19. Attali J, Benaissa A, Soize S, et al. Follow-up of intracranial aneu-rysms treated by flow diverter: comparison of three-dimensionaltime-of-flight MR angiography (3D-TOF-MRA) and contrast-en-hanced MR angiography (CE-MRA) sequences with digital subtrac-tion angiography as the gold standard. J Neurointerv Surg 2016;8:81– 86 CrossRef Medline
20. Patzig M, Forbrig R, Ertl L, et al. Intracranial aneurysms treated byflow-diverting stents: long-term follow-up with contrast-enhancedmagnetic resonance angiography. Cardiovasc Intervent Radiol 2017;40:1713–22 CrossRef Medline
21. Benaissa A, Tomas C, Clarencon F, et al. Retrospective analysisof delayed intraparenchymal hemorrhage after flow-divertertreatment: presentation of a retrospective multicenter trial.AJNR Am J Neuroradiol 2016;37:475– 80 CrossRef Medline
22. Cruz JP, Chow M, O’Kelly C, et al. Delayed ipsilateral parenchymalhemorrhage following flow diversion for the treatment of anteriorcirculation aneurysms. AJNR Am J Neuroradiol 2012;33:60 – 68CrossRef Medline
23. Kulcsar Z, Houdart E, Bonafe A, et al. Intra-aneurysmal thrombosisas a possible cause of delayed aneurysm rupture after flow-diver-sion treatment. AJNR Am J Neuroradiol 2011;32:20 –25 CrossRefMedline
24. Alibek S, Vogel M, Sun W, et al. Acoustic noise reduction in MRIusing Silent Scan: an initial experience. Diagn Interv Radiol 2014;20:360 – 63 CrossRef Medline
25. Renard D, Le Bars E, Arquizan C, et al. Time-of-flight MR angiogra-phy in cerebral venous sinus thrombosis. Acta Neurol Belg 2017;117:837– 40 CrossRef Medline
26. Wall A, Kugel H, Bachman R, et al. 3.0 T vs. 1.5 T MR angiography: invitro comparison of intravascular stent artifacts. J Magn Reson Im-aging 2005;22:772–79 CrossRef Medline
27. Wang Y, Truong TN, Yen C, et al. Quantitative evaluation of suscep-tibility and shielding effects of nitinol, platinum, cobalt-alloy, andstainless steel stents. Magn Reson Med 2003;49:972–76 CrossRefMedline
28. Majoie CB, Sprengers ME, van Rooij WJ, et al. MR angiography at 3Tversus digital subtraction angiography in the follow-up of intracra-nial aneurysms treated with detachable coils. AJNR Am J Neurora-diol 2005;26:1349 –56 Medline
29. Wallace RC, Karis JP, Partovi S, et al. Noninvasive imaging of treatedcerebral aneurysms, part 1: MR angiographic follow-up of coiledaneurysms. AJNR Am J Neuroradiol 2007;28:1001– 08 CrossRefMedline
30. Choi JW, Roh HG, Moon WJ, et al; Time-resolved 3D contrast-enhanced MRA on 3.0T: a non-invasive follow-up technique afterstent-assisted coil embolization of the intracranial aneurysm. Ko-rean J Radiol 2011;12:662–70 CrossRef Medline
31. Leucking H, Engelhorn T, Lang S, et al. FRED flow diverter: a studyon safety and efficacy in a consecutive group of 50 patients. AJNRAm J Neuroradiol 2017;38:596 – 02 CrossRef Medline
814 Oishi May 2019 www.ajnr.org

ORIGINAL RESEARCHINTERVENTIONAL
Pointwise Encoding Time Reduction with Radial Acquisitionwith Subtraction-Based MRA during the Follow-Up of Stent-
Assisted Coil Embolization of Anterior Circulation AneurysmsX Y.J. Heo, X H.W. Jeong, X J.W. Baek, X S.T. Kim, X Y.G. Jeong, X J.Y. Lee, and X S.-C. Jin
ABSTRACT
BACKGROUND AND PURPOSE: Time-of-flight MR angiography, though widely used after coil embolization, is associated with limitationsowing to magnetic susceptibility and radiofrequency shielding following stent-assisted coil embolization. We evaluated the pointwiseencoding time reduction with radial acquisition (PETRA) sequence in subtraction-based MRA (qMRA) using an ultrashort TE relative toTOF-MRA during the follow-up of stent-assisted coil embolization for anterior circulation aneurysms.
MATERIALS AND METHODS: Twenty-five patients (3 men and 22 women; mean age, 59.1 � 14.0 years) underwent stent-assisted coilembolization for anterior circulation aneurysms and were retrospectively evaluated using TOF-MRA and PETRA qMRA data from the samefollow-up session. Two neuroradiologists independently reviewed both MRA findings and subjectively graded flow within the stents(relative to the latest DSA findings) and occlusion status (complete occlusion or neck/aneurysm remnant). Interobserver and intermodalityagreement for TOF-MRA and PETRA qMRA were evaluated.
RESULTS: The mean score for flow visualization within the stents was significantly higher in PETRA qMRA than in TOF-MRA (P � .001 forboth observers), and good interobserver agreement was reported (� � 0.63). The aneurysm occlusion status of PETRA qMRA (observer 1,92.0%; observer 2, 88.0%) was more consistent with DSA than with TOF-MRA (observer 1, 76.0%; observer 2, 80.0%), and there was a betterintermodality agreement between DSA and PETRA qMRA than between DSA and TOF-MRA.
CONCLUSIONS: These findings indicate that PETRA qMRA is a useful follow-up technique for patients who have undergone stent-assisted coil embolization for anterior circulation aneurysms.
ABBREVIATIONS: PETRA � pointwise encoding time reduction with radial acquisition; qMRA � subtraction-based MRA
Stent-assisted coil embolization has been widely used for cases
in which conventional coil embolization is considered diffi-
cult, such as in wide-neck aneurysms. Considering the possibility
of recanalization, follow-up imaging is important even after com-
plete occlusion has been achieved. DSA is considered the criterion
standard for follow-up to evaluate intra-aneurysmal flow or in-
stent restenosis; however, this technique has risks associated with
contrast media, procedural invasiveness, and radiation exposure.
Contrast-enhanced MRA provides visualization of the remnant
neck and stented segments that is similar to that of DSA.1-3 How-
ever, contrast-enhanced MRA has contrast-associated risks, in-
cluding nephrogenic systemic fibrosis, anaphylaxis, gadolinium
deposition, and the potential for misdiagnosing perianeurysmal
enhancement as recanalization.
Nonenhanced TOF-MRA is another established technique
used for follow-up after coil embolization. Specifically, it is useful
for the evaluation of the residual lumen of aneurysms.4 However,
this approach is difficult in cases with stent-assisted coil emboli-
zation because visualizing blood flow within intracranial stents
and the parent artery is complicated by radiofrequency shielding
and susceptibility artifacts.2,5 These can obscure the neck re-
mnant and adjacent structures as a result of signal loss. Several
trials have attempted to overcome these problems when using
MRA after stent-assisted coil embolization.6-10 For example, ul-
trashort-TE MRA is known to decrease the susceptibility artifacts
caused by metallic devices and to increase the signal intensity
within the stent.11,12 Recently, a few studies7-9 have highlighted
the efficacy of Silent MRA (GE Healthcare, Milwaukee, Wiscon-
sin) using an ultrashort TE after stent-assisted coil embolization.
Received November 23, 2018; accepted after revision March 11, 2019.
From the Departments of Radiology (Y.J.H., H.W.J., J.W.B.), Neurosurgery (S.T.K.,Y.G.J.), and Internal Medicine (J.Y.L.), Inje University Busan Paik Hospital, Busan, Ko-rea; and Department of Neurosurgery (S.-C.J.), Inje University Haeundae Paik Hospi-tal, Busan, Korea.
This work was supported by the 2018 Inje University research grant.
Please address correspondence to Hae Woong Jeong, MD, PhD, Department ofRadiology, Inje University Busan Paik Hospital, Bokji-ro 75, Busanjin-Gu, Busan, Ko-rea, 47392; e-mail: [email protected]
http://dx.doi.org/10.3174/ajnr.A6035
AJNR Am J Neuroradiol 40:815–19 May 2019 www.ajnr.org 815

The present study evaluated another nonenhanced MRA tech-
nique using ultrashort TE, known as pointwise encoding time
reduction with radial acquisition (PETRA). Our results indicate
that PETRA showed a higher SNR compared with the conven-
tional ultrashort TE. This was due to a shorter encoding time for
whole k-space, which was required before the signal decayed.13 To
the best of our knowledge, PETRA with subtraction-based MRA
(qMRA) has not been studied following stent-assisted coil embo-
lization. Therefore, we aimed to evaluate its utility relative to
TOF-MRA during follow-up after stent-assisted coil emboliza-
tion for anterior circulation aneurysms.
MATERIALS AND METHODSPatientsThis retrospective study evaluated 25 patients (22 women and 3
men; mean age, 59.1 � 14.0 years) who underwent stent-assisted
coil embolization for unruptured aneurysms in the anterior cir-
culation (24 cases in the paraclinoid segment of the ICA, 1 case in
the anterior communicating artery) between September 2017 and
October 2018. All subjects underwent TOF-MRA and PETRA
qMRA during the same follow-up session. The retrospective pro-
tocol of the study was approved by the Inje University Busan Paik
Hospital institutional review board.
Eighteen patients were treated using a Neuroform stent
(Stryker Neurovascular, Kalamazoo, Michigan), 6 patients were
treated with an Enterprise stent (Codman & Shurtleff, Raynham,
Massachusetts), and 1 patient was treated using both stents. En-
dovascular therapy and DSA were performed using a biplane an-
giographic unit (Integris V, Philips Healthcare, Best, the Nether-
lands; or Artis zee biplane system, Siemens, Erlangen, Germany).
Complete occlusion was identified in 15 cases, and a residual neck
was observed in 10 cases, based on the latest DSA findings.
Imaging AcquisitionIntracranial TOF-MRA and PETRA qMRA were performed dur-
ing the same follow-up session using 3T MR imaging (Magnetom
Skyra; Siemens) with a 64-channel head-neck coil. The PETRA
qMRA technique has been described previously14 and is commer-
cially available. Briefly, labeled and control data were obtained;
the labeled data were applied to the slice-selective saturation pulse
for the carotid artery (ie, arterial inflow appears dark). The satu-
ration pulse of control data was applied to the 10 mm above the
vertex of the head, and the subtracted MRA showed dark back-
ground tissue and suppressed venous flow. The detailed scan pa-
rameters for PETRA qMRA: TR/TE, 3.52/0.07 ms; flip angle, 6°;
FOV, 230 � 230 mm; matrix, 320 � 320; radial sampling, 20,000
radial spokes; voxel size, 0.72 � 0.72 � 0.72 mm3; section thick-
ness, 0.72 mm; NEX, 1; bandwidth, 363 Hz/pixel; slice-selective
saturation pulse applied once per 20 TRs; and acquisition time, 2
minutes 10 seconds. The detailed scan parameters for TOF-MRA:
TR/TE, 24/3.99 ms; flip angle, 20°; FOV, 220 � 177 mm; matrix,
576 � 302; voxel size, 0.38 � 0.38 � 0.38 mm3; section thickness,
0.6 mm; NEX, 1; bandwidth, 185 Hz/pixel; acquisition time, 6
minutes 40 seconds; number of slab, 6. The maximum intensity
projections for both sequences were reconstructed in the same
manner as the DSA images.
Image AnalysisTwo neuroradiologists independently reviewed both MRA find-
ings at 2-week intervals and subjectively graded the visualization
of flow within each stent (relative to the latest DSA findings) using
the following scale: 1, no signal within the stent; 2, slightly visible
but not of diagnostic quality due to image blurring; 3, good qual-
ity with minimal blurring; or 4, excellent quality. The occlusion
status of the coiled aneurysm was also evaluated. The locations of
the aneurysms were provided to the observers, but they were
blinded to the DSA results. However, observers were not blinded
to the type of MR images because the 2 MR images are distinc-
tively different in appearance. One experienced interventional
neuroradiologist also assessed the occlusion status of the coiled
aneurysm using the Montreal Neurological Institute scale.15 Spe-
cifically, patients were rated as having complete occlusion,
subtotal occlusion (residual neck, residual aneurysm), or in-
complete occlusion. The latest DSA images were used as refer-
ences, and the average interval between the latest DSA and the
MRA follow-up was 16 months, with a range of 1 day to 127
months.
Statistical AnalysesContinuous variables are presented as mean � SD. We compared
the mean scores for each MRA technique and type of intracranial
stent using the Wilcoxon signed rank test and the Mann-Whitney
test. Weighted � coefficients were used to evaluate the interob-
server and intermodality agreement for TOF-MRA and PETRA
qMRA. The results were classified as poor (�0.20), fair (0.21–
0.40), moderate (0.41– 0.60), good (0.61– 0.80), or excellent
(0.81–1.00).16 All statistical analyses were performed using SPSS
software (Version 24.0; IBM, Armonk, New York) and MedCalc
for Windows (Version 18.11.3; MedCalc Software, Mariakerke,
Belgium). P values � .05 were considered statistically significant.
RESULTSThe mean score for assessing blood flow within the intracranial
stent was significantly higher in the PETRA qMRA than in the
TOF-MRA (observer one: 3.40 � 0.87 for PETRA qMRA and
2.20 � 0.87 for TOF-MRA, P � .001; observer two: 3.60 � 0.76
for PETRA qMRA and 2.44 � 0.77 for TOF-MRA, P � .001) with
good interobserver agreement for both MRA techniques (� �
0.63 for PETRA qMRA, 95% CI, 0.35– 0.90; � � 0.63 for TOF-
MRA, 95% CI, 0.43– 0.83). The Neuroform stents (open-cell de-
sign) were associated with higher scores than the Enterprise stents
(closed-cell design) for both PETRA qMRA and TOF-MRA; how-
ever, no significant differences were detected between the 2 intra-
cranial stents (Table 1). On the basis of the latest DSA findings,
complete occlusion was achieved in 15 cases (60.0%) and a resid-
ual neck was observed in 10 cases (40.0%). PETRA qMRA find-
ings were consistent with DSA findings in 23 cases (92.0%) ac-
cording to observer 1 and 22 cases (88.0%) according to observer
2. Therefore, the intermodality agreement between PETRA
qMRA and DSA was excellent according to observer 1 (weighted
� � 0.83; 95% CI, 0.60 –1.00) and good according to observer 2
(weighted � � 0.73; 95% CI, 0.47–1.00) (Table 2). However, only
19 cases (76.0%) of TOF-MRA findings were consistent with DSA
according to observer 1 and 20 cases (80.0%) according to ob-
816 Heo May 2019 www.ajnr.org

server 2. Thus, the intermodality agreement between TOF-MRA
and DSA was moderate in both observer 1 (weighted �� 0.44;
95% CI, 0.12– 0.77) and observer 2 (weighted � � 0.55; 95% CI,
0.23– 0.86) (Figs 1 and 2).
DISCUSSIONThe present study revealed that PETRA qMRA provided better
visualization of intracranial stent flow than TOF-MRA, regardless
of stent type. Furthermore, PETRA qMRA showed higher inter-
modality agreement with DSA than TOF-MRA. In the 2 cases in
which PETRA qMRA failed to detect the residual neck, the inter-
vals between the last DSA and the MRA were 31 and 15 months.
Santillan et al17 reported cumulative occlusion after the first treat-
ment, and our cases may have involved progressive occlusion
within the aneurysms. In cases in which PETRA qMRA identified
the residual neck, its configuration was more similar to DSA find-
ings than to TOF-MRA findings. These results suggest that
PETRA qMRA could be a useful imaging technique following
stent-assisted coil embolization.
The increased use of intracranial stent placement has also in-
creased the difficulty of using follow-up imaging to assess the
recanalization status or stability of the stent. Although DSA is an
established technique for follow-up, it also has risks related to
contrast media (eg, nephrogenic systemic fibrosis), neurologic
complications (eg, embolic infarction),18 and radiation exposure.
Contrast-enhanced MRA provides better delineation of the par-
ent artery and is correlated with DSA findings; however, it can also
cause contrast-related complications. Furthermore, contrast-en-
hanced MRA can produce a false-positive result that indicates a
residual neck, which is caused by peripheral enhancement of the
thrombus or vasa vasorum within the aneurysmal wall.19,20 In
contrast, TOF-MRA is a noninvasive imaging technique that is
used following intracranial stent insertion. However, TOF-MRA
is prone to susceptibility artifacts, which can generate false-posi-
tive or false-negative results at the stent insertion site. Various
trials have attempted to overcome these problems.4,10,21 Addi-
tionally, some reports have described the value of the ultra-
short-TE technique in this setting,4,6-9 which can significantly re-
duce susceptibility artifacts and decrease the phase dispersion of
labeled flow.22,23
Irie et al6 reported that Silent MRA with an ultrashort TE is
useful for visualizing flow within an intracranial stent and the
occlusion status of aneurysms. Furthermore, there is a strong pos-
itive correlation between the results obtained using Silent MRA
and DSA. PETRA qMRA also uses an ultrashort TE, and our find-
ings indicate that the results from this technique are strongly cor-
related with those from Silent MRA. Similar to Silent MRA,
PETRA qMRA uses subtraction of scanned images from before
and after labeling. This makes it difficult to assess static tissue and
may prevent detection of in-stent thrombus, which is visualized as
a high-intensity signal during TOF-MRA. Although in-stent
thrombosis can occasionally occur after stent insertion for athero-
sclerotic stenosis, it is uncommon and usually asymptomatic or it
spontaneously regresses in patients who undergo stent-assisted
coil embolization.17,24 PETRA qMRA is associated with poorer
FIG 1. A 54-year-old man with a left paraclinoid internal carotid artery aneurysm who underwent stent-assisted coil embolization using aNeuroform stent. A, The follow-up DSA reveals the neck remnant (arrow). B, The PETRA qMRA reveals minimal signal loss at the stent insertionsite, and the neck remnant is clearly visible (arrow). C, The TOF-MRA reveals mild signal loss at the stent insertion site and a less prominent neckremnant relative to the PETRA qMRA.
Table 1: Comparison of PETRA qMRA and TOF-MRA accordingto stent designa
Enterprise(n = 6)
Neuroform(n = 18)
PValue
PETRA qMRAObserver 1 2.83 � 1.17 3.50 � 0.71 .224Observer 2 3.33 � 0.82 3.89 � 0.32 .156Mean for 2 observers 3.08 � 0.97 3.69 � 0.42 .177
TOF-MRAObserver 1 2.00 � 0.90 2.33 � 0.84 .454Observer 2 2.17 � 0.41 2.61 � 0.78 .137Mean for 2 observers 2.08 � 0.58 2.47 � 0.78 .224
a Data are presented as means.
Table 2: Comparison of occlusion status of coiled aneurysmsbetween PETRA qMRA and TOF-MRAa
PETRA qMRA TOF-MRAObserver 1
Complete occlusion 100.0% (17/15) 100.0% (21/15)Residual neck 80.0% (8/10) 40.0% (4/10)
Observer 2Complete occlusion 100% (17/15) 100.0% (20/15)Residual neck 70.0% (7/10) 50.0% (5/10)
Interobserver agreement 0.90 (95% CI,0.72–1.00)
0.86 (95% CI,0.61–1.00)
a Data represent sensitivity (number of cases).
AJNR Am J Neuroradiol 40:815–19 May 2019 www.ajnr.org 817

imaging quality than TOF-MRA, which is another disadvantage
of PETRA qMRA, like Silent MRA. Although, Silent MRA is asso-
ciated with better background suppression, it has been reported
that it showed more blurring and a lower SNR than TOF-MRA
because of its longer readout time.25 Conversely, PETRA qMRA
had a shorter acquisition time (approximately 2 minutes) than
Silent MRA and TOF-MRA (approximately 6 –7 minutes) using a
highly undersampled outer k-space.13
The degree of artifacts associated with an intracranial stent can
vary according to the material, cell design, and strut thickness. For
example, previous reports have indicated that stents made using
stainless steel or cobalt are associated with more artifacts than
nitinol stents.10,26,27 The present study included only patients
who were treated with nitinol stents, albeit with different cell de-
signs (open cell versus closed cell) and strut thicknesses. Although
the Neuroform stent has an open-cell design, thinner struts, and
better intrastent flow than the Enterprise stent (a closed-cell de-
sign with thicker struts), there were no significant differences be-
tween the 2 intracranial stents according to the analyses of the 2
observers. We believe that this was due to the small sample size of
this study. Similarly, previous studies5,21,28 have demonstrated
that the Neuroform stent generated fewer artifacts than the En-
terprise stent because the thinner struts generated less radiofre-
quency shielding.5,7,11
The present study has several limitations. First, the retrospec-
tive design is prone to selection bias. Second, there was a long
interval between the latest DSA and MRA, which may indicate
that the patients were evaluated with MRA when they were at a
slightly different status from that in their last DSA. However, we
do not regularly perform DSA for patients who do not show evi-
dence of recanalization during follow-up MRA due to the inva-
siveness of the procedure and the possibility of neurologic com-
plications. Therefore, shorter intervals between the latest DSA
and MRA could not be achieved. Additionally, we did not com-
pare our results with those of contrast-enhanced MRA, which is
considered a useful follow-up technique for stent-assisted coil
embolization.21,29 Thus, future studies comparing PETRA qMRA
with contrast-enhanced MRA are necessary. Furthermore, we
evaluated cases that involved nitinol stents, which have fewer ar-
tifacts than stents made using other materials. Further studies
should be conducted to determine whether our findings are con-
sistent with the use of stainless steel, platinum, and cobalt stents.
Finally, this study had a small sample size; future studies should
include a large sample size to confirm the effectiveness of PETRA
qMRA.
CONCLUSIONSOur results show that PETRA qMRA provides clear visualization of
intracranial stent flow in the anterior circulation. Additionally, PE-
TRA qMRA was more similar to the occlusion status of DSA than
TOF-MRA. Overall, it appears that PETRA qMRA could be a useful
follow-up technique for patients who have undergone stent-assisted
coil embolization for anterior circulation aneurysms.
ACKNOWLEDGMENTSThe authors thank Kang Soo Kim (Siemens Healthcare, Korea)
for technical advice.
Disclosures: Young Jin Heo—RELATED: Grant: 2018 Inje University research grant.
REFERENCES1. Agid R, Willinsky R, Lee SK, et al. Characterization of aneurysm
remnants after endovascular treatment: contrast-enhanced MR an-giography versus catheter digital subtraction angiography. AJNRAm J Neuroradiol 2008;29:1570 –74 CrossRef Medline
2. Lubicz B, Levivier M, Sadeghi N, et al. Immediate intracranial aneu-rysm occlusion after embolization with detachable coils: a compar-ison between MR angiography and intra-arterial digital subtrac-tion angiography. J Neuroradiol 2007;34:190 –97 CrossRef Medline
3. Kaufmann TJ, Huston J 3rd, Cloft HJ, et al. A prospective trial of 3Tand 1.5T time-of-flight and contrast-enhanced MR angiography inthe follow-up of coiled intracranial aneurysms. AJNR Am J Neuro-radiol 2010;31:912–18 CrossRef Medline
4. Gonner F, Heid O, Remonda L, et al. MR angiography with ultra-short echo time in cerebral aneurysms treated with Guglielmi de-tachable coils. AJNR Am J Neuroradiol 1998;19:1324 –28 Medline
5. Cho WS, Kim SS, Lee SJ, et al. The effectiveness of 3T time-of-flightmagnetic resonance angiography for follow-up evaluations after
FIG 2. A 70-year-old woman with a right paraclinoid internal carotid artery aneurysm who underwent stent-assisted coil embolization using anEnterprise stent. A, The follow-up DSA reveals the neck remnant (arrows). B, The PETRA qMRA reveals minimal signal loss at the stent-insertion-site remnant (arrow), and the neck remnant is clearly visible. C, The TOF-MRA reveals marked signal loss at the stent-insertion-site remnant(arrow) and poor differentiation of the prominent neck remnant relative to PETRA qMRA.
818 Heo May 2019 www.ajnr.org

the stent-assisted coil embolization of cerebral aneurysms. Acta Ra-diol 2014;55:604 –13 CrossRef Medline
6. Irie R, Suzuki M, Yamamoto M, et al. Assessing blood flow in anintracranial stent: a feasibility study of MR angiography using asilent scan after stent-assisted coil embolization for anterior circu-lation aneurysms. AJNR Am J Neuroradiol 2015;36:967–70 CrossRefMedline
7. Takano N, Suzuki M, Irie R, et al. Usefulness of non– contrast-en-hanced MR angiography using a silent scan for follow-up after Y-configuration stent-assisted coil embolization for basilar tip aneu-rysms. AJNR Am J Neuroradiol 2017;38:577– 81 CrossRef Medline
8. Takano N, Suzuki M, Irie R, et al. Non-contrast-enhanced silentscan MR angiography of intracranial anterior circulation aneu-rysms treated with a low-profile visualized intraluminal supportdevice. AJNR Am J Neuroradiol 2017;38:1610 –16 CrossRef Medline
9. Ye J, Luo X, Qu J, et al. Follow-up assessment of coiled intracranialaneurysms using zTE MRA as compared with TOF MRA: a prelim-inary image quality study. Eur Radiol 2017;27:4271– 80 CrossRefMedline
10. Meyer JM, Buecker A, Spuentrup E, et al. Improved in-stent mag-netic resonance angiography with high flip angle excitation. InvestRadiol 2001;36:677– 81 CrossRef Medline
11. Choi JW, Roh HG, Moon WJ, et al. Optimization of MR parametersof 3D TOF-MRA for various intracranial stents at 3.0T MRI. Neu-rointervention 2011;6:71–77 CrossRef Medline
12. Ikushima Y, Hashido T, Watanabe Y, et al. Effects of imaging param-eters on the quality of contrast-enhanced MR angiography of cere-bral aneurysms treated using stent-assisted coiling: a phantomstudy. Magn Reson Med Sci 2017;16:146 –51 CrossRef Medline
13. Grodzki DM, Jakob PM, Heismann B. Ultrashort echo time imagingusing pointwise encoding time reduction with radial acquisition(PETRA). Magn Reson Med 2012;67:510 –18 CrossRef Medline
14. Yutaka Natsuaki RG, Grimm R, Grodzki D, et al. PETRA quiet MRA:improved robustness with 3D elastic cross-registration. In: Pro-ceedings of the Annual Meeting and Exhibition of the International So-ciety for Magnetic Resonance in Medicine, Singapore. May 7– 8, 2016
15. Raymond J, Guilbert F, Weill A, et al. Long-term angiographic re-currences after selective endovascular treatment of aneurysms withdetachable coils. Stroke 2003;34:1398 – 403 CrossRef Medline
16. Landis JR, Koch GG. The measurement of observer agreement forcategorical data. Biometrics 1977;33:159 –74 Medline
17. Santillan A, Greenberg E, Patsalides A, et al. Long-term clinical andangiographic results of Neuroform stent-assisted coil embolization
in wide-necked intracranial aneurysms. Neurosurgery 2012;70:1232–37; discussion 1237 CrossRef Medline
18. Willinsky RA, Taylor SM, terBrugge K, et al. Neurologic complica-tions of cerebral angiography: prospective analysis of 2,899 proce-dures and review of the literature. Radiology 2003;227:522–28CrossRef Medline
19. Gauvrit JY, Leclerc X, Pernodet M, et al. Intracranial aneurysmstreated with Guglielmi detachable coils: usefulness of 6-month im-aging follow-up with contrast-enhanced MR angiography. AJNRAm J Neuroradiol 2005;26:515–21 Medline
20. Gauvrit JY, Leclerc X, Caron S, et al. Intracranial aneurysmstreated with Guglielmi detachable coils: imaging follow-up withcontrast-enhanced MR angiography. Stroke 2006;37:1033–37CrossRef Medline
21. Choi JW, Roh HG, Moon WJ, et al. Time-resolved 3D contrast-enhanced MRA on 3.0T: a non-invasive follow-up technique afterstent-assisted coil embolization of the intracranial aneurysm. Ko-rean J Radiol 2011;12:662–70 CrossRef Medline
22. Schmalbrock P, Yuan C, Chakeres DW, et al. Volume MRangiography: methods to achieve very short echo times. Radiology1990;175:861– 65 CrossRef Medline
23. Robson MD, Gatehouse PD, Bydder M, et al. Magnetic resonance: anintroduction to ultrashort TE (UTE) imaging. J Comput Assist To-mogr 2003;27:825– 46 CrossRef Medline
24. Fiorella D, Albuquerque FC, Woo H, et al. Neuroform in-stentstenosis: incidence, natural history and treatment strategies. Neu-rosurgery 2006;59:34 – 42 CrossRef
25. Holdsworth SJ, Macpherson SJ, Yeom KW, et al. Clinical evaluationof Silent T1-weighted MRI and Silent MR angiography of the brain.AJR Am J Roentgenol 2018;210:404 –11 CrossRef Medline
26. Bartels LW, Bakker CJ, Viergever MA. Improved lumen visualiza-tion in metallic vascular implants by reducing RF artifacts. MagnReson Med 2002;47:171– 80 CrossRef Medline
27. Bartels LW, Smits HF, Bakker CJ, et al. MR imaging of vascularstents: effects of susceptibility, flow, and radiofrequency eddy cur-rents. J Vasc Interv Radiol 2001;12:365–71 CrossRef Medline
28. Lovblad KO, Yilmaz H, Chouiter A, et al. Intracranial aneurysmstenting: follow-up with MR angiography. J Magn Reson Imaging2006;24:418 –22 CrossRef Medline
29. Agid R, Schaaf M, Farb R. CE-MRA for follow-up of aneurysms poststent-assisted coiling. Interv Neuroradiol 2012;18:275– 83 CrossRefMedline
AJNR Am J Neuroradiol 40:815–19 May 2019 www.ajnr.org 819

ORIGINAL RESEARCHINTERVENTIONAL
Treatment of Wide-Neck Intracranial Aneurysms with theWoven EndoBridge Device Associated with Stenting:
A Single-Center ExperienceX F. Cagnazzo, X R. Ahmed, X C. Dargazanli, X P.-H. Lefevre, X G. Gascou, X I. Derraz, X S.A. Kalmanovich, X C. Riquelme,
X A. Bonafe, and X V. Costalat
ABSTRACT
BACKGROUND AND PURPOSE: The intrasaccular flow disruptor, the Woven EndoBridge device, is increasingly used for the treatment ofwide-neck intracranial aneurysms. Due to unfavorable anatomy, additional stent placement is sometimes required to avoid WovenEndoBridge protrusion into bifurcation branches. We report our experience with the Woven EndoBridge associated with stent placementfor the treatment of complex intracranial aneurysms.
MATERIALS AND METHODS: Patients with aneurysms treated with the Woven EndoBridge Single-Layer plus stent placement wereevaluated retrospectively with prospectively maintained data. The technical feasibility, procedural complications, aneurysm occlusion,and clinical outcome were studied.
RESULTS: Seventeen patients and aneurysms treated with the Woven EndoBridge plus stent placement were included. The meananeurysm size was 7 � 3.1 mm. Aneurysm locations were the following: MCA (10 patients), anterior communicating artery (3 patients), basilartip (3 patients), and posterior communicating artery (1 patient). Two lesions were ruptured and treated in the acute phase. The WovenEndoBridge and stent placement were successfully delivered in all cases. There were no permanent/major complications. Among the 2patients with SAH, minor and completely reversible in-stent thrombosis occurred during treatment. An asymptomatic occlusion of theangular artery with a distal nonbifurcation aneurysm was discovered during the angiographic follow-up. Long-term (10.4 months) angio-graphic complete (Raymond-Roy I) and near-complete (Raymond-Roy II) occlusion was obtained in 11 (69%) and 2 (12.5%) aneurysms,respectively. The mean sizes of aneurysms showing Raymond-Roy I/Raymond-Roy II and Raymond-Roy III occlusion were 5.5 � 2.1 mm and10 � 1 mm, respectively (P � .003). The mean fluoroscopy time was 35 � 14 minutes.
CONCLUSIONS: Aneurysm embolization with the Woven EndoBridge device associated with stent placement appears technically fea-sible and effective for the treatment of lesions with unfavorable anatomy. In our study, this strategy was relatively safe with a low rate ofrelevant procedure-related adverse events.
ABBREVIATIONS: AcomA � anterior communicating artery; PcomA � posterior communicating artery; RR � Raymond-Roy; SL � Single-Layer
Despite the increased operator experience and the improve-
ment of available devices, the endovascular treatment of
wide-neck intracranial aneurysms, especially at bifurcation
points, remains challenging. Accordingly, more complex endo-
vascular techniques have been developed such as balloon-assisted
coiling, stent-assisted coiling, and flow diversion.1,2 The intrasa-
ccular flow disruptor, the Woven EndoBridge device (WEB; Se-
quent Medical, Aliso Viejo, California), is now a well-established
option for the treatment of wide-neck bifurcation aneurysms.3-6
However, although the WEB treatment procedure is usually a
single-step technique, additional stent placement can sometimes
be required to prevent the protrusion of the device into the bifur-
cation arteries.7 To date, there are no series specifically evaluating
treatment-related outcomes of the WEB associated with addi-
tional stent placement, to our knowledge. We present a retrospec-
tive series of 17 consecutive aneurysms treated with WEB plus
stent placement at our institution, discussing the safety and effi-
cacy of this treatment strategy.
MATERIALS AND METHODSPatient SelectionOur hospital institutional review board approved this retrospec-
tive study. The prospectively maintained data bases of WEB de-
Received January 3, 2019; accepted after revision March 11.
From the Neuroradiology Department, University Hospital Gui De Chauliac, CentreHospitalier Universitaire de Montpellier, Montpellier, France.
Please address correspondence to Federico Cagnazzo, MD, Neuroradiology De-partment, CHU Gui De Chauliac, 80 Ave Augustin Fliche, 34000 Montpellier,France; e-mail: [email protected]
http://dx.doi.org/10.3174/ajnr.A6032
Indicates article with supplemental on-line tables.
820 Cagnazzo May 2019 www.ajnr.org

vices (from January 2014 to December 2018) at our institution
were retrospectively reviewed by 2 and, in case of inconsis-
tency, by 3 investigators independently to identify patients
with intracranial aneurysms treated with the WEB and requir-
ing additional stent placement to protect the vessel. We in-
cluded aneurysms embolized with the WEB plus a stent in the
same treatment session, excluding lesions in which stent place-
ment was performed in a second treatment. Data collection
included the following: demographics, aneurysm characteris-
tics, clinical presentation, details of the treatment, follow-up
imaging, and clinical outcome. Treatment strategy was decided
by multidisciplinary consensus (vascular neurosurgeons, in-
terventional neuroradiologists). The decision to treat with the
WEB plus stent placement was made on the basis of the follow-
ing situations: 1) planned stent placement: wide-neck lesions
with branching vessels coming from the aneurysm for which
treatment with adjunctive stent placement was planned be-
forehand because of the risk of WEB protrusion into the vessel;
and 2) unplanned stent placement: slow flow or narrowing of
the bifurcation vessel after WEB deployment due to the pro-
trusion of the device into the artery.
Antiplatelet TherapyFor unruptured aneurysms, antiplatelet therapy included daily
dual-antiplatelet medication with aspirin (Kardegic), 75 mg,
and clopidogrel (Plavix), 75 mg, starting 5 days before treat-
ment. The therapy was maintained for
3 months. In general, on the basis of
the clinical and radiologic evaluations, the
patients were switched to aspirin. The
VerifyNow P2Y12 assay (Accumetrics,
San Diego, California) was used to test the
platelet inhibition: Both the P2Y12 and as-
pirin reaction units were tested. When
stents and the WEB were used in patients
with acutely ruptured aneurysms, an in-
travenous bolus of abciximab (0.125 mg/
kg) was administered before stent
deployment, and standard dual-anti-
platelet therapy was started the day af-
ter. Concurrent with the procedure, in
both unruptured and ruptured aneu-
rysms, intravenous heparinization was
performed (activated clotting time
maintained above 250 seconds).
Description of TechniqueAll patients were treated under general
anesthesia via a transfemoral approach.
Access to the target aneurysm was ob-
tained in a triaxial fashion. Through a
long femoral sheath, a 6F guiding cath-
eter was advanced into the carotid ar-
tery. Vessel and aneurysm features
were analyzed via biplane and 3D ro-
tational angiography. Size selection of
the WEB was derived from the mea-
surements of the aneurysm (width and
height of the dome, width of the neck) based on a 3D rotational
angiographic dataset. In general, the device was chosen adding
1 mm to the average width (to assure good wall apposition) and
subtracting 1 mm from the average height of the aneurysm (to
adjust for the longitudinal increase caused by the horizontal
compression).8 An appropriate VIA Microcatheter (Sequent
Medical) was placed inside the aneurysmal fundus followed by
the deployment of the WEB under roadmap guidance.
The stent was selected on the basis of the diameter of the artery
and was unsheathed under roadmap guidance through an appro-
priate microcatheter navigated beyond the aneurysm neck. Im-
mediately postdeployment, VasoCT (Philips Healthcare, Best, the
Netherlands) with diluted iodinated contrast medium was used to
assess both the WEB and stent apposition.
Clinical and Imaging AssessmentClinical evaluation was performed preoperatively, postproce-
dure, throughout the following days, and at discharge. The
modified Rankin Scale was used for outcome assessment. Clin-
ical follow-up evaluation was performed at 3, 6, 12, and 24
months. Usually, the degree of aneurysm occlusion was evalu-
ated with MR angiography or digital subtraction angiography
at 6 months, followed by long-term (12 and 24 months) DSA
follow-up. The aneurysm occlusion rate was defined on the
basis of the Raymond-Roy (RR) classification: complete occlu-
FIG 1. A, Patient 5 with a 6 � 4 mm unruptured AcomA aneurysm. B, A WEB-SL (7 � 3 mm) isopened inside the sac, with good aneurysm wall apposition and without impacting the branchingvessels. However, after deployment, a protrusion occurred in the right A2 segment, leading to astenosis (white arrowhead). C, A laser-cut Neuroform Atlas stent (3 � 20 mm) is then delivered toprotect the caliber of the artery (white arrowhead). D, A final VasoCT confirms the satisfactoryposition and wall apposition of the stent and the WEB. E, Twelve-month DSA follow-up showscomplete occlusion of the aneurysm.
AJNR Am J Neuroradiol 40:820 –26 May 2019 www.ajnr.org 821

sion (class I), residual neck (class II), and incomplete occlusion
or residual aneurysm (class III).9
Statistical AnalysisAll statistical analyses were performed with SPSS, Version 24
(IBM, Armonk, New York). Summary statistics are presented for
all data available using means � SDs for continuous variables and
frequency tabulations for categoric variables.
RESULTSBaseline Population CharacteristicsPopulation characteristics are summarized in On-line Table 1. In
the 4-year period, 102 consecutive patients with unruptured and
ruptured intracranial aneurysms were treated with the WEB. We
extracted 17 patients treated with WEB plus stent placement (12
women, 5 men; mean age, 62 � 8.9 years; range, 39–75 years). The
pretreatment mRS score was 0 for 15 patients (88%), 1 for 1 patient
(6%), and 4 for 1 patient (6%). Overall, 14 patients showed vascular
risk factors: Two patients were hypertensive (14%), 5 patients were
smokers (36%), and 7 patients were hypertensive and smokers
(50%). Two patients were treated in the setting of acute SAH (pa-
tients 4 and 7).
Aneurysm CharacteristicsThe mean size of the aneurysms was 7 � 3.1 mm (range, 3–11
mm). All the aneurysms arose from a bifurcation point or pre-
sented with a branching vessel coming
from the neck. Only 1 patient (patient
13) presented with an aneurysm with a
fusiform aspect arising along the wall
of the angular artery (M3). The most
common location was the MCA (10
patients), followed by the anterior com-
municating artery (AcomA) (3 patients),
basilar tip (3 patients), and posterior com-
municating artery (PcomA) (1 patient).
Fifteen aneurysms were unruptured
(88%), whereas 2 (12%) lesions were
acutely ruptured. Among the unruptured
group, 1 aneurysm (6%) was previously
coiled, and WEB plus stent placement was
used because of recanalization after coiling
(patient 17).
Treatment Characteristics andTechnical ResultsThe Single-Layer (SL) WEB device was
used in all the reported cases (On-line
Table 2). Stent placement was per-
formed with the Neuroform Atlas
(Stryker Neurovascular, Kalamazoo,
Michigan) in 14 cases (illustrative case in
Fig 1) and with the LEO baby stent (Balt
Extrusion, Montmorency, France) in 2
cases. One case of a large unruptured
PcomA aneurysm was treated with the
WEB plus the Pipeline Embolization
Device (PED; Covidien, Irvine, Califor-
nia) (patient 6 and Fig 2). Among 10 patients (58%), stent and WEB
were planned before the treatment. A single stent was used in all
except 2 cases (patients 3 and 17 treated with Y-stent placement)
(illustrative case in Fig 3). In all cases, the WEB and stent were suc-
cessfully navigated to the target area and deployed inside the sac and
across the aneurysm neck, respectively. The mean intervention time
was 78 � 19 minutes (range, 50–105 minutes). The mean fluoros-
copy time was 35 � 14 minutes (range, 17–70 minutes).
Clinical Outcome and Procedure-Related ComplicationsTreatment-related complications and clinical outcomes are sum-
marized in On-line Table 2. There were no permanent complica-
tions. Overall, 2 patients showed mild intraprocedural in-stent
thrombosis completely reversible after abciximab injection (0.125
mg/kg). In these 2 cases, stent placement was performed in the
setting of acute SAH: The bifurcation vessel presented slow flow
due to a mild WEB protrusion, and the stent was placed to protect
the branch (patients 4 and 7). During follow-up, patient 13, with
a distal nonbifurcation MCA aneurysm, presented with a com-
pletely asymptomatic occlusion of the vessel after 12 months of
DSA follow-up (Fig 4).
The mean fluoroscopy time among patients reporting intrapro-
cedural ischemic events versus patients without intraprocedural
complications was 51.5 � 18.5 minutes versus 33 � 3.1 minutes,
respectively (P � .08), whereas the mean intervention time was
FIG 2. A, Right ICA angiography depicting a 9 � 10 mm PcomA unruptured aneurysm. A fetalvariant of the PcomA arises from the aneurysm (red arrows). B, A WEB-SL (10 � 5 mm) wasdelivered inside the sac, intentionally undersized with respect to the origin of the fetal PcomA.Subsequently, a PED, 3.5 � 18 mm, was implanted from the right ICA to the right M1, covering theaneurysm neck, the PcomA, and the right A1. C, Flat panel CT reconstruction shows successfulWEB and flow-diverter implantation and correct vessel wall apposition. D, Fifteen-month DSAfollow-up shows complete occlusion of the aneurysm and the narrowing of the covered right A1(white arrowheads).
822 Cagnazzo May 2019 www.ajnr.org

100 � 0 minutes and 76 � 18.5 minutes, respectively (P � .09).
During long-term clinical follow-up (mean clinical follow-up, 11
months; range, 6–36 months), there were no modifications of the
mRS related to the treatment. Overall, 14 patients presented with
mRS 0, one patient presented with mRS 1, one patient (with a previ-
ous SAH from another aneurysm) presented with mRS 4, and 1 pa-
tient died due to the complications of the SAH.
Angiographic Outcome of AneurysmsThe mean radiologic follow-up was 10.4 months (range, 6–36
months) (On-line Table 2). Immediate complete occlusion (Ray-
mond-Roy [RR] I) after treatment was achieved in 6 aneurysms
(35%); 1 aneurysm (6%) showed a neck remnant (RR II), whereas 10
aneurysms (59%) were incompletely occluded (RR III). Sixteen pa-
tients were available for long-term angiographic follow-up. Overall,
11 (69%) aneurysms were completely occluded, 2 lesions presented
with neck remnants (12.5%), and 3 aneurysms (18.5%) showed in-
complete occlusion and were retreated with Y-stent-assisted coiling.
The mean sizes of aneurysms with occlusion RR I/RR II and RR
III were 5.5 � 2.1 mm (range, 3–9 mm) and 10 � 1 mm (range, 9–11
mm), respectively (P� .003). Immediately after treatment, 90% (9 of
10) of aneurysms showing RR III occlusion presented with contrast
agent stagnation inside the sac. Of them, 77% (7 of 9) progressed to
RR I/II occlusion during follow-up. There were no cases of aneurysm
rupture during long-term follow-up. Three cases of asymptomatic
mild stent stenosis (�50%) were observed
and were related to in-stent intimal hyper-
plasia. In case of mild stent stenosis, aspi-
rin was usually prolonged until the next
radiologic follow-up.
DISCUSSIONThe safety and efficacy of the WEB de-
vice for the treatment of wide-neck in-
tracranial aneurysms, particularly for
lesions challenging to treat with stan-
dard coiling, have been reported in
several studies.5,6,10,11 However, treat-
ment-related outcomes after intrasac-
cular flow-disruption with the WEB
used with stents were not evaluated.
We report the first series of a “stent-
assisted WEB” used for the treatment
of intracranial aneurysms in different
locations.
Technical and AngiographicOutcomesThe WEB and the stent were successfully
deployed inside the aneurysm and the
artery in all cases, highlighting the feasi-
bility of this technique. Consistent with
the literature of WEB devices,5,10 initial
complete/near-complete occlusion im-
mediately after WEB and stent deploy-
ment was obtained in 41% of patients,
whereas long-term adequate occlusion
(RR I/RR II) was 81%. These results ap-
pear quite comparable with the angiographic outcome of other
endovascular treatment modalities. In a meta-analysis of nearly
1900 aneurysms treated with stent-assisted coiling, the rates of
immediate and long-term complete/near-complete occlusion
were 54% and 73%, respectively.12 However, in our study, 3 an-
eurysms (18%) were incompletely occluded at follow-up and re-
quired retreatment with Y-stent-assisted coiling. Although the
rate of retreatment was quite high, all of these were large aneu-
rysms located at the basilar tip (On-line Tables 1 and 2). In a
recent series of 79 endovascularly treated basilar tip aneurysms,
the rate of incomplete occlusion was close to 40%, and large
aneurysm size was reported as an independent risk factor for
incomplete occlusion.13 Similarly, Abecassis et al14 reported a
retreatment rate close to 40% among basilar tip aneurysms
treated with endovascular techniques. Accordingly, in our ex-
perience, the stent-assisted WEB technique was associated with
good angiographic results, except for large aneurysms of the
basilar tip, where the bifurcation configuration and the hemo-
dynamic forces may play an important role in the aneurysm
recanalization.15
Among the published series of the WEB, the rate of treatment
with the WEB and additional stent placement ranged between
5%6 and 18%.7,16 In general, the stents were implanted due to a
suboptimal placement of the WEB inside the sac with a protrusion
FIG 3. A, Patient 3 with a left large (14 � 7 mm) unruptured aneurysm originating from the MCAbifurcation and another small unruptured aneurysm of the AcomA (white arrowhead). B, TheMCA aneurysm, initially treated with a WEB-SL (9 � 6 mm), presents with a large recanalization(red arrowhead) due to WEB compaction. C, VasoCT shows the retreatment with a secondWEB-SL (9 � 6 mm) associated with 2 Y-configurated LEO baby stents (2 � 18 mm) deployed fromthe M1 to the superior and inferior M2 branches (small white arrows). The first WEB appearscompacted (small red arrow). D, Thirty-six-month DSA follow-up shows complete occlusion ofthe aneurysm. Both M2 branches are normal in caliber. The small AcomA aneurysm was coiled inanother treatment session (white arrowhead).
AJNR Am J Neuroradiol 40:820 –26 May 2019 www.ajnr.org 823
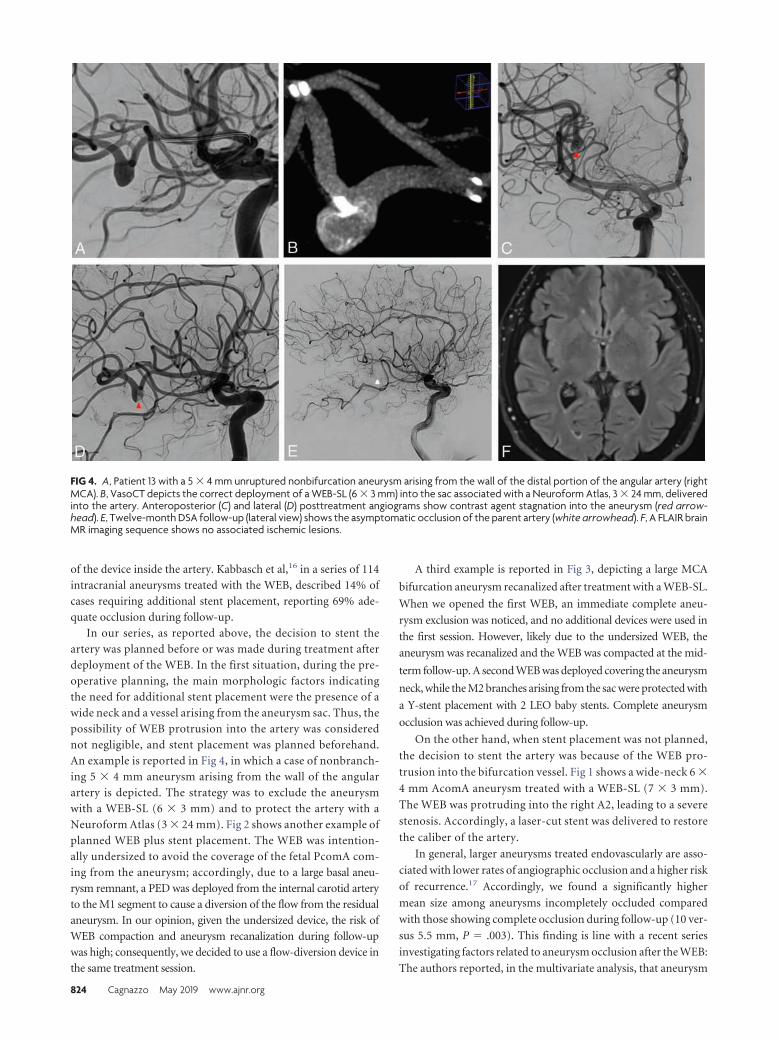
of the device inside the artery. Kabbasch et al,16 in a series of 114
intracranial aneurysms treated with the WEB, described 14% of
cases requiring additional stent placement, reporting 69% ade-
quate occlusion during follow-up.
In our series, as reported above, the decision to stent the
artery was planned before or was made during treatment after
deployment of the WEB. In the first situation, during the pre-
operative planning, the main morphologic factors indicating
the need for additional stent placement were the presence of a
wide neck and a vessel arising from the aneurysm sac. Thus, the
possibility of WEB protrusion into the artery was considered
not negligible, and stent placement was planned beforehand.
An example is reported in Fig 4, in which a case of nonbranch-
ing 5 � 4 mm aneurysm arising from the wall of the angular
artery is depicted. The strategy was to exclude the aneurysm
with a WEB-SL (6 � 3 mm) and to protect the artery with a
Neuroform Atlas (3 � 24 mm). Fig 2 shows another example of
planned WEB plus stent placement. The WEB was intention-
ally undersized to avoid the coverage of the fetal PcomA com-
ing from the aneurysm; accordingly, due to a large basal aneu-
rysm remnant, a PED was deployed from the internal carotid artery
to the M1 segment to cause a diversion of the flow from the residual
aneurysm. In our opinion, given the undersized device, the risk of
WEB compaction and aneurysm recanalization during follow-up
was high; consequently, we decided to use a flow-diversion device in
the same treatment session.
A third example is reported in Fig 3, depicting a large MCA
bifurcation aneurysm recanalized after treatment with a WEB-SL.
When we opened the first WEB, an immediate complete aneu-
rysm exclusion was noticed, and no additional devices were used in
the first session. However, likely due to the undersized WEB, the
aneurysm was recanalized and the WEB was compacted at the mid-
term follow-up. A second WEB was deployed covering the aneurysm
neck, while the M2 branches arising from the sac were protected with
a Y-stent placement with 2 LEO baby stents. Complete aneurysm
occlusion was achieved during follow-up.
On the other hand, when stent placement was not planned,
the decision to stent the artery was because of the WEB pro-
trusion into the bifurcation vessel. Fig 1 shows a wide-neck 6 �
4 mm AcomA aneurysm treated with a WEB-SL (7 � 3 mm).
The WEB was protruding into the right A2, leading to a severe
stenosis. Accordingly, a laser-cut stent was delivered to restore
the caliber of the artery.
In general, larger aneurysms treated endovascularly are asso-
ciated with lower rates of angiographic occlusion and a higher risk
of recurrence.17 Accordingly, we found a significantly higher
mean size among aneurysms incompletely occluded compared
with those showing complete occlusion during follow-up (10 ver-
sus 5.5 mm, P � .003). This finding is line with a recent series
investigating factors related to aneurysm occlusion after the WEB:
The authors reported, in the multivariate analysis, that aneurysm
FIG 4. A, Patient 13 with a 5 � 4 mm unruptured nonbifurcation aneurysm arising from the wall of the distal portion of the angular artery (rightMCA). B, VasoCT depicts the correct deployment of a WEB-SL (6 � 3 mm) into the sac associated with a Neuroform Atlas, 3 � 24 mm, deliveredinto the artery. Anteroposterior (C) and lateral (D) posttreatment angiograms show contrast agent stagnation into the aneurysm (red arrow-head). E, Twelve-month DSA follow-up (lateral view) shows the asymptomatic occlusion of the parent artery (white arrowhead). F, A FLAIR brainMR imaging sequence shows no associated ischemic lesions.
824 Cagnazzo May 2019 www.ajnr.org

size (OR � 1.2; 95% CI, 1.01–1.38; P � .034) was an independent
morphologic risk factor for aneurysm remnants.16
Treatment-Related ComplicationsA recent large series and meta-analysis of the WEB for the
treatment of intracranial aneurysms showed variable rates of
treatment-related morbidity (between 2% and 10%).5,10 In our
series, there were no permanent events or major neurologic
complications. We describe 2 cases (patients 4 and 7) of intrap-
rocedural complications after stent placement during acute
SAH: A mild in-stent thrombosis was reported after stent de-
ployment and was completely resolved after abciximab injec-
tion. During follow-up, only 1 patient (patient 13) had an
asymptomatic parent vessel occlusion (angular artery) that was
discovered during the angiographic long-term follow-up. It is
likely that the artery was moderately stenosed by the WEB, and
due to the collateral circulation, it became occluded without
radiologic (the FLAIR findings were negative) and clinical se-
qualae (Fig 4).
Treatment with the WEB is, in general, a straightforward
strategy, and this is mainly reflected by the brevity of the total
fluoroscopic time reported in the literature. Fiorella et al3 in
the WEB Intra-saccular Therapy Study (WEB-IT) reported a
mean fluoroscopy time of 30 � 15.7 minutes. Similarly, in a
recent series of ruptured aneurysms treated with the WEB, the
mean fluoroscopy time was 24 minutes (range, 8 – 40 min-
utes).18 It has been reported that longer intervention time
(�120 minutes) is a risk factor associated with ischemic events
after endovascular treatment of intracranial aneurysms.19 In
our series, although some aneurysms required more complex
treatment such as Y-stent placement plus a WEB, the mean
intervention and fluoroscopy times were relatively low (78 and
35 minutes, respectively). Consistent with the literature,
among patients reporting intraprocedural ischemic events, the
mean fluoroscopy (51.5 versus 33 minutes) and intervention
(100 versus 76 minutes) times were higher compared with
those without complications.
Limitations of the StudyOur study has limitations intrinsic to single-center series. The
number of patients is relatively small, though it is the first larger
series investigating WEB-plus-stent placement. The data, though
prospectively collected, were analyzed retrospectively. In addi-
tion, the imaging outcome was assessed by operators and not
independently. There was a lack of standardization of radiologic
follow-up.
CONCLUSIONSAneurysm embolization with WEB devices in association with
stent placement appears both technically feasible and effective for
the treatment of lesions with unfavorable anatomy, allowing high
rates of long-term occlusion. In our study, this strategy was rela-
tively safe with a low rate of relevant procedure-related adverse
events.
Disclosures: Pierre-Henri Lefevre—UNRELATED: Payment for Development of Edu-cational Presentations: Medtronic. Alain Bonafe—UNRELATED: Consultancy:Stryker Neurovascular, MicroVention. Vincent Costalat—UNRELATED: Consul-
tancy: Medtronic, Stryker Neurovascular, Balt Extrusion, MicroVention; Grants/Grants Pending: Medtronic, Balt Extrusion*; Payment for Development of Educa-tional Presentations: Medtronic, Balt Extrusion, Stryker Neurovascular. *Money paidto the institution.
REFERENCES1. Shapiro M, Becske T, Sahlein D, et al. Stent-supported aneurysm
coiling: a literature survey of treatment and follow-up. AJNR Am JNeuroradiol 2012;33:159 – 63 CrossRef Medline
2. Pierot L, Cognard C, Spelle L, et al. Safety and efficacy of balloonremodeling technique during endovascular treatment of intracra-nial aneurysms: critical review of the literature. AJNR Am J Neuro-radiol 2012;33:12–15 CrossRef Medline
3. Fiorella D, Molyneux A, Coon A, et al; WEB-IT Study Investigators.Demographic, procedural and 30-day safety results from the WEBIntra-saccular Therapy Study (WEB-IT). J Neurointerv Surg 2017;9:1191–96 CrossRef Medline
4. Tau N, Sadeh-Gonik U, Aulagner G, et al. The Woven EndoBridge(WEB) for endovascular therapy of intracranial aneurysms: updateof a systematic review with meta-analysis. Clin Neurol Neurosurg2018;166:110 –15 CrossRef Medline
5. Pierot L, Gubucz I, Buhk JH, et al. Safety and efficacy of aneurysmtreatment with the WEB: results of the WEBCAST 2 study. AJNRAm J Neuroradiol 2017;38:1151–55 CrossRef Medline
6. Caroff J, Mihalea C, Klisch J, et al. Single-layer WEBs: intrasaccularflow disrupters for aneurysm treatment—feasibility results from a Eu-ropean study. AJNR Am J Neuroradiol 2015;36:1942–46 CrossRefMedline
7. Kabbasch C, Mpotsaris A, Reiner M, et al. WEB as part of a multimo-dality treatment in complex, large, and partially thrombosed intracra-nial aneurysms: a single-center observational study of technical suc-cess, safety, and recurrence. JNeurointervSurg2016;8:1235–39CrossRefMedline
8. Lescher S, du Mesnil de Rochemont R, Berkefeld J. Woven Endo-bridge (WEB) device for endovascular treatment of complex un-ruptured aneurysms-a single center experience. Neuroradiology2016;58:383–90 CrossRef Medline
9. Roy D, Milot G, Raymond J. Endovascular treatment of unrupturedaneurysms. Stroke 2001;32:1998 –2004 CrossRef Medline
10. Asnafi S, Rouchaud A, Pierot L, et al. Efficacy and safety of the Wo-ven EndoBridge (WEB) device for the treatment of intracranialaneurysms: a systematic review and meta-analysis. AJNR Am J Neu-roradiol 2016;37:2287–92 CrossRef Medline
11. van Rooij SB, van Rooij WJ, Peluso JP, et al. WEB treatment ofruptured intracranial aneurysms: a single-center cohort of 100patients. AJNR Am J Neuroradiol 2017;38:2282– 87 CrossRefMedline
12. Zhao B, Yin R, Lanzino G, et al. Endovascular coiling of wide-neckand wide-neck bifurcation aneurysms: a systematic review andmeta-analysis. AJNR Am J Neuroradiol 2016;37:1700 – 05CrossRef Medline
13. Ge H, Lv X, Jin H, et al. The role of endovascular treatment in un-ruptured basilar tip aneurysms. Interv Neuroradiol 2017;23:8 –13CrossRef Medline
14. Abecassis IJ, Sen RD, Barber J, et al. Predictors of recurrence, pro-gression, and retreatment in basilar tip aneurysms: a location-con-trolled analysis. Oper Neurosurg (Hagerstown) 2019;16:435– 44CrossRef Medline
15. Sugiyama S, Niizuma K, Sato K, et al. Blood flow into basilar tipaneurysms: a predictor for recanalization after coil embolization.Stroke 2016;47:2541– 47 CrossRef Medline
16. Kabbasch C, Goertz L, Siebert E, et al. Factors that determine aneu-rysm occlusion after embolization with the Woven EndoBridge(WEB). J Neurointerv Surg 2018 Oct 24. [Epub ahead of print]CrossRef Medline
AJNR Am J Neuroradiol 40:820 –26 May 2019 www.ajnr.org 825

17. Cagnazzo F, Mantilla D, Rouchaud A, et al. Endovascular treatmentof very large and giant intracranial aneurysms: comparison be-tween reconstructive and deconstructive techniques—a meta-anal-ysis. AJNR Am J Neuroradiol 2018;39:852–58 CrossRef Medline
18. Da Ros V, Bozzi A, Comelli C, et al. Ruptured intracranial aneu-rysms treated with Woven EndoBridge intrasaccular flow
disruptor: a multicenter experience. World Neurosurg 2019;122:e498 –505 CrossRef Medline
19. Hahnemann ML, Ringelstein A, Sandalcioglu IE, et al. Silent embolismafter stent-assisted coiling of cerebral aneurysms: diffusion-weightedMRI study of 75 cases. J Neurointerv Surg 2014;6:461–65 CrossRefMedline
826 Cagnazzo May 2019 www.ajnr.org
ORIGINAL RESEARCHINTERVENTIONAL
Image Quality of Low-Dose Cerebral Angiography andEffectiveness of Clinical Implementation on Diagnostic and
Neurointerventional Procedures for Intracranial AneurysmsX J. Choi, X B. Kim, X Y. Choi, X N.Y. Shin, X J. Jang, X H.S. Choi, X S.L. Jung, and X K.J. Ahn
ABSTRACT
BACKGROUND AND PURPOSE: Awareness of the potential for exposure to high doses of radiation from interventional radiologicprocedures has increased. The purpose of this study was to evaluate image quality and dose reduction of low-dose cerebral angiographyduring diagnostic and therapeutic procedures for intracranial aneurysms.
MATERIALS AND METHODS: A retrospective review of 1137 prospectively collected patients between January 2012 and June 2014 wasperformed. Beginning in April 2013, a dose-reduction strategy was implemented. Subjective image-quality assessment of 506 standard and540 low-dose cerebral angiography images was performed by 2 neuroradiologists using a 5-point scale and was tested using noninferioritystatistics. Radiation dose-area product and air kerma of 1046 diagnostic and 317 therapeutic procedures for intracranial aneurysms wereanalyzed and compared between groups before (group 1) and after (group 2) clinical implementation of a dose-reduction strategy.
RESULTS: The image quality of the low-dose cerebral angiography was not inferior on the basis of results from the 2 readers. Fordiagnostic cerebral angiography, the mean dose-area product and air kerma were 140.8 Gy�cm2 and 1.0 Gy, respectively, in group 1 and 82.0Gy�cm2 and 0.6 Gy in group 2 (P � .001, P � .001). For the neurointerventional procedure, the mean dose-area product and air kerma were246.0 Gy�cm2 and 3.7 Gy, respectively, in group 1 and 169.8 Gy�cm2 and 3.3 Gy in group 2 (P � .001, P � .291).
CONCLUSIONS: With low-dose cerebral angiography, image quality was maintained, and implementation of dose-reduction strategiesreduced radiation doses in patients undergoing diagnostic and neurointerventional procedures for intracranial aneurysms.
ABBREVIATIONS: AK � air kerma; DAP � dose-area product
Although CT and MR angiography are performed frequently
to diagnose cerebrovascular diseases, cerebral angiography is
still the criterion standard for the evaluation of the vasculature in
cerebrovascular disease, especially when therapeutic procedures
are anticipated. The potential for high radiation doses from inter-
ventional radiologic procedures is well-known; thus, such proce-
dures should only be performed with adequate justification.1,2
The adverse health effects of radiation exposure can be divided
into 2 categories: deterministic effects and stochastic effects. Skin
dose is related to deterministic effects such as skin erythema, ne-
crosis, ulceration, cataract, and permanent epilation.1,3 Although
direct measurement of the skin radiation dose using thermolumi-
nescent dosimeters is the most accurate, it is not practical because
it is a cumbersome procedure with limitations.4,5 Dose-area
product (DAP) and air kerma (AK) are alternative indirect mea-
surements of a patient dose and are the most convenient and
currently most widely used parameters for monitoring it.4,6-10
With increased awareness of the need for reduction of the
radiation dose during cerebral angiography, many techniques and
strategies have reduced unnecessary radiation doses while main-
taining image quality needed to perform procedures.7-12 At Seoul
St. Mary’s Hospital, we have recorded radiation parameters for
each procedure since 2009, and our early experience has shown
that the proportion of the radiation dose in terms of DAP from
angiographic acquisitions was 88.6% for diagnostic cerebral an-
giography and 49.5% for neurointerventional procedures.6 Thus,
low-dose angiography provides good image quality and may be an
effective way to reduce the radiation dose to patients undergoing
diagnostic or neurointerventional procedures. Although there
have been several reports showing the effectiveness of low-dose
cerebral angiography, little work has been done to study the ap-
Received November 22, 2018; accepted after revision February 27, 2019.
From the Department of Radiology (J.C.), St. Vincent’s Hospital, College of Medi-cine, The Catholic University of Korea, Gyeonggi-do, Republic of Korea; and De-partment of Radiology (B.K., Y.C., N.Y.S., J.J., H.S.C., S.L.J., K.J.A.), Seoul St. Mary’sHospital, College of Medicine, The Catholic University of Korea, Seoul, Republic ofKorea.
Please address correspondence to Bum-soo Kim, MD, Department of Radiology,Seoul St. Mary’s Hospital, The Catholic University of Korea, 505, Banpo-dong,Seocho-gu, Seoul, 133–701, Korea; e-mail: [email protected]
http://dx.doi.org/10.3174/ajnr.A6029
AJNR Am J Neuroradiol 40:827–33 May 2019 www.ajnr.org 827

plication and its effectiveness in a clinical setting with a large vol-
ume of patients.8,9,13-15
Since April 2013, our clinic has implemented the following
new dose-reduction strategy: 1) low-dose angiographic protocol
(from 3.6 �Gy/frame to 1.8 �Gy/frame) for cerebral angiography,
and 2) a roadmap image saved for evaluation of the femoral arte-
rial puncture site, instead of femoral angiography. The purpose of
this study was to evaluate image quality of low-dose cerebral an-
giography and the effectiveness of the clinical implementation of
our dose-reduction strategies in diagnostic and neurointerven-
tional procedures for intracranial aneurysms.
MATERIALS AND METHODSThis study was approved by Seoul St. Mary’s Hospital institu-
tional review board. A waiver of the need for consent was obtained
for this Health Insurance Portability and Accountability Act–
compliant retrospective study. Retrospective review of the pro-
spectively collected data base of 1137 patients (799 females, 338
males; median age, 56 years; range, 13– 88 years) between January
2012 and June 2014 was performed. All procedures were per-
formed by a team of 2 experienced neurointerventionalists. A
clinical fellow with �300 previous cases performed the diagnostic
angiographic procedures, while embolizations were performed by
a radiologist with �20 years of experience in aneurysm emboli-
zation. Diagnostic procedures performed for follow-up after clip-
ping of an aneurysm were excluded. There were, in total, 1046
diagnostic and 317 therapeutic procedures.
The angiographic system used was a biplane angiographic unit
(Axiom Artis dBA; Siemens, Erlangen, Germany) with a flat panel
detector: A and B planes (48 cm) with variable FOVs of 42 to
32–22 to 16 cm. The total filtration was 2.5 mm Al. The angiog-
raphy unit had 3 pulsed fluoroscopy modes of 10, 15, and 30 P/s,
of which 15 P/s was used most frequently with variable copper
filtration of up to 0.9 mm. The system had a DAP meter, including
a verification of the AK and DAP displayed values against an ex-
ternal dosimeter during the quality-assurance process at least
once a year.
Since April 2013, our institution has applied the following
dose-reduction strategy: 1) low-dose angiographic protocol
(from 3.6 �Gy/frame to 1.8 �Gy/frame) for cerebral angiography,
and 2) a roadmap image saved for evaluation of the femoral artery
puncture site, instead of femoral angiography. Angiographic pro-
cedures were the same as those used in a previous protocol,
including acquisition of internal carotid and vertebral arteriogra-
phies in anteroposterior and lateral views, and rotational angiog-
FIG 1. Image quality of angiography by 2 separate readers before (Phase 1) and after (Phase 2) the low-dose angiographic protocol.
Table 1: Mean image quality of angiography by 2 separate readersbefore and after the low-dose angiographic protocol
Reader 1 Reader 2Phase 1 4.94 � 0.32 4.91 � 0.33Phase 2 4.95 � 0.32 4.94 � 0.23
828 Choi May 2019 www.ajnr.org

raphy was performed using 5-second dual runs with 0.36 �Gy/
frame when an intracranial aneurysm was suspected on 2D
cerebral angiography.6
Two experienced neuroradiologists with �15 years of experi-
ence evaluated the quality of the images, which had been arranged
in a random order. They reviewed all DSA series, and they were
blinded to the examination date to avoid knowing the dose cate-
gory. They analyzed the image quality on a scale of 5, with the
higher number indicating better image quality: 1 (nondiagnos-
tic), 2 (poor: compromised large and small vessel visualization), 3
(average: diagnostic value for large vessel but compromised
small vessel visualization), 4 (good: excellent large vessel and
minimal compromise of small vessel visualization), 5 (very
good: excellent large and small vessel visualization).
The parameters measured were
DAP, AK, fluoroscopy exposure time,
and the number of angiographic image
acquisitions for all procedures. Image
quality was also obtained for 1046 diag-
nostic procedures (506 procedures be-
fore the low-dose protocol and 540 pro-
cedures after the low-dose protocol).
A noninferiority test was used for the
image quality of diagnostic procedures
before and after dose reduction, and in-
terrater reliability was tested using the
Cronbach �. The difference in parame-
ters before and after the dose-reduction
protocol was tested with a Student t test.
SPSS (IBM, Armonk, New York) was
used for statistical analysis. Statistical
significance was defined as P � .05.
RESULTSThe subjective data for the quality of im-
ages before and after the low-dose pro-
tocol by 2 radiologists are presented in
Table 1 and Fig 1. The image-quality
score was well-correlated between the 2
observers (Cronbach � � 0.853). The
diagnostic noninferiority of the angiography with 1.8 �Gy/frame
was demonstrated using the noninferiority test because the upper
margin of the 1-sided 97.5% confidence interval did not cross the
predefined noninferiority margin of �0.2. Figure 2 shows repre-
sentative examples of the 2 cohorts.
The quantitative data are shown in Table 2 and Fig 3. Before
application of the low-dose angiographic protocol (Phase 1),
mean fluoroscopic time, total mean DAP, total AK, and total
angiographic image frames were 13.0 � 7.9 minutes, 140.8 �
48.1 Gy�cm2, 1.02 � 0.42 Gy, and 251.2 � 72 frames for
diagnostic procedures, respectively, and 53.5 � 34.1 minutes,
246.0 � 148.3 Gy�cm2, 3.67 � 2.66 Gy, and 287.6 � 150
frames for therapeutic procedures. The third quartiles, which
may be used as a dose reference level, were 14.4 and 64.5 min-
utes for fluoroscopy times, 160.8 and 301.4 Gy�cm2 for DAP,
1.18 and 4.42 Gy for AK, and 273 and 341 image frames in
diagnostic and therapeutic procedures, respectively. After ap-
plication of the low-dose angiographic protocol (Phase 2),
mean fluoroscopic time, total mean DAP, total AK, and total
angiographic image frames were 11.9 � 6.9 minutes, 82.0 �
30.0 Gy�cm2, 0.61 � 0.33 Gy, and 222.6 � 52 frames for
diagnostic procedures, respectively, and 49.1 � 32.2 minutes,
169.8 � 111.6 Gy�cm2, 3.31 � 3.21 Gy, and 260.2 � 128
frames for therapeutic procedures. The third quartiles, which
may be used as a dose reference level, were 13.8 and 60.0 min-
utes for fluoroscopy times, 94.1 and 206.2 Gy�cm2 for DAP,
0.69 and 4.24 Gy for AK, and 246 and 334 image frames in
diagnostic and therapeutic procedures, respectively. There was
a significant difference between the mean parameters of fluo-
roscopic time (P � .012), DAP (P � .001), AK (P � .001), and
image frames (�0.001) before and after dose reduction for
FIG 2. Representative examples of angiographic images before (A) and after (B) the low-doseangiographic protocol. These are cerebral angiograms of a patient who underwent diagnosticangiography to determine the cause of perimesencephalic subarachnoid hemorrhage.
Table 2: Mean and third quartile results for fluoroscopic time,DAP, AK, and image frames for diagnostic and therapeuticprocedures before and after the low-dose angiographic protocol
FluoroscopicTime (min)
DAP(Gy×cm2) AK (Gy)
ImageFrames
DiagnosticPhase 1
Mean 13.0 � 7.9 140.8 � 48.1 1.02 � 0.42 251.2 � 723rd quartile 14.4 160.8 1.18 273
Phase 2Mean 11.9 � 6.9 82.0 � 30.0 0.61 � 0.33 222.6 � 523rd quartile 13.8 94.1 0.69 246P value .012 �.001 �.001 �.001
TherapeuticPhase 1
Mean 53.5 � 34.1 246.0 � 148.3 3.67 � 2.66 287.6 � 1503rd quartile 64.5 301.4 4.42 341
Phase 2Mean 49.1 � 32.2 169.8 � 111.6 3.31 � 3.21 260.2 � 1283rd quartile 60.0 206.2 4.24 334P value .237 �.001 .291 .080
AJNR Am J Neuroradiol 40:827–33 May 2019 www.ajnr.org 829
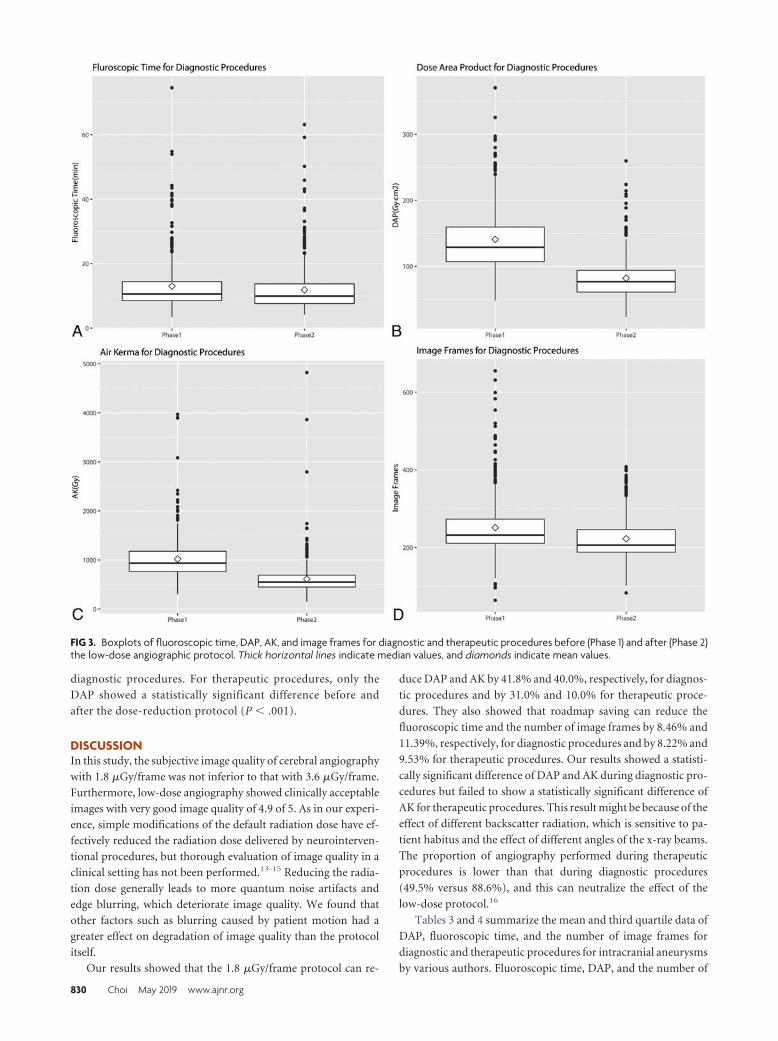
diagnostic procedures. For therapeutic procedures, only the
DAP showed a statistically significant difference before and
after the dose-reduction protocol (P � .001).
DISCUSSIONIn this study, the subjective image quality of cerebral angiography
with 1.8 �Gy/frame was not inferior to that with 3.6 �Gy/frame.
Furthermore, low-dose angiography showed clinically acceptable
images with very good image quality of 4.9 of 5. As in our experi-
ence, simple modifications of the default radiation dose have ef-
fectively reduced the radiation dose delivered by neurointerven-
tional procedures, but thorough evaluation of image quality in a
clinical setting has not been performed.13-15 Reducing the radia-
tion dose generally leads to more quantum noise artifacts and
edge blurring, which deteriorate image quality. We found that
other factors such as blurring caused by patient motion had a
greater effect on degradation of image quality than the protocol
itself.
Our results showed that the 1.8 �Gy/frame protocol can re-
duce DAP and AK by 41.8% and 40.0%, respectively, for diagnos-
tic procedures and by 31.0% and 10.0% for therapeutic proce-
dures. They also showed that roadmap saving can reduce the
fluoroscopic time and the number of image frames by 8.46% and
11.39%, respectively, for diagnostic procedures and by 8.22% and
9.53% for therapeutic procedures. Our results showed a statisti-
cally significant difference of DAP and AK during diagnostic pro-
cedures but failed to show a statistically significant difference of
AK for therapeutic procedures. This result might be because of the
effect of different backscatter radiation, which is sensitive to pa-
tient habitus and the effect of different angles of the x-ray beams.
The proportion of angiography performed during therapeutic
procedures is lower than that during diagnostic procedures
(49.5% versus 88.6%), and this can neutralize the effect of the
low-dose protocol.16
Tables 3 and 4 summarize the mean and third quartile data of
DAP, fluoroscopic time, and the number of image frames for
diagnostic and therapeutic procedures for intracranial aneurysms
by various authors. Fluoroscopic time, DAP, and the number of
FIG 3. Boxplots of fluoroscopic time, DAP, AK, and image frames for diagnostic and therapeutic procedures before (Phase 1) and after (Phase 2)the low-dose angiographic protocol. Thick horizontal lines indicate median values, and diamonds indicate mean values.
830 Choi May 2019 www.ajnr.org

image frames before the low-dose protocol of this study are sim-
ilar to those from the previous results, except for the report of
Hassan and Amelot,17 in which the most recent angiographic sys-
tem was used.6,18-21 Our study is especially meaningful in that
dose reduction was achieved without purchasing a new angio-
graphic system with sophisticated functions.
We evaluated the DAP instead of the entrance skin dose in our
study. The DAP is the absorbed radiation dose multiplied by the
size of the area irradiated.22 This value can be used to monitor
radiation exposure levels and is readily available because it can be
easily measured using an ionization chamber in fluoroscopic and
angiographic units, and the effective dose can be calculated from
it using conversion factors.22 Even though the precise prediction
of the skin dose using DAP is difficult because x-ray beams enter
FIG 3. Continued.
Table 3: Summary of mean and third quartile data of DAP, fluoroscopic time, and number of image frames acquired during diagnosticcerebral angiography for intracranial aneurysms
Reference No. of Patients
DAP (Gy×cm2)FluoroscopyTime (min) No. of Frames
Mean 3rd Quartile Mean 3rd Quartile Mean 3rd QuartilePhase 1 506 140.8 160.8 13.0 14.4 251.2 273Phase 2 540 82.0 94.1 11.9 13.8 222.6 246Hassan and Amelot17 398 43.1 59.7 5.6 7.5 245 314Chun et al6 439 136.6 154.2 12.6 14.0 251 273D’Ercole et al18 100 142.1 180 9.9 12.3 220 317Aroua et al19 91 121 125 12.6 15 679 480Verdun et al20 91 107 124Brambilla et al21 188 158 198 13.7 17.5
AJNR Am J Neuroradiol 40:827–33 May 2019 www.ajnr.org 831

the patient in many directions, there is a good correlation between
skin dose and DAP.5 Thus, DAP can be used to set the action level
of radiation that indicates skin exposures necessitating medical
follow-up for possible radiation injuries and to refine the nation-
wide reference level as well.16,23
The reduction in the number of image frames in our study was
largely due to the use of roadmap saving instead of angiography
for femoral arteries. Greater reduction of the radiation dose by
reducing the number of frames can be achieved using lower frame
rates that still produce acceptable image quality.
Some factors can be adjusted to reduce the radiation dose.
Fluoroscopic time is directly related to the radiation dose and is
dependent on the operators. We think proficiency in cerebral an-
giography can reduce fluoroscopic time, especially for therapeutic
procedures. Rotational angiography is another factor that can be
adjusted. When the radiation dose by angiographic procedures
was reduced, the proportion of the radiation dose by rotational
angiography increased (Table 5). We think we can further reduce
the radiation dose using a low-dose protocol for rotational an-
giography, the feasibility of which was shown by Pearl et al.11 Last,
strict control of the FOV to contain only vascular structures can
also contribute to reduction of the radiation dose.
There are some limitations in our study. First, it was retrospec-
tive. Even though the data base was built prospectively, the study
was retrospective and vulnerable to selection bias and informa-
tion bias. We think that the large number of samples tested over-
comes this limitation. Second, the cases analyzed were limited to
aneurysms. We used only aneurysms because they are the most
frequent vascular disease and can be used as representative cases.
However, limiting cases makes it difficult to generalize the results
of this study. Third, the DAP we used was a simple summation of
angiographic DAP, fluoroscopic DAP, and rotational angio-
graphic DAP. In this study, we did not evaluate acquisition and
fluoroscopic doses separately because we concentrated on only
the effect of the low-dose angiography on the total patient dose.
Further studies separately analyzing the 2D angiographic dose, 3D
rotational angiographic dose, and fluoroscopic dose would have
meaningful results. Fourth, we did not evaluate the radiation dose
according to the mode of treatment. Cheung et al24 showed that
the mode of treatment can affect the radiation dose, and this
might have had a confounding effect on our results.
CONCLUSIONSLow-dose cerebral angiography maintained image quality, and
implementation of dose-reduction strategies contributed to re-
duced radiation doses of patients undergoing diagnostic and neu-
rointerventional procedures for intracranial aneurysms.
REFERENCES1. Valentin J. Avoidance of radiation injuries from medical interven-
tional procedures, ICRP Publication 85. Ann ICRP 2000;30:7– 67CrossRef
2. Food U, Administration D. Avoidance of serious X-ray-inducedskin injuries to patients during fluoroscopically-guided proce-dures. Med Bull 1994;24:7–17
3. Wagner LK, Eifel PJ, Geise RA. Potential biological effects followinghigh X-ray dose interventional procedures. J Vasc Interv Radiol1994;5:71– 84 CrossRef Medline
4. Mahesh M. Fluoroscopy: patient radiation exposure issues. Radio-graphics 2001;21:1033– 45 CrossRef Medline
5. Suzuki S, Furui S, Matsumaru Y, et al. Patient skin dose during neu-roembolization by multiple-point measurement using a radiosen-sitive indicator. AJNR Am J Neuroradiol 2008;29:1076 – 81 CrossRefMedline
6. Chun CW, Kim BS, Lee CH, et al. Patient radiation dose in diagnos-tic and interventional procedures for intracranial aneurysms: expe-rience at a single center. Korean J Radiol 2014;15:844 – 49 CrossRefMedline
7. Soderman M, Holmin S, Andersson T, et al. Image noise reductionalgorithm for digital subtraction angiography: clinical results. Ra-diology 2013;269:553– 60 CrossRef Medline
8. Soderman M, Mauti M, Boon S, et al. Radiation dose in neuroan-giography using image noise reduction technology: a populationstudy based on 614 patients. Neuroradiology 2013;55:1365–72CrossRef Medline
9. Schneider T, Wyse E, Pearl MS. Analysis of radiation doses incurredduring diagnostic cerebral angiography after the implementationof dose reduction strategies. J Neurointerv Surg 2017;9:384 – 88CrossRef Medline
10. Honarmand AR, Shaibani A, Pashaee T, et al. Subjective and objec-tive evaluation of image quality in biplane cerebral digital subtrac-tion angiography following significant acquisition dose reduction
Table 4: Summary of mean and third quartile data of DAP, fluoroscopic time, and number of image frames acquired during therapeuticcerebral angiography for intracranial aneurysms
Reference No. of Patients
DAP (Gy×cm2)FluoroscopyTime (min) No. of Frames
Mean 3rd Quartile Mean 3rd Quartile Mean 3rd QuartilePhase 1 144 246.0 301.4 53.5 64.5 287.6 341Phase 2 173 169.8 206.2 49.1 60.0 260.2 334Hassan and Amelot17 71 78.7 111.9 25.7 34.8 300 428Chun et al6 111 226.0 272.8 52.9 61.1 241 276D’Ercole et al18 72 382.2 487 37.2 46.3 558 717Aroua et al19 52 335 440 36.5 50 760 800Verdun et al20 58 335 352Brambilla et al21 356 319.9 87.1 1053
Table 5: The proportion of DAP contributed by rotationalangiography before and after the low-dose protocola
Phase 1 Phase 2Diagnostic
Total DAP (Gy�cm2) 140.8 � 48.1 82.0 � 30.0Rotation DAP (Gy�cm2) 26.3 � 13.4 28.0 � 13.7Rotations/total DAP 18.7 % 34.1 %No. of rotations 1.49 � 2.60 1.44 � 0.68
TherapeuticTotal DAP (Gy�cm2) 246.0 � 148.3 169.8 � 111.6Rotation DAP (Gy�cm2) 30.8 � 17.0 25.6 � 14.3Rotations/total DAP 12.5 % 15.1 %No. of rotations 1.58 � 0.79 1.33 � 0.68
a Data are means and percentages.
832 Choi May 2019 www.ajnr.org

in a clinical setting. J Neurointerv Surg 2017;9:297–301 CrossRefMedline
11. Pearl MS, Torok C, Katz Z, et al. Diagnostic quality and accuracy oflow dose 3D-DSA protocols in the evaluation of intracranial aneu-rysms. J Neurointerv Surg 2015;7:386 –90 CrossRef Medline
12. Vano E, Fernandez JM, Sanchez RM, et al. Patient radiation dosemanagement in the follow-up of potential skin injuries in neurora-diology. AJNR Am J Neuroradiol 2013;34:277– 82 CrossRef Medline
13. Yi HJ, Sung JH, Lee DH, et al. Analysis of radiation doses and dosereduction strategies during cerebral digital subtraction angiogra-phy. World Neurosurg 2017;100:216 –23 CrossRef Medline
14. Schneider T, Wyse E, Pearl MS. Analysis of radiation doses incurredduring diagnostic cerebral angiography after the implementationof dose reduction strategies. J Neurointerv Surg 2017;9:384 – 88CrossRef Medline
15. Kahn EN, Gemmete JJ, Chaudhary N, et al. Radiation dose reductionduring neurointerventional procedures by modification of defaultsettings on biplane angiography equipment. J Neurointerv Surg2016;8:819 –23 CrossRef Medline
16. Ihn YK, Kim BS, Byun JS, et al. Patient radiation exposure during diag-nostic and therapeutic procedures for intracranial aneurysms: a mul-ticenter study. Neurointervention 2016;11:78–85 CrossRef Medline
17. Hassan AE, Amelot S. Radiation exposure during neurointerven-tional procedures in modern biplane angiographic systems: a sin-gle-site experience. Interv Neurol 2017;6:105–16 CrossRef Medline
18. D’Ercole L, Thyrion FZ, Bocchiola M, et al. Proposed local diagnos-tic reference levels in angiography and interventional neuroradiol-ogy and a preliminary analysis according to the complexity of theprocedures. Phys Med 2012;28:61–70 CrossRef Medline
19. Aroua A, Rickli H, Stauffer JC, et al. How to set up and apply refer-ence levels in fluoroscopy at a national level. Eur Radiol 2007;17:1621–33 CrossRef Medline
20. Verdun FR, Aroua A, Trueb PR, et al. Diagnostic and interventionalradiology: a strategy to introduce reference dose level taking intoaccount the national practice. Radiat Prot Dosimetry 2005;114:188 –91 CrossRef Medline
21. Brambilla M, Marano G, Dominietto M, et al. Patient radiationdoses and references levels in interventional radiology. Radiol Med2004;107:408 –18 Medline
22. Nickoloff EL, Lu ZF, Dutta AK, et al. Radiation dose descriptors:BERT, COD, DAP, and other strange creatures. Radiographics 2008;28:1439 –50 CrossRef Medline
23. Bogaert E, Bacher K, Lemmens K, et al. A large-scale multicentrestudy of patient skin doses in interventional cardiology: dose-areaproduct action levels and dose reference levels. Br J Radiol 2009;82:303–12 CrossRef Medline
24. Cheung NK, Boutchard M, Carr MW, et al. Radiation exposure, andprocedure and fluoroscopy times in endovascular treatment of in-tracranial aneurysms: a methodological comparison. J NeurointervSurg 2018;10:902– 06 CrossRef Medline
AJNR Am J Neuroradiol 40:827–33 May 2019 www.ajnr.org 833

ORIGINAL RESEARCHINTERVENTIONAL
Differences in Cerebral Aneurysm Rupture Rate According toArterial Anatomies Depend on the Hemodynamic Environment
X S. Fukuda, X Y. Shimogonya, and X N. Yonemoto, on behalf of the CFD ABO Study Group
ABSTRACT
BACKGROUND AND PURPOSE: Cerebral aneurysms have significantly different rupture rates depending on their size and location. Themechanisms underlying these differences are unclear. We examined whether anatomic rupture risks are dependent on the hemodynamicenvironment on the aneurysmal surface.
MATERIALS AND METHODS: Patient-specific geometries and flow rates of 84 cerebral aneurysms (42 anterior communicating artery and42 MCA aneurysms) were acquired from our clinical study, the Computational Fluid Dynamics Analysis of Blood Flow in Cerebral Aneu-rysms: Prospective Observational Study. Pulsatile blood flow was simulated to calculate hemodynamic metrics with special attention towall shear stress magnitude and temporal disturbance. Multivariate analyses were performed to identify associations between hemody-namic metrics and known rupture predictors (age, sex, hypertension, smoking history, location, and size).
RESULTS: All the wall shear stress magnitude– based metrics showed a significant negative association with size and location (P � .03), butnot other risk factors. All the wall shear stress disturbance– based metrics were significantly related to size (P � .001). Only normalizedtransverse wall shear stress, a metric for multidirectional wall shear stress disturbance, was related to location (P � .03). The normalizedtransverse wall shear stress had the highest odds ratio for location and size among hemodynamic metrics (odds ratios, 1.275 and 1.579; 95%confidence intervals, 1.020 –1.693 and 1.238 –2.219, respectively). Among the arterial geometric parameters, the aspect ratio had the secondstrongest association with all hemodynamic metrics, after our newly proposed aspect ratio–asphericity index.
CONCLUSIONS: The differences in aneurysm rupture rates according to size and location may reflect differences in hemodynamicenvironments in qualitatively different ways. An enhanced multidirectional wall shear stress disturbance may be especially associated withaneurysm rupture.
ABBREVIATIONS: AAI � aspect ratio–asphericity index; AcomA � anterior communicating artery; � � regression coefficient; CFD � computational fluiddynamics; GON � gradient oscillatory number; NtransWSS � normalized transverse wall shear stress; NWSS � normalized wall shear stress; NWSSG � normalized wallshear stress gradient; OSI � oscillatory shear index; TAWSS � time-averaged wall shear stress; TAWSSG � time-averaged wall shear stress gradient; WSS � wall shearstress
Cerebral aneurysm rupture is a major cause of life-threatening
SAH, with high mortality and disability rates. Although sev-
eral known risk factors exist, including size, location, sex, age,
history of hypertension, and smoking, it remains difficult to pre-
dict which cerebral aneurysms are more likely to rupture.1-4 New
predictors of cerebral aneurysm rupture are thus needed.
Aneurysm ruptures are mainly attributable to the biologic
process of the progressive degradation of vessel wall structure and
strength, in which hemodynamic stress and inflammation are
thought to be closely involved.1,5-7 We have focused on the role of
hemodynamics and are using computational fluid dynamics
Received November 26, 2018; accepted after revision March 11, 2019.
From the Department of Neurosurgery (S.F.), National Hospital Organization KyotoMedical Center, Kyoto, Japan; College of Engineering (Y.S.), Nihon University,Koriyama, Japan; and Department of Biostatistics (N.Y.), Kyoto University, Kyoto,Japan
Shunichi Fukuda and Yuji Shimogonya contributed equally to this work.
The CFD ABO Study Group Member List is in the On-line Appendix.
This work is supported by a grant-in-aid for the Japanese National Hospital Organi-zation Multi-Center Clinical Research, AMED, under grant No. JP15gm0810006h0301,and JSPS KAKENHI grant No. 15K10323.
Paper previously presented, in part, at: International Stroke Conference 2018, Janu-ary 23–25, 2018; Los Angeles, California.
Please address correspondence to Shunichi Fukuda, MD, Department of Neurosur-gery, National Hospital Organization Kyoto Medical Center, 1-one Mukaihata-cho,
Fukakusa, Fushimi-ku, Kyoto City, Kyoto, Japan 612-8555; e-mail:[email protected]
Indicates open access to non-subscribers at www.ajnr.org
Indicates article with supplemental on-line appendix and tables.
Indicates article with supplemental on-line photos.
http://dx.doi.org/10.3174/ajnr.A6030
834 Fukuda May 2019 www.ajnr.org

(CFD) techniques to clarify hemodynamics-related factors of ce-
rebral aneurysm ruptures. We are currently conducting the Com-
putational Fluid Dynamics Analysis of Blood Flow in Cerebral
Aneurysms: Prospective Observational Study (the CFD ABO
Study) as a multi-institutional prospective observational clinical
study of the National Hospital Organization in Japan
(UMIN000013584). Individual flow rates and arterial geometries
were acquired from 461 registered patients to provide realistic
patient-specific CFD models.
Among the known predictors of rupture, cerebral artery ana-
tomic parameters such as size and location are the most signifi-
cant.1-4 The rupture rate of aneurysms with sizes of 7–10 mm is
approximately 3 times higher than that of 3–5 mm aneurysms.2
The rupture rate of anterior communicating artery (AcomA) an-
eurysms is approximately twice that of MCA aneurysms.2 Several
researchers have reported that low wall shear stress (WSS) and
disturbed WSS are significantly associated with aneurysm rup-
ture.1,6,8,9 However, the relationships between these anatomic
risk factors and the hemodynamic environment and the underly-
ing mechanisms remain unclear. A better understanding of these
phenomena could improve the prediction of aneurysm ruptures.
Given the above-described background, we hypothesized that
rupture risks based on arterial anatomic parameters are deter-
mined by the hemodynamics—that is, the hemodynamic envi-
ronment on the aneurysmal surface may vary depending on the
size and location of the aneurysm, and changes in the hemody-
namic environments may cause differences in the rupture-risk
rate. We examined the associations between known risk factors
and hemodynamic metrics on the aneurysmal surface, and we
considered the mechanisms from the point of view of fluid me-
chanics. We applied CFD and multivariate analysis to 84 cases of
bifurcation-type aneurysms located at 2 representative and fre-
quently involved sites, the MCA and AcomA, from the CFD ABO
Study. We also explored which geometry-related metrics of aneu-
rysms (among size and 8 other known geometric parameters)
were best correlated with the detected hemodynamics metrics.
MATERIALS AND METHODSSee the On-line Appendix for details of the CFD ABO study
methodology.
Data Sources3D-CTA images and patient-specific physiologic data, including
the flow rate, were acquired from patients who consented to par-
ticipate in either the CFD ABO Study approved by the National
Hospital Organization, Japan, or the pilot study approved by the
Ethics Committee of the Kyoto Medical Center, Japan. We ana-
lyzed 84 bifurcation-type aneurysms (42 AcomA and 42 MCA
aneurysms). A flow chart of the method used is provided in On-
line Fig 1.
CFD Modeling and PostprocessingPulsatile blood flow was simulated using the CFD software
package ANSYS CFX (ANSYS, Canonsburg, Pennsylvania).
We then calculated 7 hemodynamic metrics and 9 geometric
parameters during postprocessing for use in statistical analy-
ses. The CFD modeling and postprocessing details are de-
scribed in the On-line Appendix.
Statistical AnalysisThe continuous data are reported as means � SDs and were ana-
lyzed using the Wilcoxon rank sum test. A multivariate regression
analysis was performed to investigate the influence of known risk
factors for rupture—ie, size (the maximum diameter of the cere-
bral aneurysm), location (AcomA versus MCA), sex, age, history
of hypertension and smoking— on the 7 hemodynamic metrics:
the time-averaged wall shear stress (TAWSS), normalized WSS
(NWSS), time-averaged WSS gradient (TAWSSG), normalized
WSS gradient (NWSSG), oscillatory shear index (OSI), gradient
oscillatory number (GON), and normalized transverse WSS
(NtransWSS).
We performed a multivariate logistic analysis to determine the
effects of the 7 hemodynamic metrics on size (�7 versus �7 mm)
and location. We also performed a multivariate regression
analysis to determine the associations between the known ar-
terial geometric parameters and hemodynamic metrics after
adjustment for age, sex, hypertension, smoking history, and
aneurysm location. The rationales for risk-factor selection are
described in the On-line Appendix. We computed regression
coefficients with 95% CIs and P values for the models. Differ-
ences with P � .05 were considered significant. All analyses
were performed using JMP, Version 11.0.0 software (SAS In-
stitute, Cary, North Carolina).
RESULTSCharacteristicsThe case characteristics are summarized in the Table.
Association of Known Rupture Risk Factors withHemodynamic MetricsTo investigate whether known rupture risk factors are hemody-
namically involved in rupture, we examined the association be-
Characteristics of the cases with cerebral aneurysmsa
CharacteristicsWomen (No.) (%) 43 (51.2%)Age (yr) 70.4 � 9.0Age 70 yr or older 46 (54.8%)Hypertension (No.) (%) 62 (73.8%)Smoking history (No.) (%) 49 (58.3%)AcomA (No.) (%) 42 (50.0%)Size (mm) 5.64 � 2.04Surface area (mm2) 60.0 � 44.8Volume (mm3) 45.5 � 48.8Size ratio 2.42 � 1.08Area ratio 14.9 � 14.1Aspect ratio 0.93 � 0.39Aspect ratio–asphericity index 0.565 � 0.246Parent artery diameter (mm) 2.45 � 0.53Aneurysm surface-averaged TAWSS (Pa) 4.68 � 4.96Aneurysm surface-averaged NWSS 5.88 � 6.58Aneurysm surface-averaged TAWSSG
(Pa/mm)5.15 � 6.14
Aneurysm surface-averaged NWSSG 16.0 � 19.9Aneurysm surface-averaged OSI 0.0169 � 0.0144Aneurysm surface-averaged GON 0.0664 � 0.0523Aneurysm surface–averaged NtransWSS 0.130 � 0.059
a Data are mean � SD unless otherwise indicated.
AJNR Am J Neuroradiol 40:834 –39 May 2019 www.ajnr.org 835

tween each rupture risk factor and hemodynamic metrics using a
multivariate regression analysis (On-line Table 1 and On-line Fig
3). The size and WSS magnitude– based metrics, TAWSS, NWSS,
TAWSSG, and NWSSG, were significantly negatively correlated,
indicated by the following: TAWSS regression coefficient (�),
�0.561 (95% CI, �1.064 to �0.058) P � .02; NWSS �, �0.867
(95% CI, �1.510 to �0.224) P � .008; TAWSSG �, �0.868 (95%
CI, �1.486 to �0.249) P � .006; NWSSG �, �3.22 (95% CI,
�5.16 to �1.28) P � .001. The WSS disturbance– based metrics,
OSI, GON, and NtransWSS, were significantly positively corre-
lated as indicated by the following: OSI �, 0.00332 (95% CI,
0.00191– 0.00472) P � .001; GON �, 0.0145 (95% CI, 0.0097–
0.0193) P � .001; NtransWSS �, 0.0145 (95% CI, 0.0089 – 0.0200)
P � .001.
In contrast, a significant negative association was observed
between the location (MCA versus AcomA aneurysms) and each
of the WSS magnitude– based metrics: TAWSS �, �1.82 (95% CI,
�2.84 to �0.80) P � .001; NWSS �, �2.45 (95% CI, �3.75 to
�1.15) P � .001; TAWSSG �, �2.05 (95% CI, �3.31 to �0.80)
P � .001; NWSSG �, �6.91 (95% CI, �10.84 to �2.98) P � .001.
A significant positive association with the location was found in
only NtransWSS as a metric for multidirectional WSS disturbance
among all of the WSS disturbance– based metrics examined (�,
0.0119; 95% CI, 0.0006 – 0.0232; P � .03).
Association of Hemodynamic Metrics with the Size andLocation of Cerebral AneurysmsUsing a multivariate logistic analysis, we sought to identify which
hemodynamic metric was most strongly related to the size (�7
versus �7 mm) and location in which significant hemodynamic
involvement was observed. Although all of the hemodynamic
metrics showed a significant association with both size and loca-
tion, the NtransWSS had the highest OR and the strongest asso-
ciation with both size (OR, 1.579; 95% CI, 1.238 –2.128) and lo-
cation (OR, 1.275; 95% CI, 1.020 –1.639) (On-line Table 1).
Association between Aneurysm Arterial GeometricParameters and Hemodynamic MetricsSeveral arterial geometric parameters have been reported as pre-
dictors of aneurysm rupture, such as size, size ratio, and aspect
ratio. We therefore examined which arterial geometric parameter
most strongly reflects each hemodynamic metric by performing a
multivariate regression analysis. Among the known arterial geo-
metric rupture risk factors, the aspect ratio showed the strongest
association with all hemodynamic metrics as shown in On-line
Table 2: TAWSS �, �2.46 (95% CI, �5.12 to �0.21) P � .07;
NWSS �, �3.20 (95% CI, �6.65 to 0.25) P � .06; TAWSSG �,
�2.92 (95% CI, �6.26 to �0.42) P � .08; NWSSG �, �10.5 (95%
CI, �21.1 to �0.2) P � .05; OSI �, 0.00799 (95% CI, 0.00017–
0.01616) P � .05; GON �, 0.0352 (95% CI, 0.0057– 0.0648) P �
.02; NtransWSS �, 0.0379 (95% CI, 0.0052– 0.0707) P � .02.
However, the aspect ratio–asphericity index (AAI), our newly
proposed geometric parameter, was more strongly correlated
with all the hemodynamic metrics than the aspect ratio: TAWSS
�, �4.02 (95% CI, �8.23 to �0.19) P � .06; NWSS �, �5.46
(95% CI, �10.90 to �0.01) P � .04; TAWSSG �, �4.72 (95% CI,
�9.99 to �0.56) P � .07; NWSSG �, �17.3 (95% CI, �34.0 to
�0.5) P � .04; OSI �, 0.0121 (95% CI, 0.0008 – 0.0250) P � .06;
GON �, 0.0559 (95% CI, 0.0092– 0.1027) P � .01; NtransWSS �,
0.0558 (95% CI, 0.0038 – 0.1079) P � .03. Here, AAI is defined as
(H / N) � (d2 / S), where H is the height, N the neck width, d the
size, and S the surface area.
Differences in Flow Rates in Parent Vessels and Sizebetween the AcomA and MCA AneurysmsThe anterior cerebral artery flow rate (90.9 � 41.9 mL/min) was
significantly lower than the MCA flow rate (123.0 � 50.9 mL/
min) (P � .001; On-line Table 3). The size was slightly, but not
significantly, larger in the AcomA aneurysms (5.82 � 2.10 mm)
than the MCA aneurysms (5.46 � 2.00 mm).
Differences in Flow Rates in Parent Vessels and SizeBetween the 2 Different Size GroupsThe parent vessel flow rate was not significantly different between
the large (�7 mm; 92.2 � 41.9 mL/min) and small aneurysm
groups (�7 mm; 112.8 � 50.8 mL/min; On-line Table 4). The size
was significantly greater in the large (8.28 � 1.16 mm) than in the
small (4.58 � 1.17 mm) aneurysm group (P � .001).
Differences in Hemodynamic Metrics between SizeGroups with a Threshold of 5 or 7 mmUsing a multivariate regression analysis, we examined the differ-
ences in hemodynamic metrics between the 2 different size groups
with a threshold of 5 or 7 mm (On-line Table 5). The WSS mag-
nitude– based metrics and size were better correlated in the 5-
than the 7-mm threshold (�, 5 versus 7 mm; TAWSS, �1.27 ver-
sus �1.20; NWSS, �2.37 versus �1.48; TAWSSG, �1.89 versus
�1.70; NWSSG, �7.97 versus �5.20), whereas in the WSS dis-
turbance– based metrics, the association was stronger in the 7-
than the 5-mm threshold (�, 5 versus 7 mm; OSI, 0.00367 versus
0.00648; GON, 0.0207 versus 0.0260; NtransWSS, 0.0176 versus
0.0274).
Flow Rates and TAWSS on the ICA in MCA AneurysmCasesIn the MCA aneurysm cases, both the flow rate and the TAWSS on
the ICA on the side where the aneurysm was present were signif-
icantly higher in the large (�5 mm) than the small (�5 mm)
aneurysm group (P � .03 and .03, respectively; On-line Table 6).
DISCUSSIONHemodynamics is likely involved in cerebral aneurysm ruptures,
and some of the rupture predictors become significant risk factors
due to the influence of hemodynamics.1,5-7 Several studies have
quantitatively examined hemodynamic metrics in ruptured and
unruptured cerebral aneurysms.7,10 These reports examined the
degree of association between hemodynamic metrics and aneu-
rysm rupture and demonstrated that ruptured and unruptured
aneurysms had significantly different hemodynamic characteris-
tics.10 Therefore, it is presumed that some of the known rupture
risks become significant by reflecting the influence of these hemo-
dynamic environments. However, to our knowledge, no report
has described the significance of the association between hemo-
dynamic parameters as independent variables and the rupture
risks, such as size and location, or conversely, how much the rup-
836 Fukuda May 2019 www.ajnr.org

ture risks as independent variables are related to hemodynamic
environments, though several reports have examined the associ-
ation between hemodynamic factors and rupture itself.7,10 There-
fore, we statistically examined the mutual relationship between
hemodynamic parameters and representative risk factors such as
age, sex, smoking history, and hypertension in addition to size
and location. This is thus the first examination of this type. The
results of our analyses indicate that arterial anatomic parameters
(size and location of aneurysms) and hemodynamic metrics char-
acterizing the WSS magnitude and disturbance were significantly
associated; both the associations of the arterial anatomic param-
eters with the hemodynamic metrics and the associations of the
hemodynamic metrics with the arterial anatomic parameters were
statistically significant (On-line Table 1 and On-line Fig 3), sug-
gesting that rupture risks based on arterial
anatomic parameters are determined by
the hemodynamic environment.
Larger and AcomA aneurysms have
higher rupture rates than smaller and
MCA aneurysms, respectively.2 The pres-ent results show that the TAWSS on theaneurysmal surface was significantly neg-atively associated with size and location(On-line Table 1 and Figs 1 and 2 and On-line Figs 3–5). This finding is consistentwith studies showing that a significant de-crease in the magnitude of the WSS on theaneurysmal surface is closely associatedwith the aneurysm rupture status.1,6,8,9
This leads us to ask what mecha-nisms cause the WSS to become low ordisturbed depending on the size and lo-cation. Are the mechanisms differentbetween size and location? Based on thepresent data, we considered the mecha-nisms from the point of view of fluidmechanics. The finding that the TAWSSwas significantly decreased on AcomAaneurysms compared with MCA aneu-rysms could be explained qualitatively.It is hemodynamically clear that theTAWSS on the aneurysmal surface is af-fected principally by the size of the aneu-rysm and the inflow rate into the aneu-rysm.11 The larger the size of theaneurysm (ie, the larger the open spaceinside the aneurysm) and the lower theinflow rate, the lower the TAWSS willbe.
Because it was difficult to measurethe inflow rate into the aneurysm for allthe cases, we use the flow rate in the par-ent vessel, the anterior cerebral artery orMCA, in the following discussion. In ourresults, the anterior cerebral artery flowrate was significantly lower than theMCA flow rate, whereas the aneurysmalsize showed no significant difference be-
tween the AcomA and MCA aneurysm
groups (On-line Table 3). Therefore, the significant difference in
TAWSS between the 2 groups was due mainly to the difference in
flow rates. In contrast, the decrease in the TAWSS with increasing
aneurysm size may be explained simply by the effect of size be-
cause the flow rate in the parent vessel showed no difference be-
tween the 2 size groups (On-line Table 4).
A significant positive association was observed between each
of the WSS disturbance– based metrics (the OSI, GON, and
NtransWSS) and the size of the aneurysm (On-line Table 1, Fig 1,
and On-line Fig 4). With respect to location, however, only
NtransWSS differed significantly among the different locations
(On-line Table 1, Fig 2, and On-line Fig 5). These findings suggest
that aneurysm size and location both contribute significantly to
FIG 1. Comparisons of hemodynamic metrics between a representative small aneurysm (A) anda large aneurysm (B).
FIG 2. Comparisons of hemodynamic metrics between a representative anterior communicatingartery aneurysm (A) and an MCA aneurysm (B).
AJNR Am J Neuroradiol 40:834 –39 May 2019 www.ajnr.org 837
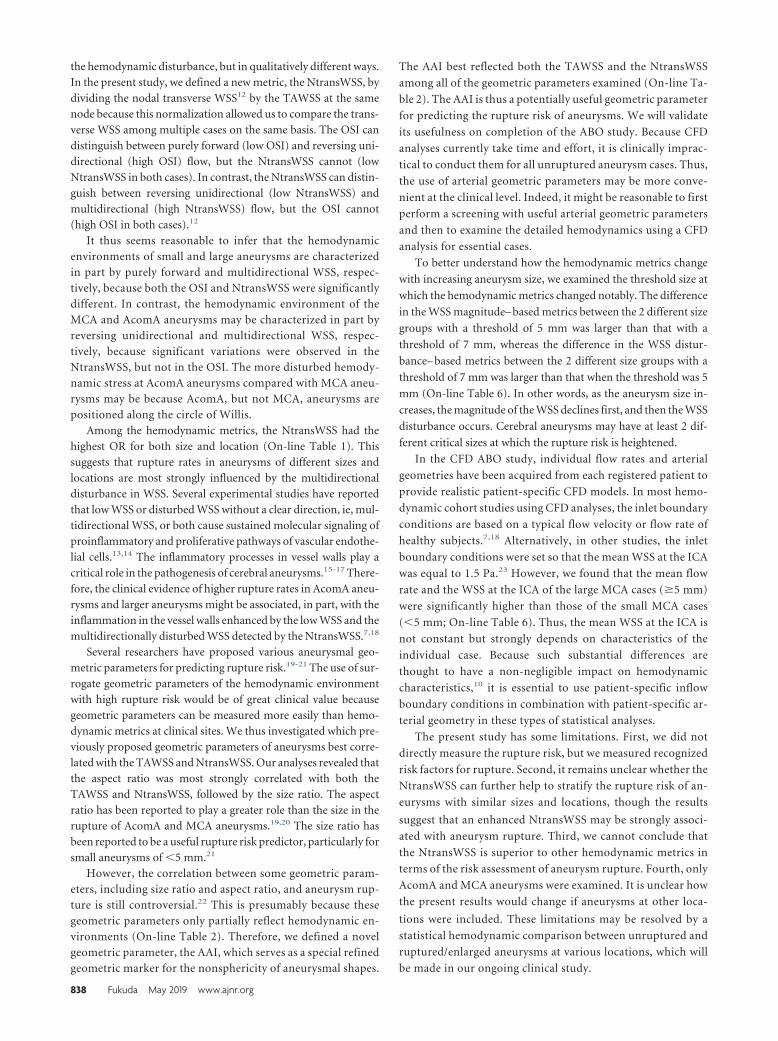
the hemodynamic disturbance, but in qualitatively different ways.In the present study, we defined a new metric, the NtransWSS, bydividing the nodal transverse WSS12 by the TAWSS at the samenode because this normalization allowed us to compare the trans-verse WSS among multiple cases on the same basis. The OSI candistinguish between purely forward (low OSI) and reversing uni-directional (high OSI) flow, but the NtransWSS cannot (lowNtransWSS in both cases). In contrast, the NtransWSS can distin-guish between reversing unidirectional (low NtransWSS) andmultidirectional (high NtransWSS) flow, but the OSI cannot(high OSI in both cases).12
It thus seems reasonable to infer that the hemodynamicenvironments of small and large aneurysms are characterizedin part by purely forward and multidirectional WSS, respec-tively, because both the OSI and NtransWSS were significantlydifferent. In contrast, the hemodynamic environment of theMCA and AcomA aneurysms may be characterized in part byreversing unidirectional and multidirectional WSS, respec-tively, because significant variations were observed in theNtransWSS, but not in the OSI. The more disturbed hemody-namic stress at AcomA aneurysms compared with MCA aneu-rysms may be because AcomA, but not MCA, aneurysms arepositioned along the circle of Willis.
Among the hemodynamic metrics, the NtransWSS had thehighest OR for both size and location (On-line Table 1). Thissuggests that rupture rates in aneurysms of different sizes andlocations are most strongly influenced by the multidirectionaldisturbance in WSS. Several experimental studies have reportedthat low WSS or disturbed WSS without a clear direction, ie, mul-tidirectional WSS, or both cause sustained molecular signaling ofproinflammatory and proliferative pathways of vascular endothe-lial cells.13,14 The inflammatory processes in vessel walls play acritical role in the pathogenesis of cerebral aneurysms.15-17 There-fore, the clinical evidence of higher rupture rates in AcomA aneu-rysms and larger aneurysms might be associated, in part, with theinflammation in the vessel walls enhanced by the low WSS and themultidirectionally disturbed WSS detected by the NtransWSS.7,18
Several researchers have proposed various aneurysmal geo-metric parameters for predicting rupture risk.19-21 The use of sur-rogate geometric parameters of the hemodynamic environmentwith high rupture risk would be of great clinical value becausegeometric parameters can be measured more easily than hemo-dynamic metrics at clinical sites. We thus investigated which pre-viously proposed geometric parameters of aneurysms best corre-lated with the TAWSS and NtransWSS. Our analyses revealed thatthe aspect ratio was most strongly correlated with both theTAWSS and NtransWSS, followed by the size ratio. The aspectratio has been reported to play a greater role than the size in therupture of AcomA and MCA aneurysms.19,20 The size ratio hasbeen reported to be a useful rupture risk predictor, particularly forsmall aneurysms of �5 mm.21
However, the correlation between some geometric param-eters, including size ratio and aspect ratio, and aneurysm rup-ture is still controversial.22 This is presumably because thesegeometric parameters only partially reflect hemodynamic en-vironments (On-line Table 2). Therefore, we defined a novelgeometric parameter, the AAI, which serves as a special refinedgeometric marker for the nonsphericity of aneurysmal shapes.
The AAI best reflected both the TAWSS and the NtransWSS
among all of the geometric parameters examined (On-line Ta-
ble 2). The AAI is thus a potentially useful geometric parameter
for predicting the rupture risk of aneurysms. We will validate
its usefulness on completion of the ABO study. Because CFD
analyses currently take time and effort, it is clinically imprac-
tical to conduct them for all unruptured aneurysm cases. Thus,
the use of arterial geometric parameters may be more conve-
nient at the clinical level. Indeed, it might be reasonable to first
perform a screening with useful arterial geometric parameters
and then to examine the detailed hemodynamics using a CFD
analysis for essential cases.
To better understand how the hemodynamic metrics change
with increasing aneurysm size, we examined the threshold size at
which the hemodynamic metrics changed notably. The difference
in the WSS magnitude– based metrics between the 2 different size
groups with a threshold of 5 mm was larger than that with a
threshold of 7 mm, whereas the difference in the WSS distur-
bance– based metrics between the 2 different size groups with a
threshold of 7 mm was larger than that when the threshold was 5
mm (On-line Table 6). In other words, as the aneurysm size in-
creases, the magnitude of the WSS declines first, and then the WSS
disturbance occurs. Cerebral aneurysms may have at least 2 dif-
ferent critical sizes at which the rupture risk is heightened.
In the CFD ABO study, individual flow rates and arterial
geometries have been acquired from each registered patient to
provide realistic patient-specific CFD models. In most hemo-
dynamic cohort studies using CFD analyses, the inlet boundary
conditions are based on a typical flow velocity or flow rate of
healthy subjects.7,18 Alternatively, in other studies, the inlet
boundary conditions were set so that the mean WSS at the ICA
was equal to 1.5 Pa.23 However, we found that the mean flow
rate and the WSS at the ICA of the large MCA cases (�5 mm)
were significantly higher than those of the small MCA cases
(�5 mm; On-line Table 6). Thus, the mean WSS at the ICA is
not constant but strongly depends on characteristics of the
individual case. Because such substantial differences are
thought to have a non-negligible impact on hemodynamic
characteristics,10 it is essential to use patient-specific inflow
boundary conditions in combination with patient-specific ar-
terial geometry in these types of statistical analyses.
The present study has some limitations. First, we did not
directly measure the rupture risk, but we measured recognized
risk factors for rupture. Second, it remains unclear whether the
NtransWSS can further help to stratify the rupture risk of an-
eurysms with similar sizes and locations, though the results
suggest that an enhanced NtransWSS may be strongly associ-
ated with aneurysm rupture. Third, we cannot conclude that
the NtransWSS is superior to other hemodynamic metrics in
terms of the risk assessment of aneurysm rupture. Fourth, only
AcomA and MCA aneurysms were examined. It is unclear how
the present results would change if aneurysms at other loca-
tions were included. These limitations may be resolved by a
statistical hemodynamic comparison between unruptured and
ruptured/enlarged aneurysms at various locations, which will
be made in our ongoing clinical study.
838 Fukuda May 2019 www.ajnr.org

CONCLUSIONSIn the analysis of AcomA and MCA aneurysms, the arterial ana-
tomic parameters (size and location) and hemodynamic metrics
characterizing the WSS magnitude and disturbance were signifi-
cantly associated. Therefore, the differences in the rupture rate of
aneurysms for various arterial anatomic parameters may reflect
the differences in the hemodynamic environment. Our results
also suggest that a CFD analysis is a useful simulation that
matches epidemiologic data. Although both low WSS and en-
hanced disturbed flow may be involved in aneurysm ruptures, an
enhanced disturbance of multidirectional WSS may be most
strongly associated with aneurysm ruptures; the NtransWSS, a
refined hemodynamic metric proposed in the present study, had
the highest OR for size and location among all the examined he-
modynamic metrics including OSI. Size and location had signifi-
cant effects on the hemodynamic environment in qualitatively
different ways; thus, the decrease in the WSS with increasing an-
eurysm size may be explained by the effect of size itself, whereas
the significant difference in the WSS according to location may be
due to the difference in the flow rate of the parent artery. Our
novel geometric parameter, the AAI, may be useful for predicting
the rupture risk of aneurysms.
ACKNOWLEDGMENTSWe thank Dr Geert W. Schmid-Schonbein, Chair of the Depart-
ment of Bioengineering, University of California, San Diego, for
his valuable advice. We also thank Mr Yasuhide Imoto for his
assistance.
Disclosures: Shunichi Fukuda—RELATED: Grant: grant-in-aid from the Japanese Na-tional Hospital Organization Multi-Center Clinical Research, AMED, and a JSPSKAKENHI grant, Comments: This study was supported by a grant-in-aid from theJapanese National Hospital Organization Multi-Center Clinical Research, AMED, un-der grant No. JP15gm0810006h0301 and a JSPS KAKENHI grant No. 15K10323.
REFERENCES1. Etminan N, Rinkel GJ. Unruptured intracranial aneurysms: devel-
opment, rupture and preventive management. Nat Rev Neurol 2016;12:699 –713 CrossRef Medline
2. Morita A, Kirino T, Hashi K, et al; the UCAS Japan Investigators. Thenatural course of unruptured cerebral aneurysms in a Japanese co-hort. N Engl J Med 2012;366:2474 – 82 CrossRef Medline
3. Greving JP, Wermer M, Brown RD Jr, et al. Development of thePHASES score for prediction of risk of rupture of intracranialaneurysms: a pooled analysis of six prospective cohort studies. Lan-cet Neurol 2014;13:59 – 66 CrossRef Medline
4. Cebral JR, Raschi M. Suggested connections between risk factors ofintracranial aneurysms: a review. Ann Biomed Eng 2013;41:1366 – 83CrossRef Medline
5. Kayembe KN, Sasahara M, Hazama F. Cerebral aneurysms and vari-ations in the circle of Willis. Stroke 1984;15:846 –50 CrossRefMedline
6. Shimogonya Y, Fukuda S. Computational and experimental studies
into the hemodynamics of cerebral aneurysms. Journal of Biome-chanical Science and Engineering 2016;11:15– 00488 CrossRef
7. Xiang J, Natarajan SK, Tremmel M, et al. Hemodynamic-morpho-logic discriminants for intracranial aneurysm rupture. Stroke 2011;42:144 –52 CrossRef Medline
8. Signorelli F, Sela S, Gesualdo L, et al. Hemodynamic stress, inflam-mation, and intracranial aneurysm development and rupture: asystematic review. World Neurosurg 2018;115:234 – 44 CrossRefMedline
9. Takao H, Murayama Y, Otsuka S, et al. Hemodynamic differencesbetween unruptured and ruptured intracranial aneurysms duringobservation. Stroke 2012;43:1436 –39 CrossRef Medline
10. Cebral JR, Mut F, Weir J, et al. Quantitative characterization of thehemodynamic environment in ruptured and unruptured brain an-eurysms. AJNR Am J Neuroradiol 2011;32:145–51 CrossRef Medline
11. Jansen IG, Schneiders JJ, Potters WV, et al. Generalized versus pa-tient-specific inflow boundary conditions in computational fluiddynamics simulations of cerebral aneurysmal hemodynamics.AJNR Am J Neuroradiol 2014;35:1543– 48 CrossRef Medline
12. Peiffer V, Sherwin SJ, Weinberg PD. Computation in the rabbit aortaof a new metric: the transverse wall shear stress—to quantify themultidirectional character of disturbed blood flow. J Biomech 2013;46:2651–58 CrossRef Medline
13. Aoki T, Yamamoto K, Fukuda M, et al. Sustained expression ofMCP-1 under low wall shear stress concomitant with turbulentflow in endothelial cells of intracranial aneurysm. Acta NeuropatholCommun 2016;4:48 CrossRef Medline
14. Chien S. Effects of disturbed flow on endothelial cells. Ann BiomedEng 2008;36:554 – 62 CrossRef Medline
15. Aoki T, Kataoka H, Shimamura M, et al. NF- kappaB is a key medi-ator of cerebral aneurysm formation. Circulation 2007;116:2830 – 40CrossRef Medline
16. Nuki Y, Tsou TL, Kurihara C, et al. Elastase-induced intracranialaneurysms in hypertensive mice. Hypertension 2009;54:1337– 44CrossRef Medline
17. Aoki T, Fukuda M, Nishimura M, et al. Critical role of TNF-alpha-TNFR1 signaling in intracranial aneurysm formation. Acta Neuro-pathol Commun 2014;2:34 CrossRef Medline
18. Shojima M, Oshima M, Takagi K, et al. Magnitude and role of wallshear stress on cerebral aneurysm: computational fluid dynamicstudy of 20 middle cerebral artery aneurysms. Stroke 2004;35:2500 – 05 CrossRef Medline
19. Lin N, Ho A, Gross BA, et al. Differences in simple morphologicalvariables in ruptured and unruptured middle cerebral artery aneu-rysms. J Neurosurg 2012;117:913–19 CrossRef Medline
20. Maiti TK, Bir SC, Patra DP, et al. 158 Morphological parameters foranterior communicating artery aneurysm rupture risk assessment.Neurosurgery 2016;63:163– 64 CrossRef
21. Kashiwazaki D, Kuroda S; Sapporo SAH Study Group. Size ratio canhighly predict rupture risk in intracranial small (<5 mm) aneu-rysms. Stroke 2013;44:2169 –73 CrossRef Medline
22. Lauric A, Baharoglu MI, Gao BL, et al. Incremental contribution ofsize ratio as a discriminant for rupture status in cerebral aneurysms:comparison with size, height, and vessel diameter. Neurosurgery 2012;70:944–51; discussion 951–52 CrossRef Medline
23. Sugiyama S, Niizuma K, Sato K, et al. Blood flow into basilar tipaneurysms: a predictor for recanalization after coil embolization.Stroke 2016;47:2541– 47 CrossRef Medline
AJNR Am J Neuroradiol 40:834 –39 May 2019 www.ajnr.org 839

ORIGINAL RESEARCHINTERVENTIONAL
Impact of Balloon-Guiding Catheter Location on Recanalizationin Patients with Acute Stroke Treated by Mechanical
ThrombectomyX D.E. Jeong, X J.W. Kim, X B.M. Kim, X W. Hwang, and X D.J. Kim
ABSTRACT
BACKGROUND AND PURPOSE: Mechanical thrombectomy with proximal flow control and forced aspiration may improve the outcomeof endovascular revascularization therapy for patients with acute stroke. The purpose of this study was to compare the impact ofballoon-guiding catheter locations in patients treated for anterior circulation acute ischemic stroke using mechanical thrombectomy.
MATERIALS AND METHODS: The influence of the balloon-guiding catheter location (proximal, balloon-guiding catheter tip proximal toC1 vertebral body; distal, between the skull base and the C1 vertebral body) was analyzed in patients with acute anterior circulation stroketreated with stent-retriever thrombectomy. The baseline angiographic/clinical characteristics, time intervals, recanalization rates, andclinical outcomes were compared.
RESULTS: The clinical analysis included 102 patients (mean age, 69.5 � 12.8 years; male/female ratio � 52:50). The balloon-guiding catheterwas located distally in 49 patients and proximally in 53 patients for flow control and forced aspiration during stent retrieval. Thepuncture-to-recanalization time was shorter in the distal group than in the proximal group (40 versus 56 minutes, P � .02). Successful andcomplete recanalizations were more frequently achieved in the distal group compared with the proximal group (98.0% versus 75.5%. P �
.003; 67.3% versus 45.3%, P � .04, respectively). Multivariate analysis showed that the distal catheterization location was independentlyassociated with successful recanalization (adjusted OR, 13.4; 95% CI, 2.4 –254.8; P � .02).
CONCLUSIONS: Location of the balloon-guiding catheter has a significant impact on recanalization in patients with acute stroke. Theballoon-guiding catheter should be positioned as distally as safely possible in the cervical ICA for maximally effective thrombectomy.
ABBREVIATION: BGC � balloon-guiding catheter
The successful recanalization and better clinical outcome of endo-
vascular revascularization therapy in acute ischemic stroke have
been proved in several randomized clinical trials.1-5 Recently, various
methods using balloon-guiding catheters, intermediate catheters,
and stent-deployment techniques have been introduced that may
improve the efficacy of mechanical thrombectomy.6-8 Proximal flow
control with a balloon-guiding catheter (BGC) using stent retrievers
has been shown to improve recanalization rates with shorter proce-
dural times.9-11 Despite the improved outcome, some cases still show
less-than-optimal results with prolonged procedural time and un-
successful/incomplete recanalization.
It is intuitive that the effects of flow arrest and forced aspiration
would be most effective when the distance between the thrombus
and the site of balloon occlusion is short (ie, the balloon is catheter-
ized as distally as possible). However, the actual clinical impact of
achieving distal balloon catheterization is not well-known. In addi-
tion, there may be concerns for complications such as dissection re-
lated to distal navigation of the BGC into the distal cervical ICA.12,13
The purpose of this study was to compare the impact of BGC
locations in patients treated for anterior circulation acute isch-
emic stroke by mechanical thrombectomy.
MATERIALS AND METHODSPatient AnalysisThe patients were collected from a prospectively maintained
stroke registry. Between July 2014 and June 2018, three hundred
thirty-two patients were referred for endovascular revasculariza-
tion therapy of acute ischemic stroke in Severance Hospital. The
inclusion criteria for the study were as follows: 1) patients pre-
Received December 28, 2018; accepted after revision March 7, 2019.
From the Department of Radiology (D.E.J., J.W.K., B.M.K., D.J.K.), Yonsei UniversityCollege of Medicine, Severance Hospital, Seoul, South Korea; Department of Neu-rology (D.E.J.), YeongNam University College of Medicine, Daegu, South Korea; andDepartment of Mechanical and Aerospace Engineering (W.H.), Seoul National Uni-versity, Seoul, South Korea.
This study was supported by a grant from the Research Institute of RadiologicalScience, Yonsei University College of Medicine (grant No. 4-2017-0877).
Please address correspondence to Dong Joon Kim, MD, PhD, Department of Radi-ology, Yonsei University College of Medicine, 50-1 Yonsei-ro, Seodaemun-gu,Seoul 03722, South Korea; e-mail: [email protected]
http://dx.doi.org/10.3174/ajnr.A6031
840 Jeong May 2019 www.ajnr.org

senting within 8 hours from symptom onset of an anterior circu-
lation large-vessel occlusion on CT angiography, 2) ASPECTS of 4
or more, 3) treated by stent-retriever (Solitaire, 4 � 20 mm; Co-
vidien, Irvine, California) thrombectomy with a BGC (Cello 95
cm; Covidien). The exclusion criteria of this study were the fol-
lowing: 1) posterior circulation occlusion (n � 61), 2) dissection
(n � 1) as the etiology of stroke, and 3) ipsilateral stenosis or
occlusion of the proximal ICA (n � 29). Other reasons for
exclusion were the following: primary contact aspiration (n �
18), different-profile BGC/stent retriever (n � 106), no BGC
use (n � 6), primary angioplasty (n � 4), failed access (n � 2),
and multiple cerebral artery occlusions (n � 3). In total, 102
patients who met the criteria were included in this study. The
anteroposterior and lateral DSA images were reviewed for
analysis of the imaging findings, including the cervical ICA
tortuosity, occlusion site, BGC location, recanalization, and
number of thrombectomies.
The locations of the BGCs were defined and grouped as
follows: the distal balloon-guiding group, the balloon-guiding tip
catheterization approaches the entrance of the petrous ICA—ie,
balloon inflation between the skull base and the lower margin of
the C1 vertebral body; and the proximal BGC group, balloon in-
flation proximal to lower margin of the C1 vertebral body for flow
control and forced aspiration during stent retrieval. Tortuosity of
the cervical ICA was defined as an angulation of �90° of the main
flow axes of the cervical ICA. Modified TICI scores of 2b or 3 were
defined as successful recanalization.14 A modified TICI score of 3
was defined as complete recanalization. Embolization to a new
territory was defined as emboli observed within the previously
unaffected territory on postthrombectomy angiography.15
Clinical information including sex, age, vascular risk fac-
tors (hypertension, diabetes mellitus, atrial fibrillation, previ-
ous ischemic stroke), NIHSS score, intravenous rtPA therapy,
time intervals (onset, puncture, recanalization time), hemor-
rhage, 3-month mRS score, and mortality was analyzed. The re-
canalization time was defined as the time to final recanalization in
successful recanalizations and the time of the last angiographic
series in patients with unsuccessful recanalizations. An intracere-
bral hemorrhage was classified according to the second Europe-
an-Australasian Acute Stroke Study classification, and symptom-
atic intracerebral hemorrhage was defined as any hemorrhage
associated with an NIHSS score increase of �4 within 24 hours.16
Good clinical outcome was defined as 3-month mRS scores of
0 –2. The images and clinical information were compared be-
tween the distal and proximal BGC groups.
ProcedureAll procedures were performed by the femoral artery approach. In
general, an 8F sheath (Radifocus; Terumo, Tokyo, Japan or Flexor
Shuttle-SL; Cook, Bloomington, Indiana) and an 8F BGC were
introduced into the cervical ICA coaxially with a 5F diagnostic
catheter. Distal access to the cervical ICA with the BGC was pre-
ferred, but the decision was made at the discretion of the operator.
A microcatheter over a microguidewire was used in all cases for
catheterization of the occluded intracranial vessel. After we placed
the microcatheter distal to the thrombus, the microguidewire was
replaced by a stent retriever. After stent deployment, antegrade
reperfusion was maintained for 3– 4 minutes before retrieval. Af-
ter proximal flow control with balloon inflation, the stent re-
triever and the microcatheter were retrieved together under con-
tinuous forced aspiration using 20-mL syringes. After mechanical
thrombectomy,
15- to 20-minute delayed angiograms were obtained to detect
re-occlusion of the target vessel.
Statistical AnalysisThe data were analyzed using the R statistical and computing
software (Version 3.5.1; http://www.r-project.org/). The contin-
uous variables were analyzed with the 2-sample t test and pre-
sented as mean � SD when normal distribution could be as-
sumed; otherwise, the Mann-Whitney U test was used and
presented as a median (minimum, maximum). Categoric vari-
ables were compared using the Pearson �2 or Fisher exact test as
appropriate. Multivariate logistic analyses were performed for
variables including sex, age, hypertension, initial NIHSS score, IV
rtPA therapy, tortuosity of the ICA, and BGC location. A P
value � .05 was considered statistically significant.
The study was approved by the Severance Hospital institu-
tional review board with a waiver of informed consent due to its
retrospective design.
RESULTSThe mean age of the patients was 69.5 � 12.8 years (male/female
ratio � 52:50). The median initial NIHSS score was 15. The baseline
characteristics of the distal and proximal BGC groups are summa-
rized in Table 1. Hypertension was more frequent in the proximal
BGC group than in the distal BGC group. Other factors did not show
statistically significant differences between the groups.
Overall successful recanalization was achieved in 88 of 102
(86.3%) patients. The puncture-to-recanalization time was sig-
nificantly shorter in the distal BGC group than in the proximal
BGC group (56 versus 40 minutes, P � .02). Successful recanali-
zation was more frequently achieved in the distal BGC group
compared with the proximal BGC group (98.0% versus 75.5%,
P � .003; Table 2). Complete recanalization was also more fre-
quently achieved with a distal BGC (67.3% versus 45.3%, P �
.04). The good long-term outcome rates were more favorable in
the distal BGC group but did not reach statistical significance
(57.1% versus 45.3%, P � .32).
In the multivariate logistic regression analysis (adjusted for
age, sex, initial NIHSS score, IV-rtPA use, ICA tortuosity, and
hypertension), the BGC location was the only independent
factor of successful recanalization (adjusted odds ratio, 13.399;
95% confidence interval, 2.369 –254.815; P � .02; Table 3).
Successful recanalization was highest in patients with nontor-
tuous cervical ICAs and distal balloon-guiding catheterization
(100%) and lowest in patients with tortuous cervical ICAs and
proximal balloon-guiding catheterization (70.6%, Table 4).
There were 2 cases of iatrogenic proximal common carotid
artery dissection in patients with left distal ICA and M2 occlu-
sions, respectively. Both dissections occurred in cases of distal
BGC location and were discovered during reselection of the af-
fected carotid artery with a 5F diagnostic catheter for delayed
angiograms after mechanical thrombectomy. In the former case,
AJNR Am J Neuroradiol 40:840 – 44 May 2019 www.ajnr.org 841

modified TICI 3 recanalization had been achieved for intracranial
occlusion with contrast stagnation at the common carotid artery
dissection site but with no flow compromise; thus, no further
treatment was performed. In the latter case, modified TICI 2b
recanalization had been achieved for the intracranial occlusion.
Slight flow reduction at the common ca-
rotid artery dissection site was seen, but
intracranial flow was preserved from
good anterior communicating artery
cross-flow; thus, no further treatment
was performed for the dissection. Both
patients showed good clinical outcome.
DISCUSSIONOur results show that the location of the
BGC may have a significant impact on the
mechanical thrombectomy treatment re-
sult in patients with acute stroke. When we
compared distal with proximal BGC loca-
tion, flow control and aspiration at the dis-
tal cervical ICA were associated with
significantly improved successful and
complete recanalization rates during
mechanical thrombectomy with stent
retrievers.
Improved Efficacy of MechanicalThrombectomyCurrently, clot capture with a stent re-
triever and contact aspiration with a dis-
tal aspiration catheter are the 2 main
concepts of mechanical thrombec-
tomy.9,11,17,18 Various improvised tech-
niques for improved flow control and as-
piration are being introduced. The bare
wire thrombectomy technique involves
removal of the microcatheter before stent
retrieval for increased aspiration force.8
The concurrent use of the stent retriever
with distal aspiration catheters may have a
synergistic effect of local aspiration and
thrombus entrapment by the stent.19,20
Continuous aspiration before stent de-
ployment and during distal navigation of
the aspiration catheter and retrieval may
decrease the incidence of clot fragment
emboli and increase the near-complete re-
canalization rates.7
Proximal flow control with a BGC and
forced aspiration are also an adjuvant
method for improved efficacy. Analysis of
the North American Solitaire Acute Stroke Registry has shown that
the use of a BGC with a Solitaire stent-retriever device is associated
with superior revascularization results (modified TICI grade, 3;
53.7% versus 32.5%), shorter procedure time (120 � 28.5 versus
161 � 35.6 minutes), and improved clinical outcome (discharge
NIHSS score 12 � 14.5 versus 17.5 � 16) compared with patients
without a BGC.11 However, to the best of our knowledge, there are
no reports analyzing the impact of location of the BGC. Thus, our
study shows that the effects of proximal flow control and forced as-
piration can be maximized without an increase in complications by
achieving distal catheterization with the BGC.
Table 1: Comparison of the baseline characteristics of distal and proximal BGC groupsDistal BGC (n = 49) Proximal BGC (n = 53) P Value
Age (yr)a 70 (37–96) 72 (24–87) .32Female 23 (46.9%) 27 (50.9%) .84Atrial fibrillation 26 (53.1%) 21 (39.6%) .25Hypertension 27 (55.1%) 41 (77.4%) .03Diabetes mellitus 12 (24.5%) 11 (20.8%) .91Ischemic strokeb 4 (8.2%) 4 (7.5%) �.99Smokingb 4 (8.2%) 3 (5.7%) .71Initial NIHSS score (mean) 13.9 � 5.5 14.5 � 5.4 .58IV rtPA use 20 (40.8%) 20 (37.7%) .91Onset-to-puncture time (min)a 195 (90–758) 200 (75–1185) .41Occlusion location
M1 22 (44.9%) 31 (58.5%) .24M2 13 (26.5%) 10 (18.9%) .49ICA 14 (28.6%) 12 (22.6%) .65Tortuous ICA 11 (22.4%) 17 (32.1%) .39
a Mann-Whitney U test. Data are medians, and numbers in parentheses are interquartile range.b Fisher exact test.
Table 2: Comparison of the results between the distal and proximal BGC groupsDistal
BGC (n = 49)Proximal
BGC (n = 53)P
ValuePuncture-to-recanalization time
(min)a40 (14–133) 56 (15–204) .02
Puncture-to-recanalization time(mean) (min)
47.8 � 7.6 67.9 � 12.4 .01
No. of passesa 2 (1–7) 2 (1–12) .32No. of passes (mean) 2.3 � 0.4 3.1 � 0.8 .07Emboli to new territoryb 2 (4.1%) 3 (5.7%) �.99Successful recanalization 48 (98.0%) 40 (75.5%) .003Complete recanalization 33 (67.3%) 24 (45.3%) .04Cervical artery dissectionb 2 (4.1%) 0 .23Symptomatic hemorrhageb 4 (8.2%) 3 (5.7%) .71Discharge NIHSS scorea 6 (0–42) 6 (0–42) .28Mortality 5 (10.2%) 10 (18.9%) .34Good clinical outcome 28 (57.1%) 24 (45.3%) .32
a Mann-Whitney U test. Data are medians, and numbers in parentheses are interquartile range.b Fisher exact test.
Table 3: Predictors of successful recanalization
Variable
Univariable Analysis Multivariable Analysis
OddsRatio (95% CI)
PValue
Adjusted OddsRatio (95% CI)
PValue
Age 0.99 (0.95–1.04) .94 1.03 (0.97–120.01) .38Sex 0.49 (0.14–1.52) .23 0.50 (0.12–1.88) .32Hypertension 0.29 (0.04–1.16) .12 0.36 (0.04–1.98) .28Initial NIHSS score 0.99 (0.89–1.10) .80 1.01 (0.89–1.15) .84IV rtPA use 1.19 (0.38–4.14) .77 0.97 (0.26–3.86) .97ICA tortuosity 0.44 (0.14–1.48) .17 0.51 (0.14–1.89) .30Distal/proximal BGC
location15.6 (2.92–289.52) .01 13.40 (2.37–254.82) .02
Table 4: Recanalization rates according to ICA tortuositya
Total Tortuosity (+) Tortuosity (−)Total 86/102 (84.3%) 22/28 (78.6%) 64/74 (86.5%)Distal BGC 48/49 (98.0%) 10/11 (90.9%) 38/38 (100%)Proximal BGC 38/53 (71.7%) 12/17 (70.6%) 26/36 (72.2%)
a � indicates present; �, absent.
842 Jeong May 2019 www.ajnr.org

Factors Associated with Improved Efficacy of DistalBalloon-Guiding CatheterizationA number of factors including the diameter of the vessel, length,
tortuosity, surface roughness, and flow velocity can influence the
forced aspiration pressure.
For a straight pipe, the Darcy Weisbach equation states
P � fD
�V2
2
L
D,
Where P is the pressure difference across the pipe, � is the density of
the fluid, V is the average velocity in the pipe, fD is the friction factor,
L is the length of the pipe, and D is the diameter of the pipe.21 Short-
ening of the length correlates with distal location of the BGC. Thus,
distal BGC location will result in a theoretic decrease in the pressure
difference within the system and an increase in the aspiration force.
Our results support the theoretic advantages of distal balloon-guid-
ing catheterization with significant improvement in recanalization
rates. From the equation, we can also postulate that using a BGC with
a larger inner diameter will result in an increased aspiration force;
however, the feasibility and risks of navigating a larger profile BGC to
the distal ICA have to be considered.
Another potential factor for improved recanalization in the distal
BGC group may be related to the extravascular anatomy of the ICA.
The cervical ICA is encased by the soft tissues of the neck. There may
be concerns for collapse of the cervical ICA during forced aspiration
of the proximally positioned BGC.18 On the other hand, the petrous
ICA may be more resistant to collapse due to the thick periosteal layer
attached to the vessel and petrous bone.22 Collapse of the cervical
ICA may result in decreased suction force and dissection. It may also
cause shearing of the clot captured by the stent and result in distal
emboli during retrieval. These concerns may be reflected in the sig-
nificantly lower incidence of successful and complete recanalizations
with proximal balloon-guiding catheterization in our series.
Risks and Other Factors Associatedwith Distal Balloon-GuidingCatheterizationAlthough achieving distal location of the
BGC is favorable in terms of recanaliza-
tion efficacy, this may not always be fea-
sible. One of the main causes of failure
of distal access may be the tortuosity
and/or the diameter of the cervical ICA.
The tortuous vessel hinders safe bal-
loon-guiding catheterization. However,
our series shows that although tortuos-
ity can preclude distal BGC access, it
may be overcome in some cases (Fig-
ure). Distal catheterization was achieved
in 11 of the 28 cases with cervical ICA
tortuosity, and 10 of these 11 cases
(90.9%) resulted in successful recanali-
zation compared with 12 of 17 cases
(70.6%) with proximal catheterization
in patients with tortuous cervical ICAs.
The tortuous vessel may be straightened
by carefully navigating the guidewire or
using coaxial catheters. Distal access
with a coaxial intermediate catheter may
reduce the gap between the 2 catheters, thus reducing the risk of
dissection, and may also provide support for advancement of
the BGC. Selection of a BGC with a soft distal tip may also aid
in safe distal catheterization.
Another cause of failure of distal access may be length incom-
patibility of the BGC. In tall patients or patients with very tortu-
ous aortas, the BGC may not be long enough to reach the distal
ICA, especially when the shorter length BGC is selected. On the
other hand, a longer length BGC may not always be advantageous
in patients with severely tortuous cervical ICAs. Sufficient access
of the distal cervical ICA with the BGC may not be achieved in
these cases; this issue may impede sufficient distal access of the
microcatheter to the occluded artery. Careful investigation of the
cervical vessels on the preprocedural CT angiography, the tortu-
osity of the aorta during sheath introduction, and the habitus of
the patient before selection of the length of the BGCs may aid in
selecting the appropriate-length devices. Other causes may in-
clude oversight of the BGC location by the operator and kickback
of the BGC during microcatheter navigation.
In our retrospective analysis, the BGC was positioned proximally
in almost half of the patients (36/74 patients) despite the nontortuous
cervical ICA. The difference in recanalization rates between patients
with a distal-versus-proximal BGC in nontortuous ICA cases was
about 30% (100% versus 72.2%, Table 4). Considering the signifi-
cant impact on recanalization, the operator should be alert to con-
firming the location of the BGC throughout the procedure.
Despite the improved outcome from distal balloon-guiding
catheterization, its benefits should be carefully weighed against
the potential risks. We experienced 2 cases of left proximal com-
mon carotid artery dissection during reselection of the carotid
artery with a diagnostic catheter for delayed angiograms. Al-
though the location of the dissections was localized in the com-
FIGURE. A 53-year-old woman who presented with acute stroke and an initial NIHSS score of 7.Delayed-phase nonsubtracted lateral DSA image shows occlusion of the left supraclinoid ICA.Acute angulation of the proximal cervical ICA is seen at the lower C2 vertebral level (A). The tip ofthe BGC is located at the C3 vertebral level proximal to the angulation of the cervical ICA (B).Careful balloon-guiding catheterization was successfully performed into the distal cervical ICAdespite the tortuous artery. The tip of the BGC is now located at the C1 vertebral level (C).Stent-retriever thrombectomy with proximal flow control and continuous forced aspirationthrough the distally located BGC was performed. Subtracted lateral DSA image shows completerecanalization after thrombectomy. The cervical ICA shows no signs of dissection (D). The patientshowed good clinical outcome on 3-month follow-up.
AJNR Am J Neuroradiol 40:840 – 44 May 2019 www.ajnr.org 843

mon carotid artery without ICA extension, suggesting that it was
not directly related to BGC navigation in the cervical ICA, endo-
thelial injury may have occurred during initial navigation of the
Shuttle sheath and BGC into the acutely angulated left common
carotid artery and may have been discovered during reselection
for the delayed angiogram. Fortunately, these patients did not
have any serious complications associated with the dissections.
However, such risks should be carefully avoided, especially in pa-
tients with severely tortuous cervical ICAs. Our results also call for
the development of softer tipped and flexible BGCs, which can be
safely navigated distally into the cervical ICA.
In our study, the puncture-to-recanalization time was signifi-
cantly shorter in the distal than in the proximal BGC group. This
feature may be due to the tendency for a decreased mean number
of passes in the distal BGC group (2.3 � 0.4 versus 3.1 � 0.8, P �
.07). Also, the higher incidence of hypertension in the proximal
BGC group may have been associated with more tortuous arteries,
including the aorta, resulting in increased procedural time.23
This study is limited by the retrospective nature of the analysis.
To analyze and prove the concept of BGC location and its impact
on recanalization, we limited the patients in this series to those
treated with a specific type of stent retriever and BGC; thus, there
may be bias. It remains to be clarified whether devices with differ-
ent profiles such as a longer stent retriever would compensate for
the effect of the BGC position because longer stent retrievers may
enhance thrombectomy performance.24 Also, despite the signifi-
cantly higher recanalization rates with distal balloon-guiding
catheterization, the difference in the long-term good outcome
rate did not reach statistical significance, probably due to the
small size of the cohort. Future prospective studies in a larger
cohort are warranted.
CONCLUSIONSIn patients with acute stroke treated with short stent retrievers
and without contact aspiration, the location of the BGC has a
significant impact on the recanalization of occluded arteries. The
BGC should be navigated as distally as safely possible in the cer-
vical ICA for maximally effective thrombectomy.
ACKNOWLEDGMENTSThe authors thank Professor Kyunghwa Han, PhD, Department
of Radiology, Yonsei University College of Medicine, for the sta-
tistical analysis.
Disclosures: Dong Joon Kim—UNRELATED: Consultancy: Stryker Pacific Limited.
REFERENCES1. Berkhemer OA, Fransen PS, Beumer D, et al. A randomized trial of
intraarterial treatment for acute ischemic stroke. N Engl J Med 2015;372:11–20 CrossRef Medline
2. Campbell BC, Mitchell PJ, Kleinig TJ, et al; EXTEND-IA Investiga-tors. Endovascular therapy for ischemic stroke with perfusion-im-aging selection. N Engl J Med 2015;372:1009 –18 CrossRef Medline
3. Goyal M, Demchuk AM, Menon BK, et al; ESCAPE Trial Investiga-tors. Randomized assessment of rapid endovascular treatment ofischemic stroke. N Engl J Med 2015;372:1019 –30 CrossRef Medline
4. Jovin TG, Chamorro A, Cobo E, et al; REVASCAT Trial Investigators.Thrombectomy within 8 hours after symptom onset in ischemicstroke. N Engl J Med 2015;372:2296 –306 CrossRef Medline
5. Saver JL, Goyal M, Bonafe A, et al; SWIFT PRIME Investigators.Stent-retriever thrombectomy after intravenous t-PA vs. t-PAalone in stroke. N Engl J Med 2015;372:2285–95 CrossRef Medline
6. Haussen DC, Rebello LC, Nogueira RG. Optimizating clot retrievalin acute stroke: the push and fluff technique for closed-cell sten-trievers. Stroke 2015;46:2838 – 42 CrossRef Medline
7. McTaggart RA, Tung EL, Yaghi S, et al. Continuous aspiration priorto intracranial vascular embolectomy (CAPTIVE): a techniquewhich improves outcomes. J Neurointerv Surg 2017;9:1154 –59CrossRef Medline
8. Nikoubashman O, Alt JP, Nikoubashman A, et al. Optimizing endo-vascular stroke treatment: removing the microcatheter before clotretrieval with stent-retrievers increases aspiration flow. J Neuroin-terv Surg 2017;9:459 – 62 CrossRef Medline
9. Chueh JY, Kuhn AL, Puri AS, et al. Reduction in distal emboli withproximal flow control during mechanical thrombectomy: a quan-titative in vitro study. Stroke 2013;44:1396 – 401 CrossRef Medline
10. Chueh JY, Puri AS, Wakhloo AK, et al. Risk of distal embolizationwith stent retriever thrombectomy and ADAPT. J Neurointerv Surg2016;8:197–202 CrossRef Medline
11. Nguyen TN, Malisch T, Castonguay AC, et al. Balloon guide catheterimproves revascularization and clinical outcomes with the Solitairedevice: analysis of the North American Solitaire Acute Stroke Reg-istry. Stroke 2014;45:141– 45 CrossRef Medline
12. Paramasivam S, Leesch W, Fifi J, et al. Iatrogenic dissection duringneurointerventional procedures: a retrospective analysis. J Neuro-interv Surg 2012;4:331–35 CrossRef Medline
13. Akpinar S, Yilmaz G. Dissection of extracranial internal carotid ar-tery due to balloon guiding catheter resulting in asymptomatic in-ternal carotid artery occlusion. Iran J Radiol 2016;13:e28209CrossRef Medline
14. Zaidat OO, Yoo AJ, Khatri P, et al; Cerebral Angiographic Revascu-larization Grading (CARG) Collaborators, STIR RevascularizationWorking Group, STIR Thrombolysis in Cerebral Infarction (TICI)Task Force. Recommendations on angiographic revascularizationgrading standards for acute ischemic stroke: a consensus state-ment. Stroke 2013;44:2650 – 63 CrossRef Medline
15. Mokin M, Setlur Nagesh SV, Ionita CN, et al. Comparison of modernstroke thrombectomy approaches using an in vitro cerebrovascularocclusion model. AJNR Am J Neuroradiol 2015;36:547–51 CrossRefMedline
16. Hacke W, Kaste M, Fieschi C, et al. Randomised double-blind pla-cebo-controlled trial of thrombolytic therapy with intravenous al-teplase in acute ischaemic stroke (ECASS II): Second European-Australasian Acute Stroke Study Investigators. Lancet 1998;352:1245–51 CrossRef Medline
17. Velasco A, Buerke B, Stracke CP, et al. Comparison of a balloonguide catheter and a non-balloon guide catheter for mechanicalthrombectomy. Radiology 2016;280:169 –76 CrossRef Medline
18. Klinger-Gratz PP, Schroth G, Gralla J, et al. Protected stent retrieverthrombectomy prevents iatrogenic emboli in new vascular territo-ries. Neuroradiology 2015;57:1045–54 CrossRef Medline
19. Jindal G, Serulle Y, Miller T, et al. Stent retrieval thrombectomy in acutestoke is facilitated by the concurrent use of intracranial aspirationcatheters. J Neurointerv Surg 2017;9:944–47 CrossRef Medline
20. Humphries W, Hoit D, Doss VT, et al. Distal aspiration with retrievablestent assisted thrombectomy for the treatment of acute ischemicstroke. J Neurointerv Surg 2015;7:90–94 CrossRef Medline
21. White FM. Fluid Mechanics. 8th Edition. New York: McGraw-HillEducation; 2016
22. Sekhar LN, Schramm VL Jr, Jones NF, et al. Operative exposure andmanagement of the petrous and upper cervical internal carotid ar-tery. Neurosurgery 1986;19:967– 82 CrossRef Medline
23. Dobrin PB, Schwarcz TH, Baker WH. Mechanisms of arterial andaneurysmal tortuosity. Surgery 1988;104:568 –71 Medline
24. Haussen DC, Al-Bayati AR, Grossberg JA, et al. Longer stent retriev-ers enhance thrombectomy performance in acute stroke. J Neuroin-terv Surg 2019;11:6 – 8 CrossRef Medline
844 Jeong May 2019 www.ajnr.org

CLINICAL REPORTINTERVENTIONAL
Angiographic and Clinical Features of NoninvolutingCongenital Hemangiomas
X A. Patel, X R. De Leacy, and X A. Berenstein
ABSTRACTSUMMARY: While infantile hemangiomas are very common, congenital hemangiomas are rare and less understood. Congenital heman-giomas are present at birth. They fall into 2 major categories: rapidly involuting congenital hemangioma and noninvoluting congenitalhemangioma. Noninvoluting congenital hemangioma is the rarer of the 2 entities. If not recognized and treated appropriately, noninvo-luting congenital hemangioma can lead to considerable morbidity. There is a paucity of literature regarding noninvoluting congenitalhemangiomas. In this article, we will outline our experience with this condition, focusing on clinical and angiographic features. There is adistinct angiographic appearance of noninvoluting congenital hemangiomas involving an arterial-capillary web, a dense tumor blush withidentifiable feeding arteries, no arteriovenous shunting, and variably present draining veins. Our experience with endovascular emboliza-tion and direct percutaneous treatment is the largest for this entity to date. Endovascular embolization and/or direct percutaneoussclerotherapy of this lesion may obviate subsequent surgical resection.
ABBREVIATION: NICH � noninvoluting congenital hemangioma
Hemangiomas are vascular tumors that enlarge through pro-
liferation of endothelial cells. Infantile hemangiomas are
common lesions, occurring in up to 10% of infants and young
children.1 These tumors generally appear in the first 6 weeks of life
and subsequently undergo a spontaneous involution phase. Dig-
ital subtraction angiography, if performed, will demonstrate di-
lated feeding arteries, organized arterial angioarchitecture, a
dense parenchymal blush, and drainage into dilated draining
veins.1 Infantile hemangiomas may demonstrate rapid venous
filling, indicating arteriovenous shunting.
Congenital hemangiomas are much rarer lesions. Physicians
caring for pediatric patients with hemangiomas have long noted
that infants would occasionally present with congenital hemangi-
omas.2 These hemangiomas undergo their proliferative phase in
utero. Therefore, while they can still grow proportionally as the
patient ages, these hemangiomas will not demonstrate accelerated
or disproportionate postnatal growth. The pathologic character-
istic distinguishing these lesions from the more common infantile
hemangioma is the lack of expression of glucose transporter iso-
form 1 (GLUT1).3
There are 2 types of congenital hemangiomas: rapidly involut-
ing congenital hemangiomas and noninvoluting congenital hem-
angiomas (NICHs). These lesions rarely coexist with the more
common infantile hemangiomas and are usually solitary. As the
name implies, rapidly involuting congenital hemangioma lesions
undergo a rapid involuting phase, and most cases demonstrate
complete involution within the first 6 –14 months of life.4 Man-
agement of these lesions is straightforward if the patient presents
typically. Observation is, in general, the initial approach. Lesions
that do not involute may need biopsy to exclude a tumor such as
rhabdomyosarcoma or congenital fibrosarcoma.
Noninvoluting congenital hemangiomas are even rarer than
rapidly involuting congenital hemangioma lesions. Most lesions
occur in the head and neck, trunk, or limbs. These lesions tend to
be plaquelike, pink-to-purple with telangiectasia on the surface.
They are often warm to touch. Noninvoluting congenital heman-
giomas stain negative for GLUT1, and a characteristic hobnailed
appearance is often seen on pathology. As their name implies,
these lesions will never disappear or involute. Imaging often dem-
onstrates hyperintensity on T2-weighted images with flow voids
similar to those in infantile hemangiomas. A limited description
of the angiographic features of these lesions and endovascular
Received November 16, 2018; accepted after revision March 2, 2019.
From the Department of Radiology (A.P.), New York Presbyterian-Weill CornellMedical Center, New York, New York; and Cerebrovascular Center (R.D.L., A.B.),Icahn School of Medicine at Mount Sinai, New York, New York.
Previously presented at: American Society of Neuroradiology Annual Meeting andthe Foundation of the ASNR Symposium, June 2–7, 2018;Vancouver, British Columbia, Canada.
Please address correspondence to Anant Patel, MD, Department of Radiology,New York Presbyterian-Weill Cornell Medical Center, 520 E 70th Street, Starr 8a,New York, New York 10021; e-mail: [email protected]; @AnantPatelMD
Indicates article with on-line table.
http://dx.doi.org/10.3174/ajnr.A6044
AJNR Am J Neuroradiol 40:845– 48 May 2019 www.ajnr.org 845

approaches for treating them is available.5 The literature focuses
on resection as the mainstay of treatment. Previous, limited re-
ports of endovascular embolization are only in the context of a
preoperative setting to control bleeding in larger lesions during
subsequent resection. Here, we report our experience with this
entity and demonstrate that endovascular embolization and/or
direct percutaneous sclerotherapy can be an effective treatment
strategy in well-selected cases.
Case Series
Case Selection. Using Mount Sinai institutional review board–
approved protocol, all cases of noninvoluting congenital heman-
giomas from 1990 to present were identified for this retrospective
study. Ten patients were identified from the January 1990 to May
2017. All cases were patients who had been referred for endovas-
cular embolization and/or direct percutaneous sclerotherapy. All
patients were treated. Indications for treating NICH included cos-
metic deformity, location not suitable for gross resection, lesions
previously treated but not regressing, or the need to shrink the size
of the lesion so that it could be amenable to a subsequent
resection.
Lesion location, clinical scenario, patient age, angiographic
features, embolization technique, postembolization angiography,
need for multiple treatments (if applicable), complications, and
long-term clinical follow-up were recorded. Comparison with
any prior or subsequent imaging after angiography was per-
formed to document stability. When possible, we accessed pathol-
ogy reports confirming GLUT1 negativity in these patients with
NICH.
Angiography and EndovascularEmbolization
For patients undergoing angiography
and embolization, the right common
femoral artery was accessed. A 4F sheath
was placed. A 4F Berenstein catheter
(Boston Scientific, Fremont, California)
and/or Prowler 10 microcatheter (Cod-
man & Shurtleff, Raynham, Massachu-
setts) was used to superselect the vessel
of interest. Superselective injections
with the microcatheter along the arcade
of the vascular lesion would be per-
formed to confirm an angiographic ap-
pearance of the NICH.
Embolization was performed once
distal catheterization was achieved and
it was determined that the patient’s le-
sion was suitable for treatment. In most
cases, we used n-BCA. Specifically, we
generally used 0.7 mL of 25% n-BCA
(1 mL of n-BCA mixed with 3 mL of
Ethiodol [Andre Guerbet, Melville, New
York]) for injection. The relatively small
volume of n-BCA reflects the relative
overall volumes of these lesions (most
patients were small children), limited
number of pedicles in most lesions, and the primary objective of
the n-BCA often being to slow down the flow in the main pedicle.
Direct Percutaneous SclerotherapyPatients presenting with very large hemangiomas undergoing di-
rect percutaneous sclerotherapy were also reviewed. This tech-
nique was used more frequently across time as the practice of our
primary operator evolved. Under direct fluoroscopic monitoring,
direct percutaneous puncture of the lesion of interest at multiple
locations was performed. Following establishment of blood flow,
a small amount of contrast material was injected to confirm the
intravascular location of our angiocatheter. Subsequently, we
would sclerose the hemangioma with progressive small injections
of 98% ethanol. Given the nature of the lesions, we would inject
either in the central portion of the mass or in separate com-
partments to decrease the overall size. Many cases indeed
used multiple, separate puncture sites in which ethanol was
injected followed by �5 mL of Avitene microfibrillar collagen
hemostat suspension (Bard Davol, Warwick, Rhode Island) for
hemostasis.
OutcomesWe identified 10 patients who underwent 25 total treatments. The
On-line Table summarizes the key clinical and angiographic fea-
tures of our patients. Most of our patients presented between 2
and 8 years of age. One patient underwent treatment at 44 years of
age. Seven patients were female, and 3 were male. Five patients
were treated with endovascular embolization, 2 patients were
treated with percutaneous sclerotherapy, and 3 patients were
FIG 1. Left internal maxillary artery injection of a NICH of the left anterior chest wall. The lesionwas initially treated with QuadraSphere Microspheres; the treatment was not successful. Subse-quent treatment with an ethanol injection led to involution.
FIG 2. Right external carotid artery injection of a right facial NICH. Again, there is a discreteangiographic appearance involving an arteriocapillary web, no arteriovenous shunting, and iden-tifiable draining veins. This lesion was treated successfully with polyvinyl alcohol particles.
846 Patel May 2019 www.ajnr.org

treated with a combination of the 2 approaches as the practice of
our primary operator evolved.
Patients were seen in clinic between 1 and 2 months after treat-
ment and at 12 months. As shown in the On-line Table, most
patients required between 1 and 2 treatments to achieve 12
months without lesion recurrence or progression. One of our
patients did require a total of 12 treatments (in addition to 3
prior endovascular treatments at a peer institution) before sur-
gical resection. Another patient required 2 treatments before
surgical resection. The remaining 8 patients did not need an
operation.
DISCUSSIONOur cases highlight several important points: noninvoluting con-
genital hemangiomas have the same angiographic appearance
throughout the body. Figure 1 of a case involving an NICH in the
anterior chest wall shows the same features as a facial NICH, in-
cluding a discrete arterial-capillary web, homogeneous tumor
blush, no arteriovenous shunting, and draining veins. This lesion
was initially treated with QuadraSphere Microspheres (Merit
Medical, South Jordan, Utah) (and did not significantly involute).
The lesion was subsequently successfully treated with ethanol.
Figure 2 highlights a right facial NICH with similar angiographic
features. This lesion was successfully treated with polyvinyl alco-
hol particles, 45–120 �m. Markedly enlarged draining veins are
noted in this example.
Contrary to previous reports, our experience shows that in
some cases, endovascular embolization or direct percutaneous
sclerotherapy can obviate surgical resection. The largest previ-
ous case series on NICH identified 53 patients across 3 large
vascular anomaly centers.5 However, this study had a limited
description of angiographic features, and only 7 of 53 patients
underwent embolization, which was performed explicitly to
possibly decrease bleeding in a subsequent resection. This ar-
ticle goes on to say that “embolization is unnecessary.” Two of
our cases showed that preprocedural embolization can consid-
erably decrease intraoperative bleeding. More important, 6 of
our cases suggest that effective endovascular embolization
and/or direct sclerotherapy can entirely obviate a resection.
FIG 3. Pre- and postembolization images of a right parotid NICHtreated with n-BCA. There were 5 vascular pedicles seen on angiog-raphy, and each was injected with 25% n-BCA (0.15– 0.45 mL perpedicle).
FIG 4. An incredibly vascular left parotid lesion. This lesion was treated with both endovascular embolization and direct percutaneoussclerotherapy. Postembolization image (E) from this case shows a markedly reduced vascular supply.
AJNR Am J Neuroradiol 40:845– 48 May 2019 www.ajnr.org 847

Indeed, we have seen that endovascular embolization and/or
direct sclerotherapy can effectively decrease the vascular sup-
ply, lead to involution, and, in appropriately selected cases, be
a definitive treatment.
Another important observation from our experience is that both
endovascular embolization and direct percutaneous sclerotherapy
are effective. Figure 3 highlights a right parotid NICH in a 4-year-old
patient. The lesion was not regressing. A dense tumor stain was ob-
servable as well as 5 discrete vascular pedicles feeding the lesion. The
lesion was successfully treated with n-BCA.
Direct percutaneous sclerotherapy is another technique
that can be used. Our group’s experience is that this technique
works well in select cases. Moreover, use of this procedure increased
with time, mirroring the evolution of our primary operator’s prac-
tice. Figure 4 highlights a case using both endovascular embolization
and direct percutaneous sclerotherapy with Avitene. This was an ex-
tremely vascular tumor, and the combination of both techniques led
us to achieve occlusion of approximately 80% of the tumor.
Our study has some limitations. Our case series includes only
10 patients. However, this mainly underscores the rare incidence
of this condition. Only 2 patients had a biopsy before our inter-
vention, which showed GLUT1 negativity, confirming NICH. The
remaining patients did not have a preprocedural biopsy but were
noted to have a clinical scenario reliably demonstrating an NICH
lesion. Moreover, because a subsequent operation was not neces-
sary, no sample of tissue was sent for GLUT1 staining.
Five of our patients needed only 1 treatment. One patient was
noted to have undergone 12 embolizations with us, many of
which were after surgical resection. Additionally, this patient had
3 prior embolizations at Johns Hopkins.
CONCLUSIONSOur study is the largest case series of embolization and/or direct
sclerotherapy for NICH and the most thorough evaluation of an-
giographic features associated with these lesions. NICHs have dis-
tinguishing angiographic and clinical features. Endovascular or
direct percutaneous embolization or both are effective treatment
strategies that may obviate surgical resection.
Disclosures: Reade De Leacy—UNRELATED: Board Membership: Asahi Intecc, Com-ments: research grant*; Consultancy: Siemens, Penumbra. Alejandro Berenstein—RELATED: Grant: MicroVention; Consulting Fee or Honorarium: MicroVention, MiviNeuroscience, Scientia Vascular, Endostream Medical LTD, Bendit Technologies,Magneto Thrombectomy Solutions; UNRELATED: Royalties: AngioDynamics;Stock/Stock Options: Mivi Neuroscience, Endostream Medical LTD, ScientiaVascular, Bendit Technologies, Magneto Thrombectomy Solutions. *Money paidto the institution.
REFERENCES1. Song JK, Niimi Y, Berenstein A. Endovascular treatment of hemangi-
omas. Neuroimaging Clin N Am 2007;17:165–73 CrossRef Medline2. Krol A, MacArthur CJ. Congenital hemangiomas: rapidly involuting
and noninvoluting congenital hemangiomas. Arch Facial Plast Surg2005;7:307–11 CrossRef Medline
3. North PE, Warner M, Mizeracki A, et al. GLUT1: a newly discoveredimmunohistochemical marker for juvenile hemangiomas. HumPathol 2000;31:11–22 CrossRef Medline
4. Mulliken JB, Enjoiras O. Congenital hemangiomas and infantilehemangioma: missing links. J Am Acad Dermatol 2004;50:875– 82CrossRef Medline
5. Enjolras O, Mulliken JB, Boon LM, et al. Noninvoluting congenitalhemangioma: a rare cutaneous vascular anomaly. Plast Reconstr Surg2001;107:1647–54 CrossRef Medline
848 Patel May 2019 www.ajnr.org

ORIGINAL RESEARCHHEAD & NECK
Reduced Jet Velocity in Venous Flow after CSF Drainage:Assessing Hemodynamic Causes of Pulsatile Tinnitus
X H. Haraldsson, X J.R. Leach, X E.I. Kao, X A.G. Wright, X S.G. Ammanuel, X R.S. Khangura, X M.K. Ballweber, X C.T. Chin,X V.N. Shah, X K. Meisel, X D.A. Saloner, and X M.R. Amans
ABSTRACT
BACKGROUND AND PURPOSE: Idiopathic intracranial hypertension is commonly associated with transverse sinus stenosis, a venouscause of pulsatile tinnitus. In patients with idiopathic intracranial hypertension, CSF drainage via lumbar puncture decreases intracranialpressure, which relieves the stenosis, and may provide at least temporary cessation of pulsatile tinnitus. The objective of this study was toevaluate changes in venous blood flow caused by lowered intracranial pressure in patients with pulsatile tinnitus to help identify the causeof pulsatile tinnitus.
MATERIALS AND METHODS: Ten patients with suspected transverse sinus stenosis as a venous etiology for pulsatile tinnitus symptomsunderwent MR imaging before and after lumbar puncture in the same session. The protocol included flow assessment and rating ofpulsatile tinnitus intensity before and after lumbar puncture and MR venography before lumbar puncture. Post-lumbar puncture MRvenography was performed in 1 subject.
RESULTS: There was a lumbar puncture–induced reduction in venous peak velocity that correlated with the opening pressure (r � �0.72,P � .019) without a concomitant reduction in flow rate. Patients with flow jets had their peak velocity reduced by 0.30 � 0.18 m/s (P � .002),correlating with a reduction in CSF pressure (r � 0.82, P � .024) and the reduction in subjectively scored pulsatile tinnitus intensity (r � 0.78,P � .023). The post-lumbar puncture MR venography demonstrated alleviation of the stenosis.
CONCLUSIONS: Our results show a lumbar puncture–induced reduction in venous peak velocity without a concomitant reduction inflow rate. We hypothesize that the reduction is caused by the expansion of the stenosis after lumbar puncture. Our results further showa correlation between the peak velocity and pulsatile tinnitus intensity, suggesting the flow jet to be instrumental in the development ofsound.
ABBREVIATIONS: CE � contrast-enhanced; 2Dflow � time-resolved MR velocimetry in a 2D plane; 4Dflow � time-resolved MR velocimetry in a 3D volume; IIH �idiopathic intracranial hypertension; LP � lumbar puncture; MRV � MR venography; PT � pulsatile tinnitus
Pulsatile tinnitus (PT) is the auditory perception of a rhyth-
mic, cardiac-synchronized, “whooshing” sound in the ab-
sence of an external source, which affects nearly 3 million
Americans.1-4 The impact of PT is high due to difficulties in
diagnosis, the health risks associated with the underlying caus-
ative diseases, and extremely common comorbid debilitating
psychiatric illnesses. In addition, several of the anomalies that
cause PT can have serious sequelae such as ischemic stroke,
blindness, or intracranial hemorrhage.5-7 PT is often related to
abnormal flow, including turbulence, in the blood vessels near
the cochlea, but the exact mechanism of sound production
remains elusive.
Idiopathic intracranial hypertension (IIH) is 1 cause of PT that
carries a risk of developing blindness. Many patients with IIH have
stenosis of 1 or both transverse sinuses at the junction with the sig-
moid sinus, which may be caused by increased curvature of the ten-
torium cerebelli.8-10 Stent placement in usually 1 of these stenoses has
been shown in prospective trials to both treat IIH and resolve pa-
tients’ pulsatile tinnitus.11-14 In addition, lumbar puncture (LP) with
removal of CSF temporarily decreases intracranial pressure and re-
Received August 1, 2018; accepted after revision March 18, 2019.
From the Departments of Radiology and Biomedical Imaging (H.H., J.R.L., E.I.K.,A.G.W., S.G.A., R.S.K., M.K.B., C.T.C., V.N.S., D.A.S., M.R.A.) and Neurology (K.M.), Uni-versity of California, San Francisco, San Francisco, California; and Radiology Service(D.A.S.), VA Medical Center, San Francisco, California.
This work was supported by National Institutes of Health, R21DC016087(M.R.A./D.A.S.).
Paper previously presented, in part, at: Annual Meeting of the Society for Mag-netic Resonance Angiography, August 28 –31, 2018; Glasgow, Scotland; and Ameri-can Society of Neuroradiology Annual Meeting and the Foundation of the ASNRSymposium, June 2–7, 2018; Vancouver, British Columbia, Canada.
Please address correspondence to Matthew R. Amans, MD, MSc, Department ofRadiology and Biomedical Imaging, UCSF, 505 Parnassus Ave, Room L349, San Fran-cisco, CA 94143; e-mail: [email protected]
Indicates open access to non-subscribers at www.ajnr.org
http://dx.doi.org/10.3174/ajnr.A6043
AJNR Am J Neuroradiol 40:849 –54 May 2019 www.ajnr.org 849

sults in a temporary improvement in the patients’ IIH symptoms,
including PT.
Recent advances in measuring the velocity field of blood flow
in a 3D volume through the cardiac cycle using phase contrast MR
imaging, referred to as 4Dflow, have allowed depiction of blood
flow in the main cerebral outflow veins of patients.15-17 In this
study, we used 4Dflow to try to determine the flow patterns that
may be causing pulsatile tinnitus in patients with venous sinus
stenoses who are suspected of having IIH. We performed flow
analysis of the transverse sinus stenosis before and after removal
of CSF via LP (which often at least temporarily resolves PT in
patients with IIH). The aim of the study was the following: 1) to
investigate whether flow jets, a potential source of turbulent flow,
are present in symptomatic patients; 2) to see if these flow jets are
reduced by reducing the intracranial pressure via LP; and 3) to
determine whether the reduction in flow jets correlates with the
improvement in PT sound intensity.
MATERIALS AND METHODSWe prospectively performed MR imaging of adult patients with a
suspected venous etiology of pulsatile tinnitus before and after
MR imaging– guided LP with removal of as much as 20 mL of CSF
using a study protocol approved by the Institutional Review
Board at UCSF. All patients signed written informed consent to
participate in this study.
Patient SelectionTen patients with PT and suspected IIH and venous etiology of PT
were recruited from the University of California, San Francisco
Pulsatile Tinnitus Clinic, a multispecialty clinic that evaluates pa-
tients with PT. PT was suspected to be of venous etiology if a
patient described a low-pitched, pulse-synchronous sound that
improved with ipsilateral neck compression, and potential arte-
rial (or other) causes such as carotid atherosclerosis, fibromuscu-
lar dysplasia, tumor, or dural arteriovenous fistula were not iden-
tified on noninvasive imaging. Patients were suspected of having
IIH if they had symptoms of IIH and an MR imaging that ex-
cluded intracranial mass, but had findings suggestive of IIH (in-
cluding transverse sinus stenosis, optic nerve sheath distension or
kinking, and a partially empty and expanded sella).
Experimental ProtocolPre-LP MR imaging, MR imaging– guided LP, and post-LP MR
imaging were performed consecutively in an interventional MR
imaging suite using a 1.5T MR imaging system. None of the sub-
jects were administered anxiolytic or analgesic medications before
the LP or MR imaging. A summary of the MR imaging parameters
is shown in Table 1.
The pre-LP MR imaging examination started with a low-res-
olution timing run performed after a 2-mL Gd-DTPA bolus fol-
lowed by a 20-mL saline flush (both administered at 2 mL/s) to
determine the transit time from the injection site to the jugular
vein. A contrast-enhanced MR venography (CE-MRV) was then
acquired, timed to the venous phase as determined by the timing
run. That study used a high-resolution CE-MR venogram with a
20-mL Gd-DTPA bolus followed by a 20-mL saline flush (both
administered at 2 mL/s). For 1 patient, Gd-DTPA was replaced
with ferumoxytol. In accordance with our institutional guide-
lines, 12 mL of ferumoxytol was infused slowly for 20 minutes
before the MR imaging acquisition, and the timing run was not
performed. Following the CE-MR venogram, sinus flow rates
were acquired with time-resolved MR velocimetry in a 2D plane
(2Dflow) in planes perpendicular to the sigmoid sinuses just distal
to their junctions with the jugular veins. Finally, the velocities in
the sinuses were measured using 4Dflow acquired in a slab cover-
ing the transverse and sigmoid sinuses.
Before LP, patients were asked to rate their PT symptoms on a
0 –10 Likert scale. Ten was rated as the sound intensity of a passing
train, 6 was the intensity of a typical conversation in a restaurant,
and 0 was no symptoms at the time of evaluation. LP was per-
formed under MR imaging guidance on the MR imaging table of
the interventional MR imaging suite. Opening pressure was mea-
sured with subjects lying in the decubitus position with legs re-
laxed. IIH was diagnosed by the modified Dandy criteria as open-
ing pressure of �25 cm H2O.18 Patients had 20 mL of CSF
withdrawn, which was sent for routine laboratory analysis if the
opening pressure was �25 cm H2O. Closing pressure was mea-
sured after removal of CSF. Patients were asked to again rate their
PT on the same 0 –10 scale after CSF removal.
Following the LP, a post-LP MR imaging acquisition in-
cluded 2D- and 4Dflow as previously described. Furthermore,
the prolonged intravascular residence time of ferumoxytol of
�12 hours19,20 permitted a repeat post-LP CE-MR venogram for
1 patient without administration of an additional contrast
agent.21
Flow PostprocessingThe peak velocity at several locations along the ipsilateral sinuses
was obtained using in-house software, schematically described in
Fig 1. Postprocessing begins with contouring the transverse and
sigmoid sinuses on the symptomatic side from the CE-MRV.
This is followed by a phase-offset background correction to the
4Dflow and registering the CE-MRV contour to both the pre- and
post-LP 4Dflow. Then, the centerline of the contoured lumen is
extracted, and cross-sectional cut planes are generated at 1-mm
intervals along the flow lumen. Last, peak velocities are extracted
from each of the cut planes along the centerline across time. The
Table 1: MR imaging parametersAcquisition ParametersCE-MRV FOV � 240 � 180 � 108 mm, acq. matrix � 400 � 286 � 90, acq. time � 66 sec, TR � 5.0 ms, TE � 1.8 ms, FA � 30°,
SENSE � 24Dflow FOV � 240 � 193 � 34 mm, acq. matrix � 184 � 149 � 24, acq. time � 12 min, TR � 6.5 ms, TE � 2.9 ms, FA � 8°,
SENSE � 2, segments � 3, VENC � 1.5 m/s2Dflow FOV � 160 � 120 mm, acq. matrix � 160 � 120, acq. time � 73 sec, TR � 8.8 ms, TE � 5.4 ms, FA � 15°, segments � 2,
VENC � 0.75 m/s
Note:—acq. indicates acquisition; SENSE, sensitivity encoding; FA, flip angle; VENC, velocity encoding.
850 Haraldsson May 2019 www.ajnr.org

peak velocity of �0.5 m/s visually matched the appearance of a
flow jet, so this velocity was used as a threshold value to determine
the presence of jets.
Flow rates were quantified using Segment (http://segment.
heiberg.se)22 to evaluate the 2Dflow data acquired through the
sigmoid sinus.
Statistical AnalysisLinear regression was performed to investigate the relation be-
tween the opening pressure and the change in peak velocity
caused by the CSF drainage. To investigate potential confounding
characteristics, we used ANOVA to test whether linear regression
models with 2 variables were better than a model using the open-
ing pressure alone. The additional variables investigated were flow
rate, stenosis severity, change in CSF pressure, and the amount of
CSF drained.
Statistical analysis was performed on both the group as a whole
but also on the subgroup of patients with ipsilateral flow jets,
which depict the impact for PT with suspected flow jet etiology.
Paired t tests were used to detect changes in intracranial pres-
sure, flow rate, and velocities before and after lumbar puncture.
The Pearson product momentum correlation was used to deter-
mine whether a reduction in peak velocity correlated with the
reduction in intracranial pressure, and it was also used to deter-
mine whether the reduction in peak velocity correlated with the
reduction in PT sound intensity.
RESULTSTen patients were included in the study. Seven of the 10 patients
did not meet the diagnostic criteria for IIH8; 2 were PT asymp-
tomatic at the time of the pre-LP query;an ipsilateral jet with peak velocity of�0.5 m/s was identified in 8 of the 10patients; and 1 patient underwent place-
ment of a lumbar drain preventing re-
cording of the closing pressure. A sum-
mary of the patient information is
provided in Table 2.
There was a correlation between the
change in ipsilateral peak velocity and the opening pressure (r �
�0.72, P � .019 for all patients, Fig 2, and r � �0.80, P � .030
for patients without IIH). No confounding characteristics were
found by adding a second variable to the linear regression in ad-
dition to the opening pressure: flow rate (P � .208), stenosis se-
verity (P � .375), change in CSF pressure (P � .543), and the
amount of CSF drained (P � .529).
No correlation was found between opening pressure and the
change in the ipsilateral flow rate (r � 0.21, P � .564). There
was also a correlation between the change in the PT rating and
the reduction in peak velocity (r � 0.67, P � .035). The severity
of the stenosis was not found to correlate with peak velocity
(r � 0.50, P � .146) or a change in peak velocity (r � �0.40,
P � .258).
Patients with an Ipsilateral JetEight of 10 patients had an ipsilateral flow jet, as illustrated in
Fig 3. Two of these were asymptomatic at the time of the
pre-LP query. The lumbar puncture reduced CSF pressure by a
mean of 12.8 � 3.4 cm H2O (P � .001) without significant
changes in the ipsilateral bulk flow rate (P � .479). Neverthe-
less, the peak velocity was reduced by a mean of 0.30 � 0.18
m/s (P � .002). The reduction in peak velocity correlated with
the reduction in pressure (r � 0.82, P � .024) and with the
reduction in subjectively scored PT intensity (r � 0.78, P �
.023). The hemodynamic relations for these patients are illus-
trated in Fig 4.
The 6 patients experiencing pre-LP PT symptoms reported a
mean PT intensity reduction of 3.8 � 3.4.
Table 2: Summary of patientsa
Pre-LP Post-LP P ValuePressure (cm H2O) 21.7 � 5.2 8.9 � 2.0 �.001PT intensity 4.4 � 3.2 1.7 � 2.5 .020Ipsilateral flow rate (mL/min) 393 � 100 406 � 92 .296Ipsilateral peak velocity (m/s) 0.98 � 0.37 0.73 � 0.25 .003CSF withdrawn (mL) 14.9 � 6.4Severity of stenosis 77.9 � 28.0
a Data are means unless otherwise indicated.
FIG 1. Left, MR venogram (gray) of the bilateral transverse and sigmoid sinuses showing the centerline and transverse cut planes. Right, The peakvelocity along the centerline is plotted for different time points in the cardiac cycle before (red) and after (blue) LP.
AJNR Am J Neuroradiol 40:849 –54 May 2019 www.ajnr.org 851

Patients without an Ipsilateral JetTwo patients did not have an ipsilateral flow jet. The first of these
patients had a contralateral jet of reduced peak velocity after lum-
bar puncture (0.61 m/s from 0.67 m/s pre-LP), matching the mild
improvement of the PT intensity (4 to 3). The second patient had
high velocities in the external carotid artery, which subsided after
LP, qualitatively matching the reduction in PT intensity (decreas-
ing from 3 to 0).
Pre- and Post-LP MRVThe patient imaged using ferumoxytol contrast underwent both
pre- and post-LP CE-MR venography studies, demonstrating
near-complete resolution of transverse sinus stenosis at a lower
CSF pressure (10 cm H2O from 25 cm H2O before LP) (Fig 5).
DISCUSSIONThe aim of this study was to investigate changes in venous sinus
flow features and PT intensity in response to lumbar puncture.
The key findings in this study were the following: 1) Flow jets were
seen in most cases in this study; 2) lowering the CSF pressure
decreased the peak velocity of the flow jet in a venous sinus ste-
nosis, without a concomitant reduction in the bulk flow rate; and
3) the reduction of peak velocity correlated with a reduced PT
sound intensity. We thus hypothesize that the flow jet, and not the
sinus bulk flow rate, is related to PT in patients with a transverse
sinus stenosis.
The suspected cause of the decrease in peak jet velocity
post-LP is an alleviation of transverse sinus stenosis as suggested
by prior case reports.23-26 We were able to directly demonstrate
this with MR venography in 1 patient using a blood pool contrast
agent, and we believe this study is the first to use MR venography
to show an immediate resolution in venous sinus stenosis after LP.
The direct relationship between peak jet velocity and CSF
pressure was maintained for patients in this series who met the
Dandy criteria for IIH (CSF opening pressure of �25 cm H2O)
and for patients not meeting the Dandy criteria. Of our subjects
who had improvement in their PT after removal of CSF, 5 of 7 had
an opening pressure of �20 cm H2O, a threshold for abnormal
elevation proposed by Corbett and Mehta27 for patients with a
normal body mass index. Of note, venous sinus stenosis was ob-
served in all patients in this series meeting or exceeding the 20-cm
H2O threshold.
In a prospective trial, Boddu et al11 showed that PT can be
alleviated in patients with IIH with venous sinus stent placement,
and our results suggest that broadening this therapy to patients
with PT who do not have IIH may warrant consideration, at least
for patients with a transverse sinus stenosis whose symptoms im-
prove with LP reduction of CSF pressure.28
While this study suggests the flow jet to be critical in the de-
velopment of sound, the mechanistic link between a flow jet and
PT symptoms remains opaque. We hypothesize that the transi-
tion into turbulent flow that can occur during the deceleration of
these jets immediately “downstream” from the stenosis is a prob-
able cause of the sound that causes PT.29 However, other ana-
tomic variables may also play a role, such as sigmoid sinus diver-
ticula, which can sometimes be seen in patients with transverse
sinus stenosis.
At first glance, a finding that a reduction in symptoms follow-
ing LP is not associated with a reduction in flow appears some-
what counterintuitive. Although not statistically significant, our
data rather indicate that the flow rate might be slightly increased.
On closer consideration however, it is known and expected that a
vascular stenosis will, at first, have little effect on volume flow
rates while peak velocities in the jet rise (and this feature forms the
basis of Doppler sonography evaluation of stenoses of the ex-
tracranial carotid arteries). In carotid bruits, it is the disordered
flow caused by the jet that is the source of sound, and that would
be consistent with our observations reported here for PT. We also
note that the reduced intracranial pressure seems to result in im-
provement in a very focal area of stenosis, and not the entirety of
the sinus. In fact, most of the stenoses in this cohort were caused
by compression from an arachnoid granulation as opposed to a
smooth extrinsic stenosis. This discrepancy may help to explain
the disparity between our results and prior work.
We hypothesized that the reduced peak velocities, without
concomitant reduction in flow rates, primarily are the result of a
reduction in the degree of stenosis. The stenoses caused by intra-
FIG 2. Lumbar puncture–induced change in ipsilateral peak velocityin relation to opening pressure.
FIG 3. The left side shows an ipsilateral flow jet pre-LP that is weak-ened post-LP without a concomitant change in the flow rate (374 –381mL/min). The rating of PT intensity for this patient was reduced from9 to 0.
852 Haraldsson May 2019 www.ajnr.org

cranial hypertension of �20 cm H2O are alleviated by an LP-
induced reduction in intracranial pressure resulting in a concom-
itant reduction in the jet velocities. This hypothesis is supported
by the pre- and post-LP MRA seen in Fig 5, which clearly shows
widening of the transverse sinus stenosis after the LP.
CONCLUSIONSThe objective of this study was to evaluate changes in venous
blood flow caused by lowered intracranial pressure in patients
with PT after LP to help identify the cause of PT. Our results show
an LP-induced reduction in venous peak velocity without a con-
comitant reduction in flow rate. We hypothesize that the reduc-
tion in jet velocity is caused by the alleviation of the transverse
stenosis following LP. Our results further show a correlation be-
tween peak velocity and PT intensity, suggesting that flow jets are
critical in the development of sound.
ACKNOWLEDGMENTSWe thank Drs Wade Smith and Jonathan Horton for their helpful
conversations in developing the concepts behind this work.
Disclosures: Henrik Haraldsson—RELATED: Grant: National Institutes of Health.*David A. Saloner—RELATED: Grant: National Institutes of Health.* Matthew R.Amans—RELATED: Grant: National Institutes of Health, Comments: R21DC016087*;UNRELATED: Consultancy: Covidien, Stryker Neurovascular, Comments: minor fi-nancial compensation for consultant work. Alexandra G. Wright—RELATED: Grant:National Institutes of Health, R21DC016087.* *Money paid to the institution.
REFERENCES1. Krishnan A, Mattox DE, Fountain AJ, et al. CT arteriography and
venography in pulsatile tinnitus: preliminary results. AJNR Am JNeuroradiol 2006;27:1635–38 Medline
2. Liyanage SH, Singh A, Savundra P, et al. Pulsatile tinnitus. J LaryngolOtol 2006;120:93–97 CrossRef Medline
3. Madani G, Connor SE. Imaging in pulsatile tinnitus. Clin Radiol2009;64:319 –28 CrossRef Medline
4. Harvey RS, Hertzano R, Kelman SE, et al. Pulse-synchronous tinni-tus and sigmoid sinus wall anomalies: descriptive epidemiologyand the idiopathic intracranial hypertension patient population.Otol Neurotol 2014;35:7–15 CrossRef Medline
5. Cognard C, Gobin YP, Pierot L, et al. Cerebral dural arteriovenousfistulas: clinical and angiographic correlation with a revised classi-fication of venous drainage. Radiology 1995;194:671– 80 CrossRefMedline
6. Chan CF, Gatehouse PD, Hughes R, et al. Novel technique used todetect swallowing in volume-selective turbo spin-echo (TSE) forcarotid artery wall imaging. J Magn Reson Imaging 2009;29:211–16CrossRef Medline
7. Olin JW, Froehlich J, Gu X, et al. The United States Registry forFibromuscular Dysplasia: results in the first 447 patients. Circula-tion 2012;125:3182–90 CrossRef Medline
8. Morris PP, Black DF, Port J, et al. Transverse sinus stenosis is themost sensitive MR imaging correlate of idiopathic intracranialhypertension. AJNR Am J Neuroradiol 2017;38:471–77 CrossRefMedline
9. Morris PP, Lachman N, Black DF, et al. Increased curvature of thetentorium cerebelli in idiopathic intracranial hypertension. AJNRAm J Neuroradiol 2017;38:1789 –93 CrossRef Medline
10. Farb RI, Vanek I, Scott JN, et al. Idiopathic intracranial hypertension:the prevalence and morphology of sinovenous stenosis. Neurology2003;60:1418–24 CrossRef Medline
11. Boddu S, Dinkin M, Suurna M, et al. Resolution of pulsatile tinnitusafter venous sinus stenting in patients with idiopathic intracranialhypertension. PLoS One 2016;11:e0164466 CrossRef Medline
12. Asif H, Craven CL, Siddiqui AH, et al. Idiopathic intracranialhypertension: 120-day clinical, radiological, and manometric out-comes after stent insertion into the dural venous sinus. J Neurosurg2018;129:723–31 CrossRef Medline
13. Dinkin MJ, Patsalides A. Venous sinus stenting in idiopathic intra-cranial hypertension: results of a prospective trial. J Neuroophthal-mol 2017;37:113–21 CrossRefMedline
14. Liu KC, Starke RM, Durst CR, et al. Venous sinus stenting for reduc-tion of intracranial pressure in IIH: a prospective pilot study. J Neu-rosurg 2017;127:1126 –33 CrossRef Medline
15. Kao E, Kefayati S, Amans MR, et al. Flow patterns in the jugular veinsof pulsatile tinnitus patients. J Biomech 2017;52:61– 67 CrossRefMedline
FIG 4. Lumbar puncture–induced hemodynamic changes for patients with ipsilateral jets. Note that reduced pressure lowered the ipsilateralpeak velocity (left panel) without a concomitant reduction in flow rate (middle panel). Furthermore, PT intensity also decreased as the peakvelocity was reduced.
FIG 5. LP-induced change in lumen geometry. The pre-LP MRV lumenis shown on the left side (opening pressure of 25 cm H2O), whereas thepost-LP lumen is seen in the right side (closing pressure of 10 cm H2O).Note the improved transverse sinus stenosis at a prominent arach-noid granulation in the right transverse sinus (star).
AJNR Am J Neuroradiol 40:849 –54 May 2019 www.ajnr.org 853

16. Kefayati S, Amans M, Faraji F, et al. The manifestation of vorticaland secondary flow in the cerebral venous outflow tract: an in vivoMR velocimetry study. J Biomech 2017;50:180 – 87 CrossRef Medline
17. Acevedo-Bolton G, Amans MR, Kefayati S, et al. Four dimensionalmagnetic resonance velocimetry for complex flow in the jugularvein. Quant Imaging Med Surg 2015;5:635–37 CrossRef Medline
18. Smith JL. Whence pseudotumor cerebri? J Clin Neuroophthalmol1985;5:55–56 Medline
19. Ittrich H, Peldschus K, Raabe N, et al. Superparamagnetic iron oxidenanoparticles in biomedicine: applications and developments indiagnostics and therapy. Rofo 2013;185:1149 – 66 CrossRef Medline
20. Weinstein JS, Varallyay CG, Dosa E, et al. Superparamagnetic ironoxide nanoparticles: diagnostic magnetic resonance imaging andpotential therapeutic applications in neurooncology and centralnervous system inflammatory pathologies: a review. J Cereb BloodFlow Metab 2010;30:15–35 CrossRef Medline
21. Hope MD, Hope TA, Zhu C, et al. Vascular imaging with ferumoxy-tol as a contrast agent. AJR Am J Roentgenol 2015;205:W366 –73CrossRef Medline
22. Heiberg E, Sjogren J, Ugander M, et al. Design and validation ofSegment: freely available software for cardiovascular image analy-sis. BMC Med Imaging 2010;10:1 CrossRef Medline
23. Scoffings DJ, Pickard JD, Higgins JN. Resolution of transverse sinus
stenoses immediately after CSF withdrawal in idiopathic intracra-nial hypertension. J Neurol Neurosurg Psychiatry 2007;78:911–12CrossRef Medline
24. King JO, Mitchell PJ, Thomson KR, et al. Manometry combined withcervical puncture in idiopathic intracranial hypertension. Neurol-ogy 2002;58:26 –30 CrossRef Medline
25. Baryshnik DB, Farb RI. Changes in the appearance of venous sinusesafter treatment of disordered intracranial pressure. Neurology 2004;62:1445– 46 CrossRef Medline
26. Onder H, Gocmen R, Gursoy-Ozdemir Y. Reversible transverse si-nus collapse in a patient with idiopathic intracranial hypertension.BMJ Case Rep 2015;2015 CrossRef Medline
27. Corbett JJ, Mehta MP. Cerebrospinal fluid pressure in normal obesesubjects and patients with pseudotumor cerebri. Neurology 1983;33:1386 – 88 CrossRef Medline
28. Lenck S, Labeyrie MA, Vallee F, et al. Stent placement for dis-abling pulsatile tinnitus caused by a lateral sinus stenosis: a ret-rospective study. Oper Neurosurg (Hagerstown) 2017;13:560 – 65CrossRef Medline
29. Baomin L, Yongbing S, Xiangyu C. Angioplasty and stenting forintractable pulsatile tinnitus caused by dural venous sinusstenosis: a case series report. Otol Neurotol 2014;35:366 –70CrossRef Medline
854 Haraldsson May 2019 www.ajnr.org

ORIGINAL RESEARCHHEAD & NECK
The Black Turbinate Sign, A Potential Diagnostic Pitfall:Evaluation of the Normal Enhancement Patterns of the
Nasal TurbinatesX Q. Han and X E.J. Escott
ABSTRACT
BACKGROUND AND PURPOSE: Lack of enhancement of a nasal turbinate on MR imaging, known as the black turbinate, has beenreported as a finding highly suggestive of invasive fungal rhinosinusitis in immunocompromised patients. Our purpose was to investigatethe normal enhancement pattern of nasal turbinates and to determine whether a black turbinate occurs in patients without invasive fungalrhinosinusitis and, if so, to distinguish differentiating features from pathologic enhancement.
MATERIALS AND METHODS: We examined patient medical records and available MR imaging, which included most nasal turbinates inmore than 1 sequence. Imaging was performed with contrast, either with or without fat saturation, in patients without invasive fungalrhinosinusitis. All MR images were evaluated for a turbinate enhancement pattern and the presence of nonenhancing areas.
RESULTS: After we applied the exclusion criteria, 75 MR images from each group, with and without fat saturation, were included. Overall,the frequency of observed nonenhancing portions of turbinates, ie, black turbinates, was 30%. Most observed black turbinates werelocated in the posterior portion of inferior turbinates. Tiny areas of nonenhancement within turbinates were also a common finding.
CONCLUSIONS: A black turbinate is not uncommon on MR images in immunocompetent patients who have no chance of having invasivefungal rhinosinusitis. Benign turbinate nonenhancement improves over subsequent series, has preserved thin peripheral enhancement, andoften has thin internal septa. Knowledge of this normal pattern of nasal turbinate enhancement can aid in the differentiation of the benignblack turbinate in immunocompetent patients from the pathologic black turbinate seen in patients with invasive fungal rhinosinusitis.
ABBREVIATIONS: BT � black turbinate; IFRS � invasive fungal rhinosinusitis; NE � nonenhancing or nonenhancement
Lack of enhancement of a nasal turbinate on MR images (the
“black turbinate [BT] sign”) has been reported as highly sug-
gestive of invasive fungal rhinosinusitis (IFRS) in immunocom-
promised patients (Fig 1).1-5 However, we have noticed nonen-
hancing (NE) turbinates in patients imaged for other indications,
who have essentially no possibility of having IFRS. IFRS in the
at-risk population is a rapidly progressive disease that frequently
progresses to involve the orbit and brain. Although treated with
aggressive surgical debridement, these patients usually have a
poor prognosis.6,7 On the other hand, no treatment would be
required if nonenhancement of a nasal turbinate could be a nor-
mal finding as well. Therefore, we sought to better understand
what constitutes the normal enhancement pattern of the nasal
turbinates on MR imaging and attempted to define differentiating
features between the normal and pathologic enhancement
patterns.
MATERIALS AND METHODSPatient SelectionThis was a retrospective institutional review board–approved
study involving the examination of patient medical records, such
as medical history and MR images obtained without and with
(gadolinium-based) intravenous contrast. Patients were enrolled
in the study via a reverse chronologic order search of the PACS for
appropriate MR images. We obtained 2 groups of scans. The fat-
saturation group included MR images using orbit, face, neck, or
skull base protocols: postcontrast T1-weighted imaging with fat
saturation, from May 9, 2016, through July 31, 2016. The brain
group included MR images using brain protocols: postcontrast
T1-weighted imaging that did not use fat-saturation, from July 1,
2016, through July 10, 2016. Both groups of patients were enrolled
Received March 28, 2018; accepted after revision March 18, 2019.
From the Departments of Radiology (Q.H.) and Radiology and Otolaryngology-Head and Neck Surgery (E.J.E.), University of Kentucky, Lexington, Kentucky.
Paper previously presented at: Annual Meeting of the American Society of Neuro-radiology and the Foundation of the ASNR Symposium, April 22–27, 2017; LongBeach, California.
Please address correspondence to Qiong Han, MD, PhD, Department of Radiology,University of Kentucky, HX 319D, 800 Rose St, Lexington, KY 40506; e-mail:[email protected]
Indicates article with supplemental on-line table.
http://dx.doi.org/10.3174/ajnr.A6037
AJNR Am J Neuroradiol 40:855– 61 May 2019 www.ajnr.org 855

in reverse chronologic order until the same number of patients
(75) was enrolled for each group after applying the exclusion cri-
teria. The medical records of all patients were evaluated to con-
firm that the enrolled patients were not likely to have IFRS.
Exclusion CriteriaOur exclusion criteria were specifically designed to ensure suffi-
cient and reliable evaluation of the spatial and temporal enhance-
ment pattern of the nasal turbinates. They were as follows:
1) Scans that did not include at least two-thirds of the concha
of the inferior turbinate.
2) Scans with substantial postoperative or posttreatment changes
in the sinonasal region.
3) If �1 scan was obtained at the same session, only the first
scan was counted, and any additional scan was used as a further
delayed series: If the brain was scanned first in a combined brain/
orbit scan, the orbit scan was excluded from the fat-saturation
group and only included in the brain group.
4) Scans with only 1 sequence routinely including the nasal
turbinates, such as scans using our internal auditory canal, pitu-
itary, or various research protocols.
5) Scans with significant motion or other artifacts.
6) Scans with any mass or destructive lesion in the sinonasal
region.
7) Scans from outside or satellite hospitals were excluded as
the index examinations but were used as prior comparison
examinations.
MR Image AcquisitionMR images included in this study were obtained using various MR
imaging scanners (Espree, Aera, Symphony, Skyra and Verio; Sie-
mens, Erlangen, Germany). Our departmental protocols for the
brain, orbit, face, neck, or skull base were used. There was some
variation between pediatric and adult protocols and among dif-
ferent scanners. Some of the key technical parameters such as the
length of time to acquire each sequence are summarized in the
On-line Table and Table 1. In general,
there was a 25- to 30-second delay be-
tween intravenous contrast injection
and imaging in the first postcontrast
sequence.
MR Image InterpretationMR images were evaluated for the pres-
ence of areas of NE within the nasal tur-
binates (ie, BT). Areas of NE must be
confluent areas larger than 4 � 5 mm to
be called BTs. This criterion was specif-
ically defined to differentiate between
BT and scattered small NE foci that are
commonly seen and would not likely be
interpreted as potential IFRS.Each patient with a nonenhancing
turbinate was further evaluated for thelocation of NE within the turbinates andfor whether the NE areas persisted but
improved or resolved during the multi-
ple postcontrast series. In addition, the
size symmetry of the turbinates, the overall enhancement degree,
and associated signal intensity on the T2-weighted images were
graded by a neuroradiologist with a Certificate of Added Qualifi-
cation in neuroradiology and 24 years’ experience and a senior
resident radiologist-in-training. If there was any initial disagree-
ment between the 2 observers, the final grading in each category
was decided by further discussion and consensus (Tables 2–4 for
the grading system and summary of the cases). A prior MR image,
if available, was also thoroughly reviewed to evaluate any tempo-
ral variability of the enhancement pattern of the nasal turbinate.
Statistical AnalysisThe Fisher exact test was used to determine whether there was a
statistically significant difference between the sex and age compo-
sition of the 2 groups overall and the percentage of BT cases in
each group.
RESULTSOne hundred sixty-two MR images from the fat-saturation group
and 108 MR images from the brain group were evaluated, among
which 87 MR images from the fat-saturation group and 33 MR
images from the brain group were excluded per the exclusion
criteria. Most of the excluded scans were orbit scans with insuffi-
cient inclusion of the nasal turbinates. A detailed breakdown of
the excluded scans is shown in Fig 2. Seventy-five MR images were
included in each group. The demographic information of all in-
cluded scans and scans that demonstrated BT is summarized in
Tables 6 and 7, respectively.
Overall, the observed rate of BT in both cohorts combined was
30% (45/150), with 21% (16/75) in the fat-saturation group and
39% (29/75) in the brain group, respectively. There was a discrep-
ancy between the percentage of BT cases in the 2 groups, and such
discrepancy was likely due to the technical differences, including
the length of the scans and the greater conspicuity of enhance-
ment on the images with fat saturation.
FIG 1. A 27-year-old woman with relapsed pre-B-cell acute lymphoblastic leukemia was admittedfor chemotherapy. She had an MR imaging examination due to headache. Axial (A) and coronal (B)T1-weighted postcontrast images with fat saturation showed nonenhancement centered in theleft middle turbinate (long arrows) with irregular and invasive borders extending into the leftinferior turbinate (short arrow). The patient had tissue-proved invasive fungal rhinosinusitis andwent through a series of 12 aggressive surgical debridements and eventually died.
856 Han May 2019 www.ajnr.org

The NE in the BT cases was confined within the turbinate, with
regular and well-defined borders. Another common observation
was thin rim enhancement around the NE areas (Figs 3 and 4),
likely corresponding to normal mucosal enhancement. Faint
septa could occasionally be seen in the NE areas. The NE areas
were most commonly seen in the concha of the inferior turbi-
nates, sparing the anterior aspects (Fig 3), with a similar dis-
tribution within the middle turbinates being the next most
frequent site.
Another phenomenon we frequently observed was scat-
tered small foci (usually much smaller than 4 � 5 mm) of NE,
which either developed as a resolving stage of the BT or were
present on the first postcontrast sequence. The scattered NE
foci followed a distribution pattern similar to that of BTs (Figs
4 and 5).
Size AsymmetryIn about half of the cases of BT (10 of 16 in the fat-saturation
group and 12 of 29 in the brain group, or 22 of 45 cases in both
Table 1: Timing guideline of postcontrast sequences for 3T scannersa
Skyra adult protocolsOrbit Axial T1 FS Coronal T1 FS Cor MPRAGE (O)
Timing 04:10 04:42 04:14Face Coronal T1 FS Axial T1 FS Sagittal T1 FS
Timing 03:58 04:31 05:03Neck Sagittal T1 FS Coronal T1 FS Axial T1 FS
Timing 06:43 04:39 08:02Skull base Axial FLAIR Axial T1 FS Coronal T1 FS Sagittal FLAIR FS
Timing 01:54 06:58 06:42 02:54Brain Axial T1 FLAIR Coronal T1 FLAIR Sagittal T1 FLAIR
Timing 01:54 02:54 02:54Verio adult protocols
Orbit Axial T1 FS Coronal T1 FSTiming 03:14 01:51
Face Coronal T1 FS Axial T1 FS Sagittal T1 FSTiming 04:00 04:00 05:04
Neck Axial T1 FS Coronal T1 FS Axial T1 FSTiming 03:56 04:04 05:03
Skull base Axial T1 FS Coronal T1 FS Axial T1 Sagittal T1 FSTiming 05:13 05:13 01:41 05:07
Brain Axial T1 Coronal T1 Sagittal T1 FLAIR Cor MPRAGE (O)Timing 01:21 01:45 01:39 04:18
Note:—Cor indicates coronal; FS, fat saturation; O, optional sequence; VIBE, volume interpolated gradient echo.a Skyra and Verio scanners (Siemens, Erlangen, Germany). All timing is in minutes and seconds.
Table 2: Grading criteria for imaging findingsa
Category
Grades
1 2 3Size symmetry Markedly asymmetric Mildly-to-moderately asymmetric SymmetricDegree of enhancement Less than extraocular muscle Similar to extraocular muscle Greater than extraocular muscleT2 signal intensity Similar to extraocular muscle Similar to gray matter Similar to vitreous
a Grading criteria for the symmetry of the size of the nasal turbinates, their overall degree of enhancement, and their signal intensity on the T2-weighted images. Scores rangefrom 1 to 3, with scores of 1.5 or 2.5 representing the intermediate grade between 2 levels.
Table 3: Imaging findings by groupa
Grades
1 1.5 2 2.5 3FS group (16 cases)
Size symmetry 10 6Enhancement level 12 1 2 1T2 signal intensity 8 1 7
Brain group (29 cases)Size symmetry 3 8 1 17Enhancement level 5 24T2 signal intensity 10 17 2
a Grading criteria for the symmetry of the size of the nasal turbinates, their overalldegree of enhancement, and their signal intensity on the T2-weighted images. Scoresrange from 1 to 3, with scores of 1.5 or 2.5 representing the intermediate gradebetween 2 levels.
Table 4: BT site of involvement and temporal characteristicsa
Groups Superior Middle InferiorTemporal-Improvingb
Temporal-Transientc
FS 6 16 5 11Brain 8 28 13 16
a The location of the black turbinates and the change in enhancement during multipleseries are shown. Because a patient can demonstrate BT in �1 turbinate (ie, both themiddle and inferior turbinates can show BT simultaneously), the total number ofturbinates seen with BT is larger than the number of cases in each group.b BT persists across all sequences but improves gradually.c BT resolves on later sequences.
Table 5: Relationship of turbinate size to BT, presence of BT at 2time points, and nasal cyclinga
Groups
CaseswithBT
CaseswithSize
Asymmetry
BTSeen inSmaller
Turbinates
CaseswithPriorExam
BTSeen
on PriorExam
CaseswithNasal
CyclingFS 16 10 6 9 4 0Brain 29 12 4 13 10 3
a The occurrence of BT relative to turbinate size shows that BT did not primarilyoccur in the smaller turbinate when size asymmetry was present. Patients who had aBT on 1 scan often did not always have a BT on a prior exam. Nasal cycling indicates achange in nasal turbinate symmetry between the index and prior study. This occurredrelatively infrequently.
AJNR Am J Neuroradiol 40:855– 61 May 2019 www.ajnr.org 857

groups), there was a significant side-to-side size asymmetry
between the bilateral turbinates. Among those 22 cases, ap-
proximately 45% of them (10/22) showed BTs or more prom-
inent BTs (if bilateral) in the smaller turbinates (Table 5).
Signal Intensity on T2-Weighted ImagingOn T2WI, the signal intensity of the BTs and turbinates in general
was variable but was mostly intermediate to high (Table 3), with-
out any case falling into the low category.
Temporal Characteristics of EnhancementMost cases of BT or scattered small foci of NE showed increasing
enhancement with time. Most BT regions became scattered foci of
NE with time (Fig 4), and 11 of 16 and 16 of 29 BTs in the fat-
saturation and brain groups, respectively, showed resolution of
BTs.
Prior ExaminationNine of the 16 cases of BT in the fat-saturation group and 13 of the
29 cases of BT in the brain group had adequate prior examina-
tions, per the same exclusion criteria (Table 5). Four of the 9 cases
of BTs in the fat-saturation group and 10 of the 13 cases of BTs in
the brain group also demonstrated BTs on the prior examina-
tions, respectively.
If there was any change in size asymmetry between the index
and prior examinations, we considered this as a surrogate for
nasal cycling. In summary, no nasal cycling was seen in the fat-
saturation group, while 3 cases in the brain group (of 10) showed
evidence of nasal cycling:
Case 1. The larger turbinate switched from the right side to the
left between the index and prior examinations, while BTs re-
mained predominantly on the left side on both examinations.
Case 2. The larger turbinate switched from the right side to the
left between the index and the prior examinations, while BTs were
predominantly in the smaller turbinates.
Case 3. The turbinates were symmetric on the index examination
and slightly larger on the left on the prior examination, while the
BT was predominantly seen on the left side on both examinations.
For cases with BTs seen on both the index and prior examina-
tions but without evidence of nasal cycling between the examina-
tions, 1 of 4 cases in the fat-saturation group and 3 of 7 cases in the
brain group had BTs on opposite sides between the index and
prior examinations (if on the right on the index examination, then
on the left on the prior examination, and vice versa), while the
FIG 2. Breakdown of excluded cases: 1) insufficient inclusion of nasalturbinates, 2) significant postoperative or posttreatment changes in-volving the nasal cavity, 3) inappropriate scan sequence, 4) specificprotocols, 5) significant motion or other artifacts, 6) significant nasalmass, and 7) scans from outside or satellite hospitals.
Table 6: Demographic summary of the recruited patientsa
Total Female Male P (M vs F) Pediatric Patients Adult Patients P (Adult vs Pediatric)FS group 75 40 (53%) 35 (47%) .74b 16 (21%) (6 mo to 14 yr) 59 (79%) (range, 18–81 yr) .74b
Brain group 75 41 (55%) 34 (45%) .62b 17 (23%) (2 mo to 17 yr) 58 (77%) (range, 24–86 yr) 1.00b
P FS vs Brain 1.00c 1.00c
Note:—P indicates P value; M, male; F, female.a All P values were calculated using the Fisher exact test.b To compare the sex and age composition of each group with the general population, assuming even sex distribution and approximately 24% pediatric population.c To compare the sex and age composition between the FS and brain groups.
Table 7: Demographic summary of the patients with black turbinatesa
Total Female Male P (M vs F) Pediatric Patients Adult Patients P (Adult vs Pediatric)FS group 16 11 (69%) 5 (31%) .28b 2 (12%) (11 and 14 yr) 14 (88%) (range, 31–74 yr) .73b
Brain group 29 17 (59%) 12 (41%) .83b 1 (3%) (10 yr) 28 (97%) (range, 24–79 yr) .02b,c
P FS vs brain .54d .28d
a All P values were calculated using the Fisher exact test.b To compare the sex and age compositions of each BT group with the general population, assuming even sex distribution and approximately 24% pediatric population.c Significant.d To compare the sex and age composition between the FS and brain BT groups.
858 Han May 2019 www.ajnr.org

remaining cases demonstrated BTs on the same side between the
index and prior examinations.
In summary, benign BTs may not necessarily be present in the
same patient at different time points and do not seem to be con-
sistently influenced by nasal cycling.
DISCUSSIONThe vascular supply and complex microvascular anatomy of the
nasal turbinates can partially explain our findings. The main ar-
terial supplies to the nasal turbinates are the posterolateral (or
lateral) branches of the sphenopalatine arteries.8-10 Branches first
supply the inferior turbinates, then the middle turbinates from
their posterior aspects. Blood supply is supplemented by anasto-
motic branches from the anterior ethmoidal arteries that enter
along the more anterior aspects of the turbinates.
The nasal tissues can vary in size, due to expansile or erectile
tissues.11,12 This feature is due to the complex microvascular
anatomy, consisting of capillaries, arteriovenous anastomoses,
capacitance vessels or sinusoids, and postcapillary venules. It is
the capacitance vessels or sinusoids that are responsible for the
ability of nasal structures to change size by virtue of the amount of
blood within them increasing or decreasing by several mecha-
nisms.11 Ng et al12 evaluated the distribution of these erectile or
cavernous tissues using MR imaging. The authors found the
greatest change in size in the inferior turbinate, followed by the
middle turbinate (anterior third less than the remainder) and an-
terior nasal septum. They concluded that this distribution repre-
sented that of the cavernous tissues in the nose. This distribution
seems to coincide somewhat with the distribution of the most
common sites for BT and NE foci and may also explain the filling
in of these areas with time. Additionally,
the scattered NE foci seen in most of the
cases imply that this NE phenomenon
might fall within a continuous spec-
trum, with the BT cases having the most
confluent NE foci.
The findings of benign BT, which in-
clude nonenhancing areas with well-de-
fined, noninvasive borders confined
within a turbinate, are contrasted with
the more extensive findings involving
adjacent structures seen in our case of
IFRS (Fig 1).
Common observations in our benign
BT cases of thin rim enhancement
around the nonenhancing areas (Figs 3
and 4) and intermediate and high signal
intensity on the T2-weighted images
were not consistently described in the
cases of IFRS reported in the literature1-4,7
FIG 3. A 24-year-old immunocompetent woman with a history of a gestational trophoblasticneoplasm who had a brain MR imaging for a metastatic work-up. Coronal (A) and sagittal (B)postcontrast T1-weighted images show nonenhancement of the posterior aspect of the leftinferior turbinate (long arrows) with thin rim enhancement (short arrows). The posterior aspectof the inferior turbinate is a common location of a black turbinate in immunocompetent patients.
FIG 4. A 14-year-old immunocompetent adolescent girl with right-sided blurred vision, who had orbit and brain MR imaging for a multiplesclerosis work-up. The postcontrast images for the orbit MR imaging were obtained before those for the brain MR imaging. Axial (A) and coronal(B) postcontrast T1-weighted images with fat saturation show nonenhancement most pronounced in the posterior aspects of both inferiorturbinates (long arrows) with thin rim enhancement (short arrows) and scattered nonenhancing foci in the right middle turbinate (arrowhead).The inferior turbinate, especially the posterior portion, is a common location of a BT in immunocompetent patients. The sagittal postcontrastimage from the brain MR imaging (C), which is the last postcontrast sequence available, shows that the BT of the right interior turbinate is almostcompletely resolved and has transitioned into mildly scattered nonenhancing foci (curved arrow).
AJNR Am J Neuroradiol 40:855– 61 May 2019 www.ajnr.org 859

or seen in our case of IFRS. Choi et al4 stated that in patients with
IFRS, “Although LoCE (Lack of Contrast Enhancement) showed
variable signal intensity (SI), homogeneously or heterogeneously
enhancing lesions showed exclusively low SI (100%, 12/12) on
T2WI.” Seo et al,3 in their review of 23 patients with IFRS, found
17 patients who had nonenhancing areas in the sinonasal region
(13 with extension into adjacent structures), and the signal inten-
sity on the T2WI was variable, with most being hyperintense and
many also having areas of iso- or hypointensity compared with
the brain cortex.3 Therefore, there is no consistent signal intensity
on the T2WI suggesting the diagnosis of IFRS when an NE turbi-
nate is encountered in high-risk patients. Conversely, low signal
intensity on T2WI was not seen in any of our patients with benign
BTs.
Diffusion-weighted imaging may have little utility and is only
mentioned by the authors of several series in the literature, and
not necessarily with respect to the nasal turbinates.2,4 Safder et al2
described restricted diffusion in 2 cases; however, Choi et al4 de-
scribed facilitated diffusion in 2 of their cases. Choi et al also
felt that the NE areas were due to coag-
ulation necrosis rather than infarction,
therefore explaining this imaging
finding.
The most frequent locations of NE
turbinates in IFRS are also different
from the distribution of benign BTs. Gil-
lespie et al,13 in their retrospective study
of 25 patients with IFRS, found that the
most common site of involvement was
the middle turbinate (62% of biopsied
patients). Their hypothesis was that the
middle turbinate filters the major vol-
ume of the nasal airflow and might have
contributed to the predilection for fun-
gal seeding in this region.
Compared with a true pathologic
turbinate NE pattern in patients with
IFRS, the NE turbinates in immuno-
competent patients have the features
summarized in Table 8. Overall, im-
proving NE turbinates through the
course of a scan with preserved periph-
eral (likely normal mucosal) enhance-
ment and thin septa are the key features
to differentiate benign BT from IFRS,
which will more likely demonstrate per-
sistent NE in affected turbinates; the NE
of IFRS may extend into adjacent struc-
tures rather than having well-defined
thin peripheral enhancement.
However, this comparison is itself
limited by the relative rarity of cases of
true pathologic turbinate NE both in the
literature1-7 and in daily practice.
There are several additional limita-
tions to our study. We had a relatively
small number of pediatric patients. In
both the fat-saturation and brain groups, the number of pediatric
patients was significantly less than for the adult patients (Table 6).
However, within the brain group, there was a statistically significant
difference in the number of pediatric patients compared with adult
patients demonstrating BTs (Table 7). While this could represent a
true difference, we suspect it is due to the small pediatric sample size.
Further investigation might be needed to definitively explain
this finding and to better evaluate the pediatric population
overall.
Additionally, the variable length of the sequences and the dif-
ferent protocols and scanners used could potentially affect the
valuation of the temporal pattern of enhancement. However, we
would suggest that similar scanner and protocol variability are
present in many large practices and academic institutions, so this
mix approximates the everyday scan variability that many radiol-
ogists will encounter.
Last, there was no pathologic proof of benignity of the BTs in our
immunocompetent patients; however, evidence obtained from the
patients’ electronic medical records supported this presumption.
FIG 5. Axial postcontrast T1-weighted images with fat saturation from 3 different patients. A, A43-year-old woman shows extensive nonenhancing “dots” in both inferior turbinates, left morethan right, with relative sparing of the anterior aspects, which is a typical pattern of scatterednonenhancing foci. B, A 12-year-old girl shows the more homogeneous and intense enhancementof the nasal turbinates, which is typical of pediatric patients. C, A 36-year-old woman showsrelatively homogeneous enhancement, but it is less intense than that in the pediatric patient, andthere are a few small nonenhancing dots (arrows).
Table 8: Imaging features of benign BT in immunocompetent patients compared with thoseof invasive fungal rhinosinusitis in immunocompromised patients
Incidental BT inImmunocompetent
Patients Patients with IFRSEnhancement pattern Nonenhancing centrally with
smooth, thin peripheralenhancement, likely normalmucosal enhancement
Infiltrative nonenhancementextending into adjacentstructures, without smooth,thin enhancing margin
T2 characteristic Intermediate to hyperintense,but not hypointense
Variable: hypointense,intermediate, orhyperintense
Internal feature Faint septa or confluent dots Confluent nonenhancementMost common
location for BTPosterior and midportions of
inferior turbinateMiddle turbinate
NE confined toturbinate?
Yes No
Temporal feature Increased enhancementwith time
Persistent nonenhancement
860 Han May 2019 www.ajnr.org

CONCLUSIONSAlthough a sign suggesting IFRS in the appropriate clinical set-
ting, areas of NE within the nasal turbinates are common on both
MR imaging with or without fat saturation in immunocompetent
patients who have little chance of having IFRS. This benign NE
will improve over subsequent series, have preserved thin periph-
eral enhancement, and will often have thin internal septa. Knowl-
edge of the normal patterns of nasal turbinate enhancement can
help radiologists better differentiate findings suggestive of IFRS
from normal variations and lead to a higher positive predictive
value of the BT sign.
REFERENCES1. Nunes DM, Rocha AJ, Rosa Junior M, et al. “Black turbinate sign”: a
potential predictor of mucormycosis in cavernous sinus thrombo-phlebitis. Arq Neuropsiquiatr 2012;70:78 CrossRef Medline
2. Safder S, Carpenter JS, Roberts TD, et al. The “Black Turbinate” sign:an early MR imaging finding of nasal mucormycosis. AJNR Am JNeuroradiol 2010;31:771–74 CrossRef Medline
3. Seo J, Kim HJ, Chung SK, et al. Cervicofacial tissue infarction inpatients with acute invasive fungal sinusitis: prevalence and char-acteristic MR imaging findings. Neuroradiology 2013;55:467–73CrossRef Medline
4. Choi YR, Kim JH, Min HS, et al. Acute invasive fungalrhinosinusitis: MR imaging features and their impact on prog-nosis. Neuroradiology 2018;60:715–23 CrossRef Medline
5. Bae MS, Kim EJ, Lee KM, et al. Rapidly progressive rhino-orbito-cerebral mucormycosis complicated with unilateral internal ca-rotid artery occlusion: a case report. Neurointervention 2012;7:45– 49 CrossRef Medline
6. Monroe MM, McLean M, Sautter N, et al. Invasive fungalrhinosinusitis: a 15-year experience with 29 patients. Laryngoscope2013;123:1583– 87 CrossRefMedline
7. Groppo ER, El-Sayed IH, Aiken AH, et al. Computed tomographyand magnetic resonance imaging characteristics of acute invasivefungal sinusitis. Arch Otolaryngol Head Neck Surg 2011;137:1005–10CrossRef Medline
8. Som PM, Lawson W, Fatterpekar GM, et al. Embryology, anatomy,physiology, and imaging of the sinonasal cavities. In: Som PM, Cur-tin HD, eds. Head and Neck Imaging. 5th ed. St. Louis: Mosby;2011:116 –17
9. Osborn AG. The nasal arteries. AJR Am J Roentgenol 1978;130:89 –97CrossRef Medline
10. Strandling S. Nose, nasal cavity and paranasal sinuses. In: BirchR, Collins P, Gray H, et al, eds. Gray’s Anatomy: The AnatomicalBasis of Clinical Practice. 2015. Philadelphia: Elsevier Limited;2016:556 –70
11. Widdicombe, J. Microvascular anatomy of the nose. Allergy 1997;52(40 Suppl):7–11
12. Ng BA, Ramsey RG, Corey JP. The distribution of nasal erectile mu-cosa as visualized by magnetic resonance imaging. Ear Nose ThroatJ 1999;78:159, 163– 66 Medline
13. Gillespie MB, O’Malley BW Jr, Francis HW. An approach to fulminantinvasive fungal rhinosinusitis in the immunocompromised host. ArchOtolaryngol Head Neck Surg 1998;124:520–26 CrossRef Medline
AJNR Am J Neuroradiol 40:855– 61 May 2019 www.ajnr.org 861

ORIGINAL RESEARCHPEDIATRICS
Neuroimaging Findings in Moebius SequenceX D.A. Herrera, X N.O. Ruge, X M.M. Florez, X S.A. Vargas, X M. Ochoa-Escudero, and X M. Castillo
ABSTRACT
BACKGROUND AND PURPOSE: Moebius sequence comprises a spectrum of brain congenital malformations predominantly affecting thefunction of multiple cranial nerves. Reported neuroimaging findings are heterogeneous and based on case reports or small case series. Ourgoal was to describe the neuroimaging findings of Moebius sequence in a large population of patients scanned with MR imaging.
MATERIALS AND METHODS: An observational cross-sectional study was performed to assess brain MR imaging findings in 38 patientswith Moebius syndrome studied between 2013 and 2016.
RESULTS: Retrospective analysis of MR imaging studies showed flattening of the floor of the fourth ventricle floor secondary to a bilateralabsent facial colliculus in 38 patients (100%) and unilateral absence in 1. A hypoplastic pons was found in 23 patients (60.5%). Mesencephalicmalformations consisted of tectal beaking in 15 patients (39.5%) and increased anteroposterior midbrain diameter with a shallow interpe-duncular cistern in 12 (31.6%). Infratentorial arachnoid cysts were found in 5 patients (13.2%), and cerebellar vermis hypoplasia, in 2 (5.3%).Supratentorial findings included the following: thalamic fusion (26.3%), periventricular nodular heterotopias (26.3%), ventriculomegaly(26.3%), callosal abnormalities (23.7%), and hippocampal malrotations (23.7%).
CONCLUSIONS: Findings seen in this large patient cohort agreed with previously published reports. Flattening of the fourth ventriclefloor secondary to a bilaterally absent facial colliculus was the most frequent MR imaging finding. The presence of other brain stem andcerebellar malformations as well as supratentorial abnormalities may help explain clinical symptoms and achieve a correct diagnosis.
Moebius sequence comprises a spectrum of congenital mal-
formations that mainly affect the function of cranial nerves.1
The estimated incidence of Moebius sequence is 1:250,000 live
births with no sex differences.2 This syndrome is clinically char-
acterized by unilateral or bilateral congenital facial paralysis and
the failure of ocular abduction with esotropia due to cranial nerve
VI palsy.3,4 Because of the predominant involvement of the cra-
nial nerves, Moebius sequence has been classified as forming part
of malformations of the midbrain and rhombencephalon.5 Both
genetic and nongenetic factors are believed to be important for
the development of Moebius sequence.6 Currently, the most ac-
cepted etiology of this syndrome is hypoxic-ischemic injury to the
brain stem during development, which is supported by histo-
pathologic evaluation of postmortem Moebius sequence brains
with evidence of focal necrosis with areas of gliosis and calcifica-
tion in vascular territories of the brain stem.7
Moebius sequence diagnosis is based on clinical criteria after
exclusion of similar syndromes such as congenital fibrosis of the
extraocular muscles in which there is severe congenital strabis-
mus, ptosis, and vertical gaze palsy.8,9 MR imaging is helpful to
exclude Moebius sequence mimickers and can be useful to con-
firm the diagnosis. Neuroimaging findings in Moebius sequence
have been reported previously. However, reported findings are
heterogeneous and based on case reports or small case series.9-13
Consequently, our goal was to describe the neuroimaging find-
ings of Moebius sequence in a large group of patients.
MATERIALS AND METHODSInstitutional review board (Universidad de Antioquia) approval
was obtained for this retrospective study. Between August 2013
and November 2016, a total of 43 patients with the clinical diag-
nosis of Moebius syndrome were studied with multiplanar non-
contrast MR imaging, which included routine imaging sequences.
Four patients with partial or complete fusion of the basal ganglia
were excluded because a mutation in Tubulin-related genes could
Received December 7, 2018; accepted after revision March 12, 2019.
From the Department of Radiology (D.A.H., M.M.F., S.A.V.) and Grupo de Neuro-ciencias (N.O.R.), Universidad de Antioquia, Medellín, Colombia; Department ofRadiology (M.O.-E.), Hospital Pablo Tobon Uribe, Medellín, Colombia; and Depart-ment of Radiology (M.C.), University of North Carolina, Chapel Hill, North Carolina.
Please address correspondence to Diego A. Herrera, MD, Department of Radiol-ogy, Universidad de Antioquia UdeA, Calle 32D # 80B - 34, Medellin, Colombia050030; e-mail: [email protected]
http://dx.doi.org/10.3174/ajnr.A6028
862 Herrera May 2019 www.ajnr.org

not be ruled out. Another patient with neuroimaging features of
pontine tegmental cap dysplasia was eliminated from the analysis
as well. There were 24 males (63.2%) and 14 females (36.8%) with
an average age of 4.1 years (range, 1 month to 25 years). MR
imaging studies were independently reviewed by 2 neuroradiolo-
gists and 1 neuroradiology fellow. Conflicts among reviewer as-
sessments were resolved by consensus. We analyzed the shape and
size of the fourth ventricle, vermis, cerebellum, and cisterns. For
the brain stem, we measured the length of the pons and midbrain
and assumed that normal was when the former was at least twice
the length of the latter. In the supratentorial region, we studied the
corpus callosum, gray matter distribution (including the appear-
ance of the basal ganglia), ventricular shape and size, hippocam-
pal shape and size, and subarachnoid spaces.
Means and ranges were calculated for continuous variables.
Descriptive statistics with the number of patients and percentages
were used for results presentation. All analyses were performed
using the software SPSS, Version 26 (IBM, Armonk, New York).
RESULTSInfratentorial FindingsFlattening of the fourth ventricle floor secondary to an absent
bilateral facial colliculus was present in 38 patients (100%). A
hypoplastic pons was found in 23 patients (60.5%). Mesen-
cephalic malformations consisted of tectal beaking in 15 patients
(39.5%) and increased anteroposterior midbrain diameter with a
shallow interpeduncular cistern, in 12 patients (31.6%). Infraten-
torial arachnoid cysts were found in 5 (13.2%), and cerebellar
vermis hypoplasia, in 2 (5.3%).
Supratentorial FindingsFusion of the thalami was found in 10 patients (26.3%). Periventricu-
lar nodular heterotopia was found in 10 subjects (26.3%). Corpus
callosum abnormalities were present in 9 patients (23.7%). Hip-
pocampal malrotations were observed in 9 individuals (23.7%).
Middle cranial fossa arachnoid cysts were present in 10 patients
(26.3%). Ventriculomegaly without imaging criteria for obstructive
hydrocephalus was observed in 10 patients (26.3%), and of these, 5
(13.2%) had mostly dilation of the frontal horns. Two patients
(5.3%) had hydrocephalus secondary to stenosis of the cerebral
aqueduct.
Above-mentioned neuroimaging findings are described in the
Table and Figs 1– 4.
DISCUSSIONMoebius sequence refers to malformations arising during devel-
opment of the mesencephalon-rhombencephalon and is classi-
fied within the group of early defects of the dorsoventral pattern.5
The term “sequence” is preferred to “syndrome” because it de-
fines a cascade of secondary events after an initial insult during the
embryonic period.6 In histopathologic studies of patients affected
by Moebius sequence, the main abnormality is found in the pon-
tine tegmentum where the nuclei for cranial nerve VI are located
and the intra-axial fibers of the seventh cranial nerve are crossing
posterior to these nuclei (the facial colliculus).14
Brain stem ischemia during embryogenesis is the most ac-
cepted cause of Moebius sequence. Distribution of branches of
the embryonic basilar artery makes the dorsomedial aspect of the
brain stem vulnerable to hypoxic-ischemic injury.15 This feature
probably explains why hemorrhage and uterine contractions pro-
duced by misoprostol have been associated with Moebius se-
quence.14 Concerning the genetic etiology of Moebius sequence, 2
different loci at 3q21-q22 and 10q have been reported. Addition-
ally, de novo mutations have also been reported affecting the
PLXND1 and REV3L genes. These result in a defect in facial bran-
chiomotor neuron migration, supporting these genes as causativefor at least a portion of Moebius se-quence cases.6 Clinically, patients haveunilateral or bilateral congenital facial
paralysis and esotropia with preserva-
tion of the vertical gaze.Known brain MR imaging findings
in Moebius sequence are based on smallcase series. The present study includesthe largest number of patients reportedto date. In our series, the most frequentfinding was bilateral absence of the facial
colliculus in the pontine tegmentum
with flattening of the floor of the fourth
ventricle (100%). In axial images, pa-
tients showed depression of the floor of
the fourth ventricle leading a V or horse-
FIG 1. A, Axial T2-weighted image shows bilateral absence of the facial colliculus in thepontine tegmentum with a central depression of the dorsal brain stem. The fourth ventriclehas a horseshoe or V shape (inverted V). Pons hypoplasia and a small retrocerebellar cyst areobserved. B, A different patient shows absence of only the right facial colliculus (blackarrow).
Neuroimaging findings in 38 patients with Moebius sequenceFinding No. (%)
Flattening of the floor of the fourth ventricle dueto bilateral absence of facial colliculus
38 (100%)
Pons hypoplasia 23 (60.5%)Tectal beaking 15 (39.5%)Increased anteroposterior diameter of the
mesencephalon12 (31.6%)
Thalamic fusion 10 (26.3%)Periventricular nodular heterotopia 10 (26.3%)Middle cranial fossa arachnoid cysts 10 (26.3%)Ventriculomegaly without obstructive
hydrocephalus10 (26.3%)
Dysplastic corpus callosum 9 (23.7%)Hippocampal malrotation 9 (23.7%)Infratentorial arachnoid cysts 5 (13.2%)Frontal horn prominence 5 (13.2%)Cerebellar vermis hypoplasia 2 (5.3%)Mesencephalic aqueduct stenosis with
hydrocephalus2 (5.3%)
AJNR Am J Neuroradiol 40:862– 65 May 2019 www.ajnr.org 863
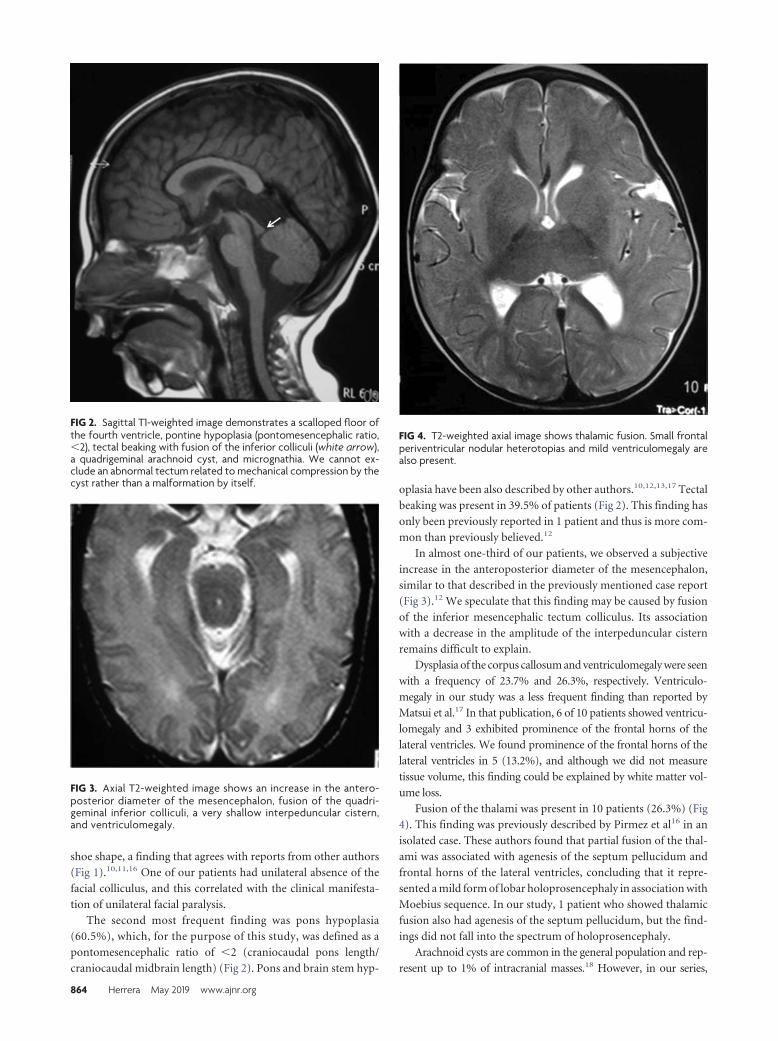
shoe shape, a finding that agrees with reports from other authors
(Fig 1).10,11,16 One of our patients had unilateral absence of the
facial colliculus, and this correlated with the clinical manifesta-
tion of unilateral facial paralysis.
The second most frequent finding was pons hypoplasia
(60.5%), which, for the purpose of this study, was defined as a
pontomesencephalic ratio of �2 (craniocaudal pons length/
craniocaudal midbrain length) (Fig 2). Pons and brain stem hyp-
oplasia have been also described by other authors.10,12,13,17 Tectal
beaking was present in 39.5% of patients (Fig 2). This finding has
only been previously reported in 1 patient and thus is more com-
mon than previously believed.12
In almost one-third of our patients, we observed a subjective
increase in the anteroposterior diameter of the mesencephalon,
similar to that described in the previously mentioned case report
(Fig 3).12 We speculate that this finding may be caused by fusion
of the inferior mesencephalic tectum colliculus. Its association
with a decrease in the amplitude of the interpeduncular cistern
remains difficult to explain.
Dysplasia of the corpus callosum and ventriculomegaly were seen
with a frequency of 23.7% and 26.3%, respectively. Ventriculo-
megaly in our study was a less frequent finding than reported by
Matsui et al.17 In that publication, 6 of 10 patients showed ventricu-
lomegaly and 3 exhibited prominence of the frontal horns of the
lateral ventricles. We found prominence of the frontal horns of the
lateral ventricles in 5 (13.2%), and although we did not measure
tissue volume, this finding could be explained by white matter vol-
ume loss.
Fusion of the thalami was present in 10 patients (26.3%) (Fig
4). This finding was previously described by Pirmez et al16 in an
isolated case. These authors found that partial fusion of the thal-
ami was associated with agenesis of the septum pellucidum and
frontal horns of the lateral ventricles, concluding that it repre-
sented a mild form of lobar holoprosencephaly in association with
Moebius sequence. In our study, 1 patient who showed thalamic
fusion also had agenesis of the septum pellucidum, but the find-
ings did not fall into the spectrum of holoprosencephaly.
Arachnoid cysts are common in the general population and rep-
resent up to 1% of intracranial masses.18 However, in our series,
FIG 2. Sagittal T1-weighted image demonstrates a scalloped floor ofthe fourth ventricle, pontine hypoplasia (pontomesencephalic ratio,�2), tectal beaking with fusion of the inferior colliculi (white arrow),a quadrigeminal arachnoid cyst, and micrognathia. We cannot ex-clude an abnormal tectum related to mechanical compression by thecyst rather than a malformation by itself.
FIG 3. Axial T2-weighted image shows an increase in the antero-posterior diameter of the mesencephalon, fusion of the quadri-geminal inferior colliculi, a very shallow interpeduncular cistern,and ventriculomegaly.
FIG 4. T2-weighted axial image shows thalamic fusion. Small frontalperiventricular nodular heterotopias and mild ventriculomegaly arealso present.
864 Herrera May 2019 www.ajnr.org

middle cranial fossa and infratentorial arachnoid cysts were observed
more frequently in 26.3% and 13.2% of patients with Moebius se-
quence, respectively. Although the pathogenesis of arachnoid cysts
has not been completely elucidated, it has been hypothesized that
they could be secondary to an early defect in fetal development coin-
ciding with the appearance of the Moebius sequence.19
Isolated periventricular nodular heterotopia was observed in
26.3% of patients. These malformations of cortical development
are the result of arrested neuronal migration. Clinically, patients
with these sporadic malformations do not have major intellectual
disabilities, and seizures may not appear until the second or third
decade of life.20 Our patients with periventricular nodular heter-
otopia did not have seizures, but because they are young, seizures
may occur later in life.
The differential diagnosis of Moebius sequence includes the
congenital cranial dysinnervation disorders. In these disorders,
MR imaging can show diverse findings such as the absence of the
abducens nerve on the affected side in Duane syndrome (related
to mutations in CHN1 or SALL4 genes) or extraocular muscle
volume loss in congenital fibrosis of the extraocular muscles (mu-
tations in KIF21A, PHOX2A, and TUBB3 genes).21 In our series,
we excluded 4 patients with cranial nerve VI and VII palsies because
brain MR imaging showed fusion of basal ganglia due to dysgenesis
of the anterior arm of the internal capsules, which is a characteristic
finding described in the spectrum of tubulinopathies resulting from
an abnormal axonal navigation/orientation caused by a mutation in
the Tubulin genes.22 Tubulinopathies could not be excluded in those
patients because they were not genetically tested; thus, we did not
include patients with dysmorphic basal ganglia in this analysis. Last,
another condition that should be considered in the differential diag-
nosis of Moebius sequence is pontine tegmental cap dysplasia (we
also excluded another patient with that disorder from the study after
analyzing the MR imaging). In this malformation, neuroimaging
shows pons hypoplasia associated with tegmental prominence pro-
jected into the fourth ventricle (tegmental “cap”) and middle cere-
bellar peduncle hypoplasia.23 This malformation can be related to
deficiencies of multiple cranial nerves and reorganization of white
matter tracts.3
Our study has limitations: mainly its retrospective nature,
nonquantitative nature, and the absence of a single researcher-
defined protocol for imaging acquisition. Nevertheless, because
of the relatively large (largest to date) number of patients, we
believe our series is unique and important to report.
CONCLUSIONSFindings seen in this large patient cohort agreed with previously
published reports. Flattening of the fourth ventricle floor second-
ary to a bilaterally absent facial colliculus was the most frequent
MR imaging finding. The presence of other brain stem and cere-
bellar malformations as well as supratentorial abnormalities may
help explain clinical symptoms and achieve a correct diagnosis.
REFERENCES1. Abramson DL, Cohen MM Jr, Mulliken JB. Mobius syndrome: clas-
sification and grading system. Plast Reconstr Surg 1998;102:961– 67CrossRef Medline
2. Picciolini O, Porro M, Cattaneo E, et al. Moebius syndrome: clinical
features, diagnosis, management and early intervention. Ital J Pedi-atr 2016;42:56 CrossRef Medline
3. Ouanounou S, Saigal G, Birchansky S. Mobius syndrome. AJNR Am JNeuroradiol 2005;26:430 –32 Medline
4. Budic I, Surdilovic D, Slavkovic A, et al. Moebius syndrome: chal-lenges of airway management. Acta Clin Croat 2016;55(Suppl 1):94 –97 Medline
5. Jissendi-Tchofo P, Severino M, Nguema-Edzang B, et al. Update onneuroimaging phenotypes of mid-hindbrain malformations. Neu-roradiology 2015;57:113–38 CrossRef Medline
6. Pedersen LK, Maimburg RD, Hertz JM, et al. Moebius sequence: amultidisciplinary clinical approach. Orphanet J Rare Dis 2017;12:4CrossRef Medline
7. St Charles S, DiMario FJ Jr, Grunnet ML. Mobius sequence: furtherin vivo support for the subclavian artery supply disruption se-quence. Am J Med Genet 1993;47:289 –93 CrossRef Medline
8. Whitman M, Hunter DG, Engle EC. Congenital fibrosis of the extra-ocular muscles. In: Adam MP, Ardinger HH, Pagon RA, et al, eds.GeneReviews® [Internet]. Seattle (WA): University of Washington,Seattle; 1993–2019
9. McKay VH, Touil LL, Jenkins D, et al. Managing the child with adiagnosis of Moebius syndrome: more than meets the eye. Arch DisChild 2016;101:843– 46 CrossRef Medline
10. Fons-Estupina MC, Poo P, Colomer J, et al. Moebius sequence:clinico-radiological findings [in Spanish]. Rev Neurol 2007;44:583– 88 Medline
11. Pedraza S, Gamez J, Rovira A, et al. MRI findings in Mobiussyndrome: correlation with clinical features. Neurology 2000;55:1058 – 60 CrossRef Medline
12. Lengyel D, Zaunbauer W, Keller E, et al. Mobius syndrome: MRIfindings in three cases. J Pediatr Ophthalmol Strabismus 2000;37:305– 08 Medline
13. Verzijl HT, Valk J, De Vries R, et al. Radiologic evidence for absenceof the facial nerve in Mobius syndrome. Neurology 2005;64:849 –55CrossRef Medline
14. Marques-Dias MJ, Gonzalez CH, Rosemberg S. Mobius sequence inchildren exposed in utero to misoprostol: neuropathological studyof three cases. Birth Defects Res A Clin Mol Teratol 2003;67:1002– 07CrossRef Medline
15. Sarnat HB. Watershed infarcts in the fetal and neonatal brainstem:an aetiology of central hypoventilation, dysphagia, Mobius syn-drome and micrognathia. Eur J Paediatr Neurol 2004;8:71– 87CrossRef Medline
16. Pirmez R, Freitas ME, Gasparetto EL, et al. Moebius syndrome andholoprosencephaly following exposure to misoprostol. PediatrNeurol 2010;43:371–73 CrossRef Medline
17. Matsui K, Kataoka A, Yamamoto A, et al. Clinical characteristics andoutcomes of Mobius syndrome in a children’s hospital. PediatrNeurol 2014;51:781– 89 CrossRef Medline
18. Osborn AG, Preece MT. Intracranial cysts: radiologic-pathologiccorrelation and imaging approach. Radiology 2006;239:650 – 64CrossRef Medline
19. Conde Sardon R. Arachnoid cysts: historical evolution of the con-cept and pathophysiological theories [in Spanish]. Neurocirugia (As-tur) 2015;26:192–95 CrossRef Medline
20. Leventer RJ, Guerrini R, Dobyns WB. Malformations of cortical de-velopment and epilepsy. Dialogues Clin Neurosci 2008;10:47– 62Medline
21. Gutowski NJ, Chilton JK. The congenital cranial dysinnervation dis-orders. Arch Dis Child 2015;100:678 – 81 CrossRef Medline
22. Bahi-Buisson N, Poirier K, Fourniol F, et al. The wide spectrum oftubulinopathies: what are the key features for the diagnosis? Brain2014;137:1676 –700 CrossRef Medline
23. Barth PG, Majoie CB, Caan MW, et al. Pontine tegmental capdysplasia: a novel brain malformation with a defect in axonal guid-ance. Brain 2007;130:2258 – 66 CrossRef Medline
AJNR Am J Neuroradiol 40:862– 65 May 2019 www.ajnr.org 865

ORIGINAL RESEARCHPEDIATRICS
Comparison of Iterative Model Reconstruction versus FilteredBack-Projection in Pediatric Emergency Head CT: Dose, Image
Quality, and Image-Reconstruction TimesX R.N. Southard, X D.M.E. Bardo, X M.H. Temkit, X M.A. Thorkelson, X R.A. Augustyn, and X C.A. Martinot
ABSTRACT
BACKGROUND AND PURPOSE: Noncontrast CT of the head is the initial imaging test for traumatic brain injury, stroke, or suspectednonaccidental trauma. Low-dose head CT protocols using filtered back-projection are susceptible to increased noise and decreasedimage quality. Iterative reconstruction noise suppression allows the use of lower-dose techniques with maintained image quality.We review our experience with children undergoing emergency head CT examinations reconstructed using knowledge-basediterative model reconstruction versus standard filtered back-projection, comparing reconstruction times, radiation dose, andobjective and subjective image quality.
MATERIALS AND METHODS: This was a retrospective study comparing 173 children scanned using standard age-based noncontrast headCT protocols reconstructed with filtered back-projection with 190 children scanned using low-dose protocols reconstructed with iterativemodel reconstruction. ROIs placed on the frontal white matter and thalamus yielded signal-to-noise and contrast-to-noise ratios. VolumeCT dose index and study reconstruction times were recorded. Random subgroups of patients were selected for subjective image-qualityreview.
RESULTS: The volume CT dose index was significantly reduced in studies reconstructed with iterative model reconstruction comparedwith filtered back-projection, (mean, 24.4 � 3.1 mGy versus 31.1 � 6.0 mGy, P � .001), while the SNR and contrast-to-noise ratios improved2-fold (P � .001). Radiologists graded iterative model reconstruction images as superior to filtered back-projection images for gray-whitematter differentiation and anatomic detail (P � .001). The average reconstruction time of the filtered back-projection studies was 101seconds, and with iterative model reconstruction, it was 147 seconds (P � .001), without a practical effect on work flow.
CONCLUSIONS: In children referred for emergency noncontrast head CT, optimized low-dose protocols with iterative model recon-struction allowed us to significantly reduce the relative dose, on average, 22% compared with filtered back-projection, with significantlyimproved objective and subjective image quality.
ABBREVIATIONS: ASIR � adaptive statistical iterative reconstruction; CNR � contrast-to-noise ratio; CTDIvol � volume CT dose index; FBP � filtered back-projection; IMR � iterative model reconstruction; MBIR � model-based iterative reconstruction; IR � iterative reconstruction
Children younger than 18 years of age constitute approxi-
mately one-fifth of the 130 million annual visits to hospital-
affiliated emergency departments in the United States.1 Trauma is
a leading cause of morbidity and mortality in children older than
1 year, with head trauma representing nearly 80% of these inju-
ries. Noncontrast head CT is often the first-line study for evalua-
tion of traumatic brain injury or suspected nonaccidental trauma
in children.2 Various dose-reduction strategies are used by ven-
dors and radiologists to reduce CT radiation exposure in chil-
dren.3,4 Minimizing radiation exposure while maintaining image
quality of brain CT is challenging because low-contrast lesion
detectability, detection of subtle bleeds, and anatomic detail, es-
pecially in the posterior fossa, may be affected by noise, artifacts,
and reduced contrast-to-noise ratio (CNR) that accompanies
lower-dose techniques.5 The use of lower-dose techniques by low-
ering the tube voltage or current, with filtered back image recon-
struction, is susceptible to increased image noise, decreased spa-
tial resolution, and low-contrast lesion detectability and overall
reduced reader confidence.
Received October 15, 2018; accepted after revision February 27, 2019.
From the Departments of Medical Imaging (R.N.S., D.M.E.B., M.A.T., R.A.A., C.A.M.)and Clinical Research (M.H.T.), Phoenix Children’s Hospital, Phoenix Arizona.
Paper previously presented at: Society for Pediatric Radiology Annual Meeting andPostgraduate Course, May 15–19, 2018; Nashville, Tennessee.
Abstract reuse permission from Springer Nature/RightLink license No.4366020744406, obtained June 11, 2018.
Please address correspondence to Richard N. Southard, MD, Vice Chair of Clinical Op-erations, Director of CT and Cardiac Imaging, Department of Medical Imaging, PhoenixChildren’s Hospital, 1919 East Thomas Rd, Main Tower/Radiology, Phoenix, AZ 85016;e-mail: [email protected]
http://dx.doi.org/10.3174/ajnr.A6034
866 Southard May 2019 www.ajnr.org

Image reconstruction with iterative reconstruction (IR) un-
couples noise reduction and spatial resolution and allows the use
of lower-dose techniques with maintained image quality.6,7 There
are different types of iterative reconstructions: those that denoise
image domain space alone; those that denoise in both projection
and image space; and pure, systems- or model-based iterative re-
construction (MBIR), which takes into consideration all aspects
of the imaging chain including system optics and, by virtue of
complex computational algorithms used, has longer reconstruc-
tion times, which may prevent its use in the emergency setting.
Overuse of noise-suppression strength may also result in an un-
desirable overly smooth image texture with loss of anatomic edge
detail presumably due to a shift in spatial frequency distribution
of image noise. We review our experience with children undergo-
ing emergency head CT examinations reconstructed using knowl-
edge-based iterative model reconstruction (IMR; Philips Health-
care, Best, the Netherlands) versus standard filtered back-
projection (FBP) reconstruction, comparing reconstruction
times, radiation dose, and objective and subjective image quality.
MATERIALS AND METHODSDesignThis institutional review board–approved and Health Insurance
Portability and Accountability Act– compliant retrospective re-
view compared 400 nonrandomized consecutive patients referred
from the emergency department for urgent head CT examina-
tions between January and March 2016 performed using either
standard age-based protocols and FBP image reconstruction or
reduced-dose age-based protocols and IMR. The institutional re-
view board waived the need for patient consent.
Patient GroupsAll children referred from the emergency department for urgent
head CT without contrast � 3D reconstruction (Current Proce-
dural Terminology: 70450/76376) in 2016 were identified in our
image data base. The first 200 consecutive patients imaged on the
64-slice multidetector row CT scanner situated in the emergency
department with FBP image reconstruction, and the first 200 con-
secutive patients imaged on the 256-slice multidetector row CT
scanner in the main department with image reconstruction using
IMR were eligible. Excluded were patients with repeat studies,
marked motion, and multiple implanted metallic leads or when
the incorrect age-based CT protocol was used. Patient age
(months) and sex were recorded for each subject.
Data Acquisition and ReconstructionWe used 4 age-based protocols for unenhanced CT head exami-
nations: younger than 1.5 years, 1.5– 6 years, 7–12 years, and older
than13 years. Image-acquisition parameters of the standard-dose
studies performed on the emergency department scanner (Bril-
liance 64-Slice; Philips Healthcare) included a collimation of 64 �
0.625 mm, pitch of 0.64, rotation time of 0.5 seconds, tube voltage
of 120 kV, and tube currents corresponding to the 4 age-based
protocols of 200, 225, 300, or 350 mAs. Scan parameters for the
low-dose studies performed on the main department scanner
(Brilliance iCT 256-Slice; Philips Healthcare) included collima-
tion of 64 � 0.625 mm, with a pitch of 0.39, rotation time of 0.4
seconds, and age-dependent tube currents of 160, 168, 200, or 210
mAs. The FBP standard-dose examinations were reconstructed
with a UB (soft) convolution kernel, section-thickness of 3 mm
with 3-mm increments, and high resolution, and the IR low-dose
examinations were reconstructed with a mild noise-reduction
IMRBRAIN 1
routine convolution kernel, a section-thickness of 3 mm
with 3-mm increments, and high resolution.
Both scanners were surveyed and tested by a certified medical
CT physicist in accordance with the American College of Radiol-
ogy CT Accreditation Program as part of our routine departmen-
tal quality-assurance program. Comparison of the calculated clin-
ical examination dose estimate and the measured volume CT dose
index (CTDIvol) reported by the scanner yielded a percentage dif-
ference of 11.86% for pediatric head (1 year of age) and 2.48% for
adult head CT protocols on the iCT 256-Slice multidetector row
CT scanner, and 0.80% and 2.60% on the Brilliance 64-Slice mul-
tidetector row CT scanner.
Radiation Dose MeasurementThe estimated radiation dose CTDIvol was recorded for each
study.
Reconstruction TimeReconstruction times were determined by recording the millisec-
ond image-creation times for the first image and the last image
reconstructed for each examination, as obtained from the in-
formation tile available for each individual image on the PACS
workstation.
Quantitative AnalysisAll images were viewed on a dedicated PACS on a calibrated dedi-
cated diagnostic workstation in our department. For each study, a
single representative image at the level of the lateral ventricles was
selected to include both the thalamus and frontal white matter, and 1
radiologist with 25 years’ experience who was not involved in the
blinded subjective image-quality review placed equal ROIs measur-
ing between 6 and 9 mm on the right thalamus deep gray matter and
right frontal white matter to maintain uniformity. Measurements of
mean CT density (Hounsfield unit) and SD yielded the signal-to-
noise ratio for the white matter and thalamus (SNRWhite Matter and
SNRThalamus) using the formula SNR � HU / SD, and CNR using the
formula CNR � (HUThalamus � HUWhite Matter) / [(SDThalamus�
SDWhite Matter) / 2].
Qualitative AnalysisSubjective image quality was assessed by selecting a randomized
de-identified age-group-matched subgroup from both the FBP
and IR groups using a random number generator (http://www.
randomnumbergenerator.com/) (n � 40; power index, �80%).
Qualitative analysis of the 3-mm images was independently per-
formed by 2 board-certified, subspecialty-certified neuroradiol-
ogy attending radiologists with 16 and 17 years’ experience, and
scores were reported assessing gray-white matter differentiation
and anatomic detail using a 5-point scale of 1, poor; 2, fair; 3,
average; 4, good; and 5, excellent. Reviewers were blinded to the
scanner, scan parameters, reconstruction settings, and slice
thickness.
AJNR Am J Neuroradiol 40:866 –71 May 2019 www.ajnr.org 867

Statistical AnalysisGroup comparisons were conducted using 2 independent-
samples equal variances t tests for continuous variables and the
�2 test for categoric variables. The Pearson correlation coeffi-
cient and the resulting P value for statistical significance were
determined, with the significance level at P � .05. Subjective
image-quality scores were combined as an average for each
patient, and the intraclass correlation coefficient and correla-
tion coefficient for the individual physician grades were calcu-
lated. Power and sample-size calculations for subjective image-
quality scoring using a 2-group independent-samples t test
were used to determine the required number of subjects
needed to detect a mean difference of 1.0 between FBP and IR.
The power calculations were conducted using the procedure
Proc Power available in the SAS statistical software. Statistical
analyses were performed using SAS 9.4 (SAS Institute, Cary
North Carolina) and R Studio, Version 1.0.153 (http://rstudio.org/
download/desktop).
RESULTSPatient GroupsA total of 363 patients were enrolled in the study; 173 patients
with a mean age of 76.3 � 73.8 months were imaged with
standard dose protocols with FBP reconstruction, and 190 pa-
tients with a mean age 67.6 � 67.9 months were imaged with
low-dose protocols with IR reconstruction. Thirty-seven pa-
tients were excluded due to excessive motion, multiple im-
planted leads, or incorrect protocol. Age group and age were
not significantly different (Table 1), and although sex differ-
ence did not achieve statistical significance, approximately
two-thirds of the patients were male.
Radiation DoseThe use of IMR reconstructions allowed diagnostic images using
lower dose parameters. The mean estimated CTDIvol was signifi-
cantly reduced in the IMR group, 24.4 � 3.1 mGy versus the FBP
group, 31.1 � 6.0 mGy (P � .001). In addition, the CTDIvol was
significantly reduced in each of the 4 individual age groups, 27%,
25%, 13%, and 12% (Table 2), with the largest dose savings
observed in the younger-than-1.5 years and 1.5- to 6-year age
groups.
Reconstruction TimesThe average study reconstruction time for the FBP-group was
100.9 seconds (range, 64 –237 seconds), and for the IMR group, it
was 147.0 seconds (range, 125– 473 seconds) (P � .001).
Quantitative AnalysisSNRThalamus, SNRWhite Matter, and CNR were significantly im-
proved in the IMR groups compared with the FBP groups approx-
imately 2-fold, with representative images and sample measure-
ments in Fig 1 and group results summarized in Table 2.
Qualitative AnalysisA random number generator was used to select 5 patients from
each of the age groups imaged on each scanner (n � 40). Sub-
jective image quality, as it pertains to anatomic detail and gray-
white matter differentiation, was scored, on average, 2.3 � 0.6
(fair-to-average) for those standard-dose studies recon-
structed with FBP, and 3.6 � 0.6 (average-to-good) for those
lower-dose studies reconstructed with IMR (P � .001). Each
physician independently scored those studies reconstructed
with IMR as superior to those reconstructed with FBP (3.6 �
0.8 versus 1.9 � 0.8 and 3.7 � 0.6 versus 2.8 � 0.6 (P � .001).
However, score agreement between the individual physicians
was low, with an intraclass correlation coefficient of 0.399 and
a correlation coefficient r � 0.43 for the FBP groups, and an
intraclass correlation coefficient of 0.345 and r � 0.37 for the
IMR groups (Table 3).
DISCUSSIONIn our patient population, we demonstrate statistically significant
relative CTDIvol dose reduction in all 4
patient age groups undergoing emer-
gency unenhanced head CT examina-
tions, 1.5 years or younger, 1.5– 6 years,
7–12 years, and 13 years and older, of
27%, 25%, 13%, and 12% respectively,
using low-dose protocols with IMR im-
age reconstruction, compared with pa-
tients imaged using standard protocols
and FBP image reconstruction, with sta-
tistically improved quantitative and
qualitative image quality (Fig 1). The
Table 1: Patient demographics by age group, age, sex, and scannera
IMR (n = 190) FBP (n = 173) Total (n = 363) P ValueAge group .50b
Younger than 1.5 years 65 (34.2%) 48 (27.7%) 113 (31.1%)1.5–6 years 60 (31.6%) 58 (33.5%) 118 (32.5%)7–12 years 24 (12.6%) 29 (16.8%) 53 (14.6%)Older than 13 years 41 (21.6%) 38 (22.0%) 79 (21.8%)
Age (mean) (SD) (months) 67.6 (67.9) 76.3 (73.8) 71.8 (70.8) .24c
Sex .05b
Female 81 (42.6%) 56 (32.4%) 137 (37.7%)Male 109 (57.4%) 117 (67.6%) 226 (62.3%)
a Data are number (percentage) unless otherwise indicated.b �2 test.c Equal variances t test.
Table 2: Mean (SD) dose estimates and objective image-quality measures by age group and scannerYounger Than 1.5 yr 1.5–6 yr 7–12 yr Older Than 13 yr
FBP IMR FBP IMR FBP IMR FBP IMRCTDIvol 29.9 (5.5) 21.8 (0.1) 30.6 (5.5) 22.8 (0.0) 31.5 (6.2) 27.5 (0.0)a 33.3 (6.9) 29.2 (0.6)a
SNRTHAL 9.3 (2.3) 22.0 (5.3) 8.6 (1.8) 20.2 (3.9) 8.8 (2.3) 18.7 (3.2) 8.6 (2.2) 17.9 (3.5)SNRWM 8.3 (2.3) 16.5 (3.8) 8.2 (2.3) 15.8 (3.3) 7.8 (1.3) 16.9 (4.3) 7.9 (2.4) 14.9 (2.9)CNR 2.1 (0.9) 4.9 (1.3) 2.1 (1.1) 4.4 (0.9) 2.0 (1.0) 3.7 (0.9) 1.8 (0.6) 3.6 (1.0)
Note:—THAL indicates thalamus; WM, white matter; vol, volume.a P value � .003. For all other results, P value � .001, equal variances t test.
868 Southard May 2019 www.ajnr.org

implication is that further dose reduction with even lower-dose
techniques and maintained, rather than improved, image quality
is possible with IMR.
The average reconstruction time with IMR was 46 seconds
(46%) longer than with standard FBP reconstruction, but with no
practical effect on work flow. Willemink et al8 likewise reported
a 35% increased reconstruction time of hybrid iDose4 (Philips
Healthcare) in abdominal CT examinations. Reconstruction
times can be expressed in slices per second; however, the number
of slices per second is not a linear function because there is a
longer lag time until the first image. In our study, the FBP recon-
structions averaged 5.2–5.6 slices/second, and the IMR recon-
structions, 3.4 –3.6 slices/second. As computer-processing speeds
improve, image-reconstruction times with IMR should continue
to decrease.
Multiple studies have reported success in reducing relative ra-
diation doses in pediatric cohorts undergoing head CT examina-
tions, ranging from 24% to 48%, using low-dose protocols with
hybrid IR image reconstruction versus standard-dose FBP proto-
cols.9-15 Vorona et al, 2013,16 reported that 20% adaptive statisti-
cal iterative reconstruction (ASIR) could allow 22% relative dose
reduction in pediatric head CT without affecting image quality.
Kilic et al, 2013,17demonstrated a 29% dose reduction with low-
dose 30% ASIR versus standard-dose FBP in 305 pediatric head
CT examinations with maintained diagnostic quality and image
sharpness, but they noted decreased SNR and increased white
matter noise in the IR images. McKnight et al, 2014,18 showed a
relative dose reduction of 28% and 48% in pediatric head CT
examinations in patients 3–12 years of age and older than 12 years
of age, respectively, using 30% ASIR. Thomas et al, 2018,19 re-
ported a relative dose reduction of 26% in pediatric head CT
examinations using hybrid IR iDose4 strength level 2 reconstruc-
tion versus standard-dose FBP, with improved SNR and CNR.
However, subjective image-quality reviewers preferred the FBP
images for noise in the older-than-13-year group, and image
sharpness in the 7- to 12-year and older-than-13-year groups.19
Kim et al, 2017,20 reported that the use of hybrid IR ASIR-V (GE
Healthcare) allowed a 12.8%–34% dose reduction and lower
noise and higher CNR in both supratentorial and posterior fossa
structures in patients younger than 3 years of age and 3–15 years
of age, with improved image sharpness on qualitative review. Ono
et al, 2016,21 reported 78 children 5 years of age and younger
undergoing emergent noncontrast head CT reconstructed with
FBP and 2 strengths of hybrid sinogram-affirmed iterative recon-
struction. SNR and CNR were highest in the IR groups, as were
subjective image-quality scores for gray-white matter differentia-
tion and artifacts from the skull.
Relatively few studies have assessed IMR in pediatric head CT
examinations. To our knowledge, no prior study has compared
pediatric head CT examinations reconstructed using IMR and
FBP. Notohamiprodjo et al, 2015,22 reported improved subjective
image quality, decreased artifacts, and significantly improved
SNR and CNR in head CT examinations
reconstructed with MBIR compared
with hybrid IR (ASIR) and proposed the
potential of further reduction of the ra-
diation dose with MBIR. den Harder et
al, 2015,23 reviewed hybrid and model-
based IR in pediatric CT examinations
and demonstrated improved noise re-
duction with MBIR and described vari-
ations of image textures depending on
IR strength and reconstruction ker-
nels.23 Smith et al, 2014,24 compared re-
duced-dose MBIR and hybrid IR 30%
ASIR in pediatric body CT and reported
decreased noise and improved spatial
resolution with MBIR, but noted an al-
tered texture and decreased sharpness of
trabecular bone with MBIR. Cheng et al,
2018,25 examined the image quality of
head and neck CTA in pediatric patients
scanned at a lowered radiation dose (80
kV) using decreased IV contrast volume
and IMR image reconstruction and
FIG 1. A, A 5-year-old girl bitten by a dog with scalp lacerations. Unenhanced head CT 3-mm axialimage obtained using standard-dose protocol with FBP reconstruction. ROIs were placed on thethalamus and frontal white matter: thalamus, 32.3 � 4.1 HU; SNR, 7.9; white matter, 26.8 � 3.9 HU;SNR, 6.9; CNR, 1.4; CTDIvol, 28.7 mGy. B, A 5-year-old boy who hit his head on concrete. Unen-hanced head CT 3-mm axial image obtained using a low-dose age-based protocol with IMRreconstruction. ROIs were placed on the thalamus and frontal white matter: thalamus, 31� 1.5 HU;SNR, 20.7; white matter, 25 � 1.5 HU; SNR, 16.7; CNR, 4.1; CTDIvol, 22.8 mGy. SNR and CNR improved2-fold with IMR, with a 21% decrease in CTDIvol.
Table 3: Mean subjective image-quality scores (SD) and average combined scores with frequency of image-quality scores given for FBPand IMR imagesa
Combined DR1 DR2 DR1 (Frequency) DR2 (Frequency) r ICCFBP 2.3 (0.6) 1.9 (0.8) 2.8 (0.6) 6/11/2/1/0 0/6/13/4/0 0.43 0.399IMR 3.6 (0.6) 3.6 (0.8) 3.7 (0.6) 0/1/10/6/3 0/1/4/15/0 0.37 0.345P value �.001 �.001 �.001
Note:—ICC indicates intraclass correlation coefficient; DR1, radiologist 1; DR2, radiologist 2.a Combined scores are in column 2. Scores are 1 (poor) to 5 (excellent).
AJNR Am J Neuroradiol 40:866 –71 May 2019 www.ajnr.org 869

found improved mean SNR and CNR, improved CT attenuation
values of the arteries, and less noise compared with patients im-
aged at a higher 100 kV with images reconstructed with FBP.
Improved vessel attenuation, CNR, and reduced noise with IMR
lend themselves to improved spatial resolution and 3D volume-
rendered models.
One common problem with model-based IR is altered image
texture, which has been described as “waxy” or “glossy.” To min-
imize this effect, our neuroradiologists rely on the 1-mm image
set for primary diagnostic interpretation. The use of thinner im-
age sets lessens the undesirable overly smooth image texture of the
thicker images reconstructed using IMR, with relative maintained
SNR, CNR, and acceptable noise (Fig 2).
A limitation of our study is that it was
a retrospective review of patients, and
we were unable to randomize patients
and scanners. Our results demonstrated
an average dose reduction of 22% with
the use of IMR, which agrees with find-
ings of other studies using hybrid IR.
However, the concept of dose reduction
is relative depending on reference proto-
cols. Individual institutional results will
vary depending on current protocols
used, availability and type of IR used,
physician noise tolerance, and image-
texture preferences.
There is an inherent limitation in as-
sessing reconstruction times because the
studies were performed on different
scanners, and machine differences in
hardware, processor clock speeds, and
RAM could impact our observed recon-
struction times.
Qualitative image-quality analysis
may have been limited by the size of the
random subsets evaluated. Lack of intra-
class correlation coefficient agreement
between our 2 reviewers may have been
the result of how they were prepared to
score image quality. Reviewers were only
given a brief written and verbal guide-
line on how to rate the studies, but there
was no hands-on prestudy training us-
ing case examples and no discussion on
how to rate each parameter before con-
ducting individual blinded reviews.Physician confidence and image-noise
tolerance can be affected by experience,
which we hoped to minimize by select-
ing radiologist reviewers, both with �16
years’ experience. Both reviewers indi-
vidually scored the IMR images as supe-
rior to those reconstructed with FBP;
however, 1 reviewer consistently scored
comparable studies 1 full grade below
that given by the second reviewer, also
contributing to lack of an intraclass correlation coefficient. Weused a 5-point rather that 4-point scale to score image quality,which added potential variability of possible scores. In addition,given the altered image texture of the IMR images, the reviewers
could conceivably learn which reconstruction algorithm was
used, possibly introducing bias.Reported IMR subjective image-quality scores may have been
underestimated because we used the 3-mm FBP and 3-mm IMRimages for review and grading, which likely affected subjective
image-quality scores, because our neuroradiology physicians rou-
tinely use the thin 1-mm IMR images for clinical interpretation.
Liu et al, 2017,26 demonstrated that thin-slice 1-mm IMR images
yielded the lowest noise, posterior fossa artifacts, and best CNR in
FIG 2. A 6-month-old female infant who fell from a couch. Axial noncontrast head CT usingstandard protocol and FBP reconstructed at 1-mm (top left) and 3-mm (top right) slice thickness.A, Thalamus, 29 � 7.5 HU; SNR, 3.9; WM, 26 � 7.5 HU; SNR, 3.5; CNR, 0.4; CTDIvol, 25.5 mGy. B,Thalamus, 29 � 3.9 HU; SNR, 7.4; WM, 24 � 4.0 HU; SNR, 6.0; CNR, 1.3; CTDIvol, 25.5 mGy. The 1-mmFBP image has noticeably increased noise and a 69% decrease in CNR compared with the 3-mmFBP image, which lessens the diagnostic quality. A 6-month-old female infant with altered loss ofconsciousness and “not acting normally.” Axial noncontrast images using low-dose protocol andIMR reconstructed at 1-mm (bottom left) and 3-mm (bottom right) slice thickness. C, Thalamus,29 � 2.7 HU; SNR, 10.7; WM, 25 � 2.2 HU; SNR, 11.4; CNR, 1.6; CTDIvol, 21.8 mGy. D, Thalamus, 29 �1.8 HU; SNR, 16.1; WM, 25 � 1.9 HU; SNR, 13.1; CNR, 2.2; CTDIvol, 21.8 mGy. The 1-mm IMR image hasincreased-but-acceptable noise, less than that in the 3-mm standard FBP image, and only a 27%decrease in CNR compared with the 3-mm IMR image. The 1-mm IMR has a more acceptable imagetexture and appears less waxy compared with the 3-mm IMR image.
870 Southard May 2019 www.ajnr.org

unenhanced brain CT examinations, compared with 3-mm hy-
brid IR and 5-mm FBP reconstruction, and they had better sen-
sitivity in the detection of small lacunar lesions. We did not ex-
amine posterior fossa image quality, which should be different
from that in supratentorial measurements due to increased pos-
terior fossa noise.
CONCLUSIONSStudy reconstruction times of urgent head CT examinations using
IMR were statistically longer than those using FBP by 46% (P �
.001), but without a practical effect on work flow. We demon-
strated a relative dose reduction of 12%–27% using optimized
low-dose head CT protocols with IMR, with the greatest dose
savings seen in the youngest patient groups, with a 2-fold im-
provement of SNR and CNR and statistically improved subjective
image quality. Results suggest that further potential dose savings
with maintained image quality are possible with IMR.
Disclosures: Richard N. Southard—UNRELATED: Consultancy: Philips Healthcare;Payment for Lectures Including Service on Speakers Bureaus: Philips Healthcare;OTHER RELATIONSHIPS: Koninklijke Philips NV: Master Enterprise Agreement be-tween Philips Healthcare and Phoenix Children’s Hospital. Dianna M.E. Bardo—UNRELATED: Consultancy: Koninklijke Philips NV, Comments: Master EnterpriseAgreement*; Payment for Lectures Including Service on Speakers Bureaus: Konin-klijke Philips NV, Comments: honoraria to my institution, travel support; Travel/Accommodations/Meeting Expenses Unrelated to Activities Listed: KoninklijkePhilips NV; Other: Thieme Publishing, Comments: Royalties. *Money paid to theinstitution.
REFERENCES1. Wier LM, Hao Y, Owens PV, et al. Overview of Children in the Emer-
gency Department, 2010. Statistical Brief #157. June 2013. HealthcareCost and Utilization Project (HCUP) Statistical Briefs [Internet].Agency for Healthcare Research and Quality, Rockville, Maryland.https://www.ncbi.nlm.nih.gov/books/NBK154386/. Accessed March26, 2019
2. Ryan M, Palasis S, Saigal G, et al. ACR Appropriateness Criteria headtrauma: child. J Am Coll Radiol 2014;11:939 – 47 CrossRef Medline
3. Coakley F, Gould R, Yeh B, et al. CT radiation dose: what can you doright now in your practice? AJR Am J Roentgenol 2011;196:619 –25CrossRef Medline
4. Mahesh M. Advances in CT technology and application to pediatricimaging. Pediatr Radiol 2011;41(Suppl 2):493–97 CrossRef Medline
5. Smith A, Dillon W, Gould R, et al. Radiation dose-reduction strate-gies for neuroradiology CT protocols. AJNR Am J Neuroradiol 2007;28:1628 –32 CrossRef Medline
6. Seibert J. Iterative reconstruction: how it works, how to apply it.Pediatr Radiol 2014;44(Suppl 3):431–39 CrossRef Medline
7. Padole A, Khawaja DR, Kalra MK, et al. CT radiation dose and iter-ative reconstruction techniques. AJR Am J Roentgenol 2015;204:W384 –92 CrossRef Medline
8. Willemink MJ, Schilham AM, Leiner T, et al. Iterative reconstruc-tion does not substantially delay CT imaging in the emergency set-ting. Insights Imaging 2013;4:391–97 CrossRef Medline
9. Mirro AE, Brady SL, Kaufman RA. Full dose-reduction potential ofstatistical iterative reconstruction for head CT protocols in a pre-dominantly pediatric population. AJNR Am J Neuroradiol 2016;37:1199 –205 CrossRef Medline
10. Harris M, Huckle J, Anthony D, et al. The acceptability of iterative
reconstruction algorithms in head CT: an assessment of SinogramAffirmed Iterative Reconstruction (SAFIRE) vs. filtered back pro-jection (FBP) using phantoms. Journal of Medical Imaging and Ra-diation Sciences 2017;48:259 – 69 CrossRef
11. Ho C, Oberle R, Wu I, et al. Comparison of image quality in pediat-ric head computed tomography reconstructed using blended itera-tive reconstruction versus filtered back projection. Clin Imaging2014;38:231–35 CrossRef Medline
12. Korn A, Fenchel M, Bender B, et al. Iterative reconstruction in headCT: image quality of routine and low-dose protocols in comparisonwith standard filtered back-projection. AJNR Am J Neuroradiol2012;33:218 –24 CrossRef Medline
13. Ren Q, Dewan SK, Li M, et al. Comparison of adaptive statisticaliterative and filtered back projection reconstruction techniques inbrain CT. Eur J Radiol 2012;81:2597– 601 CrossRef Medline
14. Bodelle B, Klein E, Naguib NN, et al. Acute intracranial hemorrhagein CT: benefits of sinogram affirmed iterative reconstruction tech-niques. AJNR Am J Neuroradiol 2014;35:445– 49 CrossRef Medline
15. Singh S, Kalra MK, Shenoy-Bhangle AS, et al. Radiation dose reduc-tion with hybrid iterative reconstruction for pediatric CT. Radiol-ogy 2012;263:537– 46 CrossRef Medline
16. Vorona G, Zuccoli G, Sutcavage T, et al. The use of adaptive statisti-cal iterative reconstruction in pediatric head CT: a feasibility study.AJNR Am J Neuroradiol 2013;34:205–11 CrossRef Medline
17. Kilic K, Erbas G, Guryildirim M, et al. Quantitative and qualitativecomparison of standard-dose and low-dose pediatric head com-puted tomography: a retrospective study assessing the effect ofadaptive statistical iterative reconstruction. J Comput Assist Tomogr2013;37:377– 81 CrossRef Medline
18. McKnight C, Watcharotone K, Ibrahim M, et al. Adaptive statisticaliterative reconstruction: reducing dose while preserving imagequality in the pediatric head CT examination. Pediatr Radiol 2014;44:997–1003 CrossRef Medline
19. Thomas A, Southard R, Curran J, et al. Comparing fourth generationstatistical iterative reconstruction technique to standard filteredback projection in pediatric head computed tomography examina-tions. J Comput Assist Tomogr 2018;42:475– 81 CrossRef Medline
20. Kim HG, Lee HJ, Lee SK, et al. Head CT: image quality improvementwith ASIR-V using a reduced radiation dose protocol for children.Eur Radiol 2017;27:3609 –17 CrossRef Medline
21. Ono S, Niwa T, Yanagimachi N, et al. Improved image quality ofhelical computed tomography of the head in children by iterativereconstruction. J Neuroradiol 2016;43:31–36 CrossRef Medline
22. Notohamiprodjo S, Deak Z, Meurer F, et al. Image quality ofiterative reconstruction in cranial CT imaging: comparison ofmodel-based iterative reconstruction (MBIR) and adaptive sta-tistical iterative reconstruction (ASiR). Eur Radiol 2015;25:140 – 46 CrossRef Medline
23. den Harder AM, Willemink MJ, Budde RP, et al. Hybrid and model-based iterative reconstruction techniques for pediatric CT. AJRAm J Roentgenol 2015;204:645–53 CrossRef Medline
24. Smith EA, Dillman JR, Goodsitt MM, et al. Model-based iterativereconstruction: effect on patient radiation dose and image qualityin pediatric body CT. Radiology 2014;270:526 –34 CrossRef Medline
25. Cheng B, Xing H, Lei D, et al. Impact of iterative model reconstruc-tion combined with dose reduction on the image quality of headand neck CTA in children. Sci Rep 2018;8:12613 CrossRef Medline
26. Liu X, Chen L, Weiwei Q, et al. Thin-slice brain CT with iterativereconstruction algorithm for small lacunar lesions detection: im-age quality and diagnostic accuracy evaluation. Medicine (Balti-more) 2017;96:e9412 CrossRef Medline
AJNR Am J Neuroradiol 40:866 –71 May 2019 www.ajnr.org 871

ORIGINAL RESEARCHPEDIATRICS
Pediatric Atypical Teratoid/Rhabdoid Tumors of the Brain:Identification of Metabolic Subgroups Using
In Vivo 1H-MR SpectroscopyX B. Tamrazi, X S. Venneti, X A. Margol, X D. Hawes, X S.Y. Cen, X M. Nelson, X A. Judkins, X J. Biegel, and X S. Bluml
ABSTRACT
BACKGROUND AND PURPOSE: Atypical teratoid/rhabdoid tumors are rare, aggressive central nervous system tumors that are predom-inantly encountered in very young children. Our aim was to determine whether in vivo metabolic profiles correlate with molecular featuresof central nervous system pediatric atypical teratoid/rhabdoid tumors.
MATERIALS AND METHODS: Twenty confirmed patients with atypical teratoid/rhabdoid tumors who underwent MR spectroscopy wereincluded in this study. In vivo metabolite levels of atypical teratoid/rhabdoid tumors were compared with molecular subtypes assessed byachaete-scute homolog 1 expression. Additionally, brain-specific creatine kinase levels were determined in tissue samples.
RESULTS: In vivo creatine concentrations were higher in tumors that demonstrated achaete-scute homolog 1 expression compared withthose without achaete-scute homolog 1 expression (3.42 � 1.1 versus 1.8 � 0.8 IU, P � .01). Additionally, levels of myo-inositol (mI) (9.0 �
1.5 versus 4.7 � 3.6 IU, P � .05) were significantly different, whereas lipids approached significance (44 � 20 versus 80 � 30 IU, P � .07) inthese 2 cohorts. Higher brain-specific creatine kinase levels were observed in the cohort with achaete-scute homolog 1 expression (P �
.05). Pearson correlation analysis showed a significant positive correlation of brain-specific creatine kinase with absolute creatine (P � .05)and myo-inositol (P � .05) concentrations.
CONCLUSIONS: In vivo MR spectroscopy may predict key molecular features of atypical teratoid/rhabdoid tumors at initial diagnosis,leading to timely patient risk stratification and accelerating the development of targeted therapies.
ABBREVIATIONS: ASCL1 � achaete-scute homolog 1; AT/RT � atypical teratoid/rhabdoid tumor; CKB � brain-specific creatine kinase; Cr � creatine; mI �myo-inositol; Cho � choline; SMARCB1 � SWI/SNF-related matrix-associated actin-dependent regulator of chromatin subfamily B member 1
Primary brain tumors are the most common pediatric solid
tumors in children and the leading cause of death from child-
hood cancer.1,2 Recently, through the emergence of molecular
diagnostics and the growing field of pediatric molecular neuro-
oncology, biologically distinct and clinically relevant molecular
subtypes of pediatric brain tumors have been identified. These
include atypical teratoid/rhabdoid tumors (AT/RTs), a group of
rare, highly aggressive central nervous system tumors with poor
prognosis. The genetic hallmark of AT/RTs is the loss of protein
expression of SWI/SNF-related matrix-associated actin-dependent
regulator of chromatin subfamily B member 1 (SMARCB1), a tu-
mor-suppressor locus on chromosome 22q11.23.3,4 Although
these tumors are uniformly characterized by deletions and/or mu-
tations in this locus, there is clinical and molecular heterogeneity
among the patients. This suggests further underlying biologic het-
erogeneity,5,6 which has been defined by recent multicenter stud-
ies.7,8 Noninvasive imaging markers obtained at initial presenta-
tion can potentially serve as surrogates for these molecular
subgroups or for specific clinically relevant molecular features
that may lead to patient risk stratification and improved treat-
ment strategies. Recently, an imaging study demonstrated signif-
icant differences in the location and conventional MR imaging
characteristics of AT/RTs, which may potentially correlate with
the different molecular features/subgroups.9
Among the molecular features that can be used to distinguish
AT/RTs is a transcription factor known as achaete-scute homolog
1 (ASCL1). Patients whose tumors had expression of ASCL1 had
improved overall survival.10 In this study, we focused on this spe-
Received December 13, 2018; accepted February 27, 2019.
From the Departments of Radiology (B.T., M.N., S.B.) and Pediatrics (A.M.) and Divi-sion of Hematology Oncology, and Pathology (D.H., A.J., J.B.), Children’s HospitalLos Angeles, Los Angeles, California; Department of Pathology (S.V.), University ofMichigan, Ann Arbor, Michigan; Department of Radiology and Neurology (S.Y.C.),University of Southern California, Los Angeles, California; and Rudi Schulte Re-search Institute (S.B.), Santa Barbara, California.
Funding for this research provided by the American Society of Pediatric Neurora-diology Research Award.
Please address correspondence to Benita Tamrazi, MD, Children’s Hospital LosAngeles, Department of Radiology, 4650 Sunset Blvd, Los Angeles CA 90027 MS 81;e-mail: [email protected]
http://dx.doi.org/10.3174/ajnr.A6024
872 Tamrazi May 2019 www.ajnr.org

cific molecular feature and explored whether in vivo 1H-MR spec-
troscopy can distinguish ASCL1-expressing AT/RTs from those
that do not express ASCL1. In an analysis of tissue samples, we
observed different levels of brain-specific creatine kinase (CKB),
with CKB being higher in ASCL1-expressing AT/RTs. Thus, our
primary objective was to determine whether in vivo Cr concen-
trations were significantly higher in AT/RTs with ASCL1 expres-
sion versus tumors without ASCL1 expression. A secondary goal
of this study was to review other metabolic features that are ob-
tained simultaneously with the measurement of creatine to fur-
ther differentiate these 2 cohorts using a metabolic/MR spectros-
copy imaging approach.
MATERIALS AND METHODSPatientsOur single-center, retrospective study was approved by our insti-
tutional review board (Children’s Hospital Los Angeles) and was
compliant with the Health Insurance Portability and Account-
ability Act. The requirement to obtain informed consent was
waived. We accessed the pediatric oncology data base of our in-
stitution to identify patients with AT/RTs from 2000 to 2017 with
MR spectroscopy and frozen tissue specimens obtained at our
institution. All included patients had confirmed AT/RTs of the
brain with patient characteristics summarized in Table 1.
Imaging ProtocolAll brain MR spectroscopy examinations were performed with
1.5T or 3T whole-body MR imaging systems in our institution
(Achieva and Ingenia, Philips Healthcare, Best, the Netherlands;
Signa HD 1.5, GE Healthcare, Milwaukee, Wisconsin). A single-
voxel point-resolved spectroscopic sequence with TE � 35 ms,
TR � 1.5 seconds (for 1.5T) and 2 seconds (for 3T), and 128 signal
averages was used for all acquisitions. T2-weighted fast spin-echo,
FLAIR, and T1-weighted FLAIR images were acquired in all in-
stances before MR spectroscopy and were reviewed to determine
the extent of tumor lesions. We identified the ROIs for MR spec-
troscopy on the basis of MR images from all 3 planes centered in
the solid parts of the tumors, excluding any surrounding normal
brain tissue or edema and in a manner that minimized inclusion
of cystic or necrotic areas. An attending pediatric neuroradiolo-
gist reviewed and approved the ROIs for each patient and con-
firmed that the MR spectroscopy profile was representative of
tumor tissue only. The sizes and shapes of the ROIs were adjusted
to lesion size and typically varied between 5 and 10 cm3. Spectra
were processed using the fully automated LCModel, Version
6.1–1 L software (http://www.lcmodel.com/). Absolute concen-
trations (IU) of Cho, Cr, mI, lactate, and lipid, which all consis-
tently have been reported to be abnormal in tumors, were ana-
lyzed. The unsuppressed water signal, assuming a water content of
75%, was used as an internal concentration reference.
Molecular Diagnostic Analysis
SMARCB1 Protocol. SMARCB1 molecular genetic analysis by
Sanger sequencing and multiplex ligation-dependent probe am-
plification were conducted on all tissue samples to confirm the
diagnosis of AT/RT11 per prior reported methodology.
ASCL1 Protocol/Immunohistochemistry and Automated Scoringof CKB. Immunohistochemical studies were performed as previ-
ously described.12 The primary antibody (ASCL1) (Mouse Anti-
MASH1, catalog No. 556604; BD Biosciences, San Jose, Califor-
nia) diluted 1:100 with Bond Primary Antibody Diluent (Leica
Biosystems, Buffalo Grove, Illinois) was incubated for 30 minutes.
The primary antibody was detected using the Bond Polymer Re-
fine Detection kit (Leica Biosystems), which uses a peroxidase
block, secondary antibodies, and 3, 3-diaminobenzidine and was
finally counter-stained with hematoxylin.
Immunohistochemical studies for CKB were performed on
previously characterized rhabdoid tumor tissue microarrays as
Table 1: Patient demographics and clinical and biologic lesion characterizationAge (yr) Sex Overall Survival (mo) Location LM ASCL1 CKB Germline Mutation0.15 F 0.5a Posterior fossa 0 Negative 5.050.32 F 17.0 Posterior fossa 0 Positive 6.31 Yes0.39 M 8.2b Posterior fossa 1 Positive0.64 M 7.0 Parietal lobe 0 Negative 5.100.67 M 0.5a Posterior fossa 1 Positive0.68 M 5.1 Intraventricular 0 ND0.92 F 0.5a Posterior fossa 1 Positive Yes0.95 M 71.9b Posterior fossa 0 ND1.09 M 13.0 Posterior fossa 0 Negative 5.311.14 M 7.0 Temporal lobe 0 Positive 6.05 Yes1.15 M 59.0 Posterior fossa 0 Negative 6.311.42 F 9.0 Posterior fossa 1 ND1.54 M 32.0 Temporal lobe 0 Positive 6.53 Yes1.55 M 63.2b Posterior fossa 0 Negative1.73 M 13.0 Pineal 0 Positive1.84 F 18.0 Frontotemporal 0 Negative 5.211.96 F NA Temporal lobe 1 ND2.86 M 18.0 Frontotemporal 1 Positive 6.617.43 F 40.0 Frontotemporal 0 Positive 6.4213.72 M 40.0 Intraventricular 0 Positive 5.71
Note:—NA indicates patient lost to follow up; LM, leptomeningeal disease present (1) versus absent (0) at presentation; ND, not determined.a Patients who died from surgical/other complications with no MR imaging or clinical evidence of progressive tumor.b Patients who were still alive at the time of the completion of this study.
AJNR Am J Neuroradiol 40:872–77 May 2019 www.ajnr.org 873

previously described,13,14 and full paraffin-embedded sections
from all available tumor blocks were obtained from imaged pa-
tients. Quantification of immunohistochemical data was per-
formed as previously described.15 Blocker D, Streptavidin (HRP),
and the DAB detection kit (Ventana Medical Systems, Tucson,
Arizona) were used according to the manufacturer’s instructions.
For automated scoring, each tissue microarray slide was scanned
using a Scanscope Scanner (Aperio, Vista, California) and viewed
through the ImageScope software program (Aperio). An individual
blinded to the experimental design captured JPEG images from each
core (circular area of 315 cm2 corresponding to the entire core) at
10� magnification. For full sections, the same blinded individual
captured 5 random areas (circular area of 315 cm2 at 10� magnifi-
cation). Quantification was conducted using an automated analysis
program with the Matlab Image-Processing Toolbox (MathWorks,
Natick, Massachusetts) based on previously described methodol-
ogy.15 The final score for a given case and marker was calculated by
averaging the score of 2 cores (for each case) or from 5 areas per
section for full slides. These raw CKB numbers were log-transformed
(CKB � log10 [CKBraw]) for statistical analysis.
Data CollectionFrozen tumor tissue from 16 of 20 patients with AT/RTs and MR
spectroscopy studies from all 20 patients diagnosed at Children’s
Hospital Los Angeles between 2000 and 2017 were available for
analysis. Sufficient tissue samples available from 11 patients were
examined for CKB.
Statistical AnalysisStatistical analysis was informed by the previously reported find-
ing of 2 distinct molecular subtypes defined by the expression of
the molecular marker ASCL1.10 For demographic measurements,
the Fisher exact test was used to assess the difference in sex and
lesion location (posterior fossa versus lesions outside the poste-
rior fossa) between the 2 ATRT categories. A 2-sided exact test
with a Wilcoxon score was used to examine the difference in con-
tinuous measurements, including the demographics, month of
follow-up, and metabolic profiles. Because there were multiple
outcomes, the sequential gatekeeper strategy16 was used to con-
trol the family-wise type I error rate. In this strategy, the outcomes
were grouped into primary, secondary, and tertiary families. The
primary and secondary outcomes were CKB and Cr, respectively.
The tertiary outcome family included Cho, lactate, mI, and lipids.
We first gave the full � of .05 to the primary outcome. If the
primary outcome failed to reject the null hypothesis, the statistical
test would stop at the primary level. Otherwise, the � value would
be fully passed to the secondary outcome. If it failed to reject the
null hypothesis at the secondary family, the statistical test would
stop; otherwise, it would proceed to the tertiary outcome family.
Because the tertiary family had 4 outcome measurements, the
Benjamini-Hochberg false discovery rate correction method was
used to control the error introduced by multiple testing. Further-
more, Spearman correlation analysis was used to assess the corre-
lation between CKB and Cr concentrations in AT/RTs. We have
conducted an exploratory analysis of survival using the Kaplan-
Meier curve with a log-rank test. Patients who died from causes
not related to disease progression were excluded because the log-
rank test assumes noninformative right censoring. Patients at fi-
nal follow-up were censored. SAS 9.4 (SAS Institute, Cary, North
Carolina) was used for all statistical tests.
RESULTSIn vivo MR spectra acquired from AT/RTs demonstrated consid-
erable metabolic heterogeneity. For example, whereas in some
patients signals from Cr and mI were readily detectable, these
metabolites were essentially absent in other AT/RT cases (Fig 1).
CKB was analyzed independently for 11 AT/RTs, and signifi-
cantly higher CKB levels were observed in the cohort with ASCL1
expression (P � .05, Table 2) in our patient population. The sub-
sequent analysis of in vivo Cr concentrations demonstrated that
Cr was significantly higher in tumors with ASCL1 expression than
in tumors without ASCL1 expression (P � .05, Table 2). In addi-
tion, significantly different in these 2 subgroups was the metabo-
lite mI (P � .05, Table 2), whereas lipid levels approached signif-
icance (P � .07, Table 2). Pearson correlation analysis showed
statistically significant positive correlations of CKB with absolute
Cr (P � .05) and mI (P � .01) concentrations.
AT/RTs located outside the posterior fossa more often ex-
pressed ASCL1 (6 versus 3 patients), whereas AT/RTs in the pos-
terior fossa more often did not express ASCL1 (3 versus 4). Al-
though this difference was not statistically significant in this small
cohort of patients, the trend is consistent with the findings re-
ported by Torchia et al.10 Overall survival in the 2 AT/RT sub-
groups was not significantly different (P � .93).
DISCUSSIONAT/RTs are rare, aggressive central nervous system tumors that
are predominantly encountered in very young children. These
tumors have been considered incurable, with survival being typi-
cally �1 year after diagnosis for most patients. Although AT/RTs
are uniformly defined by the loss of expression of SMARCB1,
clinically there is considerable heterogeneity. While most children
with these tumors have a very poor prognosis, a subset of patients
experience distinctly prolonged survival, indicating epigenetic
heterogeneity that potentially affects the response to treatment.6
Indeed, current consensus from a large multicenter study is that
there are at least 3 molecular subgroups, referred to as AT/RT-
SHH, AT/RT-TYR, and AT/RT-MYC.8 A second and indepen-
dent consortium of investigators7 also postulated 3 molecular
subgroups of AT/RTs: Group 1 carried “neurogenic” signatures
such as the expression of ASCL1 with clinically more favorable
behavior, and groups 2A and 2B consisted of “mesenchymal” AT/
RTs, which were more aggressive/treatment-resistant and did not
express ASCL1. Richardson et al5 suggested that AT/RT-SHH,
AT/RT-TYR, and AT/RT-MYC subgroups may correspond with
group 1, 2A, and 2B subgroups, respectively. However, this possibil-
ity has not been formally investigated and confirmed. In this study, to
establish a clear separation of patients, we focused on the molecular
feature of ASCL1 expression with our groups comprising AT/RTs
that either expressed ASCL1 or did not express ASCL1.
When comparing in vivo MR spectroscopy measurements in
AT/RTs, we observed significantly higher Cr concentrations in the
ASCL1-expressing group versus the non-ASCL1-expressing
group. Cr is an energy metabolite that is synthesized through a
874 Tamrazi May 2019 www.ajnr.org

2-step process in the kidneys, pancreas, and liver. The brain then
takes up Cr from the bloodstream by specific receptors known as
SLC6A8, which are expressed in neurons and oligodendrocytes of
the brain. Once Cr enters the CNS, it becomes part of the free
creatine/phosphocreatine/creatine kinase system, which serves as
an energy reservoir to maintain stable adenosine triphosphate
levels.17,18 Both free Cr and creatine/phosphocreatine contribute
to the total Cr peak, which is quantified by MR spectroscopy.
For our cohort, the finding of higher levels of CKB in ASCL1-
expressing AT/RTs provides additional evidence for considerable
differences in Cr uptake and regulation in the ASCL1-expressing
subgroup of AT/RTs. Furthermore, we have reviewed publicly
accessible data from the studies of Tor-
chia et al7,10 and have noted that in their
dataset, both CKB and the creatine re-
ceptor (SLC6A8) were significantly
higher in AT/RTs with ASCL1 expres-
sion compared with tumors without ex-
pression of ASCL1. Further studies are
necessary to determine whether there
is a direct relationship between ASCL1
expression and creatine metabolism.
However, the above observations
strongly indicate that the energy me-
tabolism in the ASCL1-expressing
subgroup could be different from that
in the subgroup without ASCL1 ex-
pression. Therefore, we postulate that
the molecular differences of the sub-
groups ultimately lead to differences
in the underlying metabolism, which
can be identified by noninvasive meth-
ods such as MR spectroscopy.
Myo-inositol was also significantly
higher in ASCL1-expressing AT/RTs
than in those without expression of
ASCL1. Myo-inositol, a sugarlike mole-
cule, is involved in signaling as part of
the second messenger systems in the
normal brain.19 Similar to creatine, mI is
not synthesized inside brain cells but is
derived from the diet or is synthesized in
the kidneys. Myo-inositol is believed to
be a putative marker of glial cells, partic-
ularly of astrocytes.20,21 It is thus gener-
ally high in astrocytomas but decreases
when lesions transform to a higher
grade.22,23 Myo-inositol is involved in
the activation of the protein kinase C,
which leads to production of proteolytic
enzymes that are found more often in
malignant, aggressive primary cerebral
tumors.22 For AT/RTs, mI may poten-
tially serve as a surrogate predictor of
more aggressive lesions—that is, lower
mI predicts the more aggressive AT/RTs
without expression of ASCL1. The cause
for low mI in these tumors may be the lack of uptake and trans-
port; however, this was not specifically investigated in this study,
and further validation studies are needed.
In contrast to Cr and mI, which were both lower in AT/RTs
that did not demonstrate ASCL1 expression, lipids were more
prominent, though statistical significance was not reached. There
is some controversy about the origin of the lipid signal in tumors.
Some groups suggested that the lipid signal originates from mo-
bile lipid molecules as a result of tissue degradation and necrosis
of aggressively growing lesions.24-26 On the other hand, promi-
nent lipid signal was also reported in spectra obtained from tu-
mors without detectable necrosis.27 In any case, there appears to
FIG 1. T2-weighted MR imaging and MR spectra of supratentorial AT/RTs with ASCL1 expression(upper row), a posterior fossa AT/RT with ASCL1 expression (middle row), and posterior fossaAT/RT without ASCL1 expression (lower row). Cr, Cho, and mI are readily detectable in the spectraof supratentorial and posterior fossa ASCL1-expressing AT/RTs, whereas only Cho is clearly de-tectable in the ASCL1-nonexpressing posterior fossa AT/RT. All spectra show prominent signalfrom lipids and lactate (Lac). Shown are the unprocessed data (thin black lines) with the super-imposed fit (thick gray lines) used for quantification. The “box” seen in the images represents thevoxel placement.
AJNR Am J Neuroradiol 40:872–77 May 2019 www.ajnr.org 875

be consensus that the presence of high lipids is generally an indi-
cator of more malignant lesions.24 The observed trend of higher
lipid levels in AT/RTs without expression of ASCL1 would thus be
consistent with a potentially worse prognosis.
Differences in our patient cohort in terms of germline-versus-
sporadic SMARCB1 mutations were also investigated. A total of 4
patients were identified with germline mutations (Table 1), all of
which demonstrated expression of ASCL1. Although this is an
interesting finding, more data are needed to investigate the clini-
cal significance, if any, of this observation.
Overall survival in the 2 AT/RT subgroups in this study was
not significantly different. This appears to be inconsistent with the
study of Torchia et al,10 which predicted a clinically more favor-
able outcome for AT/RTs with expression of ASCL1. However,
treatment approaches for most patients included in this study
were not consistent, likely playing a role in outcome/prognosis.
Thus, the inability of this study to detect a difference in clinical
outcomes of a small group of AT/RTs should not be overempha-
sized. Our study did, however, demonstrate a trend concordant
with the findings of Torchia et al,7 specifically that AT/RTs ex-
pressing ASCL1 are more often located outside the posterior
fossa.
The question arises as to whether metabolic features of AT/
RTs, obtained by noninvasive MR spectroscopy, form clusters
and whether these clusters correlate with molecular subtypes or
specific molecular features. Our analysis of the MR spectroscopy
data available for this study is suggestive of the presence of 2
dominant metabolic clusters consisting of AT/RTs with signifi-
cant differences in Cr and mI (relative to Cho) (Fig 2). However,
given the broad heterogeneity of the larger metabolic group data
points (dashed line circle in Fig 2), it is unclear whether these cases
form a separate third group as predicted by the molecular pheno-
types. Further, multicenter prospective trials with larger number
of subjects using MR spectroscopy data are needed for analysis.
Our study had several limitations, including the single-center
retrospective design. Our total number of patients is small. How-
ever, to our knowledge, this is the largest cohort of patients with
AT/RTs with both molecular and metabolic (MR spectroscopy)
data. No corrections of metabolite concentrations for T1 and T2
effects were applied because they are unknown in AT/RTs and it
was not feasible to measure them in a clinical setting in patients. It
is known that T1 times are longer at 3T than at 1.5T. The longer
TR of our 3T studies (2.0 versus 1.5 seconds) partially corrects for
this effect. Additionally, due to acquisition of the data at both 1.5
and 3T, differentiation of the mI and glycine peak proved to be
challenging, particularly at 1.5T because both mI and glycine con-
tribute to the peak at 3.5 ppm. Clinically, glycine and mI may have
similar implications because prior studies have reported that gly-
cine consumption and synthesis are correlated with rapid cancer
cell proliferation28; therefore, glycine may serve as a marker for
more aggressive tumors. Changes in glycine therefore can poten-
tially coincide with and/or parallel those of mI in aggressive brain
tumors. Further studies at 3T are warranted to investigate the role
of glycine in aggressive pediatric brain tumors.
CONCLUSIONSOur study demonstrates that metabolic profiles as determined by
MR spectroscopy can help predict molecular features of AT/RTs,
potentially serving as in vivo biomarkers for the molecular sub-
groups. AT/RTs with and without expression of ASCL1 are cur-
rently treated using similar aggressive chemotherapy regimens,
sometimes with added radiation therapy. However, it is expected
that in the future, therapeutic options will be developed that will
try to exploit unique biologic/molecular features in individual
patients. A noninvasive method for early stratification would then
be helpful clinically and is the ultimate goal for the current preci-
sion-based oncologic management of patients with brain tumors.
Disclosures: Benita Tamrazi—RELATED: Grant: American Society of Pediatric Neu-roradiology Research Grant, Comments: The grant supports research conducted forthis article*; UNRELATED: Consultancy: Bayer. Debra Hawes—UNRELATED: Employ-ment: University of Southern California, Comments: primary employer Children’sHospital Los Angeles. Marvin Nelson—UNRELATED: Employment: Children’s Hospi-
Table 2: Features of AT/RTs with expression of ASCL1a
ASCL1Pos.
ASCL1Neg.
PValue
Age (mean) (yr) 3.4 � 4.5 1.8 � 0.8 NSSex (M/F) 6:3 5:2 NSLocation PF vs not PF 3 vs 6 4 vs 3 NSCrb 3.4 � 1.1 1.8 � 0.8 �.05Chob 3.2 � 0.8 3.8 � 2.1 NSmIb 9.0 � 1.5 4.7 � 3.6 �.05Lacb 5.0 � 3.9 2.6 � 2.6 NSLipidsb 44 � 20 80 � 30 NSc
CKB (mean) 6.3 � 0.3 5.4 � 0.5 �0.05Months of follow-up (mean) 22 � 14 32 � 27 NS
Note:—NS indicates not significant; Pos., positive; Neg., negative; PF, posterior fossa.a Tissue from 16 of 20 AT/RTs was available for testing of ASCL1 status.b Means in IU.c Approaching significance with P � .07.
FIG 2. K-means cluster analysis graph demonstrating the metabolicclusters based on Cr/Cho and mI/Cho ratios. Ratios were trans-formed to z scores for better illustration. Findings suggest that asubgroup of AT/RTs (solid line) are homogeneously characterized byvery low Cr and mI levels (relative to Cho) and are well-separatedfrom other AT/RTs. It is, however, unclear whether the remaininglarger cluster of AT/RTs (dashed line) forms a single group or multipleseparate groups as suggested by the molecular data.
876 Tamrazi May 2019 www.ajnr.org

tal Los Angeles Medical Group; Comments: book published in 2012. Stefan Bluml—UNRELATED: Ians Friends Foundations, Rudi Schulte Research Institute, Comments:Salary support. *Money paid to the institution.
REFERENCES1. Ostrom QT, Gittleman H, Fulop J, et al. CBTRUS Statistical Report:
Primary Brain and Central Nervous System Tumors Diagnosed inthe United States in 2008 –2012. Neuro Oncol 2015;17(Suppl 4):iv1– 62 CrossRef Medline
2. Gurney J, Smith M, Bunin G. CNS and miscellaneous intracranialand intraspinal neoplasms. In: Ries L, Smith M, Gurney J, et al., eds.Cancer Incidence and Survival among Children and Adolescents: UnitedStates SEER Program 1975–1995. Bethesda: National Cancer Institute,SEER Program. NIH Pub. No. 99 – 4649; 1999
3. Biegel JA, Zhou JY, Rorke LB, et al. Germ-line and acquired muta-tions of INI1 in atypical teratoid and rhabdoid tumors. Cancer Res1999;59:74 –79 Medline
4. Versteege I, Sevenet N, Lange J, et al. Truncating mutations ofhSNF5/INI1 in aggressive paediatric cancer. Nature 1998;394:203– 06 CrossRef Medline
5. Richardson EA, Ho B, Huang A. Atypical teratoid rhabdoid tumour:from tumours to therapies. J Korean Neurosurg Soc 2018;61:302–11CrossRef Medline
6. Ginn KF, Gajjar A. Atypical teratoid rhabdoid tumor: current ther-apy and future directions. Front Oncol 2012;2:114 CrossRef Medline
7. Torchia J, Golbourn B, Feng S, et al. Integrated (epi)-genomic anal-yses identify subgroup-specific therapeutic targets in CNS rhab-doid tumors. Cancer Cell 2016;30:891–908 CrossRef Medline
8. Johann PD, Erkek S, Zapatka M, et al. Atypical teratoid/rhabdoidtumors are comprised of three epigenetic subgroups with distinctenhancer landscapes. Cancer Cell 2016;29:379 –93 CrossRef Medline
9. Nowak J, Nemes K, Hohm A, et al. Magnetic resonance imagingsurrogates of molecular subgroups in atypical teratoid/rhabdoidtumor. Neuro Oncol 2018;20:1672–79 CrossRef Medline
10. Torchia J, Picard D, Lafay-Cousin L, et al. Molecular subgroups ofatypical teratoid rhabdoid tumours in children: an integratedgenomic and clinicopathological analysis. Lancet Oncol 2015;16:569 – 82 CrossRef Medline
11. Eaton KW, Tooke LS, Wainwright LM, et al. Spectrum of SMARCB1/INI1 mutations in familial and sporadic rhabdoid tumors. PediatrBlood Cancer 2011;56:7–15 CrossRef Medline
12. Panwalkar P, Clark J, Ramaswamy V, et al. Immunohistochemicalanalysis of H3K27me3 demonstrates global reduction in group-Achildhood posterior fossa ependymoma and is a powerful predictorof outcome. Acta Neuropathol 2017;134:705–14 CrossRef Medline
13. Venneti S, Le P, Martinez D, et al. Malignant rhabdoid tumors ex-press stem cell factors, which relate to the expression of EZH2 andId proteins. Am J Surg Pathol 2011;35:1463–72 CrossRef Medline
14. Eaton BT, Hyatt AD, Brookes SM. The replication of bluetonguevirus. Curr Top Microbiol Immunol 1990;162:89 –118 Medline
15. Venneti S, Garimella MT, Sullivan LM, et al. Evaluation of histone 3lysine 27 trimethylation (H3K27me3) and enhancer of Zest 2(EZH2) in pediatric glial and glioneuronal tumors shows decreasedH3K27me3 in H3F3A K27M mutant glioblastomas. Brain Pathol2013;23:558 – 64 CrossRef Medline
16. FDA. Multiple Endpoints in Clinical Trials. 2017. https://www.fda.gov/downloads/drugs/guidancecomplianceregulatoryinformation/guidances/ucm536750.pdf. Accessed September 18, 2018
17. Hanna-El-Daher L, Braissant O. Creatine synthesis and exchangesbetween brain cells: what can be learned from human creatine de-ficiencies and various experimental models? Amino Acids 2016;48:1877–95 CrossRef Medline
18. Braissant O, Henry H, Villard AM, et al. Creatine synthesis andtransport during rat embryogenesis: spatiotemporal expression ofAGAT, GAMT and CT1. BMC Dev Biol 2005;5:9 CrossRef Medline
19. Fisher SK, Novak JE, Agranoff BW. Inositol and higher inositolphosphates in neural tissues: homeostasis, metabolism and func-tional significance. J Neurochem 2002;82:736 –54 CrossRef Medline
20. Isaacks RE, Bender AS, Kim CY, et al. Osmotic regulation of myo-inositol uptake in primary astrocyte cultures. Neurochem Res 1994;19:331–38 CrossRef Medline
21. Brand A, Richter-Landsberg C, Leibfritz D. Multinuclear NMR stud-ies on the energy metabolism of glial and neuronal cells. Dev Neu-rosci 1993;15:289 –98 CrossRef Medline
22. Castillo M, Smith JK, Kwock L. Correlation of myo-inositol levelsand grading of cerebral astrocytomas. AJNR Am J Neuroradiol 2000;21:1645– 49 Medline
23. Panigrahy A, Krieger MD, Gonzalez-Gomez I, et al. Quantitativeshort echo time 1H-MR spectroscopy of untreated pediatric braintumors: preoperative diagnosis and characterization. AJNR Am JNeuroradiol 2006;27:560 –72 Medline
24. Negendank W, Sauter R. Intratumoral lipids in 1H MRS in vivo inbrain tumors: experience of the Siemens cooperative clinical trial.Anticancer Res 1996;16:1533–38 Medline
25. Kuesel AC, Sutherland GR, Halliday W, et al. 1H MRS of high gradeastrocytomas: mobile lipid accumulation in necrotic tissue. NMRBiomed 1994;7:149 –55 CrossRef Medline
26. Rock JP, Hearshen D, Scarpace L, et al. Correlations between mag-netic resonance spectroscopy and image-guided histopathology,with special attention to radiation necrosis. Neurosurgery 2002;51:912–19, discussion 919 –20 Medline
27. Kuesel AC, Donnelly SM, Halliday W, et al. Mobile lipids and meta-bolic heterogeneity of brain tumours as detectable by ex vivo 1HMR spectroscopy. NMR Biomed 1994;7:172– 80 CrossRef Medline
28. Jain M, Nilsson R, Sharma S, et al. Metabolite profiling identifies akey role for glycine in rapid cancer cell proliferation. Science 2012;336:1040 – 44 CrossRef Medline
AJNR Am J Neuroradiol 40:872–77 May 2019 www.ajnr.org 877

ORIGINAL RESEARCHPEDIATRICS
Intravoxel Incoherent Motion MR Imaging of PediatricIntracranial Tumors: Correlation with Histology and
Diagnostic UtilityX K. Kikuchi, X A. Hiwatashi, X O. Togao, X K. Yamashita, X R. Kamei, X D. Momosaka, X N. Hata, X K. Iihara,
X S.O. Suzuki, X T. Iwaki, and X H. Honda
ABSTRACT
BACKGROUND AND PURPOSE: Intravoxel incoherent motion imaging, which simultaneously measures diffusion and perfusion param-eters, is promising for brain tumor grading. However, intravoxel incoherent motion imaging has not been tested in children. The purposeof this study was to evaluate the correlation between intravoxel incoherent motion parameters and histology to assess the accuracy ofintravoxel incoherent motion imaging for pediatric intracranial tumor grading.
MATERIALS AND METHODS: Between April 2013 and September 2015, 17 children (11 boys, 6 girls; 2 months to 15 years of age) withintracranial tumors were included in this retrospective study. Intravoxel incoherent motion parameters were fitted using 13 b-values for abiexponential model. The perfusion-free diffusion coefficient, pseudodiffusion coefficient, and perfusion fraction were measured in high-and low-grade tumors. These intravoxel incoherent motion parameters and the ADC were compared using the unpaired t test. Thecorrelations between the intravoxel incoherent motion parameters and microvessel density or the MIB-1 index were analyzed using theSpearman correlation test. Receiver operating characteristic analysis was used to evaluate diagnostic performance.
RESULTS: The perfusion-free diffusion coefficient and ADC were lower in high-grade than in low-grade tumors (perfusion-free diffusioncoefficient, 0.85 � 0.40 versus 1.53 � 0.21 � 10�3 mm2/s, P � .001; ADC, 1.04 � 0.33 versus 1.60 � 0.21 � 10�3 mm2/s, P � .001). Thepseudodiffusion coefficient showed no difference between the groups. The perfusion fraction was higher in high-grade than in low-gradetumors (21.7 � 8.2% versus 7.6 � 4.3%, P � .001). Receiver operating characteristic analysis found that the combined perfusion-freediffusion coefficient and perfusion fraction had the best diagnostic performance for tumor differentiation (area under the curve � 0.986).
CONCLUSIONS: Intravoxel incoherent motion imaging reflects tumor histology and may be a helpful, noninvasive method for pediatricintracranial tumor grading.
ABBREVIATIONS: D � perfusion-free diffusion coefficient; D* � pseudodiffusion coefficient; f � perfusion fraction; IVIM � intravoxel incoherent motion; MVD �microvessel density; ROC � receiver operating characteristic; WHO � World Health Organization
Brain tumors are the second most common tumors in the
pediatric population.1 Each year, approximately 2500 chil-
dren are diagnosed with brain tumors in the United States.2
Pediatric brain tumors are different from those of adults, with
specific infantile subtypes and pathologic features that are
widely heterogeneous.1 Accurate preoperative diagnosis is
beneficial for determining the appropriate therapeutic strat-
egy; however, this remains challenging because of tumor vari-
ability and heterogeneity.
MR imaging plays an important role in the accurate diagnosis of
brain tumors. Many attempts have been made to identify biomarkers
on DWI3,4 and PWI5,6 that can be used to grade pediatric brain tu-
mors and those found in adults.7,8 In clinical practice, the ADC is
usually calculated using 2 b-values (0 and 1000 s/mm2) and serves as
a useful biomarker, reflecting cellular density.4,9 Similar to the ADC,
CBV and CBF are also useful biomarkers.5,6,10 Measuring DSC-de-
rived CBV requires an intravenous gadolinium-based contrast agent.
Thus, this method can be difficult to implement in children.5 DSC
imaging often requires high-flow contrast injection by power injec-
tors requiring large-bore intravenous access, which presents chal-
Received December 19, 2018; accepted after revision March 27, 2019.
From the Departments of Clinical Radiology (K.K., A.H., O.T., K.Y., R.K., D.M., H.H.),Neurosurgery (N.H., K.I.), and Neuropathology (S.O.S., T.I.), Graduate School ofMedical Sciences, Kyushu University, Fukuoka, Japan.
This work was supported by JSPS KAKWNHI Grant Number 18H06164.
Paper previously presented, in part, at: Scientific Assembly and Annual Meeting ofRadiological Society of North America, November 29 to December 4, 2015;Chicago, Illinois: No. VSPD11-03.
Please address correspondence to Akio Hiwatashi, MD, PhD, Department ofClinical Radiology, Graduate School of Medical Sciences, Kyushu University,3-1-one Maidashi, Higashi-ku, Fukuoka 812-8582, Japan; e-mail:[email protected]
Indicates open access to non-subscribers at www.ajnr.org
Indicates article with supplemental on-line photos.
http://dx.doi.org/10.3174/ajnr.A6052
878 Kikuchi May 2019 www.ajnr.org

lenges in young children and infants.5 In contrast, measuring CBF
with arterial spin-labeling does not require a contrast agent; this fea-
ture is beneficial for children.5,6
In 1988, Le Bihan et al11 reported on an imaging technique de-
picting the molecular motion of water in tissue and used for distin-
guishing diffusion and perfusion components on the basis of the
intravoxel incoherent motion (IVIM) model. The ADC contami-
nates contributions from capillary microcirculation because it can-
not inherently separate the coherent motion of microperfusion with
small b-values.11 Therefore, the ADC is influenced by perfusion and
could be overestimated, especially in hypervascular tumors. IVIM
imaging fits the signal decay to a biexponential function using mul-
tiple b-values and then discriminates perfusion-free diffusion from
capillary perfusion, allowing the simultaneous evaluation of diffu-
sion and perfusion parameters. Furthermore, the perfusion-free dif-
fusion coefficient (D) can reveal the state of diffusion more accurately
than the ADC because it is based on a model that does not rely on the
influence of perfusion. IVIM imaging has been used to evaluate ma-
lignant tumors in adults (eg, glioma or head, neck, rectal, or breast
cancers),12-15 and the IVIM perfusion parameter correlates with tu-
mor histology in animals.16,17 However, to date, few studies have
evaluated IVIM imaging in children. The purpose of this study was to
evaluate the correlation between IVIM parameters and histology to
assess the accuracy of IVIM imaging for pediatric intracranial tumor
grading.
MATERIALS AND METHODSThis retrospective study was approved by our institutional review
board, and the informed consent requirement was waived.
PatientsThe inclusion criteria for this study are outlined in On-line Fig 1.
Twenty-one consecutive pediatric patients with intracranial tu-
mors who underwent IVIM imaging examinations between April
2013 and September 2015 were identified. On the basis of the
exclusion criteria (On-line Fig 1), 1 patient with an inadequate
histologic specimen and 3 patients with non-neuroectodermal
tumors were excluded. Therefore, data from 17 patients (11 boys,
6 girls; median age, 4 years; range, 2 months to 15 years) with 7
high-grade (World Health Organization [WHO] grades III and IV; 5
boys, 2 girls; median age, 4 years; range, 2–11 years) and 10 low-grade
(WHO grades I and II; 6 boys, 4 girls; median age, 4.5 years; range, 2
months to 15 years) tumors were available for analysis.
Histopathologic DiagnosisPatient demographics and pathologic diagnoses based on the
2016 WHO classification18 are shown in Table 1.
IVIM MR ImagingIVIM imaging was performed as previously described12,19 using a
3T MR imaging scanner (Achieva 3T TX; Philips Healthcare, Best,
the Netherlands) with an 8-channel head coil. The IVIM scans
were obtained in the axial plane using a 2D single-shot spin-echo
EPI diffusion sequence. We used 13 b-values (0, 10, 20, 30, 50, 80,
100, 200, 300, 400, 600, 800, and 1000 s/mm2) in 3 orthogonal
directions. The other IVIM imaging parameters were as follows:
TR/TE, 2500/82 ms; matrix, 128 � 126 (reconstructed to 256 �
256); NEX, 1; section thickness/gap, 5/1 mm; FOV, 230 � 230
mm; number of sections, 11; sensitivity encoding factor, 1.5; and
total scan time, 2 minutes 10 seconds. IVIM imaging was acquired
before contrast agent injection. Several standard MR images
(T1WI, T2WI, FLAIR, and contrast-enhanced T1WI) were also
obtained for diagnostic purposes.
Image AnalysisThe IVIM parameters from each map with 13 b-values were gener-
ated using a commercially available workstation (SYNAPSE
VINCENT; Fujifilm Medical, Tokyo, Japan).20 For IVIM data anal-
ysis, the biexponential model was defined by the following equation:
1)SIb
SI0� f � exp��b � D*� � �1 � f � � exp��b � D�,
where SI0 corresponds to the signal intensity without diffusion
weighting (b � 0 s/mm2) and SIb is the SI acquired with different
b-values. First, the D was determined from data with higher b-val-
ues (b � 300, 400, 600, 800, and 1000 s/mm2). When high b-val-
Table 1: Patient demographics and tumor characteristics
No. Age, Sex
Histology IVIM Parameters
ADC(× 10−3 mm2/s)Pathologic Diagnosis
WHOGrade
MIB-1(%) MVD D (× 10−3 mm2/s) f (%) D* (× 10−3 mm2/s)
1 6 yr, M Diffuse midline glioma, H3 K27M-mutant IV 59.2 3.1 1.50 16.4 5.6 1.612 4 yr, M Medulloblastoma, classic, histologically defined IV 15.6 34.7 0.30 37.7 13.7 0.563 11 yr, M Medulloblastoma, classic, histologically defined IV 72.6 10.2 0.53 27.1 30.2 0.874 3 yr, M Atypical teratoid/rhabdoid tumor IV 50.0 11.0 0.86 14.1 9.0 0.985 2 yr, F Anaplastic ependymoma III 23.2 12.5 0.87 19.3 18.4 1.026 3 yr, M Anaplastic ependymoma III 19.6 4.3 1.15 16.8 5.5 1.307 6 yr, F Anaplastic ependymoma III 58.4 10.1 0.71 20.7 41.7 0.968 12 yr, M Diffuse astrocytoma, IDH wild-type II 2.1 2.1 1.22 8.4 33.3 1.299 1 yr, M Pilocytic astrocytoma I 4.4 5.8 1.45 3.5 5.5 1.5010 3 yr, F Pilocytic astrocytoma I 6.7 4.0 1.82 7.2 10.2 1.8811 3 yr, M Pilocytic astrocytoma I 8.0 4.7 1.52 10.0 48.3 1.6412 6 yr, M Pilocytic astrocytoma I 6.0 3.2 1.72 4.2 58.4 1.7813 11 yr, F Pilocytic astrocytoma I 4.0 5.6 1.55 5.5 12.8 1.6114 2 yr, M Subependymoma I 0.1 1.9 1.58 5.1 11.3 1.6015 2 mo, F Choroid plexus papilloma I 0.1 13.4 1.47 17.4 11.6 1.6216 10 yr, M Dysembryoplastic neuroepithelial tumor I 2.7 1.3 1.76 10.9 4.3 1.8217 15 yr, F Ganglioglioma I 1.0 1.1 1.21 3.6 22.4 1.24
Note:—IDH indicates isocitrate dehydrogenase.
AJNR Am J Neuroradiol 40:878 – 84 May 2019 www.ajnr.org 879

ues were used and the IVIM component was negligible, we used
the following least-squares curve fit:
2)SIb
SI0� exp��b � D�.
Second, the segmented method was used to calculate perfusion
fraction (f ) according to the following equation:
3) f � �SI0 � SI inter� / SI0.
Here, SIinter is the intersection point of the y-axis and a line
through loge SI300 and loge SI1000. Third, the pseudodiffusion co-
efficient (D*) was derived from the monoexponential fit to Equa-
tion (1). The ADC was also calculated with b-values of 0 and 1000
s/mm2 using the following equation:
4)SI1000
SI0� exp��b � ADC�.
Two board-certified neuroradiologists (K.K. and D.M., with 13 and
7 years of experience, respectively) evaluated each tumor using non-
overlapping ROIs (area, 10 mm2). Three or more circular ROIs
were placed on each tumor map. When placing the ROIs, we care-
fully avoided areas containing necrosis, hemorrhage, calcification, or
blood vessels by referring to other sequences. The average ROI values
were used as representative values for each parameter. D-map ROIs
were copied to the corresponding ADC maps for comparison. Simi-
larly, f-map ROIs were copied to the corresponding D* maps.
Histopathologic EvaluationHistologic microvessel density (MVD) was evaluated as previ-
ously described.6 Briefly, tissue sections were immunostained
with anti-CD31 (Dako Japan, Tokyo, Japan). Stained vessels were
viewed under a microscope using a �20 objective field. The MVD
was calculated using the following equation:
MVD � (Anti-CD31 Immunostained Vascular Area)
(Total Tissue Area).
Three different fields were evaluated, and a mean representative
value was calculated.
MIB-1 is a monoclonal antibody to the Ki-67 antigen, which is
expressed in proliferating and dividing cells during all active
phases of the cell cycle (ie, G1, S, G2, and M phases), but not
during the G0 phase.21 The MIB-1 index is a marker of cell pro-
liferation.22 All specimens were evaluated by the Department of
Neuropathology using this index.
Statistical AnalysisWe assessed the distribution of the data using the Shapiro-Wilk
test. Each IVIM parameter (ie, D, D*, and f) and the ADC, MVD,
and MIB-1 index were compared between high- and low-grade
tumors using the unpaired t test. The D and ADC values were also
compared within the high- and low-grade tumor groups by a
paired t test. The Mann-Whitney U test was used when these data
deviated from a normal distribution.
The relationships between the MIB-1 proliferation index and dif-
fusion parameters (ie, D and ADC) were evaluated by the Pearson
correlation test, and those between the MVD and IVIM perfusion
parameters (ie, D* and f) were evaluated by the Spearman correlation
test.
The diagnostic performances of each IVIM parameter and the
ADC were evaluated by receiver operating characteristic (ROC)
curve analysis.
All the statistical analyses were performed using commercial
software programs (JMP, Version 11.0.0; SAS Institute, Cary,
North Carolina; GraphPad Prism 7.0, GraphPad Software, San
Diego, California; MedCalc for Windows, Version 15.10.0, Med-
Calc Software, Mariakerke, Belgium). A P value � .05 was con-
sidered statistically significant.
RESULTSDifferentiation of High- and Low-Grade Tumors UsingIVIM ParametersFigure 1 and Table 2 summarize the parameter measurements for
pediatric intracranial neuroectodermal tumor grading. The D and
ADC were lower in high-grade than in low-grade tumors (D,
0.85 � 0.40 versus 1.53 � 0.21 � 10�3 mm2/s, P � .0003; ADC,
1.04 � 0.33 versus 1.60 � 0.21 � 10�3 mm2/s, P � .0007; Fig 1A
and Table 2). The D* showed wide variability and no significant
differences between tumor grades (P � .8337; Fig 1B and Table 2).
The f was higher in high-grade than in low-grade tumors (21.7 �
8.2% versus 7.6 � 4.3%, P � .0003; Fig 1C and Table 2).
Comparison of the D and ADC ValuesThe D was significantly lower than the ADC in high- (P � .0010)
and low-grade (P � .0004; Fig 1A) tumors. The percentage differ-
ence between the D and ADC was 23.3% � 22.0% in the high-
grade tumors and 4.4% � 18.9% in the low-grade tumors.
Relationship between the IVIM Parameters and MVDOn-line Figure 2 shows the relationship between each IVIM param-
eter and histology. There were strongly negative correlations between
the MIB-1 proliferation index and D (r � �0.577, P � .0154; On-
line Fig 2A) and ADC (r � �0.517, P � .0334; On-line Fig 2B).
Notably, the correlation value of the D was higher than that of the
ADC (�0.577 versus �0.517; On-line Fig 2A, -B). There was a
strongly positive correlation between the f and MVD (� � 0.832, P �
.0001; On-line l Fig 2D). There was no significant correlation be-
tween the D* and MVD (� � –0.088, P � .7380; On-line Fig 2C).
ROC Analysis of Each IVIM Parameter for GradingPediatric Intracranial TumorsTable 3 and On-line Fig 3 show the ROC analysis results for the
diagnostic performance of each IVIM parameter in differentiat-
ing high- and low-grade tumors. The combined D and f showed
the best diagnostic performance (area under the curve � 0.986).
The D, ADC, and f also showed robust diagnostic performance
(area under the curve � 0.943, 0.907, and 0.957, respectively). The
D* showed low diagnostic performance (area under the curve �
0.536). The optimal diagnosis cutoff values for discriminating
high- and low-grade tumors were �1.50 and 16.4 for the com-
bined D and f, respectively (�1.15 for the D, �1.02 for the ADC,
and 14.1 for the f).
Figures 2 and 3 show representative patients with grades IV (me-
dulloblastoma) and I (pilocytic astrocytoma) tumors, respectively.
880 Kikuchi May 2019 www.ajnr.org

DISCUSSIONWe found significant correlations between the histology and
IVIM parameters of different pediatric intracranial tumors. These
results suggest that IVIM imaging reflects cell density and vascu-
larity across different types of pediatric brain tumors. Our find-
ings are consistent with those of previous studies showing a sig-
nificant correlation between histology and IVIM parameters in
animal models16,17 and human patients.6,12,16,17 To our knowl-
edge, no previous study has evaluated the correlation between the
IVIM parameters and the histology of intracranial tumors in chil-
dren. Furthermore, we demonstrated that both the diffusion and
perfusion parameters measured on IVIM imaging are useful
for grading intracranial neuroectodermal tumors in pediatric
patients.
Both of the diffusion parameters (ie, D and ADC) demon-
strated good sensitivity and specificity for grading pediatric intra-
cranial tumors. Diffusion parameters
reflect the movement of water mole-
cules, which is hindered in some patho-
logic states (eg, intracellular edema).
The ADC has been reported to have high
sensitivity in detecting cell density.23-25
The increased number of cell mem-
branes in tumors leads to narrowing of
the interstitial space as well as the reduc-
tion in the size of the intracellular space,
which results in decreased water move-
ment. Thus, the ADC has been used to
evaluate cell density in many types of
cancer. In previous studies, the ADC was
typically calculated using 2 b-values (ie,
0 and 1000 s/mm2).3,4,24 However, in
the present study, the D values were sig-
nificantly lower than the ADC values in
both tumor groups. Moreover, there
was a 23.3% difference between the D
and ADC in high-grade tumors. This
difference most likely reflects the increased perfusion fraction of
malignant tumors.12 With small perfusion fractions, the follow-
ing relationship applies: (ADC � D) � f/b. Applying the ADC and
D values of low- and high-grade tumors found in this study to this
relationship (ie, ADC � D) produces values of 1.9 � 10�4 mm2/s
(high-grade tumors) and 0.6 � 10�4 mm2/s (low-grade tumors).
These values are very close to the f/b (b � 1000 s/mm2) values of
2.2 � 10�4 mm2/s and 0.8 � 10�4 mm2/s for high- and low-grade
tumors, respectively.
These findings provide strong support for the results and val-
idate the method. Furthermore, the correlation value for the
MIB-1 proliferation index and D was higher than for the MIB-1
proliferation index and ADC. This result indicates that D more
precisely reflects the tumor cell density than the ADC. We also
demonstrated that D had better diagnostic performance than the
Table 2: Comparison of parameters between high- and low-grade tumorsa
Parameters High-Grade Tumor Low-Grade Tumor P ValueD (� 10�3 mm2/s) 0.30–1.50, 0.86, 0.85 � 0.40 1.21–1.82, 1.54, 1.53 � 0.21 .0003b
ADC (� 10�3 mm2/s) 0.56–1.61, 0.98, 1.04 � 0.33 1.24–1.88, 1.62, 1.60 � 0.21 .0007b
D* (� 10�3 mm2/s) 5.5–41.7, 13.7, 17.7 � 13.7 4.3–58.4, 12.8, 21.8 � 18.8 .8337c
f (%) 14.1–37.7, 19.3, 21.7 � 8.2 3.5–17.4, 6.4, 7.6 � 4.3 .0003b
MVD (%) 3.1–34.7, 10.2, 12.3 � 10.5 1.1–13.4, 3.6, 4.3 � 3.6 .0431c
MIB-1 (%) 15.6–72.6, 50.0, 42.7 � 22.8 0.1–8.0, 3.4, 3.5 � 2.8 �.0001b
a Data are expressed as range, median, mean.b Unpaired test.c Mann-Whitney U test.
Table 3: Diagnostic performance of parameters in differentiating high- and low-gradetumors
Parameters Cutoff Value Sensitivity (%) Specificity (%) AUCD (� 10�3 mm2/s) �1.15 85.7 85.7 0.943D* (� 10�3 mm2/s) 9.0 42.9 22.9 0.536f (%) 14.1 100 90.0 0.957ADC (� 10�3 mm2/s) �1.02 71.4 71.4 0.907D � f �1.50, 16.4 100 90.0 0.986
Note:—AUC indicates area under the curve.
FIG 1. Comparison of the IVIM parameters of high- (WHO grades III and IV) and low-grade (WHO grades I and II) tumors. D and ADC were lowerin high-grade than in low-grade tumors (D, 0.85 � 0.40 versus 1.53 � 0.21 � 10�3 mm2/s, P � .0003; ADC, 1.04 � 0.33 versus 1.60 � 0.21 � 10�3
mm2/s, P � .0007; A). D was significantly lower than the ADC in high- (P � .0010) and low-grade (P � .0004; A) tumors. D* showed wide variabilityand no significant differences between the high- and low-grade groups (P � .8337; B). The f was higher in high- than in low-grade tumors (21.7 �8.2% versus 7.6 � 4.3%, P � .0003; C).
AJNR Am J Neuroradiol 40:878 – 84 May 2019 www.ajnr.org 881

ADC for differentiating high- and low-grade tumors. In this
study, the ADC derived using a pair of b-values had acceptable
diagnostic performance for grading; however, the diagnostic per-
formance accuracy using D was an improvement over the conven-
tional ADC.
Of the perfusion parameters, f may reflect tumor vascular-
ity. In general, malignant tumors, in particular gliomas, are
hypervascular. Hypervascularity is another important consid-
eration for the histopathologic diagnosis of tumors because
malignancy progression is accompanied by neoangiogenesis.26
We demonstrated that the MVD reflects neoangiogenesis pro-
gression and its measured values correlated closely with those
of f. The f was higher in high-grade than in low-grade tumors,
a finding consistent with previous IVIM studies in adults.12,13
Our study may be the first to demonstrate the value of IVIM
imaging in pediatric patients with intracranial neuroectoder-
mal tumors. Many researchers have used arterial spin-labeling
to grade pediatric tumors because this method can evaluate
cerebral blood flow without a contrast agent. Similar to arterial
spin-labeling, f can also be measured without contrast agent.
This noninvasive feature is useful for children. However, D*
was not helpful for tumor grading. This finding has been
previously reported in adult IVIM studies.12,19 Moreover,
other studies have suggested that D* is poorly reproduc-
ible27,28 and could be substantially affected by cardiac mo-
tion.29 The cardiac-gating technique may improve D* assess-
ment in tumors.30
The combined D and f had the best diagnostic performance of
all parameters investigated in our study. Combining D and f in-
creased the area under the curve compared with each parameter
alone. In combination, these 2 parameters can be used to evaluate
different pathologic features of intracranial tumors. For example,
some infantile tumors have high vascularity and low cell den-
sity (ie, hemangioblastoma or choroid plexus papilloma).
IVIM imaging can simultaneously evaluate both diffusion and
perfusion parameters in the same anatomic space; this feature
improves diagnostic accuracy in such tumors. However, it is
still difficult to differentiate high-grade tumors, such as me-
dulloblastoma and atypical teratoid/rhabdoid tumor, which
have the same pattern of high vascularity and cell density. In
FIG 2. Images from an 11-year-old boy with histologically defined classic medulloblastoma (WHO grade IV). A, T2WI shows a heterogeneous,hyperintense mass in the vermis. B, Contrast-enhanced T1WI shows heterogeneous enhancement of the tumor. C, The D map shows the low Dvalue (0.53 � 10�3 mm2/s) of the lesion, which is lower than the cutoff value (�1.15 � 10�3 mm2/s; Table 3). D, The f map shows the f value (27.1%)of the lesion, which is higher than the cutoff value (14.1%; Table 3). E, MIB-1 staining reveals a high MIB-1 index (72.6%). F, Immunohistochemicalstaining for anti-CD31 shows a high MVD (10.2%). Bar � 100 �m.
882 Kikuchi May 2019 www.ajnr.org

such cases, basic information (ie, tumor location and patient
age) is essential.
A strength of this study was that histologic diagnoses were
available for all patients. However, this study also had some lim-
itations. First, the sample size was very small, especially for pa-
tients with grade II glioma (n � 1). Second, the ROI analyses were
subjective, which may have introduced selection bias. However,
in clinical practice, ROI analysis is often used for diagnosis.6,12,19
Automatic tumor segmentation, which involves computer-
aided segmentation and histogram analysis, could help address
this issue. Third, the IVIM model used in this study does
not account for non-Gaussian diffusion effects, which may
lead to the overestimation of f.15 Non-Gaussian fitting may
improve the accuracy of f, especially with very high b-values.
Fourth, we used only 3 perpendicular directions for diffusion
encoding. In anisotropic tissues, (eg, white matter), anisotro-
pic analysis via the diffusion tensor imaging method requires
the use of at least 6 directions; however, in clinical practice,
DWI averaged over 3 directions is often used during the diag-
nostic process.
CONCLUSIONSIVIM imaging reflected histology, which suggests that it may be a
helpful noninvasive diagnostic method for intracranial neuroec-
todermal tumor grading in children.
Disclosures: Kazufumi Kikuchi—RELATED: Grant: Japan Society for the Promotion ofScience KAKENHI, Comments: grant No. JP 18H06164.
REFERENCES1. Pollack IF. Brain tumors in children. N Engl J Med 1994;331:
1500 – 07 CrossRef Medline2. Gajjar A, Packer RJ, Foreman NK, et al. Children’s Oncology
Group’s 2013 blueprint for research: central nervous system tu-mors. Pediatr Blood Cancer 2013;60:1022–26 CrossRef Medline
3. Gauvain KM, McKinstry RC, Mukherjee P, et al. Evaluating pediatricbrain tumor cellularity with diffusion-tensor imaging. AJR Am JRoentgenol 2001;177:449 –54 CrossRef Medline
4. Tzika AA, Zarifi MK, Goumnerova L, et al. Neuroimaging in pediat-ric brain tumors: Gd-DTPA-enhanced, hemodynamic, and diffu-sion MR imaging compared with MR spectroscopic imaging. AJNRAm J Neuroradiol 2002;23:322–33 Medline
5. Yeom KW, Mitchell LA, Lober RM, et al. Arterial spin-labeled per-
FIG 3. Images from a 6-year-old boy with pilocytic astrocytoma (WHO grade I). A, T2WI shows a homogeneous, hyperintense mass in the vermis.B, Contrast-enhanced T1WI shows mild, heterogeneous enhancement of the tumor. C, The D map shows the high D value (1.72 � 10�3 mm2/s)of the lesion, which is higher than the cutoff value (�1.15 � 10�3 mm2/s; Table 3). D, The f map shows the low f value (4.2%) of the lesion, whichis lower than the cutoff value (14.1%; Table 3). E, MIB-1 staining reveals a low MIB-1 index (6.0%). F, Immunohistochemical staining for anti-CD31reveals a low MVD (3.2%). Bar � 100 �m.
AJNR Am J Neuroradiol 40:878 – 84 May 2019 www.ajnr.org 883

fusion of pediatric brain tumors. AJNR Am J Neuroradiol 2014;35:395– 401 CrossRef Medline
6. Kikuchi K, Hiwatashi A, Togao O, et al. Correlation between arterialspin-labeling perfusion and histopathological vascular density ofpediatric intracranial tumors. J Neurooncol 2017;135:561– 69CrossRef Medline
7. Chang YW, Yoon HK, Shin HJ, et al. MR imaging of glioblastoma inchildren: usefulness of diffusion/perfusion-weighted MRI and MRspectroscopy. Pediatr Radiol 2003;33:836 – 42 CrossRef Medline
8. Huisman TA, Sorensen AG. Perfusion-weighted magnetic reso-nance imaging of the brain: techniques and application in children.Eur Radiol 2004;14:59 –72 Medline
9. Sugahara T, Korogi Y, Kochi M, et al. Usefulness of diffusion-weighted MRI with echo-planar technique in the evaluationof cellularity in gliomas. J Magn Reson Imaging 1999;9:53– 60CrossRef Medline
10. Sugahara T, Korogi Y, Kochi M, et al. Correlation of MR imaging-determined cerebral blood volume maps with histologic and angio-graphic determination of vascularity of gliomas. AJR Am J Roent-genol 1998;171:1479 – 86 CrossRef Medline
11. Le Bihan D, Breton E, Lallemand D, et al. Separation of diffusion andperfusion in intravoxel incoherent motion MR imaging. Radiology1988;168:497–505 CrossRef Medline
12. Togao O, Hiwatashi A, Yamashita K, et al. Differentiation of high-grade and low-grade diffuse gliomas by intravoxel incoherent mo-tion MR imaging. Neuro Oncol 2016;18:132– 41 CrossRef Medline
13. Sumi M, Nakamura T. Head and neck tumors: assessment of perfu-sion-related parameters and diffusion coefficients based on the in-travoxel incoherent motion model. AJNR Am J Neuroradiol 2013;34:410 –16 CrossRef Medline
14. Surov A, Meyer HJ, Hohn AK, et al. Correlations between intravoxelincoherent motion (IVIM) parameters and histological findings inrectal cancer: preliminary results. Oncotarget 2017;8:21974 – 83CrossRef Medline
15. Iima M, Yano K, Kataoka M, et al. Quantitative non-Gaussian dif-fusion and intravoxel incoherent motion magnetic resonanceimaging: differentiation of malignant and benign breast lesions.Invest Radiol 2015;50:205–11 CrossRef Medline
16. Iima M, Reynaud O, Tsurugizawa T, et al. Characterization of gli-oma microcirculation and tissue features using intravoxel incoher-ent motion magnetic resonance imaging in a rat brain model. InvestRadiol 2014;49:485–90 CrossRef Medline
17. Lee HJ, Rha SY, Chung YE, et al. Tumor perfusion-related parame-ter of diffusion-weighted magnetic resonance imaging: correlationwith histological microvessel density. Magn Reson Med 2014;71:1554 –58 CrossRef Medline
18. Louis D, Ohgaki H, Wiestler O, et al. WHO Classification of Tu-mours of the Central Nervous System, Revised. Lyon: InternationalAgency for Research on Cancer; 2016
19. Yamashita K, Hiwatashi A, Togao O, et al. Diagnostic utility of intra-voxel incoherent motion MR imaging in differentiating primarycentral nervous system lymphoma from glioblastoma multiforme.J Magn Reson Imaging 2016;44:1256 – 61 CrossRef Medline
20. Mikayama R, Yabuuchi H, Sonoda S, et al. Comparison of intravoxelincoherent motion diffusion-weighted imaging between turbospin-echo and echo-planar imaging of the head and neck. Eur Radiol2018;28;316 –24
21. Gerdes J, Lemke H, Baisch H, et al. Cell cycle analysis of a cell pro-liferation-associated human nuclear antigen defined by the mono-clonal antibody Ki-67. J Immunol 1984;133:1710 –15 Medline
22. McCormick D, Chong H, Hobbs C, et al. Detection of the Ki-67antigen in fixed and wax-embedded sections with the monoclonalantibody MIB1. Histopathology 1993;22:355– 60 CrossRef Medline
23. Lyng H, Haraldseth O, Rofstad EK. Measurement of cell density andnecrotic fraction in human melanoma xenografts by diffusionweighted magnetic resonance imaging. Magn Reson Med 2000;43:828 –36 CrossRef Medline
24. Chen L, Liu M, Bao J, et al. The correlation between apparent diffu-sion coefficient and tumor cellularity in patients: a meta-analysis.PLoS One 2013;8:e79008 CrossRef Medline
25. Togao O, Doi S, Kuro-o M, et al. Assessment of renal fibrosis withdiffusion-weighted MR imaging: study with murine model of uni-lateral ureteral obstruction. Radiology 2010;255:772– 80 CrossRefMedline
26. Winkler F, Kienast Y, Fuhrmann M, et al. Imaging glioma cell inva-sion in vivo reveals mechanisms of dissemination and peritumoralangiogenesis. Glia 2009;57:1306 –15 CrossRef Medline
27. Andreou A, Koh DM, Collins DJ, et al. Measurement reproducibilityof perfusion fraction and pseudodiffusion coefficient derived byintravoxel incoherent motion diffusion-weighted MR imaging innormal liver and metastases. Eur Radiol 2013;23:428 –34 CrossRefMedline
28. Meeus EM, Novak J, Withey SB, et al. Evaluation of intravoxel inco-herent motion fitting methods in low-perfused tissue. J Magn ResonImaging 2017;45:1325–34 CrossRef Medline
29. Federau C, Hagmann P, Maeder P, et al. Dependence of brain intra-voxel incoherent motion perfusion parameters on the cardiac cycle.PLoS One 2013;8:e72856 CrossRef Medline
30. Habib J, Auer DP, Morgan PS. A quantitative analysis of the benefitsof cardiac gating in practical diffusion tensor imaging of the brain.Magn Reson Med 2010;63:1098 –103 CrossRef Medline
884 Kikuchi May 2019 www.ajnr.org

ORIGINAL RESEARCHPEDIATRICS
Brain and CSF Volumes in Fetuses and Neonates with AntenatalDiagnosis of Critical Congenital Heart Disease: A Longitudinal
MRI StudyX N.H.P. Claessens, X N. Khalili, X I. Isgum, X H. ter Heide, X T.J. Steenhuis, X E. Turk, X N.J.G. Jansen, X L.S. de Vries, X J.M.P.J. Breur,
X R. de Heus, and X M.J.N.L. Benders
ABSTRACT
BACKGROUND AND PURPOSE: Fetuses and neonates with critical congenital heart disease are at risk of delayed brain development andneurodevelopmental impairments. Our aim was to investigate the association between fetal and neonatal brain volumes and neonatalbrain injury in a longitudinally scanned cohort with an antenatal diagnosis of critical congenital heart disease and to relate fetal andneonatal brain volumes to postmenstrual age and type of congenital heart disease.
MATERIALS AND METHODS: This was a prospective, longitudinal study including 61 neonates with critical congenital heart diseaseundergoing surgery with cardiopulmonary bypass �30 days after birth and MR imaging of the brain; antenatally (33 weeks postmenstrualage), neonatal preoperatively (first week), and postoperatively (7 days postoperatively). Twenty-six had 3 MR imaging scans; 61 had at least1 fetal and/or neonatal MR imaging scan. Volumes (cubic centimeters) were calculated for total brain volume, unmyelinated white matter,cortical gray matter, cerebellum, extracerebral CSF, and ventricular CSF. MR images were reviewed for ischemic brain injury.
RESULTS: Total fetal brain volume, cortical gray matter, and unmyelinated white matter positively correlated with preoperative neonatal totalbrain volume, cortical gray matter, and unmyelinated white matter (r � 0.5–0.58); fetal ventricular CSF and extracerebral CSF correlated withneonatal ventricular CSF and extracerebral CSF (r�0.64 and 0.82). Fetal cortical gray matter, unmyelinated white matter, and the cerebellum werenegatively correlated with neonatal ischemic injury (r � �0.46 to �0.41); fetal extracerebral CSF and ventricular CSF were positively correlatedwith neonatal ischemic injury (r � 0.40 and 0.23). Unmyelinated white matter:total brain volume ratio decreased with increasing post-menstrual age, with a parallel increase of cortical gray matter:total brain volume and cerebellum:total brain volume. Fetal ventricularCSF:intracranial volume and extracerebral CSF:intracranial volume ratios decreased with increasing postmenstrual age; however,neonatal ventricular CSF:intracranial volume and extracerebral CSF:intracranial volume ratios increased with postmenstrual age.
CONCLUSIONS: This study reveals that fetal brain volumes relate to neonatal brain volumes in critical congenital heart disease, with anegative correlation between fetal brain volumes and neonatal ischemic injury. Fetal brain imaging has the potential to provide earlyneurologic biomarkers.
ABBREVIATIONS: CGM � cortical gray matter; CHD � congenital heart disease; ECSF � extracerebral CSF; ICV � intracranial volume; PMA � postmenstrual age;TBV � total brain volume; UWM � unmyelinated white matter; VCSF � ventricular CSF; WMI � white matter injury
Neurologic comorbidities are prevalent in neonates undergo-
ing open heart surgery with the use of cardiopulmonary by-
pass for critical congenital heart disease (CHD) in the first weeks
of life.1 Ischemic brain injury is common before and after the
surgical procedure and is associated with neurodevelopmental
disabilities throughout school age.2,3 In addition, delayed brain
growth with suggested antenatal onset has been reported in those
with critical CHD.4,5
Antenatal studies have shown fetuses with critical CHD to
demonstrate progressively reduced brain growth with enlarged
CSF spaces compared with healthy fetuses.6 Smaller brain vol-
umes in fetuses with critical CHD are thought to be the result of
reduced antenatal cerebral oxygen delivery and cerebral oxygen
Received November 11, 2018; accepted after revision February 27, 2019.
From the Departments of Neonatology (N.H.P.C., E.T., L.S.d.V., M.J.N.L.B.), PediatricCardiology (N.H.P.C., H.t.H., T.J.S., J.M.P.J.B.), Pediatric Intensive Care (N.H.P.C.,N.J.G.J.), and Obstetrics (R.d.H.), Wilhelmina Children’s Hospital, Utrecht, the Neth-erlands; Image Sciences Institute (N.K., I.I.), University Medical Center Utrecht,Utrecht, the Netherlands; and Department of Pediatrics (N.J.G.J.), Beatrix Children’sHospital, University Medical Center Groningen, Groningen, the Netherlands.
Roel de Heus and Manon J.N.L. Benders share last authorship.
Please address correspondence to Nathalie Claessens, MD, PhD, Department ofNeonatology, University Medical Centre Utrecht, KE 04.123.1, PO Box 85090, 3508AB Utrecht, the Netherlands; e-mail: [email protected];@UMCutrecht; @hetWKZ
Indicates article with supplemental on-line appendix and table.
Indicates article with supplemental on-line photo.
http://dx.doi.org/10.3174/ajnr.A6021
AJNR Am J Neuroradiol 40:885–91 May 2019 www.ajnr.org 885

consumption, a consequence of the anatomic changes from the
cardiac defect.5,7,8 The extent to which delayed fetal brain growth
is transient or persists into the neonatal period remains unde-
scribed. Revealing the association between fetal and neonatal de-
layed brain growth and acquired neonatal brain injury provides
important information for the potential use of fetal brain imaging
parameters as biomarkers for neurologic outcome in infants with
critical CHD. This would also allow future implementation of
interventions for improving brain growth before birth.
Using a prospective, longitudinal design, we investigated the
correlation between fetal and neonatal preoperative and postop-
erative brain and CSF volumes, and the correlation of fetal brain
and CSF volumes with neonatal ischemic brain injury. Our sec-
ondary aim was to examine trajectories of brain and CSF volumes
in relation to postmenstrual age (PMA) during the third trimester
of gestation and first weeks after birth in different cardiac defects.
MATERIALS AND METHODSThis was a prospective, longitudinal observational cohort study.
Study PopulationBetween May 2016 and December 2017, fetuses with an antenatal
diagnosis of critical CHD requiring open heart surgery with the
use of cardiopulmonary bypass at �30 days of life and referred
to the Wilhelmina Children’s Hospital Utrecht, a tertiary level
hospital, underwent longitudinal MR imaging of the brain at 3
time points, antenatally (around 33 weeks PMA), neonatal
preoperatively (within the first week of life), and neonatal
postoperatively (around 7 days after the operation; range, 5–10
days). For this study, we excluded individuals with a genetic
syndrome confirmed by antenatal karyotype or microarray
(such as trisomy 21 or 22q11 deletion) or cerebral congenital
malformations (such as corpus callosum agenesis). The local
medical ethics board approved the study, and parental in-
formed consent for the use of clinical data for research pur-
poses was obtained.
MR Imaging AcquisitionAll fetuses and neonates were scanned on a 3T MR imaging system
(Achieva, Philips Healthcare, Best, the Netherlands). Fetal and neo-
natal MR images were reviewed by 2 independent researchers for the
presence of congenital anomalies, parenchymal hemorrhage, isch-
emic brain injury, and ventriculomegaly (atrial diameter, �10
mm).9,10 Details are provided in the On-line Appendix.
Quantitative 3D Volumetric AnalysisFetal and neonatal coronal T2-weighted images were automati-
cally segmented into different tissue classes: extracerebral CSF
(ECSF), ventricular CSF (VCSF), unmyelinated white matter
(UWM), cortical gray matter (CGM), cerebellum, basal ganglia
and thalamus, brain stem, and myelinated white matter (Fig 1),
using a further adjusted approach for neonatal MR images.11 Vol-
umes were calculated for all 8 tissue classes. All segmentations
were manually checked for quality; no manual adjustments to the
segmentations were made. Because basal ganglia, brain stem, and
myelinated white matter were difficult to distinguish reliably on
fetal T2-weighted images, these tissues were not taken into ac-
count for this study. Intracranial volume (ICV) was calculated as
the sum of all 8 tissues classes; total brain volume (TBV), as the
sum of UWM, CGM, cerebellum, basal ganglia and thalamus,
brain stem, and myelinated white matter.
Statistical AnalysisFor statistical analysis, R statistical and computing software, Version
3.5.0 (http://www.r-project.org/) was used. Clinical variables were
predominantly not normally distributed; therefore, nonparametric
tests were performed and medians (25th/75th centiles) were pre-
sented for continuous data. Counts (percentage) were presented for
categoric data. To test the differences in baseline characteristics be-
tween individuals with and without fetal MR imaging, we used
Mann-Whitney U and Fisher exact tests. Univariable linear and non-
linear quadratic regression analysis was performed to examine the
association between fetal brain and CSF volumes and neonatal (pre-
operative and postoperative) brain, and between CSF volumes and
acquired neonatal brain injury, with correction for PMA at the time
of scanning. Correlation coefficients with 95% confidence intervals
were presented. Mixed-model analysis (R, nlme package 3.1–137)
was performed to test the difference in brain and CSF volumes be-
tween different types of CHDs (fixed effect), including PMA (fixed
effect), with the brain or CSF volume as dependent factors and indi-
vidual subjects as random factors. A P value � .007 was considered
significant with correction for multiple comparisons.
RESULTSStudy PopulationIn the study period, 71 neonates with an antenatal diagnosis of
critical CHD were born, of whom 8 died without any MR imaging
of the brain. Sixty-three neonates with an antenatal diagnosis of
FIG 1. Fetal and neonatal brain tissue segmentation. Coronal T2-weighted segmented fetal and neonatal image of the same individual withtransposition of the great arteries at 30 weeks of gestation and before the operation.
886 Claessens May 2019 www.ajnr.org

critical CHD had cardiac surgery within 30 days after birth, of
whom, 2 were excluded because of a genetic syndrome, leaving 61
neonates eligible for this study. Thirty-one neonates underwent
all 3 MR imaging scans; however, 5 had poor fetal imaging quality,
leaving 26 with all 3 MR imaging scans for the primary study aim.
All 61 neonates were included for the secondary study aim: 26 plus
an additional 21 with 2 MR imaging scans and 14 with 1 MR
imaging scan (flowchart in On-line Figure). Baseline characteris-
tics are presented in Table 1.
Fetal and Neonatal MR Imaging: Conventional AnalysisTwo fetuses showed unilateral ventriculomegaly (atrial diameter,
10 –15 mm). None of the fetuses showed parenchymal hemor-
rhage or ischemic brain injury.
At preoperative neonatal MR imaging, focal infarction was
seen in 2 (8%) and WM injury (WMI) in 2 (8%). Punctate cere-
bellar hemorrhage was seen in 1 (4%). Cumulatively (at preoper-
ative and postoperative MR imaging), focal infarction was present
in 7 (28%) and WMI in 9 (38%). Hypoxic-ischemic watershed
injury was not seen in any neonates.
Fetal Brain and CSF Volumes: Clinical FactorsFetal UWM was positively associated with fetal CGM (r � 0.87);
fetal UWM, with fetal cerebellum (r � 0.60); and fetal CGM, with
fetal cerebellum (r � 0.56). Fetal UWM:TBV (proportion of TBV
occupied by UWM) was negatively associated with fetal CGM:
TBV (r � �0.51). Fetal VCSF and ECSF were negatively associ-
ated with fetal UWM:TBV (r � �0.39 and �0.53, respectively).
Fetal brain and CSF volumes (corrected for PMA at scanning)
were not associated with maternal body mass index, maternal age,
maternal smoking, placental weight, or birth weight z score (all P
values � .007 with Bonferroni correction for multiple compari-
sons). None of the mothers of the primary study population had
preeclampsia or gestational diabetes.
Brain and CSF Volumes: Correlation between Fetal andNeonatal MR ImagingFetal volumes of CGM, UWM, and TBV correlated with preopera-
tive neonatal volumes of CGM, UWM, and TBV, respectively (Table
2). Postoperatively, the association of fetal CGM and TBV with neo-
natal CGM and TBV, respectively, was still seen. Fetal VCSF, ECSF,
VCSF: ICV, and ECSF:ICV correlated with preoperative neonatal
VCSF, ECSF, VCSF:ICV, and ECSF:ICV, respectively. Postopera-
tively, the associations between fetal and neonatal MR imaging were
still seen for ECSF and VCSF: ICV (Table 2 and On-line Table).
Fetal Brain and CSF Volumes: Correlation with NeonatalIschemic Brain InjuryBaseline characteristics were not different between neonates with
and without ischemic brain injury (data not shown). Both fetuses
with antenatal ventriculomegaly had moderate-severe WMI be-
fore the operation (100%).
The fetal TBV, CGM, UWM, and cerebellum were negatively
associated with the presence of neonatal (either preoperatively or
postoperatively acquired) ischemic brain injury (Table 2), in
which fetal ECSF was positively associated with neonatal ischemic
brain injury. The rate of preoperative ischemic brain injury was
low and consequently was not examined separately in relation to
fetal brain and CSF volumes.
Fetal and Neonatal MR Imaging: Brain Volumes, PMA, andType of CHDFor the secondary study aim, the total study population of 61
subjects was analyzed. ICV, TBV, UWM, CGM, and the cerebel-
lum all showed a linear association with PMA (Fig 2). The pro-
Table 1: Baseline and MRI characteristics of the study populationa
CharacteristicsMaternal characteristics (n � 29; fetal MRI)
Maternal age (yr) 30.5 (27.8/35.3)Maternal body mass index 22.8 (20.8/23.9)Maternal smoking 3 (12%)Placental weight (g) 455 (375/510)
Patient characteristics (n � 61; totalstudy population)
Female 18 (30)CHD groups
SVP 21 (34)TGA 18 (30)LVOTO 22 (36)
Antenatal CHD diagnosis 61 (100)Twin 1 (2)Genetic disorder 0 (0)Additional congenital anomaly 3 (5)Gestational age (wk) 39.1 (38.4/40.1)Birth weight (g) 3320 (2970/3670)Birth weight (z score) �0.4 (�0.8/0.3)Cesarean delivery 18 (31)Neonatal death 6 (10)MRI characteristics
Fetal, PMA (wks) 33.4 (32.7/34.1)Preoperative, days after birth 5 (3/6)Preoperative, PMA (wks) 40.1 (39.1/41.0)Postoperative, days after surgery 8 (7/9)Postoperative, PMA (wks) 42.0 (40.6/43.0)
Note:—LVOTO indicates left ventricle outflow tract obstruction; SVP, single ventri-cle physiology; TGA, transposition of the great arteries.a Median and interquartile range or number with percentage are shown. No signifi-cant differences were seen between the primary and secondary study populations.
Table 2: Association between fetal and neonatal MRIa
FetalVolume
Neonatal
PreoperativeVolume
PostoperativeVolume
IschemicBrain Injury
TBVb � � �UWMb � �CGMb � f �CBb f �UWM:TBVc � fCGM:TBVc fCB:TBVc � � fTBV:ICVc � fVCSFc �ECSFc � � fVCSF:ICVc f �ECSF:ICVc � f
Note:—CB indicates cerebellum.a Strength of correlation of fetal and neonatal preoperative volumes (first column);fetal and neonatal postoperative volumes (second column); fetal volumes and neo-natal ischemic brain injury (third column). Square indicates moderate correlation(closed square, r � 0.3– 0.5; open square r � �0.5 to �0.3). Circle indicates strongcorrelation (closed circle, r � 0.5– 0.8; open circle, r � �0.8 to�0.5).b Result of linear regression analysis with correction for PMA at scanning.c Result of quadratic regression analysis. Correlation coefficient and 95% CI are in theOn-line Table.
AJNR Am J Neuroradiol 40:885–91 May 2019 www.ajnr.org 887
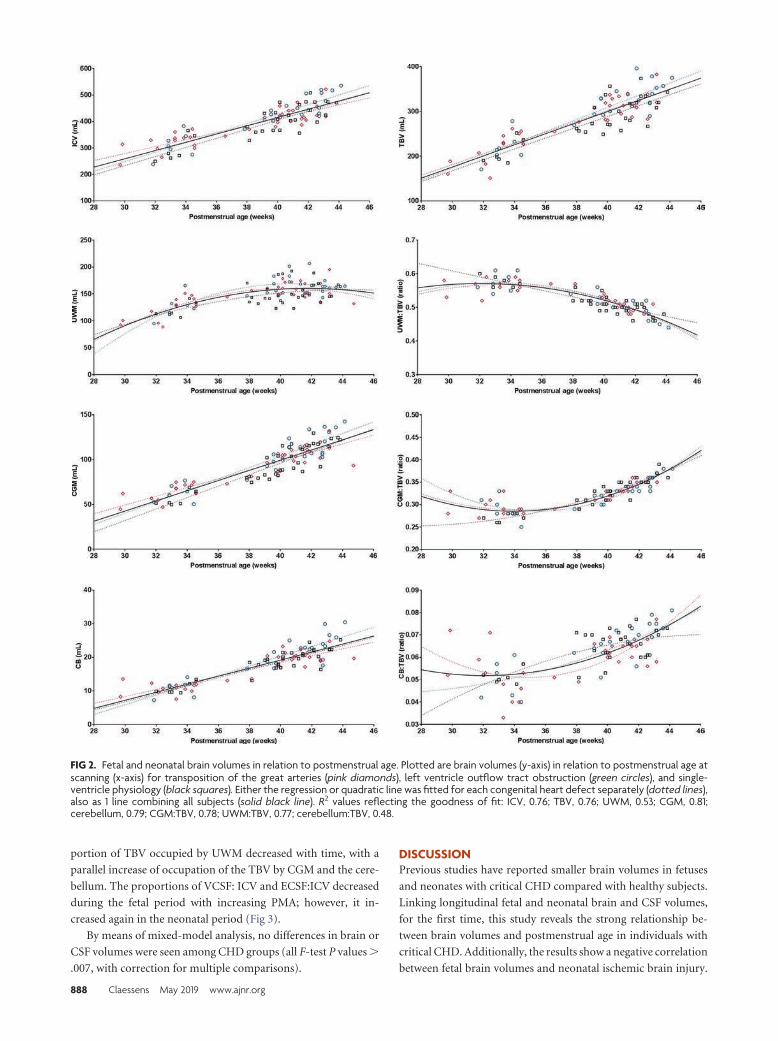
portion of TBV occupied by UWM decreased with time, with a
parallel increase of occupation of the TBV by CGM and the cere-
bellum. The proportions of VCSF: ICV and ECSF:ICV decreased
during the fetal period with increasing PMA; however, it in-
creased again in the neonatal period (Fig 3).
By means of mixed-model analysis, no differences in brain or
CSF volumes were seen among CHD groups (all F-test P values �
.007, with correction for multiple comparisons).
DISCUSSIONPrevious studies have reported smaller brain volumes in fetuses
and neonates with critical CHD compared with healthy subjects.
Linking longitudinal fetal and neonatal brain and CSF volumes,
for the first time, this study reveals the strong relationship be-
tween brain volumes and postmenstrual age in individuals with
critical CHD. Additionally, the results show a negative correlation
between fetal brain volumes and neonatal ischemic brain injury.
FIG 2. Fetal and neonatal brain volumes in relation to postmenstrual age. Plotted are brain volumes (y-axis) in relation to postmenstrual age atscanning (x-axis) for transposition of the great arteries (pink diamonds), left ventricle outflow tract obstruction (green circles), and single-ventricle physiology (black squares). Either the regression or quadratic line was fitted for each congenital heart defect separately (dotted lines),also as 1 line combining all subjects (solid black line). R2 values reflecting the goodness of fit: ICV, 0.76; TBV, 0.76; UWM, 0.53; CGM, 0.81;cerebellum, 0.79; CGM:TBV, 0.78; UWM:TBV, 0.77; cerebellum:TBV, 0.48.
888 Claessens May 2019 www.ajnr.org

Revealing the association between fetal brain imaging parameters
and neonatal brain abnormalities provides important informa-
tion for the potential use of fetal brain imaging parameters to
estimate neonatal neurologic findings in critical CHD.
In neonates with critical CHD, volumes of the largest brain
structures occupying most of the total brain volume, ie, UWM,
CGM, and cerebellum, correlated with the volumes measured in
the same individuals around 33 weeks of gestation. The findings
of this study support the hypothesis that neonatal brain volumes
are the result of antenatal brain growth and strengthen the possi-
bility of detecting delayed brain growth at an early stage, even
before birth. In our study, the association of fetal UWM and CGM
was stronger with preoperative neonatal UWM and CGM than
with postoperative UWM and CGM. This finding suggests that
growth of UWM and CGM after birth is dependent on other
neonatal factors than antenatal brain growth alone.
In our study, the association between fetal and neonatal age
was less strong for the cerebellum than it was for UWM and CGM.
However, the proportion of fetal TBV occupied by the cerebellum
was strongly associated with the proportion of preoperative and
postoperative neonatal TBV occupied by the cerebellum. The cer-
ebellum is the brain structure with the highest increase in volume
between 30 and 40 weeks PMA in extremely preterm infants.12
Previous studies have shown that in the third trimester of gesta-
tional age, cerebellar volume was comparable between fetuses
with and without CHD,13,14 whereas at term age, a reduction of
20% in the cerebellum has been observed in neonates with critical
CHD.4
Together with the relative reduction in brain volumes with
increasing gestation, a relative increase in CSF spaces has been
described in fetuses with critical CHD compared with healthy
fetuses.6 Larger CSF spaces are seen as an expression of brain
underdevelopment.15 In healthy fetuses, CSF volumes plateau late
in the third trimester,16 and the proportion of ICV occupied by
CSF decreases during the third trimester from 0.4 to 0.1.6 In our
study, the proportion of ICV occupied by VCSF and ECSF was
higher than 0.1 throughout the antenatal and neonatal period for
all neonates with critical CHD. Absolute and proportional CSF
volumes did decrease during the third trimester of gestation, to
increase again in the neonatal period. In addition, the findings of
our study revealed that increased absolute and proportional CSF
volumes at fetal age did correlate with increased neonatal CSF
volumes. This increase in CSF spaces seems abnormal and might
be a sign of further brain underdevelopment or the result of brain
tissue loss. Studies in older children with single-ventricle physiol-
ogy have shown an association between larger CSF spaces and
poorer neurodevelopment.17
Although it is becoming well-established that WM, CGM, and
cerebellar volumes are smaller in fetuses and neonates with
various types of critical CHD compared with healthy con-
trols,4,6,13,14,18,19 the contribution of these findings to neuro-
development later in childhood remains largely unknown.
Smaller neonatal brain volumes are associated with abnormal
neonatal neurobehavior20 and lower 6-year intelligence in
children with critical CHD.3 In adolescents with critical CHD,
decreased TBV is strongly correlated with poorer cognitive and
executive functioning.21
In our study, ischemic and hemorrhagic brain injury was not
seen in any of the fetuses. This finding supports the common
thought that acquired brain injury has its onset after birth, in the
neonatal intensive care and surgical period. The rate of preoper-
ative and new postoperative neonatal ischemic injury in our pop-
FIG 3. Fetal and neonatal CSF volumes in relation to postmenstrual age. Plotted are CSF volumes (y-axis) in relation to postmenstrual age atscanning (x-axis) for transposition of the great arteries (pink diamonds), left ventricle outflow tract obstruction (green circles), and single-ventricle physiology (black squares). Either the regression or quadratic line was fitted separately for each congenital heart defect (dotted lines),also as 1 line for all subjects (solid black line). R2 values reflecting the goodness of fit: VCSF, 0.27; ECSF, 0.27; VCSF:ICV, 0.14; ECSF:ICV, 0.24.
AJNR Am J Neuroradiol 40:885–91 May 2019 www.ajnr.org 889
ulation is comparable with that in previous reports.1 All individ-
uals included in this study had antenatal CHD diagnosis, which
has been suggested as a protective factor for preoperative neonatal
ischemic brain injury.2 In neonates with critical CHD, WMI and
focal infarction are the most common forms of acquired brain
injury, and especially WMI has been shown to be associated with
poorer motor and cognitive outcomes in the long term.2,3
The results of this study revealed a correlation of smaller fetal
TBV, UWM, CGM, and cerebellum with acquired neonatal isch-
emic brain injury (ie, moderate-severe WMI or focal infarction)
in neonates with an antenatal diagnosis of critical CHD. Absolute
fetal volumes of UWM, CGM, and the cerebellum (corrected
for PMA) showed a stronger correlation with acquired neonatal
brain injury than the proportion of TBV occupied by any of these
brain structures. Previous studies have also suggested a link be-
tween neonatal brain underdevelopment and acquired neonatal
brain injury.22,23 However, our study cannot reveal whether there
is a causal relationship between smaller brain volumes and ac-
quired brain injury. Brain underdevelopment might be accompa-
nied by an increased vulnerability of the brain to disturbances in
cerebral blood flow and cerebral oxygen delivery during intensive
care admission and cardiac surgery.
All critical CHD groups have reduced oxygen delivery com-
pared with healthy controls, and this reduction in brain oxygen
delivery is directly associated with smaller fetal and neonatal brain
volumes.5,7 Oxygen delivery is dependent on cerebral blood flow
and blood oxygen content. As a result of the cardiac defect, cere-
bral blood flow is most severely altered in single-ventricle physi-
ology and left-ventricle outflow tract obstruction, whereas cere-
bral blood oxygen content is lowest in transposition of the great
arteries.24 Despite these differences in antenatal cerebral circula-
tory disturbances, we found no differences in growth trajectories
of brain volumes among these CHD groups, reflecting most crit-
ical cardiac defects. Smaller fetal TBV6 and lower neonatal brain
growth rate25 have been described in single-ventricle physiology
compared with other cardiac defects; however, most neonatal
studies have shown comparable reductions in the volumes of
UWM and CGM among transposition of the great arteries and
single-ventricle physiology.4,18 All individuals with critical CHD
are at risk of reduced antenatal brain growth; however, other pa-
tient-related factors than the cardiac defect itself might determine
the degree of brain underdevelopment.
This study is one of the first to explore the correlation between
fetal and neonatal brain volumes using quantitative longitudinal
MR imaging. This study provides important information for fu-
ture research investigating whether there is a causal relationship
between brain underdevelopment and brain injury, fetal brain
underdevelopment as an early biomarker for neurodevelopmen-
tal outcomes, and potential strategies to improve antenatal brain
growth.
This study has several limitations. First, postnatal CHD diag-
nosis increases the risk of preoperatively acquired ischemic brain
injury, especially when low cardiac output syndrome is present.
However, this population cannot be included in fetal MR imaging
studies and was therefore not examined in this study. Second,
absolute brain and CSF volumes are dependent on the MR imag-
ing protocol and postimaging processing methods and are there-
fore difficult to compare among studies. Third, the subgroup
sample size (by heterogeneity of CHD populations) limited the
possibility of performing subgroup analysis. The subgroup anal-
ysis of fetal-neonatal brain volumes by PMA is at risk of type 2
errors, potentially not showing differences among the groups.
CONCLUSIONSLinking longitudinal fetal and neonatal brain and CSF volumes,
this study reveals the strong relationship between brain volumes
over postmenstrual age in individuals with critical CHD. Addi-
tionally, the results show a negative correlation between fetal
brain volumes and neonatal ischemic brain injury. Combining
these findings, this study suggests that fetal MR imaging can be
used as an early biomarker to estimate neonatal neurologic find-
ings in critical CHD.
ACKNOWLEDGMENTSThe authors would like to thank Gabrielle van Iperen, Raymond
Stegeman, and Felix Haas for their contributions to the brain
imaging program, and the Congenital Heart Disease Life Span
study group of the Wilhelmina Children’s Hospital in Utrecht,
which includes the Department of Neonatology, Department of
Pediatric Intensive Care, Department of Obstetrics, Department
of Pediatric Cardiology, Department of Pediatric Cardiothoracic
Surgery, Department of Pediatric Anesthesiology, Department of
Radiology, Department of Medical Psychology and Child Devel-
opment, and Exercise Center.
Disclosures: Ivana Isgum—UNRELATED: Grants/Grants Pending: research grantfunded by Nutricia Research, University Medical Center Utrecht, Utrecht Univer-sity*; Patents (Planned, Pending or Issued): I am an inventor of 1 accepted and 1pending patent; Stock/Stock Options: I am a scientific founder and shareholder ofQuantib-U B.V.; Linda S. de Vries—UNRELATED: Employment: Consultant Neonatol-ogist at UMCU*; Grants/Grants Pending: ZonMw grant for neonatal stroke*; Pay-ment for Lectures Including Service on Speakers Bureaus: yearly ultrasound coursein London, Imperial College, sometimes honorarium for giving a lecture*; Royalties: 3books: Hellstrom-Westas L, de Vries LS, Rosen I. An Atlas of Amplitude-IntegratedEEGs in The Newborn. 2nd ed, Informa Health, London, August 2008; Govaert P, deVries LS. An Atlas of Neonatal Brain Sonography, 2nd ed (CDM 182–183), Mac KeithPress, ISBN: 978-1-898683-56-8, July 2010; Volpe’s Textbook Neurology of the New-born, Elsevier, 2017.* *Money paid to the Institution.
REFERENCES1. Claessens NH, Kelly CJ, Counsell SJ, et al. Neuroimaging, cardiovas-
cular physiology, and functional outcomes in infants with congen-ital heart disease. Dev Med Child Neurol 2017;59:894 –902 CrossRefMedline
2. Peyvandi S, Chau V, Guo T, et al. Neonatal brain injury and timingof neurodevelopmental assessment in patients with congenitalheart disease. J Am Coll Cardiol 2018;71:1986 –96 CrossRef Medline
3. Claessens NH, Algra SO, Ouwehand TL, et al; CHD Lifespan StudyGroup Utrecht. Perioperative neonatal brain injury is associatedwith worse school-age neurodevelopment in children with criticalcongenital heart disease. Dev Med Child Neurol 2018;60:1052–58CrossRef Medline
4. von Rhein M, Buchmann A, Hagmann C, et al; Heart and Brain Re-search Group. Severe congenital heart defects are associated withglobal reduction of neonatal brain volumes. J Pediatr 2015;167:1259 – 63 e1 CrossRef Medline
5. Kelly CJ, Makropoulos A, Cordero-Grande L, et al. Impaired devel-opment of the cerebral cortex in infants with congenital heart dis-ease is correlated to reduced cerebral oxygen delivery. Sci Rep 2017;7:15088 CrossRef Medline
6. Limperopoulos C, Tworetzky W, McElhinney DB, et al. Brain vol-
890 Claessens May 2019 www.ajnr.org
ume and metabolism in fetuses with congenital heart disease: eval-uation with quantitative magnetic resonance imaging and spec-troscopy. Circulation 2010;121:26 –33 CrossRef Medline
7. Sun L, Macgowan CK, Sled JG, et al. Reduced fetal cerebral oxygenconsumption is associated with smaller brain size in fetuses withcongenital heart disease. Circulation 2015;131:1313–23 CrossRefMedline
8. Lim JM, Kingdom T, Saini B, et al. Cerebral oxygen delivery is re-duced in newborns with congenital heart disease. J Thorac Cardio-vasc Surg 2016;152:1095–103 CrossRef Medline
9. Garel C, Alberti C. Coronal measurement of the fetal lateralventricles: comparison between ultrasonography and magnetic reso-nance imaging. Ultrasound Obstet Gynecol 2006;27:23–27 Medline
10. Papile LA, Burstein J, Burstein R, et al. Incidence and evolution ofsubependymal and intraventricular hemorrhage: a study of infantswith birth weights less than 1,500 gm. J Pediatr 1978;92:529 –34CrossRef Medline
11. Moeskops P, Viergever MA, Mendrik AM, et al. Automatic segmen-tation of MR brain images with a convolutional neural network.IEEE Trans Med Imaging 2016;35:1252– 61 CrossRef Medline
12. Kersbergen KJ, Makropoulos A, Aljabar P, et al. Longitudinal re-gional brain development and clinical risk factors in extremely pre-term infants. J Pediatr 2016;178:93–100.e6 CrossRef Medline
13. Schellen C, Ernst S, Gruber GM, et al. Fetal MRI detects early alter-ations of brain development in tetralogy of Fallot. Am J Obstet Gy-necol 2015;213:392 e1–7 CrossRef Medline
14. Andescavage N, Yarish A, Donofrio M, et al. 3-D volumetric MRIevaluation of the placenta in fetuses with complex congenital heartdisease. Placenta 2015;36:1024 –30 CrossRef Medline
15. Brossard-Racine M, du Plessis AJ, Vezina G, et al. Prevalence andspectrum of in utero structural brain abnormalities in fetuses withcomplex congenital heart disease. AJNR Am J Neuroradiol 2014;35:1593–99 CrossRef Medline
16. Andescavage NN, DuPlessis A, McCarter R, et al. Cerebrospinal fluidand parenchymal brain development and growth in the healthy fe-tus. Dev Neurosci 2016;38:420 –29 CrossRef Medline
17. Heye KN, Knirsch W, Latal B, et al. Reduction of brain volumes afterneonatal cardiopulmonary bypass surgery in single-ventricle con-genital heart disease before fontan completion. Pediatr Res 2018;83:63–70 CrossRef Medline
18. Claessens NH, Moeskops P, Buchmann A, et al. Delayed cortical graymatter development in neonates with severe congenital heart dis-ease. Pediatr Res 2016;80:668 –74 CrossRef Medline
19. Clouchoux C, du Plessis AJ, Bouyssi-Kobar M, et al. Delayed corticaldevelopment in fetuses with complex congenital heart disease.Cereb Cortex 2013;23:2932– 43 CrossRef Medline
20. Owen M, Shevell M, Donofrio M, et al. Brain volume and neurobe-havior in newborns with complex congenital heart defects. J Pediatr2014;164:1121–27 e1 Medline
21. von Rhein M, Buchmann A, Hagmann C, et al. Brain volumes pre-dict neurodevelopment in adolescents after surgery for congenitalheart disease. Brain 2014;137:268 –76 CrossRef Medline
22. Dimitropoulos A, McQuillen PS, Sethi V, et al. Brain injury and de-velopment in newborns with critical congenital heart disease. Neu-rology 2013;81:241– 48 CrossRef Medline
23. Andropoulos DB, Hunter JV, Nelson DP, et al. Brain immaturity isassociated with brain injury before and after neonatal cardiac sur-gery with high-flow bypass and cerebral oxygenation monitoring.J Thorac Cardiovasc Surg 2010;139:543–56 CrossRef Medline
24. Donofrio MT, Bremer YA, Schieken RM, et al. Autoregulation of cere-bral blood flow in fetuses with congenital heart disease: the brain spar-ing effect. Pediatr Cardiol 2003;24:436–43 CrossRef Medline
25. Peyvandi S, Kim H, Lau J, et al. The association between cardiacphysiology, acquired brain injury, and postnatal brain growth incritical congenital heart disease. J Thorac Cardiovasc Surg 2018;155:291–300 e3 CrossRef
AJNR Am J Neuroradiol 40:885–91 May 2019 www.ajnr.org 891

ORIGINAL RESEARCHPEDIATRICS
Focal Cortical Dysplasia and Refractory Epilepsy: Role ofMultimodality Imaging and Outcome of Surgery
X S. Jayalakshmi, X S.K. Nanda, X S. Vooturi, X R. Vadapalli, X P. Sudhakar, X S. Madigubba, and X M. Panigrahi
ABSTRACT
BACKGROUND AND PURPOSE: Focal cortical dysplasia (FCD) is one of the most common causes of drug resistant epilepsy. Our aim wasto evaluate the role of presurgical noninvasive multimodality imaging techniques in selecting patients with refractory epilepsy and focalcortical dysplasia for epilepsy surgery and the influence of the imaging modalities on long-term seizure freedom.
MATERIALS AND METHODS: We performed a retrospective analysis of data of 188 consecutive patients with FCD and refractory epilepsywith at least 2 years of postsurgery follow-up. Predictors of seizure freedom and the sensitivity of neuroimaging modalities were analyzed.
RESULTS: MR imaging showed clear-cut FCD in 136 (72.3%) patients. Interictal FDG-PET showed focal hypo-/hypermetabolism in 144(76.6%); in 110 patients in whom ictal SPECT was performed, focal hyperperfusion was noted in 77 (70.3%). Focal resection was the mostcommon surgery performed in 112 (59.6%). Histopathology revealed FCD type I in 102 (54.3%) patients. At last follow-up, 124 (66.0%) wereseizure-free. Complete resection of FCD and type II FCD were predictors of seizure freedom. Localization of FCD on either MR imaging orPET or ictal SPECT had the highest sensitivity for seizure freedom at 97.5%. Among individual modalities, FDG-PET had the highestsensitivity (78.2%), followed by MR imaging (75.8%) and ictal SPECT (71.8%). The sensitivity of MR imaging to localize type I FCD (60.8%) wassignificantly lower than that for type II FCD (84.8%, P � .001). Among 37 patients with subtle MR imaging findings and a focal FDG-PETpattern, 30 patients had type I FCD.
CONCLUSIONS: During presurgical multimodality evaluation, localization of the extent of the epileptogenic zone in at least 2 imagingmodalities helps achieve seizure freedom in about two-thirds of patients with refractory epilepsy due to FCD. FDG-PET is the mostsensitive imaging modality for seizure freedom, especially in patients with type I FCD.
ABBREVIATIONS: EEG � electroencephalography; FCD � focal cortical dysplasia; ILAE � International League Against Epilepsy
Focal cortical dysplasia (FCD) is the most common malforma-
tion of cortical development1 and an established etiology of
drug-resistant epilepsies in children and adolescents.2 It is the
most frequent histopathology in children and the third most
common etiology in adult patients undergoing epilepsy surgery.3
These patients have a high seizure burden: More than 60% have
daily seizures.4 Precise localization of the extent of the epilepto-
genic zone may influence the surgical outcome. Therefore, in in-
dividuals with refractory epilepsy and FCD, the combination of
multimodality imaging and electrophysiologic data during pre-
surgical evaluation may help characterize the epileptogenic zone5
and improve the outcome of the surgery.
Findings from scalp electroencephalography (EEG) in FCDs
often have limitations in spatial resolution in recording readings
from deeper cortical sites.5 High-resolution MR imaging helps
recognize features typical of FCDs in only two-thirds of patients.6
Subtle MR imaging changes are often reported in the one-third of
patients with FCDs characterized by disturbances in cortical or-
ganization that reorganize.7 Frequent location of FCDs in a cen-
tral region and poor localization on MR imaging make them a
surgeon’s challenge,8 with reported seizure freedom in only one-
third of patients postsurgery, significantly lower than the nearly
60% reported in all patients with FCD.9
FDG-PET offers a 3D, high-resolution analysis and is highly
sensitive in detecting MR imaging negative for FCDs.10 FDG-PET
helps to delineate the cortical abnormalities with a higher sensi-
tivity than MR imaging, especially in patients with mild type I
FCD.11 It has been reported that incorporating FDG-PET/MR
Received December 19, 2018; accepted after revision March 12, 2019.
From the Departments of Neurology (S.J., S.K.N., S.V.), Radiology (R.V.), NuclearMedicine (P.S.), Pathology (S.M.), and Neurosurgery (M.P.), Krishna Institute of Med-ical Sciences, Secunderabad, India.
Please address correspondence to Sita Jayalakshmi, DM, Department of Neurol-ogy, Krishna Institute of Medical Sciences, Minister Rd, 1-8-31/1, Secunderabad-03,India; e-mail: [email protected]; [email protected]
http://dx.doi.org/10.3174/ajnr.A6041
892 Jayalakshmi May 2019 www.ajnr.org

imaging coregistration into the multimodality presurgical evalu-
ation enhances the detection and successful surgical treatment of
patients with FCD, especially those with type I FCD.10 In patients
in whom both MR imaging and FDG-PET fail to localize the ep-
ileptogenic zone, ictal SPECT has been associated with postsurgi-
cal seizure freedom in 86% of patients with FCD in whom the
zone of ictal hyperperfusion detected on SPECT was completely
resected.12 Hence multimodality presurgical investigations are of-
ten required, with coregistration on FDG-PET or ictal SPECT in
complex MR imaging negative cases13 because each technique has
its own limitations.12
With increasing use of noninvasive multimodality imaging in
the evaluation of refractory epilepsy with suspected FCD, it be-
comes imminent to determine the number of modalities required
to localize the extent of the epileptogenic zone and the sensitivity
of each modality for long-term seizure freedom. Moreover, it is
also imperative to determine how these modalities complement
each other in selecting the patient and planning the extent of
resection. In fact, most of the literature compares multimodality
evaluation with intracranial EEG both for confirmation of the
ictal onset zone and determining the extent of surgical resection.14
Very few studies have investigated the role of presurgical multi-
modality evaluation with postoperative seizure freedom. In those
studies that reported seizure freedom, the findings were observed
in small study populations or with a short follow-up. We evalu-
ated the role of presurgical noninvasive multimodality imaging
techniques in selecting a patient with refractory epilepsy and FCD
for epilepsy surgery and the imaging techniques influence on
long-term seizure freedom in a large cohort.
MATERIALS AND METHODSOf the 792 patients who underwent an epilepsy surgery between
January 2005 and June 2016, data of 188 consecutive patients
operated for drug-resistant epilepsy and a diagnosis of FCD were
analyzed. The study was performed at a tertiary referral center
with comprehensive epilepsy care and a dedicated epilepsy sur-
gery program running for �14 years. The program comprises a
neurologist, neuroradiologist, nuclear medicine specialist, neuro-
surgeon, and neuropathologist with substantial expertise. The in-
clusion criteria were the following: 1) type I or type II FCD within
the surgical specimen, and 2) at least 2 years of postsurgery follow-
up. Exclusion criteria were the following: 1) FCD type III, and 2)
hemispheric dysplasia, tuberous sclerosis, and periventricular
nodular heterotopias. The presurgical, surgical, and postsurgical
data were collected using a structured data-collection form. Sei-
zure classification was performed according to the International
League Against Epilepsy (ILAE) Task Force on Classification and
Terminology Guidelines.15 The study was approved by the insti-
tutional ethics committee.
Presurgical EvaluationPresurgical neurologic evaluation and surgery were performed
after the necessary consents were obtained. Preoperative seizure
frequency was calculated for the year preceding the surgery, ex-
cluding auras. A 3T brain MR imaging, FDG-PET with PET-MR
imaging fusion, video-electroencephalography (video-EEG), and
a detailed neuropsychological and developmental evaluation were
performed in all patients. Ictal SPECT was performed in cases in
which there was a discordance of the EEG data or in those with
insufficient information on 3T MRI and/or FDG-PET. Func-
tional MR imaging was performed in selected cases for lateraliza-
tion of language, memory, and motor functions.
All the patients underwent MR imaging on a 3T scanner (In-
genia 3T; Philips Healthcare, Best, the Netherlands) with a dedi-
cated epilepsy protocol. The protocol included a conventional
DWI with b-values of 0 and 1000; 2D-FLAIR; axial 3D-volume
T1; 3D-volume FLAIR; 3D-volume double inversion recovery se-
quences in the sagittal plane; and DTI with 15 directions using a
dedicated 16-channel head coil. 3D imaging parameters were as
follows—3D T1 fast-field echo: TR � 7.9 ms, TE � 3.6 ms, acqui-
sition matrix � 232 � 224, acquired spatial voxel resolution �
0.99 � 1.00 � 1.00 mm, reconstructed spatial resolution �
0.53 � 0.50 � 0.50 with a data-acquisition time of 4 minutes and
17 seconds; 3D-FLAIR volume sequence: TR � 4800 ms, TE �
289 ms, TI � 1650 ms, acquisition matrix � 224 � 224, acquired
spatial voxel resolution � 1.12 � 1.12 � 1.12 mm, reconstructed
spatial resolution � 0.98 � 0.98 � 0.56 mm, data acquisition
time � 4 minutes and 5 seconds; 3D double inversion recovery
sequence: TR � 5000 ms, TE � 288 ms, TI � 2550 ms, acquisition
matrix � 208 � 208, acquired spatial voxel resolution � 1.2 �
1.12 � 1.3 mm, reconstructed spatial resolution � 0.98 � 0.98 �
0.65 mm, data acquisition time � 5 minutes and 36 seconds.
The volume sequences were then processed by multiplanar
reconstruction and volume-rendering in the axial, coronal, and
sagittal planes for delineation of any sulcal, gyral abnormalities
such as cortical laminar architectural abnormalities and blurring
of gray-white matter interfaces. The MRIs were read by a neuro-
radiologist and neurologist with expertise in epilepsy imaging.
The MR imaging data were reanalyzed after FDG-PET in cases in
which the MR imaging findings were reported as normal or with
minor gyral abnormalities. An MR imaging abnormality was clas-
sified as clear-cut FCD and subtle FCD (when the MR imaging
lesion was indistinct and confirmed on the basis of FDG-PET
hypo-/hypermetabolism).
Prolonged video-EEG monitoring was performed and at least
2 seizures were recorded. Interictal spikes were grouped as unilat-
eral (when �75% of spikes were confined to the side of lesion),
bilateral, and multifocal. The seizure semiology was grouped as
lateralizing, nonlateralizing, and contralateral. The ictal EEG pat-
terns were classified as focal, regional, hemispheric, generalized,16
and contralateral. Unilateral spikes, lateralization on semiology,
and regional ictal EEG onset patterns were compared for analysis
with the rest of the parameters in the respective groups.
All patients underwent [18F] FDG-PET using Biograph mCT
(Siemens, Erlangen, Germany) in a 3D mode. PET-MR imaging
fusion was performed using syngo MultiModality Workplace
software (Siemens). FDG-PET and PET-MR imaging fusion im-
ages were analyzed in all 3 projections. The PET metabolism was
classified as focal hypometabolism, hypermetabolism, and nor-
mal metabolism. The extent of hypo-/hypermetabolism was clas-
sified as focal when confined to the lesion/lobe, lateralized if it was
beyond 1 lobe but in the same hemisphere, and not informative if
it was normal or uncertain. For analysis, focal hypo-/hypermetab-
olism and the rest were organized into 2 groups.
AJNR Am J Neuroradiol 40:892–98 May 2019 www.ajnr.org 893

Ictal SPECT was performed in 110 patients. Under video-EEG
monitoring, 740-MBq of technetium Tc99m ethyl cysteinate dim-
mer (Tc99m-ECD) was injected during the ictal phase. Brain
SPECT images were acquired using a Millennium MG (GE
Healthcare, Milwaukee, Wisconsin) dual-head gamma camera
equipped with low-energy, high-resolution, and parallel hole col-
limators. The SPECT hyperperfusion was classified as focal when
confined to the lesion/lobe, lateralized if it was beyond 1 lobe but
in the same hemisphere, and contralateral and noninformative if
it was bilateral, normal, or uncertain. Focal hyperperfusion and
the rest were separated into 2 groups for analysis.
SurgeryAll patients underwent surgery after the review of the multimo-
dality evaluation data in a multidisciplinary case conference. Sur-
gery was performed only if there was a concordance in at least 2
imaging modalities: Namely, the lesion was clear-cut on MR im-
aging, or a localized FDG-PET pattern or a localized ictal SPECT
pattern was present. The types of surgeries performed were focal
resection (corticectomy/lesionectomy/lobectomy), multilobar
resection, standard anterior temporal lobectomy with amygda-
lohippocampectomy, and posterior disconnection. During fo-
cal resections for a clear-cut lesion, the FCD along with a min-
imum of a 1-cm circumferential cortex was resected. However,
when the extent of FDG-PET hypometabolism (in cases with a
localized PET pattern in a noneloquent cortex) was more than
that of the MR imaging lesion, the PET abnormality was also
resected along with the lesion. All the resections were guided by
neuronavigation and intraoperative electrocorticography. The
motor cortex was defined by direct intraoperative cortical
stimulation in cases in which the lesion was close to or over-
lapping the motor cortex.
PathologyPathologic examination of the resected tissue was performed by a
neuropathologist with expertise in epilepsy pathology. The FCDs
were classified as FCD type I, FCD type IIa, and FCD type IIb
according to the ILAE classification.17 FCD type I was character-
ized by isolated lesions, which present as either radial and/or
tangential dyslamination of the neocortex. FCD type II was an
isolated lesion characterized by cortical dyslamination and dys-
morphic neurons without (type IIa) or with balloon cells (type
IIb).17
Postsurgical Evaluation and OutcomeThe postoperative hospital course, complications, and outcome
data were analyzed. Acute postoperative seizures were defined as
seizures occurring within 7 days after surgery. All the patients
underwent routine interictal EEG, at 3 months and 1 year post-
surgery. Brain MR imaging was performed at 1 year postsurgery.
Outcome at the last follow-up was assessed according to ILAE
classification where patients were categorized as ILAE class 1 (sei-
zure-free) and the rest (persistent seizures).15
Statistical AnalysisThe study population was divided into 2 groups based on seizure
freedom or the type of FCD. Comparison between groups for
categoric variables was performed using the Fisher exact test,
whereas an independent Student t test was used for comparing
continuous variables. Logistic regression was performed to eval-
uate predictors of seizure freedom. Comparison for sensitivities
was performed using the McNemar test. Data analysis was per-
formed using SPSS for Windows, Version 17.0 (IBM, New York).
A P value � .05 was considered statistically significant.
RESULTSClinical VariablesThe average age at onset of epilepsy was 7.93 � 7.56 years (range,
0 –50 years) with a mean duration of epilepsy of 9.75 � 7.17 years
(range, 0 –29 years). The average age at the surgery was 17.31 �
11.26 years (range, 2– 64 years) with 92 (48.9%) women. Daily
seizures were reported in 106 (56.4%). Febrile convulsions were
reported in 23 (12.2%) patients, while there was a family history
of epilepsy in 34 (18.1%), and 29 (15.4%) had history of status
epilepticus. Developmental delay was reported in 47 (25.0%).
Multiple seizure types were reported in 52 (27.7%) patients, and
an aura was reported in 43 (22.9%) (Table 1).
Presurgical VariablesThe interictal EEG showed regional epileptiform discharges in 93
(49.5%) patients, and 88 (46.8%) had regional ictal EEG onset.
Interictal FDG-PET showed hypo- or hypermetabolism in 181
(96.3%) and a focal PET pattern in 144 (76.6%). In the110 pa-
tients in whom ictal SPECT was performed, focal hyperperfusion
was noted in 77 (70.3%) patients. MR imaging showed clear-cut
FCD in 136 (72.3%) patients. In the remaining 52 (27.7%) pa-
tients with subtle MR imaging findings, a regional interictal or
ictal EEG onset pattern was noted in 27 patients. Among these 27
patients, a focal FDG-PET pattern was observed in 21 patients
(Fig 1). In the remaining 6 patients, ictal SPECT showed focal
hyperperfusion in 3. Among the 25 patients with subtle MR im-
aging findings and in whom ictal or interictal EEG was nonlocal-
izing, a focal FDG-PET pattern was observed in 16 patients.
Among the remaining 9 patients, ictal SPECT showed focal hy-
perperfusion in 3 patients. Surgery was performed in the re-
maining 6 patients with subtle MR imaging findings after in-
vasive EEG evaluation.
Surgical VariablesFocal resection was the most common surgery performed in
112 (59.6%), followed by amygdalohippocampectomy in 31
(16.5%) patients. Resections involved the frontal lobe in 101
(53.7%), the temporal lobe in 33 (17.6%), the parietal lobe in
17 (9.0%), and the occipital lobe in 10 (5.3%), and they were
multilobar in 27 (14.4%). The FCD was close to an eloquent
cortex in 36 (19.1%). There was no mortality. Postsurgery, 17
(9.0%) had complications, which improved by 3 months (mo-
tor weakness in 10, language dysfunction in 4, mutism in 2, and
hemianopia in 1). Complete resection of the FCD was per-
formed in 133 (70.7%) patients in whom the lesion was clear-
cut on MR imaging. Histopathology was suggestive of FCD
type I in 102 (54.3%), type II in 79 (42.0%), and mixed types I
and II in the remaining 7 (3.7%) patients.
894 Jayalakshmi May 2019 www.ajnr.org
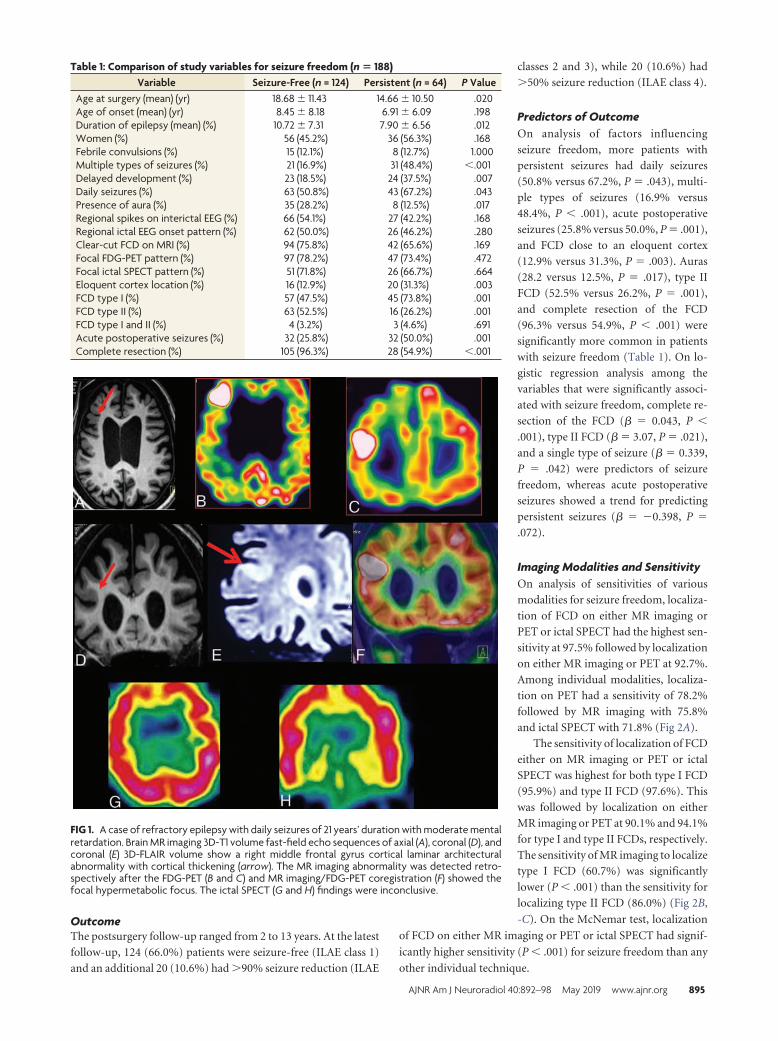
OutcomeThe postsurgery follow-up ranged from 2 to 13 years. At the latest
follow-up, 124 (66.0%) patients were seizure-free (ILAE class 1)
and an additional 20 (10.6%) had �90% seizure reduction (ILAE
classes 2 and 3), while 20 (10.6%) had
�50% seizure reduction (ILAE class 4).
Predictors of OutcomeOn analysis of factors influencing
seizure freedom, more patients with
persistent seizures had daily seizures
(50.8% versus 67.2%, P � .043), multi-
ple types of seizures (16.9% versus
48.4%, P � .001), acute postoperative
seizures (25.8% versus 50.0%, P � .001),
and FCD close to an eloquent cortex
(12.9% versus 31.3%, P � .003). Auras
(28.2 versus 12.5%, P � .017), type II
FCD (52.5% versus 26.2%, P � .001),
and complete resection of the FCD
(96.3% versus 54.9%, P � .001) were
significantly more common in patients
with seizure freedom (Table 1). On lo-
gistic regression analysis among the
variables that were significantly associ-
ated with seizure freedom, complete re-
section of the FCD (� � 0.043, P �
.001), type II FCD (� � 3.07, P � .021),
and a single type of seizure (� � 0.339,
P � .042) were predictors of seizure
freedom, whereas acute postoperative
seizures showed a trend for predicting
persistent seizures (� � �0.398, P �
.072).
Imaging Modalities and SensitivityOn analysis of sensitivities of various
modalities for seizure freedom, localiza-
tion of FCD on either MR imaging or
PET or ictal SPECT had the highest sen-
sitivity at 97.5% followed by localization
on either MR imaging or PET at 92.7%.
Among individual modalities, localiza-
tion on PET had a sensitivity of 78.2%
followed by MR imaging with 75.8%
and ictal SPECT with 71.8% (Fig 2A).
The sensitivity of localization of FCD
either on MR imaging or PET or ictal
SPECT was highest for both type I FCD
(95.9%) and type II FCD (97.6%). This
was followed by localization on either
MR imaging or PET at 90.1% and 94.1%
for type I and type II FCDs, respectively.
The sensitivity of MR imaging to localize
type I FCD (60.7%) was significantly
lower (P � .001) than the sensitivity for
localizing type II FCD (86.0%) (Fig 2B,
-C). On the McNemar test, localization
of FCD on either MR imaging or PET or ictal SPECT had signif-
icantly higher sensitivity (P � .001) for seizure freedom than any
other individual technique.
FIG 1. A case of refractory epilepsy with daily seizures of 21 years’ duration with moderate mentalretardation. Brain MR imaging 3D-T1 volume fast-field echo sequences of axial (A), coronal (D), andcoronal (E) 3D-FLAIR volume show a right middle frontal gyrus cortical laminar architecturalabnormality with cortical thickening (arrow). The MR imaging abnormality was detected retro-spectively after the FDG-PET (B and C) and MR imaging/FDG-PET coregistration (F) showed thefocal hypermetabolic focus. The ictal SPECT (G and H) findings were inconclusive.
Table 1: Comparison of study variables for seizure freedom (n � 188)Variable Seizure-Free (n = 124) Persistent (n = 64) P Value
Age at surgery (mean) (yr) 18.68 � 11.43 14.66 � 10.50 .020Age of onset (mean) (yr) 8.45 � 8.18 6.91 � 6.09 .198Duration of epilepsy (mean) (%) 10.72 � 7.31 7.90 � 6.56 .012Women (%) 56 (45.2%) 36 (56.3%) .168Febrile convulsions (%) 15 (12.1%) 8 (12.7%) 1.000Multiple types of seizures (%) 21 (16.9%) 31 (48.4%) �.001Delayed development (%) 23 (18.5%) 24 (37.5%) .007Daily seizures (%) 63 (50.8%) 43 (67.2%) .043Presence of aura (%) 35 (28.2%) 8 (12.5%) .017Regional spikes on interictal EEG (%) 66 (54.1%) 27 (42.2%) .168Regional ictal EEG onset pattern (%) 62 (50.0%) 26 (46.2%) .280Clear-cut FCD on MRI (%) 94 (75.8%) 42 (65.6%) .169Focal FDG-PET pattern (%) 97 (78.2%) 47 (73.4%) .472Focal ictal SPECT pattern (%) 51 (71.8%) 26 (66.7%) .664Eloquent cortex location (%) 16 (12.9%) 20 (31.3%) .003FCD type I (%) 57 (47.5%) 45 (73.8%) .001FCD type II (%) 63 (52.5%) 16 (26.2%) .001FCD type I and II (%) 4 (3.2%) 3 (4.6%) .691Acute postoperative seizures (%) 32 (25.8%) 32 (50.0%) .001Complete resection (%) 105 (96.3%) 28 (54.9%) �.001
AJNR Am J Neuroradiol 40:892–98 May 2019 www.ajnr.org 895

Comparison of FCD Types I and IIOn comparison of factors between type I and type II FCD, there
were no differences between the types of FCD for demographic
characteristics. More patients with type I FCD were multilobar in
location (20.6% versus 3.8%; P � .001) and had developmental
delay (31.4% versus 16.5%, P � .025). Clear-cut FCD on MR
imaging (60.8% versus 84.8%, P � .001), a regional ictal EEG
pattern (39.2% versus 58.4%, P � .024), and complete resection
of FCD (77.8% versus 90.3%, P � .048) were more common in
patients with type II FCD (Table 2). In a subset of 37 patients with
subtle MR imaging findings and a focal FDG-PET pattern, 30
patients had type I FCD, while 7 had type II FCD. In this subset,
there was no difference in seizure freedom based on the type of
FCD (56.6% versus 57.1%, P � 1.000).
DISCUSSIONIn the current study, we report that in patients with refractory
epilepsy due to FCD, multimodality imaging helps achieve seizure
freedom in nearly two-thirds of patients. More than one-fourth of
the patients with FCD and refractory epilepsy had subtle MR im-
aging findings in which FDG-PET helped localize the epilepto-
genic zone in 71%. On correlating with histopathology, most
(80%) of these patients in whom FDG-PET helped localize the
epileptogenic zone had type I FCD. Predictors of postsurgical sei-
zure freedom are a single type of seizure, complete resection of the
FCD, and type II FCD. However, we could not replicate previ-
ously reported predictors such as younger age at the operation
and shorter duration of epilepsy.14
We report seizure freedom in 66.0% of patients with an
additional 10.6% of patients reporting a �90% seizure reduc-
tion. This result is similar to the 65% favorable outcome re-
ported by Fauser et al9 and the �56% seizure freedom reported
by Kral et al.18 The most common reason for incomplete re-
section in the current study was a lesion located in close prox-
imity to the eloquent cortex, observed in 17.3% of our study
population. Subtotal resections are common in these patients
to avoid the risk of an unacceptable postoperative neurologic
deficit.3 Another commonly attributed reason for incomplete
resection is type I FCD. Previously Kim et al19 reported that
patients with FCD of a severe-pathologic group (type II) had
more chances of complete resection of FCD and subsequent
seizure freedom. In the current study, we found that both com-
pleteness of resection and seizure freedom were higher in pa-
tients with type II FCD, possibly due to clear-cut focal lesions
on MR imaging. In fact, having a dedicated 3T MR imaging
protocol itself could have influenced the seizure outcome in
the present study, as previously suggested by Ahmed et al.20
FIG 2. Comparison of sensitivities of various modalities for seizure freedom (A), type I FCD (B), and type II FCD (C).
896 Jayalakshmi May 2019 www.ajnr.org

We also agree with Ahmed et al “that a dedicated 3T MR im-
aging protocol may increase the cost of presurgical evaluation,
simultaneously considering the risks of administering general
anesthetic for the MR imaging, especially in some children.
However, additional MR imaging could improve not only the
detection of a lesion, but could assist with subsequent
management.”20
The sensitivity of MR imaging to localize type II FCD was
significantly higher than the sensitivity for type I FCD. This
finding may be because of our concurrent findings that nearly
one-fifth of patients with type I FCD had a multilobar distri-
bution compared with a mere 3.8% of patients with type II
FCD. This extensive distribution of type I FCD is perhaps the
reason for our observation of higher rates of incomplete resec-
tion and persistent seizures in type I FCD. Furthermore, Jin et
al21 reported incomplete resection of FCD and habitual acute
postoperative seizures as strong predictors of seizure recur-
rence after surgery, similar to the present study. As Hauptman
and Mathern3 suggested, given the poor localization with EEG
and normal MR imaging findings, we need better and prefera-
bly noninvasive tools to not only identify the lesion but also
provide ways to detect the borders of the histopathology and
whether the lesion involves the functional cerebral cortex. The
present study demonstrates that FDG-PET is complementary
to MR imaging to detect the extent of epileptogenic zone, es-
pecially in type I FCD.
The sensitivity of a clear-cut FCD on MR imaging for seizure
freedom in the current study at 75.8% is similar to previously
reported sensitivities of 60%–90%.10,14 Similarly, a sensitivity of
78.2% for localization of FCD on FDG-PET and a sensitivity of
approximately 70% for ictal SPECT are similar to those reported
by previous studies.8 We report that evaluation with �2 modali-
ties increases the sensitivity for seizure freedom in these patients.
Most interesting, in 71% of 52 patients in whom MR imaging was
not helpful, FDG-PET helped localize the FCD, and ictal SPECT,
in 11.5% more patients in whom MR imaging and FDG-PET both
were not helpful. Especially, in patients with type I FCD, in which
MR imaging did not localize FCD, we report that FDG-PET
helped localize the lesion and improve seizure freedom. These
observations suggest that FDG-PET is a
useful adjunct to MR imaging, especially
in patients with type I FCD.
LimitationsThe correlation between hypometabo-
lism on FDG-PET and findings on MR
imaging may not be precise because
both evaluations were not studied
within a short period. A retrospectivedesign of the study did not permit us todetermine false-negative reports. Fur-thermore, the retrospective design alsodid not allow blinding of any of the team
members for diagnoses already per-
formed, thus preventing us from ob-
serving variability between and within
an observer. Ictal SPECT was per-
formed in only a fraction of patients
because coregistration of MR imaging/FDG-PET was sufficient
in most patients.
Implications for Clinical PracticeIn developing countries, the cost of epilepsy surgery using an in-
vasive evaluation is 4 times that with noninvasive multimodality
evaluation.22 The findings of the current study that localization of
FCD in �2 noninvasive imaging modalities is sufficient to achieve
satisfactory seizure freedom may have potential cost-effective im-
plications for the feasibility of epilepsy surgery after multimodal-
ity evaluation in countries with limited resources.
CONCLUSIONSDuring presurgical multimodality evaluation, localization of the
extent of the epileptogenic zone in at least 2 imaging modalities
helps achieve seizure freedom in about two-thirds of patients with
refractory epilepsy due to FCD. FDG-PET is the most sensitive
imaging technique for seizure freedom, especially in patients with
type I FCD.
REFERENCES1. Barkovich AJ, Guerrini R, Kuzniecky RI, et al. A developmental and
genetic classification for malformations of cortical development:update 2012. Brain 2012;135(Pt 5):1348 – 69 CrossRef Medline
2. Palmini A, Holthausen H. Focal malformations of corticaldevelopment: a most relevant etiology of epilepsy in children.Handb Clin Neurol 2013;111:549 – 65 CrossRef Medline
3. Hauptman JS, Mathern GW. Surgical treatment of epilepsy associ-ated with cortical dysplasia: 2012 update. Epilepsia 2012;53(Suppl4):98 –104 CrossRef Medline
4. Chapman K, Wyllie E, Najm I, et al. Seizure outcome after epilepsysurgery in patients with normal preoperative MRI. J Neurol Neuro-surg Psychiatry 2005;76:710 –13 CrossRef Medline
5. Pittau F, Megevand P, Sheybani L, et al. Mapping epileptic activity:sources or networks for the clinicians? Front Neurol 2014;5:218CrossRef Medline
6. Colombo N, Salamon N, Raybaud C, et al. Imaging of malforma-tions of cortical development. Epileptic Disord 2009;11:194 –205CrossRef Medline
7. Janszky J, Ebner A, Kruse B, et al. Functional organization of thebrain with malformations of cortical development. Ann Neurol2003;53:759 – 67 CrossRef Medline
Table 2: Comparison of study variables for FCD types I and II (n � 181)Variable FCD Type I (n = 102) FCD Type II (n = 79) P Value
Age at surgery (mean) (yr) 16.54 � 10.76 18.11 � 11.05 .338Age of onset (mean) (yr) 8.29 � 7.88 7.76 � 7.31 .655Duration of epilepsy (mean) (%) 9.08 � 6.91 10.82 � 7.60 .117Women (%) 50 (49.0%) 40 (50.6%) .881Multilobar distribution of FCD (%) 21 (20.6%) 3 (3.8%) �.001Febrile convulsions (%) 12 (11.9%) 9 (11.4%) 1.000Multiple types of seizures (%) 31 (30.4%) 19 (24.1%) .403Delayed development (%) 32 (31.4%) 13 (16.5%) .025Daily seizures (%) 57 (55.9%) 48 (60.8%) .546Aura (%) 18 (17.6%) 23 (29.1%) .076Regional ictal EEG onset pattern (%) 40 (39.2%) 45 (58.4%) .024Clear-cut FCD on MRI (%) 62 (60.8%) 67 (84.8%) �.001Focal FDG-PET pattern (%) 77 ( (75.5%) 63 (79.7%) .592Focal ictal SPECT pattern (%) 48 (70.6%) 29 (72.5%) 1.000Eloquent cortex location (%) 21 (20.6%) 15 (19.0%) .852Seizure-free (%) 57 (55.8%) 63 (79.7%) .008Acute postoperative seizures (%) 38 (37.3%) 24 (30.4%) .348Complete resection (%) 63 (77.8%) 65 (90.3%) .048
AJNR Am J Neuroradiol 40:892–98 May 2019 www.ajnr.org 897

8. Chassoux F, Landre E, Mellerio C, et al. Type II focal corticaldysplasia: electroclinical phenotype and surgical outcome relatedto imaging. Epilepsia 2012;53:349 –58 CrossRef Medline
9. Fauser S, Essang C, Altenmuller DM, et al. Long-term seizure out-come in 211 patients with focal cortical dysplasia. Epilepsia 2015;56:66 –76 CrossRef Medline
10. Salamon N, Kung J, Shaw SJ, et al. FDG PET/MRI coregistrationimproves detection of cortical dysplasia in patients with epilepsy.Neurology 2008;71:1594 – 601 CrossRef Medline
11. Kim SK, Na DG, Byun HS, et al. Focal cortical dysplasia: comparisonof MRI and FDG-PET. J Comput Assist Tomogr 2000;24:296 –302CrossRef Medline
12. Guerrini R, Duchowny M, Jayakar P, et al. Diagnostic methods andtreatment options for focal cortical dysplasia. Epilepsia 2015;56:1669 – 86 CrossRef Medline
13. Jayakar P, Gaillard WD, Tripathi M, et al; Task Force for PaediatricEpilepsy Surgery, Commission for Paediatrics, and the DiagnosticCommission of the International League Against Epilepsy. Diagnos-tic test utilization in evaluation for resective epilepsy surgery inchildren. Epilepsia 2014;55:507–18 CrossRef Medline
14. Kim YH, Kang HC, Kim DS, et al. Neuroimaging in identifying focalcortical dysplasia and prognostic factors in pediatric and adoles-cent epilepsy surgery. Epilepsia 2011;52:722–27 CrossRef Medline
15. Wieser HG, Blume WT, Fish D, et al; Commission on Neurosurgeryof the International League Against Epilepsy (ILAE). ILAE Commis-
sion Report: proposal for a new classification of outcome with re-spect to epileptic seizures following epilepsy surgery. Epilepsia 2001;42:282– 86 Medline
16. Jayalakshmi S, Panigrahi M, Kulkarni DK, et al. Outcome of epilepsysurgery in children after evaluation with non-invasive protocol.Neurol India 2011;59:30 –36 CrossRef Medline
17. Blumcke I, Thom M, Aronica E, et al. The clinicopathologic spec-trum of focal cortical dysplasias: a consensus classification pro-posed by an ad hoc Task Force of the ILAE Diagnostic MethodsCommission. Epilepsia 2011;52:158 –74 CrossRef Medline
18. Kral T, von Lehe M, Podlogar M, et al. Focal cortical dysplasia: longterm seizure outcome after surgical treatment. J Neurol NeurosurgPsychiatry 2007;78:853–56 CrossRef Medline
19. Kim DW, Lee SK, Chu K, et al. Predictors of surgical outcome andpathologic considerations in focal cortical dysplasia. Neurology2009;72:211–16 CrossRef Medline
20. Ahmed R, Rubinger L, Go C, et al. Utility of additional dedicatedhigh-resolution 3T MRI in children with medically refractory focalepilepsy. Epilepsy Res 2018;143:113–19 CrossRef Medline
21. Jin B, Wang J, Zhou J, et al. A longitudinal study of surgical outcomeof pharmacoresistant epilepsy caused by focal cortical dysplasia.J Neurol 2016;263:2403–10 CrossRef Medline
22. Rathore C, Radhakrishnan K. Epidemiology of epilepsy surgery inIndia. Neurol India 2017;65(Supplement):S52–59 CrossRef Medline
898 Jayalakshmi May 2019 www.ajnr.org

CLINICAL REPORTPEDIATRICS
Persisting Embryonal Infundibular Recess in Morning GlorySyndrome: Clinical Report of a Novel Association
X A. D’Amico, X L. Ugga, X R. Cuocolo, X M. Cirillo, X A. Grandone, and X R. Conforti
ABSTRACTSUMMARY: Morning glory syndrome is characterized by a congenital optic disc defect that resembles the eponymous flower. Wepresent the MR imaging findings of 2 pediatric patients with morning glory disc anomaly and persisting embryonal infundibular recess,another rare malformative finding, a previously unreported association. Neuroradiologists should be aware of the possible presence of apersisting embryonal infundibular recess in patients with morning glory syndrome, to aid in the differential diagnosis including otherpituitary malformations such as pituitary stalk duplication.
ABBREVIATIONS: MGDA � morning glory disc anomaly; MGS � morning glory syndrome; PEIR � persisting embryonal infundibular recess
The morning glory disc anomaly (MGDA) is a rare, congenital
ocular defect diagnosed by fundoscopy. It is characterized
by a funnel-shaped macropapilla with central neuroglial rem-
nants, surrounded by an elevated, pigmented chorioretinal
ring, named after its resemblance to the morning glory
flower.1,2 While it is usually unilateral, bilateral MGDA may
occur.3 Even though it may be an isolated finding, it can pres-
ent in the context of a morning glory syndrome (MGS) when
associated with other congenital abnormalities, including
craniofacial, skull base, optic pathway, corpus callosum, vas-
cular, and pituitary ones.2,4
The embryonal infundibular recess is a funnel-shaped liquoral
space of the third ventricle floor extending into the pituitary stalk,
normally obliterated during development, whose persistence is
defined as persisting embryonal infundibular recess (PEIR). It has
been rarely reported5,6 and appears as an unusual expansion of
the third ventricle floor into the sella turcica with loss of the nor-
mal recess contours. At MR imaging, it appears as an intrasellar
cyst, communicating with the third ventricle. The sella turcica
may be expanded, and the pituitary gland is typically thinned
(empty sella).
We present 2 patients with fundoscopically confirmed MGDA
whose brain MR imaging showed several of the above-men-
tioned anomalies as well as a PEIR. The association between
MGDA and PEIR has not been reported currently, to the best
of our knowledge.
Case Series
Patient 1. This 3-year-old boy presented with short stature and
migraine. Fundoscopy revealed a MGDA of the right eye. Several
stimulus tests confirmed a complete growth hormone isolated
deficiency.
MR imaging showed hypophyseal hypoplasia (Fig 1) and a
stubby, thickened, and inferiorly dropped optic chiasm with
normal signal intensity (Fig 2). Sagittal images also showed a
dysmorphic hypothalamic infundibulum and pituitary stalk.
Indeed, there was a direct communication between the third
ventricle and the sellar cavity, suggesting a PEIR (Fig 1). The
acquisition of a constructive interference in steady state se-
quence confirmed this finding, better depicting a tubular mor-
phology of the pituitary stalk in the absence of sphenoidal
meningocele (Fig 1). The sella was mildly enlarged, and there
was clival hypoplasia. Additional findings included a corpus
callosum body and splenium partial agenesis and a small inter-
hemispheric arachnoid cyst (Fig 1).
Finally, bilateral supraclinoid ICA and M1 MCA segment
narrowing was detected on MRA, with thin collateral lenticu-
lostriate vessels, suggestive of Moyamoya syndrome (Fig 3).
Due to these findings and the history of headache, a DSC PWI
study was performed, indicating a preserved cerebrovascular
reserve capacity.
Received October 22, 2018; accepted after revision January 14, 2019.
From the Department of Advanced Biomedical Sciences (A.D., L.U., R. Cuocolo),University of Naples “Federico II,” Naples, Italy; and Dipartimento di Scienze Medi-che, Chirurgiche, Neurologiche (M.C.), Metaboliche e dell’Invecchiamento, Diparti-mento della Donna (A.G.), del Bambino e di Chirurgia Generale e Specialistica, andDipartimento di Medicina di Precisione (R. Conforti), University of Campania “LuigiVanvitelli,” Naples, Italy.
Please address correspondence to Renato Cuocolo, MD, Department of AdvancedBiomedical Sciences, University of Naples “Federico II”, Via S. Pansini 5, 80131, Na-ples, Italy; e-mail: [email protected]; @renatocuocolo
http://dx.doi.org/10.3174/ajnr.A6005
AJNR Am J Neuroradiol 40:899 –902 May 2019 www.ajnr.org 899
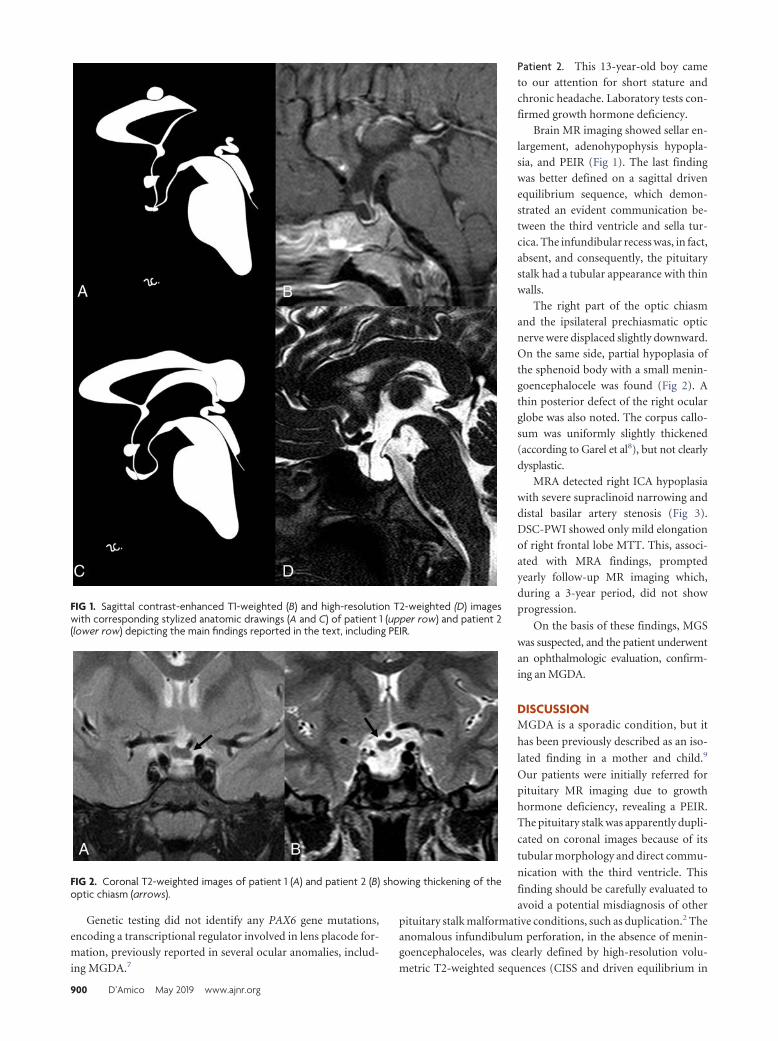
Genetic testing did not identify any PAX6 gene mutations,
encoding a transcriptional regulator involved in lens placode for-
mation, previously reported in several ocular anomalies, includ-
ing MGDA.7
Patient 2. This 13-year-old boy came
to our attention for short stature and
chronic headache. Laboratory tests con-
firmed growth hormone deficiency.
Brain MR imaging showed sellar en-
largement, adenohypophysis hypopla-
sia, and PEIR (Fig 1). The last finding
was better defined on a sagittal driven
equilibrium sequence, which demon-
strated an evident communication be-
tween the third ventricle and sella tur-
cica. The infundibular recess was, in fact,
absent, and consequently, the pituitary
stalk had a tubular appearance with thin
walls.
The right part of the optic chiasm
and the ipsilateral prechiasmatic optic
nerve were displaced slightly downward.
On the same side, partial hypoplasia of
the sphenoid body with a small menin-
goencephalocele was found (Fig 2). A
thin posterior defect of the right ocular
globe was also noted. The corpus callo-
sum was uniformly slightly thickened
(according to Garel et al8), but not clearly
dysplastic.
MRA detected right ICA hypoplasia
with severe supraclinoid narrowing and
distal basilar artery stenosis (Fig 3).
DSC-PWI showed only mild elongation
of right frontal lobe MTT. This, associ-
ated with MRA findings, prompted
yearly follow-up MR imaging which,
during a 3-year period, did not show
progression.
On the basis of these findings, MGS
was suspected, and the patient underwent
an ophthalmologic evaluation, confirm-
ing an MGDA.
DISCUSSIONMGDA is a sporadic condition, but it
has been previously described as an iso-
lated finding in a mother and child.9
Our patients were initially referred for
pituitary MR imaging due to growth
hormone deficiency, revealing a PEIR.
The pituitary stalk was apparently dupli-
cated on coronal images because of its
tubular morphology and direct commu-
nication with the third ventricle. This
finding should be carefully evaluated to
avoid a potential misdiagnosis of other
pituitary stalk malformative conditions, such as duplication.2 Theanomalous infundibulum perforation, in the absence of menin-goencephaloceles, was clearly defined by high-resolution volu-
metric T2-weighted sequences (CISS and driven equilibrium in
FIG 1. Sagittal contrast-enhanced T1-weighted (B) and high-resolution T2-weighted (D) imageswith corresponding stylized anatomic drawings (A and C) of patient 1 (upper row) and patient 2(lower row) depicting the main findings reported in the text, including PEIR.
FIG 2. Coronal T2-weighted images of patient 1 (A) and patient 2 (B) showing thickening of theoptic chiasm (arrows).
900 D’Amico May 2019 www.ajnr.org

our cases). To the best of our knowledge, among reported MGDA
cases in the literature, none had associated PEIR.
Among the possible midline abnormalities reported in MGS,
there is the craniopharyngeal canal, not present in our patients.10
It represents a rare, well-corticated midline channel of the sphe-
noid body that develops from the sellar floor to the nasopharynx.
Its origin has been hypothesized from incomplete closure of
the Rathke pouch, the precursor of the adenohypophysis. This
entity can be variably associated with encephalocele and hy-
popituitarism, most likely due to ectopic adenohypophysis and
even tumors (gliomas, dermoids, teratomas, craniopharyngi-
omas, or adenomas).11
Both of our patients had chiasmatic abnormalities with thick-
ening and inferior drooping. On the basis of our experience and
the lack of progression on follow-up imaging, we agree with
Doneda et al12 on the dysplastic and not neoplastic nature of
the chiasmal thickening. In our second patient, in the absence
of sellar floor defects, chiasmatic prolapse was related to ipsi-
lateral sphenoidal hypoplasia, which could be considered the
less severe form of a sphenoid malformative spectrum ending
with a meningoencephalocele.
While corpus callosum partial agenesis has already been de-
scribed in MGS,2 global thickening, as observed in the second
case, though in the absence of dysmorphisms or psychomotor
delay, has never been reported.
Intracranial vascular abnormalities in MGS, not necessarily
ipsilateral to the optic disc anomaly, could be due to the close
relationship of the ICA and optic vesicle development during the
fourth week of gestation.1,4,12 Arterial involvement, most com-
monly affecting the anterior circulation, ranges from mild hyp-
oplasia to focal stenosis or complete agenesis and progressive
Moyamoya syndrome.3,13 Arterial alterations in our patients were
not associated with cerebrovascular reserve impairment. While it
is not possible to completely exclude Moyamoya syndrome with-
out more prolonged monitoring, we believe a nonprogressive ar-
terial dysplasia is a more probable diagnosis. We recommend PWI
in addition to MRA and follow-up for MGS-associated vascu-
lopathy evaluation.
CONCLUSIONSWhile different craniofacial, pituitary, optic, vascular, and cere-
bral midline anomalies have been previously reported in associa-
tion with MGDA, our patients are the first in whom PEIR has also
been found. Neuroradiologists should be aware of the possible
presence of PEIR in patients with MGS, to aid in the differential
diagnosis including other pituitary malformations such as pitu-
itary stalk duplication. We also suggest the use of high-resolution
T2-weighted sequences on the sagittal plane to better define the
infundibulum in case of abnormalities.
ACKNOWLEDGMENTSThe authors thank Rosanna Cianniello for the anatomic drawings.
REFERENCES1. Thoma D, Nijs I, Demaerel P, et al. Morning glory disc anomaly with
an ipsilateral enlargement of the optic nerve pathway. Eur J PaediatrNeurol 2017;21:787–791 CrossRef Medline
2. Kalra VB, Gilbert JW, Levin F, et al. Spectrum of MRI findings inmorning glory syndrome. Neurographics 2014;4:56 – 60 CrossRef
3. Nezzar H, Mbekeani JN, Dalens H. Morning glory syndrome withcarotid and middle cerebral artery vasculopathy. Optom Vis Sci2015;92:e437– 41 CrossRef Medline
4. Ellika S, Robson CD, Heidary G, et al. Morning glory disc anomaly:characteristic MR imaging findings. AJNR Am J Neuroradiol 2013;34:2010 –14 CrossRef Medline
5. Steno A, Popp AJ, Wolfsberger S, et al. Persisting embryonal in-fundibular recess. J Neurosurg 2009;110:359 – 62 CrossRef Medline
6. Belotti F, Lupi I, Cosottini M, et al. Persisting embryonal infundib-ular recess (PEIR): two case reports and systematic literature re-view. J Clin Endocrinol Metab 2018;103:2424 –29 CrossRef Medline
7. Azuma N, Yamaguchi Y, Handa H, et al. Mutations of the PAX6 genedetected in patients with a variety of optic-nerve malformations.Am J Hum Genet 2003;72:1565–70 CrossRef Medline
8. Garel C, Cont I, Alberti C, et al. Biometry of the corpus callosum inchildren: MR imaging reference data. AJNR Am J Neuroradiol 2011;32:1436 – 43 CrossRef Medline
9. Nagy V, Kettesy B, Toth K, et al. Morning glory syndrome: a clinicalstudy of two cases [in German]. Klin Monbl Augenheilkd 2002;219:801– 05 CrossRef Medline
10. Kasim N, Choudhri A, Alemzadeh R. Craniopharyngeal canal,morning glory disc anomaly and hypopituitarism: what do they
FIG 3. MR angiography. Patient 1 (A and C) has bilateral focal stenoses of the internal carotid arteries (arrows) with thin collateral vessels in thelenticulostriate regions (dashed circles). Patient 2 shows unilateral stenosis of the right internal carotid (B) and basilar (D) arteries (arrows).
AJNR Am J Neuroradiol 40:899 –902 May 2019 www.ajnr.org 901

have in common? Oxf Med Case Reports 2018;2018:omy018 CrossRefMedline
11. Abele TA, Salzman KL, Harnsberger HR, et al. Craniopharyngealcanal and its spectrum of pathology. AJNR Am J Neuroradiol 2014;35:772–77 CrossRef Medline
12. Doneda C, Pinelli L, Scaramuzzi M, et al. Morning glory disc anom-
aly associated with ipsilateral optic nerve and chiasm thickening:three cases and review of the literature. Neuropediatrics 2017;48:463– 66 CrossRef Medline
13. Lenhart PD, Lambert SR, Newman NJ, et al. Intracranial vascularanomalies in patients with morning glory disk anomaly. Am J Oph-thalmol 2006;142:644 –50 CrossRef Medline
902 D’Amico May 2019 www.ajnr.org

CLINICAL REPORTPEDIATRICS
Oculodentodigital Dysplasia: A HypomyelinatingLeukodystrophy with a Characteristic MRI Pattern of Brain
Stem InvolvementX I. Harting, X S. Karch, X U. Moog, X A. Seitz, X P.J.W. Pouwels, and X N.I. Wolf
ABSTRACTSUMMARY: Oculodentodigital dysplasia, a rare genetic disorder caused by mutations in the gene encoding gap junction protein 1,classically presents with typical facial features, dental and ocular anomalies, and syndactyly. Oligosymptomatic patients are common anddifficult to recognize, in particular if syndactyly is absent. Neurologic manifestation occurs in approximately 30% of patients, and leuko-dystrophy or T2 hypointensity of gray matter structures or both have been noted in individual patients. To investigate MR imaging changesin oculodentodigital dysplasia, we retrospectively and systematically reviewed 12 MRIs from 6 genetically confirmed patients. Diffusesupratentorial hypomyelination, T2-hypointense Rolandic and primary visual cortex, and symmetric involvement of middle cerebellarpeduncle, pyramidal tract, and medial lemniscus was present in all, T2-hypointense pallidum and dentate nucleus in 2 patients each. Thisconsistent, characteristic pattern of diffuse supratentorial hypomyelination and brain stem involvement differs from other hypomyeli-nating and nonhypomyelinating leukodystrophies with brain stem involvement, and its recognition should trigger genetic testing foroculodentodigital dysplasia.
ABBREVIATIONS: NAWM � normal appearing white matter; ODDD � oculodentodigital dysplasia
Oculodentodigital dysplasia (ODDD) is a rare genetic disor-
der caused by mutations in the gene encoding gap junction
protein 1, also called Connexin 43 (GJA1; Online Mendelian In-
heritance in Man Nos. 164200 and 257850). Patients show typical
facial features including a narrow nose, hypoplastic alae nasi,
short palpebral fissures, and epicanthal folds (92% of pa-
tients). Ocular, in particular anterior chamber, anomalies, and
dental involvement, namely microdontia and enamel hypopla-
sia (approximately 70%), as well as syndactyly of fourth and
fifth finger (in 80%) are common.1 Neurologic manifestations
occur in approximately 30% of patients, including spastic
paraparesis, prominent urinary incontinence, ataxia, dysar-
thria, seizures, and, infrequently, developmental delay or mild
intellectual disability.1,2
Beighton et al3 first reported CT with calcification of the basal
ganglia in patients with ODDD in 1979. T2 hypointensity of deep
gray matter structures and supratentorial cortical regions (eg, the
central region) was subsequently reported for individual patients
examined with MR imaging. Diffuse T2 hyperintensity of supra-
tentorial white matter has been observed in individual cases,
brainstem involvement in three.4-6 Having noted brain stem in-
volvement in our patients, we retrospectively reviewed cranial
MR imaging, including 1H-MR spectroscopy and DWI, of 6
genetically confirmed patients with MR imaging seen at our
institutions to investigate the pattern of MR imaging changes
in ODDD.
MATERIALS AND METHODSWe retrospectively identified 6 patients with ODDD from 4 families
with previous MR imaging who were diagnosed and/or followed at
University Hospital Heidelberg and VU University Medical Center
and Amsterdam Neuroscience. Their 12 cranial MRI scans (age at
examination, 5–52 years; mean/median, 25.9/18.7 years) were sys-
tematically reviewed in consensus by a neuroradiologist (I.H.) and
pediatric neurologist (N.I.W.), each with �15 years of experience in
assessing white matter diseases. The study was approved by Heidel-
berg University (S-760/2018). Axial T2WI and T1WI were available
for all 12 MRI scans, and sagittal T1WI/T2WI and DWI with ADC,
for at least 1 MRI per patient (11/12 and 9/12 MRIs, respectively).
MR imaging was assessed for the extent of T2WI white matter
Received December 7, 2018; accepted after revision March 12, 2019.
From the Department of Neuroradiology (I.H., A.S.) and Centre for Child and Ado-lescent Medicine (S.K.), Clinic I, Division of Neuropaediatrics and Metabolic Medi-cine, University Hospital Heidelberg, Heidelberg, Germany; Institute of HumanGenetics (U.M.), Heidelberg University, Heidelberg, Germany; and Departments ofRadiology and Nuclear Medicine (P.J.W.P.) and Child Neurology (N.I.W.), VU Univer-sity Medical Center and Amsterdam Neuroscience, Amsterdam, the Netherlands.
Please address correspondence to Inga Harting, MD, Department of Neuroradiol-ogy, University of Heidelberg Medical Center, Im Neuenheimer Feld, 400, D-69120Heidelberg, Germany; e-mail: [email protected]
Indicates article with on-line tables.
Indicates article with supplemental on-line photos.
http://dx.doi.org/10.3174/ajnr.A6051
AJNR Am J Neuroradiol 40:903– 07 May 2019 www.ajnr.org 903

changes (focal/diffuse), corresponding T1WI signal changes, and in-
volvement of specific white matter structures, namely the corpus cal-
losum, anterior and posterior limbs of the internal capsule, pyrami-
dal tract, brain stem tracts, and cerebellar peduncles. The central
region and primary visual cortex, pallidum, thalamus, substantia
nigra, red nucleus, and dentate nucleus were visually compared with
normal-appearing white matter (NAWM) and with contrast in age-
matched controls.
Gradient-echo T2* and SWI, available for 4 patients (6 MRIs:
patient 1 [last MRI], patient 2, patient 5, patient 6), were checked for
T2* hypointensities due to calcifications and were compared with
contrast in age-matched controls. DWI and ADC maps were
inspected for areas of altered diffusion compared with sur-
rounding NAWM or gray matter. Quantitative 1H-MR spec-
troscopy of the supratentorial white matter was acquired in all
patients (point-resolved spectroscopy sequence or STEAM lo-
calization, TE � 20 –35 ms). Metabolite values were quantified
using LCModel (http://www.lcmodel.com/),7 compared with
control values for each scanner,8-10 and graded as normal
(within the mean � 1 SD of controls), high/low-to-normal
(differing by 1–2 SDs from the mean of controls), and high/low
(above/below the mean � 2 SDs).
PatientsDiagnosis was confirmed by mutation analysis of GJA1 in all pa-
tients; genetic and MR imaging findings are summarized in On-
line Table 1.
Patient 1 had had correction of bilat-
eral syndactyly of D IV and V at 9
months and was evaluated for action
and intention tremor at 4 years of age.
He also showed myopia, astigmatism,
and hypodontia. His father (patient 5),
older sister, paternal uncle, and grand-
mother (no MRIs) also had syndactyly
of D IV and V partly in association with
ocular and dental findings. Patients 2
and 6, adolescent daughter and mother,
had bilateral syndactyly corrected in
childhood; spastic paraparesis and uri-
nary incontinence had developed in the
mother in her mid-30s.11,12 Patient 3
had mild motor delay. At 6 years of age,
neurogenic bladder was diagnosed with
secondary incontinence and frequent
bouts of cystitis. Neurologic examina-
tion revealed mild spasticity and poste-
rior column signs. Patient 4 had syndac-
tyly of D IV and V of her right hand. She
had normal motor milestones but was
always clumsy. Motor symptoms be-
came more prominent around 40 years
of age with mild spastic paraparesis,
ataxia, and posterior column signs on
examination. She also developed neuro-
genic bladder. Optic discs were pale,
pursuit movements saccadic.
MR ImagingAll patients had diffuse, mild T2 hyperintensity of the supraten-
torial white matter with normal T1 signal, characteristic of hy-
pomyelination (Fig 1 and On-line Fig 1). Three patients had
additional, focally more pronounced T2 hyperintensity with cor-
responding T1 hypointensity. The corpus callosum was involved
in all patients, varying from T2 hyperintensity of the lateral sp-
lenium in the last MR imaging of patient 1 at 8.9 years of age to an
entirely T2 hyperintense corpus callosum (patient 4). On sagittal
images, the corpus callosum was thin in patients 2– 6. The poste-
rior limb of the internal capsule was T2 hyperintense in all pa-
tients and MRIs, while the anterior limb was normal in the young-
est 2 and was involved to a varying extent in the older 4 patients.
The younger 3 patients imaged within the first 2 decades had some
subcortical NAWM, while this was scarce (patient 5) or absent
(patients 4 and 6) in the older patients imaged at 41–52 years of
age (On-line Fig 1).
Infratentorially, all patients had T2 hyperintensity of the pon-
tine pyramidal tract, medial lemniscus, raphe, and middle cere-
bellar peduncles, as well as a small, triangular T2 hyperintensity in
the lateral pons with its base at the anterolateral pons, located
medial to the entry zone, and an intraparenchymal course of the
trigeminal nerve, consistent with the anterolateral portion of the
middle cerebellar peduncle within the pons. T2 hyperintensity
resulted in a typical pattern of signal changes at the level of the
pons (Fig 2). In the youngest patient, the pontine pyramidal tract
FIG 1. MR imaging pattern of ODDD. Mild, diffuse T2 hyperintensity of the supratentorial whitematter (B–D) and normal T1 signal (E) characteristic of hypomyelination in patient 1 with involve-ment of the posterior limb of the internal capsule (B), lateral splenium (C), and typical brain stemtract involvement at the level of the pons (A). Note T2 hypointensity of the Rolandic cortexcompared with subcortical NAWM (arrows) of the medial and superior frontal gyri (B–D) and ofthe primary visual cortex compared with the anterior limb of the internal capsule, genu, andsubcortical frontal NAWM (B and C). The craniocervical junction is normal (F). For an overview ofMR imaging changes of all patients see On-line Fig 1.
904 Harting May 2019 www.ajnr.org

only became clearly T2 hyperintense at 7.5 years of age; in patients
3 and 4, the T2 hyperintensity extended into the pyramis. Incon-
sistently involved infratentorial white matter structures were the
inferior cerebellar peduncle, superior cerebellar peduncle, and
decussation of superior cerebellar peduncles (n � 2, 1, and 1,
respectively; On-line Fig 2).
The Rolandic and primary visual cortices appeared abnor-
mally T2 hypointense, in patient 1 with hypo- instead of hyperin-
tensity to NAWM visible in the same slice (Fig 1B, D) but without
corresponding T2* hypointensity in the 4 patients with T2*/SWI.
Due to white matter hyperintensity, the deep gray matter gener-
ally appeared relatively T2 hypointense. Compared with age-
matched controls, however, only the pallidum (patients 2 and 6)
and dentate nucleus (patients 3 and 5) were more T2 hypointense
in 2 patients each, the pallidum with corresponding T2* hypoin-
tensity in both, T1 hyperintensity in patient 2 (On-line Fig 2), and
the dentate without corresponding hypointensity in patient 5
with T2*WI.
DWI did not reveal areas of restricted diffusion. Although in
some patients, the ADC was slightly increased in affected white mat-
ter areas, this was not very prominent. The craniocervical junction
was depicted on sagittal images at least once in all patients, without
evidence of stenosis or compression of the medulla.
White matter 1H-MR spectroscopy findings were normal in
patient 3. In the other 5 patients, Cr was high or high-to-normal;
mIns was high, high-to-normal, or normal; NAA was normal or
low-to-normal; and Cho was normal, low-to-normal, or low.
These findings resulted in low or low-to-normal metabolite ratios
of Cho/Cr and NAA/Cr, consistent with
hypomyelination (On-line Table 2).
Lactate was not detected, and thus was
normal.
DISCUSSIONWhile syndactyly in combination with
typical facial features suggests ODDD,
oligosymptomatic patients are com-
mon and – in particular if syndactyly is
absent – difficult to recognize. Usually
only patients with neurologic presen-
tation, occurring in approximately
30%, will be referred for cranial MR
imaging. In individual patients with MR
imaging previously reported, white matter
changes have commonly been ob-
served,2,4-6,13-25 including brain stem in-
volvement in 34-6 and, less commonly, T2
hypointensity of cortical or deep gray mat-
ter structures.2,5,6,14-16,22,23 As yet, there
are no histopathologic data.
The pattern of brain structures in-
volved in leukodystrophies has been
shown to be highly specific and effective
for a differential diagnosis using a prac-
tical diagnostic algorithm, with differen-
tiation between hypomyelinating and
nonhypomyelinating leukodystrophies
as the first discriminator.26 Hypomyelination is characterized by
moderate T2 hyperintensity, less bright than in nonhypomyeli-
nating leukodystrophies, eg, demyelination or vacuolation. T1
signal depends on the amount of myelin deposited and is often
normal or otherwise iso- or mildly hypointense.26,27 On 1H-MR
spectroscopy, elevated Cr and mIns in combination with normal
or near-normal NAA, low (-normal) NAA/Cr, and low (-normal)
Cho are typical.8,9
In all MRIs of our patients, supratentorial white matter
changes were characteristic of hypomyelination and accompanied
by typical 1H-MR spectroscopy findings in 5 of 6. Three patients
imaged during late adolescence and adulthood had foci of more
pronounced white matter changes consistent with small areas of
secondary degeneration with loss of myelin and astrogliosis.
Scarce or absent subcortical NAWM and involvement of the an-
terior limb of internal capsule only in the 3 oldest patients suggest
progression of white matter changes with time as does extension
of pyramidal tract hyperintensity from the mesencephalon to the
pons during follow-up in the youngest patient.
Hypomyelinating leukodystrophies can be differentiated
on the basis of additional, characteristic MR findings, eg, as in
hypomyelination with atrophy of basal ganglia and cerebellum
(H-ABC) or by the presence of non-neurological features, e.g.
congenital cataract in hypomyelination with congenital cata-
ract (HCC), hypodontia and/or delayed puberty in 4H syn-
drome, or syndactyly in ODDD.27 However, systemic manifes-
tations are not obligatory and therefore may not be present in
all patients, as seen in patient 3 who presented with mild spas-
FIG 2. Pattern of brain stem tract involvement. T2WI at the level of the pons demonstratescharacteristic involvement of the pyramidal tract (1), lemniscus medialis (2, black arrow), raphepontis (3, black arrow), middle cerebellar peduncle (4), and the triangular lateral pontine T2hyperintensity consistent with the anterior course of the pontocerebellar fibers forming themiddle cerebellar peduncle (5); schematic representation of tracts is given in inset in A 2, 3 inblack. A, Patient 1, B, patient 2, C, patient 3, D, patient 4, E, patient 5, F, patient 6. Field strength is3T in patient 3; otherwise, it is 1.5T. Images are from the last scan from patients with multiple scans.
AJNR Am J Neuroradiol 40:903– 07 May 2019 www.ajnr.org 905

ticity, sensory deficit, and neurogenic bladder but without syn-
dactyly. Even within families, signs and symptoms may vary.1
Notably, all our patients, irrespective of the presence or ab-
sence of neurologic manifestation or syndactyly, had a charac-
teristic pattern of brain stem tract involvement in addition to
supratentorial hypomyelination, which differed from other
hypomyelinating leukodystrophies with brain stem involve-
ment. In Pelizaeus-Merzbacher-like disease, there is promi-
nent T2 hyperintensity of the basis pontis, not always restricted
to the pyramidal tract28; in 4H syndrome the medial lemniscus
is relatively spared29; in hypomyelination of early myelinating
structures30 the medulla oblongata and caudal pons are more
extensively involved than in ODDD; moreover, none of these
disorders involve the middle cerebellar peduncles. Whereas
hypomyelination with brain stem and spinal cord involvement
and leg spasticity31 involves the medial lemniscus and pyrami-
dal tract similar to ODDD, the inferior and superior but not
middle cerebellar peduncles are T2 hyperintense.
When using prominent brain stem involvement as a start-
ing point of an MR imaging– based differential diagnosis,
ODDD must also be differentiated from 3 nonhypomyelinat-
ing leukodystrophies: Brain stem involvement is similar in au-
tosomal dominant leukodystrophy related to duplication of
the lamin B1 gene,32 but supratentorial white matter changes
are more T2 hyperintense, not consistent with hypomyelina-
tion, and tend to spare a periventricular rim. T2 hyperintensity
of the middle cerebellar peduncles in fragile X premutation
carriers is combined with T2 hyperintensity of the deep cere-
bellar white matter, while the medial lemniscus and pyramidal
tract are not affected.33 Leukoencephalopathy with brain stem
and spinal cord involvement and lactate elevation34 involves
the medial lemniscus and pyramidal tract, inferior and supe-
rior, but not the middle cerebellar peduncle and again differs
by much more prominent supratentorial T2 hyperintensity not
consistent with hypomyelination.
It has previously been noted that patients with ODDD imaged
in the first decade may have MR imaging changes despite the
absence of neurologic symptoms.1 Similarly, all 6 patients had
extensive pyramidal tract involvement and involvement of the
medial lemniscus on MR imaging, irrespective of the presence of
spasticity or impaired sensibility. Compression of the medulla at
the craniocervical junction, as initially suggested due to a hyper-
ostotic skull base,3 was not confirmed on MR imaging, either in
later reports or in our patients.
Earlier reports also noted calcifications of the basal ganglia,
which are a likely correlate of the T2 hypointensity reported in the
literature5,6,14-16,23 and of pallidal T2/T2* hypointensity in pa-
tients 2 and 6, though we cannot exclude abnormal iron accumu-
lation as previously suggested.6 Consistent with previous reports,
the Rolandic and primary visual cortices appeared abnormally T2
hypointense, however without corresponding T2* hypointensity
and, therefore, not suggestive of either calcification or abnormal
brain iron accumulation.
CONCLUSIONSBrain imaging in 6 patients from 4 families with genetically con-
firmed ODDD shows a characteristic MR imaging pattern of
brain stem tract involvement, consisting of the middle cerebellar
peduncle, pyramidal tract, and medial lemniscus in combination
with diffuse, supratentorial hypomyelination. Recognition of this
pattern should trigger genetic evaluation of undiagnosed patients
and thereby shorten the diagnostic process.
REFERENCES1. Paznekas W, Karczeski B, Vermeer S, et al. GJA1 mutations, variants,
and connexin 43 dysfunction as it relates to the oculodentodigitaldysplasia phenotype. Hum Mutat 2009;30:724 –33 CrossRef Medline
2. Loddenkemper T, Grote K, Evers S, et al. Neurological manifesta-tions of the oculodentodigital dysplasia syndrome. J Neurol 2002;249:584 –95 CrossRef Medline
3. Beighton P, Hamersma H, Raad M. Oculodento-osseous dysplasia:heterogeneity or variable expression? Clin Genet 1979;16:169 –77Medline
4. Park KW, Ryu HS, Kim J, et al. Oculodentodigital dysplasia present-ing as spastic paraparesis: the first genetically confirmed Koreancase and a literature review. J Mov Disord 2017;10:149 –53 CrossRefMedline
5. Furuta N, Ikeda N, Hirayanagi K, et al. Novel GJA1 mutation inoculodentodigital dysplasia with progressive spastic paraplegiaand sensory deficits. Intern Med 2012;51:93–98 CrossRef Medline
6. Gutmann DH, Zackai EH, McDonald-McGinn DM, et al. Oculoden-todigital dysplasia syndrome associated with abnormal cerebralwhite matter. Am J Med Genet 1991;41:18 –20 CrossRef Medline
7. Provencher S. Estimation of metabolite concentrations from local-ized in vivo proton NMR spectra. Magn Reson Med 1993;30:672–79CrossRef Medline
8. van der Voorn JP, Pouwels PJ, Hart AA, et al. Childhood white matterdisorders: quantitative MR imaging and spectroscopy. Radiology 2006;241:510–17 CrossRef Medline
9. Steenweg ME, Wolf NI, van Wieringen WN, et al. Quantitative MRIin hypomyelinating disorders: correlation with motor handicap.Neurology 2016;87:752–58 CrossRef Medline
10. Harting I, Boy N, Heringer J, et al. (1)H-MRS in glutaric aciduriatype 1: impact of biochemical phenotype and age on the cerebralaccumulation of neurotoxic metabolites. J Inherit Metab Dis 2015;38:829 –38 CrossRef Medline
11. Thomsen M, Schneider U, Weber M, et al. The different appearanceof the oculodentodigital dysplasia syndrome. J Pediatr Orthop B1998;7:23–26 Medline
12. Wiest T, Herrmann O, Stogbauer F, et al. Clinical and genetic vari-ability of oculodentodigital dysplasia. Clin Genet 2006;70:71–72CrossRef Medline
13. Alao MJ, Bonneau D, Holder-Espinasse M, et al. Oculo-dento-digitaldysplasia: lack of genotype–phenotype correlation for GJA1 muta-tions and usefulness of neuro-imaging. Eur J Med Genet 2010;53:19 –22 CrossRef Medline
14. Ganos C, Munchau A, Holst B, et al. Teaching neuroimages: oculo-dentodigital dysplasia. Neurology 2012;79:e140 CrossRef Medline
15. Barzegar M, Sayadnasiri M, Tabrizi A. Epilepsy as a rare neurologicmanifestation of oculodentodigitalis dysplasia. Iran J Child Neurol2012;6:39 – 43 Medline
16. Ginsberg LE, Jewett T, Grub R, et al. Oculodental digital dysplasia:neuroimaging in a kindred. Neuroradiology 1996;38:84 – 86 CrossRefMedline
17. Jamsheer A, Badura-Stronka M, Sowinska A, et al. A severe progres-sive oculodentodigital dysplasia due to compound heterozygousGJA1 mutation. Clin Genet 2010;78:94 –97 CrossRef Medline
18. Norton K, Carey J, Gutmann D. Oculodentodigital dysplasia withcerebral white matter abnormalities in a two-generation family.Am J Med Genet 1995;57:458 – 61 CrossRef Medline
19. Shapiro R, Griffin J, Stine O. Evidence for genetic anticipation in theoculodentodigital syndrome. Am J Med Genet 1997;71:36 – 41CrossRef Medline
20. Stanislaw CL, Narvaez C, Rogers RG, et al. Oculodentodigital dys-
906 Harting May 2019 www.ajnr.org

plasia with cerebral white matter abnormalities: an additional case.Proc Greenwood Genet Center 1998;17:20 –24
21. van Es RJ, Wittebol-Post D, Beemer FA. Oculodentodigital dysplasiawith mandibular retrognathism and absence of syndactyly: a casereport with a novel mutation in the connexin 43 gene. Int J OralMaxillofac Surg 2007;36:858 – 60 CrossRef Medline
22. Amador C, Mathews AM, Del Carmen Montoya M, et al. Expandingthe neurologic phenotype of oculodentodigital dysplasia in a 4-gen-eration Hispanic family. J Child Neurol 2008;23:901– 05 CrossRefMedline
23. Schrander-Stumpel C, Franke C. Central nervous system abnormal-ities in oculodentodigital dysplasia. Genet Counsel 1996;7:233–35
24. Kogame T, Dainichi T, Shimomura Y, et al. Palmoplantar keratosisin oculodentodigital dysplasia with a GJA1 point mutation out ofthe C-terminal region of connexin 43. J Dermatol 2014;41:1095–97CrossRef Medline
25. Tumminelli G, Di Donato I, Guida V, et al. Oculodentodigital dys-plasia with massive brain calcification and a new mutation of GJA1gene. J Alzheimers Dis 2016;49:27–30 CrossRef Medline
26. Schiffmann R, van der Knaap M. Invited article: an MRI-based ap-proach to the diagnosis of white matter disorders. Neurology 2009;72:750 –59 CrossRef Medline
27. Pouwels PJ, Vanderver A, Bernard G, et al. Hypomyelinatingleukodystrophies: translational research progress and prospects.Ann Neurol 2014;76:5–19 CrossRef Medline
28. Biancheri R, Rosano C, Denegri L, et al. Expanded spectrum of Pel-izaeus-Merzbacher-like disease: literature revision and descriptionof a novel GJC2 mutation in an unusually severe form. Eur J HumGenet 2013;21:34 –39 CrossRef Medline
29. Cayami FK, Bugiani M, Pouwels PJ, et al. 4H leukodystrophy: les-sons from 3T imaging. Neuropediatrics 2018;49:112–17 CrossRefMedline
30. Steenweg ME, Wolf NI, Schieving JH, et al. Novel hypomyelinatingleukoencephalopathy affecting early myelinating structures. ArchNeurol 2012;69:125–28 CrossRef Medline
31. Taft RJ, Vanderver A, Leventer RJ, et al. Mutations in DARS causehypomyelination with brain stem and spinal cord involvementand leg spasticity. Am J Hum Genet 2013;92:774 – 80 CrossRefMedline
32. Dos Santos MM, Grond-Ginsbach C, Aksay SS, et al. Adult-onsetautosomal dominant leukodystrophy due to LMNB1 gene duplica-tion. J Neurol 2012;259:579 – 81 CrossRef Medline
33. Brunberg JA, Jacquemont S, Hagerman RJ, et al. Fragile X premuta-tion carriers: characteristic MR imaging findings of adult male pa-tients with progressive cerebellar and cognitive dysfunction. AJNRAm J Neuroradiol 2002;23:1757– 66 Medline
34. Scheper GC, van der Klok T, van Andel RJ, et al. Mitochondrialaspartyl-tRNA synthetase deficiency causes leukoencephalopathywith brain stem and spinal cord involvement and lactate elevation.Nat Genet 2007;39:534 –39 CrossRef Medline
AJNR Am J Neuroradiol 40:903– 07 May 2019 www.ajnr.org 907

ORIGINAL RESEARCHSPINE
Lumbar Spinal Stenosis Severity by CT or MRI Does NotPredict Response to Epidural Corticosteroid versus
Lidocaine InjectionsX F.A. Perez, X S. Quinet, X J.G. Jarvik, X Q.T. Nguyen, X E. Aghayev, X D. Jitjai, X W.D. Hwang, X E.R. Jarvik, X S.S. Nedeljkovic,
X A.L. Avins, X J.M. Schwalb, X F.E. Diehn, X C.J. Standaert, X D.R. Nerenz, X T. Annaswamy, X Z. Bauer, X D. Haynor,X P.J. Heagerty, and X J.L. Friedly
ABSTRACT
BACKGROUND AND PURPOSE: Epidural steroid injections may offer little-to-no short-term benefit in the overall population of patientswith symptomatic spinal stenosis compared with lidocaine alone. We investigated whether imaging could identify subgroups of patientswho might benefit most.
MATERIALS AND METHODS: A secondary analysis of the Lumbar Epidural Steroid Injections for Spinal Stenosis prospective, double-blindtrial was performed, and patients were randomized to receive an epidural injection of lidocaine with or without corticosteroids. Patients(n � 350) were evaluated for qualitative and quantitative MR imaging or CT measures of lumbar spinal stenosis. The primary clinical endpoints were the Roland-Morris Disability Questionnaire and the leg pain numeric rating scale at 3 weeks following injection. ANCOVA wasused to assess the significance of interaction terms between imaging measures of spinal stenosis and injectate type on clinicalimprovement.
RESULTS: There was no difference in the improvement of disability or leg pain scores at 3 weeks between patients injected with epidurallidocaine alone compared with corticosteroid and lidocaine when accounting for the primary imaging measures of qualitative spinalstenosis assessment (interaction coefficients for disability score, �0.1; 95% CI, �1.3 to 1.2; P � .90; and for the leg pain score, 0.1; 95% CI,�0.6 to 0.8; P � .81) or the quantitative minimum thecal sac cross-sectional area (interaction coefficients for disability score, 0.01; 95% CI,�0.01 to 0.03; P � .40; and for the leg pain score, 0.01; 95% CI, �0.01 to 0.03; P � .33).
CONCLUSIONS: Imaging measures of spinal stenosis are not associated with differential clinical responses following epidural corticoste-roid injection.
ABBREVIATIONS: AP � anteroposterior; ESI � epidural steroid injection; ML � mediolateral; NRS � numeric rating scale; RDQ � Roland-Morris DisabilityQuestionnaire
Lumbar spinal stenosis is a common cause of low back pain,
radicular pain, and neurogenic claudication leading to disabil-
ity.1,2 Imaging for lumbar stenosis is controversial because there is
no consistent correlation between the severity of stenosis by im-
aging and the severity of symptoms.3-5
Spinal stenosis symptoms may, in part, be due to nerve root
inflammation and/or ischemia related to compression.6 Epidural
steroid injections (ESIs) are often used to reduce local inflamma-
Received January 24, 2019; accepted after revision March 19.
From the Department of Radiology (F.A.P., J.G.J., Q.T.N., D.H.), Comparative Effec-tiveness, Cost and Outcomes Research Center (J.G.J., P.J.H., J.L.F.), Departments ofNeurological Surgery (J.G.J.), Health Services (J.G.J.), Orthopedics and Sports Medi-cine (Q.T.N.), Biostatistics (P.J.H.), and Rehabilitation Medicine (J.L.F.), University ofWashington, Seattle, Washington; Department of Radiology (S.Q.), College of Wis-consin, Milwaukee, Wisconsin; Spinal Centre Division (E.A.), Schulthess Klinik, Zu-rich, Switzerland; Oregon Health Sciences University (D.J.) Portland, Oregon; TRAMedical Imaging (W.D.H.), Tacoma, Washington; University of Washington Medi-cine (E.R.J.), Seattle, Washington; Department of Anesthesiology, Perioperative andPain Medicine and Spine Unit (S.S.N.), Harvard Vanguard Medical Associates,Brigham and Women’s Hospital, Boston, Massachusetts; Division of Research(A.L.A.), Kaiser Permanente Northern California, Oakland, California; Department ofNeurosurgery (J.M.S., D.R.N.), Henry Ford Medical Group, Detroit, Michigan; De-partment of Radiology (F.E.D.), Mayo Clinic, Rochester, Minnesota; Department ofPhysical Medicine and Rehabilitation (C.J.S.), University of Pittsburgh School ofMedicine, Pittsburgh, Pennsylvania; Department of Physical Medicine and Rehabili-tation (T.A.), VA North Texas Healthcare System, Dallas, Texas; and Cancer and
Blood Disorders Center (Z.B.), Seattle Children’s Research Institute, Seattle,Washington.
This work was supported by the Agency for Healthcare Research and Quality(grants 1R01HS019222-01 and 1R01HS022972-01) and the Patient-Centered OutcomesResearch Institute (contract CE-12-11-4469).
Paper previously presented at: American Society of Neuroradiology Annual Meet-ing and the Foundation of the ASNR Symposium, April 25–30, 2015; Chicago, Illi-nois. “Qualitative Assessment of Lumbar Spinal Stenosis by CT and MRI: StenosisSeverity Does Not Predict Response to Epidural Glucocorticoid Injections.”
Please address correspondence to Janna L. Friedly, MD, Department of Rehabilita-tion Medicine, Comparative Effectiveness, Cost and Outcomes Research Center,University of Washington, Box 359859, Seattle, Washington 98104; e-mail:[email protected]
Indicates open access to non-subscribers at www.ajnr.org
Indicates article with supplemental on-line tables.
http://dx.doi.org/10.3174/ajnr.A6050
908 Perez May 2019 www.ajnr.org

tion and therefore improve lumbar spinal stenosis symptoms.7-9
Given the variable results with ESI, there is a need to understand
the patient, disease, and procedural factors associated with im-
proved outcomes. Patients with severe nerve root compression
due to disc herniation may be less likely to benefit from an ESI,
perhaps related to the predominance of mechanical compression
rather than inflammation.10 However, there is a lack of rigorous
data to determine whether imaging severity predicts the response
to ESI in lumbar central spinal stenosis.10-15 Prior studies exam-
ining the relationship between outcomes of ESI for spinal stenosis
and imaging severity have been small and uncontrolled, leading to
mixed results.
The Lumbar Epidural Steroid Injections for Spinal Stenosis
(LESS) multicenter, double-blind randomized trial found that
ESIs offered little-to-no short-term benefit compared with an
epidural injection of lidocaine alone.16 However, the primary
analysis of this study did not specifically assess whether imag-
ing spinal stenosis severity predicted a differential response to
injections of epidural corticosteroid and lidocaine versus lido-
caine alone.17
Our objective was to determine whether lumbar spine MR
imaging or CT measures of lumbar spinal stenosis severity pre-
dicted a response to epidural injection of corticosteroid and lido-
caine versus lidocaine alone. We hypothesized that patients with
less severe central stenosis, in which inflammation may play a
larger role than mechanical compression, would have a more fa-
vorable response to corticosteroid injections compared with
treatment with lidocaine alone.
MATERIALS AND METHODSPatientsA secondary, retrospective analysis of patient data from the LESS
trial was performed (ClinicalTrials.gov identifier: NCT01238536).16,18
The study was Health Insurance Portability and Accountability
Act– compliant, we obtained institutional review board approval
at each of the 16 clinical sites in the United States, and patients
provided written informed consent. Detailed inclusion and exclu-
sion criteria and patient characteristics have been previously de-
scribed.16 Inclusion criteria were patients 50 years of age and older
with MR imaging or CT evidence of lumbar central spinal stenosis
assessed by an enrolling clinician; moderate-to-severe symptoms
consistent with neurogenic claudication with an average pain
numeric rating scale (NRS) of �5 (on a scale of 0 –10 with 0
indicating no pain and 10 indicating most severe pain) for pain
in the lower back, buttock, leg, or a combination of these sites
on standing, walking, or spinal extension in the past week; and
a score of �7 on the Roland-Morris Disability Questionnaire
(RDQ), in which scores range from 0 –24, with higher scores
indicating greater disability. Patients with a history of prior
lumbar surgery, ESI in the previous 6 months, or spondylolis-
thesis requiring surgery were excluded.
InterventionsPatients were randomized to receive an epidural injection of ei-
ther corticosteroid with lidocaine (n � 200) or lidocaine alone
(n � 200). Injections were performed by 26 board-certified anes-
thesiologists, physiatrists, and radiologists with ESI expertise and
trained to perform the injections using standardized techniques.
Study physicians and outcome assessors were blinded to the in-
jectate administered. Physicians chose either an interlaminar or
transforaminal injection approach based on clinical judgment
and experience because there remains uncertainty about the rel-
ative effectiveness. Interlaminar injections were performed 1 spi-
nal level below the maximal canal stenosis as determined by the
treating physician or, if not technically feasible, as close to the level
of maximal stenosis as possible. Interlaminar injections were not
performed at the level of maximum stenosis to avoid the theoretic
possibility of worsening thecal sac compression by the epidural
injectate, and a prior study has demonstrated consistently �1
spinal level of epidural injectate dispersal following interlaminar
injection.19 Transforaminal injections were performed at the
most symptomatic nerve root level and, in many cases, with mul-
tilevel and/or bilateral injections to optimize injectate delivery.20
Under fluoroscopic guidance, an 18- to 25-ga Quincke or Tuohy
spinal needle was used to inject 2 mL of 0.25%–1% lidocaine
followed by 1–3 mL of corticosteroid or 1–3 mL of 0.25%–1%
lidocaine. The volume, dose, and type of corticosteroid were de-
termined by the treating physician (60 –120 mg of methylpred-
nisolone; 6 –12 mg of betamethasone; 60 –120 mg of triamcino-
lone; or 8 –10 mg of dexamethasone). Additional injection
procedure details are available.16,18
Clinical OutcomesDetailed outcome measures for this trial have been previously
described.16 For the current analysis, the 2 predetermined pri-
mary outcomes were the RDQ and mean leg pain NRS at 3 weeks
following injection because the greatest clinical response to the
injection was observed at that time point in the LESS trial. Sec-
ondary clinical outcome measures included the following: RDQ
and leg pain NRS at 6 weeks postinjection; back pain NRS and
mean of leg and back pain NRS at 3 and 6 weeks postinjection;
and the Swiss Spinal Stenosis Questionnaire21 symptom sub-
scale (scores of 1–5, with higher scores indicating worse symp-
toms) and the physical function subscale (scores of 1– 4, with
higher scores indicating worse function) at 3 and 6 weeks
postinjection.
ImagingMR imaging studies included at least sagittal T1, sagittal T2, and
axial T2-weighted images; CT studies included at least axial soft-
tissue algorithm images. Analysis was limited to patients with
lumbar spine CT or MR imaging studies performed within 2 years
of study enrollment (350/400 enrolled patients). Imaging studies
were anonymized and reviewed on a PACS at the data-coordinat-
ing center for qualitative and quantitative measures of lumbar
central stenosis.
Qualitative Imaging Measures of Lumbar Central StenosisQualitative central stenosis was determined for all eligible patients
at each lumbar spine level on CT (41 studies) or MR imaging (309
studies) on the basis of the degree of central canal narrowing on
axial images relative to its expected normal cross-sectional area as
follows: 0 � normal, 1 � mild stenosis, less than or equal to
one-third loss of the expected normal area; 2 � moderate stenosis,
AJNR Am J Neuroradiol 40:908 –15 May 2019 www.ajnr.org 909

one-third to two-thirds loss of the expected normal area; 3 �
severe stenosis, more than two-thirds loss of the expected normal
area.22,23 For 308 of 309 patients with MR imaging studies, we
qualitatively assessed lumbar spine perineural CSF effacement at
each lumbar spine level as a secondary measure on axial T2 MR
imaging using the grading system of Lee et al24: 0 � normal, 1 �
mild, 2 � moderate, and 3 � severe (1 MR imaging study could
not be assessed on this measure due to missing axial T2 se-
quences). For each patient, we assessed up to 5 lumbar spine
levels qualitatively and derived several single-summary mea-
sures of overall spinal stenosis. The predetermined primary
qualitative imaging measure was the maximum qualitative
central stenosis grade representing the worst level of stenosis.
Other secondary measures included the maximum qualitative
CSF effacement score and the mean central stenosis and qual-
itative CSF effacement scores to represent the overall degree of
stenosis, taking into account the degree of stenosis at multiple
levels.
Two experienced imaging readers (W.D.H., a fellowship-
trained neuroradiologist with 5 years of experience; and Q.T.N., a
radiology physician assistant with 17 years of experience inter-
preting spinal imaging) performed qualitative imaging assess-
ment blinded to patient injectate and symptoms. Imaging studies
were randomly divided between the 2 readers for review. Seventy-
one studies were reviewed by both readers independently to assess
interrater reliability.
Quantitative Imaging Measures of Lumbar CentralStenosisWe excluded patients with CT studies from quantitative analysis
because we could not reliably determine these measurements on
CT. We performed quantitative analysis at each lumbar spinal
level for 304 of 309 patients who underwent MR imaging; due to
file-format limitations, cross-referencing of axial and sagittal im-
ages could not be performed for 5 patients.
The cross-sectional thecal sac area was measured at each inter-
vertebral level by tracing its outline with an ROI tool on axial T2
images. Because axial images were not always acquired parallel to
the intervertebral disc level and perpendicular to the spinal canal,
a correction factor was applied to each level by multiplying the
measured cross-sectional area by the cosine of the angle between
the axial images and a line parallel to the adjacent vertebral body
endplate. We measured the maximum anteroposterior (AP) and
mediolateral (ML) diameters of the thecal sac on axial T2 images,
and the AP thecal sac diameter was also determined for each lum-
bar intervertebral disc level using midline sagittal T2 images.
For each patient, readers quantitatively assessed up to 5 lum-
bar spine levels, and several single-summary measures of overall
spinal stenosis were derived. The predetermined primary quanti-
tative imaging measure was the minimum, angle-corrected, thecal
sac cross-sectional area representing the worst level of stenosis.
Other secondary measures included the mean of the angle-cor-
rected, thecal sac cross-sectional area (as a summary measure for
multilevel stenosis) as well as minimum and mean summary mea-
sures for each remaining measure (Table); non-angle-corrected
measures were also evaluated.
Five trained readers performed quantitative assessment
(F.A.P. and S.Q., fellowship-trained neuroradiologists both
with 5 years of experience; E.A., an orthopedic surgeon; D.J.
and E.R.J., undergraduate research assistants) blinded to pa-
tient injectate and symptoms. After training, the readers re-
viewed a verification set of 20 MR imaging studies or 100 lum-
bar spinal levels to evaluate reliability before beginning study
imaging review.
All imaging studies were then divided among the 5 trained
readers for review. Statistical analysis was performed using data
from a single reader per patient.
Statistical AnalysisData analysis was performed using R statistical and computing
software, Version 3.1.2 (http://www.r-project.org/).23
We evaluated the interrater agreement of qualitative assess-
ments of stenosis severity between the 2 experienced readers using
unweighted � analysis. For the quantitative imaging predictors,
interrater reliability was assessed among the 5 trained readers us-
ing an intraclass correlation coefficient analysis of the verification
imaging studies.
ANCOVA for each potential imaging predictor and each clin-
ical outcome was constructed with adjustments for the baseline
clinical measure value and patient recruitment site. The depen-
dent variable in each model was the clinical outcome measure.
Independent variables were injectate group (lidocaine alone ver-
sus corticosteroid and lidocaine) and the imaging measure of spi-
nal stenosis severity. The primary statistical analysis was whether
the effect of injectate type on a clinical outcome differed depend-
ing on an imaging measure of stenosis severity. This was assessed
by including an imaging measure by injectate type interaction
term in the model and evaluating the statistical significance with a
likelihood ratio test. For post hoc comparison testing, the Tukey
Honestly Significant Difference test was performed. For the pre-
defined analysis using primary imaging measures and primary
clinical end points, statistical significance was P � .05. For explor-
atory analysis of secondary measures, a predetermined statistical
significance threshold of P � .01 was used to minimize false
discoveries.
RESULTSPatientsThere were no statistically significant differences in baseline clin-
ical or imaging features between patients randomized to epidural
corticosteroid and lidocaine versus lidocaine alone injection in
the subset of patients included in this analysis (n � 350, Table).
Imaging studies were performed a median of 43 days from study
enrollment with an interquartile range of 132 days (Q1 � 20 days
and Q3 � 152 days). Seventy-four percent (260/350) of patients
had at least 1 lumbar spine level of moderate or severe stenosis,
and 50% (175/350) of patients had at least 1 lumbar spine level of
severe stenosis.
Epidural Injection Approach and LevelThe characteristics of epidural injections were similar between
treatment groups.
Sixty-eight percent (239/350) of patients had interlaminar in-
jections, and 32% (111/350) had transforaminal injections. For
910 Perez May 2019 www.ajnr.org

each injection approach, half of patients received epidural corti-
costeroid and lidocaine and half received lidocaine alone (Table).
Epidural injections were performed within 1 lumbar spinal level
of the qualitatively worst stenosis in 92% of patients (321/350; for
example, in a patient with a maximum stenosis at L5–S1, an in-
terlaminar epidural injection at L4 –L5 is 1 lumbar spinal level
away and a transforaminal epidural injection at L5 is a one-half
lumbar spinal level away). There was no difference in the mean
distance of epidural injection from the level of maximum stenosis
between treatment groups (Table, P � .72).
Interrater Agreement for Evaluation of Imaging StudiesFor the primary qualitative imaging measure of the worst level
of central stenosis (maximum qualitative central stenosis
score), there was 74% agreement among the 2 experienced
readers on a level-by-level basis (agreement in 261 of 355 lum-
bar spinal levels) with a � score of 0.72, consistent with sub-
stantial agreement.25 On a per-patient basis, using the maxi-
mum spinal stenosis score for each patient indicating the worst
level of stenosis, there was 86% agreement (61/71 patients)
between the 2 experienced readers with a � score of 0.84. For
the primary quantitative imaging measure of the angle-cor-
rected thecal sac cross-sectional area, there was excellent agree-
ment among the 5 trained readers with an intraclass correla-
tion coefficient of 0.91.26
Primary Imaging Measures as Predictors of Improvementin the RDQ Disability Score or Leg Pain NRS followingEpidural InjectionRegardless of the type of epidural injectate, study patients had an
average 3.4-point improvement in the RDQ disability score (95%
CI, �4.0 to �2.9; P � .0001) and an average 2.5-point improve-
ment in the leg pain NRS at 3 weeks (95% CI, �2.8 to �2.2; P �
.0001). Patients who received corticosteroid with lidocaine injec-
tions had a slightly greater improvement in the RDQ disability
score and leg pain NRS than patients injected with lidocaine alone
at 3 weeks (adjusted mean differences for the RDQ, �1.7 points;
95% CI, �2.8 to �0.7; P � .01; and for the leg pain NRS, �0.6
points; 95% CI, �1.2– 0; P � .05) similar to rates previously re-
ported.16 By means of the predetermined primary imaging mea-
sure of the maximum qualitative central stenosis score, patients
with moderate central stenosis had slightly greater improvement
in the RDQ disability score and leg pain NRS regardless of the type
of injectate at 3 weeks (Fig 1) compared with those patients with
mild stenosis (adjusted average treatment effect between moder-
ate and mild central stenosis for RDQ, �2.1 points; 95% CI, �1.9
to �0.6; P � .05; and for leg pain NRS, �1.0 point; 95% CI, �1.8
to �0.2; P � .05) but not severe stenosis (adjusted average treat-
ment effect between moderate and severe central stenosis for the
RDQ, �1.3 points; 95% CI, �0.56 – 0.1; P � .15; and for the leg
pain NRS, �0.6 points; 95% CI, �1.4 – 0.1; P � .20).
Summary of patient baseline clinical and imaging characteristicsa
Lidocaine (n = 175)Corticosteroid andLidocaine (n = 175)
Patient demographicsFemale 53% (93/175) 57% (100/175)Age range; mean (SD) 50–96; 68 (9.9) 50–89; 68 (9.6)Baseline clinical measures
RDQ disability score 15.6 (4.3) 16.1 (4.5)Leg pain NRS 7.2 (1.7) 7.1 (1.9)Back pain NRS 6.6 (2.6) 6.6 (2.4)Mean of leg and back pain NRS 6.6 (1.2) 6.5 (1.5)SSSQ symptom subscale score 3.1 (0.6) 3.2 (0.6)SSSQ physical function subscale score 2.5 (0.5) 2.5 (0.5)
Injection characteristicsInterlaminar approach 68% (119/175) 69% (120/175)Transforaminal approach 32% (56/175) 31% (55/175)Mean lumbar level distance from injection to level of
qualitative worst stenosis0.6 (0.6) 0.5 (0.7)
Qualitative CT and MRI n � 175 n � 175Measures
Maximum qualitative central stenosis 2.2 (0.8) 2.3 (0.9)Mean qualitative central stenosis 1.2 (0.4) 1.2 (0.5)
Qualitative MRI measures n � 150 n � 158Maximum qualitative CSF effacement 2.0 (1.1) 2.0 (1.1)Mean qualitative CSF effacement 0.7 (0.6) 0.7 (0.6)
Quantitative MRI measures n � 148 n � 156Minimum thecal sac cross-sectional area (mm2) 72 (38) 73 (39)Mean thecal sac cross-sectional (mm2) 130 (40) 130 (38)Minimum thecal sac AP diameter on axial images (mm) 7.2 (2.5) 7.2 (2.4)Mean thecal sac AP diameter on axial images (mm) 10.6 (2.0) 10.5 (2.0)Minimum thecal sac AP diameter on sagittal images (mm) 6.2 (2.3) 6.4 (2.4)Mean thecal sac AP diameter on sagittal images (mm) 9.5 (2.0) 9.6 (2.0)Minimum thecal sac ML diameter (mm) 11.6 (3.2) 11.6 (3.1)Mean thecal sac ML diameter (mm) 16.1 (2.7) 16.1 (2.5)
Note:—SSSQ indicates Swiss Spinal Stenosis Questionnaire.a Values represent mean and SD unless otherwise specified.
AJNR Am J Neuroradiol 40:908 –15 May 2019 www.ajnr.org 911

Analysis of primary clinical outcomes using ANCOVA models
that include interaction terms between primary imaging mea-
sures of spinal stenosis severity and epidural injectate revealed no
difference in the degree of improvement in the RDQ disability
scores or the leg pain NRS at 3 weeks using the imaging measures
of the qualitative maximum central stenosis score (Fig 2; interac-
tion coefficients of maximum central stenosis score and epidural
injectate for RDQ, �0.1; 95% CI, �1.3 to 1.2; P � .90; and for the
leg pain NRS, 0.1; 95% CI, �0.6 to 0.8; P � .81) or the quantita-
tive minimum thecal sac cross-sectional area (Fig 3; interaction
FIG 1. Mean and 95% CI for the RDQ disability score (A) and the leg pain NRS (B) are presented at baseline, 3 weeks, and 6 weeks followingepidural injection, including all patients regardless of injectate type, and subdivided by the severity of spinal stenosis on imaging (mild � solidline with circle; moderate � dash line with square; severe � dotted line with triangle). Patients with moderate stenosis demonstrated slightlygreater improvement in disability scores at 3 weeks and leg pain scores at 3 and 6 weeks compared with patients with mild stenosis.
FIG 2. Mean and 95% CI RDQ disability score (A) and leg pain NRS (B) at baseline, 3 weeks, and 6 weeks after epidural injection are presented forpatients randomized to lidocaine alone (circles and solid line) and corticosteroid and lidocaine (squares and dotted line), subdivided by theseverity of qualitative spinal stenosis on imaging (mild, moderate, and severe). There were no differences in responses when taking into accountspinal stenosis severity.
912 Perez May 2019 www.ajnr.org
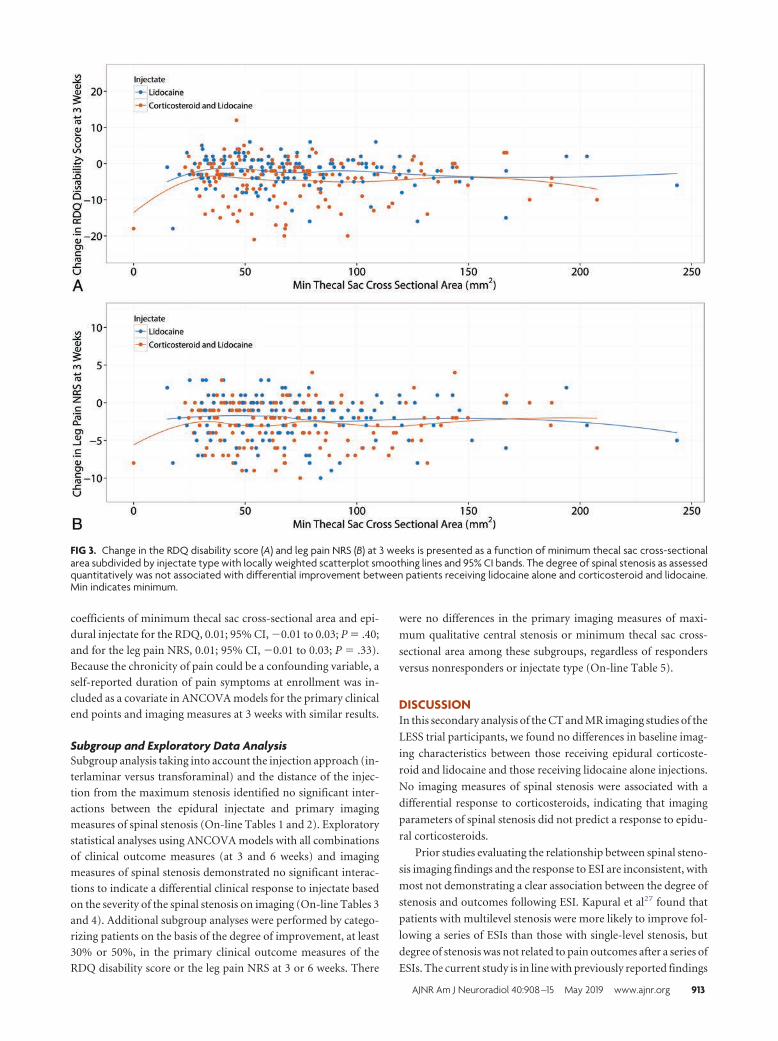
coefficients of minimum thecal sac cross-sectional area and epi-
dural injectate for the RDQ, 0.01; 95% CI, �0.01 to 0.03; P � .40;
and for the leg pain NRS, 0.01; 95% CI, �0.01 to 0.03; P � .33).
Because the chronicity of pain could be a confounding variable, a
self-reported duration of pain symptoms at enrollment was in-
cluded as a covariate in ANCOVA models for the primary clinical
end points and imaging measures at 3 weeks with similar results.
Subgroup and Exploratory Data AnalysisSubgroup analysis taking into account the injection approach (in-
terlaminar versus transforaminal) and the distance of the injec-
tion from the maximum stenosis identified no significant inter-
actions between the epidural injectate and primary imaging
measures of spinal stenosis (On-line Tables 1 and 2). Exploratory
statistical analyses using ANCOVA models with all combinations
of clinical outcome measures (at 3 and 6 weeks) and imaging
measures of spinal stenosis demonstrated no significant interac-
tions to indicate a differential clinical response to injectate based
on the severity of the spinal stenosis on imaging (On-line Tables 3
and 4). Additional subgroup analyses were performed by catego-
rizing patients on the basis of the degree of improvement, at least
30% or 50%, in the primary clinical outcome measures of the
RDQ disability score or the leg pain NRS at 3 or 6 weeks. There
were no differences in the primary imaging measures of maxi-
mum qualitative central stenosis or minimum thecal sac cross-
sectional area among these subgroups, regardless of responders
versus nonresponders or injectate type (On-line Table 5).
DISCUSSIONIn this secondary analysis of the CT and MR imaging studies of the
LESS trial participants, we found no differences in baseline imag-
ing characteristics between those receiving epidural corticoste-
roid and lidocaine and those receiving lidocaine alone injections.
No imaging measures of spinal stenosis were associated with a
differential response to corticosteroids, indicating that imaging
parameters of spinal stenosis did not predict a response to epidu-
ral corticosteroids.
Prior studies evaluating the relationship between spinal steno-
sis imaging findings and the response to ESI are inconsistent, with
most not demonstrating a clear association between the degree of
stenosis and outcomes following ESI. Kapural et al27 found that
patients with multilevel stenosis were more likely to improve fol-
lowing a series of ESIs than those with single-level stenosis, but
degree of stenosis was not related to pain outcomes after a series of
ESIs. The current study is in line with previously reported findings
FIG 3. Change in the RDQ disability score (A) and leg pain NRS (B) at 3 weeks is presented as a function of minimum thecal sac cross-sectionalarea subdivided by injectate type with locally weighted scatterplot smoothing lines and 95% CI bands. The degree of spinal stenosis as assessedquantitatively was not associated with differential improvement between patients receiving lidocaine alone and corticosteroid and lidocaine.Min indicates minimum.
AJNR Am J Neuroradiol 40:908 –15 May 2019 www.ajnr.org 913

demonstrating a lack of association of spinal canal dimensions by
CT with the outcome of the ESI11 and prior MR imaging– based
studies demonstrating lack of a statistically significant difference
between responders and nonresponders to ESI in the presence or
absence of spinal stenosis12 or by stenosis severity.14,28
We hypothesized that patients with less severe central stenosis,
for which inflammation may play a larger role than mechanical
compression, would have a more favorable response to cortico-
steroid injections compared with treatment with lidocaine alone;
however, we found that imaging measures of spinal stenosis were
not associated with a differential degree of improvement. There
was clinical improvement in both treatment groups, and overall
slightly greater improvement was seen in patients with moderate
stenosis compared with mild stenosis. Because there was im-
provement regardless of corticosteroid injection, the anti-inflam-
matory properties of corticosteroids may not have much of a role
in the treatment of spinal stenosis. This clinical improvement
could be due to the natural history of spinal stenosis, placebo
effect, or lidocaine effect. A sham injection group was not in-
cluded, and the efficacy of lidocaine alone could not be assessed.
Our results do not exclude inflammation as a contributing factor
in symptomatic spinal stenosis, though there are likely other fac-
tors that contribute to an individual patient’s symptoms and pos-
sible differential response to therapy. Moreover, if inflammation
is a contributing factor, spinal stenosis severity may not correlate
with the degree of inflammation. Nevertheless, the severity of spi-
nal stenosis on imaging was not a reliable biomarker to predict
treatment response following epidural corticosteroid injection
versus lidocaine alone, which adds to the many other patient char-
acteristics, including demographics and chronicity of pain, that
were previously also not found to reliably predict a differential
response in the LESS trial.29
The current study has several limitations. First, the causes of
spinal canal compromise (such as type of disc herniation, epidural
lipomatosis, congenital stenosis, and facet or ligamentum flavum
hypertrophy) and possible associated foraminal or lateral recess
stenosis were not specifically assessed. Previous studies in other
conditions, such as radiculopathy, have found that focal disc her-
niations and imaging severity of nerve root compression can pre-
dict short-term pain relief after ESI.10,13,30 Similarly, in a study
that excluded patients with spinal stenosis, herniated discs in the
foraminal and extraforaminal zones predicted a better response to
ESI compared with discs in the central and subarticular zones.31
Moreover, Choi et al12 found no relationship between the re-
sponse to ESI and spinal stenosis on MR imaging; however, they
reported that the disc location and nerve root compression grades
were associated with outcomes. Second, we did not localize a
likely spinal level to account for each patient’s symptoms in all
cases, which would have enabled us to correlate potential imaging
findings at a symptomatic level; nevertheless, epidural injections
were performed within 1 lumbar spinal level of the worst stenosis
in �90% of patients, and transforaminal injections were targeted
to the most symptomatic level. Third, the statistical power to de-
tect interaction effects may be low, despite large sample sizes, due
to multiple potential sources of heterogeneity, including pain and
disability levels, treatment approaches, and type and dose of cor-
ticosteroids. However, small interaction effects are unlikely to
have clinical utility to prospectively identify patients most likely to
benefit from epidural corticosteroid injection compared with li-
docaine alone for the treatment of symptomatic spinal stenosis.
CONCLUSIONSThe severity of lumbar spinal stenosis on CT or MR imaging in
patients with a clinical diagnosis of lumbar spinal stenosis does
not predict differential improvement in pain or disability follow-
ing epidural corticosteroid with lidocaine injection compared
with lidocaine injection alone.
ACKNOWLEDGMENTSWe thank the research staff for data collection and their overall
dedication to this study. In addition, we would like to thank the
LESS Scientific Advisory Board for their support.
Disclosures: Jeffrey G. Jarvik—RELATED: Grant: Agency for Healthcare Research andQuality, Comments: federal grant*; Support For Travel to Meetings for the Study orOther Purposes: Agency for Healthcare Research and Quality*; Fees for Participa-tion in Review Activities Such as Data Monitoring Boards, Statistical Analysis, End-point Committees, and the Like: Agency for Healthcare Research and Quality*; Pay-ment for Writing or Reviewing the Manuscript: Agency for Healthcare Research andQuality*; UNRELATED: Consultancy: UpToDate, Comments: section editor/consul-tant; Grants/Grants Pending: National Institutes of Health, Patient-Centered Out-comes Research Institute*; Payment for Lectures Including Service on SpeakersBureaus: Radiological Society of North America, Comments: Clinical Trials Method-ology Workshop faculty member; Royalties: UpToDate, Springer Publishing; Travel/Accommodations/Meeting Expenses Unrelated to Activities Listed: Association ofUniversity Radiologists (AUR) and General Electric (GE), Comments: GE-AUR Radiol-ogy Research Academic Fellowship annual retreat. Emin Aghayev—UNRELATED: Em-ployment: Schulthess Clinic Zurich, Swiss Federal Government, University of Bern.Ella R. Jarvik—RELATED: Grant: Agency for Healthcare Research and Quality, Com-ments: 1R01HS01922201.* Andrew L. Avins—RELATED: Grant: Agency for HealthcareResearch and Quality, Comments: as part of the Agency for Healthcare Research andQuality–funded multicenter clinical trial.* Jason M. Schwalb—RELATED: Grant:Agency for Healthcare Research and Quality, Comments: 1R01HS019222*; UNRELATED:Other: Blue Cross Blue Shield of Michigan, Comments: salary support for my role asCo-Director of the Michigan Spine Surgery Improvement Collaborative.* Christo-pher J. Standaert—RELATED: Grant: Agency for Healthcare Research and Quality,Patient-Centered Outcomes Research Institute.* David R. Nerenz—RELATED:Grant: Agency for Healthcare Research and Quality, Comments: standard researchgrant with funds used to cover the cost of conducting the study at our institution*;UNRELATED: Board Membership: Medicare Payment Advisory Commission, Com-ments: The Commission work involves the full range of Medicare payment issues. Iserved as a Medicare Payment Advisory Commission commissioner from 2012 to2018; Employment: Henry Ford Health System, Comments: I was a full-time em-ployee of the Henry Ford Health System during the entire time covered by thisdisclosure. Thiru Annaswamy—RELATED: Grant: Agency for Healthcare Researchand Quality, Comments: The LESS study was funded by the Agency for HealthcareResearch and Quality*; UNRELATED: Employment: federal government, Comments:I am a full-time employed physician at the VA. Zoya Bauer—RELATED: Grant: Agencyfor Healthcare Research and Quality.* Srdjan S. Nedeljkovic—RELATED: Grant:Brigham and Women’s Hospital.* Janna L. Friedly—RELATED: Grant: Agency forHealthcare Research and Quality, Patient-Centered Outcomes Research Institute.*Patrick J. Heagerty—RELATED: Grant: National Institutes of Health.* *Money paid tothe institution.
REFERENCES1. Deyo RA, Gray DT, Kreuter W, et al. United States trends in lumbar
fusion surgery for degenerative conditions. Spine 2005;30:1441– 45;discussion 1446 – 47 CrossRef Medline
2. Taylor VM, Deyo RA, Cherkin DC, et al. Low back painhospitalization: recent United States trends and regional varia-tions. Spine 1994;19:1207–12; discussion 13 CrossRef Medline
3. Steurer J, Roner S, Gnannt R, et al. Quantitative radiologic criteriafor the diagnosis of lumbar spinal stenosis: a systematic literaturereview. BMC Musculoskelet Disord 2011;12:175 CrossRef Medline
4. Kovacs FM, Urrutia G, Alarcon JD. Surgery versus conservativetreatment for symptomatic lumbar spinal stenosis: a systematic re-
914 Perez May 2019 www.ajnr.org

view of randomized controlled trials. Spine 2011;36:E1335–51CrossRef Medline
5. Moojen WA, Schenck CD, Lycklama A Nijeholt GJ, et al; Leiden-TheHague Spine Intervention Prognostic Study Group (SIPS). Preoper-ative MRI in patients with intermittent neurogenic claudication:relevance for diagnosis and prognosis. Spine 2018;43:348 –55CrossRef Medline
6. Harrast MA. Epidural steroid injections for lumbar spinal stenosis.Curr Rev Musculoskelet Med 2008;1:32–38 CrossRef Medline
7. Friedly J, Chan L, Deyo R. Increases in lumbosacral injections inthe Medicare population: 1994 to 2001. Spine 2007;32:1754 – 60CrossRef Medline
8. Friedly J, Nishio I, Bishop MJ, et al. The relationship between re-peated epidural steroid injections and subsequent opioid use andlumbar surgery. Arch Phys Med Rehabil 2008;89:1011–15 CrossRefMedline
9. Abdi S, Datta S, Trescot AM, et al. Epidural steroids in the manage-ment of chronic spinal pain: a systematic review. Pain Physician2007;10:185–212 Medline
10. Ghahreman A, Bogduk N. Predictors of a favorable response totransforaminal injection of steroids in patients with lumbar radic-ular pain due to disc herniation. Pain Med 2011;12:871–79 CrossRefMedline
11. Campbell MJ, Carreon LY, Glassman SD, et al. Correlation of spinalcanal dimensions to efficacy of epidural steroid injection in spinalstenosis. J Spinal Disord Tech 2007;20:168 –71 CrossRef Medline
12. Choi SJ, Song JS, Kim C, et al. The use of magnetic resonance imag-ing to predict the clinical outcome of non-surgical treatment forlumbar intervertebral disc herniation. Korean J Radiol 2007;8:156 – 63 CrossRef Medline
13. Paidin M, Hansen P, McFadden M, et al. Contrast dispersal patternsas a predictor of clinical outcome with transforaminal epidural ste-roid injection for lumbar radiculopathy. PM R 2011;3:1022–27CrossRef Medline
14. Park CH, Lee SH. Correlation between severity of lumbar spinalstenosis and lumbar epidural steroid injection. Pain Med 2014;15:556 – 61 CrossRef Medline
15. Benny BV, Patel MY. Predicting epidural steroid injections withlaboratory markers and imaging techniques. Spine J 2014;14:2500 – 08 CrossRef Medline
16. Friedly JL, Comstock BA, Turner JA, et al. A randomized trial ofepidural glucocorticoid injections for spinal stenosis. N Engl J Med2014;371:11–21 CrossRef Medline
17. Andersson GB. Epidural glucocorticoid injections in patients withlumbar spinal stenosis. N Engl J Med 2014;371:75–76 CrossRefMedline
18. Friedly JL, Bresnahan BW, Comstock B, et al. Study protocol: Lum-bar Epidural steroid injections for Spinal Stenosis (LESS)—a dou-
ble-blind randomized controlled trial of epidural steroid injectionsfor lumbar spinal stenosis among older adults. BMC MusculoskeletDisord 2012;13:48 CrossRef Medline
19. Paisley K, Jeffries J, Monroe M, et al. Dispersal pattern of injectateafter lumbar interlaminar epidural spinal injection evaluated withcomputerized tomography. Global Spine J 2012;2:27–32 CrossRefMedline
20. Lee JH, An JH, Lee SH. Comparison of the effectiveness of inter-laminar and bilateral transforaminal epidural steroid injections intreatment of patients with lumbosacral disc herniation and spinalstenosis. Clin J Pain 2009;25:206 –10 CrossRef Medline
21. Stucki G, Daltroy L, Liang MH, et al. Measurement properties of aself-administered outcome measure in lumbar spinal stenosis.Spine 1996;21:796 – 803 CrossRef Medline
22. Lurie JD, Tosteson AN, Tosteson TD, et al. Reliability of readings ofmagnetic resonance imaging features of lumbar spinal stenosis.Spine 2008;33:1605–10 CrossRef Medline
23. Andreisek G, Deyo RA, Jarvik JG, et al; LSOS working group. Con-sensus conference on core radiological parameters to describe lum-bar stenosis: an initiative for structured reporting. Eur Radiol 2014;24:3224 –32 CrossRef Medline
24. Lee GY, Guen YL, Lee JW, et al. A new grading system of lumbarcentral canal stenosis on MRI: an easy and reliable method. SkeletalRadiol 2011;40:1033–39 CrossRef Medline
25. Landis JR, Koch GG. The measurement of observer agreement forcategorical data. Biometrics 1977;33:159 –74 CrossRef Medline
26. Fleiss JL. The Design and Analysis of Clinical Experiments. Hoboken:John Wiley & Sons, Inc; 1986:1–32
27. Kapural L, Mekhail N, Bena J, et al. Value of the magnetic resonanceimaging in patients with painful lumbar spinal stenosis (LSS) un-dergoing lumbar epidural steroid injections. Clin J Pain 2007;23:571–75 CrossRef Medline
28. Cosgrove JL, Bertolet M, Chase SL, et al. Epidural steroid injectionsin the treatment of lumbar spinal stenosis efficacy and predictabil-ity of successful response. Am J Phys Med Rehabil 2011;90:1050 –55CrossRef Medline
29. Turner JA, Comstock BA, Standaert CJ, et al. Can patient character-istics predict benefit from epidural corticosteroid injections forlumbar spinal stenosis symptoms? Spine J 2015;15:2319 –31CrossRef Medline
30. Maus TP, El-Yahchouchi CA, Geske JR, et al. Imaging determinantsof clinical effectiveness of lumbar transforaminal epidural steroidinjections. Pain Med 2016;17:2176 – 84 CrossRef Medline
31. Lee JW, Choi SW, Park SH, et al. MR-based outcome predictors oflumbar transforaminal epidural steroid injection for lumbar radic-ulopathy caused by herniated intervertebral disc. Eur Radiol 2013;23:205–11 CrossRef Medline
AJNR Am J Neuroradiol 40:908 –15 May 2019 www.ajnr.org 915

ORIGINAL RESEARCHSPINE
It Is Not Necessary to Discontinue Seizure Threshold–LoweringMedications Prior to Myelography
X M. Krupa, X H. Salts, and X F. Mihlon
ABSTRACT
BACKGROUND AND PURPOSE: There is no consensus on whether patients undergoing myelography should discontinue medicationsthat could lower their seizure threshold. The purpose of this study was to document the most commonly prescribed seizure threshold–lowering medications in patients undergoing myelography and determine whether withholding such medications decreases the incidenceof seizures.
MATERIALS AND METHODS: We performed a retrospective observational study of all the myelograms obtained in 2016 at 2 affiliatedhospitals. At hospital A, seizure threshold–lowering medications are discontinued before myelography, and prophylactic diazepam is givenfor all cervical myelograms. At hospital B, seizure threshold–lowering medications are not withheld before the procedure, and medicalseizure prophylaxis is not implemented. The seizure threshold–lowering medications the patients were taking at the time of the procedureand postmyelographic seizure incidence were documented.
RESULTS: A total of 311 patients underwent myelography during 2016. One hundred eleven patients (36%) were on at least 1 seizurethreshold–lowering medication, and 30 (10%) were on at least 2. The most common medications were duloxetine, sertraline, venlafaxine,bupropion, and trazodone. The most common tricyclic antidepressant was amitriptyline. Three patients across both sites had a controlledseizure disorder and were on antiepileptics. None of the patients at either hospital had seizures during or within 3 hours following any ofthe myelograms during the study period.
CONCLUSIONS: Continuing seizure threshold–lowering medications during myelography does not increase the risk of seizures. Screen-ing for and withholding seizure threshold-lowering medications are not indicated for routine myelography.
ABBREVIATIONS: STLM � seizure threshold–lowering medication; TCA � tricyclic antidepressant
Myelography remains a useful diagnostic procedure to evalu-
ate spinal disease, especially in patients with contraindica-
tions to MR imaging.1 The risks of myelography are related to the
lumbar puncture itself and the intrathecal administration of con-
trast.2 Iodinated contrast agents used for myelography have been
in use for �90 years. The earliest agents such as iodophendylate
were oil-based and not readily resorbed from the CSF, and the oil
residue caused arachnoid adhesions in 3 of 4 patients who re-
ceived the agent.3 The first water-soluble myelographic contrast
agents were introduced in the early 1970s, and of these, metriz-
amide gained mainstream adaptation. Metrizamide compared fa-
vorably with iodophendylate because it resorbed with the CSF,
but it was well-known to carry a non-negligible risk of neurologic
symptoms, including seizure, with intrathecal administration.4
Since the advent of second-generation, nonionic water-soluble
contrast agents such as iohexol, myelography-related seizure ac-
tivity has become a very rare event. There have been only scattered
individual case reports of seizures occurring in patients undergo-
ing myelography with these agents, and most of these case reports
had extenuating circumstances such as a history of epilepsy or an
overdosage of the intrathecal contrast agent.5-8 Nonetheless, the
published guidelines for clinical practice surrounding myelogra-
phy have changed little since the transition from metrizamide to
second-generation, nonionic water-soluble contrast agents.
The American College of Radiology–American Society of
Neuroradiology–Society of Pediatric Radiology clinical practice
guidelines recommend screening patients’ medications and dis-
Received January 30, 2019; accepted after revision March 10.
From the Department of Radiology, Eastern Virginia Medical School, Norfolk,Virginia.
Paper previously presented, in part, at: Annual Meeting of the American Society ofNeuroradiology and the Foundation of the ASNR Symposium, June 4 –7, 2018: Van-couver, British Columbia, Canada.
Please address correspondence to Frank Mihlon, MD, Eastern Virginia MedicalSchool, Department of Radiology, 600 Gresham Dr, Norfolk, Virginia 23507; e-mail:[email protected]; @frankmihlon
http://dx.doi.org/10.3174/ajnr.A6027
916 Krupa May 2019 www.ajnr.org

continuing those that may lower the seizure threshold.1 The
guidelines advise withholding seizure threshold–lowering medi-
cations (STLMs) for 48 hours pre- and 24 hours postmyelogra-
phy. However, institutional and individual practices vary widely
in their adherence to these recommendations. In 2005, 63% of
practitioners screened for STLMs.9 In 2018, only 43% of practi-
tioners screened for such medications.10 Decreased adherence to
these recommendations is likely attributable to increased famil-
iarity with the newer contrast agents. Furthermore, �100 medi-
cations fall into the category of STLMs. Identifying and withhold-
ing such medications before myelography and then resuming
them after the procedure are laborious clinical tasks and are anx-
iety-provoking for the patient. In addition, referring clinicians
and patients can become frustrated by such requirements, partic-
ularly when they result in delaying or rescheduling of procedures.
In a study on the emotional implications of cancelled pediatric
outpatient operations, 45% of parents were “disappointed” and
16% were “frustrated” by the cancellation.11
This investigation is a retrospective observational study com-
paring the policies surrounding STLM continuation during my-
elography at 2 large hospitals (Sentara Norfolk General Hospital
and Sentara Virginia Beach General Hospital) within the same
institutional network and the associated myelography-induced
seizure rates. The 2 hospitals have different radiology groups and
different policies surrounding the continuation of outpatient
STLM regimens during myelography, but the contrast agent used
and other circumstances such as postmyelography care are other-
wise the same. The purpose of this study was to determine
whether there is a difference in the incidence of seizures between
these 2 sites and, as a consequence, whether allowing patients to
continue to take their outpatient STLM regimens during myelog-
raphy affects the rate of myelography-induced seizures.
MATERIALS AND METHODSFollowing institutional review board approval at Eastern Virginia
Medical School, a retrospective chart review was conducted on all
the patients who underwent myelography in 2016 at 2 hospitals in
a single institutional network. At hospital A (Sentara Virginia
Beach General Hospital), patients are screened for STLMs, and
they are discontinued 48 hours before the myelography and re-
sumed 48 hours after the procedure. Prophylactic diazepam is
given for all cervical myelograms. At hospital B (Sentara Norfolk
General Hospital), patients are not screened for STLMs, no
changes are made to patients’ medication regimens, and no diaz-
epam is given for seizure prophylaxis. All myelograms were ob-
tained with Omnipaque (iohexol; GE Healthcare, Piscataway,
New Jersey) intrathecal contrast. Administered doses varied with
procedure level, with cervical and total spine myelograms using,
on average, 10 mL of iohexol, 300 mg I/mL, and lumbar myelo-
grams using, on average, 16 mL of iohexol, 180 mg I/mL. Admin-
istered doses for thoracic myelograms varied with regard to con-
trast concentration and volume. Anticoagulants were managed in
the same manner at both sites and discontinued before the
procedure.
Demographic information (age at the procedure, sex), type of
myelogram (total spine, cervical, thoracic, or lumbar), contrast
agent and volume used, list of medications at the time of the
myelography, and the presence or absence of seizures during or
within 3 hours after the procedure were recorded. STLMs were
defined according to the Omnipaque package insert: “Phenothi-
azine derivatives . . . MAO inhibitors, tricyclic antidepressants,
CNS stimulants, and psychoactive drugs described as analeptics,
major tranquilizers, or antipsychotic drugs.”12
RESULTSBetween hospitals A and B, a total of 311 patients underwent
myelography during 2016 (Table 1). One hundred sixty-eight
myelograms were obtained at hospital A, which screens and
holds STLMs for myelography, and 143 myelograms were ob-
tained at hospital B, which does not screen and hold STLMs for
myelography. At hospital A, 43 (26%) patients undergoing
myelography were on an outpatient regimen that included at
least 1 STLM, and these were withheld for 48 hours before and
following myelography. At hospital B, 68 (48%) patients were
on an outpatient regimen that included at least 1 STLM, and
these patients underwent myelography without having the
medications withheld.
There were no significant differences in age (P � .094) or sex
(P � .266) between the 2 patient populations. The distribution of
the types of myelograms performed at the 2 hospitals varied, with
hospital A performing more lumbar myelograms and hospital B
performing more total spine myelograms. There were no reported
seizures during or within 3 hours of any of the myelograms at
either of the 2 hospitals.
The neurologic medication most frequently used by pa-
tients was duloxetine (26 patients, 8%), followed by sertraline
and venlafaxine (Table 2). The most frequently used tricyclic
antidepressant (TCA) was amitriptyline. Other infrequently
encountered TCAs were nortriptyline, amoxapine, and imip-
ramine. In total, 13 (4%) patients were on a TCA. Additionally,
13 (4%) patients were on bupropion at the time of myelogra-
phy. Six patients were taking 1 antiepileptic medication (4 at
the screened site, 2 at the nonscreened site). Medications in-
cluded carbamazepine, levetiracetam, and lamotrigine. Three
of these patients had a documented seizure disorder (2 at the
screened site, 1 at the nonscreened site). One of these patients,
who was part of the nonscreened group, was taking amitripty-
line concurrently. The remaining 3 patients were taking lam-
otrigine for bipolar disorder and chronic pain.
Table 1: Demographic information of all patients undergoingmyelography in 2016 at the 2 sites
Screened/Held Not Screened/HeldSex
Male 81 78Female 87 65
Age (yr)Median 58.5 57Mean 57.4 � 14 56.9 � 12Minimum 24 24Maximum 87 85
MyelogramCervical 34 40Thoracic 1 3Lumbar 121 61Multilevel (�1 level) 12 39
Seizures 0 0
AJNR Am J Neuroradiol 40:916 –19 May 2019 www.ajnr.org 917

DISCUSSIONIn the earlier days of medical imaging, myelography was the only
way to image spinal neural impingement. The advent of MR im-
aging brought with it the ability to image the spinal neural struc-
tures without the need for an invasive procedure, and subse-
quently, it largely replaced myelography as the diagnostic test of
choice for spinal neural impingement. Today, many patients un-
dergo myelography because they are precluded from MR imaging,
either due to safety reasons, such as having a pacemaker or claus-
trophobia, or due to artifacts from surgical hardware.1 Myelogra-
phy is also commonly used in instances in which the myelo-
graphic data are superior to data portrayed by MR imaging. These
specific situations include localization of the site of a CSF leak in
cases of intracranial hypotension; some instances of surgical plan-
ning, particularly in the case of a failing fusion construct; and in
cases of dynamic/positional neural impingement, which can be
diagnosed during the fluoroscopic portion of the examination.
The first generation of water-soluble nonionic contrast agents,
primarily metrizamide with regard to contrast use in myelogra-
phy, exhibited evidence of neurotoxicity and include many
described episodes of encephalopathy, seizures, and other neuro-
logic manifestations.8 Iohexol is a second-generation water-solu-
ble nonionic contrast agent approved by the Food and Drug Ad-
ministration for myelography in the mid-1980s and was the
contrast agent used in this retrospective observational study.
Studies comparing iohexol with metrizamide have shown that
iohexol causes significantly less frequent and less severe adverse
reactions than metrizamide.13 In a parallel, double-blind, ran-
domized study comparing iohexol and metrizamide in 60 consec-
utive patients undergoing lumbar myelography, iohexol did not
produce any epileptiform activity, but epileptiform activity was
detected in 5 patients receiving metrizamide.14 In another dou-
ble-blind comparative study of 30 patients undergoing cervical
myelography, pyramidal signs and seizures occurred only after
metrizamide myelography.15 It is unclear why iohexol has a lower
risk of seizures compared with metrizamide. This may be due to
the lower penetration of iohexol into the central nervous system
structures. Unlike metrizamide, which has a glucose side chain,
iohexol presumably does not interfere with glucose metabolism in
the brain.8
There are only a few case reports describing seizures in patients
undergoing myelography with iohexol.16-19 Alimohammadi et
al16 reported generalized tonic-clonic seizure in a 48-year-old
man who underwent outpatient lumbar myelography using 18
mL of iohexol, 240 �g/mL, which ultimately resulted in death.
Kertmen et al18 reported postprocedural generalized tonic-clonic
seizure after 3 mL of iohexol was inadvertently injected intrathe-
cally during an outpatient transforaminal percutaneous endo-
scopic lumbar discectomy for a lumbar disc herniation in a 20-
year-old woman. Rosenberg and Grant19 reported a 52-year-old
man who developed a generalized tonic-clonic seizure 30 minutes
after lumbar myelography with iohexol (dose not specified) and
who subsequently developed a malignant hyperthermia-like syn-
drome. In all these cases, patients were not taking any prescription
medications; therefore, screening for STLMs before the proce-
dure would not have changed the clinical outcome.
Despite the tenuous evidence of a significant risk of seizures
with intrathecal administration of second-generation water-sol-
uble nonionic contrast agents, the current guidelines provided
both by the relevant medical societies1 and in the iohexol package
insert12 recommend screening and withholding STLMs for my-
elography. These seizure-conscious guidelines could be in re-
sponse to the cited case reports but also may simply reflect a hold-
over from the days of metrizamide. When neuroradiologists
decide whether to implement the guidelines in their own medical
practice, they must weigh the effect on their patients. Discontin-
uing STLMs temporarily may cause antidepressant discontinua-
tion syndrome and increase the risk of relapse of depression or
anxiety,20 among other conditions. In addition, hospital systems,
referring clinicians, and radiologists alike can get frustrated with
screening and holding the ever-growing list of STLMs because
miscommunications and other potential breakdowns of that pro-
cess can result in otherwise needlessly rescheduling or cancelling
appropriate myelographic procedures.
Interestingly, the data suggest that more than half of practicing
neuroradiologists have decided that the societally recommended
screen-and-hold approach is indeed not best for their clinical
practice. In a 2018 survey of 700 American Society of Neuroradi-
ology members, only 43% of respondents reported screening for
STLMs.10 A mere 3% reported having had a patient experience a
postprocedural seizure during their entire personal history of
clinical myelography practice. There was no statistically signifi-
cant difference in postmyelographic seizures between practices
that discontinued STLMs and those that did not. A similar survey-
based study performed in 2005 found that 63% of practitioners
screened for STLMs at that time,9 indicating that across time,
the screen-and-hold practice is falling out of favor among
neuroradiologists.
Our investigation, a retrospective observational study com-
paring the policies surrounding STLM continuation during my-
elography at 2 large hospitals within the same institutional net-
Table 2: Frequency of neurologic medications reported inpatients undergoing myelography at the 2 sites
Medication Class TotalScreened/
Held
NotScreened/
HeldDuloxetine SNRI 26 11 15Sertraline SSRI 18 4 14Venlafaxine SNRI 16 7 9Bupropion Mixed 13 5 8Trazodone Mixed 11 7 4Amitriptyline TCA 10 2 8Fluoxetine SSRI 10 3 7Paroxetine SSRI 10 5 5Citalopram SSRI 7 4 3Escitalopram SSRI 6 3 3Quetiapine Antipsychotic 4 2 2Desvenlafaxine SNRI 3 0 3Lurasidone Antipsychotic 2 1 1Mirtazapine Mixed 1 0 1Nortriptyline TCA 1 0 1Amoxapine TCA 1 0 1Imipramine TCA 1 1 0Fluvoxamine SSRI 1 1 0Risperidone Antipsychotic 1 1 0
Note:—SSRI indicates selective serotonin reuptake inhibitors; SNRI, serotonin andnorepinephrine reuptake inhibitors.
918 Krupa May 2019 www.ajnr.org

work, showed that no seizures occurred in either the 168 patients
who had their STLMs screened and held for myelography or the
143 patients who were allowed to continue their STLM outpatient
regimen. Perhaps the most interesting number produced by our
study is the 68 patients at hospital B who were on at least 1 STLM
as an outpatient and were allowed to continue their medical reg-
imen during myelography; there were no postmyelography sei-
zures in this supposedly higher risk group. This finding supports
the notion that the current second-generation, nonionic contrast
agents do not present a significant risk of seizure when used for
myelography, even when allowing patients to continue their out-
patient STLM regimens in the time surrounding the procedure.
This finding is in line with the survey data that show that the
currently recommended screen-and-hold approach to STLMs for
myelography is increasingly not being used by neuroradiologists
who perform myelography as they become more familiar with the
current generation of contrast agents.
Our study has several limitations, mainly the low sample size
and the retrospective nature of the investigation. Given the rare
occurrence of myelography-related seizures using the current
generation of contrast agents, the sample number that would be
needed to find a seizure, even retrospectively, would have to be
prohibitively large and would likely not achieve statistical signif-
icance in terms of establishing causation. The sample size that
would be required to achieve statistical significance even to an-
swer the question of noninferiority would similarly be prohibi-
tively large. Thus, retrospective-type reviews like ours and surveys
will, in all likelihood, remain the type of data on which the rele-
vant societies will have to rely to make recommendations sur-
rounding the issue of STLMs and myelography. With regard to
limitations peculiar to our study, it is odd that there was such a
discrepancy in the percentage of patients who were on STLMs at
one hospital versus the other (26% versus 48%). One could spec-
ulate as to the innumerable potential reasons for this finding,
from patient population to the accuracy of patient reporting, but
it is, nonetheless, fortuitous in terms of the meaningfulness of our
study that the larger group of individuals on STLMs was at hos-
pital B, which does not screen and hold STLMs for myelography
and is functionally the experimental group in this investigation.
CONCLUSIONSWe found no evidence that continuing STLMs such as TCAs and
selective serotonin reuptake inhibitors during myelography pres-
ents an increased risk of seizures. The reported benefits of screen-
ing for such medications are anecdotal and based on studies using
older neurotoxic contrast agents, mainly metrizamide. In line
with the reports of the changing practice patterns and in lieu of
high-level prospective studies, our single-institution retrospective
observational study supports the growing body of literature that
suggests that screening for and holding STLMs is not indicated for
routine myelography.
REFERENCES1. ACR-ASNR-SPR Practice Parameter for the Performance Myelogra-
phy and Cisternography. https://www.acr.org/-/media/ACR/Files/Practice-Parameters/Myelog-Cisternog.pdf. Accessed December 21,2018
2. Eames FA, Cloft HJ. Discontinuing patient medications prior tomyelography. AJR Am J Roentgenol 2005;184:695 CrossRef Medline
3. Johnson AJ, Burrows EH. Thecal deformity after lumbar myelogra-phy with iophendylate (Myodil) and meglumine iothalamate (Con-ray 280). Br J Radiol 1978;51:196 –202 CrossRef Medline
4. Killebrew K, Whaley RA, Hayward JN, et al. Complications of metri-zamide myelography. Arch Neurol 1983;40:78 – 80 CrossRef Medline
5. Lipman JC, Wang AM, Brooks ML, et al. Seizure after intrathecaladministration of iopamidol. AJNR Am J Neuroradiol 1988;9:787– 88 Medline
6. Klein KM, Shiratori K, Knake S, et al. Status epilepticus and seizuresinduced by iopamidol myelography. Seizure 2004;13:196–99 CrossRefMedline
7. Simon JH, Ekholm SE, Kido DK, et al. High-dose iohexol myelogra-phy. Radiology 1987;163:455–58 CrossRef Medline
8. Fedutes BA, Ansani NT. Seizure potential of concomitant medica-tions and radiographic contrast media agents. Ann Pharmacother2003;37:1506 –10 CrossRef Medline
9. Sandow BA, Donnal JF. Myelography complications and currentpractice patterns. AJR Am J Roentgenol 2005;185:768 –71 CrossRefMedline
10. Shah LM, Kranz PG, Anzai Y, et al. Critical assessment of myelogra-phy practices: a call for rational guideline revision. AJNR Am J Neu-roradiol 2018;39:2378 – 84 CrossRef Medline
11. Tait AR, Voepel-Lewis T, Munro HM, et al. Cancellation of pediatricoutpatient surgery: economic and emotional implications forpatients and their families. J Clin Anesth 1997;9:213–19 CrossRefMedline
12. Omnipaque (iohexol) injection [package insert]. Piscataway: GEHealthcare; 2010
13. Hindmarsh T, Ekholm SE, Kido DK, et al. Lumbar myelography withiohexol and metrizamide: a double-blind clinical trial. Acta RadiolDiagn (Stockh) 1984;25:365– 68 CrossRef Medline
14. Maly P, Bach-Gansmo T, Elmqvist D. Risk of seizures aftermyelography: comparison of iohexol and metrizamide. AJNRAm J Neuroradiol 1988;9:879 – 83 Medline
15. Reisin R, Ethier R, de la Sayette V, et al. Metrizamide compared withiohexol for cervical myelography: a double-blind study. Can AssocRadiol J 1988;39:107–10 Medline
16. Alimohammadi H, Abdalvand A, Safari S, et al. Status epilepticusafter myelography with iohexol (Omnipaque). Am J Emerg Med2012;30:2092.e1–3 CrossRef Medline
17. Park KS, Moon JY, Oh CS, et al. Acetabular central fracture disloca-tion after generalized seizure during lumbar myelography with io-hexol. Case Rep Orthop 2013;2013:190917 CrossRef Medline
18. Kertmen H, Gurer B, Yilmaz ER, et al. Postoperative seizure follow-ing transforaminal percutaneous endoscopic lumbar discectomy.Asian J Neurosurg 2016;11:450 CrossRef Medline
19. Rosenberg H, Grant M. Ascending tonic-clonic syndrome sec-ondary to intrathecal Omnipaque. J Clin Anesth 2004;16:299 –300CrossRef Medline
20. Gabriel M, Sharma V. Antidepressant discontinuation syndrome.CMAJ 2017;189:E747 CrossRef Medline
AJNR Am J Neuroradiol 40:916 –19 May 2019 www.ajnr.org 919

ORIGINAL RESEARCHSPINE
Assessing Vascularity of Osseous Spinal Metastases withDual-Energy CT-DSA: A Pilot Study Compared with Catheter
AngiographyX Y.-C. Huang, X F.-Y. Tsuang, X C.-W. Lee, X C.-Y. Wu, and X Y.-H. Lin
ABSTRACT
BACKGROUND AND PURPOSE: Spine debulking surgery in patients with hypervascular spinal metastasis is associated with massiveintraoperative blood loss, but currently, the vascularity of tumor is determined by invasive conventional angiography or dynamic contrastMR imaging. We aimed to investigate the usefulness of noninvasive dual-energy CT-DSA, comparing it with conventional angiography inevaluating the vascularity of spinal metastasis.
MATERIALS AND METHODS: We conducted a retrospective study from January to December 2018. A total of 15 patients with spinalmetastasis undergoing dual-energy CT, conventional DSA, and subsequent debulking surgery were included. CT-DSA images were pro-duced after rigid-body registration and subtraction between CT phases. Qualitative and quantitative assessments of tumor vascularitywere conducted. Correlations between CT-DSA and conventional DSA results were evaluated using the Spearman coefficient. The meanenhancement in the estimated tumor volume and surgical blood loss was compared between hypervascular and nonhypervascular groupsusing the Wilcoxon rank sum test.
RESULTS: The CT-DSA and DSA results were strongly correlated, with � � 0.87 (P � .001). The DSA and the quantitative enhancementindex also showed a strong correlation with � � 0.83 (P � .001). Wilcoxon rank sum testing between hypervascular and nonhypervascularCT-DSA groups showed a difference in enhancement indices (P � .0003). The blood loss between the hypervascular and nonhypervasculargroups was nonsignificant (P � .09).
CONCLUSIONS: Dual-energy CT-DSA correlates well with conventional DSA in assessing the vascularity of spinal metastasis. It may serveas a noninvasive preoperative evaluation option before debulking surgery.
ABBREVIATION: DECT � dual-energy CT
Bony metastases of the spine can be very detrimental to a pa-
tient’s quality of life because they can cause severe pain, insta-
bility, and neurologic deficits secondary to spinal cord and root
compression.1,2 In selected cases, debulking surgery improves lo-
cal control and quality of life to a greater degree than conventional
methods.3 However, aggressive spinal surgery could be compli-
cated by massive intraoperative hemorrhage in hypervascular os-
seous metastases. Related studies have demonstrated that preop-
erative transarterial embolization might reduce intraoperative
blood loss,4-9 especially for pathologies prone to hypervascular
metastases such as thyroid carcinoma, renal cell carcinoma, and
hepatocellular carcinoma. However, not all metastases from such
tumors are hypervascular,5,10 and metastases from other tumor
pathologies could be hypervascular as well. Therefore, it is recom-
mended that tumor vascularity be assessed before spinal surgery.4
DSA is considered a reference standard for vascularity assessment
of bone tumors. However, DSA is an invasive imaging tool, and
quantitative measurements using DSA have not been comprehen-
sively explored, to our knowledge.
CT is one of the most commonly available imaging tools in
modern medicine. It is excellent at demonstrating osseous integ-
rity and fracture margins at rapid scanning speeds.11 In cases of
osseous metastases, the degree of enhancement is often hindered
by the inherent high density of mineral components. Addition-
ally, in small osseous metastases without substantial bone mor-
phologic changes, conventional CT has poor detection abilities
compared with MR imaging and PET.12,13 Therefore, CT plays a
supplementary role in diagnosing spinal metastases. Recent ad-
Received November 13, 2018; accepted after revision March 6, 2019.
From the Department of Medical Imaging (Y.-C.H., C.-W.L., Y.-H.L.), Division ofNeurosurgery (F.-Y.T.), Department of Surgery, and Department of Anesthesiology(C.-Y.W.), National Taiwan University Hospital, Taipei, Taiwan.
Please address correspondence to Yen-Heng Lin, MD, MS, Department of MedicalImaging, National Taiwan University Hospital, No. 7, Chung-Shan South Rd, Taipei100, Taiwan, ROC; e-mail: [email protected]
http://dx.doi.org/10.3174/ajnr.A6023
920 Huang May 2019 www.ajnr.org

vancements in CT registration and subtraction have enabled
demonstration of hypervascular bone tumors, marrow edema,
and spinal arteries.14-16 The contrast-to-noise ratio can be opti-
mized when the images are reconstructed at selected monoener-
getic levels by performing dual-energy CT (DECT).17
In this pilot study, we evaluated the potential of dual-energy
CT-DSA, compared with DSA, for assessing the vascularity of
osseous spinal metastasis before debulking surgery.
MATERIALS AND METHODSPatientsThis study was approved by the institutional review board of our
hospital. All patients who underwent dual-energy spinal CT an-
giography for osseous metastases from January to December 2018
at a single tertiary referral center were retrospectively reviewed.
Patients were included if they underwent spinal surgery and DSA
at the target levels with histopathology-proved metastatic malig-
nancy. Patients were excluded from the analysis if they had prior
spinal surgery at the target levels or if the image quality of DSA
and CT was poor for post-image processing.
CTA Acquisition and Image PostprocessingAll CT scans were performed on a 256 – detector row fast-kV-
switching DECT system (Revolution CT; GE Healthcare, Milwau-
kee, Wisconsin). The scan range contained at least 5 vertebral
body levels centered at the target level. The scan range was ex-
tended in sacral and cervical lesions to include possible distal col-
lateral blood supplies. The scans were obtained in dual-energy
mode on a fast-kV-switching DECT system that switched tube
potentials between 140 and 80 kV. Radiation doses were adjusted
according to the diagnostic reference levels18,19 and previously
reported doses that could identify the anterior spinal artery.20-22
Narrow collimation (between 4 and 8 cm) and a low scan pitch
factor (lower than 1) were used to reduce the conebeam artifacts
and enhance the z-axis resolution while maintaining a scan time
of �8 seconds. We obtained 4 CT phases: noncontrast, early ar-
terial, late arterial, and venous. Intravenous nonionic contrast
medium was injected into the antecubital vein at a flow rate of 4
mL/s; the total contrast amount was between 60 and 80 mL, which
had been tailored to the scan time. Autoscan triggering was used
with the ROI situated at the aorta at the starting position of the
scan range. The scan started 2.6 seconds after the ROI had reached
100 HU to acquire the early arterial phase; the late arterial phase
started 4 seconds after the early arterial phase had been com-
pleted. The venous phase was then performed after a 60-second
delay. The patients were instructed to maintain shallow, slow
breathing during the scans. The images were reconstructed on
0.625-mm-thick contiguous slices with a 16- to 20-cm FOV.
A stand-alone workstation (Advantage Workstation, Version
4.7; GE Healthcare) was used for postprocessing images. First, a
40-keV monochromatic CT image was reconstructed from the
DECT data file to enhance the contrast conspicuity. Late arterial
phase images were then registered to a noncontrast scan through
rigid-body registrations. Subtraction images between the late ar-
terial phase and noncontrast phase images were then obtained to
produce pure enhanced images, namely CT-DSA images. Figure 1
depicts CT-DSA before and after registration.
Quantitative Measurement and Qualitative Evaluation ofCT-DSAAfter the production of subtracted images, quantitative measure-
ments were performed on a stand-alone workstation by one of the
authors (with 4 years’ experience in neuroradiology) blinded to
the clinical information. The tumor mass was segmented along
the axial plane, slice by slice, to form a 3D ROI. Vessels and mis-
registered artifacts were excluded from the selection. Tumor vol-
ume and mean enhancement were obtained from the resultant
ROI. The following enhancement index was formulated to repre-
sent the percentage of tumor enhancement compared with that of
the artery:
Enhancement Index �
Mean Enhancement of the Estimated Tumor Volume
Enhancement of Aorta or Great Artery.
For qualitative evaluation, the subtracted images were refor-
matted to standard 3-mm axial, coronal, and sagittal images with
color-coded displays. The color scale was set between the part of
the scan range that showed the best enhancement (typically the
aorta) and zero Hounsfield units. The color map image was read
on a standard PACS for clinical diagnostic purposes. Two neuro-
radiologists (with 9 and 4 years’ experience, respectively) read the
studies independently; they were blinded to the clinical informa-
tion and catheter spinal angiography results. Tumor vascularity
was classified into 5 grades: 0 � enhancement lower than that of
the nondiseased adjacent vertebral bodies, 1 � peak enhancement
area similar to that of the nondiseased adjacent vertebral bodies,
2 � peak enhancement area higher than that of the nondiseased
adjacent vertebral bodies but lower than that of one-third of the
aortic enhancement, 3 � peak enhancement area higher than that
of one-third of the aortic enhancement, and 4 � peak enhance-
ment area higher than that of one-third of the aortic enhancement
with the presence of early venous enhancement. Figure 2 shows
the color map of CT-DSA alongside the corresponding catheter
spinal angiography images.
FIG 1. Sagittal subtraction CT before and after rigid-body registra-tion. If we set the subtracted image to a proper window, the quality ofregistration can be assessed using a DSA-like visual inspectionmethod. A, Unregistered image shows an overt misalignment artifactover bony edges. B, After solid-body registration, the number of ar-tifacts is greatly reduced.
AJNR Am J Neuroradiol 40:920 –25 May 2019 www.ajnr.org 921

Spinal AngiographyCatheter spinal angiography was performed and read by a neuro-
interventionalist (with 4 years’ experience in neurointervention
and 9 years’ experience in neuroradiology) with the patient under
local anesthesia. If a target metastasis was in the cervical spine, the
cervical spinal angiography included bilateral vertebral angiogra-
phy. For thoracolumbar disease, segmental artery angiography
was performed at both the target and adjacent levels. For a target
level lower than L3, iliac artery angiography was also performed.
Tumor vascularity was classified into 5 categories according to the
literature23: 0 � decreased enhancement compared with that in a
normal nondiseased vertebral body, 1 � same degree of enhance-
ment compared with that in a normal nondiseased vertebral body,
2 � mild tumor blush, 3 � moderate tumor blush with an opacity
similar to that of the segmental artery proper, and 4 � marked
tumor blush with early arteriovenous shunting. The angiography
study was also used to identify the Adamkiewicz and anterior
spinal arteries.
Preoperative EmbolizationPreoperative embolization was performed after the complete
angiography study if no anterior spinal arteries had been iden-
tified at the target levels. For tumors in the thoracic-to-sacral
regions, embolization was performed with particles (Contour
and Embozene particles; Boston Scientific, Natick, Massachu-
setts) at the target level and adjacent
segmental arteries when tumor stain
was present. The embolization was as-
sisted by a coil for flow redistribution
and proximal occlusion when neces-
sary.24,25 For tumors at the cervical
level and when the vertebral artery was
encased by a tumor, coil embolization
of the affected vertebral artery at both
the distal and proximal tumor edges
was performed when the collateral
supply from the contralateral vertebral
artery was adequate according to CTA
and selective angiography.
Surgical ProcedureA surgical plan was developed by a
multidisciplinary spine oncology board,
and the treatment options were deter-
mined according to the Tomita survival
scores,26 revised Tokuhashi Scores,27 and
an algorithm proposed by Cappuccio
and Boriania.28 All patients underwent
intralesional debulking surgery or total
en bloc spondylectomy, in which sur-
geons removed the vertebrae with the
tumor in piecemeal fashion or as a
whole. Vertebral reconstructions were
performed 2 levels above and below the
resected vertebra with prefabricated me-
tallic implants or polymethyl methacry-
late and posterior fixation.
Statistical AnalysisIndividual patient data were provided in detail. Spearman rank
correlation of DSA to the enhancement index and CT-DSA grade
was conducted. The interrater reliability of qualitative data was eval-
uated by weighted � values. We further dichotomized the patients
into hypervascular and nonhypervascular groups according to their
CT-DSA enhancement grades. Mean enhancement in the estimated
tumor volume and surgical blood loss was compared between the 2
groups using the Wilcoxon rank sum test. The significance level was
set at .05. All statistical analyses were performed using SAS software,
Version 9.4 (SAS Institute, Cary, North Carolina).
RESULTSA total of 47 patients evaluated for preoperative spinal CTA were
analyzed during the study period. Seven patients did not undergo
surgery after the multidisciplinary board judged that surgery was
unnecessary, 17 patients had no preoperative DSA, 2 patients had
pathologies other than metastases, and 6 patients were excluded
from this study because of prior palliative surgery. Finally, 15
patients were included for analysis. Among them, 3 patients had 2
target levels, and the remaining 12 patients had 1 target level. The
tumor types varied, comprising 1 melanoma, 1 colonic carci-
noma, 1 renal cell carcinoma, 1 thyroid cancer, 1 parotid epithe-
lial-myoepithelial carcinoma, 3 breast cancers, 1 cervical cancer, 2
FIG 2. A 68-year-old male patient with hepatocellular carcinoma with a hypervascular bonymetastasis in the T10 vertebral body. A, Coronal 40-keV monoenergetic image of the late arterialphase shows a T10 vertebral body osteolytic lesion with a pathologic compression fracture. B,Coronal 40-keV subtracted CTA after registration shows that the T10 vertebral body had beenreplaced by a metastatic tumor with avid enhancement stronger than that of the marrow in theadjacent vertebral body. An earlier segmental draining vein (white arrow) parallel to the segmen-tal artery is shown for comparison with a single enhancing segmental artery at the adjacentnormal level. C, Color-coded display of the subtracted images demonstrates the degree ofenhancement more clearly. The color map is set to a 10-stepped scale with 10% increments foreach step to assist in visual grading. D, Frontal view of DSA at the same level shows a typicalhypervascular bone metastasis. Early venous drainage to a hemizygous vein is noted (arrow-heads), indicating arteriovenous shunting within the metastatic lesion. A smaller part of thevertebral body supplied by the left segmental artery is not opacified in this DSA image. E, Iodinemap derived from the material decomposition algorithm shows falsely high iodine content innormal bone marrow. The map failed to demonstrate the expected enhancement differencebetween the tumor and normal bone marrow because of limitations of the dual-energy CTiodine-based material decomposition in bony tissue.
922 Huang May 2019 www.ajnr.org

lung cancers, and 4 hepatocellular carcinomas. The target verte-
brae included 2 cervical, 7 thoracic, and 6 lumbar vertebrae. Thir-
teen patients underwent preoperative embolization before sur-
gery. All patients underwent debulking surgery for spinal
metastases; among them, 2 patients had anterior approaches for
cervical metastasis debulking, and 13 with thoracolumbar metas-
tases underwent debulking surgery through a single posterior ap-
proach. Individual patient data are listed in the Table.
The volume CT dose index of the present study was 9.33–20.93
mGy (median, 12.64 mGy) for a single late CTA phase and 5.98 –
20.93 mGy (median, 12.25 mGy) for other single phases.
Spearman coefficients demonstrated a strong correlation be-
tween the DSA and CT-DSA grades, with � � 0.87 (P � .001). The
DSA grade and CT-DSA enhancement index were also strongly
correlated, with � � 0.83 (P � .001). For the interrater reliability
of DSA and CT-DSA, the weighted � values were 0.64 (range,
0.43– 0.84) and 0.74 (95% CI, 0.51– 0.96), respectively. The pa-
tients with CT-DSA grades 3 and 4 were assigned to the hypervas-
cular group, and those with grades 0, 1, and 2 were assigned to the
nonhypervascular group. The Wilcoxon rank sum test revealed a
difference in the enhancement indices of the 2 groups (P � .0003).
The hypervascular group had higher mean surgical blood loss
than the nonhypervascular group (3707 � 3121 versus 1500 �
1041 mL); however, this difference was not significant (P � .09).
DISCUSSIONSpine bony metastases often result in severe pain, instability, and
neurologic deficits1,2 in patients with late-stage malignancies. De-
bulking surgeries in selected cases provide improved local control
rates and neurologic outcomes but can be complicated by massive
intraoperative blood loss.3 Currently, DSA is used as a reference
standard for evaluating tumor vascularity before surgery.10,23,29
However, DSA is an invasive procedure that has only moderate
interrater and intrarater reliability for classifying the vascularity of
spinal metastases.30 In our study, the CT-DSA grading system and
quantification measurements were strongly correlated with the
DSA grading system.
DSA grading can be suboptimal because of variations in an-
giography techniques, anatomy, and tumor burden. In case 5 of
our series, DSA exhibited lower vascularity than CT-DSA (grade 3
versus 4) because the planned injection rate was insufficient for
the hypertrophied artery. Conversely, the degree of perfused ar-
terial enhancement was uniform in the CTA image, which was
unaffected by technique or anatomy variation during catheteriza-
tion. Comparisons between adjacent levels may be more reliable.
Currently, there is no consensus on the CT classification of
tumor vascularity. The proposed CT-DSA classification criteria
were designed to be clinically useful and similar to the DSA clas-
sification criteria. On the basis of discussions with spinal surgeons
of the multidisciplinary spine oncology board, we stratified grades
3 and 4 and 0, 1, and 2 as the closest matches for clinical experi-
ence. The development of an appropriate and clinically relevant
classification scheme requires well-designed studies on a large
scale with a sufficient follow-up duration. For a pilot study with a
low case number, a solid suggestion regarding classification crite-
ria is difficult to postulate. However, we believe that our current
study demonstrates that CT-DSA is practical and potentially use-
ful as a robust noninvasive tool for the preoperative evaluation of
tumor vascularity.
In related studies, specialized MR imaging protocols applying
dynamic contrast enhancement and high-resolution MRA have
been described as a means of obtaining information regarding
perfusion and arterial anatomy; these protocols are complex and
require specialized MR imaging sequences that are not routinely
performed.23,29,31 Meanwhile, conventional MR imaging se-
quences might not provide sufficient information regarding the
anatomy or degree of vascularity.31 The CTA protocol described
in our study requires only minimal modification from standard
CTA protocols for other body parts; thus, this protocol might be
easier to incorporate into clinical practice. The correlation be-
tween CT-DSA vascularity grading and intraoperative blood loss
was nonsignificant in this study. However, there is a trend sug-
gesting that high-grade tumors have high intraoperative blood
loss. Because only 15 patients were included in this study, the
primary reason for the nonsignificant result (P � .09) was insuf-
ficient statistical power and other uncontrolled parameters, in-
cluding tumor location, tumor size, surgical method, and degree
of embolization. Thus, in this study, conclusions were difficult to
draw, and further large-scale studies are needed to clarify the cor-
relation between CT-DSA and intraoperative blood loss.
DECT scans are mainly used to optimize the contrast-to-noise
Patient characteristics
Patient SexAge(yr) Tumor Type
TumorLocation
DSAGrade,Reader
1/2
CT–DSAGrade,Reader
1/2
EstimatedTumor
Volume(cm3)
EnhancementIndex
SurgicalApproach/Procedure
PreoperativeEmbolization
BloodLoss(cm3)
1 M 67 Melanoma L3 1/1 1/1 78.83 0.1574 Posterior/debulking Yes 23002 M 55 Colon cancer L4 3/3 3/3 49.59 0.1659 Posterior/debulking Yes 39503 F 44 Renal cell carcinoma C4 4/4 3/4 16.28 0.6254 Anterior/debulking Yes 6004 M 72 Thyroid cancer C7 2/1 2/3 11.93 0.1522 Anterior/debulking Yes 8005 M 54 Breast cancer L4 3/3 4/4 36.74 0.2586 Posterior/debulking Yes 10,0006 M 69 Hepatocellular carcinoma T10 4/4 3/4 18.14 0.2917 Posterior/debulking Yes 46007 F 69 Lung cancer T4 1/0 1/1 10.86 0.1653 Posterior/debulking Yes 30008 M 74 Hepatocellular carcinoma T10 2/3 1/1 22.25 0.0673 Posterior/debulking No 10009 F 58 Cervical cancer L4–5 2/4 2/2 91.14 0.0734 Posterior/debulking Yes 140010 F 51 Lung cancer L4–5 4/3 3/3 11.61 0.2183 Posterior/debulking Yes 340011 M 60 Hepatocellular carcinoma T4 4/4 4/4 14.19 0.3325 Posterior/debulking Yes 140012 M 64 Hepatocellular carcinoma T3 4/4 4/3 26.47 0.1888 Posterior/debulking Yes 200013 F 64 Breast cancer T3–4 2/2 3/2 29.06 0.1107 Posterior/debulking Yes 60014 F 44 Breast cancer L5 0/1 2/2 42.86 0.0450 Posterior/debulking Yes 20015 F 58 Parotid epithelial-
myoepithelialcarcinoma
T4 1/2 2/2 4.05 0.0339 Posterior/en bloc No 2700
AJNR Am J Neuroradiol 40:920 –25 May 2019 www.ajnr.org 923

ratios and improve the conspicuity of the anterior spinal and Ad-
amkiewicz arteries.32 In this study, the unique abilities of DECT to
perform material decomposition and virtual noncontrast studies
were not comprehensively explored for a reason. We initially at-
tempted to use a material decomposition algorithm to produce
iodine mapping; however, material decomposition algorithms
operate poorly in vertebral body scans. Iodine maps produced by
commercial standard material decomposition algorithms (with 2
base material pairs: iodine-hydroxyapatite and iodine-water) and
custom-made software that implements multiple material de-
composition algorithms, as described elsewhere,33 show falsely
high iodine content in normal bone marrow (Fig 2E). In the pres-
ent study, 11 of the 15 cases (73%) exhibited higher iodine con-
tent in normal vertebral marrow than did tumors on iodine maps
derived from multiple material decomposition algorithms. We
believe that this finding was a result of the implemented algorithm
being unable to decompose 4 materials simultaneously.34-37 In
addition to the 3-material model used in the literature for dem-
onstrating bone marrow content distributions,38,39 iodine is
added as a fourth material in enhanced spine studies. The intro-
duction of a fourth material violates the assumption of the 3-ma-
terial decomposition algorithm and renders the algorithm unsuit-
able for use in contrast spine CT. Virtual unenhanced CT images
have the same limitations because they are based on the algorithm
that performs multiple material decompositions. Nevertheless,
the role of DECT in vertebral metastases is yet to be determined,
and we still consider DECT an appealing imaging tool for verte-
bral body analysis worthy of further investigation.
In the present study, CT-DSA images were produced with pre-
contrast and late CTA scans only. The early arterial phases are not
used in CT-DSA, but it depicted segmental arteries well, because
the late arterial phase might have fading enhancements in arteries
that preclude small artery anatomic assessment. The venous phase
provides an enhanced series to make differential diagnoses and
can depict adjacent large venous structures (eg, the azygos vein
and the epidural venous plexus). These structures may not be
identified during an operation because of the limited surgical
FOV.
Although CT-DSA was performed with DECT scans in our
study, registration and subtraction can be performed without the
dual-energy scan mode. We believe that DECT scans are not man-
datory for subtracting CT to evaluate vascularity, and CT-DSA
can be used at most CT sites.
Our study had several limitations. The first limitation was the
small size of the pilot study group, which prevented further con-
trol and analysis of variables. A study with a larger sample size is
warranted to confirm the correlations with general patient condi-
tions. The second limitation concerns the retrospective nature of
this study. The subjects analyzed in this study were patients who
had undergone surgical interventions, which only represent a
subgroup of all patients. This feature rendered the analysis vul-
nerable to selection bias. The third limitation was the use of reg-
istration and subtraction, which may not be available at every CT
site. However, solid body registration and subtraction are fast and
relatively easy postprocessing steps that are commercially avail-
able from most CT vendors and in open-source image-processing
packages.40 For CT sites where registration is not available, sub-
traction of unregistered phases might be helpful.
The final limitation was the high radiation dose in the pro-
posed protocol. Although we adjusted our radiation exposure lev-
els in accordance with reported diagnostic reference levels in the
literature and implemented standard dose-reduction techniques,
radiation exposure remained high because of multiple phase ac-
quisitions and a high single-phase radiation dose for spine CTs.
Careful patient selection is warranted when using this protocol in
clinics. Patients with malignant osseous spinal metastases are
more likely to benefit from preoperative vascular imaging when
the potential detriment of radiation exposure is considered.
When CT-DSA is used in patients for whom radiation exposure is
a concern, physicians could consider skipping the early arterial or
venous phases to reduce exposure.
CONCLUSIONSDual-energy CT-DSA correlates well with conventional DSA in
assessing the vascularity of spinal metastasis. It may serve as a
potentially useful noninvasive tool for evaluating the vascularity
of spinal metastasis.
REFERENCES1. Mut M, Schiff D, Shaffrey ME. Metastasis to nervous system: spinal
epidural and intramedullary metastases. J Neurooncol 2005;75:43–56 CrossRef Medline
2. Gilbert RW, Kim JH, Posner JB. Epidural spinal cord compressionfrom metastatic tumor: diagnosis and treatment. Ann Neurol 1978;3:40 –51 CrossRef Medline
3. de Ruiter GC, Nogarede CO, Wolfs JF, et al. Quality of life after differentsurgical procedures for the treatment of spinal metastases: results of asingle-center prospective case series. Neurosurg Focus 2017;42:E17CrossRef Medline
4. Robial N, Charles YP, Bogorin I, et al. Is preoperative embolization aprerequisite for spinal metastases surgical management? OrthopTraumatol Surg Res 2012;98:536 – 42 CrossRef Medline
5. Pazionis TJ, Papanastassiou ID, Maybody M, et al. Embolization ofhypervascular bone metastases reduces intraoperative bloodloss: a case-control study. Clin Orthop Relat Res 2014;472:3179 – 87 CrossRef Medline
6. Kickuth R, Waldherr C, Hoppe H, et al. Interventional managementof hypervascular osseous metastasis: role of embolotherapy beforeorthopedic tumor resection and bone stabilization. AJR Am J Roent-genol 2008;191:W240 – 47 CrossRef Medline
7. McDonald K, Murphy LE, Eames N. Is it necessary to embolise allspinal metastases from primary renal tumours? J Orthop 2016;13:472–74 CrossRef Medline
8. Qiao Z, Jia N, He Q. Does preoperative transarterial embolizationdecrease blood loss during spine tumor surgery? Interv Neuroradiol2015;21:129 –35 CrossRef Medline
9. Mendel E, Bourekas E, Gerszten P, et al. Percutaneous techniques inthe treatment of spine tumors: what are the diagnostic and thera-peutic indications and outcomes? Spine 2009;34:S93–100 CrossRefMedline
10. Schmidt R, Rupp-Heim G, Dammann F, et al. Surgical therapy ofvertebral metastases: are there predictive parameters for intraoper-ative excessive blood loss despite preoperative embolization? Tu-mori 2011;97:66 –73 CrossRef Medline
11. Mauch JT, Carr CM, Cloft H, et al. Review of the imaging features ofbenign osteoporotic and malignant vertebral compression frac-tures. AJNR Am J Neuroradiol 2018;39:1584 –92 CrossRef Medline
12. Jeong D, Bui M, Peterson D, et al. FDG avid breast cancer bone metas-tases silent on CT and scintigraphy: a case report with radiologic-
924 Huang May 2019 www.ajnr.org

pathologic correlation. Acta Radiol Open 2017;6:2058460117734243CrossRef Medline
13. Al-Muqbel KM. Bone marrow metastasis is an early stage of bonemetastasis in breast cancer detected clinically by F18-FDG-PET/CTimaging. Biomed Res Int 2017;2017:9852632 CrossRef Medline
14. Gondim Teixeira PA, Hossu G, Lecocq S, et al. Bone marrow edemapattern identification in patients with lytic bone lesions using dig-ital subtraction angiography-like bone subtraction on large-areadetector computed tomography. Invest Radiol 2014;49:156 – 64CrossRef Medline
15. Gondim Teixeira PA, Gervaise A, Louis M, et al. Musculoskeletalwide detector CT: principles, techniques and applications in clini-cal practice and research. Eur J Radiol 2015;84:892–900 CrossRefMedline
16. Nishii T, Kono AK, Nishio M, et al. Bone-subtracted spinal CT an-giography using nonrigid registration for better visualization of ar-terial feeders in spinal arteriovenous fistulas. AJNR Am J Neurora-diol 2015;36:2400 – 06 CrossRef Medline
17. Yu L, Christner JA, Leng S, et al. Virtual monochromatic imaging indual-source dual-energy CT: radiation dose and image quality. MedPhys 2011;38:6371–79 CrossRef Medline
18. Hayton A, Wallace A, Marks P, et al. Australian diagnostic referencelevels for multi detector computed tomography. Australas Phys EngSci Med 2013;36:19 –26 CrossRef Medline
19. Directorate-General for Energy, Directorate D, Nuclear Safety and FuelCycle, Unit D3, Radiation Protection. RADIATION PROTECTION No.180 Diagnostic Reference Levels in Thirty-six European Countries (Part 2).European Commission; 2014. https://ec.europa.eu/energy/sites/ener/files/documents/RP180%20part2.pdf. Accessed January 15, 2018
20. Takase K, Sawamura Y, Igarashi K, et al. Demonstration of the arteryof Adamkiewicz at multi-detector row helical CT. Radiology 2002;223:39 – 45 CrossRef Medline
21. Kudo K, Terae S, Asano T, et al. Anterior spinal artery and artery ofAdamkiewicz detected by using multi-detector row CT. AJNR Am JNeuroradiol 2003;24:13–17 Medline
22. Yoshioka K, Tanaka R, Takagi H, et al. Ultra-high-resolution CTangiography of the artery of Adamkiewicz: a feasibility study. Neu-roradiology 2018;60:109 –15 CrossRef Medline
23. Mazura JC, Karimi S, Pauliah M, et al. Dynamic contrast-enhancedmagnetic resonance perfusion compared with digital subtractionangiography for the evaluation of extradural spinal metastases: apilot study. Spine 2014;39:E950 –54 CrossRef Medline
24. Shi HB, Suh DC, Lee HK, et al. Preoperative transarterial emboliza-tion of spinal tumor: embolization techniques and results. AJNRAm J Neuroradiol 1999;20:2009 –15 Medline
25. Suzuki H, Kondo T, Kuwatsuru R, et al. Decompressive surgery in com-bination with preoperative transcatheter arterial embolization: suc-cessful improvement of ambulatory function in renal cell carcinomapatients with metastatic extradural spinal cord compression. Int J Urol2011;18:718–22 CrossRef Medline
26. Tomita K, Kawahara N, Kobayashi T, et al. Surgical strategy for spi-nal metastases. Spine 2001;26:298 –306 CrossRef Medline
27. Tokuhashi Y, Matsuzaki H, Oda H, et al. A revised scoring system forpreoperative evaluation of metastatic spine tumor prognosis. Spine2005;30:2186 –91 CrossRef Medline
28. Cappuccio M, Gasbarrini A, Van Urk P, et al. Spinal metastasis: aretrospective study validating the treatment algorithm. Eur RevMed Pharmacol Sci 2008;12:155– 60 Medline
29. Saha A, Peck KK, Lis E, et al. Magnetic resonance perfusion charac-teristics of hypervascular renal and hypovascular prostate spinalmetastases: clinical utilities and implications. Spine 2014;39:E1433– 40 CrossRef Medline
30. Clausen C, Dahl B, Christiansen Frevert S, et al. Inter- and intra-rateragreement in the assessment of the vascularity of spinal metastasesusing digital subtraction angiography tumor blush. Acta Radiol2017;58:734 –39 CrossRef Medline
31. Khadem NR, Karimi S, Peck KK, et al. Characterizing hypervascularand hypovascular metastases and normal bone marrow of the spineusing dynamic contrast-enhanced MR imaging. AJNR Am J Neuro-radiol 2012;33:2178 – 85 CrossRef Medline
32. Shimoyama S, Nishii T, Watanabe Y, et al. Advantages of 70-kV CTangiography for the visualization of the Adamkiewicz artery: com-parison with 120-kV imaging. AJNR Am J Neuroradiol 2017;38:2399 – 405 CrossRef Medline
33. Mendonca PR, Lamb P, Sahani DV. A flexible method for multi-material decomposition of dual-energy CT images. IEEE Trans MedImaging 2014;33:99 –116 CrossRef Medline
34. Dinkel J, Khalilzadeh O, Phan CM, et al. Technical limitations ofdual-energy CT in neuroradiology: 30-month institutional ex-perience and review of literature. J Neurointerv Surg 2015;7:596 –602 CrossRef Medline
35. Gupta R, Phan CM, Leidecker C, et al. Evaluation of dual-energyCT for differentiating intracerebral hemorrhage from iodinatedcontrast material staining. Radiology 2010;257:205–11 CrossRefMedline
36. Kuno H, Onaya H, Iwata R, et al. Evaluation of cartilage invasion bylaryngeal and hypopharyngeal squamous cell carcinoma with dual-energy CT. Radiology 2012;265:488 –96 CrossRef Medline
37. Hiyama T, Kuno H, Sekiya K, et al. Bone subtraction iodine imagingusing area detector CT for evaluation of skull base invasion by na-sopharyngeal carcinoma. AJNR Am J Neuroradiol 2019;40:135– 41CrossRef Medline
38. Ali IT, Wong WD, Liang T, et al. Clinical utility of dual-energy CTanalysis of bone marrow edema in acute wrist fractures. AJR Am JRoentgenol 2018;210:842– 47 CrossRef Medline
39. Mallinson PI, Coupal TM, McLaughlin PD, et al. Dual-energy CT forthe musculoskeletal system. Radiology 2016;281:690 –707 CrossRefMedline
40. Yushkevich PA, Piven J, Hazlett HC, et al. User-guided 3D activecontour segmentation of anatomical structures: significantly im-proved efficiency and reliability. Neuroimage 2006;31:1116 –28CrossRef Medline
AJNR Am J Neuroradiol 40:920 –25 May 2019 www.ajnr.org 925

35 YEARS AGO
Celebrating 35 Years of the AJNRMay 1984 edition
926 35 Years ago May 2019 www.ajnr.org

LETTERS
Use of Balanced Steady-State Free Precession Sequences inEvaluation of Drop Metastases
Recently, an overseas colleague had reached out to us, having
trouble implementing the sequences suggested by Buch et al1
for their patients in pediatric oncology. We believe that the issue
was rooted in some inaccuracies relating to the sequences de-
scribed in the article. We are writing this letter to clarify the ter-
minology and sequence families for those who wish to use these
classes of sequences. This letter by no means reduces the value of
the article. We are quite happy to see that Buch et al have done a
formal evaluation of the potential advantages of these sequences
in further evaluation of drop metastases over previous anecdotal
evidence.
3D driven equilibrium pulses typically are not relevant to or
applied in balanced steady-state free precession (bSSFP), which is
a gradient recalled-echo sequence. These pulses use a �90° flip of
the spins to enhance the T1 recovery of CSF, for example, in
short-TR 3D fast spin-echo sequences.2 This results in a bright
CSF signal in relatively short time, though it does not have true
T2-weighting.
In addition, regular bSSFP sequences (also known as true fast
imaging with steady-state precession [TruFISP], FIESTA, and
balanced fast-field echo [bFFE] by various manufacturers) will
not work well for the reported intended purposes of Buch et al1
due to phase shift errors and banding, particularly considering the
long TR of 3D sequences.3 However, a further modification of
bSSFP needs to be made using 2 back-to-back sequence pairs with
and without phase alterations and using maximum intensity pro-
jection at the end to cancel the phase errors, hence the longer
acquisition times. This additional modification has been imple-
mented as FIESTA-C (not FIESTA) and CISS and is the one to
which the authors would have been referring.4
On another note, one must consider that the presumed bene-
fits of using these balanced SSFP sequences compared with T1-
weighted images is highly dependent on how the baseline T1-
weighted images are acquired and if other sequences, such as
high-quality T2-weighted sequences, are used in the protocol as
well. Having more than one plane postcontrast T1-weighted im-
age, using newer thin-section T1-weighted images, and combin-
ing them with relatively higher resolution T2-weighted images
will likely dampen the advantages of bSSFP because they will no
longer be compared with a limited single-plane spin-echo T1-
weighted sequence. Nevertheless, using high-resolution bSSFP-
derived sequences can certainly be useful.
REFERENCES1. Buch K, Caruso P, Ebb D, et al. Balanced steady-state free precession
sequence (CISS/FIESTA/3D driven equilibrium radiofrequency re-set pulse) increases the diagnostic yield for spinal drop metastases inchildren with brain tumors. AJNR Am J Neuroradiol 2018;39:1355– 61CrossRef Medline
2. Melhem ER, Itoh R, Folkers PJ. Cervical spine: three-dimensional fastspin-echo MR imaging–improved recovery of longitudinal magneti-zation with driven equilibrium pulse. Radiology. 2001;218:283– 88CrossRef Medline
3. Bieri O, Scheffler K. Fundamentals of balanced steady state free pre-cession MRI. J Magn Reson Imaging. 2013;38:2–11 CrossRef Medline
4. Casselman JW, Kuhweide R, Deimling M, et al. Constructive interfer-ence in steady state-3DFT MR imaging of the inner ear and cerebel-lopontine angle. AJNR Am J Neuroradiol 1993;14:47–57 Medline
X A. VossoughChildren’s Hospital of Philadelphia
University of PennsylvaniaPhiladelphia, Pennsylvania
X E.R. MelhemDepartment of Radiology
University of Maryland Medical CenterBaltimore, Marylandhttp://dx.doi.org/10.3174/ajnr.A5964
E20 Letters May 2019 www.ajnr.org

REPLY:
We appreciate the comments made by Drs Vossough and
Melhem and wish to clarify the techniques described in our
article.
We acknowledge your comment that 3D driven equilibrium
pulses are not typically relevant to or applied in balanced steady-
state free precession (bSSFP), which is a gradient recalled-echo
sequence. By the use of this term in the title, we did not mean to
imply a technical equivalency but simply included the 3D driven
equilibrium radiofrequency reset pulse in this setting because of
its use in similar indications, such as the evaluation of drop me-
tastases or vestibular schwannomas on a Philips platform.
While your comments about bSSFP, off-resonance banding
artifacts, long TRs, and the 2-pass phase alternation strategy for
mitigating phase-shift errors and banding are well taken, FIESTA
sequences do work well, in our experience, for the evaluation of
drop metastases. We found that these artifacts are less trouble-
some when using a TR of 5.288 –5.948 ms on our 1.5T Signa
scanner (GE Healthcare, Milwaukee, Wisconsin). In fact, our
study includes cases with FIESTA and does not include cases with
the longer 2-pass FIESTA-C version. On the 3T Tim Trio (Sie-
mens, Erlangen, Germany) scanner platform, however, the TR of
11.69 ms is quite long for a bSSFP scan, especially at 3T in which
the phase cycling of the different signal pathways will be increased,
and this was the very reason why the 2-pass CISS approach was
used.
Our article provides accurate parameters and sequence desig-
nations for both the CISS and FIESTA sequences used on all pa-
tients included in our study.
In our article, we highlighted the utility of the bSSFP sequence
as an adjunct to the postcontrast T1-weighted images of the spine
for the detection of drop metastases in pediatric patients with
primary brain tumors. While newer thin-section imaging tech-
niques may potentially improve the diagnostic yield of postgado-
linium T1 imaging for the evaluation of drop metastases, we be-
lieve the bSSFP sequence will remain very useful, particularly in
the setting of nonenhancing and small drop metastases.X K. Buch
X S. RinconX P. Caruso
Department of NeuroradiologyX J.E. Kirsch
MR Division, Department of RadiologyMassachusetts General Hospital
Boston, Massachusettshttp://dx.doi.org/10.3174/ajnr.A6049
AJNR Am J Neuroradiol 40:E21 May 2019 www.ajnr.org E21

LETTERS
Across the Pons and to the Milky Way: Where Are theNeuroradiology Publications?
Five years ago, we published an article in the American Journal of
Neuroradiology that demonstrated that publications describ-
ing imaging features of various uncommon CNS diseases pre-
dominate in the clinical, rather than radiology, literature.1 Short,
simple, and purely an enumeration of journal articles, Impact
Factors, and radiologist authorship, our article was a practical
wake-up call to authors, reviewers, and publishers of radiologic
content that remains relevant today. Specifically, there continue
to be frequent reports of novel neuroradiology findings of impor-
tant conditions, even in instances in which such imaging findings
are the primary purpose, embedded within the nonradiology lit-
erature. While a clinician target audience is understandable in
many cases in which the impact of such findings on clinical care is
paramount, even in these instances, acknowledged neuroradiol-
ogy interpretation of the images and neuroradiology authorship
can be lacking.1
For example, consider just 1 disease process: progressive mul-
tifocal leukoencephalopathy. A few months ago, an interesting
case report described the “punctate MR imaging pattern” in the
setting of systemic lupus erythematosus-associated progressive
multifocal leukoencephalopathy.2 This case report is found in a
clinical journal with authors affiliated with neurology, pathology,
and virology departments. Various other recently reported imag-
ing patterns or “signs” of progressive multifocal leukoencepha-
lopathy discussed within this article or related articles include the
“across the pons sign,” “inverse trident sign,” “barbell sign,”
“laminar cortical hypointensity” and other findings on suscepti-
bility-weighted imaging, and the “Milky Way” appearance.2-8 Al-
though some of these other articles on this topic did include rep-
resentation of radiologists in the authorship list, only the “barbell
sign” was found to be primarily described in a radiology journal.
To research further, I performed a PubMed search from January
1, 2017, to January 1, 2019, with the following criteria: (MR im-
aging OR MR imaging) AND (PML or progressive multifocal leu-
koencephalopathy). This search resulted in 96 publications, 6
(6%) of which were published in radiology journals.
Clinicians may be exposed to (and, indeed, may indepen-
dently author) articles describing neuroradiology features and
signs that could evade members of the neuroradiology commu-
nity. Although the reasons for this phenomenon of radiology de-
scriptions appearing in clinical journals are multifactorial, 1 fac-
tor is that a high percentage of these signs are found in case
reports, which are still published in some clinical journals but not
as frequently in radiology journals. Other factors may include the
larger number of clinical, compared with radiology, journals or
perhaps articles by highly subspecialized clinicians who have a
preference for publishing in a clinical journal.
One could submit that in the era of electronic article searches,
the precise journal classification is less relevant than it was in the
past. However, it is not always easy to find these described find-
ings embedded in clinical journals during a busy shift, and neu-
roradiologists may not be prompted to search for them if they are
unaware of their existence. In addition, due to blinding of the
peer-review process, it is not known how frequently radiologists
are invited to participate in the adjudication of such articles before
publication in clinical journals, potentially contributing to vari-
ability in the utility and accuracy of reported findings. Five years
after our study demonstrated a preponderance of neuroradiolo-
gy-focused literature published in clinical journals, it appears as
though this practice persists. It is incumbent on the neuroradiolo-
gist to be cognizant of alternate sources of information and to
challenge and/or validate findings in the peer-reviewed radiology
literature. Finally, wherever possible, it is important that neuro-
radiologists be visible within multidisciplinary care teams and en-
gaged in clinical research. Such participation may help raise the
quality of reporting of radiologic findings and ensure that they are
represented in the appropriate specialty literature sources.
REFERENCES1. Lehman VT, Doolittle DA, Hunt CH, et al. Intracranial imaging of
uncommon diseases is more frequently reported in clinical publica-tions than in radiology publications. AJNR Am J Neuroradiol 2014;35:45– 48 CrossRef Medline
2. Ishii J, Shishido-Hara Y, Kawamota M, et al. A punctate magneticresonance imaging pattern in a patient with systemic lupuserythematosus is an early sign of progressive multifocalleukoencephalopathy: a clinicopathologic study. Intern Med 2018;57:2727–34 CrossRef Medline
3. Hodel J, Darchis C, Outteryck O, et al. Punctate pattern: a promisinghttp://dx.doi.org/10.3174/ajnr.A6039
E22 Letters May 2019 www.ajnr.org

imaging biomarker for the diagnosis of natalizumab-associatedPML. Neurology 2016;86:1516 –23 CrossRef Medline
4. Jain RS, Nagpal S, Tejwani S. ‘Hot-cross bun’ and ‘inverse tridentsign’ in progressive multifocal leukoencephalopathy with HIV sero-positivity. Neurol India 2014;62:341– 42 CrossRef Medline
5. Sinnecker T, Othman J, Kuhl M, et al. 7T MRI in natalizumab-asso-ciated PML and ongoing MS activity: a case study. Neurol Neuroim-munol Neuroinflamm 2015;2:e171 CrossRef Medline
6. Bezuidenhout AF, Andronikou S, Ackermann C, et al. “Barbell Sign”:a diagnostic imaging finding in progressive multifocal leukoenceph-alopathy. J Comput Assist Tomogr 2018;42:527–30 CrossRef Medline
7. Pontillo G, Cocozza S, Lanzillo R, et al. Brain susceptibility
changes in a patient with natalizumab-related progressive multi-focal leukoencephalopathy: a longitudinal quantitative susceptibilitymapping and relaxometry study. Front Neurol 2017;8:294 CrossRefMedline
8. Papadimitropoulos GN, Lachanis S, Zompola C, et al. Laminar corti-cal hypointensities in susceptibility-weighted imaging in a case ofprogressive multifocal leukoencephalopathy. J Clin Neurol 2017;13:201– 02 CrossRef Medline
X V.T. LehmanDepartment of Radiology
Mayo Clinic College of Graduate Medical EducationRochester, Minnesota
AJNR Am J Neuroradiol 40:E22–E23 May 2019 www.ajnr.org E23

LETTERS
Radiogenomics in Medulloblastoma: Can the Human BrainCompete with Artificial Intelligence and Machine Learning?
We read with keen interest “MR Imaging-Based Radiomic
Signatures of Distinct Molecular Subgroups of Medullo-
blastoma” published recently in your prestigious journal.1 We
would like to congratulate the authors for their multi-institu-
tional collaborative study wherein radiomic features extracted
from MR imaging coupled with machine learning led to the pre-
diction of molecular subgroups in medulloblastoma. Recently, it
has become increasing possible to extract meaningful informa-
tion beyond staging from diagnostic imaging (radiophenotypes)
for correlation with genomic data and molecular markers (mo-
lecular phenotypes), leading to the exciting and emerging field of
radiogenomics.2,3 The introduction of computer-based algo-
rithms (including artificial intelligence and machine learning ap-
proaches) has not only refined the assessment of semantic features
but also allows simultaneous extraction of agnostic features (his-
tograms, textures, wavelets, and fractal dimensions), which gen-
erally go beyond the limited capabilities of the human brain. Such
automated high-throughput processing of big data significantly
reduces time and virtually eliminates interobserver variability.
In the referenced study, Iv et al,1 extracted 590 radiomic fea-
tures such as intensity-based histograms, tumor-edge sharpness,
Gabor features, and local area integral invariant features from T1-
and T2-weighted MR imaging in a multi-institutional cohort of
109 children with medulloblastoma and used support vector ma-
chine algorithms to identify the 4 molecular subgroups: wingless
(WNT), sonic hedgehog (SHH), group 3, and group 4, respec-
tively. Receiver operating characteristic (ROC) analysis revealed
better performance of the double 10-fold cross-validation model
for predicting SHH, group 3, and group 4 medulloblastoma using
a combination of T1- and T2-weighted images as demonstrated
by high area under the curve (AUC) values. The independent
3-dataset cross-validation strategy demonstrated acceptably high
predictive accuracy of select radiomic features for SHH and group
4 medulloblastoma.
Most interesting, we had also reported similar results4 in a
single-institution cohort of 111 patients with medulloblastoma,
which, surprisingly, was not even cited by the authors. In our
study, preoperative multiparametric MR imaging (primarily T1-
and T2-weighted sequences including postcontrast images) was
rigorously evaluated visually by a multidisciplinary team of radi-
ologists and clinicians (blinded to molecular subgrouping) to
document and categorize a set of 13 predefined semantic imaging
features and assign a probable molecular subgroup. Two-thirds of
patients were chosen randomly from individual subgroups to
form the training cohort, while the remaining one-third consti-
tuted the validation cohort. Multinomial logistic regression anal-
ysis was performed in the training cohort to identify imaging fea-
tures with the highest discrimination of 1 subgroup from the
other 3 subgroups to construct subgroup-specific binary nomo-
grams, which were subsequently tested in the validation cohort.
Predictive accuracy of subgroup-specific nomograms was defined
by AUC on ROC analysis, which was highest for the SHH sub-
group followed by group 4 medulloblastoma. Group 3 and
WNT subgroup nomograms had suboptimal and unacceptable
accuracy.
A comparison of the predictive accuracy of MR imaging fea-
tures (radiomic versus semantic) for molecular subgrouping of
medulloblastoma is presented in the Table. A somewhat similar
(if not better) performance of the human brain compared with
computer-based algorithms via artificial intelligence and machine
learning approaches, though somewhat intriguing, is quite reas-
suring and encouraging. Neither radiomic nor semantic MR im-
aging features identified the WNT pathway (best survival) and
group 3 medulloblastoma (worst survival) robustly and accu-
rately, posing considerable challenges in adopting imaging bio-
markers in contemporary neuro-oncologic practice. However, we
do believe that the inclusion of advanced and additional MR im-
aging sequences like diffusion-weighted imaging, gradient-echo,
http://dx.doi.org/10.3174/ajnr.A6040
Comparison of predictive accuracy defined as AUC on ROCanalyses reported in the 2 studies1,4
MolecularSubgrouping of
Medulloblastoma
AUC UsingRadiomic MRI
Signatures
AUC UsingSemantic MRI
Features
Double 10-FoldCross-
ValidationModel
3-DatasetCross-
ValidationModel
TrainingCohort(n = 76)
ValidationCohort(n = 35)
WNT 0.45 0.45 0.75 0.69SHH 0.79 0.70 0.94 0.99Group 3 0.70 0.39 0.73 0.60Group 4 0.83 0.80 0.85 0.79
E24 Letters May 2019 www.ajnr.org

and spectroscopy, coupled with further technologic refinement of
advanced machine-classifier tools could potentially further im-
prove the predictive accuracy of such radiogenomic correlation.
REFERENCES1. Iv M, Zhou M, Shpanskaya K, et al. MR imaging-based radiomic sig-
natures of distinct molecular subgroups of medulloblastoma. AJNRAm J Neuroradiol 2019;40:154 – 61 CrossRef Medline
2. Kuo MD, Jamshidi N. Behind the numbers: decoding molecular phe-notypes with radiogenomics: guiding principles and technical con-siderations. Radiology 2014;270:320 –25 CrossRef Medline
3. Zhou M, Scott J, Chaudhury B, et al. Radiomics in brain tumor:
image assessment, quantitative feature descriptors, and machine-learning approaches. AJNR Am J Neuroradiol 2018;39:208 –16CrossRef Medline
4. Dasgupta A, Gupta T, Pungavkar S, et al. Nomograms based on pre-operative multiparametric magnetic resonance imaging for predic-tion of molecular subgrouping in medulloblastoma: results from aradiogenomics study of 111 patients. Neuro Oncol 2019;21:115–24CrossRef Medline
X A. DasguptaX T. Gupta
Department of Radiation OncologyTata Memorial Centre
Mumbai, India
AJNR Am J Neuroradiol 40:E24 –E25 May 2019 www.ajnr.org E25