
Complete Issue - International Journal of Environmental ...
99
-
Upload
khangminh22 -
Category
Documents
-
view
2 -
download
0
Transcript of Complete Issue - International Journal of Environmental ...


Page | i
Preface
We would like to present, with great pleasure, the inaugural volume-3, Issue-5, May 2017, of a scholarly
journal, International Journal of Environmental & Agriculture Research. This journal is part of the AD
Publications series in the field of Environmental & Agriculture Research Development, and is devoted to
the gamut of Environmental & Agriculture issues, from theoretical aspects to application-dependent studies
and the validation of emerging technologies.
This journal was envisioned and founded to represent the growing needs of Environmental & Agriculture as
an emerging and increasingly vital field, now widely recognized as an integral part of scientific and
technical investigations. Its mission is to become a voice of the Environmental & Agriculture community,
addressing researchers and practitioners in below areas
Environmental Research:
Environmental science and regulation, Ecotoxicology, Environmental health issues, Atmosphere and
climate, Terrestric ecosystems, Aquatic ecosystems, Energy and environment, Marine research,
Biodiversity, Pharmaceuticals in the environment, Genetically modified organisms, Biotechnology, Risk
assessment, Environment society, Agricultural engineering, Animal science, Agronomy, including plant
science, theoretical production ecology, horticulture, plant, breeding, plant fertilization, soil science and
all field related to Environmental Research.
Agriculture Research:
Agriculture, Biological engineering, including genetic engineering, microbiology, Environmental impacts
of agriculture, forestry, Food science, Husbandry, Irrigation and water management, Land use, Waste
management and all fields related to Agriculture.
Each article in this issue provides an example of a concrete industrial application or a case study of the
presented methodology to amplify the impact of the contribution. We are very thankful to everybody within
that community who supported the idea of creating a new Research with IJOEAR. We are certain that this
issue will be followed by many others, reporting new developments in the Environment and Agriculture
Research Science field. This issue would not have been possible without the great support of the Reviewer,
Editorial Board members and also with our Advisory Board Members, and we would like to express our
sincere thanks to all of them. We would also like to express our gratitude to the editorial staff of AD
Publications, who supported us at every stage of the project. It is our hope that this fine collection of articles
will be a valuable resource for IJOEAR readers and will stimulate further research into the vibrant area of
Environmental & Agriculture Research.
Mukesh Arora
(Editor-in Chief)
Dr. Bhagawan Bharali
(Managing Editor)

Page | ii
Fields of Interests Agricultural Sciences
Soil Science Plant Science
Animal Science Agricultural Economics
Agricultural Chemistry Basic biology concepts
Sustainable Natural Resource Utilisation Management of the Environment
Agricultural Management Practices Agricultural Technology
Natural Resources Basic Horticulture
Food System Irrigation and water management
Crop Production
Cereals or Basic Grains: Oats, Wheat, Barley, Rye, Triticale,
Corn, Sorghum, Millet, Quinoa and Amaranth
Oilseeds: Canola, Rapeseed, Flax, Sunflowers, Corn and
Hempseed
Pulse Crops: Peas (all types), field beans, faba beans, lentils,
soybeans, peanuts and chickpeas. Hay and Silage (Forage crop) Production
Vegetable crops or Olericulture: Crops utilized fresh or whole
(wholefood crop, no or limited processing, i.e., fresh cut salad);
(Lettuce, Cabbage, Carrots, Potatoes, Tomatoes, Herbs, etc.)
Tree Fruit crops: apples, oranges, stone fruit (i.e., peaches,
plums, cherries)
Tree Nut crops: Hazlenuts. walnuts, almonds, cashews, pecans Berry crops: strawberries, blueberries, raspberries
Sugar crops: sugarcane. sugar beets, sorghum Potatoes varieties and production.
Livestock Production
Animal husbandry Ranch
Camel Yak
Pigs Sheep
Goats Poultry
Bees Dogs
Exotic species Chicken Growth
Aquaculture
Fish farm Shrimp farm
Freshwater prawn farm Integrated Multi-Trophic Aquaculture
Milk Production (Dairy)
Dairy goat Dairy cow
Dairy Sheep Water Buffalo
Moose milk Dairy product
Forest Products and Forest management
Forestry/Silviculture Agroforestry
Silvopasture Christmas tree cultivation
Maple syrup Forestry Growth
Mechanical
General Farm Machinery Tillage equipment
Harvesting equipment Processing equipment
Hay & Silage/Forage equipment Milking equipment
Hand tools & activities Stock handling & control equipment
Agricultural buildings Storage

Page | iii
Agricultural Input Products
Crop Protection Chemicals Feed supplements
Chemical based (inorganic) fertilizers Organic fertilizers
Environmental Science
Environmental science and regulation Ecotoxicology
Environmental health issues Atmosphere and climate
Terrestric ecosystems Aquatic ecosystems
Energy and environment Marine research
Biodiversity Pharmaceuticals in the environment
Genetically modified organisms Biotechnology
Risk assessment Environment society
Theoretical production ecology horticulture
Breeding plant fertilization

Page | iv
Board Members
Mukesh Arora(Editor-in-Chief)
BE(Electronics & Communication), M.Tech(Digital Communication), currently serving as Assistant Professor in the
Department of ECE.
Dr. Bhagawan Bharali (Managing Editor)
Professor & Head, Department of Crop Physiology, Faculty of Agriculture, Assam Agricultural University, Jorhat-
785013 (Assam).
Dr. Josiah Chidiebere Okonkwo
PhD Animal Science/ Biotech (DELSU), PGD Biotechnology (Hebrew University of Jerusalem Senior Lecturer,
Department of Animal Science and Technology, Faculty of Agriculture, Nau, AWKA.
Dr. Sunil Wimalawansa
MD, PhD, MBA, DSc, is a former university professor, Professor of Medicine, Chief of Endocrinology, Metabolism
& Nutrition, expert in endocrinology; osteoporosis and metabolic bone disease, vitamin D, and nutrition.
Dr. Rakesh Singh
Professor in Department of Agricultural Economics, Institute of Agricultural Sciences, Banaras Hindu University,
Also Vice President of Indian Society of Agricultural Economics, Mumbai
Dr. Ajeet singh Nain
Working as Professor in GBPUA&T, Pantnagar-263145, US Nagar, UK, India.
Prof. Salil Kumar Tewari
Presently working as Professor in College of Agriculture and Joint Director, Agroforestry Research Centre (AFRC) /
Program Coordinator in G.B. Pant University of Agric. & Tech.,Pantnagar - 263 145, Uttarakhand (INDIA).
Goswami Tridib Kumar
Presently working as a Professor in IIT Kharagpur from year 2007, He Received PhD degree from IIT Kharagpur in
the year of 1987.
Dr. Mahendra Singh Pal
Presently working as Professor in the dept. of Agronomy in G. B. Pant University o Agriculture & Technology,
Pantnagar-263145 (Uttarakhand).
Jiban Shrestha
Scientist (Plant Breeding & Genetics)
Presently working as Scientist (Plant Breeding and Genetics) at National Maize Research Programme (NMRP),
Rampur, Chitwan under Nepal Agricultural Research Council (NARC), Singhdarbar Plaza, Kathmandu, Nepal.

Page | v
Dr. V K Joshi
Professor V.K.Joshi is M.Sc., Ph.D. (Microbiology) from Punjab Agricultural University, Ludhiana and Guru Nanak
Dev University, Amritsar, respectively with more than 35 years experience in Fruit Fermentation Technology,
Indigenous fermented foods, patulin ,biocolour ,Quality Control and Waste Utilization. Presently, heading the dept.
of Food Science and Technology in University of Horticulture and Forestry, Nauni-Solan (HP), India.
Mr. Aklilu Bajigo Madalcho
Working at Jigjiga University, Ethiopia, as lecturer and researcher at the College of Dry land Agriculture, department
of Natural Resources Management.
Dr. Vijay A. Patil
Working as Assistant Research Scientist in Main Rice Research Centre, Navsari Agricultural University, Navsari.
Gujarat- 396 450 (India).
Dr. S. K. Jain
Presently working as Officer Incharge of All India Coordinated Sorghum Improvement Project, S. D. Agricultural
University, Deesa, Gujarat.
Dr. Salvinder Singh
Presently working as Associate Professor in the Department of Agricultural Biotechnology in Assam Agricultural
University, Jorhat, Assam.
Dr. Salvinder received MacKnight Foundation Fellowship for pre-doc training at WSU, USA – January 2000- March
2002 and DBT oversease Associateship for Post-Doc at WSU, USA – April, 2012 to October, 2012.
Mr. Anil Kumar
Working as Junior Research Officer/Asstt. Prof. in the dept. of Food Science & Technology in Agriculture &
Technology, Pantnagar.

Table of Contents
S.No Title Page
No.
1
Water hyacinth (Eichhornia crassipes (Mart.): Land use/land cover changes and
community-based management in east Shoa zone, Ethiopia
Authors: Abule Ebro, Kahsay Berhe, Yasin Getahun, Zewdie Adane, Nigatu Alemayehu,
YismaShawal Fayisa, Azage Tegegne
DOI: 10.25125/agriculture-journal-IJOEAR-APR-2017-2
Digital Identification Number: Paper-May-2017/IJOEAR-APR-2017-2
01-11
2
Improvement of Crop Production by Means of a Storage Effect
Authors: Gustáv Murín, Karol Mičieta
DOI: 10.25125/agriculture-journal-IJOEAR-APR-2017-26
Digital Identification Number: Paper-May-2017/IJOEAR-APR-2017-26
12-25
3
Temperature effect on seed germination of four plants in sand from coastal sand dunes in
Greece
Authors: Aglaia Liopa-Tsakalidi, Pantelis E. Barouchas
DOI: 10.25125/agriculture-journal-IJOEAR-APR-2017-31
Digital Identification Number: Paper-May-2017/IJOEAR-APR-2017-31
26-35
4
E-screen assay validation: evaluation of estrogenic activity by MCF7 cell culture bioassay,
in drinking water from different watersheds in state of São Paulo, Brazil
Authors: Ana Maria Cristina Rebello Pinto da Fonseca Martins, Marcio Hipólito, Erna Bach,
Maria Lucia Zaidan Dagli, Josete Garcia Bersano, Luara Lucena Cassiano, Gentile, L.B,
Cassiana Montagner Raimundo
DOI: 10.25125/agriculture-journal-IJOEAR-APR-2017-32
Digital Identification Number: Paper-May-2017/IJOEAR-APR-2017-32
36-42
5
Antifungal activity of lichen extracts and usnic acid for controlling the saprolegniasis
Authors: Shou-Yu Guo, Wen-Xia Liu, Liu-Fu Han, Jia-Zhang Chen
DOI: 10.25125/agriculture-journal-IJOEAR-APR-2017-35
Digital Identification Number: Paper-May-2017/IJOEAR-APR-2017-35
43-47

6
Simultaneous Estimation of Multiple Dairy Technologies uptake
Authors: Yared Deribe, Agajie Tesfaye
DOI: 10.25125/agriculture-journal-IJOEAR-MAY-2017-4
Digital Identification Number: Paper-May-2017/IJOEAR-MAY-2017-4
48-61
7
Association of Hygiene Hypothesis with High prevalence of Allergy and Autoimmune
Diseases: FMT industry
Authors: Peni K Samsuria Mutalib, Mirna Nurasri Praptini, Mutalib Abdullah, Meny Hartati
DOI: 10.25125/agriculture-journal-IJOEAR-MAY-2017-5
Digital Identification Number: Paper-May-2017/IJOEAR-MAY-2017-5
62-66
8
Scientific research contribution to fruticulture development
Authors: José Clélio de Andrade, Moacir Pasqual, Wilson Magela Gonçalves, Ângelo Albérico
Alvarenga, Ester Alice Ferreira
DOI: 10.25125/agriculture-journal-IJOEAR-MAY-2017-6
Digital Identification Number: Paper-May-2017/IJOEAR-MAY-2017-6
67-72
9
Biotermiticides to Protect the Soil Health
Authors: K. J. Kamble, Thakor N. J.
DOI: 10.25125/agriculture-journal-IJOEAR-MAY-2017-9
Digital Identification Number: Paper-May-2017/IJOEAR-MAY-2017-9
73-79
10
Effect of Concentration of Silver Nanoparticles on the Uptake of Silver from Silver
Nanoparticles in Soil
Authors: Sara Pappas, Uday Turaga, Naveen Kumar, Seshadri Ramkumar, Ronald J. Kendall
DOI: 10.25125/agriculture-journal-IJOEAR-MAY-2017-12
Digital Identification Number: Paper-May-2017/IJOEAR-MAY-2017-12
80-90

International Journal of Environmental & Agriculture Research (IJOEAR) ISSN:[2454-1850] [Vol-3, Issue-5, May- 2017]
Page | 1
Water hyacinth (Eichhornia crassipes (Mart.): Land use/land
cover changes and community-based management in east Shoa
zone, Ethiopia Abule Ebro
1*, Kahsay Berhe
2, Yasin Getahun
3, Zewdie Adane
4, Nigatu Alemayehu
5,
YismaShawal Fayisa6, Azage Tegegne
7
1,2,3,5,7International Livestock Research Institute-Livestock and Irrigation Value Chain Project for Ethiopian Smallholders
(LIVES), PO Box 5689, Addis Ababa, Ethiopia 4Justus-Liebig Universität Gießen, Institute for Agricultural Policy and Market Research, Germany
6Bureau of Agriculture, East Shoa Zone, Adama, Ethiopia
Abstract— Water hyacinth was officially reported in Ethiopia in 1956 at Koka Dam and Awash River and it is considered
as a constraint to the development of the country. Thus, this study was undertaken to determine Water hyacinth and
associated land cover/use changes, and capture perceptions regarding community-based management to enhance its proper
control/eradication in Lume and Boa districts, east Shoa zone, Ethiopia using integrated approach. The method of study
included Water hyacinth and associated land use/cover change analyses, focus group discussions, discussions with experts at
the district, zone and region levels and undertaking consultative workshop. The land use/land cover change analyses
revealed increased area coverage by Water hyacinth from about 145.53 ha in 1986 to 2319.48 ha in 2015 with decline in the
area of water bodies and wetlands. The annual rate of increase in the area of the weed was about 51.51% while water bodies
and wetlands declined by about 0.49% and 1.16%, respectively. Of the 10 group discussions undertaken in the study districts
with the communities, 9 of them reported water hyacinth to increase in terms of area coverage since its appearance in their
areas which concurs the results obtained from satellite image analyses and they reported the weed to be very harmful to their
livelihood. Furthermore, the nine group discussants disclosed water hyacinth to be of no use to them. Recommendations
included developing comprehensive management strategies and action plans, analysis and defining roles of each
stakeholder, awareness creation, training, institutional linkages, co-management and reduction of nutrient load in water
bodies.
Keywords— Co-management, control/eradication, Integrated approach, Lume and Bora districts.
I. INTRODUCTION
Water hyacinth, Eichhornia crassipes (Martius) Solms- Laubach, is fast growing aquatic free floating fresh water plant
indigenous to Brazil, Amazon basin and Ecuador region [1]. It was introduced as an ornamental species to adorn the water
bodies in many countries more than a century ago for their attractive blue or purple flowers, oblong to oval glossy leaves
with bulbous petioles. Later, this supposed-to-be prized plant was discovered to be an invasive species and posed serious
socioeconomic and environmental problems affecting millions of people in riparian communities [2]. The sturdy plant has
emerged as a major weed interfering with anthropogenic activities and is recognized as one of the top 10 worst weeds in the
world [3].
In Ethiopia, water hyacinth was first reported in Lake Koka in 1956, the Awash River and since then, it has been found in
different regions of Ethiopia. It is considered as a constraint to the development of the country [4] which has multifaceted
problems such as obstructing electricity generation, irrigation, navigation, and fishing; increasing evapo-transpiration
resulting in water loss, increase cost of crop production, providing habitat for vectors of malaria and bilharzias, harbors
poisonous snakes, causing skin rashes, and hosting agents of amoebic dysentery and typhoid [4, 5] [5] and these effects have
also been documented elsewhere in the world [2, 3]. The weed has infested water bodies in the two intervention districts
(Lume and Bora) of the Livestock and Irrigation Value Chain for Ethiopian smallholders (LIVES) project in east Shoa zone
of Oromia Region and with connection to the Awash River includes Koka Dam, lakes Ellen and Elletoke.
Local farmers in Bora district grow a number of crops for home consumption and sale mainly maize, wheat, haricot bean and
tef (Eragrostis tef) while vegetable production (tomato, onion and others) is practiced along the shores of the lakes, mainly
by private investors. Koka reservoir and lakes Ellen and Elletoke are the main water bodies in the district and are mainly
used for irrigation and fishery. Koka dam is also used for recreation while the primary purpose is for hydro-electric power

International Journal of Environmental & Agriculture Research (IJOEAR) ISSN:[2454-1850] [Vol-3, Issue-5, May- 2017]
Page | 2
generation. Koka dam and the Awash River are also found in Lume district and their use is similar to that in Bora. Similar to
Bora, the livelihood of farmers in Lume is based mainly on crop production which is followed by livestock production in the
form of cattle, sheep, goats, chickens, and equines although the intensity of cropping is more in Lume than in Bora district.
The economic importance of these water bodies in the study districts for many families and nationally is significant [4].
However, the extent of land covered, the spatial and temporal cover changes of water hyacinth and associated land
covers/uses is not documented although there is a growing global concern about land use/cover changes which emerged due
to realization that changes of the land surface influences climate and impact on ecosystem goods and services [6].
Furthermore, despite the long history of this weed in the study districts and compared to complex and diverse nature of the
problem, the interventions undertaken to control the weed particularly, in the open community field, does not much with its
expansion which justifies the need to assess the possibility of applying community-based management (CBM).
The objectives of this paper were to determine water hyacinth and associated land cover/use changes over the past three
decades (1986 to 2015) along water hyacinth infested water bodies and capture perceptions regarding CBM, to enhance
proper control/eradication of the weed in Lume and Bora districts.
II. METHODOLOGY
2.1 Description of the study area
The study was carried out along water hyacinth infested water bodies in two districts, Bora and Lume, east Shoa zone,
Oromia Region, Ethiopia (Figure 1). These two LIVES intervention districts were selected because of the significance of the
weed in the livelihoods of the surrounding farmers and communities beyond. Lume is located at 3901 to 3928 E
longitude, and 840 to 884 N latitude while Bora is located at 3875 to 3906 E longitude, and 810 to 842 N latitude.
Most of the study districts fall within the altitude range of 1,578 to 2,000 meters above sea level (masl). The study districts
are located between 75 and 110 km, southeast of Addis Ababa, capital city of Ethiopia. The districts cover about 1,110.82
km2 with a human population of 206, 248 (Lume = 137, 787 and Bora = 68, 461) [7]. The mean annual temperature in both
districts ranges from 13 to 28°C while the mean annual rainfall is 851 mm in Lume and 500 to 800 mm in Bora. Both
districts receive a bimodal rainfall; the main rain season locally known as Ganna extend from June to September while the
short rainy season (arfasa) from April to May.
FIGURE 1. LOCATION OF THE STUDY AREA IN EAST SHOA ZONE, ETHIOPIA
2.2 Analyses of the changes in the cover of water hyacinth and associated land uses/covers
Changes in the cover of water hyacinth and associated land covers/uses were detected from the analyses of sequence of
satellite imageries (Figure 2). To make the multi-temporal analysis and land cover/use types at various times extraction,
cloud free Landsat TM imageries consisting of Landsat TM of 1986 and Landsat TM of 2015 (path 168 and row 54) were

International Journal of Environmental & Agriculture Research (IJOEAR) ISSN:[2454-1850] [Vol-3, Issue-5, May- 2017]
Page | 3
analyzed to classify the land covers/uses change of the study area. All were acquired in the month of January during the dry
season. Geometric correction and image enhancement were conducted using ERDAS IMAGINE 10.2 software.
Unsupervised classification of the study area was performed prior to field visit and representative points thought to represent
the various land cover classes were marked using GARMIN GPS during field visit (250 GCPS). For the year 1986, false
color composite was prepared using the order of 4, 3, and 2 band sequences and then different enhancements were made to
increase visual interpretation of the image. In addition to GPS, digital camera was used for recording the physical features
about the areas. Ground truthing activity was undertaken not only to provide information about land cover/use types, but also
to provide complementary information needed to improve the final classification. Long transect and guided field walks were
also made by the research team to observe, listen and to verify the status of water hyacinth and associated land cover/use
classes with key informants.
FIGURE 2. LANDSAT IMAGES OF THE STUDY AREA 1986 (LEFT) AND 2015 (RIGHT)
Based on the field check points, supervised classification approach with the maximum likelihood classifier system was
applied to improve the accuracy of water hyacinth and associated land cover/use classification of the images for 1986 and
2015.
Post classification comparison was carried out for two independent images (thematic maps). Difference or change
information was generated by comparing image values of one data set (TM 1986) with those of the corresponding layer
of the second data set (TM 2015), conversion matrix between TM 1986 versus TM 2015 was compiled in the form of a
contingency table. This conversion matrix was used to quantify land cover change in terms of pixel values, ha or percentage
of area coverage. The estimation for the rate of change for the different covers/uses was computed based on the following
formula:
% cover change =
X 100%
Annual rate of change=
X 100%
% Annual rate of change=
X 100%
Where Areaiyearx = area of cover i at the first date, Areaiyearx +1 = area of cover i at the second date, = total
cover area at the first and t years = period in years between the first and second scene acquisition dates.
International Journal of Environmental & Agriculture Research (IJOEAR) ISSN:[2454-1850] [Vol-3, Issue-5, May- 2017]
Page | 4
The recognized land cover/use patterns from satellite images were exported from pixel format into a polygon and then into
shape files with the help of Arc-GIS 10. The 1986 land cover/use pattern was taken as a baseline in the analyses of changes.
2.3 Community perceptions regarding land cover/use changes and CBM of water hyacinth
To gain insight into the perceptions of the communities living along the infested areas regarding land cover/use changes and
relate this with the findings from imageries analyses, and to assess CBM of the weed, focus group discussions (FGDs) were
held. Peasant associations (lowest administrative unit) in the infested localities were identified purposely with the staff of the
district Offices of agriculture, livestock, irrigation, and peasant associations. Eleven FGDs, i.e., 6 in Bora district (Meto
Aleka, Ashwa, Malima berie, Elltoke, Ellen 1 and 2), 4 in Lume (Koka Negewo, Danguge Bakale, Derera Denbela, and
Adada Denbela) and one around Aba Samuel Lake (It is blamed to be the source of water hyacinth by communities) were
undertaken and participants of the FGDs were 8 to 15 people from different sexes, age groups, and educational backgrounds.
2.4 Consultative meeting/workshop
The research team and the Office of agriculture of east Shoa zone organized a one day consultative meeting for researchers
and development actors from across the spectrum to present and discuss research findings, identify research and development
gaps, and the approach to be followed in the management of the weed. A total of 35 development and research actors
participated in the meeting.
III. RESULTS AND DISCUSSION
3.1 Water hyacinth and associated land cover/use maps and their characteristics
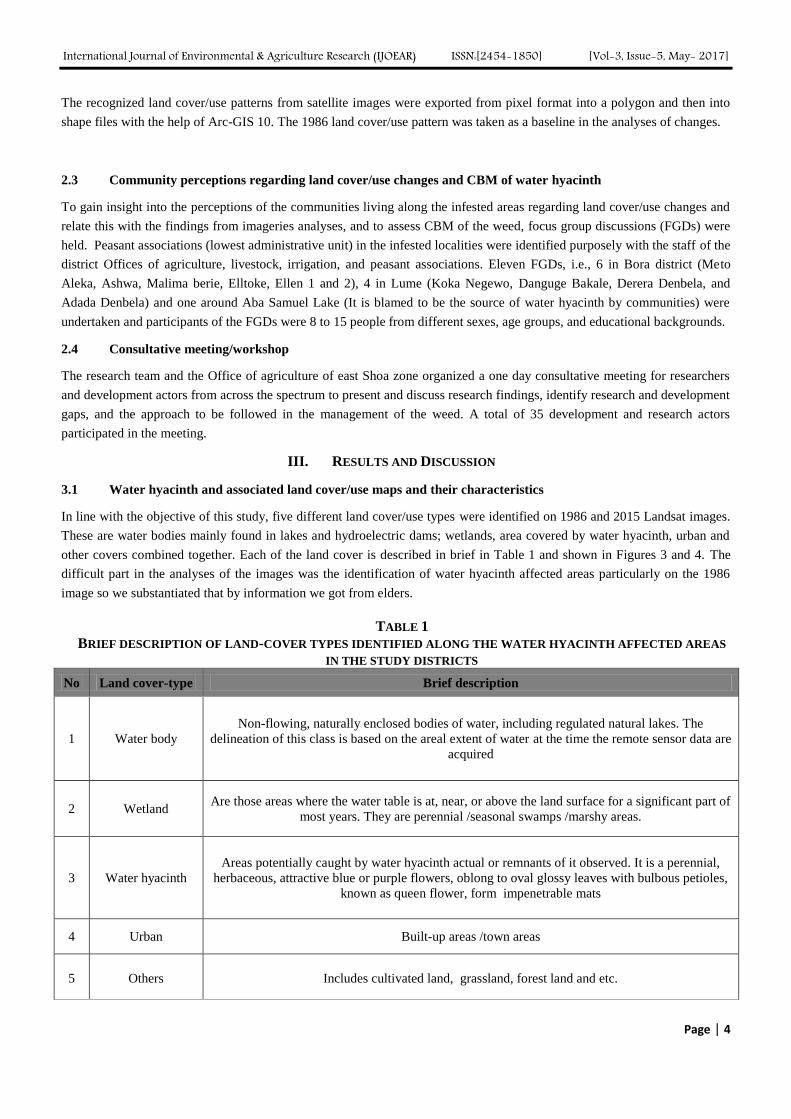
In line with the objective of this study, five different land cover/use types were identified on 1986 and 2015 Landsat images.
These are water bodies mainly found in lakes and hydroelectric dams; wetlands, area covered by water hyacinth, urban and
other covers combined together. Each of the land cover is described in brief in Table 1 and shown in Figures 3 and 4. The
difficult part in the analyses of the images was the identification of water hyacinth affected areas particularly on the 1986
image so we substantiated that by information we got from elders.
TABLE 1
BRIEF DESCRIPTION OF LAND-COVER TYPES IDENTIFIED ALONG THE WATER HYACINTH AFFECTED AREAS
IN THE STUDY DISTRICTS
No Land cover-type Brief description
1 Water body
Non-flowing, naturally enclosed bodies of water, including regulated natural lakes. The
delineation of this class is based on the areal extent of water at the time the remote sensor data are
acquired
2 Wetland Are those areas where the water table is at, near, or above the land surface for a significant part of
most years. They are perennial /seasonal swamps /marshy areas.
3 Water hyacinth
Areas potentially caught by water hyacinth actual or remnants of it observed. It is a perennial,
herbaceous, attractive blue or purple flowers, oblong to oval glossy leaves with bulbous petioles,
known as queen flower, form impenetrable mats
4 Urban Built-up areas /town areas
5 Others Includes cultivated land, grassland, forest land and etc.

International Journal of Environmental & Agriculture Research (IJOEAR) ISSN:[2454-1850] [Vol-3, Issue-5, May- 2017]
Page | 5
FIGURE 3. LAND COVER/USE MAP 1986
FIGURE 4. LAND COVER/USE MAP 2015
3.2 Land cover/use changes
Table 2 presents the coverage of each land cover/use class in 1986 and 2015 including the area and percentage area change
between the two periods for the study area. In the periods considered for the study, our result showed, the land cover
categorized as others was the largest in terms of area coverage because it encompassed different land uses/covers like
cropland, grazing land, forest land, bare land and etc. Of these land covers, according to the opinion of the FGDs, the size of
cultivated land and bare land has increased from time to time. As part of the Central rift Valley, east Shoa zone is well known
for the presence of many lakes and a dam. According to the FGDs, the water bodies assessed were there before 30 years in
their current places with some changes in their area cover with time. The wetlands which cover large shore areas provide

International Journal of Environmental & Agriculture Research (IJOEAR) ISSN:[2454-1850] [Vol-3, Issue-5, May- 2017]
Page | 6
attractive scenery especially during the rainy season and was the third largest in terms of area coverage in both 1986 and
2015. In 1986, the area covered by town/built up area was larger than the land occupied by water hyacinth while the opposite
was true for 2015 (Table 2 and Figures 3 and 4).
TABLE 2
COVER AREA, CHANGED AREA AND THE RATE OF CHANGE BETWEEN 1986 AND 2015 Land covers Land cover (1986) Land cover (2015)
Change
area (ha) % change
Annual
rate of
change
(ha/year)
Average
annual
rate of
change
(%/ year)
Cover
area (ha)
% cover
Coverage
Cover
area (ha)
% cover
Coverage
Water body 17320.86 30.29 14842.71 25.97 -2478.15 -4.33 -85.45 -0.15
Wetland 8971.74 15.69 5943.06 10.4 -3028.68 -5.3 -104.44 -0.18
Water
hyacinth 145.53 0.25 2319.48 4.06 2173.95 3.8 74.96 0.13
Town 322.47 0.56 582.39 1.02 259.92 0.45 8.96 0.02
Others 30414.87 53.2 33487.83 58.59 3072.96 5.37 105.96 0.19
Total land
area 57175.47 57157.47
As indicated in Table 2, between 1986 and 2015, water body and wetland declined by 4.33% and 5.3%, respectively while
the area under water hyacinth, town and others increased. The annual rate of decline in cover was the highest for wetland
(0.18%) followed by water bodies (0.15%) implying that they have lost their land for other land cover/use types. The decline
in the size of wetlands and water body in the study districts goes in line with the general situation prevailing in Ethiopia [8]
and globally [9] where these land covers are declining from time to time. While threats vary between regions and even within
wetlands, agriculture is considered to be the most significant land use type that is replacing the wetlands [10]. The study
found out that the decline in area by these land covers is because of the increase in area of water hyacinth and vegetable
production using irrigation which was also witnessed by the FGDs.
Water hyacinth has a high growth rate as it can double its area coverage in only 5 days [11]. According to the opinion of nine
of the FGDs, the area under water hyacinth has increased in their vicinities. Wind and water are believed to play a role for the
expansion of the weed. With increase in the volume of water in the Awash River (July and August) and putting large areas
under water and aided by wind, the amount of the weed coming to the different peasant associations increases and vice versa.
In October, with the decrease in the volume of water and the changes in the direction of the wind, the weed is taken away and
deposited mainly in Malima Berie, Elletoke and in part of Ellen peasant associations in Bora district. These sites need due
consideration in controlling the expansion of the weed.
Even if the weed seems to have dried, it easily germinates and grows again if it gets water. Gopal (1987) [1] and [12]
reported that water hyacinth can flower throughout the year, release more than 3,000 seeds per year, and double its
population in as little as two weeks. The seeds are long-lived and can live up to 20 years [1]. While seeds may not be viable
at all sites, water hyacinth commonly colonizes new areas through vegetative reproduction and propagation of horizontally
growing stolons [13]. Studies have also shown that the weed favors water bodies with high-nutrient levels, such as those
found downstream of agricultural or urban areas. Under such situations, water hyacinth can increase its biomass eightfold
compared to water bodies that are nutrient poor [14]. Abraham (2009) [15] from his study at Aba Samuel dam near Addis
Ababa reported that increase in temperature, and eutrophication by ways of increase in nutrient level and distribution to be
factors contributing to water hyacinth expansion.
On the other hand, focus group discussants at Ellen PA, in Bora district, who are mainly vegetable producers disclosed that
water hyacinth is disappearing from their PA particularly since the last 5 years. The main reasons for this are the increased
intensity of irrigated vegetable production and the hoof action/trampling of the high livestock density coming to the area for
drinking water.
The study districts are close to Addis Ababa, Adama, and Awassa and they are the major suppliers of vegetables to these
cities. Many jobless youth and women came to these districts to get jobs. As these districts are economically active areas, the
increase in the size of town/built up areas is an expected happening. According to Bassi et al. (2014) [10], rapid urbanization,
and industrialization are some of the causes for decline in wetlands and water bodies globally.

International Journal of Environmental & Agriculture Research (IJOEAR) ISSN:[2454-1850] [Vol-3, Issue-5, May- 2017]
Page | 7
3.3 Land covers transformation/flow
The land covers transition matrix between land cover classes in 1986 and 2015 is shown in Table 3. All land cover categories
except for town/built up areas changed but with varying magnitudes and variations in magnitude of change in different land
covers/uses is quite common in this type of study.
TABLE 3
CHANGE DETECTION MATRIX IN DIFFERENT LAND USE/COVER COVERAGE (HA) BETWEEN 1986 AND 2015.
Cover in 1986
(ha)
Cover in 2015 (ha)
Water Wetland Water hyacinth Town Others
Water (14601.78) 727.65 1557.72 0 433.71
Wetland 49.5 (5215.41) 101.97 0 3604.86
Water hyacinth 108 0 (37.53) 0 0
Town 0 0 0 (322.47) 0
Others 83.43 0 622.26 259.92 (29449.26)
Note: The numbers in brackets indicates the cover area which remained unchanged between 1986 and 2015, while the
numbers without the bracket indicate the flow of covers or covers that changed to other cover category.
Table 4 presents the detected changes in cover for the period of 1986 and 2015 deduced from the change detection matrix.
For instance, a total of 3,756.33 hectares of land from the wet land area was changed to others, water hyacinth and water
body areas (Table 4; Figure 6).
TABLE 4
DETECTED CHANGES IN PERCENTAGE FOR LAND COVERS/USES FOR THE PERIOD 1986 TO 2015.
Changes 1986-2015
area (ha) % of the cover
Wetland to others 3604.86 6.30
Others to urban 259.92 0.45
Water to others 433.71 0.76
Others to water hyacinth 622.26 1.09
Water to water hyacinth 1557.72 2.72
Others to water 83.43 0.15
Water to wetland 727.65 1.27
Wetland to water hyacinth 101.97 0.18
Wetland to water 49.5 0.09
Water hyacinth to water 108 0.19
Table 5 presents a summary on changed and unchanged cover areas between 1986 and 2015. The percentage changed
indicates the percentage area of a particular cover which might have changed to different covers while the percentage
unchanged represents the percentage area of the original area of a particular cover which remained unchanged for a given
period. From Table 5, the water body changed to different land covers by 15.7% while wetland by 41.87%. Nevertheless,
water hyacinth increased by 74.21% while town/built up area by 100.0%.

International Journal of Environmental & Agriculture Research (IJOEAR) ISSN:[2454-1850] [Vol-3, Issue-5, May- 2017]
Page | 8
TABLE 5
PERCENTAGE CHANGES OF INDIVIDUAL COVER BETWEEN 1986 AND 2015.
Cover Unchanged Changed % unchanged % changed
Water 14601.78 2719.08 84.30 15.70
Wetland 5215.41 3756.33 58.13 41.87
Water hyacinth 37.53 108 25.79 74.21
Urban 322.47 0 100.00 0
Others 29449.26 965.61 96.83 3.17
The classification accuracy assessment is shown in table 6. Of all the classes, the land cover/use category “others” exhibited
low user accuracy because it combined different land cover/use types (Table 6).
TABLE 6
THE ACCURACY LEVEL OF EACH LAND COVER CATEGORY AND ERROR MATRIX SHOWING CLASSIFICATION
ACCURACY Classification Water Wetland WH Urban Others Total
Water 50 0 2 0 0 52
Wetland 0 32 0 0 0 32
Water hyacinth 0 0 39 0 0 39
Town 0 0 0 48 1 49
Others 0 18 9 2 49 78
Total 50 50 50 50 50 250
Classification Reference
Total Classified total
No. of
corrected
Producer
Accuracy (%)
Users Accuracy
(%)
Water 50 50 50 100 96.15
Wetland 50 32 32 64 100
Water hyacinth 50 39 39 78 100
Town 50 48 48 96 97.96
Others 50 49 49 98 62.82
Total 250 218 218
Overall accuracy (%) 87.2 %
Overall kappa value 0.84%
Kappa: Estimated as (Ǩ). It reflects the difference between actual agreement and the agreement expected by chance.
Kappa of 0.84 means there is 84% better agreement than by chance alone.
Kappa = observed accuracy – chance agreement/1- Chance agreement
Observed accuracy determined by diagonal in error matrix.
Chance agreement incorporates off-diagonal.
3.4 Community perceptions regarding land cover/use changes and community-based management
All of the FGDs in Lume and 5 of the 6 FGDs in Bora revealed water hyacinth to be of no use to them. Only one FGD in
Bora, composed mainly of farmers involved in irrigated crop production (tomato, onion) around Ellen Lake, informed the
plant to be useful in increasing soil fertility and used as cover plant for seedling establishment and during charcoal
preparation. Although, our study did not include chemical composition analysis of the plant, studies elsewhere indicated that
owing to its high alkalinity (pH>9) and potentially toxic heavy metals contents would restrict its use to flowering-plants, with
no allowable application to horticulture for edible vegetables [16] which requires further investigation under our context.
The Aba Samuel Dam near Addis Ababa (capital city of Ethiopia) is commonly blamed to be the source of water hyacinth by
the FGDs in the lower riparian and in literatures [e.g., 15]. The group discussants at the site, however, reported that because
of the different interventions undertaken in the past 6 years (drying the water and burning the weed repeatedly), water
hyacinth has almost disappeared from the area which requires further ecological study in the area.

International Journal of Environmental & Agriculture Research (IJOEAR) ISSN:[2454-1850] [Vol-3, Issue-5, May- 2017]
Page | 9
In both districts, there is no control and/or eradication method designed by the community for managing the weed.
Traditionally, communities having croplands along the water bodies pull, pile up, dry, and burn the weed for the sake of
clearing their farm land but not meant for controlling the expansion of the weed. Able farmers spend about 2,500 Ethiopian
birr (114.10 USD)/0.25 ha) for pulling, turning, piling up, drying, and burning the weed. Very recently (2014), the Oromia
Regional government of Ethiopia, Bureau of agriculture, has started manual removal of the weed by making some payment
for community members.
The group discussants also revealed the possibility of controlling/eradicating the weed from their area if the plant can be
controlled from the source which is the upstream of the Awash River. Some of the interventions to be undertaken as
suggested by the group discussants are:
Organize communities to burn the plant when it has dried and regular removal of the weed
Technical and financial support be given by government and others for the community particularly for the removal of
the weed inside the water bodies as it will be difficult to remove by human labor alone
Training, awareness creation and strong institutional linkage
According to the group discussants in both districts, there is no CBM and it is only individual effort to clear the weed from
his/her piece of crop land. While the idea of CBM is well accepted in all most all the FGDs and discussions held at different
levels of the offices in the region, the need for proper training on the concept, the way it can be applied, awareness creation
to the communities, and institutional linkage are highly emphasized for its implementation. According to Mironga (2014)
[3], the management of water hyacinth could be government based, community based or co-managed with a strong
component of community participation. Mironga (2014) [3] discussed particular attention should be given to community
mobilization, access to information, and coordination of community-based activities. Communities should also have a role to
play in water hyacinth monitoring and the creation of early-warning systems.
Based on the results of the study, we suggest, the management of water hyacinth in the study area first be handled by co-
management and based on the results be upgraded to CBM as there are many things to be fulfilled in relation to CBM.
3.5 Development and research strategy
Based on the different methods used to undertake the study, short and long term research and development strategies are
outlined (Table 7).
TABLE 7
SHORT AND LONG TERM RESEARCH AND DEVELOPMENT STRATEGIES Short term research and development strategies Long term research and development strategies
Conducting status survey to understand the
magnitude of the damage it is causing
Review what we have at hand
Survey the distribution and perceptions nation wide
Categorizing infested habitats such as riverside, lakes
(closed water), rivers of the infested area and
demarcation
Stakeholders analysis (once identified, they should
be key participants in water-hyacinth research and
control. Secondly, seek to identify key stakeholders
in water resources and entrust them with control of
water hyacinth
Quantification of the socioeconomic and
environmental consequences of water hyacinth (the
exact magnitude of the social, economic, and
environmental problems it causes is poorly
understood in Ethiopia)
Research on policy so as to consider local, national and
regional technology policy and transfer in relation to water-
hyacinth control mechanisms currently in use. At each of
these levels, those concerned should identify, develop, and
implement policy on water-hyacinth control.
Effectiveness of available control methods —the available
methods are not precisely known for their relative
effectiveness in various situations. Furthermore, each one
of these approaches (biological, chemical, and physical
measures) has strengths as well as weaknesses. Although
there is consensus on the need to combine more than one of
these methods in an integrated strategy, no one has
undertaken research to develop this integrated approach in
Ethiopia.
Adoption of high technologies for eradication of water
hyacinth
Use of biological agents
Active involvement of the stakeholders

International Journal of Environmental & Agriculture Research (IJOEAR) ISSN:[2454-1850] [Vol-3, Issue-5, May- 2017]
Page | 10
Identify alternative methods, their costs, and
effectiveness of physical methods
Determine acceptable threshold levels for water
hyacinth
Document the success or failure of control efforts
and implementation and disseminate this information
to key players in water-hyacinth control across the
zone in good time.
Establishment of steering committee with
responsibilities
Awareness creation and further mass mobilization of
the community
Preparing community bylaws
Implementation of control strategies using manual or
mechanical and chemical methods
Improving the awareness of top level policy makers
Develop mechanisms for early recognition of impending
water-hyacinth infestations and problems, using local and
national surveys and monitoring. Use these mechanisms to
send early warnings of impending water-hyacinth
infestations. More research to be conducted on the role of
early-warning mechanisms in the evaluation of programs.
Conduct Environmental Impact Assessments (Because
water hyacinth may contain up to 95% water,
environmental consequences of the removed and
decomposing weed must be evaluated and elucidated).
Furthermore, where manual removal is being done
particular attention must be paid to water hyacinth’s
association with harmful organisms, such as snails, and
implications of manual removal for human health and
ensure adequate protection for those handling the weed.
IV. CONCLUSION
The results show that the extent of the problems in the study area vary from site to site requiring different approaches and use
of different techniques for management of the weed, i.e., physical (manual and mechanical) and biological interventions in
single or in combination depending on the nature and extent of the problem. Intensified monitoring, mitigation and
management measures are needed to keep water hyacinth at unproblematic levels. For this to happen, it is very clear that the
role of communities in control/eradication of water hyacinth should be increased through training, awareness creation,
strengthening linkages, and supporting the communities by proving resources which are beyond their reach.
In view of the major findings of the study and the above conclusions, the following recommendations can be drawn:
It is critical to develop comprehensive management strategies and action plans. A multidisciplinary approach should
be designed, which ensures that the highest political and administrative levels recognize the potential seriousness of
the weed. Solicit the good will of politicians to support water hyacinth control
Plans should also state clearly the role of each government department, stakeholders, municipal councils and local
community involved in the fight against water hyacinth
Methods for water hyacinth control should include reduction of nutrient load in the water bodies through treatment of
waters flowing from sewage works, urban wastes and factories. Changing land use practices in the riparian
communities through watershed management will help reduce agricultural runoff as a mechanism for controlling the
proliferation of water hyacinth
Early detection and monitoring are critical for the management of water hyacinth, as successful eradication or
containment is normally only possible when infestations are small. This is also essential to avoid re-establishment and
further spread from the soil seed bank
Education programs particularly public education and establishment of information center need to be undertaken
ACKNOWLEDGEMENTS
The authors heart fully thank the Oromia Bureau of Agriculture, the offices of agriculture at Adama (zonal), Lume and Bora
districts particularly the natural resource department for facilitating the study and consultative meeting. We also thank the
participants of the workshop for their contribution. Special thanks also go to Ato Fayisa, Ayule Aman, Abu, and Thomas in
facilitating data collection. We sincerely thank the communities in the water hyacinth affected peasant associations at Lumen

International Journal of Environmental & Agriculture Research (IJOEAR) ISSN:[2454-1850] [Vol-3, Issue-5, May- 2017]
Page | 11
and Bora districts for providing us valuable information for writing this article. We also greatly acknowledge the financial
support provided by the Global Affairs Canada (GAC) for undertaking the research.
REFERENCES
[1] B. Gopal, Water hyacinth, Elesevier Science Publishers, Amsterdam, 1987, p. 471.
[2] S. Patel, Threats, management and envisaged utilizations of aquatic weed Eichhornia crassipes: an overview. Rev Environ Sci
Biotechnol 11:249–259. DOI 10.1007/s11157-012-9289-4, 2012.
[3] J. M. Mironga, Lessons for Effective Management of Water Hyacinth (Eichhornia Crassipes (Mart.) Solms) in Kenya, International
Journal of Humanities and Social Science 4: 9(1): 118-126, 2014.
[4] R. Senayit, T. Agajie, T. Taye, W. Adefires, and E. Getu, Invasive Alien Plant Control and Prevention in Ethiopia, Pilot Surveys and
Control Baseline Conditions. Report submitted to EARO, Ethiopia and CABI under the PDF B phase of the UNEP GEF Project –
Removing Barriers to Invasive Plant Management in Africa. EARO, Addis Ababa, Ethiopia, 2004.
[5] T. Taye, F. Rezene, Y. Firehun, T. Dereje, and T. Tamado. Review of invasive weed research in Ethiopia, In: Increasing crop
production through improved plant protection, edited by T. Abraham, Vol. 2. Plant Protection Society of. Ethiopia, Addis Ababa,
Ethiopia, 2009, pp. 381-407.
[6] E.F. Lambin, J. G. Helmut, and L. Erika, Dynamics of land use and land cover change in tropical regions, Annual review of
environment and resources, 28:205-41, 2003, Doi: 10.1146/annurev.nergy.28.050302.105459
[7] Central Statistical Authority (CSA), Human population statistics, Addis Ababa, 2012, Ethiopia.
[8] G. Hagos, T. Gashaw, and A. Mehari, Wetland degradation in Ethiopia: Causes, consequences and remedies, Journal of environment
and earth science 4 (11), 2014: ISSN 2224-3216 (paper) ISSN 2225-0948 (online).
[9] N.C. Davidson, How much wetland has the world lost? Long-term and recent trends in global wetland area, Marine and
FreshwaterResearch 65(10): 934-941, 2014. http://dx.doi. org/10.1071/MF14173
[10] Bassi, N., M.D. Kumar, A. Sharma, and P. Pardha-Saradhi. 2014. “Status of wetlands in India: A review of extent, ecosystem benefits,
threats, and management strategies. Journal of Hydrology regional studies 2: 1–19.
[11] M.J. Ntiba, W.M. Kudoja, and C.T. Mukasa, Management issues in the Lake Victoria watershed, Lake Reservation Management 6:
211-216, 2001.
[12] EEA, The impacts of invasive alien species in Europe, EEA Technical report No 16/2012. Luxembourg: Publications Office of the
European Union, 2012. http://www.eea.europa.eu/publications/impacts-of-invasive-alien-species.
[13] J. Gichuki, R. Omondi, P. Boera, T. Tom Okorut, A. SaidMatano, T. Jembe, and A. Ofulla, Water Hyacinth Eichhornia crassipes
(Mart.) Solms-Laubach Dynamics and Succession in the Nyanza Gulf of Lake Victoria (East Africa): Implications for Water Quality
and Biodiversity Conservation, 2012, The Scientific World Journal Article ID 106429, 10 pages doi:10.1100/2012/106429
[14] J.A. Coetzee, and M.P. Hill, 2012, “The role of eutrophication in the biological control of water hyacinth, Eichhornia crassipes in
South Africa”, 2012, Biocontrol 57: 247: doi:10.1007/s10526-011-9426-y.
[15] H.M, Abraham, “Determination of spatio-temporal differences of water hyacinth and its effects in Lake Aba Samuel, south west of
Addis Ababa, Ethiopia, 2009” A Thesis Submitted to the School of Graduate Studies of Addis Ababa University in partial fulfillment
of the requirements for the Degree of Master of Science in Remote Sensing and Geographic Information Systems. Addis Ababa,
Ethiopia, 97pp.
[16] Y. Zhang, D. Zhang, and S. Barrett, Genetic uniformity characterizes the invasive spread of water hyacinth (Eichhornia crassipes), a
clonal aquatic plant, Molecular Ecology 19: 1774-1786, 2010.

International Journal of Environmental & Agriculture Research (IJOEAR) ISSN:[2454-1850] [Vol-3, Issue-5, May- 2017]
Page | 12
Improvement of Crop Production by Means of a Storage Effect Gustáv Murín
1*, Karol Mičieta
2
Department of Botany, Comenius University, Révová 39, 811 01 Bratislava, Slovakia
Abstract— This study summarizes the results of 30 years of our experiments with Vicia faba L seeds. Our long-term
practical observations of different Vicia faba L. cultivars points out the method useful for the higher yield of seeds in terms of
their viability and thus higher crop production.
Our experiments led to the following important findings regarding of seed viability:
1. Individual and group variability of seeds;
2. Storage condition before germination; and
3. The condition of their germination.
All these three influential conditions is possible to optimalize by method of storage effect described in this our report
resulting in the improvement of crop production. This is especially important in case of seeds that are rare and/or expensive,
i.e. seeds that are genetically modified or with rearranged karyotypes.
Keywords— seed color, higher germination, improvement of viability, higher crop production.
I. INTRODUCTION
Seeds have been studied for more than hundred years (cf. Murín 2001; Murín and Mičieta 2009). The first reports uncovered
the relationship between the decline of their vitality and their storage conditions (Navaschin 1933; Cartledge and Blakeslee
1934, 1935; Stube 1935; Nichols 1942; D’Amato 1951; Murín 1961; Avanzi et al. 1969). Since respiration is the most
marked manifestation of metabolism in stored seeds, it should also be considered. Rieger and Michaelis (1959) found that
V. faba seeds are susceptible to the action of ethanol or other “automutagens” which can accumulate during the respiration of
seeds stored over long period. Bewley and Black (1982, 1994) explored the relationship between the color of the testa and the
dormancy and germination of wheat, as affected by the level of inhibitors (catechinins and their derivates) occurring in the
testa. Floris and Anguillesi (1974) made a major contribution to the understanding of this external manifestation of the
internal state of broad bean seeds when they reported on several biochemical and functional changes in aging seeds. Over the
course of long storage, enzymes like catalase, peroxidase, cytochrome oxidase and decarboxylase display diminished
activity, while the protein-synthesizing capacity of older seeds is lost in the process of germination. Furthermore, membrane
permeability increases, resulting in reduced sugars and other metabolic products.
According Roos (1980) four factors must be considered in seed storage – time, temperature, relative humidity (seed moisture
content) and a level of oxygen. With the exception of recalcitrant species, two factors – time and oxygen level, have very
little effect on storability if the optimum seed moisture content and storage temperatures are observed. For example, Roberts
and Ellis (1977) predicted the 95% survival of pea (Pisum sativum L.) seeds after 1,090 years of storage at -20°C and 5%
seed moisture content. If the storage temperature is reduced further, the viability may be extended indefinitely. Attempts to
prolong life of seeds during the storage were focused at the use of liquid nitrogen (LN2) as a storage medium with a
temperature -196°C. At this temperature, presumably all biochemical activity is reduced to essentially zero. Thus the
deteriorative changes noted above should be eliminated. According Babasaheb (2004), safe seed storage moisture should be
less than 8%.
In 1981, King et al. reported that the survival of lemon (Citrus limon L.), lime (C. aurantifolia Swing.) and sour orange seeds
(C. aurantium L.) was examined under a wide range of constant moisture contents and temperatures. Seed longevity was
increased by decreasing the moisture content and temperature of the storage environment. Maximum viability was
maintained in a combination of storage conditions including the lowest moisture content (5%) and lowest temperature (-
20°C). The practicality of the dry storage of citrus seeds for genetic conservation was pointed out.

International Journal of Environmental & Agriculture Research (IJOEAR) ISSN:[2454-1850] [Vol-3, Issue-5, May- 2017]
Page | 13
Bonner (1990) offered classification of stored seeds into four classes of storage characteristics: „‘true orthodox’ seeds can be
stored for long periods at seed moisture contents of 5–10% and sub-freezing temperatures; ‘sub-orthodox’ seeds can be
stored under the same conditions, but for shorter periods due to high lipid content or thin seed coats; ‘temperate recalcitrant’
seeds cannot be dried at all, but can be stored for 3–5 years at near-freezing temperatures; and ‘tropical recalcitrant’ seeds
also cannot be dried, and they are killed by temperatures below 10–15°C.“
Grilli et al. (1995) described the level of Poly (A) Polymerase as a significant marker of the viability of seeds during their
long term storage. Also, during imbibition the production of the major organic volatiles, ethanol and acetaldehyde, depends
greatly on the long term storage of the seeds (Górecki et al. 1992). Murthy et al. (2002) identified two primary biochemical
reactions responsible for deterioration of seed vigour during long term storage – lipid peroxidation and non-enzymatic
protein glycosylation reducing sugars. The PCR analysis of Chwedorzewska et al. (2002) led the authors to the conclusion
that long term storage of seeds causing the loss of their viability also generates heritable changes in the preserved germplasm.
On the other hand, antioxidant activity in stored seeds under different conditions (temperature and w.c.) is not related to seed
viability (Merritt et al. 2003). However, Andreev et al. (2004) found that the loss of germination during the storage of rye
seeds was accompanied by a decreased excision of chromatin loop domains. As Patrick and Stoddard (2010) stated, “the
large seed size of the faba bean has enabled this species to be a model for studies of the molecular physiology of seed
development.”
The darkening of the testa of aging V. faba L. seeds and its manifestation has been a practical part of our work since 1988
(Murín 1988 a, b). Today we know that the color of the testa indicates the viability as well as the age of the seeds. Our goal
was to study the relationship between the different storage conditions, the color of the testa of seeds and the viability of the
seed samples.
II. MATERIALS AND METHODS
2.1 Seed samples
For our experiments we used sets of V. faba L. cv. Inovec seeds of the standard karyotype harvested in 1974 and also for
each year from 1976 to 1982. Non-standard, rearranged ACB karyotype (Michaelis and Rieger 1971) were harvested in 1975
and 1982. The oldest cultivar Přerovský was from 1971.
The colors of the seeds were classified from A to U according to Fisher-Saller's scale in order to determine their individual
variability. Originally designed for hair color, this scale was used for the first time by us because it registers a wide spectrum
of brown hues. In the first experiment, a total of 1,419 broad bean seeds were examined in this way. The effect of storage
time and conditions on seed coat color was also reported by Yousif et al. (2003) in their study of Australian adzuki beans.
2.2 Soaking and germination
The conditions for standard soaking and germination were altered during our experiments according to the knowledge we
obtained in each experimental stage. Our optimal set involved the soaking of seeds in plastic jars that allowed their continual
air-bubbling of distilled water. The seeds were then germinated in wet sawdust. The last six experiments were germinated
and grown in intact material Perlite.
As V. faba is sensitive to hypoxia, we made the following arrangements to prevent higher sensitivity affecting the results of
our experiments: a) better air circulation in the desiccators, which were not kept at 25 °C, but at laboratory room temperature;
b) during soaking, we used 5% chloramine B to prevent microbe contamination of the seedlings which were treated for 30
min and then washed with distilled water; and c) the seeds were germinated in wet sawdust instead of wet cotton wool which
does not permit the satisfactory respiration of seeds.
2.3 Storage
2.3.1 Storage conditions
All of the harvested V. faba seeds from our supply were stored at room temperature. Rearranged ACB karyotype was stored
at 4 °C.
International Journal of Environmental & Agriculture Research (IJOEAR) ISSN:[2454-1850] [Vol-3, Issue-5, May- 2017]
Page | 14
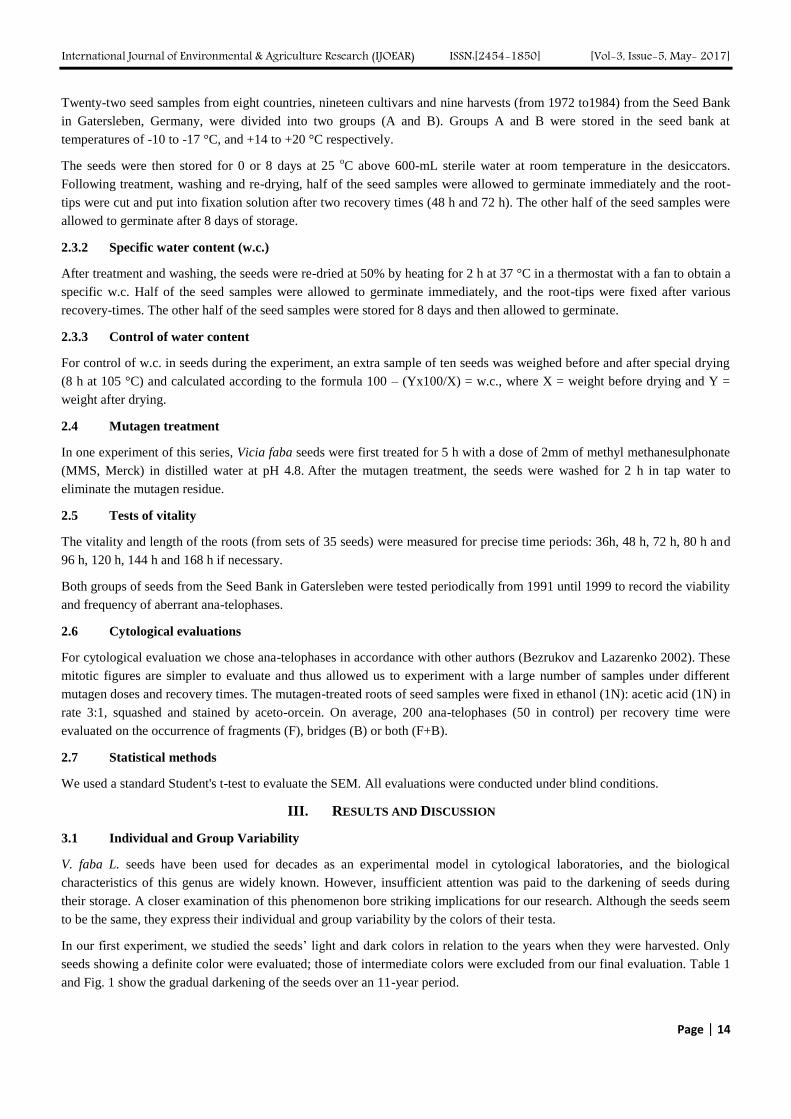
Twenty-two seed samples from eight countries, nineteen cultivars and nine harvests (from 1972 to1984) from the Seed Bank
in Gatersleben, Germany, were divided into two groups (A and B). Groups A and B were stored in the seed bank at
temperatures of -10 to -17 °C, and +14 to +20 °C respectively.
The seeds were then stored for 0 or 8 days at 25 oC above 600-mL sterile water at room temperature in the desiccators.
Following treatment, washing and re-drying, half of the seed samples were allowed to germinate immediately and the root-
tips were cut and put into fixation solution after two recovery times (48 h and 72 h). The other half of the seed samples were
allowed to germinate after 8 days of storage.
2.3.2 Specific water content (w.c.)
After treatment and washing, the seeds were re-dried at 50% by heating for 2 h at 37 °C in a thermostat with a fan to obtain a
specific w.c. Half of the seed samples were allowed to germinate immediately, and the root-tips were fixed after various
recovery-times. The other half of the seed samples were stored for 8 days and then allowed to germinate.
2.3.3 Control of water content
For control of w.c. in seeds during the experiment, an extra sample of ten seeds was weighed before and after special drying
(8 h at 105 °C) and calculated according to the formula 100 – (Yx100/X) = w.c., where X = weight before drying and Y =
weight after drying.
2.4 Mutagen treatment
In one experiment of this series, Vicia faba seeds were first treated for 5 h with a dose of 2mm of methyl methanesulphonate
(MMS, Merck) in distilled water at pH 4.8. After the mutagen treatment, the seeds were washed for 2 h in tap water to
eliminate the mutagen residue.
2.5 Tests of vitality
The vitality and length of the roots (from sets of 35 seeds) were measured for precise time periods: 36h, 48 h, 72 h, 80 h and
96 h, 120 h, 144 h and 168 h if necessary.
Both groups of seeds from the Seed Bank in Gatersleben were tested periodically from 1991 until 1999 to record the viability
and frequency of aberrant ana-telophases.
2.6 Cytological evaluations
For cytological evaluation we chose ana-telophases in accordance with other authors (Bezrukov and Lazarenko 2002). These
mitotic figures are simpler to evaluate and thus allowed us to experiment with a large number of samples under different
mutagen doses and recovery times. The mutagen-treated roots of seed samples were fixed in ethanol (1N): acetic acid (1N) in
rate 3:1, squashed and stained by aceto-orcein. On average, 200 ana-telophases (50 in control) per recovery time were
evaluated on the occurrence of fragments (F), bridges (B) or both (F+B).
2.7 Statistical methods
We used a standard Student's t-test to evaluate the SEM. All evaluations were conducted under blind conditions.
III. RESULTS AND DISCUSSION
3.1 Individual and Group Variability
V. faba L. seeds have been used for decades as an experimental model in cytological laboratories, and the biological
characteristics of this genus are widely known. However, insufficient attention was paid to the darkening of seeds during
their storage. A closer examination of this phenomenon bore striking implications for our research. Although the seeds seem
to be the same, they express their individual and group variability by the colors of their testa.
In our first experiment, we studied the seeds’ light and dark colors in relation to the years when they were harvested. Only
seeds showing a definite color were evaluated; those of intermediate colors were excluded from our final evaluation. Table 1
and Fig. 1 show the gradual darkening of the seeds over an 11-year period.

International Journal of Environmental & Agriculture Research (IJOEAR) ISSN:[2454-1850] [Vol-3, Issue-5, May- 2017]
Page | 15
TABLE 1
PROPORTION OF DARK AND LIGHT SEEDS IN THE COURSE OF AGING
Harvest
(year and cultivar) Proportion and color type of seeds
No. of seeds
examined
No. and color type
of seeds excluded
light dark
1982, ACB 100%; ACB 0.00% 32 0
1981, Inovec 68.78%; A-B 12.14%; G-H 173 33; E, F
1980, Inovec 25.80%; B-C 20.00%; Q, R, S 155 84; F, G, H
1979, Inovec 17.05%; B-C 65.88%; Q, R, S 129 22; G, H
1978, Inovec 11.46%; C-E 71.97%; Q, R, S 157 26; L, M
1977, Inovec
1976, Inovec
1975, ACB
1971, Přerovský
5.48%; A, B, C
5.71%; C-E
7.05%; A-C
0.00%
70.54%; R, S, T
86.28%; S, T
85.47%; R, S, T
100%; U
146
175
241
211
35; E, F G
14; F, G
17; K-L
0
FIGURE 1: PROPORTION (%; ORDINATE) OF LIGHT AND DARK SEEDS IN DIFFERENT HARVESTS (ABSCISSA)
In a set of seven-year-old seeds (harvested in 1975) of the rearranged ACB karyotype that were stored in 4 oC instead of
room temperature we observed a small deviation from the gradual darkening tendency. The higher the proportion of viable
seeds and thus the better germination rate of this seed set confirmed the relationship between seed viability and storage
conditions that was also stated by Michailov and Korytova (1971). We noted with interest the complete loss of viability of 9-
year-old cv. Přerovský seeds and their uniformly dark color (among the darkest on the color scale – U).
In addition to confirming the irreversible tendency of seeds to darken in the course of their storage, these experiments
suggested a possible difference in the viability and germinating capacity of seeds harvested in the same year, but
differentiated by external darkening. Three differently arranged independent experiments (Tables 2 – 4) revealed a clear
difference between dark and light seeds. It shows the importance of individual or inter-individual variability among seeds of
the same age, externally manifested by darkening.
0
10
20
30
40
50
60
70
80
90
100
1982 1981 1980 1979 1978 1977 1976 1975 1971
Light seeds
Dark seeds

International Journal of Environmental & Agriculture Research (IJOEAR) ISSN:[2454-1850] [Vol-3, Issue-5, May- 2017]
Page | 16
TABLE 2
COMPARISON OF GERMINATING CAPACITY OF LIGHT AND DARK SEEDS FROM VARIOUS HARVESTS.
Years of storage and
color
of seeds
No. of germinated seeds out of 16 after
96 hrs 168 hrs Germination rate %
6 years, light 10 4 87.5
dark 0 2 12.5
7 years, light 7 6 81.2
(ABC) dark 0 6 37.5
TABLE 3
COMPARISON OF GERMINATING CAPACITY OF LIGHT AND DARK SEEDS FROM VARIOUS HARVESTS.
Years of storage
and color of seeds
No. of germinated seeds out of 16
after 98 hrs Germination rate %
4 years, light 14 87.5
dark 3 18.7
7 years, light 11 68.7
dark 3 18.7
TABLE 4
COMPARISON OF GERMINATING CAPACITY OF LIGHT AND DARK SEEDS FROM VARIOUS HARVESTS
Years of storage and color of
seeds
No. of germinated seeds after
72 h 96 h 120 h 144 h 168 h Germination rate %
3 years, light 9 5 0 1 0 93.75
dark 2 3 4 1 2 75.00
6 years, light 5 6 2 2 0 93.75
dark 0 0 0 0 2 12.50
The next two experiments aimed at chromosome aberrations of light (more viable) and dark (less viable) colored seeds. In
the first of these experiments, we devoted most of our attention to the 1st-through-2nd mitosis (roots 12-20 mm long) and 3rd
mitosis (roots 20-30 mm long). A total of 5 750 anaphases were examined. Table 5 illustrates the differences in the degree of
chromosome aberration within a harvest (e.g., after 4 years of storage, between light 0.75 0.14% and dark 2.30 1.18%
seeds), the gradual differentiation among harvests having been preserved (dark seeds 1979: 1.73 0.7%, dark seeds 1976:
6.00 0.7%).

International Journal of Environmental & Agriculture Research (IJOEAR) ISSN:[2454-1850] [Vol-3, Issue-5, May- 2017]
Page | 17
TABLE 5
CHROMOSOME ABERRATIONS IN LIGHT AND DARK SEEDS IN THE FIRST MITOSES
Years of storage and
color of seeds
Root length
mm
Aberration rate %
(No. of anaphases examined)
Total aberration
rate %
72 h 94 h 120 h 144 h
4 years, light 12-20
2.0 (800) 1.5 (400) 0.0 (400) 1.0 (300) 1.13 0.4
20-30
0.8 (400) 1.0 (300) 0.5 (200) n.d. 0.75 0.1
dark 12-20
1.3 (300) 3.6 (300) 1.5 (300) 0.5 (200) 1.73 0.7
20-30 2.3 (300) n.d. n.d. n.d. 2.30 1.2
7 years, light 12-20
3.3 (700) 2.0 (200) 1.0 (200) 1.0 (150) 1.82 0.5
20-30
1.0 (250) 1.6 (300) 1.0 (150) n.d. 1.20 0.2
dark 12-20
n.d. 7.0 (200) 5.0 (200) n.d. 6.00 0.7
20-30
n.d. n.d. n.d. 5.0 (150) 5.00 0.0
n. d. = not detected
Examining seeds stored for 4 and 7 years, we found that the differences within a seed set were more marked in older seeds,
while dark seeds were similarly differentiated in the early mitotic cycles. In an additional experiment, we confirmed this
tendency in later mitoses as well. After 98 h of germination, 30 root-tips containing 3,000 anaphases were examined. The
root-length varied from 28 to 84 mm depending on the individual variability, while in most roots it was about 50 mm. In light
seeds of both harvests (Table 6), anaphases were evaluated separately at a root-length of 28-34 mm (3rd mitotic cycle) and of
44-57 mm (4th mitotic cycle).
TABLE 6
CHROMOSOME ABERRATIONS IN LIGHT AND DARK SEEDS IN LATER MITOSES
Years of storage and color type of
seeds Aberration rate %
In roots long
28-34 mm 44-57 mm
Total
4 years, light 0.0 1.2 0.37 0.66 0.3
dark 2.60 0.5 n.d. 2.60 0.5
7 years, light 1.5 0.82 0.5 0.82 1.00 0.3
dark 2.00 1.2 n.d. 2.00 1.2
Three hundred anaphases were examined in each test.
Table 7 shows some difference in the aberration rate between light and dark seeds of the same harvest, while the aberration
rate among seeds of the same color harvested in different years was almost the same. This shows a clear manifestation of
viability dependent at individual variability of seeds.
TABLE 7
COMPARISON OF CHROMOSOME ABERRATION RATE WITH GERMINATION RATE OF SEEDS STORED FOR 4 AND
7 YEARS.
Years of storage and
color type of seeds Aberration rate % Germination rate %
4 years, light 0.66 0.3 87.5
dark 2.60 0.5 18.7
7 years, light 1.00 0.3 68.7
dark 2.00 1.2 18.7
Three hundred anaphases were examined in each test.

International Journal of Environmental & Agriculture Research (IJOEAR) ISSN:[2454-1850] [Vol-3, Issue-5, May- 2017]
Page | 18
This finding is in accordance with already reported changes in the aberration rate of cells in seeds during their long-term
storage (Avanzi et al. 1969; Sevov et al. 1973; Cebrat 1977; Murín 1988a). The comparison of data presented in Tables 1 – 4
confirms this conclusion in relation to seed viability and chromosome damage in root-tip cells (Tables 5 – 7). In the present
case, the external signs of reduced viability (darkening) were manifested, irrespective of their age, with almost corresponding
consequences for genetic and physiological damage. The differences observed between whole seed harvests (indiscernible
among individual seeds) could thus be explained by a decreasing proportion of viable seeds and an increasing number of less
viable (dark) seeds in the same set as a result of long-term storage. In V. faba seeds, this process could be followed from the
100% proportion of light seeds in the youngest set of one-year-old seeds (with the highest germination rate and lowest
aberration rate) to the complete mortality of a seed set after 9 years of storage when the proportion of dark seeds had reached
100%.
To confirm these results, once again new experiments were designed (Tables 8 – 9). Two experiments involved 1-year old
seeds selected by their color (Table 8), and two experiments involved 5-year old seeds with and without the mutagen
treatment (Table 9). This time they were not germinating and growing in sawdust, but in intact material Perlite.
TABLE 8
ONE-YEAR OLD SEEDS SELECTED BY THEIR COLOR TESTED IN VITALITY. GERMINATION AND CHROMOSOMAL
ABERRATIONS IN THEIR ROOT TIPS. 72 h 96 h 120 h
Length of
roots
(mm)
Germi-
nation (%)
Chrom.
ab. (%)
Length of
roots
(mm)
Germi-
nation (%)
Chrom.
ab. (%)
Length of
roots
(mm)
Germi-
nation (%)
Chrom. ab.
(%)
Light
seeds 32.97 100.0 1 37.77 100 2 39.92 100 0.5
Dark seeds 22.15 87.5 2 26.12 90 1 27.62 90 1.5
TABLE 9
FIVE-YEAR OLD SEEDS WITHOUT AND AFTER TREATMENT FOR 5 H WITH DOSE OF 2mM OF METHYL
METHANESULPHONATE (MMS. MERCK)SELECTED BY THEIR COLOR TESTED IN VITALITY. GERMINATION
AND CHROMOSOMAL ABERRATIONS IN THEIR ROOT TIPS.
72 h
96 h
120 h
Length of
roots
(mm)
Germi-
nation (%)
Chrom.
ab. (%)
Length of
roots
(mm)
Germi-
nation (%)
Chrom.
ab. (%)
Length of
roots
(mm)
Germi-
nation (%)
Chrom.
ab. (%)
Light seeds 32.67 100 2.5 37.03 100 1.00 38.0 100 0.9
Dark seeds 21.40 87 4.5 23.43 87 5.57 24.8 87 1.0
72 h
96 h
120 h
MMS.
Merck
Length of
roots
(mm)
Germi-
nation (%)
Chrom.
ab. (%)
Length of
roots
(mm)
Germi-
nation (%)
Chrom.
ab. (%)
Length of
roots
(mm)
Germi-
nation (%)
Chrom. ab.
(%)
Light seeds 18.47 93.5 12.18 20.87 93.5 25.18 21.47 93.5 14.31
Dark seeds 13.70 66.5 8.50 15.60 70.0 17.79 15.87 70.0 25.04
The summarized results are found in Table 10 and confirm all of the previous findings and shows higher sensitivity of dark
colored individuals in vitality, germination and chromosomal aberrations in their root tips. However, we also found some
disturbances in this tendency in comparison with light colored individuals in chromosomal aberrations in recovery times of
72 h and 96 h.

International Journal of Environmental & Agriculture Research (IJOEAR) ISSN:[2454-1850] [Vol-3, Issue-5, May- 2017]
Page | 19
TABLE 10
COMPARISON OF THE PREVIOUS RESULTS FROM TABLES 8-9 SHOWING AN AVERAGE IN ALL TESTED PARAMETERS (LENGTH OF ROOTS. GERMINATION
AND C.A.) WITH SEM BETWEEN 1-YEAR OLD SEEDS (LINES 1-2). 5-YEAR OLD SEEDS (LINES 3-4) AND 5-YEAR OLD SEEDS TREATED BY MUTAGEN (LINES
5-6)
72 h 96 h 120 h
Length of
roots (mm)
Germi-nation
(%)
Chrom. ab.
(%)
Length of
roots (mm)
Germi-nation
(%) Chrom. ab. (%)
Length of
roots (mm)
Germi-nation
(%) Chrom. ab. (%)
Light
seeds 32.98±0.38 100.0±0.00 1.00±0.00 37.78±0.63 100.0±0.00 2.00±1.00 39.93±0.08 100.0±0.00 0.50±0.50
Dark
seeds 22.15±1.80 87.5±2.50 2.00±0.00 26.13±3.23 90.0±0.00 1.00±0.00 27.63±4.48 90.0±0.00 1.50±0.50
Light
seeds 32.67±0.20 100.0±0.00 2.50±0.50 37.03±2.70 100.0±0.00 1.00±0.00 38.00±3.47 100.0±0.00 0.90±0.90
Dark
seeds 21.40±6.13 87.0±0.00 4.50±0.50 23.44±5.17 87.0±0.00 5.57±1.57 24.80±5.27 87.0±0.00 1.00±0.00
Light
seeds 18.47±3.00 93.5±6.50 12.8±5.18 20.87±4.60 93.5±6.50 25.8±11.18 21.47±4.80 93.5±6.50 14.31±1.37
Dark
seeds 13.70±5.10 66.5±3.50 8.50±1.50 15.60±5.13 70.0±10.0 17.79±10.79 15.87±5.27 70.0±10.00 25.04±10.90

International Journal of Environmental & Agriculture Research (IJOEAR) ISSN:[2454-1850] [Vol-3, Issue-5, May- 2017]
Page | 20
3.2 Condition of seed storage before germination
Table 11 shows the spectrum of the tested samples of V. faba L. seeds from the Seed Bank in Gatersleben. It is interesting to
note that although the temperature used for group A was expected to be in favor of the longer survival of the V. faba L. seeds
in the case of A. manglesii and M. tetragona, Merritt et al. (2003) we observed the opposite effect of storage at a temperature
of -18 oC in comparison with higher storage temperatures, contrary to the findings of other authors mentioned before.
According Murthy et al. (2002), another extreme temperature for storage is above 40 oC. The darkening of testa was also
confirmed for cv. Fiesta (Nasar-Abbaset et al., 2009).
TABLE 11
SPECTRUM OF THE TESTED SAMPLES OF V. FABA L. SEEDS AND THEIR CONDITIONS ( – SHOWS ZERO
VIABILITY). Year Cultivar Country of origin A B
1972 Féverole du Gers France + -
1975 Maly Italy + -
1977 Parvin Great Britain + +
1978
Milión
Diana
Kronberger
tennis Murat
Czechoslovakia
Czechoslovakia
Germany
Ethiopia
+
+
+
+
+
-
+
+
1979
Féverole du Gers
tennis Murat
Latvija
Mazur No.18
DornburgerAckerb.
France
Ethiopia
USSR
Poland
Germany
Great Britain
+
+
+
+
+
+
-
+
+
+
+
-
1980
Romana
Maly
Přerovský
Italy
Italy
Czechoslovakia
+
+
+
+
-
+
1981
Dire Dawa
Skorospelka
Banská
Ethiopia
USSR
USSR
+
+
+
+
+
+
1982
Equina
tennis Murat
Italy
Ethiopia
+
-
+
+
1984 Maly Italy + +
Both groups were tested periodically over nine years (1991 – 1999). The first evaluated parameter to be checked
was seed vitality (i.e., their germinating capacity) according to their color; the difference is especially evident for
summarized data obtained for the 1978-1984 harvests (Table 12).
TABLE 12
GERMINATION OF LIGHT AND DARK SEEDS FROM 22 DIFFERENT SAMPLESOF 17 CULTIVARS FROM 9
COUNTRIES IN CONSEQUENT YEARS. Year of harvest Light seeds Dark seeds
1991 1992 1996 1997 1999 1991 1992 1996 1997 1999
1972 98.0 95.0 27.3 50.0 55.0 n.d. n.d. n.d. n.d. n.d. 1975 82.0 90.0 41.7 70.0 30.0 n.d. n.d. n.d. n.d. n.d.
1977 94.0 70.0 70.0 73.3 45.0 0.0 0.0 0.0 0.0 5.00 1978 100.0 96.3 95.8 97.5 92.8 100.0 27.5 23.3 10.0 18.3
1979 98.5 92.5 81.6 94.6 63.4 97.6 26.0 36.0 16.7 12.5
1980 92.0 83.3 74.5 51.1 32.4 92.0 43.3 30.0 4.4 7.5 1981 90.6 93.3 86.6 71.9 52.5 90.6 40.0 30.0 35.5 20.0
1982 95.0 75.0 73.3 80.0 40.0 95.0 50.0 13.3 20.0 10.0 1984 86.0 90.0 50.0 55.6 15.0 89.0 47.5 10.0 40.0 5.0
Total
1978-84 93.7
+2.13 88.4
+3.23 76.9
+6.39 75.1
+7.89 49.3
+11.03 94.0
+1.74 39.0
+4.14 23.7
+4.19 21.1
+5.74 12.2
+2.43

International Journal of Environmental & Agriculture Research (IJOEAR) ISSN:[2454-1850] [Vol-3, Issue-5, May- 2017]
Page | 21
When confirming the weaker vitality of darker seeds stored in less favorable conditions, we were interested in the aberration
rate as expressed by the summarized data in Table 13.
TABLE 13
SUMMARY OF ABERRATIONS PER YEAR. Year of
harvest Light seeds
Dark seeds
1992 1996 1997 1992 1996 1997
1972 0.33 + 0.0 4.81 + 3.2 1.17 + 1.2 n.d. n.d. n.d.
1975 0.66 + 0.0 1.65 + 4.9 1.51 + 1.0 n.d. n.d. n.d.
1977 0.33 + 0.0 1.00 + 0.0 n.d. 0.00 + 0.0 0.00 + 0.0 n.d.
1978 0.49 + 0.6 1.00 + 3.3 0.08 + 0.8 1.22 + 0.2 1.10 + 1.3 0.00 + 0.0
1979 0.39 + 0.4 0.00 + 0.0 0.47 + 1.2 3.26 + 1.8 4.65 + 2.4 0.19 + 1.3
1980 0.44 + 0.6 0.25 + 0.9 1.04 + 1.2 2.44 + 1.2 0.25 + 0.9 1.00 + 1.0
1981 0.33 + 0.6 0.57 + 1.1 0.25 + 1.3 2.22 + 0.8 0.00 + 0.0 0.92 + 1.9
1982 0.00 + 0.0 0.00 + 0.0 2.85 + 0.0 4.66 + 0.0 1.00 + 0.0 0.00 + 0.0
1984 1.00 + 0.0 1.23 + 4.9 1.58 + 0.8 0.00 + 0.0 3.08 + 2.5 n.d.
n. d. = not detected
As noted, the aberration frequency was not very high in old seeds for significant results. Therefore, the most important
tendencies in the evaluations from the years 1991, 1992, 1996, 1997 and 1999 best expressed themselves in the viability
measured by the percentage of germination after 96 hours. The summarized results are shown in Table 14.
TABLE 14
AVERAGE GERMINATION IN % OF LIGHT AND DARK SEEDS FOR ALL EVALUATION TIMES. YEARS OF HARVEST
AND CULTIVARS.
Light seeds
day 1 day 2 day 3
46.4 + 24.6 32.4 + 20.6 49.2 + 21.7 56.8 + 24.8
Dark seeds
day 1 day 2 day 3
11.7 + 7.0 7.00 + 2.5 11.7 + 6.5 13.1 + 7.70
The difference is significant, although it is affected by a wide range of germination of light seeds, which confirms our earlier
results from a lesser number of Czechoslovak cultivars except in the case of the parameter of the root growth (Table 15.).
TABLE 15
AVERAGE ROOT LENGTH OF LIGHT AND DARK SEEDS FOR ALL EVALUATION TIMES. YEARS OF HARVEST AND
CULTIVARS IN CM.
Light seeds
day 1 day 2 day 3
Σ 2.3 + 1.5 cm 0.7 + 0.12 2.2 + 0.59 4.0 + 0.80
Dark seeds
day 1 day 2 day 3
Σ 1.9 + 1.5cm 0.5 + 0.08 1.4 + 0.76 2.9 + 1.65

International Journal of Environmental & Agriculture Research (IJOEAR) ISSN:[2454-1850] [Vol-3, Issue-5, May- 2017]
Page | 22
This tendency was also confirmed in the case of the aberrant ana-telophases, where in the range of 0.0 – 3.66 % SEM was 0.0
– 2.42 %, thus rendering all results non-significant. There was no provable difference between the light and dark seeds or
even between cultivars or years of harvest.
All of these results support our previous conclusions and findings (Murín et al 2007). In all of the evaluated parameters, we
have observed that despite the great difference in the two basic storage conditions and the time between the harvest years and
the evaluation frequency (17 years in the case of the oldest year), germination was the only provable parameter. This
confirms the possibility of the practical use of this interesting manifestation of different storage conditions.
3.3 Experimental Storage Effect
The basic observations mentioned in the introduction regarding various plant species were later supplemented by attempts to
demonstrate a relationship between the aging of seeds and the mode of their storage and sensitivity to the action of chemicals
(e.g. Avanzi et al. 1969). Interesting results were obtained due to the effects of different moisture on stored seeds in the
course of the presumed repair mechanisms in plant cells and the corresponding recovery effects after the action of alkylating
agents (Gichner and Gaul 1971, Gichner and Velemínský 1973).
Following the method of the last mentioned authors in a series of experiments (Murín and Mičieta 2001), described in detail
in our recent report (Murín and Mičieta 2014), we found the experimental “storage effect” to be a universal method for
recovering and enhancing seed viability for higher crop production.
Seeds stored for a long time and impacted by significant chromosome damage by a chosen mutagen can recover by this
method. It means that their experimental storage under the defined conditions for 8-days resulted in 3 to 4 times lower
frequency of chromosomal aberration in root tips and a significantly higher viability (Tables 16 and 17, Figures 2 and 3).
Even 12-year old seeds after experimental storage showed viability comparable with 2-year old seeds without storage. This
prolongation of the G-1 phase causes a decrease in damage caused by long term storage and other stresses up to a condition
similar to that of young undamaged seeds. According to our experience (Murín and Mičieta 1997), the prolongation of the
storage period for more than 8 days has no greater effect, i.e. the “storage effect” is limited probably due to the limited source
of repair enzymes stored in dormant seeds.
TABLE 16
GERMINATION AND CHARACTER OF ABERRATIONS (F-FRAGMENTS. B-BRIDGES. F+B) IN ROOT TIP CELLS OF
2. 6 AND 12-YEAR OLD V. FABA SEEDS AFTER 0 DAYS OF EXPERIMENTAL STORAGE.
Years
MMS
in
mM
Germination
(in %)
No. of cells
scored
48h/72h
No. of aberrant cells
48 h recovery time 72h
F B F+B F B F+B
0 77.0 150/120 2 1 0 1 3 0
2 3 90.0 155/140 17 6 3 8 1 1
6 87.0 150/130 24 3 4 11 9 2
0 57.0 210/140 40 7 12 15 6 3
6 3 50.0 250/90 40 11 16 11 3 3
6 77.0 250/150 57 26 18 35 4 4
0 19.4 40/70 7 2 2 11 1 0
12 3 17.4 25/15 1 6 2 4 2 2
6 13.0 60/25 10 16 20 14 2 2

International Journal of Environmental & Agriculture Research (IJOEAR) ISSN:[2454-1850] [Vol-3, Issue-5, May- 2017]
Page | 23
TABLE 17
GERMINATION AND CHARACTER OF ABERRATIONS (F-FRAGMENTS. B-BRIDGES. F+B) IN ROOT TIP CELLS OF
2. 6 AND 12-YEAR OLD V. FABA SEEDS AFTER 8 DAYS OF EXPERIMENTAL STORAGE.
Years MMS
in mM
Germination
(in %)
No. of cells
scored
48h/7h
No. of aberrant cells
48 h recovery time 72h
F B F+B F B F+B
0 89.6 270/150 7 1 0 4 1 0
2 3 94.0 260/150 3 0 0 3 1 0
6 86.0 290/150 7 0 1 0 2 0
0 87.5 300/160 2 1 0 0 0 0
6 3 88.6 300/150 8 1 0 2 0 0
6 82.4 300/150 6 2 0 3 1 0
0 60.0 230/150 18 5 2 4 1 0
12 3 46.0 205/150 8 6 0 11 1 1
6 72.0 180/150 12 4 1 2 2 2
FIGURE 2. FREQUENCY OF CHROMOSOME ABERRATIONS ON DAY 0 OF EXPERIMENTAL STORAGE.
FIGURE 3. FREQUENCY OF CHROMOSOME ABERRATIONS ON DAY 8 OF EXPERIMENTAL STORAGE.
0
20
40
60
80
100
0 mM 3 mM 6 mM 0 mM 3 mM 6 mM 0 mM 3 mM 6 mM
2 years old 6 years old 12 years
old
Chromosomal aberation (%)
48h
72h
0
10
20
30
40
50
60
70
80
90
100
0 mM 3 mM 6 mM 0 mM 3 mM 6 mM 0 mM 3 mM 6 mM
2 years old 6 years old 12 years old
Chromosomal aberation (%)
48h
72h

International Journal of Environmental & Agriculture Research (IJOEAR) ISSN:[2454-1850] [Vol-3, Issue-5, May- 2017]
Page | 24
IV. CONCLUSION
In addition to the theoretical ramifications of our experiments, our work may also have practical implications in three fields:
1. As pointed out by Čupič et al. (2005), widely used agro-technical plant seeds, as in the case of Alfalfa (Medicago
sativa L.), are often stored for years after harvest, which influences their germination energy, germination, rate of
abnormal sprouts and dead seeds. This can be easily repaired by the “storage effect” with an interrupted germination
period under the described conditions causing the prolongation of the G-1 phase with a significant increase of vitality
of seeds treated this way. Consequently, it will lead to an improvement of their crop production that is most important
in the case of seeds that are genetically modified or rearranged (see ACB karyotype seeds used in our experiments).
2. Our findings may be very helpful to seed banks worldwide. The regular checking of the viability of seeds according to
germination leads to irreversible losses of stored seeds, while a simple visual test based at seed color would provide
the same answer with no loss of material. Moreover, such a test could be conducted in sealed ampules, thus not
interfering with the storage conditions in the particular seed bank. By using “storage effect” these seeds can be
revitalised (or rejuvenalised) and stored further with the possibility of long-term survival of the seeds in seed bank.
3. Finally, with the above mentioned “storage effect” the amount of yield of viable seeds can be significantly recovered
and by this method to prolong of their useful survival in the particular agricultural supply. Just at the example of Vicia
faba beans it could cause a significant economical improvement as its seeds are distributed in more than 55 countries
when 4.56 million tons of dry grains are produced in the harvested area of 2.56 million ha yearly.
ACKNOWLEDGEMENTS
Thanks to the opportunity to cooperate with Dr. Joachim Keller and the Seed Bank in Gatersleben, Germany, we had the
chance to conduct a long-term experiment using 22 seed samples from eight countries, nineteen cultivars and nine harvests.
This study was supported by VEGA grant No. 1/0885/16, and is partially the result of the project implementation of
Comenius University in the Bratislava Science Park supported by the Operational Programme Research and Development
funded by ERDF Grant No.: ITMS 26240220086. The authors are grateful to Dr. Anna Ligasová and Dr. Jana Chrenová for
their kind assistance with the practical parts of some experiments, Alena Rendeková for her comments to the manuscript and
Zuzana Randáková for her revision of the tables.
Conflicts of Interest: The authors declare no conflict of interest.
REFERENCES
[1] Andreev, I.O., Spiridonova, E.V., Kunakh, V.A., Solov´yan, V.T. Aging and loss of germination in rye seeds is accompanied by
a decreased fragmentation of nuclear DNA at loop domain boundaries. Russ. J. Plant. Physiol., 2004, 51(2):241–248.
[2] Avanzi, S., Innocenti, A.M., Tagliasacchi, A.M. Spontanueous chromosome aberrations in relation to seed dormancy in Triticum
durum Desf. Mutation Res., 1969, 7:199–203.
[3] Babasaheb, B.D. Seeds Handbook: Processing And Storage. CRC Press, 2004, p 800.
[4] Bewley, J.D., Black, M. Physiology and Biochemistry of Seeds in Relation to Germination. Dormancy and Environmental Control.
Springer-Verlag, Berlin, Heidelberg, New York, 1982, p 376.
[5] Bewley, J.D., Black, M. Seeds: Physiology of Development and Germination. Second Edition. Plenum Press, New York, 1994, p
445.
[6] Bezrukov, V.F., Lazarenko, L.M. Environmental impact on age-related dynamics of karyotypical instability in plants. Mutation Res.,
2002, 520:113–118.
[7] Bonner, F.T. Storage of seeds: Potential and limitations for germplasm conservation. Forest Ecology and Management, , Issues 1–2,
1990, Vol. 35:35–43
[8] Cartledge, J.L., Blakeslee, A.F. Mutation rate increased by aging seeds as shown by pollen abortion. Proc. Nat. Acad. Sci. USA,
1934, 20:103–110.
[9] Cartledge, J.L., Blakeslee, A.F. Mutation rate from old Datura seeds. Science, 1935, 81:492–493.
[10] Cebrat, J. Investigations on spontaneous chromosome aberrations in the roots of onion seedlings and on their effect upon seedling
growth. Genet. Pol., 1977, 18:39–49.
[11] Čupič, T., Popović, S., Grljušić, S., Tucak, M., Andrić, L., Šimic, B. Effect of storage time on alfalfa seed quality. Journal of
Central European Agriculture, 2005, 6(1):65–68.
[12] D´Amato, F. Mutazioni cromosomische spontanee in plantule di Pisum sativum L.. Caryologia, 1951, 3:285–293. (in Italian)
[13] Floris, C., Anguillesi, M.C. Aging of isolated embryos and endosperm of durum wheat: An analysis of chromosome damage.
Mutation Res., 1974, 22:133–138.

International Journal of Environmental & Agriculture Research (IJOEAR) ISSN:[2454-1850] [Vol-3, Issue-5, May- 2017]
Page | 25
[14] Gichner, T., Gaul, H. Storage effect following treatment of barley seeds with ethyl methanesulphonate - I. Influence of seed
moisture content. Rad. Bot., 1971, 11:53–58.
[15] Gichner, T., Velemínský, J. The influence of metabolic inhibitors and temperature on mutagenic activity during the storage of ethyl
methansulfonate-treated barley seeds. Biol. Plant., 1973, 15:72–79.
[16] Górecki, R.J., Michalczyk, D.J., Esashi, Y. Comparative studies on the anaerobic respiration in differently aged pea and cocklebur
seeds. Acta Physiol. Plant., 1992,14:19–27.
[17] Grilli, I., Bacci, E., Lombardi, T., Spano, C., Floris, C. Natural ageing: Poly(A) Polymerase in germinating embryos of Triticum
durum Wheat. Ann. Bot., 1995, 76:15–21.
[18] Chwedorzewska, K.J., Bednarek, P.T., Puchalski, J. Studies on changes in specific rye genome regions due to seed aging and
regeneration. Cell & Mol. Biol. Lett., 2002, 7:569–576.
[19] King, M.W., Soetisna, U., Roberts, E.H. The dry storage of Citrus seeds. Ann. Bot., 1981, 48:865–872.
[20] Maalouf, F., Nawar, M., Hamwieh, A., Amri, A., Zong, X., Bao, Sh., Yang, T. Faba bean. Genetic and Genomic Resources of Grain
Legume Improvement, Eds: Mohar Singh, Hari D. Upadhyaya and I. S. Bisht. Elsevier Inc., 2013, pp. 113–136
[21] Merritt, D.J., Senaratna, T., Touchell, D.H., Dixon, K.W., Sivasithamparam, K. Seed ageing of four Western Australian species in
relation to storage environment and seed antioxidant activity. Seed Sci. Res., 2003,13(2):155–165.
[22] Michaelis, A., Rieger, R. New karyotypes of Vicia faba. Chromosoma, 1971, Berlin 35:1–8.
[23] Michailov, O.F., Korytova, A.I. Vlijanie chranenija semjan posle obrabotki ich etileniminom na mutacionnyj process v nich. In:
Introdukcija rast. v Dnepropetr. botan. sadu. 1971, Dnepropetrovsk, pp 91–97. (in Russian)
[24] Murín, A. The aging of seeds as the cause of mitotic and chromosome damage. Biológia, 1961, 3:173–177. (in Slovak)
[25] Murín, G. Damage in the structure and reproduction of chromosome in aging Vicia faba L. seeds. Acta F. R. N. Univ. Comen.
Botanica, 1988a, 35:81–95.
[26] Murín, G. Individual variability of aging and its manifestations in Vicia faba seeds. Acta F. R. N. Univ. Comen. Botanica, 1988b,
36:87–95.
[27] Murín, G. One hundred years of plant modelling of aging. In: Berger, J. (ed): Cells III., Kopp Publishing, České Budějovice, 2001,
pp 117–120.
[28] Murín, G., Mičieta, K. Pre-replication recovery from MMS-induced chromosomal damage in Vicia faba L. seeds. Biol. Plant., 1997,
39:523–529.
[29] Murín, G., Mičieta, K. The storage effect: An universal method of enhancing DNA´s repair system. Biologia, 2001, 56 (Suppl.10): p
88.
[30] Murín, G., Mičieta, K. One hundred years of the research of aging in plants. Acta. Bot. Univ. Comen., 2009, 44:3–13.
[31] Murín, G., Mičieta, K. Enhancement of DNA Repair by simply method of implementing mutagenesis process at old Vicia faba L.
seeds with a rejuvenation effect. In: Tomlekova NB, Kozgar MI, Wani MR (eds) Mutagenesis: exploring novel genes and pathways,
Wageningen Academic Pbl., 2014, pp 355–378.
[32] Murín, G., Mičieta, K., Ligasová, A., Chrenová, J., Keller, J., Savova, M., Slade, D. Manifestation of aging via testa of the different
Vicia faba L. cultivars in the Seed Bank as marker of time of storage. Acta Bot. Univ. Comen., 2007, 43:33–36.
[33] Murthy, U.M.N., Kumar, P.P., Sun, W.Q. Mechanisms of seed ageing under different storage conditions for Vigna radiata (L.)
Wilczek: lipid peroxidation, sugar hydrolysis, Maillard reactions and their relationship to glass state transition. J. Exp. Bot., 2002,
54(384):1057–1067.
[34] Nasar-Abbas, S.M., Siddique, K.H.M., Plummer, J.A., White, P.F., Harris, D., Dods, K., D'Antuono, M. Faba bean (Vicia faba L.)
seeds darken rapidly and phenolic content falls when stored at higher temperature, moisture and light intensity. Food Science and
Technology, 2009, Volume 42, Issue 10, 1703–1711.
[35] Navaschin, M. Altern der Samen als Ursache von Chromosomen-mutationen. Planta, 1933, 20:233–243. (in German)
[36] Nichols, CH. The effect of age and irradiation on chromosomal aberrations in Allium seeds. Amer. J. Bot., 1942, 29:755–759.
[37] Patrick, J.W., Stoddard, F.L. Physiology of flowering and grain filling in faba bean. Field Crops Research, 2010, Vol. 115, Issue 3,
234–242
[38] Rieger, R., Michaelis, A. Cytologische und stofwechsel-physiologische Untersuchungen am aktiven Meristem der Wurzelspitze von
Vicia faba L. III. Weitere Befunde zur Entstehung und Wirkung "automutagener" Stoffwechsel-produkte bei Vicia faba. Biol.
Zentralbl., 1959, 78:291–307. (in German)
[39] Roberts, E.H., Ellis, R.H. Prediction of seeds longevity at sub-zero temperatures and genetic resources conservation. Nature, 1977,
268:431–433.
[40] Sevov, A., Christov, K., Christova, P. Biologični i cito-genetični izmenenija v stari semena ot carevica, schranjavani pri obiknoveni
uslovija. Genet. i Selek., 1973, 6:107–115. (in Russian)
[41] Stube, H. Samenalter und Genmutabilität bei Antirrhinum majus L.. Biol Zentralbl., 1935, 55:209–215. (in German)
[42] Yousif, A.M., Kato, J., Deeth, H.C. Effect of storage time and conditions on the seed coat colour of Australian adzuki beans. Food
Australia, 2003, 55 (10), pp. 479–484.

International Journal of Environmental & Agriculture Research (IJOEAR) ISSN:[2454-1850] [Vol-3, Issue-5, May- 2017]
Page | 26
Temperature effect on seed germination of four plants in sand
from coastal sand dunes in Greece
Aglaia Liopa-Tsakalidi1, Pantelis E. Barouchas
2
Department of Agricultural Technology, Technological Education Institute of Western Greece, GREECE
Abstract— In high temperatures of coastal sand dunes, salt may limit seed germination and thus strogly limit plant survival.
The relationship between germination and sand dunes soil temperatures has never been evaluated. The effect of coastal
dunes sands on plant germination at 20°C and 28°C was studied. Sand samples of coastal dunes from coastline regions in
Greece were analyzed and used as substrates. The Si content (89-97%) is the representative one in all soils. The Si, Al and
Mg contents in the Aegean Sea sand dunes were higher than the Ionian Sea. Pigweed germination at 28°C in sand from
mainland Greece was higher than the corresponding one from insular Greece. Purslane germination at 28°C in sand from
the Ionian Sea (52%-57%) was higher than the corresponding one from the Aegean Sea (49%-50%) and at 20°C it remained
unaffected by the soil. Chervil and coriander germination at 20°C was very low, while no germination occurred in pigweed
at 20°C and chervil and coriander at 28°C in all sand soils. The study has shown that the coastal dune soils favoured
germination of pigweed and purslane at 28°C. These results indicate that those plants have adapted to the coastal sand
dunes environment.
Keywords— sand elements, pigweed (Amaranthus retroflexus), purslane (Portulaca oleracea), chervil (Anthriscus
cerefolium), coriander (Coriandrum sativum).
I. INTRODUCTION
The sand dunes occurred in rows along the coast. Coastal dunes have an extensive global distribution (Martinez et al. 2004).
A variety of abiotic and biotic factors including sand instability, salinity, extreme high or low temperatures, drought, and
herbivore predation may limit seed germination and seedling emergence in coastal sand dunes (Sykes & Wilson 1988; Maun
1994; Maun 2009). Major problems faced by seeds are sand accretion and soil salinity.
Seed germination is a critical stage for the establishment of a species. Salt inhibits seed germination in saline soil, and high
salinity is injurious to most glycophytes. Ungar (1978) suggested that there is a complex interaction between salinity and
temperature, especially for coastal halophytes. Salinity and temperature interact in their control of seed germination (Khan &
Ungar 1999), with the greatest inhibition due to salinity usually found at the minimum or maximum limits of tolerance to
temperature (Badger & Ungar 1989). In sand dune environments, seed germination is strongly related to available moisture
and seedling survival is strongly limited by temporal changes in water availability (Maun 2009). Very small seeds showed a
high germination rate because of the small amount of moisture required for inbibition (Stairs 1986; Zheng et al. 2005).
Purslane (Portulaca oleracea) is a spontaneous wild forb, herbaceous annual plant, from the Portulacaceae family. It is one of
the world's most aggressive and worst weeds, a unique plant that has the ability to adapt to many diverse environments
(Rahdari et al. 2012). It is more tolerant to salinity and drought conditions (Hamidov et al. 2007). The plant produces
numerous minute seeds, many of which have primary dormancy and require warm temperatures and light for germination
(Egley 1984). The plant grows in the wild and is cultivated around almost the whole world. Purslane is a heat- and drought-
tolerant plant, and is an important vegetable crop (Anastácio & Carvalho 2012; Dadkhah 2013). Moreover, purslane is an
edible halophyte (Grieve & Suarez 1997) and a promising crop for saline agriculture (Kiliç et al. 2008), which has been
studied for its relatively high salinity tolerance (Teixeira & Carvalho 2009). The optimal seed germination occurs at
temperatures > 30°C, while poor germination occurs at temperatures < 24°C (Miyanishi & Cavers 1980; Zimmerman 1976).
Germination was 96% when seeds were exposed to 35/25°C day/night alternating temperatures, but 25/10°C day/night
resulted in 15% germination (Miyanishi & Cavers 1980). In the light/dark regime, the germination was lower at 25/15°C than
at 30/20°C (70%, and 81% germination, respectively) (Chauhan & Johnson 2009).
Pigweed (Amaranthus retroflexus) is a common annual worldwide weed of 60 crops in 70 countries. It can be found in a
wide range of habitats and causes substantial yield reduction in many different agricultural crops through competition
(Ghorbani et al. 2000; Holm et al. 1997). Pigweed is a thermophyte to sub-thermophyte, often highly stress-tolerant, growing
in sandy and saline habitats (Costea et al. 2004; Robertson & Clemants 2003). It reproduces by seeds which can only remain

International Journal of Environmental & Agriculture Research (IJOEAR) ISSN:[2454-1850] [Vol-3, Issue-5, May- 2017]
Page | 27
viable for at least 6–10 years (Costea et al. 2004). Seed germination of pigweed differed in its response to temperature.
Pigweed had higher germination rates at 35/30°C than at 25/20°C or 45/40°C, and at 15/10°C no seed germination was
observed (Guo & Al-Khatib 2003). Ghorbani et al. (1999) found that the minimum temperature for pigweed germination was
greater than 5°C, whereas maximum germination occurred between 35 and 40°C. Pigweed was sensitive to Al, Mn, NaCl and
Na2SO4.
Chervil (Anthriscus cerefolium) is a fragrant, delicate annual herb, belonging to the Apiacae family. Its seeds need light and
wet porous soil to germinate. Seeds of chervil have germinated at a 13°C temperature (Bubel 1988). The seed germination
percentage of chervil at 22°C in H2O was 44%. In the 80mM NaCl concentration there was an increase in the germination
(64%), while in higher NaCl concentrations the germination reduced (Liopa-Tsakalidi & Barouchas 2011).
Coriander (Coriandrum sativum) is an annual herb of the Apiaceae family, grown primarily for its seed and seed oil all over
the world (Verma & Sen 2008). It is known as a species moderately tolerant to salinity. Zidan & Elewa (1995) mentioned
that during germination, coriander tolerated salinity up to 200mm NaCl. Liopa-Tsakalidi et al. (2011) reported that no seeds
germinated in high salt concentrations (0.5 and 1.5 mol/l NaCl). In addition to this, the seed germination of coriander showed
a progressive decrease as salinity levels increased (Ewase et al. 2013; Fredj et al. 2013). The salinity effect appears mainly
during germination and plant growth (Aymen & Cherif 2013).
Little research has been conducted about the application of seed germination on coastal sand dunes and the studies on their
relationship with seedlings are still inadequate. For example, the growth characteristics of seedlings in Greek coastal sand
dunes have not been investigated with respect with to initial seed germination.
The focus of the current study was to provide knowledge on the germination behavior of pigweed (Amaranthus retroflexus),
purslane (Portulaca oleracea), chervil (Anthriscus cerefolium), and coriander (Coriandrum sativum) in two temperatures and
different sand soils of coastal sand dunes in Greece, and to ascertain the effects of different characteristics of sand soils on
germination.
II. MATERIAL AND METHOD
2.1 Analysis of sand dune soils
In the present paper, the study area was located in the mainland (Kastro Kyllinis and +Vartholomio Ileias) and the insular
(Zakynthos) coastline of the Ionian Sea, and the insular (Milos and Tinos) coastline of the Aegean Sea, in Greece (Fig. 1).
FIG. 1: STUDY AREA IN THE MAINLAND AND THE INSULAR COASTLINE OF THE IONIAN SEA, AND THE
INSULAR COASTLINE OF THE AEGEAN SEA, IN GREECE.

International Journal of Environmental & Agriculture Research (IJOEAR) ISSN:[2454-1850] [Vol-3, Issue-5, May- 2017]
Page | 28
For comparison purposes, sand samples that represent the sand soils of various coastal sand dunes of Greece, i.e. representing
areas of the Ionian and Aegean Seas, were randomly collected from 0 to 10 cm below the surface of the coastal sand dunes,
using metal spatula. At each study area, 3 samples (approximately 1-2 kg) were collected randomly from different sand
dunes within the radius of 200m. The samples were transferred to the Laboratory of Soils and Irrigations of the
Technological Educational Institute of Western Greece for further studies. Sand samples were collected from coastal sand
dunes from five regions of Greece: the Alykanas area in Zakynthos, the Kastro Kyllinis area and the Vartholomio area in
Ileias (Ionian sea), and the Milos and Tinos islands (Aegean sea).
The total content of silicon (Si), calcium (Ca) chromium (Cr), aluminium (Al), magnesium (Mg), potassium (K), titanium
(Ti), manganese (Mn), iron (Fe), sodium (Na), and zirconium (Zr) elements were determined using microwave digestion and
the Inductively Coupled Plasma-Atomic Emission Spectrometry (ICP-AES). ICP-AES is the preferred method of elemental
analysis for chemical stratigraphy. Methods: Approximately 1g ± 0,1mg of sample was digested with 2.35 mL of HNO3 65%
and 7 mL of HCl 37% (aqua regia) in microwave digestion system (Berghof speedwave MWS-3+). The temperature program
was as follows: 5 min for temperature 145°C, 10 min for temperature 170°C and 15 min for temperature 180°C. The
resulting solutions were cooled for 30 minutes and diluted to 10 mL with distilled water. The clear solutions were analyzed
by ICP-OES (Thermo Scientific iCAP 6000). The operating conditions were: nebulizer gas flow rates: 0.5 l/min; auxiliary
gas flow: 0.5 L min−1; plasma gas flow: 15 L min−1; Pump rate: 45 rpm; ICP RF power: 1100 W. Aliquots of an ICP
multielement standard solution (100 mg/L Merck) containing the analyzed elements, was used in the preparation of
calibration solutions. Working standard solutions were prepared by dilution of the stock standard solutions to desired
concentration in 1% HNO3. The ranges of the calibration curves (6 points) were selected to match the expected
concentrations for all the elements of the sample studied by ICP-OES. The correlation coefficient r2 obtained for all cases
was 0.9999. The detection limits (LOD) were calculated as the concentrations of an element that gave the standard deviation
of a series of ten consecutive measurements of blank solutions. Soil samples from BIPEA’s proficiency testing scheme A15
were used to ascertain the accuracy of the measurements. All above-mentioned sand testings were performed in the
Laboratory of Soils and Irrigations of the Technological Educational Institute of Western Greece.
2.2 Seed germination
Four plant species were utilized for this study; two weeds, pigweed (Amaranthus retroflexus) and purslane (Portulaca
oleracea), and two herbs, chervil (Anthriscus cerefolium) and coriander (Coriandrum sativum) (seed supplied by SAIS
Sementi, Cesena-Forlì, Italy). Forty seeds were placed on Petri dishes (10cm diameter) containing 15g of river sand and 15ml
of distilled water (control) or an equal quantity of the respective test sands, i.e. coastal dune sand from Alykanas area of
Zakynthos island (Ionian sea), coastal dune sand from Kastro area of Kyllinis (Ionian sea), coastal dune sand from
Vartholomio area of Ileias (Ionian sea), coastal dune sand from Milos area island (Aegean sea), coastal dune sand from Tinos
area island (Aegean sea). The petri dishes were arranged in a completely randomized block design with three replicates of
each treatment, and were transferred in a controlled plant growth chamber under 20±1°C or 28±1°C temperature regimes, a
16h photoperiod and 80±2% relative humidity (RH). The number of the germinated seeds was recorded every day, starting
from day 2 after the seeds were initially placed on Petri dishes. The experiment consisted of three replications.
2.3 Data and Statistical analysis
The germination percentage is an estimate of the seed viability. The equation to calculate the final germination percentage
(GP) is:
100 seeds totalofnumber
seeds germinated ofnumber GP
The germination rate was estimated by using a modified
tG velocity ngerminatio ofindex Timsons
, where G is the percentage of seeds which germinated after 2-day
intervals and t is the total germination period.
All data was tested by the analysis of variance (ANOVA), using the SPSS 21 software. Duncan’s multiple range test was
performed at p = 0.05 for each of the significant variables measured. Duncan’s multiple range test was performed at p = 0.05
for each of the significant variables measured.

International Journal of Environmental & Agriculture Research (IJOEAR) ISSN:[2454-1850] [Vol-3, Issue-5, May- 2017]
Page | 29
III. RESULTS
3.1 Chemical characterization of dune sand
The chemical characteristics of the sand tested are presented in Figures 2 and 3 respectively. They can provide useful
information about plant survival.
The results show that Si (89-96%) is the most represented mineral. The mean values of total Si contents for the Milos (97%)
and Tinos (96%) islands (Aegean Sea) sand dunes were significantly higher than the rest of the sand dunes. Alykanas
Zakynthos and Kastro Kyllinis (14%) were significantly lower than the rest of the dunes (Fig. 2).
When compared to the other elements, calcium contents present an important concentration. The sand chemical analysis
contains a non-negligible part of Ca, Cr, Al and Mg. The Ca and Cr contents for the Milos and Tinos islands (Aegean Sea)
sand dunes were significantly lower than the rest of them, namely Alykanas Zakynthos and Kastro Kyllinis, Vartholomio
Ileias (Ionian Sea). Similarly to Si contents, the results show that aluminium (Al) and magnesium (Mg) contents in the sand
dunes of the Aegean Sea are significantly higher than those of the Ionian Sea (Fig. 1). The K, Ti, Mn, Fe, Na, and Zr contents
do not show clear group separations like that shown by the Al contents (Fig. 2, 3).
SiO2
0
20
40
60
80
100
River sand Alykanas
Zakynthos
Kastro Kyllinis Vartholomio
Hleias
Milos Tinos
To
tal
SiO
2 (
%)
in
soil
s
CaO
0
2
4
6
8
10
River sand Alykanas
Zakynthos
Kastro Kyllinis Vartholomio
Hleias
Milos Tinos
Tot
al C
aO (
%)
in s
oils
Cr2O3
0,0
1,0
2,0
3,0
River sand Alykanas
Zakynthos
Kastro Kyllinis Vartholomio
Hleias
Milos Tinos
Tot
al C
r 2O
3 (%
) in
soils
Al2O3
0,0
1,0
2,0
3,0
River sand Alykanas
Zakynthos
Kastro Kyllinis Vartholomio
Hleias
Milos Tinos
Tot
al A
l 2O
3 (%
) in
soils
MgO
0,0
0,1
0,2
0,3
0,4
0,5
River sand Alykanas
Zakynthos
Kastro Kyllinis Vartholomio
Hleias
Milos Tinos
To
tal
Mg
O (
%)
in
soil
s
K2O
0,00
0,10
0,20
0,30
0,40
0,50
River sand Alykanas
Zakynthos
Kastro Kyllinis Vartholomio
Hleias
Milos Kastro Kyllinis
Tot
al K
2O
(%
) in
soils
FIG. 2: CHEMICAL CHARACTERIZATION (%) OF THE SAND DUNES OF FIVE AREAS OF GREECE; SILICON (SI),
CALCIUM (CA) CHROMIUM (CR), ALUMINIUM (AL), MAGNESIUM (MG), POTASSIUM (K) CONTENTS.

International Journal of Environmental & Agriculture Research (IJOEAR) ISSN:[2454-1850] [Vol-3, Issue-5, May- 2017]
Page | 30
TiO2
0,000,050,100,150,200,250,300,35
River sand Alykanas
Zakynthos
Kastro Kyllinis Vartholomio
Hleias
Milos Tinos
To
tal
TiO
2(%
) in
soil
s
K2O
0,00
0,10
0,20
0,30
0,40
0,50
River sand Alykanas
Zakynthos
Kastro Kyllinis Vartholomio
Hleias
Milos Kastro Kyllinis
Tot
al K
2O
(%
) in
soils
MnO2
0,00
0,01
0,02
0,03
0,04
0,05
0,06
River sand Alykanas
Zakynthos
Kastro Kyllinis Vartholomio
Hleias
Milos Tinos
Tot
al M
nO2 (
%)
in
soils
Fe2O3
0,0
1,0
2,0
3,0
River sand Alykanas
Zakynthos
Kastro Kyllinis Vartholomio
Hleias
Milos Tinos
To
tal
Fe
2O
3 (
%)
in
soil
s
Na2O
0,000
0,002
0,004
0,006
0,008
0,010
River sand Alykanas
Zakynthos
Kastro Kyllinis Vartholomio
Hleias
Milos Tinos
To
tal
Na
2O
(%
) in
soil
s
ZrO2
0,000
0,002
0,004
0,006
0,008
River sand Alykanas
Zakynthos
Kastro Kyllinis Vartholomio
Hleias
Milos Tinos
To
tal
ZrO
2 (
%)
in
soil
s
FIG. 3: CHEMICAL CHARACTERIZATION (%) OF THE SAND DUNES OF FIVE AREAS OF GREECE; TITANIUM
(TI), MANGANESE (MN), IRON (FE). SODIUM (NA), ZIRCONIUM (ZR) CONTENTS.
3.2 Coastal dunes effects on seed germination
The seed germination observation of pigweed, purslane, chervil and coriander plants lasted 10 days at a temperature of 20°C
and 28οC in a controlled plant growth chamber (Fig. 3). Temperature had a significant effect on the germination percentage.
No seed germination was observed at the lowest temperature (20°C) in all sand soils.

International Journal of Environmental & Agriculture Research (IJOEAR) ISSN:[2454-1850] [Vol-3, Issue-5, May- 2017]
Page | 31
Pigweed (Amaranthus retroflexus )
0
10
20
30
40
50
60
70
80
20°C 28°C 20°C 28°C 20°C 28°C 20°C 28°C 20°C 28°C 20°C 28°C
Ger
min
atio
n (
%)
.
Purslane (Portulaca oleracea )
0
20
40
60
80
20°C 28°C 20°C 28°C 20°C 28°C 20°C 28°C 20°C 28°C 20°C 28°C
Ger
min
atio
n (
%)
.
Chervil (Anthriscus cerefolium )
0
1
2
3
4
20°C 28°C 20°C 28°C 20°C 28°C 20°C 28°C 20°C 28°C 20°C 28°C
Germ
inati
on
(%
) .
Coriander (Coriandrum sativum )
0
1
20°C 28°C 20°C 28°C 20°C 28°C 20°C 28°C 20°C 28°C 20°C 28°C
River sand Alykanas
Zakynthos
Vartholomio
Hleias
Kastro
Kyllinis
Milos Tinos
Control Ionian sea Aegean sea
Ger
min
atio
n (
%)
.
FIG. 4: EFFECT OF SAND DUNES ON GERMINATION (EXPRESSED AS %) OF PIGWEED (AMARANTHUS
RETROFLEXUS), PURSLANE (PORTULACA OLERACEA), CHERVIL (ANTHRISCUS CEREFOLIUM), AND
CORIANDER (CORIANDRUM SATIVUM).
The seed germination percentage of pigweed at 28°C in the river sand (control) was 44%, significantly lower than the coastal
dune percentages. Its seed germination percentage in sand of coastal dunes from mainland Greece (Kastro Kyllinis (68%)
and Vartholomio Ileias (71%) was significantly higher than the corresponding one from insular Greece (Zakynthos (60%),
Milos (64%) and Tinos (66%) islands) (Fig. 4, 5).
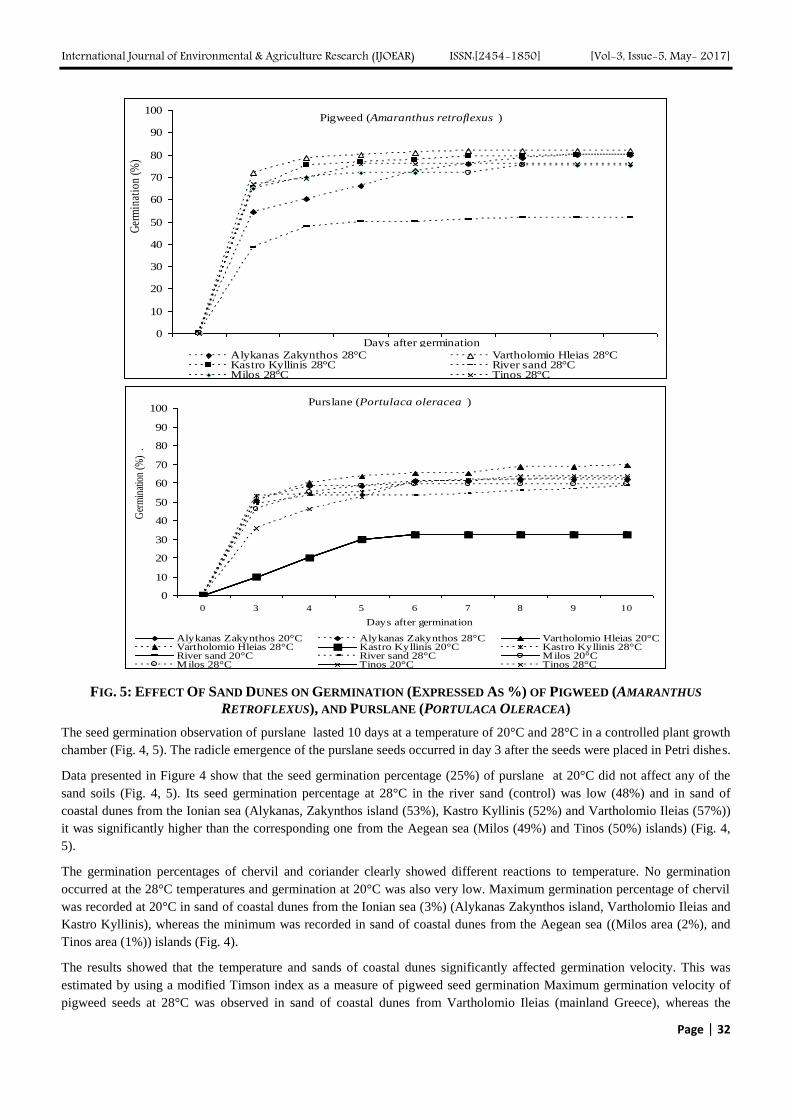
International Journal of Environmental & Agriculture Research (IJOEAR) ISSN:[2454-1850] [Vol-3, Issue-5, May- 2017]
Page | 32
Pigweed (Amaranthus retroflexus )
0
10
20
30
40
50
60
70
80
90
100
Days after germination
Ger
min
atio
n (%
) .
Alykanas Zakynthos 28°C Vartholomio Hleias 28°CKastro Kyllinis 28°C River sand 28°CMilos 28°C Tinos 28°C
Purslane (Portulaca oleracea )
0
10
20
30
40
50
60
70
80
90
100
0 3 4 5 6 7 8 9 10
Days after germination
Ger
min
atio
n (%
) .
Alykanas Zakynthos 20°C Alykanas Zakynthos 28°C Vartholomio Hleias 20°CVartholomio Hleias 28°C Kastro Kyllinis 20°C Kastro Kyllinis 28°CRiver sand 20°C River sand 28°C Milos 20°CMilos 28°C Tinos 20°C Tinos 28°C
FIG. 5: EFFECT OF SAND DUNES ON GERMINATION (EXPRESSED AS %) OF PIGWEED (AMARANTHUS
RETROFLEXUS), AND PURSLANE (PORTULACA OLERACEA)
The seed germination observation of purslane lasted 10 days at a temperature of 20°C and 28°C in a controlled plant growth
chamber (Fig. 4, 5). The radicle emergence of the purslane seeds occurred in day 3 after the seeds were placed in Petri dishes.
Data presented in Figure 4 show that the seed germination percentage (25%) of purslane at 20°C did not affect any of the
sand soils (Fig. 4, 5). Its seed germination percentage at 28°C in the river sand (control) was low (48%) and in sand of
coastal dunes from the Ionian sea (Alykanas, Zakynthos island (53%), Kastro Kyllinis (52%) and Vartholomio Ileias (57%))
it was significantly higher than the corresponding one from the Aegean sea (Milos (49%) and Tinos (50%) islands) (Fig. 4,
5).
The germination percentages of chervil and coriander clearly showed different reactions to temperature. No germination
occurred at the 28°C temperatures and germination at 20°C was also very low. Maximum germination percentage of chervil
was recorded at 20°C in sand of coastal dunes from the Ionian sea (3%) (Alykanas Zakynthos island, Vartholomio Ileias and
Kastro Kyllinis), whereas the minimum was recorded in sand of coastal dunes from the Aegean sea ((Milos area (2%), and
Tinos area (1%)) islands (Fig. 4).
The results showed that the temperature and sands of coastal dunes significantly affected germination velocity. This was
estimated by using a modified Timson index as a measure of pigweed seed germination Maximum germination velocity of
pigweed seeds at 28°C was observed in sand of coastal dunes from Vartholomio Ileias (mainland Greece), whereas the

International Journal of Environmental & Agriculture Research (IJOEAR) ISSN:[2454-1850] [Vol-3, Issue-5, May- 2017]
Page | 33
lowest rate was in the river sand (control). Moreover, the germination velocity of purslane seeds at 20°C in all sand soils was
less than at 28°C. The germination velocity of chervil and coriander are null (Table 1).
TABLE. 1: EFFECT OF SAND DUNES ON TIMSON INDEX GERMINATION VELOCITY OF PIGWEED
(AMARANTHUS RETROFLEXUS), PURSLANE (PORTULACA OLERACEA L.), CHERVIL (ANTHRISCUS CEREFOLIUM)
AND CORIANDER (CORIANDRUM SATIVUM).
Timson index, germination velocity
Sand dunes Temperature
°C
Pigweed
(Amaranthus
retroflexus)
Purslane
(Portulaca
oleracea)
Chervil
(Anthriscus
cerefolium)
Coriander
(Coriandrum
sativum )
Control River sand 20°C _ 3,3 _ _
28°C 5,2 5,8 _ _
Ionian
Sea
Alykanas
Zakynthos
20°C _ 3,3 _ _
28°C 8,0 6,2 _ _
Vartholomio
Hleias
20°C _ 3,3 _ _
28°C 8,2 6,9 _ _
Kastro
Kyllinis
20°C _ 3,3 _ _
28°C 8,0 6,3 _ _
Aegean
Sea
Milos 20°C _ 3,3 _ _
28°C 7,5 5,9 _ _
Tinos 20°C 3,3
28°C 7,6 6,3 _ _
IV. DISCUSSION
The distinctly different chemical composition of the coastal sand dunes in Kastro Kyllinis, Vartholomio Ileias, Zakynthos,
Milos and Tinos islands, show different characteristics in comparison with the dunes in the mainland and insular coastline of
the Ionian Sea and the insular coastline of the Aegean Sea of Greece (Fig. 3). Sand elements may differ along a given
coastline. For instance, along the Florida coast, the beaches primarily consist of quartz and calcium carbonate sand in the
north, and quartz sand in the south (Maun 2009). Variations in the chemical composition of frontal dune sediments along the
west coast of Jutland, Denmark, have been investigated by Saye and Pye (2006). The silicon (Si) content (89-97%) is the one
most represented in all soils of coastal sand dunes. Similar results have been reported by Maazouzi et al. (2013) for the SiO2
content in Algeria sand dunes (97%) and by Muhs et al. (2013) for the Sinai–Negev dunes of Egypt and Israel (~76 to 98%).
It is known that the seed germination is an important phase of plant development, since it gives it a better start. The above
differentiations of the coastal dunes’ chemical composition of the Ionian and the Aegean Sea exhibit different effects on the
seed germination of four plants. The higher Si contents in sand from the coastal dunes of the Aegean Sea seem to inhibit the
seed germination of some pigweed, purslane and chervil species by causing a deficiency in organic matter. However, little
information is available on the effects of silicon on seed germination under salinity.
Moreover, the high aluminium (Al) contents in sand soils from the Aegean Sea islands reduced the seed germination of
pigweed, purslane and chervil. Alamgir and Akhter (2009) reported that aluminium (Al) affected seed germination of
different wheat varieties and the inhibitory effect increased with the increase of Al3+
concentration.
The high seed germination percentage of the small seeds of purslane (60-71%) and pigweed (49-57%) in all sand soils at
28°C could result in tolerance to coastal dunes sand. Many studies on sand dunes have reported that very small seeds showed
a high germination rate because of the small amount of moisture required for inhibition (Stairs 1986; Zheng et al. 2005). In
sand dunes, seed germination is strongly related to available moisture (García et al. 2002).
The results showed that the low seed germination percentage (25%) of purslane at 20°C did not affect any sand soil. Lower
temperature low seed germination percentage of purslane was noted by Baskin and Baskin (1988) at 20/10°C and 15/6°C
day/night temperatures and by Miyanishi and Cavers (1980) at 25/10°C. No seed germination was observed in pigweed at
20°C in all sand soils. These results are in agreement with earlier results, which showed that seed germination of pigweed is
inhibited by low temperature (Ghorbani et al. 1999; Guo & Al-Khatib 2003; Steckel et al. 2004).

International Journal of Environmental & Agriculture Research (IJOEAR) ISSN:[2454-1850] [Vol-3, Issue-5, May- 2017]
Page | 34
In this paper, the absence of chervil seed germination at 28°C and the poor germination at 20°C in all sand soils showed that
seeds are germinated at temperatures lower than 13°C (Bubel 1988).
The results of this study showed no seed germination at 28° and low germination at 20°C of coriander in all sand soils due to
the fact that it is a plant sensitive to salinity (Liopa-Tsakalidi et al. 2011; Ewase et al. 2013; Fredj et al. 2013).
The study has shown that the soils of coastal sand dunes favoured seed germination of the weeds pigweed and purslane at
28°C, while inhibiting the seed germination of the herbs chervil and coriander under two different temperatures. These
results indicate that weed seeds have adapted to the coastal sand dunes environment. In further laboratory and field
experiments it would be interesting to understand the ecological role of the pigweed and purslane seeds during seed
germination in coastal sand dunes environments.
V. CONCLUSION
The study has shown differences between the percentage of various sand elements in the dunes of the mainland and insular
coastline of the Ionian Sea and the insular coastline of the Aegean Sea of Greece. Moreover, the study has shown that there
was no germination of chervil and coriander seeds in coastal dune soils and sand soils favoured germination of pigweed and
purslane at 28°C. These results indicate that the two plants, pigweed and purslane, have adapted to the coastal sand dunes
environment.
REFERENCES
[1] Alamgir ANM, Akhter S. 2009. Effects of aluminium (Al3+) on seed germination and seedling growth of wheat (Triticum aestivum
L.). Bangladesh J Bot. 3: 1-6.
[2] Anastácio A, Carvalho IS. 2012. Accumulation of fatty acids in purslane grown in hydroponic salt stress conditions. Int J Food Sci
and Nutr. 64: 235–242.
[3] Aymen EM, Cherif H. 2013. Influence of seed priming on emergence and growth of coriander (Coriandrum sativum L.) seedlings
grown under salt stress. Acta Αgr Slovenica. 101: 41 – 47.
[4] Badger KS, Ungar I. 1989. The effects of salinity and temperature on the germination of the inland halophyte Hordeum jubatum. Can
J Bot. 67: 1420-1425.
[5] Baskin JM, Baskin CC. 1988. Role of temperature in regulating the timing of germination in Portulaca oleraceae. Can J Bot. 66: 563-
567.
[6] Bubel N. 1988. The New Seed Starter's Handbook Rodale.
[7] Chauhan BS, Johnson DE. 2009. Seed germination ecology of Portulaca oleracea L. an important weed of rice and upland crop. Ann
Appl Biol. 155: 61-69.
[8] Costea M, Weaver S, Tardif FJ. 2004. The biology of Canadian weeds Amaranthus retroflexus L. A powellii S Watson and A
hybridus L. Can J Plant Scι. 84: 631-668.
[9] Dadkhah A. 2013. Phytotoxic potential of sugar beet (Beta vulgaris) and eucalyptus (Eucalyptus camaldulensis) to control purslane
(Portulaca oleracea) weed. Acta Αgr Scandinavica. 63: 46-51.
[10] Egley G. 1984. Ethylene nitrate and nitrite interactions in the promotion of dark germination of common purslane seeds. Ann Bot. 53:
833-840.
[11] Ewase AS, Omran S, El-Sherif S, Tawfik N. 2013. Effect of salinity stress on coriander (Coriandrum sativum) seeds germination and
plant growth. Egypt Acad J Biolog Sci. 4: 1-7.
[12] Fredj MB, Zhani K, Hannachi C, Mehwachi T. 2013. Effect of NaCl priming on seed germination of four coriander cultivars
(Coriandrum sativum). Eurasia J Biosci. 7: 21-29.
[13] García D, Bañuelos M, Houle G. 2002. Differential effects of acorn burial and litter cover on Quercus rubra recruitment at the limit of
its range in eastern North America. Can J Bot. 80: 1115–1120.
[14] Ghorbani R, Seel W, Leifert C. 1999. Effects of environmental factors on germination and emergence of Amaranthus retroflexus.
Weed Sci. 47: 505-510.
[15] Ghorbani R, Seel W, Litterick A, Leifert C. 2000. Evaluation of Alternaria alternata for biological control of Amaranthus retroflexus.
Weed Sci. 48: 474-480.
[16] Grieve CM, Suarez DL. 1997. Purslane (Portulaca oleracea LA halophytic crop for drainage water reuse systems. Plant Soil. 192:
277–283.
[17] Guo P, Al-Khatib K. 2003. Temperature effects on germination and growth of redroot K pigweed (Amaranthus retroflexus), Palmer
amaranth (A palmeri), and common waterhemp (A rudis). Weed Sci. 51: 869–875.
[18] Hamidov AH, Beltrao J, Costa C, Khaydarova V, Sharipova S. 2007. Environmentally useful technique—Portulaca oleracea golden
purslane as a salt removal species. WSEAS Trans Environ Develop. 7: 117-22.
[19] Holm LG, Doll J, Holm E, Pancho J, Herberger J. 1997. Wild weeds, natural histories and distribution Wiley, New York.

International Journal of Environmental & Agriculture Research (IJOEAR) ISSN:[2454-1850] [Vol-3, Issue-5, May- 2017]
Page | 35
[20] Khan MA, Ungar IA. 1999. Effect of salinity on the seed germination of Triglochin maritima under various temperature regimes.
Great Basin Nat. 59: 144-150.
[21] Kiliç CC, Kukul YS, Anaç D. 2008. Performance of purslane (Portulaca oleracea L.) as a salt-removing crop. Agr Water Manage. 95:
854–858.
[22] Liopa-Tsakalidi A, Barouchas PE. 2011. Salinity, chitin and GA3 effects on seed germination of chervil (Anthriscus cerefolium). Aust
J Crop Sci. 5: 973-978.
[23] Liopa-Tsakalidi A, Zakynthinos G, Varzakas T, Xynias IN. 2011. Effect of NaCl and GA3 on seed germination and seedling growth
of eleven medicinal and aromatic crops. J Med Plants Res. 5: 4065-4073.
[24] Maazouzi A, Kettab A, Badri A, Zahraoui B, Khalfaoui R. 2013. Physicochemical parameters of groundwater (Foggara) and sand
dune (Timimoun) Algeria Desalin Water Treat. 51: 37-39.
[25] Martínez ML, Psuty NP, Lubke RA. 2004. A perspective on coastal dunes Coastal Dunes Ecological studies 171: 3-10.
[26] Maun MA. 2009. The biology of coastal sand dunes. Oxford University Press Oxford.
[27] Maun MA. 1994. Adaptations enhancing survival and establishment of seedlings on coastal dune systems. Vegetatio. 111: 59–70.
[28] Miyanishi K, Cavers PB. 1980. The biology of Canadian weeds 40 Portulaca oleracea L. Can J Plant Scι. 60: 953–963.
[29] Muhs DR, Roskin J, Tsoar H, Skipp G, Budahn JR, Sneh A, Blumberg DG. 2013. Origin of the Sinai–Negev erg Egypt and Israel
mineralogical and geochemical evidence for the importance of the Nile and sea level history Quaternary. Sci Rev. 69: 28-48.
[30] Rahdari P, Tavakoli S, Hosseini SM. 2012. Studying of salinity stress effect on germination proline sugar protein lipid and
chlorophyll content in purslane (Portulaca oleracea L.) leaves. J Stress Physiol Biochem. 8: 182-193.
[31] Robertson KR, Clemants SE. 2003. Amaranthaceae In: Flora of North America Editorial Committee (eds). Flora of North America
vol 4. Magnoliophyta Caryophilidae. Oxford University Press. New York pp 405–456.
[32] Saye SE, Pye K. 2006 Variations in chemical composition and particle size of dune sediments along the west coast of Jutland
Denmark Sediment Geol. 183: 217–242.
[33] Stairs AF. 1986. Life history variation in Artemisia campestris on a Lake Huron sand dune system PhD thesis. University of Western
Ontario London Ont.
[34] Steckel L, Sprague C, Stoller EW, Wax L. 2004. Temperature effects on germination of nine Amaranthus species. Weed Sci. 52: 217–
221.
[35] Sykes MT, Wilson JB. 1990. An experimental investigation into the response of some New Zealand sand dune species to different
depths of burial by sand. Acta Bot Neerl. 39: 171–181.
[36] Teixeira M, Carvalho IS. 2009. Effects of salt stress on purslane (Portulaca oleracea) nutrition Ann Appl Biol 154: 77-86.
[37] Ungar IA. 1978. Halophyte seed germination. Bot Rev. 44: 233-264.
[38] Verma P, Sen NL. 2008. The impact of growth regulators on growth and biochemical constituents of Coriander (Coriandrum sativum
L.). J Herbs Spices Med Plants. 14: 144-153.
[39] Zheng ,Y, Xie Z, Yu Y, Jiang L, Shimizu H, Rimmington GM 2005 Effects of burial in sand and water supply regime on seedling
emergence of six species Ann Bot 95: 1237–1245.
[40] Zidan, MA, Elewa, MA 1995 Effect of salinity on germination, seedling growth and some metabolic changes in four plant species
(Umbelliferae) Ind J Plant Phys 38: 57–61.
[41] Zimmerman, CA 1976 Growth characteristics of weediness in Portulaca oleracea L Ecology 57: 964-974.

International Journal of Environmental & Agriculture Research (IJOEAR) ISSN:[2454-1850] [Vol-3, Issue-5, May- 2017]
Page | 36
E-screen assay validation: evaluation of estrogenic activity by
MCF7 cell culture bioassay, in drinking water from different
watersheds in state of São Paulo, Brazil Ana Maria Cristina Rebello Pinto da Fonseca Martins
1, Marcio Hipólito
2, Erna Bach
3,
Maria Lucia Zaidan Dagli4, Josete Garcia Bersano
5, Luara Lucena Cassiano
6, Gentile, L.B
7,
Cassiana Montagner Raimundo8.
1,2,6 Laboratório Interinstitucional de Sanidade em Aquicultura, Instituto Biológico do Estado de São Paulo, São Paulo, SP,
Brasil 3 Faculdade UNINOVE, São Paulo, SP, Brasil
4,7 Faculdade de Medicina Veterinária e Zootecnia – USP, São Paulo, SP, Brasil
5 Laboratório de Doenças de Suínos, Instituto Biológico do Estado de São Paulo, São Paulo, SP, Brasil
8 Laboratório de Química Ambiental – UNICAMP, Campinas, São Paulo, SP, Brasil
Abstract— Natural and synthetic estrogens have been detected in rivers, lakes and estuaries in many parts of the world.
Primary sources of these compounds are domestic and industrial effluents, which are not deleted after the water treatment.
Estrogen has been the endocrine disruptor most researched to be very active biologically and be the etiologic agent of
diverse types of cancer and other conditions such as endometriosis, precocious puberty, feminization, masculinization,
sterility. In this context, we use water of 36 natural reservoirs or dams, in a bioassay to characterize their estrogenicity in
culture of MCF7 cells and obtained high concentration of estrogen in samples taken in Ibiúna and Equestrian Santo Amaro /
SP. However, certain concentration in our samples for most water samples from different regions was very close to the limit
of quantification by bioassay and estrogen was in fmol. It has been shown that e - screen assay with MCF7 cells is a sensitive
and stable tool for quantitative analysis of estrogenicity of water and can easily be developed and implemented for routine
for estrogen quantification also in animal food and man, aqueous and plastics etc.
Keywords— endocrine disrupters, estrogen, breast cancer cells, (MCF7) bioassay: E-screen assay
I. INTRODUCTION
The speed of production and use of synthetic chemical products, since 1940, resulting in contamination ubiquitous of aquatic
animals, land and the human population. Since 1960 observers noted an increase of changes in reproduction of animals
across the globe as well as changes in reproduction and health of men by exposure to these synthetic products (VAN
LABEKE et al, 2008)
In 1991 scientists from various fields met at Wingspread Conference Center for defining and structuring the Disruption
Endocrine phenomenon. These researchers, in consensus, established that many synthetic chemicals were potentially able to
disrupt the endocrine system of animals and man. At that time concluded that the characterization of exposure to Endocrine
Disruptors was a crucial aspect for the prognosis of health effects as given in the below link.
(http://www.ourstolenfuture.org/Consensus/wingspread1.htm).
In the mid-90s there was a clear insight the possible negative impact of endocrine disruptors and the need for new legislation
to really ensure protection to human and animal’s health and the environment. But only two decades later the Society of
Endocrinology renewed the request of the endocrine disruptors list and the effects of its exposure, considering as a priority
research (DIAMANTI-KANDARAKIS et al, 2009).
The welfare of society is linked to many chemicals, essential components to everyday life, which are found everywhere, even
in remote locations both in the environment and animals and men.
For millennia, human and animals’ bodies adapted to EDs vegetables, cereals and fruit (apple, cherry, plum, potato. Carrots,
peas, beans, soybeans, wheat, oats, barley, rye, parsley, garlic) and naturally excreted not accumulate in the body. The
chemicals, however, accumulate mainly in adipose tissue mimicking glandular hormones (Colborn et al, 2002). Some of
these substances are transplacental and may affect the fetus as lead (Bowler and Cone, 2010) or fixate the milk being

International Journal of Environmental & Agriculture Research (IJOEAR) ISSN:[2454-1850] [Vol-3, Issue-5, May- 2017]
Page | 37
ingested by the newborn (Matuo, 1999) even toxic agents already accumulated in the maternal organism over the years.
(Colborn et al, 2002).
Recent studies in several countries have shown that the aquatic environment can possess estrogenic activity capable of
influencing the fauna. (Xeno) estrogens are believed to reach the aquatic environment mainly by means of municipal and
industrial sewage outfalls. However, agricultural drainage may also be a route for (xeno) estrogens to enter the aquatic
system.
Numerous natural and anthropogenic substances are known to exhibit estrogenic activity. In the aquatic environment,
estrogenic activity has primarily been ascribed to the natural steroids, 17b-estradiol (E2), estrone (E1) and estriol (E3), and
the synthetic estrogen, ethinylestradiol (EE2), used in contraceptives and hormone replacement. To a lesser extent
xenoestrogenic chemicals, such as alkylphenols and bisphenol A, may also contribute to the estrogenic activity in the aquatic
environment. (GRAY et al, 2000, SHAW and MCCULLY, 2002; AERNI et al ,2004)
Estrogen has been the endocrine disruptor most researched to be very active biologically and be the etiologic agent of diverse
types of cancer and other conditions such as endometriosis, precocious puberty, feminization, masculinization, sterility
(WELSHONS et al, 1999). Endocrine disruptors have recently been shown to promote an epigenetic transgenerational
phenotype involving several disease states (e.g. male infertility) (GORE et al, 2013). The MCF-7 cell proliferation assay is
potentially a simple and highly reproducible tool for the identification of estrogenic compounds. In the E-screen assay
developed by SOTO et al. (1995), proliferation of MCF-7 cells as a response to estrogen is measured. The E-screen is based
on the following three premises: (i) factors in human serum inhibit the proliferation of MCF-7 cells, (ii) estrogens induce cell
proliferation by negating this inhibitory effect, and (iii) non-estrogenic steroids and growth factors do not neutralize the
inhibitory signal present in human serum.
Numerous studies on animal’s exposure of wildlife and laboratories such products have shown that endocrine disrupters
affect various physiological processes such as brain activity, reproduction, immune response, development and metabolic
rates. (Tyler, 1998; McLachlan, 2001; Guillette and Gunderson, 2001; Hayes et al., 2002; Markey et al., 2003).
1.1 Endocrine disruptors
Endocrine disruptors are chemicals or agents that promote changes in the human or animal endocrine system. Several of
these substances remain in the environment accumulating in soil, river sediment being transported at great distance. They can
accumulate in the food chain representing a health risk especially those who are at the top of the food chain. (Meyer, 1999).
For example, in the region of the Great Lakes between the United States and Canada, on Lake Ontario, it was observed
biomagnetization of polychlorinated biphenyls (PCBs) from phytoplankton and zooplankton to trout and sea-gulls. The
concentration of PCBs in the sediment was established as the initial value and from that concentration analyzed the
concentration in the other beings of this ecosystem. There was a considerable increase in the concentration of PCB:
phytoplankton 250X; zooplankton 500X; Trout 2.800.000X and 25.000.000X gulls (Colborn et al, 2002).
The disruptor may be organic or inorganic substance and appear as a byproduct or waste of industrial use. They are found in
landfills and thus contaminating soil, groundwater, water sources used for public supply. Incinerators products (medical
waste and industries) also contribute to this contamination (XELEGATI and Robazzi, 2003)
TEVES in 2001 noted the presence of mercury and lead in waste of São Paulo and SISINO and OLIVEIRA in 2000
confirmed the presence of cadmium, lead, manganese and mercury in chorumem landfills and dumps.
Several species of animals have been affected by endocrine disruptors. For example, we have thyroid dysfunction in birds
and fish, decreased fertility in birds, fish, crustaceans, mammals; Successful reduction in hatching in birds, fish, turtles;
metabolic abnormalities in birds, fish and mammals, behavioral abnormalities in birds, desmasculinization and
desfeminilization of fish and female birds and dangerous changes in the immune system.
It is believed, therefore, that the effects of endocrine disruptors on the endocrine and reproductive systems act by mimicking
the endogenous hormone antagonizing the normal effects of endogenous hormones; stimulation or inhibition of the synthesis
and metabolism of hormones natural or modifying the levels of hormone receptors. These compounds are widely used by
modern society, being found in pharmaceuticals, personal products (like eg. The fragrances pesticides, antioxidants, plastics,

International Journal of Environmental & Agriculture Research (IJOEAR) ISSN:[2454-1850] [Vol-3, Issue-5, May- 2017]
Page | 38
industrial products, surfactants and others). Some of endocrine disruptors can enter the human body by the dermal route.
They are: Benzo (a) anthracene, benzo (a) pyrene, Benzene, Lead, Chlordane; dieldrin; DDT; Carbon disulfide, Heptachlor;
HCH, Mercury, pentachlorophenol (Azevedo & CHASIN, 2003).
Heavy metals act by inhibiting certain enzymes, for example, glycolysis, lipolysis and protein synthesis. Cadmium binds to
the sulfhydryl group (-SH) of the enzyme inhibiting its action. Lead inhibits the action of ζaminolivólico acid dehydrase
enzyme required for heme synthesis leading anemia. Arsenic form complex with enzyme inhibitors of adenosine triphosphate
(ATP). Mercury has affinity with the sulfhydryl group of proteins, enzymes, serum albumin, hemoglobin (Patnaik 2002;
Ferreira, 2003).
The particular hormone action starts by binding to a specific receptor of a cell. The resulting complex binds specific regions
of DNA in the nucleus activating or deactivating particular gene. KOIFMAN et al in 2002 showed that in some Brazilian
states is correlation between the use of pesticides and endocrine changes in the exposed population as infertility, testicular,
breast, prostate and ovary cancer.
The breast cancer is the most frequent cancer of women. The risk to develop it can be genetic, but according FENTON, 2006,
70% of women diagnosed had no hereditary or sporadic cancer. The increased risk of breast cancer and early puberty owes
much to the lifestyle and environment, exposure to certain chemicals that mimic hormones such as endocrine disruptors.
These products can increase the incidence of cancer by altering the flow or level-dependent tissue hormones; altering the
expression of glandular receptors, transporters of hormones or growth factors. These hormones have the best conformation
recognized by receptors and therefore result in maximum responses and are considered as responsible for most disruptors
effects caused by the disposal of effluents (Gray et al, 2000; SHAW and McCully, 2002; AERNI et al, 2004).
Understanding the complexity of exposure to synthetic chemicals is difficult by the large number of compounds and
limitations of analytical techniques. Researchers thus have focused on a few products. Elucidating the whole universe
including chemical unknown compounds is yet to happen.
Bioanalytical techniques (bioassays) may help to clarify this fact by characterizing the actual biological effects in a complex
sample and thus incorporate the effects of unidentified components and mixtures.
The ecotoxicology has done in vitro bioassays to assess the endocrine activity in environmental samples.
In this context, we can use water of our natural or built reservoirs in a bioassay to try to characterize their estrogenicity in
MCF7 cell culture (human cancer cell line). Cells of Mammary gland cancer have been used as a model of the effects of
estrogen on the growth of breast cancer and the synthesis of specific proteins.
The E-SCREEN assay was developed to evaluate the estrogenicity of chemical agents present in the environment using the
proliferative effect of estrogens on their target cells as an endpoint. This quantitative assay compares the number of cells
obtained by similar inoculum MCF-7 cells in the absence of estrogen (negative control) and presence of 17 beta-Estradiol
(positive control) in a range of suspected chemical concentrations have estrogenic function
the introduction of the paper should explain the nature of the problem, previous work, purpose, and the contribution of the
paper. The contents of each section may be provided to understand easily about the paper.
II. MATERIAL AND METHOD
Cells were seeded in plates with 96 wells, 1500 cell / well in culture medium (Dulbeccos Modified Eagle Medium / Sigma)
and incubated for 24 hours.
Following incubation, the wells were washed with 150 uL of phosphate buffer (PBS Gibco) and the medium changed to 150
ul of DMEM without phenol red (Sigma) and 5% FCS (charcoal dextran stripped / Sigma), 100 U / ml penicillin (Sigma), 0.1
mg / ml streptomycin (Sigma) and 2,5μg / ml amphotericin (Sigma).
After another 48 hrs, the medium was discarded and replaced with fresh water, experimental medium containing different
concentrations of standard (17-β estradiol) or experimental means to extract different samples.

International Journal of Environmental & Agriculture Research (IJOEAR) ISSN:[2454-1850] [Vol-3, Issue-5, May- 2017]
Page | 39
After 24 hrs of incubation (to cells adhere to the well) was exchanged to culture media with different concentrations of beta
estradiol (controls: white, negative, positive (10nm to 1FM) and solvents) and samples of the extracts (repeat where, sample
3 X).
After 6 days, the cells were fixed with cold trichloroacetic acid (Sigma), 10% (w / v) for 30 min at -4oC.
Washed 5 times in tap water and allowed to dry. Stained with 0.4% sulforhodamine B (SRB / Sigma) in 1% acetic acid
(Gibco).
Unbound SRB was removed by washing with 1% acetic acid and allowed to dry in air.
The bound SRB was solubilized with 10 nM Tris (pH 10.4) in a shaker.
After dilutions with estrogen on the MCF-7 cell proliferation, was made lecture in Elisa reader It measured the color intensity
plate reader (absorbance) at 550nm.
In possession of the results, the readings and concentration, were plotted in graph of standard curve in logarithm.
The equation of the line was used to calculate the concentrations of estrogen in the water samples from distinct locations.
III. RESULTS AND DISCUSSION
3.1 Analysis with standard in different estrogen concentrations on the MCF-7 cell proliferation
Cells when grow in culture medium without estrogen showed proliferation with lecture in Elisa reader with 107cells
However, when the medium was supplemented with water, the lecture presented 1013cells. These results showed that almost
no cells were proliferated. Wells called white presented only water or Tris, and that showed results at minus of 1013cells,
that can demonstrate negative proliferation.
Standart solution initiated with 10mmol and diluted it to micromole, picomol and fentomol. In each well were put 1500cells
and 0.15mL of culture medium and after the period of reaction was made lecture in Elisa reader.
The standart curve was plotted in logarithm graph and demonstrated a high value in lecture with 0.01mmol corresponding at
105 in concentration and decreased lecture at dilutions with estrogen until 0.01fmol or 1013 of concentration. When have
picomol the lecture decreased rapidly indicating less intensity on cell growth. The curve equation was y=-5,148ln(x) +
12,979 (Fig 1).
FIG 1: STANDART CURVE OF ESTROGEN PRESENT IN MEDIUM. CONCENTRATION OF ESTROGEN AT mmol,
PICOMOL AND FENTOMOL.

International Journal of Environmental & Agriculture Research (IJOEAR) ISSN:[2454-1850] [Vol-3, Issue-5, May- 2017]
Page | 40
3.2 Analysis of waters collected from lakes, rivers and lakes for breeding of animals and human sources.
All lecture from samples after check in Elisa reader, was used the equation curve for determinate the concentration of
estrogen. Were studied 36samples of water and in all most water samples the result demonstrated estrogen present in
fentomol (Table 1).
TABLE 2: CONCENTRATION OF ESTROGEN PRESENT IN SAMPLES OF WATER COLLECTED IN LAKES, RIVERS
AND LAKES FOR BREEDING ANIMALS AND HUMAN SOURCES (EQUIVALENT A ESTROGEN IN A STANDARD
CURVE WITH LOGARITHM).
samples number concentration of estrogen samples number Concentration of estrogen
1 0,895 .10 13
Fentomol* 21 0,833 .10 13
Fentomol
2 0,880 .10 13
Fentomol 22 0,806 .10 13
Fentomol
3 0,900 .10 13
Fentomol 23 0,811 .10 13
Fentomol
4 0,834 .10 13
Fentomol 24 0,838 .10 13
Fentomol
5 0,870 .10 13
Fentomol 25 0,902 .10 13
Fentomol
6 0,970 .10 7 Micromol 26 0,749 .10
13 Fentomol
7 0,906 .10 13
Fentomol 27 0,803 .10 13
Fentomol
8 0,920 .10 13
Fentomol 28 0,877 .10 13
Fentomol
9 0,933 .10 13
Fentomol 29 0,854 .10 13
Fentomol
10 0,829 .10 13
Fentomol 30 0,723 .10 13
Fentomol
11 0,894 .10 13
Fentomol 31 0,811 .10 13
Fentomol
12 0,824 .10 13
Fentomol 32 0,744 .10 13
Fentomol
13 0,877 .10 13
Fentomol 33 0,868 .10 13
Fentomol
14 0,891 .10 13
Fentomol 34 0,832 .10 13
Fentomol
15 0,898 .10 13
Fentomol 35 0,215 .10 7 Micromol
16 0,838 .10 13
Fentomol 36 0,598 .10 7 Micromol
17 0,825 .10 13
Fentomol
18 0,859 .10 13
Fentomol
19 0,857 .10 13
Fentomol
20 0,853 .10 13
Fentomol
Three samples of water the estrogen was present in micromol that corresponding in samples from Ibiúna and Equestrian
Santo Amaro/SP.
The only samples that showed a great amount of estrogen were sent samples of Ibiuna and Hipica of Santo Amaro / SP. In
Ibiúna, the water comes from a mine being raised fish in ponds receiving this water. The Equestrian comes from well and
belongs to the Hípica. These samples should take another repeated time analysis to confirm the results, there may be changes
in the analysis caused by the weather station, currently in São Paulo: heat and lack of water or it may be that actually have
estrogenicity by the presence of waste on site, presence of algae and other factors.
According Ouyanga et al, 2006 and Eun-Joung et al, 2007, seasonal variations can alter water quality and concentration of
DEs. During the drier station, the streams may include less water or no water is not silted to lakes high concentrations of
estrogens and thus detects the estrogenicity is little water. In our study, the E2 was determined only in periods of drought,
where the sewage inflow, constant throughout the year, is enhanced with the decrease in river flows slowly over the region
rain events. E2 is the most potent estrogen, followed by E1 and E3. Estriol, however is the major secreted form, since the
biosynthesis of 17β-estradiol in the body, other hormones, together with E2 are converted into estrone and estriol in later
before excretion (Osterlund and Hurd, 2001).
Countries like Italy, Holland, Belgium and the United States reported concentrations of these estrogens in their watersheds
between 0.2 and 21.7 ng L-1 (Verliefde, et al, 2007; Benotti et al, 2009). On the other hand, the recorded history for some

International Journal of Environmental & Agriculture Research (IJOEAR) ISSN:[2454-1850] [Vol-3, Issue-5, May- 2017]
Page | 41
Brazilian sources, including Atibaia and Capivari, it is more worrying. Concentrations in ug L-1 levels are reported to
oestrogens in rivers of Campinas, Jaboticabal and Belo Horizonte (Montagner and Jardim, 2011; Lopes et al, 2010; Moreira
et al., 2009).
The concentrations determined in our samples, in most cases, were very close to the limit of quantification by bioassay,
which only shows a tendency to detect synthetic estrogen in the bodies of water studied. The Endocrine Society has recently
expressed its concern about the presence and chronic exposure to traces of endocrine disruptors concentrations with high
potential estrogenic, as EE2 and other substances used as contraceptives and hormone replacement therapy as well as the
chemical industry by-products, because of causing adverse effects human and animal health (Diamanti-Kandarakis et al.,
2009).
MCF7 cells, tumor cells of human breast are easily cultivated and have estrogen receptors and stable estrogen dependence.
We were able to demonstrate the proliferative response of these MCF7 in the control and the presence of 17B-estradiol (E2).
A simple answer, reproducible. So, this is a sensitive system for the detection and quantification of estrogenic activity present
in water or other substrate.
Accordingly, the results of e-screen assay were also found by different groups such as, Sonnenschein et al, 1998, Soto et al,
1995, etc. Different classes of substances such as steroids, alkylphenols, bisphenols, polyphenols, phthalates, hydrocarbons,
chlorine, Xenoestrogen) act as estrogens which allow a quantitative extraction and application, also this e-screen assay.
IV. CONCLUSION
With this work, we were able to demonstrate that the E-screen assay with MCF7 cells is a sensitive and stable tool for
quantitative analysis of estrogenicity of water in watersheds in the State of São Paulo and can easily be developed and
applied in routine for animals and man food, aqueous extracts, plastics, etc.
ACKNOWLEDGEMENTS
The authors want to Thank FAPESP.
REFERENCES
[1] H. R. Aerni; B. Kobler; B. V. Rutishauser; F. E. Wettstein; R. Fischer; W. Giger; A. Hungerbühler; M.D. Marazuela; A. Peter; R.
Schönenberger; A.C. Vögeli; M.J.F. Suter; R. I. L. Eggen. Combined biological and chemical assessment of estrogenic activities in
wastewater treatment plant effluents. Anal.Bioanal. Chem. 378, 688-695, 2004
[2] F. A. Azevedo; A. M. Chasin. As bases toxicológicas da ecotoxicologia. São Carlos: RiMa, 2003. São Paulo: InterTox, 340 p, 2003
[3] M. J. Benotti; R. A. Trenholm; B. J. Van Der Ford; J. C. Holady; B. D. Stanford; S.A Snyder. Pharmaceuticals and endocrine
disrupting compounds in U.S. drinking water; Environ. Sci. Technol.; 43, p 597,2009
[4] R. Bowler; M. Cone; E. James. Segredos em medicina do trabalho. Porto Alegre: Artmed Editora, 396 p. 2010
[5] T. Colborn. O futuro roubado. Porto Alegre: L&PM, 354, 2002
[6] J. P. B. Diamanti-Kandarakis; L. C. Giudice; R. Hauser; G. S. Prins; A. M. Soto; R. T. Zoeller; A. C. Gore. Endocrine reviews
Endocrine-disrupting chemicals: An Endocrine Society scientific statement 30:293–342, 2009
[7] Eun-Joung; K. Kyoung-Woong; P. Kihong; K. Ju-Yong; K. Jiwon; H. Se-Yeong; Lee. Monitoring of environmental phenoloc
endocrine disrupting compounds in treatment effluents and river waters Korea, talanta 73,674-683, 2007
[8] S.E. Fenton. Endocrine-disrupting compounds and mammary gland development: early exposure and later life consequences.
Endocrinology 147(6 suppl): S18–S24, 2006
[9] C. P. Ferreira. Bioquímica Básica. 5.ed., rev. e ampl., São Paulo: MNP, 453 p, 2003
[10] A. C. Gore; J. J. Heidel; R. Zoeller. Epigenetic Transgenerational Actions of Endocrine Disruptors. T Endocrinology147(6), pp. s1-s3
2013
[11] T. P. R. Gray; S. Jobling; S. Morris; C. Kelly; S. Kirby; A. Janbakhsh; J. E. Harries; M. J. Waldock; J. P. Sumpter; C. R. Tyler. Long-
term temporal changes in the estrogenic composition of treated sewage effluent and its biological effects on fish Environ. Sci.
Technol, 34, 1521- 1528, 2000
[12] L. J. JR. Guillette; M. P. Gunderson. Alterations in development of reproductive and endocrine systems of wildlife populations
exposed to endocrine-disrupting contaminants. Reproduction 122(6): 857-864, 2001
[13] T. B. Hayes; A. Collins; M. Lee; M. Mendoza; N. Noriega; A. A. Stuart; A. Vonk. Hermaphroditic, demasculinized frogs after
exposure to the herbicide atrazine at low ecologically relevant doses. Proc Natl Acad Sci U S A 99(8): 5476-5480, 2002
[14] S, Koifman; R. J. Koifman; A. Meyer. Human reproductive system disturbances and pesticide exposure in Brazil. Cad. Saúde Pública,
Rio de Janeiro: v.18, n.2, mar. /abr., 2002
[15] L. G. Lopes; M. R. R. Marchi; J. B. G. Souza; J. A. Moura; C. S. Lorenzon; C. Cruz; L. A. Amaral. Estrogênios em águas naturais e
tratadas da região de Jaboticabal – São Paulo; Quim. Nova; 33; p 639, 2010

International Journal of Environmental & Agriculture Research (IJOEAR) ISSN:[2454-1850] [Vol-3, Issue-5, May- 2017]
Page | 42
[16] C. M. Markey; M. A. Coombs; C. Sonnenschein; A. M. Soto. Mammalian developmentin a changing environment: exposure to
endocrine disruptors reveals the developmental plasticity of steroid-hormone target organs. Evol Dev 5(1): 67-75, 2003
[17] Y. K. Matuo; J. N. C. Lopes; T. Matuo. Contaminação do leite humano por organoclorados DDT, BHC e ciclodienos. Jaboticabal:
FUNEP, 1990. 99p.
[18] J. A. Mclachlan. Environmental signaling: what embryos and evolution teach us aboutendocrine disrupting chemicals. Endocr Rev
22(3): 319-341, 2001
[19] A. Eyer. Estarão alguns grupos populacionais brasileiros sujeitos à ação de disruptores endócrinos? Cad. Saúde Pública, Rio de
Janeiro: 15 (4):845-850, 1999
[20] C. C. Montagner; W. F. Jardim. Spatial and seasonal variations of pharmaceuticals and endocrine disruptors in the Atibaia River, São
Paulo State (Brazil); J. Braz. Chem. Soc.; 22; p 1452, 2011
[21] D. S. Moreira; S. F. Aquino; R. J. C. F. Afonso; E. P. P. C. Santos; V. L. De Paula. Occurrence of endocrine disrupting compounds in
water sources of Belo Horizonte metropolitan area, Brazil; Environ. Technol.; 30, p 1041,2009
[22] M. K. Osterlunf; Y. L. Hurd. Estrogen receptors in the human forebrain and the relation to neuropsychiatric disorders. Prog
Neurobiol. Jun;64(3):251-67, 2001
[23] Y. Ouyanga; P. Nkedi-Kizzab; Q. T. Wuc; D. Shine; C. H. Huang. Assesment of seasonal variations in surface of water quality.Res.
40,3800-3810,2006
[24] PATNAIK, Pradyot. Guia geral: propriedades nocivas das substâncias químicas. Belo Horizonte: Ergo, v. 1, 546 p,2002
[25] I. Shaw; S. Mccully. A review of the potential impact of dietary endocrine disrupters on the consume Int. J. Food Sci. Technol. 37(5),
471-476r, 2002
[26] C. L. S. Sisino; M.R. Oliveira. Resíduos sólidos, ambiente e saúde: uma visão multidisciplinar. Rio de Janeiro: Fiocruz, p. 111-28,
2000
[27] C. Sonnenschein; A.M. Soto. An Updated Review of Environmental Estrogen and Androgen Mimics and Antagonists Molec. Biol.
Vol. 65, No. 1±6, pp. 143±150, 1998
[28] A. M. Soto; C. Sonnenschein; K. L. Chung; M. F. Fernandez; N. Olea; F. O.Serrano. The E SCREEN assay as a tool to identify
estrogens: an update on estrogenic environmental pollutants. Environental Health Perspective, 103, 113-122,199
[29] M. U. Teves. Lixo urbano – contaminação por resíduos de tintas e vernizes. São Paulo: Fundacentro, 124 p., 2001
[30] C. R. Tyler; S. Jobling; J. P. Sumpter. Endocrine disruption in wildlife: a critical review of the evidence. Crit Reviews in Toxicol
28(4):319-361, 1998
[31] N. A. Van Labeke; A. J. Sasco; J. T. Brophy; M. M. Keith; M. A. Watterson. Sex ratio changes as sentinel health events of endocrine
disruption. Int J Occup Environ Health;14(2):138-43, 2008
[32] A. Verliefde; E. Cornelissen; G. Amy; B. V. Bruggen; H. Dijk. Priority organic micropollutants in water sources in Flanders and the
Netherlands and assessment of removal possibilities with nanofiltration; Environ. Pollut.; 146; p 281,2007
[33] W. V. Welshons; S. C. Nagel; K. A. Thayer; B. M. Judy; S. A. A. L. Vom. Low-dose bioactivity of xenoestrogens in animals: Fetal
exposure to low doses of methoxychlor and other xenoestrogens increases adult prostate size in mice. Toxicol Ind Health 15: 12-25,
1999
[34] R. Xelegati; M. L. Robazzi. Riscos químicos a que estão submetidos os trabalhadores de enfermagem: uma revisão de literatura. Rev.
Latino-Am. Enfermagem, Ribeirão Preto: v.11 n.3, 2003 p. 350-6, 2003.

International Journal of Environmental & Agriculture Research (IJOEAR) ISSN:[2454-1850] [Vol-3, Issue-5, May- 2017]
Page | 43
Antifungal activity of lichen extracts and usnic acid for
controlling the saprolegniasis Shou-Yu Guo
1*, Wen-Xia Liu
2, Liu-Fu Han
3, Jia-Zhang Chen
4*
1State Key Laboratory of Mycology, Institute of Microbiology, Chinese Academy of Sciences, Beijing 100101, P. R. China.
2,3College of Life Science, Hebei Normal University, Shijiazhuang, Hebei 050024, P.R. China
4Freshwater Fisheries Research Center of Chinese Academy of Fishery Sciences, Wuxi, Jiangsu 214081, P.R. China
*Corresponding authors: Email: [email protected] and [email protected]
Abstract—Aquatic oomycetous fungi often cause serious damage to fresh water fishes. Antifungal activity of acetone
extracts of three fruticose lichens namely, Cladonia amaurocraea, Cladonia rangiferina and Usnea longissima were
investigated against three pathogenic oomycete fungi which can cause serious saprolegniasis: Saprolegnia parasitica, Achlya
bisexualis and Pythium sp.. Usnic acid was also examined for antifungal activity against the pathogenic fungi. The minimum
inhibitory concentration of usnic acid and lichen extracts for the tested fungi Saprolegnia parasitica and Achlya bisexualis
were 2 mg L-1, 200 mg L-1 respectively. The higher concentration was needed to inhibit mycelial growth of Pythium sp.. The
result suggests that the potential of using usnic acid and lichen extracts for controlling the saprolegniasis.
Keywords—antifungal activity, lichen, Oomycota, saprolegniasis, usnic acid.
I. INTRODUCTION
Saprolegniasis is a major disease problem and of great concern for the aquaculture industry. It plays a serious threat to fish
populations in natural habitats. It is usually recognized as a fungal disease caused by any of several species of water molds of
the family Saprolegniaceae, Oomycota, however, “oomycetous fungi” belong to the lineage of biflagellate “heterokont”
organisms, commonly referred to as “stramenopiles”, within the kingdom Chromista [1,2]. They do not belong to the
kingdom Fungi, although they are usually studied by mycologists. Saprolegnia parasitica and Achyla bisexalis are the two
most important oomycete fish pathogens. Some species in Pythium can also cause the saprolegniasis. Natural recovery by
infected fish is almost impossible [1,3]. Malachite green was quite an effective antifungal agent but it is mutagenic,
teratogenic and carcinogenic [4,5,6]. It has been banned since 1991 in many countries [7]. Formalin is the drug currently
permitted by FDA for controlling fungus on fish diseases in the United States. Hydrogen peroxide, sodium chloride and
bronopol are also worth mentioning in preventing and treating saprolegniasis [8]. Recently, nikkomycin Z was employed to
inhibit the growth of the mycelium of S. parasitica [9]. Due to the lack of efficient methods to control pathogenic
Saprolegniaceae, there is a dramatic reemergence of saprolegniasis in aquaculture. Thus, there is an important need for
developing efficient and sustainable methods to stop the spread of these pathogens.
Lichens are symbiotic organisms of fungi and algae or cyanobacteria that can produce unique secondary metabolites and
have been used in folk medicine since ancient times [10]. Studies in the last three decades proved the antimicrobial
(antibacterial and/or antifungal), antiviral, antiprotozoal, antipyretic, antitumour, antiproliferative, anti-inflammatory,
photoprotective, analgesic, as well as growth and enzyme inhibitory activities of some of the lichen extracts and compounds
[10,11]. Various studies have demonstrated that many of lichen species contain usnic acid could play various biological roles
and appear to function as allelopathic agents in nature. Usnic acid was proved to have the inhibitory effect on the growth of
mold, bacterium, and yeast [12]. It was also reported that the acetone, methanol and light petroleum extracts of Usnea were
effective against Bacillus licheniformis, B. megatarium and Staphylococcus aureus [13]. The results of study on the
antibacterial activities of different solvent extracts of Usnea florida showed that the extracts had certain inhibition effect on
Staphylococcus aureus, Escherich coli, Pseudomonas aeruginosa, Micrococcus luteus, and Aspergillus flavus [14].
The efficacies of usnic acid and the acetone extracts of three lichens (Cladonia amaurocraea, Cladonia rangiferina and
Usnea longissima) were evaluated for controlling the growth of Saprolegnia parasitica, Achyla bisexalis and Pythium sp. in
the present study. To the best of our knowledge, no information about the activities of lichen extracts and lichen acids against
aquatic oomycetous fungi is available at present.

International Journal of Environmental & Agriculture Research (IJOEAR) ISSN:[2454-1850] [Vol-3, Issue-5, May- 2017]
Page | 44
II. MATERIAL AND METHOD
Three species of lichen were used: Cladonia amaurocraea, Cladonia rangiferina, Usnea longissima. Three oomycetous
fungal species included: Saprolegnia parasitica, Achlya bisexualis and Pythium sp.. S. parasitica was purchased from CBS
(540.67). A. bisexualis (GHL 2012.2) and Pythium sp. (GHL 2012.3) were isolated from diseased fishes by using castor
seeds. All three strains can infect tilapia and cause saprolegniasis. The strains were cultured on potato dextrose agar (PDA)
slants and were stored at 4 oC until use. To obtain long-term growth cultures, the fungal strains were subcultured on 9-cm
diameter PDA plates at 25 oC.
The lichen thalli were removed dust particles. The extracts were prepared by the extraction of 2 g of ground lichen in 30 ml
acetone for five hours followed by filtration, at last get 20 ml lichen extracts. The stock solution of usnic acid was prepared
by 20 mg usnic acid was fully dissolved in 20 ml acetone. The lichen extracts and usnic acid were stored at 4 oC for further
bioassay. Final concentrations of stock solution for usnic acid and lichen extracts were 1 and 100 mg mL-1
respectively.
The medium of the following composition was prepared: dextrose 20 g, agar 20 g, potato 200 g, distilled water 1000 ml. The
usnic acid and lichen extracts were mixed in 100 ml standardized medium, to give concentration of usnic acid were 32, 16, 8,
4, 2 mg L-1
, the lichen extracts were 3.2, 1.6, 0.8, 0.4, 0.2 g L-1
. In controls, 800 μl acetone was used in place of usnic acid
and lichen extracts.
The pure culture of fungal species, growth and maintained on PDA medium at 25 o
C was used for the experiments. Each
treatment was duplicated three times. These treated Petri plates were incubated at 20 o
C Radial growth for each test was
recorded by taking the mean diameter of colonies from three plates. The measurements of colony diameter were made after
different incubation periods depending on the hyphal growth rate of each species: 2 days for Saprolegnia parasitica; 2, 6 and
8 days for Achlya bisexualis; 2, 7, 8 and 10 days for Pythium sp.. Inhibitory effects of lichen compounds were determined by
comparing treatment plates with control plates. The activity of each test compound was expressed as percent inhibition and,
where appropriate, in both control and treated Petri dishes, was measured diametrically and the percentage inhibition of
growth (% I) was calculated using the following formula.
I (%) =(C-T)/C×100
Where C = Diameters of fungal colony in control plate, T = Diameters of fungal colony in treatment plate.
Data were subjected to one-way analysis of variance (ANOVA) using the Statistical program SPSS16.0, and means
separation was made using Least Significant Difference (LSD). Difference on statistical analysis of data was considered
statistically significant at p<0.05.
III. RESULTS AND DISCUSSION
3.1 Activity of usnic acid
The activity of usnic acid concentration at 2, 4, 8, 16, 32 mg L-1
inhibited the growth of three pathogenic fungi is shown in
Table 1. Usnic acid absolutely inhibited the mycelial growth of Saprolegnia parasitica at 32 mg L-1
. Compared with the
activity of nikkomycin Z (about 100 mg L-1
, for totally inhibition), usnic acid has better effect to inhibit the growth of the
mycelium of S. parasitica [9]. Mycelial growth of Achlya bisexualis and Pythium sp. are totally inhibited by usnic acid at 16
mg L-1
. Among all three oomycetous fungi, usnic acid showed good antifungal activity on S. parasitica at the concentration
more than 4 mg L-1
(with percentage control >50%). The inhibitory potency of usnic acid against S. parasitica, A. bisexualis
and Pythium sp. demonstrated that the Minimal Inhibition Concentration (MIC) to be 2 mg L-1
, 2 mg L-1
, 8 mg L-1
,
respectively. The MIC was defined as the lowest concentration of significant inhibition of the visible mycelial growth.
Recently, 30 fungicidal chemicals in agriculture were screened for antifungal activity against Saprolegnia, among them,
kresoximmethyl and azoxystrobin showed very good effect in vitro with minimum inhibitory concentration (MIC) values of
1.0 and 0.5 mg L-1
, respectively [15]. However, the MIC of azoxystrobin was close to its safe concentration (SC 0.553 mg L-
1) and kresoximmethyl showed higher toxicity to goldfish (Carassius auratus) with MIC>SC (0.131 mg L
-1), thus, they may
need chemical modifications to enhance their inhibitive effects or could be used in combination with other drugs [15]. In our
study, That acute toxicity to goldfish of usnic acid performed as described in literatures [15,16] with SC (4.152 mg L-1
)
showed it can be used to control the saprolegniasis caused by S. parasitica and A. bisexualis. Among the three species of
oomycetous fungi tested, S. parasitica showed high susceptibility to the usnic acid. At concentration of 2, 4 mg L-1
, usnic

International Journal of Environmental & Agriculture Research (IJOEAR) ISSN:[2454-1850] [Vol-3, Issue-5, May- 2017]
Page | 45
acid showed growth promoting activities for Pythium sp. (Table 1). S. parasitica grows very quickly and the colony could
cover the whole Petri dishes for about 2 days, while Pythium sp. grows slowest among the three oomycetous fungi.
3.2 Activity of lichen extracts
Acetone extracts of Usnea longissima, Cladonia rangiferina and Cladonia amaurocraea at different concentrations (200,
400, 800, 1600, 3200 mg L-1
and with 800 μl acetone as control) for antifungal activity against Saprolegnia parasitica,
Achlya bisexualis and Pythium sp. with their percentage inhibition, which is an average of three replicates and its standard
error are given in Table 2. As an example, Mycelial growth of S. parasitica in different concentrations of Cladonia
rangiferina extracts was also shown in Fig. 1 a & b. Effects of lichen extracts vary at different concentrations tested. In all
cases, the fungal growth was completely inhibited with each extract at the concentration 3200 mg L-1
. No mycelial growth
was observed from all discs treated with extracts of U. longissima and C. rangiferina on Pythium sp.; the same results were
observed on Achlya bisexualis.
In the present study, the three lichens extracts significantly reduced the mycelial growth of the oomycetous fungi. Acetone
extracts of the three lichens were found to show excellent activity against all the test fungi except Pythium sp. when
compared with other two fungi. At a low concentration, extracts of lichens showed growth promoting activities for Pythium
sp.
Among three lichen species, the acetone extract of C. amaurocraea showed minimum inhibition against Saprolegnia
parasitica of 36 % at the concentration of 200 mg L-1
. Different concentrations of extracts exhibited significantly different
antifungal activity. In the case of the fungal growth was completely inhibited with each extract with the concentration 3200
mg L-1
. Minimal inhibitory concentration (MIC) of acetone extract of tested lichen was determined and shown in TABLE 3.
The minimal inhibitory concentration of the extracts against Saprolegnia parasitica and Achlya bisexualis is being found to
be 200 mg L-1
, in contrast against Pythium sp. was 800 mg L-1
(TABLE 3).
The acetone extract effects of U. longissima, C. rangiferina and C. amaurocraea at different concentrations on the mycelial
growth of Achlya bisexualis and Pythium sp. are also shown in TABLE 2. All extracts gave almost the same minimum
inhibitory concentrations against S. parasitica and A. bisexualis (TABLE 3). The results indicate that mycelial growth of A.
bisexualis is totally inhibited by extracts of the three lichens at 1600 mg L-1
and 3200 mg L-1
. At the concentration of 200 mg
L-1
and 400 mg L-1
extracts of three lichens showed growth promoting activities for Pythium sp.. While extract of C.
amaurocraea also showed growth promoting activities for Pythium sp. at the concentration of 800 mg L-1
. Acetone extracts
of U. longissima was the better growth inhibitor when compared with acetone extracts of C. rangiferina and C. amaurocraea
(TABLE 2). In the case of the extracts of U. longissima and C. amaurocraea, usnic acid should be effective compound, while
for C. rangiferina, atranorin and fumarprotocetraric acid or their combination may be the main agents.
(A) (B)
FIGURE 1: (A): MYCELIAL GROWTH OF SAPROLEGNIA PARASITICA IN DIFFERENT CONCENTRATIONS (100×)
OF CLADONIA RANGIFERINA EXTRACTS IN POTATO DEXTROSE AGAR MEDIUM.
(B) EFFECT OF DIFFERENT CONCENTRATIONS (100×) OF CLADONIA RANGIFERINA EXTRACTS ON THE
MYCELIAL GROWTH INHIBITION OF SAPROLEGNIASIS PATHOGEN SAPROLEGNIA PARASITICA. ERROR BARS
REPRESENT THE STANDARD ERROR OF THE MEAN.

International Journal of Environmental & Agriculture Research (IJOEAR) ISSN:[2454-1850] [Vol-3, Issue-5, May- 2017]
Page | 46
TABLE 1
EFFECT OF USNIC ACID ON THE MYCELIAL GROWTH AND PERCENTAGE CONTROL OF SAPROLEGNIA
PARASITICA, ACHLYA BISEXUALIS AND PYTHIUM SP.
Fungal strain Percentage control at various concentrations of usnic acid at 20 oC
0 mg/L 2 mg/L 4 mg/L 8 mg/L 16 mg/L 32 mg/L
Saprolegnia parasitica CBS
540.67 0 36.8±1.10 62.0±0.29 79.1±1.05 85.6±0.94 100±0
Achlya bisexualis GHL
2012.2 0 2.55±1.93 13.2±1.25 49.6±1.66 100±0 100±0
Pythium sp.
GHL 2012.3 0 -19.5±3.05 -5.6±3.78 23.5±1.68 100±0 100±0
TABLE 2
ANTIFUNGAL ACTIVITY OF ACETONE EXTRACTS OF USNEA LONGISSIMA, CLADONIA RANGIFERINA AND
CLADONIA AMAUROCRAEA
Lichen Concentration Percentage inhibition at various concentrations at 20
OC(%)
Saprolegnia parasitica Achlya bisexualis Pythium sp.
Usnea longissima
0 mg/L 0 0 0
200 mg/L 66.82±0.31 b 33.08±1.13 a –49.45±5.00 a
400 mg/L 70.73±0.64 c 60.34±0.30 b –24.75±4.57 b
800 mg/L 58.07±1.44 a 100±0.00 c 33.30±4.95 c
1600 mg/L 79±1.52 d 100±0.00 c 100±0.00 d
3200 mg/L 100±0.00 e 100±0.00 c 100±0.00 d
Cladonia
rangiferina
0 mg/L 0 0 0
200 mg/L 41.76±1.15 a 12.00±1.85 a –1.44±16.8 a
400 mg/L 62.57±1.54 b 32.59±1.61 b –1.11±8.50 a
800 mg/L 79.39±0.87 c 67.59±1.45 c –9.47±6.31 b
1600 mg/L 89.40±0.42 d 100±0.00 d 100±0.00 c
3200 mg/L 100±0.00 e 100±0.00 d 100±0.00 c
Cladonia
amaurocraea
0 mg/L 0 0 0
200 mg/L 36.13±1.46 a 12.60±0.69 a –23.85±2.64 a
400 mg/L 59.71±1.47 b 28.35±1.17 b –2.00±1.39 b
800 mg/L 77.86±1.18 c 64.84±1.50 c 24.78±2.58 c
1600 mg/L 87.31±0.37 d 100±0.00 d 80.42±0.63 d
3200 mg/L 100±0.00 e 100±0.00 d 100±0.00 e
a-e: Different small letters indicate significant differences among 5-level concentration within the same lichen extract (One-way
ANOVA and Least Significant Difference (LSD), P< 0.05). Data are mean ± SE (standard error) based on n = 3.
TABLE 3
MINIMAL INHIBITORY CONCENTRATION (MIC) OF USNIC ACID AND LICHEN EXTRACTS AGAINST
PATHOGENIC OOMYCETOUS FUNGI
Fungal strain
The MIC of Usnic
acid
(mg L-1
)
The MIC of lichens tested (mg L-1
)
Usnea longissima Cladonia rangiferina Cladonia amaurocraea
Saprolegnia parasitica
CBS 540.67 2 200 200 200
Achlya bisexualis
GHL 2012.2 2 200 200 200
Pythium sp.
GHL 2012.3 8 800 1600 800

International Journal of Environmental & Agriculture Research (IJOEAR) ISSN:[2454-1850] [Vol-3, Issue-5, May- 2017]
Page | 47
IV. CONCLUSION
In conclusion among all the lichen extracts and usnic acid tested for antifungal activity on the oomycetous fungi, good
efficacy was demonstrated, except at a low concentration, the growth promoting activities for Pythium sp. were observed.
Therefore, lichen secondary metabolites could be used as an effective agent for the treatment against the infection of some
pathogenic oomycetous fungi. The lichens have the potential for use in developing a novel therapy to control saprolegniasis
in aquaculture.
ACKNOWLEDGEMENTS
S.Y. Guo and J. Z. Chen were granted by the Ministry of Agriculture of China (CARS-49), L.F. Han was granted by the
Natural Science Foundation of Hebei Province (C2012205009). The valuable assistance given by the graduate students Y.Y.
Zhang and C.J. Wang in Heibei Normal University is gratefully acknowledged.
REFERENCES
[1] M.W. Dick, Straminipilous Fungi. Dordrecht: Kluwer Academic Publishers, 2001.
[2] T. Cavalier-Smith, and E.E.Y. Chao, Phylogeny and megasystematics of phagotrophic heterokonts (Kingdom Chromista). J Mol
Evolution 62:388–420, 2006.
[3] A.H. AL-Duboon, M.A. AL-Mukhtar, A.A.R. Jassim, S.Q. Bader, and J.M. AL-Zawar, Saprolegniasis of Barbus sharpeyi, Gunther
(Bunnei Fish) in Basrah/ IRAQ, Iraq J. Aqua 1: 25-29, 2006.
[4] N. Kitancharoen, A. Yamaoto, and K. Hatai, Effects of Sodium Chloride, Hydrogen Peroxid and Malachite Green on fungal infection
in Rainbow trout eggs. Biocontrol Science 3(2): 113-115, 1998.
[5] M. Sundarrajan, A. Z. Fermandis, and G. Subrahmanyam, Over expression of G1/S cyclins and PCNA and their relationship to
tyrosine phosphorylation and dephosphorylation during tumor promotion by metanil yellow and malachite green. Toxicology Letters
116(27): 119-130, 2000.
[6] S.M. Mousavi, and S.S. Mirzargar, Evaluation of Antifungal activity of new combined essential oils in comparison with Malachite
Green on Hatching rate in rain bow trout (oncorhynchus mykiss) eggs. Journal of Fisheries and Aquatic Science 4(2): 103-110, 2009.
[7] G. Fornerisa, G. Bellardib, and G.B. Palmegiano, The use of ozone in trout hatchery to reduce saprolegniasis incidence. Aquaculture
221: 157-166, 2003.
[8] J.M. Aller-Gancedo, and J. M. Fregeneda-Grandes, Comparative efficacy of Pycezes (bronopol) in controlling mortality of brown
trout Salmo trutta eggs. Aquaculture Research 38: 618-624, 2007.
[9] G. Guerriero, M. Avino, Q. Zhou, J. Fugelstad, P.-H., Clergeot et al., Chitin synthases from Saprolegnia are involved in tip growth
and represent a potential target for anti-Oomycete drugs. PLoS Pathog 6(8): e1001070, 2010. doi:10.1371/journal.ppat.1001070.
[10] H. Türk, M. Yılmaz, T. Tay, A. Özdemir Türk, and M. Kıvanc, Antimicrobial Activity of Extracts of Chemical Races of the Lichen
Pseudevernia furfuracea and their Physodic Acid, Chloroatranorin, Atranorin, and Olivetoric Acid Constituents. Z. Naturforsch. 61c,
499-507, 2006.
[11] S. Huneck, The significance of lichens and their metabolites. Naturwissenschaften 86: 559-570, 1999.
[12] X.F. Zhao, Study on bacteriostatic experiment of lichen usnic acid. Nutrition and health, Food science 21(3):42-44, 2000.
[13] B.C. Behera, N. Verma, A. Sonone, and U. Makhija, Antioxidant and Antibacterial activities of lichen Usnea ghattensis in vitro.
Biotech Lett 27: 991-995, 2005.
[14] Y. Zhou, Z. Duan, Y. Li, C.C. Li, and Y.F. Huang, Studies on the antibacterial activities of extract of Usnea florida (L.) Wigg.
Chinese Folk Medicine Magazine 87: 230-233, 2007.
[15] X. G. Hu , L. Liu, K. Hu, X. L. Yang, and G. X. Wang, In Vitro Screening of Fungicidal Chemicals for Antifungal Activity against
Saprolegnia. Journal of the world aquaculture society 44(4): 528-535, 2013.
[16] G. X. Wang, Z. Zhou, C. Cheng, J. Yao, and Z. Yang, Osthol and isopimpinellin from Fructus cnidii for the control of Dactylogyrus
intermedius in Carassius auratus. Veterinary Parasitology 158:144–151, 2008.

International Journal of Environmental & Agriculture Research (IJOEAR) ISSN:[2454-1850] [Vol-3, Issue-5, May- 2017]
Page | 48
Simultaneous Estimation of Multiple Dairy Technologies Uptake Yared Deribe
1, Agajie Tesfaye
2
1Livestock and Irrigated Value Chains for Ethiopian Smallholders Project—International Livestock Research Institute
(ILRI), P.O. Box 5689, Addis Ababa, Ethiopia 1Melkassa Agricultural Research center (MARC), Adama, Ethiopia 2Holleta Agricultural Research center (HARC), Holleta, Ethiopia
Abstract— The low productivity of the Ethiopian diary sector has been explained by the genetic potentials and management
practices. Milk production and consumption largely rely on the indigenous cows. To enhance the contribution of dairy to
household food security, nutrition and income, adoption of improved dairy breeds together with the component practices is
indispensable. To study the adoption of the dairy technologies and the factors stimulating the choices, a cross-sectional
household survey was conducted in the central and eastern Ethiopia. Results declare that the rate of adoption of improved
breeds, artificial insemination and improved forage remained to be limited. The uptake of concentrate feeding is found to be
relatively better. As the joint multivariate probit estimation confirmed, there is complementarity and interdependence in the
uptake of improved breeds, artificial insemination, concentrate feeds and improved forages. Utilization of forage lagged
behind to complement adoption of improved cows. Tobit model determination confirmed that the same factors are affecting
the adoption decisions. The factors responsible for the joint adoptions, the number of cows owned and intensity of adoption
include education status, household wealth, access to markets and district centers, contacts with extension and gender roles.
Both the joint and individual analyses highlighted the need for strategies that could overcome the constraints and ensure
better uptake of the technologies.
Keywords— productivity; adoption; joint estimation; complementarity; adoption intensity; responsible factors.
I. INTRODUCTION
Despite Ethiopia has high potentials for dairy development, farm productivity and consumption of milk lags behind the
World and African average. Recent estimates showed that the national average daily milk yield of the indigenous cows is
1.32 liter with a lactation period of 180 days. While improved cows yield 7 liters with a lactation period of 242 days
(Gebremedhin et al., 2014). Reasons of poor genetics, insufficient animal feeding and poor management practices explain the
low productivity levels. Availability of feed both in quantity and quality remain to be the major impediment for livestock
production and also specifically to the dairy sector. The size of land allocated for livestock grazing is minimal compared to
land devoted to crop productions (Ahmed et al., 2004; Gebremedhin et al., 2009; Ayele et al., 2012). Moreover, limited
availability of land and water resources and climate variability are important challenges (Godfray et al., 2010; Smith, 2013;
Alemayehu et al., 2012).
Current studies indicated that there is a high supply and demand gap for fresh milk and milk products. Population growth,
rising income and urbanization justify the recent growing trend of the demand for livestock products in the domestic and
export markets (Delgado, 2003; Smith, 2013; Dunkan et al., 2013). Keeping pace with an increasing demand for livestock
products, improving household income and reducing poverty requires revolutionizing productivity though adoption and
diffusions of dairy technologies. Literatures emphasized that adoption of new technologies is promising path way to
agricultural development (Baltenweck et al., 2006) or to accelerate economic growth and ensuring food security in Africa
(Hazell, 2013).
Notwithstanding the availability of agricultural technologies, adoption rates in Sub-Saharan agriculture remained low (Gollin
et al., 2005; Kondylis et al, 2017). In Ethiopia, several technologies of improved breeds of dairy cattle, artificial
insemination, improved forages and veterinary health care have been promoted to the users (Staal et al., 2008; Ahmed et al.,
2004; Spielman et al., 2010). However, the uptake of the technologies by the stallholder farmers proved to be minimal (Ayele
et al., 2012; Duncan et al., 2013). Several scholars have tried to find out the reasons for the lower rate of adoption of
technologies. Some farmers have better acceptance towards the disseminated technologies while others are reluctant and they
maintain their status quo positions. Determination of the complementarity, extent, intensity and the factors explaining
smallholders’ adoption decision is therefore crucial to suggest research and extension policies to design mechanisms that
facilitate adoption of technologies.

International Journal of Environmental & Agriculture Research (IJOEAR) ISSN:[2454-1850] [Vol-3, Issue-5, May- 2017]
Page | 49
II. THE STUDY APPROACH AND DATA
2.1 Design and Data Source
With an aim to address the adoption study and impacts of adoption of dairy technologies, a household survey was conducted
in 2015. The dataset used for this literature was generated through cross-sectional survey held at country level, considering
diverse agro-ecologies and administrative regions. In the Oromia region, eight zones were targeted to document the extent of
adoption and impacts of adoption of dairy technology packages. As part of the national survey, the analysis comprises East
Shewa and West Hararge zones, situated in the central and eastern part of the country. The main survey included a total of
1630 households among which 401 households were considered.
The selection of the next administrative units or districts was based on their access to markets and services, which could
further give options to target more accessible and less accessible villages. Furthermore, the cow population potential of the
districts was used as the selection criteria. Two districts, Boset and Ada’a were included in East Shewa zone. From the West
Hararge zone, Chiro and Habro districts were studied. Subsequently, two villages from each districts were considered based
on their proximity to the district center, i.e., within 10 km distance from the district for the more accessible and greater than
10 km for the less accessible PAs. Based on the nationally adjusted and determined samples, proportionate samples of
households were taken from the respective villages while taking into account the number of households residing in those
villages. The same survey instrument was used embracing gender disaggregated information towards dairy technology
adoptions and services.
2.2 Characterization of the Study Areas
In Ethiopia, the dairy system is characterized by subsistent production, low use of technologies, underdeveloped markets, and
services (Ahmed et al., 2004; Staal et al., 2008). The share of the indigenous cows constitutes 81% of the total annual milk
productions (FAOSTAT, 2014). In the rural areas, much of the production is used for household consumptions (CSA, 2015;
Duncan et al., 2013; Staal et al., 2008).
Feed constitutes the largest share of the expenditure in dairy farming system in Ethiopia. To come up with the existing feed
shortages, improved forage technologies, feed conservation technologies and the use of agro-industrial by-products have
been promoted (Lenné and Wood, 2004; Ergano, 2015). Studies indicated that there is an increased demand for concentrate
feeds, which could be explained by the replacement of indigenous cows with cross-bred cows. Grazing remains to be an
important source of feed for dairy animals comprising nearly half of the overall nutritional sources. Estimations showed that
the contribution of crop residues, green fodder and concentrate constitute 60%, 25% and 15%, respectively (Duncan et al.,
2013).
So far several development programs in the country have targeted on introduction of high yielding exotic cattle in the
highlands and distribution to smallholder farmers (Ahmed et al., 2004; Staal, 1995; Ergano, 2015). Artificial insemination
(AI) technologies have been widely promoted as an effective technique for dissemination of genetic gain to producers at a
relatively low cost. The dysfunctional nature of the Ethiopian AI system has also been emphasized. The involvement of the
private sector for the provision of AI services is also minimal (Duncan et al., 2013; Ergano, 2015).
The importance of market access for dairy development, adoption of breeds, utilization of inputs and marketing links has
been mentioned. Organized dairy cooperatives enable to overcome the existing dairy marketing constraints in rural areas
(Jaleta et al., 2013). The recent emergence of private processing industries and marketing units likely stimulate producers in
the peri urban areas and rural production systems, offering new market outlets for dairy products (Ahmed, 2004). Past studies
defined market quality sites by associating with the availability of dairy cooperatives and privates operating with necessary
dairy processing facilities (Duncan et al., 2013).
The center for East Shewa zone, named as Adama is found some 100 kilometers away from Addis Ababa. It is a business
hub for the surrounding zones and neighborhoods. The site is characterized by its proximity to better markets and services of
institutions that are disseminating dairy technologies. The major market outlets for dairy products and institutions such as
cooperatives, milk collectors, small and medium processors are available. Feed milers/mixers, flour mills and food industries
are also supplying compound and concentrate feeds.
Bishoftu is the center for Ada’s district and located about 44 kilometers away from Addis Ababa. The district has access to
markets at Bishoftu where milk collectors and processing units of the private owned, Holland Dairy and Ada’a Dairy
Cooperative are in operation. Among the industrial feed manufacturers, Alema Feed PLC is the largest supplier of compound

International Journal of Environmental & Agriculture Research (IJOEAR) ISSN:[2454-1850] [Vol-3, Issue-5, May- 2017]
Page | 50
feed for different livestock. Boset district is found in the neighborhood to the zonal center. Urban and peri-urban dairy
producers supply fresh milk for the city and milk processors such as, Yakla PLC. Some of the selected villages have access
to the district and market at Adama while others have poor access. Adama is the major supplier of wheat bran, wheat
middling and seed cakes to the neighborhoods and also distant markets.
Chiro is the administrative center for the West Hararge and had a distance of 325 kilometers from Addis Ababa. The area
could be described by the limited access to large markets, services and feed suppliers as compared to East Shewa. The formal
dairy marketing outlets both private and dairy farmer groups are not common. Though better participation in milk marketing
in the West Hararge, the informal marketing channel remains the dominant option. The district of Chiro is found very closer
to zonal center and expected to have better market access. Habro district is found 70-75 kilometers away from the zonal
center.
TABLE 1
HOUSEHOLD AND DAIRY RELATED INFORMATION ABOUT THE SURVEY SITES Household and farm characteristics East Shewa West Hararge Total Std. Dev
Family members 6.19 6.08 6.14 2.33
Age of the head(years) 45.65 38.89 42.20 12.01
Completed education (years) 2.35 2.17 2.26 3.32
Land holding (ha) 2.09 0.66 1.36 1.26
Land for perennials (ha) 0.11 0.23 0.17 0.36
Non-agricultural income (ETB)* 6211.8 2262.4 4192.8 16547.2
Total livestock ownership (TLU) 8.12 3.61 5.82 4.19
Oxen ownership (No) 2.82 0.88 1.83 1.80
Cow ownership (local) 1.47 1.26 1.37 0.87
Lactation length (months)** 7.0 5.6 6.0 -
Daily milk production (liters)** 1.38 1.83 1.60 -
Local breed cows(liters)
Early lactation 2.64 3.12
Mid lactation 1.65 1.29
Late lactation 1.07 1.10
Improved cows(liters)
Early lactation 9.27 5.68
Mid lactation 6.76 4.09
Late lactation 4.71 3.29
Source: Own Survey (2015) *1$=22.63 ETB ** Central Statistical Agency (2015).
TABLE 2
MAJOR DAIRY FEED SOURCES AND COMPOSITION (PERCENTAGES) Feed Source East Shewa West Hararge Total
Grazing 79.08 75.61 77.31
Crop residue 92.35 98.05 95.26
Green feeding 78.57 94.15 86.53
Hay 22.96 54.15 38.90
Concentrate feeds 52.04 49.27 50.62
Improved forage 10.2 29.27 19.95
Beverage by-products 80.61 6.83 42.89
Source: Own Survey (2015).
III. THEORETICAL AND ANALYTICAL CONTEXT
3.1 Theories of Technology Adoption and Empirical Models
The pioneer scholars elucidated that technology adoption commonly refers to the decision to use a new technology or best
course of action available by economic units on a regular basis. The terminology of diffusion often refers to spatial and
temporal spread of the new technology among different economic units (Rogers and Shoemaker, 1971). According to Feder
et al. (1985), individual or farm level adoption refers the degree of use of a new technology in a long-run equilibrium when
the farmer has full information about the new technology and potentials. Aggregate adoption (diffusion) was defined as the

International Journal of Environmental & Agriculture Research (IJOEAR) ISSN:[2454-1850] [Vol-3, Issue-5, May- 2017]
Page | 51
process of spread of a technology within a region. Similarly, Thirtle and Ruttan (1987) defined aggregate adoption as the
spread of a new technique within a population (in Feder and Umali, 1993).
In the literatures of agricultural technology adoption, two commonly known approaches often have been raised. Because of
the fact that agricultural extension programs in developing countries promote technologies as a package, simultaneous
adoption of whole package is expected (Beyene, 2008). One of the first models related with a technological package was
developed by incorporating technological complementarity and adoption under uncertainty. The potential output would
rather be higher if both technologies are adopted than when the single one is adopted. Thus, the model implies a situation
whereby initially larger farms adopt both technologies, while adoption of the divisible technologies by smaller farms will be
limited (Feder and Umali, 1993). Others debated the whole package approach and emphasized that farmers do not adopt
technologies as packages, rather they are opting for a single component or a few suitable technologies (Byerlee and Hesse de
Polanco, 1986). Leathers and Smale (1991) explained step-wise or sequential adoption despite risk neutrality and
unconstrained expenditures, because uncertainty is reduced through experience, the farmer may choose to adopt a component
of the package (Foster and Rosenzweig, 1995).
Empirical studies by Pitt and Sumodiningrat (1991) modeled the simultaneous decisions involved in the adoption of new
technologies under risk and uncertainty using the meta profit function. Hayami and Ruttan (1985) defined the meta profit
function as dual to the meta production function (cited in Feder and Umali, 1993). Others stated that due to this fact, it is
important to account for the relationships between the components of the innovation package (Mara et. al, 2002). The
interactions between technological components possibly have influences on adoption (Byerlee and Hesse de Polanco, 1986).
In connection to this, the simultaneous pattern of adoption was not found to be the case in drought-prone areas of Ethiopia
(Kebede et al., 1990).
Both economic and sociological factors are responsible for the disparity in farm decisions and heterogeneity among adopters
and non-adopters. From the sociological perspective of adoption, Rogers (2003) explained five main factors that are
important in innovation, viz.: relative advantage, compatibility, complexity, trialability and observability (Marra et al., 2003).
Relative advantage refers the degree to which a measure is assumed to outmatch another one, for instance costs and
associated risks with new technologies (Smit and Smitters, 1992; Sattler and Nagel, 2006).
3.2 Factors Explaining Adoption Decisions
Analysis of agricultural technology adoption tempted in the effects of imperfect information, risk, uncertainty, institutional
constraints, human capital, input availability and infrastructures (Feder et al., 1985; Foster and Rosenzweig 1995; Feder and
Umali, 1993; Semgalawe and Folmer, 2000). Differences in technology uptake among smallholders could arise due access to
farm endowments and product markets (Jayne et al., 2013). Feder et al. (1985) indicated that farm size, risk and uncertainty,
human capital, availability of labor, credit constraints, and tenure security were the most explaining factors (Marenya and
Barret, 2007). Furthermore, profitability, perceptions, attributes of the technology and information were discussed (Ervin and
Ervin, 1982; Norris and Batie, 1987; Pagiola, 1996; Shiferaw and Holden, 1998; Hassan et al., 1998a; Hassan et al., 1998b;
Lapar and Pandey, 1999; Kazianga and Masters, 2001 cited in Yigezu et al., 2015).
The conclusion by Just and Zilberman (1983) is that the magnitude of the effect of farm size on adoption decision relates to
the household‘s risk behavior and farm returns. The larger farms are relatively are in better position to fulfill the high capital
expenditures required with the adoption of new technologies. The Study by (Kebede et al., 1990) showed that in Ethiopia,
adoption of crop inputs is positively associated with land ownership. Dynamic study approaches to adoption also confirmed
that large land size is needed for continuous uptake of grade cattle in Kenya. When it comes to use of concentrates, owning
of more land tend to be associated with continued use of concentrate feeding. Whereas, farmers who started growing fodder
are the owners of less land implying the tendency for intensification of dairy production (Baltenweck et al., 2006).
Among the human capital variables, Weir and Knight (2004) found that education leads to higher probability of technology
adoptions in Ethiopia. Wozniak (1987) and Kebede et al. (1990) also found that higher levels of education and access to
information reduce the uncertainty associated with technology adoption and thus, led to better adoption behavior. Panel data
tells that household education has positive effect for the continued uptakes of grade cattle. Unexpectedly, more educated
farmers abandoned concentrate feeding while it positively affected established use of concentrates (Baltenweck et al., 2006).
Availability of more family labor encouraged establishment of dairy farming, which implies that feeding concentrates is
labor intensive. Furthermore, younger households who started keeping improved cattle in the past, but while aging they
abandoned keeping them. In Ethiopia, similar conclusions have been drawn by studies on the adoption of improved breeds in

International Journal of Environmental & Agriculture Research (IJOEAR) ISSN:[2454-1850] [Vol-3, Issue-5, May- 2017]
Page | 52
the areas of Selale and Ada’a. It is indicated that the experience of the farmer has positive impact on adoptions of improved
breeds while size of the family was negative (Kebede et al., 1993).
Possession of more wealth leads to decreased absolute risk aversion (Marra et al., 2003). Empirical studies concluded that
poor households are risk adverse so that they fail to invest in the most profitable opportunities. Conversely, they are involved
with low return and low risk activities (Dercon, 2008; Schindler, 2009). M. Rosenzweig and H. Binswanger found that the
wealth of the household encourages allocation of productive assets to the more risky portfolio (Dercon, 1996). According to
(Semgalawe and Folmer, 2000), household wealth did not have significant roles for adoption of conservation technologies. In
Ethiopia, higher wealth of the household positively affected adoptions of cross breeds in North Shewa (Selale) area while it
was negative in Ada’a (Kebede et al., 1993). The finding by (Diiro and Sam, 2015) concluded that values of the household
assets did not have significant impact on technology adoptions.
Technology adoption decision as a function of learning process from the past experiences has been emphasized. Through
learning-by-doing households accumulate knowledge (Semgalawe and Folmer, 2000; Kondylis et al., 2017) and past
adopters are more likely to continue to adopt new technologies. The role of experimentation and experience is related to more
ability to mitigate risks and making better farm decisions. Acquisition of information favors agricultural technology adoption
(Lindner, 1987). Lack of experience leads to risk aversion and has discouraging effect on adoptions. Most adoption studies
use specifications of proxy variables to address the access. Proxy variables are commonly used, and include for both the cost
of acquiring information and proxies for the incentive to acquire. Education status, distance to nearest current adopter, and
availability of extension services refer to the costs to acquire while farm size for the incentive to acquire (Marra et al., 2003).
With the prevalence of imperfect credit markets, non-farm income sources are substitutes for borrowed capital (Reardon,
1997; Ellis and Freeman, 2004) and translate into increased availability of resources to invest in improved technologies.
Findings tell that studies investigating the effect of nonfarm income on technology adoption in Africa have proved mixed
effects. Dynamic programming techniques evidence reduced farmer incentives to invest in conservation despite the access to
better nonfarm income opportunities (Diiro and Sam, 2015). On the contrary, (Marenya and Barrett, 2007) found a positive
and significant effect of nonfarm income on the use of inorganic fertilizers.
The implication of transport infrastructure, markets for the supply of inputs and services, and distribution of outputs on
adoption decision have been discussed (Fafchamps, 2004; Jayne et al., 2010). Studies conducted in Kenya indicated that low
access to formal milk market outlets are more likely not to keep grade cattle and feeding concentrates. They concluded that
for permanent adoption of dairy technologies, market access is found to be crucial. Growing of planted fodder is positively
related to market access (Baltenweck et al., 2006).
To come up with the constraints in dairy marketing in Ethiopia, dairy cooperatives and dairy hub models have been targeted
(Bernard and Spielman, 2009; Jaleta et al., 2013). Empirical research further highlighted that access to markets favors market
orientation of the smallholders than isolated households who consume the larger portion of their produce (Stifel and Minten,
2004). Farmers’ intention to adopt advanced technologies increases when they reside closer to markets. Study conducted by
(Demeke et al., 1998) proved that better road infrastructures encouraged the use of crop inputs. It is evidenced that high
quality markets impacted positively for the ownership of cross breeds in Ethiopia. The availability of formal markets for
dairy products favors adoption of cross-breed animals. The market quality encourages stall feeding and more use of
concentrate feeding. The use of AI among the indigenous cows has positive relation with the market quality but for the cross-
bred cows, it was insensitive to market quality (Duncan et al., 2013). Similarly, as the farmers became further from the
livestock markets, the tendency of growing improved fodder increased (Gebremedhin et al., 2003).
3.3 Modelling Technology Adoption and Estimations
Modeling of farm level decisions involves estimations of the likelihood of adoption of a given technology by the farmer.
Dichotomous logit or probit are used in determining whether or not a farmer adopts a complete package or a few components
(Feder and Umali, 1993; Koundouri et al., 2006). From the extension point of view, improved breed cows have been
promoted inclusive of the necessary packages for dairy production. To overcome the numerous agricultural production
constraints, farmers are also adopting a mix of technologies. The issues draw the attention to use models capturing the sort of
correlations in adopting complementary or substitutable technologies. Studies by (Maregna and Barret, 2007; Teklewold et
al., 2012) applied multivariate probit to analyze adoption decisions towards multiple technologies. Therefore, the joint
multivariate probit (MVP) model was used to determine whether the farmers adopt improved dairy breeds together with the
desired technological packages.

International Journal of Environmental & Agriculture Research (IJOEAR) ISSN:[2454-1850] [Vol-3, Issue-5, May- 2017]
Page | 53
The MVP approach simultaneously determines the influence of the set of independent variables on the probability of
adopting multiple technological choices. The model at the same time allows for potential correlations among unobserved
disturbances and relationships between the adoptions of different packages (Belderbos et al., 2004). Otherwise, disregarding
the prospective correlations and independent estimation of the single equations will lead to biased and inconsistent
parameters estimates (Greene, 2003)
The joint estimation of farmers’ adoption of improved forage (F), concentrate feeds (C), artificial insemination (A) and
improved cows (I) according to (Poirier and Kapadia, 2012) given by,
(1)
Where, is the latent for the joint adoptions, is a K×1 vector of covariates,
is a J×JK matrix and denote a J×J
covariance matrix. In the latent four dimensional MVP model, are not observed but only their component signs,
(2)
The adjustment of the off-diagonal elements prior to imposing the diagonal restrictions, the joint-multivariate probit choice
probability,
(3)
is the four dimension multivariate normal density and
(4)
The likelihood function for the joint-MVP,
(5)
Restriction on the diagonal elements of the matrix, and correlations of adoption decisions,
(6)
Decision by the farmer also involve how much to adopt a given technology. In making a choice of whether to adopt and how
much to adopt, it might take place as joint or separate decisions. When the decision includes the intensity of utilization
conditional on the first step choice of adoption, the tobit model also known as the censored normal regression model is
appropriate (Greene, 1990).Thus, the farmer makes a decision on the number of improved dairy cows to adopt or intensity of
adoption of the technology (t), the distribution of given that it is positive as denoted in (Verbeek, 2008),
(7)
The distribution given that it is censored,
(8)
The log likelihood function for the tobit model,
(9)
3.4 Factor Analysis
Households were classified into four wealth quantiles and the computation of the scores was obtained through principal
component analysis. In many of the literatures, livestock and land ownership are commonly used as proxies for household

International Journal of Environmental & Agriculture Research (IJOEAR) ISSN:[2454-1850] [Vol-3, Issue-5, May- 2017]
Page | 54
wealth. For the analysis, the amount of total land owned, number of oxen, income from off-farm labor, petty trade and
participation in perennial crop production was taken into account. West Hararge is characterized by ownership of small land
sizes and less number of livestock compared to East Shewa. Production of perennial cash crops, such as Chat & Coffee is
important to explain the specific situations. After the principal component analysis, three factors were finally retained based
on the Eigen values and total variances captured. Checking the appropriateness of the grouping with Kaiser-Meyer-Olkin
test, the value of 0.72(middling) implies that the variables have in common to warrant principal component analysis. The
predicted scores then were standardized by the respective means and standard deviations of the variables for each of the
households before the wealth quantiles have been created (Legese et al., 2010).
IV. DESCRIPTION AND ECONOMETRIC ESTIMATION RESULTS
4.1 Adoption of Dairy Technologies
The rate of adoption of improved dairy cows was found to be only 11.47 % over the two study areas. The results proved that
there is low level of uptake of the cross breeding technology. Comparatively, East Shewa has got higher adoption rate of
16.84% while West Hararge underperformed by scoring merely 6.34%. Unlike improved breeds, pooled data confirms that
the adoption of concentrate feeding was better, almost half (50.62%) of the households utilized concentrate feeds.
Specifically, adopters in East Shewa constituted 52.04% and in West Hararge, 49.27% of the households had adopted the
practices. When it comes to improved forage adoptions, 19.95% of the households had the practice of feeding forages to
dairy cows. East Shewa is described by lower utilizations of forage with a rate of 10.20% while it was relatively higher
(29.27%) for West Hararge. Despite the lower adoption of improved dairy cows in West Hararge, improved feeding of the
indigenous dairy cows was comparable to East Shewa where purchased feed is readily available. The adoption rate of
artificial insemination services is equivalent to 23.19 percent. The two areas proved slight differences towards the uptake of
the technology.
The primary reason for the households to stay with their status quo or fail to adopt improved cows was the expensiveness for
acquiring them as quoted by 46.91 percent of the households. The availability issue and lack of sources for improved cows is
the second important limitation for 36.66 percent who would like to adopt them. In spite of the two major bottlenecks, other
reasons have contributions, for instance 14.04 percent declared lack of feeding material among the hindering factors.
Inadequate awareness and the complicated management of improved cows remain to be less favoring for 13.76 and 7.02
percent, respectively.
4.2 The Joint Adoptions of Multiple Dairy Technologies
The estimation results of the joint multivariate probit analysis evidence that adoption of improved dairy cows is significantly
determined by the education status of the household head. This means that an increase of the household head’s education
leads to an increase in probability of adoptions. Several studies confirmed the positive associations of education with the
likelihood of uptake of technologies that it favors assimilation of information, learning, understanding of techniques, and
making better farm decisions. Age of the household head and size of the household have shown no significant impacts for the
decision. The household being in the highest wealth quantile (better-off households) leads to higher propensity of adoption of
the technology. As empirical studies concluded, the poor less likely adopts technologies due to lack of resources and risk
aversion behavior. The recent trend shows that improved dairy cows are so expensive and it requires higher initial
investment. Imperfect financial markets and prerequisite of collaterals limit the participation of the poor. Lack of dependable
AI services that prevailed so far also was not encouraging for acquiring at lower costs. The situation less favors the poor and
the results are in consistent to theories and earlier findings.
Frequency of extension visit with farmers significantly affects adoption decisions. Extension contacts enhance knowledge
about the technology, information on dairy management practices and AI services. Farmers who possess earlier awareness
about improved breeds have higher tendency for adoption. This could be explained by their dairying experience, contacts
with extension and networks. In contrast to areas with better accessibility to markets and services, the less accessible sites
proved limited levels of adoption. Furthermore, better accessible areas in East Shewa have significant adoptions than better
accessible localities in West Hararge where the earlier has got advantages of the services of breeding and market outlets to
Addis Ababa, Bishoftu and Adama. Better access to zonal and district centers provides incentives of extension services,

International Journal of Environmental & Agriculture Research (IJOEAR) ISSN:[2454-1850] [Vol-3, Issue-5, May- 2017]
Page | 55
market opportunities for dairy products and reduced transaction costs. Past studies highlighted the existing dairy marketing
constraints and the sought development interventions. Introduction of the formal marketing outlets through private and
farmer owned collection points possibly pledged adoptions mainly in the urban and peri urban areas. Districts or villages
with less proximity to the centers proved very limited adoptions. Distance to market centers often used as proxy for market
access is a limiting factor for adoption decisions.
Gender disparity in terms of access to information, services and resources has encouraging or discouraging basics for
farmers’ technology adoption decision. Differing settings of gender roles embedded in the households’ headship positions
have significant implications for farm decision making and adoptions. Compared to households with equal participation in
decision making, households’ decision dominated by male heads leads to less likelihood of adoption of improved cows. If the
decision is exclusively made by the wife or else the female head, positive association was evidenced. While comparing the
household headship status, male headship did not lead to significant adoption of improved breeds. The results explain the
important roles of women in adoption decisions.
The study on adoption of concentrate feeding considered purchased industrial by-products and own produced feed types. The
industrial by-products such as oil seed cakes, wheat bran, wheat middling, spent grain and grain produce were included. The
analysis result concluded that concentrate feeds adoption is positively and significantly explained by the education of the
head. The household being in the highest wealth quantiles had no significant explanation for the utilization of concentrate
feeds. The adoption of concentrate feeds comprises feeds that are own produced by the farmer and also owners of more land
may rely on grazing could be possible reasons for the weak influences. More frequent contacts with extension impacts
positively for the adoption decision. More accessible areas significantly use concentrate feeds obviously related with the
more availability of feed materials in the nearby market centers and less transaction costs. Equal participation in the
household encouraged the use of concentrate feeds in contrast to decisions made exclusively either by male or female.
For successful improved dairy breeds production, the availability and use of improved high quality forages is crucial. There
is limited use of improved forages in East Shewa though relatively higher breeds adoption. Oat-vetch is among the adopted
type by some farmers in East Shewa while elephant grass has better acceptance in West Hararge. The results showed that
male headed households are better users of forage crops. Similarly, educated farmers have better utilizations than the less
educated farmers. Possession of high wealth is positive but not very determinant for the adoption of forages. Study conducted
with regard to forage adoption concluded that wealth did not sufficiently explain the decisions (Gebremedhin et al., 2003).
Frequency of extension contact positively affects the probability of adoptions. There is association between more
accessibility and adoption of forage, however, the evidence is not sufficiently large. Rather, both accessible and less
accessible areas in West Hararge have higher adoption than more accessible in East Shewa. The study by (Gebremedhin et
al., 2003) indicated that distance from crop and feed markets encourages forage adoption.
The adoption of Artificial Insemination (AI) technology importantly and positively associated with the education status of
the household head. Households in the highest wealth quantile have higher tendency for utilization of AI services, however,
the evidences do not support significant impact as in the case of breed adoptions. Frequent extension contacts and access to
districts found to be limiting for adoption of AI. Proximity to district centers determines the access to AI and propensity of
adoptions. In the same way to breeds, recent status evidences that better accessible areas in West Hararge have shown slow
rate of adoption and is negative compared to the reference location. Better accessible areas in west Hararge have low
tendency to use AI could also be connected to lack of better market opportunities and services for dairy products.
Consequently, if decisions are dominantly made by the female head or the wife, higher adoptions of AI was concluded.
The joint multivariate probit analysis confirmed the correlation of the error terms and interdependence in the dairy
technological choices. The likelihood ratio test declared significant complementary relations among the four adoption
choices at 1% probability levels. The adoption of artificial insemination is simultaneous to that of improved breeds and
concentrate feeding. Concentrate feeding is suggestively correlated with improved cow adoption. Among all combinations,
adoption of improved cows was not with adequate forages implying the low adopted bundle. To conclude, with MVP model
we benefit from both estimation of unbiased parameters and testing of the simultaneous adoption of desirable technological
components.

International Journal of Environmental & Agriculture Research (IJOEAR) ISSN:[2454-1850] [Vol-3, Issue-5, May- 2017]
Page | 56
TABLE 3
MULTIVARIATE PROBIT JOINT ESTIMATION ON ADOPTION OF DAIRY TECHNOLOGIES
Variables
Improved cows (I) Artificial insemination
(A)
Concentrate feed
(C) Improved forage (F)
Coeff 1 SE Coeff SE Coeff SE Coeff SE
Household head 0.4422 0.2827
Household size 0.0397 0.0429 0.0236 0.0347 -0.0372 0.0320 -0.0086 0.0361
Age of the head -0.0003 0.0082 -0.0067 0.0077 -0.0025 0.0063 0.0118 0.0073
Formal education 0.1080** 0.0433 0.1114*** 0.0376 0.0943*** 0.0338 0.0785** 0.0380
Formal education
square -0.0073 0.0075 -0.0065 0.0065 -0.0083 0.0061 -0.0010 0.0060
Second2 0.2600 0.2899 0.1336 0.2258 0.1558 0.1916 -0.1397 0.2285
Middle2 0.0695 0.3143 0.1390 0.2182 0.0023 0.1887 -0.3174 0.2272
Highest2 0.6765** 0.2758 0.3035 0.2185 -0.1455 0.1924 0.1840 0.2166
Productive safety net -0.0595 0.0698 -0.0208 0.0484 0.0252 0.0392 0.0018 0.0461
Less access to district
( East Shewa)3
-0.7710*** 0.2577 -1.4108*** 0.2320 -0.4406** 0.2009 -0.1405 0.2696
Access to district
(West Hararge)3
-0.7680*** 0.2771 -0.6248*** 0.2197 -0.1944 0.2071 1.2080*** 0.2527
Less access to district
(West Harage)3
-0.7452*** 0.2636 -0.8674*** 0.2298 -0.8240*** 0.2346 0.4568* 0.2686
Frequency of
extension contact 0.2269*** 0.0757 0.2112*** 0.0639 0.3183*** 0.0700 0.1777*** 0.0612
Decision of male
headed4
-0.5327** 0.2313 0.0127 0.1810 -0.2212 0.1565
Decision of female
headed/ wife4
0.2405 0.3164 0.6855*** 0.2492 -0.3171 0.2130
Time aware of
improved breeds 0.0567*** 0.0193 0.0181 0.0147
Constant -1.6670*** 0.3193 -0.7728*** 0.2484 0.1100 0.2174 -2.0782*** 0.3488
CF 0.2072** 0.0949 AC 0.2664*** 0.0965
AF 0.0579 0.1101 IC 0.2608** 0.1257
IF 0.1009 0.1324 IA 0.4737*** 0.1052
Number of observations = 401 Wald chi2 (57)= 271.2
Log pseudo likelihood = -675.953 Prob > chi2= 0
Likelihood ratio test of CF = AF = IF = AC = IC = IA = 0
Prob > chi2= 0.0001 chi2(6) = 28.2821
1 *, **, *** significant at 10% 5% and 1%, respectively 2 Reference category is lowest wealth quantile
3 Reference category is access to district capital (East Shewa) 4 Reference category decision is equally by male & female
Conditional probabilities in (Table 4) imply the likelihood of adoption of the technology given that the other technology has
already been adopted. As shown, there is a change in the conditional probabilities compared with the marginal probabilities,
confirmed the dependency and complementarity of the actions. In contrast to all pair-wise matches, the probabilities for
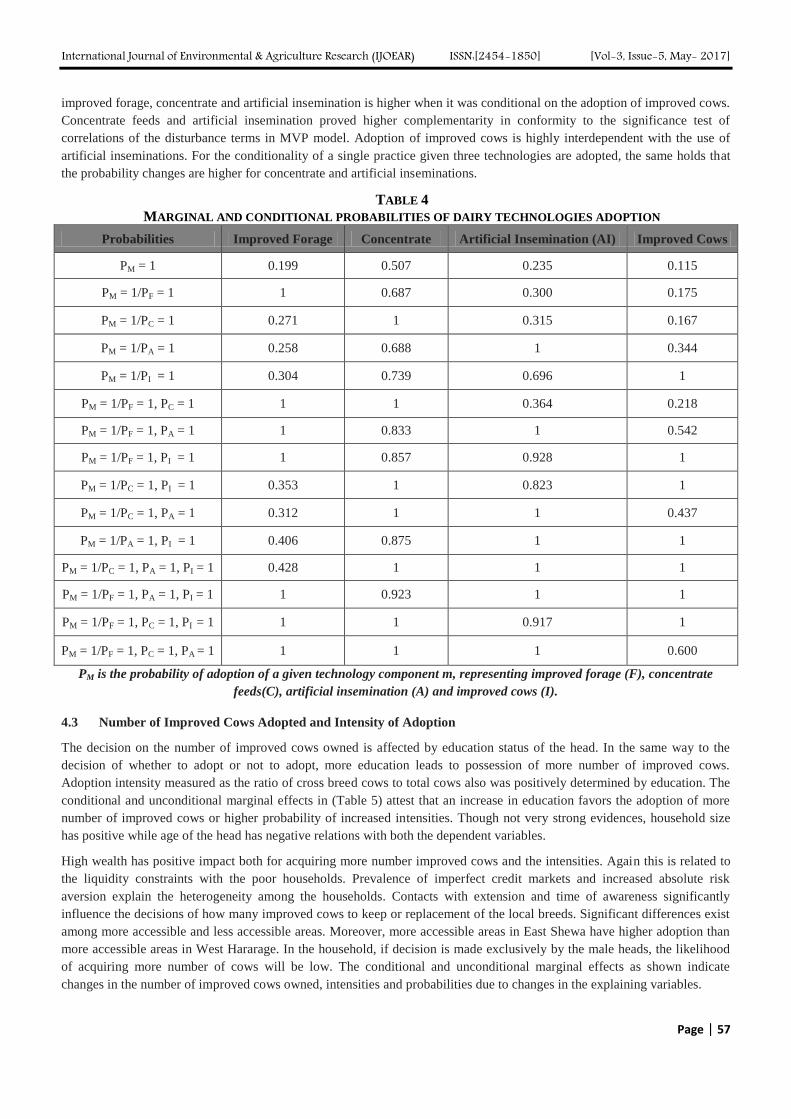
International Journal of Environmental & Agriculture Research (IJOEAR) ISSN:[2454-1850] [Vol-3, Issue-5, May- 2017]
Page | 57
improved forage, concentrate and artificial insemination is higher when it was conditional on the adoption of improved cows.
Concentrate feeds and artificial insemination proved higher complementarity in conformity to the significance test of
correlations of the disturbance terms in MVP model. Adoption of improved cows is highly interdependent with the use of
artificial inseminations. For the conditionality of a single practice given three technologies are adopted, the same holds that
the probability changes are higher for concentrate and artificial inseminations.
TABLE 4
MARGINAL AND CONDITIONAL PROBABILITIES OF DAIRY TECHNOLOGIES ADOPTION
Probabilities Improved Forage Concentrate Artificial Insemination (AI) Improved Cows
PM = 1 0.199 0.507 0.235 0.115
PM = 1/PF = 1 1 0.687 0.300 0.175
PM = 1/PC = 1 0.271 1 0.315 0.167
PM = 1/PA = 1 0.258 0.688 1 0.344
PM = 1/PI = 1 0.304 0.739 0.696 1
PM = 1/PF = 1, PC = 1 1 1 0.364 0.218
PM = 1/PF = 1, PA = 1 1 0.833 1 0.542
PM = 1/PF = 1, PI = 1 1 0.857 0.928 1
PM = 1/PC = 1, PI = 1 0.353 1 0.823 1
PM = 1/PC = 1, PA = 1 0.312 1 1 0.437
PM = 1/PA = 1, PI = 1 0.406 0.875 1 1
PM = 1/PC = 1, PA = 1, PI = 1 0.428 1 1 1
PM = 1/PF = 1, PA = 1, PI = 1 1 0.923 1 1
PM = 1/PF = 1, PC = 1, PI = 1 1 1 0.917 1
PM = 1/PF = 1, PC = 1, PA = 1 1 1 1 0.600
PM is the probability of adoption of a given technology component m, representing improved forage (F), concentrate
feeds(C), artificial insemination (A) and improved cows (I).
4.3 Number of Improved Cows Adopted and Intensity of Adoption
The decision on the number of improved cows owned is affected by education status of the head. In the same way to the
decision of whether to adopt or not to adopt, more education leads to possession of more number of improved cows.
Adoption intensity measured as the ratio of cross breed cows to total cows also was positively determined by education. The
conditional and unconditional marginal effects in (Table 5) attest that an increase in education favors the adoption of more
number of improved cows or higher probability of increased intensities. Though not very strong evidences, household size
has positive while age of the head has negative relations with both the dependent variables.
High wealth has positive impact both for acquiring more number improved cows and the intensities. Again this is related to
the liquidity constraints with the poor households. Prevalence of imperfect credit markets and increased absolute risk
aversion explain the heterogeneity among the households. Contacts with extension and time of awareness significantly
influence the decisions of how many improved cows to keep or replacement of the local breeds. Significant differences exist
among more accessible and less accessible areas. Moreover, more accessible areas in East Shewa have higher adoption than
more accessible areas in West Hararage. In the household, if decision is made exclusively by the male heads, the likelihood
of acquiring more number of cows will be low. The conditional and unconditional marginal effects as shown indicate
changes in the number of improved cows owned, intensities and probabilities due to changes in the explaining variables.

International Journal of Environmental & Agriculture Research (IJOEAR) ISSN:[2454-1850] [Vol-3, Issue-5, May- 2017]
Page | 58
TABLE 5
TOBIT REGRESSION RESULTS ON THE NUMBER COWS OWNED AND INTENSITY OF ADOPTION
Variables
Number of improved cows Intensity of adoption
Coeff1 SE Total
change
Change
E(t>0)
Probabilit
y Change
(t>0)
Coeff SE Total
change
Change
E(t>0)
Probabilit
y Change
(t>0)
Household Size 0.0940 0.0821 0.0109 0.0159 0.0064 0.0381 0.0415 0.0109 0.0159 0.0064
Age of the head -0.0043 0.0167 -0.0005 -0.0007 -0.0003 -0.0024 0.0078 -0.0005 -0.0007 -0.0003
Formal education 0.2878*** 0.0947 0.0335 0.0486 0.0195 0.1091*** 0.0397 0.0335 0.0486 0.0195
Formal education
square -0.0272* 0.0150 -0.0032 -0.0046 -0.0018 -0.0088 0.0068 -0.0032 -0.0046 -0.0018
Second2 0.6553 0.5729 0.0762 0.1106 0.0444 0.3184 0.2696 0.0762 0.1106 0.0444
Middle2 0.1762 0.5985 0.0205 0.0297 0.0119 0.0736 0.2776 0.0205 0.0297 0.0119
Highest2 1.3213** 0.5414 0.1537 0.2229 0.0894 0.5817** 0.2350 0.1537 0.2229 0.0894
Productive safety
net -0.1118 0.1354 -0.0130 -0.0189 -0.0076 -0.0406 0.0687 -0.0130 -0.0189 -0.0076
Less access to
district 3
( East Shewa)
-1.6300*** 0.5432 -0.1896 -0.2750 -0.1103 -0.7624*** 0.2404 -0.1896 -0.2750 -0.1103
Access to district
(West Hararge)3 -1.7422*** 0.5838 -0.2027 -0.2939 -0.1179 -0.7781*** 0.2572 -0.2027 -0.2939 -0.1179
Less access to
district (West
Harage)3
-2.0259*** 0.6063 -0.2357 -0.3418 -0.1371 -0.8526*** 0.2694 -0.2357 -0.3418 -0.1371
Frequency of
extension contact 0.4499*** 0.1400 0.0523 0.0759 0.0304 0.1983*** 0.0654 0.0523 0.0759 0.0304
Time aware of
improved breeds 0.0830** 0.0329 0.0097 0.0140 0.0056 0.0372** 0.0157 0.0097 0.0140 0.0056
Decision of male
headed4 -0.9280* 0.5285 -0.1080 -0.1566 -0.0628 -0.5138** 0.2475 -0.1080 -0.1566 -0.0628
Decision of
female headed/
wife 4
0.6168 0.5717 0.0718 0.1041 0.0417 0.2301 0.2672 0.0718 0.1041 0.0417
Constant -3.2261*** 0.7024 -1.4812*** 0.3084
Sigma 2.1372 0.2319 1.0283 0.0841
F(15, 386) = 4.24 F(15, 386) = 8.63
Prob > F= 0 Prob > F= 0
Log pseudo likelihood = -164.732 Log pseudo likelihood = -132.992
Pseudo R2= 0.2055 Pseudo R2= 0.2214
1 *, **, *** significant at 10% 5% and 1%, respectively 2 Reference category is lowest wealth quantile
3 Reference category is access to district capital (East Shewa) 4 Reference category decision is equally by male & female
For successful dairy production cross breeds, improved feeding and artificial insemination are not the complete packages.
Extension advises more and several component practices so that determination of the issues would be useful to gain feedback
for future research and extension approaches. Furthermore, intensity of use of the recommended component practices are
explaining successful adoptions of the technologies. Notwithstanding the analysis on the adoption of breeds, parity and blood
levels are important for enhancing efficiency of the dairy production. The effort did not attribute towards those concerns.
V. CONCLUSION AND IMPLICATIONS
Due to subsistence nature of the diary system in the country, there is limited surplus production of dairy products. High
dependence on local breeds, poor feeding and health management practices contribute for low productivity of dairy cows.
The source of feed for dairy is dominated by crop residues and grazing. The poor quality of crop residue and need for
improvement options has been mentioned. Lack of adoption of improved forage limits the potential productivity gains of
both improved and local breeds. The presence of the informal market channel in many rural areas and lack of dairy
processing facilities constrained the incentives for market orientation, utilization of inputs and technologies. It hampers the
potential income and livelihood prospects from the sector.

International Journal of Environmental & Agriculture Research (IJOEAR) ISSN:[2454-1850] [Vol-3, Issue-5, May- 2017]
Page | 59
Most of farmers raised the high cost of improved cow breeds as the major restriction and lack of supply is the second reason
for not adopting improved dairy breeds. The adoption of improved cows requires high capital so that more wealthy
households more likely own them. Sequential and package adoption approaches are debatable in many of the literatures.
Recent efforts in the study of technology adoption emphasized the complementarity and substitutability of farm practices and
adoption decisions. Analysis on the joint dairy adoption decision proved the existing complementarity in the uptake of the
technologies. The availability of concentrate feeds and AI services have association with the adoption of improved breed
cows. The adoption of forage is not satisfactory though positive association and long established dissemination efforts by
extension. The responsible factors for the adoptions include education position of the household, wealth status, extension
contacts, number of years became aware of improved cows, access to the markets and district center, and women’s
involvement in decision making. However, household wealth did not sufficiently explain the adoption of improved forages
and concentrate feeds.
The market constraints are important for adoption decision that high transaction costs reduce the incentives of farmers’
participation and have less preference to invest in high return dairy technologies. In support of this, it is concluded that milk
market participation is limiting for adoption of the dairy improved breeds. Strategies that ensure improved market access for
dairy products through linkages to formal market channels, farmer institutions, dairy infrastructure, enhancing awareness,
and lessening the financial burden of the poor are indispensable. Interventions need to consider specific realities for
improving adoptions of dairy technologies.
ACKNOWLEDGEMENTS
The authors would like to acknowledge the financial and logistical support of the Ethiopian Institute of Agricultural Research
(EIAR)-head-office, Melkassa Agricultural Research Center (MARC) and Holleta Agricultural Research Center (HARC).
REFERENCES
[1] Ahmed, M.A.M., Ehui, S. and Assefa, Y., 2004. Dairy Development in Ethiopia. International Food Policy Research Institute,
Washington, DC.
[2] Alemayehu, M., Amede, T., BÖhme, M., Peters, K.J., 2012. Increasing Livestock Water Productivity under Rain Fed Mixed
Crop/Livestock Farming Scenarios of Sub-Saharan Africa: A Review. Journal of sustainable development 5, 1-10.
[3] Ayele, S., Duncan, A., Larbi, A., Khanh, T.T., 2012. Enhancing innovation in livestock value chains through networks: Lessons from
fodder innovation case studies in developing countries. Science and public policy 39, 333-346.
[4] Baltenweck, I., Yamano, T., and Staal, S.J., 2006. Dynamic Changes in Dairy Technologies Uptake in the Kenya Highlands. Poster
paper prepared for presentation at the International Association of Agricultural Economists Conference, Gold Coast, Australia
[5] Belderbos R., Carree M., Diederen B., Lokshin B., and Veugelers R. 2004.Heterogeneity in R&D cooperation strategies. International
Journal of Industrial Organization. 22: 1237-1263.
[6] Bernard, T., Spielman, D.J., 2009. Reaching the rural poor through rural producer organizations? A study of agricultural marketing
cooperatives in Ethiopia. Food Policy 34, 60-69.
[7] Byerlee, D., & Hesse de Polanco, E., 1986. Farmers' Stepwise Adoption of Technological Packages: Evidence from the Mexican
Altiplano. American Journal of Agricultural Economics, 68 (3), 519-527.
[8] CSA (Central Statistical Agency), 2015. Report on crop and livestock product utilization. Volume VII. Addis Ababa, Ethiopia
[9] Delgado, C.L., 2003. Rising Consumption of Meat and Milk in Developing Countries Has Created a New Food Revolution. The
Journal of Nutrition 133, 3907S-3910S.
[10] Dercon S., 2008. Fate and Fear: Risk and Its Consequences in Africa. Journal of African Economies. Volume 17, AERC supplement
2.
[11] Dercon S., 1996. Risk, Crop Choice, and Savings: Evidence from Tanzania. Economic Development and Cultural Change, Vol. 44,
No. 3, pp. 485-513
[12] Diiro G.M., Sam A.G., 2015. Agricultural technology adoption and non-farm earnings in Uganda: A semiparametric analysis. The
Journal of Developing Areas. Volume 49 No. 2
[13] Duncan, A., Teufel, N., Mekonnen, K., Singh, V., Bitew, A., Gebremedhin, B., 2013. Dairy intensification in developing countries:
Effects of market quality on farm-level feeding and breeding practices. Animal: an international journal of animal bioscience 7, 2054.
[14] Ellis, F. and Freeman. H. A., 2004. “Rural Livelihoods and Poverty Reduction Strategies in Four African Countries”. Journal of Development Studies, Vol. 40, No. 4, pp. 1-30.
[15] Ergano K., 2015. Understanding factors affecting technology adoption in smallholder livestock production systems in Ethiopia: The
role of farm resources and the enabling environment. PhD thesis, Wageningen University
[16] Fafchamps, M., 2004. Market institutions in sub-Saharan Africa: Theory and evidence. MIT Press Books 1.
[17] FAOSTAT, 2014. FAOSTAT database. Food and Agriculture Organization of the United Nations, Rome, Italy.

International Journal of Environmental & Agriculture Research (IJOEAR) ISSN:[2454-1850] [Vol-3, Issue-5, May- 2017]
Page | 60
[18] Feder, G., and Umali, D.l., 1993. The Adoption of Agricultural Innovations A Review. Technological Forecasting and Social Change
43, 215-239
[19] Feder, G., Richard, E.J, and David, Z., 1985. Adoption of agricultural innovations in developing countries: a survey. Economic
development and cultural change, 33: 255-298.
[20] Foster, A and M. Rosenzweig., 1995. Learning by Doing and Learning from Others: Human Capital and Farm household Change in
Agriculture. Journal of Political Economy 103(6): 1176-1209
[21] Gebremedhin, B., Ahmed, M., Ehui, S., 2003. Determinants of adoption of improved forage technologies in crop-livestock mixed
systems: Evidence from the highlands of Ethiopia.
[22] Gebremedhin, B., Hirpa, A. and Berhe, K., 2009. Feed marketing in Ethiopia: Results of rapid market appraisal. Improving
Productivity and Market Success (IPMS) of Ethiopian farmers project Working Paper 15. ILRI (International Livestock Research
Institute), Nairobi, Kenya. 64 pp.
[23] Gebremedhin, B., Tegegne, A., Hoekstra, D., Jemaneh, S., Shiferaw, K., Bogale, A. and Getahun, Y., 2014. Developing the butter
value chain in Ethiopia. LIVES Working Paper 1. Nairobi, Kenya: International Livestock Research Institute.
[24] Godfray, H.C.J., Beddington, J.R., Crute, I.R., Haddad, L., Lawrence, D., Muir, J.F., Pretty, J., Robinson, S., Thomas, S.M., Toulmin,
C., 2010. Food Security: The Challenge of Feeding 9 Billion People. Science 327, 812-818.
[25] Gollin, D., Morris, M., Byerlee, D., 2005. Technology adoption in intensive post-green revolution systems. Am. J. Agric. Economics
87 (5), 1310–1316.
[26] Greene, W.H., 1990. Econometric Analysis. 2nd Edn. (Macmillan Publishing Company: New York, USA). 783 pp.
[27] Greene, W.H., 2003. Econometric Analysis. Prentice Hall, New Jersey.
[28] Jalleta, M., Gebremedhin, B., Tegegne, A., Jemaneh, S., Lemma, T., Hoekstra, D., 2013. Evolution of input supply and service hubs
in dairy development at Ada'a milk shed in Ethiopia. Development in Practice 23, 249-263.
[29] Jayne, T.S., Mather, D., Mghenyi, E., 2010. Principal Challenges Confronting Smallholder Agriculture in Sub-Saharan Africa. World
Development 38, 1384-1398.
[30] Just, R. E. & Zilberman, D., 1983. Stochastic Structure, Farm Size and Technology Adoption in Developing Agriculture. Oxford
Economic Papers, Oxford University Press, 35 (2), 307-328.
[31] Kebede, Y., Gunjal, K., & Coffin, G., 1990. Adoption of New Technologies in Ethiopian Agriculture: The Case of Tegulet-Bulga
District Shoa Province. Agricultural Economics, 4 (1), 27-43.
[32] Kebede, Y.M., John, G., and Garth, C., 1993. Strategic Decision-Making: Adoption of Agricultural Technologies and Risk in a
Peasant Economy. MPRA Paper No. 387
[33] Kondylis, F., Mueller, V. and Zhu, J., 2017. Seeing is believing? Evidence from an extension network experiment. Journal of
Development Economics 125 1–20
[34] Koundouri, P., Nauges C.E. and Tzouvelekas V., 2006. Technology adoption under production uncertainty: Theory and application to
irrigation technology. American Journal of Agricultural Economics. 88(3): 657–670
[35] Leathers, H. D., and Smale, M., A, 1991. Bayesian Approach to Explaining Sequential Adoption of Components of a Technological
Package, American Journal of Agricultural Economics 68, 519-527
[36] Legese, G., Langyintuo, A.S., Mwangi, W., Jaleta, M., and Rovere, R.L., 2009. Household Resource Endowment and Determinants of
Adoption of Drought Tolerant Maize Varieties: A Double-hurdle Approach. Contributed Paper prepared for presentation at the
International Association of Agricultural Economists Conference, Beijing, China
[37] Lenné, J.M., Wood, D., 2004. Is there a ‘logic of fodder legumes’ in Africa? Food Policy 29, 565-585.
[38] Lindner, R.K., 1987. Adoption and diffusion of technology: an overview. In: Champ, B.R., Highly, E., Remenyi, J.V. (Eds.),
Technological Change in Postharvest Handling and Transportation of Grains in the Humid Tropics. ACIAR Proceedings Series,
Australian Centre for International Agricultural Research, No. 19, pp. 144–151.
[39] Marenya, P.P. and Barrett, C.B., 2007. Household-level determinants of adoption of improved natural resources management
practices among smallholder farmers in western Kenya. Food Policy 32, 515–536
[40] Marra, M., Pannell, D.J., and Ghadim, A.A., 2003. The economics of risk, uncertainty and learning in the adoption of new agricultural
technologies: where are we on the learning curve? Agricultural Systems 75 (2003) 215–234
[41] Pitt, M. M., and Sumodiningrat, G., 1991. Risk, Schooling and the Choice of Seed Technology in Developing Countries: A Meta-
Profit Function Approach. International Economic Review 32, 457-473.
[42] Poirier D. J. and Kapadia D., 2012. Multivariate versus multinomial probit: when are binary decisions made separately also jointly
optimal? University of California, Irvine
[43] Reardon, T., 1997. “Using Evidence of Household Income Diversification to Inform Study of the Rural Nonfarm Labor Market in Africa”, 1997, World Development, Vol. 25, No. 5, pp. 735-738.
[44] Rogers, E. M. 2003. Diffusion of Innovation. 5th Edition ed. New York: Free Press.
[45] Rogers, E.M., Shoemaker, F.F., 1971. Communication of Innovations: A Cross-Cultural Approach. New York: Free Press.
[46] Sattler, C. and Nagel, U.J., 2006. Factors affecting farmers’ acceptance of conservation measures. Leibniz-Centre for Agricultural
Landscape Research (ZALF) e.V., Institute of Socio-economics, Müncheberg.
[47] Schindler, 2009. 'Credit for What? Informal Credit as a Coping Strategy of Market Women in Northern Ghana', Journal of
Development Studies, 46: 2, 234 — 253.

International Journal of Environmental & Agriculture Research (IJOEAR) ISSN:[2454-1850] [Vol-3, Issue-5, May- 2017]
Page | 61
[48] Semgalawe Z.M. and Folmer H., 2000. Household adoption behaviour of improved soil conservation: the case of the North Pare and
West Usambara Mountains of Tanzania. Land Use Policy 17, 321-336
[49] Smit, B. and Smithers, J., 1992. Adoption of soil conservation practices: an empirical analysis in Ontario, Canada. Land degradation
and Rehabilitation. VOL. 3, 1-14
[50] Smith, P., 2013. Delivering food security without increasing pressure on land. Global Food Security 2, 18-23.
[51] Spielman, D.J., Byerlee, D., Alemu, D., Kelemework, D., 2010. Policies to promote cereal intensification in Ethiopia: The search for
appropriate public and private roles. Food Policy 35, 185-194.
[52] Staal, S.J., 1995. Peri urban Dairying and Public Policies in Ethiopia and Kenya: A comparative Economic and Institutional Analysis,
Dept of Food and Resource Economics. Univ. of Florida, Gainesville, Florida.
[53] Staal, S.J., Nin Pratt, A., Jabbar, M., 2008. Dairy development for the resource poor. Part 2: Kenya and Ethiopia. Dairy development
case studies, Pro-Poor Livestock Policy Initiative, Rome, 1-67.
[54] Stifel, D. & Minton, B., 2004. Isolation, Welfare, and Agricultural Productivity. Cornell University Working Paper.
[55] Teklewold H., Kassie M., and Shiferaw B., 2012. Adoption of Multiple Sustainable Agricultural Practices in Rural Ethiopia, Journal
of Agricultural Economics 64(3): 597-623.
[56] Thirtle, C. G., and Ruttan, V. W., 1987. The Role of Demand and Supply in the Generation and Diffusion of Technical Change,
Harwood Academic Publishers, London.
[57] Verbeek M., 2008. A guide to modern econometrics, John Wiley and Sons Ltd, England.
[58] Weir, S. & Knight, J., 2004. Externality Effects of Education: Dynamics of the Adoption and Diffusion of an Innovation in Rural
Ethiopia. Economic Development and Cultural Change, 53, 93-113.
[59] Wozniak, G. 1987. Human Capital, Information, and the Early Adoption of New Technology. The Journal of Human Resources, 22
(1), 101-112.
[60] Yigezu, Y.A., Tizale C.Y., and Aden Aw-Hassan A.A, 2015. Modeling Farmers’ Adoption Decisions of Multiple Crop Technologies:
The Case of Barley and Potatoes in Ethiopia. International Conference of Agricultural Economists. Milan, Italy.

International Journal of Environmental & Agriculture Research (IJOEAR) ISSN:[2454-1850] [Vol-3, Issue-5, May- 2017]
Page | 62
Association of Hygiene Hypothesis with High prevalence of
Allergy and Autoimmune Diseases: FMT industry Peni K Samsuria Mutalib
1, Mirna Nurasri Praptini
2, Mutalib Abdullah
3, Meny Hartati
4
1Department of Medical Physics, Faculty of Medicine, Universitas Indonesia, INDONESIA
2 Department of Internal Medicine, Gatot Subroto Hospital, Jakarta, INDONESIA
3Unit Hemodialysis, Department of Internal Medicine, Tangerang District General Hospital, Banten, Universitas Indonesia,
INDONESIA 4Departement of Pathology Anatomy, Faculty of Medicine, University of Indonesia, INDONESIA
Abstract—Prevalence of Allergy and Autoimmune Diseases are high in developed countries, but not in developing
countries. Helminth infection were associated with lower level of allergy but the mechanism is not yet clear. In hygiene
countries like UK, Japan and Korea, Fecal Microbiota Transplantation (FMT) has gained interest as novel therapy and
prevention and reach to medicine industrial manufactures. This study will support it by associate Hygiene Hypothesis
(HyHy) and the high prevalence of Allergy and Autoimmune Disease. Systematic review and Bayesian network analysis in
EBSCO host search engine were used. Result from dynaMed Evidence Based, Point-of-care Reference e Journals: Dentistry,
Medical and Nursing has describe 9 literatures support the association of Hy-hy/parasite infection with Allergy and/ or
Autoimmune Diseases: 2 publications of meta-analysis are chosen and supported by 5 cross sectional, longitudinal, cause-
effect design, and 2 clinical and animal trial. Conclusions: Low-middle-high income countries has a life style of Hyhy
pattern support FMT industrial medicine and travelling to developing countries with broad diversity bacteria and worm in
therapeutic and prevention potential, supported by sub-saharan and tropical rainforest developing countries.
Keywords— Hygiene hypothesis, allergy, autoimmune diseases, FMT industrial medicine, traveling to developing
countries.
I. INTRODUCTION
A firmed increase of global prevalence in allergic diseases mainly among children in the last few decades. Over the years,
where several epidemiological studies have reported an inverse association between parasitic worm infections and allergies.
The relationship between helminthes infection and allergies is urgent as research aims move to approach the potential of
therapy and prevention in using helminths and their products for allergic disorders.1 Using infectious disease high prevalence
countries as a source of prevention and treatment of allergy and autoimmune diseases (AD). Knowledge of much references
in the association of Hyhy-Allergy2,3,4
Molecular aspect of epitope mapping of bacteria and worm vs. lifestyle in low-middle-
high income population are associated with Most of Autoimmune Diseases are costly but Fecal Microbiota Transplantation
(FMT) is an effective potential therapy and vaccine.5 Traveling to developing countries with high biodiversity microbiota are
also promising.
II. MATERIAL AND METHOD
Systematic Review and Bayesian analysis using EBSCO host DynaMed: Evidence –Based, point-of Care Reference, e-
Journal: Dentistry, Medical and Nursing search engine. First, searching with CINAHL plus with developing the knowledge
for the aims of study. Using the following search terms: Autoimmune Diseases, Hygiene Hypothesis, Epidemiology and AD,
Atopic Sensitization, Asthma, T1D, IBS, MS, Rheumatoid Arthritis, Ulcerative Colitis, Allergic Diseases. Epidemiology
AND Autoimmune Disease and UK (263), AND Japan (259). FMT are growing (4550), FMT and Meta-analysis (12), FMT
and UK (34), FMT AND Japan (66). FMT industry (3), Hygiene Hypothesis AND Autoimmune Disease (117), Helminth
AND Autoimmune diseases (148), Worm and Autoimmune (36), Worm and Hygiene Hypothesis (17), Epidemiology AND
Meta-analysis and Rheumatoid Arthritis (27). Second step, all are screening abstract or title: excluded the not relevant and
the duplicates by Bayesian analysis. Since we were interested in explanatory factors of bacteria and worm epitope
sequencing are filtered. In the third step, screening full text publications, excluded since not relevant, duplicated and
extracted for Table. Association of Hygiene Hypothesis or parasite infection AND Allergy/ Autoimmune Diseases. The
selection was mainly performed by one reviewer and confirmed by the co-authors.

International Journal of Environmental & Agriculture Research (IJOEAR) ISSN:[2454-1850] [Vol-3, Issue-5, May- 2017]
Page | 63
III. DISCUSSIONS
3.1 Dry and Wet climate
From clinical to molecular aspect of inflammation markers in savanna (warm and dry climate) with dormant bacteria and
worm in dry season, and also in tundra (cold and dry) where no worm no bacteria in all season are searched by us.
Meanwhile AD have been found in low prevalence in wet and warm (tropical rainforest) or hot and humid (sub-Sahara)
countries, whereas allergy and AD are epidemic in clean countries. Dormant bacteria in dry season are specific physics-
chemistry antigens and broad spectrum of variable microbiota implies rich of epitope of protein from known FMT. Figure 1
of Flowchart and Table 1 showed the association of Hygiene Hypothesis with allergy and AD.1-2, 4-11
TABLE 1
DESCRIPTION OF IDENTIFIED 9 LITERATURES ON HYGIENE HYPOTHESIS(WORM-BACTERIA)-
ALLERGY/AUTOIMMUNE DISEASES
Study Design Population
Hygiene Hypothesis
autoimmune
measure
Epitope / synthetic
vaccine measure
Figueiredo 2013 Comparison of high
vs. low infection
Environmental condition in
Latin American Aeroallergen
Immunologic
phenotypes, atopy,
asthma
Obeng 2014 Cross-sectional 1385 Ghanaian
Schoolchildren Schistosome infection
Mite Atopy but not
wheeze & asthma
Hamid 2011 A longitudinal study Semi urban and rural areas of
Flores, Indonesia
Intestinal helminth
infections Allergy
Xu 2015
Randomized
Controlled Trial
(RCT)
Metabolic syndrome subjects Fecal Microbiota
Transplantation
Beyond intestinal
disorders
Lopez-Isac 2016 Meta-analysis Meta-genome-wide
association (meta-GWAS)
Systemic Sclerosis
(SSc) and Rheumatoid
Arthritis (RA)
Top single-nucleotide
polymorphism
Colman 2014 Systematic review
and Meta-analysis
18 studies of FMT primary
therapeutic agent for 122 pts
with 79 ulcerative colitis, 39
Crohn’s disease, 4 IBD
Clinical remission
and/or mucosal
healing
IBS as autoimmune
disease
Puentes F 2016 Animal model of
autoimmune disease
Tolerogenic potential of
fusion protein in 10
transgenic mouse model
Parasite proteins
containing repeats are
essential invasion
ligands
Ability to evade the
host immune system
Ajendra 2016 Experimental NOD mice after insulitis
started in T1D process
Inflammation of the
pancreatic islets
Helminth antigens as a
new potential
therapeutic approach
against AD
Lagier 2014 Review Longitudinal CT of
Recurrent CDI patients FMT frozen, antigens
Extensive use and
wide industrialization
of FMT against AD

International Journal of Environmental & Agriculture Research (IJOEAR) ISSN:[2454-1850] [Vol-3, Issue-5, May- 2017]
Page | 64
FIGURE 1. FLOWCHART OF THE 9 IDENTIFIED LITERATURE: 2 META-ANALYSIS, 2 REVIEW, 3 CROSS
SECTIONAL, LONGITUDINAL, CAUSE-EFFECT DESIGN, 2 EXPERIMENTAL (ANIMAL/ AHUMAN) WHICH
ASSOCIATED HYGIENE HYPOTHESIS/PARASITE INFECTION WITH ALLERGY AND AUTOIMMUNE DISEASES
Improved hygiene and little infections in childhood influence the development of allergic and autoimmune diseases. It has
been reported in Latin America (Urban Brazil),6 a tropical rainforest area. Lifestyle factors with microbial exposure are
associated with allergy prevalence also reported in developed countries.7
Not only microbial exposure, helminth infections are also associated with low prevalence of allergy, 8,11
till FMT are used as
therapy in Autoimmune Diseases 12
Including metabolic diseases.9 Systematic sclerosis and rheumatoid arthritis has been identified have a common susceptibility
locus of gene.13
3.2 Proinflammatory cytokine as hygiene hypothesis marker
Parasite proteins contains repeats which induce immunosuppression and induce down-regulation of TNF- (cytokine
proinflammation) and TGF- (cytokine profibrosis) make potential application for the treatment and prevention of
autoimmune diseases.14
Entering of helminth antigens increase the protective effect stipulated by antigen-peculiar therapies and symbolizes a new
approach for potential therapy against AD including T1DM.15
The use of microbiota which has been frozen facilitates
transplantation, and per oral are at least as effective as other invasive methods and to keep from occurring the risk of
anesthesia. The use of pills form, already test as clinical trials, will certainly be the beginning landmark for the width use and
broad industrialization of fecal microbiota transplantation.10
Treatment with helminthes and worms ova mitigated the clinical symptoms of numbers autoimmune diseases in animal
model and in patients. Tuftsin-PC (TPC), a novel helminth-based compound, reduced proinflammatory cytokines and
induced the expression of anti-inflammatory cytokine, as well as expansion of Treg and Breg cells, also histological analysis
guide to a new approach for a natural therapy for beginning rheumatoid arthritis onset, one of autoimmune diseases.16
The role of transfer of immune cells adoption in worm-influenced regulation of allergy and autoimmune diseases, was
supported by animal experiments.17
The chronic diseases for families economic burden, health systems, governments and the
association between national policy maker and international economic pressure and politics have a large impact on chronic
diseases risk and countries ability in responding them, the potential of wet and warm climate area double burden of infectious
and chronic diseases.18
9 Publications of meta-analysis AND Hygiene Hypothesis/FMT AND Autoimmune diseases
Meta-analysis 1. Okada RA MA (12): 2016 2. Kim RA MA (31): 2017 3. Orenstein AE AND IBS AND MA (4): 2010 4. helminth AND autoimmune (277) + 2: 2017
EBSCO: CINA HL plus (Medline/PubMed) with full text FMT^MA (11): 2016 Helminth^AD (148): 2017 Worm^AD (36): 2017 Worm^HyHy (17): 2016 Epitope^Helminth^Vaccine (82): 2017
Bacteria envelope and wall of worm cells range of Epitopes (Antigen and Antibody): Epitope AND Meta-analysis AND RA (27): 2016
Screening abstract or title: 294-256 excluded since not relevant or duplicates analyzed by Bayesian network
Screening abstract or title: 27-20 excluded since not relevant or duplicates analyzed by Bayesian network
Screening abstract or title: 48-30 excluded since not relevant or duplicates analyzed by Bayesian network
Screening full test: 54 excluded since not relevant

International Journal of Environmental & Agriculture Research (IJOEAR) ISSN:[2454-1850] [Vol-3, Issue-5, May- 2017]
Page | 65
3.3 Economic income and Hygiene Hypothesis
How the present of chronic conditions in certain multimorbidity patterns, which could have great burden on public health at
several levels in low-, middle,-, and high-income countries has been identify and describe in several countries to the
advancement of preventive actions to decrease their prevalence and also give increase to new, understandable approaches for
the management of these co-existing conditions. 19
The association of individuals raised in hygiene environment have a higher of developing Allergy and Autoimmune Diseases
was supported by random or fixed-effect meta-analyses.20
IV. LIMITATION
These Systematic review has several limitation 1) Non published literature on all autoimmune diseases may limit the validity
of our findings, but these inflammatory bowel diseases and rheumatoid arthritis study are a real phenomenon which is
already attracted peoples from developed and clean countries with AD burden. However, we used meta-analysis with partly
overlapping data bases for our literature search on bacteria and worm cell wall antigens. And we found a large number of
papers fulfilling the criteria of our search in these HyHy-AD prevention and therapeutic. 2) Another potential problem in
this systematic review is that studies mainly used in the searching steps are depended on the vocabulary synonyms (not find
in general, but many in specific such as autoimmune diseases could be Rheumatoid arthritis, recurrent CDI, IBS, T1D, atopic
sensitization, asthma etc.) but not in Lupus Erythematosus. Different chances changes choices used give different results
may be misleading. We intended to manage this problem in an additional work, by dividing the using chosen specific to
generic into 2 broad categories: prevention and therapeutic findings.
V. SUMMARY
Epitope of FMT, bacteria, wall of worm are all rich of ranges epitopes and could be present in therapeutic a prevention
potential. These epidemiological studies from developing/ tropical rainforest area countries, present to hygiene developed
countries is similarly paralleled with low-middle- high- income population, vaccination and therapeutic fighting against
autoimmune diseases. Hygiene hypothesis / FMT has association with novel treatment for Allergy and Autoimmune
Diseases. Further knowledge and education to policy maker and global politic doer from local to global will support the
industries in FMT.
VI. CONCLUSION
Low-middle-high income countries has a life style of Hygiene hypothesis. The low- and middle economic income in
development countries have similar pattern with population in developing countries, which support FMT industrial medicine
and travelling to developing countries. Broad diversity bacteria and worm in therapeutic and prevention potential, supported
by sub-saharan and tropical rainforest developing countries.
ACKNOWLEDGEMENTS
We thank DRPM University of Indonesia, for the funding of specific stuff exposure in wet and warm/ hot and humid climate
DRPM UI 2015 no. 1772/UN2.R12/HKP.05.00/2015 and 240BE/DRPM-UI/NI.4/2008 and IMERI 2016 abstract send no.
5229. To Aaron Jonathan, we thank for supporting in the poster presentation.
REFERENCES
[1] Amoah AS, Boakye DA, van Ree R, Yazdanbakhsh M. Parasitic worms and allergies in childhood: insights from population studies
2008-2013. Pediatr Allergy Immunol Off Publ Eur Soc Pediatr Allergy Immunol 2014;25(3):208–17.
[2] 2. Shunsheng Han C. A specific hygiene hypothesis. Med Hypotheses 2016;93:146–9.
[3] 3. Yang J-Q, Zhou Y, Singh RR. Effects of Invariant NKT Cells on Parasite Infections and Hygiene Hypothesis. J Immunol Res
2016;2016:2395645.
[4] 4. Lynch SJ, Sears MR, Hancox RJ. Thumb-Sucking, Nail-Biting, and Atopic Sensitization, Asthma, and Hay Fever. Pediatrics
2016;138(2).
[5] 5. Varier RU, Biltaji E, Smith KJ, Roberts MS, Jensen MK, LaFleur J, et al. Cost-effectiveness analysis of treatment strategies for
initial Clostridium difficile infection. Clin Microbiol Infect Off Publ Eur Soc Clin Microbiol Infect Dis 2014;20(12):1343–51.

International Journal of Environmental & Agriculture Research (IJOEAR) ISSN:[2454-1850] [Vol-3, Issue-5, May- 2017]
Page | 66
[6] 6. Figueiredo CA, Amorim LD, Alcantara-Neves NM, Matos SMA, Cooper PJ, Rodrigues LC, et al. Environmental conditions,
immunologic phenotypes, atopy, and asthma: new evidence of how the hygiene hypothesis operates in Latin America. J Allergy Clin
Immunol 2013;131(4):1064.
[7] 7. Hesselmar B, Hicke-Roberts A, Wennergren G. Allergy in Children in Hand Versus Machine Dishwashing. Pediatrics
2015;135(3):e590-7.
[8] 8. Obeng BB, Amoah AS, Larbi IA, de Souza DK, Uh H-W, Fernández-Rivas M, et al. Schistosome infection is negatively associated
with mite atopy, but not wheeze and asthma in Ghanaian schoolchildren. Clin Exp Allergy J Br Soc Allergy Clin Immunol
2014;44(7):965–75.
[9] 9. Xu M-Q, Cao H-L, Wang W-Q, Wang S, Cao X-C, Yan F, et al. Fecal microbiota transplantation broadening its application beyond
intestinal disorders. World J Gastroenterol 2015;21(1):102–11.
[10] 10. Lagier J-C. Faecal microbiota transplantation: from practice to legislation before considering industrialization. Clin Microbiol
Infect Off Publ Eur Soc Clin Microbiol Infect Dis 2014;20(11):1112–8.
[11] 11. Hamid F, Wiria AE, Wammes LJ, Kaisar MM, Lell B, Ariawan I, et al. A longitudinal study of allergy and intestinal helminth
infections in semi urban and rural areas of Flores, Indonesia (ImmunoSPIN Study). BMC Infect Dis 2011;11:83.
[12] 12. Colman RJ, Rubin DT. Fecal microbiota transplantation as therapy for inflammatory bowel disease: a systematic review and meta-
analysis. J Crohns Colitis 2014;8(12):1569–81.
[13] 13. López-Isac E, Martín J-E, Assassi S, Simeón CP, Carreira P, Ortego-Centeno N, et al. Brief Report: IRF4 Newly Identified as a
Common Susceptibility Locus for Systemic Sclerosis and Rheumatoid Arthritis in a Cross-Disease Meta-Analysis of Genome-Wide
Association Studies. Arthritis Rheumatol (Hoboken, NJ) 2016;68(9):2338–44.
[14] 14. Puentes F, Dickhaut K, Hofstätter M, Pfeil J, Lauer U, Hamann A, et al. Immune Modulation and Prevention of Autoimmune
Disease by Repeated Sequences from Parasites Linked to Self Antigens. J Neuroimmune Pharmacol Off J Soc Neuroimmune
Pharmacol 2016;
[15] 15. Ajendra J, Berbudi A, Hoerauf A, Hübner MP. Combination of worm antigen and proinsulin prevents type 1 diabetes in NOD
mice after the onset of insulitis. Clin Immunol 2016;164:119–22.
[16] 16. Bashi T, Shovman O, Fridkin M, Volkov A, Barshack I, Blank M, et al. Novel therapeutic compound tuftsin-phosphorylcholine
attenuates collagen-induced arthritis. Clin Exp Immunol 2016;184(1):19–28.
[17] 17. Ding Y, Zhou R, Yang X, Zhang L. [The Role of Adoptive Transfer of Immune Cells in Helminth- induced Regulation of Allergy
and Autoimmune Diseases]. Zhongguo Ji Sheng Chong Xue Yu Ji Sheng Chong Bing Za Zhi 2015;33(4):290–4.
[18] 18. de-Graft Aikins A, Unwin N, Agyemang C, Allotey P, Campbell C, Arhinful D. Tackling Africa’s chronic disease burden: from
the local to the global. Global Health 2010 19;6:5.
[19] 19. Garin N, Koyanagi A, Chatterji S, Tyrovolas S, Olaya B, Leonardi M, et al. Global Multimorbidity Patterns: A Cross-Sectional,
Population-Based, Multi-Country Study. J Gerontol A Biol Sci Med Sci 2016;71(2):205–14.
[20] 20. Cholapranee A, Ananthakrishnan AN. Environmental Hygiene and Risk of Inflammatory Bowel Diseases: A Systematic Review
and Meta-analysis. Inflamm Bowel Dis 2016;22(9):2191–9.

International Journal of Environmental & Agriculture Research (IJOEAR) ISSN:[2454-1850] [Vol-3, Issue-5, May- 2017]
Page | 67
Scientific research contribution to fruticulture development José Clélio de Andrade
1, Moacir Pasqual
2, Wilson Magela Gonçalves
3, Ângelo Albérico
Alvarenga4, Ester Alice Ferreira
5
1,4,5Research Company of Minas Gerais (EPAMIG), Lavras, MG, Brazil, CP 176, CEP: 37200-000
2,3Federal University of Lavras (UFLA), Lavras, MG, Brazil, CP 3037, CEP: 37200-000
Abstract - This study aimed to evaluate the research contribution on development of peach, apple and guava crops in
Campos das Vertentes region, Minas Gerais State, Brazil. It was developed in two stages: the first one by consulting web of
science base, where articles about these three fruit were being sought. The search for articles related to selected fruits was
performed by ten key identification variables for each one of the following technologies: cultivars, seedlings, dormancy,
pruning, fruit thinning, fruit protection/bagging, irrigation, harvesting, post-harvest and commercialization. The second
stage was carried out by means of interviews with the peach, apple and guava producers in Barbacena, São João Del Rei
and Lavras respectively, which were selected for being development poles of this region. The results were tabulated
separately for the first stage and the second stage, confronted the results of interviews with the search of articles. It was
concluded that research and technology generation has contributed to the development of peach, apple and guava crops in
Campo das Vertentes area.
Key words: Innovation, Research, Fruit growing.
I. INTRODUCTION
Fruit farming has great social and economic importance, as well as food, being an important source of nutrients. According
to IBRAF (2013), in the 1989-90 biennium, production was 420 million tons, in 1996 it exceeded 500 million tons and in
2009 it was 728 million tons. In Brazil, fruit production already accounts for 25% of agricultural production. It is one of the
most demanding and technology-dependent sectors to achieve success in the business. Therefore, the activities of generation
and transfer of technology have been intensified (IBRAF, 2013). Fruit cultivation has great social and economic importance,
as well as food, being an important source of nutrients. According to IBRAF (2013), in the 1989-90 biennium, production
was 420 million tons, in 1996 it exceeded 500 million tons and in 2009 it was 728 million tons. In Brazil, fruit production
already accounts for 25% of agricultural production. It is one of the most demanding and technology-dependent sectors to
achieve success in the business. Therefore, the activities of generation and transfer of technology have been intensified
(IBRAF, 2013).
Currently, Brazil counts on thirty poles for the development of fruit growing that extends from Rio Grande do Sul to Rio
Grande do Norte and Amazonia, where the production of the whole productive chain of fruit agribusiness (IBRAF, 2013) is
developed. The technological innovation in Brazilian fruit growing is a segment of the economy that has most stood out in
the last years and continues in full evolution, both in the production of fruits for table, as for industry. To this end, Brazil
became the third largest producer of fruit in the world, behind only China and India, with a production of around 40 million
tons / year, in an area of 2.5 million hectares (KIST et al., 2012). Technological innovation has been detected in Brazilian
fruit growing, being inserted in all links of the productive chains. However, their profiles are heterogeneous in aspects of
technology adopted, forms of implantation, among other factors (IBGE, 2013).
Temperate fruits, such as apples and peaches, because they are of temperate climate origin, have in Brazil a series of
inhospitable factors that need to be improved genetically or adapted by new management techniques, such as seedling
formation Through methods of grafting, pruning, breaking dormancy, irrigation, among others, for the success of economic
exploitation. Also, the native fruits of tropical climate, such as guava, also needed genetic improvement, creation of new
management techniques, such as: formation of seedlings through grafting, pruning and irrigation methods, for successful
exploitation (SANTOS, 2012 and PEREIRA & KAVATI, 2011). In order to obtain a better quality of fruits, it is necessary to
obtain a better quality fruit in the coloring of the peel and pulp, fruit size, productivity and harvest of several harvests / year.
Today, with the advancement of research, Brazil produces enough apple for the domestic market and even allows the export
of the fruit with excellent quality. Until the 1970, it produced only 10% and with little quality (Faschinello and Nachitigal,
2009). All this was only possible thanks to the technologies generated by the research that reached the producer, enabling
successful economic exploitation (BARBOSA et al., 1992). Another example is the production of peach which, according to

International Journal of Environmental & Agriculture Research (IJOEAR) ISSN:[2454-1850] [Vol-3, Issue-5, May- 2017]
Page | 68
Ojima et al. (1989) and Raseira et al. (1998), Brazil drastically reduced its importation thanks to research work in the areas of
genetic improvement and adaptation of cultivars through agronomic evaluations and the development of new management
techniques, such as: seedling formation through grafting, Pruning systems, dormancy breakdown, a technique that allowed
the economic exploitation of the majority of temperate fruits in Brazil, irrigation and soil fertility. Thus, currently peaches of
excellent quality are produced in the coloring of the bark and pulp, flavor and high productivity.
In the tropical fruits, such as guava, there was also a great advance in cultivation thanks to research on genetic improvement,
adaptation of cultivars through evaluation techniques, formation of seedlings through bud grafting and grafting techniques.
Pruning and irrigation that allowed the harvest of several harvests per year and at the moment of market demand, for both
table and industry. (SANTOS, 2012 and PEREIRA & KAVATI, 2011). Still, we can highlight results in the use of cultural
and phytosanitary practices that allowed the effective control of diseases.
According to Etzkowits (2003), the technological innovation of a country is based on the relationship between universities,
companies and states, being relevant for both developed and emerging economies. For Brazil that is experiencing a
transitional period for the creation of a knowledge-based society, this relationship is important for its development. The
incentives for Brazilian R & D activities in the last decades have been undergoing significant changes, such as the creation of
new research programs in the various areas, notably in agriculture, and in the fruit-growing sector there has been significant
development.
The objective of this work was to evaluate the contribution of technologies generated by the research and published in
publications of technical-scientific journals available on the internet in relation to the technologies adopted by the producers
in the development of the Campo das Vertentes region of Minas Gerais, Brazil.
II. MATERIAL AND METHOD
The research was developed in the Campo das Vertentes region of the State of Minas Gerais, Brazil, located between the
parallels 20o24’ south latitude and the meridians 43
o30’ west longitude of Greenwich. It is a mesoregion, made up of thirty-
six municipalities, grouped into three micro-regions: Lavras with nine municipalities; São João Del Rei with fifteen and
Barbacena with twelve (IBGE, 2013).
The work was carried out in two stages: in the first one, secondary data were collected by analyzing the articles through a
consultation on the website www.periodicos.capes.gov.br on the Web of Science database. We searched for articles on the
peach, apple and guava culture in the world and in Brazil. After the search we tabulated the main magazines with these
publications in the world and in Brazil as well as the main universities and research institutions that work with these cultures.
In this stage, the articles for each of the three fruit trees were searched for ten variables: varieties, seedlings, dormancy,
pruning, fruit thinning, fruit bagging / irrigation, harvesting, post harvesting and commercialization, participation in events
Dissemination and transfer of technology and technical assistance. The second stage consisted of interviews with farmers in
three municipalities in the Campo das Vertentes region of Minas Gerais, peach, apple and guava, selected to be evaluated in
this research, for the pioneering of the producers to introduce these fruits in the municipalities of Barbacena, São João Del
Rei and Lavras, respectively, where they were evaluated.
The data were collected through a questionnaire for interview with semistructured questions as a technique for collecting
information. The questions presented had the objective of evaluating the contribution of the research in fruit growing based
on the technological recommendations recommended by the research institutions and rural extension and university, through
its stock of technical and scientific knowledge. In this way the degree of adoption of these technological recommendations by
the fruit producers of the selected municipalities was evaluated.
The sampling of the number of producers for interviews was performed according to the criteria of Cochran (1965); in the
locality with fifty other producers the sample was 10%, where there were from ten to forty producers of 20% and in places
with at least ten 100% producers. Thus, for the peach tree in Barbacena, eight producers were interviewed out of a total of
twenty-two, for apple in São João Del Rei two producers as well as for guava in Lavras two producers were interviewed
because both localities had less than ten producers that exploit this commercially using high technology. All these producers
being nominated by Company of Technical Assistance and Rural Extension of the State of Minas Gerais - EMATER-MG for
the interviews.

International Journal of Environmental & Agriculture Research (IJOEAR) ISSN:[2454-1850] [Vol-3, Issue-5, May- 2017]
Page | 69
III. INDENTATIONS AND EQUATIONS
The results presented and discussed come from the confrontation between the first stage and the second stage. The ranking of
the main journals that publish scientific articles on peach, apple and guava in the world (Table 1) and in Brazil (Table 2) is
presented first, followed by the results of the interviews referring to the ten variables analyzed for Peach, apple and guava:
cultivars, seedlings, breakage of dormancy, pruning, irrigation, fruit thinning, fruit protection / bagging, harvest and post
harvest, participation in events for diffusion and transfer of technology and technical assistance. It is observed that Acta
Horticulturae is the magazine that publishes the most articles about the peach tree, apple tree and guava tree around the
world. Second to peach and apple tree comes to Hortscience. The Brazilian Journal of Fruticultura is the third placed in
number of articles on guava in the world. There are in Brazil numerous technical-scientific journals specialized in the
publication of technologies generated by the research, such as those presented in Table 2.
TABLE 1
SCIENTIFIC JOURNALS IN THE WORLD WITH PUBLICATIONS ON PEACH, APPLE AND GUAVA CROPS FROM 1999
TO 2013. Journal Articles number
Peach tree:
Acta Horticulturae 1,498 Hortscience 1,032
Phytopathology 514 Journal Of The American Society Horticultural Science 501
Journal Of Economic Entomology 385
Apple tree:
Acta Horticulturae 3,598
Hortscience 1,725 Phytochemistry 968
Journal Of The American Society Horticultural Science 912 Journal Of Agricultural and Food Chemistry 869
Guava tree:
Acta Horticulturae 242 Proceedings of the1st International Guava Symposium 83
Revista Brasileira de Fruticultura 61 II International Symposium on Guava and Myrtacea 45
Food Chemistry 40
Source: Web of Science (January, 2014)
TABLE 2
NUMBER OF ARTICLES IN SCIENTIFIC JOURNALS IN BRAZIL WITH PUBLICATIONS ON PEACH, APPLE AND
GUAVA CROPS, 1999 TO 2013. Journal Articles number
Peach tree: Revista Brasileira de Fruticultura 84
Pesquisa Agropecuária Brasileira 52 Ciência Rural 28
Ciência e Agrotecnologia 16
Bragantia 7 Apple tree:
Revista Brasileira de Fruticultura 81 Pesquisa Agropecuária Brasileira 73
Ciência e Tecnologia de Alimentos 35
Ciência Rural 33 Ciência e Agrotecnologia 19
Guava tree: Revista Brasileira de Fruticultura 61
Pesquisa Agropecuária Brasileira 23 Ciência e Agrotecnologia 15
Ciência Rural 11
Ciência e Tecnologia de Alimentos 8
Source: Web of Science (January, 2014)

International Journal of Environmental & Agriculture Research (IJOEAR) ISSN:[2454-1850] [Vol-3, Issue-5, May- 2017]
Page | 70
The Brazilian Journal of Fruticulture is the one that most publishes articles on peach, apple and guava, followed by the
Brazilian Agricultural Research. Rural Science is the third for the peach tree and the fourth for the apple tree and the guava
tree. The Science and Agrotechnology is the fourth for the peach tree and the third for apple and guava in number of
published articles.
The cultivar selected for orchard formation is one of the most important components in the production system. It is a factor
that can be changed without changing the cost of implementing the crop with fruit. The cultivars indicated by the research
and technical assistance for the region Campo das Vertentes of Minas Gerais have as main parameter the low requirement in
cold. Among those presented, all producers interviewed said that they cultivate ‘Maciel’ and ‘Douradão’ peach, ‘Eva’
cultivars for apple and ‘Paluma’ and ‘Pedro Sato’ guava.
Regarding the acquisition of seedlings, considering that these have a relevant role in the success of fruitful exploitation. A
sound material with the desired genetic characteristics, produced by skilled and skilled nurseries, is of fundamental
importance in the formation of an orchard. According to Oliveira et al. (2003) and Raseira et al. (2010), the seedlings
indicated by the research and technical assistance must have good genetic characteristics, both of the rootstock and the
canopy, healthy and formed by specialized and suitable nurseries. All the producers interviewed said that they acquire
seedlings as indicated by the technical assistance.
The guava tree, because it comes from a tropical climate, has no need to break dormancy. On the other hand, the artificial
dormancy break in temperate fruits was one of the great findings for the successful economic exploitation of these fruit trees
in the region of the Campo das Vertentes of Minas Gerais. According to Nunes, Marondin and Sartori (2001) and Marafon et
al. (2003), the effect of the internal factors such as the balance of the promoters and inhibitors of growth and external factors
such as temperature, photoperiod and solar radiation. (2007). According to Oliveira et al. (2003), in the region of Campo das
Vertentes, the amount of cold is not enough to break the natural dormancy of the buds, so that sprouting and flowering are
carried out. For this, it is necessary the artificial dormancy break with chemical phytohormone. All peach and apple
producers interviewed said they performed this procedure in accordance with the recommendations.
The pruning of fruit plants is a practice that aims to modify the vigor of the plants, to produce more and to improve the
quality of the fruits, to maintain the plant with a size appropriate to its treatment and handling, to modify the tendency of the
plant to produce more vegetative branches That fruitful or vice versa, lead the plant to a desired shape, suppress superfluous
and inconvenient, diseased or dead branches, regulate the alternation of crops, so as to obtain crops regularly, according to
Brickell, 1979. Ojima et al. (1989), Raseira et al. (2010) and Alvarenga, Oliveira and Gonçalves (2013), recommend pruning
in the peach, apple and guava trees, so that the plant can bear the fruits load, maintaining balanced growth and avoiding crop
alternation between good and bad harvests. Of stimulating the formation of flower buds, also ensuring a good distribution of
the buds in the crown of the plant, improving the quality and size of the fruits. All respondents said they perform pruning
according to recommendations.
Irrigation is an important practice recommended by research and, consequently, by technical assistance during the dry or
summer period, to avoid water stress and to normalize the physiological system of plants (RASEIRA et al., 2010). It is
recommended by the research for the peach tree crop, especially in the dry season, which coincide with the coldest period of
the year and also with the time of breaking of dormancy, therefore bud buds of flowering and fruiting, (RASEIRA Et al.,
2010). All the producers responded that they irrigate by the drip system, according to the recommendations, for the three
crops.
Fruit thinning is a very old practice and aims to reduce the fruit load in the plant, with the purpose of protecting the plant,
enabling conditions for homogenous production in size and appearance and to facilitate cultural treatment. According to
Raseira et al. (2010), recommend the thinning operation of the fruits of the peach tree plant to enable better fruit formation in
appearance and flavor, creating better conditions for aeration and light incidence, thus improving the physiological state.
Also, to facilitate cultural dealings and harvesting. All respondents said they do the thinning, for all three cultures.
Protecting the fruit is the most important practice to eliminate the attack of the fruit fly, other insects and birds. It is an
operation that can be performed by spraying with chemicals, or manually, using fruit bagging with TNT bag or butter paper.
According to Raseira et al. (2010) and Monteiro et al. (2007), the protection of the fruit of the peach tree, either by spraying
with chemicals or by hand, through bagging, is an important operation to protect the fruits of the fruit fly and other insects,
thus guaranteeing more quality to the fruits. In guava, according to Souza, Mancin and Melo (2013) and Pereira (2011), the
protection of fruits is very important. It is recommended to make the bagging when the fruit is destined for consumption in

International Journal of Environmental & Agriculture Research (IJOEAR) ISSN:[2454-1850] [Vol-3, Issue-5, May- 2017]
Page | 71
natura, since besides protecting the fruits there is the advantage of valuing the production like organic. All the producers
interviewed said to carry out operations to protect the fruits.
The research and the market recommend that the fruits be harvested in a way that does not lose its integrity, disqualifying
them in the market. After harvesting the fruits, they should be taken to the packing house or shed to be standardized, graded,
packaged and stored in accordance with standards and standards established by the Ministry of Agriculture (RASEIRA et al.,
2010 and MONTEIRO et al. All producers interviewed said they follow the established standards. Of these 62%, they use the
refrigeration of the fruits because they commercialize the production with the market of the northeast, notably Fortaleza-CE
and Recife-PE, the rest, 38%, do not refrigerate because they send the production to the Central of Slaughtering of the State
of Minas Gerais - CEASA - MG.
For Alvarenga, Oliveira and Gonçalves (2013), the research recommends that preventive practices be done against diseases
of fungal and physiological origin, in order not to damage the product. To do so, one must harvest the fruits at the correct
time, to eliminate the foci of inoculate. The fruits after harvesting should be sorted, packaged and stored, preferably under
refrigeration. According to Souza, Mancin and Melo (2013) the guava fruit harvest must be done manually and, when the
fruits are bright dark green coloring, starting to lighten, this is the ideal harvesting point. After harvest, the fruit should be
sorted, packed and stored for marketing. All producers carry out the recommended standards and market the fruits in free
markets, wineries and supermarkets.
The events carried out for diffusion and transfer of technologies are of fundamental importance for the dissemination and
improvement of production techniques. It is in these events that the producers, extension agents, researchers and other
members of the productive chains exchange experiences on the new technological innovations realized. For peach trees and
apple trees, all producers interviewed said they participated in these events sporadically in the southern states of the country,
notably São Paulo and Paraná. Of these, 45% said they already attended technological events outside the country, notably in
the USA. As for guava, all the producers interviewed said that they do not participate in these exclusive events to deal with
the guava culture, since they do not exist in the region or are not properly divulged.
In the evaluations of technical assistance, all said that they receive special and specialized technical assistance in a
continuous and programmed way, regarding the production process and information on new technologies and market
tendencies.
IV. CONCLUSION
The research has contributed to the generation and publication of several technologies for the cultivation of peach, apple and
guava.
Producers in the Campo das Vertentes have adopted most of the technologies generated and recommended by the research.
The adoption of the technologies generated by the research has contributed to the development of the cultivation of peaches,
apples and guavas in the Campo das Vertentes Region of Minas Gerais, Brazil.
REFERENCES
[1] ALVARENGA, A. A; OLIVEIRA, D. L.; GONÇALVES, E. D. Aspectos da cultura da macieira em regiões de inverno ameno.
Boletim Técnico EPAMIG, Belo Horizonte, n. 101, 2013, 40 p.
[2] BARBOSA, W.; CAMPO-DALL'ORTO, F. A et al. O pessegueiro no sistema de pomar compacto: VI. Frutificação efetiva e raleio
químico em seleções IAC. Bragantia, Campinas, v. 51, p. 63-67, 1992a.
[3] BRICKELL, C. A poda. Portugal: Publicações Europa-América, 1979, 228p.: Il.
[4] COCHRAN, W. G. Técnicas de Amostragem. Rio de Janeiro: Editora Fundo de Cultura e USAID, 1965, 428 p.
[5] Etzkowitz, H. Innovation in innovation: the triple helix of university-industry-government relations. Social Science Information,
London, v. 42, n. 3, p. 293-296, 2003.
[6] HOFFMANN, A.; NACHTIGALL, G. R. Fatores edafo-climaticos. In: NACHTIGALL, G.R. (Ed.). Maçã: produção. Bento
Gonçalves: Embrapa Uva e Vinho; Brasília: Embrapa Informação Tecnológica, p. 25-31, 2004.
[7] INSTITUTO BRASILEIRO DE FRUTICULTURA - IBRAF, 2010. Produção Brasileira de Frutas, 2009. Available in:
<http:\\www.ibraf.org.br/estatisticas/Produção Brasileira de Frutas 2009 – Final.pdf>. Accessed: december 2013.
[8] INSTITUTO BRASILEIRO DE GEOGRAFIA E ESTATÍSTICA – IBGE. Banco de dados. Produção agrícola municipal. Available
in: <http:\\www.sidra.ibge.gov.br/bda/agric>. Accessed: december 2013.
[9] KIST, B. B.; VENCATO, A. Z et. Al. Anuário Brasileiro Da Fruticultura, Editora Gazeta: Santa Cruz do Sul, 2012, 128 p.

International Journal of Environmental & Agriculture Research (IJOEAR) ISSN:[2454-1850] [Vol-3, Issue-5, May- 2017]
Page | 72
[10] MARAFON, A. C.; HERTER, F. G et al. Concentrações de carboidratos em tecidos de pessegueiro (Prunus persica (L.) Batsch) cv.
Jubileu em plantas com ou sem sintomas de morte-precoce durante o período de dormência. Revista Brasileira de Fruticultura,
Jaboticabal, v. 29, n. 1, p. 75-79, 2007.
[11] MONTEIRO, L.B.; MIO, L. L. M. de. Et al. Avaliação de atrativos alimentares utilizados no monitoramento de mosca-das-frutas em
pessegueiro na Lapa-PR. Revista Brasileira de Fruticultura, v. 29, n. 1, p. 72-74, Apr. 2007.
[12] NUNES, J. L. da.; MARONDIN, G.A.; SARTORI, I. A. Cianamida hidrogenada, thidiazuron e óleo mineral na quebra da dormência
e na produção do pessegueiro cv. chiripá . Revista Brasileira de Fruticultura, Jaboticabal, v. 23, n. 3, p. 493-496, Dec. 2001.
[13] OJIMA, M.; CAMPO-DALL'ORTO, F. A et al. O. Aurora-1 e Aurora-2: novos cultivares de pêssego doce de polpa amarela. In:
CONGRESSO BRASILEIRO DE FRUTICULTURA, 10, Fortaleza, 1989. Anais... Fortaleza: Sociedade Brasileira de Fruticultura,
p.422-425, 1989.
[14] OLIVEIRA, A.P.de.; NIENOW, A. A.; CALVETE, E. O. Capacidade de enraizamento de estacas semilenhosas e de cultivares de
pessegueiro tratadas com AIB. Revista Brasileira de Fruticultura, v. 25, p. 282-285, 2003.
[15] PEREIRA, F.M.; KAVATI, R. Contribuição da pesquisa científica brasileira no desenvolvimento de algumas frutíferas de clima
subtropical. Revista Brasileira de Fruticultura, Jaboticabal, v. 33, 2011, 92 p.
[16] RASEIRA, A.; PEREIRA, J. F. M et al. Instalação e manejo do pomar. Org. MEDEIROS, C. A. B.; RASEIRA, M. C. B. A cultura
do pessegueiro, Brasília: EMBRAPA-SPI; Pelotas: Embrapa-CPACT, p. 81-87, 1998.
[17] RASEIRA, M. C. B.; NAKASU, B. H. et al. Pessegueiro: cultivar BRS Kampai. Revista Brasileira de Fruticultura, v. 32, n. 4, p.
1275-1279, Dec. 2010.
[18] SANTOS, J. P. Ecofisiologia da goiaba. Universidade do Estado da Bahia. Available in: http:\\pt.scribd.com/doc/24497565/A-
Cultura-Ecofisiologia-Da-Goiaba. Accessed: august 2013.
[19] SOUZA, O. P.; MANCIN, C. A.; MELO, B. Cultura da goiabeira, 2011. Available in:
<http:\\ www.fruticultura.iciag.ufu.br/goiabao.html>. Accessed: december 2013.

International Journal of Environmental & Agriculture Research (IJOEAR) ISSN:[2454-1850] [Vol-3, Issue-5, May- 2017]
Page | 73
Biotermiticides to Protect the Soil Health K. J. Kamble
1, Thakor N. J.
2
Deptartment of Agricultural Process Engineering, CAET, Dr.BSKKV, Dapoli
Abstract— Chemical termiticides are hazardous to biotic and abiotic factors in the environment and hence banned in US
and European countries but are still in use in developing countries. They are applied in huge quantity reaching to potable
water ways, food, and fodder and killing soil microbiological components. It has been observed from the study that these
hazardous termiticides can be replaced by ecofriendly and cheap Biotermiticides made from the plant based oils. Four tree
borne oils (CNSL(50-100%), Neemseed oil(10-25%), Karanj seed oil(10-25%) and Markingnut oil(10-25%) and three
chemicals Chlorpyrifos(10-50%), Coppernaphthenate(10-50%) and (Boric acid(10-50%) were used in different proportions
to formulate CNSL based termiticides. Specimen samples were treated and exposed to termites for 60 days. The mass loss
after 60 days was noted and results were analyzed. Chlorpyrifos and Coppernaphthenate 100% have shown better termite
control property than boric acid. Commercial termiticides their own might be effective against termite but except
Chlorpyrifos and other two have shown not much promising results in CNSL based formulation when compared with the oil
formulations. It was observed that CNSL(50-80%) + NO (10-25%) + BSL(10-25%) and CNSL(50-80%) + NO(10-25%) +
KO(10-25%) formulations can act as an effective termiticides. All four oils if used 100% have shown good resistant against
termites.
Keywords— CNSL- Cashew nut shell liquid, NO- Neemseed oil, KO- Karanj oil, BSL- Bhilawan shell liquid.
I. INTRODUCTION
Termites are a group of eusocial insects of infraorder Isoptera, or as epifamiliy Termitoidae within the cockroach order
Blattodea (Beccaloni and Paul, 2013). They are of four groups: dampwood living and feeding in very moist wood, drywood
termites do not require contact with moisture or soil and subterranean termites live and breed in soil, and arboreal/mound
builders. Termite mounds are commonly found in Africa, Australia, Southeast Asia, and parts of South America (Krishna,
1969; Inward et al., 2007). They are polymorphic living in colonies comprising reproductives (king, queen), soldiers and
workers called castes. The queen in ‘Royal Chamber’ is very much bigger than the king and is capable of laying eggs at the
rate of 36,000 a day for as long as 50 years. Single subterranean termite colony may contain millions of workers and may
forage a distance of up to 100 m2. (Su & Scheffrahn, 1988).
Termites help in aeration of the soil due to burrowing activities, the breakdown and release of organic matter as termites eat
and digest soil, improvement of soil fertility when termite mounds, which are rich in minerals, are crushed down and
incorporated into the soil, as a source of minerals for cattle who lick the mounds and as a source of protein rich food for
many organisms including ants, guinea fowl and other mammals including humans (HDRA, 2001). It is also observed that
termite in its natural environment; improve soil pH, organic carbon content, water content and porosity by recycling dead
organics (Abdel and Skai, 2011).
Although there are some benefits of termites in soil reclamation but they are often called the “Silent Destroyer” as they may
be secretly hiding and thriving in homes without any immediate signs of damage. About 10% of species of the termite are
economically significant as pests and consume cellulose-based plant materials and destroy valuable property, documents,
furniture and furnishings anything that contains cellulose, silently and swiftly, before becoming aware of the damage done.
Termites also cause damage to living trees, crop plants, wooden electric poles, railway sleepers, telephone and electrical
cables, etc. (Krishna and Weesner, 1970; Pardeshi et al., 2010; Mitchell, 2003; Ogedegbe and Eloka, 2015).
The economic losses associated with termite damage for Malaysia, India, Australia, China, Japan and the United States are
10, 35, 100, 375, 800 and 1,000 million US dollars respectively (Abdel and Skai, 2011). In Indian region about 35 species
have been reported to damage about 10-25% agricultural crops and timber in buildings (Rajgopal, 2002). It is observed that
due to termite attack on wheat, paddy, cotton, sugarcane, groundnut, in Punjab, Rajasthan, Delhi, Uttar Pradesh, Andhra
Pradesh, Bihar and Gujarat, Madhya Pradesh, and Maharashtra faced major loss in crop production (Patel and Patel, 1954;

International Journal of Environmental & Agriculture Research (IJOEAR) ISSN:[2454-1850] [Vol-3, Issue-5, May- 2017]
Page | 74
Chhotani, 1980; Verma et al. 2009). As many as 13 species of termite are reported to cause 30-60% destruction of buds of
sugarcane in India (Roonwal, 1981) and are responsible for plant mortality (5-50%) and pod damage (46%) in groundnut
(Rajgopal, 2002). Not only crops and wood but the cash, ornaments and saving documents kept in banks have been found
attacked by termite in India (Indian Express News, 22 Apr 2016, TNN. Apr 5, 2008).
Chemical termiticides used to control the termite include liquid termiticides, termite baits, building materials impregnated
with termiticides and wood treatments. Chemical treatments on broad base can be of two types repellent termiticide and non-
repellent termiticide. These chemicals do not kill the termites; they simply deter them from entering the treated soil and
building tunnels. Ex. Cypernethrin, Bifenthrin, Fenitrothion, Permethrin and Fenvalerate, Chlorpyrifos. Non-repellent
chemicals do not prevent termites from tunneling; they only kill the termites upon ingestion or contact. An example is
imidacloprid, Aldrin, Heptachlor, Chlordane, Coppernaphthenate, Boric acid etc. Grace, et al.,(1993) reported that the
toxicity of aldrin, chlordane, DDT, dieldrin and heptachlor was observed 17,20,24,28 and 33years after treatment in Hawaii.
These are applied in huge quantity in soil or poured in mounds to destroy it. These chemicals are very toxic to all the biotic
factors in soil and on the earth, leading to hazardous effects and diseases. This may is one of the threats to the human
existence on the earth through soil pollution.
It is necessary to search the alternative safe termiticides to the commercial hazardous chemicals damaging soil health and
ultimately the environment as a whole. Therefore the study was undertaken in the College of Agricultural Engineering and
Technology, DBSKKV, Dapoli on, “Development of Cashew nut shell liquid based termiticide’. The main objective of study
was developing and testing cashew nut shell liquid based termiticide by using Neemseed oil, Karanj seed oil and Markingnut
shell oil in different proportions and field tested for termite response.
II. MATERIALS AND METHODS
In this study four tree borne oils (Cashew nut shell liquid (CNSL), Neemseed oil, Karanj seed oil and Markingnut oil(BSL))
and three chemicals (Boric acid, Chlorpyrifos and Coppernaphthenate) were used in different proportions (Table 1).
Treatment detail is shown in Table 2 and Table 3. Wood specimens (30cm long and 2.5cm diameter) of Giripushpa
(Gliricidia sepium), were dried and weighed before the subsequent treatment. As per the treatments, CNSL based oil and
chemical formulations were made. Then dry weighed specimens were treated with both the formulations by surface area
application and dipping into the solution up to 10cm and room dried for 24 hrs. Then specimens were again weighed to know
the percent weight of termiticide absorbed by the surface area of each wood sample. The detail experimental design of the
present investigation is as shown in fig.1. Treated specimen samples were placed in the mound holes 10cm deep by breaking
mound soil cap and exposed to termites up to 60 days.
TABLE 1
TREATMENT DETAILS OF THE EXPERIMENT
1 Experiment—I
(Oil Formulation)
Material Levels (%)
CNSL 50,60,70,80,100
Neemseed Oil 10, 15, 20,25,100
Karanj seed Oil 10, 15, 20,25,100
BSL 10, 15, 20,25,100
2
Experiment-II
(Chemical Formulation with
CNSL)
Material Levels (%)
CNSL 50,60,70,80,90,100
Chlorpyriphos 10,20,30,40,50,100
Coppernaphthanate 10,20,30,40,50,100
Boric acid 10,20,30,40,50,100

International Journal of Environmental & Agriculture Research (IJOEAR) ISSN:[2454-1850] [Vol-3, Issue-5, May- 2017]
Page | 75
TABLE 2
TREATMENT COMBINATION FOR OIL FORMULATION
Sr.
No. Treatment
Oils
CNSL(%) Neem oil (%) Karanj oil (%) BSL (%)
1 TO1 100 0 0 0
2 TO2 0 100 0 0
3 TO3 0 0 100 0
4 TO4 0 0 0 100
5 TO5 80 10 10 0
6 TO6 80 10 0 10
7 TO7 80 0 10 10
8 TO8 70 15 15 0
9 TO9 70 15 0 15
10 TO10 70 0 15 15
11 TO11 60 20 20 0
12 TO12 60 20 0 20
13 TO13 60 0 20 20
14 TO14 50 25 25 0
15 TO15 50 25 0 25
16 TO16 50 0 25 25
17 TO17(Control) 0 0 0 0
(TO- Treatment of oil formulation)
TABLE 3
TREATMENT COMBINATION FOR CHEMICAL FORMULATION WITH CNSL.
Sr.
No. Treatment
CNSL
(%)
Chlorpyrifos
(%)
Coppernaphthanate
(%)
Boric acid
(%)
1 TC1 100 0 0 0
2 TC2 0 100 0 0
3 TC3 0 0 100 0
4 TC4 0 0 0 100
5 TC5 90 10 0 0
6 TC6 90 0 10 0
7 TC7 90 0 0 10
8 TC8 80 20 0 0
9 TC9 80 0 20 0
10 TC10 80 0 0 20
11 TC11 70 30 0 0
12 TC12 70 0 30 0
13 TC13 70 0 0 30
14 TC14 60 40 0 0
15 TC15 60 0 40 0
16 TC16 60 0 0 40
17 TC17 50 50 0 0
18 TC18 50 0 50 0
19 TC19 50 0 0 50
20 TC20(Control) 0 0 0 0
(TC - Treatment of chemical formulation with CNSL)

International Journal of Environmental & Agriculture Research (IJOEAR) ISSN:[2454-1850] [Vol-3, Issue-5, May- 2017]
Page | 76
Oil Formulation
Chemical Formulation with CNSL
Oils - 4 Types
CNSL
Neemseed oil
Karanj oil
BSL
Oil (1) + Chemicals (3)
CNSL
Chlorpyriphos
Coppernaphthanate
Boric acid
Formulation Levels - 5 Formulation Levels - 6
Treatments – 17(Table 5) Treatments – 20(Table 6)
Testing Testing
FT(60days) LT(20days) FT(60days) LT(20days)
SA DI SA DI SA DI SA DI
Mass loss Mass loss Mass loss Mass loss
Termite
Infestation
Termite
Mortality
Termite
Infestation
Termite
Mortality
FT - Field Test
LT - Laboratory Test
SA - Surface area application
DI - Dipping into solution
FIG.1 FLOW DIAGRAM OF EXPERIMENTAL DESIGN.
After 60 days wood specimens were removed from the termite mounds and weighed to know the mass loss by termite attack
which was calculated as below.
Mass loss (ML%)
The termite attack to the specimen samples placed on the mound will be quantified by calculating the weight after 60 days.
X 100 (1)
Where, M1 and M2 are initial (before exposure) and final (after exposure) weight (g) of the wood sample (EN 118, 2005).

International Journal of Environmental & Agriculture Research (IJOEAR) ISSN:[2454-1850] [Vol-3, Issue-5, May- 2017]
Page | 77
TABLE 4
MASS LOSS OBSERVED IN OIL FORMULATION TREATMENTS
Sr.
No.
Treatment
(CNSL:NO:KO:BSL)
Surface Application Dipping
Wt.Loss % Wt.Loss %
T1 100:0:0:0 5.37 3.46
T2 0:100:0:0 0.00 4.44
T3 0:0:100:0 0.00 0.00
T4 0:0:0:100 5.90 3.56
T5 80:10:10:0 0.00 0.000
T6 80:10:0:10 0.00 0.000
T7 80:0:10:10 10.16 6.21
T8 70:15:15:0 0.00 0.00
T9 70:15:0:15 0.00 0.00
T10 70:0:15:15 7.56 4.23
T11 60:20:20:0 0.00 0.00
T12 60:20:0:20 0.00 0.00
T13 60:0:20:20 5.07 0.00
T14 50:25:25:0 0.00 0.000
T15 50:25:0:25 4.44 0.00
T16 50:0:25:25 0.00 2.69
T17 0 19.94 38.94
III. RESULTS AND DISCUSSION
In the oil formulation experiment, from surface application treatments it was observed that specimens of T2, T3, T5, T6, T8, T9,
T11, T12 T14, T16 were not attacked by termite, where as among rest of the treatments specimens of T7 was attacked causing
highest mass loss 10.16% and in treatment T15 it was lowest i.e 4.44% as against control treatment T17 in which the mass loss
was 19.94%. In the same experiment with specimens dipping in formulation, specimens of treatments T3, T5, T6, T8, T9, T11,
T12, T13, T14, T15 were not attacked by termite, whereas among rest of the treatments specimens of T7 was attacked causing
highest mass loss 6.2% and in treatment T16 it was lowest i.e. 2.69%, as against control treatment T17 in which the mass loss
was 38.94%.
The results indicate that synergistic effect of oils in treatments CNSL +Neemseed oil + Karanj oil and CNSL +Neemseed oil
+ BSL has positive effect on termite control in both surface application and dipping treatments of oil formulation experiment.
It is clear that presence of Neemseed oil with CNSL stands more effective against termite attack.
In the chemical formulation experiment from surface application treatments it was observed that specimens of T2, T5, T8, T10,
T11, T17 were not attacked by termite, where as among rest of the treatments specimens of T4 was attacked causing highest
mass loss 79.13% and in treatment T3 it was lowest i.e 4.43%, as against control treatment T20 in which the mass loss was
85.40%. In the same experiment with specimens dipping in formulation, specimens of treatments T2, T3, T8, T10, T11, T12, T14,
T17 were not attacked by termite, whereas among rest of the treatments specimens of T4 was attacked causing highest mass
loss 73.56% and in treatment T5 it was lowest i.e. 4.84%, as against control treatment T20 in which the mass loss was 87.73%.
In chemical formulation treatments it is observed that specimens from treatments CNSL with boric acid were highly attacked
in comparison to other treatments whereas only one treatment with Chlorpyrifos was attacked by termite, may be because of
its repellent nature. Boric acid is slow poison, it shows its effect after ingestion, and hence the specimens treated with it
might be attacked more but after effect is unknown. Coppernaphthenate treated specimens were attacked by termite unevenly
with increase in its proportion with CNSL it might be because of synergistic effect.
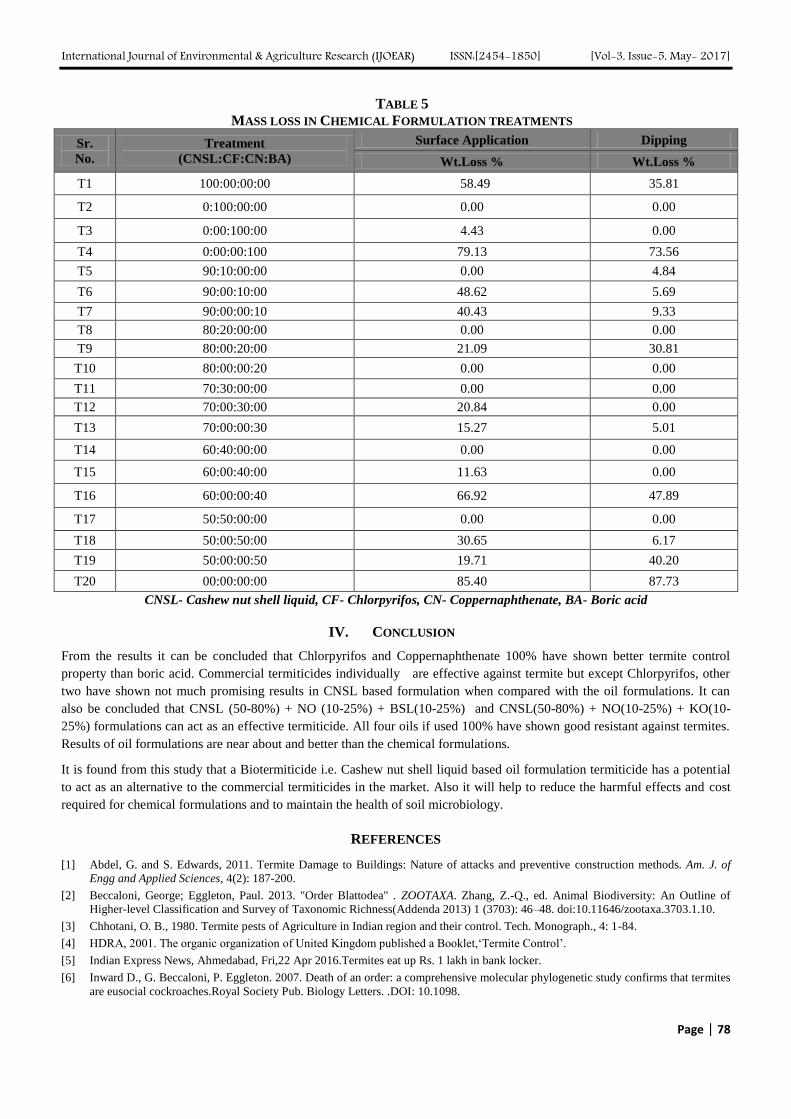
International Journal of Environmental & Agriculture Research (IJOEAR) ISSN:[2454-1850] [Vol-3, Issue-5, May- 2017]
Page | 78
TABLE 5
MASS LOSS IN CHEMICAL FORMULATION TREATMENTS
CNSL- Cashew nut shell liquid, CF- Chlorpyrifos, CN- Coppernaphthenate, BA- Boric acid
IV. CONCLUSION
From the results it can be concluded that Chlorpyrifos and Coppernaphthenate 100% have shown better termite control
property than boric acid. Commercial termiticides individually are effective against termite but except Chlorpyrifos, other
two have shown not much promising results in CNSL based formulation when compared with the oil formulations. It can
also be concluded that CNSL (50-80%) + NO (10-25%) + BSL(10-25%) and CNSL(50-80%) + NO(10-25%) + KO(10-
25%) formulations can act as an effective termiticide. All four oils if used 100% have shown good resistant against termites.
Results of oil formulations are near about and better than the chemical formulations.
It is found from this study that a Biotermiticide i.e. Cashew nut shell liquid based oil formulation termiticide has a potential
to act as an alternative to the commercial termiticides in the market. Also it will help to reduce the harmful effects and cost
required for chemical formulations and to maintain the health of soil microbiology.
REFERENCES
[1] Abdel, G. and S. Edwards, 2011. Termite Damage to Buildings: Nature of attacks and preventive construction methods. Am. J. of
Engg and Applied Sciences, 4(2): 187-200.
[2] Beccaloni, George; Eggleton, Paul. 2013. "Order Blattodea" . ZOOTAXA. Zhang, Z.-Q., ed. Animal Biodiversity: An Outline of
Higher-level Classification and Survey of Taxonomic Richness(Addenda 2013) 1 (3703): 46–48. doi:10.11646/zootaxa.3703.1.10.
[3] Chhotani, O. B., 1980. Termite pests of Agriculture in Indian region and their control. Tech. Monograph., 4: 1-84.
[4] HDRA, 2001. The organic organization of United Kingdom published a Booklet,‘Termite Control’.
[5] Indian Express News, Ahmedabad, Fri,22 Apr 2016.Termites eat up Rs. 1 lakh in bank locker.
[6] Inward D., G. Beccaloni, P. Eggleton. 2007. Death of an order: a comprehensive molecular phylogenetic study confirms that termites
are eusocial cockroaches.Royal Society Pub. Biology Letters. .DOI: 10.1098.
Sr.
No.
Treatment
(CNSL:CF:CN:BA)
Surface Application Dipping
Wt.Loss % Wt.Loss %
T1 100:00:00:00 58.49 35.81
T2 0:100:00:00 0.00 0.00
T3 0:00:100:00 4.43 0.00
T4 0:00:00:100 79.13 73.56
T5 90:10:00:00 0.00 4.84
T6 90:00:10:00 48.62 5.69
T7 90:00:00:10 40.43 9.33
T8 80:20:00:00 0.00 0.00
T9 80:00:20:00 21.09 30.81
T10 80:00:00:20 0.00 0.00
T11 70:30:00:00 0.00 0.00
T12 70:00:30:00 20.84 0.00
T13 70:00:00:30 15.27 5.01
T14 60:40:00:00 0.00 0.00
T15 60:00:40:00 11.63 0.00
T16 60:00:00:40 66.92 47.89
T17 50:50:00:00 0.00 0.00
T18 50:00:50:00 30.65 6.17
T19 50:00:00:50 19.71 40.20
T20 00:00:00:00 85.40 87.73

International Journal of Environmental & Agriculture Research (IJOEAR) ISSN:[2454-1850] [Vol-3, Issue-5, May- 2017]
Page | 79
[7] EN 118. 2005. European Committee for Standardization. Wood preservatives- determination of toxic values action against
Reticulitermes species (European Termites): 17-118. http://www.epa.gov/pesticides/op/chlorpyrifos/efedrra1.pdf.
[8] J. K. Grace, J. R. Yates, M. Tamashiro and R. T. Yamamoto. 1993. Persistence of organochlorine insecticides for Formosan
subterranean termite(Isoptera: Rhinotermitidae) control in Hawaii. J. Econ. Entomol. 86(3): 761-766.
[9] Krishna, K. 1969. Introduction. In Biology of termites. A book edited by K. Krishna and F. M. Weesner, 1: 1–17. New York:
Academic press, xiii + 598 pp.
[10] Krishna, K. and F. M. Weesner, 1970. Taxonomy, Phylogeny and Distribution. In: Biology of Termites. Academic Press, New York,:
643.
[11] Michael J. B., D. G. Wujek, F. L. Thomas, Jr., G. A. Lyon, T. Matsumoto, A. S. Robertson. 2000.Methods and apparatuses for
monitoring or controlling pests (Especially Termite). US 6016625 A.
[12] Ogedegbe, A. B.O. and E. V. Eloka. 2015. Biodiversity of Termites on Farmlands in Local Government (Ugoniyekorhionmwon,
Orhionwmon) Area, Edo State, Nigeria. Int. J. Pure Appl. Sci. Technol., 27(2): 65-76.
[13] Pardeshi, M. and B. A. K. Prusty, 2010. Termites as ecosystem engineers and potentials for soil restoration. Curr. Sci., 99: 11-11.
[14] Patel, G.A. & H.K. Patel, 1954. Seasonal incidence of termite injury in the northern parts of the Bombay State. Indian 1. Entomol.,
15(4) : 376-378.
[15] Rajagopal, D. 2002. Economically important termite species in India. Sociobiology, 40: 33-46.
[16] Roonwal, M.L., 1981. Termites of Agricultural Importance in India and their Importance. In: Progress in Soil Biology and Ecology
in India, Veeresh, G.K. (Ed.). University of Agricultural Science, Hebbal, Bangalore, : 253-265.
[17] Su, N.Y. and R. H. Scheffrahn. 1988. Foraging population and territory of the Formosan subterranean termite (Isoptera:
Rhinotermitidae) in an urban environment. Sociobiology, 14: 353-359.
[18] TNN. Apr 5, 2008, 01.19 AM , IST. Tamil Nadu News.Termites eat up cash, FDs in bank locker.
[19] Varma, M., S. Sharma and R. Prasad. 2009. Biological alternatives for termite control: A review. Int. Biodeteriration and
Biodegration, 63: 959-972.
[20] US EPA, 2000. Reregistration eligibility science chapter for chlorpyrifos. Fate and environmental risk assessment chapter.
[21] U.S. Geological Survey. Circular 1225. Reston, VA: USGS; 1999. The quality of our nation's waters – nutrients and pesticides.
http://water.usgs.gov/pubs/circ/circ1225/.

International Journal of Environmental & Agriculture Research (IJOEAR) ISSN:[2454-1850] [Vol-3, Issue-5, May- 2017]
Page | 80
Effect of Concentration of Silver Nanoparticles on the Uptake of
Silver from Silver Nanoparticles in Soil Sara Pappas
1, Uday Turaga
2, Naveen Kumar
3, Seshadri Ramkumar
4, Ronald J. Kendall
5
1,2,3,5The Wildlife Toxicology Laboratory, The Institute of Environmental and Human Health, Texas Tech University,
Lubbock, TX, USA 4Nonwovens and Advanced Materials Laboratory, The Instutite of Environmental and Human Health, Texas Tech
University, Lubbock, TX, USA
Abstract— The bioavailability and uptake of silver from silver nanoparticles in soil was investigated. Two species of insects,
Acheta domesticus and Tenebrio molitor, and two species of plants, Helianthus annuus and Sorghum vulgare, were exposed
to a range of concentrations of silver nanoparticles in soil. Silver nanoparticles were charactrized by techniques including
transmission electron microscopy, dynamic light scattering, and powder X-ray diffraction. The concentration of silver in
insects and plants exposed to silver nanoparticles was measured using inductively coupled plasma-optical emission
spectrometry. The results suggested an increase in the levels of silver in both insects and plants as a function of increasing
concentrations of silver nanoparticles in soil. The translocation of silver to various parts of dicot plants such as stems and
leaves was also observed. Such a result was not observed in the case of monocot plants. Results from this study suggests that
silver nanoparticles would be available for uptake by insects and plants in terrestrial ecosystems.
Keywords— Silver nanoparticles, Acheta domesticus, Tenebrio molitor, Helianthus annuus, Sorghum vulgare,
inductively coupled plasma-optical emission spectrometry.
I. INTRODUCTION
The antimicrobial properties exhibited by silver and silver nanomaterials have propelled their widespread use in many
consumer products that include detergents, textiles, home appliances, nutritional supplements, etc. In fact, silver based
nanomaterials are one of the most common and most used among all nanomaterials [1]. According to a study by the Grand
View Research, Inc. the global market for silver nanoparticles (Ag NPs) is projected to reach USD 2.45 billion by 2022 [2].
The widespread use of Ag NPs invariably raises questions and concerns about the risks and consequences resulting from their
release into the environment.
Ag NPs are introduced into the terrestrial systems primarily through applications of sewage sludge to land [3-17]. Once
present in an ecosystem, the environmental behavior, fate and ecotoxicity of metal-based nanoparticles are known to be
influenced by their physical and chemical characteristics. Physical characteristics include size and shape of nanoparticles
and chemical characteristics include acid-base character of the surface and aqueous solubility of the metal. The physical
and chemical characteristics of nanoparticles influence their transformation phenomena such as aggregation, sorption to
surfaces, and dissolution to metal ions. Additionally, surface coatings on metal based nanoparticles also influence their
environmental behavior, fate and ecotoxicity [10]. For instance, the properties of Ag NPs that influence their uptake and
toxicity to the earthworm Lumbricus rubellus in soil have been investigated by Makama et al. 2016 [18].
The physicochemical characteristics of soil influence the chemical form, mobility, bioavailability and toxicity of pollutants
in terrestrial ecosystems. These physicochemical characteristics include pH, ionic composition, grain size, soil texture,
organic matter content, temperature, solar radiation exposure, hydrostatic pressure, and cation exchange capacity. Thus, it
is important to understand that the environmental behavior, fate, bioavailability and ecotoxicity of nanomaterials and other
pollutants are influenced and determined by a combination of the physicochemical characteristics of the soil, the
physicochemical characteristics of nanomaterials, and the physiological status of biota [19, 20].
Once present in a terrestrial environment, it has been shown that certain types of nanoparticles possess the ability to be
taken up by insects [ 2 1 ] and plants [22-27], thereby entering the food web. The uptake of nanoparticles from soil
depends on a large number of factors. One such factor is the concentration of nanoparticles present in soil. Larger amounts
of nanoparticles may be prone to a phenomenon called aggregation, which causes the final size of the nanoparticles to be
larger than they were originally. This could potentially affect the uptake of nanoparticles as the uptake of nanoparticles is

International Journal of Environmental & Agriculture Research (IJOEAR) ISSN:[2454-1850] [Vol-3, Issue-5, May- 2017]
Page | 81
inversely proportional to their size. The small size of nanoparticles enables their easy uptake, dissolution and release of ions
with increased surface area [28]. Conversely, the presence of a large amount of nanoparticles in a system may result in an
increased uptake.
In the present study, the uptake of silver by insects and plants as a function of concentration of Ag NPs in soil was
investigated. Studies to understand the uptake, kinetics and transformatoin of metal nanoparticles in terrestrial ecosystems
usually include the terrestrial isopods [29-31]. Terrestrial ispods enable the study of uptake and transformation of metal
nanoparticles because of their ability to uptake nanopartiles extensively through the oral route. Surface uptake of
nanoparticles in terrestrial isopods was found to be negligible [32]. However, to comprehensively understand the effect of
nanoparticles on terresrtial ecosystems, it is important to investigate their uptake in other components of terrestrial
ecosystems that play a keyrole in terresrtial food webs.
Two species of insects, Acheta domesticus and Tenebrio molitor, and two species of plants, Helianthus annuus (a dicot)
and Sorghum vulgare (a monocot) were used in this study. Insects constitute an important source of food to insectivorous
birds. They serve as a crucual link in the metal-transport chains between trophic levels in food webs [33]. As they are a
very good source of protein and other nutrients, insects and larvae serve as an important food source to birds especially
during the breeding season [34]. Considering the signficance of insects in the food web of all insectivorous birds, it is
important to understand if insects are able to uptake abd accumulate silver from Ag NPs in soil. Two different species of
plants, a monocot and a dicot, were chosen for this study to understand if there is any difference in the uptake of silver
from Ag NPs in soil by these plants. The objective was to examine if either of the monocot or dicot plant species uptake
silver from Ag NPs in soil. Additionally, the possibility of translocation of silver to other tisseus of plant such as stem,
seeds, etc was also evaluated. Considering seeds of plants also serve as an important food source for granivorous birds [35],
such a study would help understand if these plants are playing a role in the metal-transport chain in the food web of
granivorous birds.
The test species were exposed to concentrations of Ag NPs ranging from 0-625 mg/kg (ppm) in soil. Studies have
suggested that sewage sludge can contain a wide range of concentrations of silver. Concentrations of silver as high as 960
ppm were reported in some sludge samples [12]. Thus, the concentration of Ag NPs used in this study is not outside the
realms of possibility.
II. MATERIAL AND METHOD
2.1 Soil Collection and Preparation
All soil used during the insect and plant exposure experiments was collected 40 minutes south of Colorado City, Texas at
an elevation of 684 m above sea level. Exact coordinates were as follows: Universal Transverse Mercator (UTM) 14 S
0319752 mE 3557792 mN. All soil was collected from the top 10 cm of soil, shoveled into clean plastic containers and
transported back to The Institute of Environmental and Human Health (TIEHH) at Texas Tech University (TTU) in
Lubbock, TX. Once at TIEHH the soil was processed for homogeneity. All large rocks, roots, living organisms, and other
organic matter were removed first and large clumps of soil were crushed. The soil was then sifted through a 2 mm wire
screen into another clean plastic storage container. Processed soil was covered and stored indoors until ready for use.
2.2 Soil Analysis
Soil samples were sent to Midwest Laboratories Inc. (Omaha, NE) for basic soil analysis. Soil texture, percent humic
matter, percent organic matter, exchangeable cations (K+
, Mg2+
, Ca2+
), available phosphorus (P), soil pH, percent base
saturation of cations (K+
, Mg2+
, Ca2+
, H+
), cation exchange capacity (CEC), and sulfur (S) content were all analyzed in
order to fully characterize the soil.
2.3 Characterization of Ag NPs
Uncoated Ag NPs (30-50 nm) were purchased from US Research Nanomaterials, Inc. (Houston, TX). According to the
manufacturer, the Ag NPs contain 99.99% Ag (www.us-nano.com). The manufacturer also confirmed the size and
spherical shape of each lot of nanoparticles.

International Journal of Environmental & Agriculture Research (IJOEAR) ISSN:[2454-1850] [Vol-3, Issue-5, May- 2017]
Page | 82
2.4 Transmission Electron Microscopy
In order to confirm the size range and shape of the nanoparticles, transmission electron microscopy (TEM) was used. Each
sample was prepared by dispersing the Ag NP powder in ethanol (EtOH). Each sample was sonicated for 10 minutes
before being drop cast onto a carbon coated copper grid. Samples were air dried before analysis. TEM (Hitachi H-8100
TEM) images were taken at 200 kV using a tungsten filament side-mounted camera.
2.5 Dynamic Light Scattering
Dynamic light scattering (DLS) was used as an additional method to confirm the size of the nanoparticles. Sample
preparation was performed by placing approximately 10 mg of silver nanoparticle powder in 10 mL of reagent grade
acetone (Fisher Chemical). Samples were sonicated until nanoparticles remained suspended in solution. Samples were
analyzed using a Nanotrac NPA252 Combination (Microtrac Inc. Montgomery, PA) and Mictrotrac Flex Software
(Version: 10.3.14). Method settings were customized for each sample of silver nanoparticles (absorbing particles) and
acetone (refractive index: 1.36).
Samples were analyzed by running two consecutive 60 second scans. The average value of the two scans was recorded as
the final result of each analysis. The particle size given at 50% was used as the average particle size of each sample.
2.6 Powder X-ray Diffraction
Powder x-ray diffraction (PXRD) was used to confirm the composition of the nanoparticles. A Rigaku Ultima III X-Ray
Diffractometer was used to analyze all samples. Samples were analyzed using Cu Kα radiation as x-ray source. The silver
nanoparticles were analyzed using the following instrument parameters: parallel-beam geometry was used with a step width
of 0.03° and a count time of one second; the divergence, scattering, and receiving slits were set at one. Once completed, the
diffraction patterns were compared and matched to the phases in the International Center for Diffraction Data (ICDD)
powder diffraction file (PDF) database.
2.7 Insect Treatment with Ag NPs
Two replicates were prepared using 37.9 L terrariums (50.8 cm x 27.9 cm x 33.0 cm) for each insect species treatment group,
including the control group. Before use, each terrarium was thoroughly cleaned using water, followed by a 10% bleach
( c a l c i u m h y p o c h l o r i t e ) solution to remove any remaining chemical residues. Exactly 2.5 kg of soil was weighed
into each clean terrarium. An analytical balance was used to weigh out the necessary amount of Ag NPs for each treatment
group: 0 (control), 1, 5, 25, 125, and 625 ppm. Nanoparticles for each treatment group were added to each terrarium and
manually mixed for at least 60 seconds to ensure homogeneity. Insects used in the study were purchased from
reptilefoods.com. Each terrarium received either 300 small crickets or 400 large mealworms. Insects were provided with
fresh food and water as needed throughout the course of the study that lasted 28 days.
Once the 28 day exposure was complete, live insects were carefully extracted from the terrariums and placed in glass jars.
The jars were then placed in a -80°C freezer until all the insects were deceased.
The insects were then freeze dried (FreeZone 2.5 Liter Freeze Dry System, Labconco, Corp. Kansas City, MO) for at least
48 hours to ensure the removal of all moisture. Freeze dried insects were then crushed into a fine powder and stored in a
freezer until they could be digested.
2.8 Plant Treatment with Ag NPs
Commercially available 7.6 L plastic nursery containers were purchased and filled with approximately two inches of
commercial pond pebbles to aid in proper drainage. Exactly 2.5 kg of soil was weighed out in a separate plastic container.
An analytical balance was used to weigh out the necessary Ag NPs; these were added to the soil and mixed in for at least
60 seconds. The treated soil was then carefully transferred into each nursery container. Two replicates were prepared for
each treatment group for each of the two plant species.
Seeds of each plant species were planted in their respective nursery containers and transported to the TTU greenhouse. The
plants remained in the greenhouse until they reached maturity, approximately three months for H. annuus and six months
for the S. vulgare. While in the greenhouse, plants received shaded sunlight and were maintained at or above 60°F. Once

International Journal of Environmental & Agriculture Research (IJOEAR) ISSN:[2454-1850] [Vol-3, Issue-5, May- 2017]
Page | 83
plants reached maturity, the entire plant was harvested. The roots were separated from the remainder of the plant and rinsed
using tap water for a full minute to remove all attached soil. The shoot system of the plant was separated into leaves,
stems, and seeds. The plant tissue samples were stored in a freezer until they could be digested.
2.9 Processing of Samples for Analysis
Three identical samples were weighed out using the insect samples collected from each terrarium. For each plant treatment
group, four samples were prepared from each nursery container: a root sample, a leaf sample, a stem sample, and a seed
sample, if possible. For each sample, either plant or insect, approximately 1.0000 grams were weighed into a 100 mL
beaker. It should be noted here that the weights are dry weight (dw) for the insects and wet weight (ww) for the plants.
Exactly 10 mL of 70% reagent grade nitric acid (HNO3) (Fisher Chemicals) was added to each beaker using an acid-washed
10 mL volumetric flask. A 10 mL aliquot of reagent grade 30% hydrogen peroxide (H2O2) (Fisher Chemicals) was
carefully added to each beaker using a volumetric flask. A method blank was run with each set of samples by adding 10 mL
of HNO3 and 10 mL H2O2 to an empty beaker. All beakers were placed onto hot plates and covered with a Teflon watch
glass and allowed to sit overnight before digesting. Samples were then slowly heated; the temperature was raised in 5°C
increments until the solutions in the beakers began to gently reflux.
The beakers were diligently monitored to ensure that the mixtures did not boil over in order to prevent the loss of sample.
Any samples that did boil over were removed and were rerun at a later time. Samples were periodically swirled during the
reflux process if needed. The samples in the beakers were allowed to gently reflux until the volume had been reduced to
roughly 5 mL.
Once a sample had reached the desired volume it was carefully removed from the hot plate and placed in an ice bath to
cool. After the samples were cooled, the samples were filtered into 50 mL plastic centrifuge tubes (Corning CentriStar™)
using acid-washed glass funnels and ashless filter paper (Whatman No. 41). By filtering each sample, any remaining solids
and/or digested lipids were removed from the final sample. Exactly 10 mL of 5% HNO3 was measured using a volumetric
flask and poured into each empty sample beaker. The acid solution was swirled in each beaker and the contents were
poured into the funnel. This process was repeated twice so the samples were diluted with a total of 20 mL of the 5% HNO3
solution. Once filtering had been completed, the centrifuge tubes were stored at room temperature until analysis by
inductively coupled plasma optical emission spectrometry (ICP-OES) could be performed.
2.10 Analysis of Samples on ICP-OES
All samples were analyzed using a Teledyne Instruments (Hudson, New Hampshire) Prodigy High Dispersion Inductively
Coupled Plasma Optical Emission Spectrometer (ICP-OES). All samples were analyzed for silver at three wavelengths:
224.643, 328.068, and 338.289 nm.
The three silver wavelengths were aligned next using a 10 ppm silver standard solution (SPEX CertiPrep, lot# CL7-
09AGY). The instrument was calibrated using a range of silver standards from 0-20 ppm.
2.11 Statistical Analysis
The dilution factors were factored back into sample results by multiplying the analyzed concentration by the final sample
weight and then dividing by the initial sample weight. These final calculated sample concentrations were then used to run
statistical analyses.
All data was compared using a basic Kruskal-Wallis test in R [36] after being found to be non-parametric [37]. The Shapiro
test was used to compare the normality of the data [38]. This was followed by a multiple comparison test after Kruskal-
Wallis test to identify all significant differences among the treatment groups (p<0.05).
III. RESULTS AND DISCUSSION
3.1 Soil Characterization
The control soil was found to contain 54% sand, 36% silt, and 10% clay. This type of soil is classified as a sandy loam.
Additional tests found the soil to contain 0.01% humic matter, 1.7% organic matter, and 9 ppm S. The pH of the control
soil was slightly basic, 8.1. And the CEC of the soil was calculated to be 18.0 meq/100g.

International Journal of Environmental & Agriculture Research (IJOEAR) ISSN:[2454-1850] [Vol-3, Issue-5, May- 2017]
Page | 84
Other data from soil analysis is summarized in Table I. Additionally, control soil samples analyzed by ICP-OES were
found to contain no detectable concentrations of silver.
TABLE 1
CHARACTERISTICS OF SOIL USED IN THE STUDY
Analysis Results
Organic Matter 1.7%
Exchangeable Potassium 263 ppm
Exchangeable Magnesium 114 ppm
Exchangeable Calcium 3273 ppm
Soil pH 8.1
Cation Exchange Capacity (CEC) 18.0 meq/100g
Base Saturation, Potassium 3.7%
Base Saturation, Magnesium 5.3%
Base Saturation, Calcium 91.0%
Base Saturation, Hydrogen 0.0%
Sulfur Content 9 ppm
Humic Matter 0.01%
Sand Content 54%
Silt Content 36%
Clay Content 10%
3.2 Transmission Electron Microscopy
The 30-50 nm uncoated Ag NPs were found to be heavily aggregated after being dispersed in EtOH. However, the
spherical shape of Ag NPs was confirmed by the TEM (Fig. 1).
FIG. 1: TRANSMISSION ELECTRON MICROSCOPY IMAGE OF 30-50 nm UNCOATED Ag NPs.

International Journal of Environmental & Agriculture Research (IJOEAR) ISSN:[2454-1850] [Vol-3, Issue-5, May- 2017]
Page | 85
3.3 Dynamic Light Scattering
Approximately 95% of the 30-50 nm Ag NPs were found to be between 30.70 to 52.90 nm. A representative size
distribution pattern in presented in Fig. 2. The average size of the particles was 41.80 nm.
FIG. 2: SIZE DISTRIBUTION OF UNCOATED 30-50 nm Ag NPs AS DETERMINED BY DYNAMIC LIGHT
SCATTERING.
3.4 Powder X-Ray Diffraction
The PXRD analysis of the silver nanoparticles confirmed their composition. The diffraction patterns matched both
those in the ICDD and those provided by the manufacturer. A typical diffraction pattern is presented in Fig. 3.
FIG. 3: DIFFRACTION PATTERN OF UNCOATED 30-50 nm Ag NPs aS DETERMINED BY POWDER X-RAY
DIFFRACTION.
3.5 ICP-OES Results
Of all the three wavelengths considered for the analysis of silver in the present study, the data from 338.289 nm was chosen
for subsequent analysis. Wavelength 224.643 nm was a double and deemed not usable. The wavelength at 328.068 nm was

International Journal of Environmental & Agriculture Research (IJOEAR) ISSN:[2454-1850] [Vol-3, Issue-5, May- 2017]
Page | 86
bracketed by iron at 328.026 nm and 328.129 nm, which could have been a potential interference in both the insects and
plant samples.
3.6 Uptake of Silver from Ag NPs in Soil by Insects
Previous studies in literature speculated that silver nanoparticles would be completely immobilized in a sewage sludge due
to the formation of the insoluble silver sulfide (Ag2S) [6, 20, 39, 16, 40]. It was theorized that the silver nanoparticles
would remain immobile, and therefore unavailable for uptake, after the sludge was applied as a land amendment.
However, the present study showed that Ag NPs would be available for uptake by both insects and plants at high enough
concentrations.
It should be noted that this study used pristine nanoparticles rather than silver that had interacted with sewage sludge.
However, the widespread use of Ag NPs in detergents, textiles, etc. pontetially serves as an anthropogenic source for
the release of pristine silver nanoparticles into terrestrial ecosystems. Sewage sludge typocally contains 0.3-2.3 wt% of
sulphur [41]. Hence, it is possible that there may not be enough sulphur in the sludge in the event of presence of high
concentration of Ag NPs.
In the case of both the insects used in the study, a concentration dependent increase in the uptake of silver from Ag NPs in
soil was observed (Fig. 4 & 5). Insects exposed to the highest concentrations of Ag NPs used in the study (125 and 625
ppm) were observed to contain quantifiable concentrations of silver (> 0.1 ppm). Levels of silver in insects exposed to the
lowest concentrations of Ag NPs used in the study (0 and 1 ppm) could not be quantified (below instrument detection
limits or < 0.005 ppm). Lastly, insects exposed to intermediate concentrations of Ag NPs used in the study (5 and 25 ppm)
were found to contain at least trace amounts of silver. In the case of A. domesticus, the levels of silver found in the highest
treatment groups (125 and 625 ppm) were found to be significantly higher than the levels of silver in the control and 1
ppm treatment groups (p<0.05). In the case of T. molitor, levels of silver in insects from the 625 ppm treatment group
were found to be significantly higher than the levels of silver in insects exposed to 1 ppm Ag NPs in soil (p<0.05).
Past studies have found insects to uptake bulk metals from soil [42-44]. In the present study, an uptake of silver from Ag
NPs as a function of concentration of Ag NPs in soil was observed. This result is in agreement with a previous study
that has investigated the uptake of silver from Ag NPs in sandy loam soil. An analysis of the characteristics of soil used
in this study has determined that the soil is sandy loam in nature. The low organic matter content, low organic carbon
content, low clay content and low CEC of sandy loam soil usually result in more Ag ions being available for uptake. A
similar result was observed in another study that has dealt with the uptake of silver ions from Ag NPs by earthworms
[20].
The uptake of silver ions from Ag NPs can occur via ingestion or via endocytosis. Either one of these processes could be
responsible for the uptake of Ag NPs in A. domesticus and T. molitor. Nanoparticles are also known to adhere to the cell
walls or damaged cells, a phenomenon which was previously observed with quantum dots [45]. Another explanation could
be the dermal exposure to silver ions by the test species. Studies have suggested that the uptake and accumulation whole
particles is possible in cases of dermal exposure to nanoparticles [20].
FIG. 4: UPTAKE OF Ag FROM Ag NPs IN SOIL BY
A. DOMESTICUS (n=2).
FIG. 5: UPTAKE OF Ag FROM Ag NPs IN SOIL BY A.
MOLITOR (n=2).

International Journal of Environmental & Agriculture Research (IJOEAR) ISSN:[2454-1850] [Vol-3, Issue-5, May- 2017]
Page | 87
3.7 Uptake of Silver from Ag NPs in Soil by Plants
All S. vulgare root samples were found to contain at least trace amounts of silver, regardless of treatment group. No other
plant tissue samples were found to contain silver except the leaf samples from the 625 ppm treatment group, which
contained trace amounts. An increase in root concentrations of Ag was observed as a function of increasing concentrations of
Ag NPs in soil (Fig. 6).
The H. annuus control samples were found to contain silver concentrations below detection limits, except one stem sample
which was found to contain trace amounts of silver. Such an observation could be likely due to contamination and sample
preparation and processing errors. The 1 ppm treatment group was found to contain no silver. All of the root and leaf samples
of the 5, 25, 125, and 625 ppm treatment groups were found to contain at least trace amounts of silver. The stem samples of
the highest treatment groups (125 and 625 ppm) were also found to contain at least trace amounts of silver. The root samples
showed an overall trend of increasing concentrations of silver as a function of increasing concentrations of Ag NPs in soil
(Figure 7).
FIG. 6: UPTAKE OF Ag FROM Ag NPs IN SOIL BY S.
VULGARE (n=2).
FIG. 7: UPTAKE OF Ag FROM Ag NPs IN SOIL BY H.
ANNUUS (n=2), n = 1 FOR THE 625 PPM
TREATMENT GROUP.
There were no significant differences among any of the plant tissue samples. Additionally, in both plant species, the roots
were found to contain the highest concentrations of silver, followed by the leaves, the stems, and finally the seeds in the H.
annuus tissue samples. A similar result was observed by Reddy and Dunn 1984 who have investigated the uptake of heavy
metals like Cadmium, Nickle, and Chromium by soybeans grown on sludge-amended soils (Reddy and Dunn 1984). A major
limitation that considerably affected the obseved inferences was the limited sample size (n =2). Such a small sample size has
considerably affected the power of the statistical tools used in analysing the data.
Uptake of silver from Ag NPs in soil by the plants used in the study is observed at the highest soil treatment groups. The H.
annuus samples were found to take up more than the S. vulgare, although these amounts were not found to be significantly
higher. These results were not unexpected as dicots are better able to take up metals from soil than monocots due to the
differences in root exudates [ 4 6 ] . The root exudates of dicots contain more organic acids than monocots. These organic
acids include citric acid, maleic acid, ascorbic acid, and oxalic acid [47, 48]. The presence of organic acids in root exudates
lowers the pH in the vicinity of the roots thereby solubilizing metals and enabling their uptake [49, 25, 50]. However, the
uptake and accumulation of silver by S. vulgare, a monocot plant, may be explained by its root morphology. The presence of
thin and numerous roots in monocots present a high surface area for nanoparticles that facilitates penetration and
accumulation into the system [51]. Additionally, recent studies have suggested that the presence of elevated levels of
chlorine (Cl) in soil, due to its salinity or when irrigated with water containing high amounts of Cl, may potentially increase
the bioavailability and subsequent uptake of silver. This phenomenon could be possible explained due to the formation of
AgClx complexes in soluble or colloidal forms at elevated Cl concentrations. High Cl concentrations result in an increase in
the mass transport of Ag and labile Ag, eventually resulting in the uptake of silver by plants [52].

International Journal of Environmental & Agriculture Research (IJOEAR) ISSN:[2454-1850] [Vol-3, Issue-5, May- 2017]
Page | 88
Additionally, H. annuus was also found to translocate silver to the shoot portion of the plant whereas, S. vulgare did not. It
has long been established that some plants are able to uptake metals from soil via the roots and distribute them throughout
the shoot system [53, 23, 8, 54]. A possible explanation for the differences in translocation may be due to the differences in
root exudates. If dicots are better at dissolving metals, a higher concentration of silver ions would be present around the
roots; the ions would be able to travel further into a plant than a silver nanoparticle. Ions would also be able to diffuse across
a membrane or be actively transported across the lipid bilayer through transport proteins [55] whereas solid nanoparticles
would not.
IV. CONCLUSIONS
An uptake of silver from Ag NPs in soil by both insects and plants was observed at high concentrations (125 and 625 ppm).
Both species of plants were found to accumulate silver in the roots. Not surprisingly, the dicot species were found to
translocate more silver to the shoot system than the monocot species. Sewage sludge samples have been found to contain
levels of silver as high as 960 ppm. Therefore, the possibility of bioaccumulation of silver and its eventual entry into the food
chain of insectivorous and granivorous birds cannot be discounted.
ACKNOWLEDGEMENTS
The authors would like to thank Sematech, TX for their financial contribution to this project. We also would like to thank Dr.
Melanie A Barnes, Department of Geosciences, Texas Tech University, Ms. Roya Baghi, Department of Chemistry &
Biochemistry, Texas Tech University, and Michael T Abel, Trace Analysis, Inc., Lubbock, Texas, for all their valuable
expertise, time and help with this project. Finally, we would like to extend our appreciation to the prospective Editors and
Reviewers.
REFERENCES
[1] The Project on Emerging Nanotechnologies. Available from: www.nanotechproject.org [Accesesed 01 August 2016].
[2] Global Silver Nanoparticles Market By Application (Electronics & Electrical, Healthcare, Food & Beverages, Textiles) Is Expected
To Reach USD 2.54 Billion By 2022. Available from: https://www.grandviewresearch.com/press-release/global-silver-nanoparticles-
market [Accessed 01 August 2016].
[3] Nowack B, Bucheli TD. Occurrence, Behavior and Effects of Nanoparticles in the Environment. Environ Pollut. 2007; 150:5–22.
[4] Cornelis G, Kirby JK, Beak B, Chittleborough D, McLaughlin MJ. A Method for Determination of Retention of Silver and Cerium
Oxide Manufactured Nanoparticles in Soils. Environ Chem. 2010; 7:298–308.
[5] Kim B, Park C-S, Murayama M, Hochella Jr MF. Discovery and Characterization of Silver Sulfide Nanoparticles in Final Sewage
Sludge Products. Environ Sci Technol. 2010; 44: 7509–14.
[6] Unrine JM, Hunyadi SE, Tsyusko OV, Rao W, Shoults-Wilson WA, Bertsch PM. Evidence for Bioavailability of Au Nanoparticles
from Soil and Biodistribution within Earthworms (Eisenia Fetida). Environ Sci Technol. 2010; 44:8308–8313.
[7] Oromieh, A. G., 2011. Evaluating Solubility, Aggregation and Sorption of Nanosilver Particles and Silver Ions in Soils. Thesis (MS).
Department of Soil and Environment, Swedish University of Agricultural Sciences.
[8] Miralles P, Tamara L C, Andrew TH. Toxicity, Uptake, and Translocation of Engineered Nanomaterials in Vascular Plants. Environ
Sci Technol. 2012; 46: 9224–39.
[9] Pan B, Xing B. Applications and Implications of Manufactured Nanoparticles in Soils: A Review. Eur J Soil Sci. 2012; 63:437–456.
[10] Tourinho PS, Van Gestel CA, Lofts S, Svendsen C, Soares AM, Loureiro S. Metal‐ based Nanoparticles in Soil: Fate, Behavior, and
Effects on Soil Invertebrates. Environ Toxicol Chem. 2012; 31:1679–1692.
[11] Unrine JM, Shoults-Wilson WA, Zhurbich O, Bertsch PM, Tsyusko OV. Trophic Transfer of Au Nanoparticles from Soil along a
Simulated Terrestrial Food Chain. Environ Sci Technol. 2012; 46:9753–9760.
[12] VandeVoort AR, Arai Y, Sparks DL (2012) Environmental Chemistry of Silver in Soils: Current and Historic Persective. Advances in
Agronomy 114. Academic Press: 59–90.
[13] Anjum NA, Sarvajeet SG, Armando CD, Eduarda P, Iqbal A. Silver Nanoparticles in Soil–plant Systems. J Nanopart Res. 2013;
15:1–26.
[14] Hou W-Che, Westerhoff P, Posner JD. Biological Accumulation of Engineered Nanomaterials: A Review of Current Knowledge.
Environ Sci.: Processes & Impacts. 2013; 15:103–22.
[15] Kaegi R, Voegelin A, Ort C, Sinnet B, Thalmann B,Krismer J, Hagendorfer H, Elumelu M, Mueller E. Fate and Transformation of
Silver Nanoparticles in Urban Wastewater Systems. Water Res. 2013; 47:3866–3877.
[16] Reidy B, Haase A, Luch A, Dawson KA, Lynch I. Mechanisms of Silver Nanoparticle Release, Transformation and Toxicity: A
Critical Review of Current Knowledge and Recommendations for Future Studies and Applications. Mater. 2013; 6:2295–2350.
[17] Yu S-J, Yin Y-G, Liu J-F. Silver Nanoparticles in the Environment. Environ Sci.: Processes & Impacts. 2013; 15:78–92.
[18] Makama S, Piella J, Undas A, Dimmers WJ, Peters R, Puntes VF, Van De Brink NW. Properties of silver nanoparticles influencing
their uptake in and toxicity to the earthworm Lumbricus rubellus folowing exposure in soil. Environ Pollut. 2016; 218:870-878.

International Journal of Environmental & Agriculture Research (IJOEAR) ISSN:[2454-1850] [Vol-3, Issue-5, May- 2017]
Page | 89
[19] Babich H, Stotzky G, Ehrlich HL. Environmental Factors that Influence the Toxicity of Heavy Metal and Gaseous Pollutants to
Microorganisms. CRC Cr Rev Microbiol. 1980; 8:99-145.
[20] Shoults-Wilson WA, Reinsch BC, Tsyusko OV, Bertsch P M , Lowry GV, Unrine JM .Role of Particle Size and Soil Type in
Toxicity of Silver Nanoparticles to Earthworms. Soil Sci Soc Am J. 2011; 75:365–377.
[21] Unrine JM, Tsyusko OV, Hunyadi SE, Judy JD, Bertsch PM. Effects of Particle Size on Chemical Speciation and Bioavailability of
Copper to Earthworms (Eisenia Fetida) Exposed to Copper Nanoparticles. J Environ Qual. 2010; 39:1942–1953.
[22] Zhu H, Han J, Xiao JQ, Jin Y. Uptake, Translocation, and Accumulation of Manufactured Iron Oxide Nanoparticles by Pumpkin
Plants. J Environ Monitor. 2008; 10:7
[23] Nair R, Varghese SH, Nair BG, Maekawa T, Yoshida Y, Kumar DS. Nanoparticulate Material Delivery to Plants. Plant Sci. 2010;
179:154–63.
[24] Rico CM, Majumdar S, Duarte-Gardea M, Peralta- Videa JR, Gardea-Torresdey JL. Interaction of Nanoparticles with Edible Plants
and Their Possible Implications in the Food Chain. J Agr Food Chem. 2011; 59:3485–3498.
[25] Yin L, Cheng Y, Espinasse B, Colman BP, Auffan M, Wiesner M, Rose J, Liu J, Bernhardt ES. More than the Ions: The Effects of
Silver Nanoparticles on Lolium Multiflorum. Environ Sci Technol. 2011; 45:2360–2367.
[26] Lee W-M, Kwak J, An Y-J. Effect of Silver Nanoparticles in Crop Plants Phaseolus radiatus and Sorghum bicolor: Media Effect on
Phytotoxicity. Chemosphere. 2012; 86:491–499.
[27] Song U, Jun H, Waldman B, Roh J, Kim Y, Yi J, Lee EJ. Functional Analyses of Nanoparticle Toxicity: A Comparative Study of the
Effects of TiO2 and Ag on tomatoes (Lycopersicon esculentum). Ecotox Environ Safe. 2013; 93:60–67.
[28] Powers CM, Badireddy AR, Ryde IT, Seidler FJ, Slotkin TA. Silver nanoparticles compromise neurodevelopment in PC12 cells:
critical contributions of silver Ion, particle size, coating, and composition. Environ Health Persp. 2011; 119:37–44.
[29] Romih T, Drasler B, Jemec A, Drobne B, Novak S, Golobic M, Makovec D, Susic R, Kogej K. Bioavailability of cobalt and iron from
citric-acid-adsorbed CoFe2O4 nanoparticles in the terrestrial isopod Porcellio scaber Sci Total Environ. 2015; 508:76-84.
[30] Tourinho PS, Van Gestel CAM, Jurkschat K, Soares AM, Loureino S. Effects of soil and dietary exposure to Ag nanoparticles and
AgNO3 in the terrestrial isopod Porcellionides pruinosus. Environ Pollut. 2015; 205:170-177.
[31] Tourinho PS, Van Gestel CAM, Morgan AJ, Kille P, Svendsen C, Jurkschat K, Mosselmans JFW, Soares AMVM, Loureiro S.
Toxicokinetics of Ag in the terrestrial isopod Porcellionides pruinosus exposed to Ag NPs and AgNO3 via soil and food.
Ecotoxicology. 2016; 25:267-278.
[32] Vijver MG, Wolterbeek HT, Vink JP, Van Gestel CAM (2005) Surface adsoprtion of metals onto the eartheorm Lumbricus rubellus and
the isopod Porcellio scaber is negligible compared to absorption on the body. Sci Total Environ 340:271-280.
[33] Dauwe T, Janssens E, Bervoets L, Blust R, Eens M. Relationships betwee metal concentration in great tit nestlings and their
environment and food. Environ Pollut. 20014; 131:373-380.
[34] Winter S, Streit B. Organichlorine compounds in a three-step terrestrial food chain. Chemosphere. 1992; 24:1765-1774.
[35] Shuman TW, Robel RJ, Zimmerman JL, Kemp KE. Variance in Digestve Efficinces of Four Sympatric Avian Granivores. The Auk.
1989; 106:324-326.
[36] Rstudio Team (2015). Rstudio: Integrated Development for R. Rstudio Inc., Boston, MA. http://www.rstudio.com/.
[37] McKillup, S., 2011. Statistics Explained: An Introductory Guide for Life Scientists. Cambridge University Press.
[38] Shapiro SS, Wilk MB. An analysis of variance test for normality (complete samples). Biometrika. 1965; 52:591-611.
[39] Levard C, Hotze EM, Lowry GV, Brown Jr GE. Environmental Transformations of Silver Nanoparticles: Impact on Stability and
Toxicity. Environ Sci Technol. 2012; 46:6900–6914.
[40] Whitley AR, Levard C, Oostveen E, Bertsch PM, Matocha CJ, Kammer FVD, Unrine JM. Behavior of Ag Nanoparticles in Soil:
Effects of Particle Surface Coating, Aging and Sewage Sludge Amendment. Environ Pollut. 2013; 182:141–149.
[41] Dewil R, Baeyens J, Roels J, De Steene BV. Environ Eng Sci. 2008; 25: 879-886.
[42] Migliorini M, Pigino G, Bianchi N, Bernini F, Leonzio C. The Effects of Heavy Metal Contamination on the Soil Arthropod
Community of a Shooting Range. Environ Pollut. 2004; 129: 331–340.
[43] Suthar S, Singh S. Bioconcentrations of Metals (Fe, Cu, Zn, Pb) in Earthworms (Eisenia Fetida), Inoculated in Municipal Sewage
Sludge: Do Earthworms Pose a Possible Risk of Terrestrial Food Chain Contamination? Environ Toxicol. 2009; 24:25–32.
[44] Del Toro I, Floyd K, Gardea-Torresdey J, Borrok D. Heavy Metal Distribution and Bioaccumulation in Chihuahuan Desert Rough
Harvester Ant (Pogonomyrmex rugosus) Populations. Environ Pollut. 2010; 158:1281–1287.
[45] Al-Salim N, Barraclough E, Burgess E, Clothier B, Deurer M, Green S, Malone L, Weir G. Quantum Dot Transport in Soil, Plants,
and Insects. Sci Total Environ. 2011; 409:3237–3248.
[46] Sauerbeck DR. Plant Element and Soil Properties Governing Uptake and Availability of Heavy Metals Derived from Sewage Sludge.
Water Air Soil Poll. 1991; 57:227–37.
[47] Wang H, Inukai Y, Yamauch A. Root Development and Nutrient Uptake. CRC Cr Rev Plant Sci. 2006; 25:279–301.
[48] Koo B-J, Chang AC, Crowley DE, Page AL, Taylor A. Availability and Plant Uptake of Biosolid-Borne Metals. Appl Environ Soil
Sci. 2013; Article ID 892036, 10 pages.
[49] Raskin I, Nanda Kumar PBA, Dushenkov S, Salt DE. Bioconcentration of Heavy Metals by Plants. Curr Opin Biotech. 1994; 5:285–
290.
Reddy MR, Dunn SJ. Accumulation of Heavy Metals by Soybean from Sludge-Amended Soil. Environ Pollut B. 1984; 7:281–295.
[50] Lee W-M, An Y-J, Yoon H, kweon H-S. Toxicity and bioavailability of copper nanoparticles to the terrestrial plants mung bean

International Journal of Environmental & Agriculture Research (IJOEAR) ISSN:[2454-1850] [Vol-3, Issue-5, May- 2017]
Page | 90
(Phaseolus radiates) and wheat (Triticum aestivum): Plant agar test for water insoluble nanoparticles. Environ Toxicol Chem. 2008;
27:1915-1921.
[51] Wang P, Menzies NW, Dennis PG, Guo J, Forstner C, Sekine R, Lombi E, Kappen P, Bertsch PM, Kopittke PM. Silver nanoparticles
entering soils via the wastewater-sludge-soil pathway pose low risk to plants but elevated Cl concentrations increase Ag
bioavailability. Environ SciTechnol. 2016; 50:8274-8281.
[52] Ma X, Geiser-Lee J, Deng Y, Kolmakov A. Interactions between Engineered Nanoparticles (ENPs) and Plants: Phytotoxicity, Uptake
and Accumulation. Sci Total Environ. 2010; 408:3053–3061.
[53] Zhao L, Peralta-Videa JR, Ren M, Varela-Ramirez A, Li C, Hernandez-Viezcas JA, Aguilera RJ, Gardea-Torresdey JL. Transport of
Zn in a Sandy Loam Soil Treated with ZnO NPs and Uptake by Corn Plants: Electron Microprobe and Confocal Microscopy Studies.
Chem Eng J. 2012; 184:1–8.
[54] Campbell NA, and J. B. Reece. 2005. “Biology. 7th.” Ed Pearson Benjamin Cummings. Cape Town (2005).