Complete Issue - International Journal of Environmental and ...
88
-
Upload
khangminh22 -
Category
Documents
-
view
7 -
download
0
Transcript of Complete Issue - International Journal of Environmental and ...


Page | i
Preface
We would like to present, with great pleasure, the inaugural volume-6, Issue-11, November 2020, of a
scholarly journal, International Journal of Environmental & Agriculture Research. This journal is part of
the AD Publications series in the field of Environmental & Agriculture Research Development, and is
devoted to the gamut of Environmental & Agriculture issues, from theoretical aspects to application-
dependent studies and the validation of emerging technologies.
This journal was envisioned and founded to represent the growing needs of Environmental & Agriculture as
an emerging and increasingly vital field, now widely recognized as an integral part of scientific and
technical investigations. Its mission is to become a voice of the Environmental & Agriculture community,
addressing researchers and practitioners in below areas.
Environmental Research:
Environmental science and regulation, Ecotoxicology, Environmental health issues, Atmosphere and
climate, Terrestric ecosystems, Aquatic ecosystems, Energy and environment, Marine research,
Biodiversity, Pharmaceuticals in the environment, Genetically modified organisms, Biotechnology, Risk
assessment, Environment society, Agricultural engineering, Animal science, Agronomy, including plant
science, theoretical production ecology, horticulture, plant, breeding, plant fertilization, soil science and
all field related to Environmental Research.
Agriculture Research:
Agriculture, Biological engineering, including genetic engineering, microbiology, Environmental impacts
of agriculture, forestry, Food science, Husbandry, Irrigation and water management, Land use, Waste
management and all fields related to Agriculture.
Each article in this issue provides an example of a concrete industrial application or a case study of the
presented methodology to amplify the impact of the contribution. We are very thankful to everybody within
that community who supported the idea of creating a new Research with IJOEAR. We are certain that this
issue will be followed by many others, reporting new developments in the Environment and Agriculture
Research Science field. This issue would not have been possible without the great support of the Reviewer,
Editorial Board members and also with our Advisory Board Members, and we would like to express our
sincere thanks to all of them. We would also like to express our gratitude to the editorial staff of AD
Publications, who supported us at every stage of the project. It is our hope that this fine collection of articles
will be a valuable resource for IJOEAR readers and will stimulate further research into the vibrant area of
Environmental & Agriculture Research.
Mukesh Arora
(Managing Editor)
Dr. Bhagawan Bharali
(Chief Editor)

Page | ii
Fields of Interests Agricultural Sciences
Soil Science Plant Science
Animal Science Agricultural Economics
Agricultural Chemistry Basic biology concepts
Sustainable Natural Resource Utilisation Management of the Environment
Agricultural Management Practices Agricultural Technology
Natural Resources Basic Horticulture
Food System Irrigation and water management
Crop Production
Cereals or Basic Grains: Oats, Wheat, Barley, Rye, Triticale,
Corn, Sorghum, Millet, Quinoa and Amaranth
Oilseeds: Canola, Rapeseed, Flax, Sunflowers, Corn and
Hempseed
Pulse Crops: Peas (all types), field beans, faba beans, lentils,
soybeans, peanuts and chickpeas. Hay and Silage (Forage crop) Production
Vegetable crops or Olericulture: Crops utilized fresh or whole
(wholefood crop, no or limited processing, i.e., fresh cut salad);
(Lettuce, Cabbage, Carrots, Potatoes, Tomatoes, Herbs, etc.)
Tree Fruit crops: apples, oranges, stone fruit (i.e., peaches,
plums, cherries)
Tree Nut crops: Hazlenuts. walnuts, almonds, cashews, pecans Berry crops: strawberries, blueberries, raspberries
Sugar crops: sugarcane. sugar beets, sorghum Potatoes varieties and production.
Livestock Production
Animal husbandry Ranch
Camel Yak
Pigs Sheep
Goats Poultry
Bees Dogs
Exotic species Chicken Growth
Aquaculture
Fish farm Shrimp farm
Freshwater prawn farm Integrated Multi-Trophic Aquaculture
Milk Production (Dairy)
Dairy goat Dairy cow
Dairy Sheep Water Buffalo
Moose milk Dairy product
Forest Products and Forest management
Forestry/Silviculture Agroforestry
Silvopasture Christmas tree cultivation
Maple syrup Forestry Growth
Mechanical
General Farm Machinery Tillage equipment
Harvesting equipment Processing equipment
Hay & Silage/Forage equipment Milking equipment
Hand tools & activities Stock handling & control equipment
Agricultural buildings Storage

Page | iii
Agricultural Input Products
Crop Protection Chemicals Feed supplements
Chemical based (inorganic) fertilizers Organic fertilizers
Environmental Science
Environmental science and regulation Ecotoxicology
Environmental health issues Atmosphere and climate
Terrestric ecosystems Aquatic ecosystems
Energy and environment Marine research
Biodiversity Pharmaceuticals in the environment
Genetically modified organisms Biotechnology
Risk assessment Environment society
Theoretical production ecology horticulture
Breeding plant fertilization

Page | iv
Board Members
Dr. Bhagawan Bharali (Chief Editor)
Professor & Head, Department of Crop Physiology, Faculty of Agriculture, Assam Agricultural University, Jorhat-
785013 (Assam).
Mr. Mukesh Arora (Managing Editor)
BE(Electronics & Communication), M.Tech (Digital Communication), currently serving as Associate Professor in
the Department of EE, BIET, Sikar.
Dr. Kusum Gaur (Associate Editor)
Dr. Kusum Gaur working as professor Community Medicine and member of Research Review Board of Sawai Man
Singh Medical College, Jaipur (Raj) India.
She has awarded with WHO Fellowship for IEC at Bangkok. She has done management course from NIHFW. She
has published and present many research paper in India as well as abroad in the field of community medicine and
medical education. She has developed Socio-economic Status Scale (Gaur's SES) and Spiritual Health Assessment
Scale (SHAS). She is 1st author of a book entitled " Community Medicine: Practical Guide and Logbook.
Research Area: Community Medicine, Biostatics, Epidemiology, Health and Hospital Management and Spiritual
Health
Dr. Darwin H. Pangaribuan
Associate Professor in Department of Agronomy and Horticulture, Faculty of Agriculture, University of Lampung,
Indonesia.
Educational background: (Ir.) from Faculty of Agriculture, IPB University, Bogor, Indonesia; (Dipl. Eng) in Land
Evaluation from the University of Tweente (UT-ITC), Enschede, The Netherlands; (M.Sc) in Crop Production from
Wageningen University (WU), The Netherlands. (Ph.D) in Horticulture from University of Queensland (UQ),
Brisbane, Australia.
Research Interest: Vegetable Production & Physiology; Biostimulant & Biofertilizers; Organic Farming, Multiple
Cropping, Crop Nutrition, Horticulture.
Dr Peni Kistijani Samsuria Mutalib
Working as Research coordinator and HOD in the department of Medical Physics in University of Indonesia.
Professor Jacinta A.Opara
Working full-time and full-ranked Professor and Director, Centre for Health and Environmental Studies at one of the
top 10 leading public Universities in Nigeria, the University of Maiduguri-Nigeria founded in 1975.
Dr. Samir B. Salman AL-Badri
Samir Albadri currently works at the University of Baghdad / Department of Agricultural Machines and Equipment.
After graduation from the Department of Plant, Soils, and Agricultural Systems, Southern Illinois University
Carbondale. The project was 'Hybrid cooling to extend the saleable shelf life of some fruits and vegetables. I worked
in many other subject such as Evaporative pad cooling.
Orchid ID: https://orcid.org/0000-0001-9784-7424
Publon Profile: https://publons.com/researcher/1857228/samir-b-albadri

Page | v
Dr. Goswami Tridib Kumar
Presently working as a Professor in IIT Kharagpur from year 2007, He Received PhD degree from IIT Kharagpur in
the year of 1987.
Prof. Khalil Cherifi
Professor in Department of Biology at Faculty of Sciences, Agadir, Morocco.
Dr. Josiah Chidiebere Okonkwo
PhD Animal Science/ Biotech (DELSU), PGD Biotechnology (Hebrew University of Jerusalem Senior Lecturer,
Department of Animal Science and Technology, Faculty of Agriculture, Nau, AWKA.
Prof. Özhan ŞİMŞEK
Agriculture Faculty, Department of Horticulture, Çukurova University, Adana, 01330 Turkey.
Dr. Anka Ozana Čavlović
Working as Professor in the department of Faculty of Forestry, University of Zagreb, Svetošimunska 25, Zagreb.
Dr. Rakesh Singh
Professor in Department of Agricultural Economics, Institute of Agricultural Sciences, Banaras Hindu University,
Also Vice President of Indian Society of Agricultural Economics, Mumbai.
Dr. Sunil Wimalawansa
MD, PhD, MBA, DSc, is a former university professor, Professor of Medicine, Chief of Endocrinology, Metabolism
& Nutrition, expert in endocrinology; osteoporosis and metabolic bone disease, vitamin D, and nutrition.
Dr. Ajeet singh Nain
Working as Professor in GBPUA&T, Pantnagar-263145, US Nagar, UK, India.
Dr. Salvinder Singh
Presently working as Associate Professor in the Department of Agricultural Biotechnology in Assam Agricultural
University, Jorhat, Assam.
Dr. Salvinder received MacKnight Foundation Fellowship for pre-doc training at WSU, USA – January 2000- March
2002 and DBT overseas Associateship for Post-Doc at WSU, USA – April, 2012 to October, 2012.
Dr. V K Joshi
Professor V.K.Joshi is M.Sc., Ph.D. (Microbiology) from Punjab Agricultural University, Ludhiana and Guru Nanak
Dev University, Amritsar, respectively with more than 35 years experience in Fruit Fermentation Technology,
Indigenous fermented foods, patulin ,biocolour ,Quality Control and Waste Utilization. Presently, heading the dept.
of Food Science and Technology in University of Horticulture and Forestry, Nauni-Solan (HP), India.
Dr. Mahendra Singh Pal
Presently working as Professor in the dept. of Agronomy in G. B. Pant University o Agriculture & Technology,
Pantnagar-263145 (Uttarakhand).

Page | vi
Dr. Vijay A. Patil
Working as Assistant Research Scientist in Main Rice Research Centre, Navsari Agricultural University, Navsari.
Gujarat- 396 450 (India).
Prof. Salil Kumar Tewari
Presently working as Professor in College of Agriculture and Joint Director, Agroforestry Research Centre (AFRC) /
Program Coordinator in G.B. Pant University of Agric. & Tech., Pantnagar - 263 145, Uttarakhand (INDIA).
Dr. S. K. Jain
Presently working as Officer Incharge of All India Coordinated Sorghum Improvement Project, S. D. Agricultural
University, Deesa, Gujarat.
Dr. Deshmukh Amol Jagannath
Presently working as Assistant Professor in Dept. of Plant Pathology, College of Agriculture polytechnic, NAU,
Waghai.
Mr. Anil Kumar
Working as Junior Research Officer/Asstt. Prof. in the dept. of Food Science & Technology in Agriculture &
Technology, Pantnagar.
Mr. Jiban Shrestha
Scientist (Plant Breeding & Genetics)
Presently working as Scientist (Plant Breeding and Genetics) at National Maize Research Programme (NMRP),
Rampur, Chitwan under Nepal Agricultural Research Council (NARC), Singhdarbar Plaza, Kathmandu, Nepal.
Mr. Aklilu Bajigo Madalcho
Working at Jigjiga University, Ethiopia, as lecturer and researcher at the College of Dry land Agriculture, department
of Natural Resources Management.
Mr. Isaac Newton ATIVOR
MPhil. in Entomology, from University of Ghana.
He has extensive knowledge in tree fruit orchard pest management to evaluate insecticides and other control
strategies such as use of pheromone traps and biological control to manage insect pests of horticultural crops. He has
knowledge in agronomy, plant pathology and other areas in Agriculture which I can use to support any research from
production to marketing.
Mr. Muhammad Farooq
Mphil (Food Technology) Gold Medalist
PhD Scholar, Food Science and Biological Engineering, Jiangsu University in China
Production Manager Zeal Food & Beverages Industry Aladand Road, Amandara Batkhela Malakand Agency KP. He
developed the skills for Preparation of different fruit pulp preserve Orange, Peach, Guava, Strawberry, and orange
squash, orange marmalade.

Table of Contents
S.No Title Page No.
1
Inoculation of (Prosopis Laevigata) by Arbuscular Mycorrhizal Fungi in Different Doses
of Organic Matter in Two Types of Soil
Authors: Abdul Khalil Gardezi, Sergio Roberto Márquez-Berber, Eduardo Valdés Velarde,
Manuel Ortega Escobar, Miguel Jorge Escalona-Maurice, Gabriel Haro-Aguilar, Mario Ulises
Larqué-Saavedra
DOI: https://dx.doi.org/10.5281/zenodo.4297161
Digital Identification Number: IJOEAR-NOV-2020-1
01-08
2
Cattle Ticks and Risk Factors Related to Tick Infestation of Livestock in Periurban
Farms in Southern Cote D'ivoire
Authors: Claude Aimée DIAHA-KOUAME, Valery Edgard ADJOGOUA, Marc Hermann
AKAFFOU, Egomli Stanislas ASSOHOUN, N'guessan Fidèle DIOBO, Konan Adjoua Rose
Marie Clémence KOUASSI
DOI: https://dx.doi.org/10.5281/zenodo.4297767
Digital Identification Number: IJOEAR-NOV-2020-2
09-15
3
Rubber Tree Cultivation and Improvement: Biological Aspects and the Risk of
Inbreeding Depression
Authors: Ong Chin Wei, Shamsul Bahri Abdul Razak
DOI: https://dx.doi.org/10.5281/zenodo.4297808
Digital Identification Number: IJOEAR-NOV-2020-3
16-24
4
Malting Sludges as Soil Amendment
Authors: Campaña, D.H., Airasca A.
DOI: https://dx.doi.org/10.5281/zenodo.4297824
Digital Identification Number: IJOEAR-NOV-2020-4
25-28
5
In-Vitro Studies of Different Culture Media and Biocontrol Agents on Growth and
Sporulation of Alternaria Alternata (Fr.) Keissler an Incitant of Broad bean (Vicia Faba
L.) Leaf Blight Disease
Authors: David Kamei, Archana U Singh
DOI: https://dx.doi.org/10.5281/zenodo.4297879
Digital Identification Number: IJOEAR-NOV-2020-5
29-36

6
The Impact of Population Growth on Natural Forests in Rwanda
Authors: Christine UWIRAGIYE, Abias MANIRAGABA
DOI: https://dx.doi.org/10.5281/zenodo.4297903
Digital Identification Number: IJOEAR-NOV-2020-6
37-41
7
Factors Influencing Adoption of New Irrigation Technologies on Farms in Morocco:
Application of Logit Model
Authors: Taoufik YATRIBI
DOI: https://dx.doi.org/10.5281/zenodo.4297914
Digital Identification Number: IJOEAR-NOV-2020-7
42-51
8
Evaluation of the Development of Roselle (Hibiscus Sabdariffa L.) in Two Soil Types with
Interaction of Bacterial Cells and Vermicompost
Authors: Abdul Khalil Gardezi, Oscar Eduardo Hernández Torres, Guillermo Carrillo
Castañeda, Sergio Roberto Márquez-Berber, Héctor Flores Magdaleno, Eduardo Valdés
Velarde, Mario Ulises Larqué Saavedra, Gabriel Haro Aguilar
DOI: https://dx.doi.org/10.5281/zenodo.4297920
Digital Identification Number: IJOEAR-NOV-2020-8
52-61
9
Heavy Metal Contamination in Soil of Industrial Area, Dewas, Madhya Pradesh, India
Authors: Reeta Kori, Alok Saxena, Harish Wankhade, Asad Baig, Ankita Kulshreshtha, Saket
Mishra, Smriti Sen
DOI: https://dx.doi.org/10.5281/zenodo.4297924
Digital Identification Number: IJOEAR-NOV-2020-9
62-69
10
Bacteriological Characteristics of Spring Water in Ambo Town, West Shoa Zone, Oromia
Region, Ethiopia
Authors: P. Sekhar
DOI: https://dx.doi.org/10.5281/zenodo.4297934
Digital Identification Number: IJOEAR-NOV-2020-11
70-78

International Journal of Environmental & Agriculture Research (IJOEAR) ISSN:[2454-1850] [Vol-6, Issue-11, November- 2020]
Page | 1
Inoculation of (Prosopis Laevigata) by Arbuscular Mycorrhizal
Fungi in Different Doses of Organic Matter in Two Types of Soil Abdul Khalil Gardezi
1*, Sergio Roberto Márquez-Berber
2, Eduardo Valdés Velarde
3,
Manuel Ortega Escobar4, Miguel Jorge Escalona-Maurice
5, Gabriel Haro-Aguilar
6,
Mario Ulises Larqué-Saavedra7
*1,4,6 Postgraduate College, Agricultural Science, Department of Hydrosciences, Montecillo Campus, Km. 36.5 Carretera Fed.
México-Texcoco, Montecillo, Texcoco, Estado de México, México, 56230. 2Crop Science Department, Chapingo Autonomous University, Km 38.5 Carretera Fed. México-Texcoco s/n, Col. Chapingo,
Texcoco, Estado de México, Mexico, 56230. 3Agroforestry Center for Sustainable Development, Chapingo Autonomous University, Km 38.5 Carretera Fed. México-
Texcoco s/n, Col. Chapingo, Texcoco, Estado de México,Mexico, 56230. 5Postgraduate College, Rural Development, Regional Geographic Analysis, Montecillo Campus, Km. 36.5 Carretera Fed.
México-Texcoco, Texcoco, Estado de México, México, 56230 7Metropolitan Autonomous University, Azcapotzalco, Mexico
*1Corresponding author: Dr. Abdul Khalil Gardezi, Postgraduate College, Agricultural Sciences, Department of
Hydrosciences, Montecillo Campus. Km. 36.5 Carretera Fed. México-Texcoco, Texcoco, Estado de México, México, C.P.
56230. Tel. 595-95-20200 ext. 1165, 1167 or 1171.
Abstract—The mesquite tree (Prosopis laevigata), besides its conventional uses, has a high potential to recover
agricultural areas with salinity problems. It improves the physical and chemical properties of the soil, and in the
rehabilitation of degraded arid and semi-arid zones, or those tending to desertification.The aim of this research was to test
the effect of organic fertilization and inoculation with Glomus sp. on mesquite trees. We did the experiment under
greenhouse conditions. The effect of applying Glomus sp. and organic matter in different doses during the growth of shoots
and roots was evaluated in 13 agronomic variables in mesquite seedlings grown in Lithosols and Xerosols soils. We used a
complete randomized block design with three replications. After 180 days, we analyzed the data using Statistical Analysis
Software (SAS) version 9.2. We observed a positive and significant effect on the growth of the agronomic variables studied
under greenhouse conditions, and inoculation with Glomus sp. The organic matter factor presented significant differences (p
≤ 0.05). We determined that the ideal dose was 55 g per experimental unit. According to the soil used, positive effects (p ≤
0.05) were observed for 50% of the agronomic variables in the Xerosols soil with relation to the Lithosols soil. We concluded
that the inoculation of Prosopis laevigata with Glomus sp., and adding organic matter favors the growth of both the shots
and the roots of the plant.
Keywords— Earthworms, Glomus sp., Lithosols soil, mesquite tree, vermicompost, Xerosols soil.
I. INTRODUCTION
Mesquite [Prosopis laevigata (Humb. Et Bonpl. ex Willd).M.C. Johnst.], has multiple uses: as wood for fuel (firewood and
coal), for construction of fences (live fences or walls of logs), for handicrafts and kitchen tools. Also, the use of its pods is for
forage and food. The industry uses its resins to manufacture glues, varnishes, and other solvents. The mesquite flowers are
very important for honey production because of the nectar bees collected from the trees. We can also use it as a medicinal
plant to treat different diseases (Meraz et al., 1998; Ríos-Gómez et al., 2010). Mesquite trees grow in the desert and semi-
desert regions of Mexico. We can find them along the central and southern Pacific coast, the arid regions of the northeast and
in the central highlands of Mexico (Sauceda et al., 2014).

International Journal of Environmental & Agriculture Research (IJOEAR) ISSN:[2454-1850] [Vol-6, Issue-11, November- 2020]
Page | 2
Mesquite trees and beans (Phaseolus vulgaris L.) are very important in the ecosystems because they can fix nitrogen and
their organic matter increases the fertility of the soil when incorporated. Thus, improving the nutrition of nearby plants
(Gardezi et al., 2016; López et al., 2010; Prieto-Ruiz et al., 2013).
Such an increase in organic matter also contributes to improving the stability and structure of the soil, reducing erosion of
marginal soils, degraded soils, and tepetates soils. Tepetates are indurated earthy materials from Mexico that have been
reported with different names in different countries in the USA is known as silcrete. The soil capacity for storage water
increases, as does the infiltration rate. Mesquite trees have one of the highest photosynthetic rates because of their optimal
use of nitrogen and water (Ruiz-Tavares, 2011).
Mesquite (P. laevigata.) is the only tree in the ecosystem that has a great potential to rehabilitate arid and semiarid regions
prone to desertification Gardezi et al., (2008). Also, it can recover agricultural lands with problems of salinity in the soil and
water.
Recently, there has been a growing trend to produce mesquite trees in degraded ecosystems for restoration (Prieto-Ruiz et al.,
2013). Around nine million plants of Prosopis laevigata and Prosopis glandulosa (Torr.) were produced in 2011 for
reforestation programs in Mexico per the National Forestry Commission (Comisión Nacional Forestal (CONAFOR), 2012).
On a different matter, the application of natural and biological fertilizers has received great interest by researchers because
they have increased yields with a reduced ecological footprint when compared with the chemical ones (Vessey, 2003;
Dadrasan et al., 2015). Vermicompost is compost produced when some earthworms (Eisenia foetida, Eisenia andrei,
Lumbricus rubellus, as an example) transform organic residues into a stable sub product (Soto and Muñoz, 2002). Also,
characterized by materials finely divided as peat, with high porosity, good drainage, and great moisture retention. It has a
large surface able to absorb and keep essential nutrients in forms easily assimilated by plants, such as nitrates, exchangeable
phosphorus, soluble potassium, calcium, and magnesium (Atiyeh et al., 2000a; Atiyeh et al., 2000b). The organic matter
added to the soil improves soil properties such as density, porosity, and the capacity of water absorption (Sree Ramulu, 2001;
Singh and Agrawal, 2007).
We have found that the dual inoculation with arbuscular mycorrhizal fungi (Glomus fasciculatum), and Rhizobium strains
helped trees from the genus Leucaena and Prosopisto mitigate the adverse effects of sodium chloride on the growth and
development of juvenile seedlings (Dixon et al., 1993). Therefore, the aim of this study was to test the effects of Glomus sp.,
and the application of organic matter on the shots and root growth of mesquite trees (Prosopis laevigata) in two different
soils.
II. MATERIALS AND METHODS
2.1 Experimental site description
The study was done under greenhouse conditions at the Postgraduate College, Montecillo Campus, State of Mexico, in the
spring and summer of 2017. We used two soil types, one red (Xerosols) and the other grey (Lithosols), with the
characteristics shown in Table 1. Lithosols soils limited in depth by continuous coherent and hard rock within 10 cm of the
surface. Xerosolssoils have a weak ochric A horizon and an aridic moisture regime; lacking permafrost within 200 cm of the
surface.We obtained the soil from Salinas, San Luis Potosi, Mexico (Fig. 1). The location of Salinas is 2,200 meters above
sea level, its geographical coordinates are Longitude: 22º 46 '32' ', Latitude: -101º 47' 06 ''.

International Journal of Environmental & Agriculture Research (IJOEAR) ISSN:[2454-1850] [Vol-6, Issue-11, November- 2020]
Page | 3
TABLE 1
ANALYSIS OF TWO TYPES OF SOILS
Soil SP EC pH OM N inorg P K Ca Mg Fe Cu Mn Zn
dS m-1
1:02 % mg kg-1
Xerosol (red) 28 0.54 8.3 1.78 35.27 0.85 477.04 6413.24 110.0 12.33 0.11 19.18 1.90
Litosol (gray) 34.7 0.65 7.07 2.05 28.86 1.07 453.58 2249.79 209.6 21.96 2.81 47.96 2.28
Key: SP=Saturation point, EC=Electric conductivity, pH= Hydrogen potential, OM= Organic matter, N inorg= Inorganic
nitrogen.
FIGURE 1: Soil sampled area at San Luis Potosi, Mexico
Source: Ministry of Communications and Transport. Mexico.
Soil sampled
area

International Journal of Environmental & Agriculture Research (IJOEAR) ISSN:[2454-1850] [Vol-6, Issue-11, November- 2020]
Page | 4
2.2 Soil analysis
We used the Walkey and Black method to determine the soil’s organic matter and the Olsen method for phosphorus. We
measured interchangeable bases using ammonium acetate pH 7:1 Normal (CH3COONH4) and micronutrients with
diethylenetriamine penta-acetic acid (D.T.P.A.).
2.3 Experimental materials
The seeds of Prosopis laevigata were collected from Acatlán, Hidalgo State, Mexico and the inoculation were done at
planting, mixing 5 g of sand with sorghum roots with 85% colonization of Glomus sp. and 1050 spores per 100 g of inert
material. The fungus was provided from the collection of the laboratory of microbiology, Department of Agricultural
Sciences, Postgraduate College. We applied two levels of mycorrhiza Glomus sp., (with and without Glomus). Then the
mesquite seeds were treated with mechanical scarification (scarification drum with fine sandpaper) for five minutes. Later on,
we put the seeds to germinate in foam trays with sterile red volcanic rock as a substrate.When the plants reached an average
height of 5 cm, they were transplanted to black polyethylene bags with 3kg of soil and pasteurized with steam water for 4
hours for two consecutive days.
We applied organic matter as a source of vermicompost, prepared by using 60 kg of bovine manure, 25 kg of melon waste,
and 15 kg of wheat straw. The mixture was subjected for four months to the action of earthworms. We put four doses of 0,
18.5 g, 37 g, and 55.5 g of vermicompost mixed in three kg bags. The equivalent of 0, 25, 50, and 75 t ha-1
of organic matter.
The study lasted 180 days, from planting until harvest, as recommended by Gardezi et al., 2009. Thirteen agronomic
variables were tested: plant height (cm), the number of branches, leaf area (cm2), the number of leaves, root length (cm), root
volume (cm3), root fresh weight (g), root dry weight (g), stem diameter (mm), leaves fresh weight (g), leaves dry weight (g),
shoot fresh weight (g), shoot dry weight (g). Length measurements were taken with a ruler, diameter with a caliper, weight
with an Ohaus digital scale model 605, and leaf area with a Li-Cor LI-3100C area meter.
2.4 Experimental design and treatments
A factorial arrangement with 16 treatments (4x2x2) was used with a randomized block design using three replications. An
analysis of variance for all variables registered was done using SAS Computer Software version 9.2, and a Tukey means
comparison test for the significant variables (Bautista-Calles et al., 2008).
III. RESULTS AND DISCUSSION
3.1 Primary effects
In this study, the treatments influenced all variables but root fresh weight (g). The inoculation of mycorrhiza presented the
same tendency. Regarding the application of organic matter, most variables but leaf area (cm2), the number of leaves, and
root fresh weight (g) had significant differences (p ≤ 0.05). The soils used in this experiment mainly affected the growth of
the shoot part (Table 2).
The inoculation with mycorrhiza interacted with the organic matter applied in growth of the mesquite plants measured in
plant height, the number of branches, root length, and root volume. Also, an interaction between the two soils used and
inoculation with Glomus sp. was found in plant height and the number of branches. An interaction between the two soils used
and the organic matter applied hada triple interaction of the organic matter, the soils, and the inoculation with Glomus sp. as
recorded in the number of branches. Therefore, the branching of the mesquite trees was the most sensitive variable to the
factors studied in this experiment (Table 2).
In a similar matter, it was found in another species of mesquite (Prosopis articulata), and in Parkinsonia microphylla a
positive response to (height, the number of branches, and stem diameter) to the inoculation with plant growth-promoting
microorganisms, arbuscular mycorrhizalfungi, and compost (Bashan et al., 2012).

International Journal of Environmental & Agriculture Research (IJOEAR) ISSN:[2454-1850] [Vol-6, Issue-11, November- 2020]
Page | 5
TABLE 2
EFFECT OF THE TREATMENTS ON THE VARIABLES MEASURED
Source of
variation
Degrees
of
freedom
Plant
height
(cm)
Number
of
branches
Leaf area
(cm2)
Number
of leaves
Root
length
(cm)
Root
Volume
(cm3)
Root
fresh
weight
(g)
Root
dry
weight
(g)
Stem
diameter
(mm)
Leaves
fresh
weight
(g)
Leaves
dry
weight
(g)
Shoot
fresh
weight
(g)
Shoot
dry
weight
(g)
Treatments 15 3330.9111* 4500.1875* 5410.0764* 4040.9097* 57.2097* 80.1875* 36.9973 0.662* 2.2627* 2.9654* 0.8904* 4.205* 1.1857*
Organic
matter (OM) 3 2461.8333* 2664.0208* 3677.9097 1721.6875 61.4097* 93.6875* 53.9969 1.0113* 1.9067* 4.4181* 1.6318* 5.813* 2.3528*
Soil 1 9075.0000* 12065.0208* 8295.0208* 7525.0208* 15.1875 20.0208 25.0708 0.0326 0.8008 7.5764* 1.3906* 0.6464 0.0729
OM x Soil 3 250.3889 1982.1875* 1900.5208 745.2431 8.8542 9.6319 32.1747 0.1828 0.0364 0.3116 0.3001 0.8526 0.2107
Glomus sp. 1 26226.7500* 22663.5208* 45325.5208* 33761.0208* 402.5208* 540.0208* 78.5664 4.0542* 21.3333* 19.9563* 5.542* 40.793* 9.4963*
OM
x Glomus sp. 3 828.1389* 2895.5764* 2138.5764 2948.3542 66.7431* 106.2986* 31.3733 0.6745 1.0311 0.2668 0.0575 0.1128 0.0908
Soil x Glomus sp.
1 3710.0833* 4200.0208* 180.1875 42.1875 2.5208 3.5208 21.7487 0.0188 0.6075 1.0121 0.0668 0.1553 0.1863
OM x Soil
x Glomus sp. 3 110.2500 1982.9653* 1399.7986 1013.1875 8.9653 3.4653 25.6463 0.073 0.7586 0.3154 0.1296 0.3818 0.0222
Error 32 592.8542 553.8958 1900.6458 1373.9167 15.9792 11.6875 21.7923 0.3165 0.5221 1.0169 0.3115 1.7548 0.3847
Coefficient
of variation 31.7200 40.3 40.91 36.11 17.09 139.36 49.78 22.7 50.63 42.79 46.25
*The numbers followed by an asterisk have significant differences (p≤0.05).

International Journal of Environmental & Agriculture Research (IJOEAR) ISSN:[2454-1850] [Vol-6, Issue-11, November- 2020]
Page | 6
3.2 Effect of the organic matter
There was a trend to have higher values in most of the variables recorded, with the application of vermicompost. However,
only the dry weight of the leaves had a significant difference between the control and the use of organic matter. Just plant
height, stem diameter, shoot dry weight, and root volume showed higher values with greater application of organic matter,
but the amount used did not have significant differences (p ≤0.05, Table 3). Taking into account all the variables, the medium
quantity of vermicompost used (37.5 g) can be recommended.
TABLE 3
EFFECT OF THE ORGANIC MATTER ON THE VARIABLES MEASURED
Organic matter *
Variables
X1 X2 X5 X6 X8 X9 X10 X11 X12 X13
55.5 91.667a 61.917ab 26.083a 24.75a 1.5417a 3.6333a 2.7567ab 1.2592a 3.8042a 1.8667a
37.5 84.417ab 77.083a 22.833ab 23.25a 1.0958ab 3.2667ab 3.0392a 1.3875a 3.5142ab 1.5050ab
18.5 71.75ab 52.667ab 24ab 21.5ab 1.0167ab 3.1667ab 2.7483ab 1.2008a 2.7975ab 1.1500b
0 59.167b 41.917b 20.667b 18.25b 0.8667b 2.6667b 1.665b 0.5617b 2.2667b 0.8425b
* Grams per experimental unit.
X1= plant height (cm), X2= number of branches X5= root length (cm), X6= root volume (cm3), X8= root dry weight (g),
X9= stem diameter, X10= leaves fresh weight (g), X11= leaves dry weight (g), X12= shoot fresh weight (g), and X13=
shoot dry weight (g).
Means with the same letter within the same column are statistically equal (Tukey, p ≤0.05).
It showed that the addition of organic matter to the soil increased the sustainability of the agricultural production. Organic
matter has several desirable properties such as high-water retention, elevated cationic exchange capacity, it improves the
availability of nutrients, and the ability to sequester contaminants (Aggelides and Londra, 2000; Weber et al., 2007;
Asgharipour and Rafiei, 2011). Therefore, vermicompost has great potential for agriculture and horticulture as a source of
nutrients (Atiyeh et al., 2000a; Atiyeh et al., 2000b).Also, the amount of compost applied improves the physical properties of
the soil(Aggelides and Londra, 2000).
3.3 Effect of the soil
The Xerosol soil promoted a significantly higher growth of the shoot part of mesquite plants (p ≤0.05, Table 4). The higher
quantity of inorganic nitrogen, potassium, and calcium (Table 1) contributed to the better development of the plants. The
quantity of nitrogen in the environment is a limiting factor for growth (Erisman, 2011).Phosphorous is another nutrient
important for plants, non-available on the soil (Raghothama, 1999; Hammond and White, 2008). However, it seems in
sufficient quantities in the Xerosols soils.
TABLE 4
EFFECT OF THE SOILS ON THE VARIABLES MEASURED
Soils Variables
X1 X2 X3 X4 X10 X11
Xerosol 90.5000a 74.2500a 119.7100a 115.1700a 2.9496a 1.2725a
Lithosols 63.0000b 42.5420b 93.4200b 90.1300b 2.1550b 0.9321b
X1= plant height (cm), X2= number of branches, X3= leaf area (cm2), X4= the number of leaves,X10= leaves fresh weight
(g), X11= leaves dry weight (g).
Means with the same letter within the same column are statistically equal (Tukey, p ≤0.05).
3.4 Effect of the mycorrhiza
The inoculation with Glomus sp. promoted higher root and shoot growth in the mesquite plants (Table 5). Gardezi et al.,
(2008) showed similar results with the inoculation of Glomus intrarradices in the same trees. They showed that high
absorption of mineral nutrients caused an improvement in the growth of the plants. Adding Glomus sp. increase the growth of
the trees in soils with lower P content, such as the case of the arboreous legume Acacia farnesiana (Gardezi et al., 1990).

International Journal of Environmental & Agriculture Research (IJOEAR) ISSN:[2454-1850] [Vol-6, Issue-11, November- 2020]
Page | 7
Glomus sp. can stimulate the growth of plants in a better way than phosphorous fertilization (Gardezi and Ferrera-Cerrato,
1992).
TABLE 5
EFFECT OF THE INOCULATION WITH GLOMUS SP. ON THE VARIABLES MEASURED
Glomus
sp.
Variables
X1 X2 X3 X4 X5 X6 X8 X9 X10 X11 X12 X13
Inoculated 100.1250a 80.1250a 137.2900a 129.1700a 26.2920a 25.2917a 1.4208a 3.8500a 3.1971a 1.4421a 4.0175a 1.7858a
Non inoculated 53.3750b 36.6670b 75.8300b 76.1300b 20.5000b 18.5833b 0.8396b 2.5167b 1.9075b 0.7625b 2.1738b 0.8963b
X1= plant height (cm), X2= number of branches, X3= leaf area (cm2), X4= leaves number, X5= root length (cm), X6= root
volume (cm3), X8= root dry weight (g), X9= stem diameter, X10= leaves fresh weight (g), X11= leaves dry weight (g), X12=
shoot fresh weight (g), and X13= shoot dry weight (g).
Means with the same letter within the same column are statistically equal (Tukey, p ≤0.05).
IV. CONCLUSION
In this study, the inoculation of Prosopis laevigata with Glomus sp. favored the growth of mesquite seedlings under
greenhouse conditions, shoot, and root growth increased. The Xerosols soils from the northern central highlands provided
better conditions for the shoot parts. The highest quantity of organic matter applied gave the largest increase in growth.
Therefore, we recommend the use of Glomus sp. in Xerosols soils with high quantities of organic matter for the production of
mesquite plants.
REFERENCES
[1] Aggelides, S.M., and P.A. Londra. 2000. Effects of compost produced from town water and sewage sludge on the physical properties
of a loamy and clay soil. Bioresource Technology.71 (3): (253-259). https://doi/10.1016/S0960-5824(99)00074-7.
[2] Asgharipour, M., and Rafiei, M. 2011. Effect of Different Amendments and Drought the Growth and Yield of Basil in the
Greenhouse. Advances in Environmental Biology. 5(6): 1233-1239. ISSN 1995-0756.
[3] Atiyeh, R. M. Subler, S., Edwards, C. A., Bachman, G., Metzger, J. D., and Shuster, W. 2000a.Effects of vermicomposts and
composts on plant growth in horticultural container media and soil. Pedobiologia.44, (5), 2000: 579-590.
https://doi.org/10.1078/S0031-4056(04)70073-6.
[4] Atiyeh, R. M., Arancon, N., Edwards, C. A. and Metzger, J. D., 2000b. Influence of earthworm-processed pig manure on the growth
and yield of greenhouse tomatoes. Biores. Technol.75 (3): 175-180. https://doi.org/10.1016/S0960-8524(00)00064-X.
[5] Bashan, Y., Salazar, B. G., Moreno, M. López, B. R., and Linderman, R.G. 2012.Restoration of eroded soil in the Sonoran Desert
with native leguminous trees using plant growth-promoting microorganisms and limited amounts of compost and water. Journal of
Environmental Management.102: 26-36. https://doi/org/10.1016/j.jenvman.2011.12.032.
[6] Bautista-Calles, F., Carrillo-Castañeda, G., y Villegas-Monter, A. 2008. Recuperaciónde la alta capacidad de germinación de la
semilla de papaya mediante la tecnología de preacondicionamiento y biorreguladores. Agrociencia (inSpanish). 42(7): 817-826.
versión On-line ISSN 2521-9766. versión impresa ISSN 1405-3195.
[7] Comisión Nacional Forestal (CONAFOR). 2012. Evaluación complementaria del PROCOREF. Ejercicio fiscal 2011. Universidad
Autónoma Chapingo (in Spanish).
[8] Dadrasan M., Chaichi M.R., Pourbabaee A.A., Yazdani D., and Keshavarz-Afshar R.2015. Deficit irrigation and biological fertilizer
influence on yield and trigonelline production of fenugreek. Industrial Crops Products.77: 145-162.
https://doi/10.1016/j.indcrop.2015.08.040.
[9] Dixon, R.K.; Garg, V.K. and Rao, M.V. 1993. Inoculation of Leucaena and Prosopis seedlingswith Glomus and Rhizobium species in
saline soil: Rhizosphere relations and seedling growth. Arid Soil Research and Rehabilitation.7(2):133-144.
https://doi/10.1080/15324989309381343.
[10] Erisman, J.W. 2011. The New Global Nitrogen Cycle in Ecological Aspects ofNitrogenMetabolism in Plants (Eds. J. C. Polacco and
C. D. Todd), John Wiley & Sons, Inc., Hoboken, NJ, USA. Pp. 5-15. https://doi/org/10.1002/9780470959404.ch1.
[11] Gardezi, A.K., J.D. Contreras D., J., Guzman-Plazola, R.A, and Ferrera-Cerrato, R., 1990.Growth of Acacia farnesiana associated
with mycorrhizal fungi in three types of Mexican soils. Nitrogen Fixing Tree Research Reports.8: 99-102.
[12] Gardezi, A.K. and R. Ferrera-Cerrato. 1992. Mycorrhizal inoculation ofCaesalpinea cacalaco.Nitrogen Fixing Tree Research
Reports.10: 116-118.
[13] Gardezi, A. K., Gardezi, H.S., Ojeda-Trejo, E. y Márquez-Berber, S.R. 2008.Respuesta a la inoculación de Glomus intraradix, materia
orgánica y dosis de fertilización fosfatada en el crecimiento de mezquite (Prosopis sp.). Agroproductividad (in Spanish).1(6): 24-28.

International Journal of Environmental & Agriculture Research (IJOEAR) ISSN:[2454-1850] [Vol-6, Issue-11, November- 2020]
Page | 8
[14] Gardezi, A.K., Exebio-Garcia, A., Mejia-Saenz, E., Ojeda-Trejo, E., Tijerina-Chavez, L.,Gardezi, Habibsha, and Delgadillo-Pinon, M.
2009. Sewage Water Irrigation and Growth Response of Leucaena leucocephala Inoculated withGlomus intrarradices and
Application of Organic Matter. Journal of Applied Science.9:1373-1377.URL: https://scialert.net/abstract/?doi=jas.2009.1373.1377.
[15] Gardezi, A.K., Márquez-Berber, S.R., Martínez-Menez, M., Flores-Magdaleno, H.,Escalona-Maurice, M.J., M.U. Larqué-Saavedra,
and G. AlmaguerVergas, 2016. Soil Contamination and its Effects on Beans (Phaseolus vulgaris L.) Growth Affected by Organic
Matter and Associated with Glomus intrarradices. European Scientific Journal,special edition: ESJ June 2016, Special Edition,107-
118. https://dx.doi.org/10.19044/esj.2016.v12n10p%25pOn-line version ISSN 1857-7431. Print version ISSN 1857-7881.
[16] Hammond, J.P., and White, P.J. 2008. Diagnosing phosphorus deficiency in cropplants. In: White, P.J., and J.P. Hammond (Eds.),
The Ecophysiology of Plant-Phosphorus Interactions. Plant Ecophysiology, vol 7. Springer, Dordrecht. Pp. 225-246.On-
line version ISBN 978-1-4020-8434-8. Print version ISBN: 978-1-4020-8435-5.
https://doi.org/10.1007/978-1-4020-8435-5_10.
[17] López H., J. A., J. C. Ríos S., J. C. Monárrez G., R. Rosales S., J. M. Mejía B. yV.Bustamante G., 2010. Tecnología disponible para la
obtención de semilla de mezquite en el norte de México. Folleto Técnico Núm. 45. Campo Experimental Valle del Guadiana. INIFAP.
Durango, Dgo. México (in Spanish).39 pp.
[18] Meraz V., S., J. Orozco V., J. A. Lechuga C., F. Cruz S. y J. Vernon C., 1998. Elmezquite,árbol de gran utilidad. Ciencias (in
Spanish).51: 20-21.
[19] Prieto Ruiz, J. A., Rosales Mata, S., SigalaRodriguez, J. A., Madrid Aispuro, R. E.,y Mejía Bojorques, J. M. 2013. Producción
de Prosopis laevigata (Humb, et Bonpl ex Wild) MC Johnst. con diferentes mezclas de sustrato. Revista Mexicana de Ciencias
Forestales (in Spanish). 4(20): 50-57. versión impresa ISSN 2007-1132.
[20] Raghothama, K.G. 1999. Phosphate acquisition. Annual Review of PlantPhysiology and Plant Molecular Biology.Vol. 50: 665–
693.https://doi/.org/10.1146/annurev.arplant.50.1.665.
[21] Ríos-Gómez, R., Salas-García, C.E., Monroy-Ata, A., and Solano, E. 2010. Salinityeffect onProsopis laevigata seedlings. Terra
Latinoamericana.28(2): 99-107.
[22] Ruiz Tavares, D. R. 2011. Uso potencial de la vaina de mezquite para laalimentaciónde animales domésticos del altiplano potosino.
Tesis de título facultad de maestría en ciencias ambientales (in Spanish). Universidad Autónoma de San Luis Potosí. 60
pp.URL:http://ninive.uaslp.mx/xmlui/handle/i/3648.
[23] Sauceda, R. E.N.; Rojo, M. G. E.; Ramírez, V. B.; Martínez, R. R.; Cong, H. M. dela C.; Medina, T. S. M. y Piña, R. H. H. 2014.
Análisis técnico del árbol del mezquite (Prosopis laevigata. & Bonpl. Ex Wild.) en México. Ra Ximhai (in Spanish). vol.10, núm. 3,
enero-junio, 2014, pp. 173-193.versión impresa ISSN 1665-0441.
[24] Singh, R.P. and Agrawal, M. 2007. Potential benefits and risks of land applicationof sewage sludge. Science Direct.28: 347-358.
https://doi.org/10.1016/j.wasman.20016.12.010.
[25] Soto, G., and Muñoz, C. 2002. Consideraciones teóricas y prácticas sobre elcompostysu empleo en la agricultura orgánica. Manejo
Integrado de Plagas(in Spanish). (Costa Rica). (65):123-129.
[26] Sree Ramulu, U.S., 2001. Reuse of municipal sewage and sludge in agriculture.Scientific Publishers, Jodhpur, India.
https://books.google.com.mx>books.
[27] Vessey J.K. 2003. Plant growth-promoting rhizobacteria as biofertilizers. Plant andSoil.255(2): 571 586.
https://doi.org/10.1023/A:1026037216893.Print version ISSN 0032-079XOn-line version ISSN 1573-5036.
[28] Weber, J., Karczewska, A. Drozd, J. Licznar, M.,Licznar S.,Jamroz, E., andKocowicz, A.2007. Agricultural and ecological aspects of
a sandy soil as affected by the application of municipal solid waste composts. Soil Biol. Biochem.39(6): 1294-1302.ISSN 0038-0717.

International Journal of Environmental & Agriculture Research (IJOEAR) ISSN:[2454-1850] [Vol-6, Issue-11, November- 2020]
Page | 9
Cattle Ticks and Risk Factors Related to Tick Infestation of
Livestock in Periurban Farms in Southern Cote D'ivoire Claude Aimée DIAHA-KOUAME
1*, Valery Edgard ADJOGOUA
2,
Marc Hermann AKAFFOU3, Egomli Stanislas ASSOHOUN
4,
N’guessan Fidèle DIOBO5, Konan Adjoua Rose Marie Clémence KOUASSI
6
*1,2,3Institut Pasteur de Côte d’Ivoire
4Laboratoire de mathématiques appliquées et informatique UFR-MI (UFHB), Côte d'Ivoire
5Université Félix Houphouët-Boigny, UFR Biosciences 22 BP 582 Abidjan 22, Côte d’Ivoire
6Université Nangui Abrogoua Abidjan, Côte d’Ivoire
Abstract— Tick-borne diseases are a global public health problem, particularly in sub-Saharan Africa, where most of the
disease is caused by malaria and many other diseases of viral, parasitic or bacterial origin. This study aimed to identify the
bovine tick’s species in cattle farms and to determine possible risk factors related to tick infestation in Abidjan district and
Azaguié commune. Thus, in July 2019, thirteen (13) herds distributed in these localities were visited for tick sampling and to
conduct epidemiological investigations. At each visit, ticks were harvested from 15 cattle per herd. All the farms visited were
infested with ticks. 96.92% of sampled animals had ticks. A total of 1796 ticks were collected of which 89.42% (1606) were
adults, 10.41% (187) were pupae and 0.17% (3) was larvae. Two species of ticks have been identified, Amblyomma
variegatum with 25% of the population and Rhipicephalus (Boophilus) microplus with 75%. 96% of the cattle were infested
by ticks of the species R. (B.) microplus and 56% of the cattle were infested by ticks of the species A. variegatum. The co-
infestation of cattle by the two identified species was 53%. The distribution of the sexes showed that in the species A.
variegatum, males were more numerous (13.44% for males and 8.76% for females). However in the species R. (B.)
microplus, females were more numerous (5.08% for males and 62.3% for females).The analysis of risk factors associated
with tick infestation in cattle has shown that factors such as Undefined parks, Type of pasture, Training in the use of
acaricides and Presence of wild animals contribute to major ectoparasite infestations in cattle. Tick samples collected from
peri-urban farms in the district of Abidjan and the locality of Azaguié as part of this study, indicate that the relatively recent
introduction of the species Rhipicephalus (Boophilus) microplus presents a threat to animal and human health.
Keywords— Ticks, Rhipicephalus (Boophilus) microplus, Risk factors, Côte d’Ivoire.
I. INTRODUCTION
Among the potentially emerging diseases, those transmitted by arthropods, particularly ticks, are very numerous. Ticks pose
a number of problems in human and veterinary health by their direct nuisance following their bites, but also by the infectious
agents they are likely to transmit (Aubry & Gaüzère, 2016). These ectoparasites play a major role in human and animal
epidemiology. Thus, they transmit a greater variety of pathogens than any other group of arthropods and are among the most
important vectors capable of infecting both humans and domestic animals (Boyard, 2007).Tick-borne diseases cause
enormous economic damage to livestock farmers and according to Guerrero et al., (2014), the economic impact of ticks is
major, especially in areas where cattle breeding is an important source of income. Also in terms of animal and human health,
the consequences can be fatal and can even lead to death if the intervention is late or even leave physical and cognitive after-
effects that can be very disabling if they are not treated early enough in humans.
To explain the spread of tick-borne diseases the study of the properties of the pathogen is therefore insufficient (Estrada-
Peñaet al., 2015). And according to Brownstein et al. (2005) the notion of acarological risk must be taken into account,
integrating both the notions of vector abundance in the environment and the prevalence of infection among the vector
population. Given the central role of the vector in explaining cases of tick-borne diseases, knowledge of its lifestyle and
distribution is an essential asset in the fight against these diseases. Tick-borne diseases pose real public health problems
around the world and particularly in sub-Saharan Africa, where most diseases have very often been overlooked in favour of
major viral or bacterial epizootics. In the district of Abidjan and its suburbs, there is strong demographic growth followed by
galloping urbanisation. According to United Nation estimates, urban dwellers accounted for one third of the world's
population in 1950, whereas they accounted for more than half in 2015 and will probably account for two thirds in 2050
(United Nations, 2014).In the face of this rapid urbanisation, previously isolated agricultural farms are now found close to the
houses. This proximity can thus pose a threat to the population because the human-animal interface is much reduced. In the

International Journal of Environmental & Agriculture Research (IJOEAR) ISSN:[2454-1850] [Vol-6, Issue-11, November- 2020]
Page | 10
general context of assessing the infectious risk of tick-borne pathogen transmission, it is necessary to study the distribution of
species present in an environment where human populations and farmed animals come into frequent contact. This study aims
to identify bovine tick species in peri-urban cattle farms in Abidjan district and Azaguié commune and to determine possible
risk factors related to ectoparasitic infestation.
II. MATERIAL AND METHODS
2.1 Study area
This study took place in the south of Côte d'Ivoire, precisely in the district of Abidjan and the locality of Azaguié. The
district of Abidjan is bordered to the south by the Atlantic Ocean. It has a humid tropical climate with two dry seasons (from
December to April, then in July and September) and two rainy seasons (from May to July, then in October and November)
(Tapsoba, 1995).The temperature varies between 24 and 31°C. The district of Abidjan has a surface area of 2119 km², with a
body of water representing about 15% of this surface. The district of Abidjan, the capital of Cote d'Ivoire, has a large part of
forest vegetation in the image of its Banco National Park and protected areas. Four communes in the district of Abidjan
(Cocody, Port-Bouet, Yopougon and Songon) and Azaguié commune were visited for sampling. In all these localities,
thirteen (13) peri-urban cattle farms were visited. All farms were georeferenced using a Garmin Etrex 20 GPS (Figure 1).
FIGURE 1: Location of farms
2.2 Sampling and conservation of ticks
In July 2019, thirteen (13) peri-urban cattle farms were visited. During each of these visits, for an average of 5 minutes per
animal, ticks were collected from 15 animals over one year old. A questionnaire was also submitted to the manager of each
farm in order to collect information on the farms and data that would allow us to characterize the different herds in our
sample. For the collection of ticks, the animals were restrained in the restraint corridors for those farms that had them and on
the ground for those that did not, with the support of farm workers. The ticks collected from each animal were placed in 10

International Journal of Environmental & Agriculture Research (IJOEAR) ISSN:[2454-1850] [Vol-6, Issue-11, November- 2020]
Page | 11
ml collection tubes containing 70% ethyl alcohol for preservation. Each tube was subsequently identified with a tag
indicating the location, date of collection, age, sex and identification number of the animal collected.
2.3 Collection of farm information
In order to describe the cattle tick population present on the farms visited and to establish the risk factors for cattle tick
infestations, a questionnaire was developed. This questionnaire included information on epidemiological data on the cattle on
the farm, and information on the environment. This questionnaire was completed at the time of tick harvesting and completed
during interviews with each farm owner or manager. This questionnaire includes the following information: physical
characteristics of cattle; overall health characteristics; habitat; feeding; geographical location by GPS; distance of farms from
human habitations; type of farm construction; number of people caring for animals; level of education of the people caring
for animals; health history of the farms; other domestic animals in vicinity of cattle; tick control; description of local ecology.
2.4 Ticks identification and conservation
After harvests, all samples were sent to laboratory of Institut Pasteur de Côte d’Ivoire (IPCI) for diagnosis. All adult
specimens, nymphs and larvae were identified by microscopic examination to confirm species and sex using standard
taxonomic keys. Thus identification was carried out according to stasis, genus and species. It was carried out using an
OPTIKA binocular magnifier (G x 10 or G x 20) and identification keys (Walker et al., 2003; Meddour-Bouderda &
Meddour, 2006; Apanaskevich &Horak, 2007; 2009).
2.5 Statistical analysis
The data collected was entered using Microsoft Office Excel version 2013. Data processing was carried out using R software
version 4.0.0 (multiplatform software: Windows, linux and Mac OS X downloadable at http://cran.r-project.org). The
Student t-test was used to compare means of two sample groups.
III. RESULTS
3.1 Frequency of tick genera and stasis of collected ticks
In thirteen farms visited, ticks were sampled from 195 cattle. Of these, 189 were tick carriers, representing an infestation rate
of 96.92%. The total number of ticks collected was 1796, of which 89.42% (1208) were adults, 10.41% (187) were nymphs
and 0.17% (3) was larvae. The identification revealed the presence of two (2) distinct genera. These are the genus
Amblyomma and the genus Rhipicephalus. All ticks of the genus Rhipicephalus belong to the subgenus Rhipicephalus
(Boophilus).
The distribution of different stasis in the genus Amblyomma and the subgenus Rhipicephalus (Boophilus) showed that in the
genus Amblyomma, males were more numerous with 13.44% and 8.76% for females. On the other hand, in the subgenus
Rhipicephalus (Boophilus), females were more numerous with 62.3% and 5.08% for males (Figure 2).
FIGURE 2: Frequency of Tick Stasis
0.00
10.00
20.00
30.00
40.00
50.00
60.00
70.00
AMB_M AMB_F AMB_N RHI (B.)_M RHI (B.)_F RHI (B.)_N
[13.44]%[8.76]%
[4.02]% [5.08]%
[62.30]%
[6.41]%

International Journal of Environmental & Agriculture Research (IJOEAR) ISSN:[2454-1850] [Vol-6, Issue-11, November- 2020]
Page | 12
AMB_M :male Amblyomma, AMB_F :female Amblyomma, AMB_N :nymph Amblyomma, RHI (B.)_M :male Rhipicephalus
(Boophilus), RHI (B.)_F :female Rhipicephalus (Boophilus), RHI (B.)_N :nymph Rhipicephalus (Boophilus)
3.2 Tick species identified
After identification of ticks, the two genera obtained were represented by one species each. The infestation rates of animals
by two tick species were 25% for Amblyomma variegatum (Fabricius, 1794) and 75% for Rhipicephalus (Boophilus)
microplus (Canestrini, 1888) (Figure 3).
FIGURE 3: Proportion of Tick Species
3.3 Infestation of Cattle by Ticks
Of all animals sampled, 96.92% had ticks. All infested steers were parasitized by the species Rhipicephalus (Boophilus)
microplus (96.92%) and 56% of beefs were infested by ticks of the species Amblyomma variegatum. The co-infestation of
cattle by two identified species was 53%.
TABLE 1
PREVALENCE, INTENSITY AND ABUNDANCE OF TICK INFESTATION IN CATTLE
Ticks number
Moyenne
(Ecartype) Min Med Max IQR (CV)
138.2 (71.4) 60 127 348 51 (0.5)
Ticks species Prévalence % a
Mean
intensityb
Mean abundancec % of beef infested
Rhipicephalus (Boophilus)
microplus 98,94 6,46 6,19 96,92
Amblyomma variegatum 57,67 3,65 2,04 53
a. Number of infested beefs by a tick species/number of infested beefs × 100
bNumber of collected tick species/number of infested buffaloes by a tick species
cTotal number of collected a tick species/total number of analyzed beefs
3.4 Analysis of the risk factors associated with cattle infestation by tick
Following the questionnaires submitted to each farm manager, a summary of the characteristics of farm, history of tick
infestation and pasture management is carried out in order to determine risk factors associated with tick infestation in cattle
for all farms. The student T-test applied to our data showed that four factors were significant. These were: undefined parks,
type of pasture, training in the use of acaricides and presence of wild animals (Table 2).
[25]% A.variegatu
m
[75]% R. (B.)
microplus

International Journal of Environmental & Agriculture Research (IJOEAR) ISSN:[2454-1850] [Vol-6, Issue-11, November- 2020]
Page | 13
TABLE 2
RISK FACTORS RELATED TO THE PRESENCE OF TICKS ON FARMS
Variable Modality Freqs (% of
Valid) Mean (sd) P value
Location of farm Dense vegetation 3 (23.1%) 149.3 (76.76)
0.469 Clear vegetation 10 (76.9%) 101(36.75)
Herd size Large (more than 150 heads) 4 (30.8%) 97.75 (30.71)
0.079 Small (less than 150 heads) 9 (69.2%) 156.11 (78.14)
Type of pasture Mixte 3 (23.1%) 93.67 (6.03)
0.049 Native 10 (76.9%) 151.5 (76.97)
Presence of wild animals No 3 (23.1%) 88.67 (25.01)
0.047 Yes 10 (76.9%) 153 (74.76)
Training in the use of
acaricides
No 12 (92.3%) 137.08 (74.42) 0.042
Yes 1 (7.7%) 151 (NA)
Effect of acaricides on ticks Effective 0 (0%) 0 (NA)
NA Not effective 13 (100.0%) 138.15 (71.36)
Type of speculation of
breeding
Meat 9 (69.2%) 151.78 (79.53) 0.414
Milk-meat 4 (30.8%) 107.50 (41.15)
Delimited park No 12 (92.3%) 144.67 (70.38)
0.042 Yes 1 (7.7%) 60 (NA)
Containment corridor Absent 10 (76.9%) 149.3 (76.76) 0.174
Present 3 (23.1%) 101.0 (36.76)
Education
Cannot read or write 10 (76.9%) 149.3 (76.76) 0.174
Can read and write 3 (23.1%) 101.0 (36.76)
Tick treatment
Some of the animals 12 (92.3%) 145.00 (70.38) 0.154
All animals 1 (7.7%) 60 (NA)
Treatment method used Manual sprayer 12 (92.3%) 145.00 (70.38)
0.154 Pour-on 1 (7.7%) 60 (NA)
Frequency of tick treatment Upon observation of ticks 13 (100.0%) 138.15 (71.36)
NA Every week 0 (0%) 0 (NA)
IV. DISCUSSION
Emerging diseases in humans are thought to be zoonoses in more than 60-70% of cases. Thus, faced with an increase in the
incidence of tick-borne diseases, it would be better to know the species of ticks present in our environment in order to be able
to control potential vector-borne diseases. This study on ticks in the district of Abidjan and the commune of Azaguié in the
south of Côte d'Ivoire has shown the presence of two genera which are: Amblyomma and Rhipicephalus. In Côte d'Ivoire,
these genera have also been highlighted in earlier work (Achi et al., 2011; Diaha-Kouamé 2013; Amoia, 2015; Diaha-
Kouamé 2017).In this study, the two genera obtained were represented by one species each, Amblyomma variegatum and
Rhipicephalus (Boophilus) microplus. The latter was the predominant species with a proportion of 75%. The work carried out
by Knopf et al. (1999) and Achi et al., (2011) showed that A. variegatum was the predominant tick species in cattle farming.
It should also be noted that in Côte d'Ivoire (CI), the species R. (B.) microplus was first identified in 2007 in Azaguié
(Madder et al., 2007). Since then, several studies have shown that this species is even in the majority in several large
breeding areas of Côte d'Ivoire (Madder et al., 2011; Touré et al., 2012; Diaha-Kouamé 2013; Boka et al., 2014, Amoia,
2015; Diaha-Kouamé, 2017).In this study we observed a decrease in the specific diversity of tick species. Indeed, previous
studies carried out in these regions had recorded several other species. Among these species, we noted the presence of other
species of subgenus Rhipicephalus (Boophilus) such as Rhipicephalus (Boophilus) decoloratus (Koch, 1844), Rhipicephalus
(Boophilus) geigyi (Aeschlimann & Morel, 1965) and Rhipicephalus (Boophilus) annulatus (Say, 1821). The fact is that
since the introduction of the species R. (B.) microplus in Côte d’Ivoire, these species have been identified in very small
proportions or even non-existent in certain farms (Madder et al., 2011; Touré et al., 2014; Diaha-Kouamé, 2017).This has
been observed in our study where we note a complete elimination of these species to the detriment of R. (B.) microplus which

International Journal of Environmental & Agriculture Research (IJOEAR) ISSN:[2454-1850] [Vol-6, Issue-11, November- 2020]
Page | 14
is the species newly introduced into Côte d'Ivoire. This study still shows the invasion capacity of R. (B.) microplus, as shown
by Madder et al. (2011)in the Azaguié region and also by Diaha-Kouamé, (2017) on the transhumance corridor between Côte
d'Ivoire and Burkina Faso where a small proportion of these species (0.02% for R. (B.) decoloratus, 0.49% for R. (B.)
annulatus and 0.30% for R. (B.) geigyi) were obtained. The importance of ticks lies in particular in the fact that they can be
vectors of disease. It is therefore important to be aware of their way of life, as well as the areas where animals are likely to
become infested, in order to control and prevent diseases transmitted by these mites. Very little is known about the risk
factors associated with the presence of ticks in cattle, particularly in the rapidly urbanising southern Côte d’Ivoire region.
In this study the analysis of risk factors associated with tick infestation in cattle showed that factors such as undefined parks,
type of pasture, training in the use of acaricides and presence of wild animals would contribute to major ectoparasite
infestations in these animals. The fact that the parks are not indefinite and the fact that the animals go to feed in the natural
environment favour frequent contact between farmed and wild animals. The presence of wildlife is then very strong in most
cases. And according to (Aubry & Gaüzère, 2016) the reservoir of several tick species is represented by wild rodents.
According to these authors, risk areas should be avoided through the use of marked paths for leisure activities in the forest
and contact with wild animals. It should also be noted that these increasing contacts between wild and domestic fauna and
humans are progressively favouring exchanges of pathogens that may have harmful sanitary consequences on the three
compartments. As is the case at the periphery of protected areas in southern Africa where these health risks are easily
manifested in cases where livestock co-exist with wildlife species that have co-evolved with major livestock pathogens (Jori,
2017). There is therefore a growing interest in the health of populations around the world in relation to these wild animal
species. According to (Wiethoelter et al., 2015), this progressive interest is justified by the fact that, generally speaking, the
global transformations of our planet have progressively favoured interactions between human and wild animals populations
and are shaping what is known as the interface between wild and anthropised environments. It is an interface in which
animals (wild and domestic) and humans interact and promote the circulation and transmission of their infectious agents. One
such disease is African Swine Fever (ASF) transmitted by a double-stranded DNA virus of the Asfaviridae family. Its
epidemiology and ecology includes both direct transmission between infected domestic pigs and/or wild boar and vector
transmission (by soft tick bites) (Jori, 2017).Further research is therefore needed to better understand the association between
the increasing environmental risk in the region and exposure to human disease and other emerging tick-borne infections
(Kulkarni et al., 2017). A study carried out in Brazil has shown that buffaloes reared in the municipality of Santarém have
different levels of tick and lice infestation depending on the direct influence of the characteristics of the Amazonian
ecosystem. Thus, the floodplain environment, which is widely used for buffalo breeding, contributed to minor ectoparasite
infestations in these animals (Batista et al., 2018).Measures to prevent tick-borne diseases include eliminating ticks by
applying acaricide to animals and reducing the habitat of ticks in the environment. Livestock farmers generally control ticks
because of the repugnance associated with heavy animal infestations but most are unaware that ticks can transmit diseases to
animals and more often than not the animals are carriers of pathogens but are asymptomatic. In this study the lack of training
in acaricide applications would contribute to the infestation of cattle. Indeed, the work of Furlong, (2004) showed that the
appearance and then the evolution of tick resistance to acaricides are due to the inappropriate use of chemical acaricides in
several regions. According to Aubry & Gaüzère, (2016) reducing and controlling tick populations is very difficult and that no
single measure is therefore sufficient to completely prevent tick infestation in environments where ticks are present, whether
in humans or animals. A study in livestock farms in northern Côte d'Ivoire showed that antibiotic doses and acaricide
dilutions were not appropriate for the treatment of animals. Under dilution and overdoses of the drugs were therefore more
observed (Yéo et al 2017). The lack of health monitoring in this type of livestock farming is frequent and represents a
considerable and neglected health risk.
V. CONCLUSION
The identification of tick species and the knowledge of possible risk factors related to ectoparasitic infestation are very
important in the framework of the fight against these parasites and the prevention of diseases that ticks can transmit. Two tick
species were identified in this study, Amblyomma variegatum with 25% of the population and Rhipicephalus (Boophilus)
microplus with 75%.The analysis of risk factors associated with tick infestation in cattle has shown that factors such as
undefined parks, type of pasture, training in the use of acaricides, presence of wild animals contribute to major ectoparasite
infestations in cattle. Entomological and microbiological monitoring is therefore necessary as it could help to anticipate an
epidemic event. Vector surveillance and tick control measures should therefore be improved as part of a One Health
approach. These initiatives will therefore need to be brought together in order to map the risk and distribution of ticks in Côte
d'Ivoire, as well as the pathogens they carry. This knowledge will be used to guide prevention and control actions.

International Journal of Environmental & Agriculture Research (IJOEAR) ISSN:[2454-1850] [Vol-6, Issue-11, November- 2020]
Page | 15
REFERENCES
[1] Achi YL, Koné P, Stachurski F, Betschart B. Impact des tiques sur des bovins métis dans le nord de la Côte d’Ivoire. Bulletin of
Animal Health and Production in Africa, 2012, 53 (2):139-145.
[2] Amoia C. Diagnostic des pratiques de lutte anti-tique et distribution spatiale de la tique invasive Rhipicephalus (Boophilus) microplus
(Canestrini, 1888) en Côte d’Ivoire. Mémoire de Master, Université Nangui Abrogoua Abidjan, 2015, 77 p.
[3] Aubry P, Gaüzère B A. Maladies transmises à l’homme par les tiques, Médecine vétérinaire 2016 10 p
[4] Baffi MA, De Souza GR, De Sousa CS, Ceron CR, Bonetti AM. Esterase enzymes involved in pyrethroid and organophosphate
resistance in a Brazilian population of Riphicephalus (Boophilus) microplus (Acari, Ixodidae). Mol Biochem Parasitol, 2008 ; 16: 70-
73.DOI: 10.1016/j.molbiopara.2008.03.009
[5] Batista H R, Sarturi C, Stelmachtchuk F N, Oliveira DR, Morini AC, Gennari SM, Marcili A, Bastos FAN, BarataLES, Minervino
AHH.Prevalence and risk factors associated with ectoparasite infestation of buffaloes in an Amazonian ecosystem Parasites &
Vectors; 2018, 11:335 https://doi.org/10.1186/s13071-018-2917-2
[6] Boka OM, Madder M, Achi YL, Kaboret YY, Berkvens D. Modélisation du remplacement de Rhipicephalus (Boophilus) decoloratus
par Rhipicephalus (Boophilus) microplus, une tique émergente en Côte d’Ivoire, European Scientific Journal, 2014 ; 10: 120-132.
DOI: 10.1007/s10493-017-0129-7
[7] Boyard C. Facteurs environnementaux de variation de l’abondance des tiques Ixodes ricinus dans des zones d’étude modèles en
Auvergne. Thèse de Doctorat, Universite Blaise Pascal, Universite d’auvergne, 2007, 233 p.
[8] Brownstein JS, Holford TR, Fish D. Effect of climate change on Lyme disease risk in North America. Ecohealth, 2005, 2: 38-46.
DOI: 10.1007/s10393-004-0139-x
[9] Diaha-Kouamé CA. Caractérisation des tiques le long du couloir de transhumance ivoiro-burkinabé et évaluation de l’activité
acaricide de quatre (4) plantes locales sur Rhipicephalus (Boophilus) microplus (canestrini, 1888). Thèse de Doctorat, Université Félix
Houphouet Boigny, Abidjan, 2017, 230 p.
[10] Diaha-Kouamé CA. Contribution à l’étude de la distribution des tiques infestant les bovins en Côte d'Ivoire. Mémoire de Master
Ecologie Tropicale, Université Félix Houphouët Boigny, Abidjan, 2013, 73 p
[11] Estrada-Peña A, Fuente J, Ostfeld RS, Cabezas-Cruz A. Interactions between tick and transmitted pathogens evolved to minimise
competition through nested and coherent networks, Scientific Reports, 2015, 5: 10361, DOi: 10.1038/srep10361
[12] Furlong J. Controle estratégico do carrapato dos bovines, A Hora Veterinaria,2004,23(137): 53-56.
[13] Guerrero FD, Andreotti R, Bendele KG, Cunha RC, Miller RJ, Yeater K, Pérez de León AA.Rhipicephalus (Boophilus) microplus
aquaporin as an effective vaccine antigen to protect against cattle tick infestations, Parasites & Vectors, 2014, (7): 475. doi:
10.1186/s13071-014-0475-9
[14] ICTTD. Ticks of veterinary and medical importance: Latin America, 2004.
[15] Jori MF, Faune sauvage et risques sanitaires en milieu tropical, Mémoire (HDR) Université de Montpellier-École doctorale
GAIA.2017, 181 p
[16] Knopf L, Komoin-Oka C, Zinsstag J. Le rôle du parasitisme dans les élevages bovins N’dama de la savane humide de la CI. Rapport
d’activité Centre Suisse de Recherches Scientifique en CI,1999,114 p.
[17] Kulkarni M, Kryuchkov R, Statculescu A, Thickstun C, Dibernardo A, Lindsay L, Talbot B. Distribution géographique de la tique
Ixodes scapularis et taux d’infection en 2017 à Ottawa (Ontario), Relevé des maladies transmissibles au Canada, 2018;44(10):269-75
https://doi.org/10.14745/ccdr.v44i10a02f
[18] Madder M, Thys E, Achi L, Toure A, De Deken R. Rhipicephalus (Boophilus) microplus: a most successful invasive tick species in
West-Africa. Exp Appl Acarol, 2011; 10493-010-9390-8. DOI: 10.1007/s10493-010-9390-8
[19] Madder M, Thys E, Geysen D, Baudoux C, Horak I. Boophilus microplus ticks found in West Africa. Exp Appl Acarol, 2007; 43:
233-234. DOI: 10.4102/ojvr.v74i1.133
[20] Meddour-Bouderda K, Meddour A. Clés d’identification des Ixodina (Acarina) d’Algérie. Sciences et Technologies, 2006 ; 4: 32-42.
[21] Peter RJ, Van Den BP, Penzhorn BL & Sharp B. Tick, fly, and mosquito control lessons from the past, solutions for the
future,Veterinary parasitology, 2005, 132, 205-215.
[22] Tapsoba S. Contribution à l’étude géologique et hydrogéologique de la région de Dabou (sud de la Côte d’Ivoire) : hydrochimie,
isotopie, et indice cationique de vieillissement des eaux souterraines. Thèse de doctorat 3ème cycles, Université de Cocody, 1995, 201
p.
[23] Toure A, Diaha CA, Sylla I, Kouakou K, Récente recomposition des populations de tiques prévalent en Côte d’Ivoire. International
Journal of Biology and Chemical Sciences, 2014 ; 284 (8): 566-578. DOI: 10.4314/ijbcs.v8i2.15
[24] Toure A, Komoin-Oka C, Sylla I. Cattle ticks population and prevalence of Babesia spp amongst it vector: Rhipicephalus (Boophilus)
microplus in a zone of Ivory Coast. International Journal of Biological and. Chemical Sciences, 2012 ; 6: 1514-1581.
[25] United Nations, World Urbanization Prospects The 2014 Revision, 2014, 517p
[26] Walker AR, Bouattour A, Camicas JL, Estrada-Pena A, Horak I, Latif A, Pegram R, Preston PM. Ticks of domestic animals in Africa:
a guide to identification of species, vol. 1, Bioscience Reports, Scotland, UK. 2003, 222 p.
[27] Yeo N, Karamoko Y, Soro D, Zouh Bi ZF & Traore SI.Elevages de bétail dans la région du Poro (Côte d’Ivoire) : Caractérisation et
modalités de lutte contre les pathogènes transmis par les tiques. International Journal of Bioloical and Chemical Sciences, 2017, 11(1):
237-246.DOI: 10.4314/ijbcs.v11i1.19.

International Journal of Environmental & Agriculture Research (IJOEAR) ISSN:[2454-1850] [Vol-6, Issue-11, November- 2020]
Page | 16
Rubber Tree Cultivation and Improvement: Biological Aspects
and the Risk of Inbreeding Depression Ong Chin Wei
1, Shamsul Bahri Abdul Razak
2
1Rubber Research Institute of Malaysia, Sungai Buloh, Selangor, Malaysia
2Universiti Malaysia Terengganu, Kuala Terengganu, Malaysia
Abstract— Rubber trees (Hevea spp.) are among the essential plants cultivated and have contributed to Malaysia’s
economy growth for many decades. Latex harvested from rubber trees is an irreplaceable raw material and accounts for a
wide range of uses in tires, tubes, footwear, rubber gloves, and other rubber-based products. There were many attempts to
produce ideal rubber tree for increasing latex yield production through the improvement programmes since 1950s. However,
the risk of inbreeding depression and the planting materials produced from the chosen parents that are closely related in the
improvement programmes is fairly high. Inbreeding depression caused discouraging effects such as uneven bark surface, leaf
disease infection, easily damaged by wind blows and eventually reducing the production of latex yield overall. This review
highlights the important of biological aspects for latex production in rubber tree and seeing minimizing the risk of
inbreeding depression with the necessity of broader genetic base in the rubber tree cultivation and improvement
programmes.
Keywords— Inbreeding depression, genetic base, rubber.
I. INTRODUCTION
Genus of Hevea belongs to the Euphorbiaceae family, mainly climber herbs, shrubs, and trees. It is among the largest
families of plants, comprising over 230 genera and 5,700 species. Generally specified in the grasslands, Euphorbiaceae has
the most vegetation types, including grain forest trees, weeds, and succulents. In South America, Hevea trees can be found in
forests in Brazil, Bolivia, Colombia, Ecuador, French Guiana, Guyana, Peru, Suriname, and Venezuela (Webster and
Paardekooper, 1989; Schultes, 1990; Priyadarshan, 2011). The successful transplantation and domestication of rubber trees
from the Amazon forest has allowed Malaysia to play an essential role as one of the most critical natural rubber suppliers in
the world for the past several decades. According to a report by the Malaysian Rubber Board (MRB) in 2019, the estimated
total production of natural rubber in 2019 from smallholdings and estates in Malaysia was recorded to be 639,000 tons. The
total export value of natural rubber and rubber products amounted to approximately RM 40 billion (Natural Rubber Statistics
2019, http://www.lgm.gov.my/nrstat). The primary destinations for raw rubber exports in 2019 were China, Germany,
Finland, Iran, the USA, and other countries. In recent trends, the high global demand for natural rubber is a positive sign and
robust progress for many rubber-producing countries such as Malaysia.
II. RUBBER TREE CULTIVATION AND IMPROVEMENT IN MALAYSIA
The most famous event in natural rubber history was the considerable amount of natural rubber produced by plantations to
meet the Industrial Revolution's demand. Currently, the use of natural rubber has triumphed from diverse domestic products,
to those used in industry. Natural rubber is the polymers’ chain that displays high resilience and impact resistance, elasticity,
and low heat swelling during production process. Due to the distinct molecular structure of rubber, it is difficult to be
matched by synthetic rubber that is extracted from petroleum sources. It began in 1876 when Henry Wickham collected
approximately 70,000 rubber seeds, primarily H. brasiliensis, near the Tapajos River in Brazil, and attempted to sow them in
the UK. These small seedling populations were then transported to Ceylon (Sri Lanka) and Singapore in 1876. During the
transportation journey, only 22 seedlings survived, and arrived in Kuala Kangsar in 1877. The 22 seedlings in Kuala Kangsar
constitute the genetic base for rubber planting materials in The Federation of Malaya (Ong et al., 1983; Baulkwill 1989;
Barlow 1978; Loadman 2005, MRB 2005). In 1957, the Rubber Research Institute of Malaya, later known as the Rubber
Research Institute of Malaysia (RRIM), launched its major Hevea improvement program. RRIM initiated with a small
organization with only a few divisions, and took over the responsibility for research and support of works related to rubber
from the Department of Agriculture, Malaysia. It has established several experimental stations in Selangor and Johor to
provide technical support, services, and Hevea improvement programs in the country (MRB, 2005). Before the 1950s,
seedlings that were germinated from rubber seeds were widely recognized as planting materials by either rubber plantations

International Journal of Environmental & Agriculture Research (IJOEAR) ISSN:[2454-1850] [Vol-6, Issue-11, November- 2020]
Page | 17
or smallholdings. Generally, seedling trees can produce different yields and unpredicted characteristics. However, seeds
obtained from the established RRIM experimental gardens are considered useful and highly recommended for planting in
quality (Mass, 1919; Cramer, 1924; Holder and Heusser, 1928; Heuser 1932; RRIM, 1957).
In the 1950s, bud grafting was tested and recognized as a useful technique in which clonal seedlings produced a high amount
of latex from the planting materials, including Tjirandji 1, RRIM 501, RRIM 526, AVROS 157, and PR 107 (RRIM, 1952;
Webster and Baulkwill, 1989). Subsequently, the planting materials derived from bud-grafting rapidly substituted the
unselected seedlings from the experimental seed gardens (Burkill, 1959; Priyadarshan, 2011). Rubber planting guidelines
began with the first introduction in 1957, and provided information and evidence on high yielding planting materials, disease
resistance, and wind damage incident in Malaysia's rubber growing areas (Ong et al., 2011). PB 86, Tjirandji 1, RRIM 501,
RRIM 513, and GI 1 were recognized as excellent planting materials at the time, and were recommended for wide-scale
planting in Malaysia. In 1967, the RRIM 500 clone series was replaced by the RRIM 600 clone series; which later emerged
to be the most popular planting materials for several decades (RRIM, 1959; RRIM, 1961; RRIM, 1963; RRIM, 1967;
Shepherd, 1969). Later, numerous rubber-planting materials were introduced in the 1970s, including RRIM 709, RRIM 801,
IAN 873, PB, and 230, PB 243, PB 253, PB 254, PB 259, PB 262, PB 310, PB 311, and PB 312. However, all of these
planting materials were derived from the parent trees of H. brasiliensis (RRIM, 1975; RRIM, 1977).
In 1980-1997, RRIM planting recommendations were reported to detect major leaf diseases, soil categorization, and wind
damage incidents. Planting materials were classified into three primary categories and grouped into Classes I, II, and III. This
planting recommendation highlighted Class I planting materials for a wide area of planting. RRIM 600, RRIM 712, GT 1, PB
217, PB 260, PR 255, and PR 261 were highly recommended for planting from 1980 to 1994 (RRIM, 1980; RRIM, 1983;
RRIM, 1986; RRIM, 1989). RRIM thus tested several rootstocks with proven performance like the PB 5/51 and the RRIM
623, which produced a high survival rate when bud-grafted with commercial planting materials such as GT 1, RRIM 605,
RRIM 712, RRIM 901, PB 217, and PB 235 (RRIM, 1983; RRIM, 1986; RRIM, 1992). In 1995-97, MRB planting
recommendations emphasized the selection of Latex Timber Clones (LTC) as suitable planting materials for producing high
latex yields and rubberwood through their breeding programs. Latex yield remains the most auspicious characteristic, while
rubberwood production was another aspect of planting LTC (RRIM, 1995; Ong and Nasaruddin, 2011; Ratnasingam et al.,
2011). Currently, commercial planting materials typically originate from the Large Scale Clone Trials (LSCT) such as RRIM
901, RRIM 908, RRIM 911, RRIM 921, RRIM 936, RRIM 940, PB 260, PB 350, PB 355, PB 359, and PB366 (Ramli et al.,
1996; MRB, 2006; MRB, 2009). The typical commercial planting materials were developed from H. brasiliensis ever since
then and were extensively cultivated in Malaysia.
III. BIOLOGICAL ASPECTS FOR YIELD PRODUCTION
3.1 Flowers and Fruits
Rubber trees and other Hevea species have a diploid number of chromosomes (2n = 36) (Ong, 1981; Webster and
Paardekooper, 1989; Vinod and Meenattoor, 1991). The standard features of Hevea species include prominent trifoliate
leaves with separated male and female flowers at the same inflorescence and a trilocular capsule fruit pod, containing three
seeds and latex in almost all parts of the tree. The inflorescence has multiple branches and panicles with both male and
female flowers. The female flowers are produced at the end of the branches, while the male counterparts are born on other
panicle parts. After five years of planting, they begin to blossom, but rarely open together, encouraging cross-pollination
(Barlow, 1978). Insects usually pollinate the flowers, and cross-pollination is common in rubber trees. Five months after the
female flowers are pollinated and fertilized, they ripen as a trilocular capsule of fruit pods that explode and eventually
disseminate the seeds (Barlow, 1978; Webster and Paardekooper, 1989).
3.2 Bark
Natural rubber or latex is harvested by cutting the outer layers of the bark structure of a rubber tree where a group of specific
cells known as laticifers (commonly known as latex vessels) are located in the inner bark (Shamsul Bahri, 2000). The bark
structure consists of several distinct soft and hard layers. Soft bark is the thin layer of cells that produces rows of cells as
concentric cylinders of parenchymatous tissues and tube cells that eventually form the laticifers. The laticifers are arranged in
regular rows that are nearly parallel to the cambium that ultimately routes up in a tree trunk. Meanwhile, hard bark is the

International Journal of Environmental & Agriculture Research (IJOEAR) ISSN:[2454-1850] [Vol-6, Issue-11, November- 2020]
Page | 18
waterproof layer with an abundance of stone cells and active phellogen, forming a cork layer that hardly produces latex
(Barlow, 1978; Gomez, 1982).
3.3 Leaves
The leaves are typically arranged into three leaflets on a rubber tree, sometimes with prominent leaf stories and canopies, and
often experience leaf defoliation once a year (Webster and Paardekooper, 1989; Schultes, 1990). Features such as the leaf
shape and orientation allows the identification of different planting materials observed in H. brasiliensis (Md.Zain et al.,
1997; Mercykutty et al., 2002). Leaf characteristics in the plant kingdom usually show higher dissimilarities in
morphological appearance than those of the stems and roots; leaf shape and venation architecture are particularly useful
identification features (Dale et al., 1971; Hickey, 1973; Dickinson et al., 1987). Hickey (1979) and Mercykutty et al. (2002)
found the essential morphological features for the classification of specific plant species in a type like a leaf shape, leaf size,
leaf venation pattern, leaf margin, and the shape of the leaf’s tip and base. In budwood nurseries, the leaf's presence for
clonal identification is particularly important to ensure the propagation of correctly identified planting materials. More than
200 rubber budwood nurseries currently exist in the country country, and the private and public sectors annually produce
nearly 1 million clonal polybag plants (Shamsul Bahri et al., 2013).
3.4 Stomata
The guard cells are specialized epidermal cells assisted by subsidiary cells in a normal condition, where the contraction and
expansion of the stomata for gas exchange occurs during photosynthesis. Stomata actively open and close during the
daytime, due to a response to light intensity, carbon dioxide concentration, and humidity, with the aid of surrounding cells.
Several stomata classifications are proposed for Hevea; primarily based on the evolution of related ontogeny structures
(Metcalfe and Chalk, 1950; Esau, 1977; Hickey, 1979; Patel, 1979; Baranova, 1992; Das, 2002; Carpenter, 2005). However,
the most commonly accepted classification of stomata is based on the mature stomata and subsidiary cells proposed by
Metcalfe and Chalk (1950). In general, several types of stomata in dicotyledonous plants are classified based on the number
and arrangement of the subsidiary cells into anisocytic, anomocytic, actinocytic, cyclocytic, diacytic, and paracytic groups.
Anisocytic type stomata are surrounded by only three subsidiary cells that vary in their position, shape and size, and are
distinctly smaller than the other two. Stomata of the anomocytic type are surrounded by many subsidiary cells that are
irregular in shape and size. Moreover, actinocytic type stomata are surrounded by at least four or more subsidiary cells. On
the other hand, the diacytic type stomata are surrounded by a couple of distinct or indistinct subsidiary cells that are at right
angles to the guard cells. The cyclocytic type stomata are surrounded by several subsidiary cells encircling the guard cells. In
contrast, in the paracytic type of stomata, stomata are surrounded by two subsidiary cells that are arranged parallel to them.
3.5 Laticifers
Latex is harvested by systematically removing the external bark layers of rubber trees. Gomez (1981) and MRB (2005) stated
that the anatomical organization of the bark structure of Hevea could be divided into two distinct layers of the internal soft
zone (closer to the cambium) and the external hard zone (stone cells and cork). In Hevea, the laticifer is developed mainly in
the soft bark layer in which latex is produced, and the laticifers are successively produced in the cambium region. However,
in previous research, the rubber plant breeders paid little attention to describing the bark surface and several laticifers in
Hevea species (Frey-Wyssling, 1930, RRIM, 1957; RRIM, 1963, RRIM, 1994). The laticifers' functions are speculated as
latex production, physiological activities, cellulose content production, protection against insect attacks, and contribution in a
transportation pathway (Pakianathan et al., 1989; Kutchan, 2005; Pickard, 2008; Konno, 2011). Esau (1965) and Shamsul
Bahri (2000) distinct that rubber tree laticifers as a series of articulated fused cells that sustain latex and form systems that
penetrate the plant body via various tissues. There exist other plant species that also comprise similar laticifer systems,
including Papaver and Lactuca (lettuce) species. Meanwhile, non-articulated laticifers are produced from individual cells
and develop into branched or unbranched tube-like structures where these type of laticifers are not fused (de Fay and Jacob,
1989; Shamsul Bahri, 2000; Hagel et al., 2008).
3.6 Rubber Particles
Rubber particles derived from H. brasiliensis are described as the hydrophobic center of cis-1, 4-polyisoprene surrounded by
complex lipoprotein layers with two types of rubber particle proteins known as Rubber Elongation Factor (REF) and Small
Rubber Particle Protein (SRPP) (Siler et al., 1997; Cornish et al., 1999; Nawamawat et al., 2001). In Hevea latex, REF and
SRPP range from 117 to 298 amino acids with molecular weights of 14.5 and 24-kiloDaltons (kDa) respectively. REF and
SRPP are vital proteins taking part in latex production initiation in rubber trees (Oh et al., 1999; Wood and Cornish, 2000;

International Journal of Environmental & Agriculture Research (IJOEAR) ISSN:[2454-1850] [Vol-6, Issue-11, November- 2020]
Page | 19
Cornish, 2001; Wititsuwannakul et al., 2008). The variations in the surface protein contained in Hevea plant were indicated
by studies on Large Rubber Particles (LRPs) and Small Rubber Particles (SRPPs), mainly for commercial planting materials,
but no direct links were made between rubber-formed particles size and molecular weight suspended in latex, and surface
proteins (Cornish, 1993; Wood and Cornish, 2000; Sight et al. 2003). According to Paardekooper (1989), latex collected
from Hevea is a cytoplasm that is rich of mainly rubber particles and other cell organelle such as plutoids in which rubber
particles are made of a group of polymer chains that are bound together by a glycoprotein membrane. Additionally, lipids
membranes, proteins, and other substances surround rubber particles in Hevea (Cornish et al., 1993). The rubber particles'
surface comprises various types of enzymes, binding undertaking sites for latex biosynthesis (Oh et al., 1999; Kang et al.,
2000; Singh et al., 2003). Previous studies on latex and rubber particles were primarily focused on the consistency aspects
such as dry rubber content percentage, mechanical stability, Wallace plasticity, Mooney viscosity, and plasticity retention
index relevant to rubber growers and smallholdings in Malaysia (Yip, 1990; Bonfils et al., 2000; Ong, 2000).
3.7 Seeds
Rubber seeds are vital for producing seedling planting materials and as rootstock for bud-grafting of high-yield clones in
natural rubber-producing countries. There is one or sometimes two seed fall seasons a year in many rubber-producing
countries such as Malaysia. A mature rubber tree can be identified by patterns on the seed coat that display noticeable
differences in size and color. The rubber seed coat characteristics are inherited from the female parent. The rubber seeds
originating from the same female parent are identical, irrespective of the pollen source, although seed size may vary because
of the growth environment (Lacey et al., 1997; Mercykutty et al., 2002). Thus, a visual description of the variations on the
seeds’ morphological characteristics can be utilized to verify the authenticity of the planting material (Mercykutty et al.,
2002; Md.Zain et al., 2003). Each rubber seed has its dorsal and ventral sides. The dorsal side is convex with a central ridge,
while the ventral side is nearly flat with lateral cheeks. The seed coat color among planting materials may vary from grey to
light brown, brown, and dark brown. The presence of mottling of deep brown or greyish brown shades on the seed coat is
evident in different planting materials of H. brasiliensis (Md.Zain et al., 2003).
3.8 Rootstock-Scion Compatibility
The observation of planting materials’ latex yield with specific rootstock resulted in several findings to evaluate the rootstock
effects. Several attempts were made to select elite rootstocks that enhanced scion growth and overall yield performance
(Djikman, 1951; Buttery, 1961). Several seedling families and commercial planting materials were tested as rootstock. The
majority exhibited strong evidence of high latex yield and diverse rootstock dynamic form (Buttery 1961). More recent
experiments tested several commercial planting materials such as PB 5/51, RRIM 600, RRIM 628, SG 170, RRIC 52, and 48
E/130, grafted on the rootstocks derived from PB 5/51, RRIM 623, RRIM 600, RRIM 501, Tjir 1 and unselected seedling as
an initial screening for elite rootstock (Ng et al., 1982; Ng, 1983). Ng et al. (1983) demonstrated that rootstocks derived from
H. brasiliensis could significantly influence the scions' growth and production through rootstock-scion interaction. Although
plant breeders emphasized the selection of rootstock capacity before bud grafting from RRIM since the 1980s (Leong and
Yoon, 1979; Ng et al., 1982; Ng, 1983), there exist no specific standardized criteria for rootstock selection, particularly after
the replacement of PB5/51, RRIM 501 and RRIM 603 by newly planting rootstock (RRIM 1992; RRIM 1994). Nowadays, it
is common for seeds to be collected from various sources without knowledge about their origin or rootstock-scion
compatibility.
IV. GERMPLASM RESOURCES
Rubber plant breeders from the Rubber Research Institute of Malaysia have been attempting to resolve the narrow genetic
basis of rubber plants in the country, including the conservation of germplasm and planting material exchange exercises with
other countries. There might be several attempts to apply the rubber genetic resources by private plantations and
smallholdings over the past few decades, but there remains a lack documentation and clarity in records of the improvement
programmes in germplasm availability and utilization.
4.1 Seedling Trees Exchanged Programmes in the 1950s
In 1951-52, RRIM introduced several Hevea seedlings from Brazil, including H. brasiliensis, H. spruceana and H.
benthamiana. These seedling trees displayed strong resistance against the South American Leaf Blight (SALB) disease that
attacked rubber trees in South America. However, the main objective was to employ these seedlings for high latex production
in the RRIMM breeding programs. The progress of identifying potential planting materials from Hevea species was halted

International Journal of Environmental & Agriculture Research (IJOEAR) ISSN:[2454-1850] [Vol-6, Issue-11, November- 2020]
Page | 20
for several years, attributable to their low yields and poor growth, compared to commercial planting materials such as RRIM
Clone Series (RRIM, 1952; RRIM 1957; Ong and Tan, 1987).
4.2 Hevea Germplasm 1967
About 100 rubber trees originated from the Amazon and were brought to Malaysia, including species of H. brasiliensis, H.
benthamiana, H. camargoana, H. guianensis, H nitida, H. pauciflora, H. spruceana, and H. rigidifolia. These trees were
planted and tested in a small plot area at the RRIM Research Station, Sungai Buloh. Ong (1977) concluded that these Hevea
species were inferior in latex production and morphological characteristics, including bark renewal and commercial planting
materials. However, the reporting and improvement programs on these Hevea species have remained unclear, with few
publications and limited information publicly available to rubber planters and growers in Malaysia.
4.3 Hevea Germplasm 1981
In 1981, the International Rubber Research and Development Board (IRRDB) and the Brazilian Government initiated a joint
expedition to collect Hevea seeds and budwood in South America. The expedition explored the Amazon forest in three
leading states of Brazil, namely, Acre, Mato Grosso, and Rondonia, where the Hevea species were distributed. The
expedition collected 64,736 rubber seeds and 1,522 meters of budwood. Malaysia received about 24,000 seeds for
preservation and conservation, while the remaining seeds were retained in Brazil. The materials collected from the expedition
focused on H. brasiliensis, and approximately 13,000 seedlings were successfully germinated and transplanted to the
conservation site at RRIM Research Station, Sungai Buloh (Ramli et al., 1996). Over the years, progenies derived from the
hand-pollination program have been evaluated in several experimental sites. These progenies were primarily assessed for
latex yield potential and growth, two and a half years after planting (Ong and Tan, 1987; Ong and Nasaruddin, 2011).
According to Ramli et al. (1996), the potential yield of the trees planted in 1981 was lower than the commercial planting
materials. The most vigorous trees were from the state of Acre, and the growth vigor between the trees was considerably
different from the same state. The selected tree was explored as parents and incorporated into the improvement programs.
4.4 Hevea Germplasm 1995
The Rubber Research Institute Malaysia (RRIM), Forest Research Institute Malaysia (FRIM), and Forestry Department
Peninsular Malaysia (FDPM) have initiated the Amazon forest expedition in 1995 to collect Hevea seeds. The expedition
aimed to collect Hevea seeds that would produce high rubberwood and latex yields, and return to Malaysia. The expedition
took place across 13 locations in Brazil, including Acre, Atalia de Norte, Belem, Borba, Benjamin Constant, CPAA Manaus,
Iranduba, Manaus, Manicore, Sao Gabriel, Sao Paulo de Olivencia, Tapajos, and Tabatinga (Ong and Nasaruddin, 2011).
Seeds of eight Hevea species, including H. brasiliensis, H. benthamiana, H. camargoana, H. guianensis, H. nitida, H.
pauciflora, H. rigidifolia, and H. spruceana were identified and brought back to Malaysia. However, two Hevea species were
not brought back from this expedition, namely, H. camporum and H. microphylla. These germinated seedlings were
subsequently assigned to the planting site according to seedling batches. Moreover, the unsatisfactory low germination
percentage of less than 20% of the total seeds' sowing and survival percentage forced the seedlings to be planted without
properly assigned accession numbers (RRIM, 1995; Ong and Mohd Nasaruddin, 2011). Ong and Nasaruddin (2011) reported
that two selections were made to select a new planting source. However, both selections were focused on a high rubberwood
potential rather than a latex yield. The capacity of these Hevea species as planting materials was established by sorting the
highest truncated wood volume (Ong and Nasaruddin, 2011). The circumference of these Hevea species was measured at the
5th and 10th year after planting.
V. THE RISK OF INBREEDING DEPRESSION
From the beginning of the improvement programs, parent trees were chosen for the crossing, where the pollen of selected
male parents was collected and introduced into female parents through the hand-pollination program. Seedlings resulting
from the hand-pollination program were selected into Hand Pollinated Seedling Trials and further evaluated in Small Scale
Clone Trials. The trees that presented promising characteristics such as high latex yield and healthy leaves were selected for
Large Scale Clone Trials. Lastly, the trees that indicated potential in high latex production and other favorable characteristics
were recommended as new commercial planting materials for wide-area planting. Plant breeders found it challenging to
improve the rubber tree in yield and growth vigor, due to the inbreeding decline complemented by the narrow genetic base.
This effect was seen in the frequently used classical breeding system of "Generation Wise Assortative Mating" (GAM) that
involves the sibling mating of rubber planting materials derived from H. brasiliensis (Tan, 1987; Ramli et al., 1996). In such
a breeding system, the finest genotypes in one generation of planted rubber planting materials were selected as parents for the

International Journal of Environmental & Agriculture Research (IJOEAR) ISSN:[2454-1850] [Vol-6, Issue-11, November- 2020]
Page | 21
next cycle of breeding, subsequently continuing the same procedure in the coming cycles (Simmond, 1989; Ramli et al.,
1996). Homozygosity and the occurrence of lethal alleles in the Hevea plant lead to general weaknesses such as low latex
yield, loss of general vigor and adverse morphology affecting bark smoothness; the biochemical quality of rubber particles
from inbred progenies are the critical consequences of the inbreeding method. Such developments would severely affect the
performance of the rubber tree as a crop plant. Inbreeding depression caused by the narrow genetic base in Hevea affects not
only future breeding programs for yield improvement, but also the availability of gene sources for useful morphological and
biochemical characteristics.
Hereafter, attempts must be made to improve the genetic base by adding new genetic materials from germplasm to overcome
these issues. Once a new pool of genetic resources is introduced, efforts can then be made to utilize them for complete
crossing. Subsequently, close consideration and caution must be taken concerning the use of novel materials in breeding to
improve yields and other essential characteristics. Broadening the Hevea genetic base is an essential strategy to produce high
latex yielding planting materials in future breeding programs. In hybridization programs, the common practice is to produce
progenies with suitable characteristics that would contribute to a more productive plant. There is an additional gain in
widening the genetic base for crop improvement, where inter-specific crosses are involved. In other natural rubber producing
countries, crop improvement programs often incorporate attempts to produce a hybrid between H. brasiliensis and Hevea
species, to develop immunity towards leaf diseases (Schultes, 1990). However, the interspecific hybrids developed between
commercial planting materials and other Hevea species are discouraging due to the low latex production and severe infection
by the South American Leaf Blight (SALB). Although SALB is not present in Asia, Malaysia also embarked on several trials
involving inter-specific hybrids in the 1970s (Gilbert et al., 1973; Tan and Subramaniam, 1976; Tan, 1987).
VI. CONCLUSION
The selection of productive planting materials to produce vigorous trees capable of producing higher latex quantities has
become crucial for Malaysian smallholdings, plantations, and rubber growers. For commercial and large-scale planting, the
preferable planting materials should generate high latex yield, healthy leaves and canopies, smooth and soft bark surface for
tapping, fast bark renewal rate after tapping, straight stem and trunk, vigorous girth growth and high survival rate of
rootstock-scion compatibility. Besides, characteristics such as bark thickness, number of laticifers, number of stomata, leaflet
position, seeds, and photosynthetic rates were the primary concerns in Hevea improvement. The characteristics that should be
found in suitable rubber planting materials and approved by the rubber growers are as follows: (1) High latex yield
production; (2) Smooth and soft bark surface; (3) Low susceptibility to leaf diseases; and (4) High tolerance to wind damage.
Currently, rubber plant breeders are still trying to improve rubber-planting materials with all the right characteristics into a
single model or "Ideotype", while at the same time considering minimizing the effect of “Inbreeding depression” when
breeding for a new rubber planting material for commercial planting. Inbreeding depression ought to reduce the vigorous
growth and latex yield production with a narrow genetic base. Therefore, Hevea improvement programs necessitate to
incorporate broader genetic resources with a selection of materials that includes commercial rubber planting materials
derived from H. brasiliensis and other Hevea species that are compatible with crossing or hybridization. The highlights from
this research aim to provide opportunities to employ the potential rubber species and genetic resources to select desirable
characteristics with the urge to utilize a new source of rootstocks in bud-grafting and multiplication of planting materials in
the future.
REFERENCES
[1] Baranova M (1992) Principles of comparative stomatographic studies of flowering plants. The Botanical Review 58(1):49-99.
[2] Barlow C (1978) The Natural Rubber Industry. Oxford University Press, London.
[3] Baulkwill WJ (1989) The history of natural rubber production. In: Webster CC and Baulkwill (Eds.) Rubber, Longman Scientific and
Technical, UK and John Wiley and Sons, Inc, New York.
[4] Blaser H (1945) Anatomy of Cryptotesgia grandiflora with Special Reference to the Latex System. American Journal of Botany
32:135-141.
[5] Bonfils F, Char C, Garnier H, Sanago A, Sainte-Beuve J (2000) Inherent molar mass distribution of clones and properties of crumb
natural rubber. Journal of Rubber Research 3(3): 164-184.
[6] Bouncing-balls. Accessed on 12th January 2015. URL: http://Hevea.bouncing-balls.com/ chemistry tech conservation /
vulcanization.htm
[7] Burkill HM (1959) Large Scale Variety Trials of Hevea brasiliensis Mull-Arg. on Malayan Estate 1934-53. Journal of The Rubber
Research Institute of Malaya 16(1): 1-37.

International Journal of Environmental & Agriculture Research (IJOEAR) ISSN:[2454-1850] [Vol-6, Issue-11, November- 2020]
Page | 22
[8] Buttery BR (1961) Investigation into the relationship between stock and scion in Hevea. Journal of The Rubber Research Institute of
Malaya. 17: 46-76.
[9] Carpenter KJ (2005) Stomatal architecture and evolution in basal angiosperms. American Journal of Botany 92(10): 1595-1615.
[10] Cornish K, Siler DJ, Grosjean O, Goodman N (1993) Fundamental similarities in rubber particles architecture and function in three
evolutionarily divergent plant species. Journal of Natural Rubber Research 8: 275-187.
[11] Cornish K, Wood DF, Windle JJ (1999) Rubber particles from four different species, examined by transmission electron microscopy
and electron-paramagnetic-resonance spin labelling, are found to consist of a homogeneous rubber core enclosed by a contiguous
monolayer biomembrane. Planta 210(1): 85–96.
[12] Cramer PJS (1924) Our inoculated Hevea trees in their first test year; their growth and production. Archief Voor De Rubbercultuur
8:458-493.
[13] Dale MB, Groves RH, Hull VJ, O'Callaghan JF (1971) A new method for describing leaf shape. New Phytologist 70: 437-442.
[14] Das S (2002) On the ontogeny of stomata and glandular hairs in some Indian mangroves. Acta Botanica Croatica 61(2): 199-205.
[15] de Fay E and Jacob JL (1989) Anatomical organization of the laticiferous system in the bark. In: d'Auzac J, Jacob JL, Chrestin H
(Eds.), Physiology of rubber tree latex, 4-14. CRC Press, Boca Raton, Florida.
[16] Dickinson TA, Parker WH, Strauss RE (1987) Another approach to leaf shape comparisons. Taxon 36:1-20.
[17] Dijkman MJ (1951) Hevea: thirty years of research in the Far East. Florida: University of Miami Press.
[18] Dunlop Tires. Our 124-Year Journey. Accessed on 18th December 2014. URL: http://Hevea.dunloptires.com/en-US/company/tire-
history
[19] Esau K (1965) Plant Anatomy. Wiley. New York.
[20] Esau K (1977) Anatomy of Seed Plants. Wiley. New York.
[21] Frey-Wyssling A (1930) Investigation into the relation between the diameter of the latex tubes and the rubber production of Hevea
brasiliensis. Archief Voor De Rubbercultuur 14:135-166.
[22] Fry C (2009) The Plant Hunters. Andre Deutsch. London.
[23] Gilbert NE, Dodds KS, Subramaniam S (1973) Progress of breeding investigations with Hevea brasiliensis. Analysis of data from
earlier crosses. Journal of Rubber Research Institute of Malaysia 23(5); 365-380.
[24] Goulding M (1980) Fishes and the Forest: Explorations in Amazonian Natural History. University of California Press.
[25] Gomez JB (1981) Anatomy and ultracytology related to breeding of Hevea. In: Hevea Breeding Course. Rubber Research Institute of
Malaysia.
[26] Gomez JB (1982) Anatomy of Hevea and its influence on latex production. MRRDB Monograph No.7, Malaysian Rubber Research
and Development Board.
[27] Gomez JB and Samsidar H (1980) Variations in leaf morphology and anatomy between clones of Hevea. Journal of Rubber Research
Institute of Malaysia 28(3): 157-172.
[28] Hagel JM, Yeung EC, Facchini PJ (2008) Got milk? The secret life of laticifers. Trends in Plant Science. 13(12):631-639.
[29] Heusser C (1932) Yields figures from legitimate Hevea seedlings in 1930 in the Soengei Pantjoer Experimental Station. Archief Voor
De Rubbercultuur. Rubber Research Institute of Malaya 16:129-156.
[30] Hickey LJ (1973) Classification of the architecture of dicotyledonous leaves. American Journal of Botany 60:17-33.
[31] Hickey LJ (1979) A revised classification of the architecture of dicotyledonous leaves. In: Metcalfe CR and Chalk L, Anatomy of the
dicotyledons Volume 1. Systematic anatomy of leaf and stem, with a brief history for the subject, 25-39. Clarendon Press, Oxford.
[32] Holder HJVS and Heusser C (1928) Experimental tapping on Hevea buddings and seedlings on Boekit Maradja Estatae. Archief Voor
De Rubbercultuur 12(58):37-49.
[33] Kang H, Kang MY, Han KH (2000) Identification of natural rubber and characterization of rubber biosynthetic activity in fig tree.
Plant Physiology 123(3):1133-1142.
[34] Konno K (2011) Plant latex and other exudates as plant defense systems: Roles of various defense chemicals and proteins contained
therein. Phytochemistry 72(13): 1510-1530.
[35] Kutchan TM (2005) A role for intra- and intercellular translocation in natural product biosynthesis. Current Opinion in Plant Biology
8(3):292-300.
[36] Kew. Hevea brasiliensis (rubber tree). Accessed on 9th January 2014. URL: http: // Hevea.kew.org / plants-fungi / Hevea-
brasiliensis.htm.
[37] Kew. Neotropical Euphorbiaceae. Accessed on 9th January 2014. URL: kew.org /science /tropamerica /neotropikey/families/
Euphorbiaceae.htm
[38] Lacey EP, Smith S, Case AL (1997) Parental effects on seed mass: Seed coat but not embryo/endosperm effect. American Journal of
Botany 84(11):1617-1620.
[39] Loadman J (2005) Tears of the Tree: The Story of Rubber - A Modern Marvel. Oxford University Press, UK.
[40] Leong SK and Yoon PK (1979) Effects of bud eyes on early scion growth of Hevea. Journal of Rubber Research Institute of Malaysia
27(1): 1-7.
[41] Maas JGJA (1919) The vegetative propagation of Hevea Brasiliensis. Archief Voor De Rubbercultuur. Rubber Research Institute of
Malaya 3:279-287.
[42] Martins MBG and Zieri R (2003) Leaf anatomy of rubber-tree clones. Scientia Agricola 60(4):709-713.

International Journal of Environmental & Agriculture Research (IJOEAR) ISSN:[2454-1850] [Vol-6, Issue-11, November- 2020]
Page | 23
[43] Md.Zain AA (1997) RRIM 2000 Series Clones: Characteristics and Description. Rubber Research Institute of Malaysia.
[44] Md.Zain AA (2003) Prestasi awal klon lateks balak Siri RRIM 2000 di Projek Pembangunan Terkawalselia. Malaysian Rubber
Board.
[45] Metcalfe CR and Chalk L (1950). Anatomy of the Dicotyledons Volume I. Oxford University Press, Oxford UK.
[46] Mercykutty VC, Marattukalam JG, Saraswathyamma CK, Meenakumari T (2002) Identification of Hevea clones: a manual. Rubber
Research Institute of India, Kottayam, Kerala, India.
[47] Michelin. A brief history of the Michelin brand in the cycle tire field. Accessed on 18th December 2014. URL: http: //
bike.michelinman.com /advice /miscellanous/a-brief-history-of-the-michelin-brand-in-the-cycle-tire-field
[48] MRB (2005) The evolution of the rubber industry in Malaysia: Navigating and re-inventing the industry. Malaysian Rubber Board.
[49] MRB (2009) Rubber Plantation and Processing Technologies. Malaysian Rubber Board, Kuala Lumpur.
[50] Natural Rubber Statistics 2019. Accessed on 1st August 2020. URL: http://www.lgm.gov.my/nrstat.
[51] Nawamawat K, Sakdapipanich JT, Ho CC, Ma Y, Song J, Vancso JG (2011) Surface nanostructure of Hevea brasiliensis natural
rubber latex particles.Colloids and Surfaces A: Physicochemical and Engineering Aspects 390(1): 157–166.
[52] Nelson T and Dengler N (1997) Leaf vascular pattern formation. The Plant Cell9:1121-1135.
[53] Ng AP, Ho CY, Sultan MO, Ooi CB, Lew HL, Yoon PK (1982) Influence of six rootstocks on growth and yield of six scion clones of
Hevea brasiliensis. Proceedings of the Rubber Research Institute of Malaysia Planters' Conference, Kuala Lumpur, 134-151.
[54] Ng AP (1983) Performance of rootstocks. Planters' Bulletin of Rubber Research Institute of Malaysia 175: 56-63.
[55] Oh SK, Kang H, Shin DH, Yang J, Chow KS, Yeang HY, Wagner B, Breiteneder H, Han KH (1999) Isolation, characterization, and
functional analysis of a novel cDNA clone encoding a small rubber particle protein from Hevea brasiliensis. The Journal of
Biological Chemistry 274 (24): 17132–17138.
[56] Ong SH (1977) Investigations on clones derived from seedlings of variousHeveaspecies introduced in 1966 by the Rubber Research
Institute of Malaya. Workshop on International collaboration inHevea breeding and the collection and establishment of materials from
the neo-tropics, Kuala Lumpur, 12-16 April 1977.
[57] Ong SH (1981) Correlations between yield, girth and bark thickness of RRIM Clone trials. Journal of Rubber Research Institute of
Malaysia 29(1): 1-14.
[58] Ong CW, Nasaruddin MA, Shamsul Bahri AR, Zarawi AG, Nurmi Rohayu AH, Rasyidah MR, Abdul Aziz AK (2011) Malaysia
experience on Rubber Planting Recommendations since 1925. IRRDB Workshop on Improving productivity Through Good
Agricultural Practices. 26th-28th September 2011, Mawlamyine, Myanmar.
[59] Ong SH and Tan H (1987) Utilization of Hevea genetic resources in RRIM. Malaysian Applied Biology Journal 16(1): 145-155.
[60] Ong CW and Nasaruddin MA (2011). The potential timber yielding genotypes identified from the mother tree selection (second
selection) in 1995Hevea Germplasm. Report: Malaysian Timber Council, 2011.
[61] Pakianathan SW, Harridas G, d'Auzac J (1989) Water relation and latex flow. In: d'Auzac J, Jacob JL, Chrestin H (Eds). Physiology of
rubber tree latex, 233-256. CRC Press, Boca Raton, USA.
[62] Patel JD (1979) New morphological classification of stomatal complexes. Phytomorphology29:218-229.
[63] Pickard WF (2008) Laticifers and secretory ducts: two other tube systems in plants. New Phytologist 177:877-888.
[64] Priyadashan PM (2011) Biology of Hevea rubber. CABI, Wallingford, UK.
[65] Ramli O, Masahuling B, Ong SH (1996) Genetic enhancement for Hevea improvement. Second National Congress on Genetics, 13th-
l5th November 1996, Kepong, Malaysia.
[66] Ratnasingam J, Ioras F, Wenming L (2011) Sustainability of the rubberwood sector in Malaysia. Notulae Botanicae Horti
Agrobotanici Cluj-Napoca 39(2): 305-311.
[67] RRIM (1952) Seed gardens for estates. Planters’ Bulletin. Rubber Research Institute of Malaya.
[68] RRIM (1957) Planting Recommendations 1957-58. Planters’ Bulletin. Rubber Research Institute of Malaysia.
[69] RRIM (1959) Planting Recommendations 1959-60. Planters’ Bulletin. Rubber Research Institute of Malaysia.
[70] RRIM (1961) Planting Recommendations 1961-62. Planters’ Bulletin. Rubber Research Institute of Malaysia.
[71] RRIM (1963) Planting Recommendations 1963-64. Planters’ Bulletin. Rubber Research Institute of Malaysia.
[72] RRIM (1964) Planting materials used on estate in Malaysia. Planters’ Bulletin. Rubber Research Institute of Malaysia.
[73] RRIM (1965) Planting Recommendations 1965-66. Planters’ Bulletin. Rubber Research Institute of Malaysia.
[74] RRIM (1967) Planting Recommendations 1967-68. Planters’ Bulletin. Rubber Research Institute of Malaysia.
[75] RRIM (1975) Planting materials used in Peninsular Malaysia for 1971 and 1972. Planters’ Bulletin. Rubber Research Institute of
Malaysia.
[76] RRIM (1977) Environmax Planting Recommendations 1977-79. Planters’ Bulletin. Rubber Research Institute of Malaysia.
[77] RRIM (1983) RRIM Planting Recommendations 1983-85. Planters’ Bulletin. Rubber Research Institute of Malaysia.
[78] RRIM (1986) RRIM Planting Recommendations 1986-88. Planters’ Bulletin. Rubber Research Institute of Malaysia.
[79] RRIM (1989) RRIM Planting Recommendations 1989-91. Planters’ Bulletin. Rubber Research Institute of Malaysia.
[80] RRIM (1992) RRIM Planting Recommendations 1992-94. Planters’ Bulletin. Rubber Research Institute of Malaysia.
[81] RRIM (1994) Planting materials used in Peninsular Malaysia, 1989-1992. Planters’ Bulletin. Rubber Research Institute of Malaysia
3-11.
[82] RRIM (1995) Heveawood availability in Peninsular Malaysia. Planters' Bulletin. Rubber Research Institute of Malaysia 73-83.
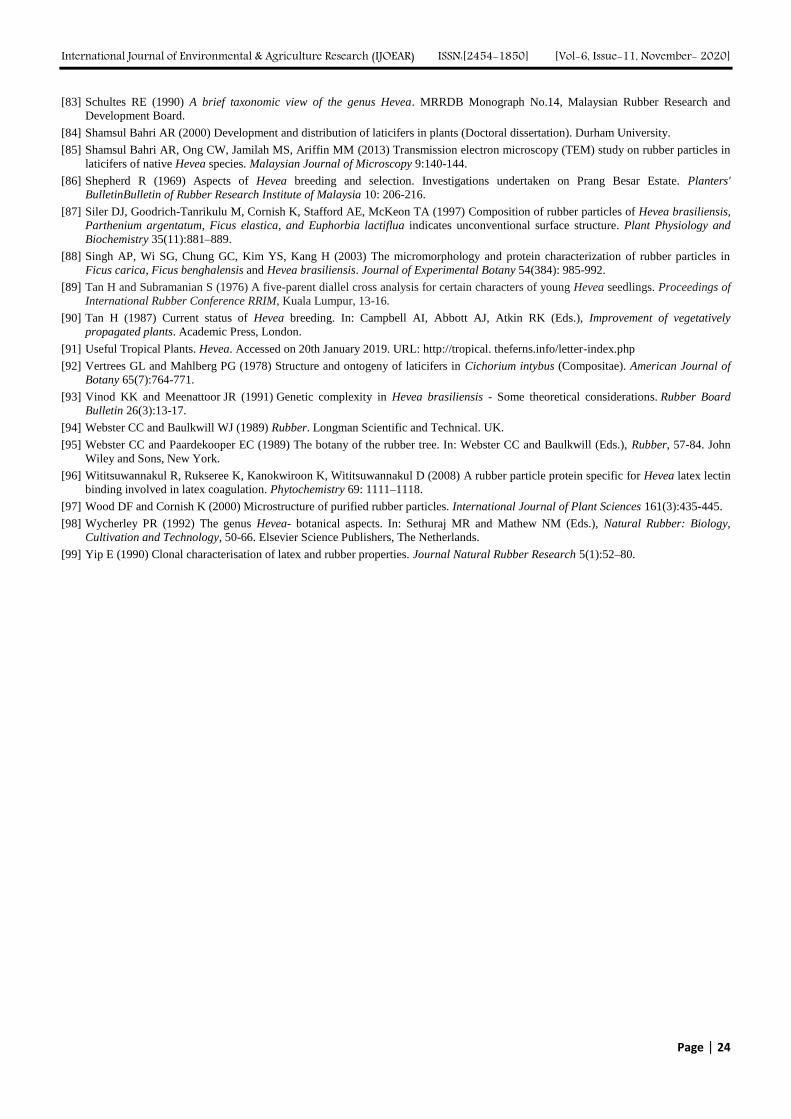
International Journal of Environmental & Agriculture Research (IJOEAR) ISSN:[2454-1850] [Vol-6, Issue-11, November- 2020]
Page | 24
[83] Schultes RE (1990) A brief taxonomic view of the genus Hevea. MRRDB Monograph No.14, Malaysian Rubber Research and
Development Board.
[84] Shamsul Bahri AR (2000) Development and distribution of laticifers in plants (Doctoral dissertation). Durham University.
[85] Shamsul Bahri AR, Ong CW, Jamilah MS, Ariffin MM (2013) Transmission electron microscopy (TEM) study on rubber particles in
laticifers of native Hevea species. Malaysian Journal of Microscopy 9:140-144.
[86] Shepherd R (1969) Aspects of Hevea breeding and selection. Investigations undertaken on Prang Besar Estate. Planters'
BulletinBulletin of Rubber Research Institute of Malaysia 10: 206-216.
[87] Siler DJ, Goodrich-Tanrikulu M, Cornish K, Stafford AE, McKeon TA (1997) Composition of rubber particles of Hevea brasiliensis,
Parthenium argentatum, Ficus elastica, and Euphorbia lactiflua indicates unconventional surface structure. Plant Physiology and
Biochemistry 35(11):881–889.
[88] Singh AP, Wi SG, Chung GC, Kim YS, Kang H (2003) The micromorphology and protein characterization of rubber particles in
Ficus carica, Ficus benghalensis and Hevea brasiliensis. Journal of Experimental Botany 54(384): 985-992.
[89] Tan H and Subramanian S (1976) A five-parent diallel cross analysis for certain characters of young Hevea seedlings. Proceedings of
International Rubber Conference RRIM, Kuala Lumpur, 13-16.
[90] Tan H (1987) Current status of Hevea breeding. In: Campbell AI, Abbott AJ, Atkin RK (Eds.), Improvement of vegetatively
propagated plants. Academic Press, London.
[91] Useful Tropical Plants. Hevea. Accessed on 20th January 2019. URL: http://tropical. theferns.info/letter-index.php
[92] Vertrees GL and Mahlberg PG (1978) Structure and ontogeny of laticifers in Cichorium intybus (Compositae). American Journal of
Botany 65(7):764-771.
[93] Vinod KK and Meenattoor JR (1991) Genetic complexity in Hevea brasiliensis - Some theoretical considerations. Rubber Board
Bulletin 26(3):13-17.
[94] Webster CC and Baulkwill WJ (1989) Rubber. Longman Scientific and Technical. UK.
[95] Webster CC and Paardekooper EC (1989) The botany of the rubber tree. In: Webster CC and Baulkwill (Eds.), Rubber, 57-84. John
Wiley and Sons, New York.
[96] Wititsuwannakul R, Rukseree K, Kanokwiroon K, Wititsuwannakul D (2008) A rubber particle protein specific for Hevea latex lectin
binding involved in latex coagulation. Phytochemistry 69: 1111–1118.
[97] Wood DF and Cornish K (2000) Microstructure of purified rubber particles. International Journal of Plant Sciences 161(3):435-445.
[98] Wycherley PR (1992) The genus Hevea- botanical aspects. In: Sethuraj MR and Mathew NM (Eds.), Natural Rubber: Biology,
Cultivation and Technology, 50-66. Elsevier Science Publishers, The Netherlands.
[99] Yip E (1990) Clonal characterisation of latex and rubber properties. Journal Natural Rubber Research 5(1):52–80.

International Journal of Environmental & Agriculture Research (IJOEAR) ISSN:[2454-1850] [Vol-6, Issue-11, November- 2020]
Page | 25
Malting Sludges as Soil Amendment Campaña, D.H.
1*, Airasca A.
2
Universidad Tecnológica Nacional – Facultad Regional Bahia Blanca-GEAQB Grupo de estúdio Ambiente Química y
Biología – Argentina
Abstract— Residual sludge that results from the treatment of malt house effluents produced during the malting of barley
in malt house (Argentina) was evaluated to determine its fertilising potential and capability for improving soil as a way to
reuse or recycle this material. The Cabildo soil (Southwest of Buenos Aires Province), of the typic Argiustoll subgroup had a
sandy clay-loam texture and was tested in this field experiments. This soil plots (4 m2) were amended with equivalent malting
sludges doses of 5, 15, and 25 Mg/ha. When biosolids, like malting sludges, are incorporated as an amendment, many
micronutrients are provided. Chemical properties of the soil, particularly the pH, EC (Electrical Conductivity) and Cation
Exchange Capacity (CEC), were improved. Dactylis glomerata L. were utilised as growing crop (forage) in this field test,
productivity ( Dry matter) and quality (protein %) gave results following 0,205 kg/m2
and 11.94 % at control in comparison
with 0,4 kg/m2
and 15.15 % of amended soil. Calcium concentration in grasses was significantly different for control (4651
mg/kg-1
) in comparison with high sludge dose (8907 mg/kg-1
), the same trend was found with micronutrients like Copper and
Molybdenum. This result from field test indicate that this residual sludge constitutes a suitable amendment for agricultural
soils, increasing quality and productivity of Dactylis glomerata L and improving several soil properties.
Keywords— Malting Sludge, Soil Amendment, Forage.
I. INTRODUCTION
Nutrient depletion is a major form of soil degradation. The sludge from effluent treatment plants in agro-industrial processes
is a potential source of organic fertilisers (Roy et al., 2003) that can be used to restore the fertility of agricultural soils with
better prospects than even inorganic or conventional fertilisation. When biosolids are incorporated as an amendment, many
micronutrients that are not incorporated with conventional (synthetic) fertilisation are provided. This incorporation is an
advantage, given that the design of fertiliser dosages at the micro-level would be notably costly. The bioavailability of trace
elements, such as micronutrients or toxic elements, is not determined by the total concentrations of the elements in question;
rather, it depends directly on the chemical properties of the soil, particularly the pH and cation exchange capacity. The
application of biosolids, organic (plant/animal) waste to the soil should be reconsidered as an economic practice, both from
the standpoint of operating costs and from the standpoint of the environment, given the facts that matter is recycled and it can
effectively compete with chemical fertilisers at lower environmental costs. All of these factors support the pursuit of an
effectively sustainable agricultural-livestock production method. The use of organic waste would also be an advantage for
countries with relatively low industrialisation that could more easily "close" the cycle of nutrient recycling in contrast to
highly industrialised countries. Ideally, sustainable agricultural-livestock production would be stable when organic waste
arising from the study area is reused within the same area (Schulz et al., 1997). This stability is possible when the surface
areas of agricultural land are large, and the generation of agribusiness and domestic waste is not excessive, as is the
Argentina situation. One way to improve or restore long-term soil quality is to intervene in the complex processes of agro-
ecosystem biocycles.
Taking into account the limiting soil factors for growing crops in marginal zones of the Argentine Pampas, such as the
southwestern regions of the province of Buenos Aires (sub-humid – semi-arid zones), a typical Mollysol soil (Argiudol
suborder) was tested with the objective to propose practices, such as amendment with biosolids (organic waste), like malting
sludges that would improve the soil quality and increase the sustainable productivity of cereals and fodder to prevent
deterioration of the ecosystem. Sludge from waste biomass (activated sludge treatment of malting effluents), mainly organic
matter had a chemical composition about 50% cellulose, hemicellulose 20%, 18% of lignin, 6% protein, 5% amino acids and
sugars and other pectin, waxes, pigments, etc.

International Journal of Environmental & Agriculture Research (IJOEAR) ISSN:[2454-1850] [Vol-6, Issue-11, November- 2020]
Page | 26
II. MATERIALS AND METHODS
Soil plots were established in Rucalen-Cabildo (Buenos Aires, Province) as soil C (Torres Carbonell et al., 2012). Malting
sludges were from a malt house nearby Bahia Blanca- Argentina (Campaña D.H. et al., 2014). 15 plots were laid out square,
4 m2 each, with ploughing and raking up soil, and, after 8 days, biosolids was applied superficial. 4 trials were conducted
with three replicates each, adding doses equivalent to 5, 15 and 25 Mg. per há. Control plots (soil without sludge), also was
tested. Once added, sludge was mixed with the topsoil (15 - 20 cm), then raking to prepare the seedbed. Five weeks later (36
days), it was take the first soil sample from each plot and was seeded, orchard grass (Dactylis glomerata L). The seeding rate
was 1.25 grams of seed per m2 each plot (equivalent to the rate typically used forage cropping). Any irrigation was not
performed, so that the water intake was only by rainfall during the experimental period. After fourteen weeks, the grass was
cutted, immediately was make the second sampling of soil and finally the third sample was collected after completion of the
final collection of grass, which was made by hand with scissors cutting leaving a minimum of grass remaining in the plot
(less than 2 cm in height). The harvest included, orchard grass and the other species grow together. The pH, electrical
conductivity, exchange cations and the effective exchange capacity, were measured for soil samples. For vegetables, after
performing acid digestion (nitric/perchloric acid) samples were determined total contents of P, Ca, Mg, K, Cu, Zn, Mo
atomic emission spectrometer inductively coupled plasma (ICP-AES). To estimate the crude protein, the determination was
made on a dry sample of plant total N measured by the Kjeldahl method, multiplied by the factor 6.25, assuming that the
average content of N is 16% crude protein. Statistical validation was by analysis of variance (ANOVA) to test significant
differences of measured variables; all cases were determined properties by triplicate samples. As an alternative
nonparametric analysis of variance (ANOVA) were used: in some cases the Kruskal-Wallis, or the Wilcoxon test.
III. RESULTS AND DISCUSSION
Eight months crop growing (forage) using orchard grass (Dactylis glomerata L.) in soil C, sub-humid climatic conditions
(Cabildo- Buenos Aires-Argentina) was performed. At the experimental plots was determined soil pH, electrical conductivity
(EC), cation exchange capacity (CEC). For Dacylis glomerata L. (Orchard grass), dry matter production, and quality,
including protein, Ca, Mg, K, P, Zn, Cu and Mo were measured. The micronutrients evolution and forage production were
evaluated, beginning March and ending mid-November. The maximum and minimum average temperatures were similar
initial and finally (26º C and 13.2° C in March and 25.8° C and 10.6° C in November). The lowest temperature happend at
July, with an average maximum of 11.6 Tº C and average minimum of 1.5° C. The rainfall for the period was 469 mm, the
distribution was: 132 mm at 1st sampling, 124 mm at second one and 213 mm at final sampling. Intermediate sampling
results were not showed (space limitation), pH, electrical conductivity, cation exchange capacity and exchangeable cátions
are presented in Table 1. Finally plant production (dry matter), protein and micronutrients contents were determined and
showed in Table 2.
TABLE 1
pH EC AND CEC OF SOIL AMENDED WITH MALTING SLUDGE (0, 120 AND 240 DAYS) *
Soil Properties Low Dose Medium Dose High Dose Control
Initial pH 7.26a 6.73a 7.12 B 7.59ª
Initial EC (Ms/Cm-1
) 0.48b 0.47b 1.04b 0.23 A
Initial CEC (Cmol(+)Kg-1
) 24.58a 25.17a 29.48b 23.65ª
Mid pH ) 7.78a 7.12a 7.16a 7.90ª
Mid EC (Ms/Cm-1
) 7.26 A 6.73 A 7.12 B 7.59ª
Mid CEC (Cmol(+)Kg-1
) 19.98a 19.35a 23.3a 17.91ª
Final pH 7.58a 6.93 A 7.50a 7.77ª
Final EC (Ms/Cm-1
) 0.19b 0.21b 0.23b 0.09ª
Final CEC (Cmol(+)Kg-1
) 22.08a 18.10a 23.27a 18.52ª
*Average values of three plots same dose
In each row values followed by the same letter are not significantly different (p>0.05).
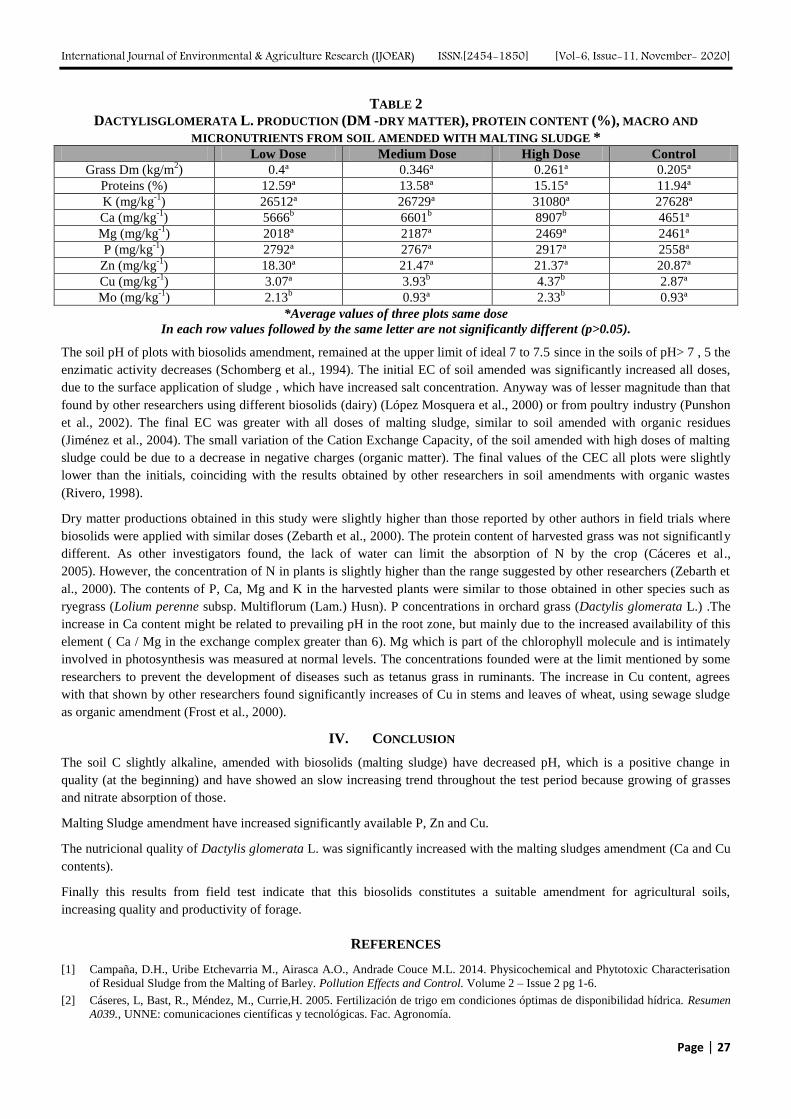
International Journal of Environmental & Agriculture Research (IJOEAR) ISSN:[2454-1850] [Vol-6, Issue-11, November- 2020]
Page | 27
TABLE 2
DACTYLISGLOMERATA L. PRODUCTION (DM -DRY MATTER), PROTEIN CONTENT (%), MACRO AND
MICRONUTRIENTS FROM SOIL AMENDED WITH MALTING SLUDGE * Low Dose Medium Dose High Dose Control
Grass Dm (kg/m2) 0.4ª 0.346ª 0.261ª 0.205ª
Proteins (%) 12.59ª 13.58ª 15.15ª 11.94ª
K (mg/kg-1
) 26512ª 26729ª 31080ª 27628ª
Ca (mg/kg-1
) 5666b 6601
b 8907
b 4651ª
Mg (mg/kg-1
) 2018ª 2187ª 2469ª 2461ª
P (mg/kg-1
) 2792ª 2767ª 2917ª 2558ª
Zn (mg/kg-1
) 18.30ª 21.47ª 21.37ª 20.87ª
Cu (mg/kg-1
) 3.07ª 3.93b 4.37
b 2.87ª
Mo (mg/kg-1
) 2.13b 0.93ª 2.33
b 0.93ª
*Average values of three plots same dose
In each row values followed by the same letter are not significantly different (p>0.05).
The soil pH of plots with biosolids amendment, remained at the upper limit of ideal 7 to 7.5 since in the soils of pH> 7 , 5 the
enzimatic activity decreases (Schomberg et al., 1994). The initial EC of soil amended was significantly increased all doses,
due to the surface application of sludge , which have increased salt concentration. Anyway was of lesser magnitude than that
found by other researchers using different biosolids (dairy) (López Mosquera et al., 2000) or from poultry industry (Punshon
et al., 2002). The final EC was greater with all doses of malting sludge, similar to soil amended with organic residues
(Jiménez et al., 2004). The small variation of the Cation Exchange Capacity, of the soil amended with high doses of malting
sludge could be due to a decrease in negative charges (organic matter). The final values of the CEC all plots were slightly
lower than the initials, coinciding with the results obtained by other researchers in soil amendments with organic wastes
(Rivero, 1998).
Dry matter productions obtained in this study were slightly higher than those reported by other authors in field trials where
biosolids were applied with similar doses (Zebarth et al., 2000). The protein content of harvested grass was not significantly
different. As other investigators found, the lack of water can limit the absorption of N by the crop (Cáceres et al.,
2005). However, the concentration of N in plants is slightly higher than the range suggested by other researchers (Zebarth et
al., 2000). The contents of P, Ca, Mg and K in the harvested plants were similar to those obtained in other species such as
ryegrass (Lolium perenne subsp. Multiflorum (Lam.) Husn). P concentrations in orchard grass (Dactylis glomerata L.) .The
increase in Ca content might be related to prevailing pH in the root zone, but mainly due to the increased availability of this
element ( Ca / Mg in the exchange complex greater than 6). Mg which is part of the chlorophyll molecule and is intimately
involved in photosynthesis was measured at normal levels. The concentrations founded were at the limit mentioned by some
researchers to prevent the development of diseases such as tetanus grass in ruminants. The increase in Cu content, agrees
with that shown by other researchers found significantly increases of Cu in stems and leaves of wheat, using sewage sludge
as organic amendment (Frost et al., 2000).
IV. CONCLUSION
The soil C slightly alkaline, amended with biosolids (malting sludge) have decreased pH, which is a positive change in
quality (at the beginning) and have showed an slow increasing trend throughout the test period because growing of grasses
and nitrate absorption of those.
Malting Sludge amendment have increased significantly available P, Zn and Cu.
The nutricional quality of Dactylis glomerata L. was significantly increased with the malting sludges amendment (Ca and Cu
contents).
Finally this results from field test indicate that this biosolids constitutes a suitable amendment for agricultural soils,
increasing quality and productivity of forage.
REFERENCES
[1] Campaña, D.H., Uribe Etchevarria M., Airasca A.O., Andrade Couce M.L. 2014. Physicochemical and Phytotoxic Characterisation
of Residual Sludge from the Malting of Barley. Pollution Effects and Control. Volume 2 – Issue 2 pg 1-6.
[2] Cáseres, L, Bast, R., Méndez, M., Currie,H. 2005. Fertilización de trigo em condiciones óptimas de disponibilidad hídrica. Resumen
A039., UNNE: comunicaciones científicas y tecnológicas. Fac. Agronomía.

International Journal of Environmental & Agriculture Research (IJOEAR) ISSN:[2454-1850] [Vol-6, Issue-11, November- 2020]
Page | 28
[3] Frost, H.L., Ketchum, L.H., 2000. Trace metal concentration in durum wheat from applicatiopn of sewage sludge and commercial
fertilizer. Adv. Envirom.Res. 4:347-355.
[4] Jimenez, L., Larrea, M., Noguera, N., 2004. Efectos del estiércol bovino sobre algunas propiedades químicas de un ultisol degradado
en el área de Machiques Colón, estado de Zulia. Rev. Fac. Agron., 21 (4): 236-245, Caracas.
[5] Lopez Mosquera , M.E., 2000. Evaluación Del efecto salino en suelo fertilizado con lodos de industria láctea . Edafología – Tomo 7
– Universidad Santiago de Compostela – España.
[6] Punshon, T., Adriano D.C., Weber, J.T. 2002 . Restoration of drastically eroded land using coal fly ash and poultry biosolid.
Sci.Total Environ. 296: 209-225.
[7] Rivero, C. 1998. Efecto de La incorporación de residuos orgânicos sobre algunas propiedades de um alfisol degradado.
Rev.Venesuelos. 3 (2): 55-61.
[8] Roy, R.N., Misra, R.V., Lesschen, J.P.,Smaling, E.M. 2003. Assesment of soil nutrient balance. FAO. Fertlizer and Plant Nutrition
Bulletin 14.
[9] Schomberg, H.H., Ford, P.B., Hardgrove, W.L., 1994 . Influence of crop residues on nutrient cycling and soil chemical properties.
Managing Agricultural Residues . Lewis Pub.
[10] Schulz, R., Romheld, V. 1997.Recycling of municipal and industrial organic wastes in agriculture: benefits lilitations and means of
improvements. Plant nutrition for sustainable food production and environment. Kluwer academic Pub (Japan) 581-586.
[11] Torres Carbonell C.A., Marinissen A., Lauric, A., Campaña D.H., Loewy T. 2012. XIX Congreso Latinoamericano de la Ciencia del
Suelo- Abril 2012 – Mar del Plata – Argentina.
[12] Zebarth, B.J., McDougall, N., Neilsen, G., Neilsen D., 2000. Availability of Nitrogen from municipal biosolids for dryland forage
grass. Canadian J. Plant Sci 80:575-582.

International Journal of Environmental & Agriculture Research (IJOEAR) ISSN:[2454-1850] [Vol-6, Issue-11, November- 2020]
Page | 29
In-Vitro Studies of Different Culture Media and Biocontrol
Agents on Growth and Sporulation of Alternaria Alternata (Fr.)
Keissler an Incitant of Broad bean (Vicia Faba L.) Leaf Blight
Disease David Kamei
1 and Archana U Singh
2
1KVK, ICAR, Senapati District, Manipur
2Division of Nematology, ICAR- IARI, New Delhi
Abstract— Studies on different culture media and biocontrol agents on growth and sporulation of Alternaria alternata (fr.)
keissler causal organism of Broad bean (Vicia faba L.) leaf blight disease was conducted in vitro. Six culture media was
tested for growth and sporulation of A. Alternata. It was found in that in liquid broth media, Potato dextrose broth (607 mg,
dry weight of mycelium) and in solid media, maximum linear growth recorded in Potato dextrose agar (90 mm) with
maximum number of spores 6.2 x 10³ spores/ml. The antagonistic studies of 5 fungal biocontrol agents in dual culture
technique found that all biocontrol agents statistically produced a significant antagonistic effect on linear growth and
sporulation of A. Alternata. Maximum linear growth inhibition of Alternaria alternata was found in Trichoderma harzianum
(17.5mm) with 89.6% inhibition and at par with Trichoderma viride (19.5mm) with 84.4% inhibition followed by T. hamatum
(22.3 mm) with 74.1% inhibition and Gliocladium virens (21.0 mm) with 70.6% and minimum significant inhibition effect in
T. koningii (22.8 mm) with per cent inhibition of 67.2 over the check. Highest spore inhibition of was found in T. harzianum
(89.6%) and T. viride (84.4%) followed by T. hamatum (74.1%) and G. virens (70.6%) while minimum inhibition was found
in T. koningii (67.25). It was further observed that T. harzianum could overgrown the growth of pathogenic fungus within 2
days and for T. viride within 3 days where as T. hamatum and G. virens took 5 days.
Keywords— Alternaria alternata, blight disease, broth media, solid media, efficacy, linear growth, sporulation, mycelium,
biocontrol agents.
I. INTRODUCTION
Broad bean (Vicia faba L.) is an important leguminous crop cultivated in different parts of mild sub-tropical and temperate
regions of the world. In Manipur and north eastern state of India it is mostly grown as vegetable crop, where tender green
pods were used as culinary purposes and mature seeds used as dals, snacks preparation and seed purposes. This important
winter vegetable crop was often attacked by various diseases and out of eight major diseases recorded, blight disease caused
by Alternaria alternata fr keissler is most serious (Gupta, 1985). The disease first appeared as small circular, brownish
colour at the margin or tip of the leaf and progressed towards the midrib or the spots coalesce together to form into an
elongated, irregular necrotic dark brown lesions. The affected young plants turn pale and leaf get drooping and wilted and die
later. At present there is little information on physiology of the fungus associated with the blight disease and on management
practices against this disease. Therefore the present investigation was taken up to study the effect of different types of culture
media on the growth and sporuration of the pathogen and also to study the antagonistic effect of various bioagents against
this pathogenic fungus.(Goswami and Mittal, 2002; Mittal et al., 2005 and Goswami and Mittal, 2004)
II. MATERIALS AND METHODS
The research works was carried out in the laboratory of Department of Plant Pathology, Krishi Vigyan Kendra-Senapati
district, Manipur in the year 2018-19. The details of experimental approaches and procedures adopted during the course of
investigations are described as follows:
2.1 Collection of diseased specimen
Broad bean plant showing typical leaf blight symptoms were collected from different location of Senapati district of Manipur
during rabi season (2018-19) and brought in the laboratory of KVK-Senapati, Hengbung, Manipur for isolation purpose and
use further for study.
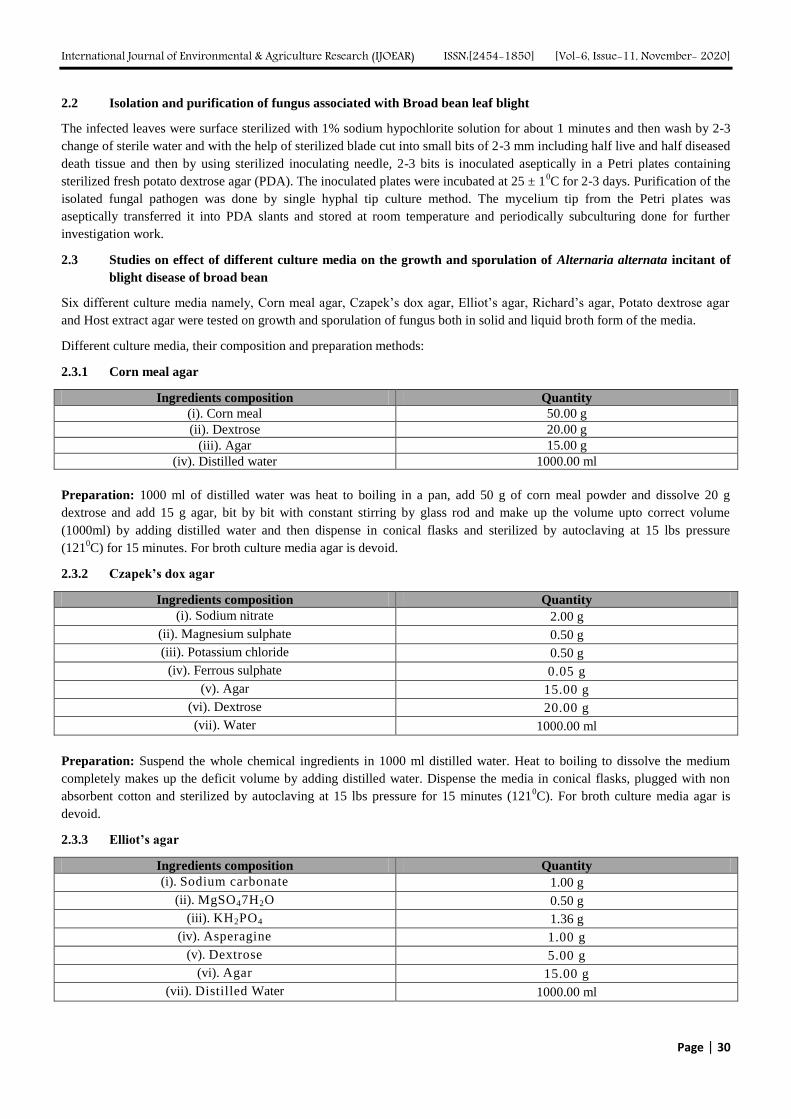
International Journal of Environmental & Agriculture Research (IJOEAR) ISSN:[2454-1850] [Vol-6, Issue-11, November- 2020]
Page | 30
2.2 Isolation and purification of fungus associated with Broad bean leaf blight
The infected leaves were surface sterilized with 1% sodium hypochlorite solution for about 1 minutes and then wash by 2-3
change of sterile water and with the help of sterilized blade cut into small bits of 2-3 mm including half live and half diseased
death tissue and then by using sterilized inoculating needle, 2-3 bits is inoculated aseptically in a Petri plates containing
sterilized fresh potato dextrose agar (PDA). The inoculated plates were incubated at 25 ± 10C for 2-3 days. Purification of the
isolated fungal pathogen was done by single hyphal tip culture method. The mycelium tip from the Petri plates was
aseptically transferred it into PDA slants and stored at room temperature and periodically subculturing done for further
investigation work.
2.3 Studies on effect of different culture media on the growth and sporulation of Alternaria alternata incitant of
blight disease of broad bean
Six different culture media namely, Corn meal agar, Czapek’s dox agar, Elliot’s agar, Richard’s agar, Potato dextrose agar
and Host extract agar were tested on growth and sporulation of fungus both in solid and liquid broth form of the media.
Different culture media, their composition and preparation methods:
2.3.1 Corn meal agar
Ingredients composition Quantity
(i). Corn meal 50.00 g
(ii). Dextrose 20.00 g
(iii). Agar 15.00 g
(iv). Distilled water 1000.00 ml
Preparation: 1000 ml of distilled water was heat to boiling in a pan, add 50 g of corn meal powder and dissolve 20 g
dextrose and add 15 g agar, bit by bit with constant stirring by glass rod and make up the volume upto correct volume
(1000ml) by adding distilled water and then dispense in conical flasks and sterilized by autoclaving at 15 lbs pressure
(1210C) for 15 minutes. For broth culture media agar is devoid.
2.3.2 Czapek’s dox agar
Ingredients composition Quantity
(i). Sodium nitrate 2.00 g
(ii). Magnesium sulphate 0.50 g
(iii). Potassium chloride 0.50 g
(iv). Ferrous sulphate 0.05 g
(v). Agar 15.00 g
(vi). Dextrose 20.00 g
(vii). Water 1000.00 ml
Preparation: Suspend the whole chemical ingredients in 1000 ml distilled water. Heat to boiling to dissolve the medium
completely makes up the deficit volume by adding distilled water. Dispense the media in conical flasks, plugged with non
absorbent cotton and sterilized by autoclaving at 15 lbs pressure for 15 minutes (1210C). For broth culture media agar is
devoid.
2.3.3 Elliot’s agar
Ingredients composition Quantity
(i). Sodium carbonate 1.00 g
(ii). MgSO47H2O 0.50 g
(iii). KH2PO4 1.36 g
(iv). Asperagine 1.00 g
(v). Dextrose 5.00 g
(vi). Agar 15.00 g
(vii). Distilled Water 1000.00 ml

International Journal of Environmental & Agriculture Research (IJOEAR) ISSN:[2454-1850] [Vol-6, Issue-11, November- 2020]
Page | 31
Preparation: Suspend the whole chemical ingredients in 1000 ml distilled water. Heat to boiling to dissolve the medium
completely makes up the deficit volume (upto 1000ml) by adding distilled water. Dispense the media in conical flasks,
plugged with non absorbent cotton and sterilized by autoclaving at 15 lbs pressure for 15 minutes (1210C). For broth culture
media agar is devoid.
2.3.4 Richard’s agar
Ingredients composition Quantity
(i). Potassium nitrate 10.00 g
(ii). Monopotassium dehydrogen phosphate 5.00 g
(iii). Magnessium sulphate 2.50 g
(iv). Ferric chloride 0.02 g
(v). Sucrose 50.00 g
(vi). Agar 15.00 g
(vii). Distilled 1000.00 ml
Preparation: Suspend the whole chemical ingredients in 1000 ml distilled water. Heat to boiling to dissolve the medium
completely makes up correct volume (1000ml) by adding distilled water. Dispense the media in conical flasks plugged with
non absorbent cotton and sterilized by autoclaving at 15 lbs pressure for 15 minutes (1210C). For broth culture media agar is
devoid.
2.3.5 Potato dextrose agar
Ingredients composition Quantity
(i). Potato 200.00 g
(ii). Dextrose 20.00 g
(iii). Agar 15.00 g
(iv). Distilled 1000.00 ml
Preparation: 200 g sliced potato were boiled in 500 ml of distilled water and half cook or till soften, collect the decoction by
straining in a cheese cloth and add 20 gm of dextrose. In another beaker 500 ml of water is heated and 20 gm of agar is added
bit by bit till it completely gets dissolved. Now agar solution and potato extracts dextrose solution were mixed together and
the volume is brought upto correct volume (1000 ml) by adding more distilled water. Dispense the media in conical flasks
and plugged with non absorbent cotton and sterilized by Autoclaving at 15 lbs pressure (1210C) for 15 minutes. For potato
dextrose broth media agar is devoid.
2.3.6 Host extract agar
Ingredients composition Quantity
(i). Broad bean leaves 100.00 g
(ii). Dextrose 20.00 g
(iii). Agar 15.00 g
(iv). Distilled 1000.00 ml

International Journal of Environmental & Agriculture Research (IJOEAR) ISSN:[2454-1850] [Vol-6, Issue-11, November- 2020]
Page | 32
Preparation: 100 gm fresh broad bean leaves were boiled in 500 ml of distilled water till soften. Collect the decoction by
straining in a cheese cloth and to it add 20 g dextrose. In another beaker 500 ml of water is heated and 15 gm of agar is added
bit by bit till it completely gets dissolved. Now agar solution and broad bean leaf extracts dextrose solution were mixed
together and the volume is brought upto correct volume (1000 ml) by adding more distilled water, dispensed the media in
conical flasks and plugged with non absorbent cotton and sterilized by Autoclaving at 15 lbs pressure (1210C) for 15 minutes.
For host leaf extract broth media agar is devoid.
1) Liquid Broth media test
50 ml each of the broth media to be tested was dispensed in 100 ml capacity conical flasks and autoclaved at 15 lb pressure
(1210C) for 15 minutes. Each treatment was replicated into four times. Mycelial discs of 3 days old test fungus mycelium was
cut by using sterilize 5 mm cork borer and with the help of sterilized inoculating needle a mycelial disc was aseptically
inoculate into those conical flasks containing the test media. The inoculated conical flasks was plugged again and incubated
at 25 ± 10C for 10 days. The mycelial mats was harvested through pre-weighed Qualigens No. 651 A (11.0 cm diameter)
filter paper and dried at 600C in a hot air oven for 72 hours and then cooled in desiccator for 24 hours and re-weighed in an
electronic balance. The mycelial dry weight for each treatment was recorded and actual growth was calculated.
2) Solid media test:
50 ml each of different solid medium to be tested was autoclaved and then dispensed 20 ml of it in the sterilized Petri plates
of 9 cm diameter. Each treatment was replicated into four. Mycelial discs were cut from 3 days old actively growing colony
of fungal culture by using sterilized 5 mm diameter cork borer. One mycelial disc was inoculated at the centre of each test
plates containing sterilized media and then incubated at 25±10C. The radial growth was recorded in 24 hours intervals till the
fungus covered the whole plate. The differences in the growth rate were calculated for all the treatments by using the formula
Vincent (1927).
𝐼 =(𝐶−𝑇)
𝐶× 100 (1)
Where, I=percent inhibition
C=growth in control
T=growth in treatment
For estimation of fungal spores the method described by Devi (1991) was followed. For this, 1 sq.cm mycelial block was cut
from each plate and the mycelial mats were removed from the medium. It was then transferred into a test tube containing 5ml
distilled water and shaken it for 5 minutes. The spore density/ml of this homogemous spores solution was estimated by using
a Haemocytometer.
2.4 Effect of biocontrol agents on the growth and sporulation of Alternaria alternate
The efficacy of 5 biocontrol agents namely Trichoderma viride, Trichoderma harzianum, Trichoderma hamatum,
Trichoderma koningii and Gliocladium virens was tested on growth and sporulation of Alternaria alternata by dual culture
technique. The biocontrol agents were collected from ITCC, IARI, New Delhi vide Dept. of Plant Pathology, College of
Agriculture, CAU, Imphal.
Biocontrol agents and pathogen was multiplied in sterilized potato dextrose agar (PDA) plates separately. Mycelial discs
were cut with a sterilized cork borer of 5 mm diameter from actively growing 3 days old fungal colony. Each mycelial discs
of both pathogen and bio-agents was placed in opposite pole 3cm apart in fresh sterilized potato dextrose agar (PDA) plates.
The control plate was inoculated only with pathogenic fungal mycelial disc. Each treatment was replicated into four times.
The seeded plates were then incubated at 25 ± 10C. The observation was taken at 24 hours interval till the pathogen and
biocontrol agent comes in contact with each other. The per cent inhibition on the fungal radial growth was calculated.
For estimation of spores, 1 sq. cm. mycelial blocks were cut from each plate at the point of contact between pathogen and
biocontrol agent. The mycelial mat was removed from the medium and then transferred it to different test tubes containing 5
ml sterile distilled water and shaken for 5 minutes, the spore density per ml from each treatment was estimated by using
haemocytometer.

International Journal of Environmental & Agriculture Research (IJOEAR) ISSN:[2454-1850] [Vol-6, Issue-11, November- 2020]
Page | 33
III. RESULT AND DISCUSSION
TABLE 1
EFFICIENCY OF DIFFERENT TYPES OF BROTH CULTURE MEDIA ON MYCELIUM GROWTH OF ALTERNARIA
ALTERNATA
* Mean of four replication
FIGURE 1: Performance of different culture media on growth of Alternaria alternata
The data presented in the above Table 1, fig.1, is the results of different types of broth culture media test on the growth of
fungi. Among the media statistically significant and maximum growth of Alternaria alternata (dry wt. mycelium) was found
in Potato dextrose (607mg) followed by Host extract (467mg) and Elliote’s media (255mg) while minimum growth was
found in corn meal (195) and Richard’s medium (125). Our present investigation was in corroborate with that of Lipps and
Herr (1980) who reported that maximum growth of Alternaria helianthi was observed on potato dextrose broth and V-8
juice, semi synthethic medium. Similarly, Singh (1994) also reported that Alternaria alternata, an incitant of stalk rot of
sunflower could grow well on Potato dextrose broth among various media under trial.
TABLE 2
EFFECT OF SOLID CULTURE MEDIA ON GROWTH AND SPORULATION OF ALTERNARIA ALTERNATA
* Mean of four replication
S. No. Types of culture media Growth (mg)*
1. Corn meal 195
2. Czapek’s dox 230
3. Elliot’s broth 255
4. Richard’s medium 125
5 Potato dextrose 607
6. Host extract 465
C.D. 5% 4.2
S. No. Media Growth (mm)* No. of spores/ml*
1. Corn meal agar 77 2.6 x 10³
2. Czapek’s dox agar 78 2.8 x 10³
3. Elliot’s agar 81 2.9 x 10³
4. Richard’s agar 62 1.9 x 10³
5. Potato dextrose agar 90 6.2 x 10³
6. Host extract agar 83 3.5 x 10³
C.D. 5% 0.6 -
0
100
200
300
400
500
600
700
Corn meal Czapek’s dox
Elliote’s Richard’s Potato dextrose
Host extract
195 230255
125
607
465
Dry
wei
ght
myc
eliu
m (
mg.
)
Types of media (Broth)
Diff. culture media on growth of Alternaria alterneta

International Journal of Environmental & Agriculture Research (IJOEAR) ISSN:[2454-1850] [Vol-6, Issue-11, November- 2020]
Page | 34
FIGURE 2: Different culture media and its
effect on radial growth of Alternaria alternata
FIGURE 3: Different culture media and its
effect on sporulation of Alternaria alternata
PHOTO 1: Different culture media on linear growth of A. alternate (1).Elliot’s agar (2).Host extracts agar (3). Potato dextrose agar (4).Czapek’s dox agar (5).Richard’s agar, (6).Corn
meal agar
The data presented in the above Table 2. Fig. 2 & 3 were the results of different culture media and its effect on radial growth
of fungus and production of spores. The results found among the tested media that maximum linear growth was found in
Potato dextrose agar (90 mm) followed by Host extract agar (83 mm), and Elliot’s agar (81 mm) whereas mimimum radial
growth was recorded in Richard’s agar (62 mm) and corn meal agar (77 mm). Our finding was in agreement with Allen et al.
(1993) who reported best colony growth of Alternaria helianthi on Potato dextrose agar (PDA), whereas Pandey and
Vishwakarma (1998) reported that maximum radial growth of Alternaria alternata was recorded in Capsicum dextrose agar
and Radish dextrose agar, they also found that synthetic media like Czapek’s dox agar and Richard’s agar supported poor
linear growth of fungus. This might be due to higher nutrient content of the vegetable base media to support growth of the
fungus than those of synthetic media.
It was further observed that all media induce sporulation however, among the tested media maximum sporulation was found
in Potato dextrose agar (6.2 x 10³) and Host extract agar (3.5 x 10
3) followed by Elliote’s agar (2.9 x 10
3) and Czapek’s dox
agar (2.8 x 10³) and minimum sporulation was found in Richard’s agar (1.9 x 10³) and Corn meal agar (2.6 x 10
3). Our
present investigation agreed with that of Shane et al (1981) who asserted that conidia of Alternaria helianthi per colony was
maximum on Potato dextrose agar (PDA). Singh (1994) also reported that maximum sporulation of Alternaria alternata was
found in Potato dextrose broth. Potato dextrose agar supported best mycelia growth and sporulation of Alternaria alternata
(fr.) keissler a causal organism of chickpea blight disease, Singh Virendra et al (2001).
020406080
10077 78 81
6290 83
Rad
ial g
row
th (
mm
)
Types of media (Solid)
Diff. media and radial growth of fungus
2600 2800 29001900
6200
3500
01000200030004000500060007000
Spo
res
cou
nt/
ml.
Types of solid culture media
Diff. media and fungal spore production

International Journal of Environmental & Agriculture Research (IJOEAR) ISSN:[2454-1850] [Vol-6, Issue-11, November- 2020]
Page | 35
TABLE 3
EFFECT OF BIOCONTROL AGENTS ON GROWTH AND SPORULATION OF ALTERNARIA ALTERNATA
S.
No. Treatment
Time taken for
meeting of
bioagent and
pathogenic
fungi (days)
Linear growth
of A.alternata
(mm)*
Spores/ml*
% inhibition over (check)
Linear
growth Spores
1. Trichoderma koningii 5 22.8 1.9 x 10³ 29.4 67.2
2. Trichoderma hamatum 4 22.3 1.5 x 10³ 31.0 74.1
3. Trichoderma harzianum 2 17.5 0.6 x 10³ 45.7 89.6
4. Trichoderma viride 3 19.5 0.9 x 10³ 39.5 84.4
5. Gliocladium virens 4 21.0 1.7 x 10³ 34.9 70.6
6 A. Alteriaria alternata
( check ) - 32.3 5.8 x 10
3 0 0
B. C.D.5% - 2.6 - - -
FIGURE 5: Per cent linear growth inhibition of A.
alternata by different bioagents
FIGURE 6: Per cent spore inhibition of A.alternata
by antagonistic effect of different bioagents
PHOTO 2: Antagonistic effect of biocontrol agent on linear growth of pathogenic fungus (Alternaria
alternata) in dual culture test (1). T. koningii (2). T. hamatum (3). T. harzianum (4). T. viride (5). G. virence
(6). A. alternata (check)
IV. CONCLUSION
The data presented in the above Table 3, Fig. 4 & 5 is the antagonistic effect of biocontrol agents on the growth and
sporulation of Alternaria alternata during dual culture test. It was found all biocontrol agents statistically produced a
significant antagonistic effect on linear growth and sporulation of A. alternata. However, among the bioagents, maximum
29.4 31
45.739.5
34.9
00
10
20
30
40
50
% li
nea
r gr
ow
th in
hib
itio
n
Bio control agents
Per cent growth inhibition of Alternaria alternata
67.2 74.1
89.6 84.4
70.6
00
20
40
60
80
100
% s
po
re in
hib
itio
n
Biocontrol agents
Per cent spore inhibition of A. alternata by bioagents

International Journal of Environmental & Agriculture Research (IJOEAR) ISSN:[2454-1850] [Vol-6, Issue-11, November- 2020]
Page | 36
linear growth inhibition of the pathogenic fungi (A. alternata) was found in Trichoderma harzianum (17.5mm) with 89.6%
inhibition over the check which was found at par with Trichoderma viride (19.5mm) with 84.4% inhibition followed by
Trichoderma hamatum (22.3 mm) with 74.1% inhibition and Gliocladium virens (21.0 mm) with 70.6% and minimum
significant inhibition effect was recorded in Trichoderma koningii (22.8 mm) with per cent inhibition of 67.2 over the check.
It was also observed that highest per cent inhibition of sporulation of A. alternata was found in T. harzianum (89.6) and T.
viride (84.4) followed by T. hamatum (74.1) and G. virens (70.6) while minimum per cent inhibition was found in T.
koningii (67.2). It was observed that T. harzianum could over grown the pathogenic fungus within 2 days and T. viride
within 3 days whereas T. hamatum and G. virens took 5 days. Our finding was in agreement with Basim and Katircioglu
(1990) reported that in dual culture technique, bioagent Bacillus subtilis isolates could produce antagonistic activity against 7
(seven) fungal pathogens including Alternaria alternata. Similarly, Rajeshwari et al. (1998) reported that in dual culture test
maximum inhibition of Macrophomina phaseolina was found in Trichoderma harzianum, Trichoderma viride and
Gliocladium virens but least in Trichoderma koningii. Sudhakar et al. (1998) also reported that in dual culture technique
Trichoderma viride was found superior in inhibiting the growth of Rhizoctonia solani, causal agent of rice sheath blight to
Trichoderma harzianum. They also found lysis of the pathogen with the biocontrol agents.
REFERENCES
[1] Allen, S.J., Brown, J.F and Kochman, J.K (1983) The infection process, sporulation and survival of Alternaria helianthi on sunflower.
Annals of Applied Biology. 102: 413–419
[2] Basim, H and Katircioglu, Y. Z (1990) Studies of in vitro antagonistic effects of some Bacillus subtilis isolates against important plant
pathogenic fungi. Proceeding of the second Turkish national congress of Biological control.
[3] Devi, R.K and Tombisana (1991) Studies on fungi associated with rice sheath rot. Ph. D. Thesis submitted to Manipur University,
Canchipur 117 pp
[4] Goswami, B. K and Mittal, A (2004) Management of root-knot nematode infecting tomato by Trichoderma viride and Paecilomyces
lilacinus. Indian Phytopath. 57 (2): 235-236.
[5] Goswami, B. K and Mittal, A (2002) Effect of some fungal bioagents against root-knot nematode, Meloidogyne incognita infecting
brinjal. Pak J. Nematol. 20 (1): 55-59.
[6] Gupta, D.K (1985) Studies on diseases of Broad bean in Manipur. Indian J. Mycol. Pl. Pathol. 15 (3): 297
[7] Lipps, P.E and Herr, L.J (1980) Alternaria helianthi in sunflower in Ohio. Plant. Dis. 66 (6): 509 – 512
[8] Mittal, A., Goswami, B. K and Chowdhry, P. N (2005) Hyphomycetous fungi from rhizosphere and rhizoplane of root-knot nematode
affected cucurbitaceous crops from trans-Yamuna River Belt of Delhi. Indian Phytopath 58 (4): 480-482.
[9] Pandey, K.K and Vishwakarma, S.N (1998) Growth, sporulation and colony characters of Alternaria alternata on different vegetable-
based media. J. Mycol. Pl. Pathol. 28 (3): 346–347
[10] Rajeshwari, B.J., Chandrasekhara, K and Pramod Chandra Kumar, C (1998) Antagonism of Trichoderma sp. and Gliocladium sp.
against Macrophomina phaseolina, the incitant of dry root rot of mungbean. Indian J. Plant Prot. 26 (1): 9 – 11
[11] Shane, W.W., Baumer, J.S and Sederstrom, S.G (1981) Altenaria helianthi, a pathogen of sunflower new to Minnesota. Plant Disease
65(3): 269–271
[12] Singh, M.G (1994) Studies on stalk rot of sunflower caused by Alternaria alternata (Fr.) Keissler in Manipur. M.Sc. (Agri.) thesis
submitted to CAU, Imphal. 49 pp
[13] Singh, V., Kumar, P and Sinha, A.P (2001) Influence of different media, pH and temperature on growth and sporulation of Alternaria
alternata (fr.) keissler causing Alternaria blight of Chickpea. Legume Research- An International Journal. 24(4): 238-242
[14] Sudhakar, R., Rao, K.L and Reddy, C.S (1998) Studies on antagonism of Trichoderma and Gliocladium sp. against Rhizoctonia solani
of Rice. Indian J. Plant Prot. 26 (1): 25 – 29
[15] Vincent, J.M (1927) Distortion of fungal hyphae in Presence of certain inhibitors. Nature 159 : 850.

International Journal of Environmental & Agriculture Research (IJOEAR) ISSN:[2454-1850] [Vol-6, Issue-11, November- 2020]
Page | 37
The Impact of Population Growth on Natural Forests in Rwanda
Christine UWIRAGIYE1, Abias MANIRAGABA
2
1Initiative for Development and Environmental Awareness in Rwanda (IDEAR)
2Department of Environmental Economics and Natural Resources Management, University of Lay Adventist of Kigali
(UNILAK)
Abstract— Deforestation is a growing problem in many parts of the tropical world and one of the affected countries is
Rwanda. The general objective of this study is to assess the effect of population growth on natural forest resource in Rwanda
in general. Thus, this research focused on assessing the impact of population growth on natural forest of Rwanda. It
critically examines how the population growth can impact natural forest. To achieve the set objectives, a cross sectional
research design was combined with qualitative and quantitative approach. We collected secondary data from National
Statistics Institute of Rwanda (NSIR), Ministry of Environment (MOE), Rwanda Environmental Management Authority
(REMA), etc. The study adopted descriptive approaches in processing data. The findings show that above 45.27% of natural
forests have been lost from 1984 to 2015 due to the high rate of population growth in Rwanda. As a recommendation, faced
with a dense and rapidly increasing population on a fragile land resource, Rwanda must take steps towards transforming the
economy and eliminating poverty through a Green Growth program. Family planning must be also adopted in reducing the
impact of population growth on natural forestry preservation.
Keywords— Population Growth, Natural forests, Deforestation.
I. INTRODUCTION
Deforestation is a growing problem in many parts of the tropical world and one of the affected countries is Rwanda. The
population of Rwanda is 13,056,337 as of Saturday, October 31, 2020, based on Worldometer elaboration of the latest United
Nations data. Rwanda has the most densely populated mainland African Country. In addition, the spread of poverty, the
environmental degradation especially deforestation is due to local clearing of forest for their personal needs, such as for fuel
and agriculture. Deforestation is indiscriminate cutting or overharvesting of trees for lumber or pulp, or to clear the land for
agriculture, ranching, construction, or other human activities.
Forest is the resource that provides many benefits to the society. In addition to providing wood, forests provide a habitat for
wild life, site for recreation, wildness, watershed protection and many other benefits. Forests worldwide are absorbing more
CO2 from the air but they come up short when it comes to sucking up the vast amounts of CO2 emitted by humans into the
atmosphere (Cross, 2019).
The impact of demographic changes on forests and the environment is often discussed in terms of biological carrying
capacity, i.e. the maximum number of individuals that a resource can sustain. However, many factors influence carrying
capacity, such as economic development, sociopolitical processes, and trade, technology, and consumption preferences
(Bijendra, 2009).
Faced with a dense and rapidly increasing population on a fragile land resource, Rwanda had a steady increase in the
population growth rate since 1960sdue to changes in different socioeconomic conditions in the world. So, where there is
rapid population growth, environmental degradation cannot miss. For instance, according to Forest Investment Program for
Rwanda, the natural forest cover of Rwanda was 429,728.47 Hain 1984 but has declined to 235,192.27 Ha in 2015. This
means that over 45.27%of Natural forests in Rwanda have been lost.
Rapid population growth and the low economic standard of living in Rwanda have brought in their awake numerous
consequences to land cover and use changes, change in climate and hydrological status in the country. In Rwanda studies
have indicated that as there is agricultural land expansion at the expense of other land uses. Rwandan lands are fragile and
forest, water and its biodiversity is climate dependent, which are still under stress due to population pressure and
mismanagement of natural resources. The poverty stricken economy of Rwanda needed scientific management of its natural
resources and balancing the population to cope up with the climate change and the challenges of the globalization of

International Journal of Environmental & Agriculture Research (IJOEAR) ISSN:[2454-1850] [Vol-6, Issue-11, November- 2020]
Page | 38
economy. Thus, there is a need to review the population and environment interrelation at the country level in order to suggest
the means to minimize adverse effect of population pressure on environment.
The general objective of this study is to assess the effect of population growth on natural forests resource in Rwanda in
general.
II. MATERIALS AND METHODS
2.1 Description of Study area
Rwanda has a population of over 12.6 million, living on 26,338 km2 (10,169 mi
2) of land, and is the most densely populated
mainland African Country (United Nations, 2019). According to official data from the World Bank and projections from
Trading Economics 2019, the Gross Domestic Product (GDP) in Rwanda was worth USD 10.12 billion, 24.07 % of which is
contributed by Agriculture, upon which around 72% of the working population employed in agriculture (FAO, 2015).
FIGURE 1: Map of Republic of Rwanda National Forests Cover
2.2 Data Collection
From 1960 to 2015, secondary data was collected from National Statistics Institute of Rwanda (NSIR), Ministry of
Environment (MOE), Rwanda Environmental Management Authority (REMA), etc. We collected data on different projects
related to natural forests and population growth in Rwanda. Secondary data involved different reports at the park levels,
especially those from community partnership and ranger based monitoring programs.
2.3 Data analysis
We put all data in our computer and for data analysis we used SPSS and presented our data with tables and histograms.
III. RESULTS
3.1 Population Growth
Population growth trends in Rwanda from 1955 to 2017 is shown in below figure 2.

International Journal of Environmental & Agriculture Research (IJOEAR) ISSN:[2454-1850] [Vol-6, Issue-11, November- 2020]
Page | 39
FIGURE 1. Population growth trends in Rwanda from 1955 to 2017
3.2 Natural Forest cover
Change over time from 1984 to 2015 of key natural forests in Rwanda is shown in below table 1.
TABLE 1
CHANGE OVER TIME FROM 1984 TO 2015 OF KEY NATURAL FORESTS IN RWANDA
Name of the Forest Area (ha) 1984 Area (ha) 2015 % Loss
Buhanda Natural Forest 1116 18 98.40%
Gishwati Natural Forest 21213 1440 93.20%
Mashyuza Natural Forest 85 6 92.70%
Ibanda-Makera Natural Forest 1425 169 88.10%
Karama Natural Forest 3235 1061 67.20%
Dutake Natural Forest 31 11 65.70%
Karehe-Gatuntu Natural Forest Complex 48 19 60.30%
Nyagasenyi Natural Forest 45 19 58.20%
Akagera Natural Forest 267,741 112,185 58.10%
Mukura Natural Forest 4376 1988 54.60%
Sanza Natural Forest 49 24 51.00%
Mashoza Natural Forest 36 18 51.00%
Muvumba Natural Forest 1286 688 46.50%
Ndoha Natural Forest 39 29 26.00%
Kibirizi-Muyira Natural Forest 454 352 22.40%
Busaga Natural Forest 191 159 16.90%
Nyungwe National Park 112,230 101,005 10.00%
Volcanoes National Park 16,128 16,004 0.80%
Total 429728 235195 45.27%
IV. DISCUSSION
As the figure above shows between 1960 and 2007, natural forests declined considerably by about 45.27% due to different
anthropogenic activities and resettlement of refugees. According to Forest investment Plan for Rwanda, the main drivers of
deforestation and forest degradation in Rwanda are: (i) Agriculture, with 95% of households practicing traditional
subsistence agriculture on small plots that have degraded soil structure and fertility due to continuous cultivation, (ii)
Infrastructure development, (iii) Urbanization including the growing of built-up area, which increased by over 300% in the

International Journal of Environmental & Agriculture Research (IJOEAR) ISSN:[2454-1850] [Vol-6, Issue-11, November- 2020]
Page | 40
period from 1990 to 2016, (iv) artisanal mining practices, with a high increase in issued mining permits but no restoration of
abandoned mining sites, (v) Forest product extraction, mostly firewood, charcoal and timber and (vi) Limited forestry
extension services
These drivers derive from different socio-economic factors including: (i) high population growth, with 83.5% living in rural
areas and 16.5% in cities, the increasing pressure on forests from agriculture, urbanization and exploitation of forest
resources are linked to the high population with limited land to sustain their livelihoods; (ii) Lack of awareness and
alternatives, which has led to the failure of different projects aiming to promote sustainable forest management and full
engagement of local communities. A brief summary of the impact of the agricultural, livestock, oil and mining sectors and
their impact on the forestry sector and forest management is presented in Table 2 below.
TABLE 2
ANALYSIS OF LIVESTOCK, AGRICULTURAL, OIL AND MINING SECTORS AND THEIR IMPACT ON THE FORESTRY
SECTOR AND FOREST MANAGEMENT Analysis of sectoral problems related to forestry Impact on the forestry sector and forest management
Agriculture
Population pressure coupled with farming land
scarcity leading to unsustainable farming practices
(no fallowing of land, limited use of fertiliser inputs
and in many cases poor or inadequate soil
conservation practices; hence over-cultivation,
erosion and low yields).
Some farmers are still practicing traditional farming
practices.
Deforestation within farming areas
Expansion onto fragile ecosystems, including shrub
lands (especially in the Eastern Province);
marshlands and lands on steep and very steep slopes
Livestock
Despite the zero grazing policy, some livestock
keepers are still grazing out in ranches or other
pastures
Overgrazing of available pastures leading to grazing
even on forest lands
Oil and Mining
Some mining sites are located in forests (e.g.
Mukura Forest)
Artisanal mining is most dominant throughout the
country and in most cases mined areas are not
effectively restored.
Mining causes scarring of the landscape and often
leaves behind waste rock and tailings heaps.
There is also pollution of water streams and severe
contamination of fields downstream of mines.
Deforestation and forest degradation due to mining
activities in forests
Environmental degradation, pollution of water
supplies, negative social impact in communities as
mainly practised by young men
V. CONCLUSION AND RECOMMENDATION
According to the Ministry of Environment (MOH), forests currently cover around 30 % (10.3 % natural and 19.7 %
plantations) of the dry land area of the national territory. Forests are the major source of domestic cooking energy, with
86.3% of the Rwanda population using bio-fuels in different forms, wood and charcoal being the dominant ones (MOH,
2017).
Forests also provide the foundation for Rwanda’s tourism opportunities, and also protect watersheds, downstream wetlands
and support agriculture. However, due to dense and rapidly increasing population on a fragile land resource, forests have
been threatened by deforestation and continuous degradation.
Forests in Rwanda continue to occupy a high-table position as a major resource providing multiple functions to the
population’s livelihoods, supporting the equilibrium of the ecosystem and contributing to national socio-economic
development.
Thus, sustainable management and use of natural resources and ecosystem services is well recognized as an important
ingredient for sustained economic development and improvements in human welfare, and therefore is necessary for
achieving the Sustainable Development Goals (SDGs). Environmental assets, such as soil, water and biodiversity, yield

International Journal of Environmental & Agriculture Research (IJOEAR) ISSN:[2454-1850] [Vol-6, Issue-11, November- 2020]
Page | 41
income, offer safety nets for the poor, maintain public health and drive economic growth. Yet environmental sustainability
goals are often seen as distinct from, and sometime in conflict with, development goals(KTH, 2016).
The direct causes of land degradation are mainly deforestation, overgrazing and overcutting, shifting cultivation and
agricultural mismanagement of soil and water resources: such as non-adoption of soil and water conservation practices,
improper crop rotation, use of marginal land, insufficient and/or excessive use of fertilizers, mismanagement of irrigation
schemes and over pumping of groundwater. The indirect causes of land degradation are mainly population increase, land
shortage, short term or insecure land tenure and poverty and economic pressure (FAO, 2015).
The economic contribution of forest are associated with the production, consumption of goods and services, the supply of
fuel wood, construction materials and timber come mainly from forest.
The rapid deforestation or the declining of forest accompanied by variety of other environmental problems is caused by
agricultural expansion and wood gathering. The major factors contributing to deforestation are poverty, low level of income
and population growth.
For this reason households have to depend on clouding for their fuel consumption and this is hampering the farmers from
using organic manure as fertilizer for their already degraded farmlands. The wide range of topography has contributed to the
presence of enormous biological and cultural diversity.
One of the solutions proposed to arrest forest degradation in certain area is to introduce the practices of participatory forest
management by involving the local people. The result of this study reveals that population growth huge impact on forestry
development in the ways of expanding agricultural land, using wood as energy sources and satisfying the input requirements
in agricultural activity. We also recommend Rwandans to use family planning services in reducing the impact of population
growth on the forestry development.
REFERENCES
[1] United Nations. (2019, December 1). List of countries by population (United Nations). Retrieved October 20, 2020, from
www.en.wikipedia.org: https://en.wikipedia.org/wiki/List_of_countries_by_population_(United_Nations).
[2] Bijendra, B. (2009). Impacts of Demographic Changes on Forests and Forestry in Asia and the Pacific. Bangkok: FAO.
[3] Cross, D. T. (2019, March 25). Forests absorb more of our CO2 emissions but hardly enough. Sustainability times , pp. 1-3.
[4] FAO. (2015). Retrieved October 20, 2020, from http://www.fao.org/rwanda/our-office-in-rwanda/rwanda-at-a-glance/en/.
[5] KTH. (2016). Sustainability goals combining social and environmental aspects. Stockholm: Eléonore Fauré.
[6] MOH. (2017). Rwanda National Forest Policy 2017. Kigali: Ministry of Natural Resources.

International Journal of Environmental & Agriculture Research (IJOEAR) ISSN:[2454-1850] [Vol-6, Issue-11, November- 2020]
Page | 42
Factors Influencing Adoption of New Irrigation Technologies on
Farms in Morocco: Application of Logit Model Taoufik YATRIBI
National School of Agriculture in Meknès, Rural Economy Department, BP S/40 - 50 000 Meknès - Morocco
Abstract— The objective of this article is to identify the determinants of the adoption of new irrigation technologies in
Moroccan agriculture. The research is carried out on a sample of 82 farmers from the Souss-Massa region (Morocco). The
results from the estimation of a binary logit model show that the variables: Age, level of education, non-farm income,
perceived utility, possession of a computer, farm size, access to credit, ease of use, influence the probability of adoption of
new irrigation technologies among farmers. The theoretical and managerial implications of this research are discussed.
Keywords— Precision agriculture, technology adoption, irrigation, logit model, Souss-Massa region.
I. INTRODUCTION
In Morocco, the digitization of agriculture has started to gain more interest in recent years from various public and private
actors. The last edition of the International Exhibition of Agriculture in Morocco (SIAM 2020) which was scheduled for
April 2020 devoted its theme to technological innovations in agriculture, with the slogan "The future of agriculture lies in
technological innovations ". The COVID-19 health crisis has reinforced this need to move to a digital economy, especially
when this pandemic has crippled many sectors, threatening food security. The agricultural sector is then one of the most
affected sectors. Empirical studies suggest that new technologies have positive agronomic, economic and environmental
effects [1]. Experts now agree that technological innovation is an asset to save time and precision for the good of the farmer,
the operation and the environment.
Today, Moroccan agriculture sector seems by far a sector where technological innovations are omnipresent. Unfortunately,
we haven’t the figures on the use of new technologies in the agricultural sector, but according to the World Economic Forum
(WEF) in 2019, relating to information and communication technologies (ICT) at the global level, Morocco is ranked 100 out
of 176 in the ICT Development Index, and 78 out of 139 in the NRI Index ranking (Networked Readiness Index), which
gives us an idea of the level adoption of new technologies at the national level. At this level, precision agriculture (PA)
appears to be a major asset for making agriculture an innovative and responsible sector. The literature indicates that PA
technologies have one thing in common: optimizing agricultural production. PA technologies now allow farmers to apply the
right dose of input at the right time, reduce the use of phytosanitary products, predict the outbreak of diseases in a plot,
reduce energy consumption fossil fuel and accurately determine water requirements.
The Souss-Massa region, the Kingdom's main agricultural area, and one of the main centers of economic growth thanks to
projects initiated under the Green Morocco Plan. However, agricultural activities are threatened by their dependence on water
resources. With intensive use of irrigation gradually and dangerously depleting groundwater resources, the region's dam fill
rate has fallen from 41.73 percent last year to 24 percent this year. The introduction of new precision farming technologies
has become a necessity for a more rational use of natural resources.
The adoption of technologies by farmers is the starting point for agricultural development, of which farmers are the actors,
and technologies are the tools of this development. Adoption in itself is a complex part of this subject. Previous studies show
that the adoption of technology depends on many factors (socio-demographic, economic, institutional, ..), and the farmer is at
the center of the decision to adopt and accept the technology. The reality is that Moroccan farmers are so attached to their
habits and practices, and therefore they are used to the use of traditional techniques.
In this perspective, this work is positioned downstream of the decision to adopt new irrigation technologies (NT), it is
intended to explain the adoption of NT from PA, by putting focus on three irrigation technologies, namely: Capacitive
probes, weather stations, and mobile applications. Questions arise: On what can the adoption decision of the Moroccan
farmer depend? Depending on the determinants of adoption, what may be the implications and challenges for the Moroccan

International Journal of Environmental & Agriculture Research (IJOEAR) ISSN:[2454-1850] [Vol-6, Issue-11, November- 2020]
Page | 43
agricultural sector? The interest of this research lies in the understanding of the factors which lead the farmer to the adoption
of the NT which are essential at the same time for the decision makers, the diffusers of these technologies (companies), and
for the researchers who study the determinants of growth. Interest in digitization, especially with the arrival of the COVID-
19 pandemic, has only increased in recent times. The public authorities therefore need to understand the mechanisms of
adoption by the farmer in order to be able to put in place a strategy for the development of digital agriculture.
II. THEORETICAL FRAMEWORK AND RESEARCH HYPOTHESES
The literature review allowed us to identify several variables that may influence the adoption of precision agriculture
technologies. We have grouped these variables into four groups of explanatory variables: individual factors, organizational
factors, environmental factors, and technological factors.
2.1 Individual factors
Age is identified as a determining factor in adoption. Older farmers tend to be conservative and reluctant to change and adopt
technologies due to risk aversion [2] [3] explains that older farmers are more risk averse, less motivated to experiment with
NT, less likely to be influenced by the benefits of NT. [4] explains that young farmers are more open to innovations and
more likely to adopt new technologies. In the same way, [5] add that sometimes the adoption of technologies by older
farmers is explained by the high investment costs, and that these farmers already have the means for their acquisition unlike
the younger ones.
Hypothesis 1: Age has a negative effect on the adoption of new technologies.
The education level is highlighted by many authors as a determinant of the adoption of NT [5]–[7]. For example, [2] find that
the adoption rate increases with the level of a farmer's education, especially if it’s advanced technology, and that learning is
necessary for its use. The education level makes it easier for the farmer to use it, but also becomes someone more open to
innovation.
Hypothesis 2: The education level has a positive effect on the adoption of new technologies.
On the other hand, the cost of acquisition has been closely linked in the literature to farm and non-farm income. Research
results show that the higher the farm income, the more likely the farmer is to adopt new technologies [8]. The existence of
off-farm income also increases the chances of adoption [9] [10] explains that for farmers with moderate income, non-farm
income provides cash that can help the farmer learn NT. Access to off-farm income generating activities is generally
associated with technology adoption [11] found that adoption has high costs, and that higher-income farmers are more likely
to adopt them [12] showed that a 10% increase in income from agriculture was associated with a 9.2% increase in the
chances of a producer adopting these technologies.
Hypothesis 3a: High agricultural income has a positive effect on the adoption of new technologies.
Hypothesis 3b: The existence of non-farm income has a positive effect on the adoption of new technologies.
On the other hand, farmers are more likely to adopt NT after seeing their usefulness in the field [3], [9]–[11], [13], [14]. For
example, [15], in a study on the adoption of technologies in the dairy industry in Italy, he indicates that the demonstration of
NT is practically done within the networks of farmers, which then pushes them to adopt the same technology [16] adds that
cleaner production techniques (CPT) will only be adopted when farmers perceive their usefulness and the satisfaction of
other farmers who have already adopted this technology.
Hypothesis 4: Perceived utility has a positive effect on the adoption of new technologies.
Another important factor that affects adoption is the attitude to risk. Some farmers prefer to work with the means at their
disposal rather than invest in NT [8]. One of the reasons for this reluctance is uncertainty, first about the use of technology,
and second about the economic return. For example, when the market price of agricultural products falls, farmers tend to
invest less in capital (machine, innovation, etc.). For example, [10] points out that farmers who have less uncertainty about
the economic return of NRVs are more likely to invest in these technologies. Complex technologies require additional

International Journal of Environmental & Agriculture Research (IJOEAR) ISSN:[2454-1850] [Vol-6, Issue-11, November- 2020]
Page | 44
investment in learning [9] adds that a modest level of skills and know-how negatively influence adoption. Its results show
that technologies that require a lot of skill and technical know-how decrease the likelihood of their adoption.
Hypothesis 5: Risk attitude has a negative effect on the adoption of NT.
Computer use in farm management has been associated with the adoption of certain technologies such as the personal digital
assistant (PDA) [17], or the Autosteer GPS guidance system [13] [17] explains that farmers who use computers in
administrative management (for mail, invoicing, accounting, inventory and human resource management, etc.) may be more
likely to adopt PA technology [5] postulate that farmers who are open-minded about technological advancement are also
more supportive of technology adoption on their farms.
Hypothesis 6: Possession of a computer has a positive effect on the adoption of NT.
2.2 Organizational factors
Farm size is identified as a determinant of adoption. [6] explain that large farms are more complex to manage, NT have been
shown to be effective in optimizing production and reducing costs [18] explain that the farm size is linked to the adoption of
NT, as the farmer tends to devote some of his land to trying a NT first, unlike small farms. These findings align with several
research studies on the adoption of PA technologies [4]–[6], [15], [19].
Hypothesis 7: The size of the farm has a positive effect on the adoption of new technologies.
On the other hand, [10] show that the lack of a title deed significantly decreases the likelihood of farmers adopting the
technologies. This is because farmers with title deed are more likely to adopt practices that improve the soil compared to
those who are in rental. Studies [12], [20] indicated that farmers who had obtained certificates of ownership felt more secure,
which enabled them to make long-term investments. This is the case for example with drip irrigation; its non-adoption is
most often linked to the rental status which does not benefit from subsidies.
Hypothesis 8: The absence of a title deed has a negative effect on the adoption of NT.
2.3 Institutional factors
Our exam of the literature showed the importance of the role by public services for encouraging the adoption of new
technologies. It has been shown that awareness [21], [22], access to agricultural extension services [22], credit facilities and
aggregation practice [7], [10], [18], [23] are essential to encourage the adoption of technological innovations [22] find that
training and extension are means of raising awareness and supporting the adoption of watershed management practices [5]
stress the importance of good advice, and offer the necessary information. The author points out that the lack of counseling
and training is a barrier to adoption, and that internet availability alone is not a sufficient factor for farmers.
Hypothesis 9: The presence of a consulting service has a positive effect on the adoption of NT.
Farmers' access to credit services is identified as a determinant of the adoption, because bank credit allows farmers to have
other financial resources, and therefore invest in new technologies. Several studies [7], [18], [23] conclude that farmers'
access to credit services increases the likelihood of technology adoption [10] have shown that subsidies and taxation are tools
for adopting new technologies [21] indicated that the adoption of green manure is strongly linked to certain government
measures, such as subsidies for maintenance, reduction of tax for adopters, reduction of interest rate [23] show that the
variable amount of subsidy is strongly correlated with the probability of adoption, the higher this amount, the greater the
probability of adoption. In other words, the difficulty in accessing subsidies was associated with a relatively low adoption
rate. The more difficult it is for farmers to access subsidies, the lower the likelihood of them adopting drip.
Hypothesis 10: Access to credit has a positive effect on the adoption of NT.
2.4 Technological factors
The cost of acquiring technology is often identified as a determinant of adoption [6], [7], [24]–[26] [5] point out that the
majority of farmers are reluctant to introduce precision farming techniques mainly because of their high costs. Large farms
are more likely to adopt precision farming technologies compared to small farms due to their financial capacity [10].

International Journal of Environmental & Agriculture Research (IJOEAR) ISSN:[2454-1850] [Vol-6, Issue-11, November- 2020]
Page | 45
Hypothesis 11: The more the farmer perceives the cost of the technology, the lower the probability of adoption.
Ease of use is identified as an important factor in the adoption of PA technologies [21] find that farmers' intention to adopt
EWS is influenced by perceived ease of use, subjective norms and perceived behavioral control. The authors show that
farmers' perception of the ease of use of PA technology has a significant impact on its adoption. A farmer who perceives PA
technology as complex or difficult to use is therefore less likely to adopt it [27].
Hypothesis 12: The perception of ease of use has a positive effect on the adoption of new technologies.
The figure below summarizes the variables that may explain the adoption of NT.
FIGURE 1: Proposed model to explain adoption of NT.
III. METHODOLOGY
In this section, we detail the methodology of the empirical study. First, we specify the research approach (3.1), the nature of
the sample and the data collection method, then (3.2) we present the data analysis procedure (3.3).
3.1 Justification of the research approach
The already significant literature on the variables used in this research invited us to have a hypothetico-deductive approach.
Indeed, [28] recall that when theoretical work provides enough knowledge on the phenomenon studied and lays intellectually
consistent and empirically relevant theoretical bases, the deductive approach is desirable.
3.2 Sample and data collection
Our data collection was carried out in the region of Souss-Massa (Morocco). To collect the data, we opted for remote surveys
during the month of April 2020. This choice is justified because of the health crisis (COVID-19), and the obligation of social
distancing. A questionnaire was developed based on our theoretical framework. It is composed of four parts: Individual
factors, organizational factors, institutional factors and technological factors. Table 1 gives an overview of all the variables,
and the response methods.
We contacted the public services and companies supplying new technologies in the region to obtain the telephone directories
of the farmers. A telephone directory of 130 farmers has been established. A pre-test was carried out on a sample of 10
farmers to test and adapt the questionnaire.
In order to be able to effectively explain the phenomenon studied, a large sample is needed. Otherwise, the results will be of
limited scope, which could constitute a limit to the model used. Concretely, the rule is that for each explanatory variable, it
will take at least between five to ten observations. In our case, we have retained thirteen variables, that is to say a minimum
of total observations ranging between [65; 130[. And since we have made 82 observations, the minimum number required for

International Journal of Environmental & Agriculture Research (IJOEAR) ISSN:[2454-1850] [Vol-6, Issue-11, November- 2020]
Page | 46
logistic regression modeling is reached. While such a sample doesn’t make it possible to ensure the representativeness of the
results obtained and to seek external validity, it already leaves the possibility of improving our knowledge of the process of
adoption of NT by farmers.
TABLE 1
BRIEF DESCRIPTION OF VARIABLES USED IN THE LOGIT REGRESSION MODEL
Variable Type Description
Adoption of NT Binary 1 = Yes ; 0 = No
Age Categorical 1 = <45 ; 2 = 45-60 ; 3 = Plus 60
Level of education Categorical 1 = Illiterate ; 2 = Primarylevel ; 3 = Secondarylevel ;4 = ≥ Bac+3
Farmincome Continuous -
Non-Farmincome Binary 1 = Yes ; 0 = No
Perceived utility Scale 1 = Not at all useful; 2 = Not useful 3 = Useful; 4 = Very useful
Risk attitude Scale 1 = Not at all risky; 2 = Not risky; 3 = Risky; 5 = Very risky
Possession of a
computer Binary 1 = Yes ; 0 = No
Farm size Categorical 1= <20 ; 2= 20 – 50 ; 3= 50 – 100 ; 4= >100
Land tenure Binary 1 = Property ; 0 = Location
Financial support Binary 1 = Yes ; 0 = No
Consulting survice Binary 1 = Yes ; 0 = No
Technologycoast Scale 1 = Not at all high; 2 = Not high 3 = High; 4 = Very high
Easy of use Scale 1 = Very easy; 2 = Easy; 3 = Difficult; 4 = Very difficult
3.3 Data analysis procedure
The adoption of new technologies is a YES or NO type choice, which refers to the Probit and Logit models which have been
widely developed and used to study choice problems with binary dependent variables [29], [30].
The logit model is written as follows: (𝒀ǀ 𝑿) = P (Y=1ǀ X) =L(𝐗′𝛃)
Estimation in such a nonlinear model is more often based on the principle of maximum likelihood than on the principle of
least squares. By the principle of maximum likelihood, we seek to calculate the value of the parameter 𝛽 which maximizes
the function L(𝛽|𝑋𝑛). It is equivalent to find the parameter which maximizes the log-likelihood: l|Xn=ln L(β|Xn )
= 𝑌𝑖 ln𝐺 𝑋′𝑖𝛽 + (1− 𝑌𝑖) ln 1 − 𝐺(𝑋′𝑖𝛽
𝑛
𝑖=1
IV. RESULTS AND DISCUSSIONS
In this part, we present a descriptive overview of our sample (4.1), and then we present the results of the research hypothesis
tests (4.2).
4.1 Descriptive overview of the sample
All the agricultures in our sample are managed by men, with an average age of 45 years.
The distribution of farmers in our sample by educational level shows that 35% of farmers have a higher education than BAC
+ 3. 42% are illiterate, and 23% have primary and secondary levels.
Regarding the size of the farms surveyed, our sample is made up of farms with an area ranging from 2 ha to 800 ha. Almost
40% of the farms in our sample have a size between 5-20ha, 15% have a size between 20 and 50ha; 15% are between 50 and
100ha, and 30% are over 100ha.

International Journal of Environmental & Agriculture Research (IJOEAR) ISSN:[2454-1850] [Vol-6, Issue-11, November- 2020]
Page | 47
For the type of crop, market gardening is identified as the main crop in 62% of the farms in the sample, against 38% for
citrus.
For land tenure, rental is dominant; it represents 57% of the farms in our sample. The rest are private property.
Finally, concerning the direction of production, 43% of the production of farms is intended for the local market, 40% is
reserved for export, and 17% of production is intended for processing.
4.2 Estimate of the Logit model of adoption of new technologies
Our dependent variable is NT adoption, which is a binary variable taking the value 0 if the farmer doesn’t adopt any
technology, versus the value 1 if the farmer adopts the three technologies pack aforementioned. The results of the estimation
of the binary logistic model are presented in Table 2.
The model fits well, having fulfilled the conditions of a predictive model. Based on the forward selection method, the best fit
model was created in six steps with the likelihood ratio test. Nagelkerke's R² of 0.52 indicates a satisfactory relationship
between the independent variables and the dependent variable. R² logit is 0.39, which means that almost 40% of the
variability in the probability of adoption is explained by the variables of the final model. We can then look at the Hosmer-
Lemeshow test. This indicates whether there is a significant difference between the predicted and observed values. The
ranking table shows that our model is able to correctly predict 73.4% of adoption cases, indicating a good fit of the model.
Following the ascending method (Forward selection), and the likelihood ratio test (LR), only significant variables appear in
the final model. The influence of the variables is expressed by the values of the logistic coefficients (B), and the odds-ratios
are expressed by E [B].
TABLE 2
RESULTS FOR NT ADOPTION TESTED BY BINARY LOGISTIC REGRESSION
Variable Coefficient
B Std, Error Wald X² Prob. E[B]
Age -0,221 0,091 5,90 0,007*** 0,802
Level of education (≥ Bac+3) 0,68 0,027 634,29 0,0012*** 1,974
Non-Farmincome(1 : Yes) 0,1823 0,054 11,40 0,012* 1,200
Perceived utility 0,1118 0,068 2,70 0,015* 1,118
Possession of a computer(1 : Yes) 0,096 0,047 4,17 0,0501* 1,101
Farm size (>100ha) 0,177 0,051 12,04 0,000*** 1,194
Farm size ([50 – 100ha]) 0,089 0,021 17,96 0,028* 1,093
Financial support(1 : Yes) -0,118 0,045 6,88 0,031* 0,889
Easy of use 0,168 0,021 64,00 0,000*** 1,183
C 5,501 1,124 23,95 0,021* 244,937
Note : Method: forward selection (likelihood ratio), dependent variable: NT Adoption (0 = no adoption; 1 = adoption of NT); original
model (-2Log-Likelihood): 530,107; Full model (-2 Log-Likelihood):324,710; Chi squared: 205,389***; R² (Cox and Snell) = 0.355; R²
(Nagelkerke) = 0.523; Hosmer–Lemeshow test: Chi squared = 11,489, df = 5, Sign. 0,176 (n.s); R²logit = 0.399 Classification (model):
74.5%; N = 82; *p ≤ 0.05, **p ≤ 0.01, ***p ≤ 0.001.
The age of the farmer negatively affects the adoption of new technologies (β1 = -0.221, p <0.01). A farmer who belongs to
the age group of 60 and over decreases the probability of adoption by 22.1%. This result is consistent with the literature. For
example, [4] find that the age of the farm manager has a negative effect on the likelihood of adopting irrigation technologies.
For his part, [3] explain that older farmers are more reluctant to change, less motivated to experiment with new technologies,
less likely to be influenced by the benefits of new technologies. Hypothesis H1 is validated.
The level of education of the farm manager has a positive impact on adoption (β2 = 0.68, p <0.01). According to the results
obtained, a farmer with a level of education of Bac + 3 or more, increases the probability of adoption by 68% compared to an
illiterate. The latter is half as likely as the former to adopt NT. This result is consistent with the results of several studies [5]–
[7], [31]. For example, [2] find that the adoption rate increases with the level of education of the farmer, especially if the
technology is advanced, and learning is necessary for its use. The H2 hypothesis is validated.

International Journal of Environmental & Agriculture Research (IJOEAR) ISSN:[2454-1850] [Vol-6, Issue-11, November- 2020]
Page | 48
On the other hand, we didn’t find a significant link between farm income and adoption. This result can be explained by the
fact that the farmers in our sample haven’t sufficient income to invest in or experiment with new technologies. Hypothesis
H3a is rejected. On the other hand, the existence of a non-agricultural income (or a secondary activity) increases the
probability of adoption by 18.23% compared to a farmer who doesn’t have a non-agricultural income (β5 = 0.1823, p <0.10).
This result is similar to that of [9] who point out that the existence of a non-agricultural income increases the chances of
adopting NT. Indeed, [10] explain that for farmers with moderate income, off-farm income provides cash that can help the
farmer to acquire new technologies. The H3b hypothesis is validated.
For perceived utility, the results of the estimate show that it has a positive effect on adoption (β5 = 0.1118, p <0.05). This
result is consistent with several studies, the authors agree that farmers are more likely to adopt new technologies after seeing
their usefulness [8], [13]–[15]. Hypothesis H4 is validated.
As for Risk Attitude, we didn’t find a significant link with adoption. In the literature, it’s stated that risk aversion is often
linked to the cost of investing in NT. Indeed, an investment in drip or in the use of drones requires a significant budget. In
our study on the adoption of NT (capacitive probes, weather station, applications on smart phone), their costs aren’t high,
moreover there is the possibility of reselling them on the second-hand market. Hypothesis H5 is rejected.
On the other hand, having a computer slightly affects adoption (β5 = 0.0122, p <0.05). The probability of adoption increases
by 1.22% if the farmer already has a computer before the adoption. This result is similar to that of [13], who find that
computer use in farm management is correlated with the adoption of certain technology (such as the autosteer GPS guidance
system). Computer use is one indicator that shows farmers are open to technology. As pointed out [5], farmers who are open-
minded about technological progress are also more favorable towards technology adoption. Hypothesis H6 is validated.
As for the size of the farm, the results from the model estimate show that this has a positive impact on the adoption of
technologies. However, this positive effect is not felt in the same way depending on the area class. Indeed, farms whose size
is between 50 and 100 hectares, increase the probability of adoption by 8.9% (β5 = 0.089, p <0.01), while farms whose size
is more than 100 hectares increase the probability adoption rate of 17.7% (β5 = 0.17, p <0.01) compared to the area of less
than 20 ha. This result is consistent with several studies [10], [13], [15]. This is mainly due to the fact that large farms are
more complex to manage, hence the need to use new technologies to optimize production and reduce costs. Hypothesis H7 is
validated.
The results of our estimations didn’t establish a significant association between the land tenure variable (property title) and
adoption. This can be explained by the type of NT in question. In fact, almost half of the farmers in our sample own their
land. Studies [20], [26] have shown that farmers who have ownership certificates felt more secure to invest in NT, but it also
depends on the nature of this investment, particularly if it’s a long-term investment. As in the case of drip, which requires
significant investment, which often farmer owners who adopt NT. Hypothesis H8 is rejected.
Although agricultural advice also has a positive impact on the adoption of NT [5], [18], [32], our results didn’t lead to a
meaningful relationship. This can be explained by the council’s goals in relation to digitization and the introduction of NT.
We questioned the farmers whether they had participated in training or awareness-raising workshops on NT. It turned out
that the themes discussed during these meetings are far from NT, they often relate to other agricultural activities other than
NT. Hypothesis H9 is rejected.
Although farmers' access to bank credit services is identified as a determinant of adoption [7], [18], [23]. This finding isn’t
validated in the context of our study. Indeed, our results show rather that farmers who have benefited from a bank loan are
less likely to adopt NT (β10 = -0.118, p <0.05). Having a bank loan lowers the probability of adoption by 11.8%. This can be
explained by the fact that the farmers who applied for credit, other things being equal, is a sign that they aren’t already in
good financial health. Hypothesis H10 is validated. For grants, they are usually intended for specific activities, other than
purchasing NT from precision agriculture. The farmers who declared that they had received financial support in the form of a
subsidy specified that the financial support was intended for basic equipment (tractors, plows, fertilizer spreaders, seed drills,
combine harvesters, mower binders).
Regarding the Cost of the technology, the results of the estimates show that it hasn’t significant effect on adoption.
According to our interviews with the suppliers of NT in the Souss-Massa region, they testify that the main obstacle to the
non-adoption of new technologies by Moroccan farmers isn’t the cost, but rather it is due to attitudes and practices with
which farmers are familiar. Although in many studies on the adoption of new technologies, the cost of the technology is often

International Journal of Environmental & Agriculture Research (IJOEAR) ISSN:[2454-1850] [Vol-6, Issue-11, November- 2020]
Page | 49
linked to the decision to adopt. However, in our opinion, it depends on the cost of the technology. A technology, the cost of
which is high, will make the farmer hesitate to acquire it. Hypothesis H11 is rejected.
Finally, Ease of use has a positive effect on adoption (β9 = 0.168, p <0.001). A farmer who perceives a technology as
difficult to use has less chance of adopting it compared to a farmer who perceives use as easy. This result can be explained
by the fact that a third of the farmers in our sample have a BAC+3 and above. The level of education plays an important role
in the use of NT, it would be easier for educated farmers to use technology compared to illiterate farmers. Hypothesis H12 is
validated.
V. CONCLUSION
The objective of this article was to study the determinants of the adoption of NT. Based on the existing literature on the
subject, a theoretical framework was developed. To test this theoretical framework, we relied on a sample of 82 farmers from
the region of Souss-Massa (Morocco). The results from the estimation of a binary logit model show that the variables : Age,
education level (≥ Bac+3), non-agricultural income, perceived utility, possession of a computer, farm size, credit access, ease
of use, influence the probability of adopting NT among the farmers. To our knowledge, there’s no empirical work on NT
adoption in Morocco. The results of this study provide some answers to the adoption of NT by Moroccan farmers. They can
be useful for public authorities and companies providing NT to set up strategies to promote the digitalization of the
Moroccan agricultural sector.
The low education level among farmers requires efforts in terms of training, supervision and monitoring. Indeed, the
technologies that fall within the scope of PA require learning which would only be possible if the farmer is able to
understand their operation (reading a user manual or a display screen, entering data, settings, etc.). As our results show, the
education level can make it easier or harder to use a technology. As the literature states, a technology could be adopted even
if the farmer perceives the difficulty of using it. Studies show that farmers' perception of the ease of use of PA technologies
has a significant impact on its adoption. A farmer who perceives PA technology as complex or difficult to use would
therefore be less likely to adopt it. In the short term, it isn’t possible to increase the education level of farmers so that they
can fully understand their benefits, however, the public authorities can, therefore, act on building skills and knowledge- do
this through training workshops and the provision of extension services that could equip farmers with the skills needed for
NT acceptance and adoption.
Risk aversion can be overcome by improving the perceived usefulness of new technologies by farmers. This is important
because farmers tend to ignore the benefits of using precision technologies [31]. Governments can then encourage farmers to
use NT by demonstrating their usefulness. This can be done in collaboration with private companies, suppliers of these
technologies, through the organization of demonstration workshops.
However, based on our knowledge of the field, certain variables whose effects turned out to be insignificant. These results
should be interpreted with caution. For example, we didn’t establish a significant link between land tenure and the likelihood
of adoption. In Morocco, agricultural development faces problems of various kinds, but land in rural areas is often taken to
be the main cause. Indeed, the land structures, the land status and the mode of access to land are taken to be the major
constraint and the most important blocking factor to private agricultural investment, a real engine of agricultural
development. The collective lands in their current forms, are considered on the basis of assumptions, as major obstacles to
agricultural development, because they don’t provide the conditions of security and stability necessary for agricultural
intensification and development. private investment. Nationally, 70% of farms have less than 5 ha, and only accumulate 24%
of the utilised agricultural area (UAA). This specificity of the size of farms can pose a serious problem for the
implementation of an agricultural innovation strategy.
This study isn’t without its limitations. As with all cross-sectional analyzes, it’s difficult to test causalities even if they
remain theoretically justified. Indeed, the expression "cross section" is used when the dependent and independent variables
are measured on the same date. In this case, the results obtained do not always allow the identification of causal relationships.
Also, the data collection was done remotely during the health crisis (COVID-19), which didn’t allow us to collect more
information.
In order to broaden our understanding of the NT adoption process among farmers, it would be interesting to integrate other
variables into the predictive model, such as the orientation of production (local market vs export), the type of culture.
Interactive effects are also necessary to better understand adoption. For example, studying the joint effects of educational
level with ease of use, and farm size with type of crop on adoption.

International Journal of Environmental & Agriculture Research (IJOEAR) ISSN:[2454-1850] [Vol-6, Issue-11, November- 2020]
Page | 50
Finally, digitization has now become an imperative in all sectors of the economy, including agriculture. COVID-19 will
certainly accelerate this drive for modernization, but its success begins with an understanding of the mechanisms that lead the
farmer to accept and adopt new technologies.
REFERENCES
[1] T. Koutsos et G. Menexes, « Economic, agronomic, and environmental benefits from the adoption of precision agriculture
technologies: A systematic review », Int. J. Agric. Environ. Inf. Syst., vol. 10, no 1, p. 40-56, 2019, doi: 10.4018/IJAEIS.2019010103.
[2] A. R. Kaliba, R. J. Mushi, A. G. Gongwe, et K. Mazvimavi, « A typology of adopters and nonadopters of improved sorghum seeds in
Tanzania: A deep learning neural network approach », World Dev., vol. 127, 2020, doi: 10.1016/j.worlddev.2019.104839.
[3] P. Brown, A. Daigneault, et J. Dawson, « Age, values, farming objectives, past management decisions, and future intentions in New
Zealand agriculture », J. Environ. Manage., vol. 231, p. 110-120, 2019, doi: 10.1016/j.jenvman.2018.10.018.
[4] M. Paustian et L. Theuvsen, « Adoption of precision agriculture technologies by German crop farmers », Precis. Agric., vol. 18, no 5,
p. 701-716, 2017, doi: 10.1007/s11119-016-9482-5.
[5] M. Reichardt et C. Jürgens, « Adoption and future perspective of precision farming in Germany: Results of several surveys among
different agricultural target groups », Precis. Agric., vol. 10, no 1, p. 73-94, 2009, doi: 10.1007/s11119-008-9101-1.
[6] M. J. Carrer, H. M. de Souza Filho, et M. O. Batalha, « Factors influencing the adoption of Farm Management Information Systems
(FMIS) by Brazilian citrus farmers », Comput. Electron. Agric., vol. 138, p. 11-19, juin 2017, doi: 10.1016/j.compag.2017.04.004.
[7] B. A. Gyata, « Comparative assessment of adoption determinants of electronic wallet system by rice farmers in Benue and Taraba
states, Nigeria », Food Res., vol. 3, no 2, p. 117-122, 2019, doi: 10.26656/fr.2017.3(2).132.
[8] N. J. Miller, T. W. Griffin, I. A. Ciampitti, et A. Sharda, « Farm adoption of embodied knowledge and information intensive
precision agriculture technology bundles », Precis. Agric., vol. 20, no 2, p. 348-361, 2019, doi: 10.1007/s11119-018-9611-4.
[9] S. K. Ng’ang’a, D. A. Jalang’o, et E. H. Girvetz, « Adoption of technologies that enhance soil carbon sequestration in East Africa.
What influence farmers’ decision? », Int. Soil Water Conserv. Res., nov. 2019, doi: 10.1016/j.iswcr.2019.11.001.
[10] A. P. Barnes et al., « Exploring the adoption of precision agricultural technologies: A cross regional study of EU farmers », Land Use
Policy, vol. 80, p. 163-174, janv. 2019, doi: 10.1016/j.landusepol.2018.10.004.
[11] T. W. Griffin, N. J. Miller, J. Bergtold, A. Shanoyan, A. Sharda, et I. A. Ciampitti, « Farm’s sequence of adoption of information-
intensive precision agricultural technology », Appl. Eng. Agric., vol. 33, no 4, p. 521-527, 2017, doi: 10.13031/aea.12228.
[12] D. M. Lambert, K. P. Paudel, et J. A. Larson, « Bundled adoption of precision agriculture technologies by cotton producers », J.
Agric. Resour. Econ., vol. 40, no 2, p. 325-345, 2015.
[13] J. M. D’Antoni, A. K. Mishra, et H. Joo, « Farmers’ perception of precision technology: The case of autosteer adoption by cotton
farmers », Comput. Electron. Agric., vol. 87, p. 121-128, 2012, doi: 10.1016/j.compag.2012.05.017.
[14] B. T. Dela Rue et C. R. Eastwood, « Individualised feeding of concentrate supplement in pasture-based dairy systems: Practices and
perceptions of New Zealand dairy farmers and their advisors », Anim. Prod. Sci., vol. 57, no 7, p. 1543-1549, 2017, doi:
10.1071/AN16471.
[15] P. Brown, G. Hart, B. Small, et O. M. de Oca Munguia, « Agents for diffusion of agricultural innovations for environmental
outcomes », Land Use Policy, vol. 55, p. 318-326, 2016, doi: 10.1016/j.landusepol.2016.04.017.
[16] T. Zhang, Y. Yang, J. Ni, et D. Xie, « Adoption behavior of cleaner production techniques to control agricultural non-point source
pollution: A case study in the Three Gorges Reservoir Area », J. Clean. Prod., vol. 223, p. 897-906, juin 2019, doi:
10.1016/j.jclepro.2019.03.194.
[17] J. C. Walton et al., « Grid soil sampling adoption and abandonment in cotton production », Precis. Agric., vol. 11, no 2, p. 135-147,
2010, doi: 10.1007/s11119-009-9144-y.
[18] G. Danso-Abbeam, G. Dagunga, et D. S. Ehiakpor, « Adoption of Zai technology for soil fertility management: evidence from Upper
East region, Ghana », J. Econ. Struct., vol. 8, no 1, 2019, doi: 10.1186/s40008-019-0163-1.
[19] R. Welsh, S. Grimberg, G. W. Gillespie, et M. Swindal, « Technoscience, anaerobic digester technology and the dairy industry:
Factors influencing north country new york dairy farmer views on alternative energy technology », Renew. Agric. Food Syst., vol. 25,
no 2, p. 170-180, 2010, doi: 10.1017/S174217051000013X.
[20] W. Séogo et P. Zahonogo, « Land tenure system innovation and agricultural technology adoption in Burkina Faso: Comparing
empirical evidence to the worsening situation of both rural people vulnerability and vulnerable groups’ access to land », Afr. J. Sci.
Technol. Innov. Dev., vol. 11, no 7, p. 833-842, 2019, doi: 10.1080/20421338.2019.1587257.
[21] N. Adnan, S. M. Nordin, et Z. bin Abu Bakar, « Understanding and facilitating sustainable agricultural practice: A comprehensive
analysis of adoption behaviour among Malaysian paddy farmers », Land Use Policy, vol. 68, p. 372-382, nov. 2017, doi:
10.1016/j.landusepol.2017.07.046.
[22] F. Mengistu et E. Assefa, « Farmers’ decision to adopt watershed management practices in Gibe basin, southwest Ethiopia », Int. Soil
Water Conserv. Res., vol. 7, no 4, p. 376-387, 2019, doi: 10.1016/j.iswcr.2019.08.006.
[23] G. M. Kaarthikeyan et A. Suresh, « A study on understanding the adoption of water saving technology: A case study of drip
irrigation », Int. J. Recent Technol. Eng., vol. 7, no 6, p. 1123-1130, 2019.
[24] S. C. Chang et C.-H. Tsai, « The adoption of new technology by the farmers in Taiwan », Appl. Econ., vol. 47, no 36, p. 3817-3824,
2015, doi: 10.1080/00036846.2015.1019035.

International Journal of Environmental & Agriculture Research (IJOEAR) ISSN:[2454-1850] [Vol-6, Issue-11, November- 2020]
Page | 51
[25] M. Keskin et Y. E. Sekerli, « Awareness and adoption of precision agriculture in the Cukurova region of Turkey », Agron. Res., vol.
14, no 4, p. 1307-1320, 2016.
[26] A. R. Khanal, A. K. Mishra, D. M. Lambert, et K. K. Paudel, « Modeling post adoption decision in precision agriculture: A Bayesian
approach », Comput. Electron. Agric., vol. 162, p. 466-474, 2019, doi: 10.1016/j.compag.2019.04.025.
[27] B. A. Aubert, A. Schroeder, et J. Grimaudo, « IT as enabler of sustainable farming: An empirical analysis of farmers’ adoption
decision of precision agriculture technology », Decis. Support Syst., vol. 54, no 1, p. 510-520, déc. 2012, doi:
10.1016/j.dss.2012.07.002.
[28] P. Roussel et F. Wacheux, Management des ressources humaines. Méthodes de recherche en sciences humaines et sociales. Louvain-
la-Neuve: De Boeck Supérieur, 2005.
[29] T. Amemiya, « Qualitative Response Models: A Survey », J. Econ. Lit., vol. 19, no 4, p. 1483-1536, 1981.
[30] D. McFadden, « The Revealed Preferences of a Government Bureaucracy: Empirical Evidence », Bell J. Econ., vol. 7, no 1, p. 55-72,
1976, doi: 10.2307/3003190.
[31] G. Bucci, D. Bentivoglio, et A. Finco, « Factors affecting ict adoption in agriculture: A case study in italy », Qual. - Access Success,
vol. 20, no S2, p. 122-129, 2019.
[32] A. Knierim, M. Kernecker, K. Erdle, T. Kraus, F. Borges, et A. Wurbs, « Smart farming technology innovations – Insights and
reflections from the German Smart-AKIS hub », NJAS - Wagening. J. Life Sci., vol. 90-91, 2019, doi: 10.1016/j.njas.2019.100314.
International Journal of Environmental & Agriculture Research (IJOEAR) ISSN:[2454-1850] [Vol-6, Issue-11, November- 2020]
Page | 52
Evaluation of the Development of Roselle (Hibiscus Sabdariffa L.)
in Two Soil Types with Interaction of Bacterial Cells and
Vermicompost Abdul Khalil Gardezi
1*, Oscar Eduardo Hernández Torres
2, Guillermo Carrillo
Castañeda3, Sergio Roberto Márquez-Berber
4, Héctor Flores Magdaleno
5,
Eduardo Valdés Velarde6, Mario Ulises Larqué Saavedra
7, Gabriel Haro Aguilar
8
*1,2,5,8Postgraduate College, Agricultural Science, Department of Hydrosciences, Montecillo Campus, Km. 36.5 Carretera
Fed. México-Texcoco, Montecillo, Texcoco, Estado de México, México, 56230. 3Postgraduate College, Genetic Resources and Productivity Area of Molecular Genetics, Montecillo Campus, Km. 36.5
Carretera Fed. México-Texcoco, Texcoco, Estado de México, México, 56230. 4Crop Science Department, Chapingo Autonomous University, Km 38.5 Carretera Fed. México-Texcoco s/n, Col. Chapingo,
Texcoco, Estado de México, Mexico, 56230. 6Agroforestry Center for Sustainable Development, Autonomous University Chapingo, Km 38.5 Carretera federal México-
Texcoco s/n., Col. Chapingo, Texcoco, Estado de México, México, C.P. 56230. 7Metropolitan Autonomous University, Azcapotzalco, Mexico.
*1Corresponding author: Dr. Abdul Khalil Gardezi, Postgraduate College, Agricultural Sciences, Department of
Hydrosciences, Montecillo Campus, Km. 36.5 Carretera Fed. México-Texcoco, Texcoco, Estado de México, México, 56230.
Tel. 595-95-20200 ext. 1165, 1167 or 1171.
Abstract— In this study, we tested the growth of two varieties of Roselle (Hibiscus sabdariffa) cultivated in two types of
soils and the effects of the inoculation of seeds with cells of bacterial strains and vermicompost. (H. sabdariffa) are a
member of the Malvaceae family and an important plant because its calyxes are used to produce beverages, prepare food, in
the textile industry, cosmetology, perfumery, medicine, etc.
This research was carried out at the Postgraduate College, Montecillo Campus, Mexico. The experimental design was
completely randomized blocks with a factorial arrangement (4x3x2): four levels of organic matter factor, three levels of
bacterial strains factor, and two levels of soil factor with three repetitions. The variables tested were: germination
percentage (GP), plant height (PH), stem diameter (SD), the number of leaves (NL), foliar area (FA cm 2), radical volume
(RV cm3), dry aerial part biomass weight (DAPBW), dry root biomass weight (DRBW), dry calyx biomass weight (DCBW)
and chlorophyll content (CC). The effects of soil and bacterial strains showed significant differences (p ≤ 0.05) on the
agronomic characteristics of (H. sabdariffa) plants. The organic matter factor only presented significant differences (p ≤
0.05) in the germination percentage and growth variables of the vegetative phase.
To increase crop production, the use of wastewater and microorganisms is proposed. Vermicompost exploded the percentage
of germination, height, the number of leaves and stem diameter during the first weeks of growth, presenting important results
in Creole variety (farmers’ local variety). By inoculating seeds with cells of bacterial strains, A9m and A7 helped
significantly to stimulate plant growth, finding a better response in A9m strain. The effects of soil factor showed significant
differences (p ≤ 0.05) in soil irrigated with residual water over agronomic characteristics satisfying the nutritional
requirements of the crop.
Keywords— Germination percentage, Malvaceae, Soil microorganisms, Organic matter, Wastewater.
I. INTRODUCTION
Roselle or Roselle rose (Hibiscus sabdariffa L.) is a plant that has medicinal properties backed by scientific studies; however,
it is also used to dye food, soft drinks, syrups, among other products. It is of great importance to the State of Guerrero,
Mexico, with a first-place nationally, in harvest area and calyx production (SIAP, 2016).
In this water-scarce world, wastewater has been used for people to grow crops because it is free, it contains a lot of plant
nutrients that also are free but, all these benefits do not consider the cost of the health care of the goods consumers. The
Mezquital Valley in central Mexico is an example of this issue. In sum, crops will continue to be irrigated with wastewater
due to growing water shortages, but this situation is a question of management and socioeconomic costs.

International Journal of Environmental & Agriculture Research (IJOEAR) ISSN:[2454-1850] [Vol-6, Issue-11, November- 2020]
Page | 53
Plant Growth-Promoting Bacteria (PGPB) has been used primarily in agriculture to promote seed germination, vigor, plant
growth, and improve crop yield (Kloepper, et al., 1989), and for the control of plant pathogen microorganisms (Beneduzi, et
al., 2012). Plant growth-promoting bacteria, in addition to their agricultural applications, have been used successfully to
mitigate the damage of plant growth caused by wastewater discharges into crop soils, so that crops thrive and they produce
satisfactorily because bacteria have the ability to improve wastewater bioremediation processes. Some other rhizobacteria
promote crop plants and the plants used in bioremediation processes to allow rapid extraction of hazardous materials from
soils (Bashan et al., 2008; McGrath et al., 1993).
Another cost-effective solution is the use of vermicompost. Studies show that organic fertilizers protect and develop the life
of microorganisms by improving soil structure and allowing the recycling of organic matter (Ruíz, 2011). The vermicompost
stores mainly nitrogen, phosphorus, potassium, sulfur and prolonged-release micronutrients (García, 2011; Varela and
Martínez, 2013), used as a growth medium in plant species under greenhouse conditions (Gardezi et al., 2008), increasing
microbial load and plant growth hormones, highlighting a sustainable agriculture that prevents degradation of soils with
inorganic fertilizers.
There is little information on the use of biofertilizers and organic fertilizers in the cultivation of Roselle, and the
accumulation in edible parts of the plant by toxic elements present in the soil, therefore, the information that is required to get
in this investigation consists of determining the practical, economic, and safe culture medium for the cultivation of H.
sabdariffa testing two types of soil interacting with bacterial strains and vermicompost. This will give farmers options to use
organic fertilization, reduce pollution, and gain new ecosystem-friendly technologies.
II. MATERIALS AND METHODS
2.1 Experimental site
The experiment was carried out under greenhouse conditions at the Postgraduate College, Montecillo Campus, State of
Mexico, in the spring and summer of 2016. At 19° 27´ N and 98° 54´ W with an altitude of 2245 meters above sea level.
With a mild climate, and an average annual temperature of 16.4° C and a rainfall of 762.7 mm per year, National
Meteorological (Service, Servicio Meteorológico Nacional) (SMN, 2010). The greenhouse comprises symmetrical triangular
flat roofs. The roof is glass with a 70% luminosity, and metal structure. Ventilation is through the front and side windows
(Fig 1).
FIGURE 1. Greenhouse in the Postgraduate College, Montecillo Campus.

International Journal of Environmental & Agriculture Research (IJOEAR) ISSN:[2454-1850] [Vol-6, Issue-11, November- 2020]
Page | 54
2.2 Plant material and substrate
Two varieties of Roselle, commercial (H1038) and Creole (farmers’ local variety) from the state of Guerrero were used. We
used two types of soils: one irrigated with sewage water that had been watered for decades with water from the Emiliano
Zapata dam between the boundaries of the states of Guerrero and Morelos, which houses urban wastewater from surrounding
towns. The other soil was irrigated with clean water from a well. Soil samples were obtained at 0-5 cm, 5-10 cm, 10-40 cm
deep, the characteristics and method are shown in Table 1.
TABLE 1
ANALYSIS OF TWO TYPES OF SOIL IRRIGATED WITH CLEAN AND RESIDUAL WATER
Soil sample
Irrigated with clean water Irrigated with the residual water
0-5 cm 5-10 cm 10-40 cm 0-5 cm 5-10 cm 10-40 cm Method
pH 7.21 7.35 7.36 7.36 7.39 7.45 Potentiometric
EC dSm-1
0.46 0.55 0.4 0.71 0.46 0.43
OM % 0.31 0.27 0.4 0.67 0.34 1.88 Walkley and Black
N mgKg-1
13 9.3 8.4 13 16.7 9.9 Extracted with potassium
chloride
CEC Cmol+/Kg 53 52 48 58 57 54 Olsen
P mgKg-1
7.39 6.55 3.72 8.1 18.18 5.9 Flame Emission
Spectrophotometry
K mgKg-1
204 384 382 470 398 226
Atomic absorption
spectrophotometry
Ca mgKg-1
4085 4111 2810 4222 4376 4140
Mg mgKg-1
494 464 387 926 822 846
Fe mgKg-1
2.02 1.3 1.82 2.74 1.87 1.38
Cu mgKg-1
0.77 0.74 0.71 1.59 1.7 1.51
Zn mgKg-1
0.82 0.47 0.38 0.74 0.58 0.52
Pb mgKg-1 ND 0.009 ND ND ND 0.011
Cr mgKg-1 ND ND ND ND 0.020 ND
Cd mgKg-1 ND 0.004 ND ND 0.007 ND
pH: hydrogen potential, EC: electrical conductivity, OM: organic matter, CEC: cation exchange capacity, ND not
detected.
Roselle varieties used were commercial H1038 (Hybrid variety) and Creole (Farmers’ local variety), planted in 2.5 kg
polythene bags filled with two types of soil.
Seeds inoculation with cells of microbial strains A9m and A7 (provided by the Molecular Genetics Laboratory, Faculty of
Genetics, Postgraduate College, Montecillo Campus) was done thirty minutes before sowing by adding 200 µl of bacterial
suspension per batch of 100 seeds.
Vermicompost was used as organic matter, made with 60 kg of bovine manure, 25 kg of melon residues, and 15 kg of wheat.
The mixture interacted with earthworms for four months. The Vermicompost in doses of 0, 24.05g, 48.08g, 72.05g,
equivalent to 0, 25, 50, 75 t ha-1 of organic matter, was added to four 2.5kg polyethylene bags containing soil. Irrigation was
every third day, applying the same amount of water with a container during the development of the investigation.

International Journal of Environmental & Agriculture Research (IJOEAR) ISSN:[2454-1850] [Vol-6, Issue-11, November- 2020]
Page | 55
2.3 Variables tested
The variables tested were: germination percentage (GP), plant height (PH), stem diameter (SD), the number of leaves (NL),
foliar area (FA, cm2), radical volume (RV cm
3), dry aerial part biomass weight (DAPBW), dry root biomass weight
(DRBW), dry calyx biomass weight (DCBW), and chlorophyll content (CC).
The experimental block design was handled completely randomly with 24 treatments (4x3x2) in a factorial arrangement with
three repetitions. The factors and levels studied were: (1) soil with two levels, irrigated with wastewater and irrigated with
clean water; (2) vermicompost, with four levels, 0, 24.05 g, 48.08 g, 72.05 g; (3) bacterial strains, with three levels, without
strains, with strains A9m and A7. Analysis of variance analyzed the response variables with a level of significance of p ≤
0.05 and means separation tests with Tukey (p ≤ 0.05).
III. RESULTS AND DISCUSSION
3.1 Physical and chemical properties of soil
The soil used had a clayey texture, with a moderately alkaline pH. The soil irrigated with clean water showed a pH of 7.36 in
comparison with the soil irrigated with residual water that had a pH of 7.45 in sample 10-40 cm deep. The results of
electrical conductivity (EC), organic matter (OM), cation exchange capacity (CEC), nitrogen (N), phosphorus (P), calcium
(Ca), potassium (K), magnesium (Mg), iron (Fe), zinc (Zn) and copper (Cu) were higher in soils irrigated with sewage water.
The highest concentration of N was in upper layers (0-5 cm to 5-10 cm), with a slight increase in soils irrigated with
wastewater because of the contribution of organic matter (Ramón-Zamoraet al., 2009). Likewise, the content of available P
presented average concentrations and content of K showed high levels, according to the norm NOM-021-RECNAT-2000.
The levels of Cr, Cd, and lead (Pb) were below the limit of concentration to be considered contaminants.
3.2 Germination percentage
Table 2 shows the germination percentage associated with organic matter at different doses and seeds inoculated with cells of
bacterial strains in two different soils. There were no significant differences in soil and bacterial strains factors tested (p ≤
0.05), however, there was a significant effect on levels of organic matter factor on the germination percentage. The 50% dose
of the organic matter showed a greater positive effect on the germination percentage for H1038 variety, while a 75% dose of
the organic matter showed a greater effective impact on Creole variety (Fig 2). This result shows that the addition of the
organic matter of culture media consistently improves the germination percentage of seedlings (Domínguez et al., 2010;
Atiyeh et al., 2002).
TABLE 2
GERMINATION PERCENTAGE OF ROSELLE VARIETIES H1038 AND CREOLE IN TWO TYPES OF SOIL
ASSOCIATED WITH ORGANIC MATTER AND CELLS OF BACTERIAL STRAINS
Factors and levels H1038 Creole
Germination (%)
Soil (S)
S. irrigated with clean water 68.33 a 51.11 a
S. irrigated with wastewater 72.78 a 52.78 a
Organic matter
0 g 60.00 c 39.89 c
24.05 g 66.67 bc 50.00 b
48.08 g 81.11 a 48.89 bc
72.05 g 74.44 ab 70.00 a
Bacterial strain
Without strain 67.50 a 48.33 a
With A9m strain 75.83 a 52.50 a
With A7 strain 73.33 a 56.67 a
Means with the same letter in the same column are statistically equal (Tukey, p≤ 0.05).

International Journal of Environmental & Agriculture Research (IJOEAR) ISSN:[2454-1850] [Vol-6, Issue-11, November- 2020]
Page | 56
FIGURE 2:Effect of Organic Matter Added in Two Varieties of (H. Sabdariffa) on Germination Percentage
3.3 Agronomic characteristics
Table 3 presents the results of the agronomic characteristics of two varieties of (H. sabdariffa) associated with organic matter
and bacterial strains in two types of soil.
TABLE 3
AGRONOMIC CHARACTERISTICS OF (H. SABDARIFFA) ASSOCIATED WITH ORGANIC MATTER AND
BACTERIAL STRAINS IN TWO TYPES OF SOIL Factors and
levels Height cm
Stem
diametermm
Number of
leaves Foliar area cm
2 Radical volume
cm3
Soil (S) H1038 Creole H1038 Creole H1038 Creole H1038 Creole H1038 Creole
S. irrigated with
clean water 130.72 b 110.97 b 7.18 b 6.11 b 41.25 b 45.31 b 1202.28 b 758.55 b 5.11 b 4.65 b
S. irrigated with
wastewater 147.71 a 129.41 a 8.36 a 7.08 a 49.83 a 59.47 a 1741.86 a
1070.95
a 7.45 a 5.55 a
Organic matter
0 g 139.11NS 119.17NS 7.43NS 6.61NS 46.00NS 53.83NS 1365.17NS 914.82NS 5.67NS 4.31 b
24.05 g 148.88 112.73 7.96 6.36 48.5 50.28 1671.39 818.78 6.59 4.68 ab
48.08 g 131.38 127.28 7.76 6.88 42.44 54.61 1329.89 1035.61 5.58 6.05 a
72.05 g 137.5 121.57 7.94 6.53 45.22 50.83 1521.83 889.79 7.27 5.37 ab
Bacterial strain
Without strain 126.08 b 98.13 b 7.33 b 5.85 b 40.00 b 37.79 b 1100.58 b 576.22 b 5.99NS 4.34 b
With A9mstrain 148.32 a 130.98 a 8.06 a 7.01 a 50.08 a 59.21 a 1728.17 a 1075.72
a 6.58 5.43 ab
With A7strain 143.25 a 131.46 a 7.93 ab 6.93 a 46.54 ab 60.17 a 1587.46 a 1092.30
a 6.27 5.53 a
Hybrid variety = H1038 and Creole variety = Farmers’ local variety
NS = Not significant. Means with the same letter in the same column are statistically equal (Tukey, p≤ 0.05)
TABLE 3
CONTINUATION Factors and
levels Aerial dry weight (g) Root dry weight(g) Calyx dry weight(g) Chlorophyll content SPAD unit
Soil (S) H1038 Creole H1038 Creole H1038 Creole H1038 Creole
S. irrigated with clean water 9.17 b 7.93 b 1.01 b 0.83 b 8.74 b 2.91 b 27.10 b 32.45 b
S. irrigated with
wastewater 15.79 a 10.60 a 2.01 a 1.03 a 13.79 a 4.57 a 29.64 a 41.00 a
Organic matter
0 g 11.40NS 9.40NS 1.40NS 0.80 b 10.24NS 5.02NS 28.39NS 36.24NS
24.05 g 13.49 8.16 1.40 0.88 ab 12.84 3.26 27.24 35.46
48.08 g 13.49 10.29 1.55 1.07 a 10.48 3.69 28.46 38.87
72.05 g 11.53 9.21 1.70 0.98 ab 11.52 2.99 29.39 36.34
Bacterial strain
Without strain 10.06 b 5.90 b 1.64NS 0.82 b 6.06 b 1.54 b 27.70 a 30.35 b
With A9m strain 13.83 a 11.23 a 1.43 1.03 a 14.75 a 4.69 a 28.50 a 39.12 a
With A7 strain 13.55 a 10.66 a 1.47 0.95 ab 12.99 a 4.98 a 28.91 a 40.71 a
NS = Not significant. Means with the same letter in the same column are statistically equal (Tukey, p ≤ 0.05). g=gram, SPAD=Soil-
Plant Analyses Development.
0
20
40
60
80
100
0 g 24.05 g 48.08 g 72.05 g
Ger
min
ati
on
per
cen
tag
eH1038 Criolla

International Journal of Environmental & Agriculture Research (IJOEAR) ISSN:[2454-1850] [Vol-6, Issue-11, November- 2020]
Page | 57
3.4 Soil analysis
The analysis shows that there were significant differences in all agronomic variables tested (p ≤ 0.05) in the levels studied in
the soil factors in both varieties (Table 3). This result reflected by a slight difference in the concentration of elements such as
N, P, K, Mg in both soils, because soils irrigated with wastewater increase the content of nutrients and organic matter,
favoring the development of crop and improvement of soil (Velizet al., 2009). Plevich et al., (2012) observed similar results
in alfalfa cultivation that presented an increase in nutritional value and production of plants, determining that incorporation
of wastewater to soil exceeds the values, compared to soil irrigated with clean water.
However, for the calyx number, there were no significant differences (p ≤ 0.05) in any variety (Table 4). This is explained by
the morphology of the plant, because the transition from flowering to fruiting is gradual, because the anthesis of the young
flowers continues after the old flowers have already formed the capsules (Acosta, 1999), in addition, floral induction occurs
when days are shorter (Arbex de Castro et al., 2004). However, an increase in elements such as nitrogen, phosphorus, and
potassium have a positive response of the plant in variables such as weight of fresh and dry matter from the calyx (El-Sherif
and Sarwat, 2007; Haruna et al., 2009) (Table 5).
TABLE 4
THE NUMBER OF CALYXES IN TWO VARIETIES OF THE ROSELLE CROP WITH DIFFERENT FACTORS AND
LEVELS
Factors and levels Number of Calyxes
number
Soil (S) H1038 Creole
S. irrigated with clean water 3.61NS
13.28NS
S. irrigated with wastewater 4.14 15.75
Organic Matter
0 g 4.17NS
15.06NS
24.05 g 4.44 12.94
48.08 g 3.11 15.44
72.05 g 3.78 14.61
Bacterial strain
Without strain 3.21NS
7.67 b
With A9m strain 4.08 17.96 a
With A7 strain 4.33 17.92 a
NS = Not significant. Means with the same letter in the same column are statistically equal (Tukey, p ≤0.05).
TABLE 5
WEIGHT OF FRESH AND DRIED CALYX MATTER IN TWO VARIETIES OF THE ROSELLE CROP WITH
DIFFERENT FACTORS AND LEVELS
Factors and levels Calyx fresh matter weight
(g)
Calyx dry matter weight
(g)
Soil (S) H1038 Creole H1038 Creole
S. irrigated with clean
water 26.99 b 18.73 b 8.74 b 2.91 b
S. irrigated with
wastewater 40.10 a 26.65a 13.79 a 4.57 a
Organic Matter
0 g 29.62NS
27.81NS
10.24NS
5.02NS
24.05 g 39.15 20.17 12.84 3.26
48.08 g 31.01 24.95 10.48 3.69
72.05 g 34.41 17.84 11.52 2.99
Bacterial strain
Without strain 19.73 b 9.30 b 6.06 b 1.54 b
With A9m strain 42.83 a 28.39 a 14.75 a 4.69 a
With A7 strain 38.08 a 30.38 a 12.99 a 4.98 a
NS = Not significant. Means with the same letter in the same column are statistically equal (Tukey, p ≤0.05).
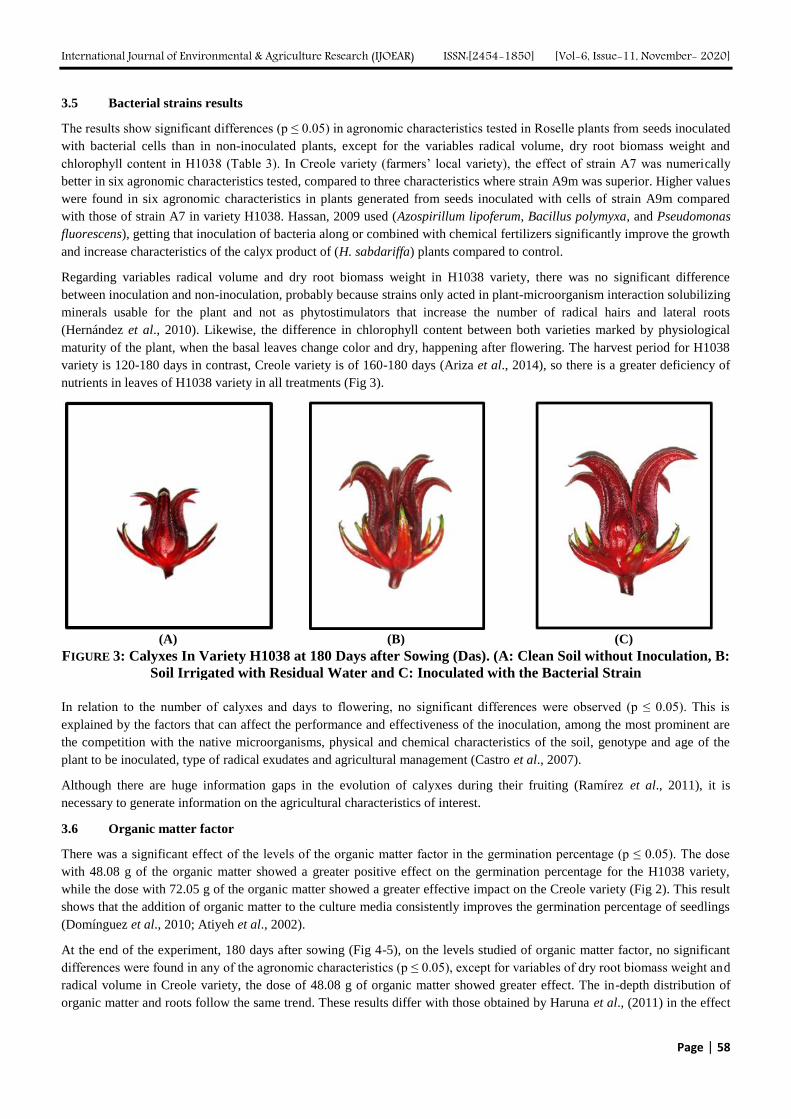
International Journal of Environmental & Agriculture Research (IJOEAR) ISSN:[2454-1850] [Vol-6, Issue-11, November- 2020]
Page | 58
3.5 Bacterial strains results
The results show significant differences (p ≤ 0.05) in agronomic characteristics tested in Roselle plants from seeds inoculated
with bacterial cells than in non-inoculated plants, except for the variables radical volume, dry root biomass weight and
chlorophyll content in H1038 (Table 3). In Creole variety (farmers’ local variety), the effect of strain A7 was numerically
better in six agronomic characteristics tested, compared to three characteristics where strain A9m was superior. Higher values
were found in six agronomic characteristics in plants generated from seeds inoculated with cells of strain A9m compared
with those of strain A7 in variety H1038. Hassan, 2009 used (Azospirillum lipoferum, Bacillus polymyxa, and Pseudomonas
fluorescens), getting that inoculation of bacteria along or combined with chemical fertilizers significantly improve the growth
and increase characteristics of the calyx product of (H. sabdariffa) plants compared to control.
Regarding variables radical volume and dry root biomass weight in H1038 variety, there was no significant difference
between inoculation and non-inoculation, probably because strains only acted in plant-microorganism interaction solubilizing
minerals usable for the plant and not as phytostimulators that increase the number of radical hairs and lateral roots
(Hernández et al., 2010). Likewise, the difference in chlorophyll content between both varieties marked by physiological
maturity of the plant, when the basal leaves change color and dry, happening after flowering. The harvest period for H1038
variety is 120-180 days in contrast, Creole variety is of 160-180 days (Ariza et al., 2014), so there is a greater deficiency of
nutrients in leaves of H1038 variety in all treatments (Fig 3).
(A) (B) (C)
FIGURE 3: Calyxes In Variety H1038 at 180 Days after Sowing (Das). (A: Clean Soil without Inoculation, B:
Soil Irrigated with Residual Water and C: Inoculated with the Bacterial Strain
In relation to the number of calyxes and days to flowering, no significant differences were observed (p ≤ 0.05). This is
explained by the factors that can affect the performance and effectiveness of the inoculation, among the most prominent are
the competition with the native microorganisms, physical and chemical characteristics of the soil, genotype and age of the
plant to be inoculated, type of radical exudates and agricultural management (Castro et al., 2007).
Although there are huge information gaps in the evolution of calyxes during their fruiting (Ramírez et al., 2011), it is
necessary to generate information on the agricultural characteristics of interest.
3.6 Organic matter factor
There was a significant effect of the levels of the organic matter factor in the germination percentage (p ≤ 0.05). The dose
with 48.08 g of the organic matter showed a greater positive effect on the germination percentage for the H1038 variety,
while the dose with 72.05 g of the organic matter showed a greater effective impact on the Creole variety (Fig 2). This result
shows that the addition of organic matter to the culture media consistently improves the germination percentage of seedlings
(Domínguez et al., 2010; Atiyeh et al., 2002).
At the end of the experiment, 180 days after sowing (Fig 4-5), on the levels studied of organic matter factor, no significant
differences were found in any of the agronomic characteristics (p ≤ 0.05), except for variables of dry root biomass weight and
radical volume in Creole variety, the dose of 48.08 g of organic matter showed greater effect. The in-depth distribution of
organic matter and roots follow the same trend. These results differ with those obtained by Haruna et al., (2011) in the effect

International Journal of Environmental & Agriculture Research (IJOEAR) ISSN:[2454-1850] [Vol-6, Issue-11, November- 2020]
Page | 59
produced by (H. sabdariffa) in the field because of incorporating poultry manure as organic matter, and as reported by
Anyinkeng and Mih, (2011).
FIGURE 4. Variety H1038 (Hybrid variety) at 180
days after sowing (DAS).
FIGURE 5. Creole variety (farmers’ local variety) at
180 days after sowing (DAS).
However, significant differences were found in growth variables at 80 days after sowing (p≤ 0.05). For H1038 variety, it
showed only a positive increase in stem diameter in doses of organic matter of 48.08 g and 72.05g (Table 6). In the Creole
variety, the dose of 48.08g expressed a greater effect on the height, the number of leaves and the diameter of the plant stem.
This may show that improved varieties, unlike Creole, have high development potential in the vegetative phase and greater
tolerance to biological stress (SAGARPA, 2014, 2015; Hidalgo-Villatoro et al., 2009), even in poor soils.
TABLE 6
GROWTH VARIABLES OF TWO VARIETIES OF ROSELLE 80 DAYS AFTER PLANTING
Factor and levels Height(cm) Number of leaves Stem diameter(mm)
Organic matter H1038 Creole H1038 Creole H1038 Creole
0 g 36.94NS
34.39 b 14.44NS
12.50 c 4.24 b 3.16 b
24.05 g 40.26 36.48 b 14.00 14.06 bc 4.52 ab 3.34 b
48.08 g 40.64 41.74 a 14.33 18.11 a 4.54 ab 3.96 a
72.05 g 40.74 42.79 a 16.78 17.94 ab 5.04 a 4.03 a
NS = Not significant. Means with the same letter in the same column are statistically equal (Tukey, p ≤ 0.05).
Finally, the behavior of plants observed in the organic matter factor reflected by mineralization existing in soil, which can
contain up to 45% of minerals (Labrador, 2001), influenced by climate and mineralogy of clays (Vogt et al., 1995; Geissen
and Brümer, 1999) and by a vegetative phase of the genus (Hibiscus), in which amount of minerals and water absorbed is
greater, during the first weeks of growth plant absorbs almost all nitrogen, phosphorus, and potassium(NPK) that will be
necessary for the rest of the growing period, so a mixture of organic matter and soil will be necessary weeks before planting,
to increase the use of nutrients provided by organic components.
IV. CONCLUSION
The four components: improved varieties, vermicompost, treated wastewater, and bacterial cells, play an important role in
the quality, quantity, and health of plants for agricultural production with a suitable formula according to soil and water
analyzes. The aggregation of organic matter shows positive effects on the percentage of the germination of both varieties and
during the vegetative phase in Creole variety. Likewise, the vermicompost increased the emergency percentage of each
variety studied and increased the radical volume. Plants with better agronomic characteristics were found in soils that were
irrigated with sewage and inoculated with some bacterial strains in both varieties of Roselle. However, the use of microbial
consortia that acts together in the crop system is suggested, having a more efficient and effective flow of nutrients in the
plant's growth.

International Journal of Environmental & Agriculture Research (IJOEAR) ISSN:[2454-1850] [Vol-6, Issue-11, November- 2020]
Page | 60
ACKNOWLEDGEMENTS
I, Oscar Eduardo Hernández Torres, express gratitude to institutions and people who made it possible to develop this
research. I would like to thank my particular council, especially Dr. Abdul Khalil Gardezi, for his valuable scientific
collaboration in carrying out this research project completed satisfactorily. Likewise, to Dr. Guillermo Carrillo-Castañeda,
Dr. Héctor Flores-Magdaleno, Dr. Sergio Roberto Marquez-Berber, Eduardo Valdés Velarde, and Gabriel Haro Aguilar, for
their support in my Master’s Degree thesis, and Mario Ulises Larqué Saavedra, for his statistical contribution to this research.
Finally, this research project was supported by the National Council of Science and Technology (CONACYT) and the
Postgraduate College. Thank you. Also, this research did not receive any specific grant from funding agencies in the public,
commercial or not-for-profit sectors.
REFERENCES
[1] Acosta, A. G. 1999. Aspectos generales del kenaf (Hibiscus cannabinus L.), en Cuba. Temas de Ciencia y Tecnología 7: 3-31.
[2] Anyinkeng, N and Mih, A. 2011. Soil nutrient supplementation on growth and biomass production of Roselle under tropical
conditions. Agric. Biol. J. N. Am. 2(4): 603-609, https://doi/10.5251/abjna.2011.2.4.603.609.
[3] Arbex de Castro, N. E., Pereira Pinto, J. E. B., das Graças Cardoso, M., Ramalho de Morais, A., Bertolucci, S. K. V., Guimarães da
Silva, F. and DelúFilho, N. 2004. Planting time for maximization of yield of vinegar plant calyx (Hibiscus sabdariffa L.). Ciência e
Agrotecnología 38(3): 542—551.http://dx.doi.org/10.1590/S1413-70542004000300009.
[4] Ariza, R., Serrano, V., Navarro, S., Ovando, M. E., Vázquez, E., Barrios, A., Michel, A., Guzman, S., y Otero, M., 2014. Variedades
Mexicanas de Roselle (Hibiscus sabdariffa) “Alma Blanca” y “Rosaliz” de color claro, y “Cotzaltzin” y “Tecoanapa” de color
rojo. Rev. Fitotec. Mex. Vol. 37 (2): 181–185.printversion ISSN 0187-7380.
[5] Atiyeh, R. M., Lee, S., Edwards, C. A., Arancon, N. Q., Metzger, J. D. 2002. The influence of humic acids derived from earthworm-
processed organic wastes on plant growth. Biores. Technol. 84: 7-14. https://doi/10.1016/S0960-8524(02)00017-2.
[6] Bashan, Yoav, Puente, M. Esther, de-Bashan, Luz E. and Hernandez, Juan-Pablo, 2008.Environmental uses of plant growth-
promoting bacteria.Plant-Microbe Interactions. Editors: E. AitBarka and C. Clément. Jan 2008: pp. 69-93 ISBN: 978-81-308-0212-
1.
[7] Beneduzi, A., Ambrosini, A. and Passaglia, Luciane M.P. 2012. Plant growth-promoting rhizobacteria (PGPR): Their potential as
antagonists and biocontrol agents. Genetics andMolecular Biology, V.35(4 Suppl): pp. 1044-1051. print version ISSN 1415-4757
http://dx.doi.org/10.1590/S1415-47572012000600020.
[8] Castro, S., Y. Herschkovitz, Y. Okony and E. Jurkevitch. 2007. Effects of inoculation with plant growth-promoting rhizobacteria on
resident rhizosphere microorganisms. FEMS Microbiology Letters 276: 1-11.
[9] Domínguez, J., Lazcano, Cristina., Gómez, María. 2010. Influencia del vermicompost en el crecimiento de las plantas. Aporte para
la elaboración de un concepto objetivo.Acta Zool. Mex vol. 26 spe 2: 359-371, 2010.On-line ISSN 2448-8445 print
version ISSN 0065-1737.
[10] El-Sherif, M. H. and M. I. Sarwat. 2007. Physiological and chemical variations in producing roselle plant (Hibiscus sabdariffa L.) by
using some organic farmyard manure. World Journal of Agricultural Sciences 3(5): 609-616.
[11] García, P.R.E. 2011. La lombriz de tierra como una biotecnología en agricultura.Universidad Autónoma de Chapingo, ISBN 978-
968-02-0299-7, 177 P, Texcoco, Estado de México, México.
[12] Gardezi, A., E. Ojeda, H. Gardezi y S. R. Márquez. 2008. Respuesta a la inoculación de Glomus intraradix, materia orgánica y dosis
de fertilización fosfatada en el crecimiento de mezquite (Prosopis sp.). Agroproductividad 1(1): 24-28.
[13] Geissen, V. and Brümer, G. W. 1999. Decomposition rates and feeding activities of soilFauna in deciduous forest soils in relation to
chemical parameters following liming andfertilization. Biology and Fertility of Soils Vol 29, Issue 4, pp 335-
342.https://doi.org/10.1007/s003740050562 ISSN 1432-0789.
[14] Haruna, I. M., H. Ibrahim and S. A. Rahman. 2009. The yield and profitability of Roselle (Hibiscus sabdariffa L.) at varying poultry
manure and nitrogen fertilizer rates in the Southern Guinea Savanna of Nigeria. Electronic Journal of Environmental, Agricultural
and Food Chemistry 8(11): 1136-1139.ISSN: 1579-4377.
[15] Haruna, I. M., Maunde, S. M., Yahuza, S. 2011. Growth and Calyx Yield of Roselle(Hibiscus Sabdariffa L.) As Affected by Poultry
Manure and Nitrogen Fertilizer Rates in The Southern Guinea Savanna of Nigeria, Canadian Journal of Pure and Applied Sciences
Vol. 5 (1): 1345-1348. On-line version ISSN 1920-3853 Print ISSN 1715-9997.
[16] Hassan, F.A.S.2009.Response of (H. sabdariffa L.) plant to some biofertilizationtreatments. Annals of Agricultural Science, 54 (2):
437-446. ISSN 0570-1783.
[17] Hernández, A., Heydrich, M., Diallo, B., Jazini, M., Vandaputte, M. 2010. Cell-freeCulture medium of Burkholderiacepacia
improves seed germination and seedling growth in maize (Zea mays) and rice (Oryza sativa). Plant Growth Regul. Vol. 60, Issue 3,
pp 191-197. https://doi.org/10.1007/s10725-009-9433-5.
[18] Hidalgo-Villatoro, S.G., Cifuentes-Reyes, W.A.L., Ruano-Solís, H. H., Cano-Castillo,L.E. 2009. Caracterización de trece genotipos
de rosa de Roselle(H. sabdariffa) en Guatemala. Agronomía Mesoamericana 20(1): 101-109. https://doi/10.15517/am.v20i1.4985.
[19] Kloepper, JW,Lifshitz, R and Zablotowicz, RM, 1989. Free-living bacterial inocula for enhancing crop productity. Trends Biotechnol
Vol7, Issue 2, Feb 1989, pp. 39-43.
[20] Labrador, M. 2001. La Materia Orgánica en los Agroecosistemas. Ediciones Mundi-Prensa. Pp. 152-160.
[21] McGrath, S.P., Sidoli, C.M.D., Baker, A.J.M. and Reeves, R.D. (1993) The Potential for the Use of Metal-Accumulating Plants for
the In-Situ Decontamination of Metal-Polluted Soils. In: Eijsackers H.J.P., Hamers T. (eds) Integrated Soil and Sediment Research:
A Basis for Proper Protection. Soil & Environment. https://doi.org/10.1007/978-94-011-2008-1_145. vol 1, pp. 673-676. Springer,
Dordrecht.

International Journal of Environmental & Agriculture Research (IJOEAR) ISSN:[2454-1850] [Vol-6, Issue-11, November- 2020]
Page | 61
[22] Plevich, J., Delagado, A., Saroff, C., Tarico, J., Crespi, R, J., Barotto, O. 2012. Elcultivo de alfalfa utilizando agua de perforación,
agua residual urbana y precipitaciones. Revista Brasileira de Engenharia Agrícola e Ambiental 16 (12) p 1353-1358.ISSN 1415-
4366. http://dx.doi.org/10.1590/S1415-43662012001200013.
[23] Ramírez, B., F. Caro, M. G. Valdivia, M. H. Ramírez y M. L. Machuca. 2011. Cambiosen tamaño y características químicas de
cálices de Jamaica (Hibiscus Sabdariffa L.) durante su maduración. Revista Chapingo Serie Horticultura 17 (2): 19-31.
[24] Ramón-Zamora, F., Rodríguez-Guevara N. J, Torres-Rodríguez, D. G., Yendis-Colinas,H. J. 2009. Uso de agua residual y contenido
de materia orgánica y biomasa microbiana en suelos de la llanura de Coro, Venezuela. Agric. Téc. Méx. Vol. 35, núm. 2: Pp. 211-
218. Printversion ISSN 0568-2517.
[25] Ruíz F. J., 2011. Ingeniería del compostaje, primera reimpresión. UniversidadAutónoma de Chapingo, ISBN-978-607-12-0049-5,
237 P, Texcoco, Estado de México,México.
[26] SAGARPA (Secretaría de Agricultura, Ganadería, Desarrollo Rural, Pesca yAlimentación). 2014. Servicio de Información
Agroalimentaria y Pesquera, Anuario Estadístico de la Producción Agrícola. http://www.siap.gob.mx. (Consulta: junio 19, 2016).
[27] SAGARPA (Secretaría de Agricultura, Ganadería, Desarrollo Rural, Pesca yAlimentación). 2015. Agenda técnica agrícola de
Guerrero. Segunda edición. ISBN volumen: 978-607-7668-42-8.
[28] SIAP (Servicio de Información Agroalimentaria y Pesquera). Agrifood and Fisheries Information Service. Date of query: 17 of
August 2016.Available athttp://infosiap.siap.gob.mx.
[29] SMN, 2010 (Servicio Meteorológico Nacional). Fecha de consulta: 09 de octubre de2016.Disponible en: http://smn.cna.gob.mx
[30] Varela, S.and Martínez, B.A. 2013. Uso del compost de biosólidos en la formulación desustratos para la producción industrial de
plantas de Nothofagus alpina. Revista Bosque 34 (3): 281-289.http://doi/10.4067/S0717-92002013000300004. ISSN- 0717-9200.
[31] Veliz, E., Llanes, J., Asela, L., Bataller, M. 2009. Reúso de aguas residuales domésticaspara riego agrícola. Valoración crítica.
Revista CENIC Ciencias Biológicas vol. 40, núm. 1: Pp. 35-44. ISSN 0253-5688.
[32] Vogt, C., Vogt, D., Brown, S., Tilley, J. P., Edmonds, R. L., Silver, W. L., Siccama, T.G. 1995. Dynamics of forest floor and soil
organic matter accumulation in boreal, temperate, and tropical forests. En: Lal R, Kimble J, Stewart BA (eds) Soil management and
the greenhouse effect. Advances in Soil Science. CRC. Boca Raton, Florida USA. Pp. 159-178.
http://doi.org/10.1201/9780203739310-14.

International Journal of Environmental & Agriculture Research (IJOEAR) ISSN:[2454-1850] [Vol-6, Issue-11, November- 2020]
Page | 62
Heavy Metal Contamination in Soil of Industrial Area, Dewas,
Madhya Pradesh, India Reeta Kori
1, Alok Saxena
2, Harish Wankhade
3, Asad Baig
4, Ankita Kulshreshtha
5*, Saket
Mishra6, Smriti Sen
7
Central Laboratory, Madhya Pradesh Pollution Control Board, Paryavaran Parisar, E-5, Arera Colony, Bhopal, India
Abstract— A study has been conducted to assess the heavy metal contamination in soil of Dewas industrial area of Madhya
Pradesh, India. Total eight locations and one control location were selected in Dewas industrial area for soil quality
monitoring w.r.t. heavy metals. The nine soil samples were monitored for heavy metals such as Chromium (Cr),
Manganese(Mn), Nickel (Ni), Copper (Cu), Zinc (Zn), Iron (Fe), Cadmium (Cd), Lead (Pb) and Cobalt (Co) analysis during
different four quarters from April 2019 to March 2020. The heavy metal contamination with w.r.t. Contamination Index (CI),
Pollution Load Index (PLI) study in selected locations in Dewas industrial area has been done. Over all Pollution Load
Index of soil was found greater than 1 which shows polluted soil w.r.t. heavy metals at all selected monitoring locations in
Dewas industrial area of Madhya Pradesh, India during this study.
Keywords— Industrial Area, Soil, Heavy Metals, Contamination Index (CI), Pollution Load Index (PLI).
I. INTRODUCTION
Heavy metals and trace elements are also a matter of concern due to their non biodegradable nature and long biological half-
lives [1]. Soil pollution due to heavy metals, such as cadmium, lead, chromium, copper, and iron is a problem of concern.
Although heavy metals are naturally present in soil, contamination comes from local sources: mostly industry, agriculture,
waste incineration, combustion of fossil fuels, and road traffic. The most important sources of heavy metals in soil are the
anthropogenic activities such as mining, smelting procedures, steel & iron industry, chemical industry, traffic, and agriculture
as well as domestic activities [2–11]. Soil is a dynamic medium made up of many minerals, organic matter, water, air, living
creatures including bacteria and earthworms. It was formed by changing due to physical factors; the parent material, time, the
climate and organisms present in composition. Generally polluted water also pollutes soil as it percolate in it. Solid waste is a
mixture of plastics, cloth, glass, metal and organic matter, sewage, sewage sludge, building debris, generated from
households, commercial and industries establishments add to soil pollution. Fly ash, iron & steel slag, medical & industrial
wastes disposed on land are important sources of soil pollution. Chemical and metallurgical industries are the most important
sources of heavy metals in soil [12–14]. The problem of soil pollution due to toxic metals has begun to cause concern now in
most of the major cities. Soil pollution in the environment with toxic metals has increased dramatically since the onset of the
industrial revolution [15-16]. Heavy metals in soil plays important role in biological system but it can cause harm if it in
higher concentration in any system of environment. Therefore concentration of Contamination Index (CI), Pollution Load
Index (PLI) w.r.t. heavy metals in Dewas Industrial area in Madhya Pradesh, India is important.
II. METHODOLOGY
2.1 Study Area
Dewas District in Ujjain Revenue Division, is situated on the Malwa plateau in the West-central part of Madhya Pradesh,
India and lies between 20°17´ and 23°20´ North latitude and 75°54´ and 77°08´ East longitude. The district is bounded by
Ujjain district in the north, Indore district in the west, West-Nimar district in the south-west, East Nimar district in the south,
Hoshangabad district in the South East, Sehore district in the east and Shajapur district in the North-East.
2.2 Monitoring Locations
Dewas industrial area is consist of four industrial area i.e. Industrial Area 1, Industrial Area 2 & 3, Sia Industrial Area, Ujjain
Road Industrial Area. Total eight locations and one control location in different industrial area in Dewas were selected for
soil is depicted in table no 1 and figure no 1.

International Journal of Environmental & Agriculture Research (IJOEAR) ISSN:[2454-1850] [Vol-6, Issue-11, November- 2020]
Page | 63
TABLE 1
MONITORING LOCATIONS AT DEWAS INDUSTRIAL AREA
S.N Code Industrial Area Monitoring Locations Latitude & Longitude
1. S1 Industrial Area 1 Near M/S White star milk and milk
products , Dewas 22.5754 & 76.2453
2. S2 Industrial Area 1 Near M/S Tata International Ltd, Dewas 23.1064 & 77.52432
3. S3 Industrial Area 1 Near M/S Raj Pioneer Laboratories
(India), Dewas 23.07689 & 77.55652
4. S4 Industrial Area 2 & 3 Near M/S Roca Bathroom Products Pvt
Ltd (Parryware Industry) Dewas 23.11448 & 77.51583
5. S5 Industrial Area 2 & 3 Near M/S VE Commercial Vehicle Ltd
unit 2 (Eicher), Dewas 23.10886 & 77.51757
6. S6 Industrial Area 2 & 3 Near M/S Navin Fluorine International
Ltd, Dewas 23.09844 & 77.52922
7. S7 Sia Industrial Area Near M/S Krishna Food Products Ltd,
Dewas 23.08073 & 77.53493
8. S8 Ujjain Road Industrial
Area
Near M/S Kriloskar Brother’s Ltd,
Dewas 23.07719 & 77.54176
9. CS (Control
Site)
Ujjain Road Industrial
Area Near M/S Bank Note Press , Dewas 23.07449 & 77.53204
FIGURE 1: Monitoring Locations at Dewas industrial area
2.3 Monitoring
All soil samples were collected as per standard guidelines followed by Central Pollution Control Board. The aliquots of soil
mixed together (unwanted matters to be separated manually before mixing of samples) during collection from the each
selected sampling area. Out of this mixture, approx. 500 gm sample to be taken into polypropylene zip pouch, duly coded,

International Journal of Environmental & Agriculture Research (IJOEAR) ISSN:[2454-1850] [Vol-6, Issue-11, November- 2020]
Page | 64
labeled at field as per guidelines of Central Pollution Control Board. Soil samples were collected from the outer surface, i.e.
05–15 cm depth, after removing surface contamination. Sampling was carried out using a plastic spatula and the use of metal
tools was avoided. The samples were collected in self-locking polythene bags and were sealed in double bags.
2.4 Digestion and Analysis:
Soil samples were dried for two days at room temperature. The dry soil sample was disaggregated with mortar and pestle.
The sample was finely powdered to –250 mesh size (US Standard) using a swing grinding mill. All soil samples were
digested by EPA Method 3050B (Acid Digestion of Sediments, Sludges and Soils) and analyzed by atomic absorption
spectrophotometer (Perkin Elmer Pinnacle 900H) [17].
2.5 Soil Pollution Indices
Pollution assessment models are indicators used to assess the presence and intensity of anthropogenic contaminant deposition
on soils. In this study, the following pollution assessment models were employed: Contamination Index (CI), Pollution Load
Index (PLI) w.r.t heavy metals concentration present in soil.
2.5.1 Contamination Index (CI):
The contamination factors were derived by using the CI equation as defined [18]:
CF= Cn/Bn (1)
Where Cn = measured metal concentration and Bn = background concentration from control site. The concentration factor
observe as; CF < 1 low; 1 < CF < 3 moderate; 3 < CF < 6 considerable, and CF > 6 as high contamination [19].
2.5.2 Pollution Load Index (PLI):
The PLI gives a generalized assessment on the level of soil contamination. The PLI is obtained using approach as follows
[20]:
PLI = [CF1 ×CF2 ×CF3 ×……. × C n] 1/n (2)
Where, CF= contamination factor; and n = number of metals. PLI > 1 indicates pollution exists; PLI < 1 indicates no metal
pollution [21]; and PLI = 1 indicates heavy metal loads close to the background level [22].
III. RESULT & DISCUSSION
The observed concentration of heavy metals in soil is depicted in Table 2. Contamination index (CI) and Pollution load index
(PLI) w.r.t. heavy metals in soil of all selected locations are presented in Table 3. All results are shown in figure no. 2 to
figure no 11.
TABLE 2
HEAVY METALS CONCENTRATION IN SOIL
S.N Analytes Unit CS S1 S2 S3 S4 S5 S6 S7 S8
1 Cr mg/kg 89 113 149 127 230 545 120 417 129
2 Mn mg/kg 524 921 1301 927 771 1566 1105 891 1274
3 Ni mg/kg 42 43 73 65 43 90 61 52 47
4 Cu mg/kg 81 172 192 153 129 146 117 110 179
5 Zn mg/kg 89 140 114 110 124 116 99 119 173
6 Co mg/kg 30 36 42 38 34 39 38 32 42
7 Cd mg/kg 1 2 1 1 1 1 2 2 2
8 Fe mg/kg 15323 46456 56801 48573 33429 52437 43657 27668 45858
9 Pb mg/kg 59 63 118 93 89 93 102 72 116

International Journal of Environmental & Agriculture Research (IJOEAR) ISSN:[2454-1850] [Vol-6, Issue-11, November- 2020]
Page | 65
TABLE 3
CONTAMINATION INDEX (CI) AND POLLUTION LOAD INDEX (PLI) OF SOIL
Heavy Metal D1 D2 D3 D4 D5 D6 D7 D8
Cr 1.269 1.674 1.426 2.584 6.123 1.348 4.685 1.449
Mn 1.757 2.482 1.769 1.471 2.988 2.108 1.7 2.431
Ni 1.023 1.738 1.547 1.023 2.142 1.452 1.238 1.119
Cu 2.123 2.37 1.888 1.592 1.802 1.444 1.358 2.209
Zn 1.573 1.28 1.235 1.393 1.3 1.112 1.337 1.943
Co 1.2 1.4 1.266 1.133 1.3 1.266 1.066 1.4
Cd 2 1 1 1 1 2 2 2
Fe 3.031 3.706 3.169 2.181 3.422 2.849 1.805 2.992
Pb 1.067 2 1.576 1.508 1.576 1.728 1.22 1.966
Pollution
Load Index
(PLI)
1.573 1.827 1.568 1.47 2.051 1.633 1.636 1.869
Figure no 2 is showing that average concentration of Chromium (Cr) was found 89 mg/kg at control site (CS). Minimum
average concentration was found 120 (S6) mg/kg and maximum average concentration was found 545 (S5) mg/kg during this
study.
FIGURE 2: Chromium (Cr) concentration in Soil
Figure no 3 is showing that average concentration of Manganese (Mn) was found 524 mg/kg at control site (CS). Minimum
average concentration was found 771 (S4) mg/kg and maximum average concentration was found 1566 (S5) mg/kg during
this study.
FIGURE 3: Manganese (Mn) concentration in Soil

International Journal of Environmental & Agriculture Research (IJOEAR) ISSN:[2454-1850] [Vol-6, Issue-11, November- 2020]
Page | 66
Figure no 4 is showing that average concentration of Nickel (Ni) was found 42 mg/kg at control site (CS). Minimum average
concentration was found 43 (S1) mg/kg and maximum average concentration was found 90 (S5) mg/kg during this study.
FIGURE 4: Nickel (Ni) concentration in Soil
Figure no 5 is showing that average concentration of copper (Cu) was found 81 mg/kg at control site (CS). Minimum average
concentration was found 110 (S7) mg/kg and maximum average concentration was found 192 (S2) mg/kg during this study.
FIGURE 5: Copper (Cu) concentration in Soil
Figure no 6 is showing that average concentration of zinc (Zn) was found 89 mg/kg at control site (CS). Minimum average
concentration was found 99 (S6) mg/kg and maximum average concentration was found 173 (S8) mg/kg during this study.
FIGURE 6: Zinc (Zn) concentration in Soil
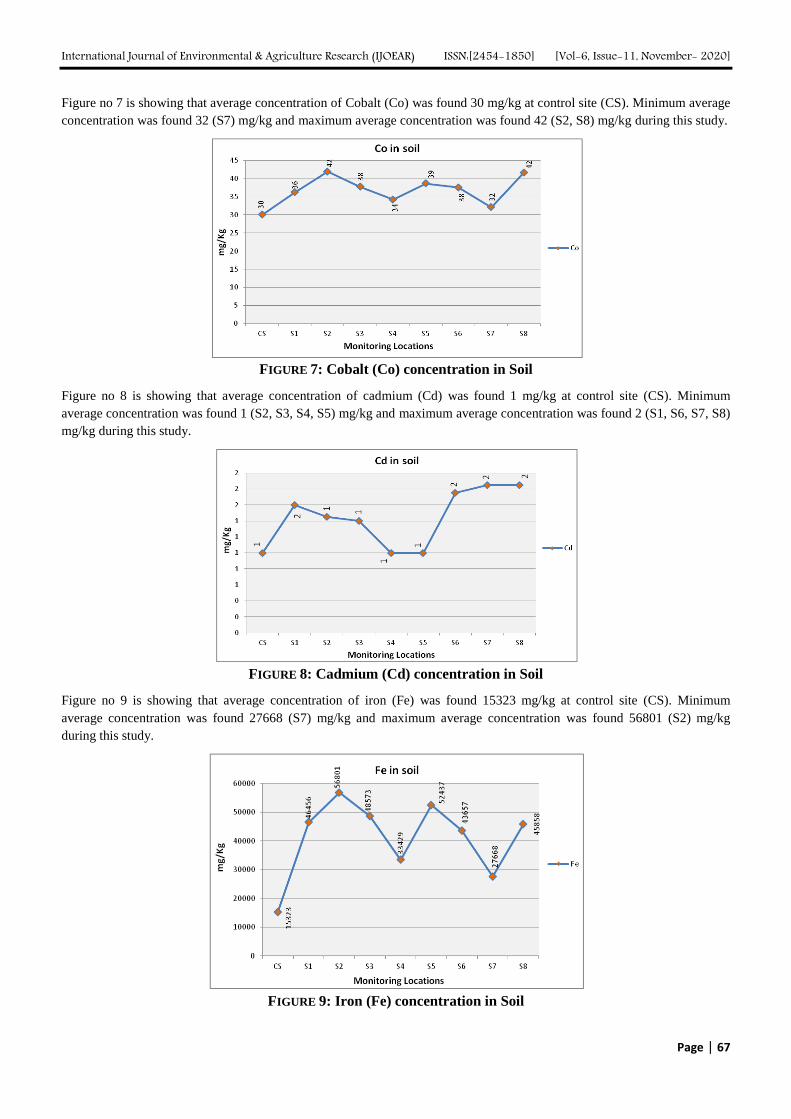
International Journal of Environmental & Agriculture Research (IJOEAR) ISSN:[2454-1850] [Vol-6, Issue-11, November- 2020]
Page | 67
Figure no 7 is showing that average concentration of Cobalt (Co) was found 30 mg/kg at control site (CS). Minimum average
concentration was found 32 (S7) mg/kg and maximum average concentration was found 42 (S2, S8) mg/kg during this study.
FIGURE 7: Cobalt (Co) concentration in Soil
Figure no 8 is showing that average concentration of cadmium (Cd) was found 1 mg/kg at control site (CS). Minimum
average concentration was found 1 (S2, S3, S4, S5) mg/kg and maximum average concentration was found 2 (S1, S6, S7, S8)
mg/kg during this study.
FIGURE 8: Cadmium (Cd) concentration in Soil
Figure no 9 is showing that average concentration of iron (Fe) was found 15323 mg/kg at control site (CS). Minimum
average concentration was found 27668 (S7) mg/kg and maximum average concentration was found 56801 (S2) mg/kg
during this study.
FIGURE 9: Iron (Fe) concentration in Soil

International Journal of Environmental & Agriculture Research (IJOEAR) ISSN:[2454-1850] [Vol-6, Issue-11, November- 2020]
Page | 68
Figure no 10 is showing that average concentration of lead (Pb) was found 59 mg/kg at control site (CS). Minimum average
concentration was found 63 (S1) mg/kg and maximum average concentration was found 118 (S2) mg/kg during this study.
FIGURE 10: Lead (Pb) concentration in Soil
Figure no 11 is showing that Pollution Load Index (PLI) was found 1.47 (S4) and maximum Pollution Load Index was found
2.051 (S5). Over all Pollution Load Index was found greater than 1 which shows polluted soil w.r.t. heavy metals at all
selected monitoring locations during this study.
FIGURE 11: Pollution Load Index w.r.t. Heavy Metals in Soil
IV. CONCLUSION
Almost three fourths of the area in the Dewas district is covered by black cotton soils, which is occupied by Deccan Basalts.
The southern part has red yellow mixed soils derived from sandstone, shale, gneiss. The heavy metal contamination with
w.r.t. Contamination Index (CI), Pollution Load Index (PLI) study in selected locations in Dewas industrial area has been
done. Over all Pollution Load Index of soil was found greater than 1 which shows polluted soil w.r.t. heavy metals at all
selected monitoring locations in Dewas industrial area of Madhya Pradesh, India during this study.
ACKNOWLEDGEMENTS
The authors acknowledge the help received from authorities of monitoring locations of Dewas industrial area. We all authors
acknowledge to the Chairman and Member Secretary, Madhya Pradesh Pollution Control Board, for encouragement of study
work and kind permission to publish this paper.

International Journal of Environmental & Agriculture Research (IJOEAR) ISSN:[2454-1850] [Vol-6, Issue-11, November- 2020]
Page | 69
REFERENCES
[1] Rahman S H, Khanam D, Adyel T M, Islam M S, Ahsan M A and Akbor M A. (2012) Assessment of Heavy Metal Contamination of
Agricultural Soil around Dhaka Export Processing Zone (DEPZ), Bangladesh:Implication of Seasonal Variation and Indices. Appl.
Sci. 2, 584-601.
[2] Suciu C I, Cosma M, Todicˇa S D, Bolboacˇa and Jantschi L. (2008) Analysis of soil heavy metal pollution and pattern in central
Transylvania. Int J of Mole Sci.9, 434–453.
[3] Chopin E I B and Alloway B J. (2007) Distribution and mobility of trace elements in soils and vegetation around the mining and
smelting areas of Tharsis, R´ıotinto and Huelva, Iberian Pyrite Belt, SW Spain. Water, Air, and Soil Pollution. 182, 1–4, 245–261.
[4] Garcia R and Mill´an E. (1998). Assessment of Cd, Pb and Zn contamination in roadside soils and grasses from Gipuzkoa (Spain).
Chemosphere. 37, 8, 1615–1625.
[5] Li X, Poon C S, and Liu P S. (2001) Heavy metal contamination of urban soils and street dusts in Hong Kong. Applied Geochemistry.
16, 11-12, 1361–1368.
[6] Sezgin N, Ozcan H K, Demir G, Nemlioglu S, and Bayat C. (2004) Determination of heavy metal concentrations in street dusts in
Istanbul E-5 highway. Environment International, 29, 7, 979–985.
[7] Viard B, Pihan F, Promeyrat S, and Pihan J C. (2004) Integrated assessment of heavy metal (Pb, Zn, Cd) highway pollution:
bioaccumulation in soil, graminaceae and land snails. Chemosphere.55 , 10, 1349–1359.
[8] Nabulo G, Oryem-Origa H, and Diamond M. (2006) Assessment of lead, cadmium, and zinc contamination of roadside soils, surface
films, and vegetables in Kampala City, Uganda. Environmental Research. 101, 42–52, 2006.
[9] Oliva S R and Espinosa A J F. (2007) Monitoring of heavy metals in topsoils, atmospheric particles and plant leaves to identify
possible contamination sources. Microchemical Journal. 86,1; 131–139.
[10] Kampa M and Castanas E. (2008) Human health effects of air pollution. Environmental Pollution. 151, 2, 362–367.
[11] Guo-li L, Da-xue, L and Quan-ming L. (2008) Heavy metals contamination characteristics in soil of different mining activity zone
Trans, Transactions of NonferrousMetals Society of China. 18, 1, 207–211.
[12] Pantelica A, Cercasov V, Steinnes E, Bode P and Wolterbeek B. (2008) in Proceedings of the 4th National Conference of Applied
Physics (NCAP ’08), 25–26, Galati, Romania, September.
[13] De Vries W, R¨omkens P F and Sch¨utze G (2007). Critical soil concentrations of cadmium, lead, and mercury in viewof health
effects on humans and animals. Reviews of Environmental Contamination and Toxicology. 191, 91–130.
[14] Cojocaru V, Pantelicˇa A, Pincovschi E and Georgescu I . (2006) EDXRF versus INAA in a pollution control of soil. Journal of
Radioanalytical and Nuclear Chemistry. 268, 1, 71–78.
[15] BangaloreMetropolitan Rapid Transport Limited, Environmental Impact Analysis, 2006.
[16] Nriagu J O (1979) “Global inventory of natural and anthropogenic emissions of trace metals to the atmosphere. Nature, 279, 409–411.
[17] Acid Digestion of Sediments, Sludges and Soils, EPA Method 3050B, Revision 2 December 1996.
[18] Lacutusu R. Appraising levels of soil contamination and pollution with heavy metals In Heinike HJ, Eckselman W, Thomasson AJ, et
al. (2000). Land information systems for planning the sustainable use of land resources. European Soil Bureau Research Report No. 4.
Office of Official Publication of the European Communities, Luxembourg. 393-402.
[19] Hakanson L. (1980) An ecological risk index for aquatic pollution control: a sedimentological approach. Water Res. 14:975–1001.
[20] Thomilson DC, Wilson DJ, Harris CR, et al. (1980). Problem in heavy metals in estuaries and the formation of pollution index. Helgol
Mar Res. 33: 566-575.
[21] Chakravarty M and Patgiri AD (2009). Metal pollution assessment in sediments of the Dikrong river, N.E. India. J Hum Ecol.
27(1):63–67.
[22] Cabrera F, Clemente L and Barrientos DE. (1999). Heavy metal pollution of soils affected by the Guadiamar toxic flood. Sci Total
Environ . 242(1–3):117–129.

International Journal of Environmental & Agriculture Research (IJOEAR) ISSN:[2454-1850] [Vol-6, Issue-11, November- 2020]
Page | 70
Bacteriological Characteristics of Spring Water in Ambo Town,
West Shoa Zone, Oromia Region, Ethiopia P. Sekhar
Environmental science division, Biology department, Bule Hora University, Bule Hora, Ethiopia
Abstract— Present study was carried out to assess the quality of spring waters in terms of microbiological and chemical
characters from Ambo. The results of the study revealed that chemical parameters such as pH (6.36-7.94),TDS(407-
1041mg/L), DO(1.5-5.85mg/L),TS (1170-495mg/L), total alkalinity (313-1277mg/L), total hardness (38-1274 mg/L),COD
(70.5-9mg/L)in the “Hora” water were higher than the maximum permissible levels of WHO standards for drinking waters.
Total aerobic mesophilic bacterial counts tested were found to be as0.977×104
cfu/ml for SFWS, 2.35 ×10⁴cuf/ml for
CDSTRM,1.14×104cfu/ml for HB,0.553×10
4 cfu/ml for HD and2.72×10
4for Huluka streams samples. The “Hora” water
contained different coli forms when tested by most probable number (MPN) method found to be in the order of 0.66 × 10²
cfu/ml for SFWS, 39 x 102
cfu/ml for CDSTRM, 0×102 for HB, 0×10
2forHDand28×10
2cfu/ml for Huluka stream. The water
samples from the different “Hora” water sources showed significant variations with respect to bacteriological and chemical
characteristics during study period. Statistical analysis showed significant difference (p <0.05) in the distribution of total
coli form, and aerobic mesophilic heterotrophic bacteria at various sampling locations. The study concluded poor water
quality in terms of bacteriological and chemical characteristics of “Hora”water sources as all the parameters were well
above WHO prescribed standards.
Keywords— Ambo town, bacteriological & chemical characteristics, Hora spring water, Huluka river, water quality,
WHO standards.
I. INTRODUCTION
Water is very essential to life and it is undoubtedly the most precious natural resource that exists on our planet. Several
forces have been continued to seriously affect the quality of water resources. Many of these are result of human activities and
natural processes and include ecosystem and landscape changes, sedimentation, pollution, over- abstraction and climate
change. Besides the following natural and human induced factors also affects the quality of water including geology,
hydrology, natural hazards, sedimentation/ erosion, agricultural activities, industrial, mining, fishing, sewage discharging/
disposal, deforestation, and other commercial activities. These activities aggravate the pollution of water body and greatly
influence the quality of water [1]. Physicochemical and biological water quality indicators will be affected by various ways
[2]. The health of aquatic ecosystem is depended on the physico- chemical and biological characteristics [3].The presence of
certain microorganisms in water is used as an indicator of possible contamination and an index of water quality [4]. Natural
hot and mineral springs water can be defined as water that, while circulating underground, undergoes changes in its
composition through heat, pressure and time caused by interaction with the surrounding rock [5].Natural mineral water is
characterized by its chemical and microbiological compositions which distinguishes it from drinking water and may not be
treated in any way that alters these properties [6]. Besides, the temperature and other essential characteristics of natural
mineral water must remain stable over time. Constituents may be present in the natural state in certain natural mineral waters
because of their hydro geological origin may present risk to public health above a certain concentration. It is therefore
deemed necessary to establish concentration limits for these constituents in natural mineral water [6].
Horas are used as a source of mineral supplement for livestock (cattle, sheep and goats). Water from the “Hora” is perceived
to enhance fat, fertility and resistance to diseases [7].In every country that has been investigated natural hot springs mineral
water have historically been attributed with therapeutically benefits due to their individual mineral compositions. Ambo
“Hora” water (mineral water) is one of water sources which have been used by the city of Ambo, Ambo district and others
for drinking purpose (both for humans and animals). It has been considered as having medicinal, bathing recreational,
cleaning, cultural values, economic importance (income generation), and other related purpose. People believe that the Ambo
“Hora” water has the medicinal value to protect the animals from different diseases, very important for their health and
growth. The Ambo “Hora” water has been used throughout the history of human population, but (still no one knows the

International Journal of Environmental & Agriculture Research (IJOEAR) ISSN:[2454-1850] [Vol-6, Issue-11, November- 2020]
Page | 71
composition of the water) there was no study carried to determine the bacteriological and physico-chemical characteristics of
this “Hora” water. So, study was aimed at assessing the bacteriological and chemical characteristics of Ambo Hora water.
This study will also help concerned authorities to understand the status of these spring waters and take appropriate measures
to protect these spring waters from being polluted from anthropogenic activities as these are important in terms of its tourism
value.
II. METHODOLOGY
2.1 Description of the Study Area
This study was carried out in Ambo town; West Showa located 115km west of Addis Ababa, the capital city of Ethiopia. The
town has a latitude and longitude of 8°59′N 37°51′E and an elevation of 2101 meters above sea level. Ambo town is known
for its mineral water from natural springs, which is bottled and the most popular brand in Ethiopia.
2.2 Sampling Methods
Samples were collected from five different locations of natural springs which include sites for human bathing (HB), cattle
drinking stream (CDSTRM), human drinking (HD), spring filewuha (SFW) and Huluka stream (HUSTR).
2.3 Sampling Size
Total 30 samples were collected from all the five different “Hora”water sources taking two representative samples from each
site.
2.4 Sampling Collection procedure
The water samples were collected by using sterilized bottles in order to avoid contamination of the bottles following standard
protocols of sample collection. All samples were collected from different locations of upstream and downstream of
confluences or point sources with at least 1m intervals. After collection of samples they were brought to microbiology and
chemistry laboratories of biology department, Ambo University.
2.5 Chemical Analysis of the Ambo “Hora” Water
Measurement of selected chemical parameters were carried out according standard procedures [8].
2.6 Bacteriological Analysis of the Ambo “Hora” Water
Bacteriological analysis of the water samples was carried out using multiple tube fermentation method for enumeration of
total coliform count. Decimal dilution series up to 10-7
from the original sample were prepared and inoculated into five
lactose broth tubes. Durham’s tubes were introduced in all tubes and sterilized them at a time. 1ml, 0.1mland 0.01ml water
samples were added to each of 5 lactose broth tubes and labeled correspondingly. Lactose broth tubes were incubated at37oC
and examined the gas formation in Durham tubes at 24hour and 48-hour intervals. Numbers of positive tubes in each dilution
were counted and a loop full of cultured from the lactose broth tube from the highest dilution that still showed positive test
was taken and streaked it on EMB and ENDO agar plates. The Petri dishes were incubated upside down at the appropriate
temperatures 37oC for total coli forms for 24 hours. After incubation, typical colonies were identified and observed for the
typical coli form colonies showed a greenish metallic sheen [9].
2.6.1 Plate Count Method
Surface plate count method was used to quantify the bacteria in the samples. Serial dilutions were prepared with sterilized
water. Seven tenfold serial dilutions of water samples were prepared and 1ml of each of the dilution was evenly spread on
nutrient agar (PCA) by using a sterilized bacterial spreader under laminar flow hood. This was repeated for each sample. The
inoculated plates were then incubated at 28oC for three days. Colonies were counted visually after three days of incubation
and then stored in the refrigerator for further analysis.
Plates with less than 300 colonies and more than 30 colonies were utilized for data analysis. Results were recorded in units of
CFU/1 ml of initial sample water. The concentration of bacteria in the original sample was determined as follows:
CFU = total colonies counted x dilution factor / volume plated

International Journal of Environmental & Agriculture Research (IJOEAR) ISSN:[2454-1850] [Vol-6, Issue-11, November- 2020]
Page | 72
2.6.2 Motility Test [10].
A straight needle was slightly touched to a young colony of 24 hrs and stabbed to a depth of only 1/3 to 1/2 inch slant culture
growing on agar medium. The slants were incubated at 37°C and examined daily for up to 7 days. A positive result indicates
diffuse, hazy growths that spread throughout the medium rendering it slightly opaque whereas negative result indicates
growth that is confined to the stab-line.
2.6.3 Biochemical characterization
2.6.3.1 Oxidase test [9].
Oxidase test was conducted according to the following procedure. A fresh culture (18 to 24 hours) of bacteria was grown in
4.5mL of nutrient broth and kept for overnight. A 0.2mL of 1% α-naphthol, and 0.3mL of 1% p-amino dimethylaniline
oxalate (Gaby and Hadley reagents) to the overnight broth culture and then mixed vigorously. The culture was observed for
color changes within 10s to 30s. It was interpreted an oxidase positive when the color changed to dark purple within 5 to 10
seconds and oxidase negative if the color did not change or it was taken longer than 2 minutes.
2.6.3.2 KliglirsIron Agar Test
A 57.52g of Kliglirs iron agar medium was take in one liter of purified water and heated with frequent agitation and boiled
for one minute to completely dissolve the medium. And then distributed into test tubes and autoclaved for 15 minutes at
121oC. After autoclaving, medium was allowed to solidify in a slanted position. Culture response in Kligler Iron Agar media
incubated aerobically at 35°C was examined for 24 hours. Results were interpreted as: an alkaline slant-acid butt (red/yellow)
indicates fermentation of dextrose only. An acid slant-acid butt (yellow/yellow) indicates fermentation of dextrose and
lactose. An alkaline slant-alkaline butt (red/red) indicates dextrose and lactose did not ferment (non-fermented). Cracks,
splits, or bubbles in the medium indicates gas production [10].
2.6.3.3 Catalase test
A 24-hour old culture was used to make a homogenous suspension on the slide. A one drop of hydrogen peroxide (3%) was
added to the suspension of pure culture isolates and the observed gas formation (effervescence) [11].
2.6.3.4 Simmon citrate agar Test
Simmon citrate agar was used to test citrate utilization. Using a sterile straight wire loop, a saline suspension of the test
organism was first streaked on the slant and then stabbed (to create anaerobic condition). All the slants were incubated for 4
days at 37oC in an aerobic atmosphere to detect the production of a positive reaction as indicated by growth with an intense
blue cooler in the slant [9].
2.6.3.5 Urea agar test
Urea agar test was used for detection of urease production by proteus species and other members of Enterobacteriaceae. A 24
gm of urea powder was added in distilled water and brought the volume to 950 ml and mixed thoroughly. Slants were
prepared with urea broth and slants were inoculated with isolates and incubated at 370C for 24 hours. The development of
pink color colonies indicates a positive result [12].
2.7 Data Analysis
Data analysis was carried out using SPSS 21 version. Parameters like descriptive statistics and 2-tailed correlation analysis
was done to know any significant relation exists among various biological and chemical parameters.
III. RESULT & DISCUSSION
Results of Physico-chemical parameters of water samples from “Hora” waters and Huluka stream were analyzed and results
were represented in the following table.

International Journal of Environmental & Agriculture Research (IJOEAR) ISSN:[2454-1850] [Vol-6, Issue-11, November- 2020]
Page | 73
TABLE 1
PHYSICO-CHEMICAL PARAMETERS OF HORA WATER SOURCES
S.No. Parameter
Sample sites
SFWS* CDSTRM* HB* HD* HULSTRM*
1 Temp. 400C±0.50 35
0±0.50 40.83
0C±O.28. 39.76
oC±1.07 27.33
0C±1.00
2 PH 6.37±0.00 6.68±0.01 6.34±0.01 6.38±0.00 7.93±0.01
3 Electrical conductivity (µS/cm) 1791 ±3.0 1933.33±2.08 1913±5.13 1910±8.0 403.66±2.08
4 TDS (ppm) 972.5±2.50 1039±6.55 812.5±2.51 986.53±2.62 402±2.64
5 DO (ppm) 1.6±0.10 1.2±0.04 1.6±0.95 1.8± 0.8 5.8±0.09
6 TS (ppm) 977.66±2.51 1167.00±2.00 926.83±2.36 1045.00±2.00 495.33±3.01
7 TA (ppm) 1260.66±3.05 1253.33±7.63 1256.60±7.63 1261±11.53 312±10.58
8 TH (ppm) 1269.50±10.75 1255±5.00 1277±2.00 1270±17.32 35.33±2.30
9 COD (ppm) 69.5±0.76 80.33±1.04 84.33±0.76 72.93±0.51 92±0.70
*SFWS - Spring file wuha sources, HB-human drinking, HULSTRM - Huluka stream, CDSTMR - cattle drinking
stream, HD–human drinking
The table 1 shows mean values of the temperature between 27.33oC to 40.83
oC. The lowest value (27.33
oC) was found in
sample site Huluka stream and the highest temperature value (40 .83OC) at sample site of human bathing. During the present
investigation, there was no great difference among the temperatures of Hora waters and all of them were above WHO
standards of 15oC. The temperature range during the present study was 27.33 to 40.83
oC. This range was also considered as
above the maximum limit of temperature for drinking water specified by WHO which is 15oC. During the present
investigation, there was no great difference among the temperatures of Hora waters and all of them were above WHO
standards of 15oC. but temperatures are higher than the study conducted in Bahir Dar town (15–20 °C) spring waters [13].
Higher water temperatures promote the growth of microorganisms in the water, which may increase the taste, odor, turbidity
and cause corrosion problems and also it decreases the solubility of gas in the water [14]. The temperature range during the
present study was 27.33 to 40.83oC. This range was also considered as above the maximum limit of temperature for drinking
water specified by WHO which is 15oC.
Mean pH values of water samples obtained from five sources were shown in table 1 and they are in the range of 7.93 to 6.34.
Human bathing recorded the lowest pH value of 6.34 followed by spring File wuha 6.37. Other sources also shown more or
less same range of pH as evident from the table no 1. But Huluka stream has registered highest pH value of 7.93. The Huluka
stream, CDSTRM and other samples recorded pH within the permissible value of 6.5 to 8.5 for drinking water [15]. The high
value of pH may be the result of waste discharge, microbial decomposition of organic matter in the water body [16]. The
lower pH values obtained in the study from the SFWS, HB and HD samples could be attributed to mineral salts dissolved in
the water. The low pH values observed in most wells and springs could be associated with carbon dioxide saturation in the
ground water [17]. The relatively higher pH of the streams could be attributable to the large surface area of the stream which
exposes it to sunlight thus increasing the temperature and photosynthetic activities which in turn increases alkalinity of the
water [18].
Data in Table 1 shows that the mean of the conductivity of water samples from the five water sources ranged from 403.66
to1933.33μs/cm. The least conductivity was observed in Huluka stream (403.66). Conductivity is a measure of the ability of
aqueous solution to carry an electric current that depends on the presence and total concentration of ions their mobility and
valance and on the temperature [19]. There is a very good positive correlation exists among conductivity, total solids and
total dissolved solids which indicates higher chemical pollutant character of the waters in the study sites.
The mean TDS content values ranged from 402 to 1039 mg/l as depicted in table 1. Huluka stream had the lowest TDS value
of 402 mg/L followed by HD (986.53 mg/l), SFW(972.5mg/l), HB (812.5 mg/l) and the CDSTRM (1039 mg/l). The highest
level was observed in CDSTRM (1039 mg/l). High values of TDS indicate that the “Hora “water is unfit for human
consumption. In the present study, it is found that almost all samples have TDS values more than the prescribed standards
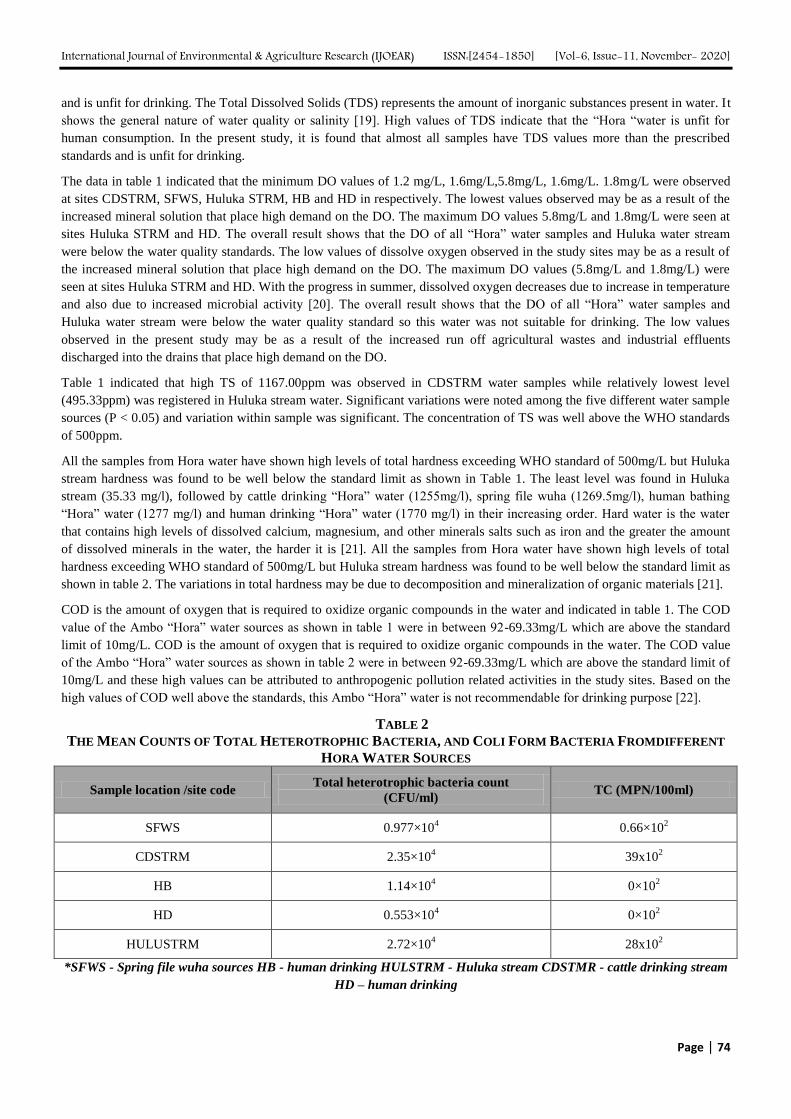
International Journal of Environmental & Agriculture Research (IJOEAR) ISSN:[2454-1850] [Vol-6, Issue-11, November- 2020]
Page | 74
and is unfit for drinking. The Total Dissolved Solids (TDS) represents the amount of inorganic substances present in water. It
shows the general nature of water quality or salinity [19]. High values of TDS indicate that the “Hora “water is unfit for
human consumption. In the present study, it is found that almost all samples have TDS values more than the prescribed
standards and is unfit for drinking.
The data in table 1 indicated that the minimum DO values of 1.2 mg/L, 1.6mg/L,5.8mg/L, 1.6mg/L. 1.8mg/L were observed
at sites CDSTRM, SFWS, Huluka STRM, HB and HD in respectively. The lowest values observed may be as a result of the
increased mineral solution that place high demand on the DO. The maximum DO values 5.8mg/L and 1.8mg/L were seen at
sites Huluka STRM and HD. The overall result shows that the DO of all “Hora” water samples and Huluka water stream
were below the water quality standards. The low values of dissolve oxygen observed in the study sites may be as a result of
the increased mineral solution that place high demand on the DO. The maximum DO values (5.8mg/L and 1.8mg/L) were
seen at sites Huluka STRM and HD. With the progress in summer, dissolved oxygen decreases due to increase in temperature
and also due to increased microbial activity [20]. The overall result shows that the DO of all “Hora” water samples and
Huluka water stream were below the water quality standard so this water was not suitable for drinking. The low values
observed in the present study may be as a result of the increased run off agricultural wastes and industrial effluents
discharged into the drains that place high demand on the DO.
Table 1 indicated that high TS of 1167.00ppm was observed in CDSTRM water samples while relatively lowest level
(495.33ppm) was registered in Huluka stream water. Significant variations were noted among the five different water sample
sources (P < 0.05) and variation within sample was significant. The concentration of TS was well above the WHO standards
of 500ppm.
All the samples from Hora water have shown high levels of total hardness exceeding WHO standard of 500mg/L but Huluka
stream hardness was found to be well below the standard limit as shown in Table 1. The least level was found in Huluka
stream (35.33 mg/l), followed by cattle drinking “Hora” water (1255mg/l), spring file wuha (1269.5mg/l), human bathing
“Hora” water (1277 mg/l) and human drinking “Hora” water (1770 mg/l) in their increasing order. Hard water is the water
that contains high levels of dissolved calcium, magnesium, and other minerals salts such as iron and the greater the amount
of dissolved minerals in the water, the harder it is [21]. All the samples from Hora water have shown high levels of total
hardness exceeding WHO standard of 500mg/L but Huluka stream hardness was found to be well below the standard limit as
shown in table 2. The variations in total hardness may be due to decomposition and mineralization of organic materials [21].
COD is the amount of oxygen that is required to oxidize organic compounds in the water and indicated in table 1. The COD
value of the Ambo “Hora” water sources as shown in table 1 were in between 92-69.33mg/L which are above the standard
limit of 10mg/L. COD is the amount of oxygen that is required to oxidize organic compounds in the water. The COD value
of the Ambo “Hora” water sources as shown in table 2 were in between 92-69.33mg/L which are above the standard limit of
10mg/L and these high values can be attributed to anthropogenic pollution related activities in the study sites. Based on the
high values of COD well above the standards, this Ambo “Hora” water is not recommendable for drinking purpose [22].
TABLE 2
THE MEAN COUNTS OF TOTAL HETEROTROPHIC BACTERIA, AND COLI FORM BACTERIA FROMDIFFERENT
HORA WATER SOURCES
Sample location /site code Total heterotrophic bacteria count
(CFU/ml) TC (MPN/100ml)
SFWS 0.977×10⁴ 0.66×10
2
CDSTRM 2.35×10⁴ 39x10
2
HB 1.14×10⁴ 0×10
2
HD 0.553×10⁴ 0×10
2
HULUSTRM 2.72×10⁴ 28x10
2
*SFWS - Spring file wuha sources HB - human drinking HULSTRM - Huluka stream CDSTMR - cattle drinking stream
HD – human drinking

International Journal of Environmental & Agriculture Research (IJOEAR) ISSN:[2454-1850] [Vol-6, Issue-11, November- 2020]
Page | 75
The total heterotrophic counts as showed in table 2 ranged from 0.977×10⁴
to 2.72×10⁴ cfu/ml. The Huluka stream samples
recorded the highest count of 2.72×10⁴ cfu while HD had the least bacterial count of 0.553×10
4. The CDSTRM, HB and SFW
samples had bacterial count of 2.35×10⁴,
1.14×10⁴
and 0.977×10⁴ cfu/ml respectively. Out of all samples of “Hora” water,
CDSTRM water and Huluka stream water samples contained higher total heterotrophic bacterial counts than the others.
Heterotrophic bacterial count of some samples in the present study was high exceeding standard permissible limit for
drinking water. The most probable number (MPN/100ml) values were recorded (Table 2) as 0.66×10²
MPN/100ml in SFWS,
39 x 102
MPN/100ml in CDSTRM and 28 x 102
MPN/100ml in Huluka stream water samples. Except HD and HB “Hora”
water all samples such as CDSTRM, Huluka stream, and SFW water samples were not within the standards of WHO for coli
forms. From all samples of “Hora” water, CDSTRM water and Huluka stream water samples contained higher total
heterotrophic bacterial counts than the others. Heterotrophic bacterial count of some samples in the present study was high
exceeding standard permissible limit for drinking water. This finding was in good agreement with similar studies by other
workers who reported that the sources of heterotrophic bacteria in water are human and animal wastes, run off pasture,
natural soil or plant bacteria, sewage, and other unsanitary practices [23]. Runoffs, sewage, agricultural waste are usually
high inorganic matter and nutrients and could cause increase in the bacteriological load of the water bodies thereby resulting
in high heterotrophic bacteria counts [24]. The higher number of bacterial count recorded in Huluka stream water samples
could probably be as a result of the increased surface area of the stream which exposes the water to contaminants as well as
human activities like swimming, washing, dipping of dirty legs or hands and inside the stream while fetching water [25].
Except HD and HB “Hora” water all samples such as CDSTRM, Huluka stream, and SFW water samples were not within the
standards of WHO for coli forms. The high coli forms obtained may be an indication that the water samples were
contaminated by fecal matter [26]. The presence of bacteria was not only making the water unsuitable for human
consumption, but also poses serious health concerns [15]. Similar studies reported the presence of these bacteria in drinking
water sources [27] and attributed it to indiscriminate human and animal defecation and general poor sanitation.
TABLE 3
DESCRIPTIVE STATISTICS
Mean Std. Deviation N
TEMP 36.5840 5.65531 5
PH 6.7400 .67937 5
EC 1590.1320 665.61654 5
TDS 842.5060 260.38296 5
TS 922.3640 255.10880 5
TA 1068.5860 422.95521 5
TH 1021.3660 551.26897 5
COD 79.8180 8.98509 5
DO 2.4000 1.91311 5
Table 3 shows descriptive statistics such as mean and standard deviations. From the above table mean DO was found to be
2.4 and COD has a mean value of 79.818. Mean values of total dissolved and suspended solids were found to be 842.50 and
922.36 ppm respectively. Significant correlation among various chemical parameters was evaluated using 2-tailed Pearson
correlation matrix at different sites and depicted in table 4.

International Journal of Environmental & Agriculture Research (IJOEAR) ISSN:[2454-1850] [Vol-6, Issue-11, November- 2020]
Page | 76
TABLE 4
CORRELATION MATRIX OF CHEMICAL PARAMETERS
TEMP PH EC TDS TS TA TH COD DO
TEMP Pearson Correlation 1 -.978** .897* .771 .721 .917* .920* -.745 -.869
Sig. (2-tailed) .004 .039 .127 .169 .028 .027 .148 .056
N 5 5 5 5 5 5 5 5 5
PH Pearson Correlation -.978** 1 -.968** -.882* -.850 -.980** -.982** .776 .952*
Sig. (2-tailed) .004 .007 .048 .068 .003 .003 .123 .012
N 5 5 5 5 5 5 5 5 5
EC Pearson Correlation .897* -.968** 1 .941* .946* .996** .996** -.715 -.993**
Sig. (2-tailed) .039 .007 .017 .015 .000 .000 .175 .001
N 5 5 5 5 5 5 5 5 5
TDS Pearson Correlation .771 -.882* .941* 1 .982** .946* .942* -.826 -.954*
Sig. (2-tailed) .127 .048 .017 .003 .015 .017 .084 .012
N 5 5 5 5 5 5 5 5 5
TS Pearson Correlation .721 -.850 .946* .982** 1 .934* .931* -.706 -.956*
Sig. (2-tailed) .169 .068 .015 .003 .020 .022 .183 .011
N 5 5 5 5 5 5 5 5 5
TA Pearson Correlation .917* -.980** .996** .946* .934* 1 1.000** -.761 -.993**
Sig. (2-tailed) .028 .003 .000 .015 .020 .000 .135 .001
N 5 5 5 5 5 5 5 5 5
TH Pearson Correlation .920* -.982** .996** .942* .931* 1.000** 1 -.758 -.992**
Sig. (2-tailed) .027 .003 .000 .017 .022 .000 .138 .001
N 5 5 5 5 5 5 5 5 5
COD Pearson Correlation -.745 .776 -.715 -.826 -.706 -.761 -.758 1 .721
Sig. (2-tailed) .148 .123 .175 .084 .183 .135 .138 .169
N 5 5 5 5 5 5 5 5 5
DO Pearson Correlation -.869 .952* -.993** -.954* -.956* -.993** -.992** .721 1
Sig. (2-tailed) .056 .012 .001 .012 .011 .001 .001 .169
N 5 5 5 5 5 5 5 5 5
**. Correlation is significant at the 0.01 level (2-tailed)
*. Correlation is significant at the 0.05 level (2-tailed)
Table 4 shows correlation between different pollutants in the sites. Dissolved oxygen shows a positive correlation with pH
(significant at 0.01 level) and COD. A strong correlation exists between total dissolved solids and parameters like electrical
conductivity, total solids and total hardness as evident from table 4. Hardness has a very strong positive correlation with
parameters like EC, TDS and TS.
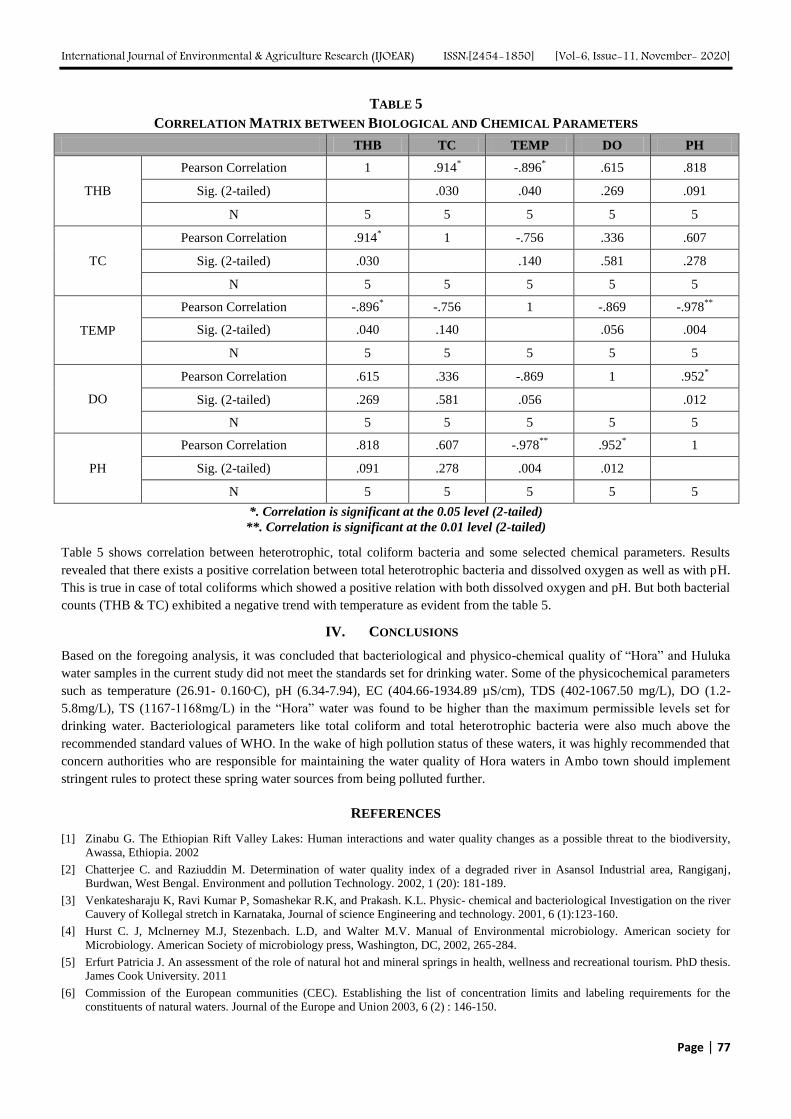
International Journal of Environmental & Agriculture Research (IJOEAR) ISSN:[2454-1850] [Vol-6, Issue-11, November- 2020]
Page | 77
TABLE 5
CORRELATION MATRIX BETWEEN BIOLOGICAL AND CHEMICAL PARAMETERS
THB TC TEMP DO PH
THB
Pearson Correlation 1 .914* -.896
* .615 .818
Sig. (2-tailed) .030 .040 .269 .091
N 5 5 5 5 5
TC
Pearson Correlation .914* 1 -.756 .336 .607
Sig. (2-tailed) .030 .140 .581 .278
N 5 5 5 5 5
TEMP
Pearson Correlation -.896* -.756 1 -.869 -.978
**
Sig. (2-tailed) .040 .140 .056 .004
N 5 5 5 5 5
DO
Pearson Correlation .615 .336 -.869 1 .952*
Sig. (2-tailed) .269 .581 .056 .012
N 5 5 5 5 5
PH
Pearson Correlation .818 .607 -.978**
.952* 1
Sig. (2-tailed) .091 .278 .004 .012
N 5 5 5 5 5
*. Correlation is significant at the 0.05 level (2-tailed)
**. Correlation is significant at the 0.01 level (2-tailed)
Table 5 shows correlation between heterotrophic, total coliform bacteria and some selected chemical parameters. Results
revealed that there exists a positive correlation between total heterotrophic bacteria and dissolved oxygen as well as with pH.
This is true in case of total coliforms which showed a positive relation with both dissolved oxygen and pH. But both bacterial
counts (THB & TC) exhibited a negative trend with temperature as evident from the table 5.
IV. CONCLUSIONS
Based on the foregoing analysis, it was concluded that bacteriological and physico-chemical quality of “Hora” and Huluka
water samples in the current study did not meet the standards set for drinking water. Some of the physicochemical parameters
such as temperature (26.91- 0.160oC), pH (6.34-7.94), EC (404.66-1934.89 µS/cm), TDS (402-1067.50 mg/L), DO (1.2-
5.8mg/L), TS (1167-1168mg/L) in the “Hora” water was found to be higher than the maximum permissible levels set for
drinking water. Bacteriological parameters like total coliform and total heterotrophic bacteria were also much above the
recommended standard values of WHO. In the wake of high pollution status of these waters, it was highly recommended that
concern authorities who are responsible for maintaining the water quality of Hora waters in Ambo town should implement
stringent rules to protect these spring water sources from being polluted further.
REFERENCES
[1] Zinabu G. The Ethiopian Rift Valley Lakes: Human interactions and water quality changes as a possible threat to the biodiversity,
Awassa, Ethiopia. 2002
[2] Chatterjee C. and Raziuddin M. Determination of water quality index of a degraded river in Asansol Industrial area, Rangiganj,
Burdwan, West Bengal. Environment and pollution Technology. 2002, 1 (20): 181-189.
[3] Venkatesharaju K, Ravi Kumar P, Somashekar R.K, and Prakash. K.L. Physic- chemical and bacteriological Investigation on the river
Cauvery of Kollegal stretch in Karnataka, Journal of science Engineering and technology. 2001, 6 (1):123-160.
[4] Hurst C. J, Mclnerney M.J, Stezenbach. L.D, and Walter M.V. Manual of Environmental microbiology. American society for
Microbiology. American Society of microbiology press, Washington, DC, 2002, 265-284.
[5] Erfurt Patricia J. An assessment of the role of natural hot and mineral springs in health, wellness and recreational tourism. PhD thesis.
James Cook University. 2011
[6] Commission of the European communities (CEC). Establishing the list of concentration limits and labeling requirements for the
constituents of natural waters. Journal of the Europe and Union 2003, 6 (2) : 146-150.

International Journal of Environmental & Agriculture Research (IJOEAR) ISSN:[2454-1850] [Vol-6, Issue-11, November- 2020]
Page | 78
[7] Kabaija E. Non- conventional indigenous mineral supplements used for cattle feeding in the pastoral rangelands of Ethiopia. Trop,
Anita. Hlth Prod. 2008, 21: 256- 262.
[8] USEPA. Methods for Chemical Analysis of Water and Wastes, USEPA Publication No. EPA-600/4-79- 020, United States
Environmental Protection Agency. 2009
[9] American Public Health Association (APHA). Standard methods for examination of water and wastewater 20th Ed. American Public
Health. New York. 1998, 81-85.
[10] Murray, Baron, Jorgensen, Landry and P faller.ed. Manual of clinical microbiology, 9th ed. American Society for Microbiology.
Washington D.C., 2007
[11] Fawole M.O. and Oso B.A. Laboratory Manual of Microbiology Spectrum Books Limited. Ibadan, Nigeria. 2001, 71-80.
[12] Brock T.D, Madigan M.T, Martinko J.M. and Parker. Biology of Microorganisms. 7th edition. Prentice-Hall. New Jersey. 1994, 192-
194.
[13] Milkiyas T, Mulugeta K, Bayeh A. Bacteriological and physico-chemical quality of drinking water and hygiene-sanitation practices of
the consumers in Bahir Dar city. Ethiopian Health Sci. 2001, 22:19–32.
[14] Gupta B.K. and Gupta R.R. Physicochemical and bacteriological study of drinking water in Satna Maheya prade. 1999, 523–552.
[15] World health organization (WHO) Guidelines for Drinking Water. Quality. 4thEdition. WHO press. 2011; 564.
[16] Patil S.G, Chonde S.G, Jadhav A.S, and Raut P.D. Impact of Physico-Chemical Characteristics of Shivaji University lakes on
Phytoplankton Communities, Kolhapur, India, Research Journal of Recent Sciences. 2009, 1 (2): 56- 60
[17] Amukama D, Kansime F, Mach R, Farnleitner A. Determination of Escherichia coli contamination with Chromo cult coliform agar
showed a high level of discrimination efficiency for differing pollution levels in tropical waters of Kampala, Uganda. Appl Environ
Microbiol. 1999, 66: 864-846.
[18] John KN, Orish EO, and Linus OE. Some physicochemical parameters of potable water supply in Warri, Niger Delta area of Nigeria.
Sci. Res. And Essay. 2008, 3(11): 547-551.
[19] Orama.B. Sources of total Dissolved Solids.Minerals.in Drinking Water, htt://WWW.water-research.net/total dissolved solids. htm,
accessed on Oct 18, 2010.
[20] Kataria H. C, Quershi H. A, Iqbal S. A, and Shandilya A. K. Assessment of water quality of Kolar reservoir in Bhopal. M.P. Pollution
Research. 1996, 15 (2): 191-193.
[21] Hart. A. Total hardness and water quality, 2007 htt://ezinearticles.com/Total hardness and water quality and & id=516135, accessed
on oct 18, 2010.
[22] Pakistan council of Research in water Resources (PCRWR). National Water Quality Monitoring Program. 2001, 1-20
[23] Edema M.O, Omemu A. M, and Fapet O. M. Microbiology and Physicochemical Analysis of different sources of drinking water in
Abeokuta. Nigeria. Niger. J. Microbial. 2001, 57
[24] Obire O, Aguda M. Bacterial community of Leachate from a waste dump and an adjacent stream. Appl. Sci. Environ Mgt. 2004, 6 (2):
71-76.
[25] Welch P, David J, Clarke TAPD, Berston S, McDougall L, Adesiyin AA. Microbial sanitation of water in rural communities of
Trinidad. Pan Ameri. J. Public Hlth. 2000, 8 (3): 172-180.
[26] Ajayi AO, Akonai KA. Distribution pattern of enteric organisms in the Lagos Lagoon. Afr. J. Biomed.Res. 2005, 8 (3): 163-168.
[27] Okonko I. O, Adejoye O. D, Ogunnusi T.A, Fajobi E. A, and Shittu O. B. Micobiological and Physicochemical Analysis of Different
Water Samples Used for Domestic Purposes in Abeokuta and jota, Lagos State, Nigeria. African journal of Biotechnology. 2008, 75:
617-621.