Competent Authorities and Weblinks to National RBM Plans in ...
Competent Children at 12
Cathy Wylie, Jean Thompson, Edith Hodgen, Hilary Ferral, Cathy Lythe, andTineke Fijn
NEW ZEALAND COUNCIL FOR EDUCATIONAL RESEARCH
TE RÜNANGA O AOTEAROA MÖ TE RANGAHAU I TE MÄTAURANGA
WELLINGTON
2004

© Crown copyright, 2004
ISBN 1–877293–39-3
Distributed by NZCER Distribution Services
P O Box 3237
Wellington
New Zealand
i
Acknowledgments
First and foremost, our thanks to the participants in the study: the children (now young people), theirparents, and their teachers, who continue to give their time and interest, and so ensure that theircumulative story can be told. The funding and interest of the Ministry of Education has also beenessential to the study, and we are most grateful for it.
We are most appreciative of the assistance given us by the principals and office staff of the many schoolsattended by the study children when they were aged-12. Three schools helped us in the development ofour interview questions for this phase through focus group discussions among students, parents, and
teachers, and through teachers trialling draft questions, and our thanks go to those involved at Evan’s BayIntermediate school, Clyde Quay school, and Te Aro school.
Our thanks too to the project team. Cathy Lythe and Tineke Fijn organised the fieldwork. Once again wewere fortunate to retain most of our highly competent fieldwork team: Anna Wildey, Betty Irons, Tricia
Meagher-Lundberg, Janet Meehan, Patricia Bullock, Wendel Richardson, Elizabeth Wagner, MarionBayne, Marilyn Weir and Brigid Wilkinson. They were joined by Miranda Duurloo, and Robyn Scott.The team’s background and understanding of the project proved to be a great asset. Our thanks to Betty
Irons, Miranda Duurloo, Elizabeth Wagner and Tricia Meagher-Lundberg for their willingness to travelsome distance to locations around New Zealand to assist with the out-of-Wellington fieldwork and toCristina Smits at NZCER who also lent a hand. Rae Julian assisted with interviewing parents for whom
English was a second language. Many team members also assisted with information checking andrecording. In this respect we thank particularly Janet Meehan who acted as coordinator when a staffmember was on leave and who, together with Elizabeth Wagner and Patricia Bullock, assisted with the
assessment of children’s tasks. For their help in the development of our competency measures we thankCedric Croft, Neil Reid, Sally Boyd and Sue McDowall.
The initial data management and analysis was provided by Barb Bishop and Leonid Grebennikov, andsecretarial support has been provided by Roberta Tiatia, Christine Williams, Carlene Grigg, LorraineThompson, and Suzanne Hay. Shelley Carlyle undertook the copy-editing of the final report.
Our advisory group has given us most useful advice and review. Our thanks go to Sandie Aikin, JudeAllison, Robyn Baker, Jacky Burgon, Clive McGee, Dick Harker, Anne Meade, Christian Monseur, andLynne Whitney.

ii
iii
Table of Contents
Acknowledgments i
Executive Summary xix
The Competent Children Project xix
This stage of the project xx
The children’s competencies at age 12 xxi
Teacher-rated competencies xxi
Task-assessed competencies xxvi
Children’s performance across time xxxi
Key findings xxxi
Children in the top and bottom quartiles xxxi
The different competencies xxxi
Gender and ethnicity xxxii
Maternal qualification and early family income xxxii
Children’s experiences and competency levels xxxiii
The contribution of early childhood education and of cumulative experiences at age 12 xxxiii
Key findings xxxiii
Early childhood education xxxiv
Family Resources xxxiv
Home and School xxxv
Bullying and coping xxxvii
Stability xxxvii
The children’s home experiences at age 12 xxxviii
Key findings xxxviii
Siblings and Birth Parents xxxix
Parental Employment xl
Parental Support, Income and Leisure Activities xl
Parent–Child Interaction xli
Children’s Activities xli
Children’s Perspectives on their Home Life xliv
Puberty xlvi
Coping with Upsets xlvi
Parental Concerns xlvi
Friendships and Relations with Peers xlvii
Children’s Values xlviii
The children’s school experiences at age 12 l
iv
Key findings l
School Characteristics lii
Classroom Characteristics liii
Attitudes to School and Teachers liii
Problem-solving at School and Attendance liv
Homework lv
Talking about School at Home lv
Children’s Views on Doing Well at School lvi
Teachers’ Overall Assessments of Children’s Performance lvi
Teachers making a difference for children lviii
Home support for children’s learning at school lviii
Selection of Secondary School lx
Children’s Attitudes to Secondary School lxi
Parental Aspirations for Children’s Education lxii
Occupational interests and expectations lxii
Some overall messages lxiii
The role of family resources lxiii
The role of participation and engagement lxiv
The roles of current and early experiences lxiv
The importance of understanding cumulative experiences lxv
1. Introduction 1
Study sample 3
Attrition rates 5
Notes on the report 5
Report structure 6
2. The children’s competencies at age 12 8
The competency measures 8
Teacher-rated competencies 8
Task-assessed competencies 14
Relationships between competency measures at age 12 20
Summary 23
3. Changes in the competencies over time 24
Attitudes, behaviours, social skills 24
Mathematics, literacy, and Logical Problem-Solving 26
v
Contributions of earlier performance levels to age-12 scores – or, is reading like riding a
bicycle (once learnt, always retrievable)? 28
Path analysis 29
Movement between quartiles 31
Continuity of performance age 5–12 32
Continuity in performance between ages 8 and 12 32
Continuity in performance between ages 10 and 12 33
Patterns of improvement for initially low performing children 34
Differences in population sub-groups 35
Summary 45
4. Cumulative experiences 48
Family resources 49
Family income 49
Child’s time 53
Engagement in school 56
School resources 63
Changes in daily settings 68
Child’s responses 71
Relations with others 72
Summary 73
Does stability confer advantages? 73
Few paths through school run entirely smoothly 74
Structural aspects of school 75
5. Contributions of early childhood education 76
Associations between ECE experience and children’s competencies at age 12 76
Length of ECE experience 77
Final ECE type 79
Early childhood education socio-economic mix 79
Early childhood education quality 80
Do aspects of ECE make separate contributions after age 5? 87
Summary 89
6. Differences in competencies related to gender and family characteristics 91
Gender 91
Ethnicity 93
Language spoken at home 94

vi
Maternal qualification 95
Family income 98
Income-related differences in children’s competencies at age 12 100
Summary 104
7. Family composition and parents 105
Family composition 105
Income sources and welfare receipt 107
Parental employment 108
Childcare out of school hours 110
Parental occupations 111
Parental health and general happiness 111
Informal support for parents 112
Parental use of leisure 112
Parental enjoyment of reading 115
Parental time spent watching television 115
Do mothers and fathers see things differently? 116
Summary 116
8. Activities and interests 118
Leisure activities 118
Home equipment 121
Television watching 122
Computer use 124
Reading 128
Writing at home 131
Mathematics at home 133
Interests 136
Club membership 136
Lessons outside school 137
Music 138
Extracurricular activities 139
Money 140
Summary 141
vii
Use of leisure 141
The role of television 141
The role of computers 142
The role of reading 142
The role of writing 143
The role of mathematics 143
Clubs, lessons, participation in formal music activity, and extracurricular activities 143
Money 144
Commonality and differences in children’s use of leisure 144
Gender 145
9. Home experiences and support 146
Children’s views of their home experiences 146
Children’s views of their home experiences and competency levels 147
Parental activities with the study children 151
Who children come home to at age 12 153
Parental expectations 153
Bed-time 155
Parental responses to children 155
Summary 157
10. Puberty, parental concerns, and change 159
Puberty 159
General happiness 160
General health 161
Residential mobility 161
Things unsettling children 161
Parental concerns 163
Household help 164
Home behaviour 165
Self-esteem/self-confidence 165
Friendships 166
School 167
Number of parental concerns 167
Summary 168
Puberty 168
Coping with upsets 169
viii
Parental concerns 169
Residential mobility 169
11. Relations with peers, and values 170
Being with friends 170
Parents and friends 172
The role of friendship in children’s lives at age 12 172
Bullying and getting a hard time at school 173
Values 176
Values in adulthood 178
Relations with children’s peers, and their earlier competency levels 179
Current patterns of peer relations, attitudes to school, and competency levels 182
Summary 185
Friendships 185
Bullying 186
Values 186
Patterns of peer relations and children’s earlier social skills and school behaviour 187
Patterns of peer relations, attitudes to school, and competency levels 187
12. School and class characteristics 189
Characteristics of schools attended by the competent children sample at age 10 189
School socio-economic decile 192
School ownership 196
School type 197
Classroom characteristics 198
Class size 198
Year level 199
Composite and single-level classrooms 199
Numbers of teachers and variation in physical classrooms 199
Parental support for children’s schoolwork 201
Peer support 202
Summary 203
School socio-economic decile 203
School ownership 203
School type 203
Classroom characteristics 204
Year level 204
ix
13. School experiences – children’s and parents’ perspectives 205
Children’s attitudes to school at age 12 205
Does liking the teacher matter? 206
Children’s views of their school experience at age 12 208
Children’s perceptions of their classrooms 216
Children’s responses to difficulty in their work 219
Homework 220
Children’s views 220
Teacher views 222
Homework completion and children’s competency scores at age 12 222
Parents’ views 223
Talking about school at home 224
Children’s views on doing well at school 225
Relation of attitudes to school with earlier competency levels and problem-solving 230
School mobility 232
Summary 234
Attitudes to school and teachers 234
Problem-solving 235
Homework 236
Talking about school at home 236
Children’s views on doing well at school 237
Traces of earlier attitudes to school work 237
School mobility 237
14. Teachers’ perspectives on the children’s progress 238
Children’s overall progress 238
Other aspects related to teachers’ overall assessments 241
Mathematics and reading age 243
Curriculum strengths 244
Children’s areas of difficulty in the curriculum 246
Teachers’ views of children’s non-curriculum strengths and weaknesses 247
Attendance 251
Teacher views of children’s highest qualification 252
The difference teachers thought they could make for children 255
Summary 256
Teachers’ overall assessments 256

x
Curriculum strengths and difficulties 256
Behavioural strengths and difficulties 256
Attendance 258
Teacher views of the study children’s likely highest qualification 258
Teachers making a difference for children 258
15. Parental contact with the school 259
Home support for schoolwork – teachers’ perspectives 259
Contact with parents and teacher views of their relationship with parents 260
Parents and teachers working together for the child 262
Parental satisfaction with their child’s progress at school 263
Parental interest in change in their child’s class 266
Parental involvement in their child’s school 266
Summary 267
Teacher perspective 267
Parent perspective 268
16. Secondary school choice, educational, and occupational aspirations 270
Choice of secondary school 270
Family characteristics and secondary school choice 271
Decision-making 273
Children’s views 274
Looking forward to secondary school 276
Parental aspirations 277
Occupational interests 278
Summary 281
Choice of secondary school 281
Attitudes to secondary school 282
Parental aspirations 282
Occupational interests 283
17. Fitting it all together 284
Results from ANOVA analysis 285
Mathematics 286
Reading comprehension 290
Communication 293
Individual Responsibility 296
xi
Perseverance 297
Path analysis 299
Key factors in children’s performance at age 12 302
Role of family resources 303
The role of participation and engagement 304
The roles of current and early experiences 304
The importance of understanding cumulative experiences 305
18. References 307
Tables
Table 1 Teachers’ ratings of children’s competency: communication xxii
Table 2 Teachers’ ratings of children’s competency: curiosity xxiii
Table 3 Teachers’ ratings of children’s competency: perseverance xxiii
Table 4 Teachers’ ratings of children’s competency: individual responsibility xxiii
Table 5 Teachers’ ratings of children’s competency: social skills with adults xxiv
Table 6 Teachers’ ratings of children’s competency: social skills with peers xxiv
Table 7 Strategies children at ages 10 and 12 said they would use when encountering
difficulties in the school grounds xxv
Table 8 Writing task – scores for particular features xxix
Table 9 Characteristics of the Competent Children sample at age 12 4
Table 10 Communication 10
Table 11 Curiosity 10
Table 12 Perseverance 11
Table 13 Individual Responsibility 11
Table 14 Social Skills with Adults 12
Table 15 Social Skills with Peers 12
Table 16 Children’s strategies when encountering difficulties in the playground age 10 and 1214
Table 17 Teacher estimations of children’s reading ages at ages 8, 10, and 12 17
Table 18 Writing task – scores for particular features 19
Table 19 Correlations between the 4 measures of literacy at age 12 20
Table 20 Loadings for the 3 factors derived in the factor analysis of age 12 competencies 21
Table 21 Correlations for social and attitudinal competency scores between ages 5 and 12 25
Table 22 Results of modelling age 12 social and attitudinal competency scores by using scores
at each of ages 5, 6, 8, and 10 26
xii
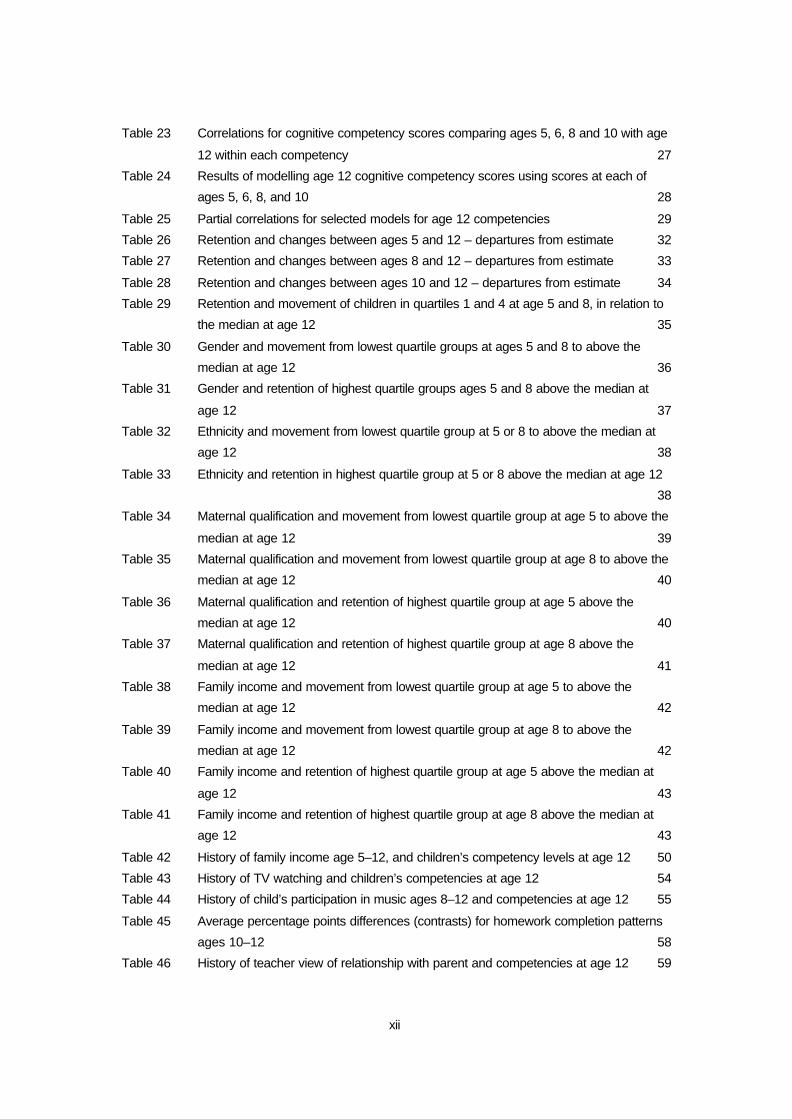
Table 23 Correlations for cognitive competency scores comparing ages 5, 6, 8 and 10 with age
12 within each competency 27
Table 24 Results of modelling age 12 cognitive competency scores using scores at each of
ages 5, 6, 8, and 10 28
Table 25 Partial correlations for selected models for age 12 competencies 29
Table 26 Retention and changes between ages 5 and 12 – departures from estimate 32
Table 27 Retention and changes between ages 8 and 12 – departures from estimate 33
Table 28 Retention and changes between ages 10 and 12 – departures from estimate 34
Table 29 Retention and movement of children in quartiles 1 and 4 at age 5 and 8, in relation to
the median at age 12 35
Table 30 Gender and movement from lowest quartile groups at ages 5 and 8 to above the
median at age 12 36
Table 31 Gender and retention of highest quartile groups ages 5 and 8 above the median at
age 12 37
Table 32 Ethnicity and movement from lowest quartile group at 5 or 8 to above the median at
age 12 38
Table 33 Ethnicity and retention in highest quartile group at 5 or 8 above the median at age 12
38
Table 34 Maternal qualification and movement from lowest quartile group at age 5 to above the
median at age 12 39
Table 35 Maternal qualification and movement from lowest quartile group at age 8 to above the
median at age 12 40
Table 36 Maternal qualification and retention of highest quartile group at age 5 above the
median at age 12 40
Table 37 Maternal qualification and retention of highest quartile group at age 8 above the
median at age 12 41
Table 38 Family income and movement from lowest quartile group at age 5 to above the
median at age 12 42
Table 39 Family income and movement from lowest quartile group at age 8 to above the
median at age 12 42
Table 40 Family income and retention of highest quartile group at age 5 above the median at
age 12 43
Table 41 Family income and retention of highest quartile group at age 8 above the median at
age 12 43
Table 42 History of family income age 5–12, and children’s competency levels at age 12 50
Table 43 History of TV watching and children’s competencies at age 12 54
Table 44 History of child’s participation in music ages 8–12 and competencies at age 12 55
Table 45 Average percentage points differences (contrasts) for homework completion patterns
ages 10–12 58
Table 46 History of teacher view of relationship with parent and competencies at age 12 59
xiii
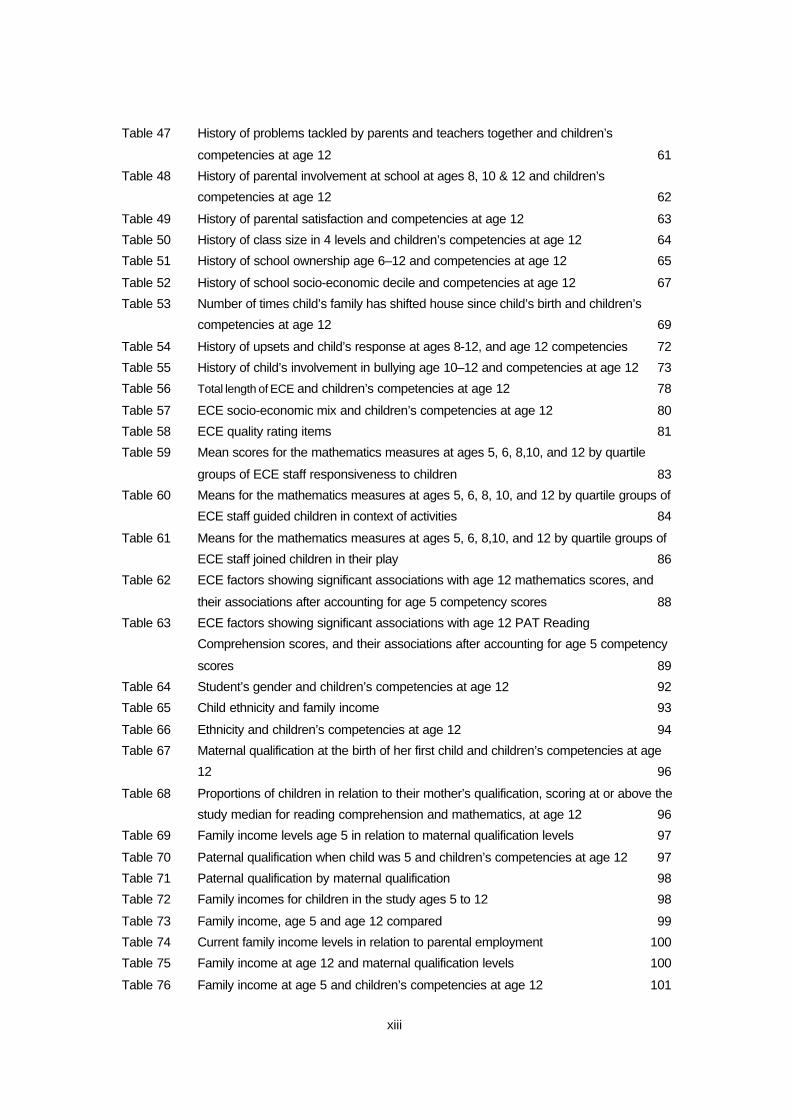
Table 47 History of problems tackled by parents and teachers together and children’s
competencies at age 12 61
Table 48 History of parental involvement at school at ages 8, 10 & 12 and children’s
competencies at age 12 62
Table 49 History of parental satisfaction and competencies at age 12 63
Table 50 History of class size in 4 levels and children’s competencies at age 12 64
Table 51 History of school ownership age 6–12 and competencies at age 12 65
Table 52 History of school socio-economic decile and competencies at age 12 67
Table 53 Number of times child’s family has shifted house since child’s birth and children’s
competencies at age 12 69
Table 54 History of upsets and child’s response at ages 8-12, and age 12 competencies 72
Table 55 History of child’s involvement in bullying age 10–12 and competencies at age 12 73
Table 56 Total length of ECE and children’s competencies at age 12 78
Table 57 ECE socio-economic mix and children’s competencies at age 12 80
Table 58 ECE quality rating items 81
Table 59 Mean scores for the mathematics measures at ages 5, 6, 8,10, and 12 by quartile
groups of ECE staff responsiveness to children 83
Table 60 Means for the mathematics measures at ages 5, 6, 8, 10, and 12 by quartile groups of
ECE staff guided children in context of activities 84
Table 61 Means for the mathematics measures at ages 5, 6, 8,10, and 12 by quartile groups of
ECE staff joined children in their play 86
Table 62 ECE factors showing significant associations with age 12 mathematics scores, and
their associations after accounting for age 5 competency scores 88
Table 63 ECE factors showing significant associations with age 12 PAT Reading
Comprehension scores, and their associations after accounting for age 5 competency
scores 89
Table 64 Student’s gender and children’s competencies at age 12 92
Table 65 Child ethnicity and family income 93
Table 66 Ethnicity and children’s competencies at age 12 94
Table 67 Maternal qualification at the birth of her first child and children’s competencies at age
12 96
Table 68 Proportions of children in relation to their mother’s qualification, scoring at or above the
study median for reading comprehension and mathematics, at age 12 96
Table 69 Family income levels age 5 in relation to maternal qualification levels 97
Table 70 Paternal qualification when child was 5 and children’s competencies at age 12 97
Table 71 Paternal qualification by maternal qualification 98
Table 72 Family incomes for children in the study ages 5 to 12 98
Table 73 Family income, age 5 and age 12 compared 99
Table 74 Current family income levels in relation to parental employment 100
Table 75 Family income at age 12 and maternal qualification levels 100
Table 76 Family income at age 5 and children’s competencies at age 12 101
xiv
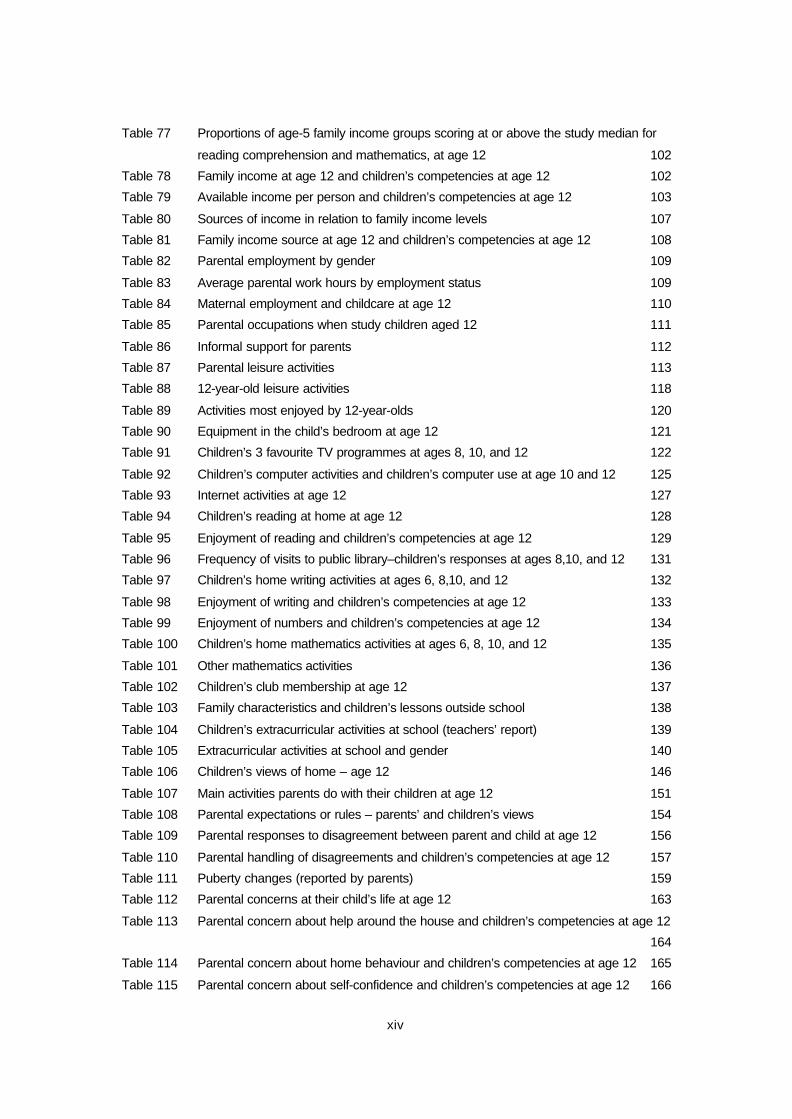
Table 77 Proportions of age-5 family income groups scoring at or above the study median for
reading comprehension and mathematics, at age 12 102
Table 78 Family income at age 12 and children’s competencies at age 12 102
Table 79 Available income per person and children’s competencies at age 12 103
Table 80 Sources of income in relation to family income levels 107
Table 81 Family income source at age 12 and children’s competencies at age 12 108
Table 82 Parental employment by gender 109
Table 83 Average parental work hours by employment status 109
Table 84 Maternal employment and childcare at age 12 110
Table 85 Parental occupations when study children aged 12 111
Table 86 Informal support for parents 112
Table 87 Parental leisure activities 113
Table 88 12-year-old leisure activities 118
Table 89 Activities most enjoyed by 12-year-olds 120
Table 90 Equipment in the child’s bedroom at age 12 121
Table 91 Children’s 3 favourite TV programmes at ages 8, 10, and 12 122
Table 92 Children’s computer activities and children’s computer use at age 10 and 12 125
Table 93 Internet activities at age 12 127
Table 94 Children’s reading at home at age 12 128
Table 95 Enjoyment of reading and children’s competencies at age 12 129
Table 96 Frequency of visits to public library–children’s responses at ages 8,10, and 12 131
Table 97 Children’s home writing activities at ages 6, 8,10, and 12 132
Table 98 Enjoyment of writing and children’s competencies at age 12 133
Table 99 Enjoyment of numbers and children’s competencies at age 12 134
Table 100 Children’s home mathematics activities at ages 6, 8, 10, and 12 135
Table 101 Other mathematics activities 136
Table 102 Children’s club membership at age 12 137
Table 103 Family characteristics and children’s lessons outside school 138
Table 104 Children’s extracurricular activities at school (teachers’ report) 139
Table 105 Extracurricular activities at school and gender 140
Table 106 Children’s views of home – age 12 146
Table 107 Main activities parents do with their children at age 12 151
Table 108 Parental expectations or rules – parents’ and children’s views 154
Table 109 Parental responses to disagreement between parent and child at age 12 156
Table 110 Parental handling of disagreements and children’s competencies at age 12 157
Table 111 Puberty changes (reported by parents) 159
Table 112 Parental concerns at their child’s life at age 12 163
Table 113 Parental concern about help around the house and children’s competencies at age 12
164
Table 114 Parental concern about home behaviour and children’s competencies at age 12 165
Table 115 Parental concern about self-confidence and children’s competencies at age 12 166
xv
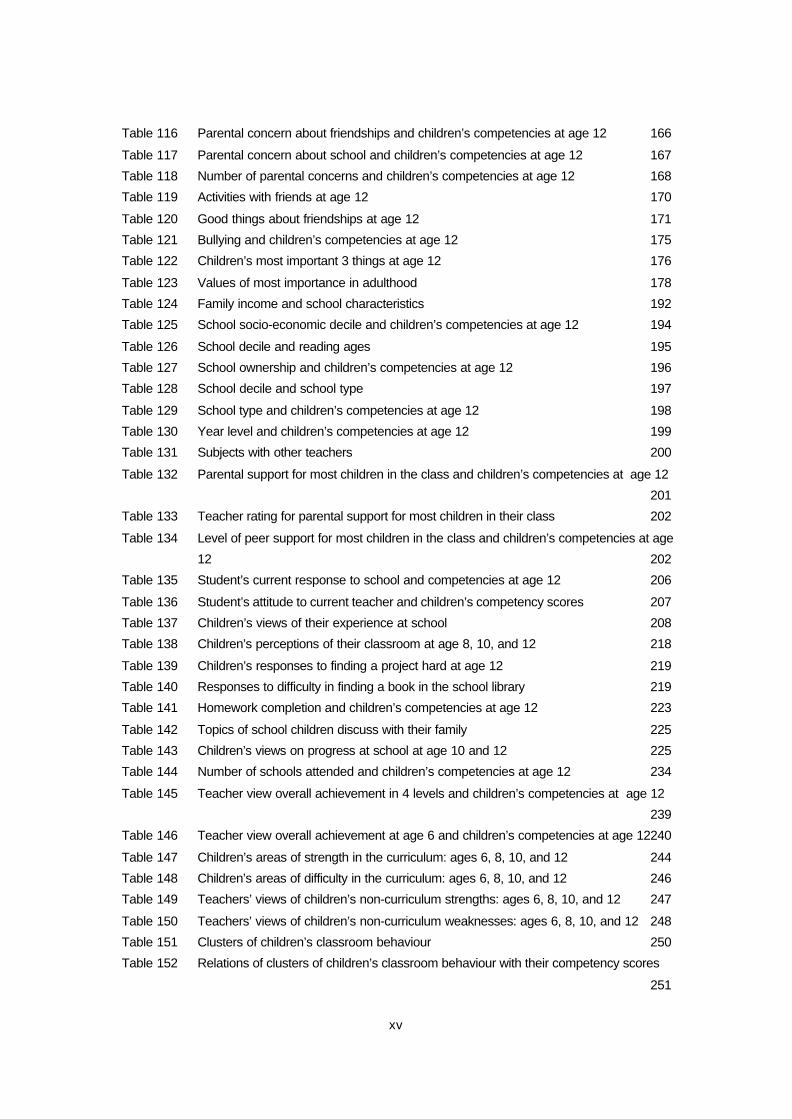
Table 116 Parental concern about friendships and children’s competencies at age 12 166
Table 117 Parental concern about school and children’s competencies at age 12 167
Table 118 Number of parental concerns and children’s competencies at age 12 168
Table 119 Activities with friends at age 12 170
Table 120 Good things about friendships at age 12 171
Table 121 Bullying and children’s competencies at age 12 175
Table 122 Children’s most important 3 things at age 12 176
Table 123 Values of most importance in adulthood 178
Table 124 Family income and school characteristics 192
Table 125 School socio-economic decile and children’s competencies at age 12 194
Table 126 School decile and reading ages 195
Table 127 School ownership and children’s competencies at age 12 196
Table 128 School decile and school type 197
Table 129 School type and children’s competencies at age 12 198
Table 130 Year level and children’s competencies at age 12 199
Table 131 Subjects with other teachers 200
Table 132 Parental support for most children in the class and children’s competencies at age 12
201
Table 133 Teacher rating for parental support for most children in their class 202
Table 134 Level of peer support for most children in the class and children’s competencies at age
12 202
Table 135 Student’s current response to school and competencies at age 12 206
Table 136 Student’s attitude to current teacher and children’s competency scores 207
Table 137 Children’s views of their experience at school 208
Table 138 Children’s perceptions of their classroom at age 8, 10, and 12 218
Table 139 Children’s responses to finding a project hard at age 12 219
Table 140 Responses to difficulty in finding a book in the school library 219
Table 141 Homework completion and children’s competencies at age 12 223
Table 142 Topics of school children discuss with their family 225
Table 143 Children’s views on progress at school at age 10 and 12 225
Table 144 Number of schools attended and children’s competencies at age 12 234
Table 145 Teacher view overall achievement in 4 levels and children’s competencies at age 12
239
Table 146 Teacher view overall achievement at age 6 and children’s competencies at age 12240
Table 147 Children’s areas of strength in the curriculum: ages 6, 8, 10, and 12 244
Table 148 Children’s areas of difficulty in the curriculum: ages 6, 8, 10, and 12 246
Table 149 Teachers’ views of children’s non-curriculum strengths: ages 6, 8, 10, and 12 247
Table 150 Teachers’ views of children’s non-curriculum weaknesses: ages 6, 8, 10, and 12 248
Table 151 Clusters of children’s classroom behaviour 250
Table 152 Relations of clusters of children’s classroom behaviour with their competency scores
251
xvi
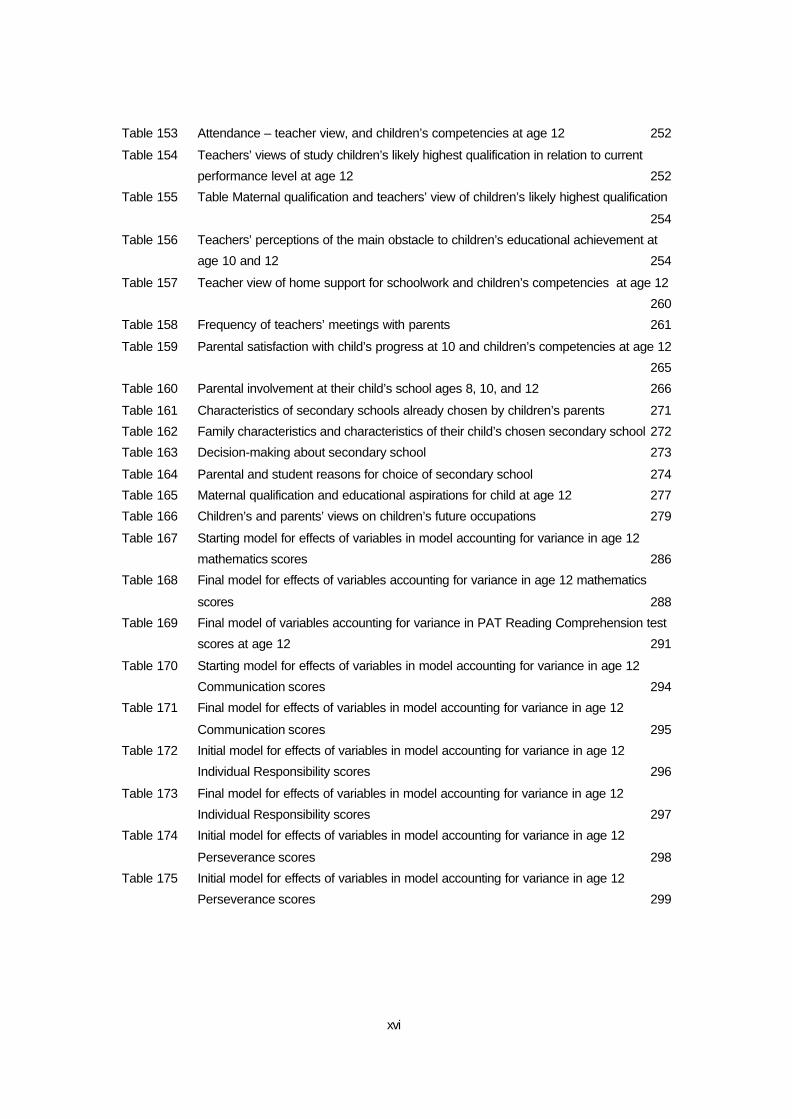
Table 153 Attendance – teacher view, and children’s competencies at age 12 252
Table 154 Teachers’ views of study children’s likely highest qualification in relation to current
performance level at age 12 252
Table 155 Table Maternal qualification and teachers’ view of children’s likely highest qualification
254
Table 156 Teachers’ perceptions of the main obstacle to children’s educational achievement at
age 10 and 12 254
Table 157 Teacher view of home support for schoolwork and children’s competencies at age 12
260
Table 158 Frequency of teachers’ meetings with parents 261
Table 159 Parental satisfaction with child’s progress at 10 and children’s competencies at age 12
265
Table 160 Parental involvement at their child’s school ages 8, 10, and 12 266
Table 161 Characteristics of secondary schools already chosen by children’s parents 271
Table 162 Family characteristics and characteristics of their child’s chosen secondary school 272
Table 163 Decision-making about secondary school 273
Table 164 Parental and student reasons for choice of secondary school 274
Table 165 Maternal qualification and educational aspirations for child at age 12 277
Table 166 Children’s and parents’ views on children’s future occupations 279
Table 167 Starting model for effects of variables in model accounting for variance in age 12
mathematics scores 286
Table 168 Final model for effects of variables accounting for variance in age 12 mathematics
scores 288
Table 169 Final model of variables accounting for variance in PAT Reading Comprehension test
scores at age 12 291
Table 170 Starting model for effects of variables in model accounting for variance in age 12
Communication scores 294
Table 171 Final model for effects of variables in model accounting for variance in age 12
Communication scores 295
Table 172 Initial model for effects of variables in model accounting for variance in age 12
Individual Responsibility scores 296
Table 173 Final model for effects of variables in model accounting for variance in age 12
Individual Responsibility scores 297
Table 174 Initial model for effects of variables in model accounting for variance in age 12
Perseverance scores 298
Table 175 Initial model for effects of variables in model accounting for variance in age 12
Perseverance scores 299

xvii
Figures
Figure 1 Paths between mathematics, literacy, and communication 22
Figure 2 Paths between achievement and social and attitudinal competency ages 8 –12 30Figure 3 History of school decile and Cognitive Composite score 68Figure 4 Length of ECE experience 78
Figure 5 ECE staff responsiveness to children and mathematics scores age 12 82Figure 6 ECE staff responsiveness to children and PAT Reading Comprehension scores age
12 82
Figure 7 ECE staff guidance and PAT Reading Comprehension scores age 12 83Figure 8 ECE staff guidance and age-12 mathematics scores 84Figure 9 ECE staff open-ended questioning and age-12 PAT Reading Comprehension scores
85Figure 10 ECE staff joined in children’s play and age-12 mathematics scores 85Figure 11 Family composition when study children aged 12 106
Figure 12 Children’s daily TV watching 123Figure 13 Children’s experience of being upset and age-12 Composite Cognitive Competency
162
Figure 14 Relations between age-10 and age-12 peer experiences and behaviour 181Figure 15 Relations between school engagement and patterns of peer relations and values 185Figure 16 School characteristics 190
Figure 17 School decile and Composite Cognitive Competency 193Figure 18 Children’s views of progress 229Figure 19 Age 10 dispositions and communication and children’s age 12 attitudes to school 232
Figure 20 Teachers’ study assessments of children’s overall achievement level 238Figure 21 Teacher views of children’s overall achievement and Composite Competency at age
12 241
Figure 22 Study children’s mathematics performance relative to their class level 243Figure 23 Teachers’ views of children’s likely highest qualification level in relation to their views of
their overall progress at age 12 253
Figure 24 Parental satisfaction with their child’s progress at school 263Figure 25 Paths between family resources, school engagement, communication, mathematics,
and literacy 301
xviii
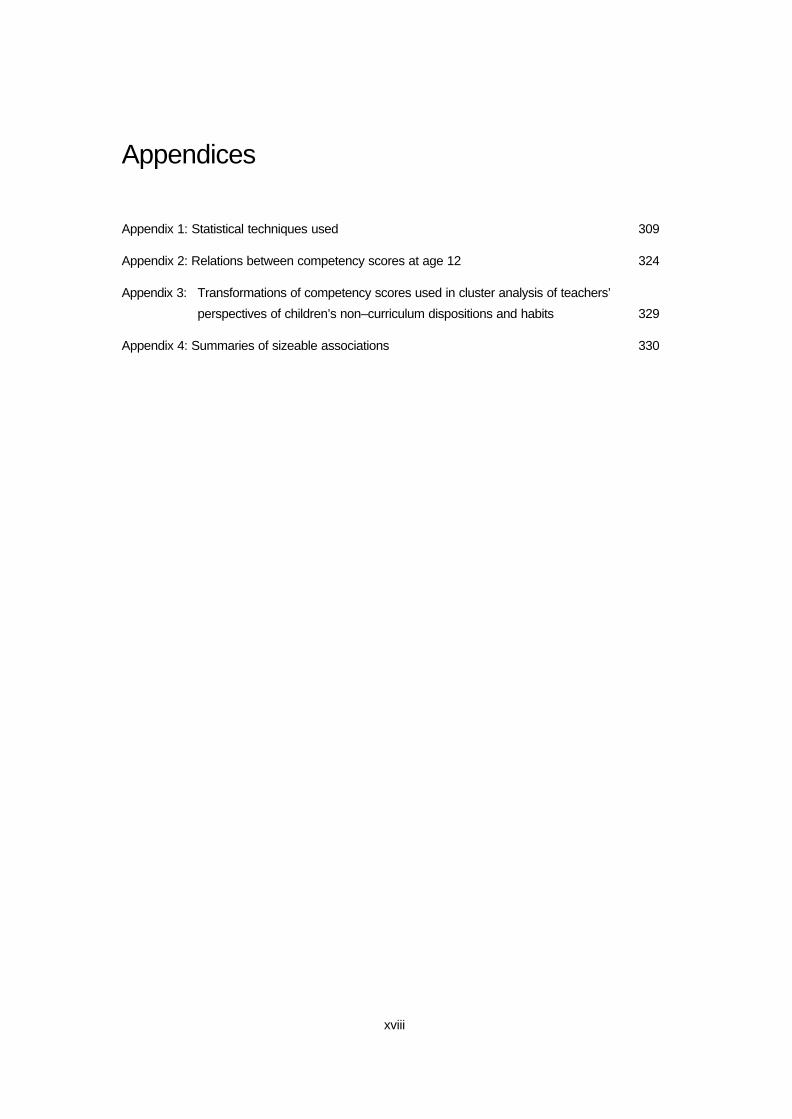
Appendices
Appendix 1: Statistical techniques used 309
Appendix 2: Relations between competency scores at age 12 324
Appendix 3: Transformations of competency scores used in cluster analysis of teachers’
perspectives of children’s non–curriculum dispositions and habits 329
Appendix 4: Summaries of sizeable associations 330
xix
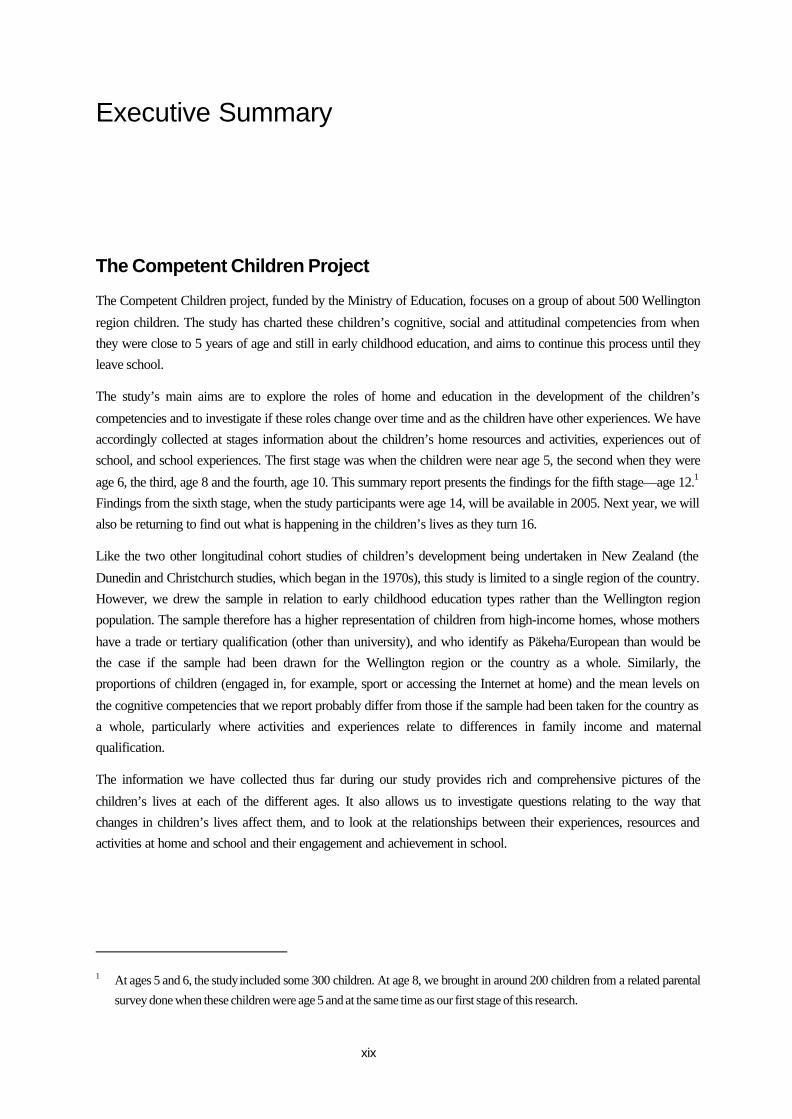
Executive Summary
The Competent Children Project
The Competent Children project, funded by the Ministry of Education, focuses on a group of about 500 Wellington
region children. The study has charted these children’s cognitive, social and attitudinal competencies from whenthey were close to 5 years of age and still in early childhood education, and aims to continue this process until theyleave school.
The study’s main aims are to explore the roles of home and education in the development of the children’s
competencies and to investigate if these roles change over time and as the children have other experiences. We haveaccordingly collected at stages information about the children’s home resources and activities, experiences out ofschool, and school experiences. The first stage was when the children were near age 5, the second when they were
age 6, the third, age 8 and the fourth, age 10. This summary report presents the findings for the fifth stage—age 12.1
Findings from the sixth stage, when the study participants were age 14, will be available in 2005. Next year, we willalso be returning to find out what is happening in the children’s lives as they turn 16.
Like the two other longitudinal cohort studies of children’s development being undertaken in New Zealand (the
Dunedin and Christchurch studies, which began in the 1970s), this study is limited to a single region of the country.However, we drew the sample in relation to early childhood education types rather than the Wellington regionpopulation. The sample therefore has a higher representation of children from high-income homes, whose mothers
have a trade or tertiary qualification (other than university), and who identify as Päkeha/European than would bethe case if the sample had been drawn for the Wellington region or the country as a whole. Similarly, theproportions of children (engaged in, for example, sport or accessing the Internet at home) and the mean levels on
the cognitive competencies that we report probably differ from those if the sample had been taken for the country asa whole, particularly where activities and experiences relate to differences in family income and maternalqualification.
The information we have collected thus far during our study provides rich and comprehensive pictures of the
children’s lives at each of the different ages. It also allows us to investigate questions relating to the way thatchanges in children’s lives affect them, and to look at the relationships between their experiences, resources andactivities at home and school and their engagement and achievement in school.
1 At ages 5 and 6, the study included some 300 children. At age 8, we brought in around 200 children from a related parental
survey done when these children were age 5 and at the same time as our first stage of this research.
xx
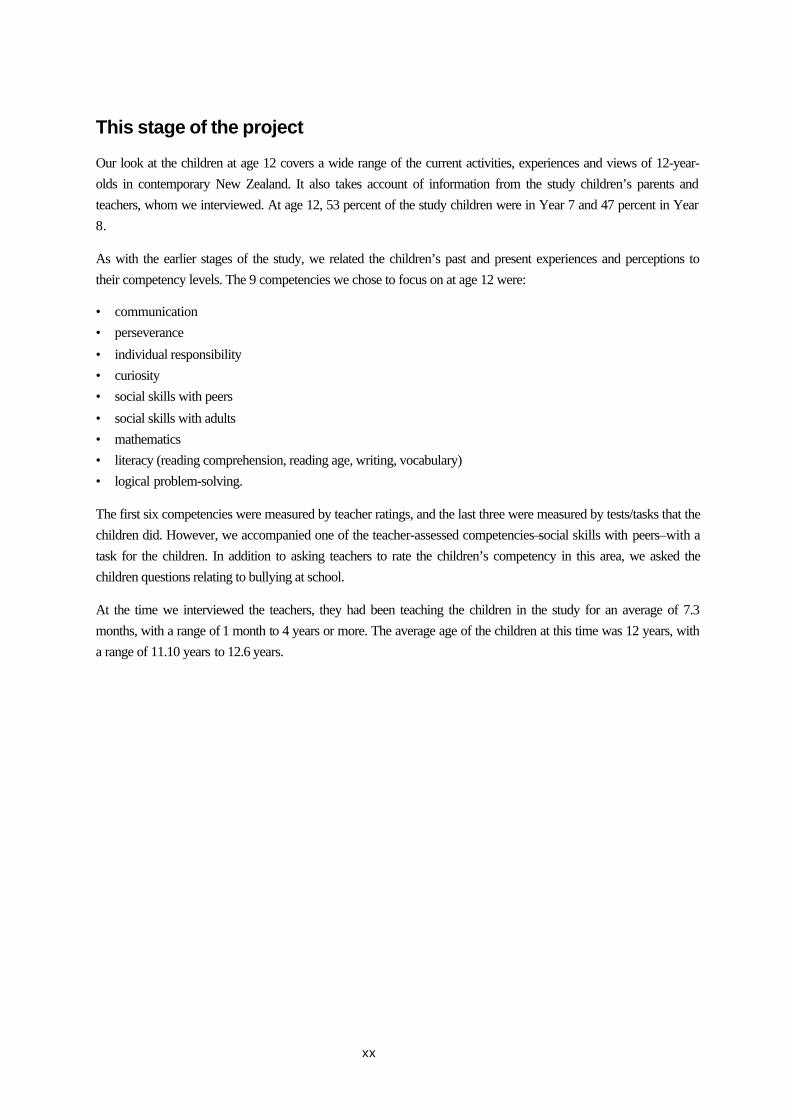
This stage of the project
Our look at the children at age 12 covers a wide range of the current activities, experiences and views of 12-year-olds in contemporary New Zealand. It also takes account of information from the study children’s parents andteachers, whom we interviewed. At age 12, 53 percent of the study children were in Year 7 and 47 percent in Year8.
As with the earlier stages of the study, we related the children’s past and present experiences and perceptions totheir competency levels. The 9 competencies we chose to focus on at age 12 were:
• communication• perseverance
• individual responsibility• curiosity• social skills with peers
• social skills with adults• mathematics• literacy (reading comprehension, reading age, writing, vocabulary)• logical problem-solving.
The first six competencies were measured by teacher ratings, and the last three were measured by tests/tasks that thechildren did. However, we accompanied one of the teacher-assessed competencies–social skills with peers–with atask for the children. In addition to asking teachers to rate the children’s competency in this area, we asked thechildren questions relating to bullying at school.
At the time we interviewed the teachers, they had been teaching the children in the study for an average of 7.3months, with a range of 1 month to 4 years or more. The average age of the children at this time was 12 years, witha range of 11.10 years to 12.6 years.

xxi
The children’s competencies at age 12
We look first at the study children’s scores on each of the competency measures at age 12, with some description oftrends in particular items making up the competency measures. We then look at the relationships between thecompetency measures at age 12.
Because of the period of growth covered in the children’s lives, we have been unable to use the same measures inevery phase of the study, although we have kept the same items and tests as much as possible.
Teacher-rated competencies? Communication ? Curiosity ? Perseverance ?Individual Responsibility
? Social Skills with Adults ?Social Skills with Peers
Key findings• Overall, the study children’s classroom behaviour on these measures, as rated by their teachers, was
much the same at age 12 as it had been when the children were ages 8 and 10.• Around two-thirds to three-quarters of the 12-year-olds seemed comfortable in the class in their role
as learners, with 15 percent or fewer receiving poor scores for individual items making up the six
measures.• The study children had higher scores for the listening items on the communication measure than for
the speaking items.
• While many of the study children enjoyed new experiences, thinking laterally or “outside the square”was common for only around a third of them.
• Most children were getting on with their peers.
• The teachers did not consider peer pressure to be a major issue for most of the children. However, thechildren’s responses to a hypothetical situation (being given a “hard time” in the school grounds)showed fewer of the children would respond assertively at age 12 than they would have at age 10 and
a doubling across the two ages of the (albeit small) proportion of children indicating they wouldrespond with aggression. A greater number of the study children said they would seek their parents’help if their first response to receiving a hard time did not work.
CommunicationThe measure of communication covered receptive language, or listening skills, and expressive language, orspeaking skills.
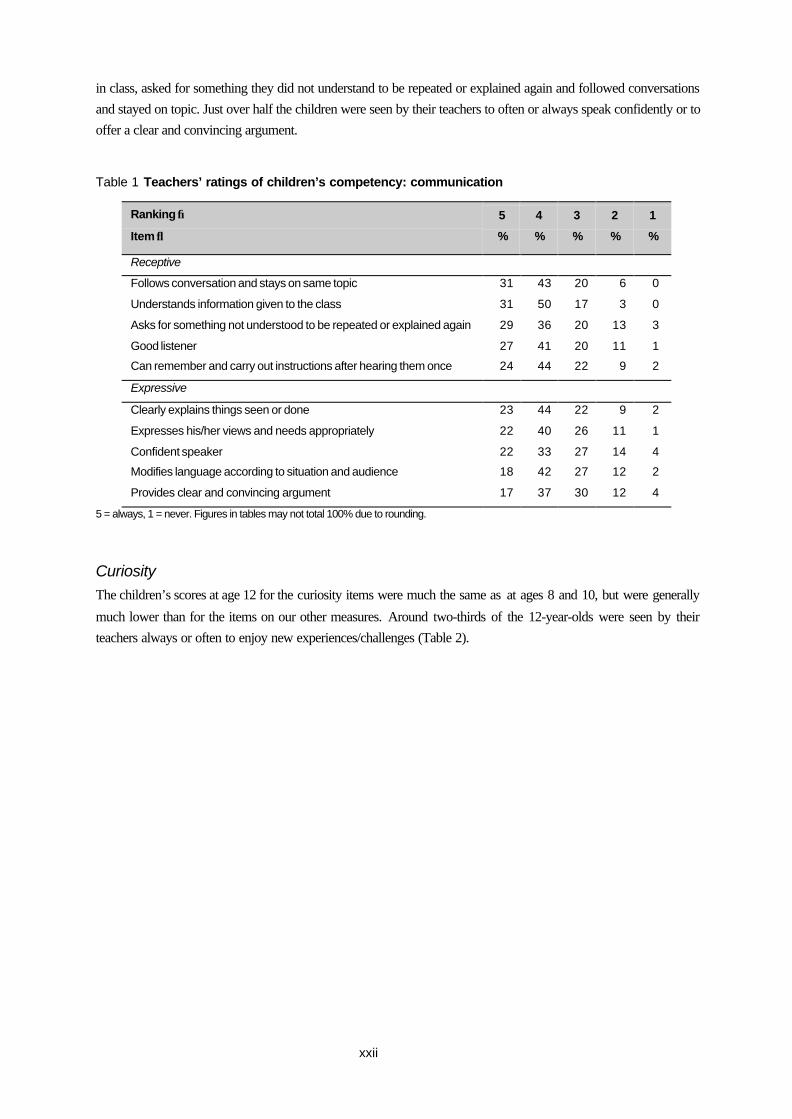
As at earlier ages, the study children’s listening scores tended to be higher than their speaking scores (Table 1).
Around three-quarters or more of the children always or often understood the information their teacher gave them
xxii
in class, asked for something they did not understand to be repeated or explained again and followed conversationsand stayed on topic. Just over half the children were seen by their teachers to often or always speak confidently or tooffer a clear and convincing argument.
Table 1 Teachers’ ratings of children’s competency: communication
Ranking →
Item ↓
5
%
4
%
3
%
2
%
1
%
Receptive
Follows conversation and stays on same topic 31 43 20 6 0
Understands information given to the class 31 50 17 3 0
Asks for something not understood to be repeated or explained again 29 36 20 13 3
Good listener 27 41 20 11 1
Can remember and carry out instructions after hearing them once 24 44 22 9 2
Expressive
Clearly explains things seen or done 23 44 22 9 2
Expresses his/her views and needs appropriately 22 40 26 11 1
Confident speaker 22 33 27 14 4
Modifies language according to situation and audience 18 42 27 12 2
Provides clear and convincing argument 17 37 30 12 4
5 = always, 1 = never. Figures in tables may not total 100% due to rounding.
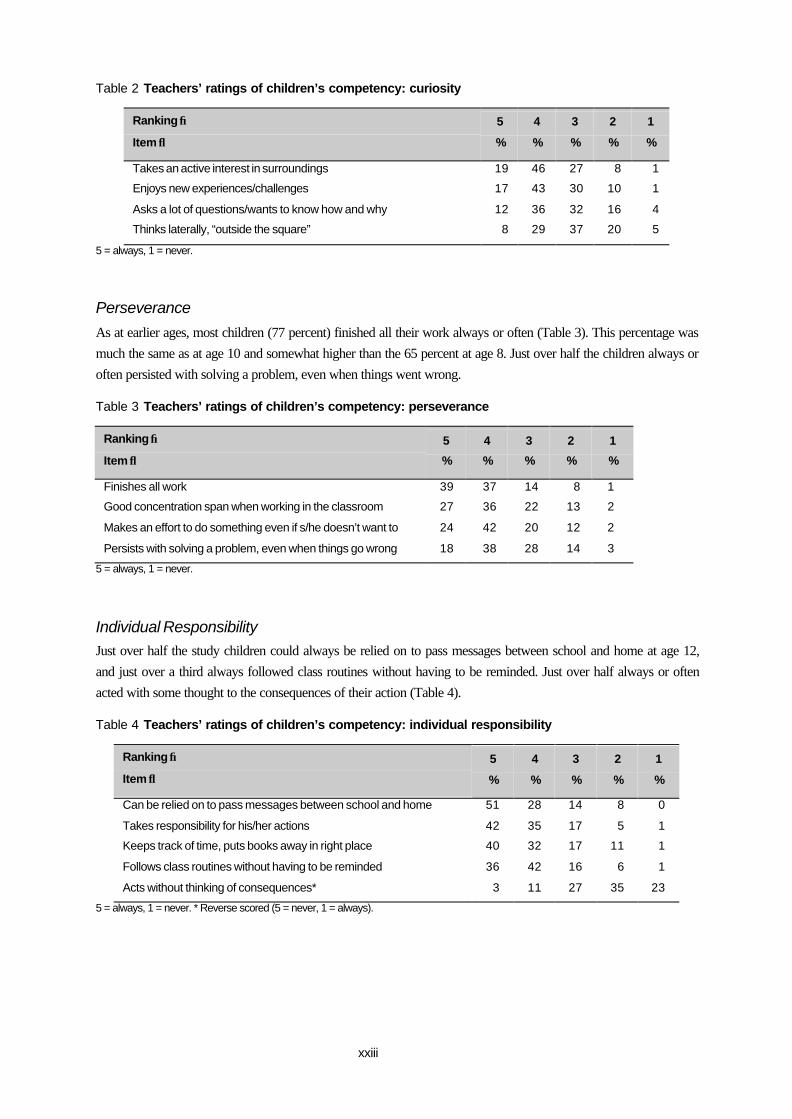
CuriosityThe children’s scores at age 12 for the curiosity items were much the same as at ages 8 and 10, but were generally
much lower than for the items on our other measures. Around two-thirds of the 12-year-olds were seen by theirteachers always or often to enjoy new experiences/challenges (Table 2).
xxiii
Table 2 Teachers’ ratings of children’s competency: curiosity
Ranking →
Item ↓
5
%
4
%
3
%
2
%
1
%
Takes an active interest in surroundings 19 46 27 8 1
Enjoys new experiences/challenges 17 43 30 10 1
Asks a lot of questions/wants to know how and why 12 36 32 16 4
Thinks laterally, “outside the square” 8 29 37 20 5
5 = always, 1 = never.
PerseveranceAs at earlier ages, most children (77 percent) finished all their work always or often (Table 3). This percentage wasmuch the same as at age 10 and somewhat higher than the 65 percent at age 8. Just over half the children always oroften persisted with solving a problem, even when things went wrong.
Table 3 Teachers’ ratings of children’s competency: perseverance
Ranking →
Item ↓
5
%
4
%
3
%
2
%
1
%
Finishes all work 39 37 14 8 1
Good concentration span when working in the classroom 27 36 22 13 2
Makes an effort to do something even if s/he doesn’t want to 24 42 20 12 2
Persists with solving a problem, even when things go wrong 18 38 28 14 3
5 = always, 1 = never.
Individual ResponsibilityJust over half the study children could always be relied on to pass messages between school and home at age 12,and just over a third always followed class routines without having to be reminded. Just over half always or oftenacted with some thought to the consequences of their action (Table 4).
Table 4 Teachers’ ratings of children’s competency: individual responsibility
Ranking →
Item ↓
5
%
4
%
3
%
2
%
1
%
Can be relied on to pass messages between school and home 51 28 14 8 0
Takes responsibility for his/her actions 42 35 17 5 1
Keeps track of time, puts books away in right place 40 32 17 11 1
Follows class routines without having to be reminded 36 42 16 6 1
Acts without thinking of consequences* 3 11 27 35 23
5 = always, 1 = never. * Reverse scored (5 = never, 1 = always).
xxiv
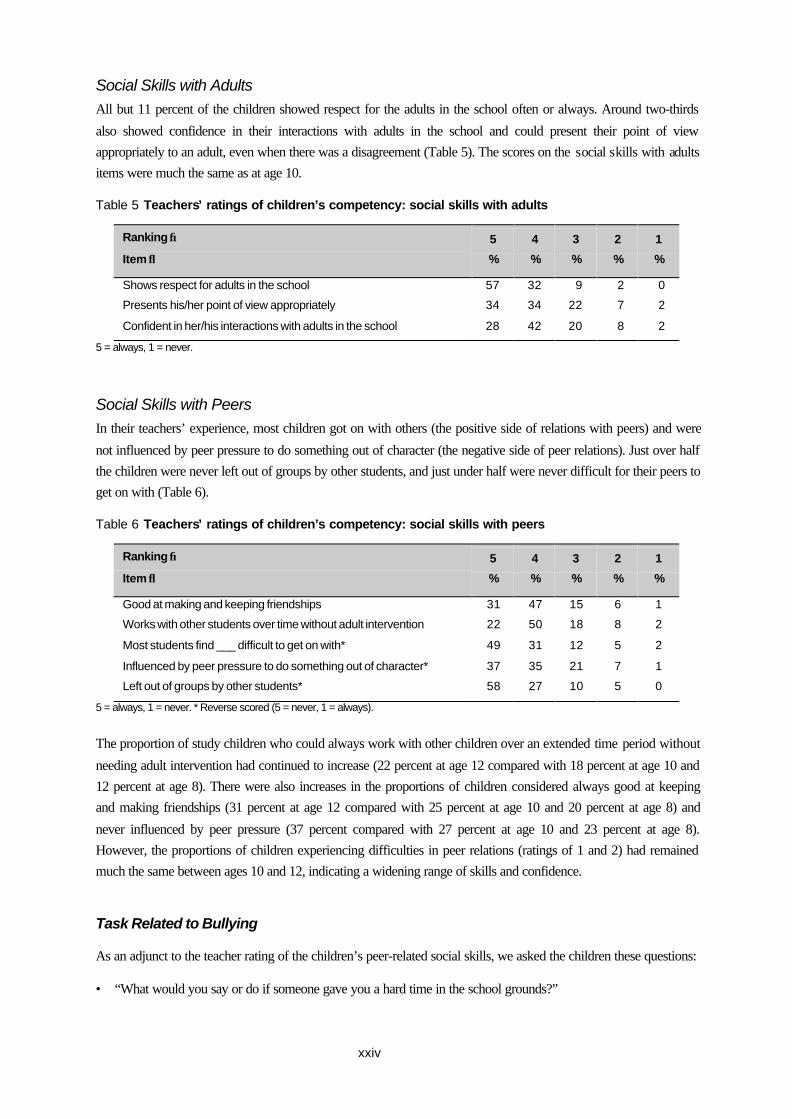
Social Skills with AdultsAll but 11 percent of the children showed respect for the adults in the school often or always. Around two-thirds
also showed confidence in their interactions with adults in the school and could present their point of viewappropriately to an adult, even when there was a disagreement (Table 5). The scores on the social skills with adultsitems were much the same as at age 10.
Table 5 Teachers’ ratings of children’s competency: social skills with adults
Ranking →
Item ↓
5
%
4
%
3
%
2
%
1
%
Shows respect for adults in the school 57 32 9 2 0
Presents his/her point of view appropriately 34 34 22 7 2
Confident in her/his interactions with adults in the school 28 42 20 8 2
5 = always, 1 = never.
Social Skills with PeersIn their teachers’ experience, most children got on with others (the positive side of relations with peers) and were
not influenced by peer pressure to do something out of character (the negative side of peer relations). Just over halfthe children were never left out of groups by other students, and just under half were never difficult for their peers toget on with (Table 6).
Table 6 Teachers’ ratings of children’s competency: social skills with peers
Ranking →
Item ↓
5
%
4
%
3
%
2
%
1
%
Good at making and keeping friendships 31 47 15 6 1
Works with other students over time without adult intervention 22 50 18 8 2
Most students find ___ difficult to get on with* 49 31 12 5 2
Influenced by peer pressure to do something out of character* 37 35 21 7 1
Left out of groups by other students* 58 27 10 5 0
5 = always, 1 = never. * Reverse scored (5 = never, 1 = always).
The proportion of study children who could always work with other children over an extended time period without
needing adult intervention had continued to increase (22 percent at age 12 compared with 18 percent at age 10 and12 percent at age 8). There were also increases in the proportions of children considered always good at keepingand making friendships (31 percent at age 12 compared with 25 percent at age 10 and 20 percent at age 8) and
never influenced by peer pressure (37 percent compared with 27 percent at age 10 and 23 percent at age 8).However, the proportions of children experiencing difficulties in peer relations (ratings of 1 and 2) had remainedmuch the same between ages 10 and 12, indicating a widening range of skills and confidence.
Task Related to Bullying
As an adjunct to the teacher rating of the children’s peer-related social skills, we asked the children these questions:
• “What would you say or do if someone gave you a hard time in the school grounds?”

xxv
• “What would you say or do if they continued to give you a hard time in the school grounds?” 2
Table 7 shows a drop between ages 10 and 12 in the proportion of children who would give an assertive response ifgiven “a hard time” in the school grounds, and double the proportion who would give an aggressive response.
Teachers were still seen as the key sources of help in this situation, and parents as more likely to be involved if thefirst response did not deter the person giving the child a hard time. Slightly higher proportions of 12-year-old than10-year-old children said they would avoid the situation or did not know what they would do. There was also an
increase across the two ages in the small proportions of children who said they would seek help from other studentsor groups of friends. Although a number of the schools attended by children had peer mediators, few studentsmentioned them as people they would involve in this particular situation.
Table 7 Strategies children at ages 10 and 12 said they would use when encountering difficulties in
the school grounds
Strategy↓
Initialresponseat age 10(N = 507)
%
Secondresponseat age 10(N = 507)
%
Initialresponseat age 12(N = 496)
%
Secondresponseat age 12(N = 496)
%
Assertive response 46 14 29 12
Ask teacher to help 21 55 29 48
Go somewhere else/do something else 21 18 26 16
Aggressive 5 4 10 9
Passive/do not know 3 3 7 5
Tell mum/dad/parents 0 2 5 17
Seek help from another student 2 1 3 3
Seek help from group of friends/gang 1 2 3 4
Peer mediators 0 1 1 1
2 These questions were very similar to a question the children were asked at age 10: “What would you say or do if youwere playing outside at lunchtime and another child picked on you?” Some of the study children possibly gave different
responses at age 12 than at age 10 because “someone” could be perceived to be an adult rather than another child.
xxvi
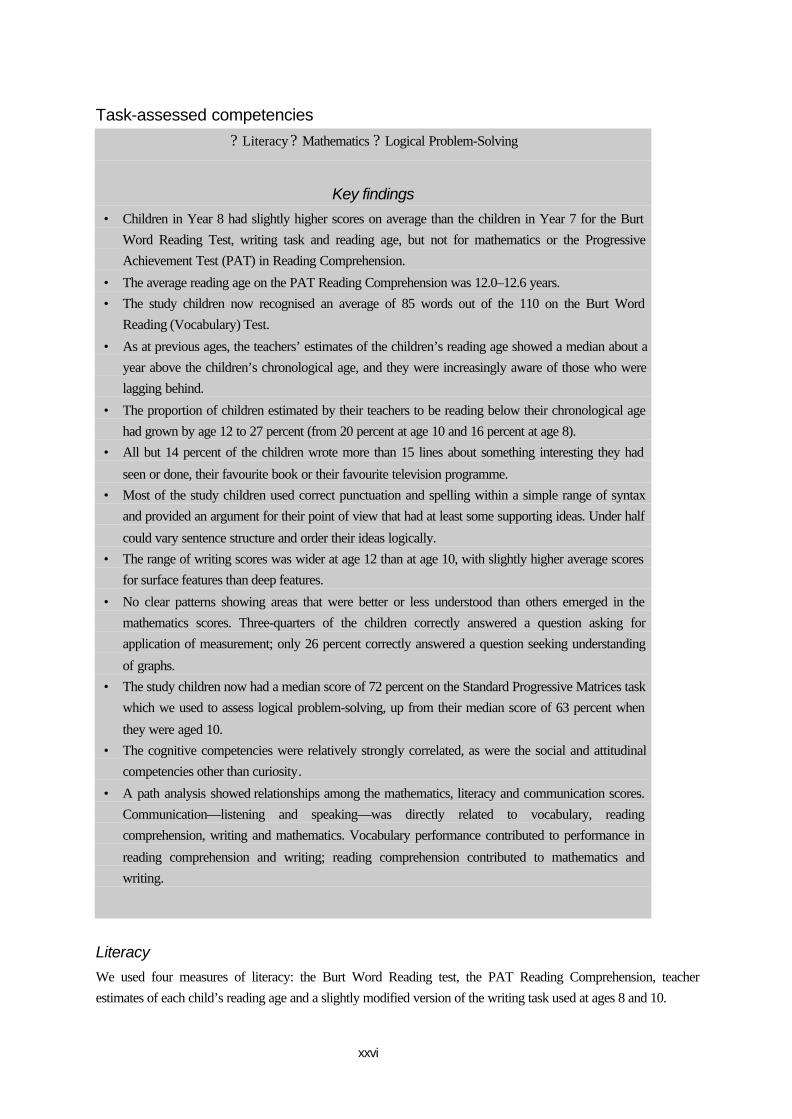
Task-assessed competencies? Literacy ? Mathematics ? Logical Problem-Solving
Key findings• Children in Year 8 had slightly higher scores on average than the children in Year 7 for the Burt
Word Reading Test, writing task and reading age, but not for mathematics or the ProgressiveAchievement Test (PAT) in Reading Comprehension.
• The average reading age on the PAT Reading Comprehension was 12.0–12.6 years.• The study children now recognised an average of 85 words out of the 110 on the Burt Word
Reading (Vocabulary) Test.
• As at previous ages, the teachers’ estimates of the children’s reading age showed a median about ayear above the children’s chronological age, and they were increasingly aware of those who werelagging behind.
• The proportion of children estimated by their teachers to be reading below their chronological agehad grown by age 12 to 27 percent (from 20 percent at age 10 and 16 percent at age 8).
• All but 14 percent of the children wrote more than 15 lines about something interesting they had
seen or done, their favourite book or their favourite television programme.• Most of the study children used correct punctuation and spelling within a simple range of syntax
and provided an argument for their point of view that had at least some supporting ideas. Under half
could vary sentence structure and order their ideas logically.• The range of writing scores was wider at age 12 than at age 10, with slightly higher average scores
for surface features than deep features.
• No clear patterns showing areas that were better or less understood than others emerged in themathematics scores. Three-quarters of the children correctly answered a question asking forapplication of measurement; only 26 percent correctly answered a question seeking understanding
of graphs.• The study children now had a median score of 72 percent on the Standard Progressive Matrices task
which we used to assess logical problem-solving, up from their median score of 63 percent when
they were aged 10.• The cognitive competencies were relatively strongly correlated, as were the social and attitudinal
competencies other than curiosity.
• A path analysis showed relationships among the mathematics, literacy and communication scores.Communication—listening and speaking—was directly related to vocabulary, readingcomprehension, writing and mathematics. Vocabulary performance contributed to performance in
reading comprehension and writing; reading comprehension contributed to mathematics andwriting.
LiteracyWe used four measures of literacy: the Burt Word Reading test, the PAT Reading Comprehension, teacherestimates of each child’s reading age and a slightly modified version of the writing task used at ages 8 and 10.
xxvii
The Burt Word Reading Test
At age 12, the median percentage score on this test was 79 percent, up from the medians of 66 percent at age 10, 45percent at age 8 and 17 percent at age 6. One child got all 110 items correct, and the fourth (top) quartile started at
88 percent compared with 79 percent at age 10 and 59 percent at age 8. The first (lowest) quartile of children was35 percent at age 8. At age 10, this lowest quartile mark had shifted upwards to 51 percent; by age 12, it was 69percent.
The mean raw score out of 110 was 84.61. As in previous phases of the Competent Children Project, the study
children’s mean score was higher than the comparable age group when the Burt Test was standardised for NewZealand in 1980. Then, the mean raw score was 78.94 for students 12.0–12.5 years of age. The study children inYear 8 achieved a mean raw score of 86.9 (SD 15.2) and those in Year 7, a mean raw score of 82.3 (SD 17.2).
PAT Reading Comprehension
This test has different questions for Year 7 and Year 8 students, with an overlap of 31 questions. Year 7 students’mean raw score (using Form A of the PAT Reading Comprehension) was 21.97 (SD 9.64), close to the mean rawscore of 22.07 (SD 8.52) for Form 1 (now Year 7) students on Form A achieved in the 1990 NZCER review of
PAT. The Year 8 mean raw score in the current study was 22.37, slightly higher than the Form 2 (now Year 8)mean raw score of the 1990 review, which was also 22.07 (SD 8.82).
Teachers’ Estimates of Reading Age
We used reading age as a quick way to tap into teachers’ professional judgement based on their knowledge of whatchildren the children were reading and had been reading.
The median for teachers’ estimates of children’s reading ages was 13.0–13.5 years, compared with 11.5–12.0 yearsat age 10 and 9.0–9.5 years at age 8. The upper quartile was age 14.0–14.5 years, and the lower quartile, age 11.5–12.0 years, with four students given a reading age of under 8 years. There had been a gradual increase in the
proportion of children thought to be reading below their chronological age as they had become older. Sixteenpercent of the children were thought to be reading below their chronological age at age 8, 20 percent at age 10 and27 percent at age 12.
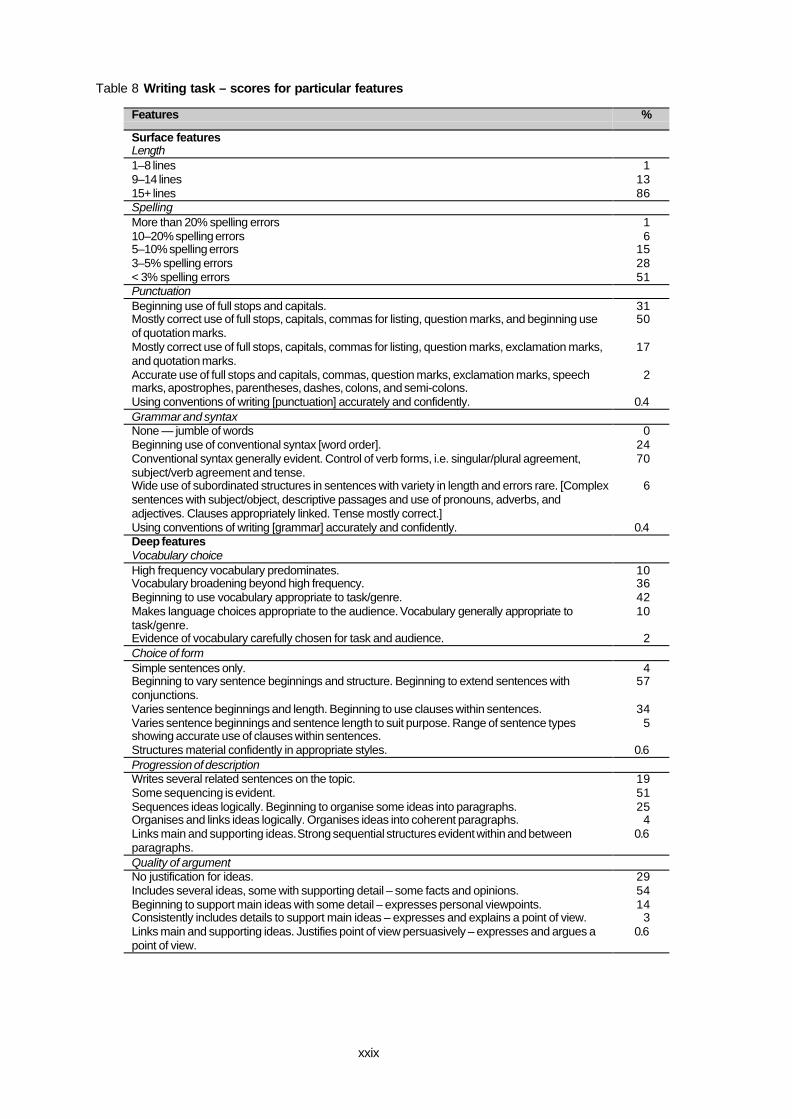
Writing
The writing task we gave at age 12 extended the ones used at ages 8 and 10. The study children were asked to write15–20 lines about something interesting that they had seen or done, or about their favourite book or televisionprogramme, telling us what happened and what they liked most about it. A non-fiction topic was chosen to put boys
and girls on an equal footing. Forty-five percent of the children chose to write about something they had done, 27percent about their favourite book and 25 percent about their favourite television programme. Six percent wroteabout something they had seen.
The median raw score on the writing test was 50 percent. There was a somewhat wider range of scores than at age
10. The top quartile was 67 percent and the bottom quartile, 45 percent: thus, half the study children’s scores fellwithin this range. At age 10, around half the children scored between 65 and 79 percent. There was a greaterincrease in writing scores between the ages of 8 and 10 than there was between the ages of 10 and 12.

xxviii
Most of the study children wrote more than 15 lines, and three-quarters produced text that had just a few wordsmisspelt. Around two-thirds were using punctuation that was mostly correct, within a simple range. Seventy percent
were using simple syntax correctly. All but 10 percent had a vocabulary wider than high frequency words, and halfwere beginning to or did match their choice of vocabulary to their task. Forty percent could vary their sentencestructure; around 30 percent were ordering their ideas logically and starting to use paragraphs. Sixty-nine percentprovided an argument that had at least some supporting ideas for their point of view.
xxix
Table 8 Writing task – scores for particular features
Features %
Surface featuresLength1–8 lines9–14 lines15+ lines
11386
SpellingMore than 20% spelling errors10–20% spelling errors5–10% spelling errors3–5% spelling errors< 3% spelling errors
16
152851
PunctuationBeginning use of full stops and capitals. 31Mostly correct use of full stops, capitals, commas for listing, question marks, and beginning useof quotation marks.
50
Mostly correct use of full stops, capitals, commas for listing, question marks, exclamation marks,and quotation marks.
17
Accurate use of full stops and capitals, commas, question marks, exclamation marks, speechmarks, apostrophes, parentheses, dashes, colons, and semi-colons.
2
Using conventions of writing [punctuation] accurately and confidently. 0.4Grammar and syntaxNone — jumble of words 0Beginning use of conventional syntax [word order]. 24Conventional syntax generally evident. Control of verb forms, i.e. singular/plural agreement,subject/verb agreement and tense.
70
Wide use of subordinated structures in sentences with variety in length and errors rare. [Complexsentences with subject/object, descriptive passages and use of pronouns, adverbs, andadjectives. Clauses appropriately linked. Tense mostly correct.]
6
Using conventions of writing [grammar] accurately and confidently. 0.4Deep featuresVocabulary choiceHigh frequency vocabulary predominates. 10Vocabulary broadening beyond high frequency. 36Beginning to use vocabulary appropriate to task/genre. 42Makes language choices appropriate to the audience. Vocabulary generally appropriate totask/genre.
10
Evidence of vocabulary carefully chosen for task and audience. 2Choice of formSimple sentences only. 4Beginning to vary sentence beginnings and structure. Beginning to extend sentences withconjunctions.
57
Varies sentence beginnings and length. Beginning to use clauses within sentences. 34Varies sentence beginnings and sentence length to suit purpose. Range of sentence typesshowing accurate use of clauses within sentences.
5
Structures material confidently in appropriate styles. 0.6Progression of descriptionWrites several related sentences on the topic. 19Some sequencing is evident. 51Sequences ideas logically. Beginning to organise some ideas into paragraphs. 25Organises and links ideas logically. Organises ideas into coherent paragraphs. 4Links main and supporting ideas. Strong sequential structures evident within and betweenparagraphs.
0.6
Quality of argumentNo justification for ideas. 29Includes several ideas, some with supporting detail – some facts and opinions. 54Beginning to support main ideas with some detail – expresses personal viewpoints. 14Consistently includes details to support main ideas – expresses and explains a point of view. 3Links main and supporting ideas. Justifies point of view persuasively – expresses and argues apoint of view.
0.6
xxx
MathematicsAs at ages 8 and 10, we used a reduced set of 20 items from the standardised PAT Mathematics. The selected items
were those that are around the median in their level of difficulty and power to differentiate between students (highscorers overall got the items correct and low scorers overall did not). The mean raw score out of 20 for the studychildren was 10.19 (SD 4.77). The mean raw score of the children in Year 7 was 9.82 (SD 4.57); for those in Year8, it was 10.57 (SD 4.9).
Most of the scores ranged around 50 percent, with no clear patterns showing areas of mathematics that were betteror less understood than others. Three-quarters of the study children got the correct answer for a question seekingapplication of measurement; only 26 percent correctly answered a question seeking understanding of graphs(related to data, statistics and probability).
Logical problem-solvingWe used a pattern-matching test, the Standard Progressive Matrices, to assess logical problem-solving. The medianscore was 72 percent, an increase from the median scores of 63 at age 10, and 40 percent at age 8. The studychildren now correctly matched an average 42 patterns out of the 60 they were presented with.
xxxi
Children’s performance across time
Key findings• Overall, children’s level of performance at age 5 was not a reliable guide to their level of performance at
age 12 for literacy and the social and attitudinal measures.
• However, there was more consistency over time in the scores of children who were performing at high orlow levels at nearly age 5, just before they reached school. For example, 77 percent of those who were in thetop quartile of mathematics scores at age 5 had scores at or above the median at age 12, compared with 13percent of those whose mathematics scores at nearly age 5 put them in the lowest quartile.
• Consistency firmed over time. Eighty-nine percent of the top quartile group for mathematics at age 10scored at or above the median at age 12, compared with 4 percent of those in the lowest quartile group at age10.
Children in the top and bottom quartiles
Two-thirds of the children who were performing in the top quartile at age 5 were scoring above the median at age12 for the cognitive competencies and curiosity. At least two-thirds of those in the top quartile at age 8 wereperforming above the median at age 12 for all the competencies. Between a fifth to two-fifths of the children who
performed in the lowest quartile at age 5 were performing above the median at age 12, but fewer children liftedtheir performance to this extent between ages 8 and 12. Improved performance was much less likely formathematics.
However, more children from the lowest quartile at age 8 had progressed above the median by age 12 than seemed
likely from our analysis at age 10. This finding suggests that though the windows of opportunity for developingperformance do seem to narrow over time, particularly by the end of the first three years of school, they are notclosed. The opportunities—support, experiences and relationships—available to children can make a markeddifference.
The different competenciesMathematics had the highest level of consistency in performance between ages 5 and 12. Around a third of thevariance, or spread, in the children’s scores for mathematics at age 12 could be accounted for by their scores at age
5, indicating the importance of activities and conversations using mathematics, patterns and symbols beforechildren reach school.
The strength of correlations between earlier and age 12 scores for the social and attitudinal competencies wasmoderate rather than strong, although they became more consistent between the ages of 8 and 12. Children’s scores
on the social and attitudinal competencies may reflect different individual responses and interactions between
xxxii
individual children, their teachers and peers, as well as different settings. Social and attitudinal competencies maybe more influenced by context than are the cognitive competencies.
Reading seems to be the competency that is least context-dependent, with the children’s earlier levels of
performance most likely to be subsumed into age 10 performance. Path analysis showed that the social andattitudinal competencies “feed into” the cognitive competencies at the same age, and that the cognitivecompetencies feed into the social and attitudinal competencies of the next age.
Gender and ethnicity
The children’s gender and ethnicity did not make marked differences to the patterns of progress for children whowere in the top quartile of earlier performance. Once a certain level of knowledge and skills had been gained, it waslikely to be maintained.
Gender and ethnicity were more apparent in differences in patterns of progress for children in the bottom quartile at
age 5. Boys in the lowest quartile at the earlier ages were more likely than their female counterparts to progressabove the median at age 12 for mathematics and the Burt Word Reading Test, although the girls were more likelyto have moved above the median for the social and attitudinal competencies. The trends for ethnicity suggest that
Mäori children who scored in the bottom quartile at age 5 were less likely than their Päkeha/European counterpartsto progress above the median for mathematics, and less likely to make progress from age 8 to age 12 inmathematics, reading comprehension and writing.
Maternal qualification and early family income
Maternal qualification and family income showed more links with patterns over time. Children whose familyincome was low when they were age 5 were less likely to perform at or above the median at age 12 if they had beenin the top quartile at age 5 for mathematics, reading and communication, but this pattern was not evident in relation
to children in this category who were in the top quartile at age 8. Children whose mothers had no qualification andwho were in the top quartiles at age 5 and/or age 8 were somewhat less likely than their peers whose mothers hadsome qualification to have scores at or above the median at age 12 for mathematics, reading comprehension andwriting.
Children whose mothers had a university qualification were most likely to move from the lowest quartile at age 5for the cognitive competencies, and those whose mothers had no qualification or a school qualification, least likely.Progress from the bottom quartile at age 8 to above the median at age 12 was more likely for children whose
mothers had a university qualification. Children whose families had very high incomes at age 5 were more likely toprogress from the lowest quartile at age 5 to above the median at age 12 for mathematics, and there was a similartrend for progress from age 8.
Comparison of the activities and experiences of children from low-income homes who were scoring above the
median at age 12 for mathematics and reading comprehension, and those who were not, showed differences in thechildren’s use of time and use of language that are consistent with theories of cultural capital.

xxxiii
Children’s experiences and competency levels
Longitudinal pictures of children’s experience and access to resources show that behind the “snapshots” taken ateach age lies (sometimes) considerable variability in previous experience and access to resources. We thereforelook here first at how differences in patterns over time for some key family resources and experiences at home and
school related to the study children’s competency levels at age 12, after taking into account family income when thechildren were age 5, and maternal qualification levels. We then take a closer look at the children’s experiences athome and school at age 12, and the relationship between their experiences in these environments and theircompetency levels.
The contribution of early childhood education and of cumulative experiences at age12
Key findings• Early childhood education quality was still contributing to the children’s competency in mathematics and
literacy at age 12.
• Family income levels when the children were nearly age 5 had more bearing than current family incomes ontheir competency at age 12.
• While high numbers of house shifts and changes of school disadvantaged some children, high levels ofmaternal qualification and family income appeared to be acting as buffers.
• Maternal qualification levels mattered more than family income for children’s competency levels at age 12.(High parental qualification levels relate to the opportunities children have to use symbols and language from
an early age. These experiences foster enjoyment, and enjoyment is associated with higher performancelevels.)
• Competency levels at age 12 were not related to the kind of family a child was living in (i.e., one- or two-parent) or to whether the family had remained intact since the child was born.
• Age 12 competency levels were also unrelated to patterns of maternal employment from when the child wasnearly age 5, or to current maternal employment.
• Few paths through school had run smoothly, with most children having experienced a problem that parentsand teachers had resolved together, or a teacher they did not like. These experiences, however, did notinfluence competency at age 12 unless the problems continued.
• Children who had received consistent messages about the value of school from their parents’ voluntary workat their school had higher average scores at age 12.
xxxiv
• The few children whose classes always numbered below 25 had higher scores at age 12 for mathematics,literacy and logical problem-solving.
• Children who had consistently attended high-decile schools had higher average scores at age 12. Little overall
difference was evident between consistent attendance at state, state integrated and private schools, but thosewho had attended state integrated schools had higher scores for social skills with peers, and those who hadattended private schools, for writing.
• Staying clear of bullying behaviour over the years, whether as victim, bully or both, benefited children.
Early childhood education
The study children’s early childhood education experience was still contributing to their mathematics and readingcomprehension scores seven years later. By age 12, the range of early childhood education aspects showingrelationships with the children’s mathematics scores was wider than with their PAT Reading Comprehension
scores, perhaps because more reading activities occur in homes, or perhaps because the kinds of activities andinteractions provided by early childhood education staff support mathematics performance through practice inpatterns and puzzle-solving.
Most of the associations with mathematics remained after taking the children’s scores at age 5 and family income
and maternal qualification into account. The proportion of variance in scores, and the size of the difference betweenthe scores for children with different levels of early childhood education experience increased rather than decreasedwith time. Both these patterns suggest that early childhood education contributes to children’s performance at age12 through ways of working and thinking, rather than the simple provision of knowledge at a certain level.
The particular early childhood education quality aspects that continued to show associations with the PAT ReadingComprehension scores focused on staff–child interaction, along with a “print-saturated” environment. Thecentrality of staff–child interaction found in this study for long-term outcomes is consistent with other large-scale
research on concurrent and short-term relations between early childhood education quality and outcomes forchildren.
Family Resources
House Moves
Sixty-nine percent of the study children had moved house at least once since their birth, and 14 percent had movedat least five times. Mobility between houses was more common for children in two-parent families with one step-parent, for children from low-income families, children of one-parent families, and those children whose mothers
had no maternal qualification. Children who had moved house five or more times were those most likely to havelower average scores on mathematics and social skills with peers. Maternal qualification and family incomeappeared to be protective factors for the other competencies with regard to a high number of house shifts.
xxxv
Family Income
Family income levels were not static over this period for many of the study children. They were mostly likely to bemuch the same for those children whose family incomes had been more than $80,000 when the study child was age
5 (84 percent). Over the seven years between the study children being nearly age 5 and age 12, 65 percent of thosewho had had low family incomes (below $30,000) saw some increases, as did 54 percent of those with familyincomes between $30,000–60,000, and 61 percent of those with family incomes of between $60,000–80,000. Ninepercent of the families saw some decreases in their family income over this period.
Children whose family incomes were low when they were age 5 had lower average scores at age 12, whether or nottheir family income levels improved over the seven years. Earlier levels of family income accounted for more of thevariance in children’s scores at age 12 than did current levels of family income. Children from homes that were
then low-income were only half as likely as those from then high-income homes to score at or above the studymedian score at age 12 for mathematics and the PAT Reading Comprehension.
Parental Qualifications
Although there are overlaps between family income and maternal qualification levels, maternal qualification is the
stronger factor in relation to children’s competency levels at age 12. Paternal qualification levels also make aseparate contribution to children’s cognitive scores. The higher the level of maternal qualification, the more likelythat the children’s father would have the same qualification level.
Home and School
Homework, TV and music
Always completing homework and consistently watching, from age 5, fewer than an average of two hours oftelevision a day benefited children in terms of their competency scores. The reverse was true for children who had
watched large amounts of television consistently from ages 5 to 12. (This association with lower competency levelswas not reduced by sometimes watching smaller amounts.) Children whose participation in music varied betweenages 8 and 12 did not have lower average scores than those whose participation was consistent. Those with thelower scores were those who had consistently had no participation in music.
Family composition
By age 12, 71 percent of the study children had always lived with both their biological parents, and 6 percent withone biological parent. Twenty-three percent had experienced some changes in their family composition, with 13
percent living with a step-parent and 10 percent living sometimes with two parents and sometimes with one. Familytype, whether stable or changing, was not related to the children’s competency levels at age 12.

xxxvi
Maternal employment and welfare benefits
Few of the study children had mothers who did not undertake some paid employment between the time the childrenwere nearly 5 years of age and when they were age 12. A few mothers were in full-time work throughout thisperiod. Different patterns of maternal employment were unrelated to the children’s scores at age 12.
Twenty-two percent of the study children were in families that had received welfare during the age 8 to age 12period. There was an indication that the cumulative experience of being in such a family may disadvantagemathematics performance at age 12.
Parents’ engagement with the school
Most of the study parents had engaged with a teacher at least once during the age 8 to age 12 period on a problemthat their child was experiencing. However, problems only had an adverse effect on cognitive competencies forthose children consistently experiencing academic problems. Social and attitudinal competencies were affected ifthe children experienced a problem in two or more of the three study phases.
The children’s teachers reported that they had relationships that they thought consistently good/excellent with only13 percent of the children’s parents over the ages 8 to 12 period. These children, and those for whom therelationship was seen as very good/excellent for two of the three phases, tended to have higher average scores.
Sixty-nine percent of the parents gave voluntary help at their child’s school in at least one of the three study phases
during the age 8 to age 12 period, and only 2 percent of the parents had had no involvement in their child’s schoolfor two or three of the study phases. Children whose parents did voluntary work at their school for at least two ofthe three phases had higher average scores, suggesting that children were receiving a consistent message about the
value of school. Conversely, children whose parents had no involvement in their school in two or three of thephases had lower scores. They, too, were getting consistent messages, but not ones supporting their engagement inschool.
Thirty-four percent of the children’s parents were always satisfied with their child’s progress at school across ages 6
to 12. Only 8 percent were never satisfied or only once satisfied. Children whose parents consistently reportedsatisfaction with their child’s progress or whose parents said they were becoming satisfied with the child’s progressat ages 10 or 12 had higher competency scores at age 12.
School characteristics
The few children whose classes had always been small (i.e., 25 or fewer students) had higher average scores formathematics, literacy and logical problem-solving. Otherwise, there were no differences related to cumulativeexperiences of classes of different size, whether the classes were much the same in size over the years or varied.However, the variation in class size in our sample was not large.
The children who had consistently attended state integrated schools since school entry had higher average scores forsocial skills with peers. Children who had consistently attended private schools had higher average scores forwriting.
Half the study children had been attending schools, on a consistent basis, in the same socio-economic decile band
(low, medium, high) since school entry. Children who had attended a high-decile school for at least three of the four
xxxvii
study phases between ages 6 to 12 had higher average scores. Children who had always attended a low-decileschool had lower average scores. Children with mixed attendance patterns had much the same average scores as
those who had consistently attended medium-decile schools, indicating that switching to different decile schools,even when the move is to a higher decile school, may not confer benefits.
Number of schools attended
By age 12, only 25 percent of the children were in the same school in which they had started, reflecting the break
that comes for most at the end of Year 6. Fifty-one percent were at their second school, and 16 percent at their thirdschool. Thus, most of the study children had attended three schools at most.
Eight percent of the children had attended four or more schools (the highest being eight) by age 12. Children whoseparents said their child had had teachers he or she did not like were almost twice as likely to be those who had
changed schools as those who had stayed in the same school. This dislike may have been the reason for changingschools and a school change under such circumstances should not be seen as school mobility per se.
On the whole, children who had attended a single school tended to have higher average scores for reading andwriting, and children who had attended four or more schools to have lower than average scores for mathematics.
Family resources diluted the strength of these associations. Although there is high interest in the effects of transitionbetween different school stages, we found no disadvantages for children who changed schools between age 10 and12, usually moving from a primary to an intermediate school.
Bullying and coping
Staying clear of bullying behaviour, whether as victim or bully, or both benefits competency. Only three of thestudy children were consistently upset and not coping in all three phases between ages 8 and 12. Children who wereupset more than once over this time, or currently, and who did not cope with it tended to have lower average scores.
Children who had upsets but coped with them tended to have higher average scores for mathematics. Those whoexperienced no upsets during this time had higher average scores for perseverance, individual responsibility andsocial skills with peers.
Stability
Overall, the experience of stability or just a couple of changes in the daily settings of children’s lives—their homes(and possibly neighbourhoods) and schools—appeared to give children advantages in some, but by no means all, ofthe competencies. However, family income and maternal qualification levels appear to act “protectively” in relationto large numbers of changes in residence and schools for some competencies.
That mathematics performance seems to be affected by a higher number of changes of residence and school isconsistent with children being more likely to develop their knowledge and skills in mathematics than in othercompetencies in a “building block” way. Children generally need to master one level before they can make furtherprogress.
xxxviii
The children’s home experiences at age 12
Key findingsFamily Situation
• Just under half the children’s mothers were in full-time employment, and just over half their fathers wereworking more than 40 hours a week on average.
• Parents needing help were more likely to call on friends than on family or neighbours, and children were morelikely to talk to their mothers than fathers about school or what they were reading.
Activities
• Playing sports, hanging out with friends and watching television were the children’s favourite non-schoolactivities, with the girls more focused on friends and reading and the boys on playing electronic games andwatching television. The study children were watching more television on average than at age 10. Boys likedcartoons, and girls liked soap operas and sitcoms.
• Ninety percent of the children had a computer in their home and spent nearly four hours a week using it. Boys’computer time centred more on games, music and surfing the Internet, girls on word processing, seekinginformation and using email and online chat rooms.
• Around two-thirds of the children enjoyed reading at home, with 45 percent identifying reading among theirfavourite out-of-school activities. Around half enjoyed writing and 45 percent working with numbers.
• Just under half the children were receiving sports coaching or performing arts/music lessons outside school.Sports and performing arts were also the main extracurricular activities done at school.
• Most had some money (either given or earned), with boys tending to spend it on games and toys, and girls onclothes and make-up.
• The boys’ greater focus on action-based activities and the girls’ on language and communication fitted with the
slightly higher scores that the girls achieved in literacy and their higher scores for the social and attitudinalmeasures.
Feelings about Life at Home
• The 12-year-olds were somewhat more positive than they had been at age 10 that they were listened to, treatedfairly, and got help if they needed it. Most felt they had interesting things to do at home. However, sizeable
minorities reported being bored or told off or felt that their family showed little interest in their school life orhomework.
• The children’s views that showed most associations (either positive or negative) with their competency scoreswere with doing interesting things, being bored, helping out at home, getting help if needed, getting told off at
home, and expectations being fair.
xxxix
Engagement with Parents
• All the parents of the study children shared some activities with their 12-year-old children, notablysocialising with other family or friends and transporting the children to their activities. Favoured activities with
boys were watching sport and transporting them to activities , and with girls, shopping and talking. Childrenwhose mothers had no qualification or whose fa milies had low incomes shared fewer activities with theirparents.
• Children whose parents mentioned just one or two shared activities scored lower on mathematics; childrenwhose parents mentioned five to seven activities scored highest.
• Most parents had expectations or rules relating to schoolwork, housework, language and media use.Parents usually dealt with disagreements (only 1 percent of parents said they and their child never disagreed)by negotiation. The next main response was the parent exerting his/her authority. Children whose parentsnegotiated with them had higher average scores than children whose parents let them win.
• Help around the house, self-esteem, and behaviour at home were the main areas of parental concern inrelation to their 12-year-old. However, around two-thirds of the parents had no concerns about their child interms of these factors or the child’s friendships, interests or school. Children for whom parents held someconcerns generally had lower average scores on the competency measures.
Relationships with Peers
• Friendships were very important to the children at age 12. Boys were much more likely to spend time withfriends in physical activity or playing games, and girls to spend time talking and shopping. Just over half thestudy children identified something negative about their friendships, as well as their positive aspects. Around12 percent had mainly aimless friendships, and 3 percent did not have good friendships.
• Bullying frequency at age 12 was much the same as it had been at age 10. Around a quarter of the 12-year-olds reported being bullied and 15 percent said they had bullied another child in the last few months. Mostbullying occurred at school and was verbal. A child’s main response to bullying was to ignore it or seek helpfrom a teacher or parent.
Children’s Values
• Enjoyment of life and doing well at school or sport were the most important values for the study childrenat age 12, followed by being with family, having lots of friends and being helpful or kind. A happy family lifeand then good health were deemed of most importance in their adulthood. Twice as many children saw havingan interesting job in adulthood as more important than having lots of money.
Siblings and Birth ParentsAt age 12, 83 percent of the study sample had at least one sibling, with a third having one, and just under a third,two siblings. Most either lived with, or were in contact with, their birth parents. Half of those who did not live with
one birth parent saw their non-resident parent regularly. Children whose parents shared their custody or whose non-resident parent had regular access to them were more likely to get on with their non-resident parent.
xl
Parental EmploymentFull-time employment of the mothers of the study children had risen gradually over time, from 19 percent when thechildren in the study had yet to start school, to 32 percent at age 10 and 41 percent by age 12. Mothers in two-parent
families were more likely to be working full-time than those in one-parent families. Otherwise, patterns ofemployment (and not being in employment) were similar across different family types. They were also similaracross different levels of maternal qualification. However, maternal qualification levels were reflected in the kindsof work undertaken.
There were also gender differences in the kinds of employment undertaken by the parents of the study children.Fathers were much more likely than mothers to be in managerial or trade work. Mothers were more likely to beworking as professionals (including teachers and nurses), technicians and associated professionals and clerks.
Fifty-six percent of the children’s fathers worked more than 40 hours a week on average, a much higher proportion
than the 29 percent of the mothers employed full-time. Use of others to help care for children when parents couldnot was mainly related to maternal employment, although there was less use of others where fathers were notemployed. The use of paid care for children (by a caregiver or through an OSCAR programme) was related to
family income and maternal qualification levels, with more use of paid care by families with higher levels ofincome and maternal qualification.
Parental Support, Income and Leisure ActivitiesMost parents could easily call on some help if they needed it, more so from friends than family or neighbours.Family characteristics were unrelated to the availability of help from others.
Most family income was earned through wages or salary. Self-employment was a source for 26 percent of thechildren’s families. Thirteen percent received a welfare benefit. While family income levels were related to familysources of income, maternal qualification levels were not.
Eighty-nine percent of the parents reported that they were generally happy, and 80 percent that they were in very
good or excellent health. Parental happiness was related to their own health and to teacher reports of their child’shappiness.
Watching television, reading and talking with friends headed the list of parents’ leisure activities. In contrast to thegender differences between the study children’s use of leisure time, there were only a few gender differences
among their parents. Maternal qualification was the family characteristic most associated with differences in the useof leisure time, followed by family income. The differences that existed were related to the use of literacy andparticipation in “high culture”. Mothers with no qualification or in low-income homes were also less likely to dovoluntary work or to garden.
Most parents interviewed said they liked reading. Enjoyment of reading was related to maternal qualification levels.Interestingly, there was no association between parental and child enjoyment of reading. Although most parentswatched television most days, the higher the level of maternal qualification and family income, the less amount oftime went to television viewing.
xli
Parent–Child InteractionThere were some indications that the children talked more with their mothers than their fathers about school,possibly because of the greater likelihood of mothers being in part-time rather than full-time employment.
Generally, there were few gender differences related to parental interaction with children, or involvement in theiractivities.
Children’s ActivitiesAt age 12, most of the study children watched television and did homework on at least two days a week. Sport,
reading, computer use and spending time with friends were the next most frequent group of activities, followed byhousework, playing electronic games and talking to friends on the phone or the Internet. The next and final group ofactivities were more occasional, with some of the children never experiencing them: reading magazines,
newspapers or comics, taking part in art/music/dance classes or working for money outside the home. With theexception of homework, children usually most enjoyed those activities they did more frequently. Between 60 and69 percent said playing sports, hanging out with friends and watching television were among their favouriteactivities.
There were some notable gender differences. Girls were more likely to read, talk with friends, do homework and goto art/music/dance classes. They most enjoyed hanging out with friends, talking with them and reading. Boys weremore likely to play electronic games and sport and to read comics. They most enjoyed playing electronic games andwatching television.
Levels of maternal qualification were reflected in the time given to reading, computer use and participation inart/music/dance classes. Children’s use of their leisure time at age 12 was unrelated to their level of family income.
Television
A quarter of the children had a television in their bedroom, available for private use. Almost twice as many boys as
girls had a television set in their bedroom, and four times as many of the children whose mothers had noqualification compared with those whose mothers had a university qualification. The latter group of children weremore likely to have a desk in their bedroom. These differences in the items that were readily available to childrenfor their private use may indicate differences in values.
At age 12, the study children were watching more television on average than they had at age 10, perhaps becausetheir tastes were shifting to longer, adult programmes, with a third now watching adult soap operas. Gender playeda role in programme preferences. Boys were more likely to prefer cartoons, and girls, adult soap operas and
sitcoms. Boys did not watch more television on average, but their taste for cartoons may be reflected in their higherrate of watching television before school.
Television played a bigger part in the lives of children whose mothers had no qualification, were from low-incomehomes or were Mäori or Pasifika, and a smaller part in the lives of children who enjoyed reading. More associations
were evident between the children’s competencies and their cumulative time spent watching television than withcurrent time use, but those whose current television watching was less than an hour had higher average scores formathematics and writing.
xlii
ComputersBy age 12, 90 percent of the study children had a computer in their home. The average time spent using a computer
at home was 3.8 hours a week. Boys spent somewhat more time than girls on the computer. Access to a homecomputer and the time spent on it related to maternal qualification levels. The latter accounted for most of thedifferences found for some competency scores in relation to time spent on the computer.
The 12-year-olds mainly used the computer for homework, email and accessing Internet. Boys were more likely to
download games or music and to surf the Internet. Girls were more likely to word process, seek information forhomework or projects and use email and online chat rooms.
Family characteristics of income or ethnicity were not associated with differences in computer use. However,maternal qualification was: the higher the level of maternal qualification, the greater the children’s use of email andof the computer for homework or projects.
Less than 10 percent of the children had a computer in their bedroom. However, three-quarters of the study childrenhad Internet access at home, and most could use the Internet on their own. Use of the computer rose with access tothe Internet and being allowed to use it on their own. The children’s main uses of the Internet were to seekinformation for schoolwork and to email.
Computer activities that showed significant associations with children’s competencies, particularly mathematicsand communication, were playing games, word processing, email, graphics and homework or projects.
ReadingAround two-thirds of the study children enjoyed reading; 45 percent put reading among their favourite out-of-
school activities. Enjoyment of reading was highest among those children whose mothers had a universityqualification. Girls enjoyed reading more than boys.
Many of the children were reading a range of reading material, including fiction and information. Fiction wassomewhat less likely to be read by boys and children whose mothers had no qualification. Children who enjoyed
reading were more likely to read across the board. Enjoyment of reading was associated with higher average scoreson all the competencies.
Reading has a double value: in itself and as a topic for conversation with parents. Most children spoke to someoneat home about what they were reading, more often their mother than father. Children who enjoyed reading were
more likely to gain this additional value from their reading. Maternal qualification again played a role in child–parent talk about reading. Talking with parents about reading was associated with higher scores on the competencymeasures.
Three-quarters of the study children visited a public library, most with their family, although 15 percent went by
themselves and 13 percent with friends. Public library use was lowest among those children whose mothers had noqualification, those who did not enjoy reading, and boys. Frequent use of a public library was associated withhigher scores on the competency measures.
Reading is a key aspect of children’s performance at age 12, and not just for scores on reading measures.
xliii
WritingThe home writing that was done by half or more of the children was largely informative and as part of relationships
with others, or it was related to word knowledge or copying existing material. Half the children enjoyed writing,with girls enjoying it more than boys. Enjoyment of writing had positive associations with children’s social andattitudinal competencies and writing, but not with reading or mathematics.
MathematicsAt age 12, 45 percent of the study children enjoyed working with numbers. This enjoyment was positivelyassociated with the children’s scores on the social and attitudinal competencies, mathematics and logical problem-solving. The main mathematics activities the children did at home were embedded in games or required use of aruler. Least common were activities involving calculators or computers.
Clubs, Lessons, Formal Music and Extracurricular ActivitiesSeventy-nine percent of the children at age 12 belonged to a club or group—slightly down on the 85 percent at age10. Sports club membership continued to dominate. Membership of children’s service clubs had dropped to 13
percent from 21 percent at age 10. Membership of groups was more likely for boys, especially sports, and lesslikely for children whose mothers had no qualification and for children from low-income homes.
Forty-seven percent of the study children attended lessons or coaching outside school. Participation in lessonsoutside school reflected family income levels. Performing arts lessons were most popular, followed by sports. Girls
were more likely to attend performing arts lessons. The higher the level of maternal qualification, the more likely itwas that children would attend performing arts lessons.
Forty-nine percent of the study children played a musical instrument or took part in a musical group, according totheir parents. Forty-one percent played an instrument, and 11 percent sang in a choir. Nine percent played in an
orchestra or cultural group. Choir and orchestra or cultural group membership occurred in similar levels at allfamily income levels. Playing an instrument was related to maternal qualification and family income levels.
Most children took part in some extracurricular activity at school, predominantly sports (64 percent), followed byperforming arts (32 percent) and voluntary or service groups (20 percent). Girls were more likely to take part inperforming arts activities and service groups; boys in computer activities and games.
MoneyOnly 2 percent of the study children had no money of their own at age 12. The main sources were their family,through chores (47 percent), regular pocket money (40 percent) and irregular money (35 percent). A quarter had a
job outside the home, with the main kind of work a source of employment that has since dried up in the Wellingtonregion, delivering daily newspapers. Competency scores were unrelated to whether children worked outside thehome.
Saving was the most frequent use of money earned or given, followed by buying food, games and toys or clothesand make-up. Boys were more likely to spend their money on games and toys; girls, on clothes and make-up.
xliv
Gender DifferencesThe gender differences in the activities the children engaged in at home show how traditional stereotypes continue
in everyday life: boys focused on action; girls on language and communication. The differences give some contextto the differences found in competency scores. These favoured girls, although the size of the differences was smallin relation to literacy and mathematics. Gender differences were more marked in relation to social and attitudinalcompetencies.
Reflections on Children’s Engagement with ActivitiesTelevision watching, sports and time with friends were common ways of spending time for the study children atage 12, no matter what their social background. The differences that were apparent related to either gender or social
background and mainly concerned engagement in activities that use language or symbols, particularly throughreading, performance and communication. These are the activities that positively contribute to children’sperformance levels. Cheaper options, such as spending large amounts of time on television viewing, appear to makesome negative contributions.
Children whose mothers had no qualification experience a “double whammy” in relation to these differences: theydo fewer of the activities that have positive associations and watch more television. Because children are morelikely to value familiar activities, it becomes harder for them to take on new activities or drop old ones.
It is worth noting the overlaps of enjoyment of reading, writing and number use, and the continuing positive
contributions these make to children’s competency scores after taking into account maternal qualification andfamily income. This inter-relationship suggests another path forward for children from homes that aredisadvantaged in terms of these key resources.
If children from these homes enjoy literacy- and mathematics-related activities from an early age—a matter of both
opportunity and methods of engaging children’s attention and interest—then they may be more likely to keep upwith activities that use and extend early knowledge and skills as they grow older. One can only underline theimportance of the greater awareness of providing such opportunities in early childhood education that has becomeevident in recent years, and of building parental confidence and skills to work with children at home.
Children’s Perspectives on their Home LifeAt age 12, most of the study children felt they belonged in their home, got support, had interesting things to do andwere fairly treated. They were somewhat more positive than they had been at age 10 that they got help if they
needed it, were treated fairly and listened to. However, there were sizeable minorities who said they got bored, felttold off or felt that their family showed little interest in their school life or homework.
Differences in gender and family resources and characteristics were reflected in just a few differences in theseviews, suggesting that gender and social differences were not the decisive factors in children’s home experience, or
their judgement of that experience, although we did find that children whose mothers had a university qualificationwere more likely to rate more highly the items that showed associations with the age 12 competency scores.
The children’s views that showed most associations with their competency scores were:
• doing interesting things• being bored (a negative association)

xlv
• helping out at home (a negative association for those who always helped out at home)• getting help if needed
• getting told off at home (a negative association)• fair expectations.
Another 10 of the items showed associations with mathematics and some of the literacy measures.
Parental Support and Sharing of Activities
Parental support came in the form of help, having things explained and having parents knowledgeable about how
the children spent their time (that they had completed their homework, for example). It also came in the form offeeling close to parents, listened to by them and trusted by them to let the child do what he or she wanted to do athome.
All the parents of the study children shared some activities with their children. Socialising with other family or
friends and transporting them to their activities headed the list. Parents of boys were more likely to watch sport withthem and transport them to activities. Parents of girls were more likely to mention shopping and talking. These areconsistent with some of the gender differences in children’s activities. There were some differences related to
family resources, particularly maternal qualification. Children whose mothers had no qualification or whosefamilies had low incomes shared fewer activities with their parents.
Children’s mathematics scores at age 12 were related to the number of activities shared with parents, with loweraverage scores for children whose parents mentioned just one or two shared activities, and the highest averagescores for children whose parents mentioned five to seven activities.
Parental Expectations
Most of the study children at age 12 said they came home from school to a parent; 31 percent also mentioned asibling. Fifteen percent came home to an empty house.
Most of the parents reported expectations or rules relating to schoolwork, housework, language and media use.
Dress and telephone use were least likely to attract parental authority. Children were less aware of theseexpectations or rules, perhaps because they were not always overt or enforced. Parents and children were mostlikely to agree about the existence of rules or expectations relating to homework, television watching and
housework, and least likely to agree about those relating to telephone use. Gender made little difference to the rules:boys reported more rules about electronic games, which they were more likely than girls to be playing, and girls,who talked more on the telephone than boys, to report rules about that. Two-thirds of the children who spent time intwo households encountered similar rules or expectations in both.
Only 1 percent of the parents said they and their 12-year-old child never disagreed. Negotiation was the mainresponse when they did, followed by the parent getting cross and the parent getting their way. Almost half theparents used a range of responses at different times. Parental reports of their responses to children were largely
unrelated to the children’s perceptions of feeling comfortable at home, listened to or treated fairly, although childrenwho said they were rarely or never told off were more likely to have parents who would negotiate in times ofdisagreement. Children whose parents negotiated with them had higher average scores than children whose parentslet them win.
xlvi
Overall, many of the study children lived in homes that were supportive and gave them structure, but without beingoverly restrictive. There were some telling differences related to family characteristics, particularly maternal
qualification, but social class was not operating within strict borders and distinct differences. Nor was genderclearly differentiating interactions between the study children and their parents.
PubertyOn parental reports, the girls were much more likely than the boys to be experiencing puberty changes at age 12: 84
percent compared with 59 percent. Puberty changes for girls included developing breasts (58 percent), experiencingmood swings (50 percent), getting body hair (35 percent) and starting menstruation (20 percent). Thirty percent ofthe girls experiencing puberty changes were sometimes or often uncomfortable with them, compared with 19
percent of the boys. Puberty changes and reactions to them were generally unrelated to children’s competencylevels.
There was some relationship between experience of puberty changes and experience of unsettling events, and withchildren’s general happiness, which teachers and parents saw similarly. Most of the children were said to be in verygood or excellent health, with parental reports of their overall children’s health reflecting family income levels.
Coping with UpsetsForty-one percent of the parents thought their 12-year-old child was experiencing something upsetting, a slightlyhigher proportion than at earlier school ages. Parents were most aware of family-related reasons for children being
upset. However, as at earlier ages, most children who were upset could cope with it; 11 percent of those who wereupset could not. Experiences of upsets and how children coped with them were largely unrelated to familycharacteristics or gender.
We found that those whose coping with being upset varied had lower scores for perseverance and social skills with
peers. There was a tendency for children who were coping poorly to score lower on the cognitive competencies,although this was not evident after accounting for maternal qualification.
Parental ConcernsHelp around the house, self-esteem and behaviour at home were the main areas of parental concern in relation to
their 12-year-old. However, two-thirds or more of the parents of the study children had no concerns about theirchild in relation to help around the house, their self-esteem, behaviour at home, friendships, interests or school.
Some interesting trends emerged relating to maternal qualification: parents with university qualifications seemedmore tolerant of their age 12 children becoming assertive, and possibly less likely to see that assertiveness as
contesting parental authority. Help around the house and behaviour at home were more likely to be concerns wheremothers had no qualification and family incomes were low.
In general, children for whom parents held some concerns had lower average scores on the competency measures.Parental concern about their child in relation to school was not related to the cognitive competencies, but to thesocial and attitudinal competencies.
xlvii
Friendships and Relations with PeersFriendships were very important to the study children at age 12. Being with friends was among their most preferredways to spend their time. Much of this activity was informal. There were marked gender differences, with boys
much more likely to spend their time with friends in informal physical activity or playing games, and girls muchmore likely to spend time talking and shopping. Boys valued sharing interests more than girls, and girls, havingsomeone to talk to.
Just over half the study children could identify something that was not so good about their friendships—mainly
arguments, or unreliability. Boys were somewhat more positive (or less critical) about their friendships than girls,perhaps reflecting different expectations and ways of relating to friends. Differences in family resources andethnicity were not reflected in differences as marked as those with gender in the way the study children spent timewith their friends or what they valued about their friendships.
Just over half the children said they had five or more close friends; 13 percent had one or two. The number of closefriends was unrelated to gender or family characteristics and was largely unrelated to children’s competency scores.Close friends tended to be of the same sex, but 42 percent of the boys and 27 percent of the girls said their closefriends included both boys and girls.
Ninety-one percent of the study children felt that their parents liked their friends, or most of them. Parentaljudgement was still respected and held more weight than friendships. When we asked the study children what theywould do if their parents told them not to do something and their friends really wanted them to do it, 66 percent said
they would not do the activity, and another 6 percent said they would try to persuade their friends not to do it.Fourteen percent would try to persuade their parents to let them. Eleven percent thought it would depend what theactivity was. Only 6 percent would go ahead and do the activity their friends proposed but their parents opposed.
Girls were more likely to try to persuade their parents to let them do the activity, and boys more likely to do itanyway.
Through factor analysis, we found that fun in friendships was more likely to be valued than communication andthat most children had good friendships. However, around 12 percent had mainly aimless friendships, and 3 percentdid not have good friendships.
BullyingAround a quarter of the study children said they had been picked on or bullied by someone in the last couple ofmonths. Bullying frequency at age 12 was much the same as it was at age 10. Most bullying occurred at school (20
percent), with 4 percent of the children having been bullied at home and 2 percent in a public place. Most of thebullying was verbal. The main response to the bullying was to ignore it or seek help from a teacher or parent.Fifteen percent of the children said they had bullied another child in the last few months.
Gender was unrelated to experiences of being bullied or bullying, but children whose mothers had no qualification
were more likely to be bullied. There were more reports of bullying from children attending decile 5–10 schoolsthan those attending decile 1–4 schools. Children who had experienced bullying—as victim or bully or both—tended to score lower than those who had not been involved in bullying.
xlviii
Patterns of Peer Relations and Children’s Earlier Social Skills and School BehaviourCross-tabulation of factors relating to children’s earlier social skills and their current patterns of relations with peers
showed no notable associations between “ordinary” levels of social skills and comfort at school at age 10, and“ordinary” relations with peers at age 12. However, relatively poor social skills, social isolation and being bullied atage 10 were more likely to precede being bullied at age 12. Children who had been socially isolated two years
earlier were less likely to see friendship as a key value, and those who had had poor social skills, less likely to thinkof friendships as fun. Earlier poor social skills and experiences of bullying were more likely to precede socialisolation and bullying at age 12, and less likely to see friendship involving communication, fun or a part of theeveryday.
Friendship mattered a great deal at both ages for these children, but was not a source of satisfaction. Looked atanother way, it would appear that some children with poor social skills at age 10 need additional support fromadults in their life if they are to have positive experiences of friendship two years later.
Patterns of Peer Relations, Attitudes to School and Competency LevelsWe found that those who bullied other children were more likely to have friendships focused on fun and to scorehighly on the “appearances matter” set of values (see below). They were less likely to be engaged in learning or toview diligence as a sign that they were doing well at school. Those who were regularly bullied did not show
differences in friendship patterns or values, but were more likely to feel distressed at school and to be less engagedin learning than those who were not bullied. They were more likely to see diligence as a sign that they were doingwell at school. For both the bully and the bullied, school is not enjoyable, but for rather different reasons.
Distress at school was also more likely to be experienced by those who experienced isolation at school. These
children saw school progress in terms of “ease” and were more likely to respond aggressively if given a hard timein school. Thus, those who felt isolated did not respond passively, but like the bully and bullied were more likely todisengage from learning.
Children who emphasised communication in their friendships were more likely to reach out for help if they needed
it and to problem-solve. The other trends for other patterns of friendship that we found suggest that these relate tohow children tackle work at school, with lower scores for the PAT Reading Comprehension for children who hadaimless friendships or for whom friendship was an especially key value.
The indications here are that while friendship is an everyday part of most children’s lives at age 12, its value can
over-topple if it becomes too important, if relationships are vexed or focused on power or if the friendship has littleshared content. Too large a focus on friendship can counter engagement in schoolwork, or it can be a sign thatchildren are not engaging in the work required to make the most of school.
Children’s Values
Enjoyment of life and doing well at school or sport were the most important values for the study children at age 12.The next biggest group of values in terms of importance was being with family, having lots of friends and beinghelpful or kind.
The connections we found between the values comprised three main groups:
The anchored life: 50 percent of the study children had high scores for the items in this group.

xlix
Action and friendship: 31 percent of the study children had high scores for the items in this group.
Appearances matter: 9 percent of the study children had high scores for the items in this group.
Children with high scores for the “anchored life” items were more likely to enjoy reading at age 12 and to have hadhigher scores for communication at age 10. Those with higher scores for “action and friendship” were more likely
to have had higher scores for social skills at age 10. The children with higher scores for the “appearances matter”group of items were more likely to have had lower scores at age 10 for individual responsibility.
The study children said that a happy family life, followed by good health, would be of most importance to them intheir adulthood. Having an interesting job was mentioned by twice as many of the children at age 12 as having lotsof money.
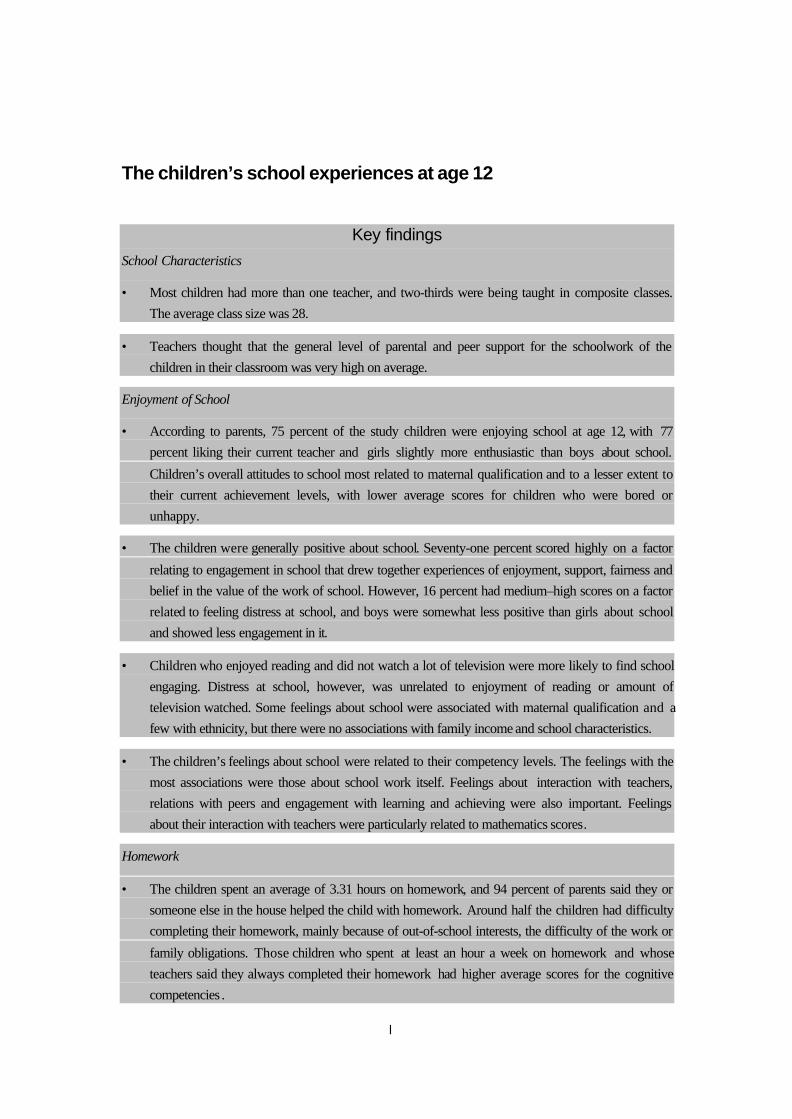
l
The children’s school experiences at age 12
Key findingsSchool Characteristics
• Most children had more than one teacher, and two-thirds were being taught in composite classes.The average class size was 28.
• Teachers thought that the general level of parental and peer support for the schoolwork of thechildren in their classroom was very high on average.
Enjoyment of School
• According to parents, 75 percent of the study children were enjoying school at age 12, with 77percent liking their current teacher and girls slightly more enthusiastic than boys about school.
Children’s overall attitudes to school most related to maternal qualification and to a lesser extent totheir current achievement levels, with lower average scores for children who were bored orunhappy.
• The children were generally positive about school. Seventy-one percent scored highly on a factor
relating to engagement in school that drew together experiences of enjoyment, support, fairness andbelief in the value of the work of school. However, 16 percent had medium–high scores on a factorrelated to feeling distress at school, and boys were somewhat less positive than girls about schooland showed less engagement in it.
• Children who enjoyed reading and did not watch a lot of television were more likely to find schoolengaging. Distress at school, however, was unrelated to enjoyment of reading or amount oftelevision watched. Some feelings about school were associated with maternal qualification and afew with ethnicity, but there were no associations with family income and school characteristics.
• The children’s feelings about school were related to their competency levels. The feelings with themost associations were those about school work itself. Feelings about interaction with teachers,relations with peers and engagement with learning and achieving were also important. Feelingsabout their interaction with teachers were particularly related to mathematics scores.
Homework
• The children spent an average of 3.31 hours on homework, and 94 percent of parents said they orsomeone else in the house helped the child with homework. Around half the children had difficultycompleting their homework, mainly because of out-of-school interests, the difficulty of the work or
family obligations. Those children who spent at least an hour a week on homework and whoseteachers said they always completed their homework had higher average scores for the cognitivecompetencies .

li
• Just under half the children thought it very important to do homework (49 percent). The children’sviews on this matter were unrelated to their competency scores.
Doing Well at School
• Children’s ways of judging how well they were doing at school did not show clear-cut groupings interms of attributions to either their own ability or effort or in terms of extrinsic or intrinsicindications. Lower average scores were, however, evident for those children who equated doingwell with not having anything hard to do.
• At age 12, teachers were more likely than they had been at the younger ages to describe thechildren as having a sense of humour and liking a challenge. They saw around half of the childrenas mature, reliable, kind or well-behaved, an increase from previous ages, and girls more likely than
boys to exhibit these characteristics. Children whose mothers had a university qualificationappeared to be more confident overall.
• Children who were seen by their teachers as making very good or excellent progress were thosemost likely to be described as having such attributes as maturity, confidence and liking a challenge,
although some attributes (for example, kindness, having a sense of humour) were evident in muchthe same degree across all the achievement levels.
• The majority of the children had teachers who felt they could make a difference to the children’slearning. However, 37 percent had teachers who felt they could make some difference, and 8
percent, teachers who thought they could make only a little difference. Teachers felt more confidentworking with children who are already working well than with children who are struggling.
• Most parents (88 percent) said they felt comfortable talking with their child’s teacher about theirchild, but fewer were working with teachers to resolve any problems at age 12 than was the case at
the earlier ages. Associations were found between academic problems and below-average progress,but not with social-emotional problems.
• The 30 percent of parents who had reservations or were dissatisfied with their child’s progress atschool was a somewhat larger proportion than at previous ages. While these parents were likely to
work with teachers to solve problems, they were more likely to be uncomfortable talking with theteacher and to want to change something in the classroom, such as classroom resources. Parentalsatisfaction was unrelated to family characteristics, but was related to children not making progressor being bored.
Plans for the Future
• Decisions as to which secondary school a child would attend had been made or were being made formost of the children. Parents and children were tending to share the decision-making.
• Many of the 12-year-olds (59 percent) were looking forward to going to secondary school; only 15percent (twice as many of whom were boys than girls) were definitely not looking forward to doing
lii
so. Those who were not looking forward to or who felt unsure thought the work at secondary schoolmight be too hard or the social environment difficult.
School CharacteristicsAround 40 percent each of the study children were attending intermediates or full primary schools, withunder 10 percent each attending Years 7–15 secondary schools, or composite schools–mostly private. A
higher proportion of the study children were attending private schools than their peers in the Wellingtonregion.
The kind of school attended by the children related to family characteristics. Children whose mothers hadno qualification were more likely to be attending intermediates or decile 1 schools; very few of this group
were attending private schools. There was a similar trend in relation to family income. Mäori and Pasifikachildren were more likely to be attending decile 1–2 schools, and Mäori children, state schools.
There were some apparent differences for children’s literacy and logical problem-solving levels related tothe type of school they were attending. However, the patterns of distribution of school types in terms of
socio-economic characteristics were uneven: most composite schools fell into the decile 9–10 or nodecile brackets; few intermediates were decile 9–10 schools; and few full primary schools were decile 1–2. Once we took maternal qualification and family income into account, these differences were no longerevident.
We did find lower average scores for children currently attending decile 1–2 schools for mathematics andreading comprehension, over and above family characteristics. Some of this pattern may be due to howthe study children in these schools were spending their time. They were less likely to be engaging in
reading and more likely to be watching television than children attending the higher decile schools. Inestimating the range of reading age in their class, the teachers in the lower decile schools gave a lowerreading age at the bottom end of the range than did teachers of classes in higher decile schools, and a
wider range than most others. Decile 1–2 school classes in the study also had somewhat lower averageattendance, a lower average level of parental support, a higher proportion of children whose first languagewas not English and fewer small classes (under 20). However, decile 1–2 parents expressed satisfactionlevels much the same as other parents.
Private school students in this study had higher average scores for writing, after taking family income andmaternal qualification into account. No clear differences emerged in regard to children’s accounts of theirtime-use, or their attitudes to writing or their parents’ accounts of their relationship with the school that
could shed light on why this might be so; however, private school students were more likely than othersto spend a longer time on homework.

liii
Classroom CharacteristicsThe average class size of 28 experienced by the children participating in the Competent Children project
had remained constant from age 8. Class numbers were lowest in private schools and highest inintermediate schools. Sixty-seven percent of the children were being taught in composite classes, mostcovering both Year 7 and Year 8.
Only 11 percent of the children at age 12 had a single teacher for all their subjects. Almost all the
classroom teachers taught their children literacy; mathematics was likely to be taught by another teacherfor a third of the children, and science, a quarter. The specialist subjects of technology and music or artwere most likely to be taught by another teacher. However, at age 12, children’s home class teachers sawthe children’s parents just as often if they did not teach the child all their subjects as if they did.
Teachers rated the general level of parental support for the schoolwork of the children in their class asvery high on average. There were some associations with the general level of parental support in aclassroom and mathematics and the literacy measures other than the PAT Reading Comprehension.
Levels of parental support were related to the school socio-economic decile, and ownership (whether theschool was a state school, state integrated or private).
The general level of peer support in the study children’s classrooms was also rated high by the teachers.Children who were in classrooms with low ratings for peer support had lower average scores for the
social and attitudinal competencies and writing after taking family income and maternal qualification intoaccount. Levels of peer support were unrelated to school characteristics.
Attitudes to School and Teachers
Parents’ Perceptions
According to parents, 75 percent of the study children were enjoying school at age 12. Girls were slightlymore enthusiastic than boys. Children’s overall attitudes to school were most related to maternalqualification. They were also related to their current achievement levels, with lower average scores forchildren who were bored or unhappy.
It was reasonably common for children to encounter at least one teacher they did not like in their schoolcareer: 43 percent of the children had done so, and a further 14 percent had had some teachers they hadmixed views about. Seventy-seven percent of the parents reported that their child liked his or her current
teacher. Liking the teacher was unrelated to family characteristics but was related to gender. Children’sviews about their current teacher did not seem to affect their mathematics, literacy, logical problem-solving or curiosity scores. However, children were picking up something in their relationship with their
teacher that was reflected in teacher ratings of the children’s dispositions and social skills. Similar trendsemerged when we looked at the associations with parents’ reports of children’s views of previousteachers.
liv
Children’s Perceptions
Overall, the children were positive about their experiences of school: most usually enjoyed themselves;
they felt teachers helped them and they had good friends. Just over half said they usually did interestingthings at school, liked their teachers and learnt most things pretty quickly. Seventy-one percent had highscores on a factor relating to engagement in school that drew together experiences of enjoyment, support,
fairness and belief in the value of the work of school. However, 16 percent of the study children hadmedium–high scores on a factor relating to feeling distress at school.
Boys were somewhat less positive about their school experience than girls, and showed less engagement.Some feelings about school were associated with maternal qualification. There were no associations with
family income, and only a few with ethnicity. School characteristics were not associated with differencesin student views of their experiences, indicating that differences in school characteristics do not lead toquite distinct types of school experiences.
Engagement in school related to whether the children enjoyed reading and how much television they
watched. Those who enjoyed reading and did not watch a lot of television were more likely to find schoolengaging. Distress at school, however, was unrelated to enjoyment of reading or amount of televisionwatched.
Children’s views of their school experience, and reactions to it, related to their competency levels at age
12. The views with the most widespread associations were those relating to the actual work of school, andeither alienation or identification with its structure and what it offered. Views that were associated witharound two-thirds of the competency measures related to the students’ interaction with their teachers, to
peer relations and to the student’s engagement with the work of learning and achieving. All the otherviews also showed some associations. Overall, there were more associations with the social andattitudinal competencies than the cognitive competencies, and most of the associations with mathematicsscores were found in items related to student interaction with the teacher.
On comparing the children’s views of their classrooms at age 12 with their views of their classrooms atages 8 and 10, we found that enjoyment levels were lower at age 12, but so too were perceived levels ofcompetition and of the difficulty of classwork.
Problem-solving at School and Attendance
At age 12, children were still looking to teachers for help and advice if they encountered a problem intheir work. A few children said they would do nothing or give up if faced with a difficulty in a project orfinding a book in the school library.
Ninety-three percent of the study children had good attendance at school, with little difference related to
school or family characteristics. Children whose attendance was lower than others had lower averagescores for the social and attitudinal competencies but not the cognitive competencies.
lv
Homework
Children’s ViewsMost of the study children did homework at least two days a week: 57 percent said they did homeworkon four or five days, and 32 percent on two or three days each week. Nine percent said they didhomework on one day a week, and 1 percent said they never did homework. The average time spent on
homework was 3.31 hours a week. Time on homework reflected maternal qualification and familyincome levels and was slightly higher for girls. Children who did homework more often spent more timeon it overall.
Children who spent at least an hour a week on homework had higher average scores for the cognitive
competencies than those who did not. While children who thought homework was important gave itmore time, average hours spent on homework were unrelated to difficulties in completing it. Just overhalf the study children found some difficulty getting their homework done, mainly related to their ownout-of-school interests, the difficulty of the work or family obligations.
Just under half the study children thought it was very important to do homework (49 percent). However,the children’s views on the importance of homework were unrelated to their competency levels. Aroundtwo-thirds of the study children liked doing at least some of their homework, including 24 percent who
liked doing most or all of what they were given. While maternal qualification was unrelated to views ofhomework, enjoyment of reading and working with numbers was.
Teachers’ ViewsTeachers reported that around three-quarters of the study children always did their homework.
Homework completion was related to gender and levels of maternal qualification and family income, butnot ethnicity. Children who always did their homework had higher average scores on the competencies.
Parents’ ViewsNinety-four percent of the parents said they or someone else in the household gave their child some help
with their homework. This help was mostly “as needed” and consisted of provision of resources orsupervision. There were some differences in the kind of support parents gave which reflected familyresources. Projects or research were thought to be the kind of homework students got the most valuefrom, followed by mathematics.
Talking about School at HomeThree-quarters of the study children talked to their mothers most about their school experiences; 28percent talked to their fathers. These children were almost twice as likely to talk about schoolwork itselfas about social activities or interesting or unusual events.
lvi
Children’s Views on Doing Well at SchoolThe children’s ways of judging how well they were doing at school did not show clear-cut groupings in
terms of attributions to either their own (unchanging) ability or effort, or in terms of extrinsic or intrinsicindications. While we found that children who performed below average according to their teachers weremore likely than those who were doing well to use ease and diligence as signs of doing well, they werejust as likely as others to also see their achievement in terms of understanding.
The children with lower achievement were just as likely as others to get excited by understanding,thinking about things or getting a new idea about how things work. Boredom and lack of challenge werejust as likely to be cited as reasons for dissatisfaction by parents whose child’s achievement was below
the average level as by parents of children achieving at the top level. This suggests that while lowperformers need tailored attention focused on the particular aspects that they find difficult, they also needstimulation and the opportunity for understanding and connection (rather than “the basics” only).
However, there were indications that children whose family resources may disadvantage them in terms of
school experience put more emphasis on extrinsic signs and the ease with which they could do a task toguide them on how well they were doing at school. This would put them at a further disadvantage, giventhat we found lower average scores on the competency measures for those who saw doing well at schoolin terms of not having anything hard to do.
Teachers’ Overall Assessments of Children’s PerformanceThroughout this study, teachers’ overall assessments of the study children’s overall performance have notgiven patterns of normal distribution (the Bell-shaped curve) at any age, including age 12. The teachers
have placed fewer students as below average than one would expect from a normal distribution. Thissituation may simply reflect the particular nature of this sample, which has a higher proportion than foundnationally of children from homes with high levels of maternal qualification and income. However, there
are implications for communication with parents if “average” is used as a benchmark in that parents andteachers have different understandings of what this term means. Interestingly, teacher assessments of thestudy children’s mathematics performance relative to their class level gave more of a normal distributioncurve than their views of overall performance.
The categories the children were assigned to by their teachers are consistent with the children’sperformance on the Competent Children’s Project competency measures, with clear linear gradationsbetween each category for the cognitive competencies, which were tests done by the children, as well asthe ratings given by teachers for the social and attitudinal competencies.
Teachers’ overall assessments of how the study children were doing at school also reflected the children’shomework completion, attendance, health and happiness, their particular strengths and difficulties relatedto the curriculum, their level of engagement in school and their experience of distress (as given by the
children). They did not reflect differences in school characteristics, but did reflect teachers’ perceptions ofthe level of home support for a child, maternal qualification, family income, gender and, to a lesserextent, ethnicity.
lvii
Curriculum Strengths and DifficultiesAccording to their teachers, 95 percent of the study children had at least one area of strength in their classcurriculum. Some differences relating to gender and maternal qualification emerged, but family incomeand ethnicity were largely unrelated to perceptions of curriculum strengths, as were school characteristics.
Around two-fifths of the study children were seen to have strengths in reading, mathematics or physicaleducation.
Forty-two percent of the study children had no areas of difficulty in the class curriculum. Around a fifthhad difficulty with spelling, mathematics, handwriting or story writing. Difficulty was more likely to beexperienced by boys and children whose mothers had no qualification.
Behavioural Strengths and DifficultiesAt age 12, around half the children were seen as mature, reliable, kind or well-behaved, an increase fromprevious ages. At age 12, the study children were more likely to be described as having a sense of
humour and liking a challenge than they were at younger ages. There were some differences in gender(girls were more likely than boys to be seen as mature, reliable, well-organised and tolerant), and fewerrelated to maternal qualification, indicating greater confidence among children whose mothers had auniversity qualification.
Teachers’ overall views of the children’s achievement related to some of these behaviours. Childrenwhose achievement level was seen as very good or excellent were twice as likely as those assessed asmaking average or below average progress to be described as having strengths of maturity, independence
or confidence, and three times as likely to be seen as organised and able to concentrate, or as leaders.They also were most likely to be seen as being reliable or sensible, creative or innovative and to like achallenge. However, the qualities of kindness, warm-heartedness, tolerance, patience, willingness and of
being well-behaved, trying hard, having a sense of humour and being happy or at ease were evident inmuch the same degree for all achievement levels.
Around a fifth of the study children were seen as having poor work habits, being passive or having lowself-esteem. Boys were more likely than girls to be seen as being immature or having poor work habits.
Those children who were assessed as making less than average progress overall were around four timesmore likely to be seen as aggressive, three times as likely to have poor work habits and to be immature oreasily led astray and twice as likely to be seen as living in their own world, having low-self-esteem and
being unreliable. Bossiness, rudeness, being self-centred and not trying were found at much the samelevels across all achievement levels.
Children’s Likely Highest QualificationOnly 15 percent of the study children were thought likely to achieve a school level qualification, or none,
as their highest qualification. Twenty-one percent were thought likely to achieve a postgraduateuniversity degree, 38 percent an undergraduate university degree, 16 percent a tertiary diploma and 8percent a trades qualification. Views of the children’s highest qualification level were linked to views of
lviii
their overall progress at age 12. They also reflected differences in gender, family characteristics andschool characteristics.
Some obstacles to children achieving this likely level were seen for 64 percent of the study children. Poorself-management, low self-esteem, a greater interest in other things and more interest in being popularwere the main obstacles identified. Like parents, teachers saw more obstacles for boys in achieving the
highest educational level they appeared capable of, with the obstacles located in their attitudes and whatthey wanted to do. Teachers also considered children from homes with fewer family resources as facingthe greater obstacles.
Teachers making a difference for children
Home support and resources seem to be factors in teachers’ perceptions of children’s progress at schooland in their likely future progress. Gender also plays a part. This is probably why not all the teachersthought they could make a lot of difference to the study children’s learning. Fifty-five percent of the study
children had teachers who thought they could make a lot of difference to their learning, 37 percent hadteachers who felt they could make some difference, and 8 percent had teachers who felt they could makeonly a little difference.
However, when we directly cross-tabulated teachers’ views here with gender and family characteristics,
we found no associations. What does seem to matter more is children’s overall level of performance intheir class; family characteristics and gender therefore play a “backroom” role rather than a directive rolein teacher views about the efficacy of their teaching. This shows us that teachers feel more confident in
working with those who are already working well, and less comfortable about their ability to improve theperformance of those who are struggling, a consideration that has implications for the kind of support thatteachers need to be given if we are to raise the level of achievement overall, and to reduce the gapsbetween those who are in the “long tail” of underachievement and those who are not.
Home support for children’s learning at school
Teachers’ PerspectiveSeventy-five percent of the study children were thought by their teachers to be getting very good support
or better from home for their work at school. Teachers’ views of the children’s home support reflectedfamily income and maternal qualification levels but not ethnicity. The proportion of study childrengetting maximum home support was much the same across differences in school deciles and in schoolownership.
One source of information that teachers use to gauge home support may be student achievement; anothermay be whether they have regular contact with children’s parents (where there is interaction between thetwo realms). Where children were seen as having very good or maximum home support, teachers were
more likely to think they could make a lot of difference to their learning and less likely to see difficultiesin these children achieving their full potential in education.
lix
The parent that teachers had usually interacted with throughout the study was the mother, but at age 12,
the teachers had less regular contact with mothers than previous teachers: they saw 27 percent of themothers of the children regularly, compared with 38 percent at age 10 and 43 percent at age 8. They hadnever met either parent of 11 percent of the study children. Patterns of teacher contact with fathers, whichwere less frequent, were much the same at age 12 as they had been since age 8.
The higher the level of maternal qualification, the more likely the teacher was to see the mother regularly.Student gender, ethnicity and family income were unrelated to how regularly teachers saw mothers, butthey were more likely to have no relationship with mothers from low-income homes. The teachers saw
28 percent of their relationships with parents as either less than good or non-existent. On the whole,despite some broad decile-related differences, any differences in the parent–teacher relationship reflecteddifferences in maternal qualification, parents’ likely ease in formal educational environments and their
interest in education. There may be some confounding here with children’s achievement levels, sincethese tend to reflect maternal qualification levels at the extremes.
Parents’ PerspectiveEighty-eight percent of the parents said they felt comfortable talking with their child’s teacher about their
child. Seven percent said they had not met their child’s teacher. Fewer parents worked with teachers toresolve a child’s problem at age 12: 43 percent compared with 50 percent at age 10 and 65 percent at age8. The problems were almost evenly divided between academic issues and social-emotional problems.
Academic issues were more likely to be raised by the parents of children who were making below-average progress (although not all of them); social-emotional problems were unrelated to children’sprogress.
Sixty-nine percent of the parents expressed satisfaction with their child’s progress at school; 20 percent
had some reservations. Ten percent were dissatisfied, a somewhat larger proportion than at previous ages.Parental satisfaction was unrelated to family characteristics, but was related to children not makingprogress or being bored.
Parents who were dissatisfied or whose satisfaction was qualified were more likely to work with teachers
to solve problems. However, they were also more likely to be uncomfortable talking with their child’steacher about the child and to want to change something in the classroom. A quarter of those who weresatisfied with their child’s progress also said they would like to change something in their child’s
classroom. Twenty-nine percent of the parents wanted to make some change; a further 9 percent wereundecided. The most frequent changes desired were changes to class programme or resources.
While children whose parents had been dissatisfied with their progress two years earlier were more likelyto have lower average scores at age 12, there were also low scorers in the group whose parents were
satisfied with their progress. Just under half of those whose parents expressed satisfaction with theirprogress scored below the median for the study measure of mathematics and the PAT ReadingComprehension at age 12. Nonetheless, the higher the teacher’s assessment of child’s overallachievement, the higher the level of parental satisfaction.
lx
Maternal qualification was unrelated to parental satisfaction with their child’s progress or comfort talking
to the child’s teacher, joint parent–teacher effort to sort out problems, parents talking to their child aboutschool or parents’ views of their child’s attitude to school. However, interest in changing something abouttheir child’s class was highest for families where the mother had a university qualification (38 percent)and lowest in those with no qualification.
Most parental involvement in their child’s school consisted of parent–teacher interviews. A third of theparents had done voluntary work at the school, but only 8 percent of this was taking place in classroomsby age 12, down from 17 percent at age 10 and 42 percent at age 8. Maternal qualification levels related
to voluntary work, in and out of classrooms. We found no associations between competency scores andthe total number of kinds of parental involvement in a child’s school. However, there were someassociations between specific forms of parental involvement in the child’s school: voluntary work in the
school was associated with higher mathematics and communication scores for the children of parentswho did this; lack of involvement with lower mathematics scores. These patterns suggest the importanceof the different signals that children can receive about the value of education, as well as parental comfortin the formal educational environment.
Selection of Secondary SchoolSecondary schools had been selected or narrowed down two or three schools for 91 percent of the Year 8students and for 84 percent of the Year 7 students. Twenty-seven percent of those who had selected
private schools and 24 percent of those who had selected state integrated schools were already attendingthese schools.
The school characteristics of the secondary schools that their children would attend were similar to thosementioned by parents who had made their selection when their children were younger. However, there
was a decrease in the proportion choosing decile 9–10 schools and a corresponding increase in thosechoosing schools in the adjacent decile 7–8 band. This shift may reflect the reality of school enrolmentpolicies.
In relation to family income and maternal qualification, differentiation in the patterns of primary school
chosen occurred largely at the ends of the socio-economic decile spectrum and in relation to privateschools. The same pattern was evident with choice of secondary school for the study children at age 12.However, there were still substantial proportions of parents from low-income families and those where
the mother had no qualification who wanted their child to attend a decile 9–10 school. Very high-incomefamilies deciding on a non-state school were likely to favour a private school; high-income and Pasifikafamilies were more likely to opt for state integrated schools. Two or more schools were more likely to bebeing weighed against each other by those families where the mother had a post-school qualification.
Deciding which secondary school to attend was largely a shared process, although students were morelikely to see this decision as shared with them than their parents did, or up to them alone. Parents weremore likely to make the decision on their own in families where the mother did not have a post-schoolqualification. This also appeared to be the case for Pasifika children.
lxi
Parents were twice as likely as the age 12 children to mention a good reputation as one of their main
reasons for their choice of secondary school and somewhat more likely to mention the proximity of theschool. Just over a quarter of both parents and children mentioned family tradition, and just under aquarter of each group the fact that friends of the child would be going or were already going there. Noassociations were found between the reasons given and who was involved in the decision-making.
Maternal qualification levels were not reflected in the reasons given by children for the choice ofsecondary school, but family income was, with school reputation more likely to be mentioned more bythose with high or very high incomes. School reputation was also more likely to be mentioned as a major
reason by those going on to decile 9–10 schools: this was the only difference in reason related to schoolsocio-economic decile. Children going on to private schools were more likely to mention reputation;those going on to state schools, proximity; and those going on to state integrated or private schools,religion.
Family income differences were not reflected in the most frequent reasons that parents gave for choice ofsecondary school, but were if the reasons related to the school being single-sex and/or of religiouscharacter. Single-sex schools were more likely to be chosen for daughters than sons. Maternal
qualification was largely unrelated to parental reasons for choice of secondary school, although the schoolchoices made for the child’s friends were mentioned most in relation to children whose mothers had auniversity qualification. Among parents, there was no association between school decile and schoolreputation.
On the whole, the existing differences in patterns of current school attendance relating to differences infamily resources look set to continue in the secondary schools attended by the study children. However,differences in family resources do not figure substantially in the reasons given by parents and children for
choice of secondary school. While there were some expected differences, they were not consistent acrossboth parents and children, nor were they clear-cut in relation to school decile.
Children’s Attitudes to Secondary SchoolFifty-nine percent of the 12-year-olds were looking forward to going to secondary school, but 26 percent
were fluctuating or unsure in their response to this change. Only 15 percent were definitely not lookingforward to moving on to secondary school. Boys varied more in their feelings, but twice as many girls asboys were not looking forward to secondary school.
The main reasons why students felt positive about going on to secondary school were that they felt ready
for a change, thought they would learn interesting things or have more challenge and would have morechoice and be more independent (22 percent). Those who were not looking forward to secondary school,or who felt unsure about it, thought the work could be too hard or feared the social environment of the
secondary school. Thirteen percent felt confused about moving on and said they did not know what toexpect.
lxii
Parental Aspirations for Children’s EducationHalf the children’s parents wanted their child to definitely have a tertiary education; only 4 percent said
they would settle for secondary school only. Parents’ aspirations reflected ethnicity, maternalqualification and family income levels. Mäori parents were less likely to aspire to university or othertertiary education for their child, as were parents where the mother had no qualification.
The latter tended to be more aware of the costs of post-school education as a potential obstacle to their
child getting the education they would like them to have. The main obstacles that parents saw as standingin the way of their aspirations for their child’s education were the child’s own choice; lack of money; andthe child’s attitude or temperament; with boys seen as more prone than girls to not realising their parentalaspirations through their own choice or attitude.
Aspirations for the children at age 12 that included tertiary education were highest among the very high-income families and those where the mother had a university qualification.
Forty-five percent of the parents said they were saving for their child’s post-primary education, a slightincrease from the 40 percent at ages 8 and 10. Saving was most likely to be occurring for children whose
mothers had a university qualification, in the very high-income families and in Pasifika and Asianfamilies.
Occupational interests and expectationsAround a fifth of the study children were interested in professional occupations and in sports. Only 7
percent of the children could not think of an occupation that they would like to do as an adult. Maternalqualification and family income levels were not significantly related to parental views of what wouldinterest their child, although there were definite trends, notably more mention of professional occupations
and science for those with mothers with a university qualification. Science was also more likely to bementioned by children from very high-income homes. The uniformed services appealed more to thosechildren whose mothers had a school-level qualification, or none. Gender made some difference to theparents’ ideas of future occupations, but not the children’s.
lxiii
Some overall messages
The role of family resourcesLike many other studies of children’s development that have collected data on family resources as well as
school and class-level data, we have found that family resources play a major role. They do not operate ina rigid manner, nor do they relate to children’s competency levels in a lock-step fashion, with everysingle level of family income or maternal qualification corresponding with a higher level of performanceby children on the cognitive competencies.
However, a comparison of the proportions of children scoring at or above the median for reading andmathematics at age 12 for different family income levels when the study children were nearly age 5shows around a third of those who came from low-income homes, around half of those from medium-
income homes and around two-thirds of those who came from high-income homes scored at this level.The range is wider in relation to maternal qualification. Around a fifth to a quarter of the study childrenwith mothers with no qualification scored at or above the median for reading and mathematics at age 12
compared with around half for those children whose mothers had a school level, trade or tertiary levelqualification, and around three-quarters to four-fifths of those whose mothers had a universityqualification.
Our final statistical modelling, using two different methods, gave consistent and complementary pictures
about the importance of language experience and use in everyday life, from an early age. Languageexperience and use is important for the development of not just comprehension in reading, but also ofunderstanding and reasoning skills in mathematics. Language use and experience is also related to
engagement in school or the ability to make the most of what schoolwork and school interactions have tooffer. And they are related to family resource levels, particularly maternal qualification levels.
Many activities, behaviours and experiences are associated with advantage in terms of family resources.These include a greater use of reading and enjoyment of it and more time spent in activities that are likely
to extend knowledge, analytical skills and communication skills. Some of these activities do not comecheaply, such as the performing arts. Other experiences include a greater parental interest in theirchildren’s education, an interest that is more likely to be informed by the parents’ own educationalexperiences and confidence. And it includes more support for children to be assertive.
By treating family income and parental qualification levels separately rather than as components of acomposite socio-economic status, we have been able to show that these factors do operate somewhatdifferently. Higher maternal qualification levels can act as a buffer for some of the disadvantages of low
family income, but less so in reverse. This may be because so many activities and experiences that co-occur with having some form of maternal qualification, particularly at the upper end, are those that co-occur with engagement with the work of the school, particularly around reading and use of language incommunication.
lxiv
The role of participation and engagementThere are also many similarities in the way that children from different backgrounds spend their time,
react to adults and peers and identify what is important to them. Although children whose mothers had ahigh qualification were likely to watch less television than those whose mothers had no qualification, theydid watch some television, and their tastes in programmes were not clearly distinctive. Differences inchildren’s activities and engagement related more to gender than to social class.
Children who were struggling with school, in a spiral of lack of achievement and lack of engagement(feeling supported, having trust, having interesting things to do), came from all family backgrounds.Children who had been bullied, experienced isolation, had poor social skills and who struggled to gain
more positive meaning out of friendships also came from all family backgrounds. Gender was moreimportant than family resources in relation to performance in the social and attitudinal competencies.What matters in the work of teachers and parents to arrest such negative spirals of reinforcing experience,
actions and reactions is not so much children’s social backgrounds as their specific needs and the patternsof experiences and habits needing to be reshaped.
The roles of current and early experiencesA longitudinal study can also compare the contribution of current and earlier experiences. Two striking
findings relate to the importance of children’s early experiences for their later performance. The firstconcerns the continued contribution of aspects of early childhood education, and the fact that some ofthese had grown over time rather than diminished. Second is the greater contribution that family income
levels in these early years had made to children’s later competencies, more so than current or improvedfamily income levels during the seven years following.
These findings indicate that when weighing up the costs of providing support for children in their firstfew years, and therefore for their families, we need to take a long-term view. It seems that some of the
ground lost for some of the children in this study in those early years is very difficult to regain in lateryears. Children from homes with high maternal qualification found it easier to make up this ground thanothers. It is of concern that not only was it harder for children from homes with low levels of family
resources to make up this ground, but also that children from these family backgrounds who had beenearly high performers were more likely to lose ground over time.
The difficulty of catching up was particularly marked in relation to mathematics. This may be because ofthe nature of mathematics, or it may be that we have historically as a country and education system putmore emphasis on reading and the teaching of reading.
While this study points to the early years, before children reach school, and then the first three years ofschool as providing the best window of opportunity for children to gain solid foundations for continuedlearning, it also shows that adult responses to children’s lack of engagement, lack of performance or their
being upset is not age-limited in terms of making a difference for individuals. More children than weexpected from our analysis of performance at earlier years moved from low levels of performance at age
lxv
10 to performing at or above the study median at age 12. Most parents of the study children had workedwith their child’s teacher at some stage to sort out difficulties their child had experienced.
What is of concern is that teachers of the study children at age 12 were less confident that they couldmake a difference to the learning of children who were struggling in their learning. This underlines theimportance of the government’s strong emphasis on providing more curriculum, pedagogical and
assessment leadership and resources to support teachers in their work with students, and the need toensure that learners who are struggling are a priority in this support. We also need to ensure that engaginglearning experiences are available for students who have fewer home resources than others tocomplement and support the work of school.
The importance of understanding cumulative experiencesMuch of the analysis of “risk” and “resilience” among children emphasises both the co-occurrence of riskand supportive factors, and the need to see risk and resilience in terms of clusters of co-occurring factors
rather than single decisive factors. The value of a longitudinal study such as this one is that it can showhow this compounding in terms of occurrence happens through time, and that an accumulation of positiveor negative experiences can tip a balance.
For example, the children in our study who had experienced just a few changes of school by age 12 were
unaffected; it was the children who had experienced more than four schools by the age of 12 who showedsome areas of lower performance. We also found class size at age 12 to be unrelated to children’scompetency levels. It was only when we looked at experiences of class size over time that we could see
trends. The amounts of time that the children at age 12 were spending watching television showed fewerassociations with children’s competency levels than did the cumulative amounts. By not limitingourselves to current data only, we gain a greater understanding of the relationships between children’sexperiences and opportunities and their performance.
Finally, many of the study children had been upset at different stages of the times when we talked withtheir parents, but very few were upset at every stage and most had or were coping with being upset.Around half the study children had had a teacher they did not like, but this had not affected their
performance at age 12. For many of the study children, life had been a mixture of beneficial and lessbeneficial experiences. We cannot ensure that children have only beneficial experiences, but we can takeaction so that they have enough of them, a critical mass, to make the difference.

lxvi
1
Section One
Introduction
The Competent Children study began in 1992 with a pilot study. Data collection for the study began in1993, with full material collected for 307 children (the “original” sample), and a “light” survey collecteddata from parents and early childhood education centres on a further 767 children. The children were all
in their last months of early childhood education, and were close to age 5. When the “original” samplewere aged 6, we undertook further data collection for them.3 Then at age 8, we added 242 children fromthe light survey to increase our sample size, giving a total of 523 children for whom we collected data.
We followed up this larger sample at age 10, with 507 children. A full record of the reports from thestudy and associated papers is available on the NZCER website, www.nzcer.org.nz. The project has beenfunded by the Ministry of Education, with some additional funding from NZCER and at the age-10phase, the then Ministry of Social Policy.
This present report is based on the data collected when the children were aged 12, and included 496children. At each stage we have provided descriptions of the study children’s current experiences,perceptions, and competencies, as well as using the data and analysis of earlier phases to shed light on
children’s development over time, and the role in this development of early childhood education,children’s experiences, family resources, and school experiences.
This report aims to provide an overall picture of what is a reasonably comprehensive set of the differentkinds of factors which can influence children’s development. The set of factors included in the age-12
phase of the Competent Children project is based on our previous findings, the research questions givenbelow, a scan of relevant research literature to identify factors which may be more specific to this age-group, and on the aim of providing a base-line for a focus in the next phases of the study on the children’s
experiences of adolescence. Our comparison of our findings with those of other studies is mainly in termsof identifying the major patterns and trends which emerge over time. There is much more that can bedone in terms of providing a rationale for the factors included and of delving more deeply into particular
3 An account of the development of the study, instruments, and some of the issues with the original study designand sample arising over time, is given in Wylie (2003a).

Section One
Introduction
2
aspects, but to do so in a single report would make this a mammoth task for both the research team and
our readers. We will be pursuing some of these aspects in a range of different articles for peer-reviewedjournals and popular versions aimed at a more general readership.
This particular phase of the Competent Children project focuses on the following research questions:
1. Is there a set of core competencies at age 12? How do these relate to those identified earlier in theCompetent Children project?
2. How predictable are children’s competency levels at age 12 from their earlier competency levels at
ages near-5, 6, 8, and 10? Are there different trends for different population sub-groups and differentcompetencies? To what extent are these results modified by school experiences, home resources andsupport, and children’s activities?
3. What differences in children’s competency levels at age 12 are attributable to stability or change incumulative resources and experiences since near age 5?
4. Does early childhood education experience continue to have an impact at age 12? If so, whichaspects remain important?
5. What weight do these aspects of children’s lives play in their competencies compared to each other:family resources, school experiences, home-based and out-of-school activities, and early childhoodeducation experiences?
6. How are children’s earlier competency levels in social skills, parental and teacher reports of theirattitude to school and relevant school behaviour related to their experience at age 12 of their peers(including bullying), and the pattern of their peer relations outside school?
7. How are children’s earlier competency levels in perseverance, communication, and individual
responsibility, parent and teacher reports of their dispositions and ability to cope with problems,related to their competency levels at age 12, and their attitudes to school, including motivation andengagement?
8. How are children’s attitudes to school, including motivation and engagement, their problem-solving
approaches and competency levels at age 12 related to the pattern of their peer relations in andoutside school?
9. What consistency is there between the child’s school progress and children’s judgments of theirschool experiences, parental satisfaction with their child’s school, their involvement in the child’s
school, and teacher perceptions of the child’s school engagement, their relations with the parents,and parental support for the child?
10. Do different population sub-groups show different patterns of school choice and satisfaction withtheir child’s school progress?
As the study children were now in their early adolescence, there was more of an emphasis in this phase
on collecting data on the children’s friendships and aspirations. We have gathered this data to see how
Section One
Introduction
3
friendships and aspirations at age 12 related to children’s competency levels, and to provide base-line
information so that we could track changes in patterns of peer relations and aspirations and factors thatmight affect them as the study children move through adolescence, and any enduring or emergingassociations with their competency levels and school and other achievements in later phases of theCompetent Children project.
The choice of material that we collected was based on existing research (both findings and aspects whichemerged from analysis as needing more attention), the questions we had used in earlier phases of theCompetent Children project, to allow comparison over time, and the main research questions for this
phase. We also undertook focus groups with students, parents, and staff at 3 Wellington schools indifferent socio-economic areas to check some of the items we proposed to cover, and to gain moreunderstanding of specific aspects so we could word our questions appropriately. Many of the questions
we asked in the age-12 phase, for children and parents particularly, were open-ended, and captured bothin the words given and by the interviewer using pre-coded categories on the interview schedule.
Study sample
The original Wellington region sample was chosen in terms of providing sufficient numbers of childrenin each of the 3 main types of early childhood education other than te köhanga reo, with as many as wereavailable from family day care and the few existing a’oga amata in the area.4 It was not chosen to be
representative of the family characteristics of the Wellington region population of near-5-year-olds. Theabsence of the ngä köhanga reo in the study5 accounts to some extent for the under-representation ofMäori children in the study, as shown in the table following. There is also an under-representation of
children from Pasifika homes. The Competent Children sample is under-representative of low-incomefamilies, and over-representative of high-income families (to some extent reflecting the higher thanaverage national income levels in the Wellington region). The sample under-represents women (parents)
with school-level qualifications, and over-represents those with trade or tertiary level (other thanuniversity) qualifications, compared with the overall New Zealand population.
4 Full details are given in the Competent children at age 5 report.
5 Köhanga reo are Mäori medium early childhood education centres which are centred around the revitalisation ofMäori language and tikanga. Because of these differences with English-medium early childhood education types,a parallel study with differences in instruments and approach was discussed with the Te Köhanga Reo NationalTrust. If funding could be found, there was some interest in this possibility, but capacity building and managingthe growth of köhanga reo were then the priorities for the Trust.
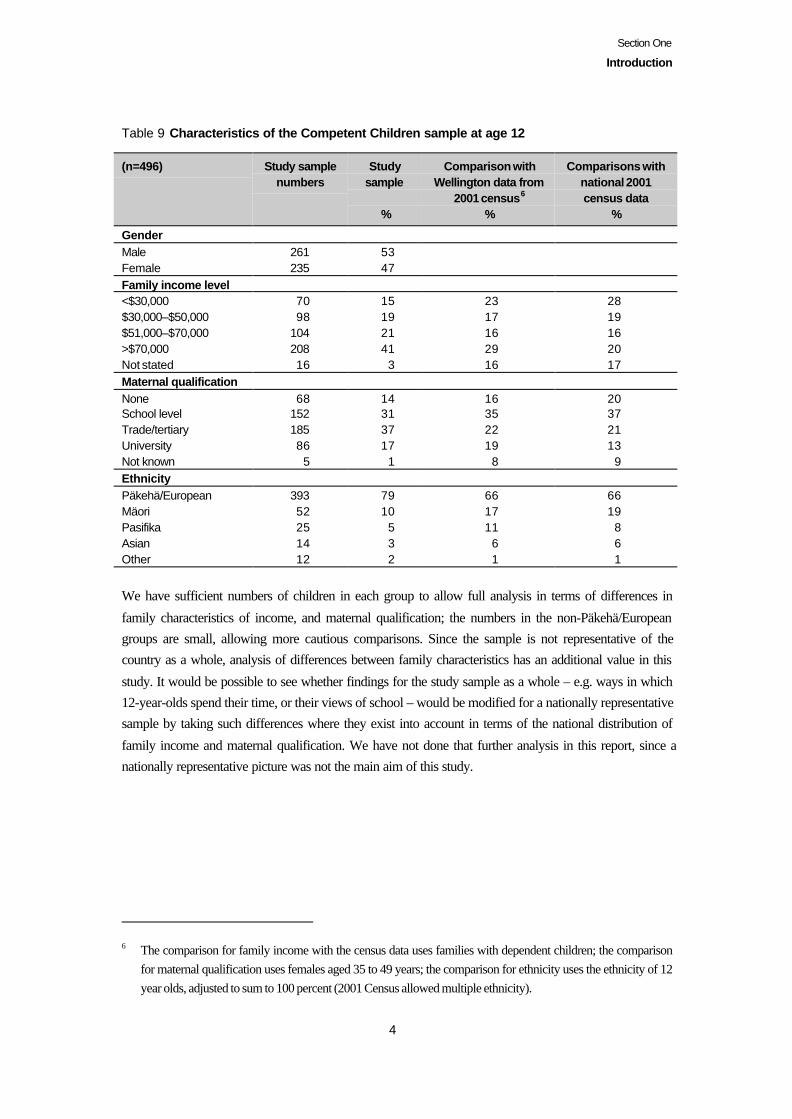
Section One
Introduction
4
Table 9 Characteristics of the Competent Children sample at age 12
(n=496) Study samplenumbers
Studysample
%
Comparison withWellington data from
2001 census6
%
Comparisons withnational 2001census data
%
GenderMale 261 53Female 235 47Family income level<$30,000 70 15 23 28$30,000–$50,000 98 19 17 19$51,000–$70,000 104 21 16 16>$70,000 208 41 29 20Not stated 16 3 16 17Maternal qualificationNone 68 14 16 20School level 152 31 35 37Trade/tertiary 185 37 22 21University 86 17 19 13Not known 5 1 8 9EthnicityPäkehä/European 393 79 66 66Mäori 52 10 17 19Pasifika 25 5 11 8Asian 14 3 6 6Other 12 2 1 1
We have sufficient numbers of children in each group to allow full analysis in terms of differences in
family characteristics of income, and maternal qualification; the numbers in the non-Päkehä/Europeangroups are small, allowing more cautious comparisons. Since the sample is not representative of thecountry as a whole, analysis of differences between family characteristics has an additional value in this
study. It would be possible to see whether findings for the study sample as a whole – e.g. ways in which12-year-olds spend their time, or their views of school – would be modified for a nationally representativesample by taking such differences where they exist into account in terms of the national distribution of
family income and maternal qualification. We have not done that further analysis in this report, since anationally representative picture was not the main aim of this study.
6 The comparison for family income with the census data uses families with dependent children; the comparisonfor maternal qualification uses females aged 35 to 49 years; the comparison for ethnicity uses the ethnicity of 12year olds, adjusted to sum to 100 percent (2001 Census allowed multiple ethnicity).
Section One
Introduction
5
Attrition rates
549 children in total have taken part in the study. The characteristics of those who remained in the studyat age 12 and the 53 who had left were compared to see if there were any differences in terms of familyincome, maternal qualification, gender, and ethnicity. There were no significant differences, with one
exception. There has been a higher attrition rate among Pasifika children (17 percent compared with 10percent overall). Family movements out of New Zealand have been one of the main reasons for childrenleaving the study.
When they were 12, 454 (92 percent) of the children remaining in the study were still attending schools in
the Wellington region. Forty-two children lived in other parts of the country: 33 in the North Island, and 9in the South Island. Fifteen had gone to live in the Auckland region, 8 in the Manawatu-Wanganuiregion, 5 in the Canterbury region, and 4 in the Bay of Plenty.
Of the 307 in the “original” sample at age 5, 268 remained at age 12 (87 percent). Of the 242 who joined
the study at age 8, 228 remain (94 percent). For the “original” sample, data collection included: at theirfinal early childhood education centre, ratings of its quality, observation of child behaviour, andinterview-based material; material from the children themselves, including tasks to assess competencies,
and ratings of the children’s social and attitudinal competencies from their early childhood educationteachers. There was also material from children, parents, and teachers when the children were aged 6,after their first school year. For those who joined the study at age 8, we have some age 5 material which
was collected in a “light” survey at age 5 (collecting data from parents by phone, and from centres bysurvey).
We checked whether there were differences in scores for early literacy and mathematics competencymeasures at age 5 between those who had left the study and those who remained; there were none,
indicating that those remaining in the study continue to be representative of the original study sample interms of competency scores as well as family characteristics. We also did this same analysis with themathematics and PAT Reading Comprehension test scores at age 8 for the children who joined the studyfully at age 8, with the same result.
Notes on the report
The material from parents, students, and teachers is largely of their own perceptions and reporting. To
keep the report readable, we have not continually repeated the source of all the findings (as in “theirreport of”). where people are reporting on their own experiences and activities. We have tended to notethat people are giving us perceptions when they are describing their impression of another’s reaction, forexample, parental reports of how children feel about school.
Appendix 1 gives a full description of the statistical methods used in this report, including a glossary ofstatistical terms used. Please refer to this in reading the report, since we have not repeated thesedescriptions or definitions in the text of the report. In the descriptive findings, we have reported
Section One
Introduction
6
differences between groups or characteristics if they were significant at the p < 0.05 level. We have also
reported differences whose p-value is slightly above this (.06 or .07) where the results are consistent withother findings, and where it seems possible that the results would have been significant with a largersample.
In our reporting of ANOVA analysis of the relationships between children’s competency levels and
particular factors, we have reported results that remain significant (here at the p < 0.01 level) after firsttaking into account maternal qualification levels and family income levels at age 5, separately. We usedfamily income levels at age 5 rather than current levels of family income because we found stronger
associations with children’s competency levels with the earlier rather than current family income levels inthis phase as well as previous phases of the project. The fact that a factor does not continue to showsignificant associations with a competency after taking into account these two strong aspects of the
resources available to children indicates possible links between these aspects of resources and theparticular factor, and may well be describing elements of income or education which have an effect inrelation to the competency.
The income levels used in the descriptive material are less than $30,000 (also sometimes referred to as
“low” income), between $30–60,000 (sometimes referred to as “middle” income), between $60–80,000(sometimes referred to as “high” income), and above $80,000 (sometimes referred to as “very high”income). We have used 4 levels of maternal qualification in the descriptive analysis, but 5 for theANOVA analysis of the relationship of this factor with the study children’s competency levels.
Report structureThe first section of the report describes the children’s competency levels on the measures we used, looksat relations between the competencies, both current and in relation to previous scores, and then concludes
by looking at whether there are different trends for children’s movement over time in terms of gender,family income levels, maternal qualification levels, and ethnicity. This section covers the first 2 researchquestions for this phase of the project.
In the next section, we cover the third research question, looking at the relationship between children’s
age-12 competency levels, and cumulative patterns or “history” of children’s experiences for some keyfactors.
We then focus on an analysis of the associations between the children’s early childhood educationexperience, and their competency levels at age 12, covering the fourth research question.
The next section provides descriptions of children’s current experiences at home, with peers, and at
school, and analysis of some of these with their current competency levels. The remaining researchquestions are covered in these sections.

Section One
Introduction
7
The final section gives a number of multifactor models to give a more specific answer to the fifth
research question, and draws together the separate threads from the different sections of the report in anoverall conclusion of the ways in which children develop, the roles of their different experiences, and theways these experiences are combined.

8
Section Two
The children’s competencies at age 12
The competency measures
In this section, we look first at the study children’s scores on each of our competency measures at age 12,with some description of trends in particular items making up the competency measures. Then we look atthe relationships between the competency measures at age 12.
The selection and development of the measures in this study have been described elsewhere (Wylie,
Thompson, and Kerslake Hendricks, 1996; Wylie, 2003a). Because of the period of growth covered inthe children’s lives, it has not been possible to use the same measures in every phase of the study,although we have kept the same items and tests as much as possible. The reliability of each of the
measures (the degree to which the scores on each of the items within it are associated with the total scorefor the measure) has been above 0.7 for all measures other than Social Skills with Peers.
We have made some changes to individual items within each competency measure as the study childrenhave grown. At age 12, we changed 2 of the 5 items within the measure of Individual Responsibility, 4 of
the items within the measure of Communication, and one each within the measures of Curiosity andSocial Skills with Peers. We added a new item to the measure of Communication, and withdrew onefrom the measure of Social Skills with Adults.
Teacher-rated competencies
Communication, Curiosity, Perseverance, Individual Responsibility,Social Skills with Adults, Social Skills with Peers
The teachers had taught the individual children in the study for an average of 7.3 months, with a rangefrom 1 month (3 percent) to 4 years or more (4 children). The average age of the children when theirteachers were interviewed was 12 years, with a range from 11 years 10 months ( 3 percent) to 12 years 6months (one child).

Section Two
The children’s competencies at age 12
9
For these 6 competencies, teachers rated children by matching a set of statements related to each
competency area to the child, using a 5-point scale, which we then converted to a numerical rating:always (5); often (4); sometimes (3); hardly ever (2); never (1). The scores for each of the items withineach of the competency measures were added together, and converted into percentages to give an overallrating.
We look at each of these competencies in turn, giving scores on the individual items used to measurethem.7 Our focus is mainly on those items where more children scored at the top end of the scale, andthose items where more children scored at the lowest end of the scale, and on trends over time in thescores in each item.
Then we look at how well a child’s score on an item matched their score on another item used for thesame competency measure. If each child in the study had the same individual score on each of the 2 itemsbeing compared, that would give a correlation of 1 (written as r=1). This would be the strongest possible
correlation. A correlation of below 0.3 means that there is practically no match in the scores on the 2items being compared. We were not seeking high correlations between the items, since we wanted amultidimensional measure, with each item giving insight into a different aspect of the competency area.
CommunicationThe measure of Communication covered receptive language, or listening skills, and expressive language,or speaking skills. At age 12, we included 5 items for each of these 2 dimensions of Communication.Previously, we had had 4 items for speaking skills. The Communication measure had stayed much the
same from age 5 to age 10. At age 12, we undertook some revision, adjusting the wording to ensureclarity, splitting one item which asked about both explanations and descriptions into one about the clarityof explanations, and one about the clarity of argument. We also dropped 2 items which some thought
were too dependent on contextual opportunities for children, or difficult for teachers to know about.These items focused on children’s experimentation with language, and on the ease with which theirspeech was understood, even by strangers. The reliability of the measure was 0.90.8
As at earlier ages, the study children’s listening scores tended to be higher than their speaking scores.
Around three-quarters or more always or often understood the information their teacher gave them inclass, asked for something they did not understand to be repeated or explained again, and followedconversations and stayed on the same topic. Just over half the children were seen by their teachers tooften or always speak confidently, or offer a clear and convincing argument.
7 The scores of the original children in the study, and those who joined at age 8 from the survey, were comparedand found to be very similar in their distributions for all the competencies at age 10. We therefore use the whole
sample in our analyses except where otherwise stated.
8 Reliability here refers to the correlation of scores on individual items with scores overall for the measure. Acorrelation of 0.7 or more is generally considered adequate. We have used Cronbach’s coefficient alpha tocalculate the reliability of the competency measures, using standardised scores.
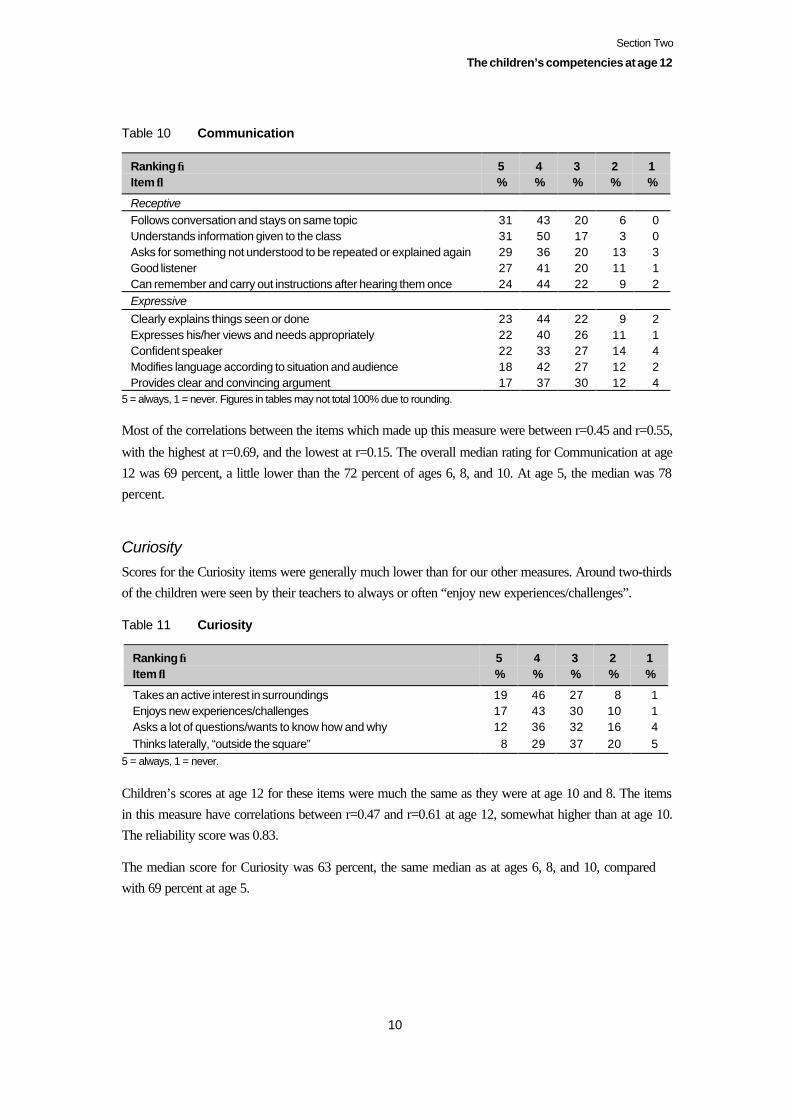
Section Two
The children’s competencies at age 12
10
Table 10 Communication
Ranking →Item ↓
5%
4%
3%
2%
1%
ReceptiveFollows conversation and stays on same topic 31 43 20 6 0Understands information given to the class 31 50 17 3 0Asks for something not understood to be repeated or explained again 29 36 20 13 3Good listener 27 41 20 11 1Can remember and carry out instructions after hearing them once 24 44 22 9 2ExpressiveClearly explains things seen or done 23 44 22 9 2Expresses his/her views and needs appropriately 22 40 26 11 1Confident speaker 22 33 27 14 4Modifies language according to situation and audience 18 42 27 12 2Provides clear and convincing argument 17 37 30 12 4
5 = always, 1 = never. Figures in tables may not total 100% due to rounding.
Most of the correlations between the items which made up this measure were between r=0.45 and r=0.55,
with the highest at r=0.69, and the lowest at r=0.15. The overall median rating for Communication at age12 was 69 percent, a little lower than the 72 percent of ages 6, 8, and 10. At age 5, the median was 78percent.
CuriosityScores for the Curiosity items were generally much lower than for our other measures. Around two-thirdsof the children were seen by their teachers to always or often “enjoy new experiences/challenges”.
Table 11 Curiosity
Ranking →Item ↓
5%
4%
3%
2%
1%
Takes an active interest in surroundings 19 46 27 8 1Enjoys new experiences/challenges 17 43 30 10 1Asks a lot of questions/wants to know how and why 12 36 32 16 4Thinks laterally, “outside the square” 8 29 37 20 5
5 = always, 1 = never.
Children’s scores at age 12 for these items were much the same as they were at age 10 and 8. The itemsin this measure have correlations between r=0.47 and r=0.61 at age 12, somewhat higher than at age 10.The reliability score was 0.83.
The median score for Curiosity was 63 percent, the same median as at ages 6, 8, and 10, comparedwith 69 percent at age 5.
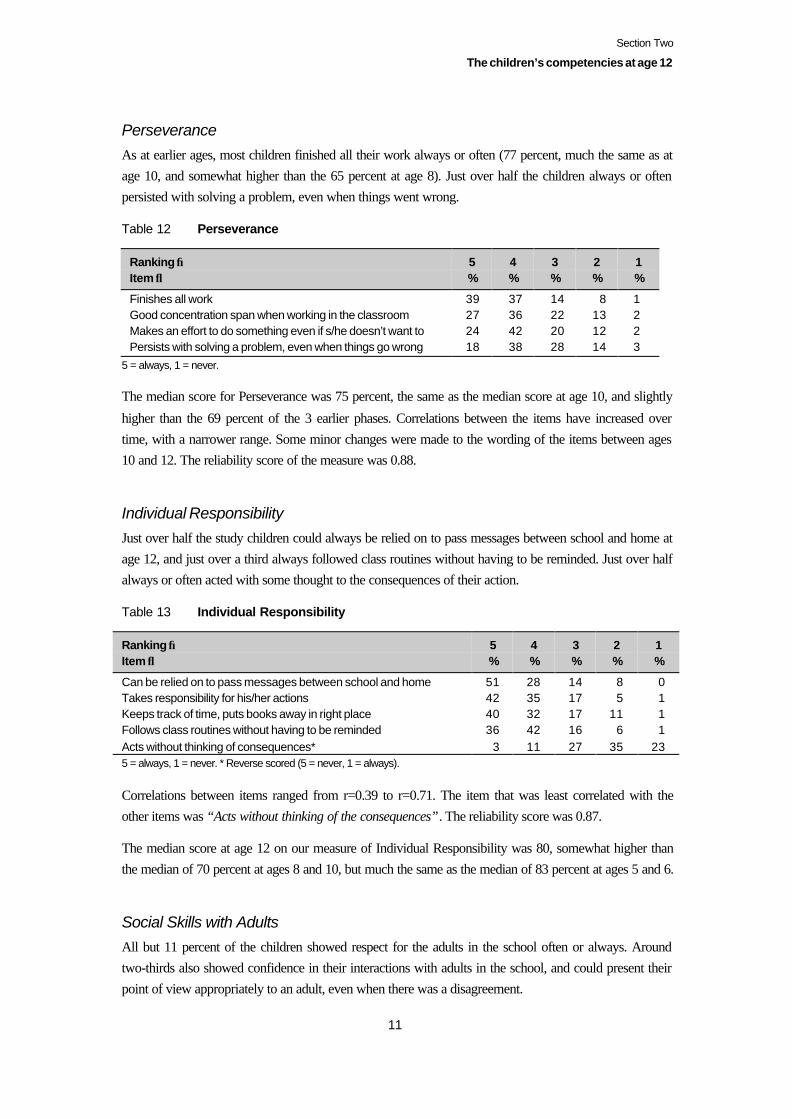
Section Two
The children’s competencies at age 12
11
PerseveranceAs at earlier ages, most children finished all their work always or often (77 percent, much the same as atage 10, and somewhat higher than the 65 percent at age 8). Just over half the children always or oftenpersisted with solving a problem, even when things went wrong.
Table 12 Perseverance
Ranking →Item ↓
5%
4%
3%
2%
1%
Finishes all work 39 37 14 8 1Good concentration span when working in the classroom 27 36 22 13 2Makes an effort to do something even if s/he doesn’t want to 24 42 20 12 2Persists with solving a problem, even when things go wrong 18 38 28 14 3
5 = always, 1 = never.
The median score for Perseverance was 75 percent, the same as the median score at age 10, and slightly
higher than the 69 percent of the 3 earlier phases. Correlations between the items have increased overtime, with a narrower range. Some minor changes were made to the wording of the items between ages10 and 12. The reliability score of the measure was 0.88.
Individual ResponsibilityJust over half the study children could always be relied on to pass messages between school and home atage 12, and just over a third always followed class routines without having to be reminded. Just over halfalways or often acted with some thought to the consequences of their action.
Table 13 Individual Responsibility
Ranking →Item ↓
5%
4%
3%
2%
1%
Can be relied on to pass messages between school and home 51 28 14 8 0Takes responsibility for his/her actions 42 35 17 5 1Keeps track of time, puts books away in right place 40 32 17 11 1Follows class routines without having to be reminded 36 42 16 6 1Acts without thinking of consequences* 3 11 27 35 235 = always, 1 = never. * Reverse scored (5 = never, 1 = always).
Correlations between items ranged from r=0.39 to r=0.71. The item that was least correlated with theother items was “Acts without thinking of the consequences”. The reliability score was 0.87.
The median score at age 12 on our measure of Individual Responsibility was 80, somewhat higher thanthe median of 70 percent at ages 8 and 10, but much the same as the median of 83 percent at ages 5 and 6.
Social Skills with AdultsAll but 11 percent of the children showed respect for the adults in the school often or always. Aroundtwo-thirds also showed confidence in their interactions with adults in the school, and could present theirpoint of view appropriately to an adult, even when there was a disagreement.
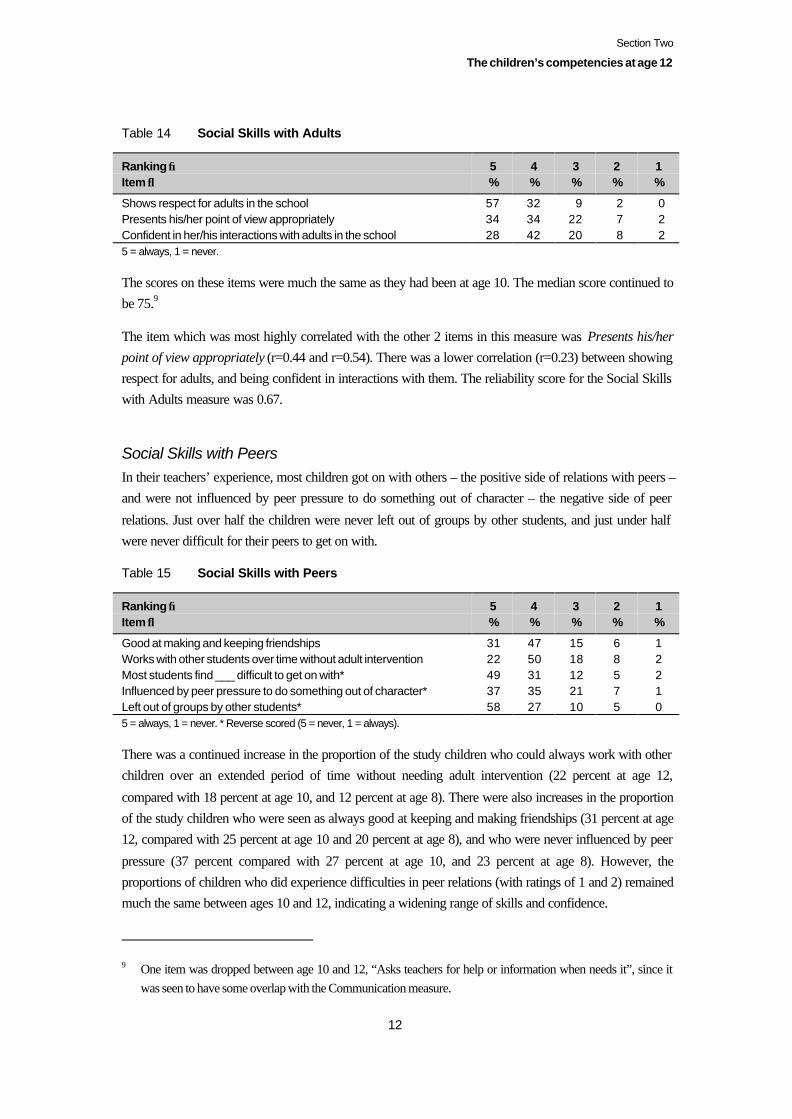
Section Two
The children’s competencies at age 12
12
Table 14 Social Skills with Adults
Ranking →Item ↓
5%
4%
3%
2%
1%
Shows respect for adults in the school 57 32 9 2 0Presents his/her point of view appropriately 34 34 22 7 2Confident in her/his interactions with adults in the school 28 42 20 8 25 = always, 1 = never.
The scores on these items were much the same as they had been at age 10. The median score continued tobe 75.9
The item which was most highly correlated with the other 2 items in this measure was Presents his/herpoint of view appropriately (r=0.44 and r=0.54). There was a lower correlation (r=0.23) between showingrespect for adults, and being confident in interactions with them. The reliability score for the Social Skillswith Adults measure was 0.67.
Social Skills with PeersIn their teachers’ experience, most children got on with others – the positive side of relations with peers –and were not influenced by peer pressure to do something out of character – the negative side of peer
relations. Just over half the children were never left out of groups by other students, and just under halfwere never difficult for their peers to get on with.
Table 15 Social Skills with Peers
Ranking →Item ↓
5%
4%
3%
2%
1%
Good at making and keeping friendships 31 47 15 6 1Works with other students over time without adult intervention 22 50 18 8 2Most students find ___ difficult to get on with* 49 31 12 5 2Influenced by peer pressure to do something out of character* 37 35 21 7 1Left out of groups by other students* 58 27 10 5 05 = always, 1 = never. * Reverse scored (5 = never, 1 = always).
There was a continued increase in the proportion of the study children who could always work with otherchildren over an extended period of time without needing adult intervention (22 percent at age 12,
compared with 18 percent at age 10, and 12 percent at age 8). There were also increases in the proportionof the study children who were seen as always good at keeping and making friendships (31 percent at age12, compared with 25 percent at age 10 and 20 percent at age 8), and who were never influenced by peer
pressure (37 percent compared with 27 percent at age 10, and 23 percent at age 8). However, theproportions of children who did experience difficulties in peer relations (with ratings of 1 and 2) remainedmuch the same between ages 10 and 12, indicating a widening range of skills and confidence.
9 One item was dropped between age 10 and 12, “Asks teachers for help or information when needs it”, since itwas seen to have some overlap with the Communication measure.

Section Two
The children’s competencies at age 12
13
The lowest correlation (r=0.19) was between children’s susceptibility to peer pressure and their being leftout of groups. The reliability score for these items was 0.77.
In devising the overall measure of Social Skills with Peers in earlier phases, we have given equal weightto each of the 5 items rated by teachers, and to each of the 2 stages of the social problem-solving taskgiven to the children. This is described below. We have followed this process for our analysis of the age-
12 phase, to keep consistency. However, the correlation between the teacher ratings and scores on thistask have been very low; and when we include the results of this task in the measure, the reliability scoredropped to 0.67.
The median score on the Social Skills with Peers at age 12 was 73 percent, slightly higher than at age 10.
Social problem-solving task
At age 12, we used only one task, dropping a task focused on getting a fair share of a scarce and valuedresource. The remaining task is related to bullying. The children were asked “What would you say or doif someone gave you a hard time in the school grounds?” They were then asked “What would you say or
do if they continued to give you a hard time in the school grounds?” This is much the same question theywere asked at age 10, with some rephrasing to be more appropriate for the age-12 group.10
The next table shows a drop in the proportion of children who would be assertive in the face of beinggiven a hard time in the school grounds, and double the proportion who would give an aggressive
response. Teachers remain key sources of help in this situation, and parents are more likely to be involvedif the first response does not deter the person who is giving the child a hard time. There are slightly higherproportions of children who would avoid the situation, did not know what they would do, and increases
in the small proportions of children who said they would seek help from other students, or groups offriends. Though a number of the schools attended by children had peer mediators, few studentsmentioned them as people they would involve in this particular situation.
10 At age 10, the question was phrased “What would you say or do if you were playing outside at lunchtime andanother child picked on you?” Possibly some of the study children gave different responses at age-12 than at age10 because “someone” could be conceived as an adult rather than another child.

Section Two
The children’s competencies at age 12
14
Table 16 Children’s strategies when encountering difficulties in the playground age 10
and 12
Strategy↓
InitialresponseAt age 10(n=507)
%
SecondresponseAt age 10(n=507)
%
InitialresponseAt age 12(n=496)
%
SecondresponseAt age 12(n=496)
%
Assertive response 46 14 29 12Ask teacher to help 21 55 29 48Go somewhere else/do something else 21 18 26 16Aggressive 5 4 10 9Passive/do not know 3 3 7 5Tell mum/dad/parents 0 2 5 17Seek help from another student 2 1 3 3Seek help from group of friends/gang 1 2 3 4Peer mediators 0 1 1 1
Task-assessed competencies
Mathematics, Literacy, Logical Problem-Solving
These 3 competencies were mostly assessed by tasks carried out by the study children during the research
interview, but the writing and PAT Reading Comprehension tests were usually done by teachers withinclass time. The average age when the research interview took place was 12 years, with a spread of agesfrom 11 years 10 months (3 percent of the sample) to one child aged 12 years 6 months.
Fifty-two percent of the study children were in Year 8, and 47 percent were in Year 7 classes when we
interviewed them. Three children attended Montessori or Steiner schools where they were not grouped byyear level.
MathematicsAs at ages 8 and 10, we used a reduced set of 20 items from the standardised PAT (Progressive
Achievement Test) for Mathematics.11 The items selected from the whole test for Year 7 and 8 studentswere those which were around the median in their level of difficulty (the proportion of students who gotthem right), and in their power to differentiate between students (high scorers overall got the itemscorrect, and low scorers overall did not).
11 Ninety-five percent of the teachers used PATs or multi-choice tests for children aged 12, an increase from 74percent at age 8, and 88 percent at age 10. Decile 1–2 schools were now just as likely to use them, a contrast totheir much lower use in these schools at ages 8 and 10. Decile 3–4 schools were least likely to use them (25percent).

Section Two
The children’s competencies at age 12
15
The mean raw score out of 20 was 10.19 (s.d. 4.77). The mean raw score of the study children who werein Year 7 was 9.82 (s.d. 4.57), and for those in Year 8, 10.57 (s.d. 4.9).
A higher proportion of the study children got 9 of the 20 items correct than did form 2 (Year 8) studentsin the 1992 standardisation of the PAT Mathematics, the same on 6 of them, and lower for 5 of them.This is a somewhat different picture than at ages 8 and 10, when the Competent Children project sample
had a higher proportion of correct items than the standardised sample. Most of the scores ranged around50 percent, with no clear patterns showing areas of mathematics which were better, or less, understoodthan others. Three-quarters of the study children got the correct answer for a question seeking application
of measurement; only 26 percent got the correct answer for a question seeking understanding of graphs(related to data, statistics, and probability).
LiteracyWe used 4 measures of literacy: the Burt Word Reading test, the PAT Reading Comprehension test,
teacher’s estimate of the child’s reading age, and a slightly modified version of the writing task used atages 8 and 10.
Burt Word Reading test
The Burt Word Reading test is a single test which does not change as children grow older. Children are
asked to read a set of increasingly difficult words. Children’s marks should increase as their wordrecognition (vocabulary) skills increase, as they did in this sample, though a plateau is reached. We seethe beginnings of this in the much lower increase in scores between ages 10 and 12 than between youngerages, and a much smaller range of scores.
At age 12, the median percentage score on the Burt Word Reading test was 79 percent, up from themedians of 66 percent at age 10, 45 percent at age 8, and 17 percent at age 6. One child got all 110 itemscorrect, and the fourth (top) quartile started at 88 percent compared with 79 percent at age 10, and 59
percent at age 8. The first (lowest) quartile of children was 35 percent at age 8; at age 10, this lowestquartile mark had shifted upwards to 51 percent, and by age 12, it was 69 percent.
The mean raw score was 84.61 out of 110. As in previous phases of the Competent Children project, thestudy children’s mean score was higher than the comparable age group when the Burt test was
standardised for New Zealand in 1980. Then the mean raw score was 78.94 for students aged 12 years to12 years 5 months.12
The mean raw score was 86.9 (s.d. 15.2) for Year 8 students in the study, and 82.3 (s.d. 17.2) for Year 7students.
12 Gilmore, A., Croft, C., & Reid , N. (1981). Burt Word Reading Test. NZ Revision. Teachers’ Manual. Wellington:New Zealand Council for Educational Research, p. 2.
Section Two
The children’s competencies at age 12
16
PAT Reading Comprehension test
The PAT Reading Comprehension test has different questions for Year 7 and Year 8 students, with an
overlap of 31 questions. The median raw score for the Year 7 students (for the Year 7 test) was 57.9percent, and for the Year 8 students (for the Year 8 test), 56.1 percent. The median score in percentileterms for both year groups – ignoring differences in the tests – was 58.5 percent, up from 51 percent at
age 10, and 37 percent at age 8. As at age 10, we devised a score adjusted to take account of thedifferences in tests for each year level. This was done by looking first at the scores on the 31 questions incommon, which showed a median of 53 percent for the Year 7 students, and 61 percent for the Year 8
students. A Student’s T-test showed that the probability that both year groups had the same mean was p =0.003, and a 95 percent confidence interval of the true difference between the two groups was between 2percent and 10.2 percent, with the average difference of 6.1 percent. The Year 7 student scores weretherefore adjusted downwards by 6.1 percent.
Year 7 students’ mean raw score (using form A of the PAT Reading Comprehension test) was 21.97 (s.d.9.64), close to the mean raw score of 22.07 (s.d. 8.52) for form 1 (now Year 7) students on form Aachieved in the 1990 NZCER review of PAT. The Year 8 mean raw score in this study was 22.37,
slightly higher than the form 2 (now Year 8) mean raw score of the 1990 review, which was also 22.07(s.d. 8.82).
Teachers’ estimates of reading age
We have used reading age as a quick way to tap into teachers’ professional judgment based on theirknowledge of what children are reading and have been reading.
The median on teachers’ estimates of children’s reading ages was 13–13½ years, compared with 11½–12years old at age 10, and 9–9½ years at age 8. The upper quartile was age 14–14½ years, and the lowerquartile, age 11½–12 years, with 4 students given a reading age of less than 8 years.
The next table shows a gradual increase in the proportion of children thought to be reading below their
chronological age, as the children grow older. Sixteen percent of the study children were thought to bereading below their chronological age at age 8, 20 percent at age 10, and 27 percent at age 12.
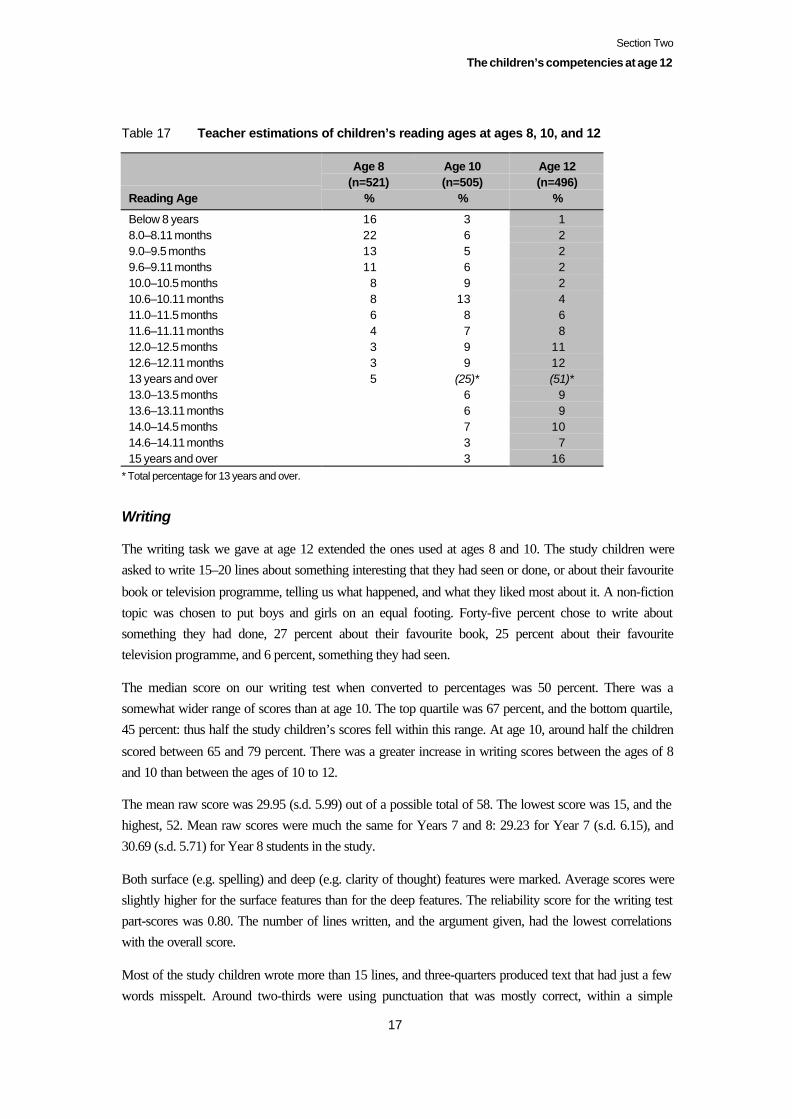
Section Two
The children’s competencies at age 12
17
Table 17 Teacher estimations of children’s reading ages at ages 8, 10, and 12
Reading Age
Age 8(n=521)
%
Age 10(n=505)
%
Age 12(n=496)
%
Below 8 years 16 3 18.0–8.11 months 22 6 29.0–9.5 months 13 5 29.6–9.11 months 11 6 210.0–10.5 months 8 9 210.6–10.11 months 8 13 411.0–11.5 months 6 8 611.6–11.11 months 4 7 812.0–12.5 months 3 9 1112.6–12.11 months 3 9 1213 years and over 5 (25)* (51)*13.0–13.5 months 6 913.6–13.11 months 6 914.0–14.5 months 7 1014.6–14.11 months 3 715 years and over 3 16
* Total percentage for 13 years and over.
Writing
The writing task we gave at age 12 extended the ones used at ages 8 and 10. The study children wereasked to write 15–20 lines about something interesting that they had seen or done, or about their favourite
book or television programme, telling us what happened, and what they liked most about it. A non-fictiontopic was chosen to put boys and girls on an equal footing. Forty-five percent chose to write aboutsomething they had done, 27 percent about their favourite book, 25 percent about their favouritetelevision programme, and 6 percent, something they had seen.
The median score on our writing test when converted to percentages was 50 percent. There was asomewhat wider range of scores than at age 10. The top quartile was 67 percent, and the bottom quartile,45 percent: thus half the study children’s scores fell within this range. At age 10, around half the children
scored between 65 and 79 percent. There was a greater increase in writing scores between the ages of 8and 10 than between the ages of 10 to 12.
The mean raw score was 29.95 (s.d. 5.99) out of a possible total of 58. The lowest score was 15, and thehighest, 52. Mean raw scores were much the same for Years 7 and 8: 29.23 for Year 7 (s.d. 6.15), and30.69 (s.d. 5.71) for Year 8 students in the study.
Both surface (e.g. spelling) and deep (e.g. clarity of thought) features were marked. Average scores wereslightly higher for the surface features than for the deep features. The reliability score for the writing testpart-scores was 0.80. The number of lines written, and the argument given, had the lowest correlationswith the overall score.
Most of the study children wrote more than 15 lines, and three-quarters produced text that had just a fewwords misspelt. Around two-thirds were using punctuation that was mostly correct, within a simple

Section Two
The children’s competencies at age 12
18
range. Seventy percent were using simple syntax correctly. All but 10 percent had a wider vocabulary
than high frequency words, and half were beginning to or did match their choice of vocabulary to theirtask. Forty percent could vary their sentence structure, and around 30 percent were ordering their ideaslogically, and starting to use paragraphs. Sixty-nine percent provided an argument for their point of viewwhich had at least some supporting ideas.
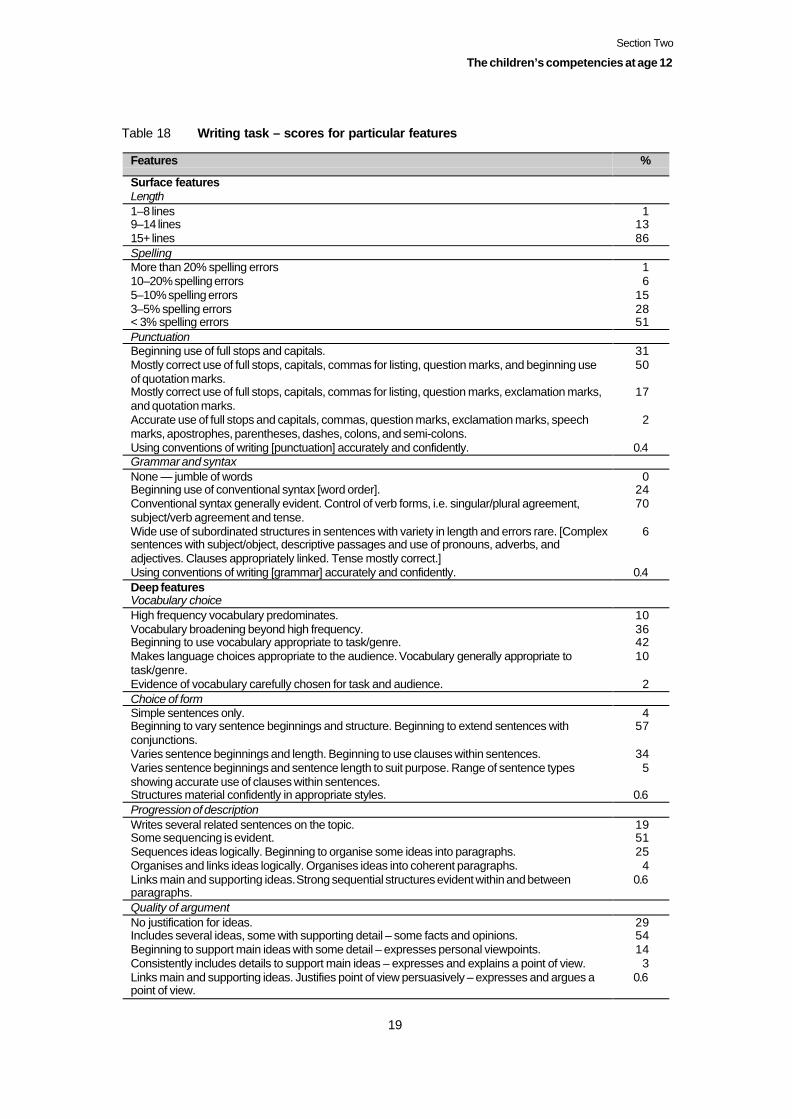
Section Two
The children’s competencies at age 12
19
Table 18 Writing task – scores for particular features
Features %
Surface featuresLength1–8 lines9–14 lines15+ lines
11386
SpellingMore than 20% spelling errors10–20% spelling errors5–10% spelling errors3–5% spelling errors< 3% spelling errors
16
152851
PunctuationBeginning use of full stops and capitals. 31Mostly correct use of full stops, capitals, commas for listing, question marks, and beginning useof quotation marks.
50
Mostly correct use of full stops, capitals, commas for listing, question marks, exclamation marks,and quotation marks.
17
Accurate use of full stops and capitals, commas, question marks, exclamation marks, speechmarks, apostrophes, parentheses, dashes, colons, and semi-colons.
2
Using conventions of writing [punctuation] accurately and confidently. 0.4Grammar and syntaxNone — jumble of words 0Beginning use of conventional syntax [word order]. 24Conventional syntax generally evident. Control of verb forms, i.e. singular/plural agreement,subject/verb agreement and tense.
70
Wide use of subordinated structures in sentences with variety in length and errors rare. [Complexsentences with subject/object, descriptive passages and use of pronouns, adverbs, andadjectives. Clauses appropriately linked. Tense mostly correct.]
6
Using conventions of writing [grammar] accurately and confidently. 0.4Deep featuresVocabulary choiceHigh frequency vocabulary predominates. 10Vocabulary broadening beyond high frequency. 36Beginning to use vocabulary appropriate to task/genre. 42Makes language choices appropriate to the audience. Vocabulary generally appropriate totask/genre.
10
Evidence of vocabulary carefully chosen for task and audience. 2Choice of formSimple sentences only. 4Beginning to vary sentence beginnings and structure. Beginning to extend sentences withconjunctions.
57
Varies sentence beginnings and length. Beginning to use clauses within sentences. 34Varies sentence beginnings and sentence length to suit purpose. Range of sentence typesshowing accurate use of clauses within sentences.
5
Structures material confidently in appropriate styles. 0.6Progression of descriptionWrites several related sentences on the topic. 19Some sequencing is evident. 51Sequences ideas logically. Beginning to organise some ideas into paragraphs. 25Organises and links ideas logically. Organises ideas into coherent paragraphs. 4Links main and supporting ideas. Strong sequential structures evident within and betweenparagraphs.
0.6
Quality of argumentNo justification for ideas. 29Includes several ideas, some with supporting detail – some facts and opinions. 54Beginning to support main ideas with some detail – expresses personal viewpoints. 14Consistently includes details to support main ideas – expresses and explains a point of view. 3Links main and supporting ideas. Justifies point of view persuasively – expresses and argues apoint of view.
0.6
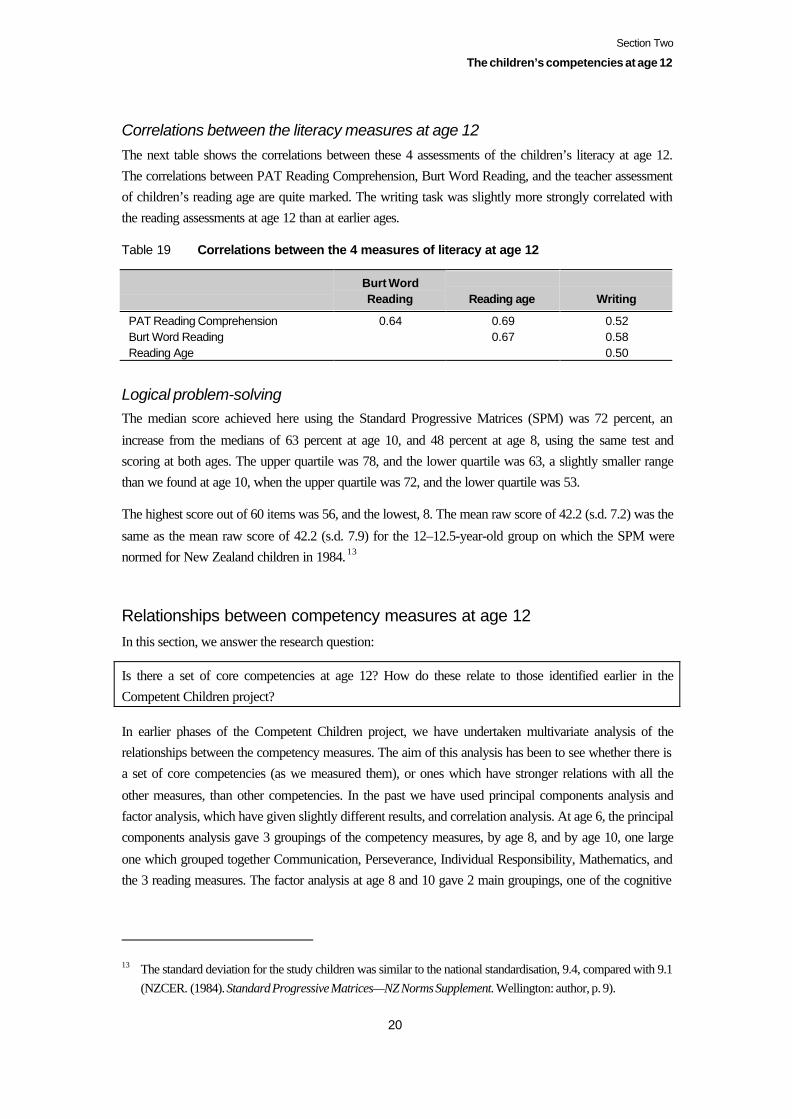
Section Two
The children’s competencies at age 12
20
Correlations between the literacy measures at age 12The next table shows the correlations between these 4 assessments of the children’s literacy at age 12.The correlations between PAT Reading Comprehension, Burt Word Reading, and the teacher assessmentof children’s reading age are quite marked. The writing task was slightly more strongly correlated withthe reading assessments at age 12 than at earlier ages.
Table 19 Correlations between the 4 measures of literacy at age 12
Burt WordReading Reading age Writing
PAT Reading ComprehensionBurt Word ReadingReading Age
0.64 0.690.67
0.520.580.50
Logical problem-solvingThe median score achieved here using the Standard Progressive Matrices (SPM) was 72 percent, an
increase from the medians of 63 percent at age 10, and 48 percent at age 8, using the same test andscoring at both ages. The upper quartile was 78, and the lower quartile was 63, a slightly smaller rangethan we found at age 10, when the upper quartile was 72, and the lower quartile was 53.
The highest score out of 60 items was 56, and the lowest, 8. The mean raw score of 42.2 (s.d. 7.2) was the
same as the mean raw score of 42.2 (s.d. 7.9) for the 12–12.5-year-old group on which the SPM werenormed for New Zealand children in 1984. 13
Relationships between competency measures at age 12In this section, we answer the research question:
Is there a set of core competencies at age 12? How do these relate to those identified earlier in theCompetent Children project?
In earlier phases of the Competent Children project, we have undertaken multivariate analysis of therelationships between the competency measures. The aim of this analysis has been to see whether there isa set of core competencies (as we measured them), or ones which have stronger relations with all the
other measures, than other competencies. In the past we have used principal components analysis andfactor analysis, which have given slightly different results, and correlation analysis. At age 6, the principalcomponents analysis gave 3 groupings of the competency measures, by age 8, and by age 10, one large
one which grouped together Communication, Perseverance, Individual Responsibility, Mathematics, andthe 3 reading measures. The factor analysis at age 8 and 10 gave 2 main groupings, one of the cognitive
13 The standard deviation for the study children was similar to the national standardisation, 9.4, compared with 9.1(NZCER. (1984). Standard Progressive Matrices—NZ Norms Supplement. Wellington: author, p. 9).
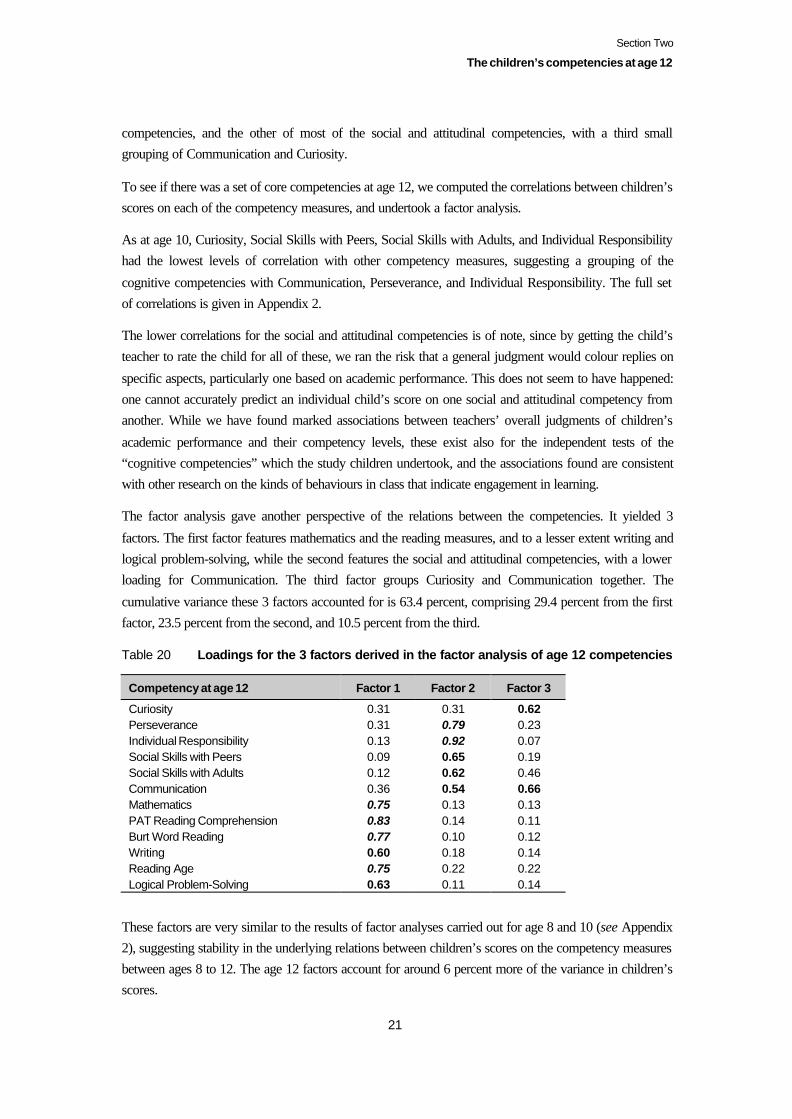
Section Two
The children’s competencies at age 12
21
competencies, and the other of most of the social and attitudinal competencies, with a third smallgrouping of Communication and Curiosity.
To see if there was a set of core competencies at age 12, we computed the correlations between children’sscores on each of the competency measures, and undertook a factor analysis.
As at age 10, Curiosity, Social Skills with Peers, Social Skills with Adults, and Individual Responsibilityhad the lowest levels of correlation with other competency measures, suggesting a grouping of the
cognitive competencies with Communication, Perseverance, and Individual Responsibility. The full setof correlations is given in Appendix 2.
The lower correlations for the social and attitudinal competencies is of note, since by getting the child’steacher to rate the child for all of these, we ran the risk that a general judgment would colour replies on
specific aspects, particularly one based on academic performance. This does not seem to have happened:one cannot accurately predict an individual child’s score on one social and attitudinal competency fromanother. While we have found marked associations between teachers’ overall judgments of children’s
academic performance and their competency levels, these exist also for the independent tests of the“cognitive competencies” which the study children undertook, and the associations found are consistentwith other research on the kinds of behaviours in class that indicate engagement in learning.
The factor analysis gave another perspective of the relations between the competencies. It yielded 3
factors. The first factor features mathematics and the reading measures, and to a lesser extent writing andlogical problem-solving, while the second features the social and attitudinal competencies, with a lowerloading for Communication. The third factor groups Curiosity and Communication together. The
cumulative variance these 3 factors accounted for is 63.4 percent, comprising 29.4 percent from the firstfactor, 23.5 percent from the second, and 10.5 percent from the third.
Table 20 Loadings for the 3 factors derived in the factor analysis of age 12 competencies
Competency at age 12 Factor 1 Factor 2 Factor 3
Curiosity 0.31 0.31 0.62Perseverance 0.31 0.79 0.23Individual Responsibility 0.13 0.92 0.07Social Skills with Peers 0.09 0.65 0.19Social Skills with Adults 0.12 0.62 0.46Communication 0.36 0.54 0.66Mathematics 0.75 0.13 0.13PAT Reading Comprehension 0.83 0.14 0.11Burt Word Reading 0.77 0.10 0.12Writing 0.60 0.18 0.14Reading Age 0.75 0.22 0.22Logical Problem-Solving 0.63 0.11 0.14
These factors are very similar to the results of factor analyses carried out for age 8 and 10 (see Appendix2), suggesting stability in the underlying relations between children’s scores on the competency measuresbetween ages 8 to 12. The age 12 factors account for around 6 percent more of the variance in children’sscores.
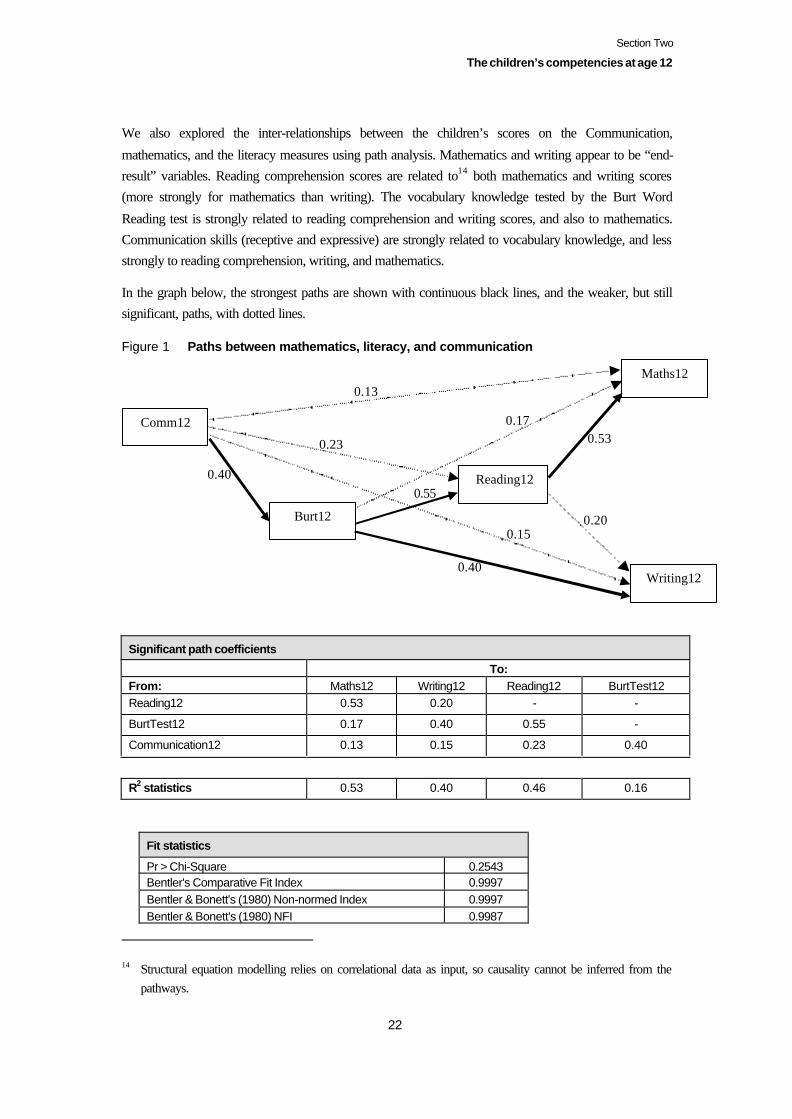
Section Two
The children’s competencies at age 12
22
We also explored the inter-relationships between the children’s scores on the Communication,
mathematics, and the literacy measures using path analysis. Mathematics and writing appear to be “end-result” variables. Reading comprehension scores are related to14 both mathematics and writing scores(more strongly for mathematics than writing). The vocabulary knowledge tested by the Burt Word
Reading test is strongly related to reading comprehension and writing scores, and also to mathematics.Communication skills (receptive and expressive) are strongly related to vocabulary knowledge, and lessstrongly to reading comprehension, writing, and mathematics.
In the graph below, the strongest paths are shown with continuous black lines, and the weaker, but stillsignificant, paths, with dotted lines.
Figure 1 Paths between mathematics, literacy, and communication
Significant path coefficients
To:From: Maths12 Writing12 Reading12 BurtTest12Reading12 0.53 0.20 - -
BurtTest12 0.17 0.40 0.55 -
Communication12 0.13 0.15 0.23 0.40
R2 statistics 0.53 0.40 0.46 0.16
Fit statistics
Pr > Chi-Square 0.2543Bentler's Comparative Fit Index 0.9997Bentler & Bonett's (1980) Non-normed Index 0.9997Bentler & Bonett's (1980) NFI 0.9987
14 Structural equation modelling relies on correlational data as input, so causality cannot be inferred from thepathways.
Maths12
Writing12
Reading12
Burt12
Comm12
0.40
0.53
0.20
0.17
0.13
0.40
0.55
0.15
0.23

Section Two
The children’s competencies at age 12
23
Summary
The study children’s classroom behaviour was much the same at age 12 as it had been when they were
aged 10 and 8. Around two-thirds to three-quarters seemed comfortable in the class in their role aslearners, with 15 percent or fewer receiving poor scores for individual items making up the social andattitudinal competencies. The study children had higher scores for listening than speaking. While many
enjoyed new experiences, thinking laterally or “outside the square”’ was common for only around a third.Relations with peers continued to strengthen, but there was no increase in the proportion of children whoseemed to their teachers to be subject to peer pressure. However, children’s responses to a hypothetical
situation, being given a hard time in the school grounds, did show that fewer children would be assertiveat age 12 than at age 10, and a doubling of the (small) proportion of children who would respond withaggression. More of the study children would turn to their parents for help if their first response did notwork.
The study children were almost evenly divided between Year 7 and Year 8. There was little differencebetween each year on their scores for the cognitive competency measures. The median raw score on theBurt Word Reading test (vocabulary) was now 79 percent, with some evidence that the study children
were beginning to approach the plateau found with this test. Teachers’ estimates of the children’s readingage continue to show a median which is about a year above the children’s chronological age. However, aschildren grow older, teachers seem more aware of those who are lagging behind. The proportion of
children estimated to be reading below their chronological age has grown to 27 percent (from 20 percentat age 10, and 16 percent at age 8).
There was a wider range of writing scores at age 12 than there had been at age 10, with slightly higheraverage scores for surface features than deep features. Most of the children used correct punctuation and
spelling, within a simple range of syntax, and provided an argument for their point of view which had atleast some supporting ideas. Under half could vary sentence structure, and order their ideas logically.
The “cognitive” competencies are relatively strongly correlated (they group together as one factor); as are5 of the 6 social and attitudinal competencies, which form another factor, with Curiosity and
Communication forming a third factor which makes a smaller contribution to the variance in children’sscores at age 12. These groupings are consistent with those found at ages 8 and 10. A path analysisindicates relationships amongst mathematics, literacy and Communication scores, with Communication
— listening and speaking — directly feeding into vocabulary, reading comprehension, writing, andmathematics; vocabulary feeding into reading comprehension and writing; and reading comprehensionfeeding into mathematics and writing.
24
Section Three
Changes in the competencies over time
This section explores patterns of children’s progress over time, in relation to this research question:
How predictable are children’s competency levels at age 12 from their earlier competency levels at agesnear-5, 6, 8, and 10? Are there different trends for different population sub-groups and differentcompetencies? To what extent are these results modified by school experiences, home resources andsupport, and children’s activities?
There is a range of ways in which we can analyse children’s progress over time to answer this question.We have used 5 different methods: simple correlations between percentile scores, more complexregression analysis, partial correlations, path analysis, and finally, analysis of children’s movement acrossquartile groups, which, unlike the other 4 approaches, does not assume linearity in the measures.
The main reason for using a range of methods here is to ensure that the patterns found are not merely theresult of a single method of analysis. Where there are similar results from using different methods, it ismore likely that the trends found are real. This is particularly important because our measures of thechildren’s competencies were not identical at every age.
Attitudes, behaviours, social skills
The next table shows the correlations between individual scores on the teacher-rated competencies,
Communication, Perseverance, Individual Responsibility, Curiosity, Social Skills with Peers, and SocialSkills with Adults, between the ages of 5 to 12. There is an increase in the correlation of individual scoresover time for all these measures bar Curiosity between ages 6 and 12, after the first year at school,suggesting growth in children’s knowledge and ability to operate in the school environment over time.
These social and attitudinal competencies are weakly or moderately correlated, but all correlations arestatistically significant (all p-values were less than or equal to 0.007). Given that different teachers ratedthe children, the lack of strong correlation over time is likely to reflect different individual responses and
interactions between individual children, their teachers, and peers, as well as different settings andexpectations in those settings.
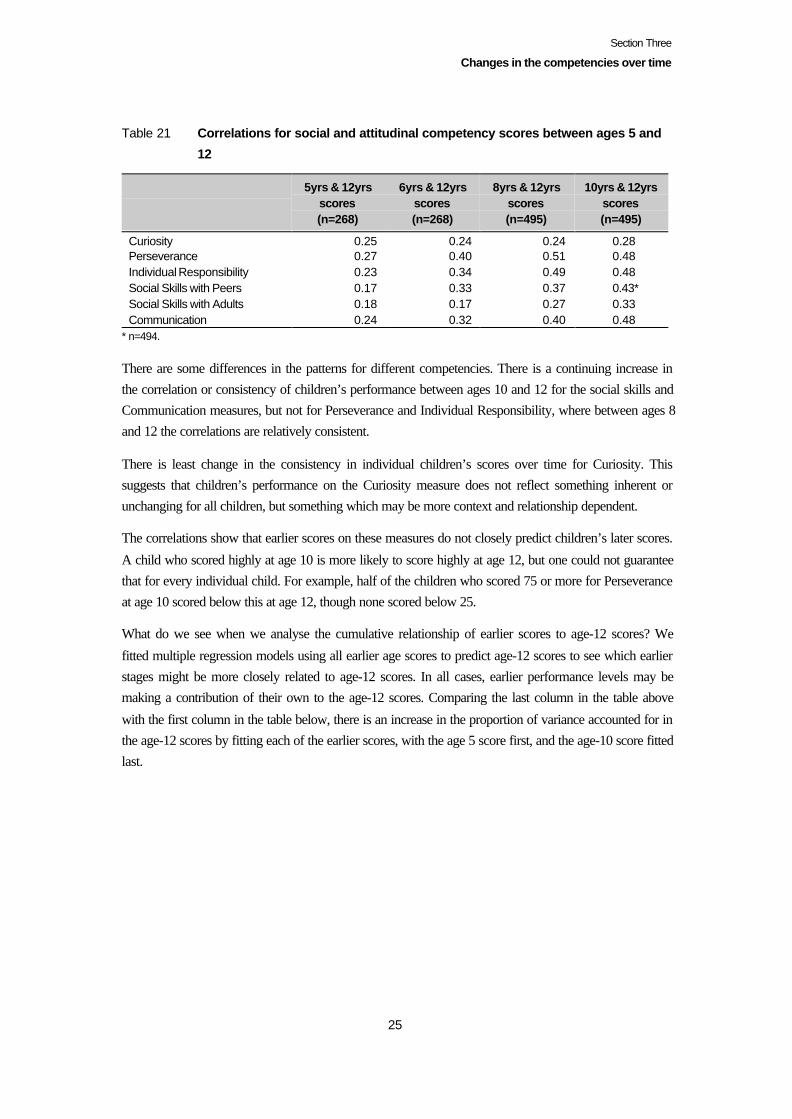
Section Three
Changes in the competencies over time
25
Table 21 Correlations for social and attitudinal competency scores between ages 5 and
12
5yrs & 12yrsscores(n=268)
6yrs & 12yrsscores(n=268)
8yrs & 12yrsscores(n=495)
10yrs & 12yrsscores(n=495)
Curiosity 0.25 0.24 0.24 0.28Perseverance 0.27 0.40 0.51 0.48Individual Responsibility 0.23 0.34 0.49 0.48Social Skills with Peers 0.17 0.33 0.37 0.43*Social Skills with Adults 0.18 0.17 0.27 0.33Communication 0.24 0.32 0.40 0.48
* n=494.
There are some differences in the patterns for different competencies. There is a continuing increase inthe correlation or consistency of children’s performance between ages 10 and 12 for the social skills andCommunication measures, but not for Perseverance and Individual Responsibility, where between ages 8and 12 the correlations are relatively consistent.
There is least change in the consistency in individual children’s scores over time for Curiosity. Thissuggests that children’s performance on the Curiosity measure does not reflect something inherent orunchanging for all children, but something which may be more context and relationship dependent.
The correlations show that earlier scores on these measures do not closely predict children’s later scores.
A child who scored highly at age 10 is more likely to score highly at age 12, but one could not guaranteethat for every individual child. For example, half of the children who scored 75 or more for Perseveranceat age 10 scored below this at age 12, though none scored below 25.
What do we see when we analyse the cumulative relationship of earlier scores to age-12 scores? We
fitted multiple regression models using all earlier age scores to predict age-12 scores to see which earlierstages might be more closely related to age-12 scores. In all cases, earlier performance levels may bemaking a contribution of their own to the age-12 scores. Comparing the last column in the table above
with the first column in the table below, there is an increase in the proportion of variance accounted for inthe age-12 scores by fitting each of the earlier scores, with the age 5 score first, and the age-10 score fittedlast.
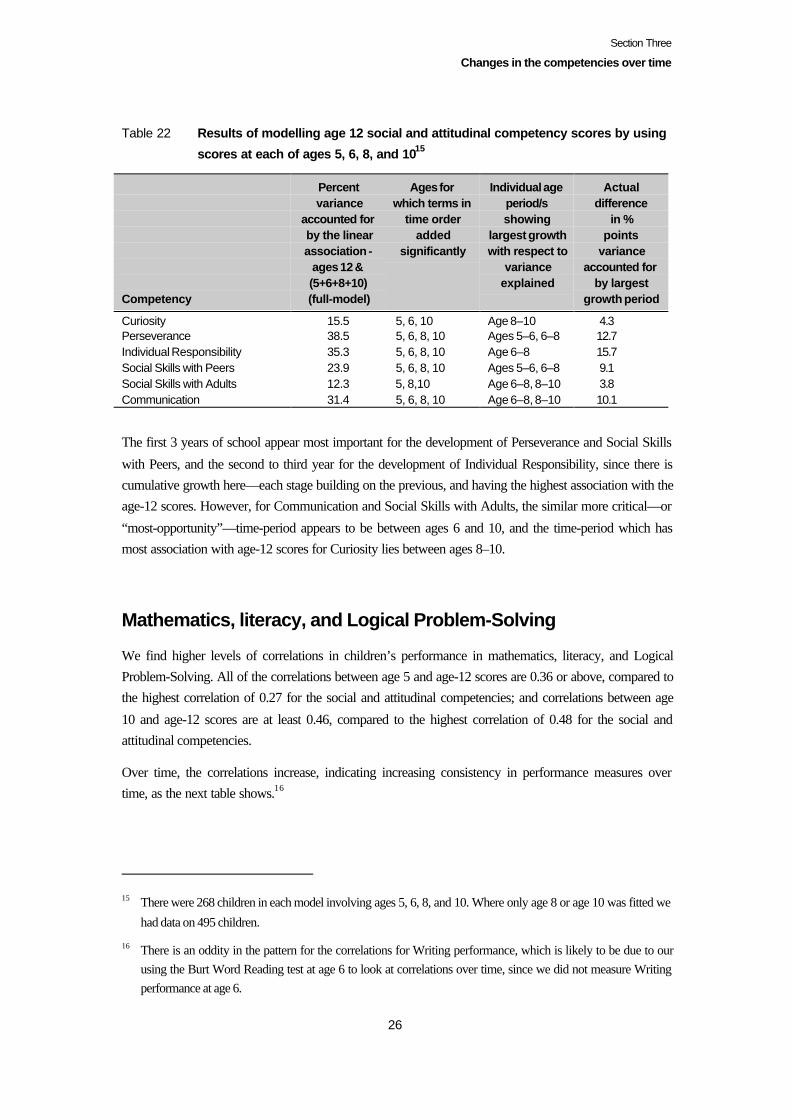
Section Three
Changes in the competencies over time
26
Table 22 Results of modelling age 12 social and attitudinal competency scores by using
scores at each of ages 5, 6, 8, and 1015
Competency
Percentvariance
accounted forby the linearassociation -
ages 12 &(5+6+8+10)(full-model)
Ages forwhich terms in
time orderadded
significantly
Individual ageperiod/sshowing
largest growthwith respect to
varianceexplained
Actualdifference
in %points
varianceaccounted for
by largestgrowth period
Curiosity 15.5 5, 6, 10 Age 8–10 4.3Perseverance 38.5 5, 6, 8, 10 Ages 5–6, 6–8 12.7Individual Responsibility 35.3 5, 6, 8, 10 Age 6–8 15.7Social Skills with Peers 23.9 5, 6, 8, 10 Ages 5–6, 6–8 9.1Social Skills with Adults 12.3 5, 8,10 Age 6–8, 8–10 3.8Communication 31.4 5, 6, 8, 10 Age 6–8, 8–10 10.1
The first 3 years of school appear most important for the development of Perseverance and Social Skills
with Peers, and the second to third year for the development of Individual Responsibility, since there iscumulative growth here—each stage building on the previous, and having the highest association with theage-12 scores. However, for Communication and Social Skills with Adults, the similar more critical—or
“most-opportunity”—time-period appears to be between ages 6 and 10, and the time-period which hasmost association with age-12 scores for Curiosity lies between ages 8–10.
Mathematics, literacy, and Logical Problem-Solving
We find higher levels of correlations in children’s performance in mathematics, literacy, and LogicalProblem-Solving. All of the correlations between age 5 and age-12 scores are 0.36 or above, compared tothe highest correlation of 0.27 for the social and attitudinal competencies; and correlations between age
10 and age-12 scores are at least 0.46, compared to the highest correlation of 0.48 for the social andattitudinal competencies.
Over time, the correlations increase, indicating increasing consistency in performance measures overtime, as the next table shows.16
15 There were 268 children in each model involving ages 5, 6, 8, and 10. Where only age 8 or age 10 was fitted we
had data on 495 children.
16 There is an oddity in the pattern for the correlations for Writing performance, which is likely to be due to ourusing the Burt Word Reading test at age 6 to look at correlations over time, since we did not measure Writingperformance at age 6.
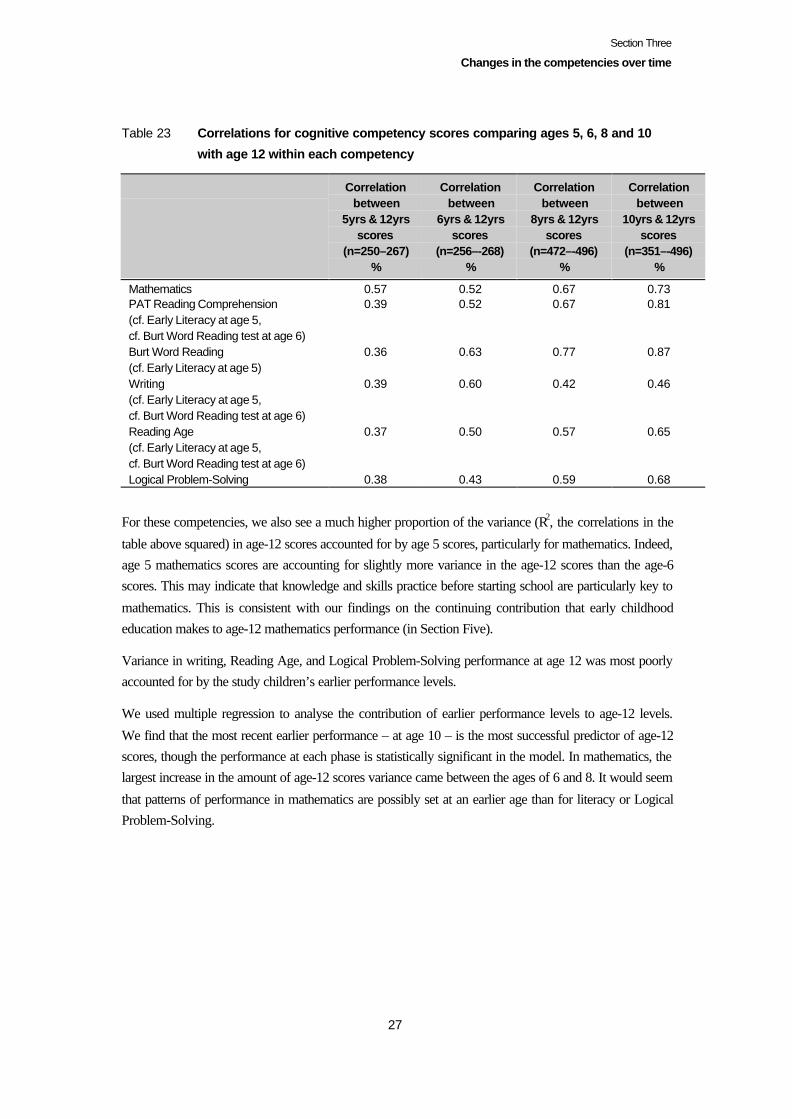
Section Three
Changes in the competencies over time
27
Table 23 Correlations for cognitive competency scores comparing ages 5, 6, 8 and 10
with age 12 within each competency
Correlationbetween
5yrs & 12yrsscores
(n=250–267)%
Correlationbetween
6yrs & 12yrsscores
(n=256–-268)%
Correlationbetween
8yrs & 12yrsscores
(n=472–-496)%
Correlationbetween
10yrs & 12yrsscores
(n=351–-496)%
Mathematics 0.57 0.52 0.67 0.73PAT Reading Comprehension(cf. Early Literacy at age 5,cf. Burt Word Reading test at age 6)
0.39 0.52 0.67 0.81
Burt Word Reading(cf. Early Literacy at age 5)
0.36 0.63 0.77 0.87
Writing(cf. Early Literacy at age 5,cf. Burt Word Reading test at age 6)
0.39 0.60 0.42 0.46
Reading Age(cf. Early Literacy at age 5,cf. Burt Word Reading test at age 6)
0.37 0.50 0.57 0.65
Logical Problem-Solving 0.38 0.43 0.59 0.68
For these competencies, we also see a much higher proportion of the variance (R2, the correlations in the
table above squared) in age-12 scores accounted for by age 5 scores, particularly for mathematics. Indeed,age 5 mathematics scores are accounting for slightly more variance in the age-12 scores than the age-6scores. This may indicate that knowledge and skills practice before starting school are particularly key to
mathematics. This is consistent with our findings on the continuing contribution that early childhoodeducation makes to age-12 mathematics performance (in Section Five).
Variance in writing, Reading Age, and Logical Problem-Solving performance at age 12 was most poorlyaccounted for by the study children’s earlier performance levels.
We used multiple regression to analyse the contribution of earlier performance levels to age-12 levels.
We find that the most recent earlier performance – at age 10 – is the most successful predictor of age-12scores, though the performance at each phase is statistically significant in the model. In mathematics, thelargest increase in the amount of age-12 scores variance came between the ages of 6 and 8. It would seem
that patterns of performance in mathematics are possibly set at an earlier age than for literacy or LogicalProblem-Solving.
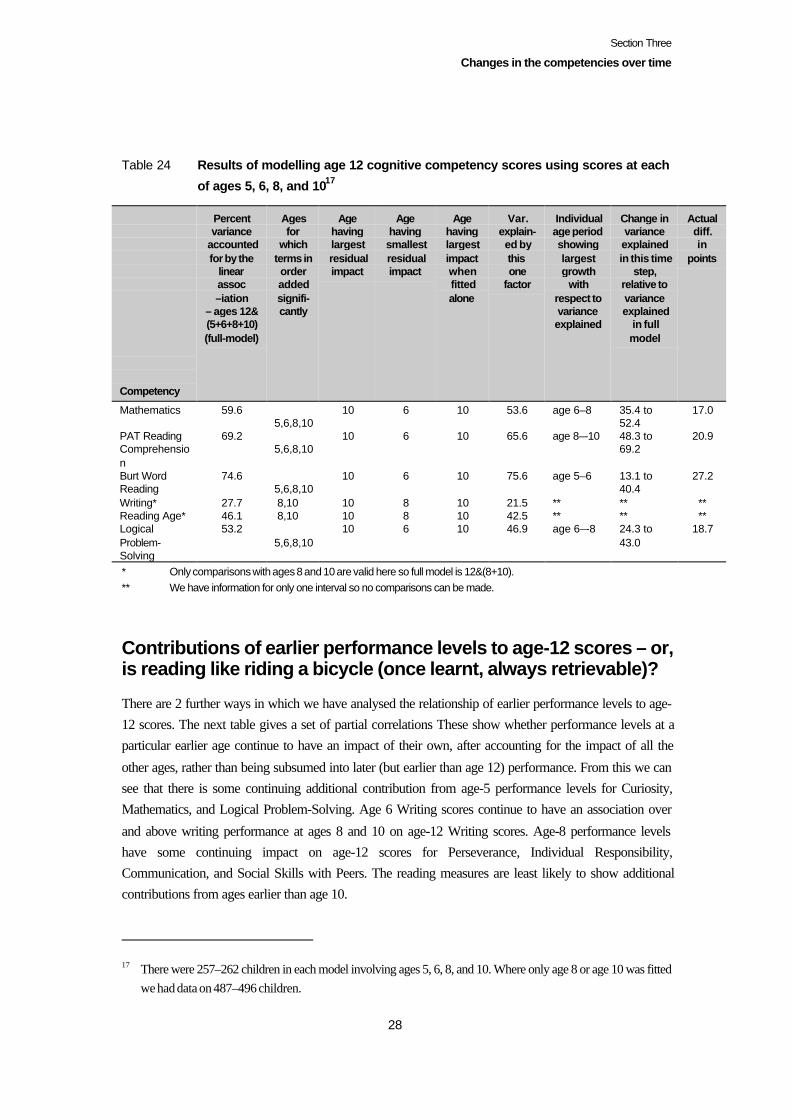
Section Three
Changes in the competencies over time
28
Table 24 Results of modelling age 12 cognitive competency scores using scores at each
of ages 5, 6, 8, and 1017
Competency
Percentvariance
accountedfor by the
linearassoc–iation
– ages 12&(5+6+8+10)(full-model)
Agesfor
whichterms inorderaddedsignifi-cantly
Agehavinglargestresidualimpact
Agehavingsmallestresidualimpact
Agehavinglargestimpactwhenfittedalone
Var.explain-ed bythisone
factor
Individualage periodshowinglargestgrowth
withrespect tovarianceexplained
Change invarianceexplainedin this time
step,relative tovarianceexplained
in fullmodel
Actualdiff.in
points
Mathematics 59.65,6,8,10
10 6 10 53.6 age 6–8 35.4 to52.4
17.0
PAT ReadingComprehension
69.25,6,8,10
10 6 10 65.6 age 8–-10 48.3 to69.2
20.9
Burt WordReading
74.65,6,8,10
10 6 10 75.6 age 5–6 13.1 to40.4
27.2
Writing* 27.7 8,10 10 8 10 21.5 ** ** **Reading Age* 46.1 8,10 10 8 10 42.5 ** ** **LogicalProblem-Solving
53.25,6,8,10
10 6 10 46.9 age 6–-8 24.3 to43.0
18.7
* Only comparisons with ages 8 and 10 are valid here so full model is 12&(8+10).** We have information for only one interval so no comparisons can be made.
Contributions of earlier performance levels to age-12 scores – or,is reading like riding a bicycle (once learnt, always retrievable)?
There are 2 further ways in which we have analysed the relationship of earlier performance levels to age-12 scores. The next table gives a set of partial correlations These show whether performance levels at aparticular earlier age continue to have an impact of their own, after accounting for the impact of all the
other ages, rather than being subsumed into later (but earlier than age 12) performance. From this we cansee that there is some continuing additional contribution from age-5 performance levels for Curiosity,Mathematics, and Logical Problem-Solving. Age 6 Writing scores continue to have an association over
and above writing performance at ages 8 and 10 on age-12 Writing scores. Age-8 performance levelshave some continuing impact on age-12 scores for Perseverance, Individual Responsibility,Communication, and Social Skills with Peers. The reading measures are least likely to show additionalcontributions from ages earlier than age 10.
17 There were 257–262 children in each model involving ages 5, 6, 8, and 10. Where only age 8 or age 10 was fittedwe had data on 487–496 children.
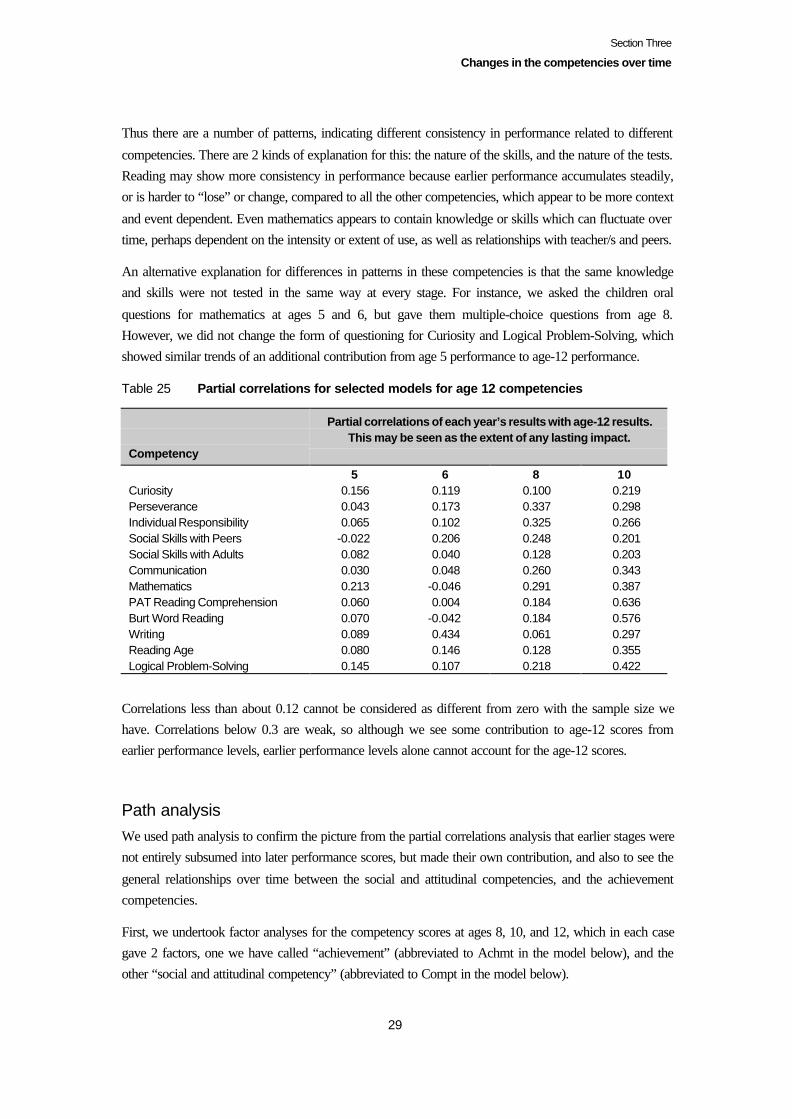
Section Three
Changes in the competencies over time
29
Thus there are a number of patterns, indicating different consistency in performance related to different
competencies. There are 2 kinds of explanation for this: the nature of the skills, and the nature of the tests.Reading may show more consistency in performance because earlier performance accumulates steadily,or is harder to “lose” or change, compared to all the other competencies, which appear to be more context
and event dependent. Even mathematics appears to contain knowledge or skills which can fluctuate overtime, perhaps dependent on the intensity or extent of use, as well as relationships with teacher/s and peers.
An alternative explanation for differences in patterns in these competencies is that the same knowledgeand skills were not tested in the same way at every stage. For instance, we asked the children oral
questions for mathematics at ages 5 and 6, but gave them multiple-choice questions from age 8.However, we did not change the form of questioning for Curiosity and Logical Problem-Solving, whichshowed similar trends of an additional contribution from age 5 performance to age-12 performance.
Table 25 Partial correlations for selected models for age 12 competencies
Competency
Partial correlations of each year’s results with age-12 results.This may be seen as the extent of any lasting impact.
5 6 8 10Curiosity 0.156 0.119 0.100 0.219Perseverance 0.043 0.173 0.337 0.298Individual Responsibility 0.065 0.102 0.325 0.266Social Skills with Peers -0.022 0.206 0.248 0.201Social Skills with Adults 0.082 0.040 0.128 0.203Communication 0.030 0.048 0.260 0.343Mathematics 0.213 -0.046 0.291 0.387PAT Reading Comprehension 0.060 0.004 0.184 0.636Burt Word Reading 0.070 -0.042 0.184 0.576Writing 0.089 0.434 0.061 0.297Reading Age 0.080 0.146 0.128 0.355Logical Problem-Solving 0.145 0.107 0.218 0.422
Correlations less than about 0.12 cannot be considered as different from zero with the sample size wehave. Correlations below 0.3 are weak, so although we see some contribution to age-12 scores fromearlier performance levels, earlier performance levels alone cannot account for the age-12 scores.
Path analysisWe used path analysis to confirm the picture from the partial correlations analysis that earlier stages werenot entirely subsumed into later performance scores, but made their own contribution, and also to see the
general relationships over time between the social and attitudinal competencies, and the achievementcompetencies.
First, we undertook factor analyses for the competency scores at ages 8, 10, and 12, which in each casegave 2 factors, one we have called “achievement” (abbreviated to Achmt in the model below), and theother “social and attitudinal competency” (abbreviated to Compt in the model below).
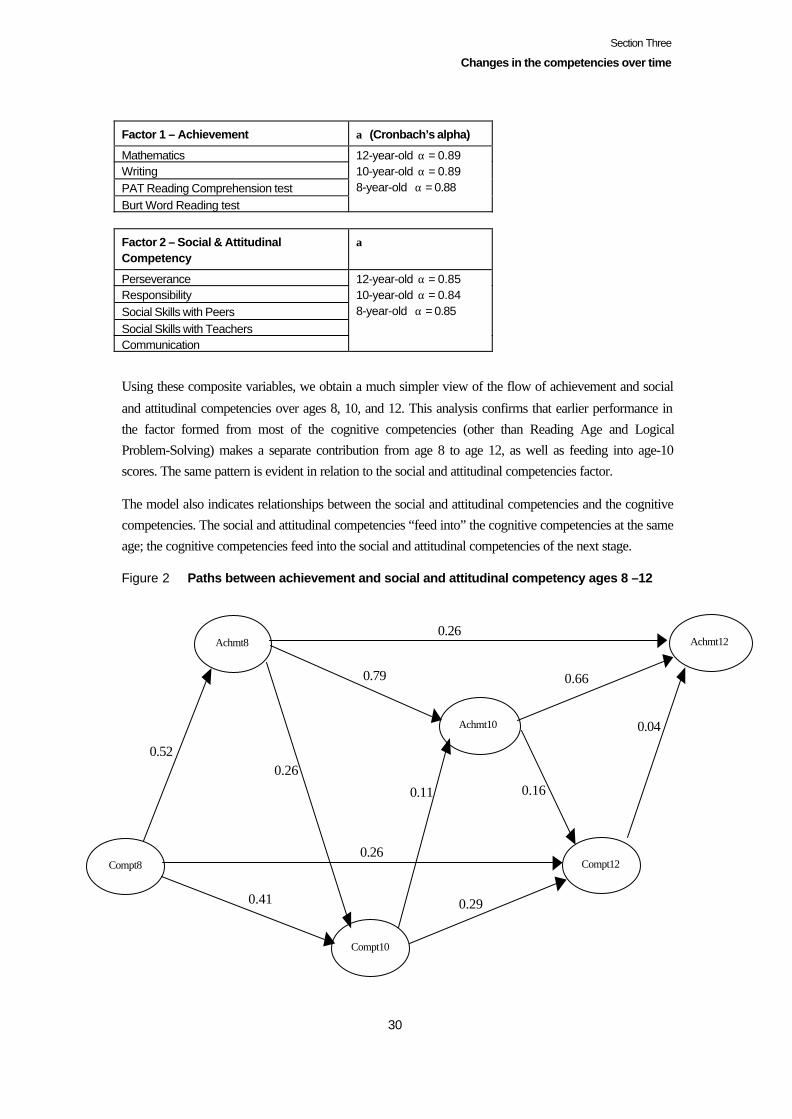
Section Three
Changes in the competencies over time
30
Factor 1 – Achievement α (Cronbach’s alpha)
MathematicsWritingPAT Reading Comprehension testBurt Word Reading test
12-year-old α = 0.8910-year-old α = 0.898-year-old α = 0.88
Factor 2 – Social & AttitudinalCompetency
α
PerseveranceResponsibilitySocial Skills with PeersSocial Skills with TeachersCommunication
12-year-old α = 0.8510-year-old α = 0.848-year-old α = 0.85
Using these composite variables, we obtain a much simpler view of the flow of achievement and social
and attitudinal competencies over ages 8, 10, and 12. This analysis confirms that earlier performance inthe factor formed from most of the cognitive competencies (other than Reading Age and LogicalProblem-Solving) makes a separate contribution from age 8 to age 12, as well as feeding into age-10scores. The same pattern is evident in relation to the social and attitudinal competencies factor.
The model also indicates relationships between the social and attitudinal competencies and the cognitivecompetencies. The social and attitudinal competencies “feed into” the cognitive competencies at the sameage; the cognitive competencies feed into the social and attitudinal competencies of the next stage.
Figure 2 Paths between achievement and social and attitudinal competency ages 8 –12
0.29
Achmt10
Achmt12Achmt8
Compt10
Compt12Compt8
0.66 0.79
0.04
0.26
0.26
0.41
0.52
0.11 0.160.26

Section Three
Changes in the competencies over time
31
Path coefficients
To:From: Achievement
at age 12Achievement
at age 10Achievement
at age 8Social &
AttitudinalCompetency
at age 12
Social &Attitudinal
Competencyat age 10
Achievement at age 10 0.66 - - 0.16 -Achievement at age 8 0.26 0.79 - - 0.26Social & AttitudinalCompetency at age 12
0.04 - - - -
Social & AttitudinalCompetency at age 10
- 0.11 - 0.29 -
Social & AttitudinalCompetency at age 8
- - 0.52 0.26 0.41
R2 statistics 0.81 0.71 0.27 0.34 0.35
Fit statistics
Pr > Chi-Square 0.7131Bentler's Comparative Fit Index 1.0000Bentler & Bonett's (1980) Non-normed Index 1.0035Bentler & Bonett's (1980) NFI 0.9990
Movement between quartiles
Previous reports from the study have shown that there are different patterns of performance for childrenwho start school with different levels of knowledge and skills. This result is consistent with other studies
showing a “Matthew effect”, with children who start at relatively high levels more likely to continue toperform at that level, and those who start at relatively low levels, more likely to continue to perform at alower level than their peers. There was more volatility among those who start school in the middle 2
quartiles of performance, and it was not until age 10 that we could see age 8 inclusion in the middle 2quartiles as showing higher retention rates, providing more guidance to subsequent performance.
The next 3 tables show the extent to which children stayed within the quartile group of their performanceat age 5, 8, and 10 (their retention), or moved from the top quartile (those scoring at or above the fourth
quartile) to the bottom quartile (those scoring at or below the first quartile), and vice versa, in terms oftheir performance at age 12. The tables are based on an estimate of the proportion of the group whichshould remain in the quartile if movements over time were based on chance alone, and give the
calculation of the difference from this estimate so that patterns for different competencies can becompared. A minus sign indicates that fewer children than the estimate were actually retained or moved.
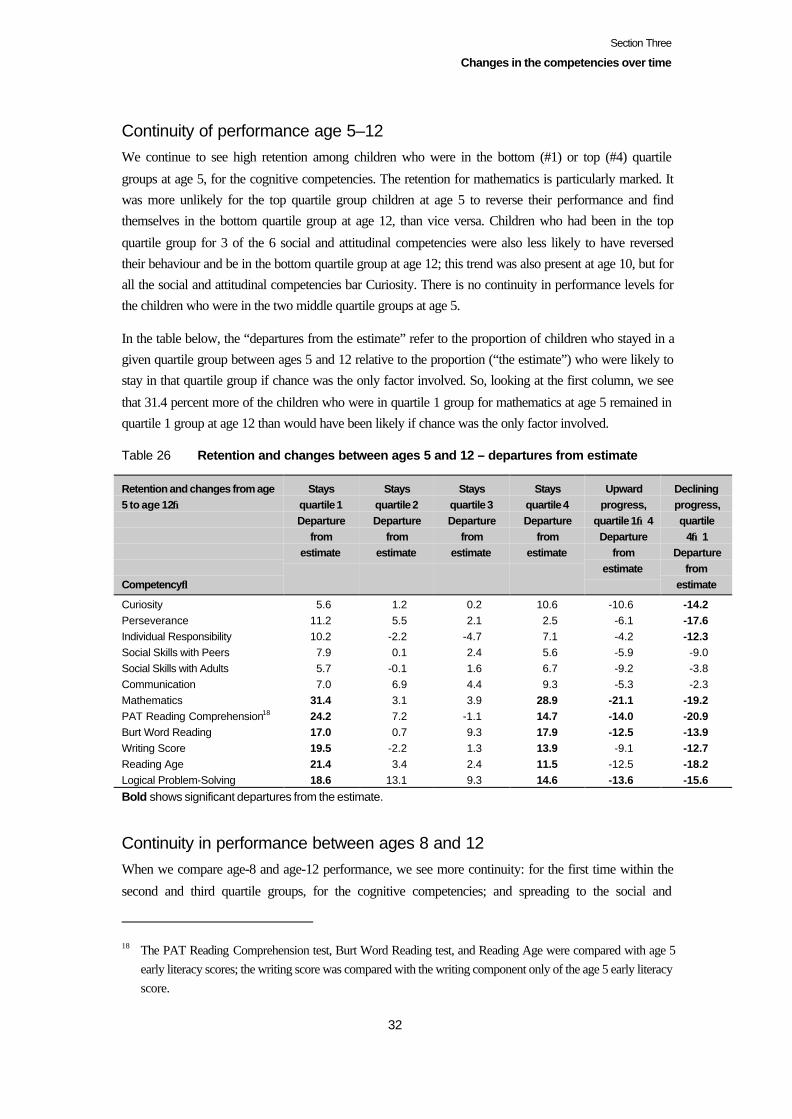
Section Three
Changes in the competencies over time
32
Continuity of performance age 5–12We continue to see high retention among children who were in the bottom (#1) or top (#4) quartile
groups at age 5, for the cognitive competencies. The retention for mathematics is particularly marked. Itwas more unlikely for the top quartile group children at age 5 to reverse their performance and findthemselves in the bottom quartile group at age 12, than vice versa. Children who had been in the top
quartile group for 3 of the 6 social and attitudinal competencies were also less likely to have reversedtheir behaviour and be in the bottom quartile group at age 12; this trend was also present at age 10, but forall the social and attitudinal competencies bar Curiosity. There is no continuity in performance levels forthe children who were in the two middle quartile groups at age 5.
In the table below, the “departures from the estimate” refer to the proportion of children who stayed in agiven quartile group between ages 5 and 12 relative to the proportion (“the estimate”) who were likely tostay in that quartile group if chance was the only factor involved. So, looking at the first column, we see
that 31.4 percent more of the children who were in quartile 1 group for mathematics at age 5 remained inquartile 1 group at age 12 than would have been likely if chance was the only factor involved.
Table 26 Retention and changes between ages 5 and 12 – departures from estimate
Retention and changes from age5 to age 12→
Competency↓
Staysquartile 1Departure
fromestimate
Staysquartile 2Departure
fromestimate
Staysquartile 3Departure
fromestimate
Staysquartile 4Departure
fromestimate
Upwardprogress,
quartile 1→4Departure
fromestimate
Decliningprogress,quartile
4→1Departure
fromestimate
Curiosity 5.6 1.2 0.2 10.6 -10.6 -14.2Perseverance 11.2 5.5 2.1 2.5 -6.1 -17.6Individual Responsibility 10.2 -2.2 -4.7 7.1 -4.2 -12.3Social Skills with Peers 7.9 0.1 2.4 5.6 -5.9 -9.0Social Skills with Adults 5.7 -0.1 1.6 6.7 -9.2 -3.8Communication 7.0 6.9 4.4 9.3 -5.3 -2.3Mathematics 31.4 3.1 3.9 28.9 -21.1 -19.2PAT Reading Comprehension18 24.2 7.2 -1.1 14.7 -14.0 -20.9Burt Word Reading 17.0 0.7 9.3 17.9 -12.5 -13.9Writing Score 19.5 -2.2 1.3 13.9 -9.1 -12.7Reading Age 21.4 3.4 2.4 11.5 -12.5 -18.2Logical Problem-Solving 18.6 13.1 9.3 14.6 -13.6 -15.6
Bold shows significant departures from the estimate.
Continuity in performance between ages 8 and 12When we compare age-8 and age-12 performance, we see more continuity: for the first time within the
second and third quartile groups, for the cognitive competencies; and spreading to the social and
18 The PAT Reading Comprehension test, Burt Word Reading test, and Reading Age were compared with age 5early literacy scores; the writing score was compared with the writing component only of the age 5 early literacyscore.
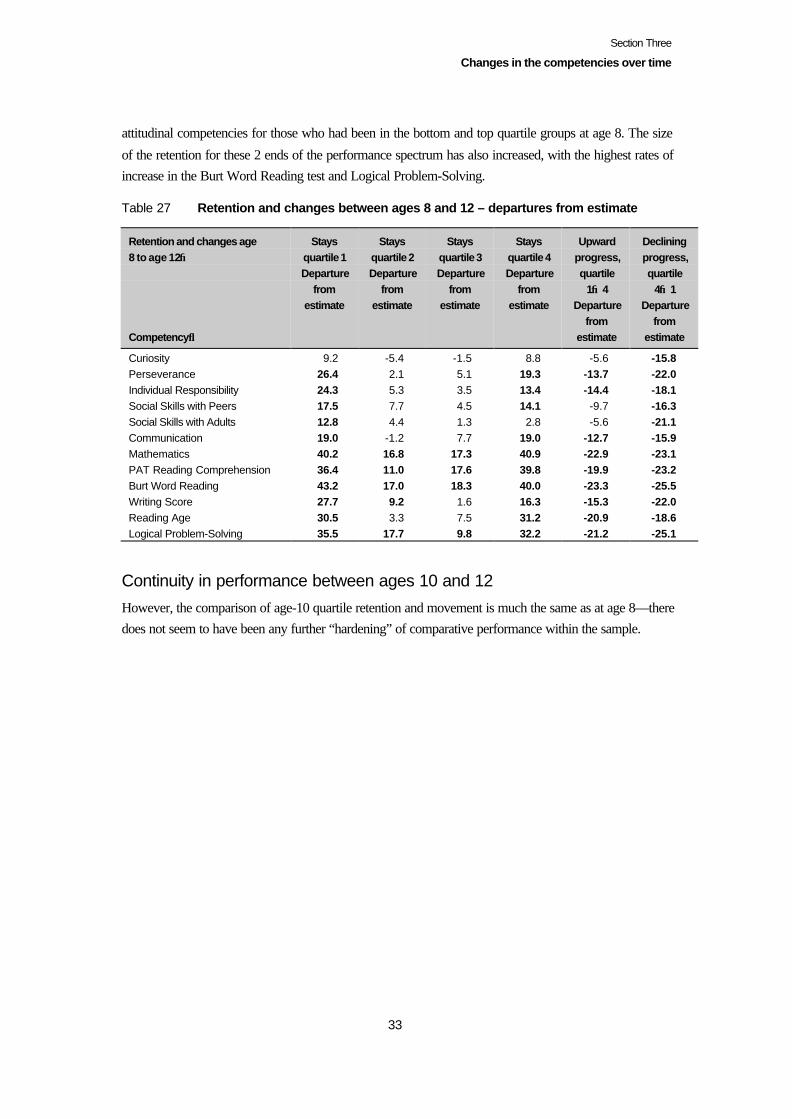
Section Three
Changes in the competencies over time
33
attitudinal competencies for those who had been in the bottom and top quartile groups at age 8. The size
of the retention for these 2 ends of the performance spectrum has also increased, with the highest rates ofincrease in the Burt Word Reading test and Logical Problem-Solving.
Table 27 Retention and changes between ages 8 and 12 – departures from estimate
Retention and changes age8 to age 12→
Competency↓
Staysquartile 1Departure
fromestimate
Staysquartile 2Departure
fromestimate
Staysquartile 3Departure
fromestimate
Staysquartile 4Departure
fromestimate
Upwardprogress,quartile
1→4Departure
fromestimate
Decliningprogress,quartile
4→1Departure
fromestimate
Curiosity 9.2 -5.4 -1.5 8.8 -5.6 -15.8Perseverance 26.4 2.1 5.1 19.3 -13.7 -22.0Individual Responsibility 24.3 5.3 3.5 13.4 -14.4 -18.1Social Skills with Peers 17.5 7.7 4.5 14.1 -9.7 -16.3Social Skills with Adults 12.8 4.4 1.3 2.8 -5.6 -21.1Communication 19.0 -1.2 7.7 19.0 -12.7 -15.9Mathematics 40.2 16.8 17.3 40.9 -22.9 -23.1PAT Reading Comprehension 36.4 11.0 17.6 39.8 -19.9 -23.2Burt Word Reading 43.2 17.0 18.3 40.0 -23.3 -25.5Writing Score 27.7 9.2 1.6 16.3 -15.3 -22.0Reading Age 30.5 3.3 7.5 31.2 -20.9 -18.6Logical Problem-Solving 35.5 17.7 9.8 32.2 -21.2 -25.1
Continuity in performance between ages 10 and 12
However, the comparison of age-10 quartile retention and movement is much the same as at age 8—theredoes not seem to have been any further “hardening” of comparative performance within the sample.
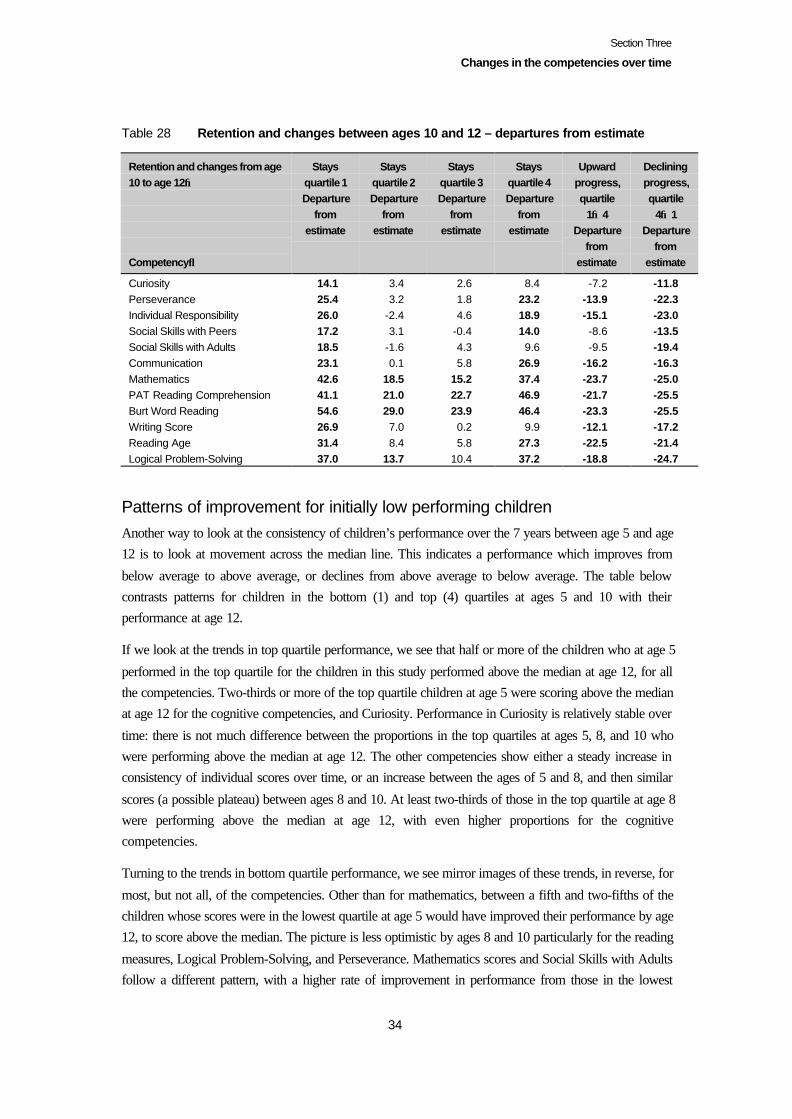
Section Three
Changes in the competencies over time
34
Table 28 Retention and changes between ages 10 and 12 – departures from estimate
Retention and changes from age10 to age 12→
Competency↓
Staysquartile 1Departure
fromestimate
Staysquartile 2Departure
fromestimate
Staysquartile 3Departure
fromestimate
Staysquartile 4Departure
fromestimate
Upwardprogress,quartile
1→4Departure
fromestimate
Decliningprogress,quartile
4→1Departure
fromestimate
Curiosity 14.1 3.4 2.6 8.4 -7.2 -11.8Perseverance 25.4 3.2 1.8 23.2 -13.9 -22.3Individual Responsibility 26.0 -2.4 4.6 18.9 -15.1 -23.0Social Skills with Peers 17.2 3.1 -0.4 14.0 -8.6 -13.5Social Skills with Adults 18.5 -1.6 4.3 9.6 -9.5 -19.4Communication 23.1 0.1 5.8 26.9 -16.2 -16.3Mathematics 42.6 18.5 15.2 37.4 -23.7 -25.0PAT Reading Comprehension 41.1 21.0 22.7 46.9 -21.7 -25.5Burt Word Reading 54.6 29.0 23.9 46.4 -23.3 -25.5Writing Score 26.9 7.0 0.2 9.9 -12.1 -17.2Reading Age 31.4 8.4 5.8 27.3 -22.5 -21.4Logical Problem-Solving 37.0 13.7 10.4 37.2 -18.8 -24.7
Patterns of improvement for initially low performing childrenAnother way to look at the consistency of children’s performance over the 7 years between age 5 and age12 is to look at movement across the median line. This indicates a performance which improves from
below average to above average, or declines from above average to below average. The table belowcontrasts patterns for children in the bottom (1) and top (4) quartiles at ages 5 and 10 with theirperformance at age 12.
If we look at the trends in top quartile performance, we see that half or more of the children who at age 5
performed in the top quartile for the children in this study performed above the median at age 12, for allthe competencies. Two-thirds or more of the top quartile children at age 5 were scoring above the medianat age 12 for the cognitive competencies, and Curiosity. Performance in Curiosity is relatively stable over
time: there is not much difference between the proportions in the top quartiles at ages 5, 8, and 10 whowere performing above the median at age 12. The other competencies show either a steady increase inconsistency of individual scores over time, or an increase between the ages of 5 and 8, and then similar
scores (a possible plateau) between ages 8 and 10. At least two-thirds of those in the top quartile at age 8were performing above the median at age 12, with even higher proportions for the cognitivecompetencies.
Turning to the trends in bottom quartile performance, we see mirror images of these trends, in reverse, for
most, but not all, of the competencies. Other than for mathematics, between a fifth and two-fifths of thechildren whose scores were in the lowest quartile at age 5 would have improved their performance by age12, to score above the median. The picture is less optimistic by ages 8 and 10 particularly for the reading
measures, Logical Problem-Solving, and Perseverance. Mathematics scores and Social Skills with Adultsfollow a different pattern, with a higher rate of improvement in performance from those in the lowest

Section Three
Changes in the competencies over time
35
quartile at age 8, than those in the lowest quartile at age 10. Why this should be so is not clear. When we
did the same analysis when the study children were aged 10, we found much lower proportions ofchildren moving from the bottom quartile above the median between ages 8 and 10 for mathematics andSocial Skills with Aults, and to a lesser extent, PAT Reading Comprehension and Reading Age scores.
Thus more of the children who were in the bottom quartile at age 8 have made progress in the last 2 yearsthan seemed likely. This underlines the fact that although the windows of opportunity to improveperformance do seem to narrow over time, particularly by the end of the first 3 years of school, they are
not locked. The opportunities – experiences and relationships – available to children can make a markeddifference.
Table 29 Retention and movement of children in quartiles 1 and 4 at age 5 and 8, in
relation to the median at age 12
Retention and movement →
Competency ↓
% ofquartile 1at age 5above
median atage 12
% ofquartile 1at age 8
above themedian at
age 12
% ofquartile 1at age 10above themedian at
age 12
% ofquartile 4at age 5
above themedian at
age 12
% ofquartile 4at age 8
above themedian at
age 12
% ofquartile 4at age 10above themedian at
age 12
Curiosity 37 31 36 66 65 57Perseverance 21 13 11 49 62 69Individual Responsibility 33 19 18 60 66 67Social Skills with Peers 39 30 31 60 67 69Social Skills with Adults 20 39 29 49 69 71Communication 38 29 20 59 72 80Mathematics 13 21 4 77 87 89PAT Reading Comprehension 27 12 9 72 88 97Burt Word Reading 27 6 2 64 86 97Writing 21 26 25 65 73 72Reading Age 31 15 11 60 78 78Logical Problem-Solving 30 14 19 66 86 87
Differences in population sub-groupsNext we compare the movements of the lowest and highest quartiles of children at ages 5 and 8, in
relation to their performance at age 12 in terms of 4 characteristics: gender, ethnicity, family income, andmaternal qualification. Section Six provides more information about the distribution of thesecharacteristics among the study children and their families at age 12, and associations with their
competency levels at age 12. There are some trends evident in the material, though differences forindividual competencies cannot be regarded as statistically significant because of the small numbersinvolved in some of the sub-groups.
GenderBoys make up around two-thirds of the bottom quartile at both ages 5 and 8 for most of the competencies.
There are some differences in the patterns of progress of girls and boys from the lowest quartiles. Girlswho scored in the lowest quartile at ages 5 and 8 were more likely than their male counterparts to have
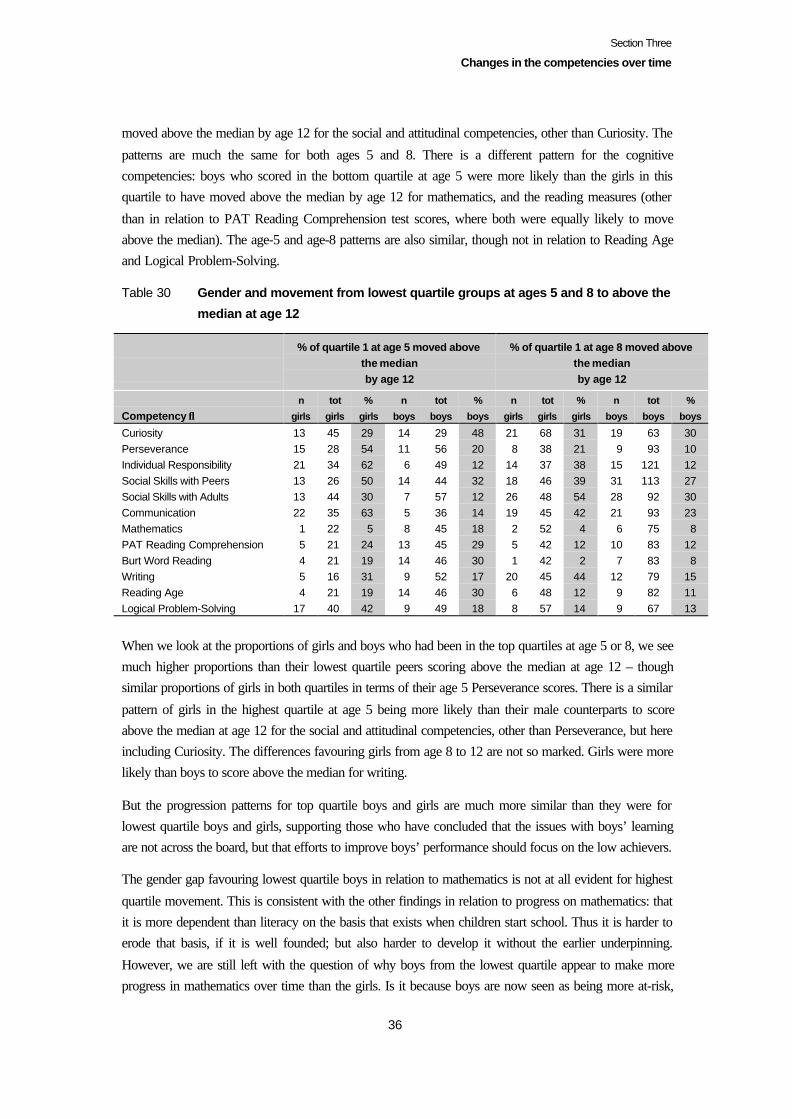
Section Three
Changes in the competencies over time
36
moved above the median by age 12 for the social and attitudinal competencies, other than Curiosity. The
patterns are much the same for both ages 5 and 8. There is a different pattern for the cognitivecompetencies: boys who scored in the bottom quartile at age 5 were more likely than the girls in thisquartile to have moved above the median by age 12 for mathematics, and the reading measures (other
than in relation to PAT Reading Comprehension test scores, where both were equally likely to moveabove the median). The age-5 and age-8 patterns are also similar, though not in relation to Reading Ageand Logical Problem-Solving.
Table 30 Gender and movement from lowest quartile groups at ages 5 and 8 to above the
median at age 12
% of quartile 1 at age 5 moved abovethe medianby age 12
% of quartile 1 at age 8 moved abovethe medianby age 12
Competency ↓n
girls
tot
girls
%
girls
n
boys
tot
boys
%
boys
n
girls
tot
girls
%
girls
n
boys
tot
boys
%
boys
Curiosity 13 45 29 14 29 48 21 68 31 19 63 30Perseverance 15 28 54 11 56 20 8 38 21 9 93 10Individual Responsibility 21 34 62 6 49 12 14 37 38 15 121 12Social Skills with Peers 13 26 50 14 44 32 18 46 39 31 113 27Social Skills with Adults 13 44 30 7 57 12 26 48 54 28 92 30Communication 22 35 63 5 36 14 19 45 42 21 93 23Mathematics 1 22 5 8 45 18 2 52 4 6 75 8PAT Reading Comprehension 5 21 24 13 45 29 5 42 12 10 83 12Burt Word Reading 4 21 19 14 46 30 1 42 2 7 83 8Writing 5 16 31 9 52 17 20 45 44 12 79 15Reading Age 4 21 19 14 46 30 6 48 12 9 82 11Logical Problem-Solving 17 40 42 9 49 18 8 57 14 9 67 13
When we look at the proportions of girls and boys who had been in the top quartiles at age 5 or 8, we seemuch higher proportions than their lowest quartile peers scoring above the median at age 12 – thoughsimilar proportions of girls in both quartiles in terms of their age 5 Perseverance scores. There is a similar
pattern of girls in the highest quartile at age 5 being more likely than their male counterparts to scoreabove the median at age 12 for the social and attitudinal competencies, other than Perseverance, but hereincluding Curiosity. The differences favouring girls from age 8 to 12 are not so marked. Girls were morelikely than boys to score above the median for writing.
But the progression patterns for top quartile boys and girls are much more similar than they were forlowest quartile boys and girls, supporting those who have concluded that the issues with boys’ learningare not across the board, but that efforts to improve boys’ performance should focus on the low achievers.
The gender gap favouring lowest quartile boys in relation to mathematics is not at all evident for highest
quartile movement. This is consistent with the other findings in relation to progress on mathematics: thatit is more dependent than literacy on the basis that exists when children start school. Thus it is harder toerode that basis, if it is well founded; but also harder to develop it without the earlier underpinning.
However, we are still left with the question of why boys from the lowest quartile appear to make moreprogress in mathematics over time than the girls. Is it because boys are now seen as being more at-risk,
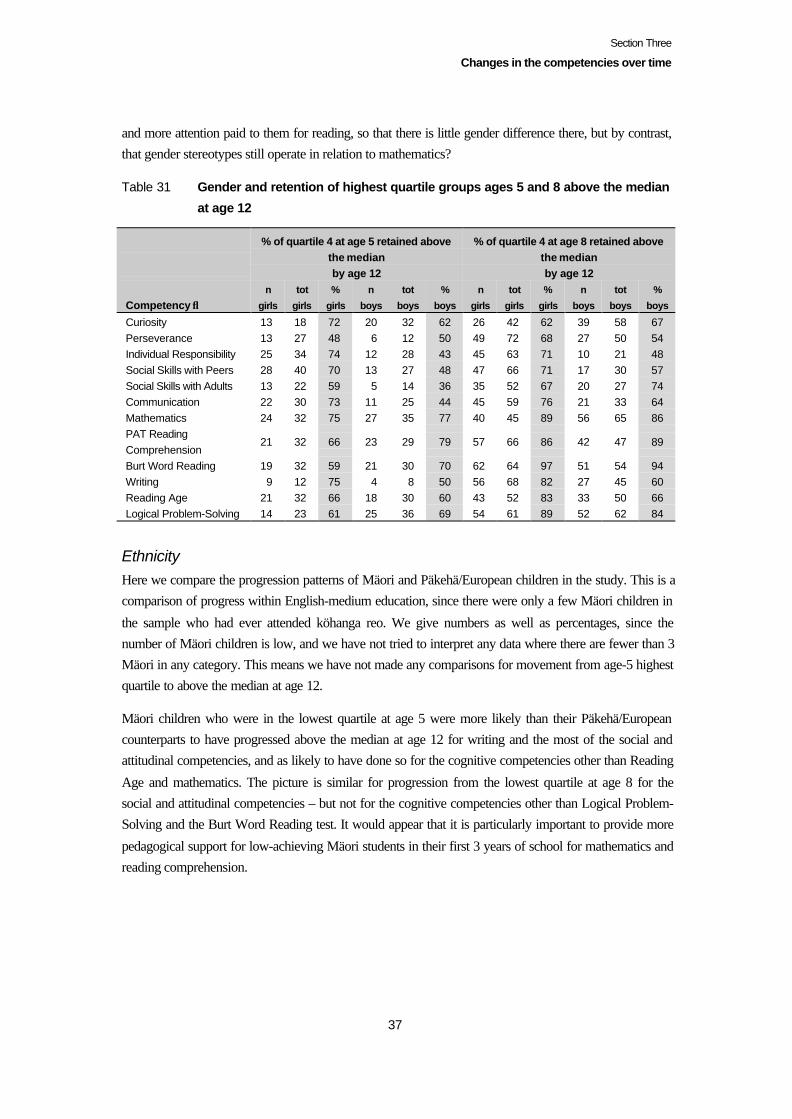
Section Three
Changes in the competencies over time
37
and more attention paid to them for reading, so that there is little gender difference there, but by contrast,that gender stereotypes still operate in relation to mathematics?
Table 31 Gender and retention of highest quartile groups ages 5 and 8 above the median
at age 12
% of quartile 4 at age 5 retained abovethe medianby age 12
% of quartile 4 at age 8 retained abovethe medianby age 12
Competency ↓n
girls
tot
girls
%
girls
n
boys
tot
boys
%
boys
n
girls
tot
girls
%
girls
n
boys
tot
boys
%
boys
Curiosity 13 18 72 20 32 62 26 42 62 39 58 67Perseverance 13 27 48 6 12 50 49 72 68 27 50 54Individual Responsibility 25 34 74 12 28 43 45 63 71 10 21 48Social Skills with Peers 28 40 70 13 27 48 47 66 71 17 30 57Social Skills with Adults 13 22 59 5 14 36 35 52 67 20 27 74Communication 22 30 73 11 25 44 45 59 76 21 33 64Mathematics 24 32 75 27 35 77 40 45 89 56 65 86PAT ReadingComprehension
21 32 66 23 29 79 57 66 86 42 47 89
Burt Word Reading 19 32 59 21 30 70 62 64 97 51 54 94Writing 9 12 75 4 8 50 56 68 82 27 45 60Reading Age 21 32 66 18 30 60 43 52 83 33 50 66Logical Problem-Solving 14 23 61 25 36 69 54 61 89 52 62 84
EthnicityHere we compare the progression patterns of Mäori and Päkehä/European children in the study. This is acomparison of progress within English-medium education, since there were only a few Mäori children in
the sample who had ever attended köhanga reo. We give numbers as well as percentages, since thenumber of Mäori children is low, and we have not tried to interpret any data where there are fewer than 3Mäori in any category. This means we have not made any comparisons for movement from age-5 highestquartile to above the median at age 12.
Mäori children who were in the lowest quartile at age 5 were more likely than their Päkehä/Europeancounterparts to have progressed above the median at age 12 for writing and the most of the social andattitudinal competencies, and as likely to have done so for the cognitive competencies other than Reading
Age and mathematics. The picture is similar for progression from the lowest quartile at age 8 for thesocial and attitudinal competencies – but not for the cognitive competencies other than Logical Problem-Solving and the Burt Word Reading test. It would appear that it is particularly important to provide more
pedagogical support for low-achieving Mäori students in their first 3 years of school for mathematics andreading comprehension.
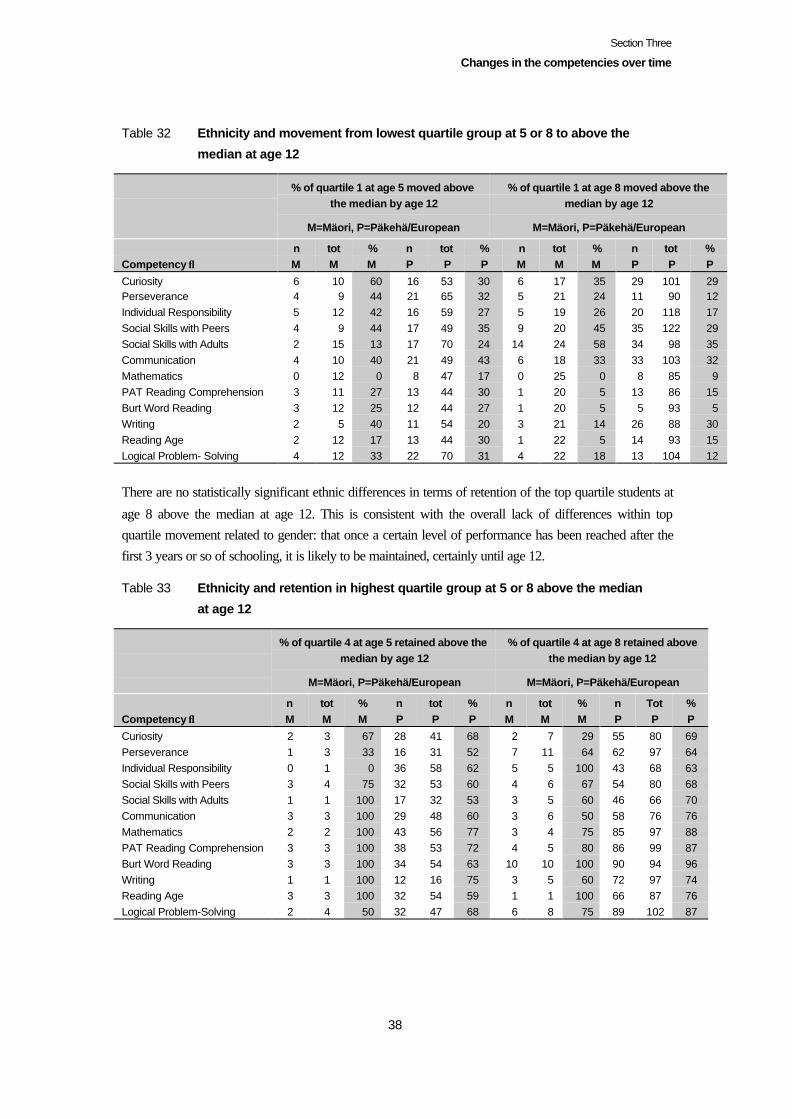
Section Three
Changes in the competencies over time
38
Table 32 Ethnicity and movement from lowest quartile group at 5 or 8 to above the
median at age 12
% of quartile 1 at age 5 moved abovethe median by age 12
M=Mäori, P=Päkehä/European
% of quartile 1 at age 8 moved above themedian by age 12
M=Mäori, P=Päkehä/European
Competency ↓nM
totM
%M
nP
totP
%P
nM
totM
%M
nP
totP
%P
Curiosity 6 10 60 16 53 30 6 17 35 29 101 29Perseverance 4 9 44 21 65 32 5 21 24 11 90 12Individual Responsibility 5 12 42 16 59 27 5 19 26 20 118 17Social Skills with Peers 4 9 44 17 49 35 9 20 45 35 122 29Social Skills with Adults 2 15 13 17 70 24 14 24 58 34 98 35Communication 4 10 40 21 49 43 6 18 33 33 103 32Mathematics 0 12 0 8 47 17 0 25 0 8 85 9PAT Reading Comprehension 3 11 27 13 44 30 1 20 5 13 86 15Burt Word Reading 3 12 25 12 44 27 1 20 5 5 93 5Writing 2 5 40 11 54 20 3 21 14 26 88 30Reading Age 2 12 17 13 44 30 1 22 5 14 93 15Logical Problem- Solving 4 12 33 22 70 31 4 22 18 13 104 12
There are no statistically significant ethnic differences in terms of retention of the top quartile students at
age 8 above the median at age 12. This is consistent with the overall lack of differences within topquartile movement related to gender: that once a certain level of performance has been reached after thefirst 3 years or so of schooling, it is likely to be maintained, certainly until age 12.
Table 33 Ethnicity and retention in highest quartile group at 5 or 8 above the median
at age 12
% of quartile 4 at age 5 retained above themedian by age 12
M=Mäori, P=Päkehä/European
% of quartile 4 at age 8 retained abovethe median by age 12
M=Mäori, P=Päkehä/European
Competency ↓nM
totM
%M
nP
totP
%P
nM
totM
%M
nP
TotP
%P
Curiosity 2 3 67 28 41 68 2 7 29 55 80 69Perseverance 1 3 33 16 31 52 7 11 64 62 97 64Individual Responsibility 0 1 0 36 58 62 5 5 100 43 68 63Social Skills with Peers 3 4 75 32 53 60 4 6 67 54 80 68Social Skills with Adults 1 1 100 17 32 53 3 5 60 46 66 70Communication 3 3 100 29 48 60 3 6 50 58 76 76Mathematics 2 2 100 43 56 77 3 4 75 85 97 88PAT Reading Comprehension 3 3 100 38 53 72 4 5 80 86 99 87Burt Word Reading 3 3 100 34 54 63 10 10 100 90 94 96Writing 1 1 100 12 16 75 3 5 60 72 97 74Reading Age 3 3 100 32 54 59 1 1 100 66 87 76Logical Problem-Solving 2 4 50 32 47 68 6 8 75 89 102 87
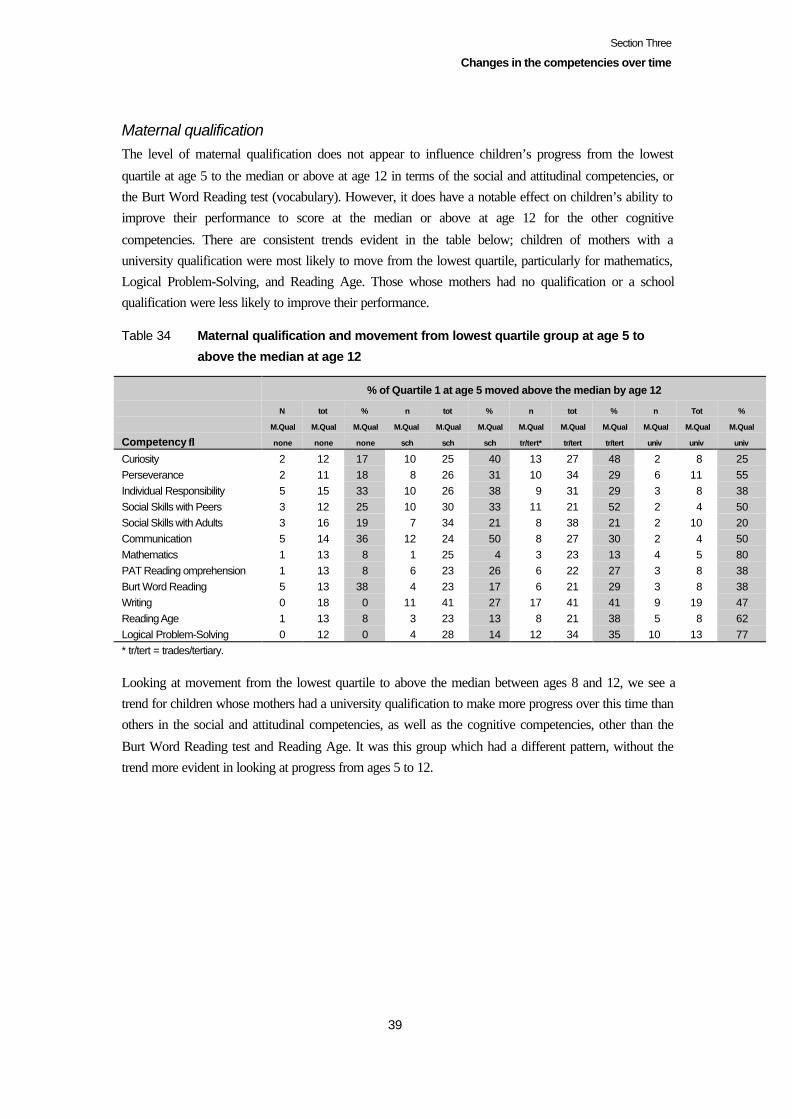
Section Three
Changes in the competencies over time
39
Maternal qualificationThe level of maternal qualification does not appear to influence children’s progress from the lowest
quartile at age 5 to the median or above at age 12 in terms of the social and attitudinal competencies, orthe Burt Word Reading test (vocabulary). However, it does have a notable effect on children’s ability toimprove their performance to score at the median or above at age 12 for the other cognitive
competencies. There are consistent trends evident in the table below; children of mothers with auniversity qualification were most likely to move from the lowest quartile, particularly for mathematics,Logical Problem-Solving, and Reading Age. Those whose mothers had no qualification or a schoolqualification were less likely to improve their performance.
Table 34 Maternal qualification and movement from lowest quartile group at age 5 to
above the median at age 12
% of Quartile 1 at age 5 moved above the median by age 12
Competency ↓
N
M.Qual
none
tot
M.Qual
none
%
M.Qual
none
n
M.Qual
sch
tot
M.Qual
sch
%
M.Qual
sch
n
M.Qual
tr/tert*
tot
M.Qual
tr/tert
%
M.Qual
tr/tert
n
M.Qual
univ
Tot
M.Qual
univ
%
M.Qual
univ
Curiosity 2 12 17 10 25 40 13 27 48 2 8 25Perseverance 2 11 18 8 26 31 10 34 29 6 11 55Individual Responsibility 5 15 33 10 26 38 9 31 29 3 8 38Social Skills with Peers 3 12 25 10 30 33 11 21 52 2 4 50Social Skills with Adults 3 16 19 7 34 21 8 38 21 2 10 20Communication 5 14 36 12 24 50 8 27 30 2 4 50Mathematics 1 13 8 1 25 4 3 23 13 4 5 80PAT Reading omprehension 1 13 8 6 23 26 6 22 27 3 8 38Burt Word Reading 5 13 38 4 23 17 6 21 29 3 8 38Writing 0 18 0 11 41 27 17 41 41 9 19 47Reading Age 1 13 8 3 23 13 8 21 38 5 8 62Logical Problem-Solving 0 12 0 4 28 14 12 34 35 10 13 77* tr/tert = trades/tertiary.
Looking at movement from the lowest quartile to above the median between ages 8 and 12, we see atrend for children whose mothers had a university qualification to make more progress over this time thanothers in the social and attitudinal competencies, as well as the cognitive competencies, other than the
Burt Word Reading test and Reading Age. It was this group which had a different pattern, without thetrend more evident in looking at progress from ages 5 to 12.
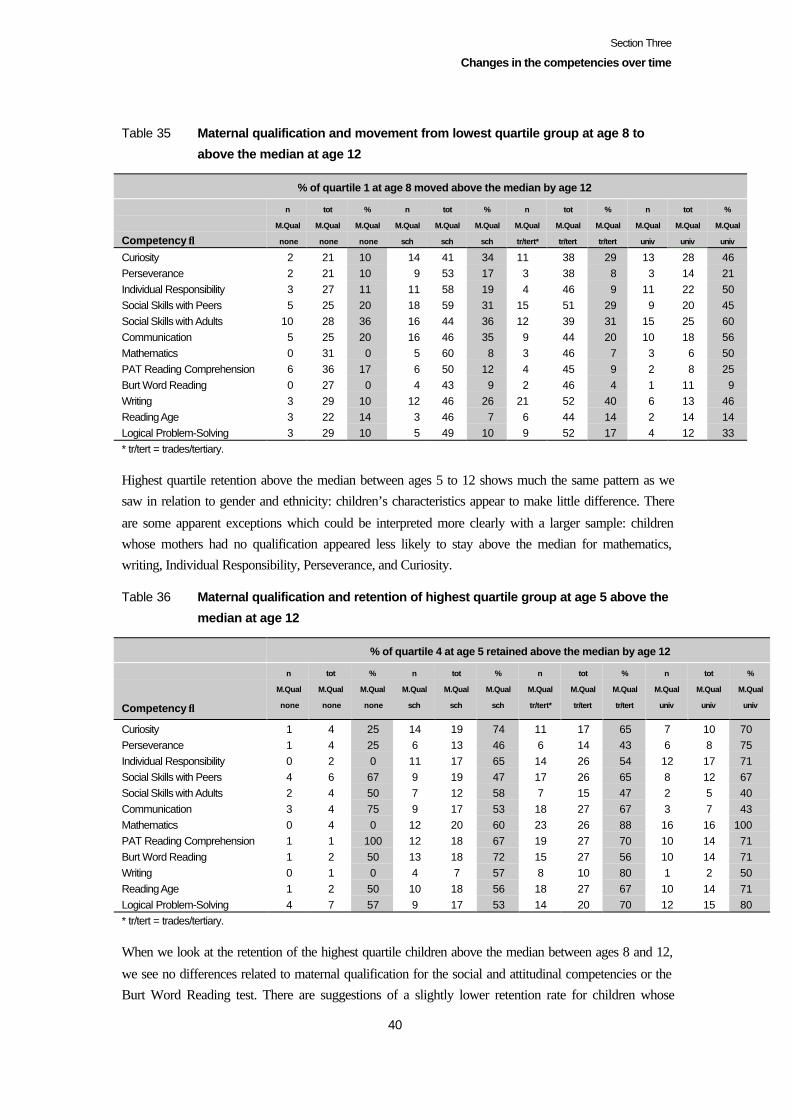
Section Three
Changes in the competencies over time
40
Table 35 Maternal qualification and movement from lowest quartile group at age 8 to
above the median at age 12
% of quartile 1 at age 8 moved above the median by age 12
Competency ↓
n
M.Qual
none
tot
M.Qual
none
%
M.Qual
none
n
M.Qual
sch
tot
M.Qual
sch
%
M.Qual
sch
n
M.Qual
tr/tert*
tot
M.Qual
tr/tert
%
M.Qual
tr/tert
n
M.Qual
univ
tot
M.Qual
univ
%
M.Qual
univ
Curiosity 2 21 10 14 41 34 11 38 29 13 28 46Perseverance 2 21 10 9 53 17 3 38 8 3 14 21Individual Responsibility 3 27 11 11 58 19 4 46 9 11 22 50Social Skills with Peers 5 25 20 18 59 31 15 51 29 9 20 45Social Skills with Adults 10 28 36 16 44 36 12 39 31 15 25 60Communication 5 25 20 16 46 35 9 44 20 10 18 56Mathematics 0 31 0 5 60 8 3 46 7 3 6 50PAT Reading Comprehension 6 36 17 6 50 12 4 45 9 2 8 25Burt Word Reading 0 27 0 4 43 9 2 46 4 1 11 9Writing 3 29 10 12 46 26 21 52 40 6 13 46Reading Age 3 22 14 3 46 7 6 44 14 2 14 14Logical Problem-Solving 3 29 10 5 49 10 9 52 17 4 12 33* tr/tert = trades/tertiary.
Highest quartile retention above the median between ages 5 to 12 shows much the same pattern as wesaw in relation to gender and ethnicity: children’s characteristics appear to make little difference. There
are some apparent exceptions which could be interpreted more clearly with a larger sample: childrenwhose mothers had no qualification appeared less likely to stay above the median for mathematics,writing, Individual Responsibility, Perseverance, and Curiosity.
Table 36 Maternal qualification and retention of highest quartile group at age 5 above the
median at age 12
% of quartile 4 at age 5 retained above the median by age 12
Competency ↓
n
M.Qual
none
tot
M.Qual
none
%
M.Qual
none
n
M.Qual
sch
tot
M.Qual
sch
%
M.Qual
sch
n
M.Qual
tr/tert*
tot
M.Qual
tr/tert
%
M.Qual
tr/tert
n
M.Qual
univ
tot
M.Qual
univ
%
M.Qual
univ
Curiosity 1 4 25 14 19 74 11 17 65 7 10 70Perseverance 1 4 25 6 13 46 6 14 43 6 8 75Individual Responsibility 0 2 0 11 17 65 14 26 54 12 17 71Social Skills with Peers 4 6 67 9 19 47 17 26 65 8 12 67Social Skills with Adults 2 4 50 7 12 58 7 15 47 2 5 40Communication 3 4 75 9 17 53 18 27 67 3 7 43Mathematics 0 4 0 12 20 60 23 26 88 16 16 100PAT Reading Comprehension 1 1 100 12 18 67 19 27 70 10 14 71Burt Word Reading 1 2 50 13 18 72 15 27 56 10 14 71Writing 0 1 0 4 7 57 8 10 80 1 2 50Reading Age 1 2 50 10 18 56 18 27 67 10 14 71Logical Problem-Solving 4 7 57 9 17 53 14 20 70 12 15 80* tr/tert = trades/tertiary.
When we look at the retention of the highest quartile children above the median between ages 8 and 12,
we see no differences related to maternal qualification for the social and attitudinal competencies or theBurt Word Reading test. There are suggestions of a slightly lower retention rate for children whose
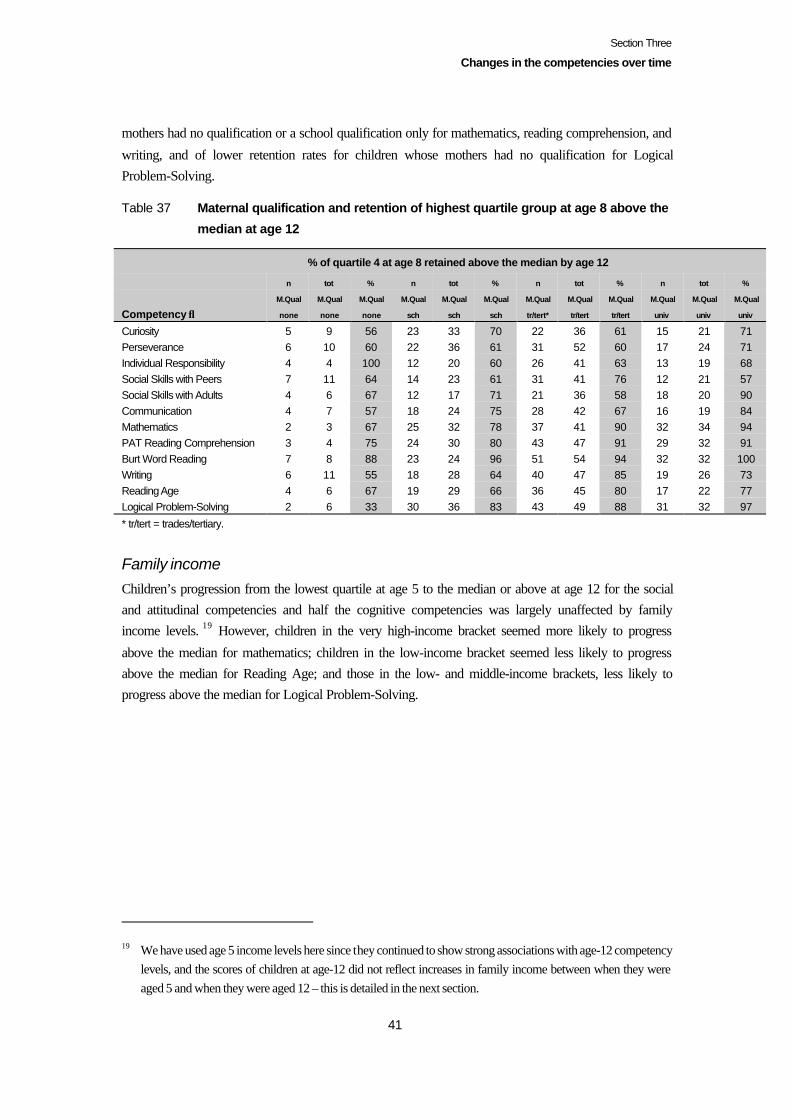
Section Three
Changes in the competencies over time
41
mothers had no qualification or a school qualification only for mathematics, reading comprehension, and
writing, and of lower retention rates for children whose mothers had no qualification for LogicalProblem-Solving.
Table 37 Maternal qualification and retention of highest quartile group at age 8 above the
median at age 12
% of quartile 4 at age 8 retained above the median by age 12
Competency ↓
n
M.Qual
none
tot
M.Qual
none
%
M.Qual
none
n
M.Qual
sch
tot
M.Qual
sch
%
M.Qual
sch
n
M.Qual
tr/tert*
tot
M.Qual
tr/tert
%
M.Qual
tr/tert
n
M.Qual
univ
tot
M.Qual
univ
%
M.Qual
univ
Curiosity 5 9 56 23 33 70 22 36 61 15 21 71Perseverance 6 10 60 22 36 61 31 52 60 17 24 71Individual Responsibility 4 4 100 12 20 60 26 41 63 13 19 68Social Skills with Peers 7 11 64 14 23 61 31 41 76 12 21 57Social Skills with Adults 4 6 67 12 17 71 21 36 58 18 20 90Communication 4 7 57 18 24 75 28 42 67 16 19 84Mathematics 2 3 67 25 32 78 37 41 90 32 34 94PAT Reading Comprehension 3 4 75 24 30 80 43 47 91 29 32 91Burt Word Reading 7 8 88 23 24 96 51 54 94 32 32 100Writing 6 11 55 18 28 64 40 47 85 19 26 73Reading Age 4 6 67 19 29 66 36 45 80 17 22 77Logical Problem-Solving 2 6 33 30 36 83 43 49 88 31 32 97
* tr/tert = trades/tertiary.
Family incomeChildren’s progression from the lowest quartile at age 5 to the median or above at age 12 for the socialand attitudinal competencies and half the cognitive competencies was largely unaffected by familyincome levels. 19 However, children in the very high-income bracket seemed more likely to progress
above the median for mathematics; children in the low-income bracket seemed less likely to progressabove the median for Reading Age; and those in the low- and middle-income brackets, less likely toprogress above the median for Logical Problem-Solving.
19 We have used age 5 income levels here since they continued to show strong associations with age-12 competencylevels, and the scores of children at age-12 did not reflect increases in family income between when they wereaged 5 and when they were aged 12 – this is detailed in the next section.
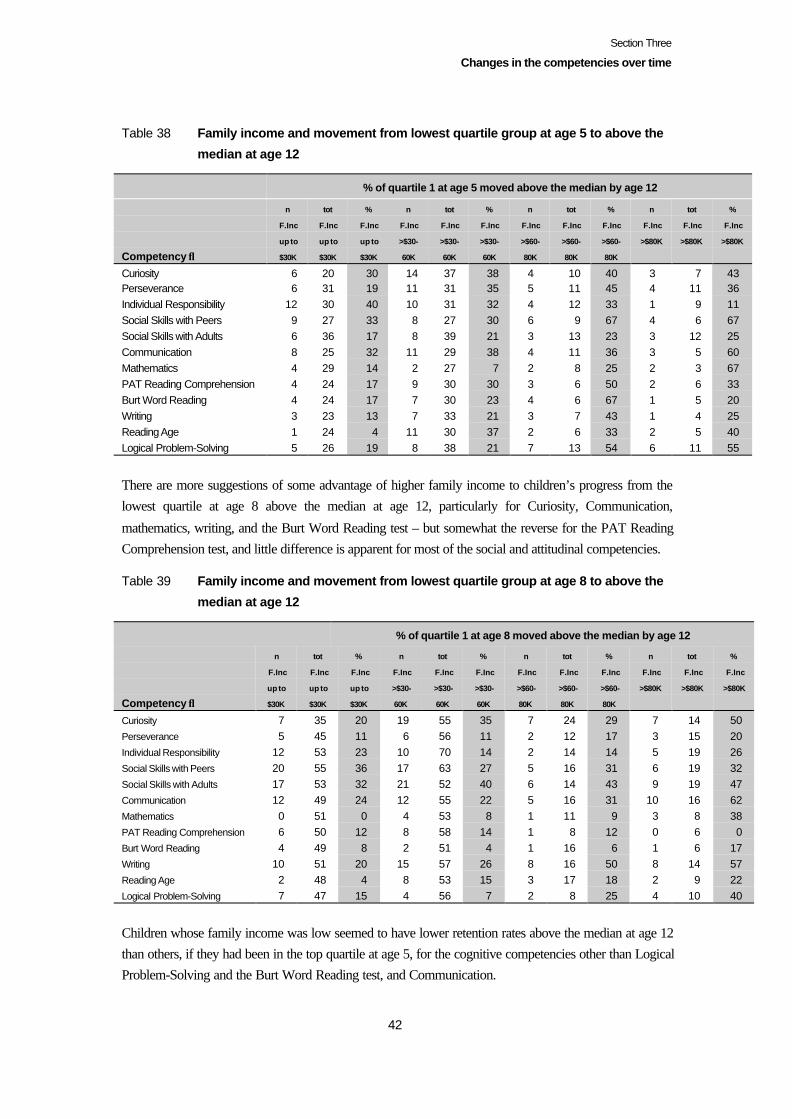
Section Three
Changes in the competencies over time
42
Table 38 Family income and movement from lowest quartile group at age 5 to above the
median at age 12
% of quartile 1 at age 5 moved above the median by age 12
Competency ↓
n
F.Inc
up to
$30K
tot
F.Inc
up to
$30K
%
F.Inc
up to
$30K
n
F.Inc
>$30-
60K
tot
F.Inc
>$30-
60K
%
F.Inc
>$30-
60K
n
F.Inc
>$60-
80K
tot
F.Inc
>$60-
80K
%
F.Inc
>$60-
80K
n
F.Inc
>$80K
tot
F.Inc
>$80K
%
F.Inc
>$80K
Curiosity 6 20 30 14 37 38 4 10 40 3 7 43Perseverance 6 31 19 11 31 35 5 11 45 4 11 36Individual Responsibility 12 30 40 10 31 32 4 12 33 1 9 11Social Skills with Peers 9 27 33 8 27 30 6 9 67 4 6 67Social Skills with Adults 6 36 17 8 39 21 3 13 23 3 12 25Communication 8 25 32 11 29 38 4 11 36 3 5 60Mathematics 4 29 14 2 27 7 2 8 25 2 3 67PAT Reading Comprehension 4 24 17 9 30 30 3 6 50 2 6 33Burt Word Reading 4 24 17 7 30 23 4 6 67 1 5 20Writing 3 23 13 7 33 21 3 7 43 1 4 25Reading Age 1 24 4 11 30 37 2 6 33 2 5 40Logical Problem-Solving 5 26 19 8 38 21 7 13 54 6 11 55
There are more suggestions of some advantage of higher family income to children’s progress from thelowest quartile at age 8 above the median at age 12, particularly for Curiosity, Communication,
mathematics, writing, and the Burt Word Reading test – but somewhat the reverse for the PAT ReadingComprehension test, and little difference is apparent for most of the social and attitudinal competencies.
Table 39 Family income and movement from lowest quartile group at age 8 to above the
median at age 12
% of quartile 1 at age 8 moved above the median by age 12
Competency ↓
n
F.Inc
up to
$30K
tot
F.Inc
up to
$30K
%
F.Inc
up to
$30K
n
F.Inc
>$30-
60K
tot
F.Inc
>$30-
60K
%
F.Inc
>$30-
60K
n
F.Inc
>$60-
80K
tot
F.Inc
>$60-
80K
%
F.Inc
>$60-
80K
n
F.Inc
>$80K
tot
F.Inc
>$80K
%
F.Inc
>$80K
Curiosity 7 35 20 19 55 35 7 24 29 7 14 50Perseverance 5 45 11 6 56 11 2 12 17 3 15 20Individual Responsibility 12 53 23 10 70 14 2 14 14 5 19 26Social Skills with Peers 20 55 36 17 63 27 5 16 31 6 19 32Social Skills with Adults 17 53 32 21 52 40 6 14 43 9 19 47Communication 12 49 24 12 55 22 5 16 31 10 16 62Mathematics 0 51 0 4 53 8 1 11 9 3 8 38PAT Reading Comprehension 6 50 12 8 58 14 1 8 12 0 6 0Burt Word Reading 4 49 8 2 51 4 1 16 6 1 6 17Writing 10 51 20 15 57 26 8 16 50 8 14 57Reading Age 2 48 4 8 53 15 3 17 18 2 9 22Logical Problem-Solving 7 47 15 4 56 7 2 8 25 4 10 40
Children whose family income was low seemed to have lower retention rates above the median at age 12than others, if they had been in the top quartile at age 5, for the cognitive competencies other than LogicalProblem-Solving and the Burt Word Reading test, and Communication.
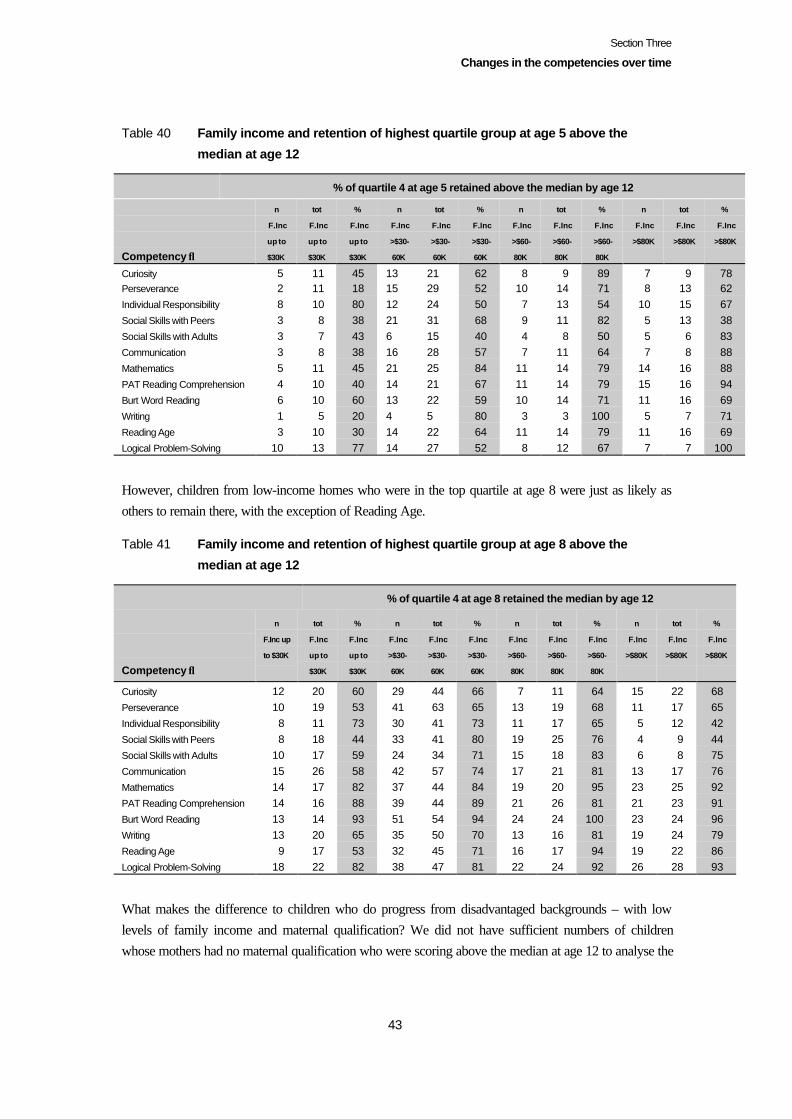
Section Three
Changes in the competencies over time
43
Table 40 Family income and retention of highest quartile group at age 5 above the
median at age 12
% of quartile 4 at age 5 retained above the median by age 12
Competency ↓
n
F.Inc
up to
$30K
tot
F.Inc
up to
$30K
%
F.Inc
up to
$30K
n
F.Inc
>$30-
60K
tot
F.Inc
>$30-
60K
%
F.Inc
>$30-
60K
n
F.Inc
>$60-
80K
tot
F.Inc
>$60-
80K
%
F.Inc
>$60-
80K
n
F.Inc
>$80K
tot
F.Inc
>$80K
%
F.Inc
>$80K
Curiosity 5 11 45 13 21 62 8 9 89 7 9 78Perseverance 2 11 18 15 29 52 10 14 71 8 13 62Individual Responsibility 8 10 80 12 24 50 7 13 54 10 15 67Social Skills with Peers 3 8 38 21 31 68 9 11 82 5 13 38Social Skills with Adults 3 7 43 6 15 40 4 8 50 5 6 83Communication 3 8 38 16 28 57 7 11 64 7 8 88Mathematics 5 11 45 21 25 84 11 14 79 14 16 88PAT Reading Comprehension 4 10 40 14 21 67 11 14 79 15 16 94Burt Word Reading 6 10 60 13 22 59 10 14 71 11 16 69Writing 1 5 20 4 5 80 3 3 100 5 7 71Reading Age 3 10 30 14 22 64 11 14 79 11 16 69Logical Problem-Solving 10 13 77 14 27 52 8 12 67 7 7 100
However, children from low-income homes who were in the top quartile at age 8 were just as likely asothers to remain there, with the exception of Reading Age.
Table 41 Family income and retention of highest quartile group at age 8 above the
median at age 12
% of quartile 4 at age 8 retained the median by age 12
Competency ↓
n
F.Inc up
to $30K
tot
F.Inc
up to
$30K
%
F.Inc
up to
$30K
n
F.Inc
>$30-
60K
tot
F.Inc
>$30-
60K
%
F.Inc
>$30-
60K
n
F.Inc
>$60-
80K
tot
F.Inc
>$60-
80K
%
F.Inc
>$60-
80K
n
F.Inc
>$80K
tot
F.Inc
>$80K
%
F.Inc
>$80K
Curiosity 12 20 60 29 44 66 7 11 64 15 22 68Perseverance 10 19 53 41 63 65 13 19 68 11 17 65Individual Responsibility 8 11 73 30 41 73 11 17 65 5 12 42Social Skills with Peers 8 18 44 33 41 80 19 25 76 4 9 44Social Skills with Adults 10 17 59 24 34 71 15 18 83 6 8 75Communication 15 26 58 42 57 74 17 21 81 13 17 76Mathematics 14 17 82 37 44 84 19 20 95 23 25 92PAT Reading Comprehension 14 16 88 39 44 89 21 26 81 21 23 91Burt Word Reading 13 14 93 51 54 94 24 24 100 23 24 96Writing 13 20 65 35 50 70 13 16 81 19 24 79Reading Age 9 17 53 32 45 71 16 17 94 19 22 86Logical Problem-Solving 18 22 82 38 47 81 22 24 92 26 28 93
What makes the difference to children who do progress from disadvantaged backgrounds – with lowlevels of family income and maternal qualification? We did not have sufficient numbers of childrenwhose mothers had no maternal qualification who were scoring above the median at age 12 to analyse the
Section Three
Changes in the competencies over time
44
factors that might make a difference,20 but we did undertake cross-tabulations comparing the experiences
and opportunities of the 132 children from low-income homes (less than $30,000) in the sample at age12, comparing those who were performing at the median or above at age 12 with those who were not, for2 key areas, mathematics and reading comprehension (Wylie 2003b).
There were some differences in terms of “cultural capital” and the way children spend their time. The
children from low-income homes who were scoring at the median or above (the “high” achieving group)were more likely to have well-qualified mothers (partially reflecting the high proportion of sole-parents inthe low-income category at age 5). They were engaged more in reading, were more likely to take part in
art, music, or dance classes, and to play organised sport with their friends. They were more likely to havewatched less television on a daily basis since age 5, and less likely to often play electronic or videogames. Their parents were less likely to watch television most days (62 percent compared with 84
percent). Overall, they tended to have spent longer in early childhood education, and to have experienceda somewhat higher quality in their final early childhood education centre. Their families were more likelyto have owned a computer for at least 4 years.
Teachers of the “high” achieving group were more likely to give high ratings to the support whichchildren gave their peers in class, and to the level of parental support for the children in their class.
Parent and teacher expectations of children’s further educational pathways and parent expectations thattheir child would be likely to take up a professional career were higher for the “high” achieving group byage 12. This may reflect their levels of achievement after 7 years at school. But early parental aspirations
for their child’s future education were much the same for the 2 groups. The students’ views of the careersthat appealed to them were broadly similar, with somewhat more interest shown in professions by the“high” achieving group, and more interest in sports-related work by the “low” achieving group (whoscored below the median at age 12).
The children in the “low” achieving group were just as likely as those in the “high” achieving group to beseen by their teachers as having strengths of being willing, trying hard. Their teachers were just as likelyto think their teaching could make a difference to the individual child’s learning.
The “high” achieving group enjoyed reading more (77 percent compared with 55 percent), and to a lesser
extent, working with numbers (55 percent compared with 36 percent). But the enjoyment of writing wasmuch the same in both groups.
The students were similar in their reports of their school experiences, and their feelings about those: theredid not seem to be a mismatch between home and school for the “low” achieving group in terms of a
sense of being supported by their teachers and peers, belonging, or feeling fairly treated. Nor did theirviews of how they gauged their performance show a difference where one might expect it: the “low”
20 We focused on children whose mothers had no qualification because they had lower scores than those whosemothers had a school qualification. However, this analysis of quartile movement suggests that there is moresimilarity than difference in the 2 groups in terms of progress over time, and that there would therefore be valuein undertaking a similar analysis as the one presented below for children from low-income homes.
Section Three
Changes in the competencies over time
45
achieving group were just as likely as the “high” achieving group to see this in terms of effort (rather than
ability, which can hinder effort). Where they differed was in terms of the pace and quality of work: 55percent of the “low” achieving group thought they could do better work if they tried compared with 26percent of the “high” achieving group, and 43 percent thought they usually learnt most things prettyquickly, compared with 64 percent of the “high” achieving group.
But there were some striking differences in the teacher ratings of the children’s attitudes and social skills.The “high” achieving group was much more likely to score highly on all 9 of the items in our measure ofcommunication. These items focus on oral language, both receptive (listening) and expressive. The same
trend was evident in relation to around half the items on other measures. The “high” achieving group wasmore likely to ask questions, think laterally, keep going when they struck a problem, finish their work,have a good concentration span, work with their peers without needing adult intervention, and make and
keep friendships. Teachers were more likely to see the “low” achieving group as lacking self-confidence,particularly in relation to their achievement of their full potential in education.
Parents of the “high” achieving group were more likely to say that they used negotiation to resolve adisagreement with their child (43 percent compared with 31 percent). They were also more likely to offer
encouragement if their child struck a difficulty in something they were trying to do (45 percent comparedwith 25 percent). The “high” achieving group was more likely to say they were listened to at homealways or almost always (75 percent compared with 38 percent).
The “high” achieving group was more likely to identify the sharing of interests with friends as one of the
things they enjoyed about their friendships (57 percent compared with 38 percent). There were nodifferences between the groups in terms of their initial experiences of puberty and reactions to it,friendship patterns other than the one above, or parental concerns.
In talking of mechanisms by which family income might influence outcomes for children, Kalil (2003)
notes the difference between factors which are directly or immediately associated (or “proximal”), andfactors which have an indirect association (“distal”). In focusing on reading and mathematics, theproximal factors emerge more clearly – as one would expect – and they can be categorised as mainly
fitting human capital theory. If we take human capital to mean the extension of the self, throughexperiences of things beyond the immediate, everyday, or already known, and having habits of (andtherefore feeling easy about and enjoying) asking questions, reading, and working on a problem, then theemphasis becomes more pronounced.
Relationships and processes which support the development of a communicative identity with somesense that the child can influence events through their communication (for example, negotiate withparents), are also evident.
Summary
There is more consistency, or predictability, in individual children’s scores on the cognitive competencymeasures between earlier ages and age 12, than on the social and attitudinal competency measures. The
Section Three
Changes in the competencies over time
46
consistency increases over time, reaching very high levels between ages 10 to 12 for mathematics, the
PAT Reading Comprehension test, and the Burt Word Reading test. Age-5 mathematics scores are just asconsistent with age-12 scores as the children’s scores after their first year at school, pointing to a patternwhich becomes very clear in this section of the particular importance for mathematics development ofchildren’s experience before school.
The strength of correlations between earlier and age-12 scores for the social and attitudinal competenciesis moderate rather than strong. There is more consistency in individual children’s age-8, 10, and 12 scoreson the social and attitudinal competencies than with those of earlier ages. While there is more consistency
in Curiosity scores, with age-5 scores just as good a guide for scores at age 12 as age-10 scores, thecorrelation between age-12 scores and each earlier score is weak. The lack of strong correlation in thesocial and attitudinal competencies over time may simply reflect the smaller number of items in each
measure in comparison to the cognitive competency measures. However, that explanation does notaccount for the growing consistency in social and attitudinal scores from ages 8 to 12. Another possiblereason is that scores on the social and attitudinal competencies reflect different individual responses and
interactions between individual children, their teachers, and peers, as well as different settings. Thiswould indicate that the social and attitudinal competencies are more influenced by context than thecognitive competencies.
The first 3 years of school appear most important for the development or consolidation of Perseverance
and Social Skills with Peers habits and skills, the first 5 years of school for the development of IndividualResponsibility, and the years from age 6 to age 10 for the development of Communication and SocialSkills with Adults.
There are different patterns of progress for different competencies. Reading seems to be the competency
which is least context-dependent, with earlier levels of performance most likely to be subsumed into age-10 performance. Performance at age 5 in mathematics, Logical Problem-Solving, and Curiosity is morelikely to not be subsumed into later performance, but to be seen as making an additional contribution to
the relationship of earlier performance to age-12 scores. This picture from partial correlations wasconfirmed by structural equation modelling of the consistency of scores between ages 8 to 12, whichshowed that earlier performance in the factor formed of most of the cognitive competencies (other than
Reading Age and Logical Problem-Solving) makes a separate contribution from age 8 to age 12, as wellas feeding into age-10 scores. The same pattern is evident in relation to the social and attitudinal factor(made up of all the social and attitudinal competencies other than Curiosity).
This modelling also showed that the social and attitudinal competencies “feed into” the cognitive
competencies at the same age; the cognitive competencies feed into the social and attitudinalcompetencies of the next age.
We continue to see high retention among children who were in the bottom or top quartiles at age 5, forthe cognitive competencies. The retention for mathematics is particularly marked. The continuity in
children’s performance in terms of quartile movement between ages 8 and 12 was more marked, for allthe quartiles. However, there was no further increase in continuity in quartile retention between ages 10 to
Section Three
Changes in the competencies over time
47
12, suggesting that comparative performance at age 8 gives nearly as good a guide to children’scomparative performance at age 12.
Two-thirds of the children who were performing in the top quartile at age 5 were scoring above themedian at age 12 for the cognitive competencies and Curiosity. At least two-thirds of those in the topquartile at age 8 were performing above the median at age 12 for all the competencies. Between a fifth to
two-fifths of the children who were performing in the lowest quartile at age 5 were performing above themedian at age-12, but fewer could lift their performance to this extent between the ages of 8 and 12.Improved performance was much less likely for mathematics. However, more children from the lowest
quartile at age 8 had progressed above the median by age 12 than seemed likely from our analysis at age10, suggesting that though the windows of opportunity do seem to narrow over time, particularly by theend of the first 3 years of school, they are not closed. The opportunities – experiences and relationships –available to children can make a marked difference.
On the whole, children’s characteristics of gender and ethnicity did not make marked differences to thepatterns of progress for children who were in the top quartiles of earlier performance. Once a certain levelof knowledge and skills had been gained, it is likely to be maintained. However, there were some
different patterns in relation to maternal qualification and family income. Children whose family incomewas low did seem to have lower retention rates above the median if they had been in the top quartile atage 5 for mathematics, reading comprehension, and Communication, but this pattern was not evident in
relation to retention from age 8. Children whose mothers had no qualification seemed somewhat lesslikely than others to retain their performance above the median from being in the top quartile at ages 5and 8 for mathematics, reading comprehension, and writing.
Social differences are more apparent in patterns of progress for children who were in the bottom quartiles.
There were trends from the data suggesting that boys who were in the lowest quartile were more likelythan their female counterparts to progress above the median for mathematics and the Burt Word Readingtest, though the girls were more likely to have moved above the median for the social and attitudinal
competencies. The trends for ethnicity suggest that Mäori children who scored in the bottom quartile atage 5 were less likely than their Päkehä/European counterparts to progress above the median formathematics, and less likely to make progress from age 8 to age 12 for mathematics, reading
comprehension, and writing. Children whose mother had a university qualification were most likely tomove from the lowest quartile at age 5 to the median or above at age 12 for the cognitive competencies,and those whose mother had no qualification or a school qualification, least likely. Progress from the
bottom quartile at age 8 to above the median at age 12 was more likely for children whose mother had auniversity qualification. Children whose families had very high-incomes at age 5 were more likely toprogress from the lowest quartile at age 5 to above the median at age 12 for mathematics, and there was asimilar trend for progress from age 8.
Comparison of children from low-income homes who were scoring above the median at age 12, andthose who were not, in relation to mathematics and reading comprehension showed differences in thechildren’s use of time and use of language which are consistent with theories of cultural capital.
48
Section Four
Cumulative experiences
In this section we focus on the research question:
What differences in children’s competency levels at age 12 are attributable to stability or change incumulative resources and experiences since near age 5?
We describe patterns of children’s experience over time, to see what differences there are for childrenwho have consistent experiences or reports of the same thing (e.g., watching television for substantial
periods of time, having a mother in full-time employment), and those whose experiences are more varied.The factors we focus on are drawn from those with which we have found consistent associations withchildren’s current competency levels, and which are of interest to policymakers, or continue to occur inpopular thinking as potential “risk” factors.
We have developed the patterns used for the analysis from the data. Often, we found too many differentpatterns to use the ones we found without having to reduce them to groups with sufficient size for us toanalyse.21 The ranges of combinations found indicate something of the fluidity of children’s and adults’
lives over time. We often explored associations between the competencies and the range of combinationsfirst to decide which categories to use in the final analysis. Where we have used age-5 and 6 data, we usethe “original sample”, of around 240 children. For some factors which were introduced in later phases,we use data from only those phases.
These 20 “history” factors are:
Family resources
family income, maternal employment, welfare receipt
Child’s time
TV watching, participation in music
21 For example, we originally had 14 different patterns of maternal employment status over the 7 years, which wereduced to 5 for the purposes of analysis.
Section Four
Cumulative experiences
49
Engagement in school
school attendance, homework, teacher relationship with parent, parental involvement in school, parentworking with teacher to resolve problems, parental satisfaction with child’s educational progress
School resources
class size, school socioeconomic decile, school ownership
Changes in daily settings
number of house-shifts, number of schools attended, changes of school between age 10 and 12, familytype
Child’s responses
how child copes with upsets
Relations with others
bullying
Family resources
We look here at changes in family income, maternal employment, and whether families receive welfare.
Family incomeDetails of current family income, and family income at age 5, and their associations with children’scompetencies are given in Section Six. In the previous Competent Children phase, we found that age 5
family income levels continued to have a bearing on the children’s competency levels, and that theaverage scores of children whose families improved their income from low levels when the children were5, were not statistically different from their counterparts whose family incomes remained low.
The categories used here were based on parents’ reports of their family income levels before tax, at ages5, 8, 10, and 12. This gave information for 448 of the study children.
• All low (below $30,000),22 at each stage.• Low at 5: low family income at age 5, and higher for subsequent stages.• All middle (between $30–60,000), at each stage.
22 Hyslop and Mare (2001) describe low-income households as having incomes between $15–30,000. Ninety-onepercent of the families of Competent Children sample live in their household without other family or non-familyresidents, allowing us to assume that family and household income should be the same for most of the projectsample.
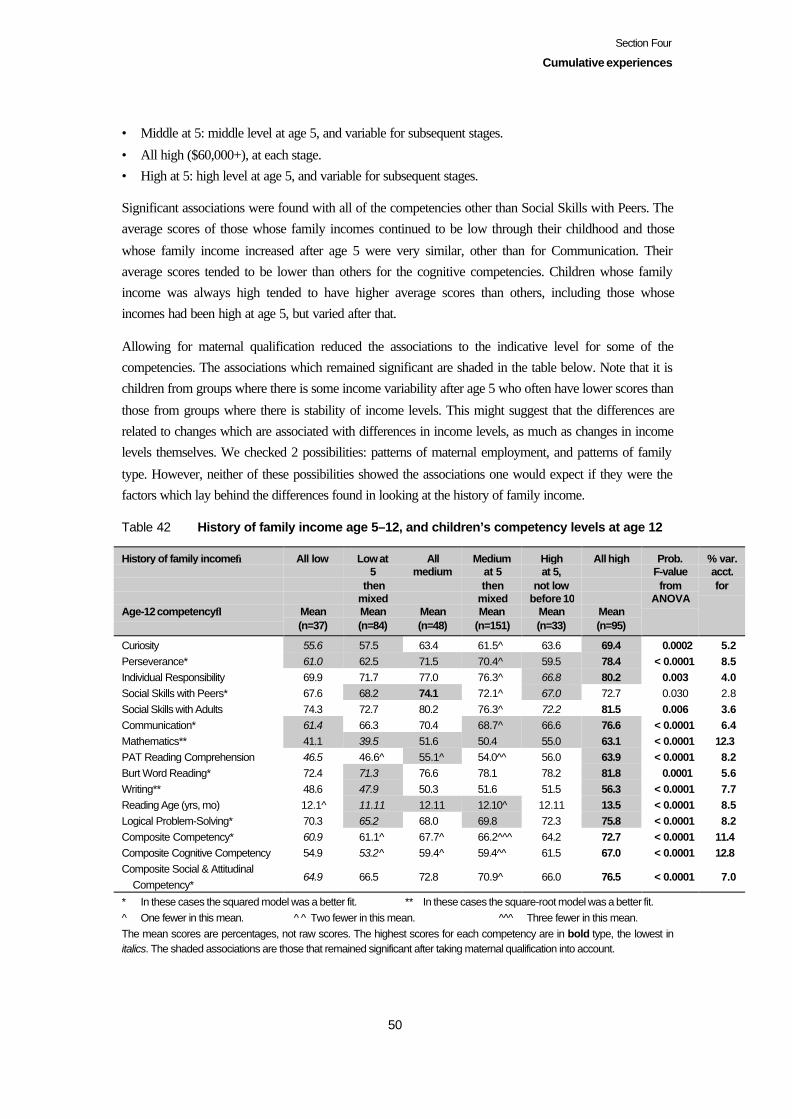
Section Four
Cumulative experiences
50
• Middle at 5: middle level at age 5, and variable for subsequent stages.
• All high ($60,000+), at each stage.• High at 5: high level at age 5, and variable for subsequent stages.
Significant associations were found with all of the competencies other than Social Skills with Peers. Theaverage scores of those whose family incomes continued to be low through their childhood and those
whose family income increased after age 5 were very similar, other than for Communication. Theiraverage scores tended to be lower than others for the cognitive competencies. Children whose familyincome was always high tended to have higher average scores than others, including those whoseincomes had been high at age 5, but varied after that.
Allowing for maternal qualification reduced the associations to the indicative level for some of thecompetencies. The associations which remained significant are shaded in the table below. Note that it ischildren from groups where there is some income variability after age 5 who often have lower scores than
those from groups where there is stability of income levels. This might suggest that the differences arerelated to changes which are associated with differences in income levels, as much as changes in incomelevels themselves. We checked 2 possibilities: patterns of maternal employment, and patterns of family
type. However, neither of these possibilities showed the associations one would expect if they were thefactors which lay behind the differences found in looking at the history of family income.
Table 42 History of family income age 5–12, and children’s competency levels at age 12
History of family income→
Age-12 competency↓
All low
Mean(n=37)
Low at5
thenmixedMean(n=84)
Allmedium
Mean(n=48)
Mediumat 5then
mixedMean
(n=151)
Highat 5,
not lowbefore 10
Mean(n=33)
All high
Mean(n=95)
Prob.F-valuefrom
ANOVA
% var.acct.for
Curiosity 55.6 57.5 63.4 61.5^ 63.6 69.4 0.0002 5.2Perseverance* 61.0 62.5 71.5 70.4^ 59.5 78.4 < 0.0001 8.5Individual Responsibility 69.9 71.7 77.0 76.3^ 66.8 80.2 0.003 4.0Social Skills with Peers* 67.6 68.2 74.1 72.1^ 67.0 72.7 0.030 2.8Social Skills with Adults 74.3 72.7 80.2 76.3^ 72.2 81.5 0.006 3.6Communication* 61.4 66.3 70.4 68.7^ 66.6 76.6 < 0.0001 6.4Mathematics** 41.1 39.5 51.6 50.4 55.0 63.1 < 0.0001 12.3PAT Reading Comprehension 46.5 46.6^ 55.1^ 54.0^^ 56.0 63.9 < 0.0001 8.2Burt Word Reading* 72.4 71.3 76.6 78.1 78.2 81.8 0.0001 5.6Writing** 48.6 47.9 50.3 51.6 51.5 56.3 < 0.0001 7.7Reading Age (yrs, mo) 12.1^ 11.11 12.11 12.10^ 12.11 13.5 < 0.0001 8.5Logical Problem-Solving* 70.3 65.2 68.0 69.8 72.3 75.8 < 0.0001 8.2Composite Competency* 60.9 61.1^ 67.7^ 66.2^^^ 64.2 72.7 < 0.0001 11.4Composite Cognitive Competency 54.9 53.2^ 59.4^ 59.4^^ 61.5 67.0 < 0.0001 12.8Composite Social & Attitudinal Competency*
64.9 66.5 72.8 70.9^ 66.0 76.5 < 0.0001 7.0
* In these cases the squared model was a better fit. ** In these cases the square-root model was a better fit.^ One fewer in this mean. ̂ ̂ Two fewer in this mean. ^^ ̂ Three fewer in this mean. The mean scores are percentages, not raw scores. The highest scores for each competency are in bold type, the lowest initalics. The shaded associations are those that remained significant after taking maternal qualification into account.

Section Four
Cumulative experiences
51
Note that family income history, though a powerful factor in accounting for the variance in children’s
scores in mathematics – particularly in what is a very “noisy” environment for statistical analysis – leavesmuch to be explained. Though it looms large in social and educational research and becomes a frame formuch analysis, it does not provide us with a full understanding of what lies behind differences inchildren’s performance.
Maternal employmentOnly 14 of the study children had mothers who did not undertake some employment between the timethey were near-5, and when they were aged 12. We found 14 patterns of maternal employment (full-time,
part-time, or not in paid employment) over the age 5, 6, 8, 10, and 12 phases, for the 240 mothers fromthe “original” sample for whom we had information for all these phases.23 Only 19 of the children’smothers were always in full-time work, and only 23 always in part-time work.
We put the 14 patterns into 5 groups for analysis purposes. They were:
• no employment, or only employed at age 10 or 12 (14 percent, n=33);
• employment for 2-3 years (12 percent, n=29);• all or some part-time work, no full-time work (27 percent, n=64);• some full-time employment (40 percent, n=95); and
• all full-time employment (8 percent, n=19).We found no associations between these categories and the children’s competency levels at age 12. Thisis consistent with finding only 1 or 2 associations with children’s competencies at age 12 and maternal
employment for each of the different phases analysed separately, and with these associations not beingevident for all phases, suggesting that something other than maternal employment status itself may bebehind the associations found.
Most of the associations were no longer evident or were reduced to the indicative level after taking family
income and maternal qualification into account. Here are the trends found in the phases analysedseparately:
• indicative associations in relation to scores at age 12 for Perseverance with children whose mothershad been in full-time employment at ages 5 and 8, scoring around 6 percentage points lower than
others on average;• indicative associations in relation to scores at age 12 for writing, with children whose mothers had
been in part-time employment at ages 6 and 8, scoring around 3 percentage points more than others;
• indicative associations in relation to scores at age 12 for Individual Responsibility, with childrenwhose mothers had been in full-time employment at ages 8 and 10, scoring around 6 percentagepoints lower than others on average; and
23 We have maternal employment data from age 5 for all the children in the study, but only for the “original” sampleat age 6.
Section Four
Cumulative experiences
52
• a significant association in relation to scores at age 12 for the PAT Reading Comprehension test, with
children whose mothers were currently in full-time employment scoring around 6 percentage pointslower than others.
There does not seem to be any cumulative advantage or disadvantage for children at age 12 from their
mothers’ patterns of employment over the previous 7 years; there are indicative associations with specificphases, but these differ, suggesting that something other than maternal employment itself may beinvolved.
Welfare receiptIn the age-10 phase, we analysed patterns of family receipt of welfare over the previous 5 years, andfound some associations, with children whose parents had received the Domestic Purposes Benefit(DPB) having lower scores on Perseverance, Social Skills with Peers, and Individual Responsibility.
However, family income levels showed stronger associations than welfare receipt. For the presentanalysis, we focused on the ages 8–12, and also compared groups of those whose family had neverreceived welfare, those who had done so for at least 2, 5, or 8 years, and those who had done so for ashorter period.
We did not find any differences within the sub-sample of those whose families had received welfare inrelation to length of time. The lack of significance may be related to the small number of children whosefamilies had received welfare for 8 years or more (18). The data showed an indicative association which
was no longer notable after taking into account family income and maternal qualification, with childrenwhose families received welfare for 8 years or more having lower mathematics scores (a difference of 8–9 percentage points after allowing for maternal qualification and family income).
The categories we used to analyse the history of welfare receipt over the 4 years between when the studychildren were aged 8, and when they were aged 12, for 491 children, were:
• no benefit at any of the stages when child aged 8, 10, or 12 (78 percent, n=385);• benefit other than DPB at age 12 (5 percent, n=23);• benefit at age 10, but not age 8 and other than DPB not at age 12 (8 percent, n=32);
• always on benefit, but not non-DPB benefit at age 12 (4 percent, n=19); and• benefit at age 8, 10, and 12 other than non-DPB (8 percent, n=32).In the one-factor analyses, there were significant associations with Curiosity, Perseverance, mathematics,
and Reading Age, showing higher scores for children whose families had never received a benefit.However, their scores were higher compared with different groups of benefit receipt for eachcompetency, rather than being higher compared with the same group(s) across the range of competencies,
suggesting that something other than benefit receipt could be involved. Allowing for family income andmaternal qualification reduced these associations to the indicative or not notable level, though thedifference in mathematics scores for those whose family had never received a benefit and those whose
families were currently receiving a non-DPB benefit remained significant after taking into accountmaternal qualification, but not family income.
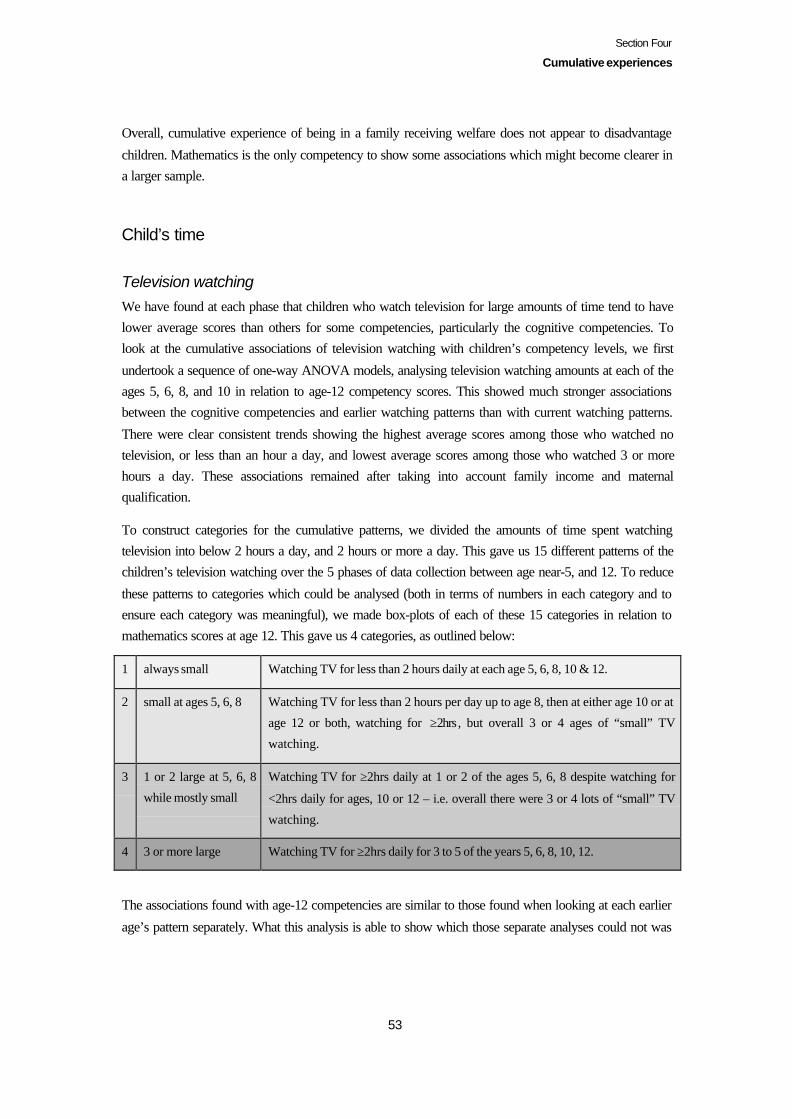
Section Four
Cumulative experiences
53
Overall, cumulative experience of being in a family receiving welfare does not appear to disadvantage
children. Mathematics is the only competency to show some associations which might become clearer ina larger sample.
Child’s time
Television watchingWe have found at each phase that children who watch television for large amounts of time tend to havelower average scores than others for some competencies, particularly the cognitive competencies. Tolook at the cumulative associations of television watching with children’s competency levels, we first
undertook a sequence of one-way ANOVA models, analysing television watching amounts at each of theages 5, 6, 8, and 10 in relation to age-12 competency scores. This showed much stronger associationsbetween the cognitive competencies and earlier watching patterns than with current watching patterns.
There were clear consistent trends showing the highest average scores among those who watched notelevision, or less than an hour a day, and lowest average scores among those who watched 3 or morehours a day. These associations remained after taking into account family income and maternalqualification.
To construct categories for the cumulative patterns, we divided the amounts of time spent watchingtelevision into below 2 hours a day, and 2 hours or more a day. This gave us 15 different patterns of thechildren’s television watching over the 5 phases of data collection between age near-5, and 12. To reduce
these patterns to categories which could be analysed (both in terms of numbers in each category and toensure each category was meaningful), we made box-plots of each of these 15 categories in relation tomathematics scores at age 12. This gave us 4 categories, as outlined below:
1 always small Watching TV for less than 2 hours daily at each age 5, 6, 8, 10 & 12.
2 small at ages 5, 6, 8 Watching TV for less than 2 hours per day up to age 8, then at either age 10 or at
age 12 or both, watching for ≥2hrs, but overall 3 or 4 ages of “small” TV
watching.
3 1 or 2 large at 5, 6, 8
while mostly small
Watching TV for ≥2hrs daily at 1 or 2 of the ages 5, 6, 8 despite watching for
<2hrs daily for ages, 10 or 12 – i.e. overall there were 3 or 4 lots of “small” TV
watching.
4 3 or more large Watching TV for ≥2hrs daily for 3 to 5 of the years 5, 6, 8, 10, 12.
The associations found with age-12 competencies are similar to those found when looking at each earlier
age’s pattern separately. What this analysis is able to show which those separate analyses could not was
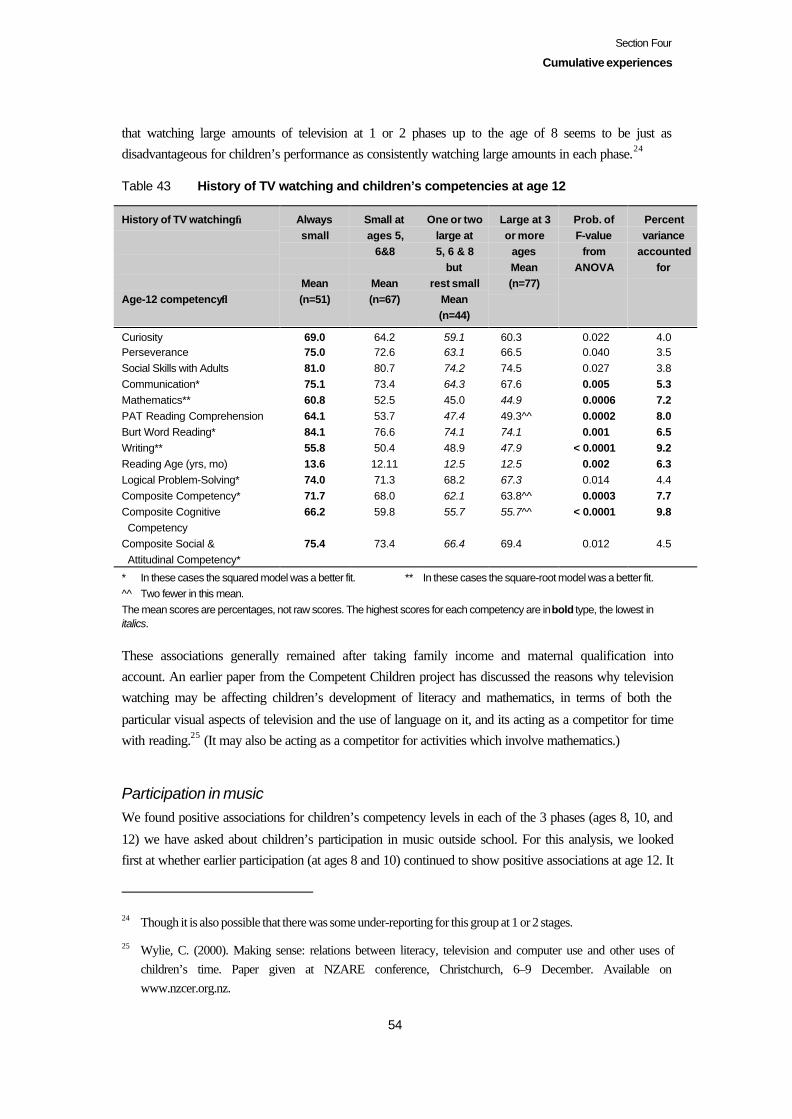
Section Four
Cumulative experiences
54
that watching large amounts of television at 1 or 2 phases up to the age of 8 seems to be just asdisadvantageous for children’s performance as consistently watching large amounts in each phase.24
Table 43 History of TV watching and children’s competencies at age 12
History of TV watching→
Age-12 competency↓
Alwayssmall
Mean(n=51)
Small atages 5,
6&8
Mean(n=67)
One or twolarge at5, 6 & 8
butrest small
Mean(n=44)
Large at 3or more
agesMean(n=77)
Prob. ofF-value
fromANOVA
Percentvariance
accountedfor
Curiosity 69.0 64.2 59.1 60.3 0.022 4.0Perseverance 75.0 72.6 63.1 66.5 0.040 3.5Social Skills with Adults 81.0 80.7 74.2 74.5 0.027 3.8Communication* 75.1 73.4 64.3 67.6 0.005 5.3Mathematics** 60.8 52.5 45.0 44.9 0.0006 7.2PAT Reading Comprehension 64.1 53.7 47.4 49.3^^ 0.0002 8.0Burt Word Reading* 84.1 76.6 74.1 74.1 0.001 6.5Writing** 55.8 50.4 48.9 47.9 < 0.0001 9.2Reading Age (yrs, mo) 13.6 12.11 12.5 12.5 0.002 6.3Logical Problem-Solving* 74.0 71.3 68.2 67.3 0.014 4.4Composite Competency* 71.7 68.0 62.1 63.8^^ 0.0003 7.7Composite Cognitive Competency
66.2 59.8 55.7 55.7^^ < 0.0001 9.8
Composite Social & Attitudinal Competency*
75.4 73.4 66.4 69.4 0.012 4.5
* In these cases the squared model was a better fit. ** In these cases the square-root model was a better fit.^^ Two fewer in this mean.The mean scores are percentages, not raw scores. The highest scores for each competency are in bold type, the lowest initalics.
These associations generally remained after taking family income and maternal qualification intoaccount. An earlier paper from the Competent Children project has discussed the reasons why televisionwatching may be affecting children’s development of literacy and mathematics, in terms of both the
particular visual aspects of television and the use of language on it, and its acting as a competitor for timewith reading.25 (It may also be acting as a competitor for activities which involve mathematics.)
Participation in musicWe found positive associations for children’s competency levels in each of the 3 phases (ages 8, 10, and
12) we have asked about children’s participation in music outside school. For this analysis, we lookedfirst at whether earlier participation (at ages 8 and 10) continued to show positive associations at age 12. It
24 Though it is also possible that there was some under-reporting for this group at 1 or 2 stages.
25 Wylie, C. (2000). Making sense: relations between literacy, television and computer use and other uses ofchildren’s time. Paper given at NZARE conference, Christchurch, 6–9 December. Available onwww.nzcer.org.nz.
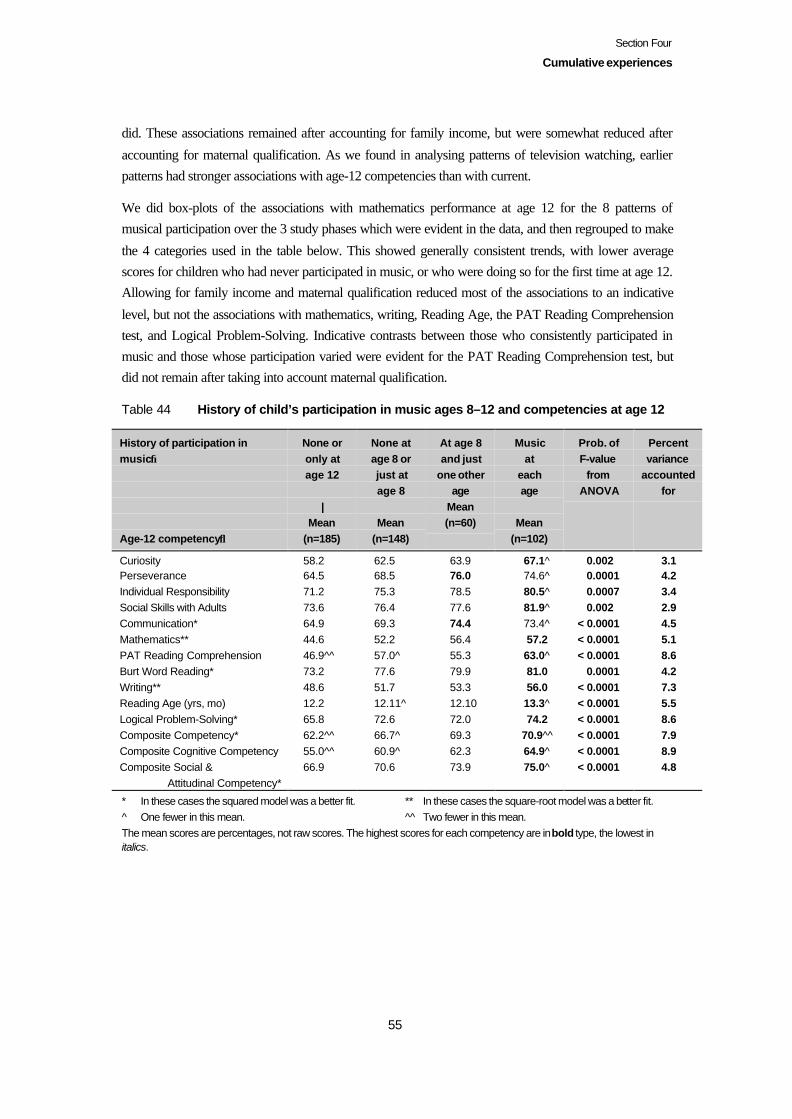
Section Four
Cumulative experiences
55
did. These associations remained after accounting for family income, but were somewhat reduced after
accounting for maternal qualification. As we found in analysing patterns of television watching, earlierpatterns had stronger associations with age-12 competencies than with current.
We did box-plots of the associations with mathematics performance at age 12 for the 8 patterns ofmusical participation over the 3 study phases which were evident in the data, and then regrouped to make
the 4 categories used in the table below. This showed generally consistent trends, with lower averagescores for children who had never participated in music, or who were doing so for the first time at age 12.Allowing for family income and maternal qualification reduced most of the associations to an indicative
level, but not the associations with mathematics, writing, Reading Age, the PAT Reading Comprehensiontest, and Logical Problem-Solving. Indicative contrasts between those who consistently participated inmusic and those whose participation varied were evident for the PAT Reading Comprehension test, butdid not remain after taking into account maternal qualification.
Table 44 History of child’s participation in music ages 8–12 and competencies at age 12
History of participation inmusic→
Age-12 competency↓
None oronly atage 12
|Mean
(n=185)
None atage 8 orjust atage 8
Mean(n=148)
At age 8and just
one otherage
Mean(n=60)
Musicat
eachage
Mean(n=102)
Prob. ofF-value
fromANOVA
Percentvariance
accountedfor
Curiosity 58.2 62.5 63.9 67.1^ 0.002 3.1Perseverance 64.5 68.5 76.0 74.6^ 0.0001 4.2Individual Responsibility 71.2 75.3 78.5 80.5^ 0.0007 3.4Social Skills with Adults 73.6 76.4 77.6 81.9^ 0.002 2.9Communication* 64.9 69.3 74.4 73.4^ < 0.0001 4.5Mathematics** 44.6 52.2 56.4 57.2 < 0.0001 5.1PAT Reading Comprehension 46.9^^ 57.0^ 55.3 63.0^ < 0.0001 8.6Burt Word Reading* 73.2 77.6 79.9 81.0 0.0001 4.2Writing** 48.6 51.7 53.3 56.0 < 0.0001 7.3Reading Age (yrs, mo) 12.2 12.11^ 12.10 13.3^ < 0.0001 5.5Logical Problem-Solving* 65.8 72.6 72.0 74.2 < 0.0001 8.6Composite Competency* 62.2^^ 66.7^ 69.3 70.9^^ < 0.0001 7.9Composite Cognitive Competency 55.0^^ 60.9^ 62.3 64.9^ < 0.0001 8.9Composite Social &
Attitudinal Competency*66.9 70.6 73.9 75.0^ < 0.0001 4.8
* In these cases the squared model was a better fit. ** In these cases the square-root model was a better fit.^ One fewer in this mean. ^^ Two fewer in this mean.The mean scores are percentages, not raw scores. The highest scores for each competency are in bold type, the lowest initalics.
Section Four
Cumulative experiences
56
Engagement in school
School attendanceThe data we have used for school attendance is teachers’ overall summary in terms of good, satisfactory,or poor, rather than actual days per school year.26 The numbers of students in the study whose attendanceis less than good is small: 22 at age 6, increasing to 34 at age 12. When we compared previous attendance
rates separately at age 6, 8, and 10 with age-12 competency levels, we found only a few indicativeassociations. Current attendance rates showed stronger associations, with the social and attitudinal, butnot the cognitive competencies.
Because there were no associations with age-12 competencies evident with the age-6 attendance, and we
would be restricted to a smaller sub-sample if we included age-6 data, we omitted this phase indeveloping the categories for a history of school attendance. We found 8 patterns of school attendancebetween ages 8 and 12, using data from 495 children, which we analysed with box-plots in relation to the
mathematics and PAT Reading Comprehension test scores at age 12 to derive 4 sensible groups foranalysis. These are:
• good attendance for all 3 phases (84 percent);• good at age 8, satisfactory/ poor at 10, and good again at age 12 (5 percent);
• good at age 8, either good or satisfactory/poor at age 10, and satisfactory/poor at age 12 (6 percent);and
• satisfactory/poor at age 8, with either kind of attendance at ages 10 and 12 (5 percent).
The significant associations found were with the social and attitudinal competencies. These show higheraverage scores for those whose school attendance has always been good, and others, particularly thosewhose attendance is currently not good. These associations largely remained significant after taking intoaccount family income and maternal qualification.
HomeworkWe used teachers’ reports of whether the study children had completed their homework, for ages 10 and12. Both current homework completion and earlier completion at age 10 showed strong relationships
with children’s competency levels at age 12 which remained after taking family income and maternalqualification into account. Homework completion is likely to be playing a part in teachers’ overalljudgments of children in relation to the questions we asked them to compile the social and attitudinal
competencies. Its relationship with the cognitive competencies may reflect existing levels ofunderstanding of what has been taught, and confidence about that, as much as the time (practice) given tohomework, and opportunity to interact with parents if they assist. Either interpretation makes sense of our
finding that age-10 completion rates have a similar bearing on age-12 competency levels as do currentcompletion rates.
26 We have collected actual attendance records for the age-14 phase.
Section Four
Cumulative experiences
57
We found 9 patterns of homework completion over the 2 study phases (using our categories: completes
homework/homework completion varies/homework is not completed). When we used box-plots to lookat the associations of these 9 groups with the children’s scores at age 12 for mathematics, PAT ReadingComprehension test, Perseverance, and the Composite Cognitive Competency, we found it difficult to see
a smaller number of clear categories. These 9 groups show these patterns among the 491 children forwhom we had data on homework completion for both phases:
Homework completed at age 10:
• Completed at age 12 (59 percent, n=289).• Varied completion at age 12 (11 percent, n=52).
• Not completed at age 12 (3 percent, n=16).Homework completion varied at age 10:
• Completed at age 12 (11 percent, n=53).• Varied completion at age 12 (8 percent, n=38).
• Not completed at age 12 (2 percent, n=11).Homework not completed at age 10:
• Completed at age 12 (3 percent, n=15).• Varied completion at age 12 (2 percent, n=8).
• Not completed at age 12 (2 percent, n=9).When we used these 9 groups in ANOVA analysis, we found that those who completed their homeworkin both phases had higher average scores, and that categories which included current completion tended
to show higher average scores than those who did not complete homework. We therefore regrouped thedata into 3 categories:
• Completion at both ages 10 and 12 (59 percent).• “Mixed”: Completion or varied completion at age 12 (with any level of completion at age 10) (34
percent).• Non-completion at age 12 (with any level of completion at age 10) (7 percent).There were significant associations which remained after taking into account family income and maternal
qualification, with a linear trend for the social and attitudinal competencies, but no notable differencesbetween the mixed and non-completion at 12 group for the cognitive competencies. This lack ofdifference suggests that teachers may using current homework completion rates as one of the things they
consider in rating children’s social and attitudinal competencies, or, alternatively, that homeworkcompletion is a sign of engagement in school. It also suggests that consistency in homework completionmay matter more for the cognitive competencies, but leaves open the question of whether eitherinterpretation of the 2 suggested earlier in this section makes sense on its own.
The following table shows the percentage points differences among the 3 groups:
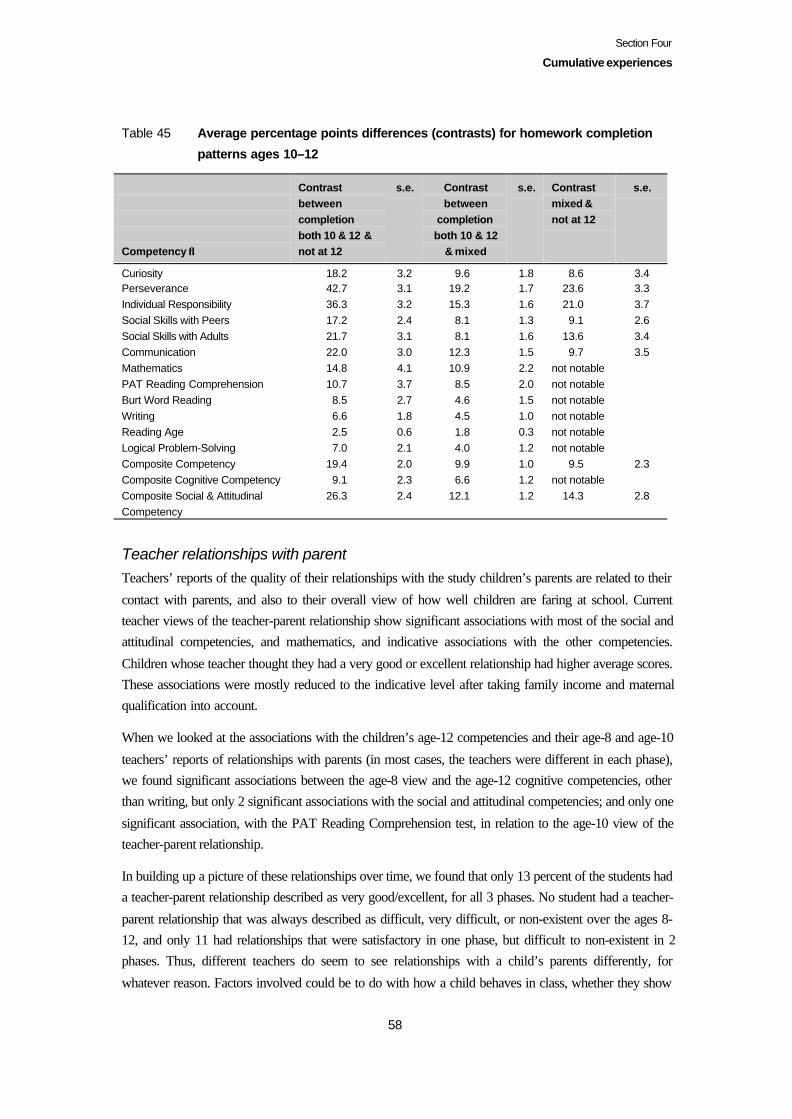
Section Four
Cumulative experiences
58
Table 45 Average percentage points differences (contrasts) for homework completion
patterns ages 10–12
Competency ↓
Contrastbetweencompletionboth 10 & 12 ¬ at 12
s.e. Contrastbetween
completionboth 10 & 12
& mixed
s.e. Contrastmixed ¬ at 12
s.e.
Curiosity 18.2 3.2 9.6 1.8 8.6 3.4Perseverance 42.7 3.1 19.2 1.7 23.6 3.3Individual Responsibility 36.3 3.2 15.3 1.6 21.0 3.7Social Skills with Peers 17.2 2.4 8.1 1.3 9.1 2.6Social Skills with Adults 21.7 3.1 8.1 1.6 13.6 3.4Communication 22.0 3.0 12.3 1.5 9.7 3.5Mathematics 14.8 4.1 10.9 2.2 not notablePAT Reading Comprehension 10.7 3.7 8.5 2.0 not notableBurt Word Reading 8.5 2.7 4.6 1.5 not notableWriting 6.6 1.8 4.5 1.0 not notableReading Age 2.5 0.6 1.8 0.3 not notableLogical Problem-Solving 7.0 2.1 4.0 1.2 not notableComposite Competency 19.4 2.0 9.9 1.0 9.5 2.3Composite Cognitive Competency 9.1 2.3 6.6 1.2 not notableComposite Social & AttitudinalCompetency
26.3 2.4 12.1 1.2 14.3 2.8
Teacher relationships with parentTeachers’ reports of the quality of their relationships with the study children’s parents are related to their
contact with parents, and also to their overall view of how well children are faring at school. Currentteacher views of the teacher-parent relationship show significant associations with most of the social andattitudinal competencies, and mathematics, and indicative associations with the other competencies.
Children whose teacher thought they had a very good or excellent relationship had higher average scores.These associations were mostly reduced to the indicative level after taking family income and maternalqualification into account.
When we looked at the associations with the children’s age-12 competencies and their age-8 and age-10
teachers’ reports of relationships with parents (in most cases, the teachers were different in each phase),we found significant associations between the age-8 view and the age-12 cognitive competencies, otherthan writing, but only 2 significant associations with the social and attitudinal competencies; and only one
significant association, with the PAT Reading Comprehension test, in relation to the age-10 view of theteacher-parent relationship.
In building up a picture of these relationships over time, we found that only 13 percent of the students hada teacher-parent relationship described as very good/excellent, for all 3 phases. No student had a teacher-
parent relationship that was always described as difficult, very difficult, or non-existent over the ages 8-12, and only 11 had relationships that were satisfactory in one phase, but difficult to non-existent in 2phases. Thus, different teachers do seem to see relationships with a child’s parents differently, for
whatever reason. Factors involved could be to do with how a child behaves in class, whether they show
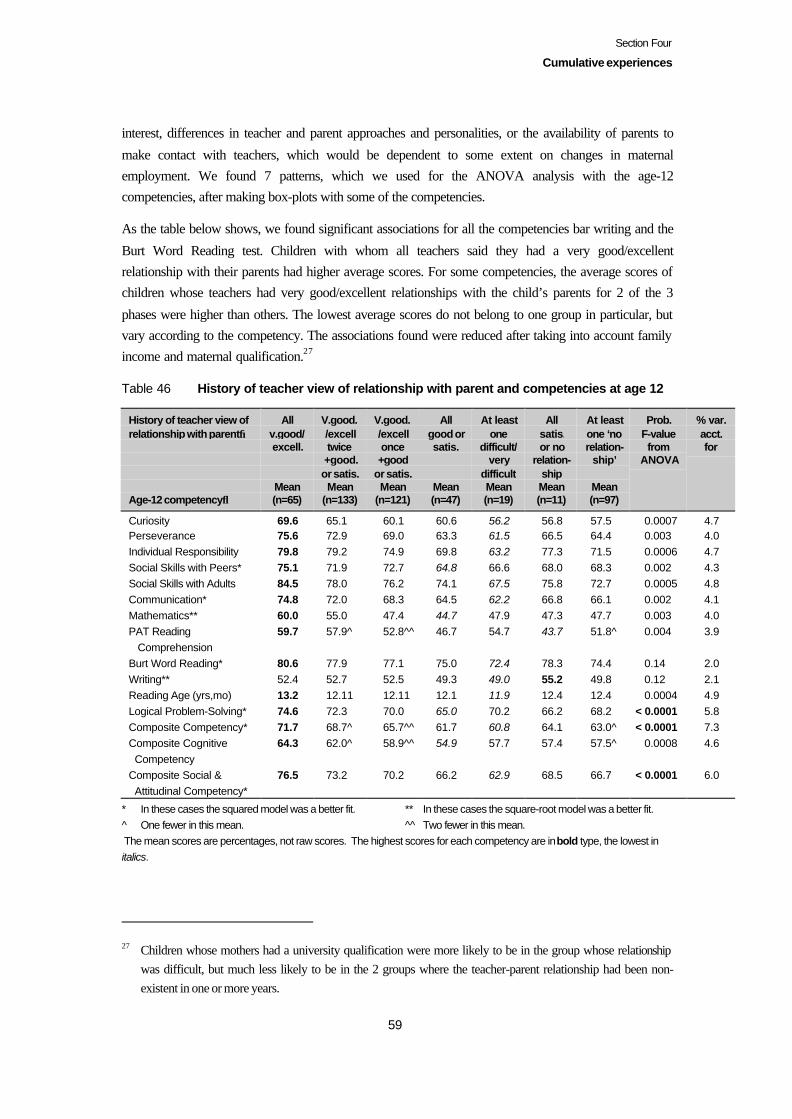
Section Four
Cumulative experiences
59
interest, differences in teacher and parent approaches and personalities, or the availability of parents to
make contact with teachers, which would be dependent to some extent on changes in maternalemployment. We found 7 patterns, which we used for the ANOVA analysis with the age-12competencies, after making box-plots with some of the competencies.
As the table below shows, we found significant associations for all the competencies bar writing and the
Burt Word Reading test. Children with whom all teachers said they had a very good/excellentrelationship with their parents had higher average scores. For some competencies, the average scores ofchildren whose teachers had very good/excellent relationships with the child’s parents for 2 of the 3
phases were higher than others. The lowest average scores do not belong to one group in particular, butvary according to the competency. The associations found were reduced after taking into account familyincome and maternal qualification.27
Table 46 History of teacher view of relationship with parent and competencies at age 12
History of teacher view ofrelationship with parent→
Age-12 competency↓
Allv.good/excell.
Mean(n=65)
V.good./excelltwice+good.or satis.Mean
(n=133)
V.good./excellonce+good
or satis.Mean
(n=121)
Allgood orsatis.
Mean(n=47)
At leastone
difficult/very
difficultMean(n=19)
Allsatis.or no
relation-shipMean(n=11)
At leastone ‘norelation-
ship’
Mean(n=97)
Prob.F-valuefrom
ANOVA
% var.acct.for
Curiosity 69.6 65.1 60.1 60.6 56.2 56.8 57.5 0.0007 4.7Perseverance 75.6 72.9 69.0 63.3 61.5 66.5 64.4 0.003 4.0Individual Responsibility 79.8 79.2 74.9 69.8 63.2 77.3 71.5 0.0006 4.7Social Skills with Peers* 75.1 71.9 72.7 64.8 66.6 68.0 68.3 0.002 4.3Social Skills with Adults 84.5 78.0 76.2 74.1 67.5 75.8 72.7 0.0005 4.8Communication* 74.8 72.0 68.3 64.5 62.2 66.8 66.1 0.002 4.1Mathematics** 60.0 55.0 47.4 44.7 47.9 47.3 47.7 0.003 4.0PAT Reading Comprehension
59.7 57.9^ 52.8^^ 46.7 54.7 43.7 51.8^ 0.004 3.9
Burt Word Reading* 80.6 77.9 77.1 75.0 72.4 78.3 74.4 0.14 2.0Writing** 52.4 52.7 52.5 49.3 49.0 55.2 49.8 0.12 2.1Reading Age (yrs,mo) 13.2 12.11 12.11 12.1 11.9 12.4 12.4 0.0004 4.9Logical Problem-Solving* 74.6 72.3 70.0 65.0 70.2 66.2 68.2 < 0.0001 5.8Composite Competency* 71.7 68.7^ 65.7^^ 61.7 60.8 64.1 63.0^ < 0.0001 7.3Composite Cognitive Competency
64.3 62.0^ 58.9^^ 54.9 57.7 57.4 57.5^ 0.0008 4.6
Composite Social & Attitudinal Competency*
76.5 73.2 70.2 66.2 62.9 68.5 66.7 < 0.0001 6.0
* In these cases the squared model was a better fit. ** In these cases the square-root model was a better fit.^ One fewer in this mean. ^^ Two fewer in this mean. The mean scores are percentages, not raw scores. The highest scores for each competency are in bold type, the lowest initalics.
27 Children whose mothers had a university qualification were more likely to be in the group whose relationshipwas difficult, but much less likely to be in the 2 groups where the teacher-parent relationship had been non-existent in one or more years.
Section Four
Cumulative experiences
60
Parents working with teachers to resolve a problem their child is experiencingThere are associations between children’s age-12 competency levels, and whether they are experiencingany problems that the parent is working on with the teacher, at the significant level for the social andattitudinal competencies, and at an indicative level for 3 of the 4 literacy levels (which might reflect
greater parental awareness of reading issues). These associations remained after taking family incomeand maternal qualification into account.
When we undertook ANOVA analysis of the relationship between earlier parental reports of workingwith teachers on a child’s problem for each of the age-8 and age-10 phases separately, we found similarpatterns, but with indicative associations with mathematics, rather than literacy.
When we looked at the patterns of responses across all 3 phases, 8, 10, and 12, we separated out theincidence of problems into academic, and social-emotional (s-em in the table below). For the 389children for whom we have all data, and excluding the few whose parents identified a problem that they
did not discuss with the teacher, and those who did not define the nature of the problem, we found thatonly 17 percent of the children had never had their parents working with their teachers to resolve someproblem which had cropped up. In other words, it is almost the norm over a 4-year period for children toexperience at least one issue, which parents and teachers feel is best resolved by working together.
A problem requiring joint teacher-parent attention had emerged in just 1 of the 3 phases for 30 percent ofthe study children, and in two of the phases, for 34 percent.
Problems attracting joint parent-teacher attention in all 3 phases occurred for 20 percent of the children. Itwas rare for the problems to always be about academic progress (11 children), with a further 19
experiencing academic problems at age 8 only, and other problems after that. Only 10 experienced social-emotional problems in all 3 phases, with a further 20 experiencing social-emotional problems at age 8,and other problems after that. Sixteen experienced both academic and social-emotional problems at age 8,and a mixture after that.
The associations with children’s competencies at age 12 are significant, and relatively strong in terms ofthe proportion of variance they explain. Children who never experienced problems, or had onlyexperienced them once between age 8 and age 12 had higher average scores for the 4 social and
attitudinal competencies that showed significant associations. For the cognitive competencies, it was thechildren who had academic problems who showed lower scores than others. These associations remainedafter taking into account family income and maternal qualification.
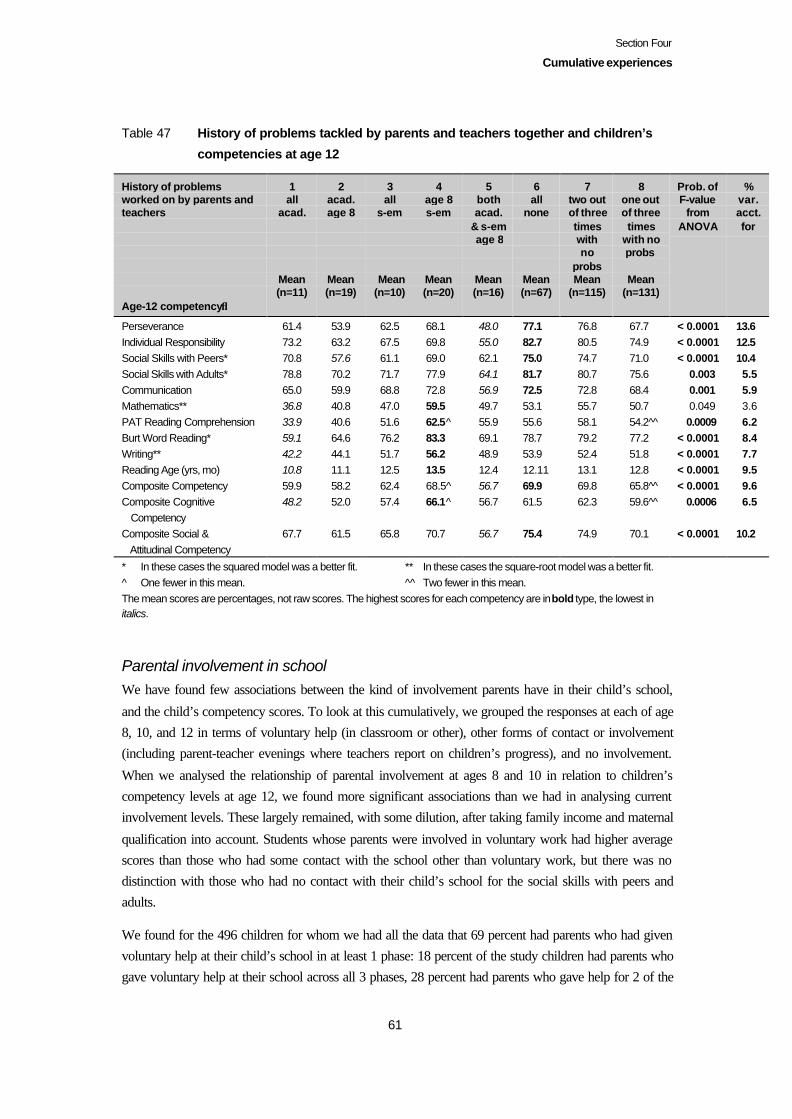
Section Four
Cumulative experiences
61
Table 47 History of problems tackled by parents and teachers together and children’s
competencies at age 12
History of problemsworked on by parents andteachers
Age-12 competency↓
1all
acad.
Mean(n=11)
2acad.age 8
Mean(n=19)
3all
s-em
Mean(n=10)
4age 8s-em
Mean(n=20)
5bothacad.
& s-em age 8
Mean(n=16)
6all
none
Mean(n=67)
7two outof threetimeswithno
probsMean
(n=115)
8one outof threetimes
with noprobs
Mean(n=131)
Prob. ofF-value
fromANOVA
%var.acct.for
Perseverance 61.4 53.9 62.5 68.1 48.0 77.1 76.8 67.7 < 0.0001 13.6Individual Responsibility 73.2 63.2 67.5 69.8 55.0 82.7 80.5 74.9 < 0.0001 12.5Social Skills with Peers* 70.8 57.6 61.1 69.0 62.1 75.0 74.7 71.0 < 0.0001 10.4Social Skills with Adults* 78.8 70.2 71.7 77.9 64.1 81.7 80.7 75.6 0.003 5.5Communication 65.0 59.9 68.8 72.8 56.9 72.5 72.8 68.4 0.001 5.9Mathematics** 36.8 40.8 47.0 59.5 49.7 53.1 55.7 50.7 0.049 3.6PAT Reading Comprehension 33.9 40.6 51.6 62.5^ 55.9 55.6 58.1 54.2^^ 0.0009 6.2Burt Word Reading* 59.1 64.6 76.2 83.3 69.1 78.7 79.2 77.2 < 0.0001 8.4Writing** 42.2 44.1 51.7 56.2 48.9 53.9 52.4 51.8 < 0.0001 7.7Reading Age (yrs, mo) 10.8 11.1 12.5 13.5 12.4 12.11 13.1 12.8 < 0.0001 9.5Composite Competency 59.9 58.2 62.4 68.5^ 56.7 69.9 69.8 65.8^^ < 0.0001 9.6Composite Cognitive Competency
48.2 52.0 57.4 66.1^ 56.7 61.5 62.3 59.6^^ 0.0006 6.5
Composite Social & Attitudinal Competency
67.7 61.5 65.8 70.7 56.7 75.4 74.9 70.1 < 0.0001 10.2
* In these cases the squared model was a better fit. ** In these cases the square-root model was a better fit.^ One fewer in this mean. ^^ Two fewer in this mean.The mean scores are percentages, not raw scores. The highest scores for each competency are in bold type, the lowest initalics.
Parental involvement in schoolWe have found few associations between the kind of involvement parents have in their child’s school,
and the child’s competency scores. To look at this cumulatively, we grouped the responses at each of age8, 10, and 12 in terms of voluntary help (in classroom or other), other forms of contact or involvement(including parent-teacher evenings where teachers report on children’s progress), and no involvement.
When we analysed the relationship of parental involvement at ages 8 and 10 in relation to children’scompetency levels at age 12, we found more significant associations than we had in analysing currentinvolvement levels. These largely remained, with some dilution, after taking family income and maternal
qualification into account. Students whose parents were involved in voluntary work had higher averagescores than those who had some contact with the school other than voluntary work, but there was nodistinction with those who had no contact with their child’s school for the social skills with peers andadults.
We found for the 496 children for whom we had all the data that 69 percent had parents who had givenvoluntary help at their child’s school in at least 1 phase: 18 percent of the study children had parents whogave voluntary help at their school across all 3 phases, 28 percent had parents who gave help for 2 of the

Section Four
Cumulative experiences
62
3 phases, and 23 percent had parents who gave help for 1 phase. Nine percent had only other kinds of
involvement in their child’s school for all 3 phases. Twenty percent had had no involvement in theirchild’s school in at least 1 phase, and 2 percent, no involvement for 2 or 3 of the phases.
Children whose parents did voluntary work at their child’s school in at least 2 of the 3 phases had higheraverage scores on a number of the competencies. There are consistent patterns, with the children’s
cognitive competency scores reflecting the degree of parental involvement over the period when thestudy children were aged 8 to 12. The relationships between levels of parental involvement and the socialand attitudinal competencies are less consistent. These associations remained after taking into account
family income and maternal qualification. Children whose parents had no qualification were under-represented in the group taking part in voluntary work at the school (11 percent); no children whosemothers had a university qualification were in the group whose parents were not involved in their schoolat 2 or more stages.
Table 48 History of parental involvement at school at ages 8, 10 & 12 and children’s
competencies at age 12
History of parental involvementat school at ages 8,10,&12→
Age-12 competency↓
Voluntaryhelp atschoolages
8,10,&12Mean(n=88)
Two agesvoluntary
one“other”
Mean(n=139)
Two“other”plus 1
voluntary
Mean(n=115)
Three“other”
Mean(n=45)
One“none”
Mean(n=97)
Two orthree
“none”
Mean(n=12)
Prob. ofF-valuefrom
ANOVA
% var.
acct. for
Curiosity 68.1 64.4 61.1 53.0^ 59.1 55.7 0.0001 5.0Perseverance 76.7 73.9 64.6 59.8^ 64.9 69.8 < 0.0001 6.8Individual Responsibility 78.7 79.1 72.0 68.9^ 72.5 77.9 0.0031 3.6Social Skills with Peers* 72.7 72.9 69.9 65.6^ 69.1 75.7 0.024 2.6Communication* 73.9 72.2 67.9 62.6^ 64.9 67.3 0.0001 5.0Mathematics** 57.8 55.0 49.2 44.7 46.4 30.0 < 0.0001 5.8PAT Reading Comprehension 60.6^^ 55.8 54.3^ 51.6^ 49.2 41.6 0.002 3.9Writing** 53.7 53.3 50.7 50.2 49.5 48.6 0.013 2.9Reading Age (yrs, mo) 13.3 13.1 12.7 12.2^ 12.4^ 11.7 < 0.0001 5.5Composite Competency 70.2^^ 68.8 64.6^ 60.9^^ 63.3 62.7 < 0.0001 6.6Composite CognitiveCompetency
63.4^^ 61.8 58.9^ 57.7^ 56.6 50.4 0.0002 4.8
Composite Social & Attitudinal Competency
74.9 73.6 68.3 63.5^ 67.8 70.8 < 0.0001 6.1
* In these cases the squared model was a better fit ** In these cases the square-root model was a better fit.^ One fewer in this mean. ^^ Two fewer in this mean.The mean scores are percentages, not raw scores. The highest scores for each competency are in bold type, the lowest initalics.
Parental satisfaction with child’s school progressAt each stage, we have found significant associations between parental satisfaction levels and thechildren’s competency levels across the board, with the highest average scores for children whose parentsshowed satisfaction, and lowest for those parents who were not satisfied. In looking at previous levels of
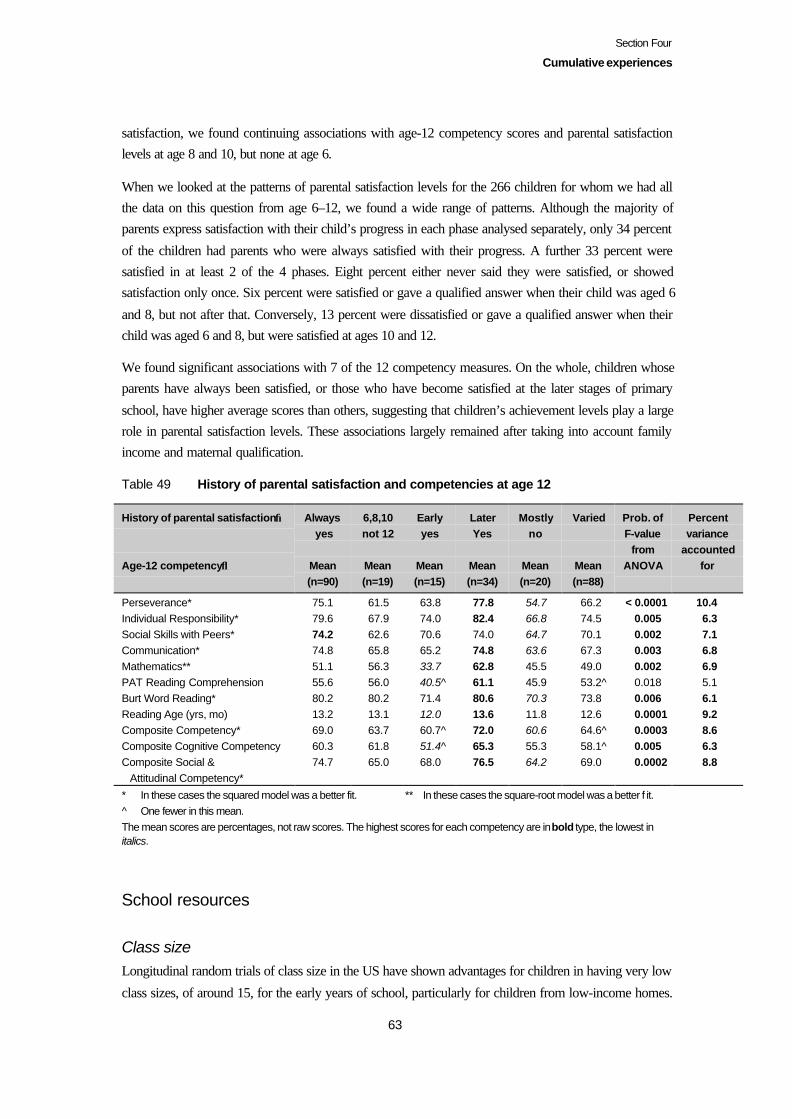
Section Four
Cumulative experiences
63
satisfaction, we found continuing associations with age-12 competency scores and parental satisfactionlevels at age 8 and 10, but none at age 6.
When we looked at the patterns of parental satisfaction levels for the 266 children for whom we had allthe data on this question from age 6–12, we found a wide range of patterns. Although the majority ofparents express satisfaction with their child’s progress in each phase analysed separately, only 34 percent
of the children had parents who were always satisfied with their progress. A further 33 percent weresatisfied in at least 2 of the 4 phases. Eight percent either never said they were satisfied, or showedsatisfaction only once. Six percent were satisfied or gave a qualified answer when their child was aged 6
and 8, but not after that. Conversely, 13 percent were dissatisfied or gave a qualified answer when theirchild was aged 6 and 8, but were satisfied at ages 10 and 12.
We found significant associations with 7 of the 12 competency measures. On the whole, children whoseparents have always been satisfied, or those who have become satisfied at the later stages of primary
school, have higher average scores than others, suggesting that children’s achievement levels play a largerole in parental satisfaction levels. These associations largely remained after taking into account familyincome and maternal qualification.
Table 49 History of parental satisfaction and competencies at age 12
History of parental satisfaction→
Age-12 competency↓
Always yes
Mean(n=90)
6,8,10not 12
Mean(n=19)
Earlyyes
Mean(n=15)
LaterYes
Mean(n=34)
Mostlyno
Mean(n=20)
Varied
Mean(n=88)
Prob. ofF-value
fromANOVA
Percentvariance
accountedfor
Perseverance* 75.1 61.5 63.8 77.8 54.7 66.2 < 0.0001 10.4Individual Responsibility* 79.6 67.9 74.0 82.4 66.8 74.5 0.005 6.3Social Skills with Peers* 74.2 62.6 70.6 74.0 64.7 70.1 0.002 7.1Communication* 74.8 65.8 65.2 74.8 63.6 67.3 0.003 6.8Mathematics** 51.1 56.3 33.7 62.8 45.5 49.0 0.002 6.9PAT Reading Comprehension 55.6 56.0 40.5^ 61.1 45.9 53.2^ 0.018 5.1Burt Word Reading* 80.2 80.2 71.4 80.6 70.3 73.8 0.006 6.1Reading Age (yrs, mo) 13.2 13.1 12.0 13.6 11.8 12.6 0.0001 9.2Composite Competency* 69.0 63.7 60.7^ 72.0 60.6 64.6^ 0.0003 8.6Composite Cognitive Competency 60.3 61.8 51.4^ 65.3 55.3 58.1^ 0.005 6.3Composite Social & Attitudinal Competency*
74.7 65.0 68.0 76.5 64.2 69.0 0.0002 8.8
* In these cases the squared model was a better fit. ** In these cases the square-root model was a better f it.^ One fewer in this mean.The mean scores are percentages, not raw scores. The highest scores for each competency are in bold type, the lowest initalics.
School resources
Class sizeLongitudinal random trials of class size in the US have shown advantages for children in having very low
class sizes, of around 15, for the early years of school, particularly for children from low-income homes.
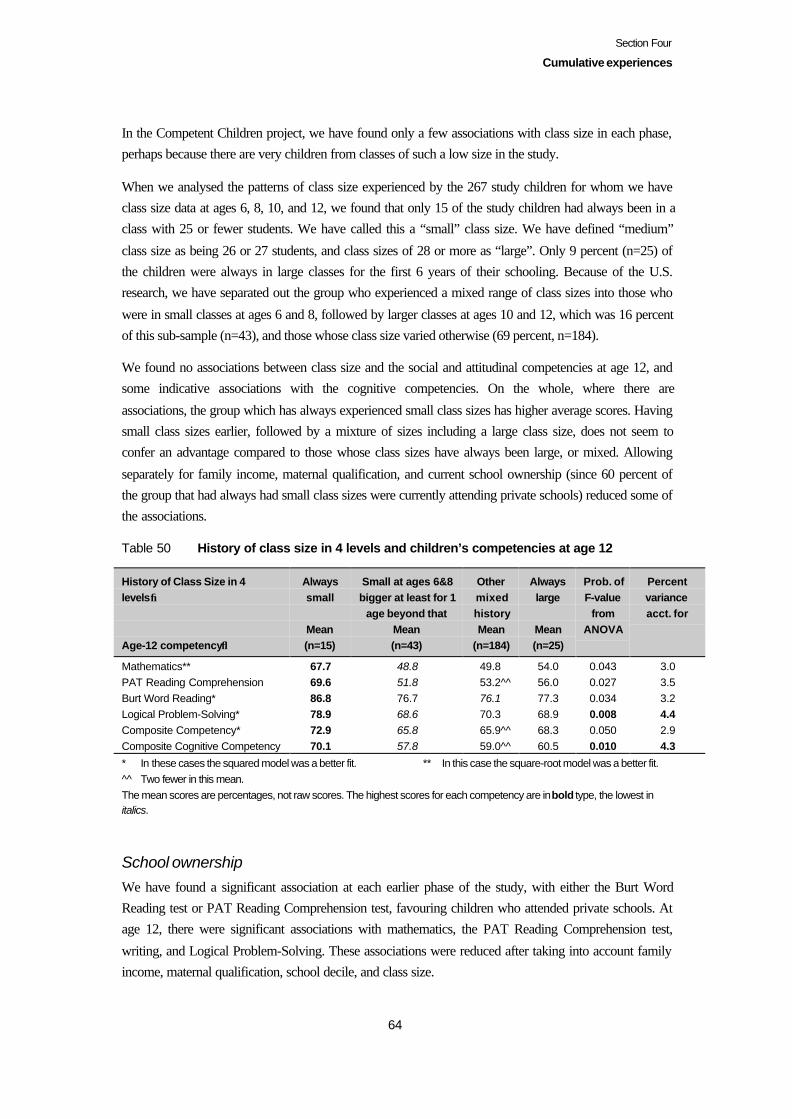
Section Four
Cumulative experiences
64
In the Competent Children project, we have found only a few associations with class size in each phase,perhaps because there are very children from classes of such a low size in the study.
When we analysed the patterns of class size experienced by the 267 study children for whom we haveclass size data at ages 6, 8, 10, and 12, we found that only 15 of the study children had always been in aclass with 25 or fewer students. We have called this a “small” class size. We have defined “medium”
class size as being 26 or 27 students, and class sizes of 28 or more as “large”. Only 9 percent (n=25) ofthe children were always in large classes for the first 6 years of their schooling. Because of the U.S.research, we have separated out the group who experienced a mixed range of class sizes into those who
were in small classes at ages 6 and 8, followed by larger classes at ages 10 and 12, which was 16 percentof this sub-sample (n=43), and those whose class size varied otherwise (69 percent, n=184).
We found no associations between class size and the social and attitudinal competencies at age 12, andsome indicative associations with the cognitive competencies. On the whole, where there are
associations, the group which has always experienced small class sizes has higher average scores. Havingsmall class sizes earlier, followed by a mixture of sizes including a large class size, does not seem toconfer an advantage compared to those whose class sizes have always been large, or mixed. Allowing
separately for family income, maternal qualification, and current school ownership (since 60 percent ofthe group that had always had small class sizes were currently attending private schools) reduced some ofthe associations.
Table 50 History of class size in 4 levels and children’s competencies at age 12
History of Class Size in 4levels→
Age-12 competency↓
Alwayssmall
Mean(n=15)
Small at ages 6&8bigger at least for 1
age beyond thatMean(n=43)
OthermixedhistoryMean
(n=184)
Alwayslarge
Mean(n=25)
Prob. ofF-value
fromANOVA
Percentvarianceacct. for
Mathematics** 67.7 48.8 49.8 54.0 0.043 3.0PAT Reading Comprehension 69.6 51.8 53.2^^ 56.0 0.027 3.5Burt Word Reading* 86.8 76.7 76.1 77.3 0.034 3.2Logical Problem-Solving* 78.9 68.6 70.3 68.9 0.008 4.4Composite Competency* 72.9 65.8 65.9^^ 68.3 0.050 2.9Composite Cognitive Competency 70.1 57.8 59.0^^ 60.5 0.010 4.3
* In these cases the squared model was a better fit. ** In this case the square-root model was a better fit.^^ Two fewer in this mean.The mean scores are percentages, not raw scores. The highest scores for each competency are in bold type, the lowest initalics.
School ownershipWe have found a significant association at each earlier phase of the study, with either the Burt WordReading test or PAT Reading Comprehension test, favouring children who attended private schools. Atage 12, there were significant associations with mathematics, the PAT Reading Comprehension test,
writing, and Logical Problem-Solving. These associations were reduced after taking into account familyincome, maternal qualification, school decile, and class size.
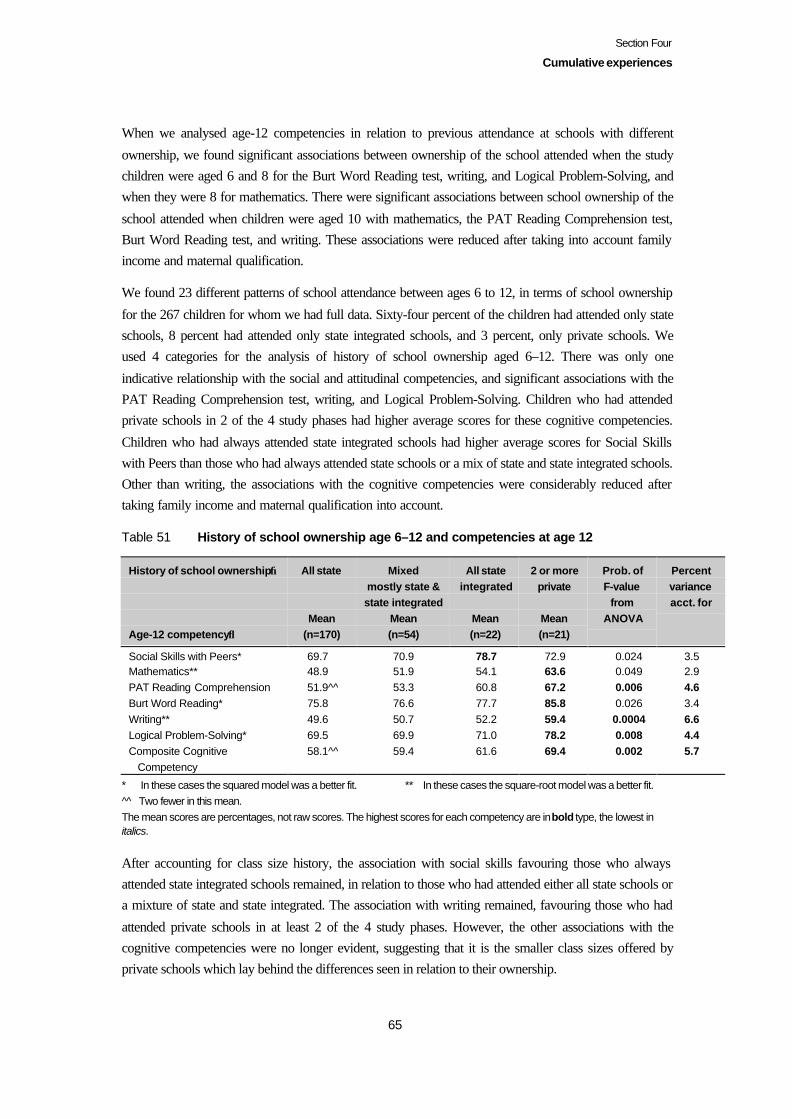
Section Four
Cumulative experiences
65
When we analysed age-12 competencies in relation to previous attendance at schools with different
ownership, we found significant associations between ownership of the school attended when the studychildren were aged 6 and 8 for the Burt Word Reading test, writing, and Logical Problem-Solving, andwhen they were 8 for mathematics. There were significant associations between school ownership of the
school attended when children were aged 10 with mathematics, the PAT Reading Comprehension test,Burt Word Reading test, and writing. These associations were reduced after taking into account familyincome and maternal qualification.
We found 23 different patterns of school attendance between ages 6 to 12, in terms of school ownership
for the 267 children for whom we had full data. Sixty-four percent of the children had attended only stateschools, 8 percent had attended only state integrated schools, and 3 percent, only private schools. Weused 4 categories for the analysis of history of school ownership aged 6–12. There was only one
indicative relationship with the social and attitudinal competencies, and significant associations with thePAT Reading Comprehension test, writing, and Logical Problem-Solving. Children who had attendedprivate schools in 2 of the 4 study phases had higher average scores for these cognitive competencies.
Children who had always attended state integrated schools had higher average scores for Social Skillswith Peers than those who had always attended state schools or a mix of state and state integrated schools.Other than writing, the associations with the cognitive competencies were considerably reduced aftertaking family income and maternal qualification into account.
Table 51 History of school ownership age 6–12 and competencies at age 12
History of school ownership→
Age-12 competency↓
All state
Mean(n=170)
Mixedmostly state &state integrated
Mean(n=54)
All stateintegrated
Mean(n=22)
2 or moreprivate
Mean(n=21)
Prob. ofF-value
fromANOVA
Percentvarianceacct. for
Social Skills with Peers* 69.7 70.9 78.7 72.9 0.024 3.5Mathematics** 48.9 51.9 54.1 63.6 0.049 2.9PAT Reading Comprehension 51.9^^ 53.3 60.8 67.2 0.006 4.6Burt Word Reading* 75.8 76.6 77.7 85.8 0.026 3.4Writing** 49.6 50.7 52.2 59.4 0.0004 6.6Logical Problem-Solving* 69.5 69.9 71.0 78.2 0.008 4.4Composite Cognitive Competency
58.1^^ 59.4 61.6 69.4 0.002 5.7
* In these cases the squared model was a better fit. ** In these cases the square-root model was a better fit.^ ̂ Two fewer in this mean.The mean scores are percentages, not raw scores. The highest scores for each competency are in bold type, the lowest initalics.
After accounting for class size history, the association with social skills favouring those who alwaysattended state integrated schools remained, in relation to those who had attended either all state schools ora mixture of state and state integrated. The association with writing remained, favouring those who had
attended private schools in at least 2 of the 4 study phases. However, the other associations with thecognitive competencies were no longer evident, suggesting that it is the smaller class sizes offered byprivate schools which lay behind the differences seen in relation to their ownership.
Section Four
Cumulative experiences
66
School socio-economic decileWe have found associations between the cognitive competencies and Communication, and school socio-economic decile at each earlier phase, only a few at age-6, but more at later ages.
When we analysed the relationship between the age-12 competencies and each of the earlier phasesseparately, we found stronger associations with the socio-economic decile of the school attended at age 6
than showed with age-6 competency scores, and similar associations as those found for currentcompetency levels for the socio-economic decile of the school attended at age 8 and age 10. Theassociations remained significant after taking into account family income and maternal qualification for
all competencies other than reading age, and writing (in relation to age-8 school decile). Generally,students who had attended decile 1–2 schools at an earlier age had lower average scores than others, andstudents who had attended decile 9–10 schools at an earlier age, higher scores.
This suggested a grouping of deciles into low (1–2), medium (3–-8), and high (9–-10) for analysis of the
children’s history of school attendance in terms of socio-economic decile. We found 33 different patternsover the 6-year period, for the 243 students for whom we had all the data for each of the 4 phases. Thisreflects movement between schools related mainly to change of family residence, but also deliberate
choices of new schools. It is also likely to reflect changes in the decile designation of schools, which wererevisited at least once in this period on a national basis, after the national census in 1996, and children’sshifts at age 12 to intermediates and Year 7–15 secondary schools which, because they draw on wider
catchment areas, tend to have different (overall higher) decile ratings overall compared with primaryschools.
Sixteen percent of this sub-sample had always attended a high-decile school. Thirty percent had alwaysattended a medium decile school. Only 4 percent (n=9) of the children had always attended a low-decileschool between the ages of 6 to 12.
We regrouped these patterns into 4 categories, as shown in the table below. The “high” category includeschildren whose school was high-decile from ages 6–10, then medium at age 12. The “mixed” categoryincluded all mixtures, including children who did attend a high-decile school for two of the phases, orwhose latest school was high-decile.
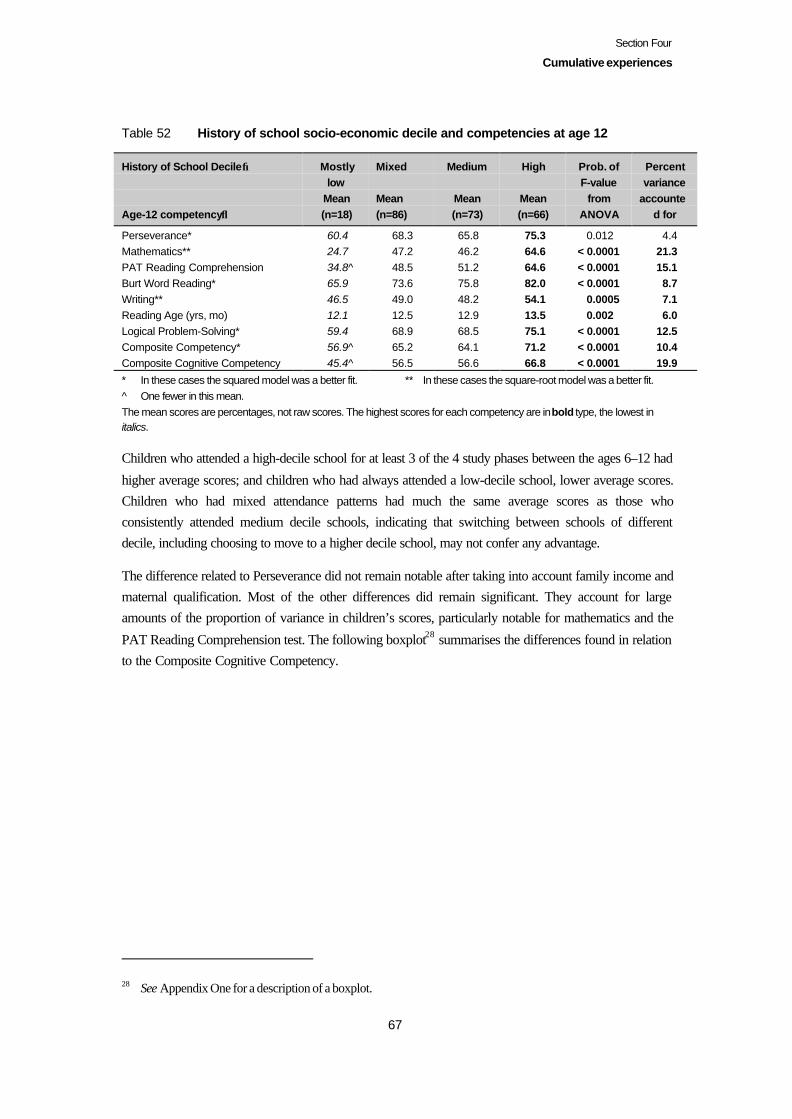
Section Four
Cumulative experiences
67
Table 52 History of school socio-economic decile and competencies at age 12
History of School Decile→
Age-12 competency↓
Mostlylow
Mean(n=18)
Mixed
Mean(n=86)
Medium
Mean(n=73)
High
Mean(n=66)
Prob. ofF-value
fromANOVA
Percentvariance
accounted for
Perseverance* 60.4 68.3 65.8 75.3 0.012 4.4Mathematics** 24.7 47.2 46.2 64.6 < 0.0001 21.3PAT Reading Comprehension 34.8^ 48.5 51.2 64.6 < 0.0001 15.1Burt Word Reading* 65.9 73.6 75.8 82.0 < 0.0001 8.7Writing** 46.5 49.0 48.2 54.1 0.0005 7.1Reading Age (yrs, mo) 12.1 12.5 12.9 13.5 0.002 6.0Logical Problem-Solving* 59.4 68.9 68.5 75.1 < 0.0001 12.5Composite Competency* 56.9^ 65.2 64.1 71.2 < 0.0001 10.4Composite Cognitive Competency 45.4^ 56.5 56.6 66.8 < 0.0001 19.9
* In these cases the squared model was a better fit. ** In these cases the square-root model was a better fit.^ One fewer in this mean.The mean scores are percentages, not raw scores. The highest scores for each competency are in bold type, the lowest initalics.
Children who attended a high-decile school for at least 3 of the 4 study phases between the ages 6–12 had
higher average scores; and children who had always attended a low-decile school, lower average scores.Children who had mixed attendance patterns had much the same average scores as those whoconsistently attended medium decile schools, indicating that switching between schools of differentdecile, including choosing to move to a higher decile school, may not confer any advantage.
The difference related to Perseverance did not remain notable after taking into account family income andmaternal qualification. Most of the other differences did remain significant. They account for largeamounts of the proportion of variance in children’s scores, particularly notable for mathematics and the
PAT Reading Comprehension test. The following boxplot28 summarises the differences found in relationto the Composite Cognitive Competency.
28 See Appendix One for a description of a boxplot.

Section Four
Cumulative experiences
68
Figure 3 History of school decile and Cognitive Composite score
Changes in daily settings
Shifting houseSixty-nine percent of the study children had moved house at least once by the time they were 12. Twenty-
three percent had moved once, 15 percent, twice, 17 percent, 3 or 4 times, and 14 percent, 5 or moretimes (to a total of 14 shifts for one child). A number of associations were found with children’scompetency levels at age 12, generally favouring children who had either stayed in the same house, ormoved only once or twice in relation to those who had moved 5 or more times.
3040
5060
7080
90Cognitive Composite at age 12 grouped by
History of School Decile across ages 6, 8, 10 & 12
History of School Decile across ages 6, 8, 10 & 12mostly low mixed medium high
Cog
nitiv
e C
ompo
site
at a
ge 1
2
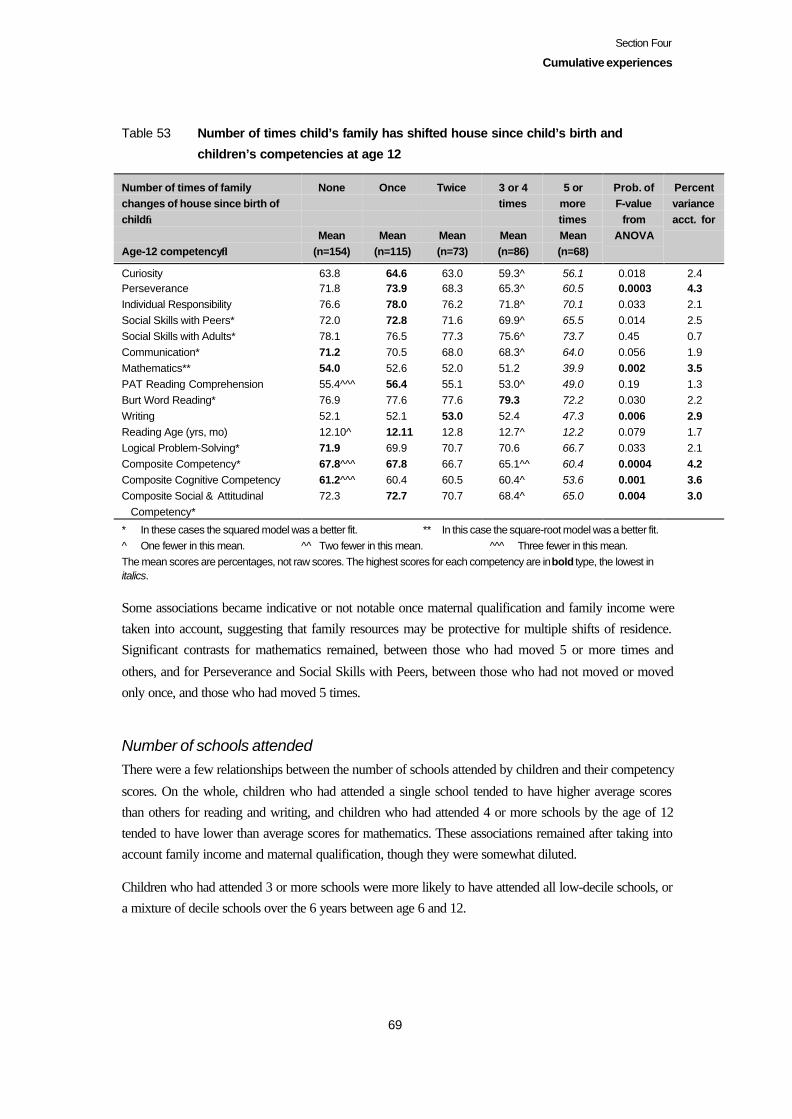
Section Four
Cumulative experiences
69
Table 53 Number of times child’s family has shifted house since child’s birth and
children’s competencies at age 12
Number of times of familychanges of house since birth ofchild→
Age-12 competency↓
None
Mean(n=154)
Once
Mean(n=115)
Twice
Mean(n=73)
3 or 4times
Mean(n=86)
5 ormoretimesMean(n=68)
Prob. ofF-value
fromANOVA
Percentvarianceacct. for
Curiosity 63.8 64.6 63.0 59.3^ 56.1 0.018 2.4Perseverance 71.8 73.9 68.3 65.3^ 60.5 0.0003 4.3Individual Responsibility 76.6 78.0 76.2 71.8^ 70.1 0.033 2.1Social Skills with Peers* 72.0 72.8 71.6 69.9^ 65.5 0.014 2.5Social Skills with Adults* 78.1 76.5 77.3 75.6^ 73.7 0.45 0.7Communication* 71.2 70.5 68.0 68.3^ 64.0 0.056 1.9Mathematics** 54.0 52.6 52.0 51.2 39.9 0.002 3.5PAT Reading Comprehension 55.4^^^ 56.4 55.1 53.0^ 49.0 0.19 1.3Burt Word Reading* 76.9 77.6 77.6 79.3 72.2 0.030 2.2Writing 52.1 52.1 53.0 52.4 47.3 0.006 2.9Reading Age (yrs, mo) 12.10^ 12.11 12.8 12.7^ 12.2 0.079 1.7Logical Problem-Solving* 71.9 69.9 70.7 70.6 66.7 0.033 2.1Composite Competency* 67.8^^^ 67.8 66.7 65.1^^ 60.4 0.0004 4.2Composite Cognitive Competency 61.2^^^ 60.4 60.5 60.4^ 53.6 0.001 3.6Composite Social & Attitudinal Competency*
72.3 72.7 70.7 68.4^ 65.0 0.004 3.0
* In these cases the squared model was a better fit. ** In this case the square-root model was a better fit.^ One fewer in this mean. ^^ Two fewer in this mean. ^^ ̂ Three fewer in this mean.The mean scores are percentages, not raw scores. The highest scores for each competency are in bold type, the lowest initalics.
Some associations became indicative or not notable once maternal qualification and family income weretaken into account, suggesting that family resources may be protective for multiple shifts of residence.Significant contrasts for mathematics remained, between those who had moved 5 or more times and
others, and for Perseverance and Social Skills with Peers, between those who had not moved or movedonly once, and those who had moved 5 times.
Number of schools attendedThere were a few relationships between the number of schools attended by children and their competency
scores. On the whole, children who had attended a single school tended to have higher average scoresthan others for reading and writing, and children who had attended 4 or more schools by the age of 12tended to have lower than average scores for mathematics. These associations remained after taking intoaccount family income and maternal qualification, though they were somewhat diluted.
Children who had attended 3 or more schools were more likely to have attended all low-decile schools, ora mixture of decile schools over the 6 years between age 6 and 12.
Section Four
Cumulative experiences
70
Transitions between schools between ages 10–12There is growing interest in the impact of transitions between schools serving different age groups. Forty-four percent of the study children moved from primary school to 2-year intermediates between our datagathering at age 10, and at age 12. Thirty-six percent stayed at their (“full”) primary school. Other
transitions were: 8 percent moved to Year 7–15 secondary schools, 5 percent moved from primaryschools to composite schools, and 7 percent changed their primary school.
We found a significant association with writing, and indicative associations with mathematics, PATReading Comprehension test, Logical Problem-Solving, and Individual Responsibility, though theproportion of variance accounted for by patterns in transition at this stage was small.
The associations favoured children who moved from primary to composite schools (all private). Theseassociations were no longer notable after taking into account family income and maternal qualification.
Thus the main transition at this age, from primary to intermediate school, did not appear to have a markedassociation with children’s competency scores. We tested this out further in 2-factor modelling, where we
first accounted for age-10 PAT Reading Comprehension test scores. The contrasts favouring childrenwho had moved from primary to composite schools were no longer present. There was one remainingcontrast (p = 0.045), a 3 percentage points difference in score favouring children who stayed at the same
school and those who moved from a primary to intermediate school. We did not analyse this result furtherin terms of family income and maternal qualification, but it seems likely that this result would no longerbe notable once we had taken them into account, since intermediate school attendance was related tothese 2 family characteristics.
Family typeThe categories we used here were based on parents’ reports of their family make-up at ages 5, 8, 10, and12, based on the 406 for whom we had data at each stage. They are:
• all stages: 2-parent biological (71 percent);
• all stages: 1-parent biological (6 percent);• some stages 2-parent, some stages 1-parent (10 percent); and• biological parent and partner in at least 1 stage (13 percent).
The only significant associations found were with Perseverance and mathematics. Children who were in2-parent biological families at all stages had higher average scores than those who were in 1-parentfamilies at all stages. This association remained significant with Perseverance after taking maternal
qualification into account, but not family income at age 5. The association with mathematics becameindicative after taking maternal qualification into account, and was no longer evident after taking intoaccount family income.
Children who were in 1-parent families, and those where there was at least one stage where the parents
were the biological parent and her/his partner tended to be over-represented in the low-income group, incontrast to the children who had had their original 2 parents at all stages. Differences in patterns related tomaternal qualification were evident, but not so clear-cut.
Section Four
Cumulative experiences
71
Child’s responses
How child copes with upsetsCurrent experience of being upset, and how a child coped with it, showed some associations with age-12competency levels, more so for the social and attitudinal than cognitive competencies. These associationsremained after taking family income and maternal qualification into account.
When we analysed the relationship with age-12 competency scores with children’s earlier experience of
upsets and how they dealt with them (at ages 8 and 10), taking each phase separately, we found only afew indicative associations. An association with Reading Age was common to both earlier phases.
Thirty-five percent of the 489 children for whom we had data for all 3 phases had not experiencedanything which upset them (on parental report, at the time of our interviews). Only 3 students were upset
and not coping in all 3 stages. We grouped the data into 10 categories, and examined the box-plots ofthese categories’ association with Perseverance, Social Skills with Peers, mathematics, and theComposite Competency to decide on a smaller number of categories for analysis. The following table
shows 6 categories, and the average scores for each. There are significant associations for 3 of the 6 socialand attitudinal competencies, showing higher average scores for those who experience no upsettingexperiences. This same pattern does not emerge with mathematics, when it was children who
experienced upsets at every age but who could cope with it, at least some of the time, who had higheraverage scores; the children with the lowest average scores were those who were upset more than once,or currently, and who did not cope with being upset. These associations remained after taking intoaccount family income and maternal qualification.
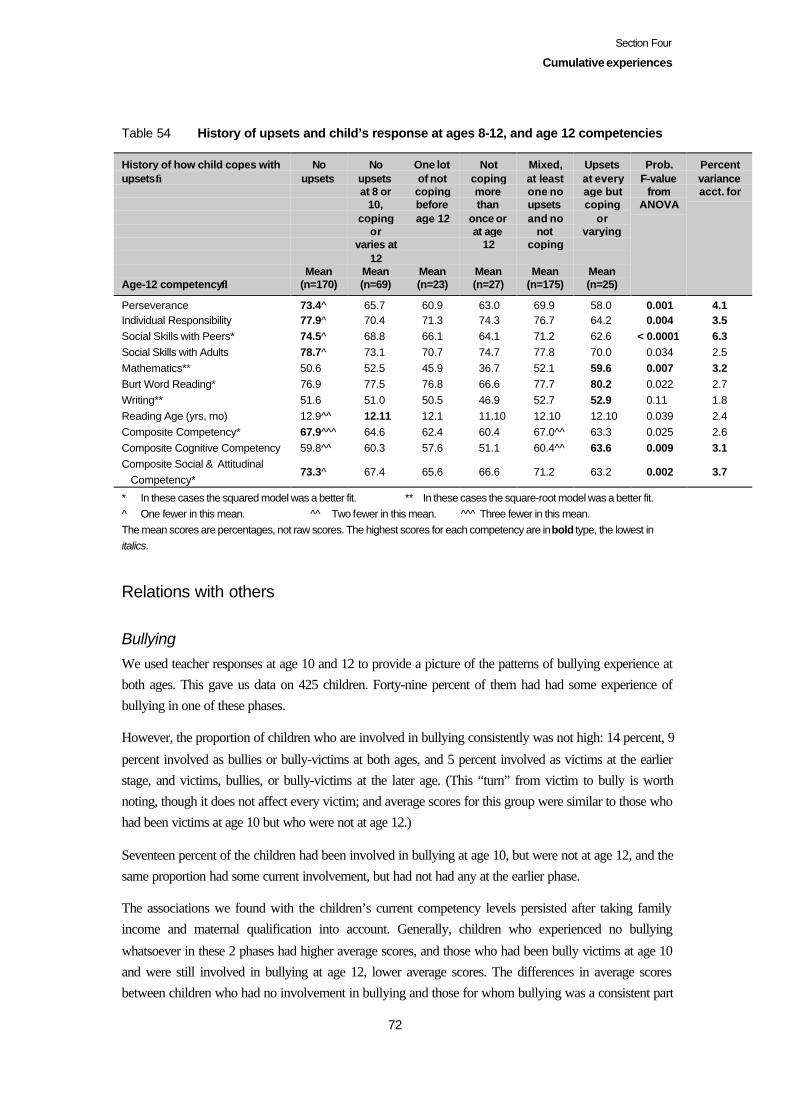
Section Four
Cumulative experiences
72
Table 54 History of upsets and child’s response at ages 8-12, and age 12 competencies
History of how child copes withupsets→
Age-12 competency↓
Noupsets
Mean(n=170)
Noupsetsat 8 or
10,coping
orvaries at
12Mean(n=69)
One lotof notcopingbeforeage 12
Mean(n=23)
Notcopingmorethan
once orat age
12
Mean(n=27)
Mixed,at leastone noupsetsand no
notcoping
Mean(n=175)
Upsetsat everyage butcoping
orvarying
Mean(n=25)
Prob.F-value
fromANOVA
Percentvarianceacct. for
Perseverance 73.4^ 65.7 60.9 63.0 69.9 58.0 0.001 4.1Individual Responsibility 77.9^ 70.4 71.3 74.3 76.7 64.2 0.004 3.5Social Skills with Peers* 74.5^ 68.8 66.1 64.1 71.2 62.6 < 0.0001 6.3Social Skills with Adults 78.7^ 73.1 70.7 74.7 77.8 70.0 0.034 2.5Mathematics** 50.6 52.5 45.9 36.7 52.1 59.6 0.007 3.2Burt Word Reading* 76.9 77.5 76.8 66.6 77.7 80.2 0.022 2.7Writing** 51.6 51.0 50.5 46.9 52.7 52.9 0.11 1.8Reading Age (yrs, mo) 12.9^^ 12.11 12.1 11.10 12.10 12.10 0.039 2.4Composite Competency* 67.9^^^ 64.6 62.4 60.4 67.0^^ 63.3 0.025 2.6Composite Cognitive Competency 59.8^^ 60.3 57.6 51.1 60.4^^ 63.6 0.009 3.1Composite Social & Attitudinal Competency*
73.3^ 67.4 65.6 66.6 71.2 63.2 0.002 3.7
* In these cases the squared model was a better fit. ** In these cases the square-root model was a better fit.^ One fewer in this mean. ^^ Two fewer in this mean. ^^ ̂ Three fewer in this mean.The mean scores are percentages, not raw scores. The highest scores for each competency are in bold type, the lowest initalics.
Relations with others
BullyingWe used teacher responses at age 10 and 12 to provide a picture of the patterns of bullying experience atboth ages. This gave us data on 425 children. Forty-nine percent of them had had some experience ofbullying in one of these phases.
However, the proportion of children who are involved in bullying consistently was not high: 14 percent, 9
percent involved as bullies or bully-victims at both ages, and 5 percent involved as victims at the earlierstage, and victims, bullies, or bully-victims at the later age. (This “turn” from victim to bully is worthnoting, though it does not affect every victim; and average scores for this group were similar to those whohad been victims at age 10 but who were not at age 12.)
Seventeen percent of the children had been involved in bullying at age 10, but were not at age 12, and thesame proportion had some current involvement, but had not had any at the earlier phase.
The associations we found with the children’s current competency levels persisted after taking familyincome and maternal qualification into account. Generally, children who experienced no bullying
whatsoever in these 2 phases had higher average scores, and those who had been bully victims at age 10and were still involved in bullying at age 12, lower average scores. The differences in average scoresbetween children who had no involvement in bullying and those for whom bullying was a consistent part

Section Four
Cumulative experiences
73
of their school experience over the 2 phases were around 10 percentage points for the cognitive
competencies, and a year and a half for Reading Age, and between 13 and 21 percentage points for thesocial and attitudinal competencies.
Table 55 History of child’s involvement in bullying age 10–12 and competencies at age
12
History of Involvement inBullying→
Age-12 competency↓
Bullyvictim atage 10,victim,bully, or
bullyvictim atage 12
Mean(n=23)
Victim,bully, or
bullyvictim atage 10
but noneof theseat age 12
Mean(n=73)
Victim atage 10,victim,bully, or
bullyvictim atage 12
Mean(n=22)
Bully at10,
victim,bully orbully
victim atage 12
Mean(n=17)
Notvictim,bully, or
bullyvictim at
10,victim,bully, or
bullyvictim at
12Mean(n=72)
None ofthese at
bothages 10and 12
Mean(n=218)
Prob.F-valuefrom
ANOVA
% var.acct. for
Perseverance* 53.8 66.5 66.5 68.0 62.1^ 74.8 < 0.0001 8.8Individual Responsibility* 64.1 73.0 75.2 74.1 71.2^ 78.7 0.0002 5.5Social Skills with Peers* 56.3 69.4 68.3 68.4 68.4^ 74.3 < 0.0001 9.2Social Skills with Adults* 63.8 77.7 78.0 77.9 73.1^ 79.2 0.003 4.3Communication* 59.6 69.4 70.3 70.9 64.5^ 72.3 0.002 4.4Mathematics** 45.0 50.1 49.1 41.8 47.2 55.6 0.014 3.3PAT Reading Comprehension 44.6 53.5 48.4 50.2 50.2 59.2^^^ 0.0006 5.1Burt Word Reading* 70.8 76.2 78.0 72.5 73.6 80.4 0.002 4.5Reading Age (yrs, mo) 11.10 12.5 12.4 12.7 12.3^ 13.2^ < 0.0001 6.9Composite Competency* 58.0 65.1 65.6 64.3 62.5^ 69.7^^^ < 0.0001 8.2Composite Cognitive Competency 54.8 58.7 58.5 56.2 57.2 63.1^^^ 0.0006 5.0Composite Social & Attitudinal Competency*
60.2 69.5 70.4 69.7 66.2^ 74.0 < 0.0001 7.1
* In these cases the squared model was a better fit. ** In this case the square-root model was a better fit.^ One fewer in this mean. ^^^ Three fewer in this mean.The mean scores are percentages, not raw scores. The highest scores for each competency are in bold type, the lowest initalics.
Summary
Longitudinal pictures of children’s experience and access to resources show that behind the “snapshots”taken at each age lies sometimes considerable variability in previous experience and access to resources.
Does stability confer advantages?Do children benefit from stability per se? Children who stayed in the same house or shifted once or twiceonly between their birth and age 12 tended to have higher average scores than those who had shifted 5 ormore times. Those whose families had always enjoyed very high-incomes also had higher average scores.
Section Four
Cumulative experiences
74
There seemed to be some disadvantage to study children whose family income levels varied over time,
compared with those whose family incomes remained stable, even at low levels. Yet we do not seedisadvantage occurring from variation in maternal employment, or family type.
In terms of the children’s own use of time, the advantage of consistency depends on the kind of use. It isadvantageous to always complete homework, and to consistently watch less than 2 hours television a day
on average. It is not advantageous to be watching large amounts of television consistently from the agesof 5 to 12. (Nor was this association with lower competency levels reduced by sometimes watchingsmaller amounts.) Children whose participation in music varied between ages 8 and 12 did not have
lower average scores than those whose participation was consistent; those with the lower scores werethose who had been consistent in having no participation in music.
It is an advantage to stay clear of bullying behaviour, whether as victim or bully, or both.
Only 3 of the study children were consistently upset and not coping in all 3 phases between ages 8 and12. Children who were upset more than once over this time, or currently, and who did not cope with it,
tended to have lower average scores. Children who had upsets but coped with them tended to have higheraverage scores for mathematics, and those who experienced no upsets during this time had higheraverage scores for Perseverance, Individual Responsibility, and Social Skills with Peers.
Few paths through school run entirely smoothly
Different teachers experience their relationship with a child’s parents differently. Only 13 percent of thestudy children had relationships between parents and teachers that their teachers consistently thoughtwere very good/excellent over the ages 8 to 12. These children, and those for whom the relationship wasseen as very good/excellent for 2 of the 3 phases, tended to have higher average scores.
Parents and teachers are likely to work together at least once during the age-8 to age-12 period on aproblem that an individual child is experiencing. This did not seem to affect children’s cognitivecompetencies, unless a child consistently experienced academic problems. It did seem to affect children’s
age-12 scores for the social and attitudinal competencies if children experienced a problem in 2 or moreof the 3 study phases.
Sixty-nine percent of the parents of the study children gave voluntary help at their child’s school in atleast 1 of the 3 study phases during the age-8 to age-12 period, and only 2 percent of the parents had had
no involvement in their child’s school for 2 or 3 of the study phases. Children whose parents didvoluntary work at their school for at least 2 of the 3 phases had higher average scores, suggesting thatchildren were receiving a consistent message about the value of school. Conversely, children whose
parents had no involvement in their school in 2 or 3 of the phases had lower scores: they too were gettingconsistent messages, but perhaps not ones supporting their engagement in school.
Only 34 percent of the children’s parents were always satisfied with their progress at school between ages6 to 12, and only 8 percent were never satisfied, or only once satisfied. Consistency in parentalsatisfaction with progress is associated with higher scores, or with becoming satisfied at age 10 or 12.
Section Four
Cumulative experiences
75
Structural aspects of schoolStability of class size was useful for the few children whose classes have always been small (in this study,
25 or fewer students). Otherwise, there were no differences related to cumulative experiences of classesof different size, whether the classes were much the same in size over the years, or varied. However, thevariation in class size in our sample is not large.
Children who have consistently attended state integrated schools have higher average scores for Social
Skills with Peers than others, and those who have consistently attended private schools, higher averagescores for writing.
Half the children have consistently attended schools in the same socio-economic decile band (low,medium, and high). Children who attended a high-decile school for at least 3 of the 4 study phases
between the ages 6–12 had higher average scores; and children who had always attended a low-decileschool, lower average scores. Children who had mixed attendance patterns had much the same averagescores as those who consistently attended medium decile schools, indicating that switching between
schools of different decile, including choosing to move to a higher decile school, may not confer anyadvantage.
There appears to be some advantage in stability of school: children who stayed at the same schoolbetween ages 6 and 12 tended to have higher average scores for reading and writing, and children who
had attended 4 or more schools, lower average scores for mathematics. However, though there is highinterest in the effects of transition between different school stages, we found no disadvantages forchildren who changed school between age 10 and 12.
Overall, the experience of stability or just a couple of changes in the daily settings of children’s lives—
their homes (and possibly neighbourhoods) and schools—appeared to give children advantages in some,but by no means all, of the competencies. But family income and maternal qualification levels appear toact “protectively” in relation to large numbers of changes in residence for some competencies andexperiences.
It is interesting that mathematics performance does seem to be affected by a higher number of changes ofresidence and school. This is consistent with the way in which mathematics knowledge and skills developmore in a “building block” way, one level needing an earlier level to be mastered before further progresscan be made.
76
Section Five
Contributions of early childhood education
The role of early childhood education (ECE) in children’s lives, both at the time they participated in it,and later, has been a key focus for the Competent Children study. We have found that aspects of ECEcontinued to show associations with the study children’s competency scores 5 years after they left it,
when they were aged 10. These associations were mainly with children’s literacy, mathematics, andSocial Skills with Peers, and the aspects of early childhood education were mainly related to quality ofthe child’s final ECE centre, length of ECE experience, and the socio-economic mix served by the child’sfinal ECE centre. More detail is given in Wylie and Thompson (2002).
This section focuses on the research question:
Does early childhood education continue to have an impact at age 12? If so, which aspects remainimportant?
We analysed the following aspects of the study children’s ECE experience in 2 ways. First, we usedANOVA analysis to establish whether there were still associations between the aspect and children’s
competency scores at age 12, which remained after taking into account family income and maternalqualification. Then, for those aspects which showed associations, we included in the models the child’sage-5 score on each competency, to see whether the aspect was having an association through its
contribution to the age-5 score, or whether it was also making a contribution over and above this. Formost of this analysis, we use only the “original sample” children, for whom we have full material on earlychildhood education experience and quality, but there are some aspects for which we have data for thewhole study sample.
Associations between ECE experience and children’scompetencies at age 12
We start with the results of the first analysis. We included in this analysis those aspects which haveshown no associations throughout the study, just in case there was a “sleeper” effect. But we continued tofind no associations between the children’s competency levels, and parental satisfaction levels with ECEstaff communication with them about their child’s experience in their final ECE
Section Five
Contributions of early childhood education
77
centre, parental perception that the final ECE centre had some negative aspects for their child, or the level
of parental involvement in the child’s final ECE centre. We have found 1 or 2 associations over the yearsin relation to children’s patterns of combinations of ECE types (whether they attended 2 or more in thesame time period, for example, both kindergarten and family day care), but we found no associationswith age-12 competencies.
Length of ECE experienceWe have 2 kinds of data on children’s length of time in ECE: their starting age, and the total length oftheir experience.
Starting ageWe used data for all the children in the study at age 12 to analyse the association between ECE startingage and children’s competencies at age 12. Twenty-eight percent of the children had started ECE beforethey were a year old. Sixteen percent had started ECE in their second year, and 22 percent, in their third
year. Thirty-three percent had started ECE after age 3. We found significant associations with Curiosity,mathematics, and PAT Reading Comprehension test, and indicative associations with Reading Age andLogical Problem-Solving. In general, children who started ECE before they were age 2 had higher scores
of around 4–5 percentage points compared with those who started after that age. The associations formathematics and the PAT Reading Comprehension test remained after taking family income andmaternal qualification into account, but not those for Curiosity, Reading Age, or Logical Problem-Solving.
Length of ECE experienceLength of experience is not synonymous with starting age, since some children who start ECE experienceat the same age had breaks in that experience. Positive associations with length of ECE experience have
been reported from a number of longitudinal studies, including the Christchurch study (Fergusson,Horwood, and Lynskey, 1994), and in Sweden (Andersson, 1993; Broberg et al., 1997). The US researchshows more mixed findings, with positive associations linked to the quality of the ECE experience, or the
school experience following it (Currie, 2000; Smith et al., 2000; pp. 30–37). In the Competent Childrenstudy, we have found associations at each phase after the completion of ECE, stronger at ages 6 and 8than at age 10, with some dilution after taking into account family income and maternal qualification.
There have been consistent associations with mathematics, Communication, and Logical Problem-Solving.
At age 12, we continued to find significant associations with mathematics and Logical Problem-Solving,but no longer with Communication. An indicative association with Social Skills with Adults emerged for
the first time, with the contrast favouring children who had attended ECE for between 24–35 months overthose who had attended for 48 months or more remaining indicative after taking family income andmaternal qualification into account. However, there was no difference in average scores for children who
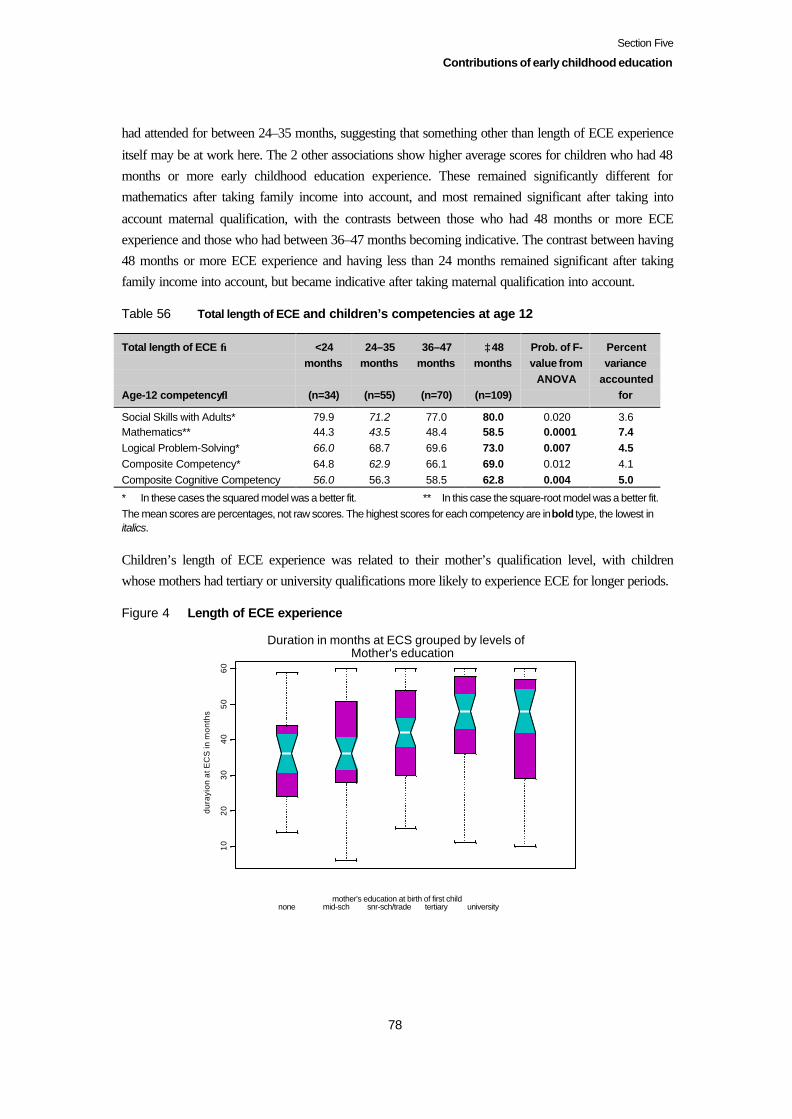
Section Five
Contributions of early childhood education
78
had attended for between 24–35 months, suggesting that something other than length of ECE experience
itself may be at work here. The 2 other associations show higher average scores for children who had 48months or more early childhood education experience. These remained significantly different formathematics after taking family income into account, and most remained significant after taking into
account maternal qualification, with the contrasts between those who had 48 months or more ECEexperience and those who had between 36–47 months becoming indicative. The contrast between having48 months or more ECE experience and having less than 24 months remained significant after takingfamily income into account, but became indicative after taking maternal qualification into account.
Table 56 Total length of ECE and children’s competencies at age 12
Total length of ECE →
Age-12 competency↓
<24months
(n=34)
24–35months
(n=55)
36–47months
(n=70)
≥48months
(n=109)
Prob. of F-value from
ANOVA
Percentvariance
accountedfor
Social Skills with Adults* 79.9 71.2 77.0 80.0 0.020 3.6Mathematics** 44.3 43.5 48.4 58.5 0.0001 7.4Logical Problem-Solving* 66.0 68.7 69.6 73.0 0.007 4.5Composite Competency* 64.8 62.9 66.1 69.0 0.012 4.1Composite Cognitive Competency 56.0 56.3 58.5 62.8 0.004 5.0
* In these cases the squared model was a better fit. ** In this case the square-root model was a better fit.The mean scores are percentages, not raw scores. The highest scores for each competency are in bold type, the lowest initalics.
Children’s length of ECE experience was related to their mother’s qualification level, with childrenwhose mothers had tertiary or university qualifications more likely to experience ECE for longer periods.
Figure 4 Length of ECE experience
10
20
30
40
50
60
Duration in months at ECS grouped by levels of Mother's education
mother's education at birth of first child none mid-sch snr-sch/trade tertiary university
dura
yion
at E
CS
in m
onth
s
Section Five
Contributions of early childhood education
79
Final ECE typeIn the first phase of the study, we found that New Zealand ECE types as they were in 1993–94 had
different combinations of structural quality features, often combining good quality ones with lesssupportive ones. This may lie behind the lack of difference we have found in relation to ECE type. Usingdata for all the study children, we did find in several phases that children who had attended A’oga Amata
(most of which in our sample were then in their fledgling stage) had lower average scores for somecompetencies, but these associations did not remain when we took into account whether children’sEnglish was their second language and maternal qualification levels.
At age 12, this trend continued. However, the associations with mathematics and the PAT Reading
Comprehension test remained significant after taking into account family income and maternalqualification. Children who had attended A’oga Amata had much lower average scores than others – ofaround 26 percentage points for mathematics and around 18 percentage points for the PAT Reading
Comprehension test. These differences were reduced by 7–9 percentage points and were at the indicativelevel after taking into account the child’s first language at the time they were attending their final ECEcentre.
Children who had attended kindergartens had lower average mathematics scores of around 13 percentage
points than those who had attended playcentre or family day care. Children who had attended playcentreshad higher average scores of 3 percentage points for Logical Problem-Solving than those who hadattended kindergartens, a contrast which became indicative once maternal qualification was taken intoaccount.
Would we find similar trends if a new cohort of children were followed from their final ECE centreattendance in 2004? The greater support for A’oga amata, and their growth over the last decade suggeststhat a new Competent Children study would be unlikely to find the associations we have found in this
study. It is unclear whether we would find the (small) contrast between playcentre and kindergartenagain, since the decade has also seen the introduction of Te Whäriki, the ECE curriculum, and much moreprofessional development.
Early childhood education socio-economic mix
We have consistently found that children whose final ECE centre served mainly middle-class families (assummarised by teachers) had higher average scores for the cognitive competencies. We continued to findthese associations at age 12.
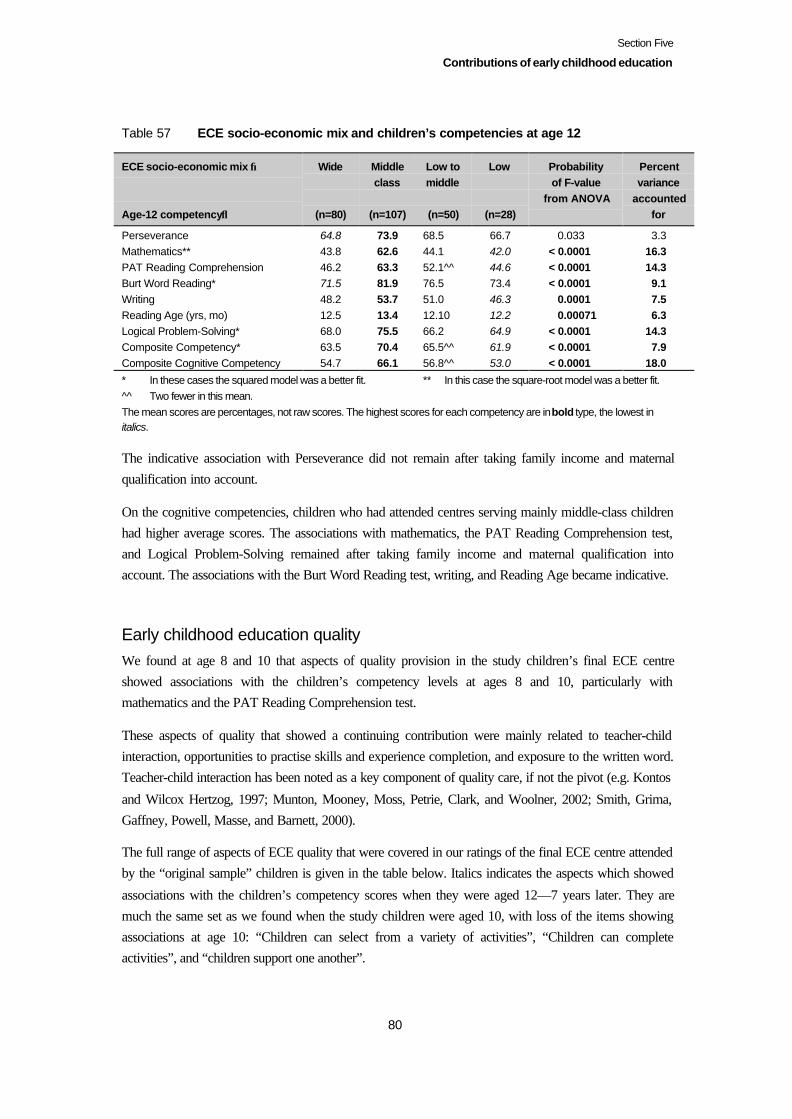
Section Five
Contributions of early childhood education
80
Table 57 ECE socio-economic mix and children’s competencies at age 12
ECE socio-economic mix →
Age-12 competency↓
Wide
(n=80)
Middleclass
(n=107)
Low tomiddle
(n=50)
Low
(n=28)
Probabilityof F-value
from ANOVA
Percentvariance
accountedfor
Perseverance 64.8 73.9 68.5 66.7 0.033 3.3Mathematics** 43.8 62.6 44.1 42.0 < 0.0001 16.3PAT Reading Comprehension 46.2 63.3 52.1^^ 44.6 < 0.0001 14.3Burt Word Reading* 71.5 81.9 76.5 73.4 < 0.0001 9.1Writing 48.2 53.7 51.0 46.3 0.0001 7.5Reading Age (yrs, mo) 12.5 13.4 12.10 12.2 0.00071 6.3Logical Problem-Solving* 68.0 75.5 66.2 64.9 < 0.0001 14.3Composite Competency* 63.5 70.4 65.5^^ 61.9 < 0.0001 7.9Composite Cognitive Competency 54.7 66.1 56.8^^ 53.0 < 0.0001 18.0
* In these cases the squared model was a better fit. ** In this case the square-root model was a better fit.^^ Two fewer in this mean.The mean scores are percentages, not raw scores. The highest scores for each competency are in bold type, the lowest initalics.
The indicative association with Perseverance did not remain after taking family income and maternalqualification into account.
On the cognitive competencies, children who had attended centres serving mainly middle-class childrenhad higher average scores. The associations with mathematics, the PAT Reading Comprehension test,and Logical Problem-Solving remained after taking family income and maternal qualification intoaccount. The associations with the Burt Word Reading test, writing, and Reading Age became indicative.
Early childhood education qualityWe found at age 8 and 10 that aspects of quality provision in the study children’s final ECE centreshowed associations with the children’s competency levels at ages 8 and 10, particularly withmathematics and the PAT Reading Comprehension test.
These aspects of quality that showed a continuing contribution were mainly related to teacher-childinteraction, opportunities to practise skills and experience completion, and exposure to the written word.Teacher-child interaction has been noted as a key component of quality care, if not the pivot (e.g. Kontos
and Wilcox Hertzog, 1997; Munton, Mooney, Moss, Petrie, Clark, and Woolner, 2002; Smith, Grima,Gaffney, Powell, Masse, and Barnett, 2000).
The full range of aspects of ECE quality that were covered in our ratings of the final ECE centre attendedby the “original sample” children is given in the table below. Italics indicates the aspects which showed
associations with the children’s competency scores when they were aged 12—7 years later. They aremuch the same set as we found when the study children were aged 10, with loss of the items showingassociations at age 10: “Children can select from a variety of activities”, “Children can completeactivities”, and “children support one another”.
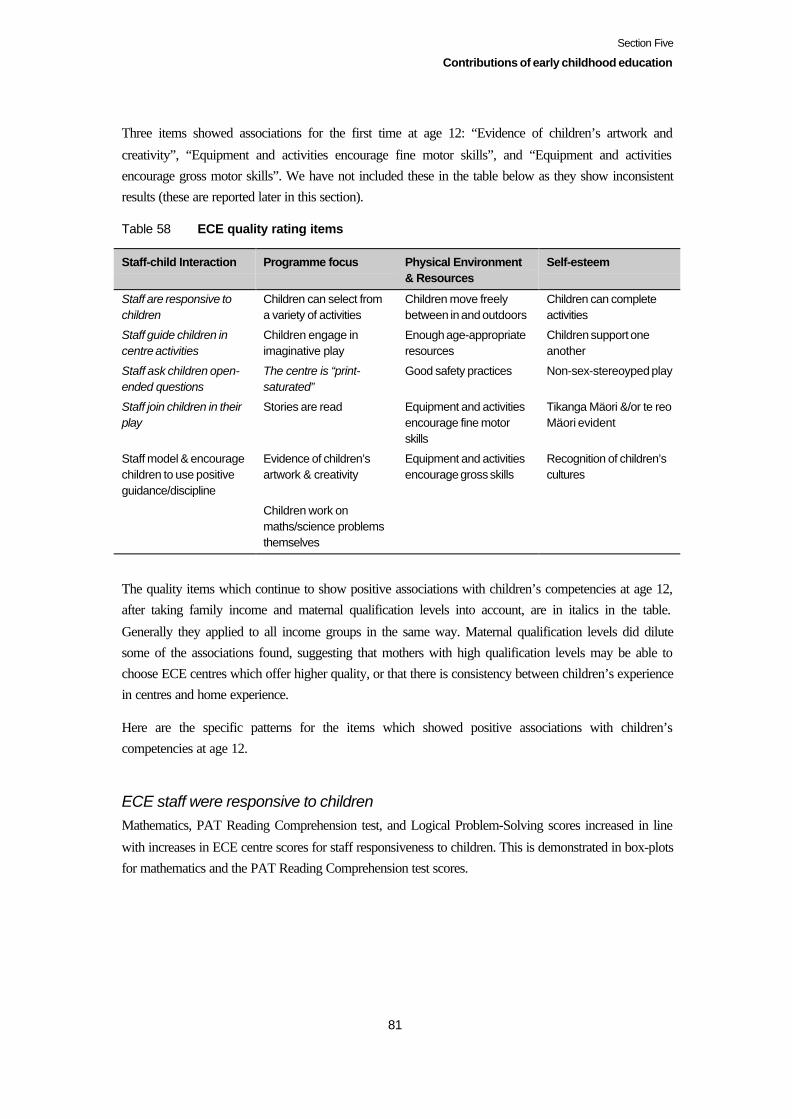
Section Five
Contributions of early childhood education
81
Three items showed associations for the first time at age 12: “Evidence of children’s artwork and
creativity”, “Equipment and activities encourage fine motor skills”, and “Equipment and activitiesencourage gross motor skills”. We have not included these in the table below as they show inconsistentresults (these are reported later in this section).
Table 58 ECE quality rating items
Staff-child Interaction Programme focus Physical Environment& Resources
Self-esteem
Staff are responsive tochildren
Children can select froma variety of activities
Children move freelybetween in and outdoors
Children can completeactivities
Staff guide children incentre activities
Children engage inimaginative play
Enough age-appropriateresources
Children support oneanother
Staff ask children open-ended questions
The centre is “print-saturated”
Good safety practices Non-sex-stereoyped play
Staff join children in theirplay
Stories are read Equipment and activitiesencourage fine motorskills
Tikanga Mäori &/or te reoMäori evident
Staff model & encouragechildren to use positiveguidance/discipline
Evidence of children’sartwork & creativity
Equipment and activitiesencourage gross skills
Recognition of children’scultures
Children work onmaths/science problemsthemselves
The quality items which continue to show positive associations with children’s competencies at age 12,after taking family income and maternal qualification levels into account, are in italics in the table.
Generally they applied to all income groups in the same way. Maternal qualification levels did dilutesome of the associations found, suggesting that mothers with high qualification levels may be able tochoose ECE centres which offer higher quality, or that there is consistency between children’s experiencein centres and home experience.
Here are the specific patterns for the items which showed positive associations with children’scompetencies at age 12.
ECE staff were responsive to childrenMathematics, PAT Reading Comprehension test, and Logical Problem-Solving scores increased in line
with increases in ECE centre scores for staff responsiveness to children. This is demonstrated in box-plotsfor mathematics and the PAT Reading Comprehension test scores.
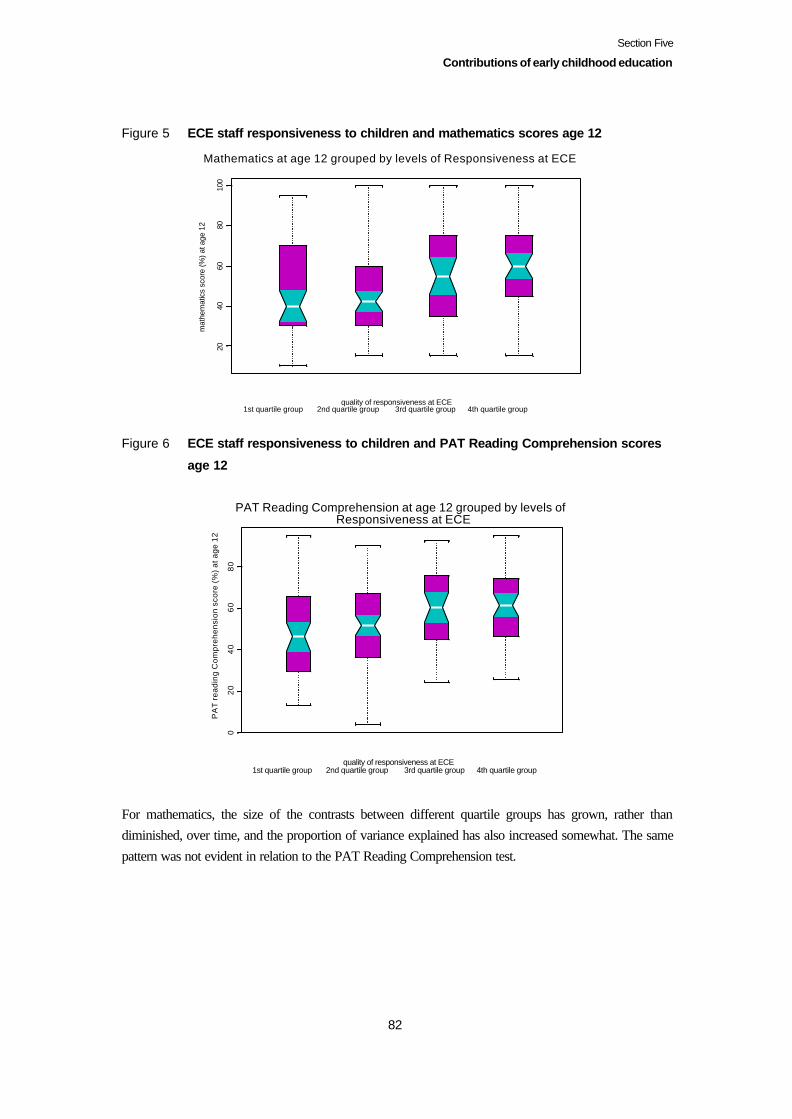
Section Five
Contributions of early childhood education
82
Figure 5 ECE staff responsiveness to children and mathematics scores age 12
2040
6080
100
Mathematics at age 12 grouped by levels of Responsiveness at ECE
quality of responsiveness at ECE 1st quartile group 2nd quartile group 3rd quartile group 4th quartile group
mat
hem
atic
s sc
ore
(%) a
t age
12
Figure 6 ECE staff responsiveness to children and PAT Reading Comprehension scores
age 12
For mathematics, the size of the contrasts between different quartile groups has grown, rather thandiminished, over time, and the proportion of variance explained has also increased somewhat. The samepattern was not evident in relation to the PAT Reading Comprehension test.
02
04
06
08
0
PAT Reading Comprehension at age 12 grouped by levels of Responsiveness at ECE
quality of responsiveness at ECE 1st quartile group 2nd quartile group 3rd quartile group 4th quartile group
PA
T r
eadi
ng C
ompr
ehen
sion
sco
re (
%)
at a
ge 1
2
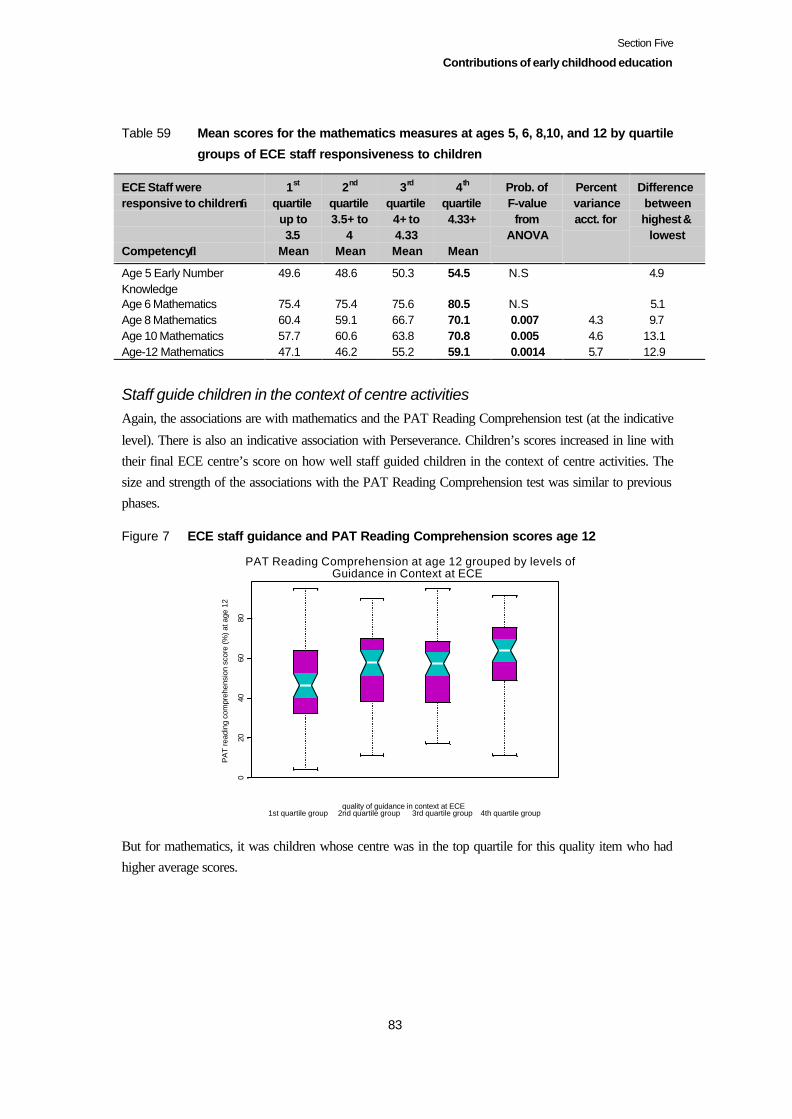
Section Five
Contributions of early childhood education
83
Table 59 Mean scores for the mathematics measures at ages 5, 6, 8,10, and 12 by quartile
groups of ECE staff responsiveness to children
ECE Staff wereresponsive to children→
Competency↓
1st
quartileup to3.5
Mean
2nd
quartile3.5+ to
4Mean
3rd
quartile4+ to4.33Mean
4th
quartile4.33+
Mean
Prob. ofF-value
fromANOVA
Percentvarianceacct. for
Differencebetweenhighest &
lowest
Age 5 Early NumberKnowledge
49.6 48.6 50.3 54.5 N.S 4.9
Age 6 Mathematics 75.4 75.4 75.6 80.5 N.S 5.1Age 8 Mathematics 60.4 59.1 66.7 70.1 0.007 4.3 9.7Age 10 Mathematics 57.7 60.6 63.8 70.8 0.005 4.6 13.1Age-12 Mathematics 47.1 46.2 55.2 59.1 0.0014 5.7 12.9
Staff guide children in the context of centre activitiesAgain, the associations are with mathematics and the PAT Reading Comprehension test (at the indicative
level). There is also an indicative association with Perseverance. Children’s scores increased in line withtheir final ECE centre’s score on how well staff guided children in the context of centre activities. Thesize and strength of the associations with the PAT Reading Comprehension test was similar to previousphases.
Figure 7 ECE staff guidance and PAT Reading Comprehension scores age 12
020
4060
80
PAT Reading Comprehension at age 12 grouped by levels of Guidance in Context at ECE
quality of guidance in context at ECE 1st quartile group 2nd quartile group 3rd quartile group 4th quartile group
PA
T re
adin
g co
mpr
ehen
sion
sco
re (%
) at a
ge 1
2
But for mathematics, it was children whose centre was in the top quartile for this quality item who hadhigher average scores.
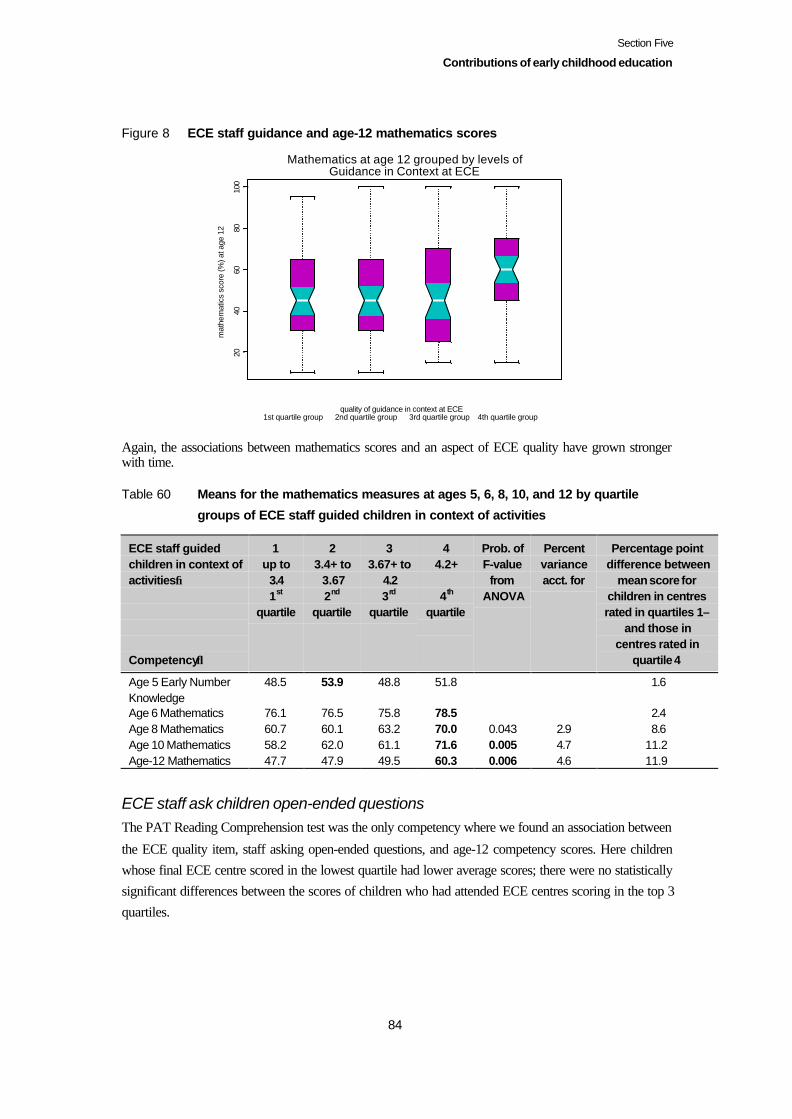
Section Five
Contributions of early childhood education
84
Figure 8 ECE staff guidance and age-12 mathematics scores
2040
6080
100
Mathematics at age 12 grouped by levels of Guidance in Context at ECE
quality of guidance in context at ECE 1st quartile group 2nd quartile group 3rd quartile group 4th quartile group
mat
hem
atic
s sc
ore
(%) a
t age
12
Again, the associations between mathematics scores and an aspect of ECE quality have grown strongerwith time.
Table 60 Means for the mathematics measures at ages 5, 6, 8, 10, and 12 by quartile
groups of ECE staff guided children in context of activities
ECE staff guidedchildren in context ofactivities→
Competency↓
1up to 3.41st
quartile
23.4+ to 3.672nd
quartile
33.67+ to
4.23rd
quartile
44.2+
4th
quartile
Prob. ofF-value
fromANOVA
Percentvarianceacct. for
Percentage pointdifference between
mean score forchildren in centresrated in quartiles 1–
and those incentres rated in
quartile 4
Age 5 Early NumberKnowledge
48.5 53.9 48.8 51.8 1.6
Age 6 Mathematics 76.1 76.5 75.8 78.5 2.4Age 8 Mathematics 60.7 60.1 63.2 70.0 0.043 2.9 8.6Age 10 Mathematics 58.2 62.0 61.1 71.6 0.005 4.7 11.2Age-12 Mathematics 47.7 47.9 49.5 60.3 0.006 4.6 11.9
ECE staff ask children open-ended questionsThe PAT Reading Comprehension test was the only competency where we found an association between
the ECE quality item, staff asking open-ended questions, and age-12 competency scores. Here childrenwhose final ECE centre scored in the lowest quartile had lower average scores; there were no statisticallysignificant differences between the scores of children who had attended ECE centres scoring in the top 3quartiles.

Section Five
Contributions of early childhood education
85
Figure 9 ECE staff open-ended questioning and age-12 PAT Reading Comprehension
scores
020
4060
80
PAT Reading Comprehension at age 12 grouped by levels of Encouragement to think using open-ended Questions at ECE
quality of encouragement through open-ended questions at ECE 1st quartile group 2nd quartile group 3rd quartile group 4th quartile group
PA
T re
adin
g co
mpr
ehen
sion
sco
re (%
) at a
ge 1
2
ECE staff joined children in their playThe significant associations here were with mathematics and Logical Problem-Solving, with an indicativeassociation in relation to Social Skills with Adults. Children whose final ECE centre scored in the topquartile for this aspect of quality had higher average scores than others.
Figure 10 ECE staff joined in children’s play and age-12 mathematics scores
2040
6080
100
Mathematics at age 12 grouped by levels of ECE Staff Join in Children's Play
ECE staff join in children's play 1st quartile group 2nd quartile group 3rd quartile group 4th quartile group
mat
hem
atic
s sc
ore
(%) a
t age
12
Children whose ECE centre had been in the top quartile for the level of staff joining in children’s playhad higher average scores than others. Again, we found that the associations between an aspect of ECEquality and the mathematics measure grew stronger rather than weaker over time.
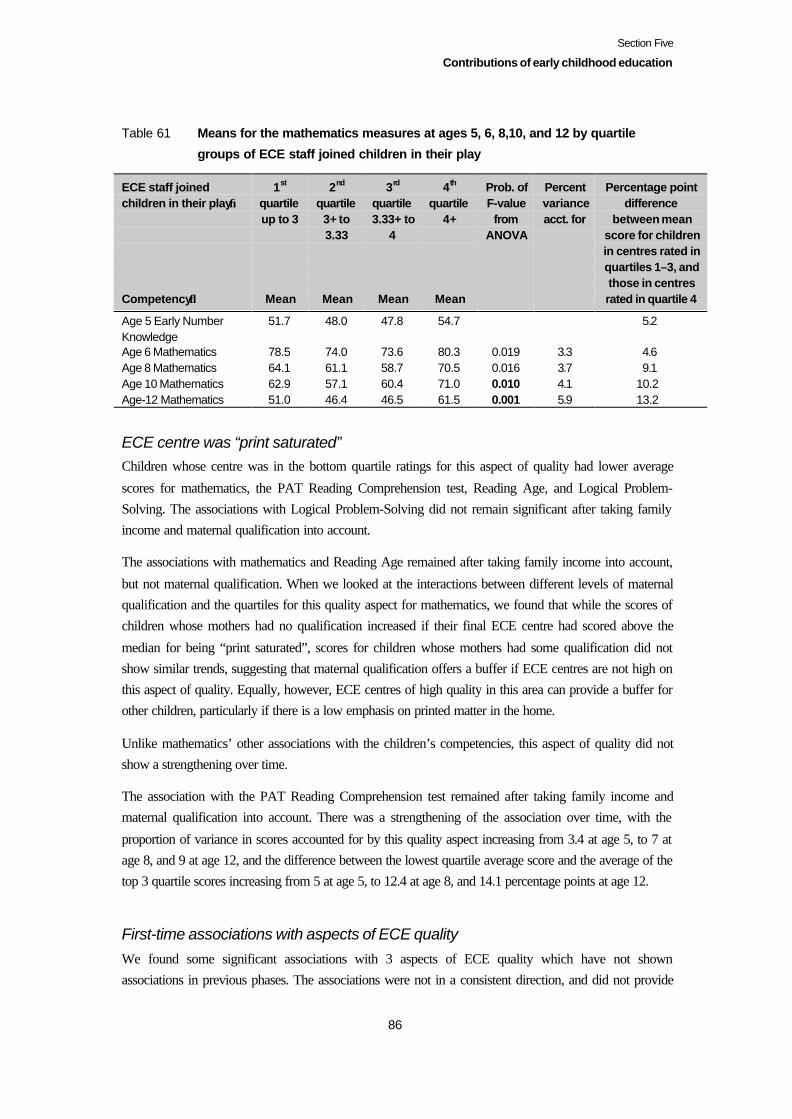
Section Five
Contributions of early childhood education
86
Table 61 Means for the mathematics measures at ages 5, 6, 8,10, and 12 by quartile
groups of ECE staff joined children in their play
ECE staff joinedchildren in their play→
Competency↓
1st
quartileup to 3
Mean
2nd
quartile3+ to3.33
Mean
3rd
quartile3.33+ to
4
Mean
4th
quartile4+
Mean
Prob. ofF-value
fromANOVA
Percentvarianceacct. for
Percentage pointdifference
between meanscore for childrenin centres rated inquartiles 1–3, andthose in centresrated in quartile 4
Age 5 Early NumberKnowledge
51.7 48.0 47.8 54.7 5.2
Age 6 Mathematics 78.5 74.0 73.6 80.3 0.019 3.3 4.6Age 8 Mathematics 64.1 61.1 58.7 70.5 0.016 3.7 9.1Age 10 Mathematics 62.9 57.1 60.4 71.0 0.010 4.1 10.2Age-12 Mathematics 51.0 46.4 46.5 61.5 0.001 5.9 13.2
ECE centre was “print saturated”Children whose centre was in the bottom quartile ratings for this aspect of quality had lower average
scores for mathematics, the PAT Reading Comprehension test, Reading Age, and Logical Problem-Solving. The associations with Logical Problem-Solving did not remain significant after taking familyincome and maternal qualification into account.
The associations with mathematics and Reading Age remained after taking family income into account,
but not maternal qualification. When we looked at the interactions between different levels of maternalqualification and the quartiles for this quality aspect for mathematics, we found that while the scores ofchildren whose mothers had no qualification increased if their final ECE centre had scored above the
median for being “print saturated”, scores for children whose mothers had some qualification did notshow similar trends, suggesting that maternal qualification offers a buffer if ECE centres are not high onthis aspect of quality. Equally, however, ECE centres of high quality in this area can provide a buffer forother children, particularly if there is a low emphasis on printed matter in the home.
Unlike mathematics’ other associations with the children’s competencies, this aspect of quality did notshow a strengthening over time.
The association with the PAT Reading Comprehension test remained after taking family income andmaternal qualification into account. There was a strengthening of the association over time, with the
proportion of variance in scores accounted for by this quality aspect increasing from 3.4 at age 5, to 7 atage 8, and 9 at age 12, and the difference between the lowest quartile average score and the average of thetop 3 quartile scores increasing from 5 at age 5, to 12.4 at age 8, and 14.1 percentage points at age 12.
First-time associations with aspects of ECE qualityWe found some significant associations with 3 aspects of ECE quality which have not shownassociations in previous phases. The associations were not in a consistent direction, and did not provide

Section Five
Contributions of early childhood education
87
clear signals, suggesting that something other than the aspect of quality analysed may have been at workin each case.
Evidence of children’s artwork and creativity
Unlike the other aspects of quality, we found that it was the top quartile which was associated with thelowest average scores for mathematics (43, compared with an average of 54 percentage points for thebottom 3 quartiles).
ECE equipment and activities encourage fine motor skills
Here the association we found was with the Burt Word Reading test, with children in the third quartilehaving the highest average score (a 7 percentage points difference on average).
ECE equipment and activities encourage gross motor skills
We found significant associations with Communication and Reading Age, and indicative associationswith mathematics, the Burt Word Reading test, and writing. Children whose centres were either in the topand bottom quartile groups had the highest average scores.
Do aspects of ECE make separate contributions after age 5?
The second part of our analysis of the role of ECE factors at age 12 focused on whether we could see aseparate contribution to age-12 scores over and above age 5 scores. To do this, we allowed first for theage 5 score in the competency, then fitted family income or maternal qualification separately, and finally
the ECE factor, to see whether the ECE factor added to the proportion of variance accounted for by themodel.
The 2 tables below summarising our findings with regard to mathematics and the PAT ReadingComprehension test scores at age 12 include all the ECE factors which were identified in the first part of
the analysis as having significant associations, or which emerged in this second part of the analysis ashaving some associations with age-12 competency levels, and identify those that continued to showsignificant associations in bold italics, and those showing indicative associations, in italics only.
We found that some ECE factors did make a separately identifiable contribution, over and above the age-
5 scores, to age-12 scores, more so for mathematics than for the PAT Reading Comprehension testscores. This may be because ECE gives children additional opportunities to manipulate objects, workwith puzzles, and try new experiences with adults encouraging them that may be less available to children
in their homes than reading, simply because most parents are more comfortable with reading than withmathematics.
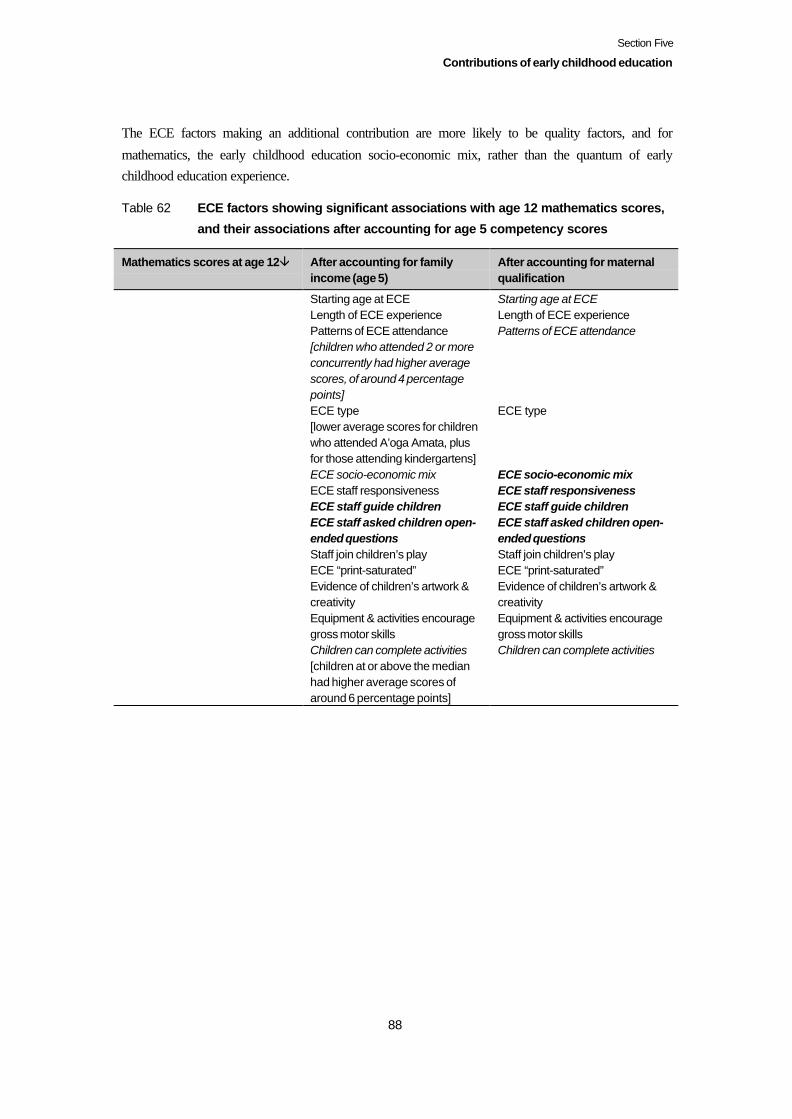
Section Five
Contributions of early childhood education
88
The ECE factors making an additional contribution are more likely to be quality factors, and for
mathematics, the early childhood education socio-economic mix, rather than the quantum of earlychildhood education experience.
Table 62 ECE factors showing significant associations with age 12 mathematics scores,
and their associations after accounting for age 5 competency scores
Mathematics scores at age 12â After accounting for familyincome (age 5)
After accounting for maternalqualification
Starting age at ECELength of ECE experiencePatterns of ECE attendance[children who attended 2 or moreconcurrently had higher averagescores, of around 4 percentagepoints]ECE type[lower average scores for childrenwho attended A’oga Amata, plusfor those attending kindergartens]ECE socio-economic mixECE staff responsivenessECE staff guide childrenECE staff asked children open-ended questionsStaff join children’s playECE “print-saturated”Evidence of children’s artwork &creativityEquipment & activities encouragegross motor skillsChildren can complete activities[children at or above the medianhad higher average scores ofaround 6 percentage points]
Starting age at ECELength of ECE experiencePatterns of ECE attendance
ECE type
ECE socio-economic mixECE staff responsivenessECE staff guide childrenECE staff asked children open-ended questionsStaff join children’s playECE “print-saturated”Evidence of children’s artwork &creativityEquipment & activities encouragegross motor skillsChildren can complete activities
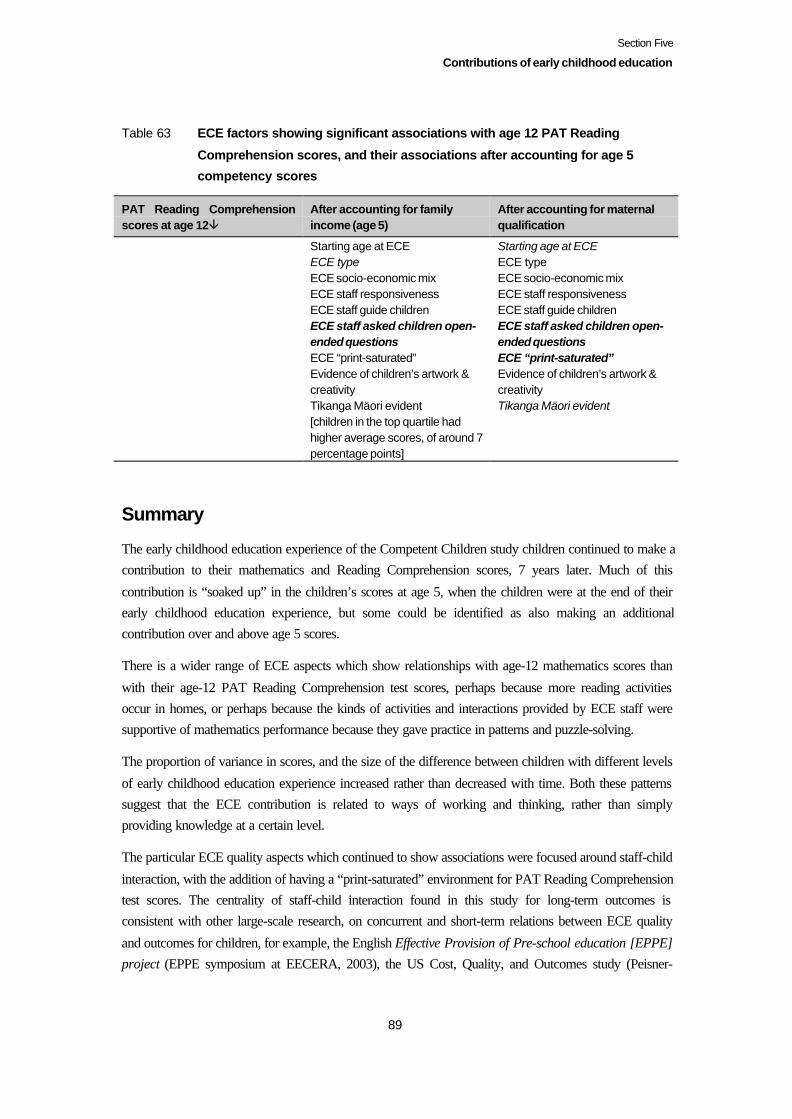
Section Five
Contributions of early childhood education
89
Table 63 ECE factors showing significant associations with age 12 PAT Reading
Comprehension scores, and their associations after accounting for age 5
competency scores
PAT Reading Comprehensionscores at age 12â
After accounting for familyincome (age 5)
After accounting for maternalqualification
Starting age at ECEECE typeECE socio-economic mixECE staff responsivenessECE staff guide childrenECE staff asked children open-ended questionsECE “print-saturated”Evidence of children’s artwork &creativityTikanga Mäori evident[children in the top quartile hadhigher average scores, of around 7percentage points]
Starting age at ECEECE typeECE socio-economic mixECE staff responsivenessECE staff guide childrenECE staff asked children open-ended questionsECE “print-saturated”Evidence of children’s artwork &creativityTikanga Mäori evident
Summary
The early childhood education experience of the Competent Children study children continued to make acontribution to their mathematics and Reading Comprehension scores, 7 years later. Much of this
contribution is “soaked up” in the children’s scores at age 5, when the children were at the end of theirearly childhood education experience, but some could be identified as also making an additionalcontribution over and above age 5 scores.
There is a wider range of ECE aspects which show relationships with age-12 mathematics scores than
with their age-12 PAT Reading Comprehension test scores, perhaps because more reading activitiesoccur in homes, or perhaps because the kinds of activities and interactions provided by ECE staff weresupportive of mathematics performance because they gave practice in patterns and puzzle-solving.
The proportion of variance in scores, and the size of the difference between children with different levels
of early childhood education experience increased rather than decreased with time. Both these patternssuggest that the ECE contribution is related to ways of working and thinking, rather than simplyproviding knowledge at a certain level.
The particular ECE quality aspects which continued to show associations were focused around staff-child
interaction, with the addition of having a “print-saturated” environment for PAT Reading Comprehensiontest scores. The centrality of staff-child interaction found in this study for long-term outcomes isconsistent with other large-scale research, on concurrent and short-term relations between ECE quality
and outcomes for children, for example, the English Effective Provision of Pre-school education [EPPE]project (EPPE symposium at EECERA, 2003), the US Cost, Quality, and Outcomes study (Peisner-

Section Five
Contributions of early childhood education
90
Feinberg, and Burchinal, 1997), and the US NICHD Study of Early Child Care (NICHD Early ChildCare Research Network, 2002).
91
Section Six
Differences in competencies related to genderand family characteristics
In this section, we report the results of our analysis of the relationships between the competencymeasures, and gender, and family characteristics of income, maternal qualification, and ethnicity.
Gender
Summarising all available data from recent NEMP studies, international comparisons, and secondarylevel qualifications, the Ministry of Education (2003, p. 25) notes that “The average performance of boysand girls varied according to the assessment area, with girls generally achieving higher than boys in
reading, arts and languages and boys achieving higher than, or as well as, girls in mathematics andscience.”
In the Competent Children project, we have found no significant differences at age 5, and few at age 6.By age 8, only mathematics and fine motor skills scores did not show some difference related to gender.
This pattern continued at age 10, when boys’ average scores were lower for all the competency measuresother than mathematics, where there was no gender difference, and Curiosity, where boys had higherscores on average.
At age 12, we found no gender differences in Curiosity, mathematics, the Burt Word Reading test, or
Logical Problem-Solving. The size of the differences between girls’ and boys’ performance was small forthe PAT Reading Comprehension test and writing – about 4 percentage points. The size of the differencewas more marked for the social and attitudinal competencies.
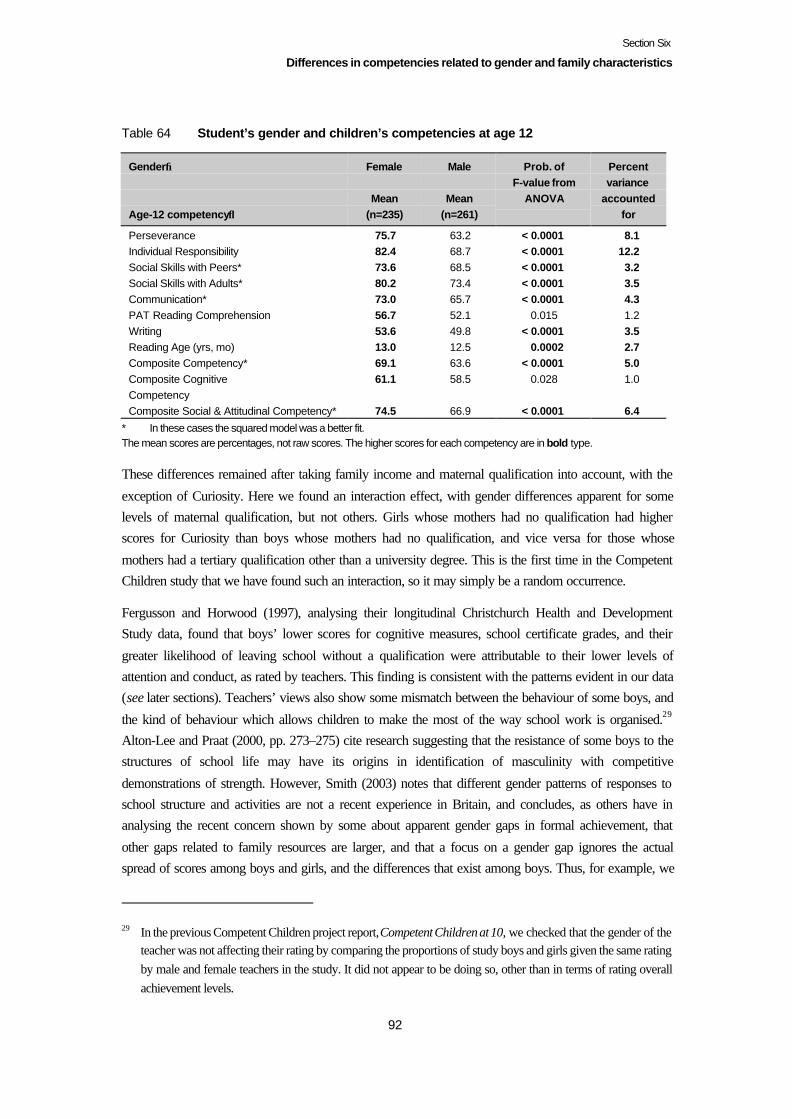
Section Six
Differences in competencies related to gender and family characteristics
92
Table 64 Student’s gender and children’s competencies at age 12
Gender→
Age-12 competency↓
Female
Mean(n=235)
Male
Mean(n=261)
Prob. ofF-value from
ANOVA
Percentvariance
accountedfor
Perseverance 75.7 63.2 < 0.0001 8.1Individual Responsibility 82.4 68.7 < 0.0001 12.2Social Skills with Peers* 73.6 68.5 < 0.0001 3.2Social Skills with Adults* 80.2 73.4 < 0.0001 3.5Communication* 73.0 65.7 < 0.0001 4.3PAT Reading Comprehension 56.7 52.1 0.015 1.2Writing 53.6 49.8 < 0.0001 3.5Reading Age (yrs, mo) 13.0 12.5 0.0002 2.7Composite Competency* 69.1 63.6 < 0.0001 5.0Composite CognitiveCompetency
61.1 58.5 0.028 1.0
Composite Social & Attitudinal Competency* 74.5 66.9 < 0.0001 6.4
* In these cases the squared model was a better fit.The mean scores are percentages, not raw scores. The higher scores for each competency are in bold type.
These differences remained after taking family income and maternal qualification into account, with the
exception of Curiosity. Here we found an interaction effect, with gender differences apparent for somelevels of maternal qualification, but not others. Girls whose mothers had no qualification had higherscores for Curiosity than boys whose mothers had no qualification, and vice versa for those whose
mothers had a tertiary qualification other than a university degree. This is the first time in the CompetentChildren study that we have found such an interaction, so it may simply be a random occurrence.
Fergusson and Horwood (1997), analysing their longitudinal Christchurch Health and DevelopmentStudy data, found that boys’ lower scores for cognitive measures, school certificate grades, and their
greater likelihood of leaving school without a qualification were attributable to their lower levels ofattention and conduct, as rated by teachers. This finding is consistent with the patterns evident in our data(see later sections). Teachers’ views also show some mismatch between the behaviour of some boys, and
the kind of behaviour which allows children to make the most of the way school work is organised.29
Alton-Lee and Praat (2000, pp. 273–275) cite research suggesting that the resistance of some boys to thestructures of school life may have its origins in identification of masculinity with competitive
demonstrations of strength. However, Smith (2003) notes that different gender patterns of responses toschool structure and activities are not a recent experience in Britain, and concludes, as others have inanalysing the recent concern shown by some about apparent gender gaps in formal achievement, that
other gaps related to family resources are larger, and that a focus on a gender gap ignores the actualspread of scores among boys and girls, and the differences that exist among boys. Thus, for example, we
29 In the previous Competent Children project report, Competent Children at 10, we checked that the gender of theteacher was not affecting their rating by comparing the proportions of study boys and girls given the same ratingby male and female teachers in the study. It did not appear to be doing so, other than in terms of rating overallachievement levels.
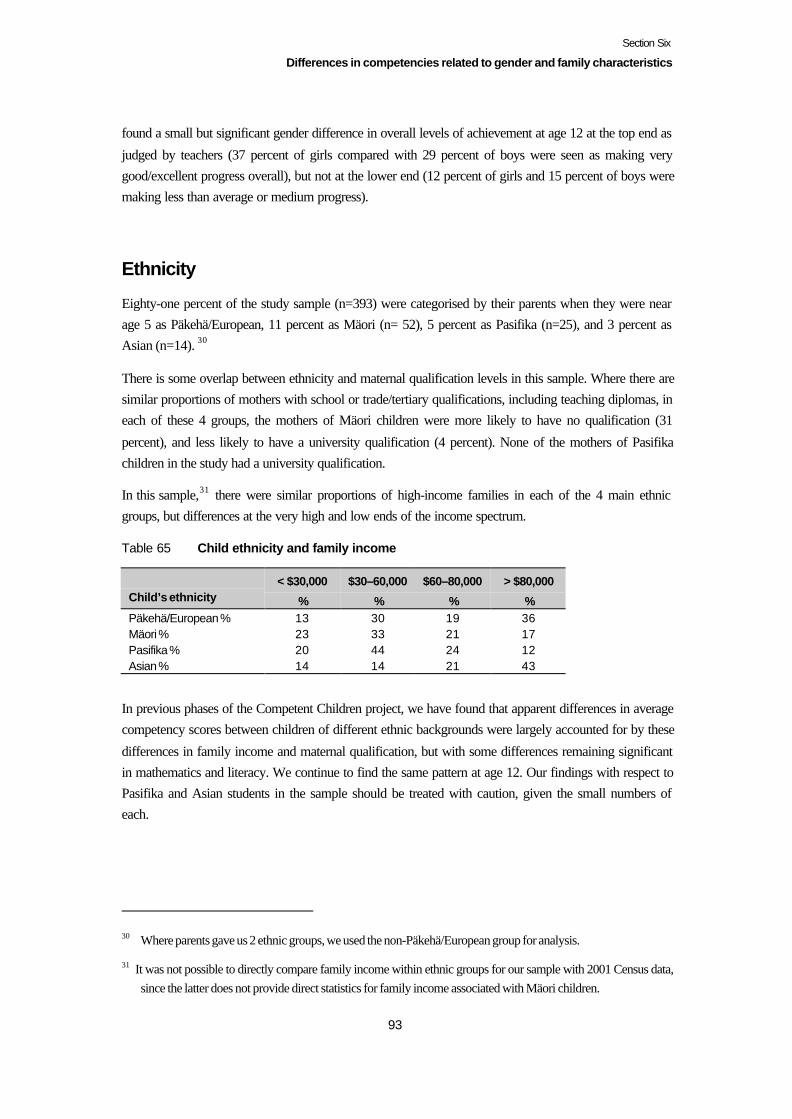
Section Six
Differences in competencies related to gender and family characteristics
93
found a small but significant gender difference in overall levels of achievement at age 12 at the top end as
judged by teachers (37 percent of girls compared with 29 percent of boys were seen as making verygood/excellent progress overall), but not at the lower end (12 percent of girls and 15 percent of boys weremaking less than average or medium progress).
Ethnicity
Eighty-one percent of the study sample (n=393) were categorised by their parents when they were nearage 5 as Päkehä/European, 11 percent as Mäori (n= 52), 5 percent as Pasifika (n=25), and 3 percent asAsian (n=14). 30
There is some overlap between ethnicity and maternal qualification levels in this sample. Where there aresimilar proportions of mothers with school or trade/tertiary qualifications, including teaching diplomas, ineach of these 4 groups, the mothers of Mäori children were more likely to have no qualification (31
percent), and less likely to have a university qualification (4 percent). None of the mothers of Pasifikachildren in the study had a university qualification.
In this sample,31 there were similar proportions of high-income families in each of the 4 main ethnicgroups, but differences at the very high and low ends of the income spectrum.
Table 65 Child ethnicity and family income
Child’s ethnicity< $30,000
%
$30–60,000
%
$60–80,000
%
> $80,000
%Päkehä/European % 13 30 19 36Mäori % 23 33 21 17Pasifika % 20 44 24 12Asian % 14 14 21 43
In previous phases of the Competent Children project, we have found that apparent differences in averagecompetency scores between children of different ethnic backgrounds were largely accounted for by these
differences in family income and maternal qualification, but with some differences remaining significantin mathematics and literacy. We continue to find the same pattern at age 12. Our findings with respect toPasifika and Asian students in the sample should be treated with caution, given the small numbers ofeach.
30 Where parents gave us 2 ethnic groups, we used the non-Päkehä/European group for analysis.
31 It was not possible to directly compare family income within ethnic groups for our sample with 2001 Census data,since the latter does not provide direct statistics for family income associated with Mäori children.
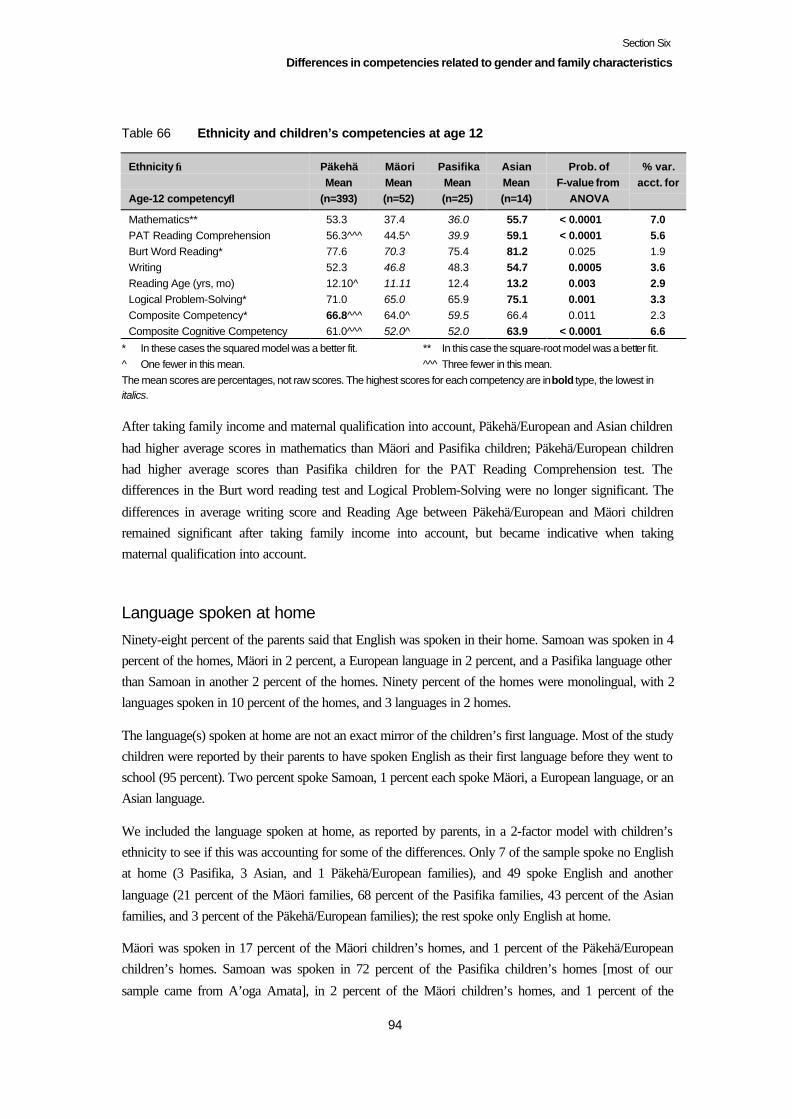
Section Six
Differences in competencies related to gender and family characteristics
94
Table 66 Ethnicity and children’s competencies at age 12
Ethnicity →
Age-12 competency↓
PäkehäMean
(n=393)
MäoriMean(n=52)
PasifikaMean(n=25)
AsianMean(n=14)
Prob. ofF-value from
ANOVA
% var.acct. for
Mathematics** 53.3 37.4 36.0 55.7 < 0.0001 7.0PAT Reading Comprehension 56.3^^^ 44.5^ 39.9 59.1 < 0.0001 5.6Burt Word Reading* 77.6 70.3 75.4 81.2 0.025 1.9Writing 52.3 46.8 48.3 54.7 0.0005 3.6Reading Age (yrs, mo) 12.10^ 11.11 12.4 13.2 0.003 2.9Logical Problem-Solving* 71.0 65.0 65.9 75.1 0.001 3.3Composite Competency* 66.8^^^ 64.0^ 59.5 66.4 0.011 2.3Composite Cognitive Competency 61.0^^^ 52.0^ 52.0 63.9 < 0.0001 6.6
* In these cases the squared model was a better fit. ** In this case the square-root model was a better fit.^ One fewer in this mean. ^^ ̂ Three fewer in this mean.The mean scores are percentages, not raw scores. The highest scores for each competency are in bold type, the lowest initalics.
After taking family income and maternal qualification into account, Päkehä/European and Asian children
had higher average scores in mathematics than Mäori and Pasifika children; Päkehä/European childrenhad higher average scores than Pasifika children for the PAT Reading Comprehension test. Thedifferences in the Burt word reading test and Logical Problem-Solving were no longer significant. The
differences in average writing score and Reading Age between Päkehä/European and Mäori childrenremained significant after taking family income into account, but became indicative when takingmaternal qualification into account.
Language spoken at home
Ninety-eight percent of the parents said that English was spoken in their home. Samoan was spoken in 4percent of the homes, Mäori in 2 percent, a European language in 2 percent, and a Pasifika language otherthan Samoan in another 2 percent of the homes. Ninety percent of the homes were monolingual, with 2languages spoken in 10 percent of the homes, and 3 languages in 2 homes.
The language(s) spoken at home are not an exact mirror of the children’s first language. Most of the studychildren were reported by their parents to have spoken English as their first language before they went toschool (95 percent). Two percent spoke Samoan, 1 percent each spoke Mäori, a European language, or anAsian language.
We included the language spoken at home, as reported by parents, in a 2-factor model with children’sethnicity to see if this was accounting for some of the differences. Only 7 of the sample spoke no Englishat home (3 Pasifika, 3 Asian, and 1 Päkehä/European families), and 49 spoke English and another
language (21 percent of the Mäori families, 68 percent of the Pasifika families, 43 percent of the Asianfamilies, and 3 percent of the Päkehä/European families); the rest spoke only English at home.
Mäori was spoken in 17 percent of the Mäori children’s homes, and 1 percent of the Päkehä/Europeanchildren’s homes. Samoan was spoken in 72 percent of the Pasifika children’s homes [most of our
sample came from A’oga Amata], in 2 percent of the Mäori children’s homes, and 1 percent of the
Section Six
Differences in competencies related to gender and family characteristics
95
Päkehä/European children’s homes. Other Pasifika languages were spoken in 4 homes: 2 in the homes of
Päkehä/European children, and one each in Mäori and Pasifika children’s homes. Fifty-seven percent ofthe Asian children heard an Asian language in their home.
The language spoken at home made no difference to the ethnic-related differences reported here, for thissample. When we analysed the language spoken at home on its own, we found only a few indicative
associations once we took family income and maternal qualification into account. Children whosefamilies spoke only English had higher average scores for mathematics than those who spoke Englishand another language at home, and for the PAT Reading Comprehension test (around 7 percentage points
on each). Children whose families spoke only English had a higher average Reading Age than thosewhose families spoke only another language at home.
Maternal qualification
Maternal qualification is the family characteristic that we have found in the Competent Children study tohave the strongest associations with children’s cognitive competency levels. Below are the associationsfound at age 12. They remain significant after including family income at age 5 in the model. The scores
for the cognitive competencies generally follow a consistent path: lowest for those whose mother has noqualification, and highest for those whose mother has a university qualification. The shaded areas indicatethe groups with which significant contrasts exist. Within the social and attitudinal competencies, they
tend to be either differences in average scores between those whose mothers have no qualification andothers, or between those whose mother had a university qualification and others (though not all others forevery competency). Within the cognitive competencies, we see differentiation at both ends of thematernal qualification spectrum.
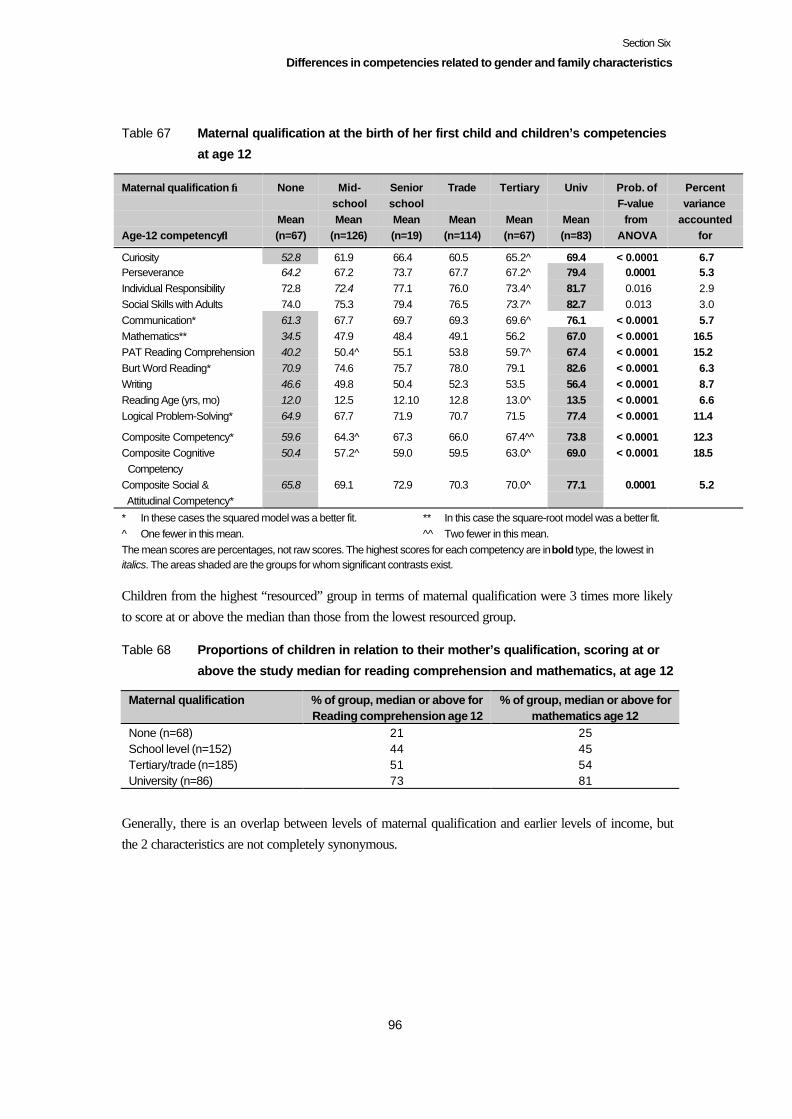
Section Six
Differences in competencies related to gender and family characteristics
96
Table 67 Maternal qualification at the birth of her first child and children’s competencies
at age 12
Maternal qualification →
Age-12 competency↓
None
Mean(n=67)
Mid-schoolMean
(n=126)
SeniorschoolMean(n=19)
Trade
Mean(n=114)
Tertiary
Mean(n=67)
Univ
Mean(n=83)
Prob. ofF-value
fromANOVA
Percentvariance
accountedfor
Curiosity 52.8 61.9 66.4 60.5 65.2^ 69.4 < 0.0001 6.7Perseverance 64.2 67.2 73.7 67.7 67.2^ 79.4 0.0001 5.3Individual Responsibility 72.8 72.4 77.1 76.0 73.4^ 81.7 0.016 2.9Social Skills with Adults 74.0 75.3 79.4 76.5 73.7^ 82.7 0.013 3.0Communication* 61.3 67.7 69.7 69.3 69.6^ 76.1 < 0.0001 5.7Mathematics** 34.5 47.9 48.4 49.1 56.2 67.0 < 0.0001 16.5PAT Reading Comprehension 40.2 50.4^ 55.1 53.8 59.7^ 67.4 < 0.0001 15.2Burt Word Reading* 70.9 74.6 75.7 78.0 79.1 82.6 < 0.0001 6.3Writing 46.6 49.8 50.4 52.3 53.5 56.4 < 0.0001 8.7Reading Age (yrs, mo) 12.0 12.5 12.10 12.8 13.0^ 13.5 < 0.0001 6.6Logical Problem-Solving* 64.9 67.7 71.9 70.7 71.5 77.4 < 0.0001 11.4
Composite Competency* 59.6 64.3^ 67.3 66.0 67.4^^ 73.8 < 0.0001 12.3Composite Cognitive Competency
50.4 57.2^ 59.0 59.5 63.0^ 69.0 < 0.0001 18.5
Composite Social & Attitudinal Competency*
65.8 69.1 72.9 70.3 70.0^ 77.1 0.0001 5.2
* In these cases the squared model was a better fit. ** In this case the square-root model was a better fit.^ One fewer in this mean. ^^ Two fewer in this mean.The mean scores are percentages, not raw scores. The highest scores for each competency are in bold type, the lowest initalics. The areas shaded are the groups for whom significant contrasts exist.
Children from the highest “resourced” group in terms of maternal qualification were 3 times more likelyto score at or above the median than those from the lowest resourced group.
Table 68 Proportions of children in relation to their mother’s qualification, scoring at or
above the study median for reading comprehension and mathematics, at age 12
Maternal qualification % of group, median or above forReading comprehension age 12
% of group, median or above formathematics age 12
None (n=68) 21 25School level (n=152) 44 45Tertiary/trade (n=185) 51 54University (n=86) 73 81
Generally, there is an overlap between levels of maternal qualification and earlier levels of income, butthe 2 characteristics are not completely synonymous.
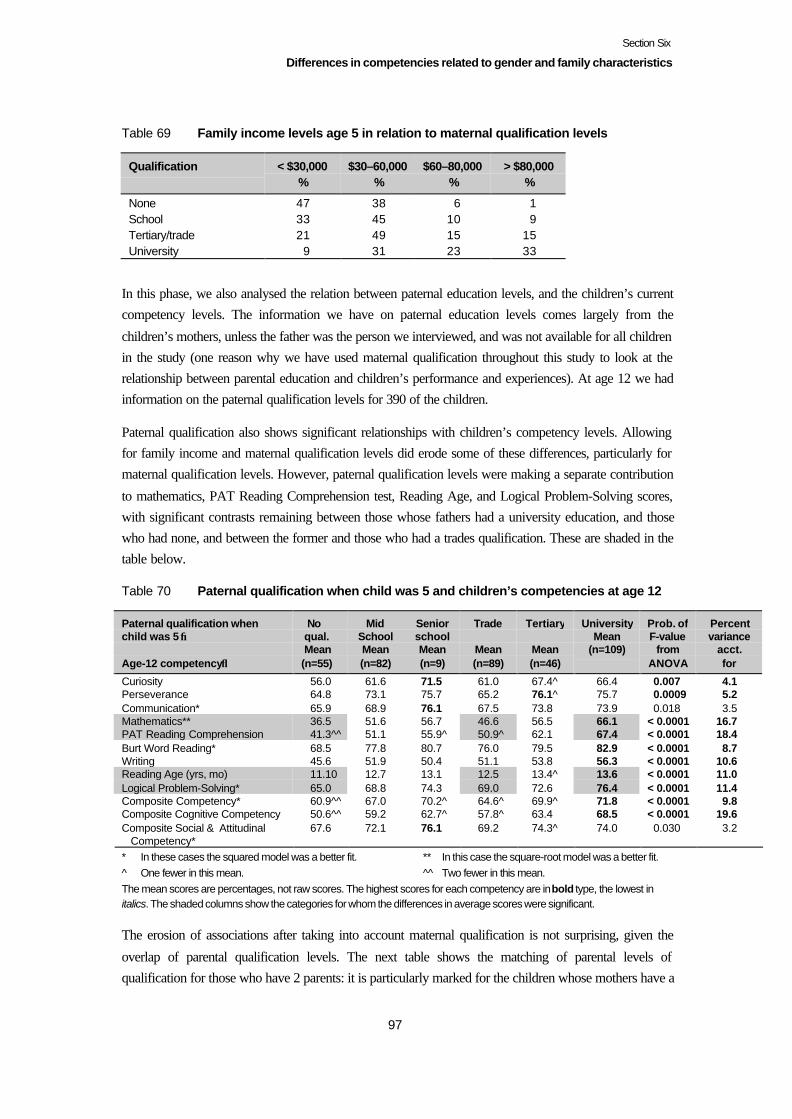
Section Six
Differences in competencies related to gender and family characteristics
97
Table 69 Family income levels age 5 in relation to maternal qualification levels
Qualification < $30,000%
$30–60,000%
$60–80,000%
> $80,000%
None 47 38 6 1School 33 45 10 9Tertiary/trade 21 49 15 15University 9 31 23 33
In this phase, we also analysed the relation between paternal education levels, and the children’s currentcompetency levels. The information we have on paternal education levels comes largely from the
children’s mothers, unless the father was the person we interviewed, and was not available for all childrenin the study (one reason why we have used maternal qualification throughout this study to look at therelationship between parental education and children’s performance and experiences). At age 12 we hadinformation on the paternal qualification levels for 390 of the children.
Paternal qualification also shows significant relationships with children’s competency levels. Allowingfor family income and maternal qualification levels did erode some of these differences, particularly formaternal qualification levels. However, paternal qualification levels were making a separate contribution
to mathematics, PAT Reading Comprehension test, Reading Age, and Logical Problem-Solving scores,with significant contrasts remaining between those whose fathers had a university education, and thosewho had none, and between the former and those who had a trades qualification. These are shaded in thetable below.
Table 70 Paternal qualification when child was 5 and children’s competencies at age 12
Paternal qualification whenchild was 5 →
Age-12 competency↓
No qual. Mean(n=55)
MidSchoolMean(n=82)
SeniorschoolMean(n=9)
Trade
Mean(n=89)
Tertiary
Mean(n=46)
UniversityMean
(n=109)
Prob. ofF-value
fromANOVA
Percentvariance
acct.for
Curiosity 56.0 61.6 71.5 61.0 67.4^ 66.4 0.007 4.1Perseverance 64.8 73.1 75.7 65.2 76.1^ 75.7 0.0009 5.2Communication* 65.9 68.9 76.1 67.5 73.8 73.9 0.018 3.5Mathematics** 36.5 51.6 56.7 46.6 56.5 66.1 < 0.0001 16.7PAT Reading Comprehension 41.3^^ 51.1 55.9^ 50.9^ 62.1 67.4 < 0.0001 18.4Burt Word Reading* 68.5 77.8 80.7 76.0 79.5 82.9 < 0.0001 8.7Writing 45.6 51.9 50.4 51.1 53.8 56.3 < 0.0001 10.6Reading Age (yrs, mo) 11.10 12.7 13.1 12.5 13.4^ 13.6 < 0.0001 11.0Logical Problem-Solving* 65.0 68.8 74.3 69.0 72.6 76.4 < 0.0001 11.4Composite Competency* 60.9^^ 67.0 70.2^ 64.6^ 69.9^ 71.8 < 0.0001 9.8Composite Cognitive Competency 50.6^^ 59.2 62.7^ 57.8^ 63.4 68.5 < 0.0001 19.6Composite Social & Attitudinal Competency*
67.6 72.1 76.1 69.2 74.3^ 74.0 0.030 3.2
* In these cases the squared model was a better fit. ** In this case the square-root model was a better fit.^ One fewer in this mean. ^^ Two fewer in this mean.The mean scores are percentages, not raw scores. The highest scores for each competency are in bold type, the lowest initalics. The shaded columns show the categories for whom the differences in average scores were significant.
The erosion of associations after taking into account maternal qualification is not surprising, given the
overlap of parental qualification levels. The next table shows the matching of parental levels ofqualification for those who have 2 parents: it is particularly marked for the children whose mothers have a
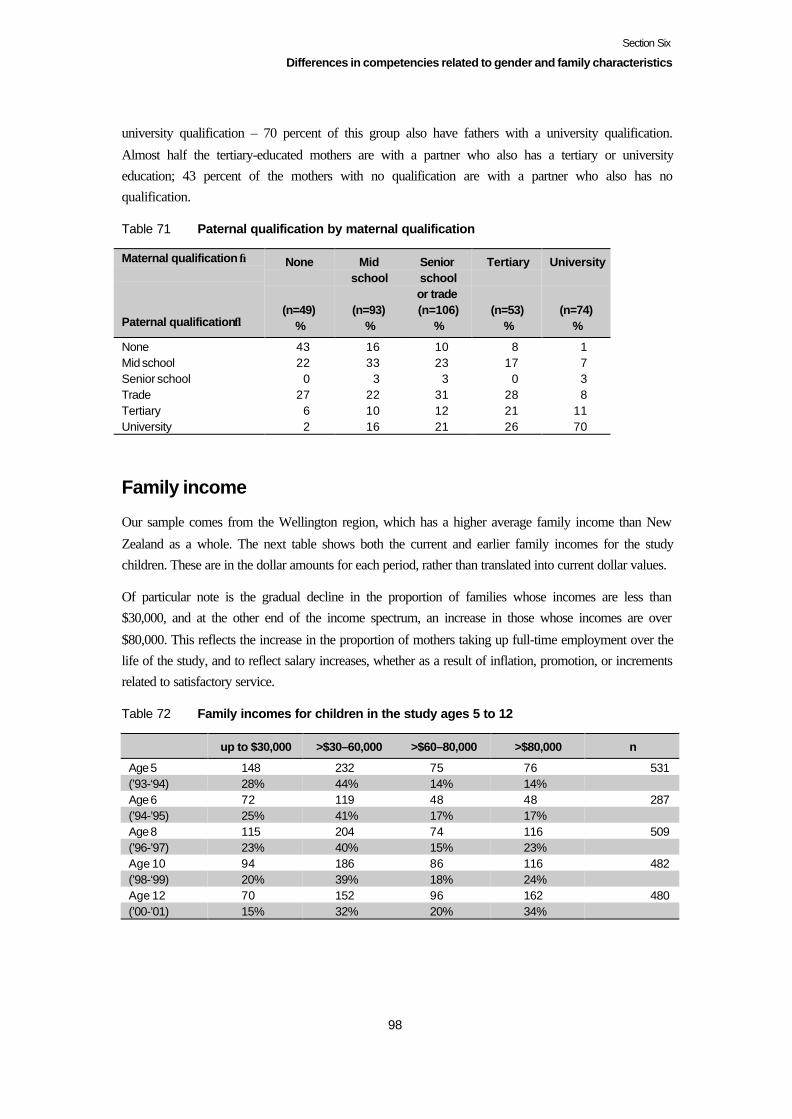
Section Six
Differences in competencies related to gender and family characteristics
98
university qualification – 70 percent of this group also have fathers with a university qualification.
Almost half the tertiary-educated mothers are with a partner who also has a tertiary or universityeducation; 43 percent of the mothers with no qualification are with a partner who also has noqualification.
Table 71 Paternal qualification by maternal qualification
Maternal qualification →
Paternal qualification↓
None
(n=49)%
Midschool
(n=93)%
Seniorschoolor trade(n=106)
%
Tertiary
(n=53)%
University
(n=74)%
None 43 16 10 8 1Mid school 22 33 23 17 7Senior school 0 3 3 0 3Trade 27 22 31 28 8Tertiary 6 10 12 21 11University 2 16 21 26 70
Family income
Our sample comes from the Wellington region, which has a higher average family income than New
Zealand as a whole. The next table shows both the current and earlier family incomes for the studychildren. These are in the dollar amounts for each period, rather than translated into current dollar values.
Of particular note is the gradual decline in the proportion of families whose incomes are less than$30,000, and at the other end of the income spectrum, an increase in those whose incomes are over
$80,000. This reflects the increase in the proportion of mothers taking up full-time employment over thelife of the study, and to reflect salary increases, whether as a result of inflation, promotion, or incrementsrelated to satisfactory service.
Table 72 Family incomes for children in the study ages 5 to 12
up to $30,000 >$30–60,000 >$60–80,000 >$80,000 n
Age 5 148 232 75 76 531(’93-‘94) 28% 44% 14% 14%Age 6 72 119 48 48 287(’94-’95) 25% 41% 17% 17%Age 8 115 204 74 116 509(’96-’97) 23% 40% 15% 23%Age 10 94 186 86 116 482(’98-‘99) 20% 39% 18% 24%Age 12 70 152 96 162 480(’00-’01) 15% 32% 20% 34%
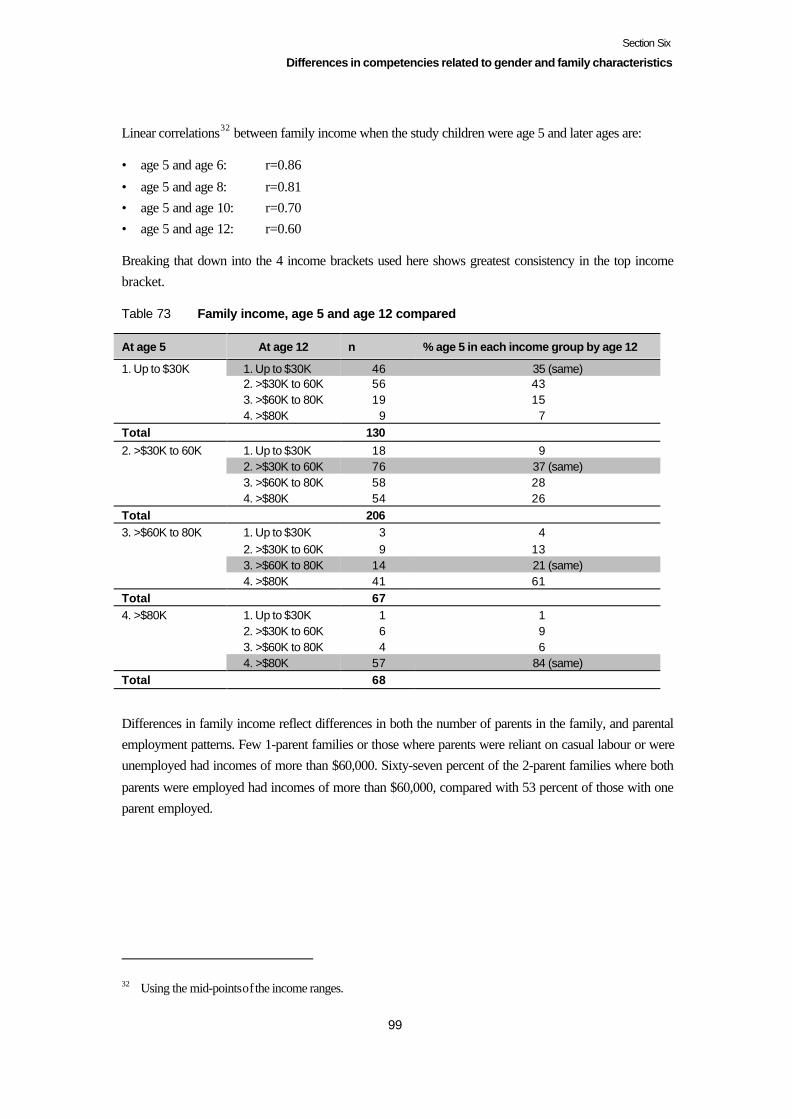
Section Six
Differences in competencies related to gender and family characteristics
99
Linear correlations32 between family income when the study children were age 5 and later ages are:
• age 5 and age 6: r=0.86
• age 5 and age 8: r=0.81• age 5 and age 10: r=0.70• age 5 and age 12: r=0.60
Breaking that down into the 4 income brackets used here shows greatest consistency in the top incomebracket.
Table 73 Family income, age 5 and age 12 compared
At age 5 At age 12 n % age 5 in each income group by age 12
1. Up to $30K 1. Up to $30K 46 35 (same)2. >$30K to 60K 56 433. >$60K to 80K 19 154. >$80K 9 7
Total 1302. >$30K to 60K 1. Up to $30K 18 9
2. >$30K to 60K 76 37 (same)3. >$60K to 80K 58 284. >$80K 54 26
Total 2063. >$60K to 80K 1. Up to $30K 3 4
2. >$30K to 60K 9 133. >$60K to 80K 14 21 (same)4. >$80K 41 61
Total 674. >$80K 1. Up to $30K 1 1
2. >$30K to 60K 6 93. >$60K to 80K 4 64. >$80K 57 84 (same)
Total 68
Differences in family income reflect differences in both the number of parents in the family, and parentalemployment patterns. Few 1-parent families or those where parents were reliant on casual labour or wereunemployed had incomes of more than $60,000. Sixty-seven percent of the 2-parent families where both
parents were employed had incomes of more than $60,000, compared with 53 percent of those with oneparent employed.
32 Using the mid-points of the income ranges.
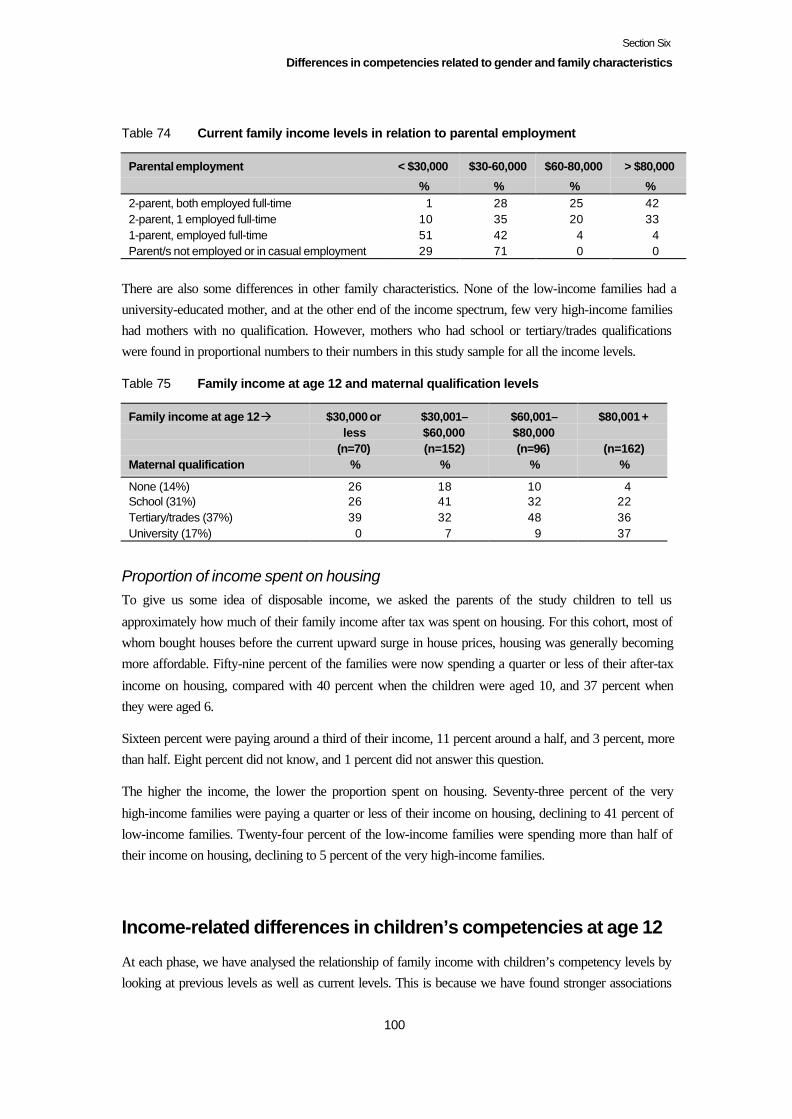
Section Six
Differences in competencies related to gender and family characteristics
100
Table 74 Current family income levels in relation to parental employment
Parental employment < $30,000
%
$30-60,000
%
$60-80,000
%
> $80,000
%2-parent, both employed full-time 1 28 25 422-parent, 1 employed full-time 10 35 20 331-parent, employed full-time 51 42 4 4Parent/s not employed or in casual employment 29 71 0 0
There are also some differences in other family characteristics. None of the low-income families had auniversity-educated mother, and at the other end of the income spectrum, few very high-income familieshad mothers with no qualification. However, mothers who had school or tertiary/trades qualificationswere found in proportional numbers to their numbers in this study sample for all the income levels.
Table 75 Family income at age 12 and maternal qualification levels
Family income at age 12 à
Maternal qualification
$30,000 orless
(n=70)%
$30,001–$60,000(n=152)
%
$60,001–$80,000(n=96)
%
$80,001 +
(n=162)%
None (14%) 26 18 10 4School (31%) 26 41 32 22Tertiary/trades (37%) 39 32 48 36University (17%) 0 7 9 37
Proportion of income spent on housingTo give us some idea of disposable income, we asked the parents of the study children to tell us
approximately how much of their family income after tax was spent on housing. For this cohort, most ofwhom bought houses before the current upward surge in house prices, housing was generally becomingmore affordable. Fifty-nine percent of the families were now spending a quarter or less of their after-tax
income on housing, compared with 40 percent when the children were aged 10, and 37 percent whenthey were aged 6.
Sixteen percent were paying around a third of their income, 11 percent around a half, and 3 percent, morethan half. Eight percent did not know, and 1 percent did not answer this question.
The higher the income, the lower the proportion spent on housing. Seventy-three percent of the very
high-income families were paying a quarter or less of their income on housing, declining to 41 percent oflow-income families. Twenty-four percent of the low-income families were spending more than half oftheir income on housing, declining to 5 percent of the very high-income families.
Income-related differences in children’s competencies at age 12
At each phase, we have analysed the relationship of family income with children’s competency levels bylooking at previous levels as well as current levels. This is because we have found stronger associations
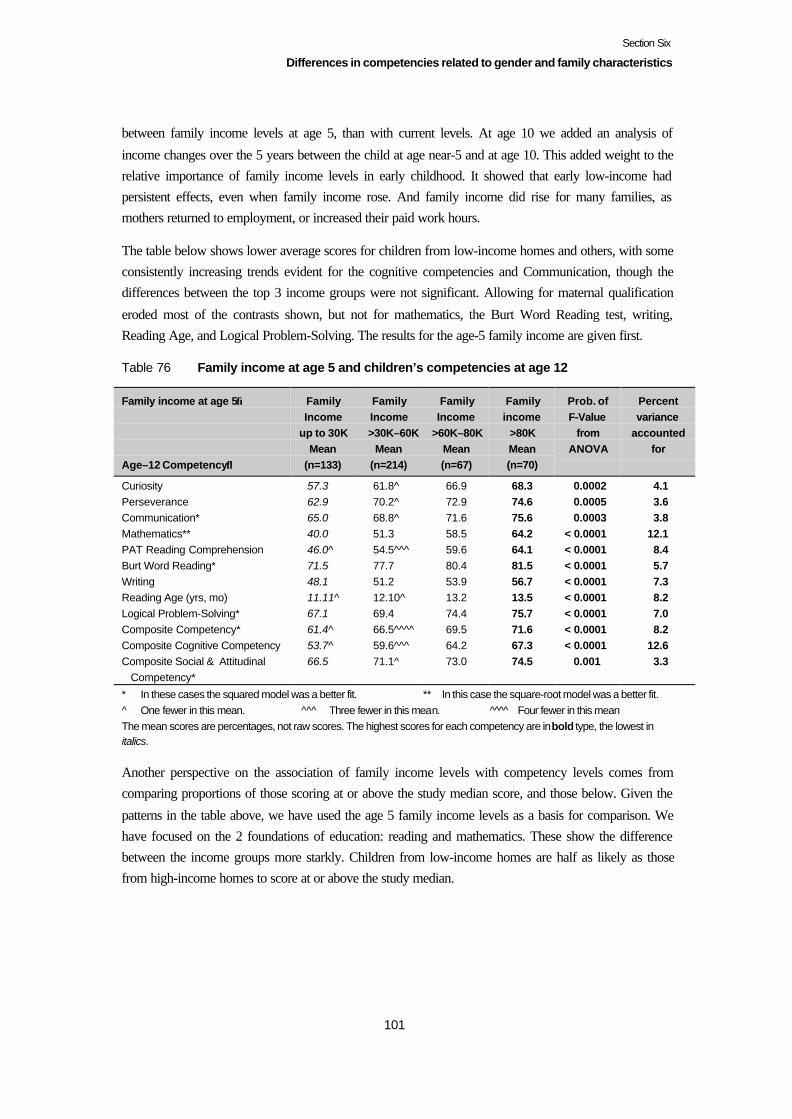
Section Six
Differences in competencies related to gender and family characteristics
101
between family income levels at age 5, than with current levels. At age 10 we added an analysis of
income changes over the 5 years between the child at age near-5 and at age 10. This added weight to therelative importance of family income levels in early childhood. It showed that early low-income hadpersistent effects, even when family income rose. And family income did rise for many families, asmothers returned to employment, or increased their paid work hours.
The table below shows lower average scores for children from low-income homes and others, with someconsistently increasing trends evident for the cognitive competencies and Communication, though thedifferences between the top 3 income groups were not significant. Allowing for maternal qualification
eroded most of the contrasts shown, but not for mathematics, the Burt Word Reading test, writing,Reading Age, and Logical Problem-Solving. The results for the age-5 family income are given first.
Table 76 Family income at age 5 and children’s competencies at age 12
Family income at age 5→
Age–12 Competency↓
FamilyIncome
up to 30KMean
(n=133)
FamilyIncome>30K–60K
Mean(n=214)
FamilyIncome
>60K–80KMean(n=67)
Familyincome
>80KMean(n=70)
Prob. ofF-Value
fromANOVA
Percentvariance
accountedfor
Curiosity 57.3 61.8^ 66.9 68.3 0.0002 4.1Perseverance 62.9 70.2^ 72.9 74.6 0.0005 3.6Communication* 65.0 68.8^ 71.6 75.6 0.0003 3.8Mathematics** 40.0 51.3 58.5 64.2 < 0.0001 12.1PAT Reading Comprehension 46.0^ 54.5^^^ 59.6 64.1 < 0.0001 8.4Burt Word Reading* 71.5 77.7 80.4 81.5 < 0.0001 5.7Writing 48.1 51.2 53.9 56.7 < 0.0001 7.3Reading Age (yrs, mo) 11.11^ 12.10^ 13.2 13.5 < 0.0001 8.2Logical Problem-Solving* 67.1 69.4 74.4 75.7 < 0.0001 7.0Composite Competency* 61.4^ 66.5^^^^ 69.5 71.6 < 0.0001 8.2Composite Cognitive Competency 53.7^ 59.6^^^ 64.2 67.3 < 0.0001 12.6Composite Social & Attitudinal Competency*
66.5 71.1^ 73.0 74.5 0.001 3.3
* In these cases the squared model was a better fit. ** In this case the square-root model was a better fit.^ One fewer in this mean. ^^^ Three fewer in this mean. ^^^^ Four fewer in this meanThe mean scores are percentages, not raw scores. The highest scores for each competency are in bold type, the lowest initalics.
Another perspective on the association of family income levels with competency levels comes fromcomparing proportions of those scoring at or above the study median score, and those below. Given the
patterns in the table above, we have used the age 5 family income levels as a basis for comparison. Wehave focused on the 2 foundations of education: reading and mathematics. These show the differencebetween the income groups more starkly. Children from low-income homes are half as likely as thosefrom high-income homes to score at or above the study median.
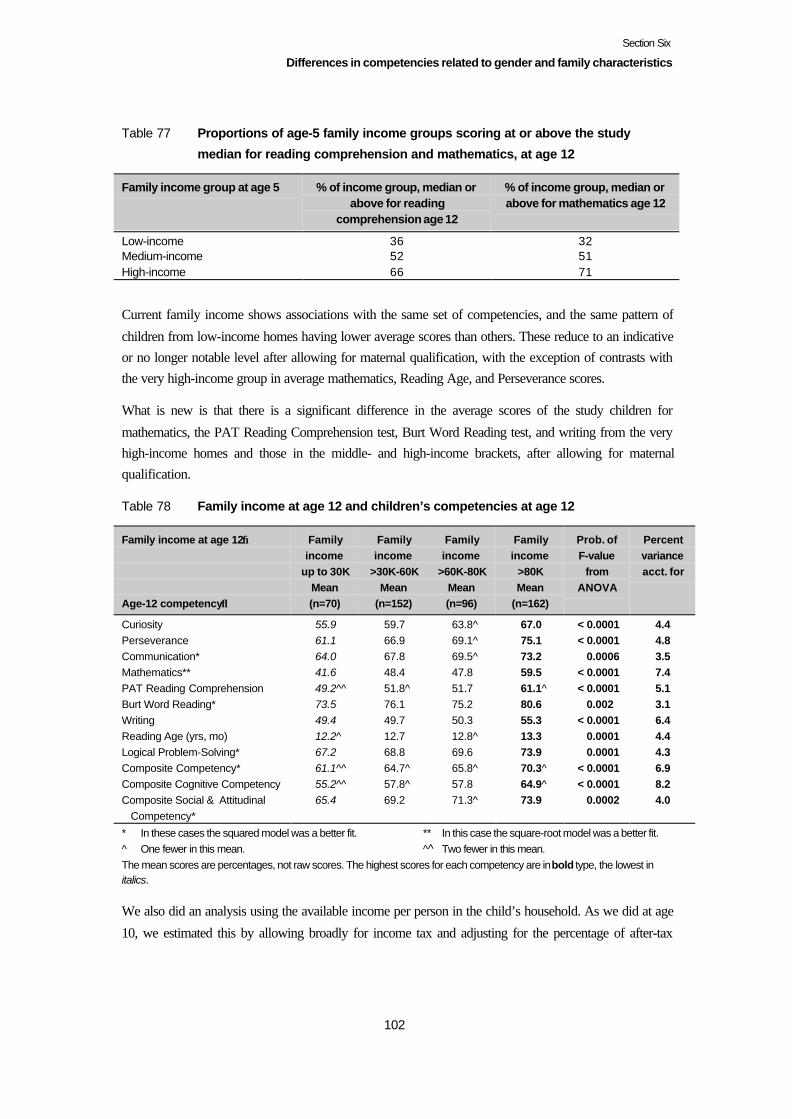
Section Six
Differences in competencies related to gender and family characteristics
102
Table 77 Proportions of age-5 family income groups scoring at or above the study
median for reading comprehension and mathematics, at age 12
Family income group at age 5 % of income group, median orabove for reading
comprehension age 12
% of income group, median orabove for mathematics age 12
Low-income 36 32Medium-income 52 51High-income 66 71
Current family income shows associations with the same set of competencies, and the same pattern of
children from low-income homes having lower average scores than others. These reduce to an indicativeor no longer notable level after allowing for maternal qualification, with the exception of contrasts withthe very high-income group in average mathematics, Reading Age, and Perseverance scores.
What is new is that there is a significant difference in the average scores of the study children for
mathematics, the PAT Reading Comprehension test, Burt Word Reading test, and writing from the veryhigh-income homes and those in the middle- and high-income brackets, after allowing for maternalqualification.
Table 78 Family income at age 12 and children’s competencies at age 12
Family income at age 12→
Age-12 competency↓
Familyincome
up to 30KMean(n=70)
Familyincome
>30K-60KMean
(n=152)
Familyincome
>60K-80KMean(n=96)
Familyincome
>80KMean
(n=162)
Prob. ofF-value
fromANOVA
Percentvarianceacct. for
Curiosity 55.9 59.7 63.8^ 67.0 < 0.0001 4.4Perseverance 61.1 66.9 69.1^ 75.1 < 0.0001 4.8Communication* 64.0 67.8 69.5^ 73.2 0.0006 3.5Mathematics** 41.6 48.4 47.8 59.5 < 0.0001 7.4PAT Reading Comprehension 49.2^^ 51.8^ 51.7 61.1^ < 0.0001 5.1Burt Word Reading* 73.5 76.1 75.2 80.6 0.002 3.1Writing 49.4 49.7 50.3 55.3 < 0.0001 6.4Reading Age (yrs, mo) 12.2^ 12.7 12.8^ 13.3 0.0001 4.4Logical Problem-Solving* 67.2 68.8 69.6 73.9 0.0001 4.3Composite Competency* 61.1^^ 64.7^ 65.8^ 70.3^ < 0.0001 6.9Composite Cognitive Competency 55.2^^ 57.8^ 57.8 64.9^ < 0.0001 8.2Composite Social & Attitudinal Competency*
65.4 69.2 71.3^ 73.9 0.0002 4.0
* In these cases the squared model was a better fit. ** In this case the square-root model was a better fit.^ One fewer in this mean. ^^ Two fewer in this mean.The mean scores are percentages, not raw scores. The highest scores for each competency are in bold type, the lowest initalics.
We also did an analysis using the available income per person in the child’s household. As we did at age
10, we estimated this by allowing broadly for income tax and adjusting for the percentage of after-tax
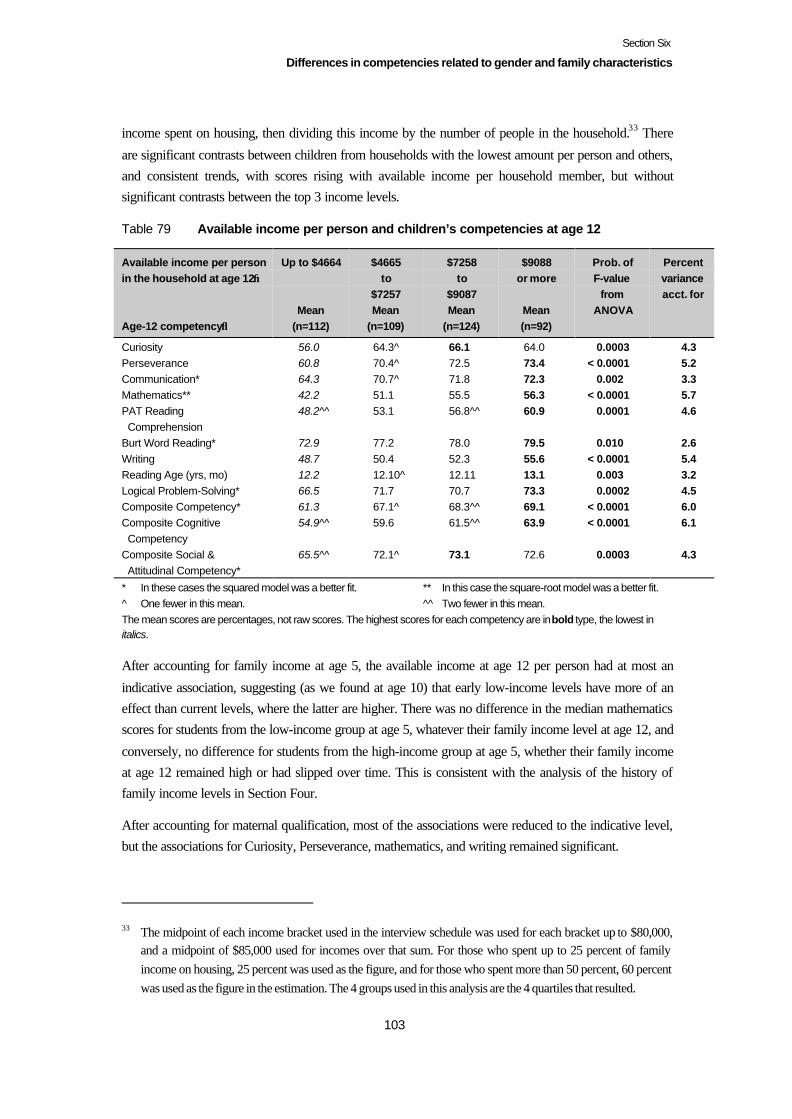
Section Six
Differences in competencies related to gender and family characteristics
103
income spent on housing, then dividing this income by the number of people in the household.33 There
are significant contrasts between children from households with the lowest amount per person and others,and consistent trends, with scores rising with available income per household member, but withoutsignificant contrasts between the top 3 income levels.
Table 79 Available income per person and children’s competencies at age 12
Available income per personin the household at age 12→
Age-12 competency↓
Up to $4664
Mean(n=112)
$4665to
$7257Mean
(n=109)
$7258to
$9087Mean
(n=124)
$9088or more
Mean(n=92)
Prob. ofF-value
fromANOVA
Percentvarianceacct. for
Curiosity 56.0 64.3^ 66.1 64.0 0.0003 4.3Perseverance 60.8 70.4^ 72.5 73.4 < 0.0001 5.2Communication* 64.3 70.7^ 71.8 72.3 0.002 3.3Mathematics** 42.2 51.1 55.5 56.3 < 0.0001 5.7PAT Reading Comprehension
48.2^^ 53.1 56.8^^ 60.9 0.0001 4.6
Burt Word Reading* 72.9 77.2 78.0 79.5 0.010 2.6Writing 48.7 50.4 52.3 55.6 < 0.0001 5.4Reading Age (yrs, mo) 12.2 12.10^ 12.11 13.1 0.003 3.2Logical Problem-Solving* 66.5 71.7 70.7 73.3 0.0002 4.5Composite Competency* 61.3 67.1^ 68.3^^ 69.1 < 0.0001 6.0Composite Cognitive Competency
54.9^^ 59.6 61.5^^ 63.9 < 0.0001 6.1
Composite Social & Attitudinal Competency*
65.5^^ 72.1^ 73.1 72.6 0.0003 4.3
* In these cases the squared model was a better fit. ** In this case the square-root model was a better fit.^ One fewer in this mean. ^^ Two fewer in this mean.The mean scores are percentages, not raw scores. The highest scores for each competency are in bold type, the lowest initalics.
After accounting for family income at age 5, the available income at age 12 per person had at most an
indicative association, suggesting (as we found at age 10) that early low-income levels have more of aneffect than current levels, where the latter are higher. There was no difference in the median mathematicsscores for students from the low-income group at age 5, whatever their family income level at age 12, and
conversely, no difference for students from the high-income group at age 5, whether their family incomeat age 12 remained high or had slipped over time. This is consistent with the analysis of the history offamily income levels in Section Four.
After accounting for maternal qualification, most of the associations were reduced to the indicative level,but the associations for Curiosity, Perseverance, mathematics, and writing remained significant.
33 The midpoint of each income bracket used in the interview schedule was used for each bracket up to $80,000,and a midpoint of $85,000 used for incomes over that sum. For those who spent up to 25 percent of familyincome on housing, 25 percent was used as the figure, and for those who spent more than 50 percent, 60 percentwas used as the figure in the estimation. The 4 groups used in this analysis are the 4 quartiles that resulted.

Section Six
Differences in competencies related to gender and family characteristics
104
Summary
Although gender and ethnicity have some associations with children’s competency scores, the
associations with family income and maternal qualification are more marked, and much stronger. Thereare overlaps between family income and maternal qualification, but maternal qualification is notsynonymous with family income levels, and of the 2 factors, it is the stronger. Paternal qualification
levels also make a separate contribution to children’s cognitive scores. The higher the level of maternalqualification, the more likely it is that fathers will have the same level of qualification.
Family income levels when the study children were age 5 continued to show significant associations withthe children’s competency levels, 7 years later. Children from homes that were then low-income were
only half as likely as those from high-income homes to score at or above the study median score at age 12for mathematics and the PAT Reading Comprehension test. Current family income levels had moreconsistently increasing associations with children’s age-12 competency levels.
In Section Ten, we cross-tabulate the material on children’s activities, experiences, and views, and
parents’ activities and concerns, to see if we can shed more light on why maternal qualification andfamily income matter for children’s competency levels, or the kinds of differences that lie behind thesesocial categories.
105
Section Seven
Family composition and parents
We spoke to the mothers of 89 percent of the study children, to the fathers of 9 percent, and otherrelatives of 2 percent. The fathers we spoke with were more likely than the mothers to be in sole-parentfamilies (30 percent compared with 15 percent of the mothers), or from 2-parent families with one step-parent (20 percent compared with 9 percent of the mothers).
Family composition
At age 12, 94 percent of the study children lived in the same house as their birth mother, and 77 percentin the same house as their birth father, according to their parents.34
In all, 29 percent did not live with one of their birth parents. Parents reported that half of these saw theirnon-resident parent regularly. Five percent of the children were in shared-custody situations. Ten percenthad regular access to their non-resident parent, and 3 percent, sometimes had access. Five percent had
only rare access, and 2 percent had no access at all. Two percent of the children had lost a parent throughdeath.
The children who did not live with both birth parents gave a somewhat more sanguine picture ofconnection with their other parent when we asked if they spent time with their other partner in their home.
Nineteen percent said they did. Nine percent spent time with their father and his partner, 6 percent withtheir father only, 2 percent with their mother and her partner, and 1 percent with their mother only. Fourpercent of the children mentioned shared parenting arrangements. Five percent mentioned either spending
every weekend or most weekends with their other parent, or school holidays. Six percent said they spentsome weekends with their other parent. Two percent mentioned regular visits during the day, and 1percent, some irregular visits. Two children also spent some time with other relatives in a third house.
Whether children were with one parent or with a step-parent made no significant difference to the kind ofcontact they had with their non-resident parent, though the quality of the relationship was more likely to
34 We got a very similar picture from the study children when we asked them. “Who are the adults who live withyou at home?” Seventy-two percent said their mother and father, 13 percent said their mother only, 9 percent,their mother and her partner, 2 percent each their father only, or their father and his partner, and 1 percent livedwith other relatives.

Section Seven
Family composition and parents
106
be variable for children living in sole-parent households (21 percent compared with 4 percent of thoseliving with a step-parent, on the resident parent report).
Seventeen percent of those who did not live with their birth parent or who were not in shared custodywere said by their resident parent to get on well with their non-resident parent. Children whose parentsshared their custody, or whose non-resident parent had regular access to them were more likely to get on
well with them (85 percent compared with 49 percent of those who saw their non-resident parentsometimes or rarely/intermittently).
At the age of 12, most of the study children remained in their original 2-parent family, as shown in thegraph below.
Figure 11 Family composition when study children aged 12
Our sample has a somewhat larger proportion of 2-parent families than the Wellington region or NewZealand as a whole, 82 percent compared with 73 percent of families with dependent children in theWellington region, and 71 percent for New Zealand.35
Children in this sample whose mother had no qualification, and Mäori children, were more likely to be in1-parent families (22 and 27 percent respectively). Seventy-one percent of the low-income families were1-parent.
Eighty-three percent of the 1-parent families were headed by women, and 17 percent by men (n=14).
Seventeen percent of the study children were the only children in their household. Thirty-six percent had
1 sibling, 29 percent, 2 siblings, 11 percent had 3 siblings, and 4 percent had 4 or more siblings, with 1 ofthe study children having 10 siblings. Five percent had half-siblings. The average number of biologicalsiblings was 1.62 (s.d. 1.09).
35 2001 Census figures for families with dependent children living in private occupied dwellings.
71%
17%
1%
10%1% Two-parent family -
birth parents
Sole-parent family
Two-parent family -two step-parents
Two parent family -one step-parent
Other
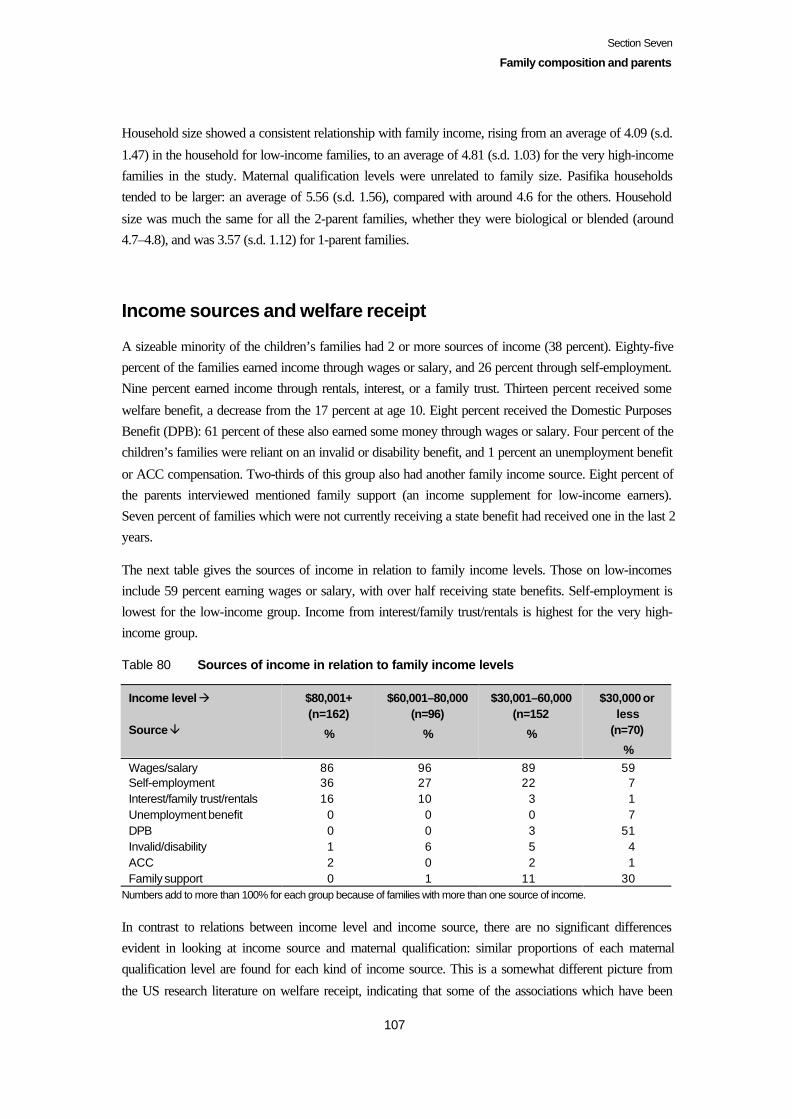
Section Seven
Family composition and parents
107
Household size showed a consistent relationship with family income, rising from an average of 4.09 (s.d.
1.47) in the household for low-income families, to an average of 4.81 (s.d. 1.03) for the very high-incomefamilies in the study. Maternal qualification levels were unrelated to family size. Pasifika householdstended to be larger: an average of 5.56 (s.d. 1.56), compared with around 4.6 for the others. Household
size was much the same for all the 2-parent families, whether they were biological or blended (around4.7–4.8), and was 3.57 (s.d. 1.12) for 1-parent families.
Income sources and welfare receipt
A sizeable minority of the children’s families had 2 or more sources of income (38 percent). Eighty-fivepercent of the families earned income through wages or salary, and 26 percent through self-employment.Nine percent earned income through rentals, interest, or a family trust. Thirteen percent received some
welfare benefit, a decrease from the 17 percent at age 10. Eight percent received the Domestic PurposesBenefit (DPB): 61 percent of these also earned some money through wages or salary. Four percent of thechildren’s families were reliant on an invalid or disability benefit, and 1 percent an unemployment benefit
or ACC compensation. Two-thirds of this group also had another family income source. Eight percent ofthe parents interviewed mentioned family support (an income supplement for low-income earners).Seven percent of families which were not currently receiving a state benefit had received one in the last 2years.
The next table gives the sources of income in relation to family income levels. Those on low-incomesinclude 59 percent earning wages or salary, with over half receiving state benefits. Self-employment islowest for the low-income group. Income from interest/family trust/rentals is highest for the very high-income group.
Table 80 Sources of income in relation to family income levels
Income level à
Source â
$80,001+(n=162)
%
$60,001–80,000(n=96)
%
$30,001–60,000(n=152
%
$30,000 orless
(n=70)
%Wages/salary 86 96 89 59Self-employment 36 27 22 7Interest/family trust/rentals 16 10 3 1Unemployment benefit 0 0 0 7DPB 0 0 3 51Invalid/disability 1 6 5 4ACC 2 0 2 1Family support 0 1 11 30
Numbers add to more than 100% for each group because of families with more than one source of income.
In contrast to relations between income level and income source, there are no significant differencesevident in looking at income source and maternal qualification: similar proportions of each maternalqualification level are found for each kind of income source. This is a somewhat different picture from
the US research literature on welfare receipt, indicating that some of the associations which have been
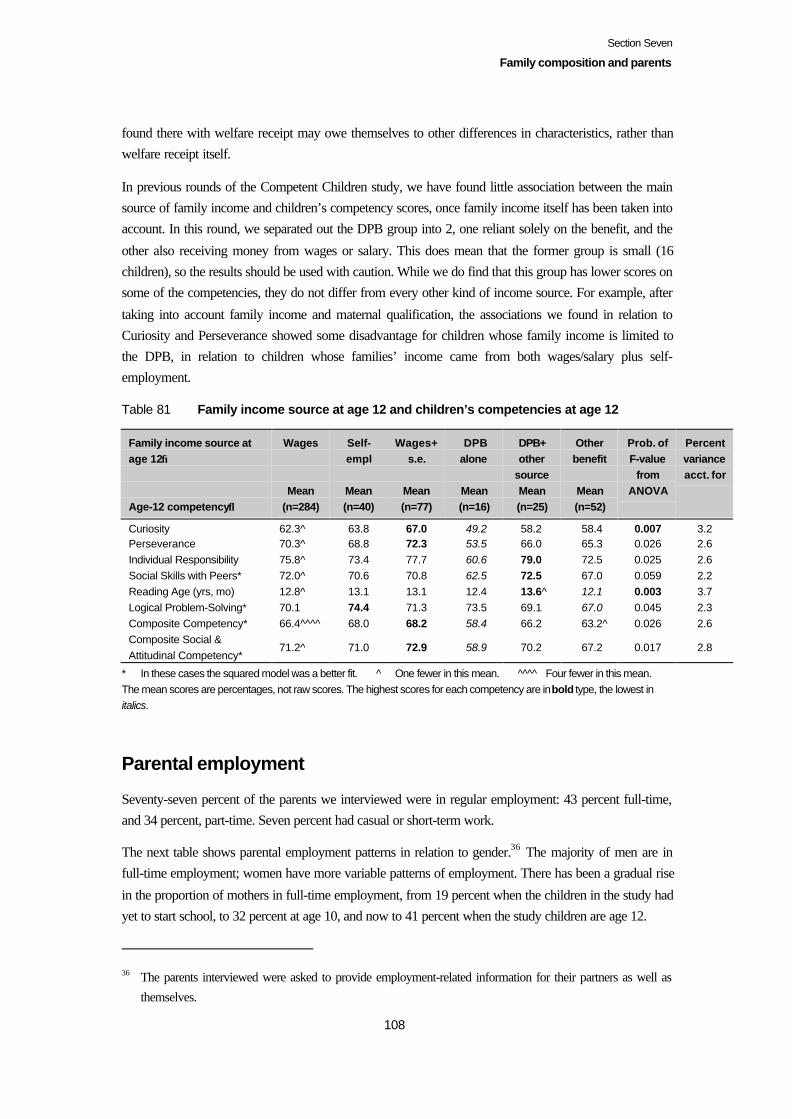
Section Seven
Family composition and parents
108
found there with welfare receipt may owe themselves to other differences in characteristics, rather thanwelfare receipt itself.
In previous rounds of the Competent Children study, we have found little association between the mainsource of family income and children’s competency scores, once family income itself has been taken intoaccount. In this round, we separated out the DPB group into 2, one reliant solely on the benefit, and the
other also receiving money from wages or salary. This does mean that the former group is small (16children), so the results should be used with caution. While we do find that this group has lower scores onsome of the competencies, they do not differ from every other kind of income source. For example, after
taking into account family income and maternal qualification, the associations we found in relation toCuriosity and Perseverance showed some disadvantage for children whose family income is limited tothe DPB, in relation to children whose families’ income came from both wages/salary plus self-employment.
Table 81 Family income source at age 12 and children’s competencies at age 12
Family income source atage 12→
Age-12 competency↓
Wages
Mean(n=284)
Self-empl
Mean(n=40)
Wages+s.e.
Mean(n=77)
DPBalone
Mean(n=16)
DPB+other
sourceMean(n=25)
Otherbenefit
Mean(n=52)
Prob. ofF-value
fromANOVA
Percentvarianceacct. for
Curiosity 62.3^ 63.8 67.0 49.2 58.2 58.4 0.007 3.2Perseverance 70.3^ 68.8 72.3 53.5 66.0 65.3 0.026 2.6Individual Responsibility 75.8^ 73.4 77.7 60.6 79.0 72.5 0.025 2.6Social Skills with Peers* 72.0^ 70.6 70.8 62.5 72.5 67.0 0.059 2.2Reading Age (yrs, mo) 12.8^ 13.1 13.1 12.4 13.6^ 12.1 0.003 3.7Logical Problem-Solving* 70.1 74.4 71.3 73.5 69.1 67.0 0.045 2.3Composite Competency* 66.4^^^^ 68.0 68.2 58.4 66.2 63.2^ 0.026 2.6Composite Social &Attitudinal Competency*
71.2^ 71.0 72.9 58.9 70.2 67.2 0.017 2.8
* In these cases the squared model was a better fit. ^ One fewer in this mean. ^^^^ Four fewer in this mean.The mean scores are percentages, not raw scores. The highest scores for each competency are in bold type, the lowest initalics.
Parental employment
Seventy-seven percent of the parents we interviewed were in regular employment: 43 percent full-time,and 34 percent, part-time. Seven percent had casual or short-term work.
The next table shows parental employment patterns in relation to gender.36 The majority of men are infull-time employment; women have more variable patterns of employment. There has been a gradual rise
in the proportion of mothers in full-time employment, from 19 percent when the children in the study hadyet to start school, to 32 percent at age 10, and now to 41 percent when the study children are age 12.
36 The parents interviewed were asked to provide employment-related information for their partners as well as
themselves.

Section Seven
Family composition and parents
109
Table 82 Parental employment by gender
Women(n=489)
%
Men(n=425)
%
Full-time employment 41 89Regular part-time job 30 0.5Two regular part-time jobs 6 1Casual/short-term work 6 4No employment 17 6On leave from employment 0 0.2
Mothers in 2-parent families were more likely to be working full-time than those in 1-parent families (41percent compared with 29 percent). Otherwise, patterns of employment (and not being in employment)were similar across different family types.
Thirty-nine percent of the mothers’ work involved shift work, irregular or long hours, weekend work, ortravel, and 7 percent held more than one job. The pattern for irregular hours was similar for the fathers –unlike previous phases. Thirty-six percent worked long or irregular hours, etc. (compared with 65 percent
at age 10).Three percent of the fathers held 2 or more jobs, much the same when the study children wereyounger.
The next table gives the average hours worked by the mothers and fathers of the study children. Note thatthe traditional 40-hour working week is not the reality for many of the fathers employed full-time. Fifty-
six percent of them worked more than 40 hours a week on average, as did 29 percent of the mothersemployed full-time. The fathers also tended to work longer hours than mothers for combinations of part-time and casual work.
Table 83 Average parental work hours by employment status
Women(n=489)
%
Men(n=425)
%
Full-time employment 40.8 (s.d. 8.9) 47.84 (s.d. 10.01)Regular part-time job 18.4 (s.d. 7.0) 20*Two regular part-time jobs 26.5 (s.d. 9.4) 38.33+ (s.d. 7.64)Casual/short-term work 10.21 (s.d. 9.4) 23.7^ (s.d. 14.14)
* 1 father, + 3 fathers, ̂ 7 fathers
Maternal employment status was unrelated to their education levels, but education levels were related to
the kind of work mothers were doing. Thus university-qualified mothers were most likely to beundertaking management or professional work (57 percent), compared with 33 percent of trades/tertiary-qualified mothers, 17 percent of school-qualified mothers, and 7 percent of mothers with no qualification.
Of the 16 percent of parents interviewed who were not in paid employment, 6 percent would like to be
doing some paid work, and 2 percent were unsure, or would like paid employment sometimes. The mainbarrier to paid work was the availability of work, followed by the need for retraining, the age of the child
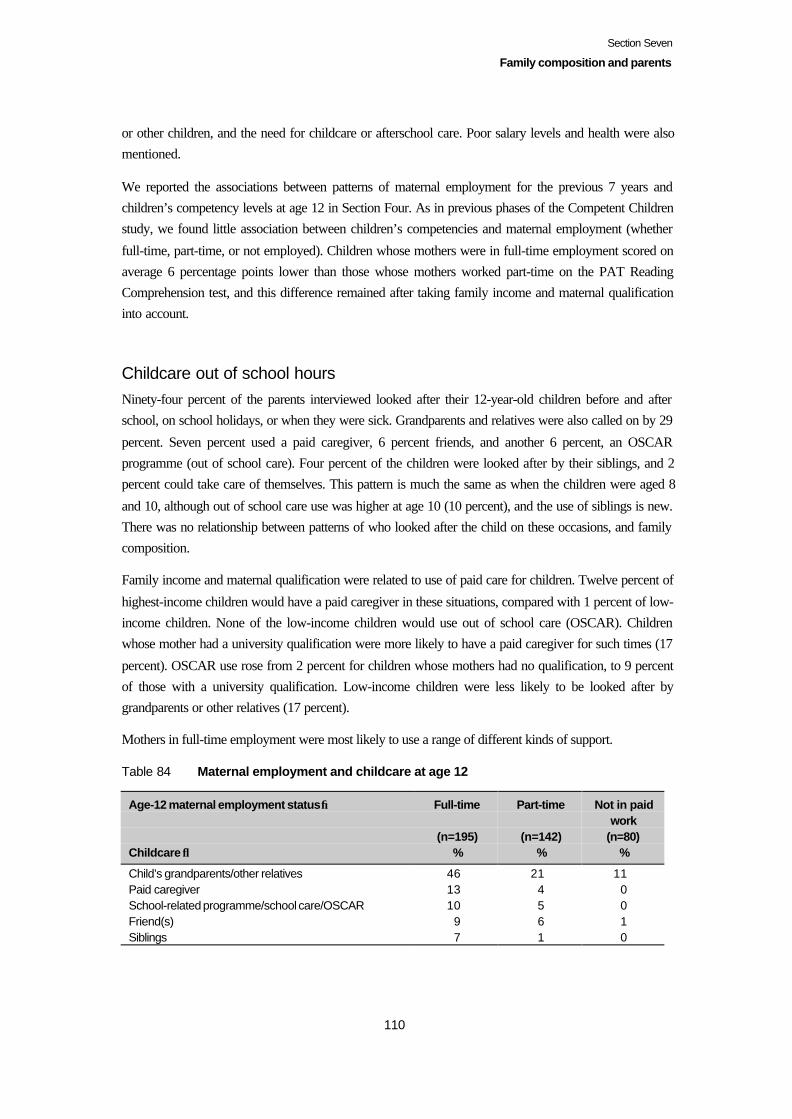
Section Seven
Family composition and parents
110
or other children, and the need for childcare or afterschool care. Poor salary levels and health were alsomentioned.
We reported the associations between patterns of maternal employment for the previous 7 years andchildren’s competency levels at age 12 in Section Four. As in previous phases of the Competent Childrenstudy, we found little association between children’s competencies and maternal employment (whether
full-time, part-time, or not employed). Children whose mothers were in full-time employment scored onaverage 6 percentage points lower than those whose mothers worked part-time on the PAT ReadingComprehension test, and this difference remained after taking family income and maternal qualificationinto account.
Childcare out of school hoursNinety-four percent of the parents interviewed looked after their 12-year-old children before and afterschool, on school holidays, or when they were sick. Grandparents and relatives were also called on by 29
percent. Seven percent used a paid caregiver, 6 percent friends, and another 6 percent, an OSCARprogramme (out of school care). Four percent of the children were looked after by their siblings, and 2percent could take care of themselves. This pattern is much the same as when the children were aged 8
and 10, although out of school care use was higher at age 10 (10 percent), and the use of siblings is new.There was no relationship between patterns of who looked after the child on these occasions, and familycomposition.
Family income and maternal qualification were related to use of paid care for children. Twelve percent of
highest-income children would have a paid caregiver in these situations, compared with 1 percent of low-income children. None of the low-income children would use out of school care (OSCAR). Childrenwhose mother had a university qualification were more likely to have a paid caregiver for such times (17
percent). OSCAR use rose from 2 percent for children whose mothers had no qualification, to 9 percentof those with a university qualification. Low-income children were less likely to be looked after bygrandparents or other relatives (17 percent).
Mothers in full-time employment were most likely to use a range of different kinds of support.
Table 84 Maternal employment and childcare at age 12
Age-12 maternal employment status→
Childcare ↓
Full-time
(n=195)%
Part-time
(n=142)%
Not in paidwork
(n=80)%
Child’s grandparents/other relatives 46 21 11Paid caregiver 13 4 0School-related programme/school care/OSCAR 10 5 0Friend(s) 9 6 1Siblings 7 1 0
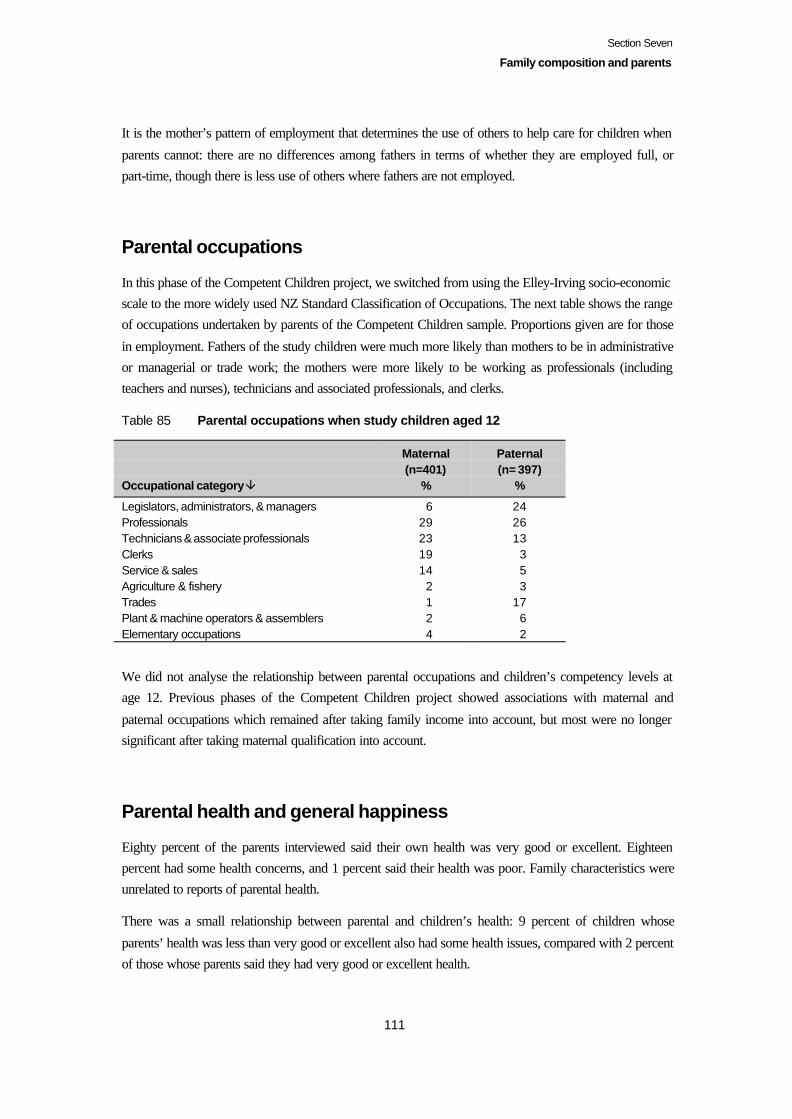
Section Seven
Family composition and parents
111
It is the mother’s pattern of employment that determines the use of others to help care for children when
parents cannot: there are no differences among fathers in terms of whether they are employed full, orpart-time, though there is less use of others where fathers are not employed.
Parental occupations
In this phase of the Competent Children project, we switched from using the Elley-Irving socio-economicscale to the more widely used NZ Standard Classification of Occupations. The next table shows the rangeof occupations undertaken by parents of the Competent Children sample. Proportions given are for those
in employment. Fathers of the study children were much more likely than mothers to be in administrativeor managerial or trade work; the mothers were more likely to be working as professionals (includingteachers and nurses), technicians and associated professionals, and clerks.
Table 85 Parental occupations when study children aged 12
Occupational category â
Maternal(n=401)
%
Paternal(n= 397)
%
Legislators, administrators, & managers 6 24Professionals 29 26Technicians & associate professionals 23 13Clerks 19 3Service & sales 14 5Agriculture & fishery 2 3Trades 1 17Plant & machine operators & assemblers 2 6Elementary occupations 4 2
We did not analyse the relationship between parental occupations and children’s competency levels atage 12. Previous phases of the Competent Children project showed associations with maternal and
paternal occupations which remained after taking family income into account, but most were no longersignificant after taking maternal qualification into account.
Parental health and general happiness
Eighty percent of the parents interviewed said their own health was very good or excellent. Eighteenpercent had some health concerns, and 1 percent said their health was poor. Family characteristics wereunrelated to reports of parental health.
There was a small relationship between parental and children’s health: 9 percent of children whose
parents’ health was less than very good or excellent also had some health issues, compared with 2 percentof those whose parents said they had very good or excellent health.
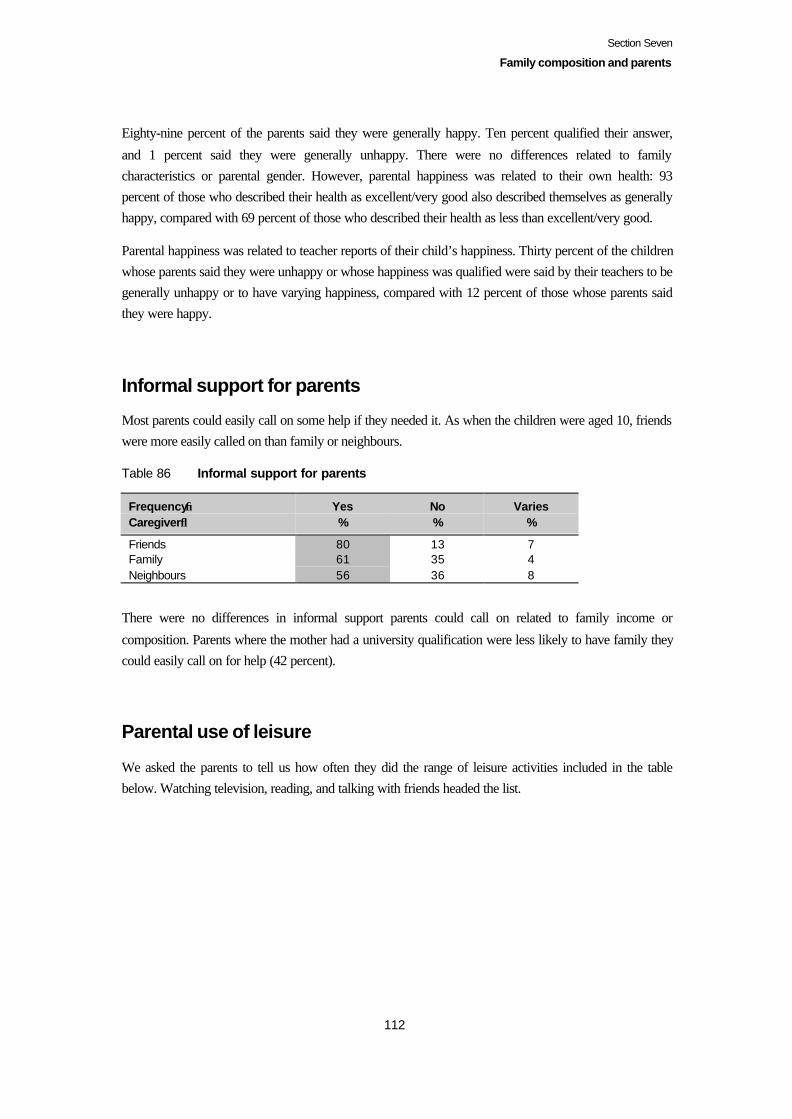
Section Seven
Family composition and parents
112
Eighty-nine percent of the parents said they were generally happy. Ten percent qualified their answer,
and 1 percent said they were generally unhappy. There were no differences related to familycharacteristics or parental gender. However, parental happiness was related to their own health: 93percent of those who described their health as excellent/very good also described themselves as generallyhappy, compared with 69 percent of those who described their health as less than excellent/very good.
Parental happiness was related to teacher reports of their child’s happiness. Thirty percent of the childrenwhose parents said they were unhappy or whose happiness was qualified were said by their teachers to begenerally unhappy or to have varying happiness, compared with 12 percent of those whose parents saidthey were happy.
Informal support for parents
Most parents could easily call on some help if they needed it. As when the children were aged 10, friendswere more easily called on than family or neighbours.
Table 86 Informal support for parents
Frequency→Caregiver↓
Yes%
No%
Varies%
Friends 80 13 7Family 61 35 4Neighbours 56 36 8
There were no differences in informal support parents could call on related to family income or
composition. Parents where the mother had a university qualification were less likely to have family theycould easily call on for help (42 percent).
Parental use of leisure
We asked the parents to tell us how often they did the range of leisure activities included in the tablebelow. Watching television, reading, and talking with friends headed the list.
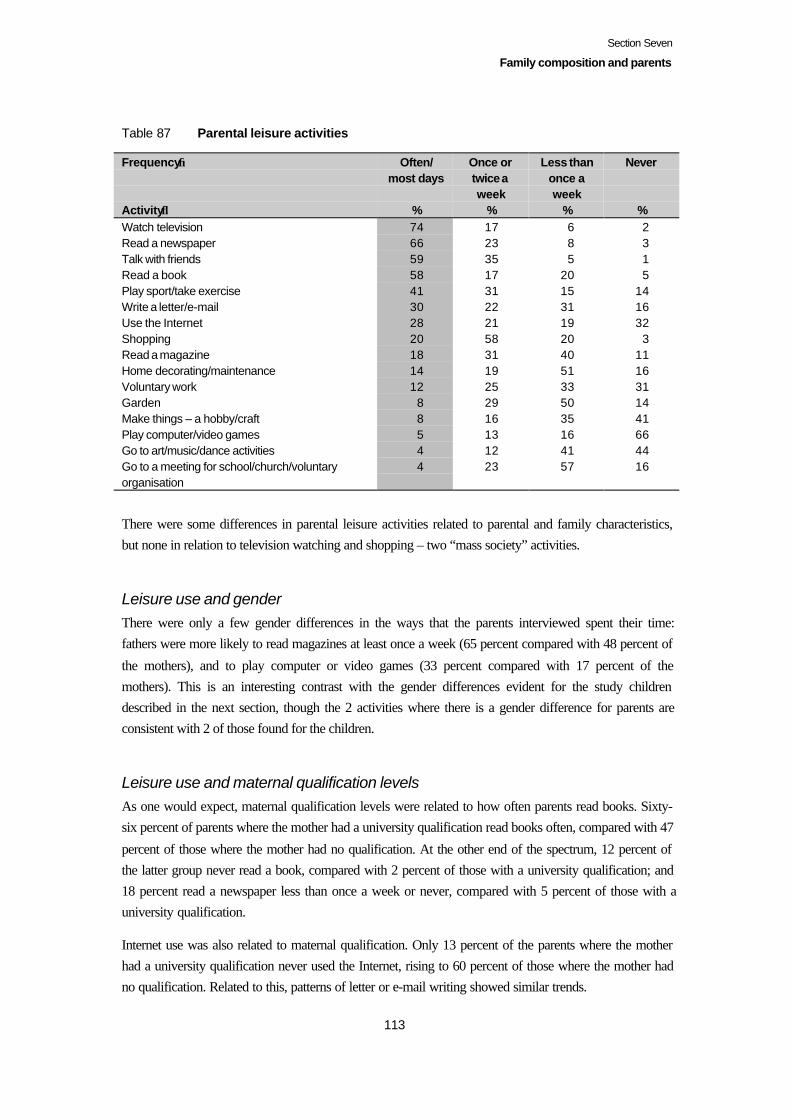
Section Seven
Family composition and parents
113
Table 87 Parental leisure activities
Frequency→
Activity↓
Often/most days
%
Once ortwice aweek
%
Less thanonce aweek
%
Never
%Watch television 74 17 6 2Read a newspaper 66 23 8 3Talk with friends 59 35 5 1Read a book 58 17 20 5Play sport/take exercise 41 31 15 14Write a letter/e-mail 30 22 31 16Use the Internet 28 21 19 32Shopping 20 58 20 3Read a magazine 18 31 40 11Home decorating/maintenance 14 19 51 16Voluntary work 12 25 33 31Garden 8 29 50 14Make things – a hobby/craft 8 16 35 41Play computer/video games 5 13 16 66Go to art/music/dance activities 4 12 41 44Go to a meeting for school/church/voluntaryorganisation
4 23 57 16
There were some differences in parental leisure activities related to parental and family characteristics,but none in relation to television watching and shopping – two “mass society” activities.
Leisure use and genderThere were only a few gender differences in the ways that the parents interviewed spent their time:fathers were more likely to read magazines at least once a week (65 percent compared with 48 percent of
the mothers), and to play computer or video games (33 percent compared with 17 percent of themothers). This is an interesting contrast with the gender differences evident for the study childrendescribed in the next section, though the 2 activities where there is a gender difference for parents areconsistent with 2 of those found for the children.
Leisure use and maternal qualification levelsAs one would expect, maternal qualification levels were related to how often parents read books. Sixty-six percent of parents where the mother had a university qualification read books often, compared with 47
percent of those where the mother had no qualification. At the other end of the spectrum, 12 percent ofthe latter group never read a book, compared with 2 percent of those with a university qualification; and18 percent read a newspaper less than once a week or never, compared with 5 percent of those with auniversity qualification.
Internet use was also related to maternal qualification. Only 13 percent of the parents where the motherhad a university qualification never used the Internet, rising to 60 percent of those where the mother hadno qualification. Related to this, patterns of letter or e-mail writing showed similar trends.
Section Seven
Family composition and parents
114
While patterns of going to art/music/dance activities often or at least once or twice a week are similar
among all the maternal qualification levels, never participating in these activities follows maternalqualification levels, from 20 percent of parents where mothers have a university qualification, to 69percent of those where mothers have no qualification. The experience of making things through a hobby
or craft was also related to maternal qualification (30 percent of the parents where the mother had auniversity qualification never did this, rising to 68 percent of those where the mother had noqualification).
While there were similar proportions of parents who did voluntary work, gardened, or played sport/took
exercise among all maternal qualification levels, parents where the mother had no qualification weremore likely to never undertake these (44, 26, and 22 percent respectively).
Leisure use and family income levelsPatterns of parental use of leisure showed fewer relationships with family income than with maternal
qualification. The differences that did exist were similar, with the exception of no differences related tosport/exercise:
• a higher proportion of parents from low-income homes reading less than once a week or never (40percent compared with 23 percent of others);
• fewer parents from low-income homes reading a newspaper often/most days (39 percent comparedwith 70 percent of others);
• use of the Internet reflecting levels of family income (rising from 14 percent of parents in low-income
homes using it often or most days, to 38 percent of parents in very high-income homes), with asimilar pattern for writing letters or e-mail;
• Parents in low-income homes least likely to garden (21 percent said they never did); and
• Parents in low-mid-income homes less likely to do home decorating or maintenance (20 percent saidthey never did, compared with 12 percent of those in high-very high-income homes).
Parental use of leisure and family compositionOnly 2 differences in use of parental leisure were related to kind of family. Parents in 1-parent families
were less likely to read a newspaper often (49 percent), and parents in new 2-parent families were morelikely to never spend time on voluntary work (53 percent).
It seems likely that some of the differences between parents related to income and maternal qualificationreflect differences in available money to support the more expensive leisure options, and, in relation to
home-related leisure use particularly, differences in whether the home is owned or rented (we did not askthis). Other differences do reflect differences in the role of literacy in everyday life, and in relation tomaternal qualification, but not family income, different levels of cultural capital, with a greater incidenceof some ‘high” cultural activities among mothers with high levels of qualification.
Section Seven
Family composition and parents
115
Leisure use and ethnicityThere were some ethnic differences. The parents of Päkehä/European children were more likely to saythey read a book often (62 percent compared with 43 percent of others). However, there was nodifference related to reading a newspaper. Mäori and Päkehä/European parents were more likely to often
talk to friends than Pasifika or Asian parents (60 percent compared with 41 percent). However, ethnicitywas unrelated to whether parents had friends they could call on easily if they needed help.
Parental enjoyment of reading
Eighty-four percent of the children’s parents whom we interviewed said they liked reading, and 11percent did if they had time. Five percent said they did not like reading. Enjoyment of reading was similarfor both mothers and fathers interviewed. Enjoyment of reading was related to maternal qualification,
with 12 percent of those parents where the mother had no maternal qualification saying they did not enjoyreading. Parents where the mother had a university qualification were most likely to enjoy reading (93percent, declining to 80 percent of those with a school or no qualification). There was no association with
family income or gender. Interestingly, there was no association between a parent’s enjoyment ofreading, and their child’s enjoyment of reading.
Mäori and Pasifika parents were more likely to say they did not like reading (15 and 12 percentrespectively).
Parental time spent watching television
The average time spent watching television among parents was 1.92 hours (s.d. 1.19), with a range fromnone (2 percent) to 8 hours a day. Fourteen percent said they watched television only occasionally.
The mothers and fathers interviewed had similar averages. The higher the mother’s qualification level,
the less television was watched: from a mean of 1.28 hours (s.d. 0.70) where the mother had a universityqualification, to a mean of 2.75 hours (s.d. 1.38) where the mother had no qualification. There was asimilar trend in relation to levels of family income: the higher the income, the less television watched on
average. Mäori parents had a higher average number of hours spent watching television (2.38 hours (s.d.1.27)).
Parental television watching time showed associations with quite a few of the children’s competencies.However, there is a considerable overlap between parental time spent watching television and family
income and maternal qualification levels, so that most associations lose their significance once those 2key aspects have been taken into account.
Section Seven
Family composition and parents
116
Do mothers and fathers see things differently?
We found few gender differences in the study parents’ perspectives on their child’s school progress, their
concerns about their child, their own involvement in the school, or their own activities with the child.Mothers were more likely to say they would get cross and get their way if there was a disagreement withthe child (39 percent compared with 22 percent of the fathers). Fathers were less likely to talk to their
child about school (74 percent compared with 88 percent of the mothers). Mothers were more likely tohear about school work from their children (38 percent compared with 20 percent of the fathers), andabout bullying or social problems (21 percent compared with 9 percent of the fathers). Mothers were
more likely to share shopping with their 12-year-old (43 percent compared with 22 percent of thefathers). These different patterns may reflect differences in employment hours, since mothers were lesslikely than fathers to be employed full-time.
Summary
Seventy-one percent of the children continued to live with both their birth parents. Half of those who didnot saw their non-resident parent regularly. Children whose parents shared their custody or whose non-
resident parent had regular access to them were more likely to get on with them. Eighty-three percent ofthe study sample had at least 1 sibling, with a third having 1, and just under a third, 2 siblings.
Seventy-seven percent of the parents we interviewed were in regular employment: 43 percent full-time,and 34 percent part-time. Seven percent had casual or short-term work. There has been a gradual rise in
the proportion of mothers in full-time employment, from 19 percent when the children in the study hadyet to start school, to 32 percent at age 10, and now to 41 percent when the study children are age 12.Mothers in 2-parent families were more likely to be working full-time than those in 1-parent families.
Otherwise, patterns of employment (and not being in employment) were similar across different familytypes. They were also similar across different levels of maternal qualification. However, maternalqualification levels were reflected in the kind of work undertaken.
Fathers of the study children were much more likely than mothers to be in managerial or trade work; the
mothers were more likely to be working as professionals (including teachers and nurses), technicians andassociated professionals, and clerks.
Fifty-six percent of the children’s fathers worked more than 40 hours a week on average, as did 29percent of the mothers employed full-time. Use of others to help care for children when parents cannot is
mainly related to maternal employment, though there is less use of others where fathers were notemployed. The use of paid care for children (by a caregiver or through an OSCAR programme) wasrelated to family income and maternal qualification levels, with more use with higher levels of incomeand qualification.
Most parents could easily call on some help if they needed it, more so from friends than family orneighbours. Family characteristics were unrelated to the availability of help from others.
Section Seven
Family composition and parents
117
Most family income was earned through wages or salary. Self-employment was a source for 26 percent
of the children’s families. Thirteen percent received a welfare benefit. While family income levels arerelated to family sources of income, maternal qualification is not.
Eighty-nine percent of the parents were generally happy, and 80 percent in very good or excellent health.Parental happiness was related to their health, and to teacher reports of their child’s happiness.
Watching television, reading, and talking with friends headed the list of parents’ leisure activities. In
contrast to the gender differences between the study children’s use of leisure time, there were only a fewgender differences for their parents, and leisure activities. Maternal qualification was the familycharacteristic most associated with differences in the use of leisure time, followed by family income. The
differences that existed were related to the use of literacy, and participation in “high culture”; motherswith no qualification or in low-income homes were also less likely to do voluntary work, or garden.
Most parents liked reading. Enjoyment of reading was related to maternal qualification levels.Interestingly, there was no association between parental and child enjoyment of reading. Though most
parents watched television most days, the higher the level of maternal qualification and family income,the less amount of time went to television viewing.
There were indications that children may talk more with their mothers about school than their fathers.This may be related to the lower proportion of mothers in full-time employment, and therefore having
more time available to spend with children. Otherwise, there were few gender differences related tointeraction with children, or involvement in their activities.
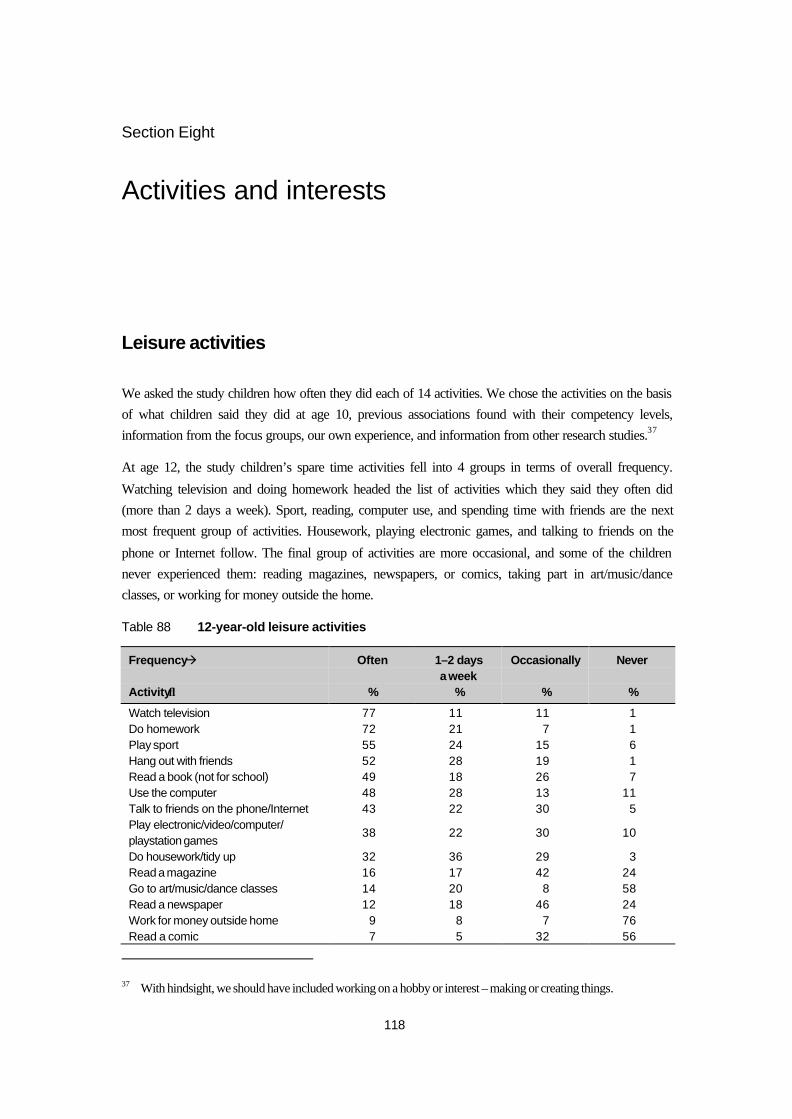
118
Section Eight
Activities and interests
Leisure activities
We asked the study children how often they did each of 14 activities. We chose the activities on the basisof what children said they did at age 10, previous associations found with their competency levels,information from the focus groups, our own experience, and information from other research studies.37
At age 12, the study children’s spare time activities fell into 4 groups in terms of overall frequency.
Watching television and doing homework headed the list of activities which they said they often did(more than 2 days a week). Sport, reading, computer use, and spending time with friends are the nextmost frequent group of activities. Housework, playing electronic games, and talking to friends on the
phone or Internet follow. The final group of activities are more occasional, and some of the childrennever experienced them: reading magazines, newspapers, or comics, taking part in art/music/danceclasses, or working for money outside the home.
Table 88 12-year-old leisure activities
Frequencyà
Activity↓
Often
%
1–2 daysa week
%
Occasionally
%
Never
%
Watch television 77 11 11 1Do homework 72 21 7 1Play sport 55 24 15 6Hang out with friends 52 28 19 1Read a book (not for school) 49 18 26 7Use the computer 48 28 13 11Talk to friends on the phone/Internet 43 22 30 5Play electronic/video/computer/playstation games
38 22 30 10
Do housework/tidy up 32 36 29 3Read a magazine 16 17 42 24Go to art/music/dance classes 14 20 8 58Read a newspaper 12 18 46 24Work for money outside home 9 8 7 76Read a comic 7 5 32 56
37 With hindsight, we should have included working on a hobby or interest – making or creating things.

Section EightActivities and interests
119
There are some gender differences in these patterns that are likely to be related to the gender differences
in performance on the Competent Children project measures, though the size of the performancedifferences is not large.
Girls were more likely than boys to:
• read a book other than for school (62 percent of girls did so often, compared with 37 percent of boys;11 percent of boys said they never read a book other than for school, compared with 3 percent of the
girls);• read a magazine (34 percent of boys said they never read a magazine, compared with 13 percent of
girls);
• often talk to friends on the phone or Internet (56 percent of girls compared with 31 percent of boys);• do their homework often (78 percent of girls compared with 67 percent of boys); and• go to art/music/dance classes often, or 1 or 2 days a week (48 percent of girls compared with 21
percent of boys).
Boys were more likely than girls to:
• play electronic/video/computer/playstation games often (54 percent of boys compared with 20percent of girls);
• play sport often (65 percent of boys compared with 43 percent of girls); and• read comics (56 percent of boys compared with 31 percent of girls).
Boys and girls were just as likely to:
• use a computer;• do housework;• hang out with friends;
• work for money outside home; and• read newspapers often, or on 1 or 2 days a week, but boys were more likely to never read a newspaper
(29 percent compared with 20 percent of girls).
On the whole, the frequency with which children reported these activities was unrelated to maternalqualification or family income. There are 3 notable exceptions.
The proportion of 12-year-old children who often read a book rises from 29 percent of those whosemother has no qualification to 45 percent of those whose mother has a school qualification, and 50percent of those whose mother has a tertiary/trade qualification, to 70 percent of those whose mother hasa university qualification.
Thirty-seven percent of those whose mothers have no qualification only used a computer occasionally ornever, compared with 26 percent of those whose mothers have a school or tertiary/trade qualification, and8 percent of those whose mothers have a university qualification.
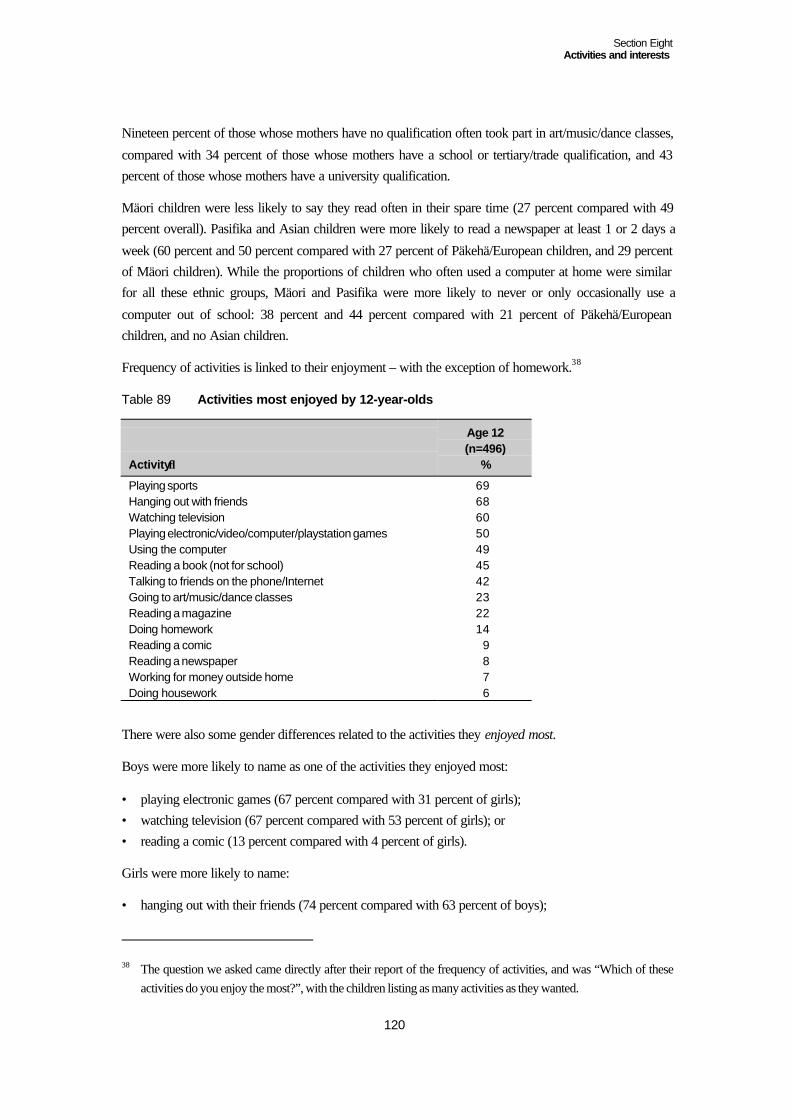
Section EightActivities and interests
120
Nineteen percent of those whose mothers have no qualification often took part in art/music/dance classes,
compared with 34 percent of those whose mothers have a school or tertiary/trade qualification, and 43percent of those whose mothers have a university qualification.
Mäori children were less likely to say they read often in their spare time (27 percent compared with 49percent overall). Pasifika and Asian children were more likely to read a newspaper at least 1 or 2 days a
week (60 percent and 50 percent compared with 27 percent of Päkehä/European children, and 29 percentof Mäori children). While the proportions of children who often used a computer at home were similarfor all these ethnic groups, Mäori and Pasifika were more likely to never or only occasionally use a
computer out of school: 38 percent and 44 percent compared with 21 percent of Päkehä/Europeanchildren, and no Asian children.
Frequency of activities is linked to their enjoyment – with the exception of homework.38
Table 89 Activities most enjoyed by 12-year-olds
Activity↓
Age 12(n=496)
%
Playing sports 69Hanging out with friends 68Watching television 60Playing electronic/video/computer/playstation games 50Using the computer 49Reading a book (not for school) 45Talking to friends on the phone/Internet 42Going to art/music/dance classes 23Reading a magazine 22Doing homework 14Reading a comic 9Reading a newspaper 8Working for money outside home 7Doing housework 6
There were also some gender differences related to the activities they enjoyed most.
Boys were more likely to name as one of the activities they enjoyed most:
• playing electronic games (67 percent compared with 31 percent of girls);• watching television (67 percent compared with 53 percent of girls); or• reading a comic (13 percent compared with 4 percent of girls).
Girls were more likely to name:
• hanging out with their friends (74 percent compared with 63 percent of boys);
38 The question we asked came directly after their report of the frequency of activities, and was “Which of theseactivities do you enjoy the most?”, with the children listing as many activities as they wanted.
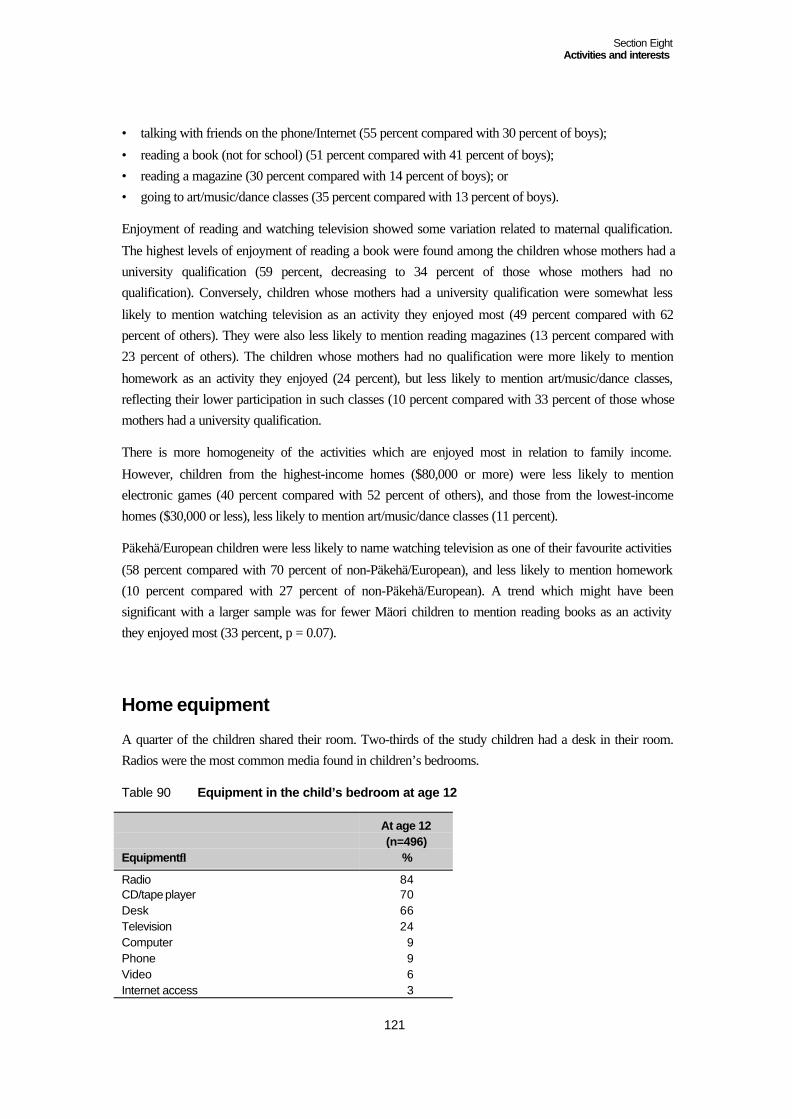
Section EightActivities and interests
121
• talking with friends on the phone/Internet (55 percent compared with 30 percent of boys);
• reading a book (not for school) (51 percent compared with 41 percent of boys);• reading a magazine (30 percent compared with 14 percent of boys); or• going to art/music/dance classes (35 percent compared with 13 percent of boys).
Enjoyment of reading and watching television showed some variation related to maternal qualification.
The highest levels of enjoyment of reading a book were found among the children whose mothers had auniversity qualification (59 percent, decreasing to 34 percent of those whose mothers had noqualification). Conversely, children whose mothers had a university qualification were somewhat less
likely to mention watching television as an activity they enjoyed most (49 percent compared with 62percent of others). They were also less likely to mention reading magazines (13 percent compared with23 percent of others). The children whose mothers had no qualification were more likely to mention
homework as an activity they enjoyed (24 percent), but less likely to mention art/music/dance classes,reflecting their lower participation in such classes (10 percent compared with 33 percent of those whosemothers had a university qualification.
There is more homogeneity of the activities which are enjoyed most in relation to family income.
However, children from the highest-income homes ($80,000 or more) were less likely to mentionelectronic games (40 percent compared with 52 percent of others), and those from the lowest-incomehomes ($30,000 or less), less likely to mention art/music/dance classes (11 percent).
Päkehä/European children were less likely to name watching television as one of their favourite activities
(58 percent compared with 70 percent of non-Päkehä/European), and less likely to mention homework(10 percent compared with 27 percent of non-Päkehä/European). A trend which might have beensignificant with a larger sample was for fewer Mäori children to mention reading books as an activitythey enjoyed most (33 percent, p = 0.07).
Home equipment
A quarter of the children shared their room. Two-thirds of the study children had a desk in their room.Radios were the most common media found in children’s bedrooms.
Table 90 Equipment in the child’s bedroom at age 12
Equipment↓
At age 12(n=496)
%
Radio 84CD/tape player 70Desk 66Television 24Computer 9Phone 9Video 6Internet access 3
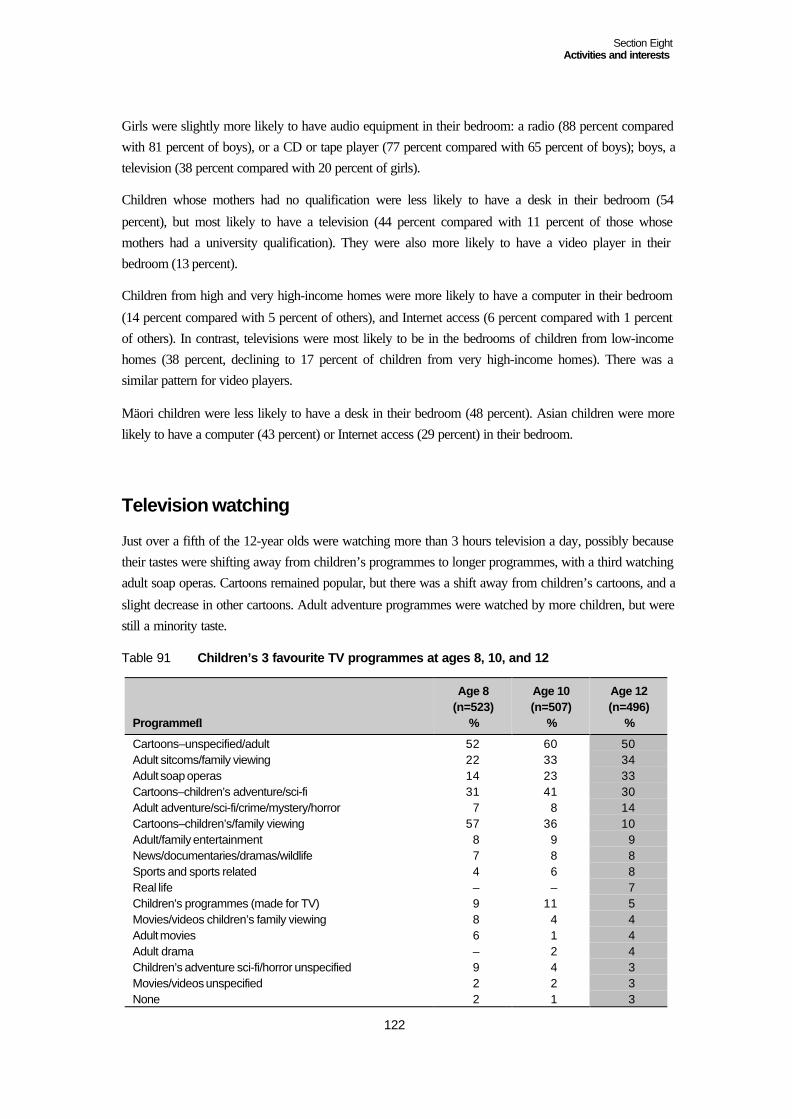
Section EightActivities and interests
122
Girls were slightly more likely to have audio equipment in their bedroom: a radio (88 percent comparedwith 81 percent of boys), or a CD or tape player (77 percent compared with 65 percent of boys); boys, atelevision (38 percent compared with 20 percent of girls).
Children whose mothers had no qualification were less likely to have a desk in their bedroom (54
percent), but most likely to have a television (44 percent compared with 11 percent of those whosemothers had a university qualification). They were also more likely to have a video player in theirbedroom (13 percent).
Children from high and very high-income homes were more likely to have a computer in their bedroom
(14 percent compared with 5 percent of others), and Internet access (6 percent compared with 1 percentof others). In contrast, televisions were most likely to be in the bedrooms of children from low-incomehomes (38 percent, declining to 17 percent of children from very high-income homes). There was asimilar pattern for video players.
Mäori children were less likely to have a desk in their bedroom (48 percent). Asian children were morelikely to have a computer (43 percent) or Internet access (29 percent) in their bedroom.
Television watching
Just over a fifth of the 12-year olds were watching more than 3 hours television a day, possibly becausetheir tastes were shifting away from children’s programmes to longer programmes, with a third watchingadult soap operas. Cartoons remained popular, but there was a shift away from children’s cartoons, and a
slight decrease in other cartoons. Adult adventure programmes were watched by more children, but werestill a minority taste.
Table 91 Children’s 3 favourite TV programmes at ages 8, 10, and 12
Programme↓
Age 8(n=523)
%
Age 10(n=507)
%
Age 12(n=496)
%
Cartoons–unspecified/adult 52 60 50Adult sitcoms/family viewing 22 33 34Adult soap operas 14 23 33Cartoons–children’s adventure/sci-fi 31 41 30Adult adventure/sci-fi/crime/mystery/horror 7 8 14Cartoons–children’s/family viewing 57 36 10Adult/family entertainment 8 9 9News/documentaries/dramas/wildlife 7 8 8Sports and sports related 4 6 8Real life – – 7Children’s programmes (made for TV) 9 11 5Movies/videos children’s family viewing 8 4 4Adult movies 6 1 4Adult drama – 2 4Children’s adventure sci-fi/horror unspecified 9 4 3Movies/videos unspecified 2 2 3None 2 1 3
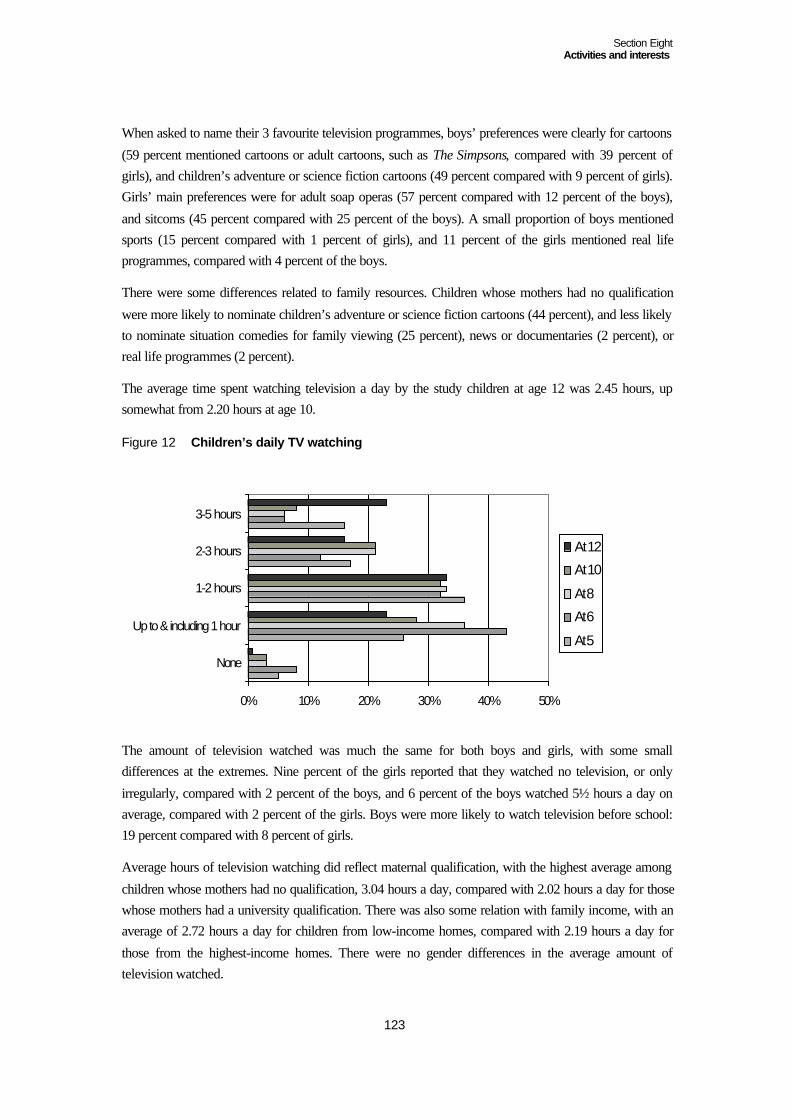
Section EightActivities and interests
123
When asked to name their 3 favourite television programmes, boys’ preferences were clearly for cartoons
(59 percent mentioned cartoons or adult cartoons, such as The Simpsons, compared with 39 percent ofgirls), and children’s adventure or science fiction cartoons (49 percent compared with 9 percent of girls).Girls’ main preferences were for adult soap operas (57 percent compared with 12 percent of the boys),
and sitcoms (45 percent compared with 25 percent of the boys). A small proportion of boys mentionedsports (15 percent compared with 1 percent of girls), and 11 percent of the girls mentioned real lifeprogrammes, compared with 4 percent of the boys.
There were some differences related to family resources. Children whose mothers had no qualification
were more likely to nominate children’s adventure or science fiction cartoons (44 percent), and less likelyto nominate situation comedies for family viewing (25 percent), news or documentaries (2 percent), orreal life programmes (2 percent).
The average time spent watching television a day by the study children at age 12 was 2.45 hours, upsomewhat from 2.20 hours at age 10.
Figure 12 Children’s daily TV watching
The amount of television watched was much the same for both boys and girls, with some smalldifferences at the extremes. Nine percent of the girls reported that they watched no television, or only
irregularly, compared with 2 percent of the boys, and 6 percent of the boys watched 5½ hours a day onaverage, compared with 2 percent of the girls. Boys were more likely to watch television before school:19 percent compared with 8 percent of girls.
Average hours of television watching did reflect maternal qualification, with the highest average among
children whose mothers had no qualification, 3.04 hours a day, compared with 2.02 hours a day for thosewhose mothers had a university qualification. There was also some relation with family income, with anaverage of 2.72 hours a day for children from low-income homes, compared with 2.19 hours a day for
those from the highest-income homes. There were no gender differences in the average amount oftelevision watched.
0% 10% 20% 30% 40% 50%
None
Up to & including 1 hour
1-2 hours
2-3 hours
3-5 hours
At 12
At 10
At 8
At 6
At 5
Section EightActivities and interests
124
Pasifika and Mäori children had the highest average hours watching television a week (2.97 and 2.68
hours respectively, compared with 2.41 for Päkehä/European and 1.66 for Asian children). Pasifikachildren were more likely to watch television before school (32 percent compared with 14 percentoverall). Preferences in television programmes were similar, with Mäori students somewhat less likely to
name sitcoms or family viewing among their 3 favourite programmes (21 percent compared with 34percent overall), and Asian students more likely to name news or documentaries (29 percent comparedwith 8 percent overall).
Children who had a television in their room were more likely to watch television for 2 hours or more a
day (66 percent compared with 39 percent of those without a television in their room). Children whoenjoyed reading were less likely to watch 4 or more hours a day (19 percent compared with 37 percent ofthose who had mixed views about reading, and 35 percent of those who disliked reading).
Fourteen percent of the children usually watched television before school, and 20 percent watched it
sometimes before they went to school. Twenty-two percent of the children whose mothers had noqualification usually watched television before school.39
Children who watched television before school tended to have higher average hours spent on television:3.42 hours (s.d. 1.65) for those who usually watched television before school, 2.84 (s.d. 1.32) for those
who sometimes watched it before school, and 2.11 hours (s.d. 1.33) for those who never watchedtelevision before breakfast. Children who watched television before they went to school were more likelyto have a television set in their bedroom (34 percent compared with 19 percent of those who did notwatch television before school).
In earlier phases of the study, we found some associations between the amount of television watched bychildren, and their mathematics and literacy scores. There was a stronger association between previouslevels of television use and current scores, than between current television use and current scores. At age
12, we found associations between children’s television watching and their competency levels for onlymathematics and writing. These favoured children who watched only an hour of television or less a day,after taking family income and maternal qualification levels into account. In Section Five, we reported thecumulative patterns of television use and their associations with children’s competency levels.
Computer use
Ninety percent of the study children had computers in their homes at age 12. Computer ownership was
associated with maternal qualification: ranging from 99 percent of the children whose mothers had auniversity qualification to 71 percent of those whose mothers had no qualification.
39 Just over half the children got up after 7am on school days (56 percent). Forty-three percent were awake between6–7am, and 2 percent, before 6am. Children who watched television before school were not earlier risers thanothers.
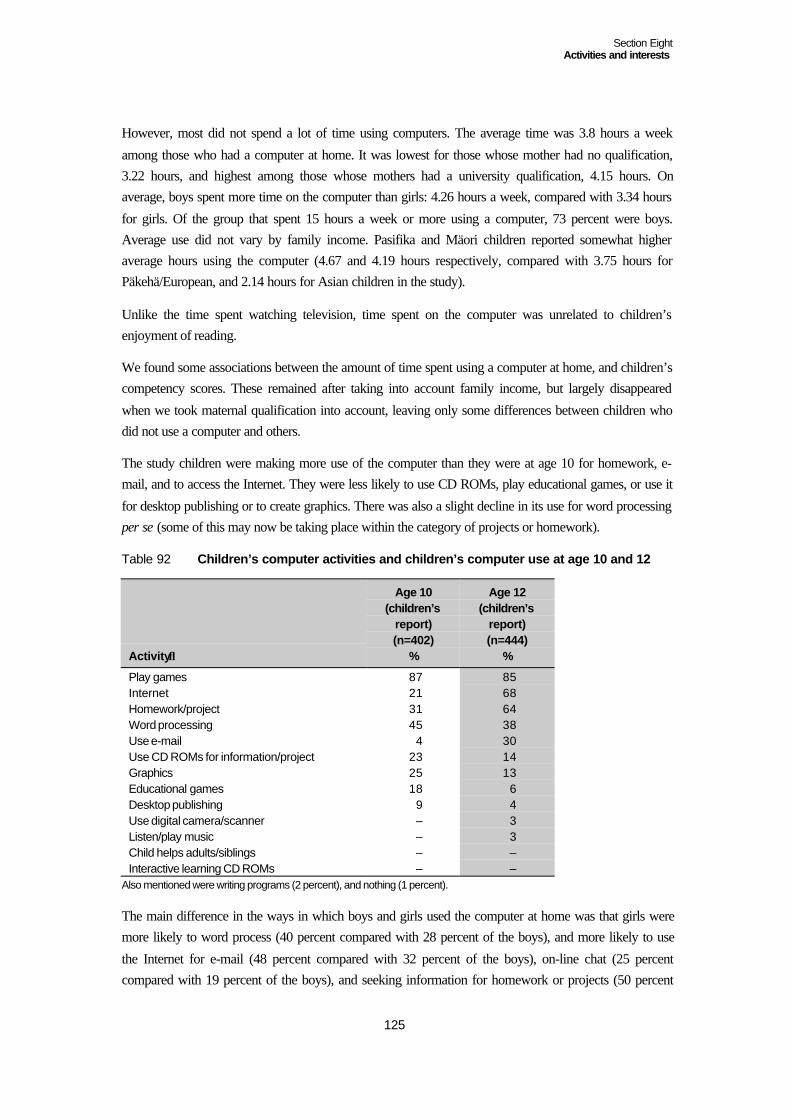
Section EightActivities and interests
125
However, most did not spend a lot of time using computers. The average time was 3.8 hours a week
among those who had a computer at home. It was lowest for those whose mother had no qualification,3.22 hours, and highest among those whose mothers had a university qualification, 4.15 hours. Onaverage, boys spent more time on the computer than girls: 4.26 hours a week, compared with 3.34 hours
for girls. Of the group that spent 15 hours a week or more using a computer, 73 percent were boys.Average use did not vary by family income. Pasifika and Mäori children reported somewhat higheraverage hours using the computer (4.67 and 4.19 hours respectively, compared with 3.75 hours forPäkehä/European, and 2.14 hours for Asian children in the study).
Unlike the time spent watching television, time spent on the computer was unrelated to children’senjoyment of reading.
We found some associations between the amount of time spent using a computer at home, and children’scompetency scores. These remained after taking into account family income, but largely disappeared
when we took maternal qualification into account, leaving only some differences between children whodid not use a computer and others.
The study children were making more use of the computer than they were at age 10 for homework, e-mail, and to access the Internet. They were less likely to use CD ROMs, play educational games, or use it
for desktop publishing or to create graphics. There was also a slight decline in its use for word processingper se (some of this may now be taking place within the category of projects or homework).
Table 92 Children’s computer activities and children’s computer use at age 10 and 12
Activity↓
Age 10(children’s
report)(n=402)
%
Age 12(children’s
report)(n=444)
%
Play games 87 85Internet 21 68Homework/project 31 64Word processing 45 38Use e-mail 4 30Use CD ROMs for information/project 23 14Graphics 25 13Educational games 18 6Desktop publishing 9 4Use digital camera/scanner – 3Listen/play music – 3Child helps adults/siblings – –Interactive learning CD ROMs – –
Also mentioned were writing programs (2 percent), and nothing (1 percent).
The main difference in the ways in which boys and girls used the computer at home was that girls weremore likely to word process (40 percent compared with 28 percent of the boys), and more likely to use
the Internet for e-mail (48 percent compared with 32 percent of the boys), on-line chat (25 percentcompared with 19 percent of the boys), and seeking information for homework or projects (50 percent

Section EightActivities and interests
126
compared with 41 percent of boys). Boys were more likely to use the Internet to download games or
music (29 percent compared with 14 percent of the girls), and for surfing (36 percent compared with 26percent).
Maternal qualification was associated with only 2 differences in patterns of computer use for those whohad a computer in their home. Forty-eight percent of those whose mothers had a university qualification
used e-mail, compared with 10 percent of those whose mothers had no qualification. Seventy-two percentof them used it for homework or projects, compared with 47 percent of those whose mothers had noqualification.
What difference does computer use make to children’s competency levels? We analysed each of the
activities we asked about, contrasting the average scores of those who said they used the computer thisway,40 and those who did not, within the group who had access to a home computer. We did find quite afew associations with all of these uses, but few which remained significant after taking family income
and maternal qualification into account. What this tells us is that the activities which do continue to showa significant association are ones which would be likely to do so for any child. However, the otheractivities are ones which are still worth noting, as they tell us something about the kinds of activities
which are more likely to be done by children who have the advantages of high levels of maternalqualification or family income, and which underpin the differences between children which emergestatistically as associated with these 2 key family resources.
The computer activities that did remain significant, particularly for mathematics and Communication,were:
Playing games on the computer
Those who played computer games had higher average scores for mathematics (10 percentage points)and Logical Problem-Solving (6 percentage points).
Word processing
Those children who used their home computer for word processing had higher average scores for SocialSkills with Adults (7 percentage points), and Communication (5 percentage points).
Those children who used their home computer for e-mail had higher average scores for Communication(6–7 percentage points).
Graphics
Those children who used their home computer for graphics had higher average scores forCommunication (7 percentage points) .
40 As with our other information on children’s activities at home, we do not know how often children do thesethings, so we cannot quantify the amount of time put into particular practices, or the level at which somethingmight be done.
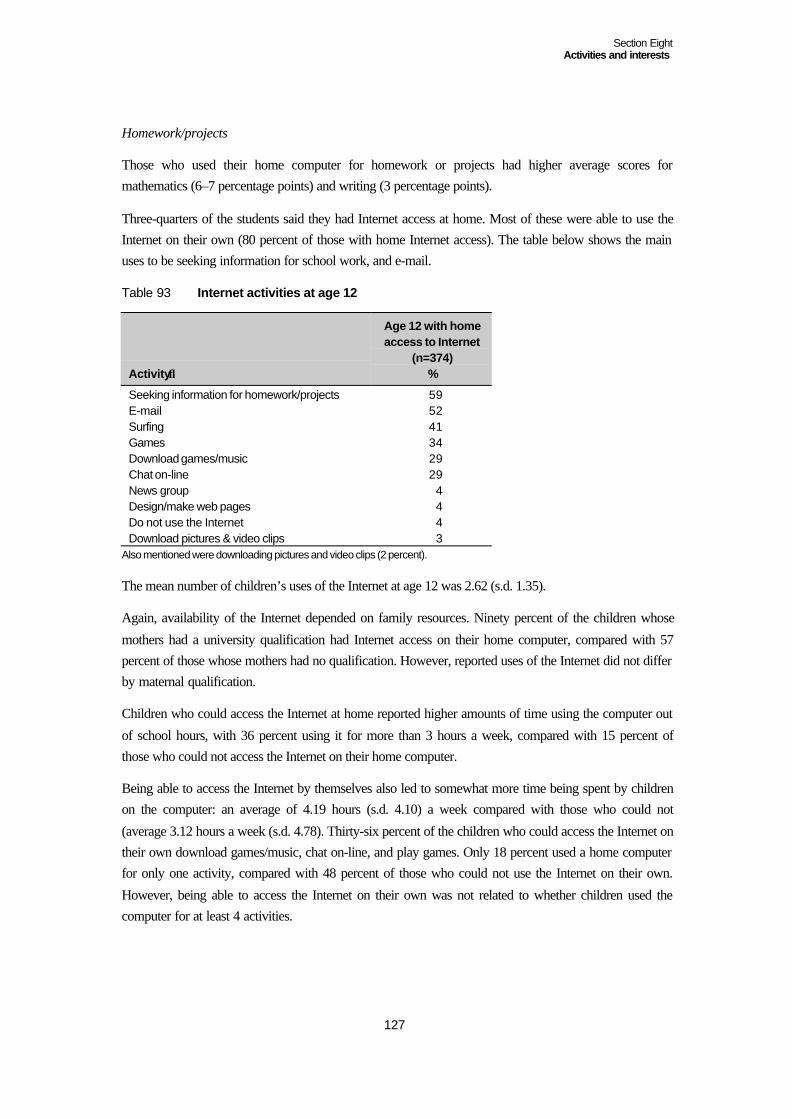
Section EightActivities and interests
127
Homework/projects
Those who used their home computer for homework or projects had higher average scores formathematics (6–7 percentage points) and writing (3 percentage points).
Three-quarters of the students said they had Internet access at home. Most of these were able to use theInternet on their own (80 percent of those with home Internet access). The table below shows the mainuses to be seeking information for school work, and e-mail.
Table 93 Internet activities at age 12
Activity↓
Age 12 with homeaccess to Internet
(n=374)%
Seeking information for homework/projects 59E-mail 52Surfing 41Games 34Download games/music 29Chat on-line 29News group 4Design/make web pages 4Do not use the Internet 4Download pictures & video clips 3
Also mentioned were downloading pictures and video clips (2 percent).
The mean number of children’s uses of the Internet at age 12 was 2.62 (s.d. 1.35).
Again, availability of the Internet depended on family resources. Ninety percent of the children whose
mothers had a university qualification had Internet access on their home computer, compared with 57percent of those whose mothers had no qualification. However, reported uses of the Internet did not differby maternal qualification.
Children who could access the Internet at home reported higher amounts of time using the computer out
of school hours, with 36 percent using it for more than 3 hours a week, compared with 15 percent ofthose who could not access the Internet on their home computer.
Being able to access the Internet by themselves also led to somewhat more time being spent by childrenon the computer: an average of 4.19 hours (s.d. 4.10) a week compared with those who could not
(average 3.12 hours a week (s.d. 4.78). Thirty-six percent of the children who could access the Internet ontheir own download games/music, chat on-line, and play games. Only 18 percent used a home computerfor only one activity, compared with 48 percent of those who could not use the Internet on their own.
However, being able to access the Internet on their own was not related to whether children used thecomputer for at least 4 activities.
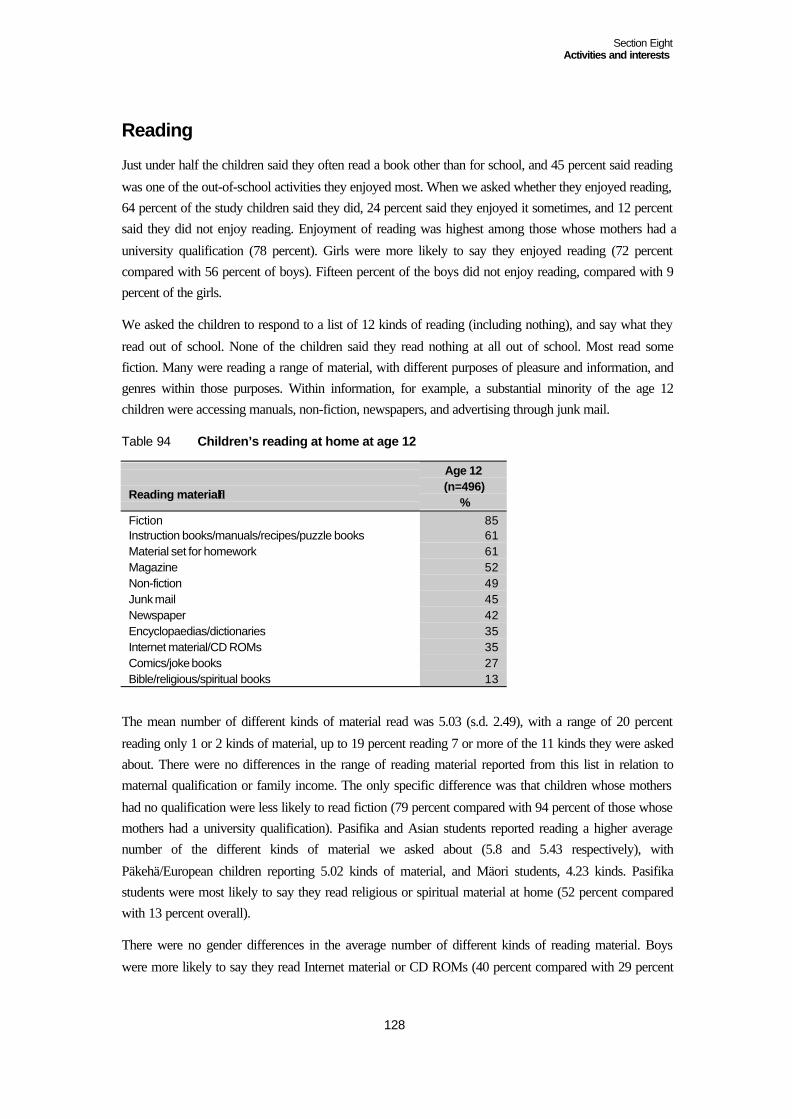
Section EightActivities and interests
128
Reading
Just under half the children said they often read a book other than for school, and 45 percent said reading
was one of the out-of-school activities they enjoyed most. When we asked whether they enjoyed reading,64 percent of the study children said they did, 24 percent said they enjoyed it sometimes, and 12 percentsaid they did not enjoy reading. Enjoyment of reading was highest among those whose mothers had a
university qualification (78 percent). Girls were more likely to say they enjoyed reading (72 percentcompared with 56 percent of boys). Fifteen percent of the boys did not enjoy reading, compared with 9percent of the girls.
We asked the children to respond to a list of 12 kinds of reading (including nothing), and say what they
read out of school. None of the children said they read nothing at all out of school. Most read somefiction. Many were reading a range of material, with different purposes of pleasure and information, andgenres within those purposes. Within information, for example, a substantial minority of the age 12children were accessing manuals, non-fiction, newspapers, and advertising through junk mail.
Table 94 Children’s reading at home at age 12
Reading material↓
Age 12(n=496)
%Fiction 85Instruction books/manuals/recipes/puzzle books 61Material set for homework 61Magazine 52Non-fiction 49Junk mail 45Newspaper 42Encyclopaedias/dictionaries 35Internet material/CD ROMs 35Comics/joke books 27Bible/religious/spiritual books 13
The mean number of different kinds of material read was 5.03 (s.d. 2.49), with a range of 20 percent
reading only 1 or 2 kinds of material, up to 19 percent reading 7 or more of the 11 kinds they were askedabout. There were no differences in the range of reading material reported from this list in relation tomaternal qualification or family income. The only specific difference was that children whose mothers
had no qualification were less likely to read fiction (79 percent compared with 94 percent of those whosemothers had a university qualification). Pasifika and Asian students reported reading a higher averagenumber of the different kinds of material we asked about (5.8 and 5.43 respectively), with
Päkehä/European children reporting 5.02 kinds of material, and Mäori students, 4.23 kinds. Pasifikastudents were most likely to say they read religious or spiritual material at home (52 percent comparedwith 13 percent overall).
There were no gender differences in the average number of different kinds of reading material. Boys
were more likely to say they read Internet material or CD ROMs (40 percent compared with 29 percent
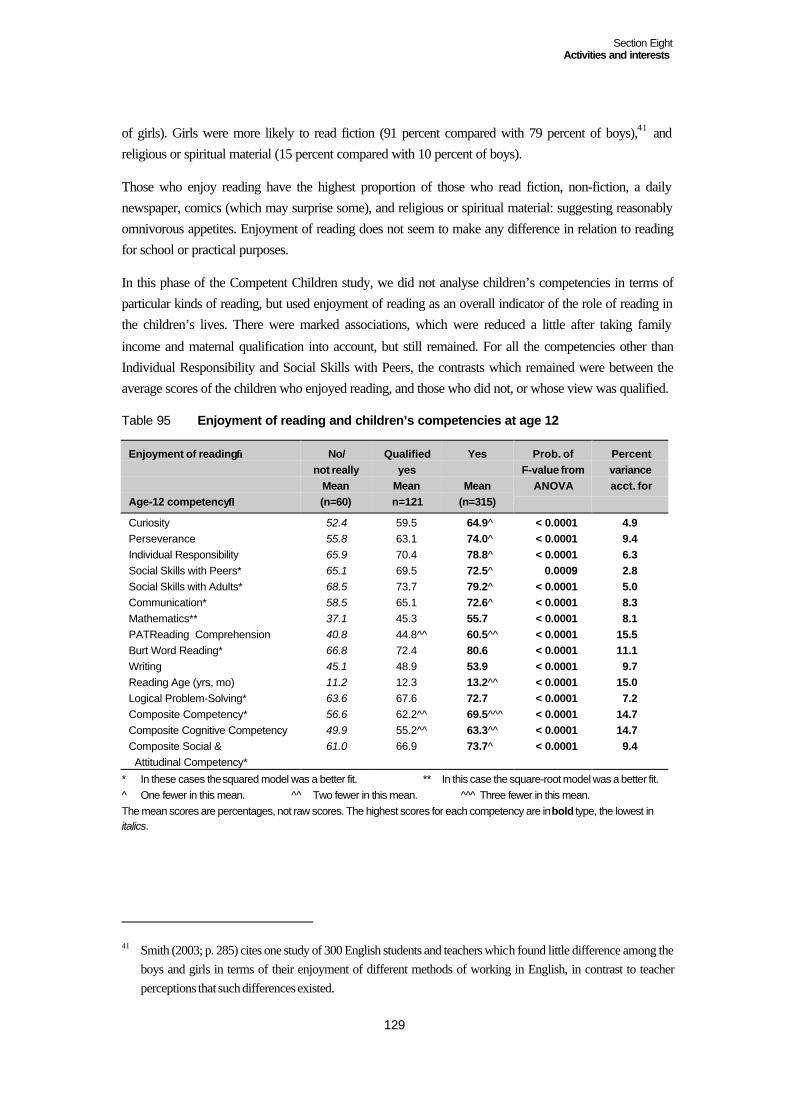
Section EightActivities and interests
129
of girls). Girls were more likely to read fiction (91 percent compared with 79 percent of boys),41 andreligious or spiritual material (15 percent compared with 10 percent of boys).
Those who enjoy reading have the highest proportion of those who read fiction, non-fiction, a dailynewspaper, comics (which may surprise some), and religious or spiritual material: suggesting reasonablyomnivorous appetites. Enjoyment of reading does not seem to make any difference in relation to readingfor school or practical purposes.
In this phase of the Competent Children study, we did not analyse children’s competencies in terms ofparticular kinds of reading, but used enjoyment of reading as an overall indicator of the role of reading inthe children’s lives. There were marked associations, which were reduced a little after taking family
income and maternal qualification into account, but still remained. For all the competencies other thanIndividual Responsibility and Social Skills with Peers, the contrasts which remained were between theaverage scores of the children who enjoyed reading, and those who did not, or whose view was qualified.
Table 95 Enjoyment of reading and children’s competencies at age 12
Enjoyment of reading→
Age-12 competency↓
No/not really
Mean(n=60)
Qualifiedyes
Meann=121
Yes
Mean(n=315)
Prob. ofF-value from
ANOVA
Percentvarianceacct. for
Curiosity 52.4 59.5 64.9^ < 0.0001 4.9Perseverance 55.8 63.1 74.0^ < 0.0001 9.4Individual Responsibility 65.9 70.4 78.8^ < 0.0001 6.3Social Skills with Peers* 65.1 69.5 72.5^ 0.0009 2.8Social Skills with Adults* 68.5 73.7 79.2^ < 0.0001 5.0Communication* 58.5 65.1 72.6^ < 0.0001 8.3Mathematics** 37.1 45.3 55.7 < 0.0001 8.1PATReading Comprehension 40.8 44.8^^ 60.5^^ < 0.0001 15.5Burt Word Reading* 66.8 72.4 80.6 < 0.0001 11.1Writing 45.1 48.9 53.9 < 0.0001 9.7Reading Age (yrs, mo) 11.2 12.3 13.2^^ < 0.0001 15.0Logical Problem-Solving* 63.6 67.6 72.7 < 0.0001 7.2Composite Competency* 56.6 62.2^^ 69.5^^^ < 0.0001 14.7Composite Cognitive Competency 49.9 55.2^^ 63.3^^ < 0.0001 14.7Composite Social & Attitudinal Competency*
61.0 66.9 73.7^ < 0.0001 9.4
* In these cases the squared model was a better fit. ** In this case the square-root model was a better fit.^ One fewer in this mean. ^^ Two fewer in this mean. ^^ ̂ Three fewer in this mean.The mean scores are percentages, not raw scores. The highest scores for each competency are in bold type, the lowest initalics.
41 Smith (2003; p. 285) cites one study of 300 English students and teachers which found little difference among theboys and girls in terms of their enjoyment of different methods of working in English, in contrast to teacherperceptions that such differences existed.
Section EightActivities and interests
130
Children talking about their readingMost of the children said they spoke to someone at home about what they were reading (72 percent).Fifty-four percent spoke with their mother, and 25 percent, with their father. Thirteen percent mentioneda sibling, and 3 percent, a relative or other adult. Boys were less likely to talk to someone at home aboutwhat they were reading (32 percent did not, compared with 23 percent of girls).
Children whose mothers had no qualification were least likely to say they talked to someone at homeabout their reading (41 percent). Children who enjoyed reading were most likely to talk to their mother,father, or a sibling. Sixty-three percent said they spoke to their mother about their reading, compared with
44 percent of those who said they had mixed feelings about reading, and 27 percent of those who did notenjoy reading.
Parental reports gave a more nuanced picture. Forty-six percent said their child talked to them about whatthey were reading, and 23 percent said they did sometimes. Thirty-one percent said their child did not talk
to them about what they were reading. The proportion of those who did talk to their parents (regularly)was in fact consistent across maternal qualification levels.
But there was a relationship with maternal qualification in terms of the remaining children. Theproportion of those whose parents reported that they did not talk to them about their reading increased
from 20 percent of children of mothers with a university qualification not talking to parents about whatthey were reading, to 44 percent of those whose mothers had no qualification. The trend was reversedwith those who sometimes talked to their parent about what they were reading, from 30 percent of
children whose mother had a university qualification, to 9 percent of those whose mothers had noqualification.
After taking family income and maternal qualification into account, children who did not talk to theirparents about what they were reading had lower average scores than those who did for all the
competencies other than Curiosity, Social Skills with Peers, and Social Skills with Adults. There was afurther distinction favouring those who usually talked to their parents about what they were reading overthose who talked only sometimes, for the PAT Reading Comprehension test, Reading Age, and LogicalProblem-Solving.
Public library useThree-quarters of the children said they visited the public library. Most went with their family (61percent). Fifteen percent went by themselves, and 13 percent, with friends. Five percent went with their
school. Public library use was lowest among those whose mothers had no qualification (62 percent), andthose who did not enjoy reading (45 percent). Thirty-one percent of boys said they did not go to thepublic library, compared with 19 percent of girls. However, those who did go, visited the library as
frequently as the girls. Pasifika children in the study were more likely to take books home from thelibrary once a week or more often (42 percent compared with 17 percent overall); since we did notspecify a public library, this probably included reading material taken home from the school library.
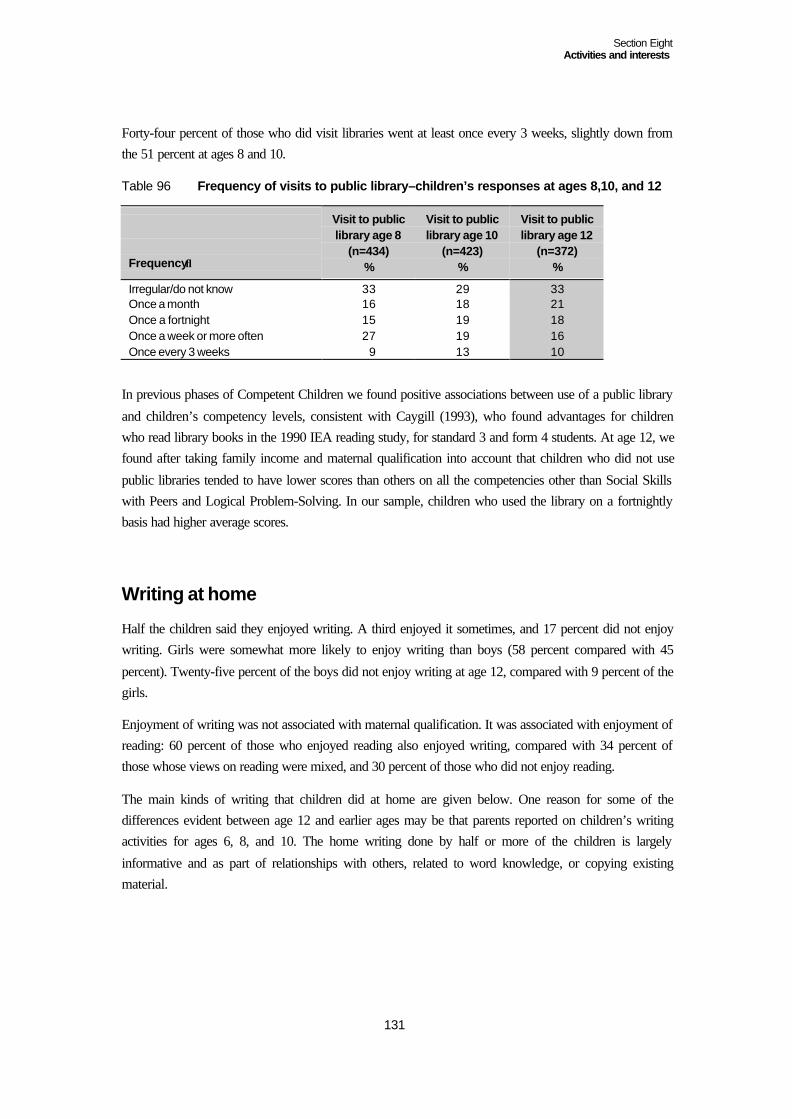
Section EightActivities and interests
131
Forty-four percent of those who did visit libraries went at least once every 3 weeks, slightly down fromthe 51 percent at ages 8 and 10.
Table 96 Frequency of visits to public library–children’s responses at ages 8,10, and 12
Frequency↓
Visit to publiclibrary age 8
(n=434)%
Visit to publiclibrary age 10
(n=423)%
Visit to publiclibrary age 12
(n=372)%
Irregular/do not know 33 29 33Once a month 16 18 21Once a fortnight 15 19 18Once a week or more often 27 19 16Once every 3 weeks 9 13 10
In previous phases of Competent Children we found positive associations between use of a public library
and children’s competency levels, consistent with Caygill (1993), who found advantages for childrenwho read library books in the 1990 IEA reading study, for standard 3 and form 4 students. At age 12, wefound after taking family income and maternal qualification into account that children who did not use
public libraries tended to have lower scores than others on all the competencies other than Social Skillswith Peers and Logical Problem-Solving. In our sample, children who used the library on a fortnightlybasis had higher average scores.
Writing at home
Half the children said they enjoyed writing. A third enjoyed it sometimes, and 17 percent did not enjoywriting. Girls were somewhat more likely to enjoy writing than boys (58 percent compared with 45
percent). Twenty-five percent of the boys did not enjoy writing at age 12, compared with 9 percent of thegirls.
Enjoyment of writing was not associated with maternal qualification. It was associated with enjoyment ofreading: 60 percent of those who enjoyed reading also enjoyed writing, compared with 34 percent ofthose whose views on reading were mixed, and 30 percent of those who did not enjoy reading.
The main kinds of writing that children did at home are given below. One reason for some of thedifferences evident between age 12 and earlier ages may be that parents reported on children’s writingactivities for ages 6, 8, and 10. The home writing done by half or more of the children is largely
informative and as part of relationships with others, related to word knowledge, or copying existingmaterial.

Section EightActivities and interests
132
Table 97 Children’s home writing activities at ages 6, 8,10, and 12
Writing activity↓
Age 6(n=297)
%
Age 8(n=521)
%
Age 10(n=505)
%
Age 12(n=496)
%
Does word puzzles/crosswords – 76 79 61Writes to family/friends – 82 70 51Copies material 80 82 76 49Writes e-mails – – – 49Writes short imaginative stories under 2 pages – 60 60 42Keeps a journal/diary 3 34 41 31Writes reports (factual writing) – 40 57 29Writes poems/plays – 47 47 24Writes long imaginative stories over 2 pages – 20 20 19Writes lists 90 21 – –
– = not asked.
Girls did more writing at home than boys. They averaged 4.23 of the activities we asked about, and boys,3.13. Girls were more likely to:
• write letters to family or friends (68 percent compared with 36 percent of boys);
• write stories of 1–2 pages (50 percent compared with 34 percent of boys);• keep a journal or diary (51 percent compared with 14 percent of boys);• write poems or plays (33 percent compared with 16 percent of boys); and• write e-mails (57 percent compared with 42 percent of boys).
However, boys were just as likely as girls to write reports and longer stories, do word puzzles orcrosswords, or copy material.
Girls had higher average marks for 6 of the 8 features of writing we marked, other than choice ofvocabulary and form, where boys performed much the same as girls.
Children whose mothers had no qualification were less likely to write reports (15 percent), or e-mails (32
percent). However, they were more likely than those whose mothers had a tertiary, trade, or universityqualification to keep a journal or diary (43 percent compared with 26 percent). There were no ethnicdifferences in the average number of writing activities reported by the study children. Pasifika studentswere more likely to keep a journal or diary (52 percent compared with 31 percent overall).
Children who enjoyed writing were most likely to write letters, write stories (short and long), keep ajournal or diary, or write poems or plays. The kinds of writing that were unrelated to enjoyment wereeither for communication, or reporting.42
42 There was also no distinction in relation to doing word puzzles or crosswords, an activity which was included inthis question at earlier ages as a mark of children using writing to denote their understanding, but which makesless sense to include at this age as children are able to use writing for a wider range of expression andcommunication.
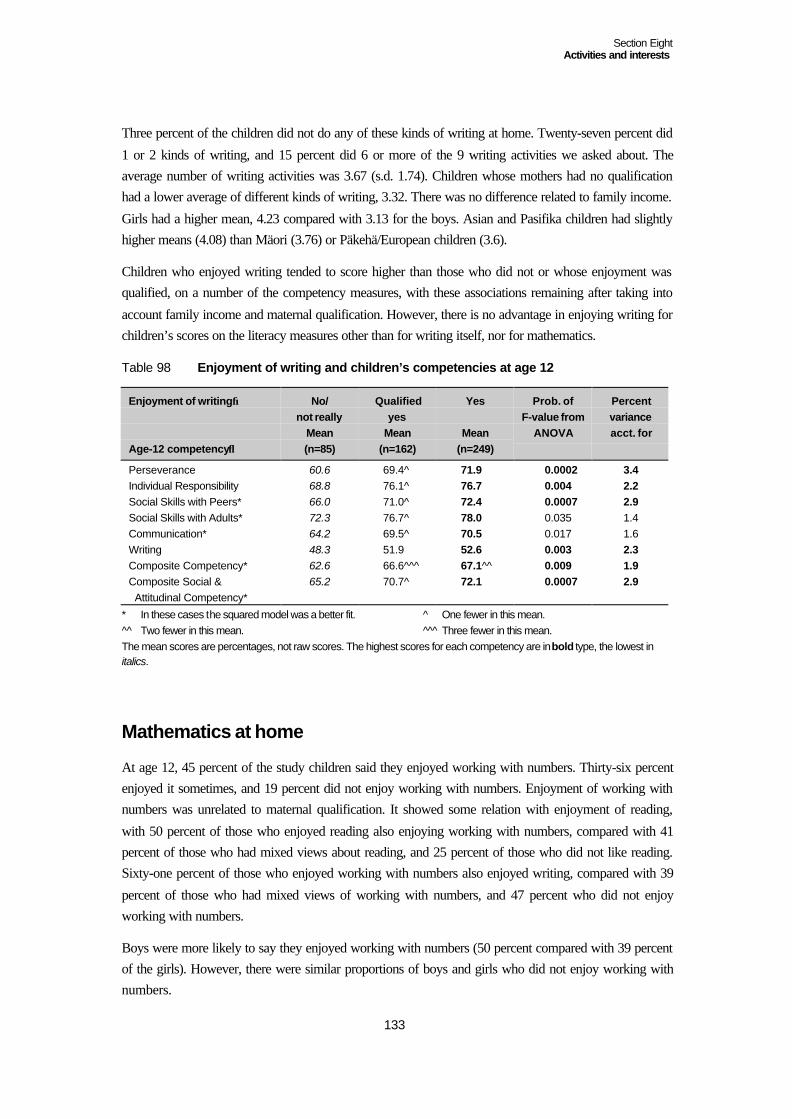
Section EightActivities and interests
133
Three percent of the children did not do any of these kinds of writing at home. Twenty-seven percent did
1 or 2 kinds of writing, and 15 percent did 6 or more of the 9 writing activities we asked about. Theaverage number of writing activities was 3.67 (s.d. 1.74). Children whose mothers had no qualificationhad a lower average of different kinds of writing, 3.32. There was no difference related to family income.
Girls had a higher mean, 4.23 compared with 3.13 for the boys. Asian and Pasifika children had slightlyhigher means (4.08) than Mäori (3.76) or Päkehä/European children (3.6).
Children who enjoyed writing tended to score higher than those who did not or whose enjoyment wasqualified, on a number of the competency measures, with these associations remaining after taking into
account family income and maternal qualification. However, there is no advantage in enjoying writing forchildren’s scores on the literacy measures other than for writing itself, nor for mathematics.
Table 98 Enjoyment of writing and children’s competencies at age 12
Enjoyment of writing→
Age-12 competency↓
No/not really
Mean(n=85)
Qualifiedyes
Mean(n=162)
Yes
Mean(n=249)
Prob. ofF-value from
ANOVA
Percentvarianceacct. for
Perseverance 60.6 69.4^ 71.9 0.0002 3.4Individual Responsibility 68.8 76.1^ 76.7 0.004 2.2Social Skills with Peers* 66.0 71.0^ 72.4 0.0007 2.9Social Skills with Adults* 72.3 76.7^ 78.0 0.035 1.4Communication* 64.2 69.5^ 70.5 0.017 1.6Writing 48.3 51.9 52.6 0.003 2.3Composite Competency* 62.6 66.6^^^ 67.1^^ 0.009 1.9Composite Social & Attitudinal Competency*
65.2 70.7^ 72.1 0.0007 2.9
* In these cases the squared model was a better fit. ^ One fewer in this mean.^^ Two fewer in this mean. ^^ ̂ Three fewer in this mean.The mean scores are percentages, not raw scores. The highest scores for each competency are in bold type, the lowest initalics.
Mathematics at home
At age 12, 45 percent of the study children said they enjoyed working with numbers. Thirty-six percentenjoyed it sometimes, and 19 percent did not enjoy working with numbers. Enjoyment of working withnumbers was unrelated to maternal qualification. It showed some relation with enjoyment of reading,
with 50 percent of those who enjoyed reading also enjoying working with numbers, compared with 41percent of those who had mixed views about reading, and 25 percent of those who did not like reading.Sixty-one percent of those who enjoyed working with numbers also enjoyed writing, compared with 39
percent of those who had mixed views of working with numbers, and 47 percent who did not enjoyworking with numbers.
Boys were more likely to say they enjoyed working with numbers (50 percent compared with 39 percentof the girls). However, there were similar proportions of boys and girls who did not enjoy working withnumbers.
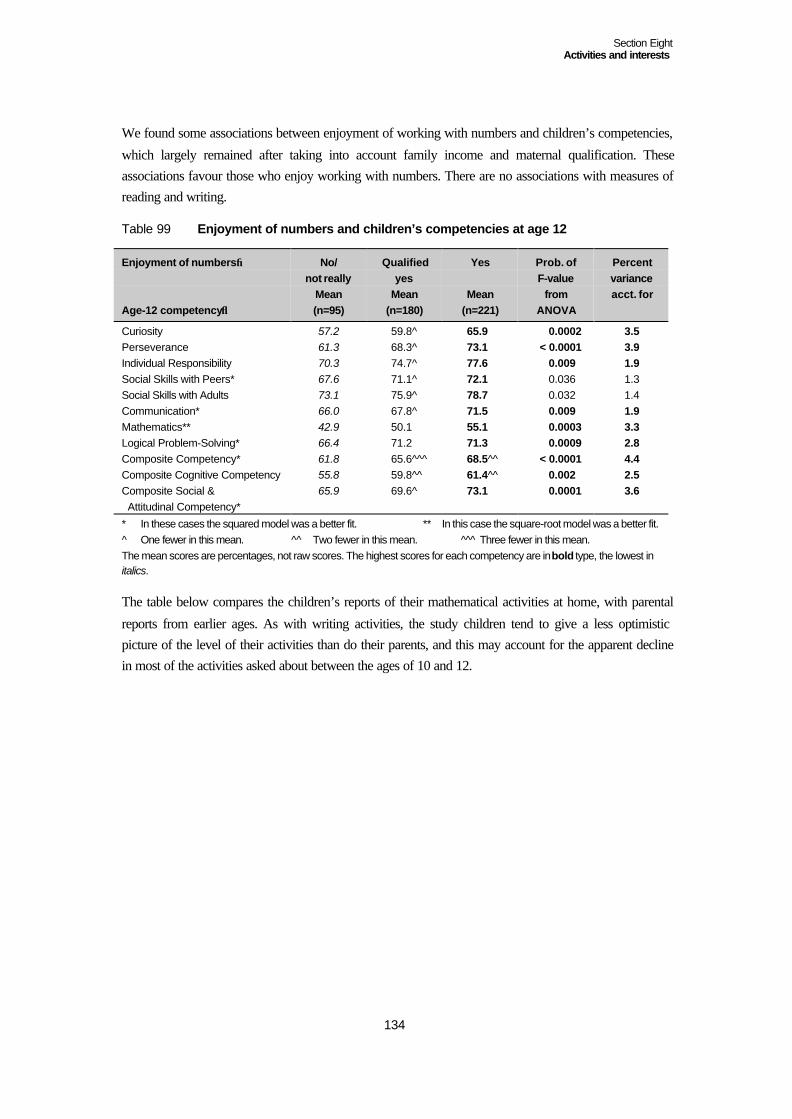
Section EightActivities and interests
134
We found some associations between enjoyment of working with numbers and children’s competencies,
which largely remained after taking into account family income and maternal qualification. Theseassociations favour those who enjoy working with numbers. There are no associations with measures ofreading and writing.
Table 99 Enjoyment of numbers and children’s competencies at age 12
Enjoyment of numbers→
Age-12 competency↓
No/not really
Mean(n=95)
Qualifiedyes
Mean(n=180)
Yes
Mean(n=221)
Prob. ofF-value
fromANOVA
Percentvarianceacct. for
Curiosity 57.2 59.8^ 65.9 0.0002 3.5Perseverance 61.3 68.3^ 73.1 < 0.0001 3.9Individual Responsibility 70.3 74.7^ 77.6 0.009 1.9Social Skills with Peers* 67.6 71.1^ 72.1 0.036 1.3Social Skills with Adults 73.1 75.9^ 78.7 0.032 1.4Communication* 66.0 67.8^ 71.5 0.009 1.9Mathematics** 42.9 50.1 55.1 0.0003 3.3Logical Problem-Solving* 66.4 71.2 71.3 0.0009 2.8Composite Competency* 61.8 65.6^^^ 68.5^^ < 0.0001 4.4Composite Cognitive Competency 55.8 59.8^^ 61.4^^ 0.002 2.5Composite Social & Attitudinal Competency*
65.9 69.6^ 73.1 0.0001 3.6
* In these cases the squared model was a better fit. ** In this case the square-root model was a better fit.^ One fewer in this mean. ^^ Two fewer in this mean. ^^ ̂ Three fewer in this mean.The mean scores are percentages, not raw scores. The highest scores for each competency are in bold type, the lowest initalics.
The table below compares the children’s reports of their mathematical activities at home, with parental
reports from earlier ages. As with writing activities, the study children tend to give a less optimisticpicture of the level of their activities than do their parents, and this may account for the apparent declinein most of the activities asked about between the ages of 10 and 12.
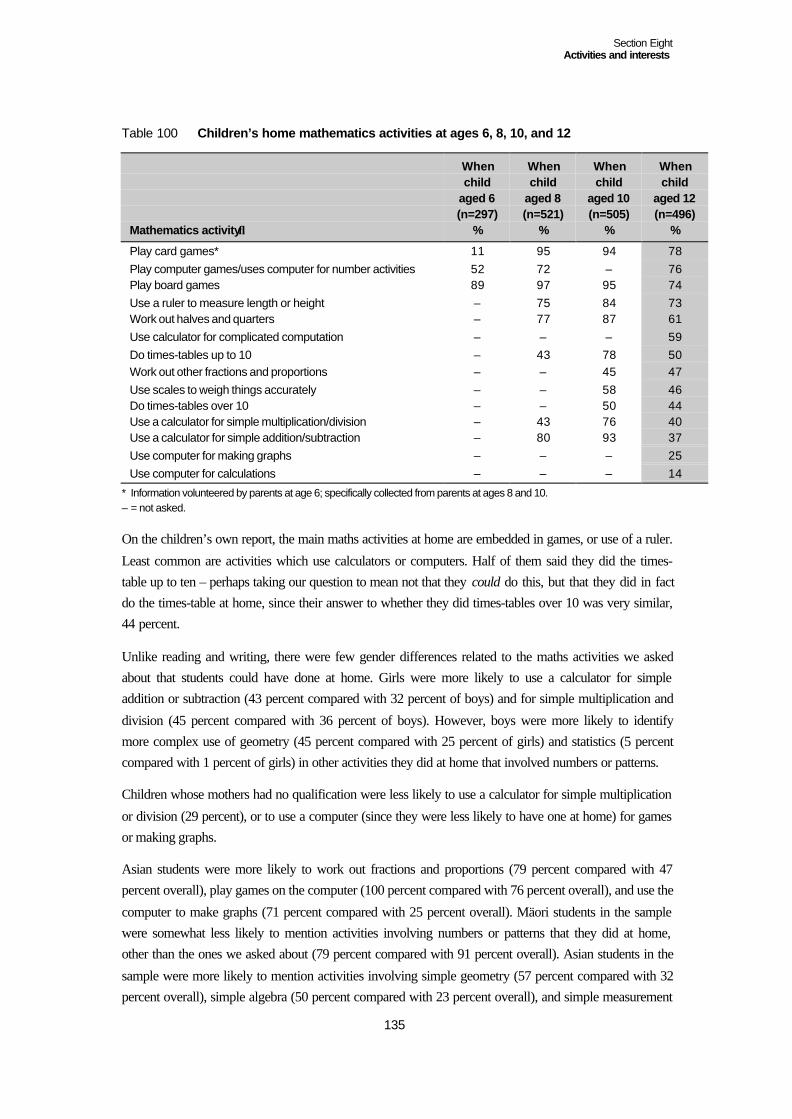
Section EightActivities and interests
135
Table 100 Children’s home mathematics activities at ages 6, 8, 10, and 12
Mathematics activity↓
Whenchild
aged 6(n=297)
%
Whenchild
aged 8(n=521)
%
Whenchild
aged 10(n=505)
%
Whenchild
aged 12(n=496)
%
Play card games* 11 95 94 78Play computer games/uses computer for number activities 52 72 – 76Play board games 89 97 95 74Use a ruler to measure length or height – 75 84 73Work out halves and quarters – 77 87 61Use calculator for complicated computation – – – 59Do times-tables up to 10 – 43 78 50Work out other fractions and proportions – – 45 47Use scales to weigh things accurately – – 58 46Do times-tables over 10 – – 50 44Use a calculator for simple multiplication/division – 43 76 40Use a calculator for simple addition/subtraction – 80 93 37Use computer for making graphs – – – 25Use computer for calculations – – – 14
* Information volunteered by parents at age 6; specifically collected from parents at ages 8 and 10.– = not asked.
On the children’s own report, the main maths activities at home are embedded in games, or use of a ruler.
Least common are activities which use calculators or computers. Half of them said they did the times-table up to ten – perhaps taking our question to mean not that they could do this, but that they did in factdo the times-table at home, since their answer to whether they did times-tables over 10 was very similar,44 percent.
Unlike reading and writing, there were few gender differences related to the maths activities we askedabout that students could have done at home. Girls were more likely to use a calculator for simpleaddition or subtraction (43 percent compared with 32 percent of boys) and for simple multiplication and
division (45 percent compared with 36 percent of boys). However, boys were more likely to identifymore complex use of geometry (45 percent compared with 25 percent of girls) and statistics (5 percentcompared with 1 percent of girls) in other activities they did at home that involved numbers or patterns.
Children whose mothers had no qualification were less likely to use a calculator for simple multiplication
or division (29 percent), or to use a computer (since they were less likely to have one at home) for gamesor making graphs.
Asian students were more likely to work out fractions and proportions (79 percent compared with 47percent overall), play games on the computer (100 percent compared with 76 percent overall), and use the
computer to make graphs (71 percent compared with 25 percent overall). Mäori students in the samplewere somewhat less likely to mention activities involving numbers or patterns that they did at home,other than the ones we asked about (79 percent compared with 91 percent overall). Asian students in the
sample were more likely to mention activities involving simple geometry (57 percent compared with 32percent overall), simple algebra (50 percent compared with 23 percent overall), and simple measurement
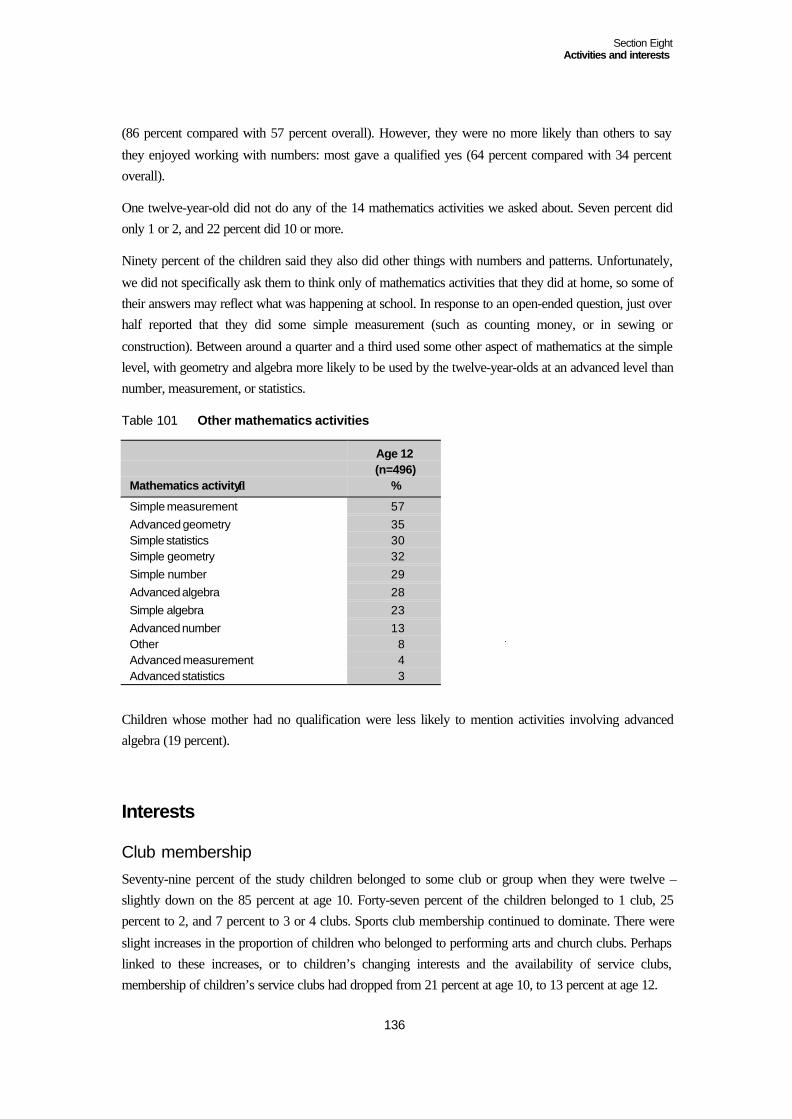
Section EightActivities and interests
136
(86 percent compared with 57 percent overall). However, they were no more likely than others to say
they enjoyed working with numbers: most gave a qualified yes (64 percent compared with 34 percentoverall).
One twelve-year-old did not do any of the 14 mathematics activities we asked about. Seven percent didonly 1 or 2, and 22 percent did 10 or more.
Ninety percent of the children said they also did other things with numbers and patterns. Unfortunately,
we did not specifically ask them to think only of mathematics activities that they did at home, so some oftheir answers may reflect what was happening at school. In response to an open-ended question, just overhalf reported that they did some simple measurement (such as counting money, or in sewing or
construction). Between around a quarter and a third used some other aspect of mathematics at the simplelevel, with geometry and algebra more likely to be used by the twelve-year-olds at an advanced level thannumber, measurement, or statistics.
Table 101 Other mathematics activities
Mathematics activity↓
Age 12(n=496)
%
Simple measurement 57Advanced geometry 35Simple statistics 30Simple geometry 32Simple number 29Advanced algebra 28Simple algebra 23Advanced number 13Other 8Advanced measurement 4Advanced statistics 3
Children whose mother had no qualification were less likely to mention activities involving advancedalgebra (19 percent).
Interests
Club membership
Seventy-nine percent of the study children belonged to some club or group when they were twelve –slightly down on the 85 percent at age 10. Forty-seven percent of the children belonged to 1 club, 25percent to 2, and 7 percent to 3 or 4 clubs. Sports club membership continued to dominate. There were
slight increases in the proportion of children who belonged to performing arts and church clubs. Perhapslinked to these increases, or to children’s changing interests and the availability of service clubs,membership of children’s service clubs had dropped from 21 percent at age 10, to 13 percent at age 12.
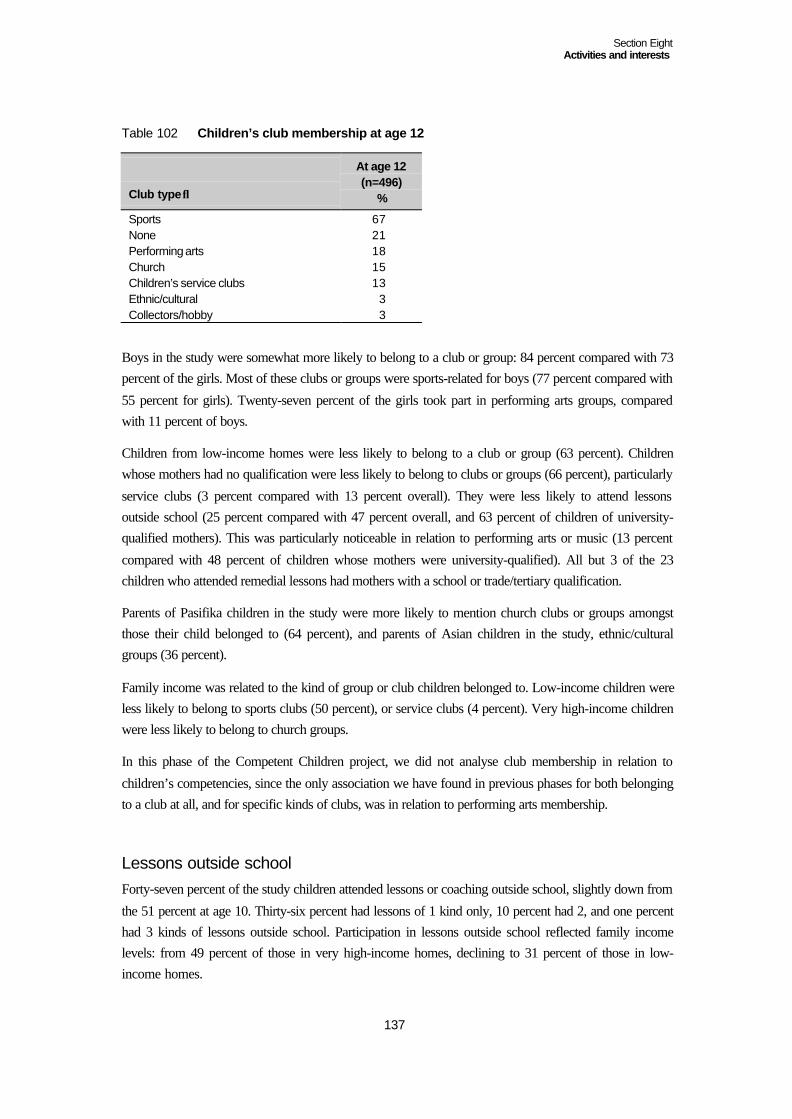
Section EightActivities and interests
137
Table 102 Children’s club membership at age 12
Club type ↓
At age 12(n=496)
%
Sports 67None 21Performing arts 18Church 15Children’s service clubs 13Ethnic/cultural 3Collectors/hobby 3
Boys in the study were somewhat more likely to belong to a club or group: 84 percent compared with 73percent of the girls. Most of these clubs or groups were sports-related for boys (77 percent compared with
55 percent for girls). Twenty-seven percent of the girls took part in performing arts groups, comparedwith 11 percent of boys.
Children from low-income homes were less likely to belong to a club or group (63 percent). Childrenwhose mothers had no qualification were less likely to belong to clubs or groups (66 percent), particularly
service clubs (3 percent compared with 13 percent overall). They were less likely to attend lessonsoutside school (25 percent compared with 47 percent overall, and 63 percent of children of university-qualified mothers). This was particularly noticeable in relation to performing arts or music (13 percent
compared with 48 percent of children whose mothers were university-qualified). All but 3 of the 23children who attended remedial lessons had mothers with a school or trade/tertiary qualification.
Parents of Pasifika children in the study were more likely to mention church clubs or groups amongstthose their child belonged to (64 percent), and parents of Asian children in the study, ethnic/culturalgroups (36 percent).
Family income was related to the kind of group or club children belonged to. Low-income children wereless likely to belong to sports clubs (50 percent), or service clubs (4 percent). Very high-income childrenwere less likely to belong to church groups.
In this phase of the Competent Children project, we did not analyse club membership in relation to
children’s competencies, since the only association we have found in previous phases for both belongingto a club at all, and for specific kinds of clubs, was in relation to performing arts membership.
Lessons outside schoolForty-seven percent of the study children attended lessons or coaching outside school, slightly down from
the 51 percent at age 10. Thirty-six percent had lessons of 1 kind only, 10 percent had 2, and one percenthad 3 kinds of lessons outside school. Participation in lessons outside school reflected family incomelevels: from 49 percent of those in very high-income homes, declining to 31 percent of those in low-income homes.

Section EightActivities and interests
138
Here, performing arts dominate (30 percent), followed by sports (18 percent, slightly down on the 23
percent at age 10). Five percent were attending remedial school-related subjects, and 2 percent, schoolsubjects for “gifted” students. Three percent had lessons in the fine arts, and 2 percent, classes related to aparticular culture or ethnic group.
Girls were more likely to have lessons in the performing arts: 56 percent compared with 39 percent of the
boys. While girls and boys were equally likely to attend sports lessons, performing arts lessons were themain reason for girls having an overall higher participation in lessons (39 percent of girls compared with21 percent of boys). The higher the level of maternal qualification and family income, the more likely
was it that study children would attend lessons outside school. Asian children in the study were also morelikely to attend lessons outside school than children from other ethnic backgrounds.
Table 103 Family characteristics and children’s lessons outside school
Lessons outside school %
Income %Very high 57High 49Medium 43Low 31Maternal qualification %None 25School 44Tertiary/trades 50University 63Ethnicity %Päkehä/European 48Mäori 37Pasifika 40Asian 71
Family characteristics also showed some relations with the kinds of lessons that children took part in. The
higher the family income, the more likely it was that children would undertake lessons in any of thecategories other than cultural. Maternal qualification was unrelated to whether children took sportslessons, or classes related to a particular culture or ethnicity. The higher the level of maternal
qualification, the more likely it was that children would undertake music or performing arts lessons(rising from 13 percent of the children whose mothers had no qualification, to 48 percent of those whosemother had a university qualification), or school subjects for gifted children (rising from none of those
whose mothers had no qualification to 4 percent of those whose mothers had a university qualification).Taking remedial school subjects was most likely for children whose mothers had either a school ortertiary/trades qualification.
Music
Forty-nine percent of the study children played a musical instrument or took part in a musical group,according to their parents. Ten percent engaged in 2 different musical activities, and 1 percent, in 4.
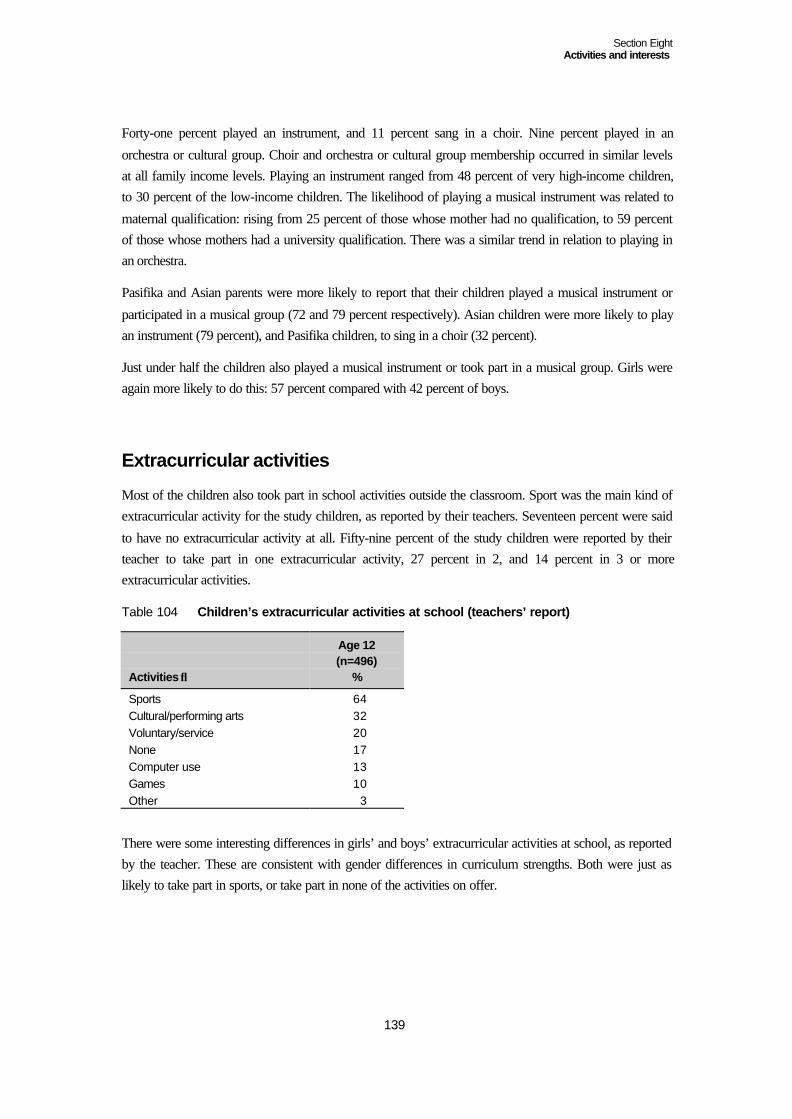
Section EightActivities and interests
139
Forty-one percent played an instrument, and 11 percent sang in a choir. Nine percent played in an
orchestra or cultural group. Choir and orchestra or cultural group membership occurred in similar levelsat all family income levels. Playing an instrument ranged from 48 percent of very high-income children,to 30 percent of the low-income children. The likelihood of playing a musical instrument was related to
maternal qualification: rising from 25 percent of those whose mother had no qualification, to 59 percentof those whose mothers had a university qualification. There was a similar trend in relation to playing inan orchestra.
Pasifika and Asian parents were more likely to report that their children played a musical instrument or
participated in a musical group (72 and 79 percent respectively). Asian children were more likely to playan instrument (79 percent), and Pasifika children, to sing in a choir (32 percent).
Just under half the children also played a musical instrument or took part in a musical group. Girls wereagain more likely to do this: 57 percent compared with 42 percent of boys.
Extracurricular activities
Most of the children also took part in school activities outside the classroom. Sport was the main kind ofextracurricular activity for the study children, as reported by their teachers. Seventeen percent were said
to have no extracurricular activity at all. Fifty-nine percent of the study children were reported by theirteacher to take part in one extracurricular activity, 27 percent in 2, and 14 percent in 3 or moreextracurricular activities.
Table 104 Children’s extracurricular activities at school (teachers’ report)
Activities ↓
Age 12(n=496)
%
Sports 64Cultural/performing arts 32Voluntary/service 20None 17Computer use 13Games 10Other 3
There were some interesting differences in girls’ and boys’ extracurricular activities at school, as reportedby the teacher. These are consistent with gender differences in curriculum strengths. Both were just aslikely to take part in sports, or take part in none of the activities on offer.
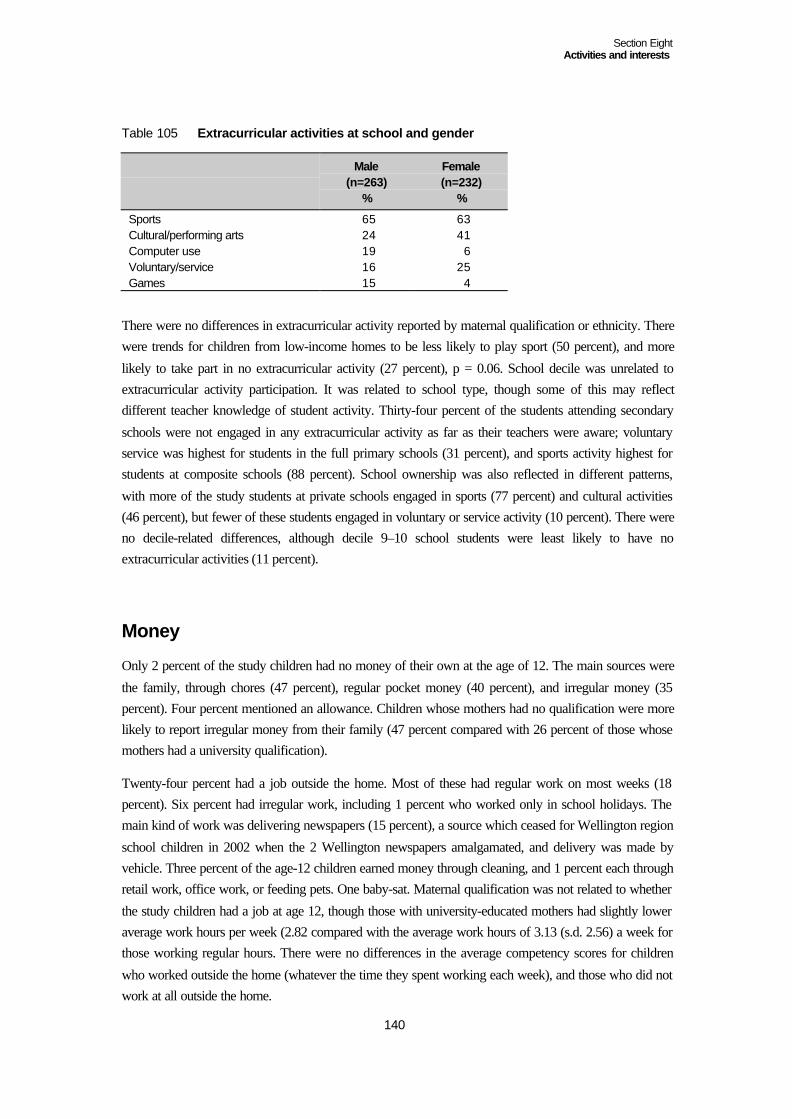
Section EightActivities and interests
140
Table 105 Extracurricular activities at school and gender
Male(n=263)
%
Female(n=232)
%
Sports 65 63Cultural/performing arts 24 41Computer use 19 6Voluntary/service 16 25Games 15 4
There were no differences in extracurricular activity reported by maternal qualification or ethnicity. Therewere trends for children from low-income homes to be less likely to play sport (50 percent), and more
likely to take part in no extracurricular activity (27 percent), p = 0.06. School decile was unrelated toextracurricular activity participation. It was related to school type, though some of this may reflectdifferent teacher knowledge of student activity. Thirty-four percent of the students attending secondary
schools were not engaged in any extracurricular activity as far as their teachers were aware; voluntaryservice was highest for students in the full primary schools (31 percent), and sports activity highest forstudents at composite schools (88 percent). School ownership was also reflected in different patterns,
with more of the study students at private schools engaged in sports (77 percent) and cultural activities(46 percent), but fewer of these students engaged in voluntary or service activity (10 percent). There wereno decile-related differences, although decile 9–10 school students were least likely to have noextracurricular activities (11 percent).
Money
Only 2 percent of the study children had no money of their own at the age of 12. The main sources were
the family, through chores (47 percent), regular pocket money (40 percent), and irregular money (35percent). Four percent mentioned an allowance. Children whose mothers had no qualification were morelikely to report irregular money from their family (47 percent compared with 26 percent of those whosemothers had a university qualification).
Twenty-four percent had a job outside the home. Most of these had regular work on most weeks (18percent). Six percent had irregular work, including 1 percent who worked only in school holidays. Themain kind of work was delivering newspapers (15 percent), a source which ceased for Wellington region
school children in 2002 when the 2 Wellington newspapers amalgamated, and delivery was made byvehicle. Three percent of the age-12 children earned money through cleaning, and 1 percent each throughretail work, office work, or feeding pets. One baby-sat. Maternal qualification was not related to whether
the study children had a job at age 12, though those with university-educated mothers had slightly loweraverage work hours per week (2.82 compared with the average work hours of 3.13 (s.d. 2.56) a week forthose working regular hours. There were no differences in the average competency scores for children
who worked outside the home (whatever the time they spent working each week), and those who did notwork at all outside the home.
Section EightActivities and interests
141
Saving was the most frequent use of money earned or given (76 percent). Thirty-five percent bought
food, 32 percent bought games or toys, 25 percent clothes or make-up, and 14 percent each boughtpossessions such as stereos, or spent money on entertainment. Ten percent of the age-12 children spentmoney on their family, and 7 percent on their friends. Eight percent spent their money on sports, and 6
percent on other activities. There were some gender differences in how children at age 12 spent their ownmoney. Boys were more likely to spend it on games or toys (48 percent compared with 15 percent ofgirls), and on sport (12 percent compared with 3 percent of girls). Girls were more likely to spend it on
clothes or makeup (37 percent compared with 13 percent of boys), on family (15 percent compared with5 percent of boys), and on friends (11 percent compared with 4 percent of boys). There were nodifferences in spending pattern related to maternal qualification.
Summary
Use of leisureWhen they were 12, most of the study children watched television and did homework on at least 2 days aweek. Sport, reading, computer use, and spending time with friends are the next most frequent group of
activities. Housework, playing electronic games, and talking to friends on the phone or Internet follow.The final activities are more occasional, and some of the children never experienced them: readingmagazines, newspapers, or comics, taking part in art/music/dance classes or working for money outside
the home. With the exception of homework, children usually enjoyed most the activities they did morefrequently, with between 60–69 percent listing playing sports, hanging out with friends, and watchingtelevision among their favourite activities.
Girls were more likely to read, talk with friends, do homework, and go to art/music/dance classes, and
enjoy most hanging out with friends, talking with them, and reading. Boys were more likely to playelectronic games and sport, and read comics, and enjoy playing electronic games and watching television.
Children’s use of their leisure time at age 12 was unrelated to their level of family income. Levels ofmaternal qualification were reflected in the time given to reading, computer use, and participation inart/music/dance classes.
The role of televisionA quarter of the children had a television in their bedroom; fewer than 10 percent had a computer orphone in their bedroom, and therefore somewhat more available for private use. Almost twice as many
boys had a television set in their bedroom as girls, and 4 times as many of the children whose mothershad no qualification compared with those whose mothers had a university qualification. The latter weremore likely to have a desk in their bedroom. These differences in what was readily available to children
for their private use indicate differences in values, and in readiness to actively steer children away fromactivities which are not known to be associated with academic achievement.
Section EightActivities and interests
142
At age 12, the study children were watching more television on average than they had at age 10, perhaps
because their tastes were shifting to longer, adult programmes, with a third now watching adult soapoperas. Gender played a role in programme preferences. Boys were more likely to prefer cartoons, andgirls, adult soap operas and sitcoms. Boys did not watch more television on average, but their taste forcartoons may be why they had a higher rate of watching before school.
Television played a bigger part in the lives of children whose mothers had no qualification, from low-income homes, or who were Mäori or Pasifika, and a smaller part in the lives of children who enjoyedreading. We found more associations between the children’s competencies and their cumulative time
spent watching television (reported in Section Four), than with current time use, but it was evident inrelation to mathematics and writing scores.
The role of computersBy age 12, 90 percent of the study children had a computer in their home. The average time spent using a
computer at home was not long, 3.8 hours a week. Boys spent somewhat more time on the computer thangirls. Access to a home computer and the time spent on it was related to maternal qualification levels. Thelatter accounted for most of the differences found for some competency scores in relation to time spent onthe computer.
Homework, e-mail, and accessing the Internet were the main uses of computers made by the studychildren at age 12. Boys were more likely to download games or music, and surf the Internet; girls weremore likely to word process, seek information for homework or projects, or use e-mail and on-linechatrooms.
Family characteristics of income or ethnicity were not associated with differences in computer use, butmaternal qualification was: the higher the level of maternal qualification, the greater use of e-mail, anduse of the computer for homework or projects.
Three-quarters of the study children had Internet access at home, and most could use the Internet on their
own. Use of the computer rose with access to the Internet, and being able to use that alone. The main useof the Internet was to seek information for school work, and e-mail.
Computer activities that showed significant associations with children’s competencies, particularlymathematics and Communication were playing games, word processing, e-mail, graphics, and forhomework or projects.
The role of readingAround two-thirds of the study children enjoyed reading, and 45 percent put reading among theirfavourite out-of-school activities. Enjoyment of reading was highest among those whose mothers had auniversity qualification. Girls enjoyed reading more than boys.
Section EightActivities and interests
143
Many of the children read a range of material, including fiction and information. Fiction was somewhat
less likely to be read by boys and children whose mothers had no qualification. Children who enjoyreading are more likely to read across the board. Enjoyment of reading was associated with higheraverage scores on all the competencies.
Reading has a double value: in itself, and as a topic for conversation with parents. Most children spoke to
someone at home about what they were reading, more often their mother than father. Children whoenjoyed reading were more likely to gain this additional value from their reading. Maternal qualificationagain played a role in child-parent talk about reading. Talking with parents about reading was associatedwith higher scores on the competency measures.
Three-quarters of the study children visited a public library, most with their family, though 15 percentwent by themselves, and 13 percent with friends. Public library use was lowest among those whosemothers had no qualification, who did not enjoy reading, and boys. Frequent use of a public library wasassociated with higher scores on the competency measures.
Thus reading is a key aspect of children’s performance at age 12, and not just for scores on readingmeasures.
The role of writingThe home writing which was done by half or more of the children is largely informative and as part of
relationships with others, related to word knowledge, or copying existing material. Half the childrenenjoyed writing, with girls enjoying it more than boys. Enjoyment of writing had positive associationswith children’s social and attitudinal competencies and writing, but not with reading or mathematics.
The role of mathematics
At age 12, 45 percent of the study children enjoyed working with numbers. This enjoyment waspositively associated with children’s scores on the social and attitudinal competencies, mathematics, andLogical Problem-Solving. The main mathematics activities the children did at home were embedded ingames, or using a ruler. Least common were activities involving calculators or computers.
Clubs, lessons, participation in formal music activity, and extracurricularactivities
Seventy-nine percent of the study children belonged to some club or group when they were twelve –slightly down on the 85 percent at age 10. Sports club membership continued to dominate. Membershipof children’s service clubs had dropped to 13 percent from 21 percent at age 10. Membership of groups
was more likely for boys, especially sports, and less likely for children whose mothers had noqualification, or who were from low-income homes.

Section EightActivities and interests
144
Forty-seven percent of the study children attended lessons or coaching outside school. Participation in
lessons outside school reflected family income levels. Performing arts lessons were most popular,followed by sports. Girls were more likely to attend performing arts lessons than sports lessons. Thehigher the level of maternal qualification, the more likely it was that children would attend performingarts lessons.
Forty-nine percent of the study children played a musical instrument or took part in a musical group,according to their parents. Forty-one percent played an instrument, and 11 percent sang in a choir. Ninepercent played in an orchestra or cultural group. Choir and orchestra or cultural group membership
occurred in similar levels at all family income levels. Playing an instrument was related to maternalqualification and family income levels.
Most children took part in some extracurricular activity at school, predominantly sports (64 percent),followed by performing arts (32 percent), and voluntary or service groups (20 percent). Girls were morelikely to take part in performing arts activities, and service groups; boys in computer activities and games.
MoneyOnly 2 percent of the study children had no money of their own at the age of 12. The main sources werethe family, through chores (47 percent), regular pocket money (40 percent), and irregular money (35
percent). A quarter had a job outside the home, with the main kind of work a source of employment thathas since dried up in the Wellington region, delivering daily newspapers. Competency scores wereunrelated to whether children worked outside the home.
Saving was the most frequent use of money earned or given, followed by buying food, games or toys, or
clothes or make-up. Boys were more likely to spend their money on games or toys, and girls, on clothesor make-up.
Commonality and differences in children’s use of leisureTelevision watching, sports, and time with friends were common ways of spending time for the study
children at age 12, no matter what their social background. The differences that are apparent and whichare related to either gender or social background are mainly related to engagement in activities that uselanguage or symbols, particularly through reading, performance, and communication. These are the
activities that positively contribute to children’s performance levels. Cheaper options, such as spendinglarge amounts of time on television viewing, appear to make some negative contributions.
Children whose mothers have no qualification experience a ‘double whammy’ in relation to thesedifferences: they do less of the activities which have positive associations, and watch more television.
Because for all children, familiar activities are more likely to be valued, it becomes harder to take on newactivities, or drop the old.
It is worth noting the overlaps of enjoyment of reading, writing, and number use, and that these continueto make positive contributions to children’s competency scores after taking into account maternal
Section EightActivities and interests
145
qualification and family income. If children from homes that are disadvantaged in terms of parental
qualification and family income enjoyed literacy and mathematics related activities from an early age —a matter of both opportunity and methods of engagement of children’s attention and interest — then theymay be more likely to keep up with activities which use and extend early knowledge and skills as they
grow older. One can only underline the importance of the greater awareness of providing suchopportunities in early childhood education which has become evident in recent years, and of buildingparental confidence and skills to work with children at home.
Gender
The gender differences in activities show how traditional stereotypes continue in everyday life: boysfocused on action, and girls on language and communication. The differences give some context to thedifferences found in competency scores. These favour girls, although the size of the differences is small
in relation to literacy and mathematics for this sample. Gender differences are more marked in relation tosocial and attitudinal competencies.
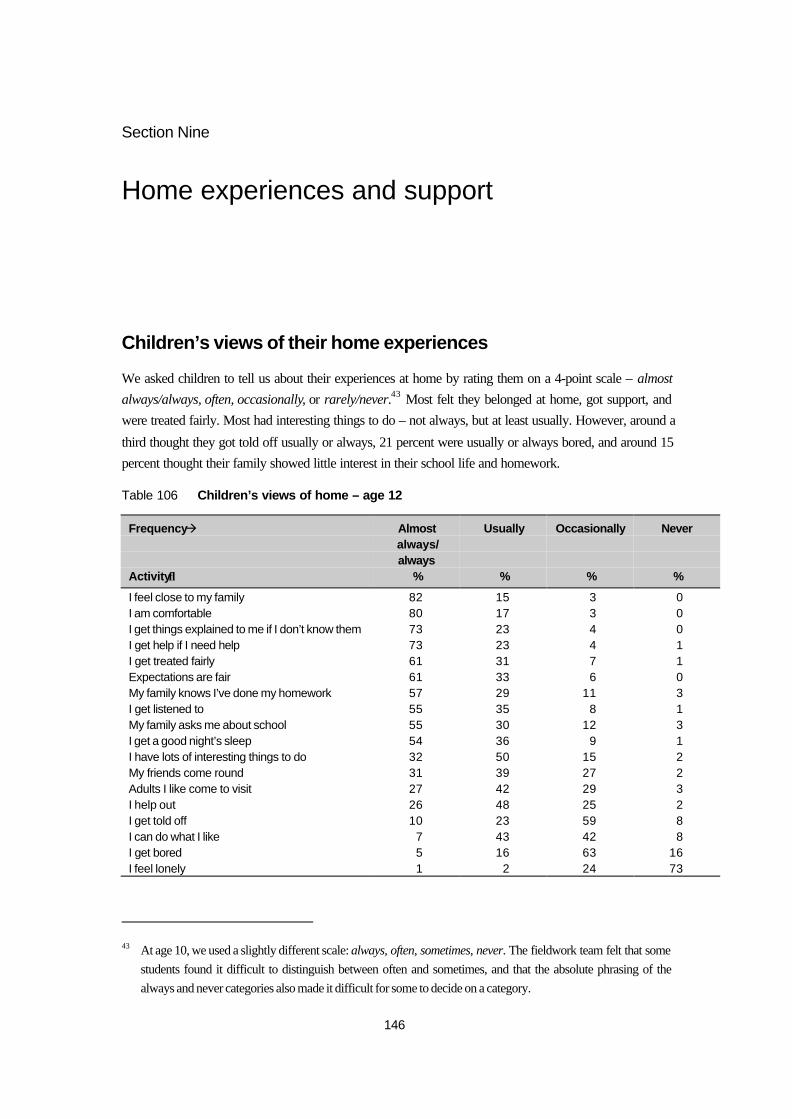
146
Section Nine
Home experiences and support
Children’s views of their home experiences
We asked children to tell us about their experiences at home by rating them on a 4-point scale – almostalways/always, often, occasionally, or rarely/never.43 Most felt they belonged at home, got support, andwere treated fairly. Most had interesting things to do – not always, but at least usually. However, around a
third thought they got told off usually or always, 21 percent were usually or always bored, and around 15percent thought their family showed little interest in their school life and homework.
Table 106 Children’s views of home – age 12
Frequencyà
Activity↓
Almostalways/always
%
Usually
%
Occasionally
%
Never
%
I feel close to my family 82 15 3 0I am comfortable 80 17 3 0I get things explained to me if I don’t know them 73 23 4 0I get help if I need help 73 23 4 1I get treated fairly 61 31 7 1Expectations are fair 61 33 6 0My family knows I’ve done my homework 57 29 11 3I get listened to 55 35 8 1My family asks me about school 55 30 12 3I get a good night’s sleep 54 36 9 1I have lots of interesting things to do 32 50 15 2My friends come round 31 39 27 2Adults I like come to visit 27 42 29 3I help out 26 48 25 2I get told off 10 23 59 8I can do what I like 7 43 42 8I get bored 5 16 63 16I feel lonely 1 2 24 73
43 At age 10, we used a slightly different scale: always, often, sometimes, never. The fieldwork team felt that somestudents found it difficult to distinguish between often and sometimes, and that the absolute phrasing of thealways and never categories also made it difficult for some to decide on a category.
Section NineHome experiences and support
147
This picture is very similar to the study children’s reports of their home experiences at age 10, but withmore positive ratings given to these 3 items: 44
• I get help if I need help (73 percent at age 12 said almost always or always compared with 59 percentwho said always at age 10);
• I get treated fairly (61 percent at age 12 said almost always or always compared with 49 percent who
said always at age 10); and• I get listened to (55 percent at age 12 said almost always or always compared with 40 percent at age
10 who said always).
Gender did not play a large role in children’s views of their homes. Boys were more likely to report being
bored usually or always (26 percent compared with 14 percent of girls) – but the same proportion of boysas girls thought they were rarely or never bored. Boys were more likely to be told off at home usually oralways (40 percent compared with 26 percent of girls) – but just as likely to think their parentalexpectations were fair.
There were very few differences related to family resources. Children of university-qualified motherswere more likely to say they could usually do what they liked (67 percent compared with 38 percent ofothers). They were less likely to say that their family only occasionally or never knew when they had
done their homework (7 percent compared with 24 percent of those whose mothers had no qualification).Mäori children were more likely to say they were almost always or always bored at home (15 percentcompared with 5 percent overall). Pasifika and Asian children in the study were more likely to say that
they almost always or always helped out at home (52 and 43 percent respectively, compared with 26percent overall). They were less likely to say that their friends came around almost always or always (4and 14 percent compared with 32 percent overall).
Children’s views of their home experiences and competency levels
We found that children’s views of their home experiences were associated with their competency levelsat age 10. The items that then showed associations with most competencies were being treated fairly,getting help if needed, and helping out. The items which showed least association were being listened toat home, and being asked about school.
At age 12, we found that the items which showed the most associations after taking family income andmaternal qualification45 into account were:
44 Although the wording for the ratings changed, the fact that there was upward movement for only some of theitems suggests that there was a change related to the children’s experience rather than the rating wording.
45 In general, the percentage points difference was more likely to decrease after taking maternal qualification intoaccount than after taking into account family income, indicating a greater overlap between the items and maternalqualification (with a trend for children of mothers who had a university qualification to be reporting more of thelevel of experience which was associated with higher scores on the competencies).

Section NineHome experiences and support
148
• doing interesting things;
• being bored;• helping out at home;• getting help if needed;
• getting told off at home; and• expectations are fair.
There were more items which showed only 2 or 3 associations after taking family income and maternalqualification into account. Some of the contrasts did not remain significant after we took these 2 key
factors into account because of the small numbers of children who rarely or never experienced thepositive interactions and support we asked about.
• Being treated fairly• Feeling lonely
• Friends come round• Closeness to family• Getting things explained
• Adults I like visit• Good night’s sleep• Can do what I like
• Family knows I’ve done my homework• Family asks me about school.
However, though this second group of items did not have wide-ranging associations with the children’scompetencies, those associations which were found show some consistent patterns, and associations withparticular competencies, including mathematics and some of the literacy measures.
We look now at the specific associations found for each of the items. Most of the contrasts were betweenthe average scores of children who rated their experience as “almost always/always” or “usually”, andthose who rated their experience as “occasionally” or “rarely/never”.
In the list that follows, the associations where the percentage points difference was 10 or more onaverage, or, for Reading Age, more than the equivalent of a year, have been starred.
Interesting things
Children who reported having interesting things to do always or usually tended to score higher thanthose who had them only occasionally or never.
Mathematics, PAT Reading Comprehension test*, Burt Word Reading test*, Writing*, Reading Age*,Perseverance, and Social Skills with Peers*.
Bored
Children who reported being bored occasionally or rarely/never tended to have higher scores than thosewho were often or always bored.
Section NineHome experiences and support
149
Mathematics*, PAT Reading Comprehension test, Burt Word Reading test, Writing, Reading Age*,
Logical Problem-Solving, Perseverance*, Individual Responsibility, Social Skills with Peers, andCommunication.
Helping out
Children who always or usually helped out had higher average scores for the social skills than those whohelped out occasionally or rarely/never; children who always or rarely/never helped out had loweraverage scores for the cognitive competencies.
Mathematics*, PAT Reading Comprehension test*, Burt Word Reading test*, Writing*, Perseverance,Individual Responsibility, Social Skills with Peers, Social Skills with Adults, and Communication.
Get help if needed
Children who always or usually got help when they needed it had higher average scores than those whooccasionally or never did.
Mathematics*, PAT Reading Comprehension test*, Burt Word Reading test*, Writing, Reading Age*,
Logical Problem-Solving, Curiosity, Perseverance*, Individual Responsibility*, Social Skills with Peers,Social Skills with Adults*, and Communication*.
Fair expectations
Children who thought their family’s expectations were always or usually fair had higher average scores.
Mathematics*, PAT Reading Comprehension test*, Burt Word Reading test*, Writing, Reading Age*,Logical Problem-Solving*, Perseverance*, Individual Responsibility, Social Skills with Peers, SocialSkills with Adults, and Communication*.
Get told off
Children who were always told off had lower average scores.
Mathematics, PAT Reading Comprehension test, Burt Word Reading test*, Writing, Reading Age*,Perseverance*, Individual Responsibility*, Social Skills with Peers, and Social Skills with Adults.
Comfortable
Children who always or usually felt comfortable at home had higher average scores than those who feltthey were only occasionally or never comfortable.
Mathematics*, PAT Reading Comprehension test*, Burt Word Reading test*, Writing*, Reading Age*,and Logical Problem-Solving*.
Listened to
Children who felt they were always or usually listened to had higher average scores than those who feltthey were only occasionally or never listened to.
Section NineHome experiences and support
150
Mathematics*, PAT Reading Comprehension test, Burt Word Reading test, Reading Age,Communication, and Perseverance.
Treated fairly
Children who felt they were always treated fairly had higher average scores.
Writing, Perseverance, and Social Skills with Peers.
Friends come around
Children whose friends usually or often came around had higher average scores than those whosefriends always came around.
Mathematics, PAT Reading Comprehension test, and Writing.
Closeness to family
Children who always or usually felt close to their family had higher average scores than those whooccasionally felt close to their family.
Mathematics*, Reading Age*, and Logical Problem-Solving.
Can do what I like at home
Children who could usually do what they liked at home had higher average scores than those who coulddo this occasionally, always, or never.
Mathematics*, PAT Reading Comprehension test*, and Burt Word Reading test.
Lonely
Children who felt they were lonely at home occasionally or rarely had higher average scores than thosewho felt always or usually lonely.
PAT Reading Comprehension test*, Reading Age*.
Good night’s sleep
Children who usually had a good night’s sleep had higher average scores than those who occasionally-never had one.
Mathematics*, Burt Word Reading test, and Social Skills with Peers.
Adults child likes visit
Children who always had adults they liked visiting had lower average scores.
Mathematics, Writing, and Logical Problem-Solving.
Section NineHome experiences and support
151
Get things explained
Children who always or usually got things explained had higher average scores than those who had themexplained occasionally-never.
Mathematics, and Communication*.
Family knows child has done homework
Children whose family always knew they did their homework had higher average scores.
Mathematics*, Burt Word Reading test*, and Writing.
Parental activities with the study children
The main activities that parents share with their 12-year-old children in this study reflect a mixture of
shared interests and practical activities. Transporting the study children to their activities is second on thelist!
Table 107 Main activities parents do with their children at age 12
Parental involvement↓
At age 12(n=496)
%
Spend time with family/friends 63Transport student to activities 58Physical activities 47Watch sport 43Shop 41Eat together 36Talk 36Interest/hobby 31TV/video watching 28Homework 27Housework 19Play sport 17Go to movies 15Art/cultural/music/theatre 13Church/spiritual 11Computers 8Reading 7Other 5Organisation 3
There are some different patterns in the activities that parents share with their daughters and sons. Parentsof sons were more likely to mention:
• watching sport (52 percent compared with 33 percent of girls); and• transporting student to activities (62 percent compared with 53 percent of girls).
Section NineHome experiences and support
152
Parents of daughters were more likely to mention:
• shopping (52 percent compared with 31 percent of boys); and• talking (41 percent compared with 32 percent of boys).
Parents of children whose mother had a university qualification were most likely to report that they spenttime with them in relation to:
• art/music/theatre/cultural events (24 percent compared with 6 percent of those whose mothers had noqualification);
• going to movies (26 percent); and• reading with them (16 percent compared with 2 percent of those whose mother had no qualification),
but least likely to report spending time on shopping (27 percent).
Parents of children whose mother had no qualification were least likely to report that they spent time with
them transporting them to activities, which is consistent with the much lower participation rate of thesechildren in sports, clubs, or lessons (35 percent).
Family income was not related to most of these activities. However, low-income parents were less likelyto transport their child to activities (44 percent), and the sharing of church or spiritual activities rose from
8 percent of very high-income parents to 17 percent of low-income parents. Family composition was alsounrelated to these activities.
Parents of Päkehä/European children were most likely to spend time with their child on an interest orhobby (33 percent compared with 19 percent of others); and Pasifika parents in the study were most
likely to share church activities with them (64 percent), but less likely to go to the movies with their child(none), or do physical activity with them (28 percent).
The average number of activities shared with a child was 5.08 (s.d. 2.4). The range was from 1 sharedactivity (4 percent) to 17 (1 parent). While the average number of activities did not differ by family
characteristics, parents from families where the mother had no qualification were more likely to reportdoing 1–3 activities (40 percent, declining to 16 percent of mothers with a university qualification). Asimilar pattern was evident in relation to family income, with low-income families more likely to reportdoing 1–3 activities (36 percent, declining to 20 percent of the very high-income families).
We analysed the total number of activities that parents reported sharing with their children in relation toscores on the competency measures. The trend was for children whose parents reported doing only 1 or 2things with them to score lower than others on the cognitive competency measures, with the highest
average scores among those whose parents did between 5–7 activities with them. These differencesremained significant for Mathematics, after taking into account family income and maternal qualification.
We also looked at 3 particular activities which seemed good indicators of the opportunity (or lack of it)for dialogue between parents and children: sharing an interest or hobby, watching television, and talkingtogether. We found no significant associations.

Section NineHome experiences and support
153
Who children come home to at age 12
Most of the children came home to a parent (73 percent). Thirty-one percent also mentioned a sibling. Six
percent came home to a relative, 3 percent to a babysitter or caregiver. Two or 3 percent each did not gostraight home after school, but went to a relative or friend’s house, after-school care, waited at theirparent’s work, or went to sports, a club, or lessons. Fifteen percent of the study children said they came
home to an empty house. A third had some variation in who was waiting for them, or what they did afterschool.
Parental expectations
To find out more about the structure of children’s home experiences, and indirectly, something aboutunderlying parental approaches to parenting, we asked some questions about the kinds of rules orexpectations parents had for their children. Most of the parents in the study had expectations or rules
related to school work, housework, and language. They also had rules related to the use of media. Dressand use of the telephone were the 2 aspects of children’s lives which were least likely to attract parentalauthority.
The study children tended to be less aware of parental rules or expectations. This may be because parents
may be setting conditions or guiding behaviour in non-overt ways, or that parents do not always enforcethese rules and expectations. Differences in parental and children’s answers here may also reflectdifferences in perceptions of the role of parental rules. Parents may see having rules as indicative of
“good parenting”, and provide an optimistic view, whereas children see not having parental rules asindicative of their own independence, and thus understate their situation.
Parents and children were most likely to give the same answer in relation to rules or expectations abouthomework, television watching, and housework (87–94 percent agreement), and least likely to give thesame answer about using the telephone (44 percent).
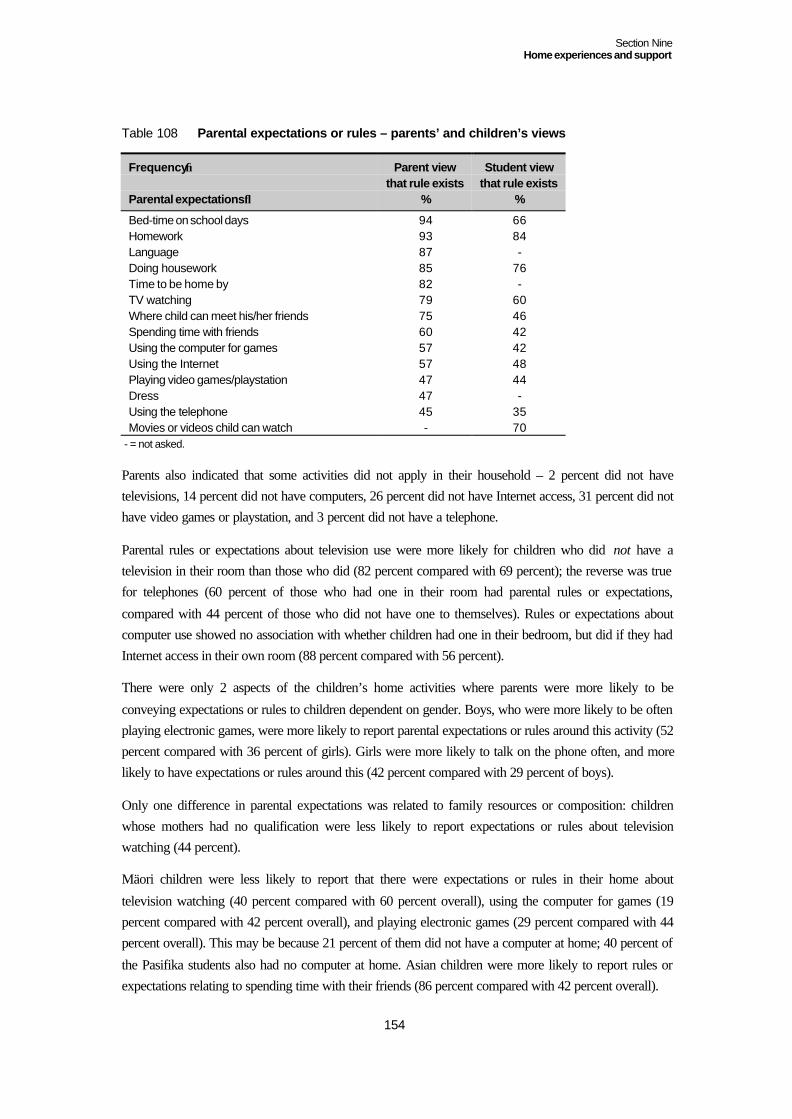
Section NineHome experiences and support
154
Table 108 Parental expectations or rules – parents’ and children’s views
Frequency→
Parental expectations↓
Parent viewthat rule exists
%
Student viewthat rule exists
%
Bed-time on school days 94 66Homework 93 84Language 87 -Doing housework 85 76Time to be home by 82 -TV watching 79 60Where child can meet his/her friends 75 46Spending time with friends 60 42Using the computer for games 57 42Using the Internet 57 48Playing video games/playstation 47 44Dress 47 -Using the telephone 45 35Movies or videos child can watch - 70
- = not asked.
Parents also indicated that some activities did not apply in their household – 2 percent did not havetelevisions, 14 percent did not have computers, 26 percent did not have Internet access, 31 percent did nothave video games or playstation, and 3 percent did not have a telephone.
Parental rules or expectations about television use were more likely for children who did not have atelevision in their room than those who did (82 percent compared with 69 percent); the reverse was truefor telephones (60 percent of those who had one in their room had parental rules or expectations,
compared with 44 percent of those who did not have one to themselves). Rules or expectations aboutcomputer use showed no association with whether children had one in their bedroom, but did if they hadInternet access in their own room (88 percent compared with 56 percent).
There were only 2 aspects of the children’s home activities where parents were more likely to be
conveying expectations or rules to children dependent on gender. Boys, who were more likely to be oftenplaying electronic games, were more likely to report parental expectations or rules around this activity (52percent compared with 36 percent of girls). Girls were more likely to talk on the phone often, and morelikely to have expectations or rules around this (42 percent compared with 29 percent of boys).
Only one difference in parental expectations was related to family resources or composition: childrenwhose mothers had no qualification were less likely to report expectations or rules about televisionwatching (44 percent).
Mäori children were less likely to report that there were expectations or rules in their home about
television watching (40 percent compared with 60 percent overall), using the computer for games (19percent compared with 42 percent overall), and playing electronic games (29 percent compared with 44percent overall). This may be because 21 percent of them did not have a computer at home; 40 percent of
the Pasifika students also had no computer at home. Asian children were more likely to report rules orexpectations relating to spending time with their friends (86 percent compared with 42 percent overall).
Section NineHome experiences and support
155
For two-thirds of the children who spent time in 2 households, parental expectations or rules were thesame in both houses; they were different for a third.
Bed-timeSixty-six percent of the children said they had a set time to go to bed on school days – rather fewer thanthe 94 percent of parents who said their child had a set bed-time. Forty-one percent said their bed-time on
school days was between 8 and 9pm, and 23 percent, between 9 and 10pm. There were no differencesrelated to maternal qualification or family income. A quarter of the Pasifika children reported that theyusually went to bed after 10pm on a school night, compared with 6 percent overall.
Children who had a set bed-time were more likely to usually be in bed by 9pm on a school day (54
percent compared with 33 percent of those who did not have a set bed-time). In most cases the set bed-time and actual bed-time were the same, though 18 percent of those whose set bed-time was before 9pmstayed up after that time, and 6 percent of those whose bed-time was between 9–10pm stayed up after
10pm. However, there was no relationship between the children’s report of whether they got a goodnight’s sleep, and their actual bed-time on school days.
Parental responses to children
To gain further insight into parental approaches to their role, we asked the parents of the study childrenwhat they would generally do if they saw their child was having difficulty with something s/he wasdoing, and how they handled disagreements with their child.
Most parents said they would either take a facilitative approach, providing support and advice (68
percent), or offer encouragement (27 percent). Fourteen percent would wait for the child to ask for helprather than step in. Twelve percent would show their child what to do. There were no differences inrelation to family characteristics. We did not analyse the relationship between parental response to their
child striking difficulty in a task and children’s competency levels at age 12, since analysis in previousstudy phases showed little relationship.
Disagreements between parents and their 12-year-old children are almost universal. Only 6 parents (1percent) in this study said they and their children never disagreed. Parents’ reports of what they would dowhen there was a disagreement are given in the next table. Negotiation is the main response.
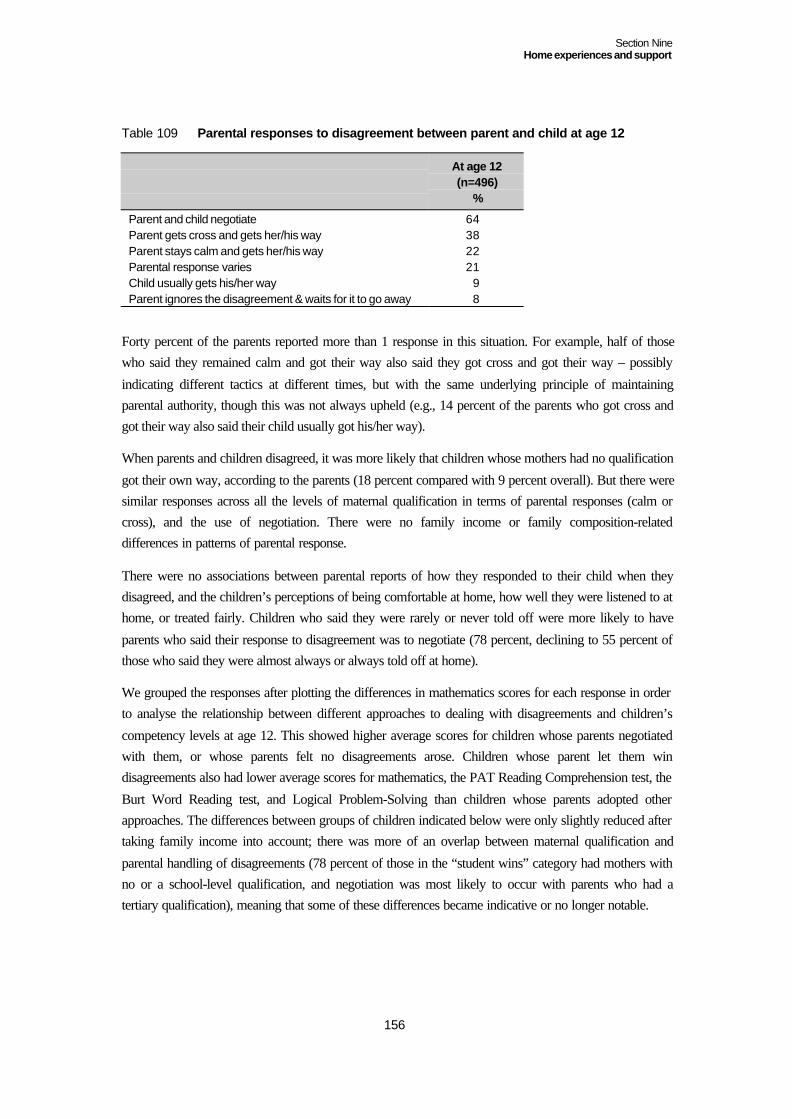
Section NineHome experiences and support
156
Table 109 Parental responses to disagreement between parent and child at age 12
At age 12(n=496)
%
Parent and child negotiate 64Parent gets cross and gets her/his way 38Parent stays calm and gets her/his way 22Parental response varies 21Child usually gets his/her way 9Parent ignores the disagreement & waits for it to go away 8
Forty percent of the parents reported more than 1 response in this situation. For example, half of thosewho said they remained calm and got their way also said they got cross and got their way – possibly
indicating different tactics at different times, but with the same underlying principle of maintainingparental authority, though this was not always upheld (e.g., 14 percent of the parents who got cross andgot their way also said their child usually got his/her way).
When parents and children disagreed, it was more likely that children whose mothers had no qualification
got their own way, according to the parents (18 percent compared with 9 percent overall). But there weresimilar responses across all the levels of maternal qualification in terms of parental responses (calm orcross), and the use of negotiation. There were no family income or family composition-relateddifferences in patterns of parental response.
There were no associations between parental reports of how they responded to their child when theydisagreed, and the children’s perceptions of being comfortable at home, how well they were listened to athome, or treated fairly. Children who said they were rarely or never told off were more likely to have
parents who said their response to disagreement was to negotiate (78 percent, declining to 55 percent ofthose who said they were almost always or always told off at home).
We grouped the responses after plotting the differences in mathematics scores for each response in orderto analyse the relationship between different approaches to dealing with disagreements and children’s
competency levels at age 12. This showed higher average scores for children whose parents negotiatedwith them, or whose parents felt no disagreements arose. Children whose parent let them windisagreements also had lower average scores for mathematics, the PAT Reading Comprehension test, the
Burt Word Reading test, and Logical Problem-Solving than children whose parents adopted otherapproaches. The differences between groups of children indicated below were only slightly reduced aftertaking family income into account; there was more of an overlap between maternal qualification and
parental handling of disagreements (78 percent of those in the “student wins” category had mothers withno or a school-level qualification, and negotiation was most likely to occur with parents who had atertiary qualification), meaning that some of these differences became indicative or no longer notable.

Section NineHome experiences and support
157
Table 110 Parental handling of disagreements and children’s competencies at age 12
Parental handling ofdisagreements at age 12→
Age-12 competency↓
Child“wins”
Mean(n=19)
Parent“wins”
Mean(n=56)
Noproblemsarise or
negotiationMean
(n=145)
Mixtureof
responses
Mean(n=183)
All/anyof
these
Mean(n=93)
Prob. ofF-value
fromANOVA
% var.acct.for
Perseverance 61.2 64.5 74.9 70.5 61.7^ < 0.0001 5.3Individual Responsibility 67.1 71.8 80.1 75.5 70.5^ 0.0007 3.8Social Skills with Adults 72.8 72.2 79.5 78.0 72.6^ 0.008 2.8Communication* 61.8 67.5 72.8 69.9 64.1^ 0.001 3.7Mathematics** 34.2 45.7 55.2 51.1 50.4 0.002 3.5PAT Reading Comprehension 35.2^ 49.0^ 60.5^ 53.6^ 52.7 < 0.0001 6.4Burt Word Reading* 65.4 73.6 80.4 76.7 76.2 0.0005 4.0Writing 47.4 49.7 54.2 51.8 49.2 0.0003 4.2Reading Age (yrs, mo) 11.7 12.1 13.1^ 12.10 12.6 0.0001 4.7Logical Problem-Solving* 58.6 69.3 72.0 70.8 69.9 0.0004 4.2Composite Competency* 58.9^ 62.8^ 69.5^ 66.8^ 63.1^ < 0.0001 5.8Composite Cognitive Competency 48.4^ 57.0^ 63.0^ 59.7^ 58.5 < 0.0001 5.3Composite Social &Attitudinal Competency*
65.0 66.8 73.9 71.6 66.2^ < 0.0001 4.8+
* In these cases the squared model was a better fit. ** In this case the square-root model was a better fit.^ One fewer in this mean.The mean scores are percentages, not raw scores. The highest scores for each competency are in bold type, the lowest initalics.
Summary
At age 12, most of the study children felt they belonged in their home, got support, had interesting things
to do, and were fairly treated. They were somewhat more positive than they had been at age 10 that theygot help if they needed it, got treated fairly, and were listened to. However, there were sizeable minoritieswho thought they were told off, got bored, or that their family showed little interest in their school life orhomework.
Differences in gender and family resources and characteristics were reflected in just a few differences inthese views, suggesting that they were not the decisive factors in children’s experience, or their judgmentof that experience, though we did find that children whose mothers had a university qualification were
more likely to rate more highly the items that showed associations with the age-12 competency scores.The set of items which showed most associations with these scores was:
• doing interesting things;• being bored;
• helping out at home;• getting help if needed;• getting told off at home; and• expectations are fair.
Section NineHome experiences and support
158
Another 10 of the items showed associations with mathematics, and some of the literacy measures. Parent
support came in the form of help, having things explained, and having parents knowledgable about howthe children spent their time – that they had completed their homework. It also came in the form offeeling close to parents, listened to by them, and trusted by them to do what the child wanted to do athome.
All the parents shared some activities with their children: socialising with other family or friends andtransporting them to their activities headed the list. Parents of boys were more likely to watch sport withthem, and transport them to activities. Parents of girls were more likely to mention shopping, and talking.
These are consistent with some of the gender differences in children’s activities at age 12 described in theprevious section. There were some differences related to family resources, particularly maternalqualification, and children whose mothers had no qualification, or whose families had low-incomes,
shared fewer activities with their parents. Children’s mathematics scores at age 12 were related to thenumber of activities shared with parents, with lower average scores for children whose parents mentionedjust 1 or 2 shared activities, and highest average scores for children whose parents mentioned 5–7activities.
Most of the study children came home from school to a parent; 31 percent also mentioned a sibling.Fifteen percent came home to an empty house.
Most of the parents reported expectations or rules relating to school work, housework, language, andmedia use. Dress and telephone use were least likely to attract parental authority. Children were less
aware of parental expectations or rules, perhaps because they were not always overt, or always enforced.Parents and children were most likely to agree on the existence of rules or expectations relating tohomework, television watching, and housework, and least likely to agree about those relating to
telephone use. Gender did not make much of a difference to the rules: boys reported more rules aboutelectronic games, which they were more likely than girls to be playing, and girls, who talked more on thetelephone than boys, to report rules about that. Two-thirds of the children who spent time in 2 householdsencountered similar rules or expectations in both.
Only 1 percent of the parents said they and their 12-year-old child never disagreed. Negotiation was themain response when they did, followed by the parent getting cross and getting their way. Almost half theparents use a range of responses at different times. Parental reports of their response to children were
unrelated to the children’s perceptions of feeling comfortable at home, listened to, or treated fairly,though children who said they were rarely or never told off were more likely to have parents who wouldnegotiate in times of disagreement. Children whose parents negotiated with them had higher averagescores than children whose parents let them win.
Overall, many of the study children lived in homes that were supportive and gave them structure, butwithout being overly restrictive. There were some telling differences related to family characteristics,particularly maternal qualification, but social class was not operating with strict borders and distinct
differences. Nor was gender clearly differentiating interactions between the study children and theirparents.
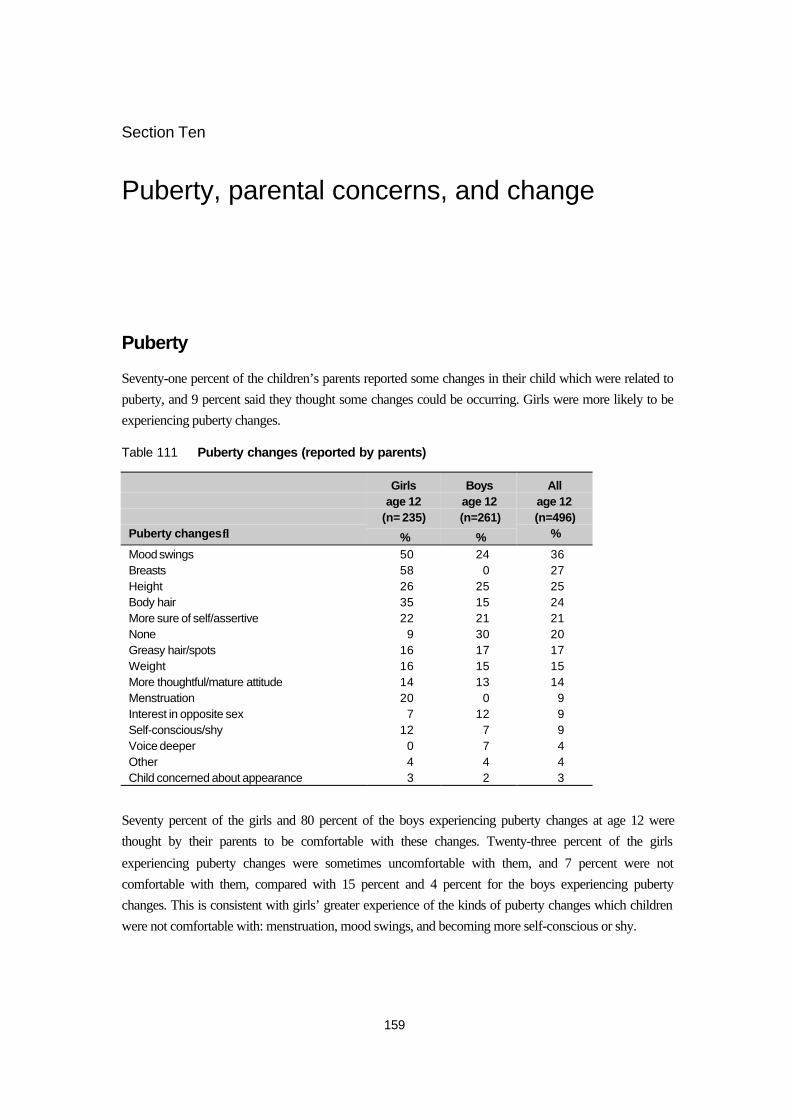
159
Section Ten
Puberty, parental concerns, and change
Puberty
Seventy-one percent of the children’s parents reported some changes in their child which were related topuberty, and 9 percent said they thought some changes could be occurring. Girls were more likely to beexperiencing puberty changes.
Table 111 Puberty changes (reported by parents)
Puberty changes ↓
Girlsage 12
(n= 235)
%
Boysage 12(n=261)
%
Allage 12(n=496)
%
Mood swings 50 24 36Breasts 58 0 27Height 26 25 25Body hair 35 15 24More sure of self/assertive 22 21 21None 9 30 20Greasy hair/spots 16 17 17Weight 16 15 15More thoughtful/mature attitude 14 13 14Menstruation 20 0 9Interest in opposite sex 7 12 9Self-conscious/shy 12 7 9Voice deeper 0 7 4Other 4 4 4Child concerned about appearance 3 2 3
Seventy percent of the girls and 80 percent of the boys experiencing puberty changes at age 12 werethought by their parents to be comfortable with these changes. Twenty-three percent of the girls
experiencing puberty changes were sometimes uncomfortable with them, and 7 percent were notcomfortable with them, compared with 15 percent and 4 percent for the boys experiencing pubertychanges. This is consistent with girls’ greater experience of the kinds of puberty changes which childrenwere not comfortable with: menstruation, mood swings, and becoming more self-conscious or shy.
Section Ten
Puberty, parental concerns, and change
160
Parental reports of their child’s overall health and puberty changes were unrelated to maternal
qualification, with 2 exceptions. Children of university-qualified mothers were less likely to be reportedas becoming more assertive in a negative sense (9 percent compared with 24 percent of others), and thoseof mothers with no qualification less likely to be reported as becoming more thoughtful or mature (3percent compared with 15 percent of others).
The occurrence of puberty changes among this sample at age 12 was unrelated to family income levels,other than fewer low-income parents reporting height changes (13 percent).
Comfort with puberty changes had some association with parents’ perceptions of their child’s generalhappiness, with only 58 percent of those seen as uncomfortable with the changes also seen as generally
happy, compared with 86 percent overall. However, there was no link between comfort with pubertychanges, and parental reports that their child was unsettled. Parents had concerns about their child’s self-confidence for 46 percent of those who were experiencing discomfort with their puberty changes,
compared with 16 percent overall, and about their child’s home behaviour for 29 percent compared with8 percent overall.
We found some trends relating competency levels to experience of puberty changes, and levels ofcomfort with these changes, but few significant relationships. There were some interesting interactions
related to gender among the group who had yet to experience puberty, with girls in this group showinghigher average scores than the boys in the group for mathematics and reading.
General happiness
Eighty-six percent of the study children were thought by their parents to be generally happy, 12 percentvaried, and 2 percent were generally unhappy. These 2 latter groups were also more likely to beuncomfortable with puberty changes (19 percent compared with 4 percent of those regarded as generally
happy). Children from very high-income homes were slightly more likely to be seen as generally happy(94 percent compared with 85 percent of others).
Parents and teachers had similar overall views about the general happiness of the study children. Therewere no differences related to school decile or ownership.
Unhappiness was also associated with unsettling events, with 63 percent of the children whose parents
thought they were unhappy or sometimes unhappy experiencing things that were unsettling them,compared with 38 percent of those whose parents thought they were generally happy. Of those who wereexperiencing something unsettling, those who were regarded as generally happy were more likely to becoping with it: 46 percent compared with 18 percent of those who were generally or sometimes unhappy.
There were no gender differences related to parents’ perceptions that their child was generally happy, orareas of concern.
Section Ten
Puberty, parental concerns, and change
161
General health
Sixty-nine percent of the study children were said to be in very good or excellent health at age 12, and 27
percent in good health. Four percent were said not to be in good health. Chronic illness (includingasthma) was the main reason why children were not in very good health (13 percent). Seven percent wereon medication. There were no differences in reported health status by gender or ethnicity. Parental reports
that children’s health was generally very good or excellent were related to family income, rising from 59percent of children from low-income homes, to 80 percent of children from very high-income homes.
Teachers reported 14 percent of the study children to have ongoing health problems. There were nodifferences in teacher perceptions related to school decile or ownership.
Residential mobility
Sixty-nine percent of the study children had moved house at least once by the time they were 12. Twenty-three percent had moved once, 15 percent, twice, 17 percent, 3 or 4 times, and 14 percent, 5 or moretimes (to a total of 14 shifts for one child).
Children from low-income families had a higher average of the homes they had lived in (3.13 (s.d. 3.08),compared with 1.84 (s.d. 2.14) for children from very high-income families). A similar trend was evidentin relation to maternal qualification. Children of 1-parent families had moved 2.47 (s.d. 2.7) times on
average, compared with 1.66 (s.d. 1.20) times for children of original 2-parent families. However,children from new 2-parent families (with 1 step-parent) had the most moves on average, 4.56 (s.d. 3.29).
The number of times children shifted house was associated with their scores on some of the competencymeasures at age 12, as described in Section Four, though the associations generally became indicative or
not notable once maternal qualification or family income were taken into account, suggesting that familyresources may be a protective factor in relation to multiple shifts of residence. However, children whohad moved 5 or more times had lower mathematics, Perseverance, and Social Skills with Peers scores.
Things unsettling children
Forty-one percent of the parents thought that their child was experiencing something that was unsettlingfor them, slightly higher than the 32–36 percent who identified something when the children were ages 6,
8, and 10. The age 12 level of being unsettled is closer to that at age 5. The things that were unsettling forchildren at this age varied. Parents were most aware of family-related triggers for being unsettled.
Twenty-seven percent mentioned aspects of family life and relationships. These included friction or stressat home (9 percent), but a much lower reason for being unsettled than at ages 10 (21 percent), or 8 (33
percent). Other family-related reasons were changes in the family (6 percent), relations between the childand their other parent (4 percent), death of a family member (4 percent), parental employment (2percent), and moving house (2 percent).
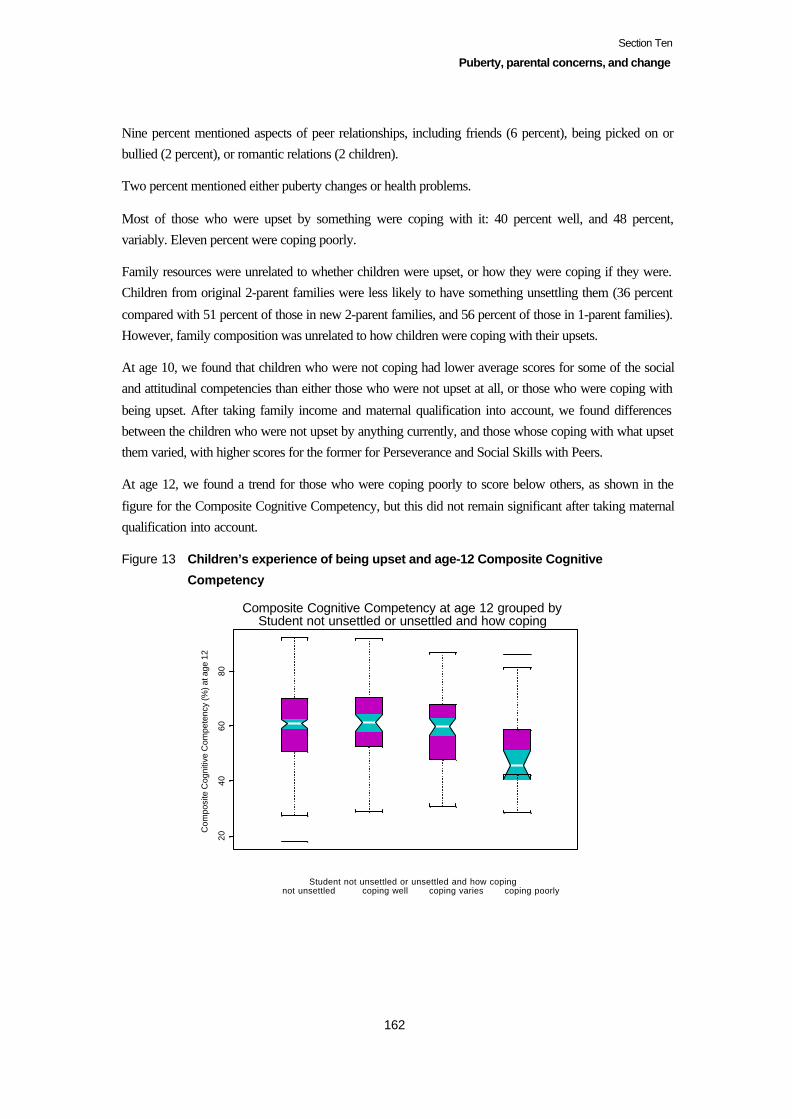
Section Ten
Puberty, parental concerns, and change
162
Nine percent mentioned aspects of peer relationships, including friends (6 percent), being picked on orbullied (2 percent), or romantic relations (2 children).
Two percent mentioned either puberty changes or health problems.
Most of those who were upset by something were coping with it: 40 percent well, and 48 percent,variably. Eleven percent were coping poorly.
Family resources were unrelated to whether children were upset, or how they were coping if they were.Children from original 2-parent families were less likely to have something unsettling them (36 percent
compared with 51 percent of those in new 2-parent families, and 56 percent of those in 1-parent families).However, family composition was unrelated to how children were coping with their upsets.
At age 10, we found that children who were not coping had lower average scores for some of the socialand attitudinal competencies than either those who were not upset at all, or those who were coping with
being upset. After taking family income and maternal qualification into account, we found differencesbetween the children who were not upset by anything currently, and those whose coping with what upsetthem varied, with higher scores for the former for Perseverance and Social Skills with Peers.
At age 12, we found a trend for those who were coping poorly to score below others, as shown in the
figure for the Composite Cognitive Competency, but this did not remain significant after taking maternalqualification into account.
Figure 13 Children’s experience of being upset and age-12 Composite Cognitive
Competency
2040
6080
Composite Cognitive Competency at age 12 grouped byStudent not unsettled or unsettled and how coping
Student not unsettled or unsettled and how coping not unsettled coping well coping varies coping poorly
Com
posi
te C
ogni
tive
Com
pete
ncy
(%) a
t age
12
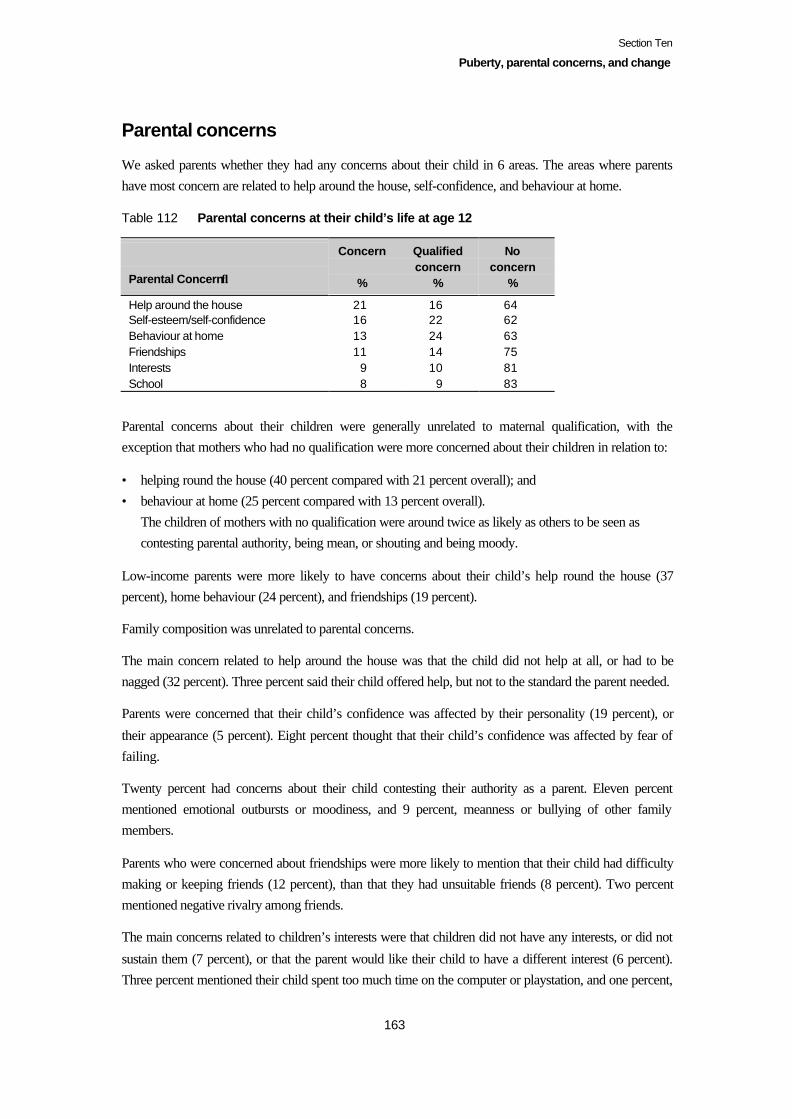
Section Ten
Puberty, parental concerns, and change
163
Parental concerns
We asked parents whether they had any concerns about their child in 6 areas. The areas where parentshave most concern are related to help around the house, self-confidence, and behaviour at home.
Table 112 Parental concerns at their child’s life at age 12
Parental Concern↓
Concern
%
Qualifiedconcern
%
Noconcern
%
Help around the house 21 16 64Self-esteem/self-confidence 16 22 62Behaviour at home 13 24 63Friendships 11 14 75Interests 9 10 81School 8 9 83
Parental concerns about their children were generally unrelated to maternal qualification, with theexception that mothers who had no qualification were more concerned about their children in relation to:
• helping round the house (40 percent compared with 21 percent overall); and• behaviour at home (25 percent compared with 13 percent overall).
The children of mothers with no qualification were around twice as likely as others to be seen ascontesting parental authority, being mean, or shouting and being moody.
Low-income parents were more likely to have concerns about their child’s help round the house (37percent), home behaviour (24 percent), and friendships (19 percent).
Family composition was unrelated to parental concerns.
The main concern related to help around the house was that the child did not help at all, or had to benagged (32 percent). Three percent said their child offered help, but not to the standard the parent needed.
Parents were concerned that their child’s confidence was affected by their personality (19 percent), or
their appearance (5 percent). Eight percent thought that their child’s confidence was affected by fear offailing.
Twenty percent had concerns about their child contesting their authority as a parent. Eleven percentmentioned emotional outbursts or moodiness, and 9 percent, meanness or bullying of other familymembers.
Parents who were concerned about friendships were more likely to mention that their child had difficultymaking or keeping friends (12 percent), than that they had unsuitable friends (8 percent). Two percentmentioned negative rivalry among friends.
The main concerns related to children’s interests were that children did not have any interests, or did not
sustain them (7 percent), or that the parent would like their child to have a different interest (6 percent).Three percent mentioned their child spent too much time on the computer or playstation, and one percent,
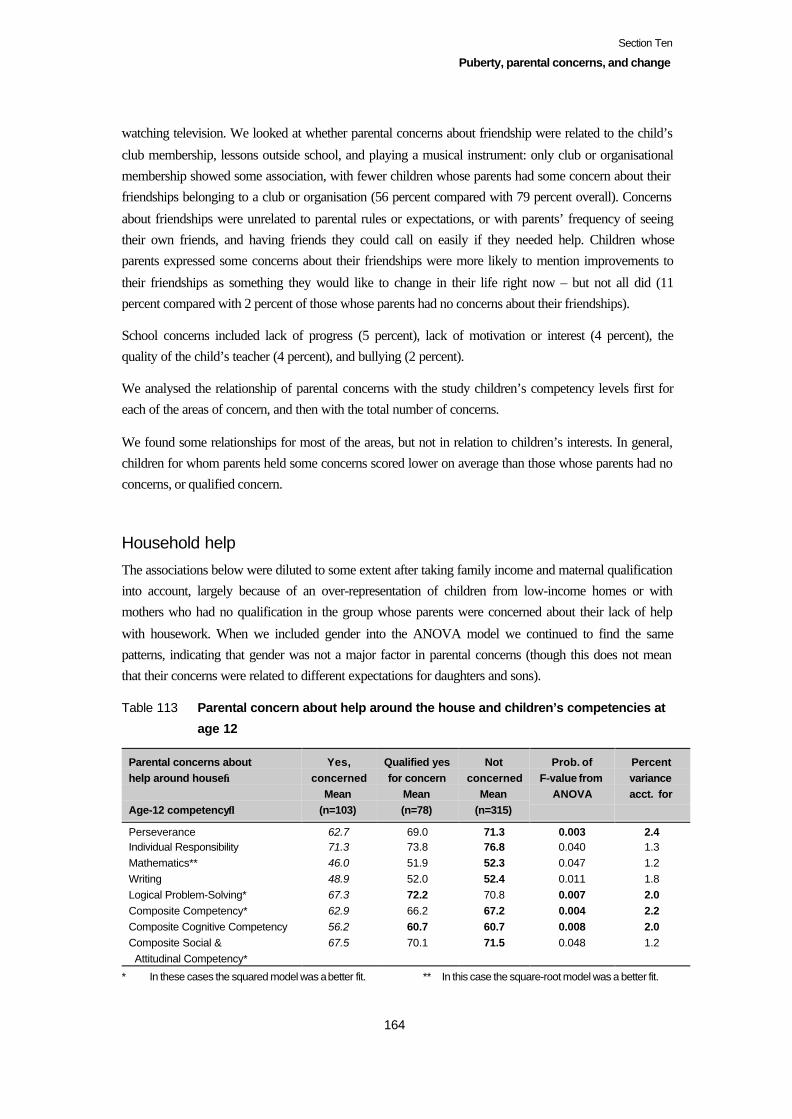
Section Ten
Puberty, parental concerns, and change
164
watching television. We looked at whether parental concerns about friendship were related to the child’s
club membership, lessons outside school, and playing a musical instrument: only club or organisationalmembership showed some association, with fewer children whose parents had some concern about theirfriendships belonging to a club or organisation (56 percent compared with 79 percent overall). Concerns
about friendships were unrelated to parental rules or expectations, or with parents’ frequency of seeingtheir own friends, and having friends they could call on easily if they needed help. Children whoseparents expressed some concerns about their friendships were more likely to mention improvements to
their friendships as something they would like to change in their life right now – but not all did (11percent compared with 2 percent of those whose parents had no concerns about their friendships).
School concerns included lack of progress (5 percent), lack of motivation or interest (4 percent), thequality of the child’s teacher (4 percent), and bullying (2 percent).
We analysed the relationship of parental concerns with the study children’s competency levels first foreach of the areas of concern, and then with the total number of concerns.
We found some relationships for most of the areas, but not in relation to children’s interests. In general,children for whom parents held some concerns scored lower on average than those whose parents had noconcerns, or qualified concern.
Household help
The associations below were diluted to some extent after taking family income and maternal qualificationinto account, largely because of an over-representation of children from low-income homes or withmothers who had no qualification in the group whose parents were concerned about their lack of help
with housework. When we included gender into the ANOVA model we continued to find the samepatterns, indicating that gender was not a major factor in parental concerns (though this does not meanthat their concerns were related to different expectations for daughters and sons).
Table 113 Parental concern about help around the house and children’s competencies at
age 12
Parental concerns abouthelp around house→
Age-12 competency↓
Yes,concerned
Mean(n=103)
Qualified yesfor concern
Mean(n=78)
Notconcerned
Mean(n=315)
Prob. ofF-value from
ANOVA
Percentvarianceacct. for
Perseverance 62.7 69.0 71.3 0.003 2.4Individual Responsibility 71.3 73.8 76.8 0.040 1.3Mathematics** 46.0 51.9 52.3 0.047 1.2Writing 48.9 52.0 52.4 0.011 1.8Logical Problem-Solving* 67.3 72.2 70.8 0.007 2.0Composite Competency* 62.9 66.2 67.2 0.004 2.2Composite Cognitive Competency 56.2 60.7 60.7 0.008 2.0Composite Social & Attitudinal Competency*
67.5 70.1 71.5 0.048 1.2
* In these cases the squared model was a better fit. ** In this case the square-root model was a better fit.

Section Ten
Puberty, parental concerns, and change
165
The mean scores are percentages, not raw scores. The highest scores for each competency are in bold type, the lowest initalics.
Home behaviourIntriguingly, social skills with adults (in the school) was the only competency where we found no relation
with parental concern about their child’s behaviour at home. The relationships we found were dilutedwhen we took maternal qualification into account, and to a lesser extent, family income. This is becausethere was an under-representation of children whose mothers had a tertiary or university qualification, or
who came from high-income families, in the group whose parents were concerned about their homebehaviour.
Table 114 Parental concern about home behaviour and children’s competencies at age 12
Parental concerns abouthome behaviour→
Age-12 competency↓
Yes,concerned
Mean(n=63)
Qualifiedyes for
concernMean
(n=121)
Notconcerned
Mean(n=312)
Prob. ofF-value
fromANOVA
Percentvariance
accountedfor
Curiosity 56.9 60.3 63.7^ 0.020 1.6Perseverance 62.0 67.3 71.3^ 0.005 2.1Individual Responsibility 71.0 73.4 76.7^ 0.058 1.1Social Skills with Peers* 67.4 69.0 72.3^ 0.018 1.6Communication* 64.6 66.4 71.0^ 0.002 2.5Mathematics** 43.3 47.1 54.0 0.0004 3.1PAT Reading Comprehension 48.8 49.7^^ 57.1^^ 0.0004 3.1Burt Word Reading* 72.5 75.2 78.5 0.007 2.0Writing 46.9 50.2 53.1 < 0.0001 4.6Reading Age (yrs, mo) 12.2 12.7 12.11^^ 0.012 1.8Logical Problem-Solving* 67.0 68.1 71.9 0.001 2.7Composite Competency* 61.4 64.0^^ 68.0^^^ < 0.0001 4.3Composite Cognitive Competency 54.5 57.2^^ 61.8^^ < 0.0001 4.6Composite Social & Attitudinal Competency*
65.9 68.7 72.1^ 0.002 2.4
* In these cases the squared model was a better fit. ** In this case the square-root model was a better fit.^ One fewer in this mean. ^^ Two fewer in this mean. ^^^ Three fewer in this mean.The mean scores are percentages, not raw scores. The highest scores for each competency are in bold type, the lowest initalics.
Self-esteem/self-confidenceHere the associations are mainly with the attitudinal and social competencies. The associations foundremained after taking family income, maternal qualification, and gender into account.

Section Ten
Puberty, parental concerns, and change
166
Table 115 Parental concern about self-confidence and children’s competencies at age 12
Parental concerns aboutself-confidence→
Age-12 competency↓
Yes,concerned
Mean(n=80)
Qualifiedyes for
concernMean
(n=108)
Notconcerned
Mean(n=308)
Prob. ofF-value
fromANOVA
Percentvarianceacct. for
Curiosity 55.9^ 59.2 64.6 0.0003 3.3Perseverance 62.1^ 68.6 71.1 0.005 2.1Individual Responsibility 69.6^ 75.0 76.7 0.018 1.6Social Skills with Peers* 65.2^ 70.2 72.5 0.0005 3.0Social Skills with Adults 70.8^ 75.3 78.5 0.002 2.5Communication* 62.6^ 67.6 71.3 0.0002 3.4Burt Word Reading* 72.4 77.8 77.8 0.024 1.5Writing 48.8 52.0 52.2 0.020 1.6Reading Age (yrs, mo) 12.2^ 12.9 12.10 0.019 1.6Composite Competency* 61.0^ 65.5^ 67.7 0.0001 3.7Composite Cognitive Competency 56.2 60.0^ 60.5 0.029 1.4Composite Social & Attitudinal Competency*
64.4^ 69.3 72.4 < 0.0001 4.0
* In these cases the squared model was a better fit. ^ One fewer in this mean.The mean scores are percentages, not raw scores. The highest scores for each competency are in bold type, the lowest initalics.
FriendshipsDispositional and social skills were the main areas which were related to parental concerns aboutfriendships, though there was also an association with Reading Age. These associations remained aftertaking into account family income, maternal qualification, and gender.
Table 116 Parental concern about friendships and children’s competencies at age 12
Parental concerns aboutfriendships→
Age-12 competency↓
Yes,concerned
Mean(n=57)
Qualifiedyes for
concernMean(n=69)
Notconcerned
Mean(n=370)
Prob. ofF-value
fromANOVA
Percentvarianceacct. for
Perseverance 59.2 68.1^ 70.8 0.0009 2.8Individual Responsibility 67.5 74.3^ 76.5 0.005 2.1Social Skills with Peers* 64.2 68.8^ 72.3 0.0006 3.0Social Skills with Adults 72.2 74.3^ 77.7 0.052 1.2Communication* 63.5 66.7^ 70.4 0.026 1.5Reading Age 12.0 12.8^ 12.10^ 0.006 2.0Logical Problem-Solving* 66.3 69.5 71.1 0.027 1.5Composite Competency* 60.7 65.3^^ 67.2^^^ 0.003 2.4Composite Cognitive Competency 55.7 59.9^ 60.3^^^ 0.042 1.3Composite Social & Attitudinal Competency*
64.1 69.2^ 71.7 0.003 2.4
* In these cases the squared model was a better fit. ^ One fewer in this mean.^^ Two fewer in this mean. ^^ ̂ Three fewer in this mean.The mean scores are percentages, not raw scores. The highest scores for each competency are in bold type, the lowest initalics.
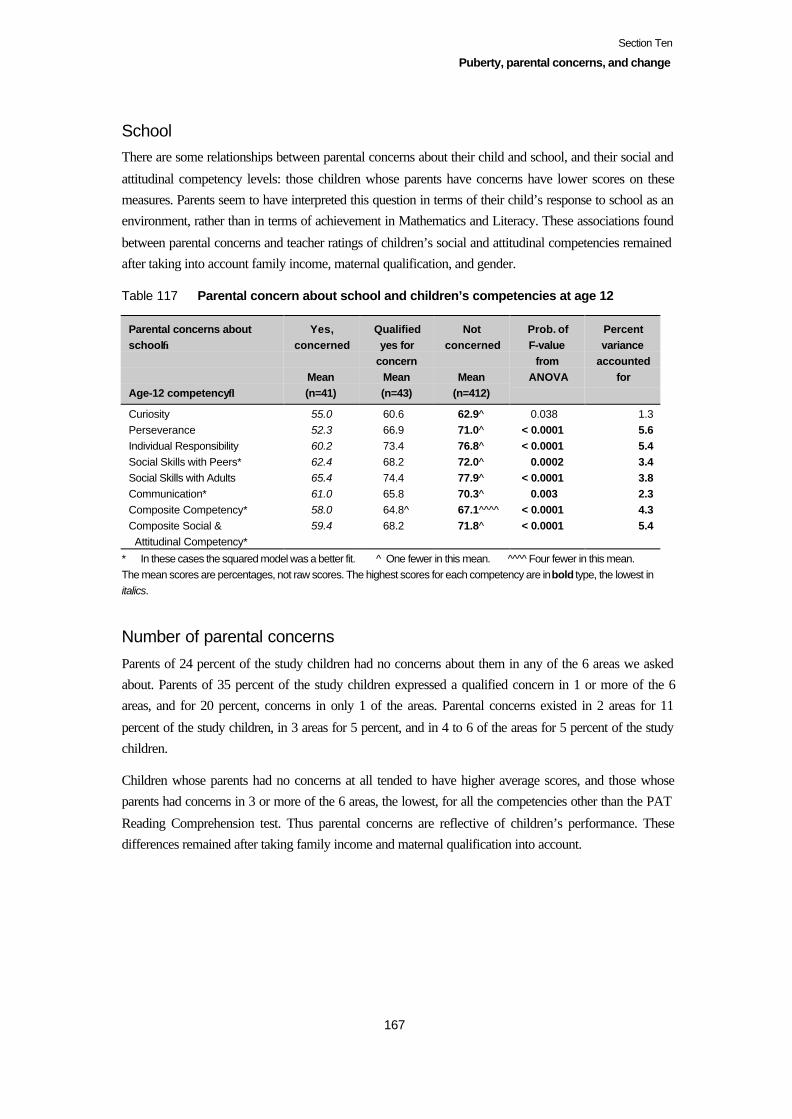
Section Ten
Puberty, parental concerns, and change
167
SchoolThere are some relationships between parental concerns about their child and school, and their social and
attitudinal competency levels: those children whose parents have concerns have lower scores on thesemeasures. Parents seem to have interpreted this question in terms of their child’s response to school as anenvironment, rather than in terms of achievement in Mathematics and Literacy. These associations found
between parental concerns and teacher ratings of children’s social and attitudinal competencies remainedafter taking into account family income, maternal qualification, and gender.
Table 117 Parental concern about school and children’s competencies at age 12
Parental concerns aboutschool→
Age-12 competency↓
Yes,concerned
Mean(n=41)
Qualifiedyes for
concernMean(n=43)
Notconcerned
Mean(n=412)
Prob. ofF-value
fromANOVA
Percentvariance
accountedfor
Curiosity 55.0 60.6 62.9^ 0.038 1.3Perseverance 52.3 66.9 71.0^ < 0.0001 5.6Individual Responsibility 60.2 73.4 76.8^ < 0.0001 5.4Social Skills with Peers* 62.4 68.2 72.0^ 0.0002 3.4Social Skills with Adults 65.4 74.4 77.9^ < 0.0001 3.8Communication* 61.0 65.8 70.3^ 0.003 2.3Composite Competency* 58.0 64.8^ 67.1^^^^ < 0.0001 4.3Composite Social & Attitudinal Competency*
59.4 68.2 71.8^ < 0.0001 5.4
* In these cases the squared model was a better fit. ^ One fewer in this mean. ^^^ ̂Four fewer in this mean.The mean scores are percentages, not raw scores. The highest scores for each competency are in bold type, the lowest initalics.
Number of parental concerns
Parents of 24 percent of the study children had no concerns about them in any of the 6 areas we askedabout. Parents of 35 percent of the study children expressed a qualified concern in 1 or more of the 6areas, and for 20 percent, concerns in only 1 of the areas. Parental concerns existed in 2 areas for 11
percent of the study children, in 3 areas for 5 percent, and in 4 to 6 of the areas for 5 percent of the studychildren.
Children whose parents had no concerns at all tended to have higher average scores, and those whoseparents had concerns in 3 or more of the 6 areas, the lowest, for all the competencies other than the PAT
Reading Comprehension test. Thus parental concerns are reflective of children’s performance. Thesedifferences remained after taking family income and maternal qualification into account.
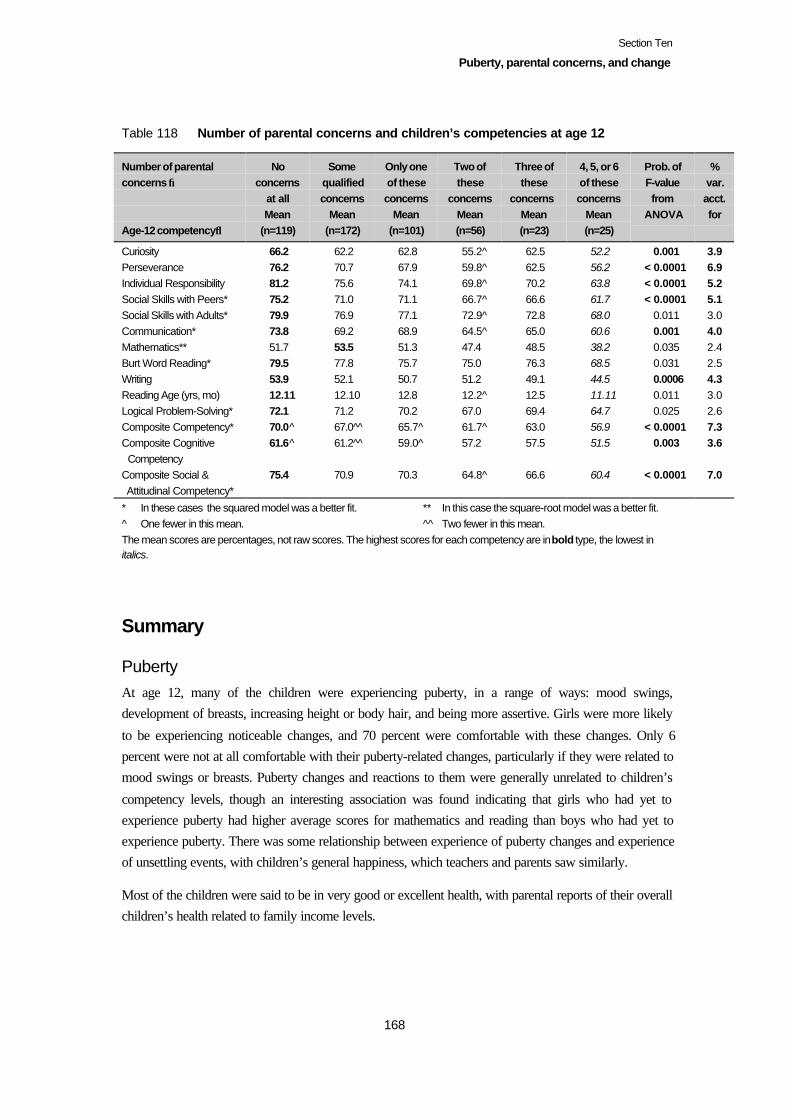
Section Ten
Puberty, parental concerns, and change
168
Table 118 Number of parental concerns and children’s competencies at age 12
Number of parentalconcerns →
Age-12 competency↓
Noconcerns
at allMean
(n=119)
Somequalifiedconcerns
Mean(n=172)
Only oneof theseconcerns
Mean(n=101)
Two ofthese
concernsMean(n=56)
Three ofthese
concernsMean(n=23)
4, 5, or 6of theseconcerns
Mean(n=25)
Prob. ofF-valuefrom
ANOVA
%var.acct.for
Curiosity 66.2 62.2 62.8 55.2^ 62.5 52.2 0.001 3.9Perseverance 76.2 70.7 67.9 59.8^ 62.5 56.2 < 0.0001 6.9Individual Responsibility 81.2 75.6 74.1 69.8^ 70.2 63.8 < 0.0001 5.2Social Skills with Peers* 75.2 71.0 71.1 66.7^ 66.6 61.7 < 0.0001 5.1Social Skills with Adults* 79.9 76.9 77.1 72.9^ 72.8 68.0 0.011 3.0Communication* 73.8 69.2 68.9 64.5^ 65.0 60.6 0.001 4.0Mathematics** 51.7 53.5 51.3 47.4 48.5 38.2 0.035 2.4Burt Word Reading* 79.5 77.8 75.7 75.0 76.3 68.5 0.031 2.5Writing 53.9 52.1 50.7 51.2 49.1 44.5 0.0006 4.3Reading Age (yrs, mo) 12.11 12.10 12.8 12.2^ 12.5 11.11 0.011 3.0Logical Problem-Solving* 72.1 71.2 70.2 67.0 69.4 64.7 0.025 2.6Composite Competency* 70.0^ 67.0^^ 65.7^ 61.7^ 63.0 56.9 < 0.0001 7.3Composite Cognitive Competency
61.6^ 61.2^^ 59.0^ 57.2 57.5 51.5 0.003 3.6
Composite Social & Attitudinal Competency*
75.4 70.9 70.3 64.8^ 66.6 60.4 < 0.0001 7.0
* In these cases the squared model was a better fit. ** In this case the square-root model was a better fit.^ One fewer in this mean. ^^ Two fewer in this mean.The mean scores are percentages, not raw scores. The highest scores for each competency are in bold type, the lowest initalics.
Summary
PubertyAt age 12, many of the children were experiencing puberty, in a range of ways: mood swings,development of breasts, increasing height or body hair, and being more assertive. Girls were more likely
to be experiencing noticeable changes, and 70 percent were comfortable with these changes. Only 6percent were not at all comfortable with their puberty-related changes, particularly if they were related tomood swings or breasts. Puberty changes and reactions to them were generally unrelated to children’s
competency levels, though an interesting association was found indicating that girls who had yet toexperience puberty had higher average scores for mathematics and reading than boys who had yet toexperience puberty. There was some relationship between experience of puberty changes and experienceof unsettling events, with children’s general happiness, which teachers and parents saw similarly.
Most of the children were said to be in very good or excellent health, with parental reports of their overallchildren’s health related to family income levels.
Section Ten
Puberty, parental concerns, and change
169
Coping with upsetsThere was a slightly higher proportion of children whose parents thought something was upsetting them
at age 12 than there had been at earlier school ages. Parents were most aware of family-related reasons.As at earlier ages, most children who were upset could cope with it; 11 percent of those who were upsetcould not. Experiences of upsets and how children coped with them was largely unrelated to family
characteristics or gender. We found that those whose coping with being upset varied had lower scores forPerseverance and Social Skills with Peers. There was a tendency for children who were coping poorly toscore lower on the cognitive competencies, though this did not remain after accounting for maternalqualification.
Parental concernsTwo-thirds or more of the parents of the study children had no concerns about their age-12 child inrelation to help around the house, their self-esteem, behaviour at home, friendships, interests, or school.Help around the house, self-esteem, and behaviour at home are the main areas of parental concern.
There are some interesting trends relating to maternal qualification: parents with university qualificationsseem more tolerant of their age-12 children becoming assertive, and may be less likely to see thatassertiveness as contesting parental authority. Children’s home behaviour and help with housework aremore likely to be concerns where mothers have no qualification, or family incomes are low.
In general, children for whom parents held some concerns had lower average scores; the associationswere often diluted after taking maternal qualification and family income into account because ofdifferences in parental concerns linked to these 2 family resources. Associations between the study
children’s competency scores and parental concerns about friendship, self-esteem, and school were noteroded by family resource levels or gender. Concern about school was not related to the cognitivecompetencies, but to the social and attitudinal competencies.
Residential mobility
Sixty-nine percent of the study children had now moved house at least once since they were born, and 14percent had moved at least 5 times. Mobility between houses was more common for children in 2-parentfamilies with 1 step-parent, for children from low-income families, children of 1-parent families, and
those whose mothers had no maternal qualification. There were associations showing lower averagemathematics and Social Skills with Peers scores for children who had moved house 5 or more times.Maternal qualification and family income appeared to be protective factors for the other competencieswith regard to a high number of house shifts.
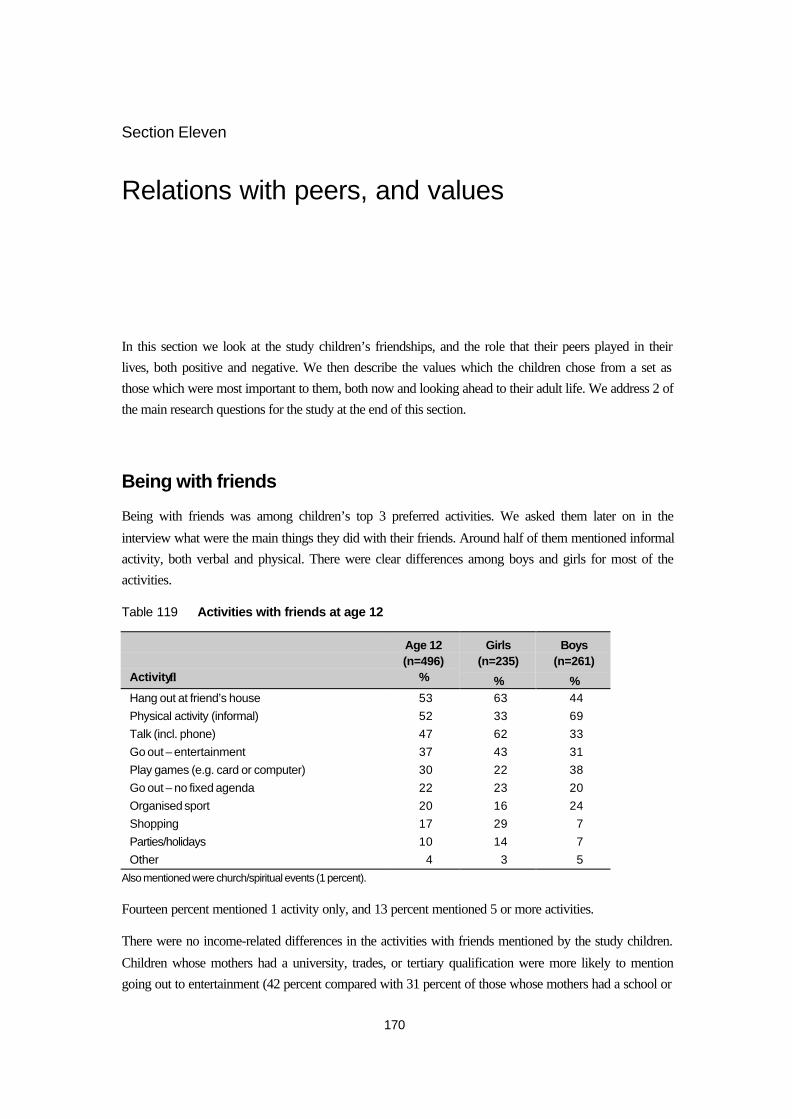
170
Section Eleven
Relations with peers, and values
In this section we look at the study children’s friendships, and the role that their peers played in theirlives, both positive and negative. We then describe the values which the children chose from a set asthose which were most important to them, both now and looking ahead to their adult life. We address 2 ofthe main research questions for the study at the end of this section.
Being with friends
Being with friends was among children’s top 3 preferred activities. We asked them later on in the
interview what were the main things they did with their friends. Around half of them mentioned informalactivity, both verbal and physical. There were clear differences among boys and girls for most of theactivities.
Table 119 Activities with friends at age 12
Activity↓
Age 12(n=496)
%
Girls(n=235)
%
Boys(n=261)
%Hang out at friend’s house 53 63 44Physical activity (informal) 52 33 69Talk (incl. phone) 47 62 33Go out – entertainment 37 43 31Play games (e.g. card or computer) 30 22 38Go out – no fixed agenda 22 23 20Organised sport 20 16 24Shopping 17 29 7Parties/holidays 10 14 7Other 4 3 5
Also mentioned were church/spiritual events (1 percent).
Fourteen percent mentioned 1 activity only, and 13 percent mentioned 5 or more activities.
There were no income-related differences in the activities with friends mentioned by the study children.
Children whose mothers had a university, trades, or tertiary qualification were more likely to mentiongoing out to entertainment (42 percent compared with 31 percent of those whose mothers had a school or
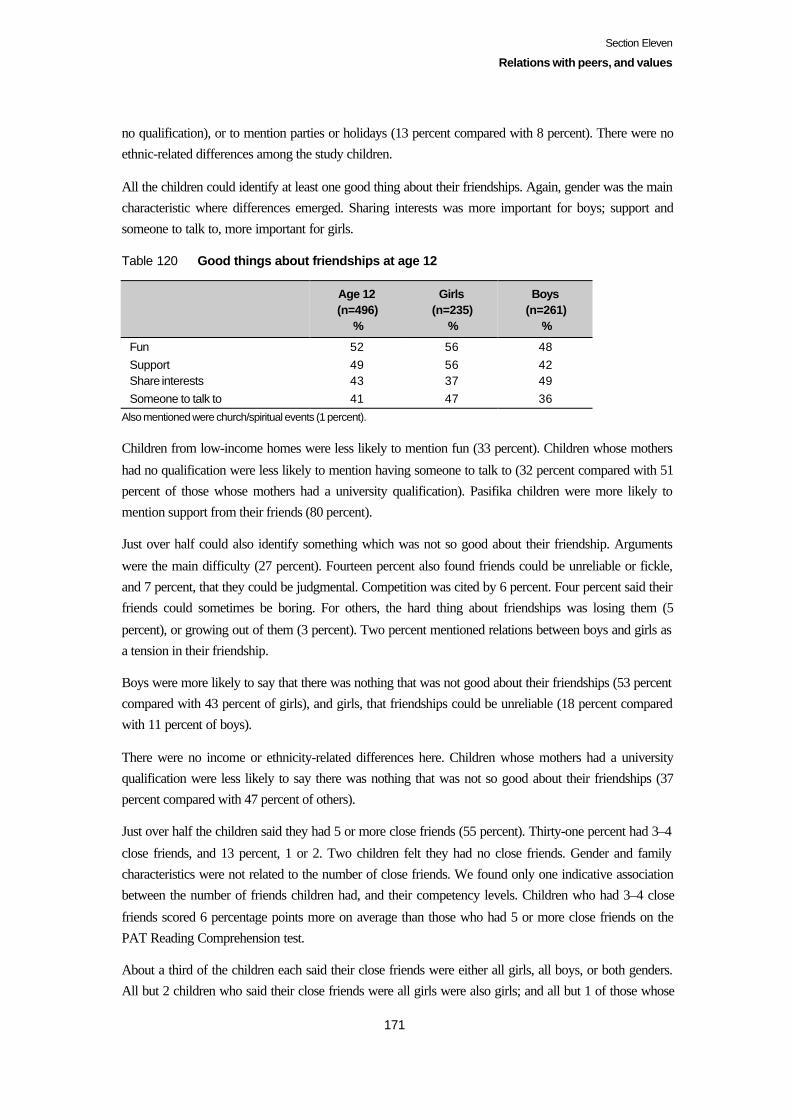
Section Eleven
Relations with peers, and values
171
no qualification), or to mention parties or holidays (13 percent compared with 8 percent). There were noethnic-related differences among the study children.
All the children could identify at least one good thing about their friendships. Again, gender was the maincharacteristic where differences emerged. Sharing interests was more important for boys; support andsomeone to talk to, more important for girls.
Table 120 Good things about friendships at age 12
Age 12(n=496)
%
Girls(n=235)
%
Boys(n=261)
%
Fun 52 56 48Support 49 56 42Share interests 43 37 49Someone to talk to 41 47 36
Also mentioned were church/spiritual events (1 percent).
Children from low-income homes were less likely to mention fun (33 percent). Children whose mothers
had no qualification were less likely to mention having someone to talk to (32 percent compared with 51percent of those whose mothers had a university qualification). Pasifika children were more likely tomention support from their friends (80 percent).
Just over half could also identify something which was not so good about their friendship. Arguments
were the main difficulty (27 percent). Fourteen percent also found friends could be unreliable or fickle,and 7 percent, that they could be judgmental. Competition was cited by 6 percent. Four percent said theirfriends could sometimes be boring. For others, the hard thing about friendships was losing them (5
percent), or growing out of them (3 percent). Two percent mentioned relations between boys and girls asa tension in their friendship.
Boys were more likely to say that there was nothing that was not good about their friendships (53 percentcompared with 43 percent of girls), and girls, that friendships could be unreliable (18 percent comparedwith 11 percent of boys).
There were no income or ethnicity-related differences here. Children whose mothers had a universityqualification were less likely to say there was nothing that was not so good about their friendships (37percent compared with 47 percent of others).
Just over half the children said they had 5 or more close friends (55 percent). Thirty-one percent had 3–4
close friends, and 13 percent, 1 or 2. Two children felt they had no close friends. Gender and familycharacteristics were not related to the number of close friends. We found only one indicative associationbetween the number of friends children had, and their competency levels. Children who had 3–4 close
friends scored 6 percentage points more on average than those who had 5 or more close friends on thePAT Reading Comprehension test.
About a third of the children each said their close friends were either all girls, all boys, or both genders.All but 2 children who said their close friends were all girls were also girls; and all but 1 of those whose
Section Eleven
Relations with peers, and values
172
close friends were all boys were boys. Forty-two percent of the boys said their close friends included bothboys and girls, compared with 27 percent of the girls.
Parents and friendsNinety-one percent of the study children felt that their parents liked their friends, or most of them. Eightpercent thought their parents liked only some of their friends, and 1 percent thought their parents did notlike their friends. These views were unrelated to child gender or family characteristics.
Parental judgment was still respected, and was more weighty than friendships. When we asked the studychildren what they would do if their parents told them not to do something and their friends really wantedthem to do it, 66 percent of the study children would not do the activity, and another 6 percent would try
to persuade their friends not to do it. Fourteen percent would try to persuade their parents to let them.Eleven percent thought it would depend what the activity was. Only 6 percent would go ahead and do theactivity their friends proposed, but their parents opposed. Girls were more likely to try to persuade their
parents to let them do the activity (17 percent compared with 10 percent of boys), and boys more likely todo it anyway (8 percent compared with 3 percent of girls).
There were no income or ethnicity-related differences here. Children whose mother had no qualificationwere more likely not to do something their parents had told them not to do (78 percent, declining to 60percent of children with whose mother had a university qualification).
The role of friendship in children’s lives at age 12We undertook a factor analysis using the material from children’s answers which had a bearing on therole friendships played in their lives, and parents’ answers as to whether they had a concern about theirchild’s friendship (detailed in Section Ten). These were all open-ended questions.
The factors drawn from children’s descriptions of their relations with their friends, and the time theyspent with friends, yielded 6 factors. We used the average of children’s scores for the items within eachfactor to give us categories to use in cross-tabulation to answer one of the research questions, and this alsogives us another dimension to the picture of the study children’s patterns of friendship.
• Friendship is a key value. This comprised children’s responses to how often they spoke to friends onthe phone, hang out with friends, and whether these were among the activities they liked most.Twenty-six percent of the study children scored highly on this factor, indicating that friendship was akey value to them. It was of some importance to 61 percent, and of low importance to 14 percent.
• Friendships focus on fun. This comprised the items that fun was what they enjoyed in their friendship,and what they did in their friendship was hang out at a friend’s house, or share parties or holidays, anda reverse score on physical activity.
Twenty-two percent of the study children scored highly on this factor, indicating that fun was whatthey valued most in their friendships. Fun in friendships was of some importance for 63 percent of thestudy children, and played a limited role for 16 percent.
Section Eleven
Relations with peers, and values
173
• Friendships focus on communication. This comprised the items talk as one of the main aspects of the
friendships, someone to talk to was an enjoyable part of friendship, and being bored was one of theless enjoyable parts.Communication in friendships was highly regarded by 25 percent of the study children. It was ofsome importance to 40 percent, and of limited importance to 36 percent.
• Matter of fact friendships. This comprised the items that there was nothing bad about the friendships,that what was not enjoyed about friendships was that they were unreliable/fickle, or that there werearguments.
Forty-eight percent of the study children enjoyed good friendships in relation to these aspects, and 48percent, quite good friendships. Three percent did not have good friendships.
• Formal friendships. This comprised the items that friendship included organised sports and going tochurch, and what was not enjoyed was competition and relations with the opposite sex.Eight percent of the children scored highly on this factor, indicating a formal structure to friendships.
• Aimless friendships. This comprised the (reverse scored) items that friendship was to share interestsand support, that it included hanging out with friends, and parental concern about the friendships. Inother words, a high score for this factor indicated a lack of content in the friendships.
Twelve percent of the children had high scores on this factor, indicating mainly aimless friendships.Sixty-nine percent had some experience of aimless behaviour in their friendships, and 19 percent, verylittle experience.
Cronbach’s alpha values for the factors were relatively low, with the highest being 0.61. The alpha values
for the factors Friendship is a key value, Matter of fact friendships, and Aimless friendships were about0.6, and those for the other factors were much lower. We decided to use all the factors in further analysis,as the groupings of items in them appeared to have a logical basis.
We cross-tabulated the children’s scores on these factors with 4 key aspects of children’s lives which are
linked to their performance at age 12: enjoyment of reading, hours spent watching television, maternalqualification, and school socio-economic decile. Different patterns of friendship showed only a fewassociations with these key aspects. Children who enjoyed reading were somewhat more likely to score
highly on the Friendships focus on communication factor (29 percent compared with 18 percent of thosewho did not enjoy reading, or had mixed views about it). Children who scored highly on the Aimlessfriendships factor were somewhat more likely to be watching television for more than 2 hours a day (54percent compared with 43 percent overall).
Bullying and getting a hard time at school
Twenty-four percent of the study children said they had been picked on or bullied by someone in the last
couple of months. This is much the same as the rate of bullying at age 10. Most of this occurred at school(20 percent), with 4 percent having been bullied at home, and 2 percent in a public place. Most of thebullying was verbal, and included teasing and being called names (17 percent). Eight percent of the

Section Eleven
Relations with peers, and values
174
students reported physical bullying, and 2 percent, the use of weapons. Two percent each also reportedbeing left out or rejected, or ganged up on.
The main response to the bullying was to ignore it (10 percent). Five percent of the children had beenassertive, and 4 percent each had told their teacher or parent. Three percent fought back, and another 3percent hid or ran away.
Fifteen percent of the study children said they had bullied or picked on someone else in the same period.
Again, most of this was verbal (11 percent). Four percent had physically bullied another child. Onepercent mentioned ganging up on or leaving out another child. There were no gender or ethnicdifferences apparent in experiences of bullying.
Two-thirds of the study children had neither bullied nor been bullied in the past few months.
Children who had bullied in the last few months were around twice as likely to also have been bullied (45
percent compared with 21 percent of those who had not bullied). Thirty-four percent had had verbalabuse compared with 15 percent of those who did not bully, 16 percent had been physically bullied,compared with 7 percent of those who did not bully, and 9 percent had been left out or ganged up oncompared with 3 percent of those who did not bully.
We looked to see if bullying was associated with the children’s gender, family characteristics, and schoolcharacteristics. Reports of being bullied or of bullying, types of bullying, and responses to bullying didnot vary by gender. Experiences of being bullied were related to maternal qualification, rising from 8
percent of the study children whose mother had a university qualification saying that school was a placewhere they were occasionally bullied, to 27 percent of those whose mother had no qualification.
There was no association with school type or ownership. Almost twice as many of the study students indecile 5–10 schools said they had been bullied than their decile 1–4 peers (27 percent compared with 15percent).
At age 10, we found that children who had recently taken part in bullying – whether as victim or bully –tended to have lower scores on our competency measures than those who had not. This remains the caseat age 12.
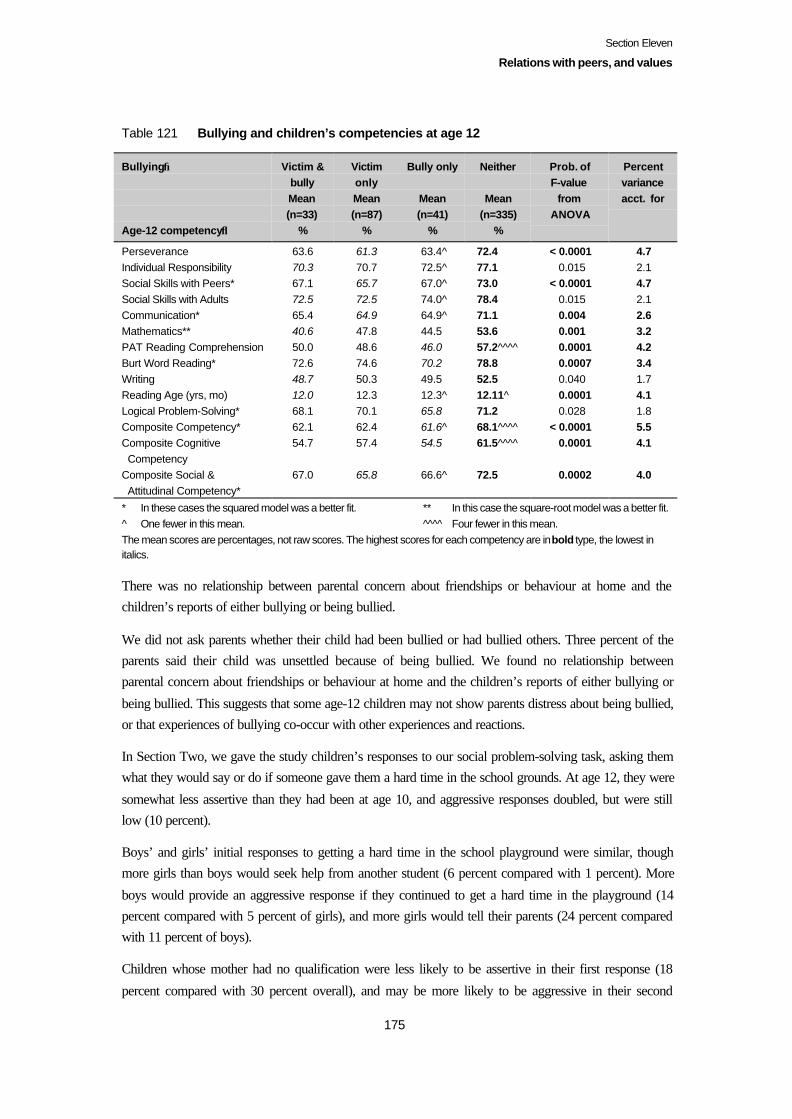
Section Eleven
Relations with peers, and values
175
Table 121 Bullying and children’s competencies at age 12
Bullying→
Age-12 competency↓
Victim &bullyMean(n=33)
%
VictimonlyMean(n=87)
%
Bully only
Mean(n=41)
%
Neither
Mean(n=335)
%
Prob. ofF-value
fromANOVA
Percentvarianceacct. for
Perseverance 63.6 61.3 63.4^ 72.4 < 0.0001 4.7Individual Responsibility 70.3 70.7 72.5^ 77.1 0.015 2.1Social Skills with Peers* 67.1 65.7 67.0^ 73.0 < 0.0001 4.7Social Skills with Adults 72.5 72.5 74.0^ 78.4 0.015 2.1Communication* 65.4 64.9 64.9^ 71.1 0.004 2.6Mathematics** 40.6 47.8 44.5 53.6 0.001 3.2PAT Reading Comprehension 50.0 48.6 46.0 57.2^^^^ 0.0001 4.2Burt Word Reading* 72.6 74.6 70.2 78.8 0.0007 3.4Writing 48.7 50.3 49.5 52.5 0.040 1.7Reading Age (yrs, mo) 12.0 12.3 12.3^ 12.11^ 0.0001 4.1Logical Problem-Solving* 68.1 70.1 65.8 71.2 0.028 1.8Composite Competency* 62.1 62.4 61.6^ 68.1^^^^ < 0.0001 5.5Composite Cognitive Competency
54.7 57.4 54.5 61.5^^^^ 0.0001 4.1
Composite Social & Attitudinal Competency*
67.0 65.8 66.6^ 72.5 0.0002 4.0
* In these cases the squared model was a better fit. ** In this case the square-root model was a better fit.^ One fewer in this mean. ^^^^ Four fewer in this mean.The mean scores are percentages, not raw scores. The highest scores for each competency are in bold type, the lowest initalics.
There was no relationship between parental concern about friendships or behaviour at home and thechildren’s reports of either bullying or being bullied.
We did not ask parents whether their child had been bullied or had bullied others. Three percent of theparents said their child was unsettled because of being bullied. We found no relationship betweenparental concern about friendships or behaviour at home and the children’s reports of either bullying or
being bullied. This suggests that some age-12 children may not show parents distress about being bullied,or that experiences of bullying co-occur with other experiences and reactions.
In Section Two, we gave the study children’s responses to our social problem-solving task, asking themwhat they would say or do if someone gave them a hard time in the school grounds. At age 12, they were
somewhat less assertive than they had been at age 10, and aggressive responses doubled, but were stilllow (10 percent).
Boys’ and girls’ initial responses to getting a hard time in the school playground were similar, thoughmore girls than boys would seek help from another student (6 percent compared with 1 percent). More
boys would provide an aggressive response if they continued to get a hard time in the playground (14percent compared with 5 percent of girls), and more girls would tell their parents (24 percent comparedwith 11 percent of boys).
Children whose mother had no qualification were less likely to be assertive in their first response (18
percent compared with 30 percent overall), and may be more likely to be aggressive in their second
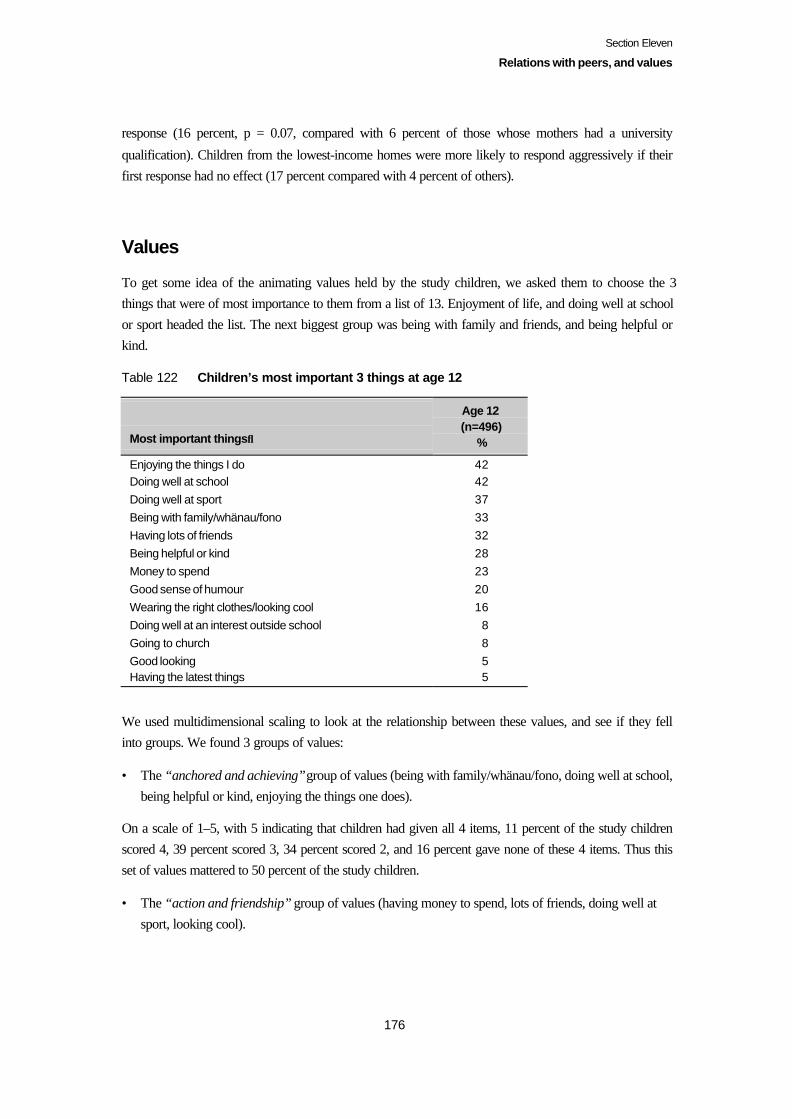
Section Eleven
Relations with peers, and values
176
response (16 percent, p = 0.07, compared with 6 percent of those whose mothers had a university
qualification). Children from the lowest-income homes were more likely to respond aggressively if theirfirst response had no effect (17 percent compared with 4 percent of others).
Values
To get some idea of the animating values held by the study children, we asked them to choose the 3things that were of most importance to them from a list of 13. Enjoyment of life, and doing well at schoolor sport headed the list. The next biggest group was being with family and friends, and being helpful orkind.
Table 122 Children’s most important 3 things at age 12
Most important things↓
Age 12(n=496)
%
Enjoying the things I do 42Doing well at school 42Doing well at sport 37Being with family/whänau/fono 33Having lots of friends 32Being helpful or kind 28Money to spend 23Good sense of humour 20Wearing the right clothes/looking cool 16Doing well at an interest outside school 8Going to church 8Good looking 5Having the latest things 5
We used multidimensional scaling to look at the relationship between these values, and see if they fellinto groups. We found 3 groups of values:
• The “anchored and achieving”group of values (being with family/whänau/fono, doing well at school,being helpful or kind, enjoying the things one does).
On a scale of 1–5, with 5 indicating that children had given all 4 items, 11 percent of the study childrenscored 4, 39 percent scored 3, 34 percent scored 2, and 16 percent gave none of these 4 items. Thus thisset of values mattered to 50 percent of the study children.
• The “action and friendship” group of values (having money to spend, lots of friends, doing well atsport, looking cool).
Section Eleven
Relations with peers, and values
177
On a scale of 1–5, with 5 indicating that children had given all 4 items, 5 percent of the study children
scored 4, 26 percent scored 3, 41 percent scored 2, and 28 percent gave none of these 4 items. This groupof values mattered (score 3 or more) to 31 percent of the study children.
• The “appearances matter” group of values (being good looking, having the latest things).
On a scale of 1–3, with 3 indicating both items were given by a child, 9 percent scored a 2, and 91 percentgave neither of these items. This group of values mattered (score 2 or more) to only 9 percent of the studychildren.
Having a good sense of humour, doing well at an interest outside school, and going to church stood ontheir own.
We used the 3 groupings of values in our analysis of the relations between competency levels andmotivation and peer relations. We found some relationships:
• those with a higher level of social skills at age 10 were more likely to have a high or very high score
for the “action and friendship” group of values at age 12, whereas those with high ratings forPerseverance and Individual Responsibility at age 10 tended not to have high scores for the “actionand friendship” group of values;
• those with high scores for the “action and friendship” group of values were more likely to try topersuade their parents to let them join their friends in an activity their parents did not want them toundertake;
• those with high scores for the “appearances matter” group of values at age 12 tended to have lowerscores for Individual Responsibility and Communication at age 10; and
• those with high scores for the “anchored and achieving” group of values tended to have higherCommunication scores at age 10.
We also cross-tabulated the children’s scores on these 3 groups of values with 4 key aspects of children’slives which are linked to their performance at age 12: enjoyment of reading, hours spent watchingtelevision, maternal qualification, and school socio-economic decile.
Children who had high scores for the “anchored and achieving” group of values were more likely to
enjoy reading (49 percent of those who scored 2 for this factor, compared with 65 percent of those whoscored 1), and were somewhat less likely to watch more than 2 hours television a day (40 percentcompared with 53 percent of those scoring 1). There were no associations with maternal qualification or
school decile. Thus these values may act in concert with the kinds of activities or ways of spending timewhich support children’s achievement.
Children who had high scores for the “action and friendship” group of values were less likely to enjoyreading (47 percent of those who scored 3 or 4 for this factor, compared with 78 percent of those who
scored 1). There were no associations with amount of television watched, maternal qualification, orschool decile.
Children who had high scores for the “appearances matter” set of values were also less likely to enjoyreading (49 percent of those who scored 2 for this factor, compared with 65 percent of those who scored
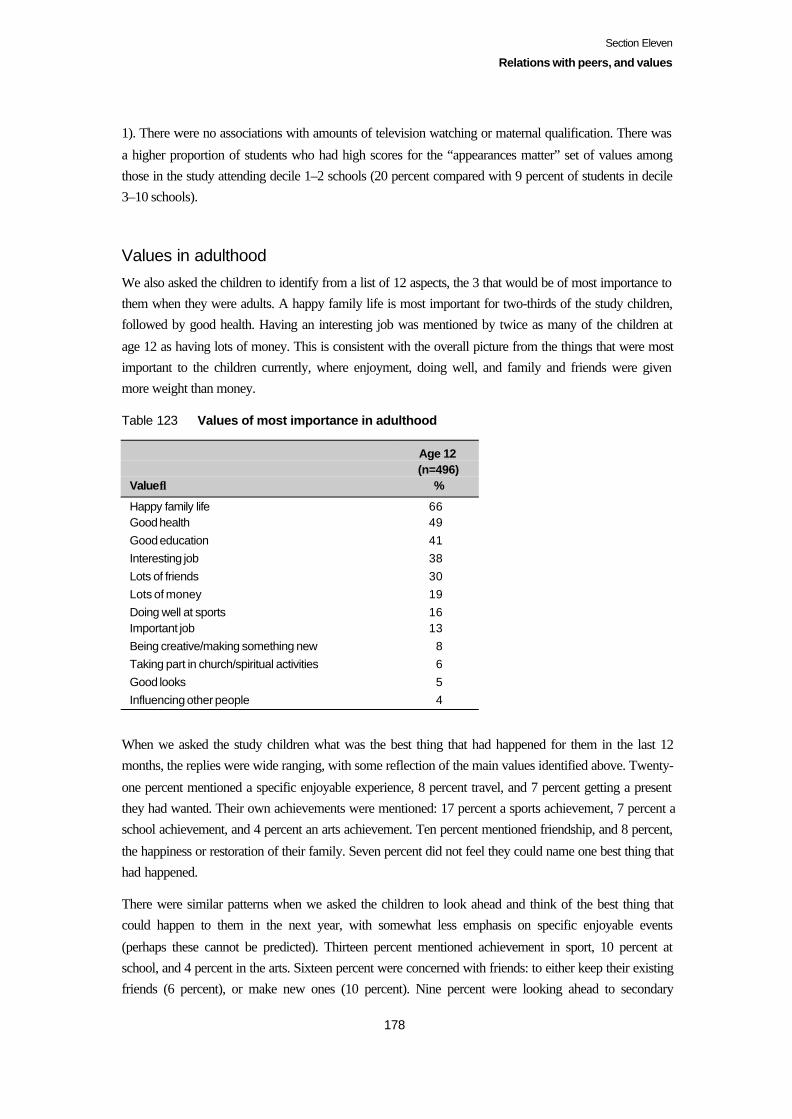
Section Eleven
Relations with peers, and values
178
1). There were no associations with amounts of television watching or maternal qualification. There was
a higher proportion of students who had high scores for the “appearances matter” set of values amongthose in the study attending decile 1–2 schools (20 percent compared with 9 percent of students in decile3–10 schools).
Values in adulthood
We also asked the children to identify from a list of 12 aspects, the 3 that would be of most importance tothem when they were adults. A happy family life is most important for two-thirds of the study children,followed by good health. Having an interesting job was mentioned by twice as many of the children at
age 12 as having lots of money. This is consistent with the overall picture from the things that were mostimportant to the children currently, where enjoyment, doing well, and family and friends were givenmore weight than money.
Table 123 Values of most importance in adulthood
Value↓
Age 12(n=496)
%
Happy family life 66Good health 49Good education 41Interesting job 38Lots of friends 30Lots of money 19Doing well at sports 16Important job 13Being creative/making something new 8Taking part in church/spiritual activities 6Good looks 5Influencing other people 4
When we asked the study children what was the best thing that had happened for them in the last 12months, the replies were wide ranging, with some reflection of the main values identified above. Twenty-
one percent mentioned a specific enjoyable experience, 8 percent travel, and 7 percent getting a presentthey had wanted. Their own achievements were mentioned: 17 percent a sports achievement, 7 percent aschool achievement, and 4 percent an arts achievement. Ten percent mentioned friendship, and 8 percent,
the happiness or restoration of their family. Seven percent did not feel they could name one best thing thathad happened.
There were similar patterns when we asked the children to look ahead and think of the best thing thatcould happen to them in the next year, with somewhat less emphasis on specific enjoyable events
(perhaps these cannot be predicted). Thirteen percent mentioned achievement in sport, 10 percent atschool, and 4 percent in the arts. Sixteen percent were concerned with friends: to either keep their existingfriends (6 percent), or make new ones (10 percent). Nine percent were looking ahead to secondary
Section Eleven
Relations with peers, and values
179
school: 6 percent wanted to get into the school they most wanted to be in, and 3 percent wanted to like
their new school. Eight percent had their eyes on a new possession, and 7 percent mentioned money. Thebest thing for 3 percent would be having their family happy or together, and for 2 percent, to have animprovement in their appearance.
Forty percent of the study children would like to change something in their lives at their age of 12. Seven
percent would like more money. Three or 4 percent mentioned one of a wide range of aspects of their lifethey would like to change: improving a skill, their health, or confidence, changing their family,appearance, or friendship, to have their parents back together again, or to gain a treasured possession.
Relations with children’s peers, and their earlier competencylevels
One of our specific research questions was:
How are children’s earlier competency levels in social skills, parental and teacher reports of their
attitude to school and relevant school behaviour related to their experience at age 12 of their peers(including bullying), and the pattern of their peer relations outside school?
To analyse this, we looked at factors drawn from age-10 data on the Social Skills with Peers measure andteachers’ perspectives on their school behaviour, bullying experience, and attitude to school, and their
relationship with the age-12 friendship factors (described earlier in this section), and children’s bullyingexperiences at age 12.
The factor analysis of the age-10 Social Skills with Peers and teachers’ perspectives on their schoolbehaviour at age 10 showed 6 factors:
• Poor social skills (using competency items showing response to peer pressure, poor work habits, loss
of temper, not working well with others, and teacher descriptions that children were immature orbullied).Five percent of the study children had poor social skills, 25 percent had some poor social skills, 48percent had mostly good social skills, and 21 percent had good social skills.
• Social isolation (using competency items showing child left out by others, not good at making andkeeping friendships, and teacher descriptions that child had low self-esteem, was not popular, or hadno strengths in terms of behaviour).
Five percent of the children were socially isolated, 14 percent were somewhat isolated, 63 percentwere rarely isolated, and 19 percent, never isolated.
• Egotistical (using teacher descriptions that a child was impatient, bossy, self-centred, or a leader).Two percent of the children were very egotistical, 16 percent were somewhat egotistical, and 82percent were not egotistical (in these senses).

Section Eleven
Relations with peers, and values
180
• Co-operative (using teacher descriptions that a child was willing, well-behaved, kind, and made an
effort).Seven percent of the children were very co-operative, 23 percent were mostly co-operative, 39 percentwere mixed in their co-operative behaviour, 29 percent were somewhat unco-operative, and 2 percentwere unco-operative.
• Dutiful (using teacher descriptions that a child was organised, tried hard, was passive, and had somepoor behaviour – an interesting mix of positive and negative behaviours (the latter were reversescored.)
Three percent of the children were very dutiful, 9 percent were mostly dutiful, 33 percent were mixedin their dutiful behaviour, 41 percent were not dutiful (in these senses), and 15 percent were not at alldutiful.
• In own world/creative (using teacher descriptions that a child was creative, unreliable, or lived inhis/her own world, another mix of positive and negative behaviours (the latter were reverse scored).
Ten percent of the children lived in their own world sometimes, 90 percent did not.
The Cronbach’s alpha values for the first 2 factors, poor social skills and isolation, were reasonable (0.75and 0.8 respectively). The Cronbach’s alpha values for the other factors were considerably lower (under0.5). The scales were still used as constituent items in them seemed to be related to some extent.
Two age-10 variables that seemed to “act in isolation” were kept separate. These were the teacher
descriptions of children’s behaviour as aggressive or showing signs of being spoilt. One difficulty foranalysis with these variables is that there were relatively few children at the extreme ends of the scale.The bullying factor combined both children’s and teachers’ responses to create a 4-level factor: definitelynot bullied, bullied in the past, may be bullied, and definitely bullied.
We also included parental answers about the child’s attitude to school at age 10 in our analysis. Wecreated 2 factors for age 12:
• Isolation at school (from children’s ratings to 2 items about their school experience: I get lonely atschool, and I have good friends (reverse scored).
One percent of the study children usually felt isolated at school, 22 percent did sometimes, and 77percent, never.
• Bullied at school (from children’s rating on the item about their school experience: I get bullied atschool, and their response to whether they had been bullied in the last few months).
Twelve percent of the study children were usually bullied, 18 percent sometimes, and 70 percent,never.
We then undertook a series of cross-tabulations with chi-squared tests of the relationship between theage-10 factors and the age-12 factors, followed by a canonical correlation analysis. An attempt to use
classification trees was not particularly successful. There was probably too much noise to be able to buildan adequate model with so many variables, given a sample size of 495. Similarly, fitting log-linear
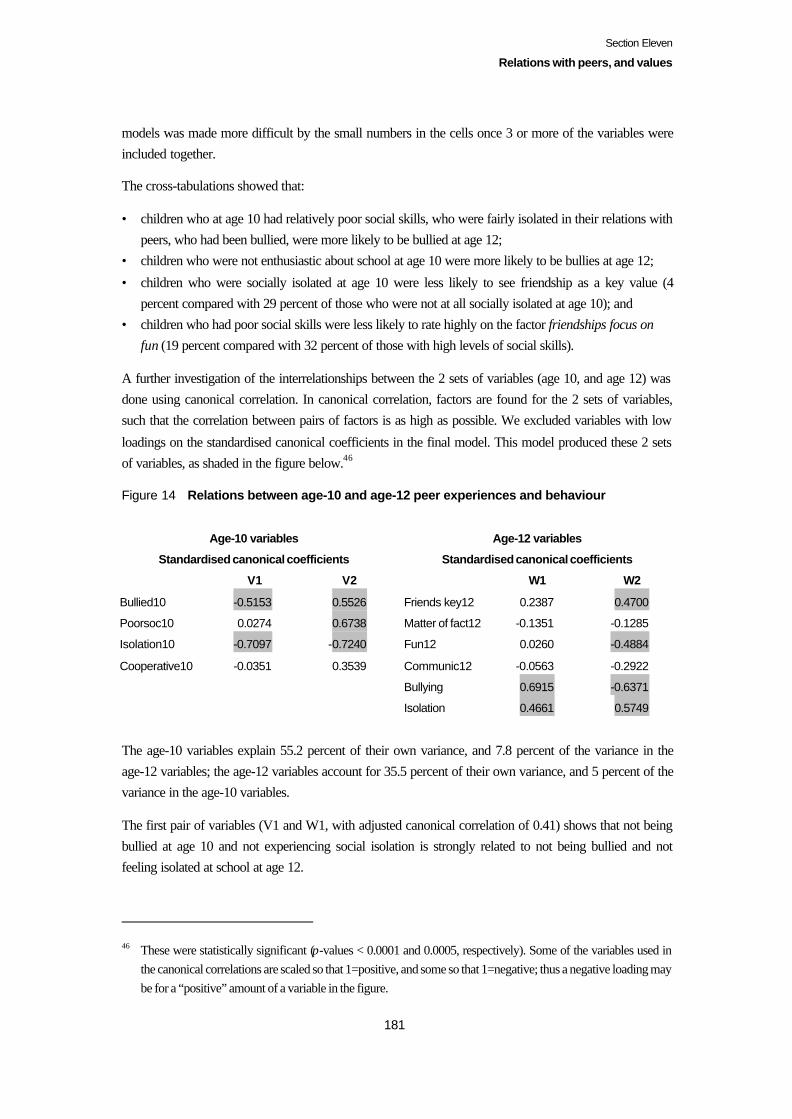
Section Eleven
Relations with peers, and values
181
models was made more difficult by the small numbers in the cells once 3 or more of the variables wereincluded together.
The cross-tabulations showed that:
• children who at age 10 had relatively poor social skills, who were fairly isolated in their relations withpeers, who had been bullied, were more likely to be bullied at age 12;
• children who were not enthusiastic about school at age 10 were more likely to be bullies at age 12;
• children who were socially isolated at age 10 were less likely to see friendship as a key value (4percent compared with 29 percent of those who were not at all socially isolated at age 10); and
• children who had poor social skills were less likely to rate highly on the factor friendships focus onfun (19 percent compared with 32 percent of those with high levels of social skills).
A further investigation of the interrelationships between the 2 sets of variables (age 10, and age 12) wasdone using canonical correlation. In canonical correlation, factors are found for the 2 sets of variables,such that the correlation between pairs of factors is as high as possible. We excluded variables with low
loadings on the standardised canonical coefficients in the final model. This model produced these 2 setsof variables, as shaded in the figure below.46
Figure 14 Relations between age-10 and age-12 peer experiences and behaviour
Age-10 variables Age-12 variables
Standardised canonical coefficients Standardised canonical coefficients
V1 V2 W1 W2
Bullied10 -0.5153 0.5526 Friends key12 0.2387 0.4700
Poorsoc10 0.0274 0.6738 Matter of fact12 -0.1351 -0.1285
Isolation10 -0.7097 -0.7240 Fun12 0.0260 -0.4884
Cooperative10 -0.0351 0.3539 Communic12 -0.0563 -0.2922
Bullying 0.6915 -0.6371
Isolation 0.4661 0.5749
The age-10 variables explain 55.2 percent of their own variance, and 7.8 percent of the variance in theage-12 variables; the age-12 variables account for 35.5 percent of their own variance, and 5 percent of thevariance in the age-10 variables.
The first pair of variables (V1 and W1, with adjusted canonical correlation of 0.41) shows that not beingbullied at age 10 and not experiencing social isolation is strongly related to not being bullied and notfeeling isolated at school at age 12.
46 These were statistically significant (p-values < 0.0001 and 0.0005, respectively). Some of the variables used inthe canonical correlations are scaled so that 1=positive, and some so that 1=negative; thus a negative loading maybe for a “positive” amount of a variable in the figure.
Section Eleven
Relations with peers, and values
182
The second pair of variables (V2 and W2, with adjusted canonical correlation of 0.23) shows that
children who were not isolated at age 10 (indicated by the negative sign before the variable), but who hadpoor social skills and were bullied then, were more likely to experience social isolation and bullying atage 12, to not find much fun in friendships, yet to also place a key value on friendship. But they place less
value on communication within friendship (perhaps because they have had little experience of this), anddo not have a matter of fact approach to friendship. Friendship has mattered a great deal at both ages, butis not a source of confidence.
Current patterns of peer relations, attitudes to school, andcompetency levels
The second research question related to the role of peers in the study children’s lives focused on theircurrent attitudes and performance levels. It was:
How are children’s attitudes to school, including motivation and engagement, their problem-solvingapproaches and competency levels at age 12 related to the pattern of their peer relations in and outsideschool?
We used the friendship factors and variables used in the previous analysis to give us factors related to
patterns of peer relations for this analysis. To analyse these in relation to children’s attitudes to school andproblem-solving approaches, we used relevant answers from the children to specific questions (most ofthese were dichotomous — the children answered yes or no — which meant they could not be used in a
factor analysis), the “values” factors described earlier in this section, and “attitudes to schoolperformance” factors, which are described fully in Section Thirteen. To see which of these variablesshowed significant associations (at the 5 percent level) with the outcome measures, we used 2 differentkinds of analysis:
Cross-tabulation between the categorical and dichotomous variables relating to attitudes to school,problem-solving approaches, and competency levels at age 12, and the variables relating to the pattern ofthe study children’s peer relations, including bullying, and ANOVA and canonical correlation analysis
were used to analyse the relationship between the variables that took an approximately continuous form(e.g. the competency measures), and the peer relations variables.
We found a number of patterns. Compared to the study children who had not recently been bullied, thosewho bullied other children at age 12 were:
• more likely to have friendships focused on fun;
• less likely to score highly on the “anchored and achieving” group of values, and more likely to scorehighly on the “appearances matter” group of values;
• more likely to try to persuade their friends not to do something their parents opposed;
• less likely to have a positive attitude to school; and• less likely to see their school progress in terms of diligence.
Section Eleven
Relations with peers, and values
183
Those who bullied other children did not lack social skills – indeed, they put a high value on friendships,
and on how they appeared to others – but not at the cost of their relations with their parents. They wouldtry to persuade their friends not to do something their own parents opposed. School work may seem moreopposed to this emphasis on friendships of a certain kind, because it does involve effort, rather than theappearance of ease which is valued in the friendships.
When we look at the variables that are related to being bullied at age 12, we found that compared with thestudy children who had not been recently bullied, those who were regularly bullied were:
• less likely to try to persuade their parents to let them do something their friends wanted them to do;• more likely to feel isolated at school;
• less likely to be engaged in learning, and more likely to feel distressed at school; and• more likely to see their school progress in terms of diligence.
Unlike their peers who bullied, schoolwork is meaningful for those who were bullied, in terms of effort.But school was not an enjoyable place for them to be. Two interpretations seem possible for the lower
proportions found in this group who would try to persuade their parents to let them do something withtheir friends. First, that this is not a likely situation for them. However, there were no differences betweenthose who were bullied and others in terms of their social skills, or the things they did value about
friendships. Another possible interpretation is that they lack confidence about their ability to persuadeothers, including their parents.
Compared with those who did not feel isolated in school, children who experienced isolation at school atage 12 were:
• less likely to be engaged in learning, and more likely to feel distress at school (only 4 percent of those
who were usually felt distress at school were never isolated, compared with 98 percent of those whonever felt distressed at school);
• slightly more likely to see school progress in terms of whether they found the work easy;
• less likely to try to persuade their parents to let them do something with their friends; and• more likely to respond aggressively if given a hard time in school (18 percent compared with 8
percent of those who were never isolated).
Aspects which were different for the study children who scored highly on the factor “friendships focus on
communication”, compared with those who did not, focused on problem-solving. They show themreadily reaching out for help. They were:
• more likely to ask peers for help if they have a hard project or can’t find a book;• more likely also to ask their teacher for help if they have a hard project;
• less likely to persist if they could not find a book;• more likely to tell their parents if they were given a hard time in the playground;• less likely to score highly for the “action and friendship” group of values; and• tended to have higher scores for Communication.
Section Eleven
Relations with peers, and values
184
The study children whose parents held some concerns about their friendships did not have different
approaches to friendship, or different patterns of scores for the three sets of values. Perhaps this is becausethere was a range of reasons for parental concerns about friendships: some due to a concern about a lackof friends, as evident below, but some for other reasons. They were:
• more likely to try to persuade their friends not to do something their parents would disapprove of;
• more likely to tell their parents if they got a hard time in the playground;• more likely to feel isolated at school; and• more likely to have lower scores for Communication, Perseverance, Social Skills with Adults, and the
PAT Reading Comprehension test.
We did find some relationships between the other forms of friendship found for the study children at age12, but with fewer variables, making a consistent pattern harder to discern. Perhaps what they underline isthe value of collecting evidence about students’ particular forms of friendship if there is a concern abouttheir performance at school.
Those who scored highly on the “matter of fact” friendship factor were:
• more likely to seek help from the teacher if they were given a hard time in the playground, and lesslikely to take a passive approach;
• less likely to feel isolated at school; and• tended to have better Writing and PAT Reading Comprehension test scores.
Those who scored highly on the “aimless” friendship factor were:
• more likely to seek help from another student if they were given a hard time in the playground; and• more likely to have lower scores for mathematics and the PAT Reading Comprehension test.
Those who scored highly on the “friendship is a key value” factor were:
• less likely to persist if they struck a hard project; and• more likely to have lower scores for the PAT Reading Comprehension test.
Those who scored highly for the “friendships focused on fun” factor were more likely to try to persuade
their parents to let them undertake the activity with friends that their parents opposed. Conversely, thosewho scored highly for the factor “formal friendships” would try to persuade their friends not to do theactivity.
We undertook a canonical correlation to look at the relationship between children’s attitudes to school
and attitudes to learning, and their patterns of peer relations and values at age 12. We dropped thosevariables that had low loadings on both canonical variables in an initial model. We ended with the setsgiven in the figure below. The shaded variables are those that loaded relatively heavily on the
standardised canonical variables. The school engagement group of variables account for 74.2 percent oftheir own variance, and 22.9 percent of the variance of the patterns of peer relations group of items; thepatterns of peer relations group accounts for 37.6 percent of their own variance and 10.5 percent of the

Section Eleven
Relations with peers, and values
185
engagement group’s variance. The 2 canonical coefficients were statistically significant (p-values both <0.0001).
Figure 15 Relations between school engagement and patterns of peer relations and values
School engagement Patterns of relations
V1 V2 W1 W2
Schoolengagement12t47
-0.1176 0.9041 CuriosityT 0.0929 -0.2471
DistressAtSchl12t 0.9706 0.2661 Gcomp -0.0759 -0.4967Diligent12 -0.0528 0.2234 shiny12 -0.0578 0.2453
anchored12-0.0171 -0.2317freeflow12 -0.0142 0.2010bullying 0.1802 -0.3707isolation 0.8885 0.2307Matteroffact12 0.1644 -0.0443
The first pair of variables (V1 and W1, adjusted canonical correlation of 0.71) shows that children whowere not distressed at school were seldom isolated at school, and to a lesser extent, were unlikely to bebullied, and were likely to take their friendships as matter of fact.
The second pair of variables (V2 and W2, adjusted canonical correlation of 0.31) shows that children
who had a low rate of engagement in school were more likely to have a lower score on the social andattitudinal competencies (gcomp), and be bullied; and to a lesser extent, to have higher scores on the“action and friendship” and “appearances matter” groups of values than on the “anchored and achieving”group of values, be unlikely to be socially isolated, and have low scores for Curiosity.
We do not know which came first – a turning away from or failure to engage in schoolwork, or moreenjoyment of things that do not always sit well with the work required of school; but by age 12, they arefound in association.
Summary
FriendshipsPeers are important to the study children at age 12. Being with friends was among their most preferredways to spend their time. Much of this activity is informal. There were marked gender differences, with
boys much more likely to spend their time with friends in informal physical activity or playing games,and girls much more likely to spend time talking and shopping. Boys valued sharing interests more, andgirls, having someone to talk to.
47 Variables ending with a T or t have been normalised (transformed).
Section Eleven
Relations with peers, and values
186
Just over half the study children could identify something that was not so good about their friendship –
mainly arguments, or unreliability. Boys were somewhat more positive (or less critical) about theirfriendships than girls.
Differences in family resources and ethnicity were not reflected in such marked differences as are evidentwith gender in the way the study children spent time with their friends or what they valued about theirfriendships.
Just over half the children said they had 5 or more close friends; 13 percent had 1 or 2. The number ofclose friends was unrelated to gender or family characteristics, and was largely unrelated to children’scompetency scores. Close friends tended to be of the same sex, but 42 percent of the boys and 27 percentof the girls said their close friends included both boys and girls.
Ninety-one percent of the study children felt that their parents liked their friends, or most of them.Parental judgment was still respected, and was more weighty than friendships. When we asked the studychildren what they would do if their parents told them not to do something and their friends really wanted
them to do it, 66 percent of the study children would not do the activity, and another 6 percent would tryto persuade their friends not to do it. Fourteen percent would try to persuade their parents to let them.Eleven percent thought it would depend what the activity was. Only 6 percent would go ahead and do the
activity their friends proposed, but their parents opposed. Girls were more likely to try to persuade theirparents to let them do the activity, and boys more likely to do it anyway.
Through factor analysis, we found that that fun in friendships was more likely to be valued thancommunication, that most children had good friendships, but around 12 percent had mainly aimlessfriendships, and 3 percent did not have good friendships.
BullyingAround a quarter of the study children said they had been picked on or bullied by someone in the lastcouple of months. Bullying frequency at age 12 was much the same as it was at age 10. Most of this
occurred at school (20 percent), with 4 percent having been bullied at home, and 2 percent in a publicplace. Most of the bullying was verbal. The main response to the bullying was to ignore it, or seek helpfrom a teacher or parent. Fifteen percent of the children said they had bullied another child in the last few
months. Gender was unrelated to experiences of being bullied or bullying, but children whose mothershad no qualification were more likely to be bullied. There were more reports of bullying from childrenattending decile 5–10 schools than those attending decile 1–4 schools.
Children who had experienced bullying — as victim or bully, or both — tended to score lower on most ofthe competency measures than those who had not been involved in bullying.
ValuesEnjoyment of life, and doing well at school or sport were most important to the study children at age 12.The next biggest group of things that were of most importance to them was being with family and having

Section Eleven
Relations with peers, and values
187
lots of friends, and being helpful or kind. We found that these values fell into three groups: “anchored and
achieving” (50 percent), “action and friendship” (31 percent) and “appearances matter” (9 percent).Those who had high scores for the “anchored and achieving” group of values were more likely to enjoyreading and have higher scores for Communication at age 10; those who had high scores on the “action
and friendship” group of values to have had high scores for social skills at age 10; and those who hadhigh scores on the “appearances matter” group of values, more likely to have had lower scores at age 10for Individual Responsibility.
What would be of most importance to the study children in their adulthood was a happy family life,
followed by good health. Having an interesting job was mentioned by twice as many of the children atage 12 as having lots of money.
Patterns of peer relations and children’s earlier social skills and schoolbehaviourCross-tabulation of factors relating to children’s earlier social skills and their current patterns of relationswith peers showed no notable associations between “ordinary” levels of social skills and comfort at
school at age 10, and “ordinary” relations with peers at age 12. However, relatively poor social skills,social isolation, and being bullied at age 10 were more likely to precede being bullied at age 12, andchildren who were socially isolated 2 years earlier were less likely to see friendship a key value, and those
who had had poor social skills, less likely to think of friendships as fun. Canonical correlation analysisconfirmed this picture, and gave it some additional dimensions. Earlier poor social skills and experiencesof bullying were more likely to precede social isolation and bullying at age 12, and an emphasis on
friendship which was less likely to focus on communication, fun, or as part of the everyday. Friendshiphas mattered a great deal at both ages, but is not a source of satisfaction. Looked at another way, it wouldappear that some children with poor social skills at age 10 need additional support from adults in their lifeif they are to have positive experiences of friendship 2 years later.
Patterns of peer relations, attitudes to school, and competency levelsWe found that those who bullied other children were more likely to have friendships focused on fun, andmore likely to score highly on the “appearances matter” group of values. They were less likely to beengaged in learning, and were less likely to view diligence as a sign that they were doing well at school.
Those who were regularly bullied did not show differences in friendship patterns or values, but weremore likely to feel distressed at school, as well as being less engaged in learning than those who were notbullied. But they were more likely to see diligence as a sign that they were doing well at school. So forboth the bully and the bullied, school is not enjoyable – but for rather different reasons.
Distress at school was also more likely to be experienced by those who experienced isolation at school;they saw school progress in terms of ease, and were more likely to respond aggressively if given a hardtime in school. So those who feel isolated do not respond passively, but like the bully and bullied, theyare also more likely to be disengaged from learning.
Section Eleven
Relations with peers, and values
188
Children who emphasised communication in their friendships were more likely to reach out for help if
they needed it, and to problem-solve. There were also other trends for other patterns of friendship that wefound which suggest that these are related to how children tackle work at school, with lower scores forthe PAT Reading Comprehension test for children who had aimless friendships – or for whom friendshipwas an especially key value.
Thus there are indications that while friendship is an everyday part of most children’s lives at age 12, itsvalue can over-topple if it becomes too important, if relationships are vexed or focused on power, or if thefriendship has little shared content. Too large a focus on friendship can become counter to engaging in
schoolwork – or else be a sign that children are not engaging in the work required to make the most ofschool.

189
Section Twelve
School and class characteristics
In this section we look at some of the characteristics of the schools attended by the study children, and thecharacteristics of the children’s classrooms.
We have not analysed every factor which we report here. The analysis is limited to factors whichprevious analysis in the study has shown to have links with children’s competencies, or which are of
perennial interest. We do not undertake any analysis of the resource aspects of schools and teachers, sincemeasurement of these is problematic, as is the assumption of direct links with children’s currentcompetency levels (Burtless, 1996; Norton, Sanderson, Booth, and Stroombergen, 2000).
Characteristics of schools attended by the competent childrensample at age 10
The table below shows the main characteristics of the schools attended by the study children at age 10.One child in the study was being home-schooled.
The study children’s patterns of attendance at different school types is similar to those of age-12 childrenin the Wellington region, but with higher private school attendance. Their patterns of attendance in termsof school socio-economic decile are similar for decile 2, 5, and 9 schools, but vary for the others.48
48 We are grateful to the Data Management section of the Ministry of Education for providing roll-related data forthis age group for Wellington and nationally.
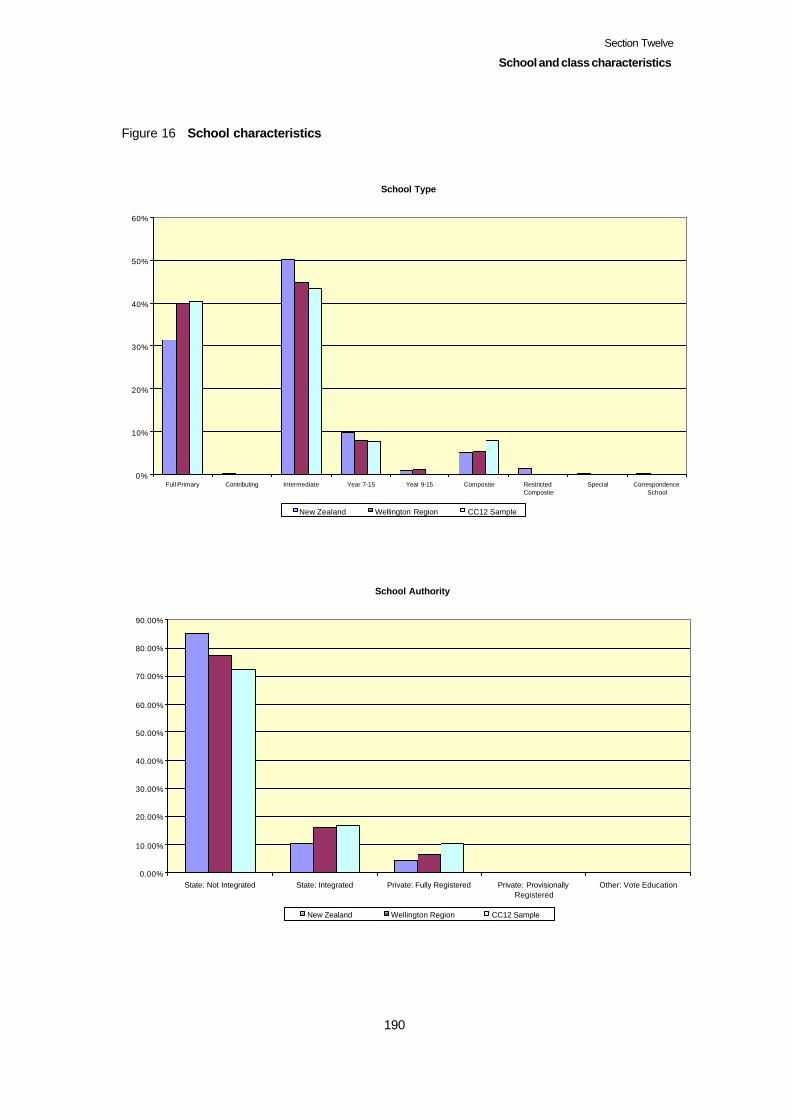
Section Twelve
School and class characteristics
190
Figure 16 School characteristics
School Type
0%
10%
20%
30%
40%
50%
60%
Full Primary Contributing Intermediate Year 7-15 Year 9-15 Composite RestrictedComposite
Special CorrespondenceSchool
New Zealand Wellington Region CC12 Sample
School Authority
0.00%
10.00%
20.00%
30.00%
40.00%
50.00%
60.00%
70.00%
80.00%
90.00%
State: Not Integrated State: Integrated Private: Fully Registered Private: ProvisionallyRegistered
Other: Vote Education
New Zealand Wellington Region CC12 Sample
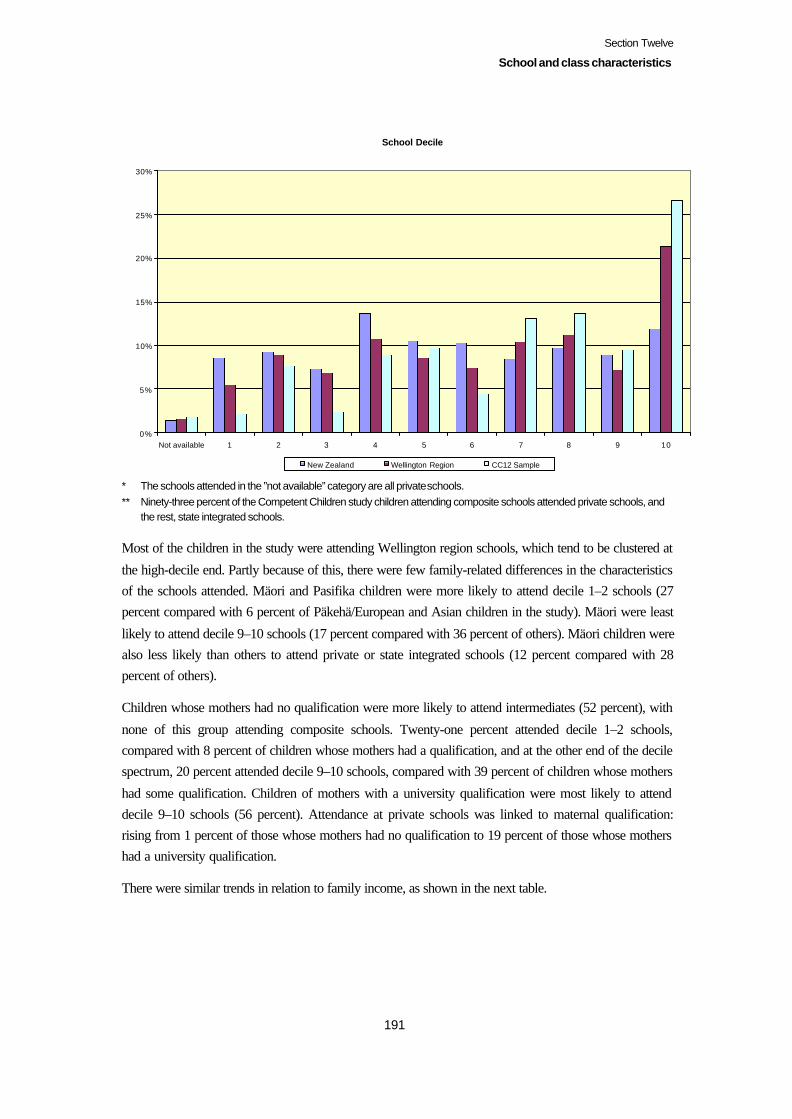
Section Twelve
School and class characteristics
191
* The schools attended in the ”not available” category are all private schools.** Ninety-three percent of the Competent Children study children attending composite schools attended private schools, and
the rest, state integrated schools.
Most of the children in the study were attending Wellington region schools, which tend to be clustered at
the high-decile end. Partly because of this, there were few family-related differences in the characteristicsof the schools attended. Mäori and Pasifika children were more likely to attend decile 1–2 schools (27percent compared with 6 percent of Päkehä/European and Asian children in the study). Mäori were least
likely to attend decile 9–10 schools (17 percent compared with 36 percent of others). Mäori children werealso less likely than others to attend private or state integrated schools (12 percent compared with 28percent of others).
Children whose mothers had no qualification were more likely to attend intermediates (52 percent), with
none of this group attending composite schools. Twenty-one percent attended decile 1–2 schools,compared with 8 percent of children whose mothers had a qualification, and at the other end of the decilespectrum, 20 percent attended decile 9–10 schools, compared with 39 percent of children whose mothers
had some qualification. Children of mothers with a university qualification were most likely to attenddecile 9–10 schools (56 percent). Attendance at private schools was linked to maternal qualification:rising from 1 percent of those whose mothers had no qualification to 19 percent of those whose mothershad a university qualification.
There were similar trends in relation to family income, as shown in the next table.
School Decile
0%
5%
10%
15%
20%
25%
30%
Not available 1 2 3 4 5 6 7 8 9 10
New Zealand Wellington Region CC12 Sample
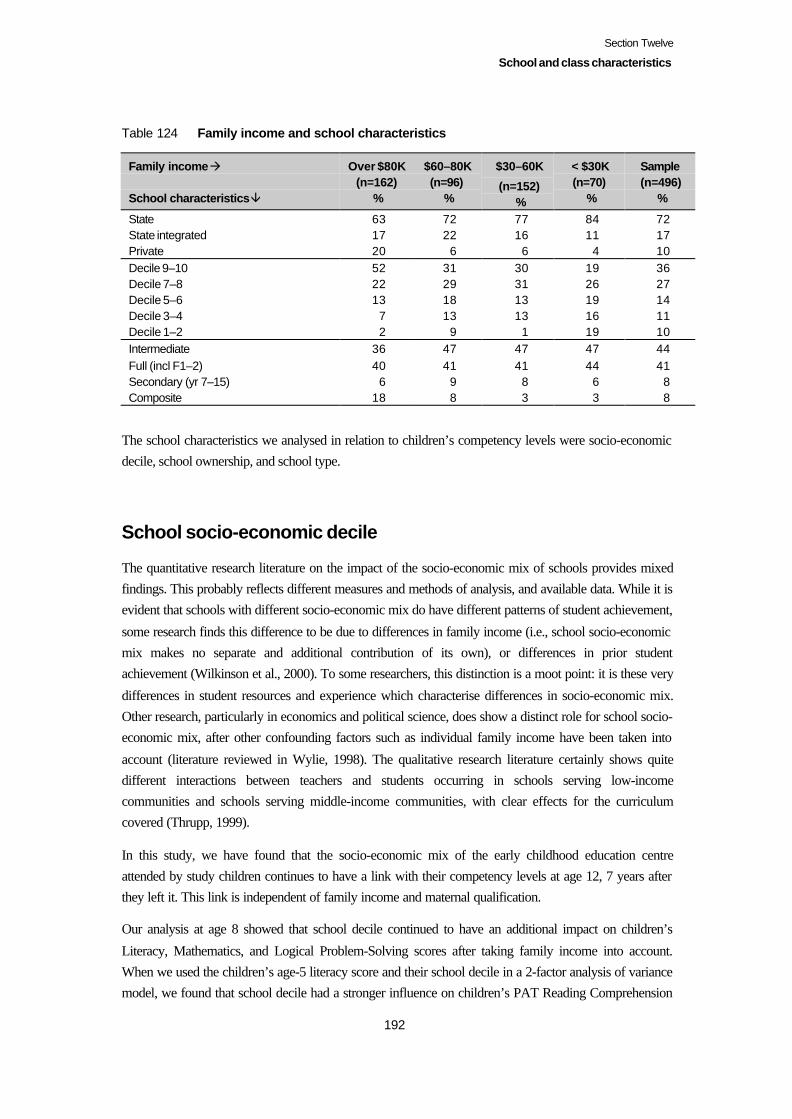
Section Twelve
School and class characteristics
192
Table 124 Family income and school characteristics
Family income à
School characteristics â
Over $80K(n=162)
%
$60–80K(n=96)
%
$30–60K
(n=152) %
< $30K(n=70)
%
Sample(n=496)
%
State 63 72 77 84 72State integrated 17 22 16 11 17Private 20 6 6 4 10Decile 9–10 52 31 30 19 36Decile 7–8 22 29 31 26 27Decile 5–6 13 18 13 19 14Decile 3–4 7 13 13 16 11Decile 1–2 2 9 1 19 10Intermediate 36 47 47 47 44Full (incl F1–2) 40 41 41 44 41Secondary (yr 7–15) 6 9 8 6 8Composite 18 8 3 3 8
The school characteristics we analysed in relation to children’s competency levels were socio-economicdecile, school ownership, and school type.
School socio-economic decile
The quantitative research literature on the impact of the socio-economic mix of schools provides mixedfindings. This probably reflects different measures and methods of analysis, and available data. While it isevident that schools with different socio-economic mix do have different patterns of student achievement,
some research finds this difference to be due to differences in family income (i.e., school socio-economicmix makes no separate and additional contribution of its own), or differences in prior studentachievement (Wilkinson et al., 2000). To some researchers, this distinction is a moot point: it is these very
differences in student resources and experience which characterise differences in socio-economic mix.Other research, particularly in economics and political science, does show a distinct role for school socio-economic mix, after other confounding factors such as individual family income have been taken into
account (literature reviewed in Wylie, 1998). The qualitative research literature certainly shows quitedifferent interactions between teachers and students occurring in schools serving low-incomecommunities and schools serving middle-income communities, with clear effects for the curriculumcovered (Thrupp, 1999).
In this study, we have found that the socio-economic mix of the early childhood education centreattended by study children continues to have a link with their competency levels at age 12, 7 years afterthey left it. This link is independent of family income and maternal qualification.
Our analysis at age 8 showed that school decile continued to have an additional impact on children’s
Literacy, Mathematics, and Logical Problem-Solving scores after taking family income into account.When we used the children’s age-5 literacy score and their school decile in a 2-factor analysis of variancemodel, we found that school decile had a stronger influence on children’s PAT Reading Comprehension
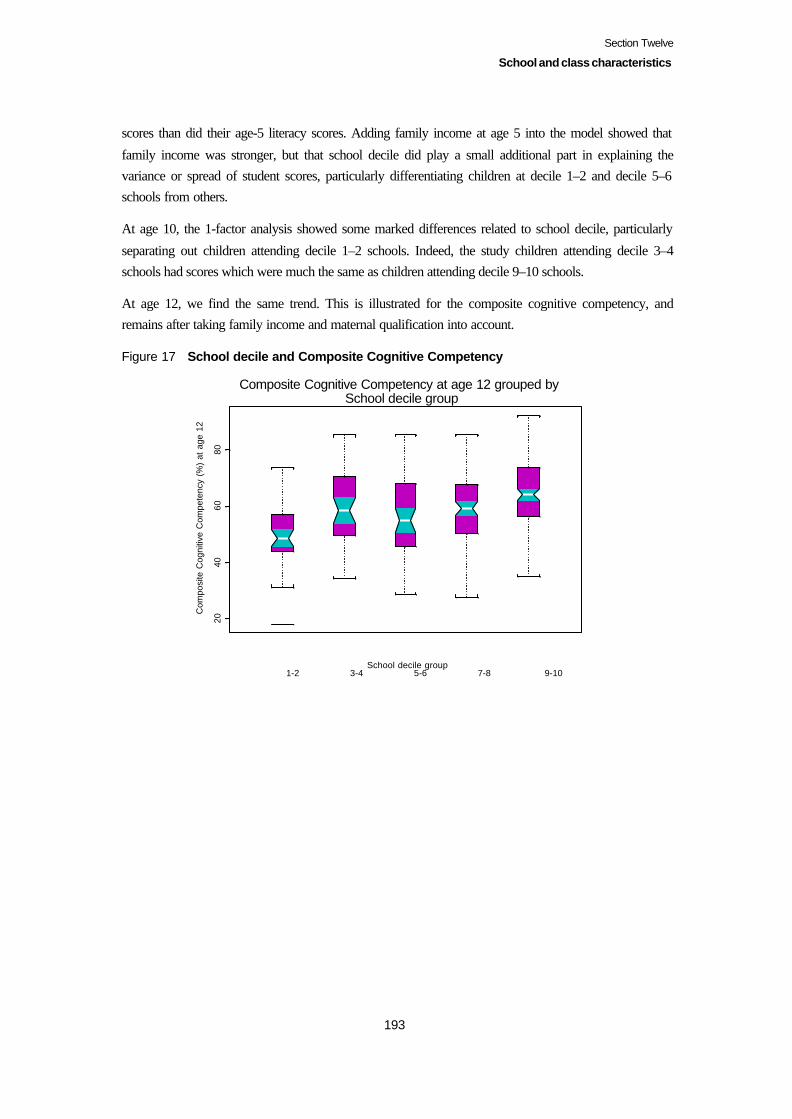
Section Twelve
School and class characteristics
193
scores than did their age-5 literacy scores. Adding family income at age 5 into the model showed that
family income was stronger, but that school decile did play a small additional part in explaining thevariance or spread of student scores, particularly differentiating children at decile 1–2 and decile 5–6schools from others.
At age 10, the 1-factor analysis showed some marked differences related to school decile, particularly
separating out children attending decile 1–2 schools. Indeed, the study children attending decile 3–4schools had scores which were much the same as children attending decile 9–10 schools.
At age 12, we find the same trend. This is illustrated for the composite cognitive competency, andremains after taking family income and maternal qualification into account.
Figure 17 School decile and Composite Cognitive Competency
2040
6080
Composite Cognitive Competency at age 12 grouped bySchool decile group
School decile group1-2 3-4 5-6 7-8 9-10
Com
posi
te C
ogni
tive
Com
pete
ncy
(%)
at a
ge 1
2
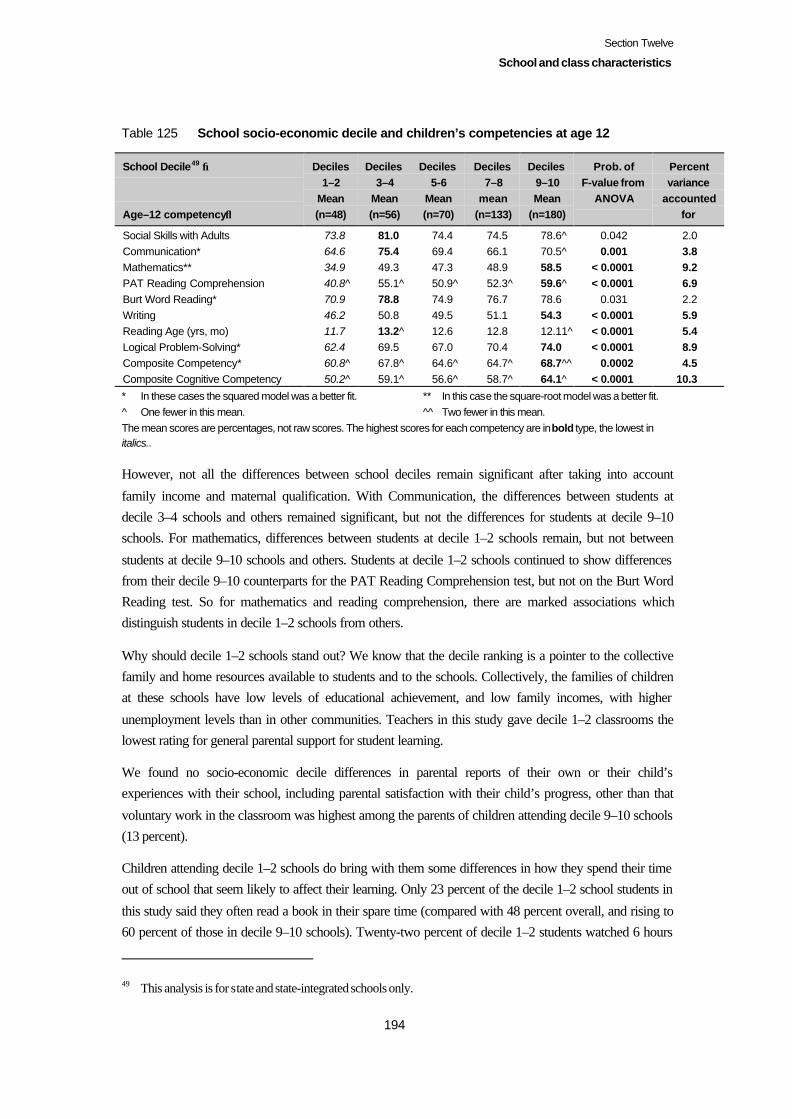
Section Twelve
School and class characteristics
194
Table 125 School socio-economic decile and children’s competencies at age 12
School Decile49 →
Age–12 competency↓
Deciles1–2
Mean(n=48)
Deciles3–4
Mean(n=56)
Deciles5-6
Mean(n=70)
Deciles7–8
mean(n=133)
Deciles9–10Mean
(n=180)
Prob. ofF-value from
ANOVA
Percentvariance
accountedfor
Social Skills with Adults 73.8 81.0 74.4 74.5 78.6^ 0.042 2.0Communication* 64.6 75.4 69.4 66.1 70.5^ 0.001 3.8Mathematics** 34.9 49.3 47.3 48.9 58.5 < 0.0001 9.2PAT Reading Comprehension 40.8^ 55.1^ 50.9^ 52.3^ 59.6^ < 0.0001 6.9Burt Word Reading* 70.9 78.8 74.9 76.7 78.6 0.031 2.2Writing 46.2 50.8 49.5 51.1 54.3 < 0.0001 5.9Reading Age (yrs, mo) 11.7 13.2^ 12.6 12.8 12.11^ < 0.0001 5.4Logical Problem-Solving* 62.4 69.5 67.0 70.4 74.0 < 0.0001 8.9Composite Competency* 60.8^ 67.8^ 64.6^ 64.7^ 68.7^^ 0.0002 4.5Composite Cognitive Competency 50.2^ 59.1^ 56.6^ 58.7^ 64.1^ < 0.0001 10.3
* In these cases the squared model was a better fit. ** In this case the square-root model was a better fit.^ One fewer in this mean. ^^ Two fewer in this mean.The mean scores are percentages, not raw scores. The highest scores for each competency are in bold type, the lowest initalics..
However, not all the differences between school deciles remain significant after taking into account
family income and maternal qualification. With Communication, the differences between students atdecile 3–4 schools and others remained significant, but not the differences for students at decile 9–10schools. For mathematics, differences between students at decile 1–2 schools remain, but not between
students at decile 9–10 schools and others. Students at decile 1–2 schools continued to show differencesfrom their decile 9–10 counterparts for the PAT Reading Comprehension test, but not on the Burt WordReading test. So for mathematics and reading comprehension, there are marked associations whichdistinguish students in decile 1–2 schools from others.
Why should decile 1–2 schools stand out? We know that the decile ranking is a pointer to the collectivefamily and home resources available to students and to the schools. Collectively, the families of childrenat these schools have low levels of educational achievement, and low family incomes, with higher
unemployment levels than in other communities. Teachers in this study gave decile 1–2 classrooms thelowest rating for general parental support for student learning.
We found no socio-economic decile differences in parental reports of their own or their child’sexperiences with their school, including parental satisfaction with their child’s progress, other than that
voluntary work in the classroom was highest among the parents of children attending decile 9–10 schools(13 percent).
Children attending decile 1–2 schools do bring with them some differences in how they spend their timeout of school that seem likely to affect their learning. Only 23 percent of the decile 1–2 school students in
this study said they often read a book in their spare time (compared with 48 percent overall, and rising to60 percent of those in decile 9–10 schools). Twenty-two percent of decile 1–2 students watched 6 hours
49 This analysis is for state and state-integrated schools only.
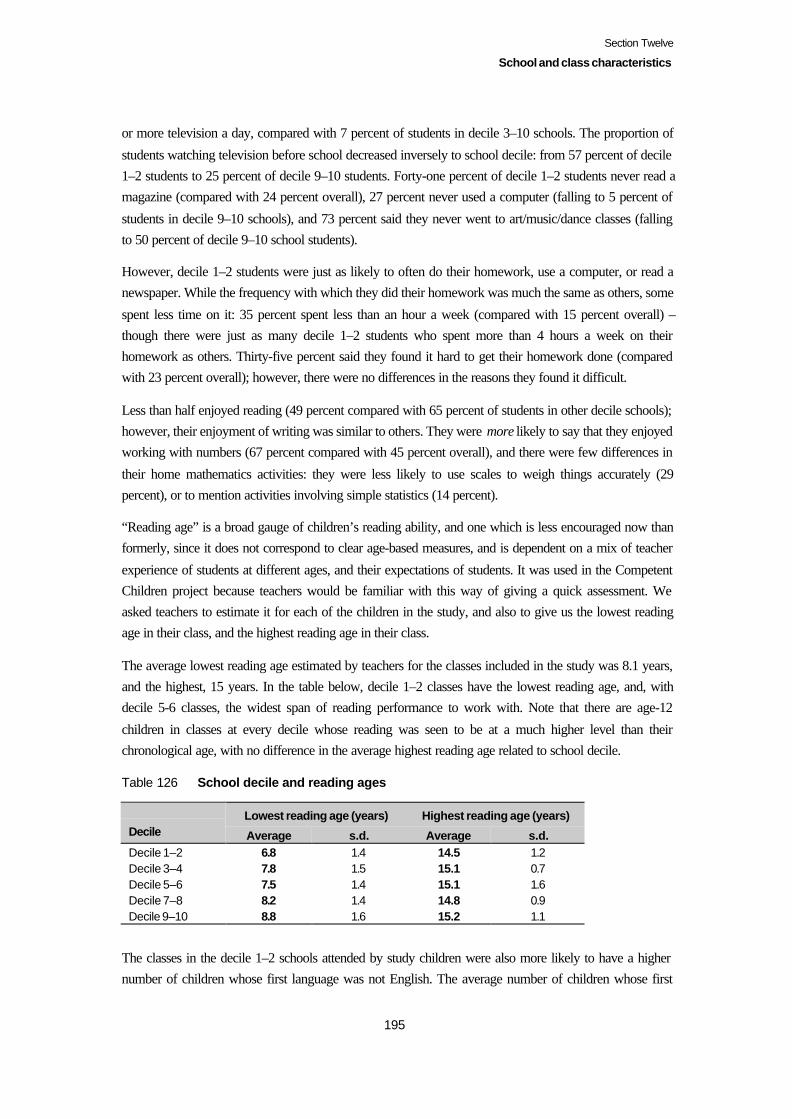
Section Twelve
School and class characteristics
195
or more television a day, compared with 7 percent of students in decile 3–10 schools. The proportion of
students watching television before school decreased inversely to school decile: from 57 percent of decile1–2 students to 25 percent of decile 9–10 students. Forty-one percent of decile 1–2 students never read amagazine (compared with 24 percent overall), 27 percent never used a computer (falling to 5 percent of
students in decile 9–10 schools), and 73 percent said they never went to art/music/dance classes (fallingto 50 percent of decile 9–10 school students).
However, decile 1–2 students were just as likely to often do their homework, use a computer, or read anewspaper. While the frequency with which they did their homework was much the same as others, some
spent less time on it: 35 percent spent less than an hour a week (compared with 15 percent overall) –though there were just as many decile 1–2 students who spent more than 4 hours a week on theirhomework as others. Thirty-five percent said they found it hard to get their homework done (comparedwith 23 percent overall); however, there were no differences in the reasons they found it difficult.
Less than half enjoyed reading (49 percent compared with 65 percent of students in other decile schools);however, their enjoyment of writing was similar to others. They were more likely to say that they enjoyedworking with numbers (67 percent compared with 45 percent overall), and there were few differences in
their home mathematics activities: they were less likely to use scales to weigh things accurately (29percent), or to mention activities involving simple statistics (14 percent).
“Reading age” is a broad gauge of children’s reading ability, and one which is less encouraged now thanformerly, since it does not correspond to clear age-based measures, and is dependent on a mix of teacher
experience of students at different ages, and their expectations of students. It was used in the CompetentChildren project because teachers would be familiar with this way of giving a quick assessment. Weasked teachers to estimate it for each of the children in the study, and also to give us the lowest readingage in their class, and the highest reading age in their class.
The average lowest reading age estimated by teachers for the classes included in the study was 8.1 years,and the highest, 15 years. In the table below, decile 1–2 classes have the lowest reading age, and, withdecile 5-6 classes, the widest span of reading performance to work with. Note that there are age-12
children in classes at every decile whose reading was seen to be at a much higher level than theirchronological age, with no difference in the average highest reading age related to school decile.
Table 126 School decile and reading ages
Lowest reading age (years) Highest reading age (years)Decile Average s.d. Average s.d.Decile 1–2 6.8 1.4 14.5 1.2Decile 3–4 7.8 1.5 15.1 0.7Decile 5–6 7.5 1.4 15.1 1.6Decile 7–8 8.2 1.4 14.8 0.9Decile 9–10 8.8 1.6 15.2 1.1
The classes in the decile 1–2 schools attended by study children were also more likely to have a highernumber of children whose first language was not English. The average number of children whose first
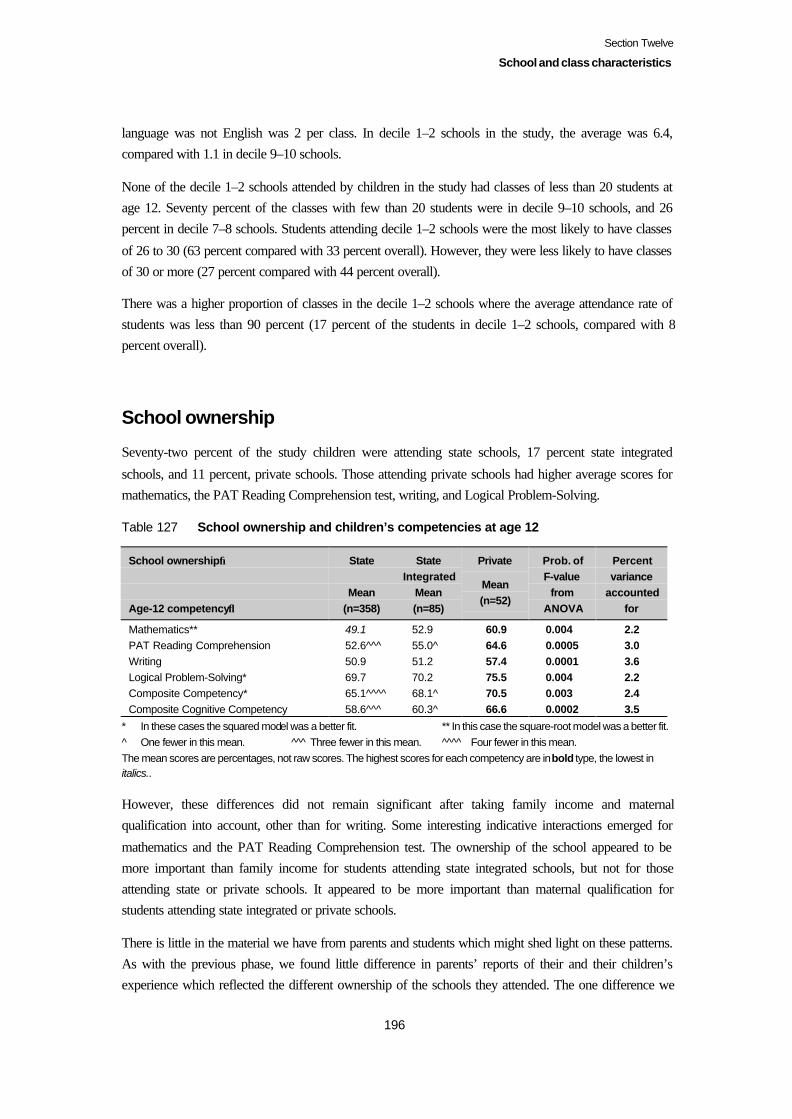
Section Twelve
School and class characteristics
196
language was not English was 2 per class. In decile 1–2 schools in the study, the average was 6.4,compared with 1.1 in decile 9–10 schools.
None of the decile 1–2 schools attended by children in the study had classes of less than 20 students atage 12. Seventy percent of the classes with few than 20 students were in decile 9–10 schools, and 26percent in decile 7–8 schools. Students attending decile 1–2 schools were the most likely to have classes
of 26 to 30 (63 percent compared with 33 percent overall). However, they were less likely to have classesof 30 or more (27 percent compared with 44 percent overall).
There was a higher proportion of classes in the decile 1–2 schools where the average attendance rate ofstudents was less than 90 percent (17 percent of the students in decile 1–2 schools, compared with 8percent overall).
School ownership
Seventy-two percent of the study children were attending state schools, 17 percent state integrated
schools, and 11 percent, private schools. Those attending private schools had higher average scores formathematics, the PAT Reading Comprehension test, writing, and Logical Problem-Solving.
Table 127 School ownership and children’s competencies at age 12
School ownership→
Age-12 competency↓
State
Mean(n=358)
StateIntegrated
Mean(n=85)
Private
Mean(n=52)
Prob. ofF-value
fromANOVA
Percentvariance
accountedfor
Mathematics** 49.1 52.9 60.9 0.004 2.2PAT Reading Comprehension 52.6^^^ 55.0^ 64.6 0.0005 3.0Writing 50.9 51.2 57.4 0.0001 3.6Logical Problem-Solving* 69.7 70.2 75.5 0.004 2.2Composite Competency* 65.1^^^^ 68.1^ 70.5 0.003 2.4Composite Cognitive Competency 58.6^^^ 60.3^ 66.6 0.0002 3.5
* In these cases the squared model was a better fit. ** In this case the square-root model was a better fit.^ One fewer in this mean. ^^ ̂ Three fewer in this mean. ^^^^ Four fewer in this mean.The mean scores are percentages, not raw scores. The highest scores for each competency are in bold type, the lowest initalics..
However, these differences did not remain significant after taking family income and maternalqualification into account, other than for writing. Some interesting indicative interactions emerged for
mathematics and the PAT Reading Comprehension test. The ownership of the school appeared to bemore important than family income for students attending state integrated schools, but not for thoseattending state or private schools. It appeared to be more important than maternal qualification forstudents attending state integrated or private schools.
There is little in the material we have from parents and students which might shed light on these patterns.As with the previous phase, we found little difference in parents’ reports of their and their children’sexperience which reflected the different ownership of the schools they attended. The one difference we
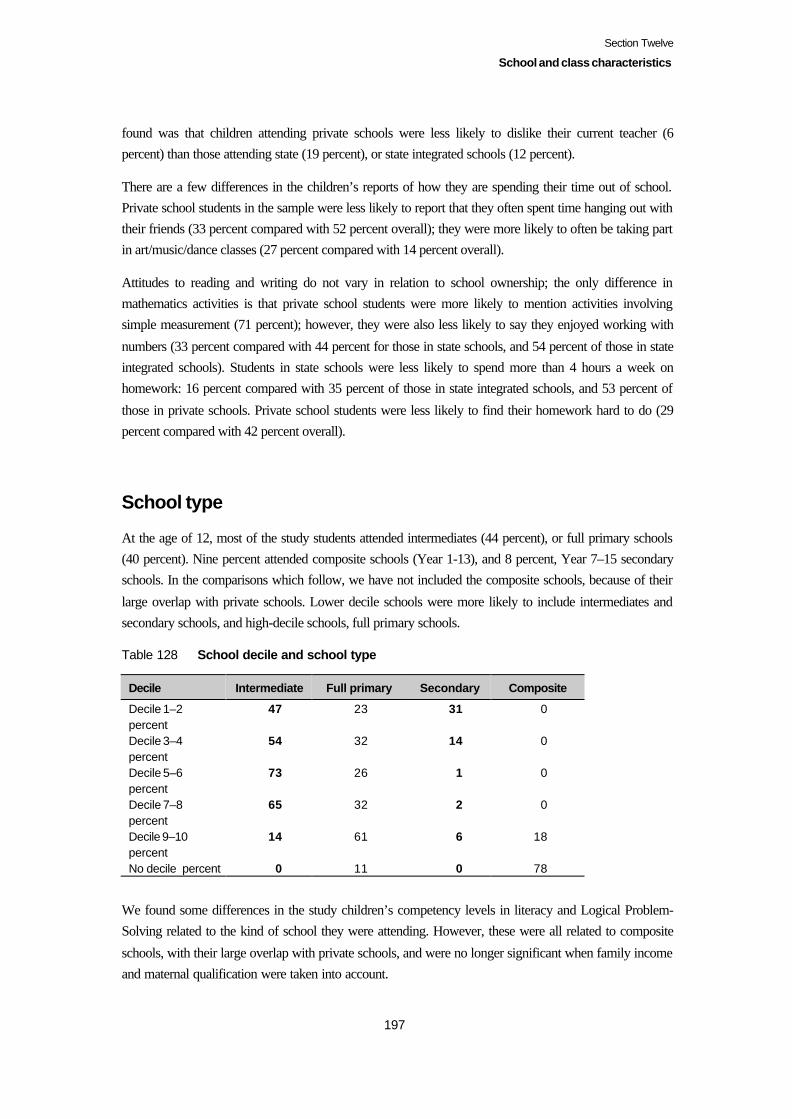
Section Twelve
School and class characteristics
197
found was that children attending private schools were less likely to dislike their current teacher (6percent) than those attending state (19 percent), or state integrated schools (12 percent).
There are a few differences in the children’s reports of how they are spending their time out of school.Private school students in the sample were less likely to report that they often spent time hanging out withtheir friends (33 percent compared with 52 percent overall); they were more likely to often be taking partin art/music/dance classes (27 percent compared with 14 percent overall).
Attitudes to reading and writing do not vary in relation to school ownership; the only difference inmathematics activities is that private school students were more likely to mention activities involvingsimple measurement (71 percent); however, they were also less likely to say they enjoyed working with
numbers (33 percent compared with 44 percent for those in state schools, and 54 percent of those in stateintegrated schools). Students in state schools were less likely to spend more than 4 hours a week onhomework: 16 percent compared with 35 percent of those in state integrated schools, and 53 percent of
those in private schools. Private school students were less likely to find their homework hard to do (29percent compared with 42 percent overall).
School type
At the age of 12, most of the study students attended intermediates (44 percent), or full primary schools(40 percent). Nine percent attended composite schools (Year 1-13), and 8 percent, Year 7–15 secondaryschools. In the comparisons which follow, we have not included the composite schools, because of their
large overlap with private schools. Lower decile schools were more likely to include intermediates andsecondary schools, and high-decile schools, full primary schools.
Table 128 School decile and school type
Decile Intermediate Full primary Secondary Composite
Decile 1–2percent
47 23 31 0
Decile 3–4percent
54 32 14 0
Decile 5–6percent
73 26 1 0
Decile 7–8percent
65 32 2 0
Decile 9–10percent
14 61 6 18
No decile percent 0 11 0 78
We found some differences in the study children’s competency levels in literacy and Logical Problem-Solving related to the kind of school they were attending. However, these were all related to composite
schools, with their large overlap with private schools, and were no longer significant when family incomeand maternal qualification were taken into account.
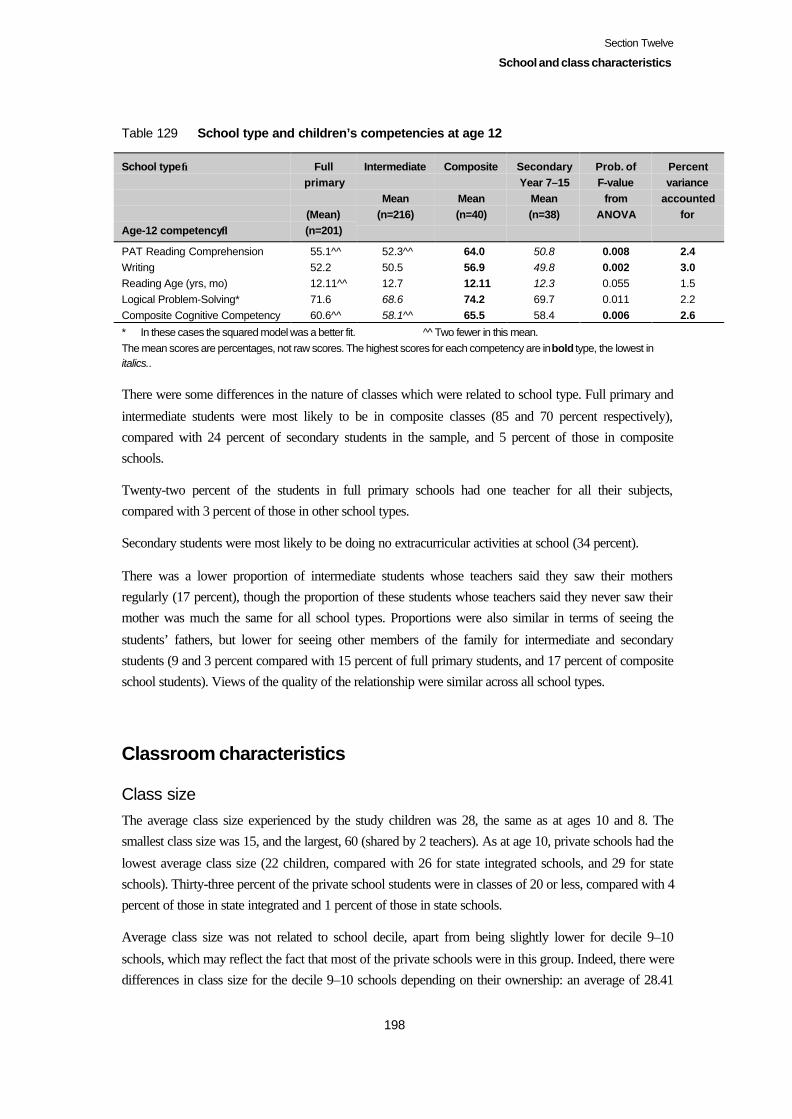
Section Twelve
School and class characteristics
198
Table 129 School type and children’s competencies at age 12
School type→
Age-12 competency↓
Fullprimary
(Mean)(n=201)
Intermediate
Mean(n=216)
Composite
Mean(n=40)
SecondaryYear 7–15
Mean(n=38)
Prob. ofF-value
fromANOVA
Percentvariance
accountedfor
PAT Reading Comprehension 55.1^^ 52.3^^ 64.0 50.8 0.008 2.4Writing 52.2 50.5 56.9 49.8 0.002 3.0Reading Age (yrs, mo) 12.11^^ 12.7 12.11 12.3 0.055 1.5Logical Problem-Solving* 71.6 68.6 74.2 69.7 0.011 2.2Composite Cognitive Competency 60.6^^ 58.1^^ 65.5 58.4 0.006 2.6
* In these cases the squared model was a better fit. ^ ̂Two fewer in this mean.The mean scores are percentages, not raw scores. The highest scores for each competency are in bold type, the lowest initalics..
There were some differences in the nature of classes which were related to school type. Full primary and
intermediate students were most likely to be in composite classes (85 and 70 percent respectively),compared with 24 percent of secondary students in the sample, and 5 percent of those in compositeschools.
Twenty-two percent of the students in full primary schools had one teacher for all their subjects,compared with 3 percent of those in other school types.
Secondary students were most likely to be doing no extracurricular activities at school (34 percent).
There was a lower proportion of intermediate students whose teachers said they saw their mothersregularly (17 percent), though the proportion of these students whose teachers said they never saw theirmother was much the same for all school types. Proportions were also similar in terms of seeing the
students’ fathers, but lower for seeing other members of the family for intermediate and secondarystudents (9 and 3 percent compared with 15 percent of full primary students, and 17 percent of compositeschool students). Views of the quality of the relationship were similar across all school types.
Classroom characteristics
Class sizeThe average class size experienced by the study children was 28, the same as at ages 10 and 8. Thesmallest class size was 15, and the largest, 60 (shared by 2 teachers). As at age 10, private schools had the
lowest average class size (22 children, compared with 26 for state integrated schools, and 29 for stateschools). Thirty-three percent of the private school students were in classes of 20 or less, compared with 4percent of those in state integrated and 1 percent of those in state schools.
Average class size was not related to school decile, apart from being slightly lower for decile 9–10
schools, which may reflect the fact that most of the private schools were in this group. Indeed, there weredifferences in class size for the decile 9–10 schools depending on their ownership: an average of 28.41
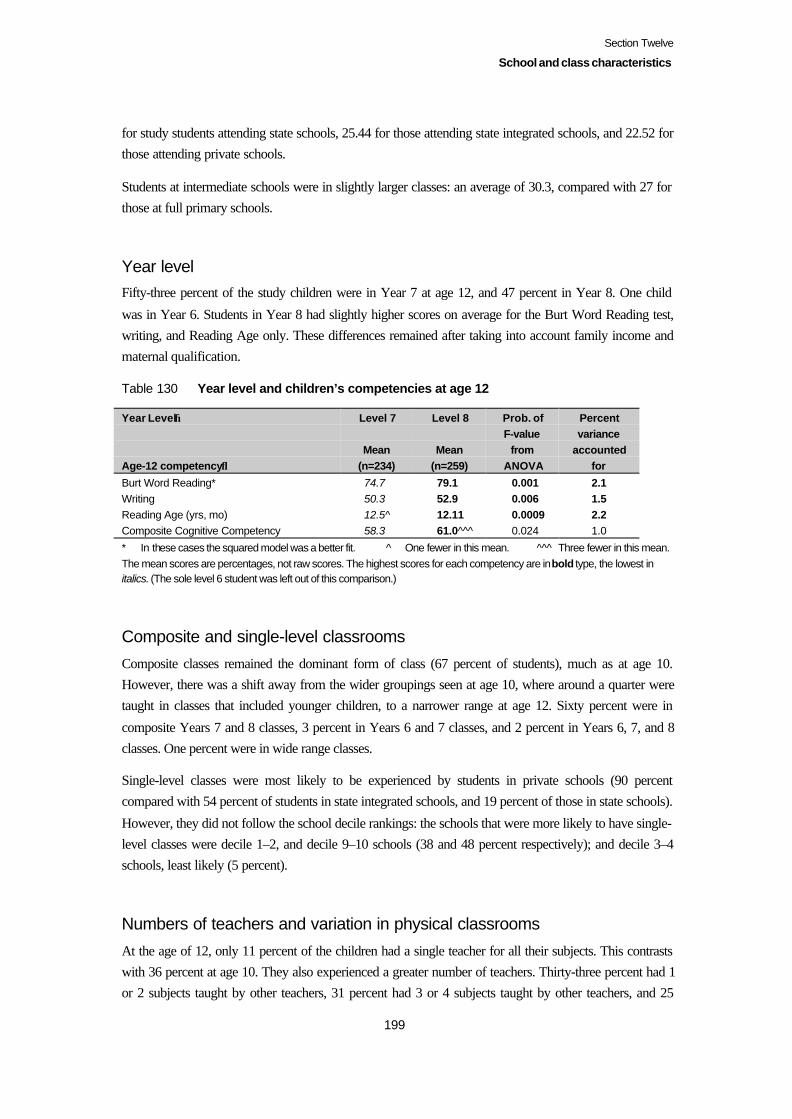
Section Twelve
School and class characteristics
199
for study students attending state schools, 25.44 for those attending state integrated schools, and 22.52 forthose attending private schools.
Students at intermediate schools were in slightly larger classes: an average of 30.3, compared with 27 forthose at full primary schools.
Year levelFifty-three percent of the study children were in Year 7 at age 12, and 47 percent in Year 8. One child
was in Year 6. Students in Year 8 had slightly higher scores on average for the Burt Word Reading test,writing, and Reading Age only. These differences remained after taking into account family income andmaternal qualification.
Table 130 Year level and children’s competencies at age 12
Year Level→
Age-12 competency↓
Level 7
Mean(n=234)
Level 8
Mean(n=259)
Prob. ofF-value
fromANOVA
Percentvariance
accountedfor
Burt Word Reading* 74.7 79.1 0.001 2.1Writing 50.3 52.9 0.006 1.5Reading Age (yrs, mo) 12.5^ 12.11 0.0009 2.2Composite Cognitive Competency 58.3 61.0^^^ 0.024 1.0
* In these cases the squared model was a better fit. ^ One fewer in this mean. ^^^ Three fewer in this mean.The mean scores are percentages, not raw scores. The highest scores for each competency are in bold type, the lowest initalics. (The sole level 6 student was left out of this comparison.)
Composite and single-level classrooms
Composite classes remained the dominant form of class (67 percent of students), much as at age 10.However, there was a shift away from the wider groupings seen at age 10, where around a quarter weretaught in classes that included younger children, to a narrower range at age 12. Sixty percent were in
composite Years 7 and 8 classes, 3 percent in Years 6 and 7 classes, and 2 percent in Years 6, 7, and 8classes. One percent were in wide range classes.
Single-level classes were most likely to be experienced by students in private schools (90 percentcompared with 54 percent of students in state integrated schools, and 19 percent of those in state schools).
However, they did not follow the school decile rankings: the schools that were more likely to have single-level classes were decile 1–2, and decile 9–10 schools (38 and 48 percent respectively); and decile 3–4schools, least likely (5 percent).
Numbers of teachers and variation in physical classrooms
At the age of 12, only 11 percent of the children had a single teacher for all their subjects. This contrastswith 36 percent at age 10. They also experienced a greater number of teachers. Thirty-three percent had 1or 2 subjects taught by other teachers, 31 percent had 3 or 4 subjects taught by other teachers, and 25
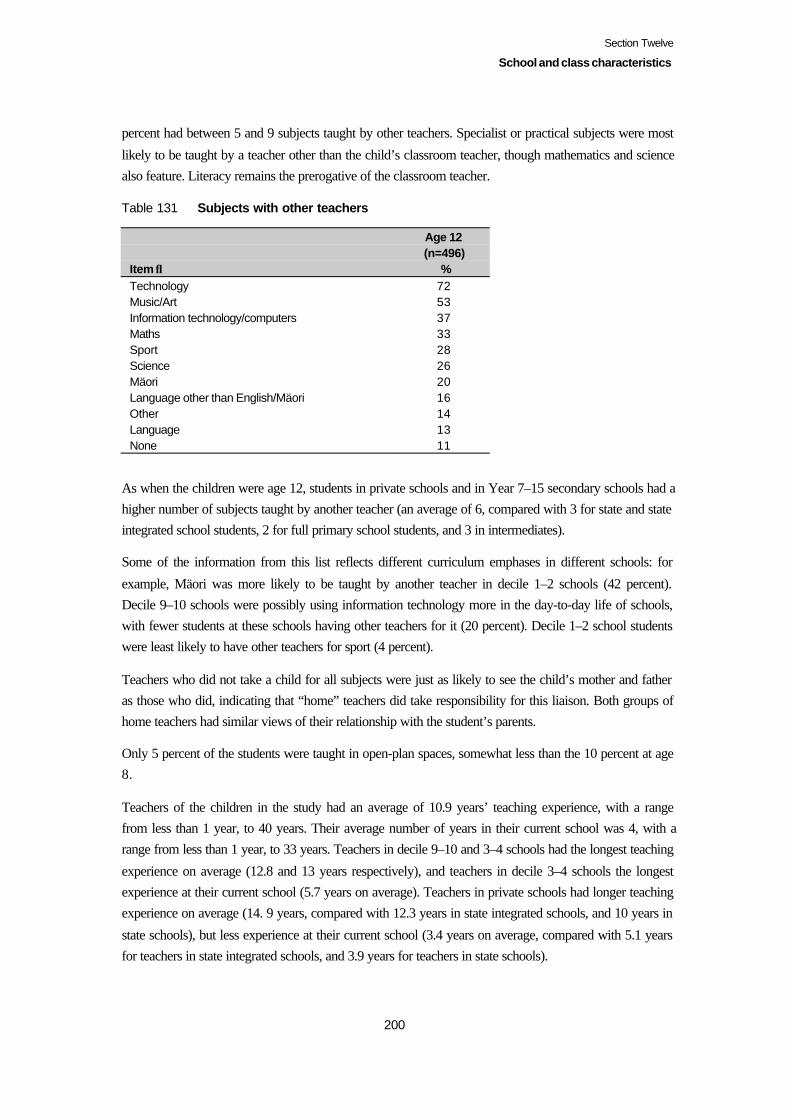
Section Twelve
School and class characteristics
200
percent had between 5 and 9 subjects taught by other teachers. Specialist or practical subjects were most
likely to be taught by a teacher other than the child’s classroom teacher, though mathematics and sciencealso feature. Literacy remains the prerogative of the classroom teacher.
Table 131 Subjects with other teachers
Item ↓
Age 12(n=496)
%Technology 72Music/Art 53Information technology/computers 37Maths 33Sport 28Science 26Mäori 20Language other than English/Mäori 16Other 14Language 13None 11
As when the children were age 12, students in private schools and in Year 7–15 secondary schools had ahigher number of subjects taught by another teacher (an average of 6, compared with 3 for state and stateintegrated school students, 2 for full primary school students, and 3 in intermediates).
Some of the information from this list reflects different curriculum emphases in different schools: for
example, Mäori was more likely to be taught by another teacher in decile 1–2 schools (42 percent).Decile 9–10 schools were possibly using information technology more in the day-to-day life of schools,with fewer students at these schools having other teachers for it (20 percent). Decile 1–2 school studentswere least likely to have other teachers for sport (4 percent).
Teachers who did not take a child for all subjects were just as likely to see the child’s mother and fatheras those who did, indicating that “home” teachers did take responsibility for this liaison. Both groups ofhome teachers had similar views of their relationship with the student’s parents.
Only 5 percent of the students were taught in open-plan spaces, somewhat less than the 10 percent at age8.
Teachers of the children in the study had an average of 10.9 years’ teaching experience, with a rangefrom less than 1 year, to 40 years. Their average number of years in their current school was 4, with arange from less than 1 year, to 33 years. Teachers in decile 9–10 and 3–4 schools had the longest teaching
experience on average (12.8 and 13 years respectively), and teachers in decile 3–4 schools the longestexperience at their current school (5.7 years on average). Teachers in private schools had longer teachingexperience on average (14. 9 years, compared with 12.3 years in state integrated schools, and 10 years in
state schools), but less experience at their current school (3.4 years on average, compared with 5.1 yearsfor teachers in state integrated schools, and 3.9 years for teachers in state schools).
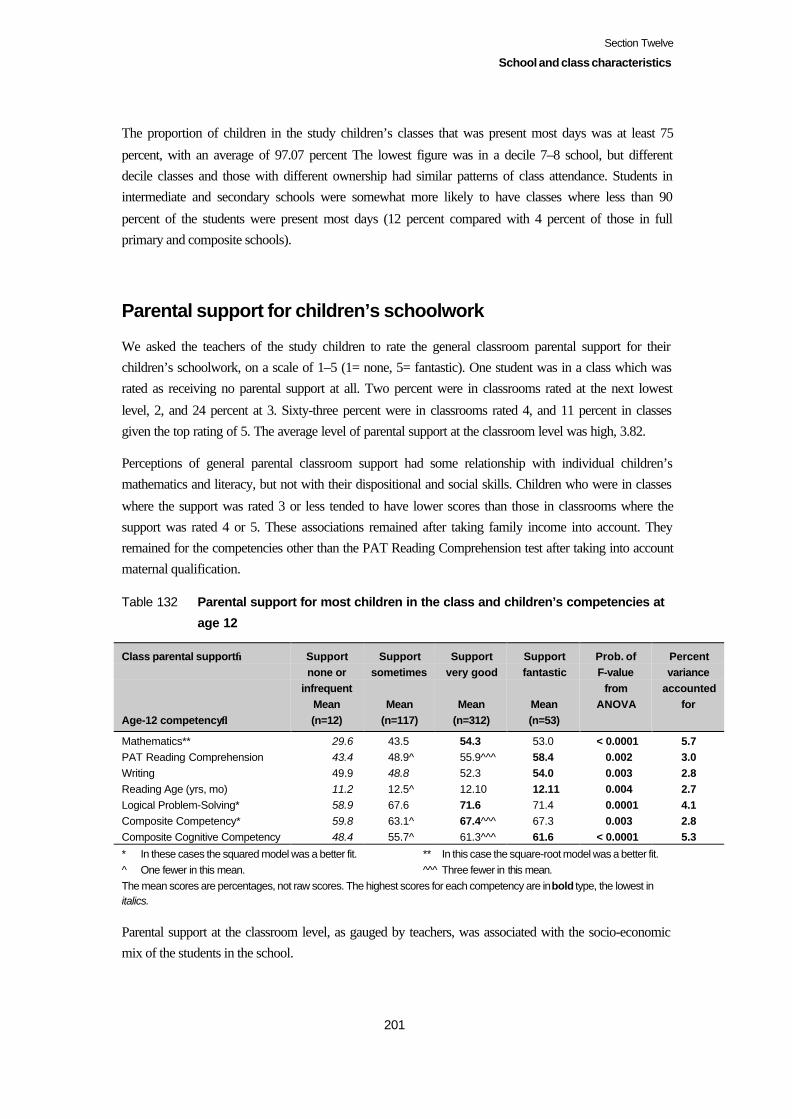
Section Twelve
School and class characteristics
201
The proportion of children in the study children’s classes that was present most days was at least 75
percent, with an average of 97.07 percent The lowest figure was in a decile 7–8 school, but differentdecile classes and those with different ownership had similar patterns of class attendance. Students inintermediate and secondary schools were somewhat more likely to have classes where less than 90
percent of the students were present most days (12 percent compared with 4 percent of those in fullprimary and composite schools).
Parental support for children’s schoolwork
We asked the teachers of the study children to rate the general classroom parental support for theirchildren’s schoolwork, on a scale of 1–5 (1= none, 5= fantastic). One student was in a class which wasrated as receiving no parental support at all. Two percent were in classrooms rated at the next lowest
level, 2, and 24 percent at 3. Sixty-three percent were in classrooms rated 4, and 11 percent in classesgiven the top rating of 5. The average level of parental support at the classroom level was high, 3.82.
Perceptions of general parental classroom support had some relationship with individual children’smathematics and literacy, but not with their dispositional and social skills. Children who were in classes
where the support was rated 3 or less tended to have lower scores than those in classrooms where thesupport was rated 4 or 5. These associations remained after taking family income into account. Theyremained for the competencies other than the PAT Reading Comprehension test after taking into accountmaternal qualification.
Table 132 Parental support for most children in the class and children’s competencies at
age 12
Class parental support→
Age-12 competency↓
Supportnone or
infrequentMean(n=12)
Supportsometimes
Mean(n=117)
Supportvery good
Mean(n=312)
Supportfantastic
Mean(n=53)
Prob. ofF-value
fromANOVA
Percentvariance
accountedfor
Mathematics** 29.6 43.5 54.3 53.0 < 0.0001 5.7PAT Reading Comprehension 43.4 48.9^ 55.9^^^ 58.4 0.002 3.0Writing 49.9 48.8 52.3 54.0 0.003 2.8Reading Age (yrs, mo) 11.2 12.5^ 12.10 12.11 0.004 2.7Logical Problem-Solving* 58.9 67.6 71.6 71.4 0.0001 4.1Composite Competency* 59.8 63.1^ 67.4^^^ 67.3 0.003 2.8Composite Cognitive Competency 48.4 55.7^ 61.3^^^ 61.6 < 0.0001 5.3
* In these cases the squared model was a better fit. ** In this case the square-root model was a better fit.^ One fewer in this mean. ^^ ̂ Three fewer in this mean.The mean scores are percentages, not raw scores. The highest scores for each competency are in bold type, the lowest initalics.
Parental support at the classroom level, as gauged by teachers, was associated with the socio-economicmix of the students in the school.

Section Twelve
School and class characteristics
202
Table 133 Teacher rating for parental support for most children in their class
For children in classrooms at Average onscale of 1–5
% rated1–3
Decile 1–2 schools 3.3 67Decile 3–4 schools 3.6 39Decile 5–6 schools 3.6 41Decile 7–8 schools 3.8 21Decile 9–10 schools 4.1 10
Private school classes had a higher rating for parental support (4.2, compared with 3.9 for state integratedschool classes, and 3.7 for state school classes).
Peer support
We asked the teachers of the study children to rate the peer support given by the students in the class toeach other, on a scale of 1–5. The average level of peer support was 3.83. Only 9 percent of the children’s
classrooms were rated 1–2 by the teachers, and 9 percent were rated as fantastic (5) in terms of peersupport.
Children whose classes were rated 3 or less for the support children gave each other tended to show lowerscores on the dispositional and social competency measures and writing, but not for mathematics andreading. These associations remained after taking into account family income and maternal qualification.
Table 134 Level of peer support for most children in the class and children’s
competencies at age 12
Class peer support→
Age-12 competency↓
Supportnone or
infrequentMean(n=9)
Supportsometimes
Mean(n=109)
Supportvery good
Mean(n=331)
Supportfantastic
Mean(n=45)
Prob. ofF-value
fromANOVA
Percentvariance
accountedfor
Curiosity 51.4 58.8 63.2 63.5 0.058 1.5Perseverance 63.2 62.0 71.2 72.4 0.001 3.2Individual Responsibility 61.1 68.3 77.6 76.7 < 0.0001 4.7Social Skills with Peers* 56.2 67.0 72.2 73.0 < 0.0001 4.4Social Skills with Adults* 74.1 70.0 79.0 75.7 < 0.0001 4.3Communication* 62.2 64.9 70.3 71.8 0.008 2.4Writing 49.2 49.4 52.6 50.1 0.022 1.9Composite Competency* 60.0 62.2 67.5^^^ 67.3^ 0.0003 3.8Composite Social & AttitudinalCompetency*
61.4 65.2 72.2 72.2 < 0.0001 4.8
* In these cases the squared model was a better fit. ^ One fewer in this mean. ^^^ Three fewer in this mean.The mean scores are percentages, not raw scores. The highest scores for each competency are in bold type, the lowest initalics.
Section Twelve
School and class characteristics
203
Ratings of peer and parental support were unrelated to whether most children in the class came to school
every day. The average rate of peer support within the class was not related to school decile, ownership,or type.
Summary
Around 40 percent of the study children were each attending intermediates or full primary schools, withunder 10 percent each attending Year 7–15 secondary schools, or composite schools, mostly private. Ahigher proportion of the children were attending private schools than their peers in the Wellington region.
The kind of school attended by children was related to family characteristics. Children whose mothershad no qualification were more likely to be attending intermediates or decile 1 schools; very few of thisgroup attended private schools. There was a similar trend in relation to family income. Mäori and Pasifikachildren were more likely to attend decile 1–2 schools, and Mäori children, state schools.
School socio-economic decileIn Section Four, we reported that children who had attended a decile 1–2 school over their schoolingyears tended to have lower average scores, over and above family income and maternal qualification. We
also found lower average scores for children currently attending decile 1–2 schools for mathematics andreading comprehension, over and above family characteristics. Some of this may be due to differences inhow the study children in these schools spent their time, with less emphasis on reading, and more on
television than others. The teachers of these classes gave estimates of the range of reading age in theirclass which included both a lower reading age at the bottom end of the range than teachers of classes inhigher decile schools gave, and a wider range than most others. Decile 1–2 school classes in the study
also had somewhat lower average attendance, a lower average level of parental support, a higherproportion of children whose first language was not English, and had fewer small classes (under 20).However, decile 1–2 parent satisfaction levels were much the same as others.
School ownership
Private school students had higher average scores for writing, after taking family income and maternalqualification into account. There are no clear differences in children’s accounts of their time-use, orattitudes to writing, or parental accounts of their relationship with the school which could shed light on
why this might be so; however, private school students were more likely to spend 4 hours or more a weekon homework.
School typeThere were some apparent differences for children’s literacy and Logical Problem-Solving levels related
to the type of school they were attending. However, there are uneven patterns of distribution of school
Section Twelve
School and class characteristics
204
types in terms of socio-economic characteristics, with most composite schools falling into the decile 9–10
or no-decile brackets, few intermediates were decile 9–10 schools, and few full primary schools weredecile 1–2. Once we took maternal qualification and family income separately into account, thesedifferences were no longer evident.
Classroom characteristics
The average class size of 28 experienced by the Competent Children study children has remainedconstant from age 8. Classes were lowest in private schools, and highest in intermediate schools. Sixty-seven percent of the children were taught in composite classes, most covering both Year 7 and Year 8.
Only 11 percent of the children now had a single teacher for all their subjects. Almost all the classroom
teachers taught their children literacy; mathematics was likely to be taught by another teacher for a thirdof the children, and science, a quarter. The specialist subjects of technology and music or art were mostlikely to be taught by another teacher. However, at age 12, children’s home class teachers saw thechildren’s parents just as often if they did not teach the child all their subjects, and if they did.
The general level of parental support for the schoolwork of the children in the class was given a highaverage rating (3.82/5). There were some associations with the general level of parental support in aclassroom and mathematics and the literacy measures other than the PAT Reading Comprehension test.Levels of parental support were related to the school socio-economic decile, and ownership.
The general level of peer support in the study children’s classrooms was also high (3.83/5). Children whowere in classrooms with low ratings for peer support had lower average scores for the social andattitudinal competencies and writing after taking family income and maternal qualification into account.Levels of peer support were unrelated to school characteristics.
Year levelAt age 12, 53 percent of the study children were in Year 7, and 47 percent in Year 8. Students in Year 8had slightly higher scores on average for the Burt Word Reading test, writing, and reading age only.
205
Section Thirteen
School experiences – children’s and parents’perspectives
Children’s attitudes to school at age 12
Most children enjoyed school, according to their parents’ report: 75 percent, slightly up on ages 10 and 8,and higher than at age 6 (62 percent). Eleven percent were described as being matter of fact and simplyaccepting school attendance as part of their daily routine, and 6 percent had mixed feelings, sometimes
enthusiastic, sometimes not. Four percent of the children were unhappy with school, and another 3percent had taken a while to settle but were now enjoying themselves. One percent were bored. Childrenfrom very high-income homes were least likely to be unhappy about school, or have mixed feelings about
it (5 percent, rising to 17 percent of children in low-income homes). A slightly higher proportion of girlswere thought to enjoy or be enthusiastic about school (80 percent compared with 71 percent of boys).
Parental reports of children’s current attitudes to school were linked to their achievement levels. On thewhole, children who were bored or unhappy had lower average scores. Children who enjoyed school, or
had taken a while to settle, tended to have higher scores on average. Scores were most variable for thegroup which had taken a while to settle to school.
These patterns remained after taking family income and maternal qualification into account for most, butnot all the competencies. The contrasts were no longer significant for mathematics in taking maternal
qualification into account, largely because differences in children’s responses to school were related totheir mother’s final educational level. For example, 17 percent of those whose mothers had noqualification were either bored, unhappy, or had mixed feelings about school, compared with 4 percent ofthose whose mothers had a university qualification.
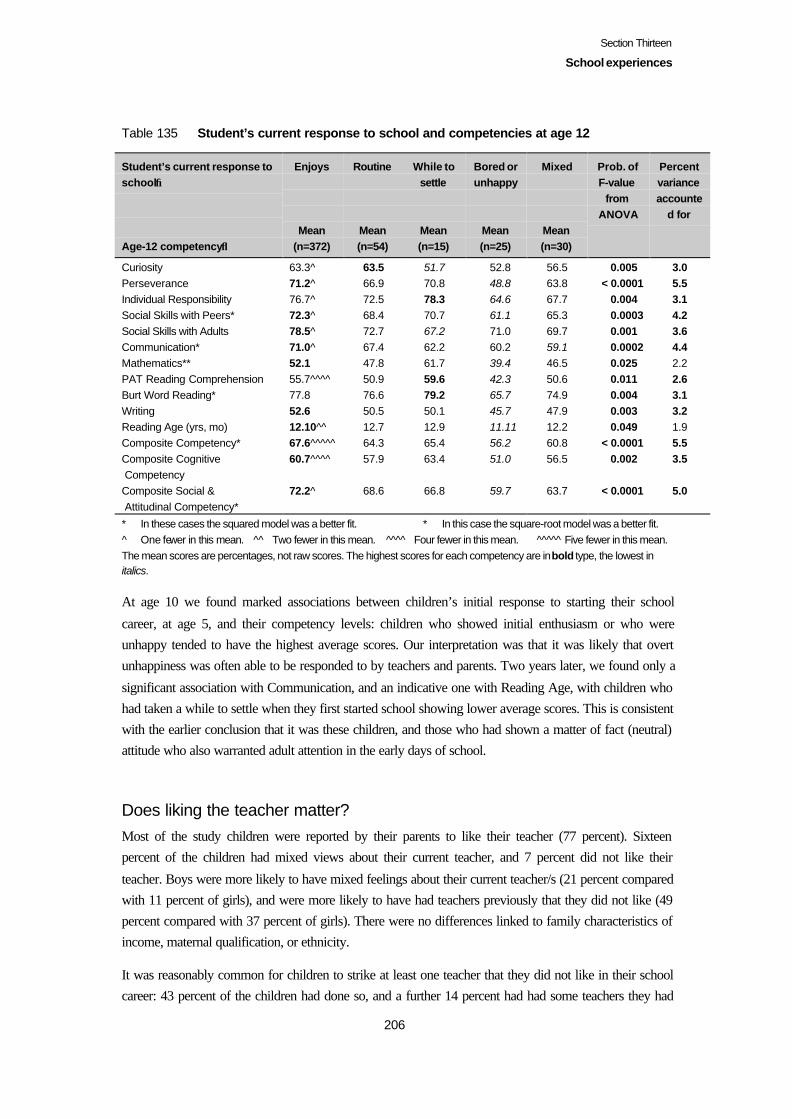
Section Thirteen
School experiences
206
Table 135 Student’s current response to school and competencies at age 12
Student’s current response toschool→
Age-12 competency↓
Enjoys
Mean(n=372)
Routine
Mean(n=54)
While tosettle
Mean(n=15)
Bored orunhappy
Mean(n=25)
Mixed
Mean(n=30)
Prob. ofF-value
fromANOVA
Percentvarianceaccounte
d for
Curiosity 63.3^ 63.5 51.7 52.8 56.5 0.005 3.0Perseverance 71.2^ 66.9 70.8 48.8 63.8 < 0.0001 5.5Individual Responsibility 76.7^ 72.5 78.3 64.6 67.7 0.004 3.1Social Skills with Peers* 72.3^ 68.4 70.7 61.1 65.3 0.0003 4.2Social Skills with Adults 78.5^ 72.7 67.2 71.0 69.7 0.001 3.6Communication* 71.0^ 67.4 62.2 60.2 59.1 0.0002 4.4Mathematics** 52.1 47.8 61.7 39.4 46.5 0.025 2.2PAT Reading Comprehension 55.7^^^^ 50.9 59.6 42.3 50.6 0.011 2.6Burt Word Reading* 77.8 76.6 79.2 65.7 74.9 0.004 3.1Writing 52.6 50.5 50.1 45.7 47.9 0.003 3.2Reading Age (yrs, mo) 12.10^^ 12.7 12.9 11.11 12.2 0.049 1.9Composite Competency* 67.6^^^^^ 64.3 65.4 56.2 60.8 < 0.0001 5.5Composite Cognitive Competency
60.7^^^^ 57.9 63.4 51.0 56.5 0.002 3.5
Composite Social & Attitudinal Competency*
72.2^ 68.6 66.8 59.7 63.7 < 0.0001 5.0
* In these cases the squared model was a better fit. * In this case the square-root model was a better fit.^ One fewer in this mean. ^^ Two fewer in this mean. ^^^^ Four fewer in this mean. ^^^^^ Five fewer in this mean.The mean scores are percentages, not raw scores. The highest scores for each competency are in bold type, the lowest initalics.
At age 10 we found marked associations between children’s initial response to starting their school
career, at age 5, and their competency levels: children who showed initial enthusiasm or who wereunhappy tended to have the highest average scores. Our interpretation was that it was likely that overtunhappiness was often able to be responded to by teachers and parents. Two years later, we found only a
significant association with Communication, and an indicative one with Reading Age, with children whohad taken a while to settle when they first started school showing lower average scores. This is consistentwith the earlier conclusion that it was these children, and those who had shown a matter of fact (neutral)attitude who also warranted adult attention in the early days of school.
Does liking the teacher matter?Most of the study children were reported by their parents to like their teacher (77 percent). Sixteenpercent of the children had mixed views about their current teacher, and 7 percent did not like their
teacher. Boys were more likely to have mixed feelings about their current teacher/s (21 percent comparedwith 11 percent of girls), and were more likely to have had teachers previously that they did not like (49percent compared with 37 percent of girls). There were no differences linked to family characteristics ofincome, maternal qualification, or ethnicity.
It was reasonably common for children to strike at least one teacher that they did not like in their schoolcareer: 43 percent of the children had done so, and a further 14 percent had had some teachers they had
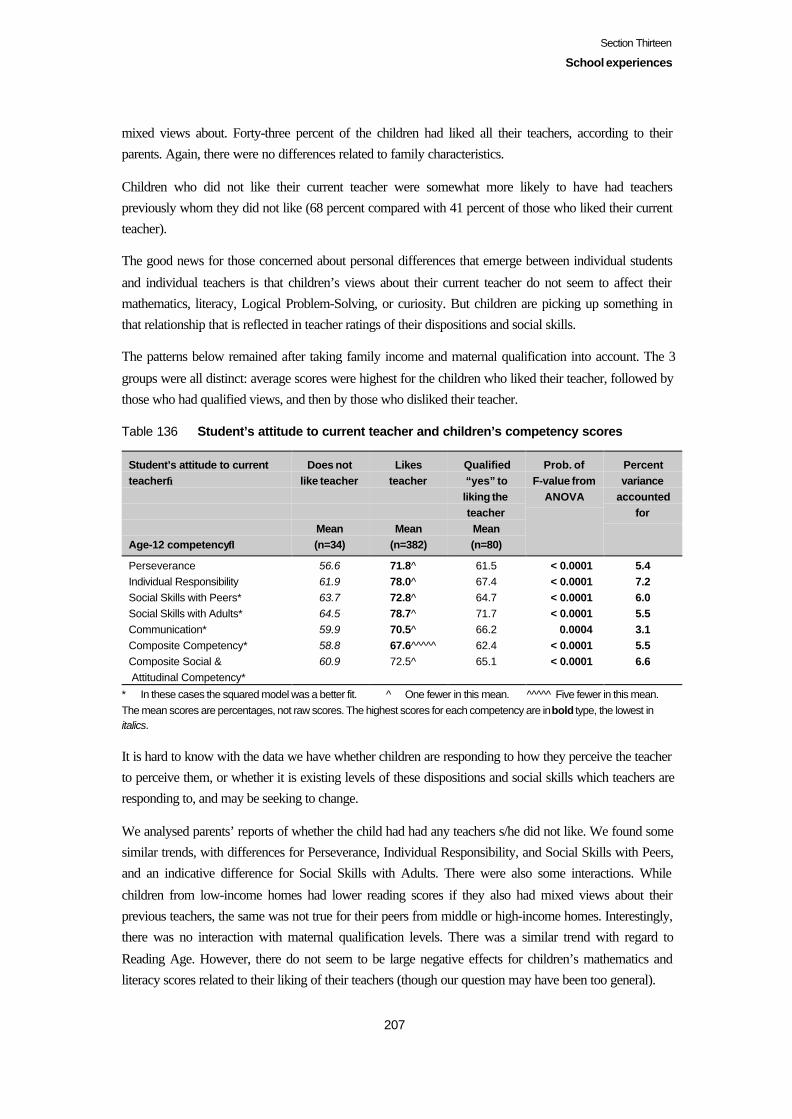
Section Thirteen
School experiences
207
mixed views about. Forty-three percent of the children had liked all their teachers, according to theirparents. Again, there were no differences related to family characteristics.
Children who did not like their current teacher were somewhat more likely to have had teacherspreviously whom they did not like (68 percent compared with 41 percent of those who liked their currentteacher).
The good news for those concerned about personal differences that emerge between individual students
and individual teachers is that children’s views about their current teacher do not seem to affect theirmathematics, literacy, Logical Problem-Solving, or curiosity. But children are picking up something inthat relationship that is reflected in teacher ratings of their dispositions and social skills.
The patterns below remained after taking family income and maternal qualification into account. The 3
groups were all distinct: average scores were highest for the children who liked their teacher, followed bythose who had qualified views, and then by those who disliked their teacher.
Table 136 Student’s attitude to current teacher and children’s competency scores
Student’s attitude to currentteacher→
Age-12 competency↓
Does notlike teacher
Mean(n=34)
Likesteacher
Mean(n=382)
Qualified“yes” toliking theteacherMean(n=80)
Prob. ofF-value from
ANOVA
Percentvariance
accountedfor
Perseverance 56.6 71.8^ 61.5 < 0.0001 5.4Individual Responsibility 61.9 78.0^ 67.4 < 0.0001 7.2Social Skills with Peers* 63.7 72.8^ 64.7 < 0.0001 6.0Social Skills with Adults* 64.5 78.7^ 71.7 < 0.0001 5.5Communication* 59.9 70.5^ 66.2 0.0004 3.1Composite Competency* 58.8 67.6^^^^^ 62.4 < 0.0001 5.5Composite Social & Attitudinal Competency*
60.9 72.5^ 65.1 < 0.0001 6.6
* In these cases the squared model was a better fit. ^ One fewer in this mean. ^^^^^ Five fewer in this mean.The mean scores are percentages, not raw scores. The highest scores for each competency are in bold type, the lowest initalics.
It is hard to know with the data we have whether children are responding to how they perceive the teacherto perceive them, or whether it is existing levels of these dispositions and social skills which teachers areresponding to, and may be seeking to change.
We analysed parents’ reports of whether the child had had any teachers s/he did not like. We found somesimilar trends, with differences for Perseverance, Individual Responsibility, and Social Skills with Peers,and an indicative difference for Social Skills with Adults. There were also some interactions. While
children from low-income homes had lower reading scores if they also had mixed views about theirprevious teachers, the same was not true for their peers from middle or high-income homes. Interestingly,there was no interaction with maternal qualification levels. There was a similar trend with regard to
Reading Age. However, there do not seem to be large negative effects for children’s mathematics andliteracy scores related to their liking of their teachers (though our question may have been too general).
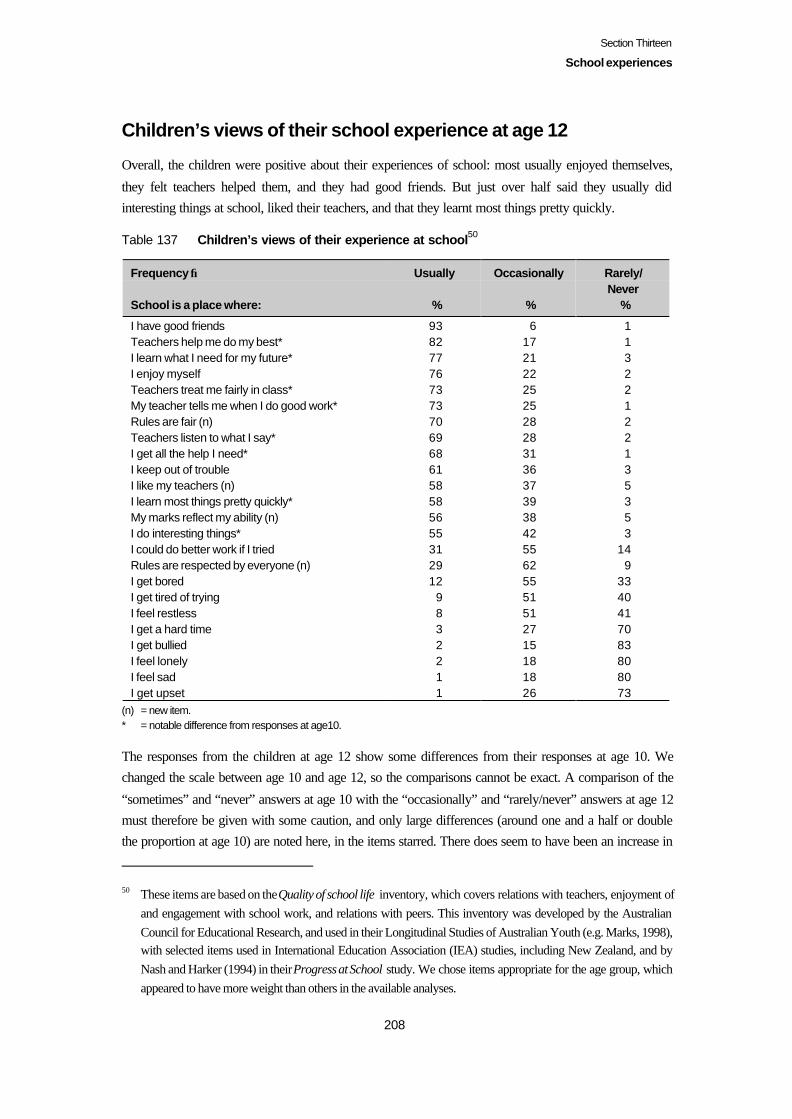
Section Thirteen
School experiences
208
Children’s views of their school experience at age 12
Overall, the children were positive about their experiences of school: most usually enjoyed themselves,
they felt teachers helped them, and they had good friends. But just over half said they usually didinteresting things at school, liked their teachers, and that they learnt most things pretty quickly.
Table 137 Children’s views of their experience at school50
Frequency →
School is a place where:
Usually
%
Occasionally
%
Rarely/Never
%
I have good friends 93 6 1Teachers help me do my best* 82 17 1I learn what I need for my future* 77 21 3I enjoy myself 76 22 2Teachers treat me fairly in class* 73 25 2My teacher tells me when I do good work* 73 25 1Rules are fair (n) 70 28 2Teachers listen to what I say* 69 28 2I get all the help I need* 68 31 1I keep out of trouble 61 36 3I like my teachers (n) 58 37 5I learn most things pretty quickly* 58 39 3My marks reflect my ability (n) 56 38 5I do interesting things* 55 42 3I could do better work if I tried 31 55 14Rules are respected by everyone (n) 29 62 9I get bored 12 55 33I get tired of trying 9 51 40I feel restless 8 51 41I get a hard time 3 27 70I get bullied 2 15 83I feel lonely 2 18 80I feel sad 1 18 80I get upset 1 26 73
(n) = new item.* = notable difference from responses at age10.
The responses from the children at age 12 show some differences from their responses at age 10. Wechanged the scale between age 10 and age 12, so the comparisons cannot be exact. A comparison of the
“sometimes” and “never” answers at age 10 with the “occasionally” and “rarely/never” answers at age 12must therefore be given with some caution, and only large differences (around one and a half or doublethe proportion at age 10) are noted here, in the items starred. There does seem to have been an increase in
50 These items are based on the Quality of school life inventory, which covers relations with teachers, enjoyment ofand engagement with school work, and relations with peers. This inventory was developed by the AustralianCouncil for Educational Research, and used in their Longitudinal Studies of Australian Youth (e.g. Marks, 1998),with selected items used in International Education Association (IEA) studies, including New Zealand, and byNash and Harker (1994) in their Progress at School study. We chose items appropriate for the age group, whichappeared to have more weight than others in the available analyses.
Section Thirteen
School experiences
209
the proportions of those who are less positive about their school experience between the 2 years, largely
in terms of their interaction with teachers and doing interesting things, rather than in terms of emotionalresponses to the classroom, and relations with peers.
The widest differences were seen in relation to students’ academic performance. For many items, therewas a gradient from those seen by their teachers to be performing at a very low or below average level, to
those performing at a very good/excellent level. The students whom teachers judged to be performingbelow average overall tended to be less positive about their classroom experiences, particularly forfeeling they did interesting things, that teachers helped them do their best, being treated fairly in class,
getting a hard time, and being told by their teacher that they had done good work, being listened to byteachers, getting all the help they need, getting tired of trying, and feeling restless. They were more likelyto say they were bullied. However, they were just as likely to like their teacher.
Children’s responses to many of these questions were related to whether they liked their current teacher.
But liking the teacher was not linked to reports of friendship, bullying, loneliness, sadness, or being upset,or to views that they could do better work if they tried or learnt most things pretty quickly, and that theclass rules were respected.
Disliking any previous teacher did not appear to influence children’s current responses to their classroom:
there were no associations found. However, we did not ask how many of the children’s previous teacherswere disliked, and possibly some analysis using the proportion of teachers who were disliked might haveshown some associations.
Boys were somewhat less positive than girls about their experiences at school. They were less likely tosay they usually:
• did interesting things (50 percent compared with 61 percent of girls);• were treated fairly in class (69 percent compared with 78 percent of girls); and• kept out of trouble (53 percent compared with 70 percent of girls).
Boys were more likely to think they could usually do better work if they tried (36 percent compared with
27 percent of girls), and 34 percent said they were rarely or never tired of trying, compared with 46percent of the girls. Eleven percent said they usually felt restless at school, compared with 4 percent of thegirls.
There were only a few individual items where school characteristics were associated with differences in
student responses: in other words, differences in school characteristics do not mean that there are distincttypes of schools in which students will have quite different experiences. Because there are only a few, itis likely that some differences found are more to do with this particular sample, and may not be found insimilar studies; others are consistent with other findings in this study.
Study children who were in composite schools were more likely to say they were only rarely or nevergiven a hard time (88 percent).
Belief that a student could usually do better work if he or she tried was related to school decile, risingfrom 22 percent of the students in decile 9–10 schools, to 47 percent of those in decile 1–2 schools.
Section Thirteen
School experiences
210
There were no family income associations, and only a few associations with ethnicity: Mäori students
were more likely to think they could do better work if they tried (50 percent compared with 27 percent ofPäkehä/European)and Päkehä/European students were more likely to report that they usually kept out oftrouble (64 percent compared with Mäori, 46 percent)
There were some associations with maternal qualification. The feeling that teachers usually treated a
student fairly in class rose with levels of maternal qualification from 64 percent of those whose motherhad no qualification to 80 percent of those whose mother had a university qualification. There was asimilar trend with reporting that the student usually kept out of trouble, rising from 43 percent of those
whose mother had no qualification, to 75 percent of those whose mother had a university qualification,and with feeling that the student’s marks usually reflected his or her ability, rising from 43 percent ofthose whose mother had no qualification, to 65 percent of those whose mother had a university
qualification. There was a reverse trend for feeling that the student could usually do better work if theytried, rising from 20 percent of the students whose mother had a university qualification, to 42 percent ofthose whose mother had no qualification. Those whose mother had a university qualification were most
confident that they usually learnt most things pretty quickly: 81 percent (compared with 58 percentoverall).
We undertook a factor analysis of the children’s responses to these items to reduce them for analysispurposes in relation to the research question which is answered at the end of this section. This produced 2
factors with alpha values of 0.81 and 0.74 respectively (the other factors had much lower alpha values, orthe variables loaded singly onto a factor).
The first draws together experiences of enjoyment, support, fairness, and belief in the value of the workof school.
Engagement in school – children’s answers to the items about school being a place where:
• I get all the help I need
• Teachers are fair• Teachers listen to what I say• I enjoy myself
• Teachers help me do my best• The rules are fair• I like the teachers
• I do interesting things• Teachers tell me when I do good work• I learn what I need for the future• I get bored [reversed].
The second factor signals distress:
• I am upset• I am lonely• I am sad.

Section Thirteen
School experiences
211
We cross-tabulated the children’s scores on these factors with 4 key aspects of children’s lives which are
linked to their performance at age 12: enjoyment of reading, hours spent watching television, maternalqualification, and school socio-economic decile. We found that the higher a child’s score was on theEngagement in school factor, the more likely they were to enjoy reading (72 percent of those who usually
engaged in school, decreasing to 43 percent of those who rarely engaged in school), and to watch lessthan 2 hours television a day (64 percent, decreasing to 48 percent of those who rarely engaged inschool). Though the proportion of those who were usually engaged in school was related to levels of
maternal qualification (ranging from 43 percent of the children whose mothers had a universityqualification to 22 percent of those whose mothers had no qualification), the proportions of those whoonly rarely or occasionally engaged with school were unrelated to maternal qualification levels. Student
engagement in school-levels were much the same across all the school deciles. Distress at school does notshow similar associations. Taken together, this would suggest that children’s own confidence in the kindsof skills practised at school – particularly the key role of literacy both in itself and as a key to knowledgeand understanding – plays an important role in their engagement in school.
Children’s views of their classroom experiences and competency levelsWe found that children’s views of their classroom experiences were often associated with theircompetency levels at age 10. The items that then showed associations with most competencies after
taking into account family income and maternal qualification were to do with fair treatment, havinginteresting work, and keeping out of trouble. The items which showed least association were to do withpeer relations (or lack of them).
At age 12, we found that after taking into account family income and maternal qualification, the items fell
into 4 groups: those that showed an association with 11 or 12 of the 12 competency measures, those thatshowed an association with between 8–10, those that showed associations with 4–7, and those thatshowed no or few associations. This is a different pattern from the set of items asked about homeexperiences, which fell into 2 groups.
The items which showed widespread associations with the competency measures (11 or 12 of the 12)were:
• I keep out of trouble• I could do better work if I tried
• I get tired of trying• I get bored• The rules are fair, and• I learn most things pretty quickly.
These items are mostly about the actual work of school, and either alienation from it – it holds noattraction or experience of success – or ability to identify with its structure (fair rules) and what it offers.
The next group shows associations with around two-thirds of the 12 competency measures. These itemswere:

Section Thirteen
School experiences
212
• I do interesting things
• The teacher helps me do my best• Teachers treat me fairly in class• My teacher tells me when I do good work
• I get a hard time in school• I feel restless• I get bullied• My marks reflect my ability.
This group has more items focused on the student’s interaction with their teacher, with some itemsrelating to peer relations, and some on the student’s engagement with the work of learning and achieving.
The third group shows associations with a third to a half of the competency measures:
• I feel lonely at school• I learn what I need for my future
• I like my teachers• Teachers listen to what I say• I have good friends at school
• I enjoy myself• I get all the help I need.
This set of items is also mixed, with somewhat more of a focus on the tone of relationships with teachersand peers.
The final group of 2 shows few or no associations with the 12 competency measures:
• I feel sad at school – no associations• The rules are respected by everyone.
We report next the specific associations found for each of these items. Most of the contrasts werebetween the average scores of children who rated their experience as “usually”, and those who rated theirexperience as “occasionally” or “rarely-never”. In the lists that follow, the starred associations are those
where the percentage points difference was 10 or more on average, or, for Reading Age, more than theequivalent of a year.
Items with universal associations
I could do better work if I tried
Children who reported they rarely/never, or occasionally could do better work if they tried had higheraverage scores than those who said they could usually do better work if they tried.
Mathematics*, PAT Reading Comprehension test*, Burt Word Reading test, Writing, Reading Age,
Logical Problem-Solving, Curiosity, Perseverance*, Individual Responsibility, Social Skills with Peers,Social Skills with Adults, and Communication.
Section Thirteen
School experiences
213
I keep out of trouble
Children who said they usually kept out of trouble had higher average scores than those who said they didso occasionally, or rarely/never.
Mathematics*, PAT Reading Comprehension test*, Burt Word Reading test*, Writing, Reading Age*,Logical Problem-Solving, Curiosity, Perseverance*, Individual Responsibility*, Social Skills with Peers,Social Skills with Adults, and Communication.
The rules are fair
Children who thought that the school rules were usually fair had higher average scores than those whothought they were only occasionally, or rarely/never fair.
Mathematics, PAT Reading Comprehension test, Burt Word Reading test*, Writing, Reading Age,Logical Problem-Solving, Curiosity, Perseverance*, Individual Responsibility*, Social Skills withPeers*, Social Skills with Adults*, and Communication*.
I learn most things pretty quickly
Children who thought they usually learnt most things pretty quickly had higher average marks than thosewho thought they did so only occasionally, or rarely/never.
Mathematics*, PAT Reading Comprehension test*, Burt Word Reading test*, Writing, Reading Age,Logical Problem-Solving, Curiosity*, Perseverance, Individual Responsibility, Social Skills with Peers,Social Skills with Adults, and Communication*.
I get tired of trying
Children who reported that they rarely or never got tired of trying had higher average marks than those
who reported usually or occasionally getting tired of trying; for the cognitive competencies, those whoreported occasionally getting tired of trying had higher average marks than those who reported gettingoften tired of trying.
Mathematics*, PAT Reading Comprehension test, Burt Word Reading test, Reading Age, Logical
Problem-Solving, Curiosity, Perseverance*, Individual Responsibility, Social Skills with Peers, SocialSkills with Adults, and Communication.
I get bored
Children who said they usually got bored had lower average marks than those who said they occasionallyor rarely/never got bored.
Mathematics*, PAT Reading Comprehension test, Burt Word Reading test, Writing, Reading Age*,
Curiosity, Perseverance*, Individual Responsibility*, Social Skills with Peers*, Social Skills withAdults*, and Communication*.
Items with many associations
Section Thirteen
School experiences
214
I do interesting things
Children who said they usually did interesting things at school had higher average scores than those who
said they did them occasionally or rarely/never for the social and attitudinal competencies, and for threeof the 4 literacy measures.
PAT Reading Comprehension test, Writing, Reading Age, Curiosity, Perseverance*, IndividualResponsibility*, Social Skills with Peers*, Social Skills with Adults*, and Communication*.
I feel restless
Children who reported that they usually felt restless at school had lower average marks than those who
felt restless occasionally or rarely/never for the social and attitudinal competencies, mathematics, and 3 ofthe 4 literacy measures.
Mathematics*, PAT Reading Comprehension test*, Writing, Reading Age, Curiosity, Perseverance*,Individual Responsibility*, Social Skills with Peers, Social Skills with Adults, and Communication*.
My marks reflect my ability
Children who thought the marks they received for their work usually reflected their ability had higher
scores than those who thought their marks only occasionally did so, for social and attitudinal competencymeasures, mathematics, and the 4 literacy measures.
Mathematics, PAT Reading Comprehension test, Burt Word Reading test, Writing, Reading Age,Perseverance, Individual Responsibility, Social Skills with Adults, and Communication.
Teachers help me to do my best
Children who thought their teachers usually helped them do their best had higher average scores thanothers for the social and attitudinal competencies, and all 4 literacy measures.
PAT Reading Comprehension test, Burt Word Reading test, Writing, Reading Age, Perseverance*,Individual Responsibility*, Social Skills with Peers, Social Skills with Adults*, and Communication*.
Teachers treat me fairly in the classroom
Children who felt they were usually treated fairly by their teachers had higher average scores for thesocial and attitudinal competency measures, mathematics, and 2 of the literacy measures.
Mathematics, Writing, Reading Age, Perseverance*, Individual Responsibility*, Social Skills with Peers,Social Skills with Adults*, and Communication.
I enjoy myself
Children who usually enjoyed themselves had higher average marks than those who said theyoccasionally or rarely/never did so for the social and attitudinal competency measures, and 1 literacymeasure.
Section Thirteen
School experiences
215
Burt Word Reading test*, Curiosity, Perseverance, Individual Responsibility, Social Skills with Peers,Social Skills with Adults*, and Communication.
I get all the help I need
Children who thought they usually got all the help they needed had higher average marks than those whothought they got it occasionally or rarely/never for the social and attitudinal competencies, and 2 of theliteracy measures.
Writing, Reading Age, Curiosity, Perseverance*, Individual Responsibility*, Social Skills with Peers*,Social Skills with Adults*, and Communication*.
Teachers tell me when I do good work
Children whose teacher usually told them when they were doing good work had higher average scoresthan those who heard this from their teacher only occasionally, or rarely/never for the social andattitudinal competencies, and 1 of the literacy measures.
Reading Age, Curiosity, Perseverance, Individual Responsibility, Social Skills with Peers, Social Skillswith Adults*, and Communication*.
I get bullied
Children who said they were rarely/never bullied at school had higher average scores than those who saidthey were occasionally or usually bullied for the social and attitudinal competencies, and the four literacymeasures.
PAT Reading Comprehension test, Burt Word Reading test, Writing, Reading Age*, Perseverance*,Individual Responsibility, Social Skills with Peers*, and Social Skills with Adults*.
I get a hard time in school
Children who felt they rarely/never got a hard time in school had higher average scores than those whothought they occasionally did for the social and attitudinal competency measures, and 3 of the literacymeasures.
PAT Reading Comprehension test, Burt Word Reading test, Reading Age, Curiosity, Perseverance*,Individual Responsibility, Social Skills with Peers, Social Skills with Adults, and Communication.
Items with some associations
I have good friends at school
Children who thought they usually had good friends had higher average marks than those who thoughtthey had them occasionally or rarely/never for social and attitudinal competencies.
Perseverance*, Individual Responsibility*, Social Skills with Peers*, Social Skills with Adults*, andCommunication*.
Section Thirteen
School experiences
216
I like my teachers
Children who usually liked their teachers had higher average marks than those who liked them onlyoccasionally, or rarely/never, for 5 of the social and attitudinal competency measures.
Perseverance*, Individual Responsibility*, Social Skills with Peers*, Social Skills with Adults*, andCommunication*.
Teachers listen to what I say
Children who thought their teachers usually listened to what they had to say had higher average scoresthan those who thought they listened only occasionally, or rarely/never, for 4 social and attitudinalcompetency measures, and 1 literacy measure.
Reading Age, Perseverance, Individual Responsibility, Social Skills with Peers, and Social Skills withAdults*.
I learn what I need for my future
Children who thought they were usually learning what they needed for their future had higher averagemarks than those who thought they did so occasionally or rarely/never for some of the social andattitudinal competency measures.
Perseverance, Individual Responsibility*, Social Skills with Peers*, and Social Skills with Adults*.
I feel lonely
Children who usually felt lonely at school had lower average marks than those who felt lonely onlyoccasionally, or rarely/never, for 2 of the social and attitudinal competencies, and 2 of the 4 literacymeasures.
Perseverance, Social Skills with Peers*, PAT Reading Comprehension test*, and Writing.
Items with few associations
The rules are respected by everyone
Children who thought their school rules were rarely/never respected by everyone had lower averagemarks than those who thought they usually or occasionally were for 2 competency measures.
Social Skills with Peers*, and Writing.
Children’s perceptions of their classrooms
As at ages 8 and 10, we also asked the study children to use the My Class Inventory (MCI) to give us their
perceptions of the difficulty of the work they were given, their general enjoyment (satisfaction), thedegree of competitiveness between students, friction between children, and friendliness between children(cohesion).

Section Thirteen
School experiences
217
The next table gives the age-12 responses, and compares them with the study children’s responses at ages
8 and 10. On the whole, enjoyment (satisfaction) levels are lower in the study children’s classrooms atage 12 (as they perceive them), but so also are levels of the difficulty of the work they are given, andcompetition. Levels of both cohesion and friction were highest when the children were aged 8. There hasbeen some further differentiation among classroom peers in terms of friendship since age 10.
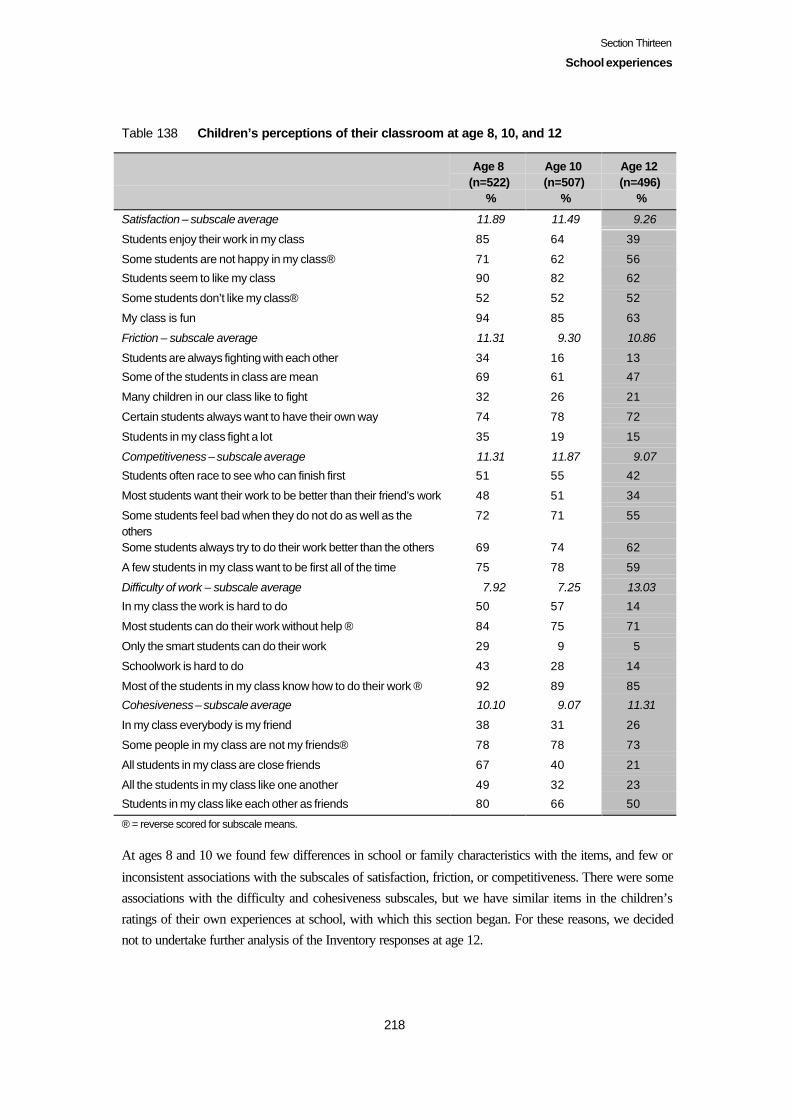
Section Thirteen
School experiences
218
Table 138 Children’s perceptions of their classroom at age 8, 10, and 12
Age 8(n=522)
%
Age 10(n=507)
%
Age 12(n=496)
%
Satisfaction – subscale average 11.89 11.49 9.26
Students enjoy their work in my class 85 64 39
Some students are not happy in my class® 71 62 56
Students seem to like my class 90 82 62
Some students don’t like my class® 52 52 52
My class is fun 94 85 63
Friction – subscale average 11.31 9.30 10.86
Students are always fighting with each other 34 16 13
Some of the students in class are mean 69 61 47
Many children in our class like to fight 32 26 21
Certain students always want to have their own way 74 78 72
Students in my class fight a lot 35 19 15
Competitiveness – subscale average 11.31 11.87 9.07
Students often race to see who can finish first 51 55 42
Most students want their work to be better than their friend’s work 48 51 34
Some students feel bad when they do not do as well as theothers
72 71 55
Some students always try to do their work better than the others 69 74 62
A few students in my class want to be first all of the time 75 78 59
Difficulty of work – subscale average 7.92 7.25 13.03
In my class the work is hard to do 50 57 14
Most students can do their work without help ® 84 75 71
Only the smart students can do their work 29 9 5
Schoolwork is hard to do 43 28 14
Most of the students in my class know how to do their work ® 92 89 85
Cohesiveness – subscale average 10.10 9.07 11.31
In my class everybody is my friend 38 31 26
Some people in my class are not my friends® 78 78 73
All students in my class are close friends 67 40 21
All the students in my class like one another 49 32 23
Students in my class like each other as friends 80 66 50
® = reverse scored for subscale means.
At ages 8 and 10 we found few differences in school or family characteristics with the items, and few or
inconsistent associations with the subscales of satisfaction, friction, or competitiveness. There were someassociations with the difficulty and cohesiveness subscales, but we have similar items in the children’sratings of their own experiences at school, with which this section began. For these reasons, we decidednot to undertake further analysis of the Inventory responses at age 12.
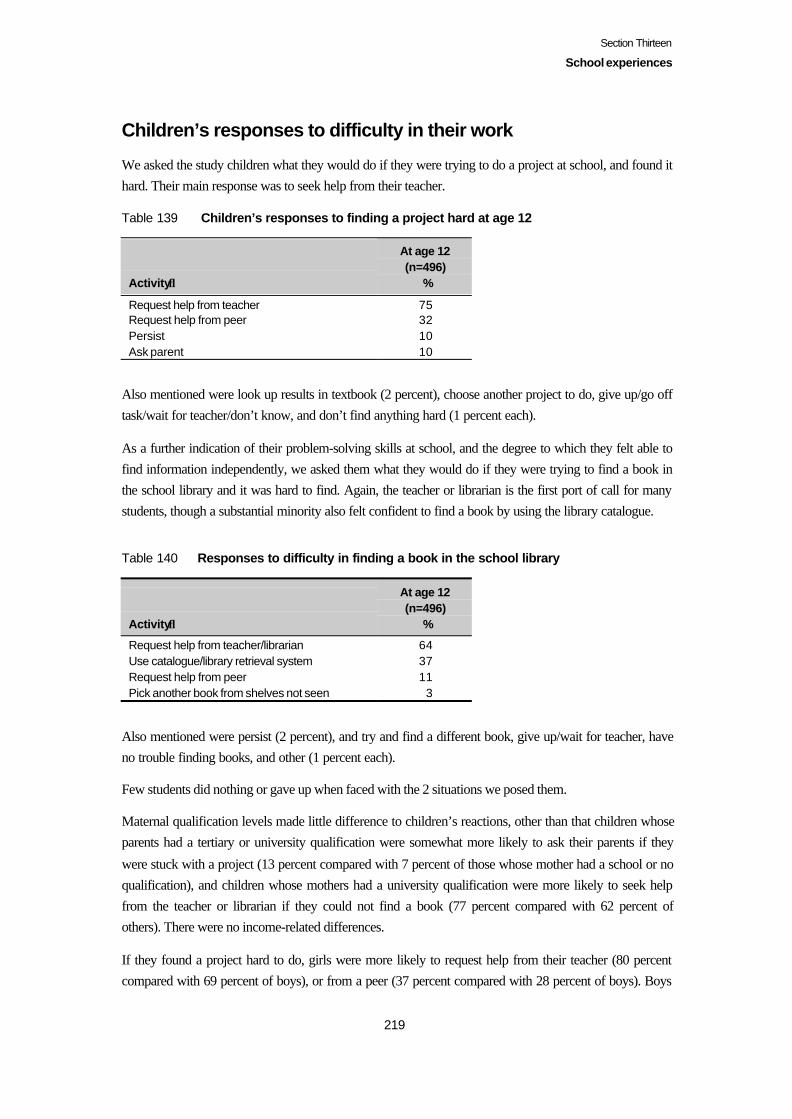
Section Thirteen
School experiences
219
Children’s responses to difficulty in their work
We asked the study children what they would do if they were trying to do a project at school, and found ithard. Their main response was to seek help from their teacher.
Table 139 Children’s responses to finding a project hard at age 12
Activity↓
At age 12(n=496)
%
Request help from teacher 75Request help from peer 32Persist 10Ask parent 10
Also mentioned were look up results in textbook (2 percent), choose another project to do, give up/go offtask/wait for teacher/don’t know, and don’t find anything hard (1 percent each).
As a further indication of their problem-solving skills at school, and the degree to which they felt able tofind information independently, we asked them what they would do if they were trying to find a book inthe school library and it was hard to find. Again, the teacher or librarian is the first port of call for manystudents, though a substantial minority also felt confident to find a book by using the library catalogue.
Table 140 Responses to difficulty in finding a book in the school library
Activity↓
At age 12(n=496)
%
Request help from teacher/librarian 64Use catalogue/library retrieval system 37Request help from peer 11Pick another book from shelves not seen 3
Also mentioned were persist (2 percent), and try and find a different book, give up/wait for teacher, haveno trouble finding books, and other (1 percent each).
Few students did nothing or gave up when faced with the 2 situations we posed them.
Maternal qualification levels made little difference to children’s reactions, other than that children whoseparents had a tertiary or university qualification were somewhat more likely to ask their parents if they
were stuck with a project (13 percent compared with 7 percent of those whose mother had a school or noqualification), and children whose mothers had a university qualification were more likely to seek helpfrom the teacher or librarian if they could not find a book (77 percent compared with 62 percent ofothers). There were no income-related differences.
If they found a project hard to do, girls were more likely to request help from their teacher (80 percentcompared with 69 percent of boys), or from a peer (37 percent compared with 28 percent of boys). Boys
Section Thirteen
School experiences
220
were marginally more likely to persist (12 percent compared with 7 percent, p = 0.06). Girls were also
more likely to request help from a teacher or librarian if they couldn’t find a book in the library (70percent compared with 59 percent of boys), or from a peer (15 percent compared with 8 percent of boys).
Homework
Children’s views
Most of the study children did homework at least 2 days a week: 57 percent said they did homework on 4or 5 days, and 32 percent, on 2 or 3 days each week. Nine percent said they did homework on one day aweek, and 1 percent said they never did homework. There was an association with level of maternal
qualification: 49 percent of the children whose mothers had no qualification said they did homework on4–5 days a week, rising to 64 percent of those whose mothers had a university qualification.
The study children’s estimates of the number of hours they spent on homework each week at age 12ranged from half an hour (3 percent) to 20 hours (1 child), with an average of 3.31 hours (s.d. 2.28).
Girls’ average time spent on homework was 3.51 hours, slightly more than the average for the boys in thestudy, 3.11 hours. Pasifika and Päkehä/European children reported the highest average time spent onhomework each week: 3.48 and 3.32 hours respectively, compared with 2.88 for Asian children, and 2.71for Mäori children in the study.
Children whose mothers had no qualification reported a lower average amount of time spent onhomework, 2.49 hours a week. Children from the highest-income homes had a slightly higher averagetime spent on homework, 3.67 hours a week.
We found that time spent on homework was associated with all of the competency measures. However,
the contrast was between those who did homework for less than an hour a week, and those who didhomework for an hour or more, with no significant differences between children spending differentamounts of time above that. Allowing for family income and maternal qualification did reduce some of
these associations to an indicative level, but the associations with the cognitive competencies remainedsignificant. The difference between those who did homework for less than an hour a week and others forthe Composite Cognitive Competency after allowing for maternal qualification was between 6–8percentage points.
The average number of hours spent on homework reflected how often children did it. The average timespent on homework by those who only did it once a week was 1.83 hours (s.d. 1.61), for those who did it2–3 days a week, 2.65 hours (s.d. 2.53), and for those who did it 4–5 days a week, 3.9 hours (s.d. 2.53).
Views of how important homework is were also reflected in the time children gave it: an average of 3.59
hours (s.d. 2.1) for those who thought it was very important, 3.11 (s.d. 2.08) for those who thought itmattered, 2.83 (s.d. 1.8) for those who thought it wasn’t important, and 2.45 (s.d. 2.13) for those whothought its importance depended on what it was. Not surprisingly, those who didn’t like homework did

Section Thirteen
School experiences
221
less of it on average (2.74, s.d. 1.59), than those who liked some of it, or all of it, with little differencebetween these groups (an average of 3.61, s.d. 2.62 for the former, and 3.51, s.d. 2.29 for the latter).
However, average hours spent on homework were not related to whether children reported difficultygetting it done.51
Just under half the study children thought it was very important to do homework (49 percent). Thirty-onepercent thought homework mattered (but was not very important). Eleven percent thought homework
was not important, 5 percent said the importance of homework depended on what it was, and 3 percentwere unsure. These views were unrelated to maternal qualification.
Päkehä/European students were less likely to say that doing homework was very important: 45 percentcompared with 69 percent of the Mäori, Pasifika, and Asian students in the study. However, they were
just as likely to say they liked doing homework. Pasifika students were more likely to say they found ithard to get their homework done (48 percent compared with 23 percent overall), with 40 percent sayingthe reason why was because they found their homework difficult.
Not surprisingly, children who liked doing all of their homework were more likely to see it as veryimportant (71 percent).
Boys were just as likely as girls to think it was very important to do homework, and to say they did notfind it hard to get their homework done. However, 41 percent of them did not enjoy doing it, comparedwith 23 percent of girls. They were more likely to identify the difficulty of homework and not wanting to
do it as things that got in the way of their getting their homework done (34 percent compared with 20percent of girls). Six percent said they forgot to take their work home, compared with 3 percent of thegirls. Girls were more likely to identify obstacles to homework as practice of music or performing arts(10 percent compared with 3 percent of boys).
Children’s views on the importance of homework showed associations with only the competencies ofmathematics and Logical Problem-Solving. However, the contrasts which remained after taking familyincome and maternal qualification into account were between the small number who said they did not
know if homework mattered, who generally scored lower than others. So there were no significantdifferences between the average scores of children holding different views of the value of homework.
Around two-thirds of the study children liked doing at least some of their homework, including 24percent who liked doing most or all of what they were given. Thirty-two percent did not like doing
homework. These views were also unrelated to maternal qualification. However, not liking homework, orliking only some of it, were related to enjoyment of reading, with 53 percent of those who did not enjoyreading disliking homework, 36 percent of those who had mixed views of reading, and 26 percent of
those who enjoyed reading. Enjoyment of working with numbers was also associated with views ofhomework, with 51 percent of those who did not enjoy working with numbers also disliking homework,
51 We did not analyse this in terms of their reasons for difficulty.

Section Thirteen
School experiences
222
compared with 29 percent of those who had mixed views about working with numbers, and 26 percent ofthose who enjoyed working with numbers.
Fifty-eight percent of the study children found some difficulty getting their homework done, 23 percentmost of the time. Experience of difficulty was unrelated to how important they thought homework was.The main obstacles to their homework completion were mainly related to their own out-of-schoolinterests, or the difficulty of the work, followed by family obligations.
The reasons they gave were sports (18 percent), the difficulty of the homework (15 percent), not wantingto do it (12 percent), television or friends (10 percent each), siblings (9 percent), music or performing arts,or family social activities or outings (6 percent each), noise (5 percent), a paid job (4 percent), forgettingto take the work home (4 percent), or the computer (3 percent).
Teacher viewsAccording to their teachers, 72 percent of the study children always did their homework, 20 percent did itsometimes, and 7 percent did not do their homework. Girls were more likely to always complete their
homework: 83 percent compared with 63 percent of the boys. Sixty-three percent of children from low-income homes always did their homework, compared with 79 percent of children from the highest-income homes. Similarly, 62 percent of the children whose mothers lacked a qualification always did
their homework, compared with 83 percent of those whose mothers had a university qualification. Therewere no ethnic differences.
A higher proportion of children attending decile 1–2 schools did not do their homework (19 percent).This was the only school-related difference.
Homework completion and children’s competency scores at age 12
As in previous phases of the Competent Children study, children who always did their homework (on theteacher’s report) had higher average scores, and those whose homework varied tended to have higheraverage scores than those who never completed their homework. This remained the case after we took
into account family income and maternal qualification for all but one of the competencies. Theassociation with the PAT Reading Comprehension test was no longer evident when we included familyincome and maternal qualification, largely because children from low-income homes, or whose mothershad no qualification, were less likely to always complete their homework than others.
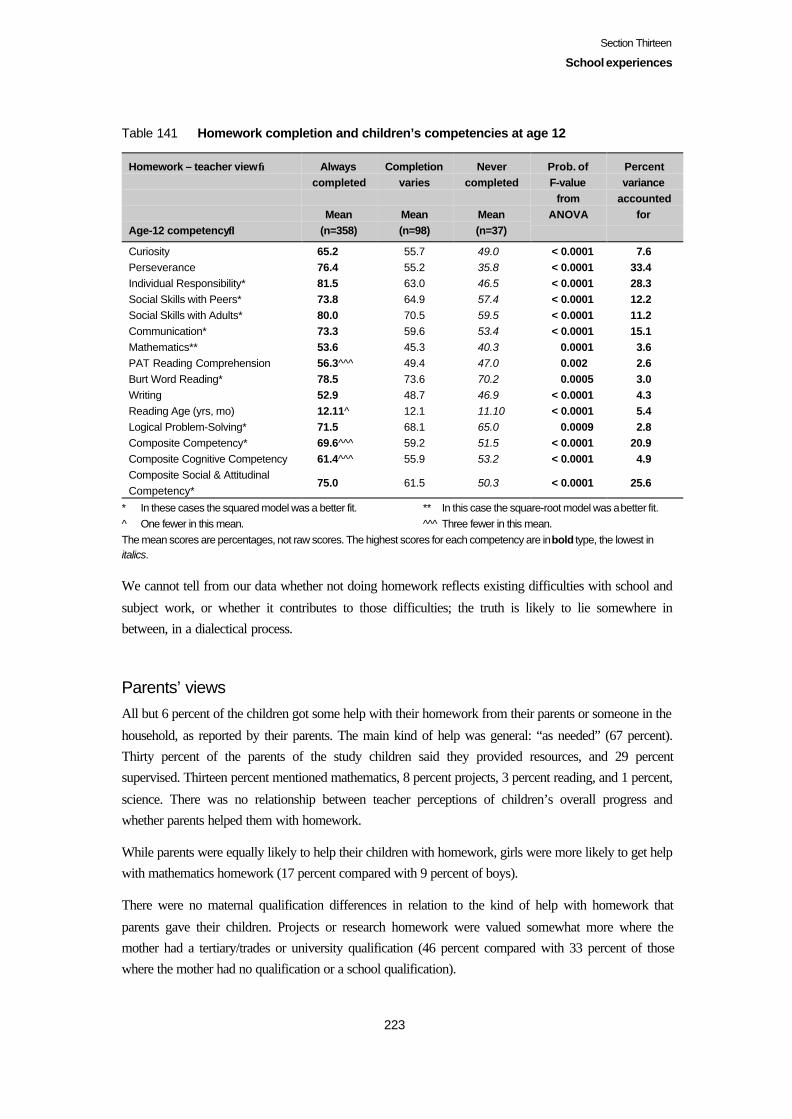
Section Thirteen
School experiences
223
Table 141 Homework completion and children’s competencies at age 12
Homework – teacher view→
Age-12 competency↓
Alwayscompleted
Mean(n=358)
Completionvaries
Mean(n=98)
Nevercompleted
Mean(n=37)
Prob. ofF-value
fromANOVA
Percentvariance
accountedfor
Curiosity 65.2 55.7 49.0 < 0.0001 7.6Perseverance 76.4 55.2 35.8 < 0.0001 33.4Individual Responsibility* 81.5 63.0 46.5 < 0.0001 28.3Social Skills with Peers* 73.8 64.9 57.4 < 0.0001 12.2Social Skills with Adults* 80.0 70.5 59.5 < 0.0001 11.2Communication* 73.3 59.6 53.4 < 0.0001 15.1Mathematics** 53.6 45.3 40.3 0.0001 3.6PAT Reading Comprehension 56.3^^^ 49.4 47.0 0.002 2.6Burt Word Reading* 78.5 73.6 70.2 0.0005 3.0Writing 52.9 48.7 46.9 < 0.0001 4.3Reading Age (yrs, mo) 12.11^ 12.1 11.10 < 0.0001 5.4Logical Problem-Solving* 71.5 68.1 65.0 0.0009 2.8Composite Competency* 69.6^^^ 59.2 51.5 < 0.0001 20.9Composite Cognitive Competency 61.4^^^ 55.9 53.2 < 0.0001 4.9Composite Social & AttitudinalCompetency*
75.0 61.5 50.3 < 0.0001 25.6
* In these cases the squared model was a better fit. ** In this case the square-root model was a better fit.^ One fewer in this mean. ^^ ̂ Three fewer in this mean.The mean scores are percentages, not raw scores. The highest scores for each competency are in bold type, the lowest initalics.
We cannot tell from our data whether not doing homework reflects existing difficulties with school and
subject work, or whether it contributes to those difficulties; the truth is likely to lie somewhere inbetween, in a dialectical process.
Parents’ viewsAll but 6 percent of the children got some help with their homework from their parents or someone in the
household, as reported by their parents. The main kind of help was general: “as needed” (67 percent).Thirty percent of the parents of the study children said they provided resources, and 29 percentsupervised. Thirteen percent mentioned mathematics, 8 percent projects, 3 percent reading, and 1 percent,
science. There was no relationship between teacher perceptions of children’s overall progress andwhether parents helped them with homework.
While parents were equally likely to help their children with homework, girls were more likely to get helpwith mathematics homework (17 percent compared with 9 percent of boys).
There were no maternal qualification differences in relation to the kind of help with homework that
parents gave their children. Projects or research homework were valued somewhat more where themother had a tertiary/trades or university qualification (46 percent compared with 33 percent of thosewhere the mother had no qualification or a school qualification).
Section Thirteen
School experiences
224
However, low-income parents were less likely to mention that they supervised their child’s homework
(16 percent), and more likely to mention help with reading (10 percent compared with 2 percent of veryhigh-income parents). By contrast, 17 percent of the very high-income group mentioned helping theirchild with maths, declining to 7 percent of the low-income group.
Projects or research were thought to be the kind of homework students got the most value from (41
percent), followed by mathematics (21 percent), with 8 percent also mentioning times-tables. Ten percentmentioned writing, 9 percent reading, and 7 percent spelling. Seven percent mentioned social studies, and2 percent each science or the arts. Three percent mentioned learning about how to study and meeting
deadlines. Four percent thought that none of their children’s homework was of any value. Familycharacteristics did not show any differences in parent views here.
Talking about school at home
We asked the study children who they talked to most about what happened to them at school. Motherswere the most frequently named (77 percent). Twenty-eight percent mentioned their fathers. Siblingswere mentioned by 11 percent, and friends by 10 percent. Two percent each mentioned another relative
or adult. Four percent said they spoke to no-one about what happened to them at school. Seventy-twopercent spoke to just 1 person mostly, but 28 percent spoke to 2 or more. School work was the main thingthey spoke about, followed by their social activity at school, and interesting or unusual events.
Girls were more likely to talk to their parents about social activities or friends (53 percent compared with
36 percent of boys), or make negative comments about teachers (9 percent compared with 3 percent ofboys). Boys were more likely to talk about sports at school (19 percent compared with 7 percent of girls).
Children from very high-income homes were more likely to talk of social activity or friends (55 percentcompared with 38 percent of others), and of unusual or interesting things (45 percent, declining to 24percent of children from low-income homes). There were no ethnicity-related differences.
Children whose mothers had no qualification were less likely to talk about their school work andachievement (25 percent compared with 40 percent of those whose mothers had a tertiary/trade oruniversity qualification). Children whose mothers had a university qualification were more likely to talkto their parent about interesting or unusual events at school (59 percent).
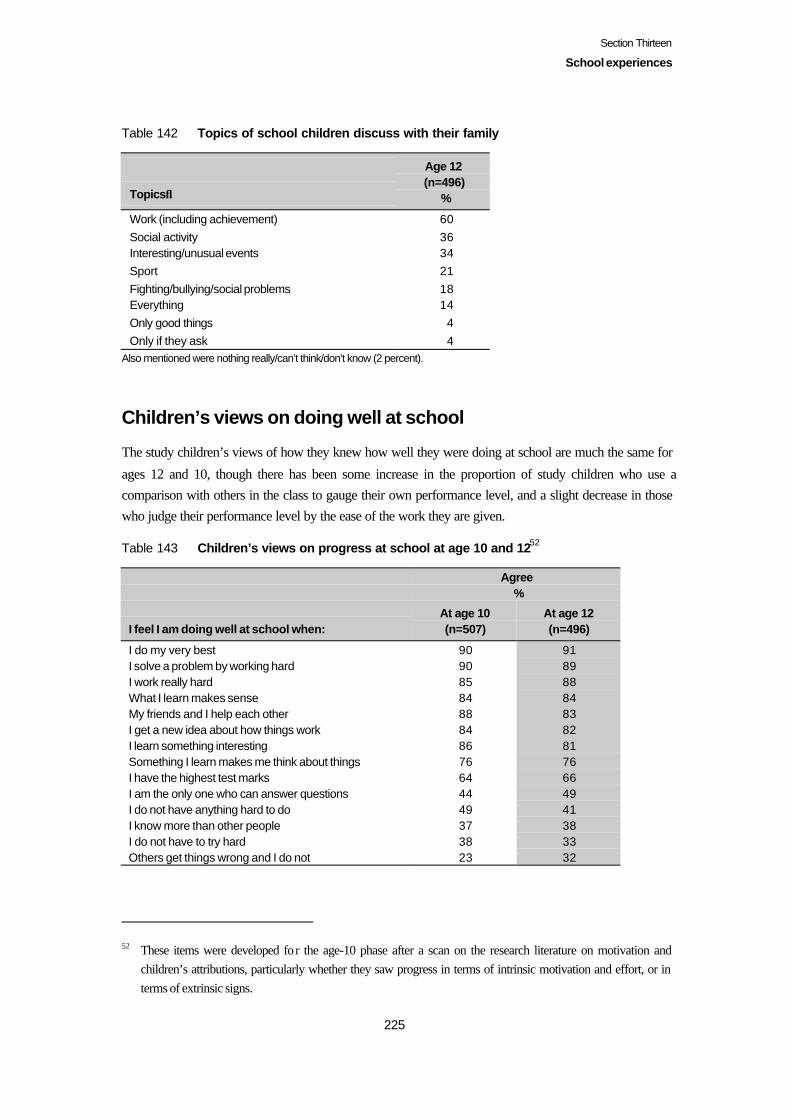
Section Thirteen
School experiences
225
Table 142 Topics of school children discuss with their family
Topics↓
Age 12(n=496)
%
Work (including achievement) 60Social activity 36Interesting/unusual events 34Sport 21Fighting/bullying/social problems 18Everything 14Only good things 4Only if they ask 4
Also mentioned were nothing really/can’t think/don’t know (2 percent).
Children’s views on doing well at school
The study children’s views of how they knew how well they were doing at school are much the same for
ages 12 and 10, though there has been some increase in the proportion of study children who use acomparison with others in the class to gauge their own performance level, and a slight decrease in thosewho judge their performance level by the ease of the work they are given.
Table 143 Children’s views on progress at school at age 10 and 1252
Agree %
I feel I am doing well at school when:At age 10(n=507)
At age 12(n=496)
I do my very best 90 91I solve a problem by working hard 90 89I work really hard 85 88What I learn makes sense 84 84My friends and I help each other 88 83I get a new idea about how things work 84 82I learn something interesting 86 81Something I learn makes me think about things 76 76I have the highest test marks 64 66I am the only one who can answer questions 44 49I do not have anything hard to do 49 41I know more than other people 37 38I do not have to try hard 38 33Others get things wrong and I do not 23 32
52 These items were developed for the age-10 phase after a scan on the research literature on motivation andchildren’s attributions, particularly whether they saw progress in terms of intrinsic motivation and effort, or interms of extrinsic signs.
Section Thirteen
School experiences
226
Children who were judged by their teachers to be performing at a very good/excellent level for their age
group were less likely to judge their own performance by whether they had to try hard: otherwise, therewere no differences. This is important: it is not that children whose achievement is lower than others donot get excited by understanding, thinking about things, or getting a new idea about how things work.
Boredom and lack of challenge were cited as reasons for dissatisfaction by parents whose child wasachieving below the average level, not just those whose child was achieving at the top level.
As with the study children’s views of their school experience, there were few associations with schoolcharacteristics, other than decile 1–2 students being more likely to associate doing well at school with nothaving anything hard to do (66 percent).
Päkehä/European and Asian children were less likely to feel they were doing well at school when theyhad nothing hard to do (39 and 43 percent respectively, compared with 52 percent of Mäori children and68 percent of Pasifika children).
Children whose mothers had no qualification were more likely to feel that they were doing well at school
when they had nothing hard to do (54 percent, declining to 34 percent of those whose mothers had atrade/tertiary, or university qualification).
Boys used comparison with others in the class more than girls do to gauge how well they were doing wellat school when they were the only one who could answer questions (54 percent compared with 43
percent of the girls), and when they knew more than other people (42 percent compared with 32 percentof the girls).
Relation of children’s views of progress and competency levelsAs at age 10, we found fewer associations between competency levels and children’s views on how they
knew if they were doing well at the work of school, than children’s reports of their classroom experiencesand interactions.
The items which showed most associations at age 10 were: I feel I am doing well when: I solve aproblem; I don’t have anything hard to do; I work really hard; something I learn makes me think about
things; I have the highest test mark. These items were consistent with the generally acceptedunderstanding from the motivation and attribution literature that children who see achievement in relationto changes in their own understanding or mastery (“intrinsic” motivation) are more likely to show higher
achievement than those who judge their own achievement by comparison with others and “extrinsic”benchmarks such as marks, and achievement in terms of effort rather than ability. Those who agreed thatthey were doing well when they did not have anything hard to do had lower scores than those whodisagreed or were unsure.
At age 12, we found fewer associations between the individual items we asked about to ascertainchildren’s views of their school progress, and their competency levels, once we took family income andmaternal qualification into account. The individual items fell into 4 groups: one with only 1 item,
showing associations with children’s scores on 9 of the 12 competency measures; a second group
Section Thirteen
School experiences
227
showing associations with between a third and a half of the measures, a third group showing associationswith less than a quarter of the measures, and a fourth showing only 1 or no associations.
The item which showed most association (with 9 of the competency measures), was I feel I am doingwell when I know more than other people, when children who said they were unsure about this, or itdepended, had higher average scores than those who either agreed or disagreed. This item hadassociations with:
Mathematics, PAT Reading Comprehension test, Burt Word Reading test, Reading Age, Perseverance*,Individual Responsibility, Social Skills with Peers, Social Skills with Adults, and Communication.
Items showing associations with some competencies
Something I learn makes me think about things
Children who disagreed with this had lower average scores than those who agreed or who said itdepended/they were unsure.
Curiosity*, Perseverance*, Individual Responsibility*, Social Skills with Peers*, and Social Skills withAdults*.
I get a new idea about how things work
Children who disagreed with this had lower average scores than those who agreed.
Perseverance*, Individual Responsibility, Social Skills with Peers, Social Skills with Adults*, andCommunication*.
Nothing is hard to do
Children who agreed with this had lower average scores than those who disagreed or who said itdepended/they were unsure.
Mathematics, PAT Reading Comprehension test, Burt Word Reading test, Writing, Reading Age, andLogical Problem-Solving.
I solve a problem by working hard
Children who agreed with this had higher average scores than those who disagreed.
Individual Responsibility, Social Skills with Peers*, Social Skills with Adults*, and Communication.
Items showing associations with few competencies
I work really hard
Children who agreed with this had higher average scores than those who disagreed.
Perseverance*, Mathematics*, and Logical Problem-Solving.
Section Thirteen
School experiences
228
I don’t have to try hard
Children who were not sure or said it depended had higher average marks than those who agreed.
Mathematics, PAT Reading Comprehension test, and writing.
I am the only one who can answer questions
Children who were not sure or said it depended had higher average scores than others.
Burt Word Reading test and writing.
Others get things wrong
Children who were unsure or said it depended had higher average scores than others.
PAT Reading Comprehension test and Burt Word Reading test.
What I learn really makes sense
Children who agreed had higher average scores than those who disagreed.
Communication* and Logical Problem-Solving.
One or no associations
I have the highest test marks, I do my very best, friends help each other, and I learn somethinginteresting.
Results from a multidimensional scale analysis
We moved from individual item analysis to a multidimensional scale analysis of the study children’sanswers about how they gauged how well they were performing at school to see if the items were
grouped in ways which would show some underlying approaches. This analysis yielded the matrixbelow. The horizontal axis shows a gradient from easy and effortless (on the left), to effort (on the right).The vertical axis is less clear-cut, but seems to show a gradient from external markers of achievement at
the top, to more internal markers at the bottom, though none of the quadrants is “pure” with respect tothese 2 axes. The fact that there are 2 axes rather than 1, and that the groups are not entirely pure accordswith the growing focus in research on motivation and attribution on context- and interest-specificresponses from students (Pintrich and Schunk, 1996).
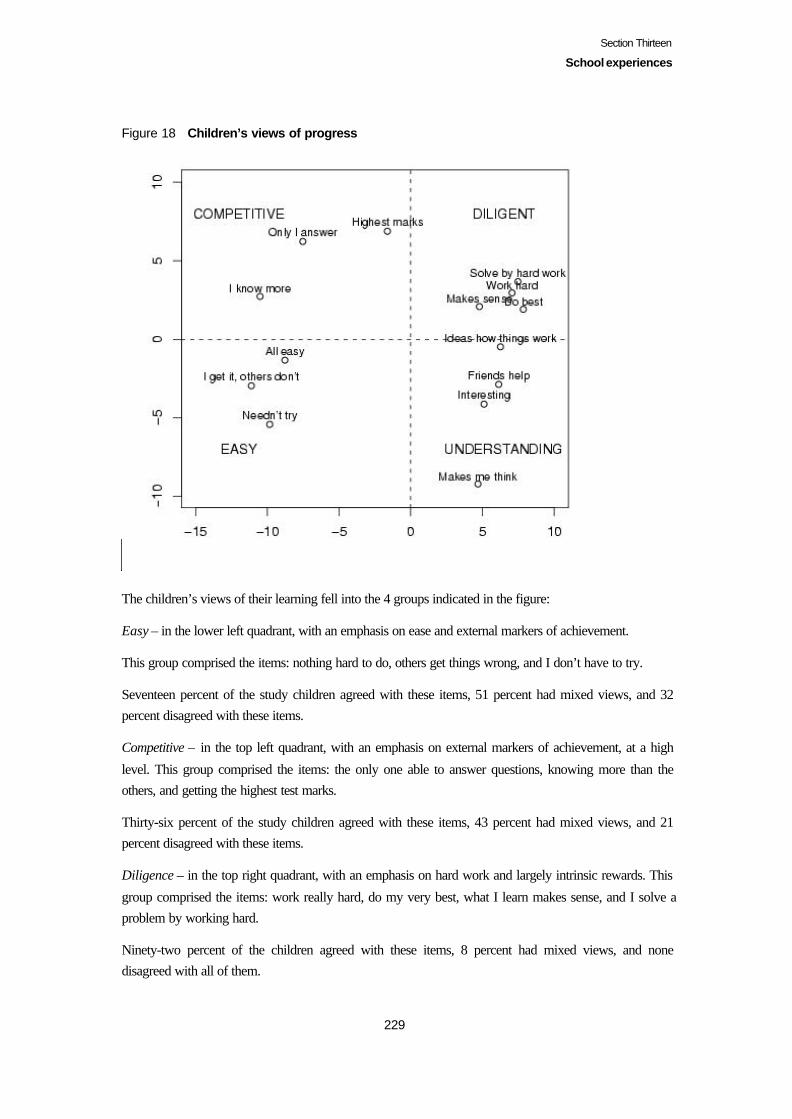
Section Thirteen
School experiences
229
Figure 18 Children’s views of progress
The children’s views of their learning fell into the 4 groups indicated in the figure:
Easy – in the lower left quadrant, with an emphasis on ease and external markers of achievement.
This group comprised the items: nothing hard to do, others get things wrong, and I don’t have to try.
Seventeen percent of the study children agreed with these items, 51 percent had mixed views, and 32percent disagreed with these items.
Competitive – in the top left quadrant, with an emphasis on external markers of achievement, at a high
level. This group comprised the items: the only one able to answer questions, knowing more than theothers, and getting the highest test marks.
Thirty-six percent of the study children agreed with these items, 43 percent had mixed views, and 21percent disagreed with these items.
Diligence – in the top right quadrant, with an emphasis on hard work and largely intrinsic rewards. This
group comprised the items: work really hard, do my very best, what I learn makes sense, and I solve aproblem by working hard.
Ninety-two percent of the children agreed with these items, 8 percent had mixed views, and nonedisagreed with all of them.
Section Thirteen
School experiences
230
Understanding – in the bottom right quadrant, with an emphasis on gaining knowledge and
understanding. This group comprised the items: when something makes me think, I learn somethinginteresting, I get a new idea of how things work, and friends help each other.
Fifty-two percent of the children agreed with these items, 44 percent had mixed views, and 4 percentdisagreed.
We cross-tabulated these 4 views of learning progress against 4 key factors related to children’s cognitive
competency levels, 2 related to children’s activities, 1 related to family resources, and 1 to schoolresources: children’s enjoyment of reading, their current hours spent watching television, maternalqualification, and school socio-economic decile. There were no differences related to children’s scores on
the Competitive or Understanding groupings. Children whose mothers had no qualification and those indecile 1–2 schools were more likely to agree with the Easy grouping. Children who did not enjoy readingwere more likely to disagree with the Diligent grouping.
We also cross-tabulated these 4 views with the teachers’ overall assessment of the children’s learning
progress. There were no associations in relation to the Competitive, Understanding groupings, but therewere consistent trends in relation to the Diligent grouping, with proportions of children disagreeing withthe items in this group twice as high among those making below average progress than among those
making very good/excellent progress, and in relation to the Easy grouping, with 42 percent of thosemaking very good/excellent progress disagreeing with the items in this group, compared with 16 percentof those making below average progress.
Relation of attitudes to school with earlier competency levelsand problem-solving
One of the research questions for the age-14 phase focused on the links between earlier habits andattitudes and the study children’s current attitudes to school and their competency levels. It was:
How are children’s earlier competency levels in perseverance, communication, and individualresponsibility, parent and teacher reports of their dispositions and ability to cope with problems, relatedto their competency levels at age 12, and their attitudes to school, including motivation and engagement?
We used the 2 factors related to school engagement described earlier in this section, the 4 groups of views
of learning described above, and the clusters formed from teachers’ current judgment of the children’sclassroom behaviour (described in the next section) as outcome variables, and age-10 Perseverance,Communication, and Individual Responsibility scores and age-10 parental reports on children’s
experience of upsets, and how these were coped with, as input variables. We did not use age-10 parentalreports of children’s happiness, since we had found little association with competency levels, and we didnot use age-10 teacher descriptions of children’s classroom behaviour, since we would have been
increasing the amount of inherent variability in the data by analysing age-10 clusters against age-12clusters.
Section Thirteen
School experiences
231
We cross-tabulated the age-10 variables with the age-12 variables, and used chi-squared tests forstatistical significance, followed by a canonical correlation analysis.
The cross-tabulations showed a few relations between age-10 scores and children’s school behaviour andattitudes to progress at age 12.
Children who were in the lower quartiles for Perseverance at age 10 were more likely to:
• feel distressed at school at age 12;• be in the “steady” and “patchy” clusters of their age-12 teacher views of the classroom behaviour
(rather than in the “solid” and “mature with edges” clusters); and• less likely to see school progress in terms of the easiness of the work.
Children who were in the lower quartiles for Individual Responsibility at age 10 were more likely to:
• be in the “patchy” clusters of age-12 teacher views of classroom behaviour;• feel less engaged in school; and• less likely to see school progress in terms of the easiness of the work.
Children who were in the lower quartiles for Communication at age 10 were more likely to:
• be in the “steady” and “patchy” clusters of their age-12 teacher views of the classroom behaviour(rather than in the “solid” and “mature with edges” clusters); and
• to see school progress in terms of the easiness of the work.
The canonical correlation analysis focused only on the age-10 competencies, and the children’s attitudes
to school and views of progress at age 12. Variables that had low loadings in the canonical variables wereexcluded. There were 2 pairs of significant canonical variables.53 The figure below gives the first 2canonical coefficients. The age-10 group of variables account for 84.5 percent of their own variance (they
were relatively highly correlated), and 9.8 percent of the age-12 group’s variance; the age-12 group ofvariables account for 36.4 percent of their own variance and 3.1 percent of the age-10 group’s variance.
53 Statistically significant, with p-values < 0.0001 and 0.0075, respectively.
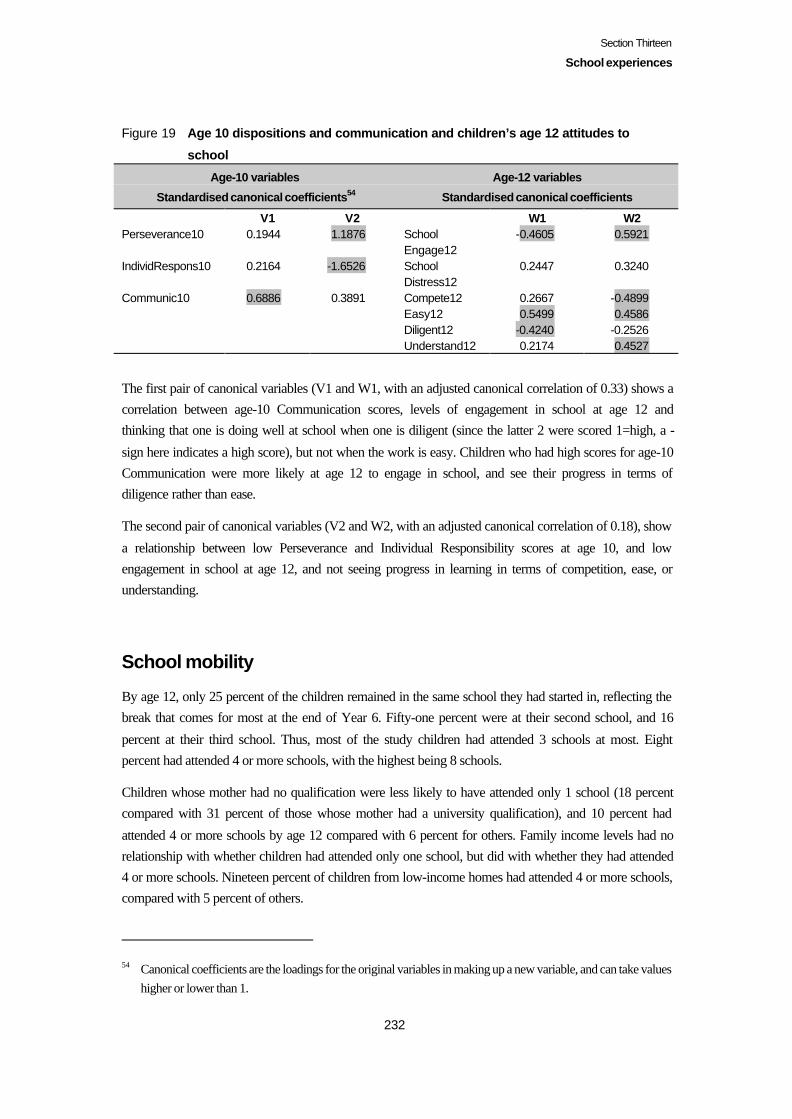
Section Thirteen
School experiences
232
Figure 19 Age 10 dispositions and communication and children’s age 12 attitudes to
school
Age-10 variables Age-12 variables
Standardised canonical coefficients54 Standardised canonical coefficients
V1 V2 W1 W2Perseverance10 0.1944 1.1876 School
Engage12-0.4605 0.5921
IndividRespons10 0.2164 -1.6526 SchoolDistress12
0.2447 0.3240
Communic10 0.6886 0.3891 Compete12 0.2667 -0.4899Easy12 0.5499 0.4586Diligent12 -0.4240 -0.2526Understand12 0.2174 0.4527
The first pair of canonical variables (V1 and W1, with an adjusted canonical correlation of 0.33) shows acorrelation between age-10 Communication scores, levels of engagement in school at age 12 andthinking that one is doing well at school when one is diligent (since the latter 2 were scored 1=high, a -
sign here indicates a high score), but not when the work is easy. Children who had high scores for age-10Communication were more likely at age 12 to engage in school, and see their progress in terms ofdiligence rather than ease.
The second pair of canonical variables (V2 and W2, with an adjusted canonical correlation of 0.18), show
a relationship between low Perseverance and Individual Responsibility scores at age 10, and lowengagement in school at age 12, and not seeing progress in learning in terms of competition, ease, orunderstanding.
School mobility
By age 12, only 25 percent of the children remained in the same school they had started in, reflecting thebreak that comes for most at the end of Year 6. Fifty-one percent were at their second school, and 16
percent at their third school. Thus, most of the study children had attended 3 schools at most. Eightpercent had attended 4 or more schools, with the highest being 8 schools.
Children whose mother had no qualification were less likely to have attended only 1 school (18 percentcompared with 31 percent of those whose mother had a university qualification), and 10 percent had
attended 4 or more schools by age 12 compared with 6 percent for others. Family income levels had norelationship with whether children had attended only one school, but did with whether they had attended4 or more schools. Nineteen percent of children from low-income homes had attended 4 or more schools,compared with 5 percent of others.
54 Canonical coefficients are the loadings for the original variables in making up a new variable, and can take valueshigher or lower than 1.
Section Thirteen
School experiences
233
Although there is a relationship between individual family resources and school mobility, school socio-
economic decile shows some mixed patterns. School stability is greatest for those in decile 9–10 schools(41 percent had attended only 1 school). School stability was also higher for the study children in decile3–4 schools (27 percent). Yet the highest proportion of study children who had attended 4 or moreschools was also found in decile 3–4 schools (14 percent).
We also looked at whether there were different patterns of school mobility in relation to the studychildren’s current school characteristics. We found the greatest stability among the children who wereattending a state integrated school: 42 percent had attended only 1 school, compared with 23 percent of
those who attended a state school, and 15 percent of those who attended a private school. Twelve percentof the latter had attended 4 or more schools, and 8 percent of those attending a state school at age 12,compared with 4 percent of those attending a state integrated school.
Children’s overall current attitudes to school, as parents reported them, were unaffected by how many
schools they had attended in their school career, perhaps because views of their current teacher weremuch the same no matter how many schools they had attended. However, the proportion of children whohad had teachers they did not like rose from 38 percent of those who had remained in one school since
they started, to 61 percent of those who had changed schools. This could mean that difficulties in teacher-child interaction may be a reason to change schools. This raises the question of the reasons behind schoolchange. If better relationships and a better learning environment can be established in another school,
then school mobility per se may not be the issue. Parents of those who had changed schools more than 3or 4 times were just as satisfied with their child’s overall progress as those whose children had stayed atone school, or made only a single change.
Parental involvement in the school showed mixed associations with the number of times a child had
moved schools. On the one hand, parents of those who had attended 4 or more schools were just as likelyas others to have regular talks with their child’s teacher, attend parent-teacher interviews, or be a board oftrustees’ or parents’ association member. On the other, it was the parents of children who had spent their
entire school life in a single school who were more likely to undertake voluntary work in classrooms,though their overall rates are not high: 14 percent compared with 6 percent of those whose children hadshifted school at least once. Other volunteer work around the school was also more likely in this group:
42 percent, decreasing to 21 percent of those whose child had been to 4 or more schools by the time theywere aged 12. Eight percent of this group were employed at their child’s school, compared with 2 percentof those whose children had shifted school at least once.
There were some relationships between the number of schools attended by children and their competency
scores. On the whole, children who had attended a single school tended to have higher average scoresthan others for reading and writing, and children who had attended 4 schools or more by the age of 12 tohave lower than average scores for mathematics. These associations remained after taking into accountfamily income and maternal qualification, though they were somewhat diluted.
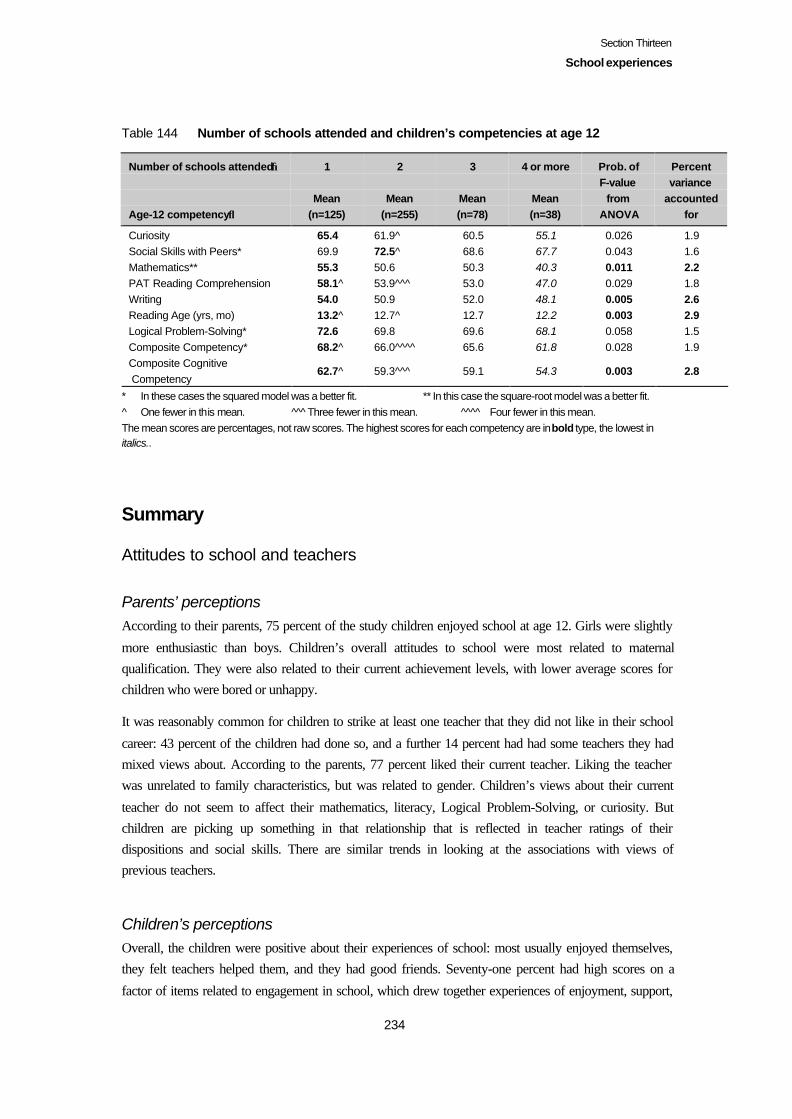
Section Thirteen
School experiences
234
Table 144 Number of schools attended and children’s competencies at age 12
Number of schools attended→
Age-12 competency↓
1
Mean(n=125)
2
Mean(n=255)
3
Mean(n=78)
4 or more
Mean(n=38)
Prob. ofF-value
fromANOVA
Percentvariance
accountedfor
Curiosity 65.4 61.9^ 60.5 55.1 0.026 1.9Social Skills with Peers* 69.9 72.5^ 68.6 67.7 0.043 1.6Mathematics** 55.3 50.6 50.3 40.3 0.011 2.2PAT Reading Comprehension 58.1^ 53.9^^^ 53.0 47.0 0.029 1.8Writing 54.0 50.9 52.0 48.1 0.005 2.6Reading Age (yrs, mo) 13.2^ 12.7^ 12.7 12.2 0.003 2.9Logical Problem-Solving* 72.6 69.8 69.6 68.1 0.058 1.5Composite Competency* 68.2^ 66.0^^^^ 65.6 61.8 0.028 1.9Composite Cognitive Competency
62.7^ 59.3^^^ 59.1 54.3 0.003 2.8
* In these cases the squared model was a better fit. ** In this case the square-root model was a better fit.^ One fewer in this mean. ^^ ̂Three fewer in this mean. ^^^^ Four fewer in this mean.The mean scores are percentages, not raw scores. The highest scores for each competency are in bold type, the lowest initalics..
Summary
Attitudes to school and teachers
Parents’ perceptionsAccording to their parents, 75 percent of the study children enjoyed school at age 12. Girls were slightly
more enthusiastic than boys. Children’s overall attitudes to school were most related to maternalqualification. They were also related to their current achievement levels, with lower average scores forchildren who were bored or unhappy.
It was reasonably common for children to strike at least one teacher that they did not like in their school
career: 43 percent of the children had done so, and a further 14 percent had had some teachers they hadmixed views about. According to the parents, 77 percent liked their current teacher. Liking the teacherwas unrelated to family characteristics, but was related to gender. Children’s views about their current
teacher do not seem to affect their mathematics, literacy, Logical Problem-Solving, or curiosity. Butchildren are picking up something in that relationship that is reflected in teacher ratings of theirdispositions and social skills. There are similar trends in looking at the associations with views ofprevious teachers.
Children’s perceptionsOverall, the children were positive about their experiences of school: most usually enjoyed themselves,they felt teachers helped them, and they had good friends. Seventy-one percent had high scores on a
factor of items related to engagement in school, which drew together experiences of enjoyment, support,
Section Thirteen
School experiences
235
fairness, and belief in the value of the work of school. Just over half said they usually did interestingthings at school, liked their teachers, 55 and learnt most things pretty quickly.
However, 16 percent showed mid-high scores on a factor relating to feeling distress at school. Boys weresomewhat less positive about their school experience than girls, and showed less engagement. Somefeelings about school were associated with maternal qualification; there were no associations with family
income, and only a few with ethnicity. School characteristics were not associated with differences instudent views of their experiences, indicating that differences in the school characteristics included here(decile, type, and ownership) do not lead to quite distinct experiences of schooling.
Engagement in school is related to whether children enjoy reading, and how much television they watch:
another example of the Matthew effect, where activities outside school which complement schoolexperience do not compensate for negative experiences or reactions, but are likely to reflect and enhancethem. Distress at school does not show these relations.
Children’s views of their school experience, and reactions to it, are related to their competency levels at
age 12. The views with the most widespread associations are those which relate to the actual work ofschool, and either alienation or identification with its structure and what it offers. Views which wereassociated with around two-thirds of the competency measures were related to the student’s interaction
with their teacher, with some items relating to peer relations, and some on the student’s engagement withthe work of learning and achieving. All the other views showed some associations. There were moreassociations with the social and attitudinal competencies than the cognitive competencies overall, andmost of the associations with mathematics scores were found in the first set of views.
Comparing the children’s views of their classrooms at age 12 with their views of their classrooms at ages8 and 10, we found that enjoyment levels were lower at age 12, but so too were competition and thedifficulty of the work.
Problem-solving
At age 12, children continue to look to teachers for help and advice if they strike a problem in their work.Few children would do nothing or give up if faced with a difficulty in a project, or finding a book in theschool library.
55 This may seem lower than parental reports of whether their child liked their teacher. However, we asked thechildren to rate the frequency of their experience, and we asked parents to give a global view.
Section Thirteen
School experiences
236
Homework
Children’s viewsMost of the study children did homework at least 2 days a week: 57 percent said they did homework on 4or 5 days, and 32 percent, on 2 or 3 days each week. Nine percent said they did homework on 1 day aweek, and one percent said they never did homework. The average time spent on homework was 3.31
hours a week. Time on homework reflected maternal qualification and family income levels; and wasslightly higher for girls. Children who did homework more often spent more time on it.
Children who spent at least an hour a week on homework had higher average scores for the cognitivecompetencies than those who did not. While children who thought homework was important gave it
more time, average hours spent on homework were unrelated to difficulties in completing it. Just overhalf the study children found some difficulty getting their homework done, mainly related to their ownout-of-school interests, the difficulty of the work, or family obligations.
Just under half the study children thought it was very important to do homework (49 percent). Butchildren’s views on the importance of homework were unrelated to their competency levels.
Around two-thirds of the study children liked doing at least some of their homework, including 24percent who liked doing most or all of what they were given. While maternal qualification is unrelated toviews of homework, enjoyment of reading and working with numbers is.
Teacher viewsAround three-quarters of the study children always did their homework. Homework completion wasrelated to gender and levels of maternal qualification and family income, but not ethnicity. Children whoalways did their homework had higher average scores for the competencies.
Parent viewsNinety-four percent of the parents said they or someone else in the household gave their child some helpwith their homework, mostly “as needed”, with the provision of resources, or supervision. There weresome differences in the kind of homework given which reflected family resources. Projects or researchwere thought to be the kind of homework students got the most value from, followed by mathematics.
Talking about school at homeThree-quarters of the study children talked to their mothers most about their school experiences; and 28percent, their fathers. They were almost twice as likely to talk about work itself as social activities orinteresting or unusual events.
Section Thirteen
School experiences
237
Children’s views on doing well at schoolAge-12 children’s views of how they judge how well they are doing at school do not show clearcut
groupings in terms of attributions to either their own (unchanging) ability, or effort, or in terms ofextrinsic signs or intrinsic gauges. While we found that children who performed below average accordingto their teachers were more likely than those who are doing well to use ease and diligence as signs they
are doing well, they are just as likely as others to also see their achievement in terms of understanding.We did not find that children whose achievement is lower than others do not get excited byunderstanding, thinking about things, or getting a new idea about how things work. Boredom and lack of
challenge were just as likely to be cited as reasons for dissatisfaction by parents whose child’sachievement was below the average level, as by parents of children achieving at the top level. Thissuggests that while low performers need tailored attention focused on the particular aspects that they find
difficult, they also need stimulation and the opportunity for understanding and connection (rather than‘the basics’ only).
However, there were some signs that children whose family resources may disadvantage them in terms ofschool experience put more emphasis on extrinsic signs, and ease, a further disadvantage since we found
lower average scores on the competency measures for those who saw doing well at school in terms of nothaving anything hard to do.
Traces of earlier attitudes to school workThere are indications from the analysis that children’s levels of Communication, Perseverance, andIndividual Responsibility at age 10 did have a bearing on their levels of engagement in school at age 12.
School mobilityBy age 12, only 25 percent of the children remained in the same school they had started in, reflecting thebreak that comes for most at the end of Year 6. Fifty-one percent were at their second school, and 16
percent, at their third school. Thus most of the study children had attended 3 schools at most. Eightpercent had attended 4 or more schools, with the highest being 8 schools. The proportion of children whohad had teachers they did not like was almost double for those who had changed schools compared with
those who had stayed in the same school. This may indicate that this was a reason to change schools,rather than an effect per se of school mobility. On the whole, children who had attended a single schooltended to have higher average scores for reading and writing, and children who had attended 4 or more
schools by the time they were aged 12 to have lower than average scores for mathematics. Familyresources diluted the strength of these associations.
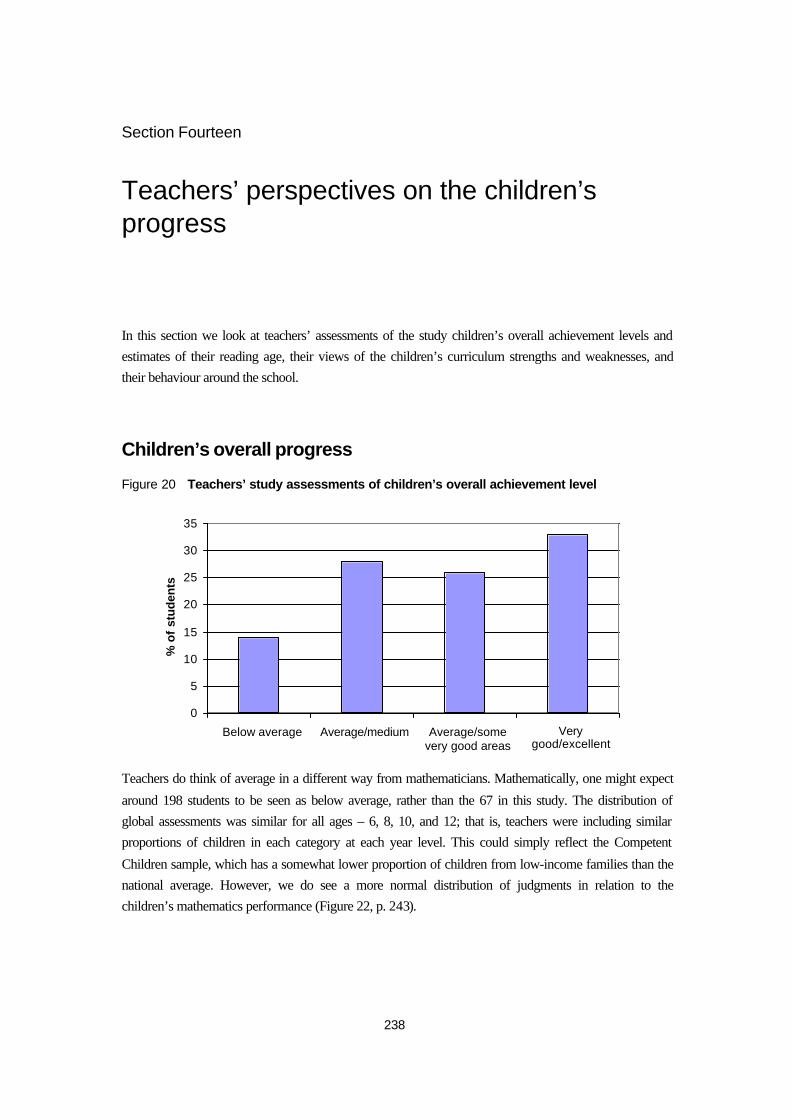
238
Section Fourteen
Teachers’ perspectives on the children’sprogress
In this section we look at teachers’ assessments of the study children’s overall achievement levels andestimates of their reading age, their views of the children’s curriculum strengths and weaknesses, andtheir behaviour around the school.
Children’s overall progress
Figure 20 Teachers’ study assessments of children’s overall achievement level
Teachers do think of average in a different way from mathematicians. Mathematically, one might expect
around 198 students to be seen as below average, rather than the 67 in this study. The distribution ofglobal assessments was similar for all ages – 6, 8, 10, and 12; that is, teachers were including similarproportions of children in each category at each year level. This could simply reflect the Competent
Children sample, which has a somewhat lower proportion of children from low-income families than thenational average. However, we do see a more normal distribution of judgments in relation to thechildren’s mathematics performance (Figure 22, p. 243).
0
5
10
15
20
25
30
35
Below average Average/medium Average/somevery good areas
Verygood/excellent
% o
f st
ud
ents
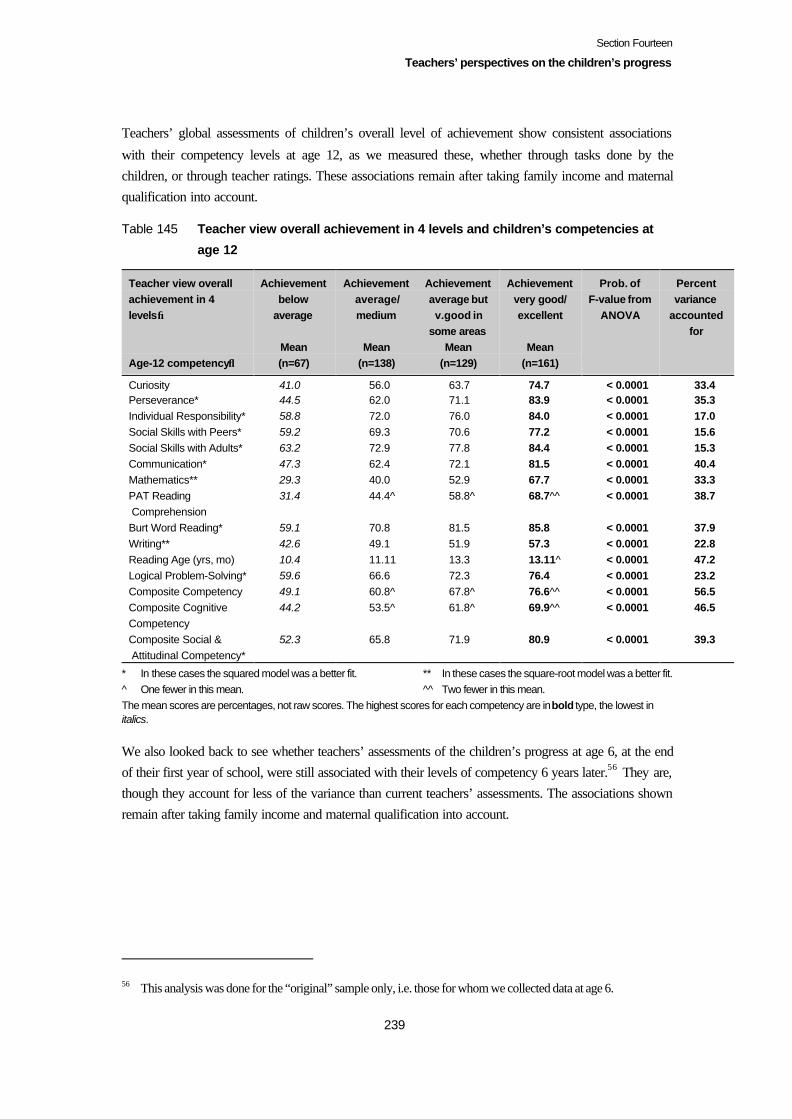
Section Fourteen
Teachers’ perspectives on the children’s progress
239
Teachers’ global assessments of children’s overall level of achievement show consistent associations
with their competency levels at age 12, as we measured these, whether through tasks done by thechildren, or through teacher ratings. These associations remain after taking family income and maternalqualification into account.
Table 145 Teacher view overall achievement in 4 levels and children’s competencies at
age 12
Teacher view overallachievement in 4levels→
Age-12 competency↓
Achievementbelow
average
Mean(n=67)
Achievementaverage/medium
Mean(n=138)
Achievementaverage butv.good in
some areasMean
(n=129)
Achievementvery good/excellent
Mean(n=161)
Prob. ofF-value from
ANOVA
Percentvariance
accountedfor
Curiosity 41.0 56.0 63.7 74.7 < 0.0001 33.4Perseverance* 44.5 62.0 71.1 83.9 < 0.0001 35.3Individual Responsibility* 58.8 72.0 76.0 84.0 < 0.0001 17.0Social Skills with Peers* 59.2 69.3 70.6 77.2 < 0.0001 15.6Social Skills with Adults* 63.2 72.9 77.8 84.4 < 0.0001 15.3Communication* 47.3 62.4 72.1 81.5 < 0.0001 40.4Mathematics** 29.3 40.0 52.9 67.7 < 0.0001 33.3PAT Reading Comprehension
31.4 44.4^ 58.8^ 68.7^^ < 0.0001 38.7
Burt Word Reading* 59.1 70.8 81.5 85.8 < 0.0001 37.9Writing** 42.6 49.1 51.9 57.3 < 0.0001 22.8Reading Age (yrs, mo) 10.4 11.11 13.3 13.11^ < 0.0001 47.2Logical Problem-Solving* 59.6 66.6 72.3 76.4 < 0.0001 23.2Composite Competency 49.1 60.8^ 67.8^ 76.6^^ < 0.0001 56.5Composite CognitiveCompetency
44.2 53.5^ 61.8^ 69.9^^ < 0.0001 46.5
Composite Social & Attitudinal Competency*
52.3 65.8 71.9 80.9 < 0.0001 39.3
* In these cases the squared model was a better fit. ** In these cases the square-root model was a better fit.^ One fewer in this mean. ^^ Two fewer in this mean.The mean scores are percentages, not raw scores. The highest scores for each competency are in bold type, the lowest initalics.
We also looked back to see whether teachers’ assessments of the children’s progress at age 6, at the endof their first year of school, were still associated with their levels of competency 6 years later.56 They are,though they account for less of the variance than current teachers’ assessments. The associations shownremain after taking family income and maternal qualification into account.
56 This analysis was done for the “original” sample only, i.e. those for whom we collected data at age 6.

Section Fourteen
Teachers’ perspectives on the children’s progress
240
Table 146 Teacher view overall achievement at age 6 and children’s competencies at age
12
Teacher view overallachievement at age 6 in 4levels→
Age-12 competency↓
Achievementminimal or
slow
Mean(n=50)
Achievementaverage/medium
Mean(n=74)
Achievementaverage butv.good in
some areasMean(n=57)
AchievementVery good/Excellent
Mean(n=87)
Prob. ofF-valuefromANOVA
Percentvar.
acct. for
Curiosity 51.8 61.1 66.0 69.2 < 0.0001 11.8Perseverance* 52.9 67.0 72.0 78.9 < 0.0001 16.2Individual Responsibility* 64.4 74.4 78.4 82.6 < 0.0001 11.2Social Skills with Peers* 65.0 71.8 70.0 74.5 0.002 5.4Social Skills with Adults* 72.2 74.9 80.3 80.7 0.007 4.5Communication* 60.0 66.0 73.3 77.6 < 0.0001 16.6Mathematics** 35.5 42.8 54.3 64.6 < 0.0001 22.2PAT Reading Comprehension 42.6^ 46.9 55.6 66.0^ < 0.0001 19.2Burt Word Reading* 65.1 73.0 77.0 86.9 < 0.0001 30.0Writing** 43.6 48.9 50.9 56.4 < 0.0001 21.6Reading Age (yrs, mo) 11.7 12.5 12.10 13.10 < 0.0001 23.0Logical Problem-Solving* 61.2 67.9 72.0 76.6 < 0.0001 23.5Composite Competency* 56.1^ 63.5 68.4 73.7^ < 0.0001 27.9Composite Cognitive Competency
48.9^ 54.9 60.9 68.6^ < 0.0001 32.3
Composite Social & Attitudinal Competency*
61.0 69.2 73.3 77.2 < 0.0001 16.1
* In these cases the squared model was a better fit. ** In this case the square-root model was a better fit.^ One fewer in this mean.The mean scores are percentages, not raw scores. The highest scores for each competency are in bold type, the lowest initalics.
This strength of association contrasts with the lack of association between parental satisfaction levels withtheir child’s progress at age 6, and the child’s performance on the study competency scores at age 12.
The next figure shows some overlaps in the range of scores for the top 3 groups; note also someindividuals who were seen as below average at age 6 had overall competency levels at age 12 which were
as high as those who were seen as achieving at the top end at age 6, and vice versa. This is consistent withthe analysis in Section Three showing that earlier performance is not a watertight predictor of laterperformance (and that therefore effort should be made with students who are struggling, as well as withthose whose performance starts to deteriorate).
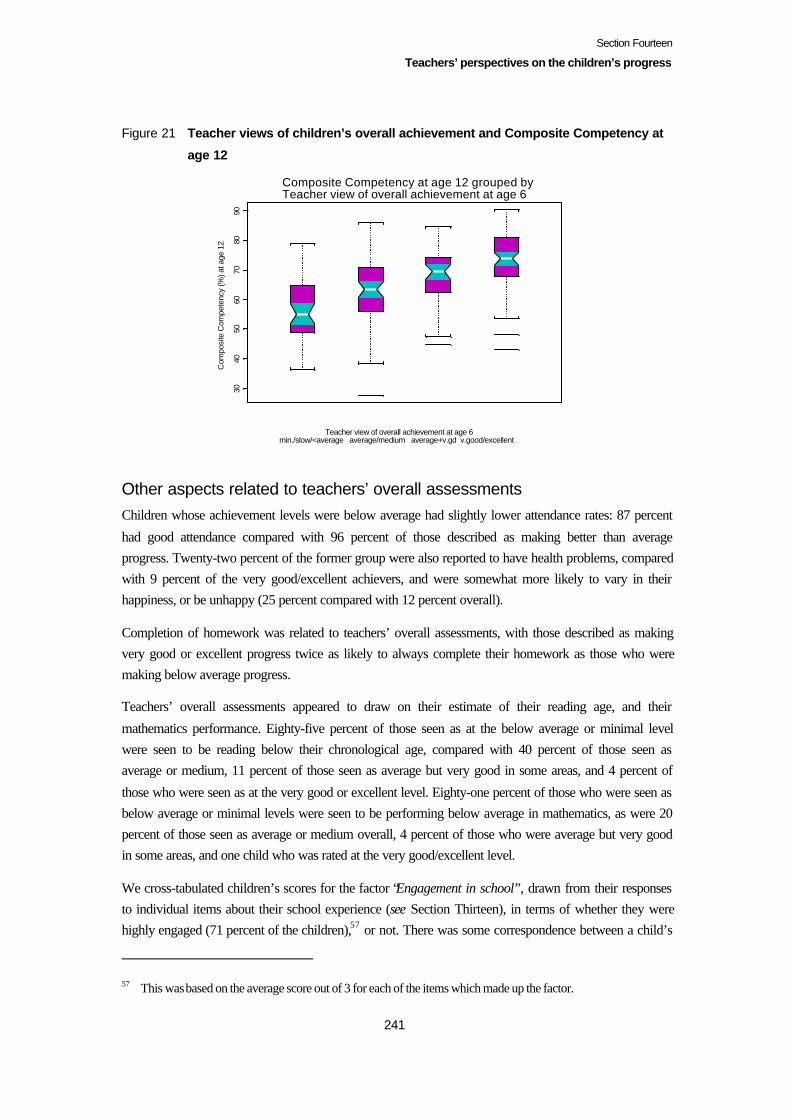
Section Fourteen
Teachers’ perspectives on the children’s progress
241
Figure 21 Teacher views of children’s overall achievement and Composite Competency at
age 12
3040
5060
7080
90
Composite Competency at age 12 grouped byTeacher view of overall achievement at age 6
Teacher view of overall achievement at age 6min./slow/<average average/medium average+v.gd v.good/excellent
Com
posi
te C
ompe
tenc
y (%
) at a
ge 1
2
Other aspects related to teachers’ overall assessmentsChildren whose achievement levels were below average had slightly lower attendance rates: 87 percent
had good attendance compared with 96 percent of those described as making better than averageprogress. Twenty-two percent of the former group were also reported to have health problems, comparedwith 9 percent of the very good/excellent achievers, and were somewhat more likely to vary in theirhappiness, or be unhappy (25 percent compared with 12 percent overall).
Completion of homework was related to teachers’ overall assessments, with those described as makingvery good or excellent progress twice as likely to always complete their homework as those who weremaking below average progress.
Teachers’ overall assessments appeared to draw on their estimate of their reading age, and their
mathematics performance. Eighty-five percent of those seen as at the below average or minimal levelwere seen to be reading below their chronological age, compared with 40 percent of those seen asaverage or medium, 11 percent of those seen as average but very good in some areas, and 4 percent of
those who were seen as at the very good or excellent level. Eighty-one percent of those who were seen asbelow average or minimal levels were seen to be performing below average in mathematics, as were 20percent of those seen as average or medium overall, 4 percent of those who were average but very goodin some areas, and one child who was rated at the very good/excellent level.
We cross-tabulated children’s scores for the factor “Engagement in school”, drawn from their responsesto individual items about their school experience (see Section Thirteen), in terms of whether they werehighly engaged (71 percent of the children),57 or not. There was some correspondence between a child’s
57 This was based on the average score out of 3 for each of the items which made up the factor.

Section Fourteen
Teachers’ perspectives on the children’s progress
242
level of engagement in school, and their overall achievement level, as described by their home teacher
(rising from 60 percent of those whose level of achievement was less than, average to 80 percent of thosewhose achievement level was very good/excellent). The “Distress at school” factor did not show quitethe reverse picture. Sixteen percent of the study children had middle to high levels of distress; but the
proportion of these in each achievement level was much the same other than the highest, where it was 9percent.
Teachers were less sanguine about the difference they could make in the learning of those they saw asmaking below average progress. Teachers of 31 percent of these children thought they could make a lot
of difference as a teacher to their learning, compared with 58 percent of the children thought to be makingaverage or better progress.
Seventy-one percent of those described as at the very good/excellent level were not experiencingdifficulty in any curriculum area, compared with 49 percent of those described as being at the
average/very good in some areas level, 20 percent of those described as average, and 3 percent of thosedescribed as less than average.
Overall assessments were also related to their description of children’s curriculum strengths: only inphysical education were children who were seen as below average equally likely to be seen as having
strength. The curriculum aspects in which those who were seen as average but very good in some areasdiffered from those who were seen as average were reading, mathematics, spelling, oral language, musicor art, and lateral thinking or problem-solving. The similarities between those who were seen as average
but very good in some areas, and those who were seen as very good or excellent overall, came in thecurriculum aspects of handwriting or printing, oral language, music or art, drama and technology.
There were no differences related to school decile or ownership. Children described as making better thanaverage progress were more likely to be involved in cultural or performing arts activities. This was theonly difference related to extracurricular activities at school.
Boys were more likely to be seen as making average or below progress (47 percent compared with 35percent of girls).
Teachers’ perceptions of the level of home support for children’s schoolwork was also related to theirassessment of their overall performance. The higher the children’s performance, the higher the level of
home support for their learning was likely to be rated. Fifty-seven percent of the children seen as makingvery good/excellent progress had home support rated at the top of the 5- point scale we used, declining to19 percent of those making less than average progress.
As in earlier years, maternal qualification levels were linked to teacher views of overall progress at age
12. Fifty percent of those whose mothers had a university qualification were seen to be making verygood/excellent progress, compared with 35 percent of those whose mothers had a trade or tertiaryqualification, 29 percent of those whose mothers had a school-level qualification, and 15 percent of those
whose mothers had no educational qualification. Two percent of those whose mothers had a universityqualification were seen to be making below average progress, compared with 27 percent of those whosemothers had no qualification.

Section Fourteen
Teachers’ perspectives on the children’s progress
243
Current family income levels were also associated: 7 percent of the children from high-income homes
were seen to be making below average progress, compared with 21 percent of those from low-incomehomes.
Päkehä/European and Asian children were more likely to be seen as making very good/excellent progress(35 percent), than Mäori or Pasifika (19 percent).
Mathematics and reading age
The teachers gave this picture of the study children’s mathematics performance, relative to their classlevel. Note that the teachers’ responses have a more symmetric (normal) distribution than the teacherperception of children’s overall performance (Figure 21, p. 241).
The teachers’ gauge of the study children’s mathematics performance relative to their class level wasconsistent with their performance on our mathematics measure.
Figure 22 Study children’s mathematics performance relative to their class level
Maternal qualification and family income were the family factors related to teachers’ assessments of
children’s mathematics performance relative to their class level. Ethnicity was unrelated to teachers’assessments of children’s mathematics performance relative to their class level.
Sixty-six percent of the study children whose mothers had university qualifications were seen asperforming above average/excellent, compared with 43 percent of those children whose mothers had a
trade or tertiary qualification, 49 percent of those whose mothers had a school qualification, and 24percent of those whose mothers had no qualification. The trends were similar in relation to familyincome.
Most of the 12-year-olds in the study who were thought to be reading below their chronological age were
also thought to be reading below their chronological age when they were 10 years old (86 percent).Reading age was unrelated to school ownership, but did show some relationship to school decile.
0
5
10
15
20
25
30
35
40
Below average Average Above average Excellent/beyond thisclass level
% o
f st
ud
ents
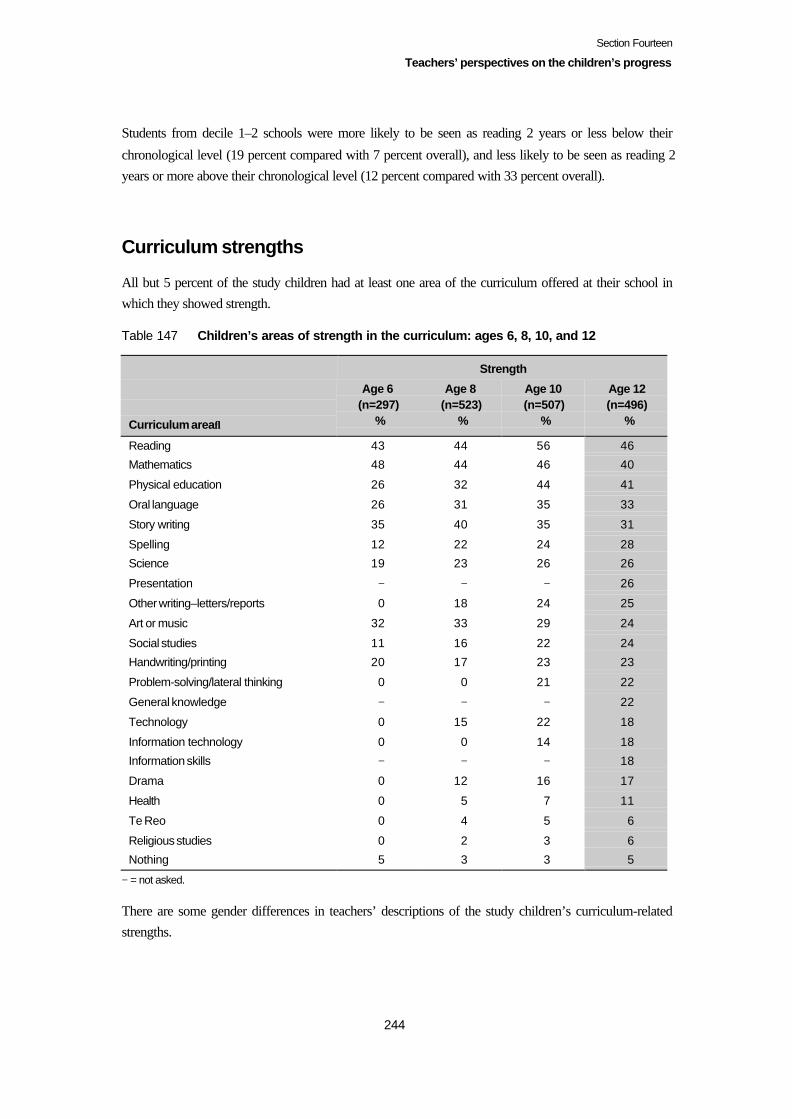
Section Fourteen
Teachers’ perspectives on the children’s progress
244
Students from decile 1–2 schools were more likely to be seen as reading 2 years or less below their
chronological level (19 percent compared with 7 percent overall), and less likely to be seen as reading 2years or more above their chronological level (12 percent compared with 33 percent overall).
Curriculum strengths
All but 5 percent of the study children had at least one area of the curriculum offered at their school inwhich they showed strength.
Table 147 Children’s areas of strength in the curriculum: ages 6, 8, 10, and 12
Strength
Curriculum area↓
Age 6(n=297)
%
Age 8(n=523)
%
Age 10(n=507)
%
Age 12(n=496)
%
Reading 43 44 56 46
Mathematics 48 44 46 40
Physical education 26 32 44 41
Oral language 26 31 35 33
Story writing 35 40 35 31
Spelling 12 22 24 28
Science 19 23 26 26
Presentation − − − 26
Other writing–letters/reports 0 18 24 25
Art or music 32 33 29 24
Social studies 11 16 22 24
Handwriting/printing 20 17 23 23
Problem-solving/lateral thinking 0 0 21 22
General knowledge − − − 22
Technology 0 15 22 18
Information technology 0 0 14 18
Information skills − − − 18
Drama 0 12 16 17
Health 0 5 7 11
Te Reo 0 4 5 6
Religious studies 0 2 3 6
Nothing 5 3 3 5
− = not asked.
There are some gender differences in teachers’ descriptions of the study children’s curriculum-relatedstrengths.
Section Fourteen
Teachers’ perspectives on the children’s progress
245
The areas where boys and girls were seen as equally strong58 were:
Maths, oral language, drama, te reo Mäori, religious studies, health, general knowledge, and problem-solving/lateral thinking.
This is a somewhat different set of strengths than when the study children were age 10: that set includedsocial studies, music and art, and did not include maths or problem-solving (where more boys were seenas having strengths), or health (where more girls were seen as having strengths).
Areas where a higher proportion of boys were reported as having strengths were:
Science, technology, physical education, and information technology.
Areas where a higher proportion of girls were reported as having strengths were:
Reading, story writing, other (non-story) writing, handwriting or printing, spelling, social studies, andpresentation.
Maternal qualification is the family factor most related to teachers’ descriptions of some curriculumstrengths of the study children at age 12. Those whose mothers had a university qualification were morelikely to be seen to have curriculum strengths in reading, mathematics, story writing, oral language,
science, problem-solving/lateral thinking, and information skills than those whose mother had atertiary/trade or school qualification, who in turn were more likely to be seen to have curriculum strengthsin these areas than those whose mother had no qualification. Those whose mothers had no qualificationwere less likely to be seen as having a strength in general knowledge (10 percent).
Family income and ethnicity were largely unrelated to the teachers’ descriptions of the curriculumstrengths of this sample. Pasifika and Mäori students were more likely to be seen as having strengths inart or music (44 and 36 percent respectively), Mäori students in te reo (21 percent), Pasifika students in
presentation (48 percent), and Päkehä/European students in problem-solving/lateral thinking (24 percentcompared with 10 percent for others), and in general knowledge (25 percent compared with 11 percentfor others).
There were few school-related differences in teacher reports. Private school teachers were more likely to
report drama as a student strength (33 percent), and least likely to report mathematics (25 percent). Stateintegrated teachers were most likely to report religious studies (29 percent) as a student strength. Decile1–2 teachers were more likely to report te reo Mäori (19 percent), and religious studies (15 percent) asstudent strengths. These differences are likely to reflect different curriculum emphases as well.
58 This was in response to an open-ended question, so teachers were not asked to rate each child on each of the areasmentioned here, but volunteered those areas of particular strength they saw in each of the study children.
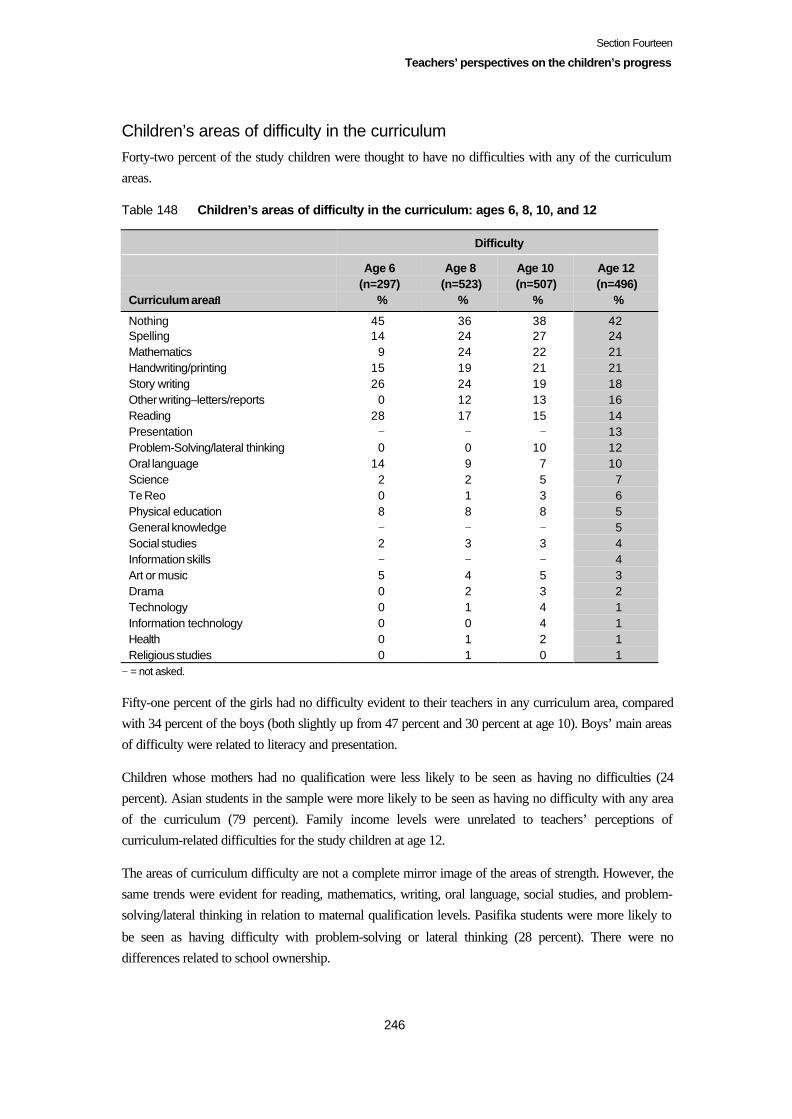
Section Fourteen
Teachers’ perspectives on the children’s progress
246
Children’s areas of difficulty in the curriculumForty-two percent of the study children were thought to have no difficulties with any of the curriculumareas.
Table 148 Children’s areas of difficulty in the curriculum: ages 6, 8, 10, and 12
Difficulty
Curriculum area↓
Age 6(n=297)
%
Age 8(n=523)
%
Age 10(n=507)
%
Age 12(n=496)
%
Nothing 45 36 38 42Spelling 14 24 27 24Mathematics 9 24 22 21Handwriting/printing 15 19 21 21Story writing 26 24 19 18Other writing–letters/reports 0 12 13 16Reading 28 17 15 14Presentation − − − 13Problem-Solving/lateral thinking 0 0 10 12Oral language 14 9 7 10Science 2 2 5 7Te Reo 0 1 3 6Physical education 8 8 8 5General knowledge − − − 5Social studies 2 3 3 4Information skills − − − 4Art or music 5 4 5 3Drama 0 2 3 2Technology 0 1 4 1Information technology 0 0 4 1Health 0 1 2 1Religious studies 0 1 0 1
− = not asked.
Fifty-one percent of the girls had no difficulty evident to their teachers in any curriculum area, comparedwith 34 percent of the boys (both slightly up from 47 percent and 30 percent at age 10). Boys’ main areasof difficulty were related to literacy and presentation.
Children whose mothers had no qualification were less likely to be seen as having no difficulties (24percent). Asian students in the sample were more likely to be seen as having no difficulty with any areaof the curriculum (79 percent). Family income levels were unrelated to teachers’ perceptions ofcurriculum-related difficulties for the study children at age 12.
The areas of curriculum difficulty are not a complete mirror image of the areas of strength. However, thesame trends were evident for reading, mathematics, writing, oral language, social studies, and problem-solving/lateral thinking in relation to maternal qualification levels. Pasifika students were more likely to
be seen as having difficulty with problem-solving or lateral thinking (28 percent). There were nodifferences related to school ownership.
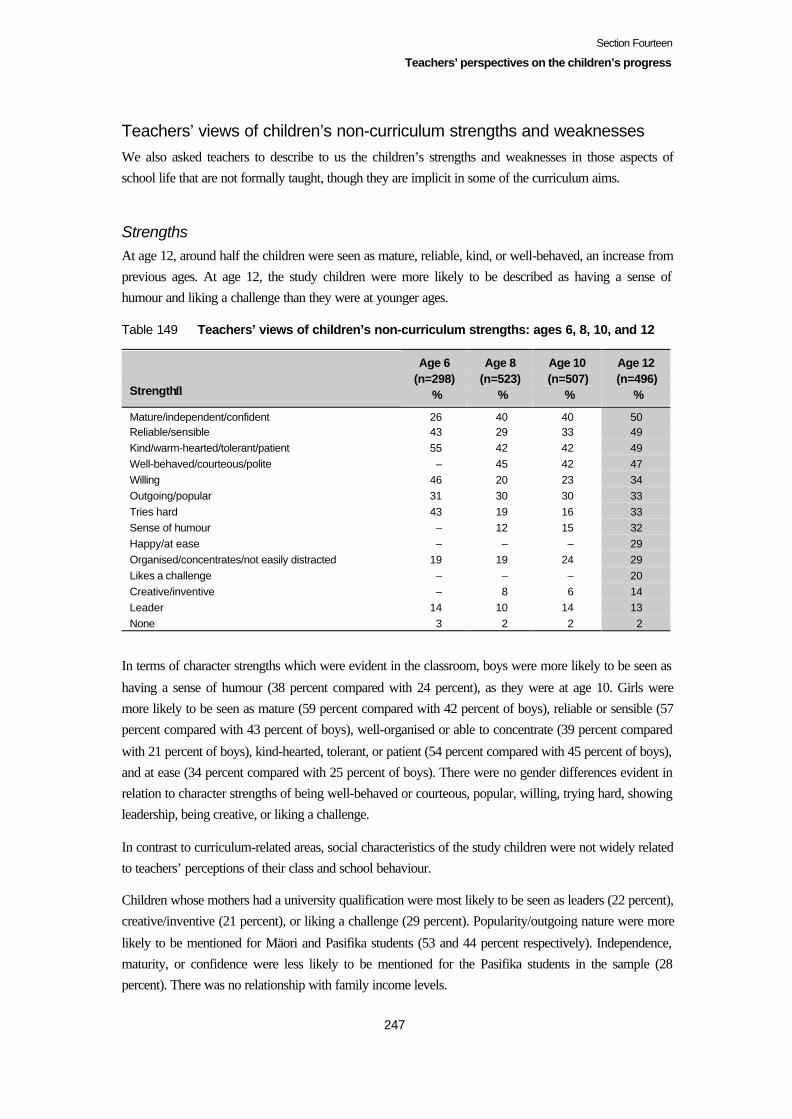
Section Fourteen
Teachers’ perspectives on the children’s progress
247
Teachers’ views of children’s non-curriculum strengths and weaknessesWe also asked teachers to describe to us the children’s strengths and weaknesses in those aspects ofschool life that are not formally taught, though they are implicit in some of the curriculum aims.
StrengthsAt age 12, around half the children were seen as mature, reliable, kind, or well-behaved, an increase fromprevious ages. At age 12, the study children were more likely to be described as having a sense ofhumour and liking a challenge than they were at younger ages.
Table 149 Teachers’ views of children’s non-curriculum strengths: ages 6, 8, 10, and 12
Strength↓
Age 6(n=298)
%
Age 8(n=523)
%
Age 10(n=507)
%
Age 12(n=496)
%
Mature/independent/confident 26 40 40 50Reliable/sensible 43 29 33 49Kind/warm-hearted/tolerant/patient 55 42 42 49Well-behaved/courteous/polite – 45 42 47Willing 46 20 23 34Outgoing/popular 31 30 30 33Tries hard 43 19 16 33Sense of humour – 12 15 32Happy/at ease – – – 29Organised/concentrates/not easily distracted 19 19 24 29Likes a challenge – – – 20Creative/inventive – 8 6 14Leader 14 10 14 13None 3 2 2 2
In terms of character strengths which were evident in the classroom, boys were more likely to be seen as
having a sense of humour (38 percent compared with 24 percent), as they were at age 10. Girls weremore likely to be seen as mature (59 percent compared with 42 percent of boys), reliable or sensible (57percent compared with 43 percent of boys), well-organised or able to concentrate (39 percent compared
with 21 percent of boys), kind-hearted, tolerant, or patient (54 percent compared with 45 percent of boys),and at ease (34 percent compared with 25 percent of boys). There were no gender differences evident inrelation to character strengths of being well-behaved or courteous, popular, willing, trying hard, showingleadership, being creative, or liking a challenge.
In contrast to curriculum-related areas, social characteristics of the study children were not widely relatedto teachers’ perceptions of their class and school behaviour.
Children whose mothers had a university qualification were most likely to be seen as leaders (22 percent),creative/inventive (21 percent), or liking a challenge (29 percent). Popularity/outgoing nature were more
likely to be mentioned for Mäori and Pasifika students (53 and 44 percent respectively). Independence,maturity, or confidence were less likely to be mentioned for the Pasifika students in the sample (28percent). There was no relationship with family income levels.

Section Fourteen
Teachers’ perspectives on the children’s progress
248
There were no differences related to school ownership, and only 1 related to school decile. Teachers of
the students attending decile 1–2 schools were more likely to mention popularity or outgoing nature fortheir students (50 percent).
Some of these attributes were related to teachers’ view of individual children’s overall achievementlevels. Students whose achievement level was seen as very good or excellent were twice as likely as those
described as making average progress or less to be described as having strengths of maturity,independence, or confidence, and 3 times as likely to be seen as organised and able to concentrate, or asleaders. They were most likely to be seen as being reliable or sensible, creative or innovative, and to like achallenge.
However, the qualities of kindness, warm-heartedness, tolerance, or patience, of willingness, being well-behaved, trying hard, having a sense of humour, and being happy or at ease, were found at much thesame levels for all achievement levels.
WeaknessesThe weaknesses identified by the children’s teachers at age 12 were more likely than the strengthsidentified at this age to occur in similar proportions as at earlier ages.
Table 150 Teachers’ views of children’s non-curriculum weaknesses: ages 6, 8, 10, and 12
Weakness↓
Age 6(n=298)
%
Age 8(n=523)
%
Age 10(n=507)
%
Age 12(n=4967)
%
Poor work habits – 26 30 24Passive (shy, too dependent) 26 22 23 19Poor self-concept/low self-esteem/insecure 18 18 16 18Self-centred/wilful 16 14 15 13Immature/dependent – 14 13 16Aggressive 9 11 5 3Does not try 7 7 4 6Lives in own world 5 5 3 7Impatient 13 4 1 4Bossy – 3 4 4Unreliable 7 2 2 4Spoilt 1 – – 3Over-anxious – – – 6Lacks friends 7 – – –Thin-skinned/oversensitive – – – 4Rude – – – 4None 28 24 19 27
Also mentioned were dishonest (2 percent), and depressed/melancholic (1 percent).
Thirty-two percent of the boys were seen as having a difficulty with poor work habits, compared with 14percent of the girls, and 22 percent as immature or easily led astray compared with 10 percent of the girls.
Some differences which were apparent at age 10 were no longer evident – boys at age 12 were no morelikely than girls to be seen as aggressive or living in their own world.
Section Fourteen
Teachers’ perspectives on the children’s progress
249
There was only 1 difference related to maternal qualification: children whose mothers had no
qualification were more likely to be seen as immature (27 percent). There were no relationships withfamily income or ethnicity, school decile or school ownership.
There were differences related to teachers’ view of children’s overall achievement. Those who weremaking less than average progress were around 4 times more likely to be seen as aggressive, 3 times as
likely to have poor work habits and be immature or easily led astray, and twice as likely to be seen asliving in their own world, having low self-esteem, or being unreliable.
Bossiness, rudeness, being self-centred, and not trying, were found at much the same levels across allachievement levels.
How do non-curriculum strengths and weaknesses relate to each other?We undertook a cluster analysis to see how these perceptions of children’s non-curriculum strengths andweaknesses related to each other. The clustering method used was a divisive hierarchical clustering of thechildren, which indicated an acceptable categorisation of 4 clusters of children. We then checked on the
typical characteristics of each cluster with respect to the variables used in the cluster analysis, totalledover all the age 6 to 12 data, giving 4 levels (very high, high, moderate, and low).
These clusters are shown in the next table, using only those characteristics which had a significance levelof above 0.01, using a chi-square test. There were no significant differences between the clusters in their
total scores from ages 6 to 12 in relation to: creativity, passivity, being self-centred, impatient, bossy,outgoing, or a leader, having low self-esteem or no strengths, or not trying, or living in one’s own world.
The 4 clusters could be described as:
• “solid” – having very high scores over the years for reliability, being organised, being willing, andwell-behaved;
• “mature with edges” – having high scores for reliability, being organised, and being willing, but lowscores for being well-behaved;
• “steady” – having a low score for maturity, moderate scores for the dispositions and habits above, but
high scores for being well-behaved, and low scores for a sense of humour; and• “patchy” – low scores for these dispositions and habits, but a very high score for sense of humour.
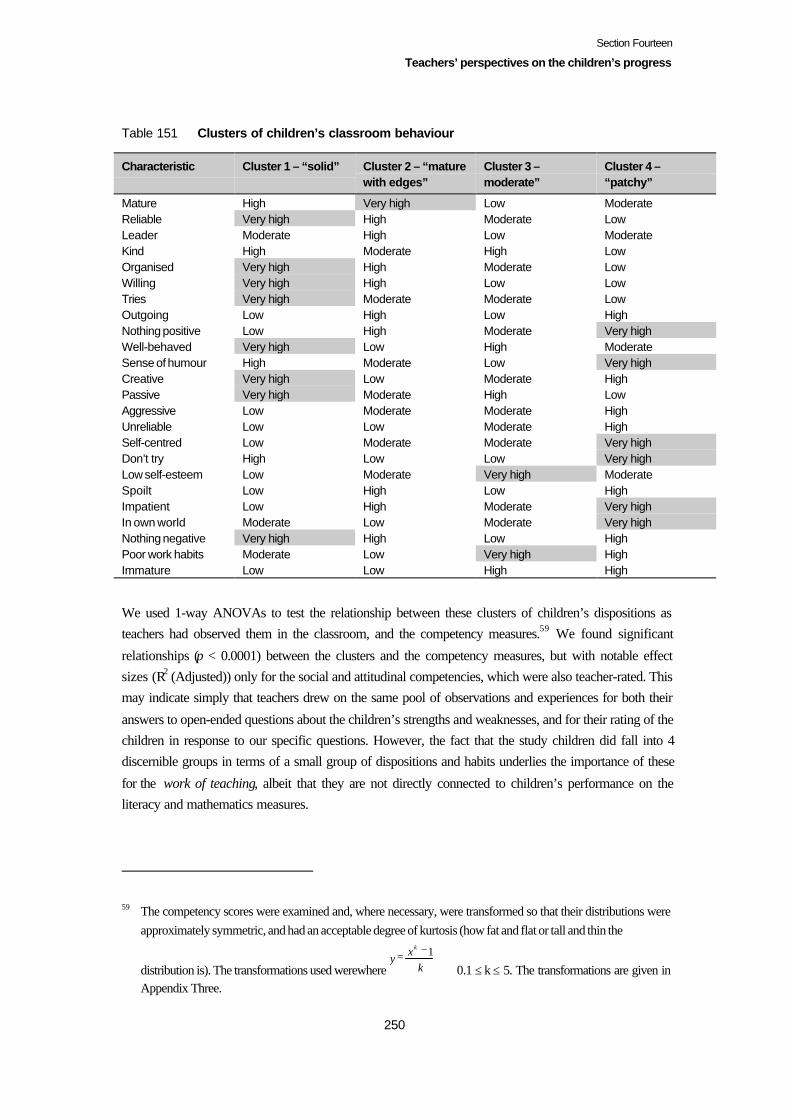
Section Fourteen
Teachers’ perspectives on the children’s progress
250
Table 151 Clusters of children’s classroom behaviour
Characteristic Cluster 1 – “solid” Cluster 2 – “maturewith edges”
Cluster 3 –moderate”
Cluster 4 –“patchy”
Mature High Very high Low ModerateReliable Very high High Moderate LowLeader Moderate High Low ModerateKind High Moderate High LowOrganised Very high High Moderate LowWilling Very high High Low LowTries Very high Moderate Moderate LowOutgoing Low High Low HighNothing positive Low High Moderate Very highWell-behaved Very high Low High ModerateSense of humour High Moderate Low Very highCreative Very high Low Moderate HighPassive Very high Moderate High LowAggressive Low Moderate Moderate HighUnreliable Low Low Moderate HighSelf-centred Low Moderate Moderate Very highDon’t try High Low Low Very highLow self-esteem Low Moderate Very high ModerateSpoilt Low High Low HighImpatient Low High Moderate Very highIn own world Moderate Low Moderate Very highNothing negative Very high High Low HighPoor work habits Moderate Low Very high HighImmature Low Low High High
We used 1-way ANOVAs to test the relationship between these clusters of children’s dispositions asteachers had observed them in the classroom, and the competency measures.59 We found significant
relationships (p < 0.0001) between the clusters and the competency measures, but with notable effectsizes (R2 (Adjusted)) only for the social and attitudinal competencies, which were also teacher-rated. Thismay indicate simply that teachers drew on the same pool of observations and experiences for both their
answers to open-ended questions about the children’s strengths and weaknesses, and for their rating of thechildren in response to our specific questions. However, the fact that the study children did fall into 4discernible groups in terms of a small group of dispositions and habits underlies the importance of these
for the work of teaching, albeit that they are not directly connected to children’s performance on theliteracy and mathematics measures.
59 The competency scores were examined and, where necessary, were transformed so that their distributions wereapproximately symmetric, and had an acceptable degree of kurtosis (how fat and flat or tall and thin the
distribution is). The transformations used werewhere kx
yk 1−=
0.1 ≤ k ≤ 5. The transformations are given inAppendix Three.
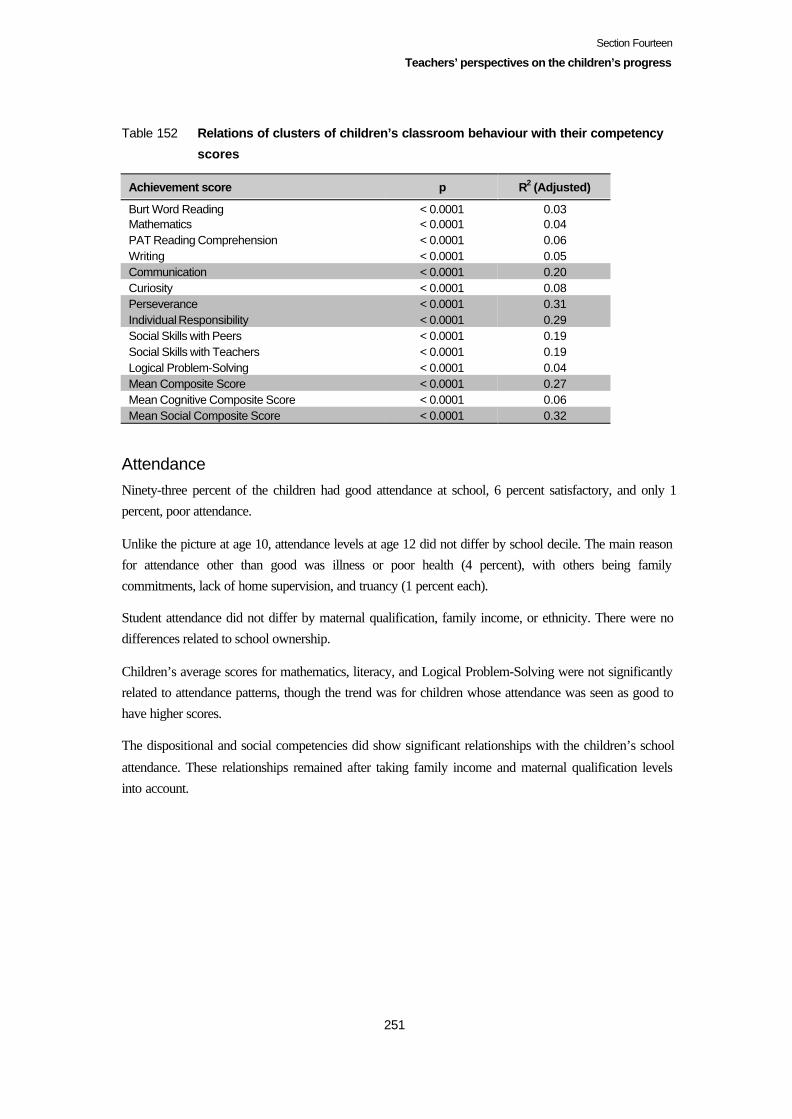
Section Fourteen
Teachers’ perspectives on the children’s progress
251
Table 152 Relations of clusters of children’s classroom behaviour with their competency
scores
Achievement score p R2 (Adjusted)
Burt Word Reading < 0.0001 0.03Mathematics < 0.0001 0.04PAT Reading Comprehension < 0.0001 0.06Writing < 0.0001 0.05Communication < 0.0001 0.20Curiosity < 0.0001 0.08Perseverance < 0.0001 0.31Individual Responsibility < 0.0001 0.29Social Skills with Peers < 0.0001 0.19Social Skills with Teachers < 0.0001 0.19Logical Problem-Solving < 0.0001 0.04Mean Composite Score < 0.0001 0.27Mean Cognitive Composite Score < 0.0001 0.06Mean Social Composite Score < 0.0001 0.32
AttendanceNinety-three percent of the children had good attendance at school, 6 percent satisfactory, and only 1percent, poor attendance.
Unlike the picture at age 10, attendance levels at age 12 did not differ by school decile. The main reasonfor attendance other than good was illness or poor health (4 percent), with others being familycommitments, lack of home supervision, and truancy (1 percent each).
Student attendance did not differ by maternal qualification, family income, or ethnicity. There were nodifferences related to school ownership.
Children’s average scores for mathematics, literacy, and Logical Problem-Solving were not significantlyrelated to attendance patterns, though the trend was for children whose attendance was seen as good tohave higher scores.
The dispositional and social competencies did show significant relationships with the children’s school
attendance. These relationships remained after taking family income and maternal qualification levelsinto account.
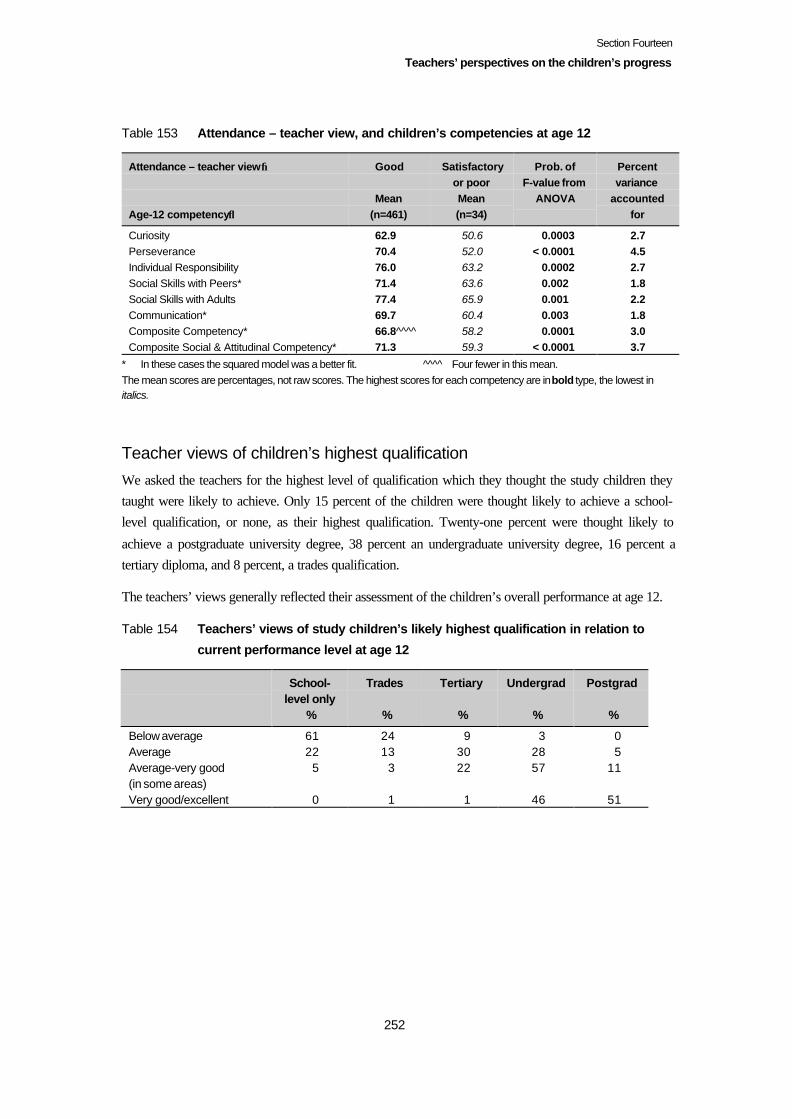
Section Fourteen
Teachers’ perspectives on the children’s progress
252
Table 153 Attendance – teacher view, and children’s competencies at age 12
Attendance – teacher view→
Age-12 competency↓
Good
Mean(n=461)
Satisfactoryor poorMean(n=34)
Prob. ofF-value from
ANOVA
Percentvariance
accountedfor
Curiosity 62.9 50.6 0.0003 2.7Perseverance 70.4 52.0 < 0.0001 4.5Individual Responsibility 76.0 63.2 0.0002 2.7Social Skills with Peers* 71.4 63.6 0.002 1.8Social Skills with Adults 77.4 65.9 0.001 2.2Communication* 69.7 60.4 0.003 1.8Composite Competency* 66.8^^^^ 58.2 0.0001 3.0Composite Social & Attitudinal Competency* 71.3 59.3 < 0.0001 3.7
* In these cases the squared model was a better fit. ^^^^ Four fewer in this mean.The mean scores are percentages, not raw scores. The highest scores for each competency are in bold type, the lowest initalics.
Teacher views of children’s highest qualification
We asked the teachers for the highest level of qualification which they thought the study children theytaught were likely to achieve. Only 15 percent of the children were thought likely to achieve a school-level qualification, or none, as their highest qualification. Twenty-one percent were thought likely to
achieve a postgraduate university degree, 38 percent an undergraduate university degree, 16 percent atertiary diploma, and 8 percent, a trades qualification.
The teachers’ views generally reflected their assessment of the children’s overall performance at age 12.
Table 154 Teachers’ views of study children’s likely highest qualification in relation to
current performance level at age 12
School-level only
%
Trades
%
Tertiary
%
Undergrad
%
Postgrad
%
Below average 61 24 9 3 0Average 22 13 30 28 5Average-very good(in some areas)
5 3 22 57 11
Very good/excellent 0 1 1 46 51

Section Fourteen
Teachers’ perspectives on the children’s progress
253
Figure 23 Teachers’ views of children’s likely highest qualification level in relation to their
views of their overall progress at age 12
More of the study girls were thought by their teachers likely to complete their education with anundergraduate university degree (43 percent compared with 33 percent of the boys), and more boys, a
trades qualification (12 percent compared with 3 percent of girls). Otherwise, teacher views of the studychildren’s likely highest qualification levels were similar for both genders.
Teachers of decile 1–2 students were more likely to think their highest qualification would be school-level, or none (35 percent). However, they estimated similar proportions of children who would attain
trades qualifications, tertiary diplomas, and undergraduate degrees. The decile 9–10 students werethought most likely to attain a university undergraduate degree (46 percent compared with 33 percent forstudents from decile 1–8 schools).
Linked to this, teachers of private school students were more likely to think they would complete an
undergraduate university degree (56 percent compared with 41 percent of state integrated school students,and 35 percent of state school students), though proportions who were likely to achieve a postgraduateuniversity degree were unrelated to school type.
There is also a relationship with maternal qualification and family income, but not with ethnicity. In terms
of family income, the children from the highest-income homes were expected to achieve at a higher levelthan others. Maternal qualification levels showed a more graduated relationship with teachers’ views ofthe children’s likeliest highest qualification.
While the proportions of children who might attain no qualification were similar across all levels of
maternal qualification, and for trades qualifications, they are rather different for school qualifications, anduniversity. Most of the 12-year-olds whose mothers had a university qualification were expected by theirteachers to gain a university qualification themselves, almost half at the post graduate level.
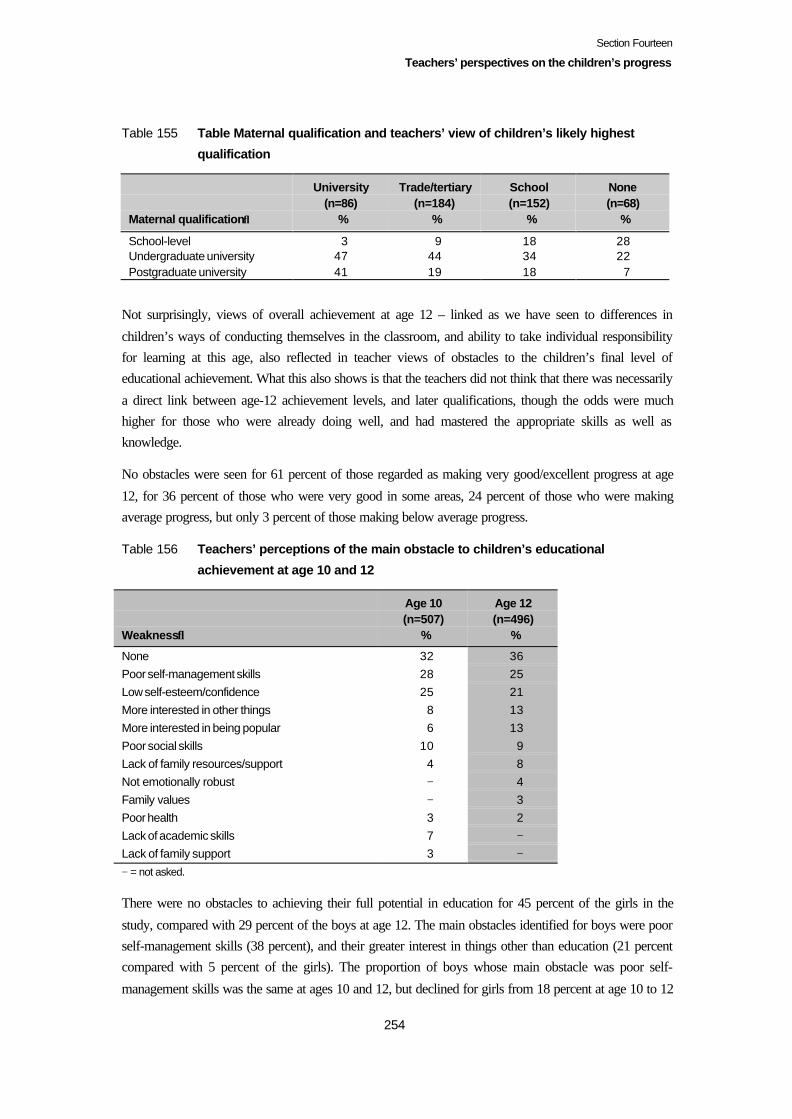
Section Fourteen
Teachers’ perspectives on the children’s progress
254
Table 155 Table Maternal qualification and teachers’ view of children’s likely highest
qualification
Maternal qualification↓
University(n=86)
%
Trade/tertiary(n=184)
%
School(n=152)
%
None(n=68)
%
School-level 3 9 18 28Undergraduate university 47 44 34 22Postgraduate university 41 19 18 7
Not surprisingly, views of overall achievement at age 12 – linked as we have seen to differences in
children’s ways of conducting themselves in the classroom, and ability to take individual responsibilityfor learning at this age, also reflected in teacher views of obstacles to the children’s final level ofeducational achievement. What this also shows is that the teachers did not think that there was necessarily
a direct link between age-12 achievement levels, and later qualifications, though the odds were muchhigher for those who were already doing well, and had mastered the appropriate skills as well asknowledge.
No obstacles were seen for 61 percent of those regarded as making very good/excellent progress at age
12, for 36 percent of those who were very good in some areas, 24 percent of those who were makingaverage progress, but only 3 percent of those making below average progress.
Table 156 Teachers’ perceptions of the main obstacle to children’s educational
achievement at age 10 and 12
Weakness↓
Age 10(n=507)
%
Age 12(n=496)
%
None 32 36Poor self-management skills 28 25Low self-esteem/confidence 25 21More interested in other things 8 13More interested in being popular 6 13Poor social skills 10 9Lack of family resources/support 4 8Not emotionally robust − 4Family values − 3Poor health 3 2Lack of academic skills 7 −Lack of family support 3 −− = not asked.
There were no obstacles to achieving their full potential in education for 45 percent of the girls in the
study, compared with 29 percent of the boys at age 12. The main obstacles identified for boys were poorself-management skills (38 percent), and their greater interest in things other than education (21 percentcompared with 5 percent of the girls). The proportion of boys whose main obstacle was poor self-
management skills was the same at ages 10 and 12, but declined for girls from 18 percent at age 10 to 12
Section Fourteen
Teachers’ perspectives on the children’s progress
255
percent at age 12. Somewhat higher proportions of boys and girls were more interested in things otherthan education at age 12 than at age 10 (15 percent of the boys, and one girl).
Teachers of decile 1–2 students were more likely to see poor self-management skills (38 percent) or lackof family resources (17 percent) as the main obstacle to their achieving their full potential in education.Teachers of students attending private schools were more likely to think they faced no obstacles to
achieving their full potential in education (56 percent of these students, compared with 39 percent ofstudents in state integrated schools, and 33 percent of those in state schools). Part of this may be linked toconfidence and family resource levels, which were more likely to be seen as obstacles for students in stateand state integrated schools.
Not surprisingly, there was a link with maternal qualification. No obstacle to a child achieving their fullpotential was seen for 47 percent of those whose mother had a university qualification, compared with 27percent of those whose mother had no qualification. Family resources were most likely to be seen as anobstacle also for the latter group (18 percent).
Similar trends were evident in relation to current family income levels. No obstacle was evident toteachers for 46 percent of the children from high and very high-income homes, compared with 26 percentof those from moderate-income homes, and 23 percent of those from low-income homes. Familyresources were seen as an obstacle for 24 percent of the latter.
The difference teachers thought they could make for children
Sixty percent of the children had teachers who thought they could make lots of difference to children’s
learning, 39 percent had teachers who thought they could make some difference, depending on the child,and 1 percent had teachers who thought they could make only a little difference to children’s learning.
When we asked the teachers to think about the study children in particular, they were slightly lesssanguine, with 55 percent of the children having teachers who thought they could make lots of difference
in that child’s learning, 37 percent having teachers who felt they could make some difference, and 8percent had teachers who felt they could make only a little difference.
However, there were some interesting differences when it came to considering individual children, with31 percent of those whose teachers thinking that the difference they could make depended on the child
thinking they could make a lot of difference for this particular individual, and conversely, 26 percent ofthose whose teachers thought they could generally make a lot of difference overall thinking that In thiscase, they could make only some difference.
There were no differences in teacher views of their ability to make a difference to learning which wererelated to school decile, ownership, or type.
Teachers’ views of the difference they could make for the study children as individuals were alsounrelated to the children’s gender, maternal qualification, family income, or ethnicity.
Section Fourteen
Teachers’ perspectives on the children’s progress
256
Summary
Teachers’ overall assessments
Teachers’ overall assessments of the study children’s overall performance have not been symmetricallydistributed. Teachers place fewer students below average performance than one would expect ifperformance was normally distributed. This has implications for communication with parents, if
“average” is used as a benchmark, and parents and teachers have different understandings of what thatmeans. However, teacher assessments of the study children’s mathematics’ performance relative to theirclass level were more symmetric.
The categories the children were assigned to by their teachers are consistent with the children’s
performance on the Competent Children’s project competency measures, with clear gradations betweeneach category, for the cognitive competencies, which were tests done by the children, as well as theratings given by teachers for the social and attitudinal competencies.
Teachers’ overall assessments of how children are doing at school also reflected their homework
completion, attendance, health, and happiness, their particular strengths and difficulties related to thecurriculum, and the children’s level of engagement in school, and experience of distress (as given by thechildren). They did not reflect differences in school characteristics, but did reflect teachers’ perceptions of
the level of home support for a child, maternal qualification, family income, gender, and to a lesserextent, ethnicity.
Teachers were less sanguine about the difference they could make in the learning of those they saw asmaking below average progress.
Curriculum strengths and difficulties
Ninety-five percent of the study children had at least one area of strength in their class curriculum. Therewere some differences related to gender and maternal qualification, but family income and ethnicity werelargely unrelated to perceptions of curriculum strengths, as were school characteristics. Around two-fifths
of the study children were seen to have strengths in at least one of reading, mathematics, or physicaleducation.
Forty-two percent of the study children had no areas of difficulty in the class curriculum. Around a fifthhad difficulty with at least one of spelling, mathematics, handwriting, and story writing. Difficulty wasmore likely to be experienced by boys and children whose mothers had no qualification.
Behavioural strengths and difficultiesAt age 12, around half the study children were seen as having at least one of the characteristics of beingmature, reliable, kind, or well-behaved. This is an increase from previous ages. They were more likely to
be described as having a sense of humour and liking a challenge than they were at younger ages. There
Section Fourteen
Teachers’ perspectives on the children’s progress
257
were some differences in gender, and fewer related to maternal qualification, but greater confidenceamong children whose mother had a university qualification.
Teachers’ overall views of the children’s achievement were related to some of these behaviours: childrenwhose achievement level was seen as very good or excellent were twice as likely as those described asmaking average progress or less to be described as having strengths of maturity, independence, or
confidence, and 3 times as likely to be seen as organised and able to concentrate, or as leaders. They weremost likely to be seen as being reliable or sensible, creative or innovative, and to like a challenge.
However, the qualities of kindness, warm-heartedness, tolerance, or patience, of willingness, being well-behaved, trying hard, having a sense of humour, and being happy or at ease, were found at much thesame levels for all achievement levels.
Around a fifth of the study children were seen as having at least one of poor work habits, being passive,or having low self-esteem. Gender was the characteristic associated with different patterns of behaviouraldifficulty.
There were differences related to teachers’ view of children’s overall achievement. Those who were
making less than average progress were around 4 times more likely to be seen as aggressive, 3 times aslikely to have at least one of poor work habits and be immature or easily led astray, and twice as likely tohave at least one of the traits of being seen to live in their own world, having low self-esteem, or being
unreliable. Bossiness, rudeness, being self-centred, and not trying, were found at much the same levelsacross all achievement levels.
Based on teachers’ reports of children’s positive and negative behaviour over the years 6 to 12, it waspossible to group the children into 4 clusters. These clusters had associations with cognitive competency
scores, and showed somewhat stronger association with their scores for communication, Perseverance,and Individual Responsibility. The 4 clusters could be described as:
• “solid” – children having very high scores over the years for reliability, being organised, beingwilling, and well-behaved;
• “mature with edges” – children having high scores for reliability, being organised, and being willing,but low scores for being well-behaved;
• “steady” – children having a low score for maturity, moderate scores for the dispositions and habits
above, but high scores for being well-behaved, and low scores for a sense of humour; and• ‘patchy’ – children having low scores for these dispositions and habits, but a very high score for sense
of humour.
Children in the “solid” and “mature with edges” clusters tended to have higher achievement scores than
those in the “steady” and “patchy” clusters. Children in the “solid” cluster had the highest scores overall,and children in the “patchy” cluster, the lowest scores overall.
Section Fourteen
Teachers’ perspectives on the children’s progress
258
AttendanceNinety-three percent of the study children had good attendance at school, with little difference related to
school or family characteristics. Children whose attendance was lower than others had lower averagescores for the social and attitudinal competencies, but not the cognitive competencies.
Teacher views of the study children’s likely highest qualificationOnly 15 percent of the children were thought likely to achieve a school-level qualification, or none, as
their highest qualification. Twenty-one percent were thought likely to achieve a postgraduate universitydegree, 38 percent an undergraduate university degree, 16 percent a tertiary diploma, and 8 percent, atrades qualification.
Views of children’s highest qualification level were linked to views of their overall progress at age 12.
They also reflected differences in gender, family characteristics, and school characteristics. Someobstacles to children achieving this likely level were seen for 64 percent of the study children. Poor self-management, low self-esteem, a greater interest in other things, and more interest in being popular were
the main obstacles identified. Like parents (see Section Sixteen), teachers see more obstacles in achievingthe highest educational level they appeared capable of for boys than girls, based on their attitudes andwhat they want to do. Teachers also see children from homes with fewer family resources as facinggreater obstacles.
Teachers making a difference for childrenHome support and resources do seem to be factors in teachers’ perceptions of children’s progress atschool, and in their likely future progress. Gender also plays a part. This is probably why not all the
teachers thought they could make a lot of difference to the study children’s learning. Fifty-five percent ofthe study children had teachers who thought they could make a lot of difference to their learning, 37percent had teachers who felt they could make some difference, and 8 percent had teachers who felt they
could make only a little difference. However, when we directly cross-tabulated teachers’ views here withgender and family characteristics, we found no associations. What does seem to matter more is children’soverall level of performance in their class; the family characteristics and gender therefore play a
“backroom” role rather than a directive role in teacher views about their own likely efficacy in theirteaching. It shows us that teachers feel more confident in working with those who are already workingwell, and less comfortable about their ability to improve the performance of those who are struggling.
259
Section Fifteen
Parental contact with the school
Home support for schoolwork – teachers’ perspectives
We asked teachers to rate on a 5-point scale the degree of support that the study children were receivingat home for their schoolwork. Thirty-eight percent of children were said to be receiving the maximumamount of support, 40 percent very good support, and 16 percent an average amount of support. Four
percent of the children were said to be poorly supported at home. Only 1 percent of the children were saidto receive no support at home for their schoolwork. The average score on the 5-point scale was a high4.10.
Views of home support were related to teachers’ assessments of children’s overall progress: 19 percent of
those judged as making below average progress were seen to be receiving the maximum amount of homesupport, compared with 58 percent of those judged to be making very good or excellent progress.
Children whose home support was rated 5 out of 5 by teachers had higher scores than other children forall the competency measures. However, there was some confounding of these relationships with family
income and maternal qualification. This is not surprising: 50 percent of the children whose mothers had auniversity qualification had homes with this rating, compared with 25 percent of those whose mothershad no qualification. Forty-four percent of the children from high and very high-income homes had
homes with this rating, compared with 34 percent of children from moderate-income homes, and 21percent of those from low-income homes.
There were no differences in teachers’ view of home support related to children’s ethnicity.
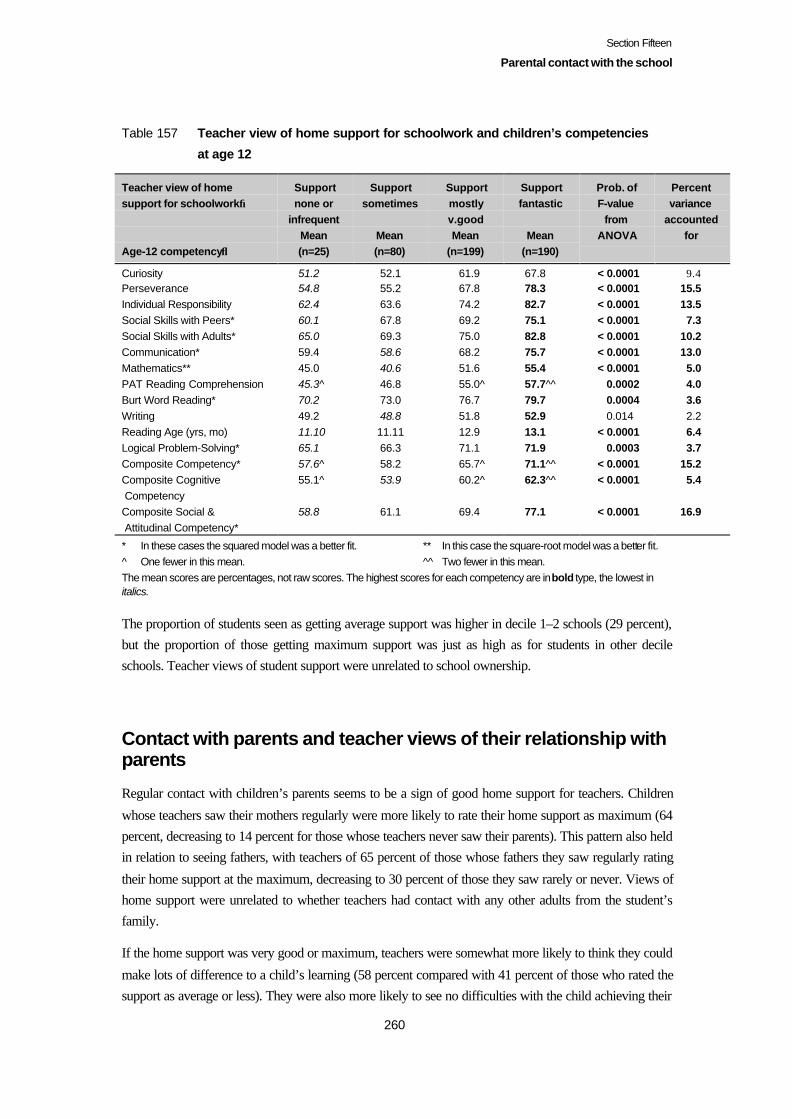
Section Fifteen
Parental contact with the school
260
Table 157 Teacher view of home support for schoolwork and children’s competencies
at age 12
Teacher view of homesupport for schoolwork→
Age-12 competency↓
Supportnone or
infrequentMean(n=25)
Supportsometimes
Mean(n=80)
Supportmostlyv.goodMean
(n=199)
Supportfantastic
Mean(n=190)
Prob. ofF-value
fromANOVA
Percentvariance
accountedfor
Curiosity 51.2 52.1 61.9 67.8 < 0.0001 9.4Perseverance 54.8 55.2 67.8 78.3 < 0.0001 15.5Individual Responsibility 62.4 63.6 74.2 82.7 < 0.0001 13.5Social Skills with Peers* 60.1 67.8 69.2 75.1 < 0.0001 7.3Social Skills with Adults* 65.0 69.3 75.0 82.8 < 0.0001 10.2Communication* 59.4 58.6 68.2 75.7 < 0.0001 13.0Mathematics** 45.0 40.6 51.6 55.4 < 0.0001 5.0PAT Reading Comprehension 45.3^ 46.8 55.0^ 57.7^^ 0.0002 4.0Burt Word Reading* 70.2 73.0 76.7 79.7 0.0004 3.6Writing 49.2 48.8 51.8 52.9 0.014 2.2Reading Age (yrs, mo) 11.10 11.11 12.9 13.1 < 0.0001 6.4Logical Problem-Solving* 65.1 66.3 71.1 71.9 0.0003 3.7Composite Competency* 57.6^ 58.2 65.7^ 71.1^^ < 0.0001 15.2Composite Cognitive Competency
55.1^ 53.9 60.2^ 62.3^^ < 0.0001 5.4
Composite Social & Attitudinal Competency*
58.8 61.1 69.4 77.1 < 0.0001 16.9
* In these cases the squared model was a better fit. ** In this case the square-root model was a better fit.^ One fewer in this mean. ^^ Two fewer in this mean.The mean scores are percentages, not raw scores. The highest scores for each competency are in bold type, the lowest initalics.
The proportion of students seen as getting average support was higher in decile 1–2 schools (29 percent),but the proportion of those getting maximum support was just as high as for students in other decileschools. Teacher views of student support were unrelated to school ownership.
Contact with parents and teacher views of their relationship withparents
Regular contact with children’s parents seems to be a sign of good home support for teachers. Children
whose teachers saw their mothers regularly were more likely to rate their home support as maximum (64percent, decreasing to 14 percent for those whose teachers never saw their parents). This pattern also heldin relation to seeing fathers, with teachers of 65 percent of those whose fathers they saw regularly rating
their home support at the maximum, decreasing to 30 percent of those they saw rarely or never. Views ofhome support were unrelated to whether teachers had contact with any other adults from the student’sfamily.
If the home support was very good or maximum, teachers were somewhat more likely to think they could
make lots of difference to a child’s learning (58 percent compared with 41 percent of those who rated thesupport as average or less). They were also more likely to see no difficulties with the child achieving their
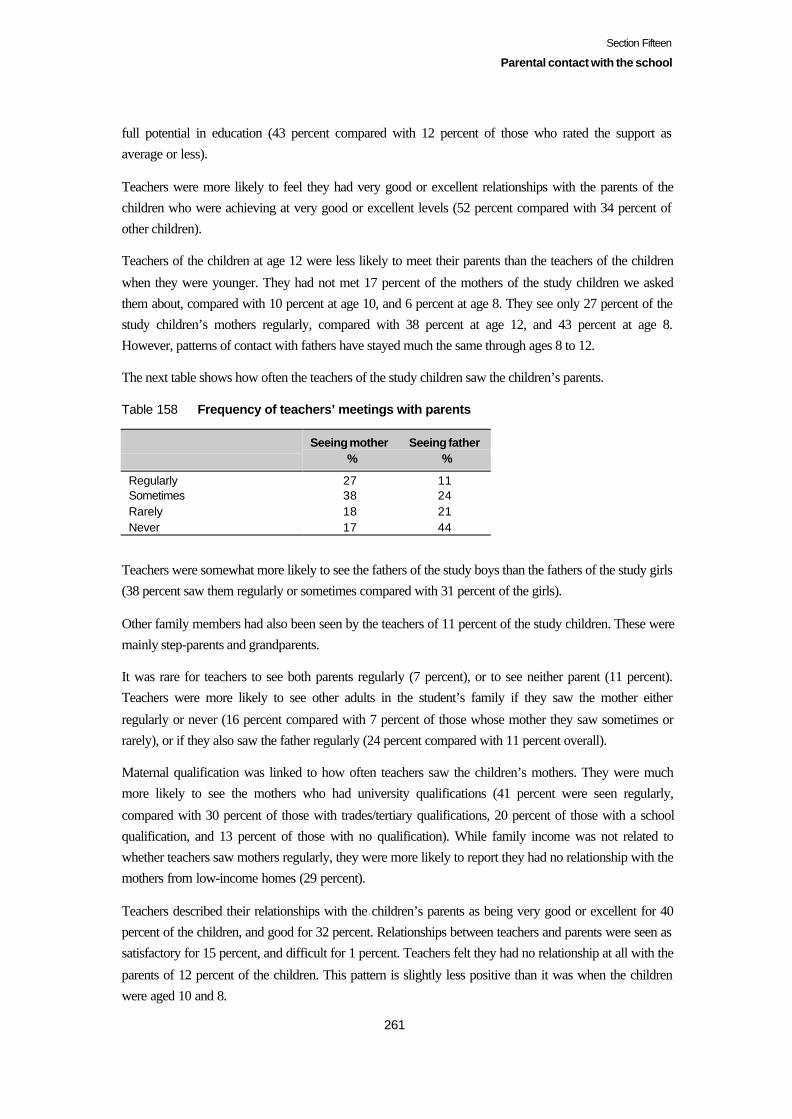
Section Fifteen
Parental contact with the school
261
full potential in education (43 percent compared with 12 percent of those who rated the support asaverage or less).
Teachers were more likely to feel they had very good or excellent relationships with the parents of thechildren who were achieving at very good or excellent levels (52 percent compared with 34 percent ofother children).
Teachers of the children at age 12 were less likely to meet their parents than the teachers of the children
when they were younger. They had not met 17 percent of the mothers of the study children we askedthem about, compared with 10 percent at age 10, and 6 percent at age 8. They see only 27 percent of thestudy children’s mothers regularly, compared with 38 percent at age 12, and 43 percent at age 8.However, patterns of contact with fathers have stayed much the same through ages 8 to 12.
The next table shows how often the teachers of the study children saw the children’s parents.
Table 158 Frequency of teachers’ meetings with parents
Seeing mother %
Seeing father %
Regularly 27 11Sometimes 38 24Rarely 18 21Never 17 44
Teachers were somewhat more likely to see the fathers of the study boys than the fathers of the study girls(38 percent saw them regularly or sometimes compared with 31 percent of the girls).
Other family members had also been seen by the teachers of 11 percent of the study children. These weremainly step-parents and grandparents.
It was rare for teachers to see both parents regularly (7 percent), or to see neither parent (11 percent).Teachers were more likely to see other adults in the student’s family if they saw the mother either
regularly or never (16 percent compared with 7 percent of those whose mother they saw sometimes orrarely), or if they also saw the father regularly (24 percent compared with 11 percent overall).
Maternal qualification was linked to how often teachers saw the children’s mothers. They were muchmore likely to see the mothers who had university qualifications (41 percent were seen regularly,
compared with 30 percent of those with trades/tertiary qualifications, 20 percent of those with a schoolqualification, and 13 percent of those with no qualification). While family income was not related towhether teachers saw mothers regularly, they were more likely to report they had no relationship with themothers from low-income homes (29 percent).
Teachers described their relationships with the children’s parents as being very good or excellent for 40percent of the children, and good for 32 percent. Relationships between teachers and parents were seen assatisfactory for 15 percent, and difficult for 1 percent. Teachers felt they had no relationship at all with the
parents of 12 percent of the children. This pattern is slightly less positive than it was when the childrenwere aged 10 and 8.
Section Fifteen
Parental contact with the school
262
Teachers who saw children’s mothers regularly were more likely to describe their relationship with a
child’s parents as very good or excellent (69 percent, decreasing to 15 percent of those whose motherthey saw rarely or never). The same pattern held in terms of whether they saw the student’s father, with83 percent of those who did so regularly describing the relationship as very good or excellent, decreasingto 28 percent of those who saw the father rarely or never.
Not surprisingly, maternal qualification was linked to teachers’ views of the relationship they had withthe child’s parents: it was described as very good or excellent for half the mothers who had a universityqualification, compared with 25 percent of those mothers who had no qualification. The teachers thought
they had no relationship with 24 percent of those with no qualification, compared with 3 percent of thosewith a university qualification. The teacher-parent relationship was less likely to be very good/excellentfor parents from low-income homes (24 percent).
There were no gender or ethnic-related differences in patterns of seeing the study children’s mothers orfathers, or in teachers’ view of their relationships with the child’s parents.
There were no decile-related differences in patterns of teachers seeing mothers or fathers, or others fromthe students’ families. Relationships were more likely to be described as (only) satisfactory for decile 7–10 students (17 percent), compared with 10 percent of decile 1–6 students), but fewer decile 9–10
students had teachers who said they had no relationship with the student’s parents (7 percent comparedwith 14 percent of decile 1–8 students).
Teachers of private school students were more likely to either see mothers of the study children theytaught regularly (38 percent compared with 27 percent overall), or not at all (25 percent compared with
16 percent overall). They were more likely to see fathers of the study children regularly (25 percentcompared with 11 percent overall). However, their views of their relationship with the study children’sparents were much the same as other teachers.
Parents and teachers working together for the child
Most parents said they felt comfortable talking with their child’s teacher about their child (88 percent).Only 2 percent were not. Another 3 percent were comfortable talking about some things, but not others.
Seven percent had not met their child’s teacher. The main reason for feeling uncomfortable was that theparent had no confidence in the child’s teacher (3 percent). Other reasons were that the parent lackedconfidence to approach the teacher, or had no time to get to know the teacher (1 percent each). Parental
views of their comfort in talking with their child’s teacher were unrelated to the teacher’s assessment ofthe child’s overall achievement level.
The older the children in the sample, the less likely were their parents to work with their child’s teacher toresolve problems encountered by their child. At age 12, 43 percent did so, lower than the 50 percent at
age 10, or the 65 percent at age 8. Forty-seven percent said their child had not experienced any problems,and 3 percent had had problems they did not share with their child’s teacher. Academic problems wereraised by 23 percent of the parents, and social-emotional problems by 20 percent. One percent raised
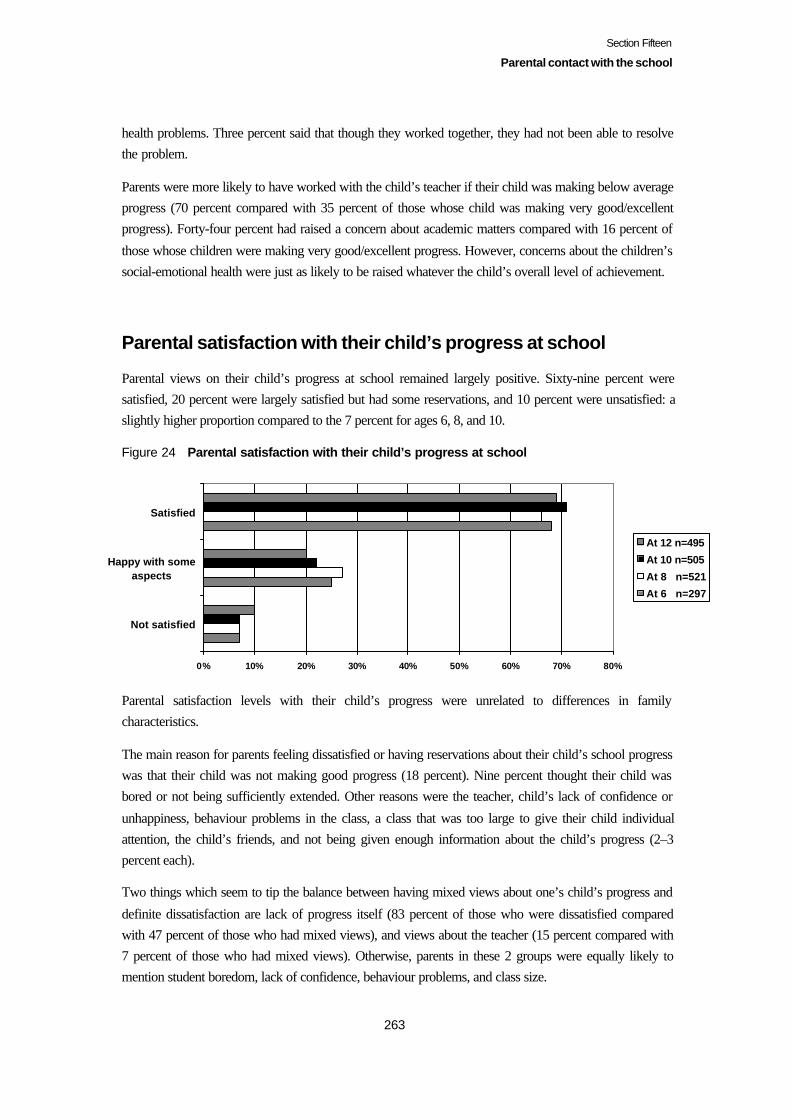
Section Fifteen
Parental contact with the school
263
health problems. Three percent said that though they worked together, they had not been able to resolvethe problem.
Parents were more likely to have worked with the child’s teacher if their child was making below averageprogress (70 percent compared with 35 percent of those whose child was making very good/excellentprogress). Forty-four percent had raised a concern about academic matters compared with 16 percent of
those whose children were making very good/excellent progress. However, concerns about the children’ssocial-emotional health were just as likely to be raised whatever the child’s overall level of achievement.
Parental satisfaction with their child’s progress at school
Parental views on their child’s progress at school remained largely positive. Sixty-nine percent weresatisfied, 20 percent were largely satisfied but had some reservations, and 10 percent were unsatisfied: aslightly higher proportion compared to the 7 percent for ages 6, 8, and 10.
Figure 24 Parental satisfaction with their child’s progress at school
Parental satisfaction levels with their child’s progress were unrelated to differences in familycharacteristics.
The main reason for parents feeling dissatisfied or having reservations about their child’s school progresswas that their child was not making good progress (18 percent). Nine percent thought their child wasbored or not being sufficiently extended. Other reasons were the teacher, child’s lack of confidence or
unhappiness, behaviour problems in the class, a class that was too large to give their child individualattention, the child’s friends, and not being given enough information about the child’s progress (2–3percent each).
Two things which seem to tip the balance between having mixed views about one’s child’s progress and
definite dissatisfaction are lack of progress itself (83 percent of those who were dissatisfied comparedwith 47 percent of those who had mixed views), and views about the teacher (15 percent compared with7 percent of those who had mixed views). Otherwise, parents in these 2 groups were equally likely tomention student boredom, lack of confidence, behaviour problems, and class size.
0% 10% 20% 30% 40% 50% 60% 70% 80%
Not satisfied
Happy with someaspects
Satisfied
At 12 n=495
At 10 n=505
At 8 n=521
At 6 n=297
Section Fifteen
Parental contact with the school
264
Parents who were dissatisfied with their child’s progress, or whose satisfaction was qualified, were more
likely to have very little or irregular contact only with their child’s school (26 percent) compared withthose who were satisfied with their child’s progress (15 percent). However, the proportions of those whohad no involvement at all in their child’s school were similar for all 3 groups.
Those who were dissatisfied with their child’s progress were more likely to:
• work with their child’s teacher to sort out a problem experienced by the child (82 percent compared
with 57 percent of those who expressed qualified satisfaction, and 39 percent of those who weresatisfied);
• be uncomfortable talking with the teacher about the child (33 percent compared with 18 percent ofthose who expressed qualified satisfaction, and 7 percent of those who were satisfied); and
• want to change something about what happened in their child’s class (54 percent compared with 34
percent of those who expressed qualified satisfaction, and 24 percent of those who were satisfied). Itis interesting that satisfaction with child’s progress does not translate into complete satisfaction withall that is happening in that child’s classroom.
Parental satisfaction with boys’ progress has varied over time: they were less satisfied than the parents of
girls at age 8, but not at ages 6 and 10; and at age 12, 65 percent of boys’ parents were satisfied with theirson’s progress, compared with 75 percent of girls’ parents. However, boys’ parents were as comfortabletalking to their teacher as girls’ parents, and just as likely to have worked with their current teacher to sort
out a problem. They were marginally more likely to have taken a cognitive or academic problem to theteacher (26 percent compared with 19 percent of girls’ parents). However, the proportion of boys taking aremedial school-related subject in lessons outside school was no higher than for girls.
We did not analyse parents’ current satisfaction with children’s progress in relation to their competency
levels at age 12, largely because our analyses in previous years had shown that there were consistentassociations: children whose parents were satisfied with their progress scored more highly than others.However, there were no significant differences between those whose parents were dissatisfied, and those
who had some reservations, for Mathematics, Social Skills with Peers, Social Skills with Adults, or FineMotor Skills.
In looking for factors which might contribute to children’s competency levels at age 12 (rather thanreflect them), it seemed more useful to return to previous parental satisfaction levels. We analysedparental satisfaction levels at age 10, and at age 6 (after the first year of school).
Children’s average performance at age 12 did reflect parental satisfaction levels with their child’sprogress at age 10. These associations remained after taking family income and maternal qualificationlevels into account. For most of the competencies, the differences are mainly between the group whose
parents were not satisfied with their progress 2 years earlier, with little difference between those whoseparents expressed satisfaction or who qualified this satisfaction. The 3 groups are different only whenanalysing the composite competencies.
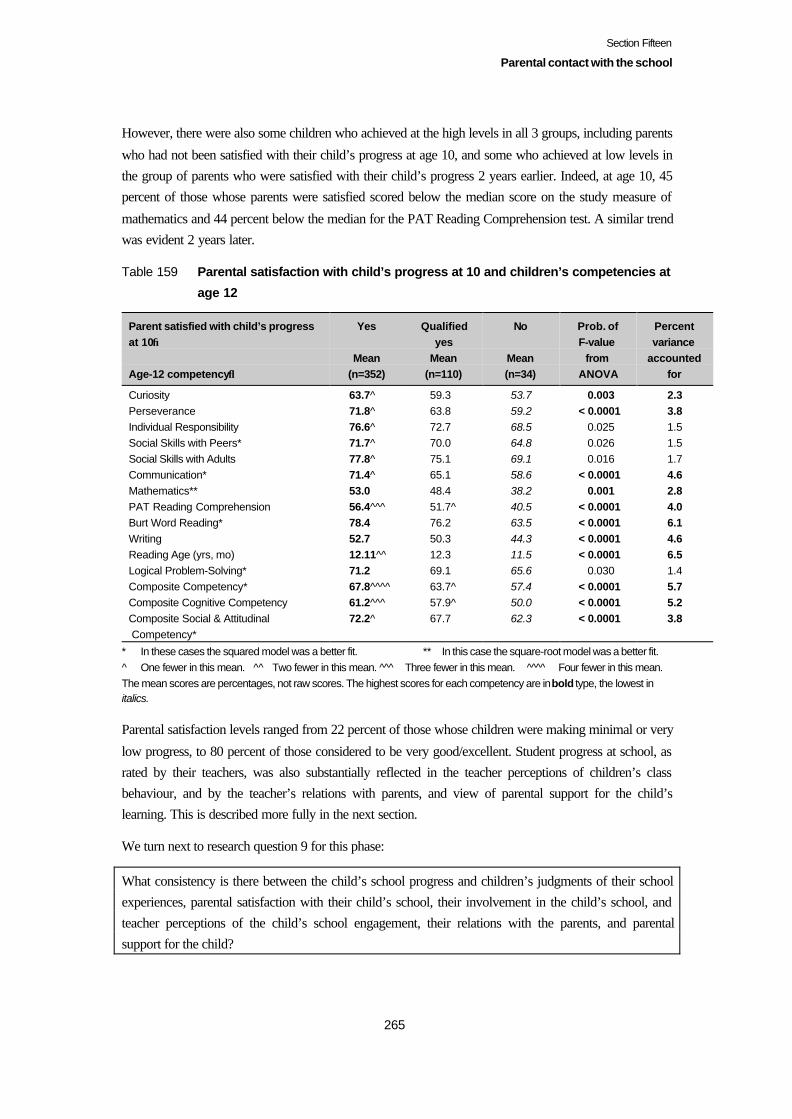
Section Fifteen
Parental contact with the school
265
However, there were also some children who achieved at the high levels in all 3 groups, including parents
who had not been satisfied with their child’s progress at age 10, and some who achieved at low levels inthe group of parents who were satisfied with their child’s progress 2 years earlier. Indeed, at age 10, 45percent of those whose parents were satisfied scored below the median score on the study measure of
mathematics and 44 percent below the median for the PAT Reading Comprehension test. A similar trendwas evident 2 years later.
Table 159 Parental satisfaction with child’s progress at 10 and children’s competencies at
age 12
Parent satisfied with child’s progressat 10→
Age-12 competency↓
Yes
Mean(n=352)
Qualifiedyes
Mean(n=110)
No
Mean(n=34)
Prob. ofF-value
fromANOVA
Percentvariance
accountedfor
Curiosity 63.7^ 59.3 53.7 0.003 2.3Perseverance 71.8^ 63.8 59.2 < 0.0001 3.8Individual Responsibility 76.6^ 72.7 68.5 0.025 1.5Social Skills with Peers* 71.7^ 70.0 64.8 0.026 1.5Social Skills with Adults 77.8^ 75.1 69.1 0.016 1.7Communication* 71.4^ 65.1 58.6 < 0.0001 4.6Mathematics** 53.0 48.4 38.2 0.001 2.8PAT Reading Comprehension 56.4^^^ 51.7^ 40.5 < 0.0001 4.0Burt Word Reading* 78.4 76.2 63.5 < 0.0001 6.1Writing 52.7 50.3 44.3 < 0.0001 4.6Reading Age (yrs, mo) 12.11^^ 12.3 11.5 < 0.0001 6.5Logical Problem-Solving* 71.2 69.1 65.6 0.030 1.4Composite Competency* 67.8^^^^ 63.7^ 57.4 < 0.0001 5.7Composite Cognitive Competency 61.2^^^ 57.9^ 50.0 < 0.0001 5.2Composite Social & Attitudinal Competency*
72.2^ 67.7 62.3 < 0.0001 3.8
* In these cases the squared model was a better fit. ** In this case the square-root model was a better fit.^ One fewer in this mean. ^^ Two fewer in this mean. ^^^ Three fewer in this mean. ^^^^ Four fewer in this mean.The mean scores are percentages, not raw scores. The highest scores for each competency are in bold type, the lowest initalics.
Parental satisfaction levels ranged from 22 percent of those whose children were making minimal or very
low progress, to 80 percent of those considered to be very good/excellent. Student progress at school, asrated by their teachers, was also substantially reflected in the teacher perceptions of children’s classbehaviour, and by the teacher’s relations with parents, and view of parental support for the child’slearning. This is described more fully in the next section.
We turn next to research question 9 for this phase:
What consistency is there between the child’s school progress and children’s judgments of their schoolexperiences, parental satisfaction with their child’s school, their involvement in the child’s school, andteacher perceptions of the child’s school engagement, their relations with the parents, and parentalsupport for the child?

Section Fifteen
Parental contact with the school
266
On the whole, we find that there is a consistency between the child’s school progress and child views of
their school experience (described in the previous section), parental satisfaction levels, and teacher’sperceptions of children’s classroom behaviour and attendance, the parental support for their learning, andthe teachers’ relations with their parents. Whether all 3 parties are aware of this consistency is another
matter. It does suggest that the relations between the triangle of parent, child, and teacher are important,and that when we look at classroom behaviour and engagement in work, it is useful to remember thatinteractions are involved, rather than one party holding sole responsibility.
Parental interest in change in their child’s class
Twenty-nine percent of the parents would like to make some changes to what happened in their child’sclass, and 9 percent were unsure. The pattern of desired changes was similar to that found when the study
children were aged 10. Changes to the class programme content or resources were mentioned by 13percent, the disciplinary climate, class composition or class size by 5–7 percent, and teacher-student orteacher-parent relations by 3–4 percent.
Parental involvement in their child’s school
Very few parents of children aged 12 were involved in voluntary classroom work. To some extent thisreflects parental employment patterns. Only 17 percent of the mothers of the children were not employed,
and a further 9 percent worked for 10 hours a week or less. Only 6 percent of the fathers were notemployed, with only 1 father working 10 hours a week or less.
Parent-teacher interviews were the main form of involvement that parents identified in response to anopen-ended question; this category was used more than the less formal “regular talks with teacher” at age10.
Table 160 Parental involvement at their child’s school ages 8, 10, and 12
Parental involvement↓
At age 8
(n=521)
%
At age 10
(n=505)
%
At age12
(n=496)
%
Parent-teacher interviews - - 65Voluntary work at school – classroom 42 17 8Attendance at school meetings and functions 8 21 26Regular talks with teacher 11 46 23Irregular contact/very little 23 14 19No involvement 9 7 10Voluntary work at school other than classroom 29 46 34Board of Trustees’/Parents’ Association member 13 13 8Paid work at school 4 5 3Partner is involved 2 1 -
Section Fifteen
Parental contact with the school
267
Maternal qualification levels made little difference to the attendance of parent-teacher interviews or
school meetings, being a member of the board of trustees or parents’ association, being employed at theschool, or having only irregular contact. However, children whose mothers had no qualification weremore likely to have a parent who had no involvement in their school (16 percent), and less likely to have
regular talks with their teacher (16 percent). There were consistent trends in relation to voluntary work inthe school, rising from 4 percent of the parents in families where the mother had no qualificationundertaking voluntary classroom work to 11 percent of the parents where the mother had a universityqualification, and for other voluntary work, from 21 percent to 47 percent.
Family income levels were less related to forms of parental involvement in schools, though parents fromthe very high-income families were more likely to do non-classroom-related voluntary work (43 percent),and parents from low-income families, less likely to attend school meetings (17 percent).
We analysed specific forms of parental involvement in school in relation to the study children’s
competency scores at age 12 (without including family income and maternal qualification into themodel), as well as the total number of their kinds of involvement.
We found only a few significant associations:
• Children whose parents said they did some voluntary work in the classroom had higher averagescores for mathematics (61 percent compared with 50 percent for those whose parents did not), and
for writing (57 percent compared with 51 percent).• However, children whose parents did other voluntary work for their child’s school also showed higher
scores for Communication, mathematics, writing, and Reading Age compared with those whose
parents did not. Only 12 percent of this group also undertook voluntary work in the classroom.• Children whose parents had little or no involvement in the school had lower scores for mathematics
after taking into account family income, but the association was reduced to an indicative level after
taking into account maternal qualification.
Summary
Teacher perspectiveSeventy-five percent of the study children were thought by their teachers to be getting very good supportor better from home for their work at school. Teachers’ views of the home support children were getting
reflected family income and maternal qualification levels, but not ethnicity. The proportion of studychildren getting maximum home support was much the same across differences in school deciles and inschool ownership.
One source of information teachers use in relation to gauging home support may be student achievement;
another may be whether they have regular contact with children’s parents. If children have very good ormaximum home support, teachers were more likely to think they could make a lot of difference to achild’s learning, and less likely to see difficulties in a child achieving their full potential in education.

Section Fifteen
Parental contact with the school
268
The parent that teachers usually interact with is the mother. At age 12, the study children’s teachers had
less regular contact with mothers than previously: they saw 27 percent of the mothers of the childrenregularly, compared with 38 percent at age 10, and 43 percent at age 8. They had never met either parentof 11 percent of the study children. Their patterns of contact with fathers, which were less frequent,
stayed much the same as they had since the children were age 8. The higher the level of maternalqualification the more likely the teacher was to see the mother regularly. Student gender, ethnicity, andfamily income were unrelated to how regularly teachers saw mothers, but they were more likely to have
no relationship with mothers from low-income homes. Twenty-eight percent of the parent-teacherrelationships were seen by the study children’s teachers as either being less than good, or non-existent.There are some broad decile-related differences, but on the whole, any differences in the parent-teacher
relationship most reflect differences in maternal qualification, and likely ease in formal educationalenvironments, and interest in education. There may be some confounding here with children’sachievement levels, since these tend to reflect maternal qualification levels at the extremes.
Parent perspective
Eighty-eight percent of the parents said they felt comfortable talking with their child’s teacher about theirchild. Seven percent said they had not met their child’s teacher. Fewer parents worked with teachers toresolve a child’s problem at age 12 – 43 percent compared with 50 percent at age 10, and 65 percent at
age 8. The problems were almost evenly divided between academic issues, and social-emotionalproblems. Academic issues were more likely to be raised by the parents of children who were makingbelow average progress (though not all of them); social-emotional problems were unrelated to children’sprogress.
Sixty-nine percent of the parents were satisfied with their child’s school progress, 20 percent had somereservations, and 10 percent were dissatisfied, a somewhat larger proportion than in previous ages.Parental satisfaction was unrelated to family characteristics. It was related to children not making
progress, or being bored. Parents who were dissatisfied or whose satisfaction was qualified were morelikely to work with teachers to solve problems, but be uncomfortable talking with their child’s teacherabout the child, and want to change something in the classroom. But a quarter of those who were satisfied
with their child’s progress would also like to change something in their child’s classroom. Twenty-ninepercent of the parents would like to make some change, and a further 9 percent were undecided. Themost frequent changes desired were changes to class programme or resources.
While children whose parents were dissatisfied with their progress 2 years earlier were more likely to
have lower average scores at age 12, there are low scorers in the group whose parents were satisfied withtheir progress, with just under half of those whose parents expressed satisfaction with their progressscoring below the median for the study measure of mathematics and the PAT Reading Comprehension
test at age 12. However, parental satisfaction levels are reasonably consistent with teacher judgments oftheir child’s overall achievement level.
Maternal qualification was unrelated to parental satisfaction with their child’s progress or comfort talkingto the child’s teacher, any joint-parent-teacher work in sorting out problems, talking to their child about
Section Fifteen
Parental contact with the school
269
school, or views of their child’s attitude to school. However, interest in changing something about their
child’s class was highest for families where the mother had a university qualification (38 percent), andlowest in those with no qualification.
Most parental involvement in their child’s school now consisted of parent-teacher interviews, with a thirdproviding some voluntary work, but only 8 percent now doing that in classrooms, down from 17 percent
at age 10, and 42 percent at age 8. Maternal qualification levels were related to voluntary work, in and outof classrooms. We found no associations in relation to the total number of kinds of parental involvementin a child’s school, and some associations between specific forms of parental involvement in their child’s
school suggesting that voluntary work in the school was associated with higher mathematics andCommunication scores for the children of parents who did this; and lack of involvement, with lowermathematics scores. Both these patterns suggest different signals about the importance of education tochildren, and parental comfort in the formal educational environment.
270
Section Sixteen
Secondary school choice, educational, andoccupational aspirations
In this section, we describe decision-making about the study children’s secondary school, and parent andchildren’s views of the reasons for the choice. We then draw this information together with informationon current school and parental satisfaction with their child’s education from previous sections to answerthe research question:
Do different population sub-groups show different patterns of school choice and satisfaction with theirchild’s school progress?
We finish by describing the parents’ aspirations for their children’s education, and the parents’ andchildren’s ideas for the children’s future occupations.
Choice of secondary school
At age 12, many of the study children were moving onto secondary school in the next school year. Only12 percent of the parents said the decision was yet to be made on what secondary school their 12-year-old
child would attend. This was related to year level, with 16 percent of the parents of Year 7 childrensaying they had not made the choice, compared with 9 percent of the Year 8 children’s parents.
Sixty-seven percent of the parents had made their decision, and 20 percent were considering 2 or moreschools. (This compares with 37 percent who had already made this decision when their child was aged5, 39 percent at age 6, 46 percent at age 8, and 55 percent at age 10.)
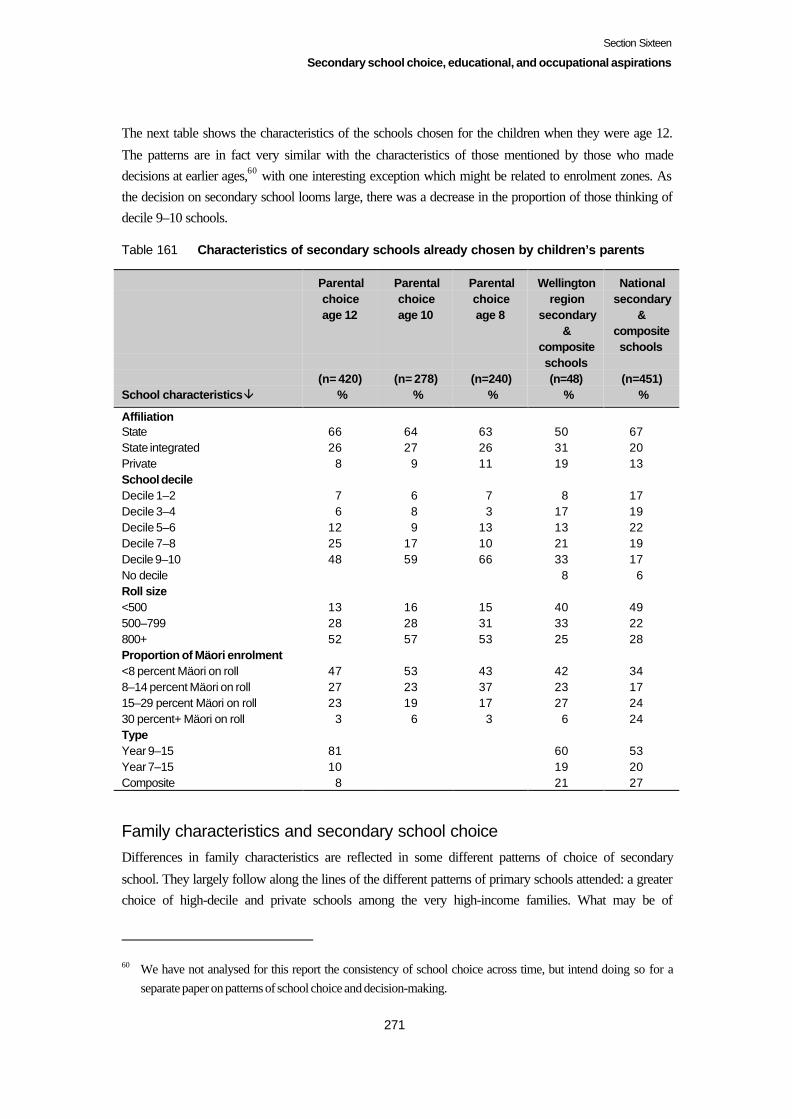
Section Sixteen
Secondary school choice, educational, and occupational aspirations
271
The next table shows the characteristics of the schools chosen for the children when they were age 12.
The patterns are in fact very similar with the characteristics of those mentioned by those who madedecisions at earlier ages,60 with one interesting exception which might be related to enrolment zones. Asthe decision on secondary school looms large, there was a decrease in the proportion of those thinking ofdecile 9–10 schools.
Table 161 Characteristics of secondary schools already chosen by children’s parents
School characteristics â
Parentalchoiceage 12
(n= 420) %
Parentalchoiceage 10
(n= 278) %
Parentalchoiceage 8
(n=240) %
Wellingtonregion
secondary&
compositeschools(n=48)
%
Nationalsecondary
&compositeschools
(n=451) %
AffiliationState 66 64 63 50 67State integrated 26 27 26 31 20Private 8 9 11 19 13School decileDecile 1–2 7 6 7 8 17Decile 3–4 6 8 3 17 19Decile 5–6 12 9 13 13 22Decile 7–8 25 17 10 21 19Decile 9–10 48 59 66 33 17No decile 8 6Roll size<500 13 16 15 40 49500–799 28 28 31 33 22800+ 52 57 53 25 28Proportion of Mäori enrolment<8 percent Mäori on roll 47 53 43 42 348–14 percent Mäori on roll 27 23 37 23 1715–29 percent Mäori on roll 23 19 17 27 2430 percent+ Mäori on roll 3 6 3 6 24TypeYear 9–15 81 60 53Year 7–15 10 19 20Composite 8 21 27
Family characteristics and secondary school choiceDifferences in family characteristics are reflected in some different patterns of choice of secondary
school. They largely follow along the lines of the different patterns of primary schools attended: a greaterchoice of high-decile and private schools among the very high-income families. What may be of
60 We have not analysed for this report the consistency of school choice across time, but intend doing so for aseparate paper on patterns of school choice and decision-making.
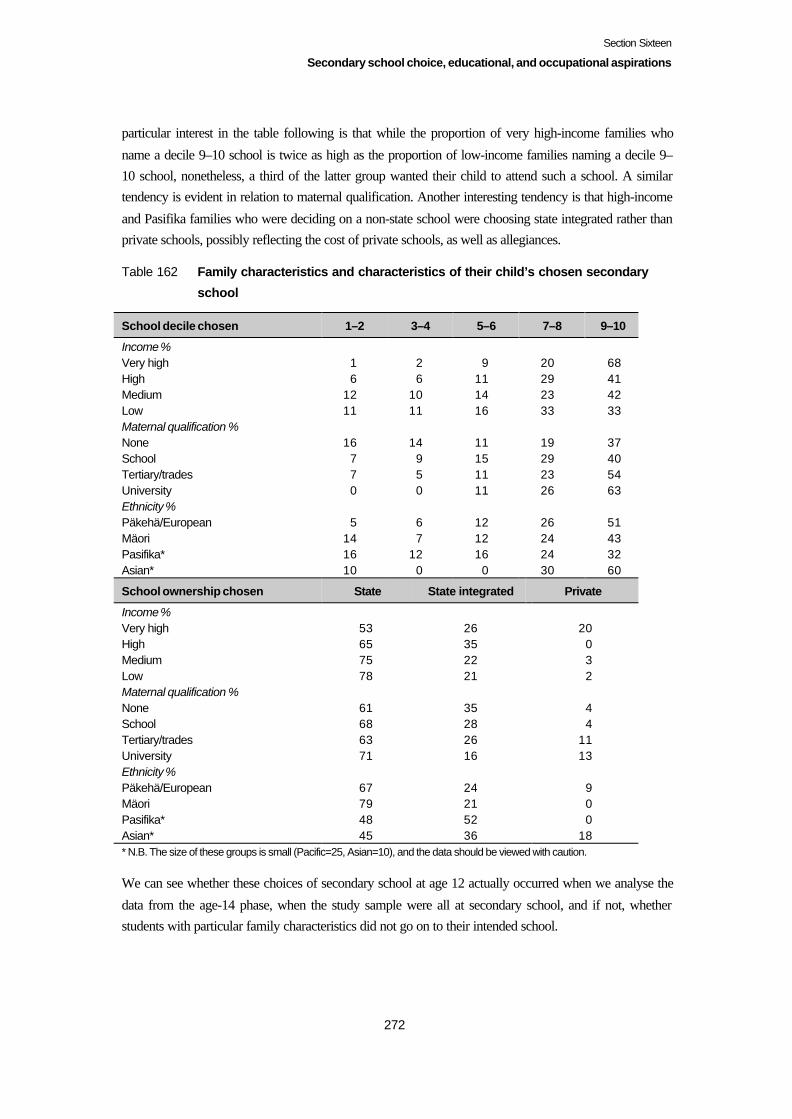
Section Sixteen
Secondary school choice, educational, and occupational aspirations
272
particular interest in the table following is that while the proportion of very high-income families who
name a decile 9–10 school is twice as high as the proportion of low-income families naming a decile 9–10 school, nonetheless, a third of the latter group wanted their child to attend such a school. A similartendency is evident in relation to maternal qualification. Another interesting tendency is that high-income
and Pasifika families who were deciding on a non-state school were choosing state integrated rather thanprivate schools, possibly reflecting the cost of private schools, as well as allegiances.
Table 162 Family characteristics and characteristics of their child’s chosen secondary
school
School decile chosen 1–2 3–4 5–6 7–8 9–10
Income %Very high 1 2 9 20 68High 6 6 11 29 41Medium 12 10 14 23 42Low 11 11 16 33 33Maternal qualification %None 16 14 11 19 37School 7 9 15 29 40Tertiary/trades 7 5 11 23 54University 0 0 11 26 63Ethnicity %Päkehä/European 5 6 12 26 51Mäori 14 7 12 24 43Pasifika* 16 12 16 24 32Asian* 10 0 0 30 60
School ownership chosen State State integrated Private
Income %Very high 53 26 20High 65 35 0Medium 75 22 3Low 78 21 2Maternal qualification %None 61 35 4School 68 28 4Tertiary/trades 63 26 11University 71 16 13Ethnicity %Päkehä/European 67 24 9Mäori 79 21 0Pasifika* 48 52 0Asian* 45 36 18* N.B. The size of these groups is small (Pacific=25, Asian=10), and the data should be viewed with caution.
We can see whether these choices of secondary school at age 12 actually occurred when we analyse the
data from the age-14 phase, when the study sample were all at secondary school, and if not, whetherstudents with particular family characteristics did not go on to their intended school.
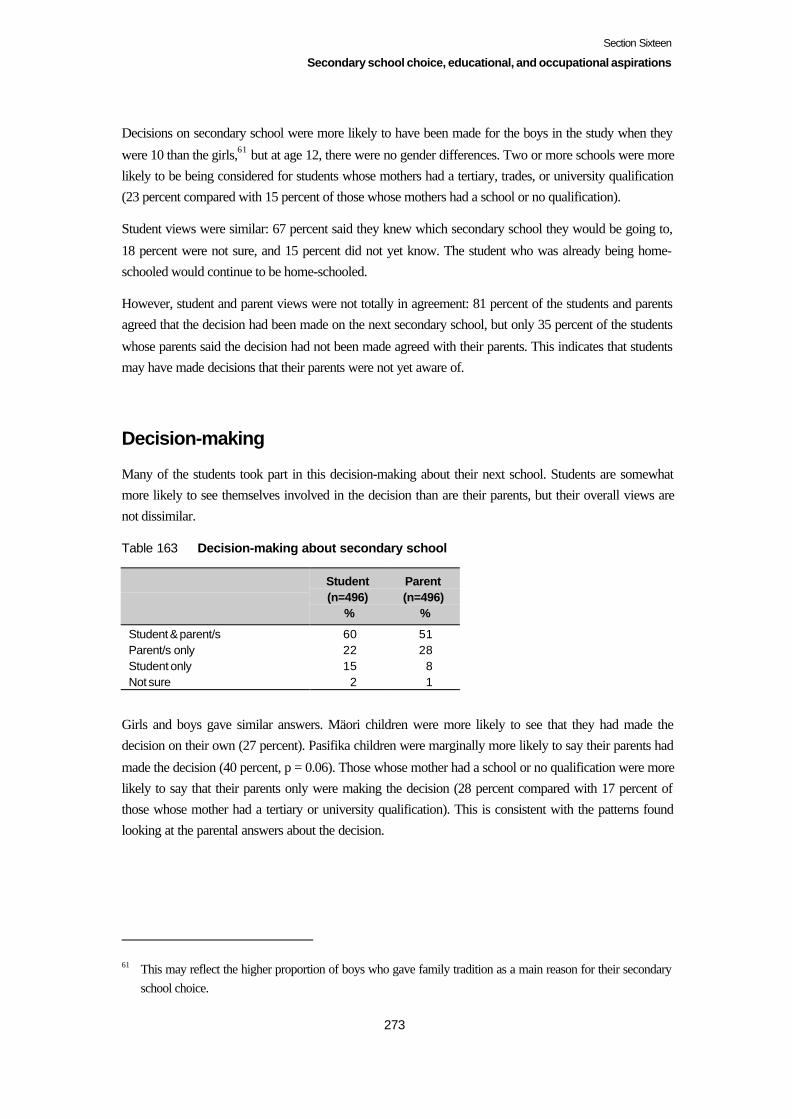
Section Sixteen
Secondary school choice, educational, and occupational aspirations
273
Decisions on secondary school were more likely to have been made for the boys in the study when they
were 10 than the girls,61 but at age 12, there were no gender differences. Two or more schools were morelikely to be being considered for students whose mothers had a tertiary, trades, or university qualification(23 percent compared with 15 percent of those whose mothers had a school or no qualification).
Student views were similar: 67 percent said they knew which secondary school they would be going to,
18 percent were not sure, and 15 percent did not yet know. The student who was already being home-schooled would continue to be home-schooled.
However, student and parent views were not totally in agreement: 81 percent of the students and parentsagreed that the decision had been made on the next secondary school, but only 35 percent of the students
whose parents said the decision had not been made agreed with their parents. This indicates that studentsmay have made decisions that their parents were not yet aware of.
Decision-making
Many of the students took part in this decision-making about their next school. Students are somewhatmore likely to see themselves involved in the decision than are their parents, but their overall views arenot dissimilar.
Table 163 Decision-making about secondary school
Student(n=496)
%
Parent(n=496)
%
Student & parent/s 60 51Parent/s only 22 28Student only 15 8Not sure 2 1
Girls and boys gave similar answers. Mäori children were more likely to see that they had made thedecision on their own (27 percent). Pasifika children were marginally more likely to say their parents had
made the decision (40 percent, p = 0.06). Those whose mother had a school or no qualification were morelikely to say that their parents only were making the decision (28 percent compared with 17 percent ofthose whose mother had a tertiary or university qualification). This is consistent with the patterns foundlooking at the parental answers about the decision.
61 This may reflect the higher proportion of boys who gave family tradition as a main reason for their secondaryschool choice.
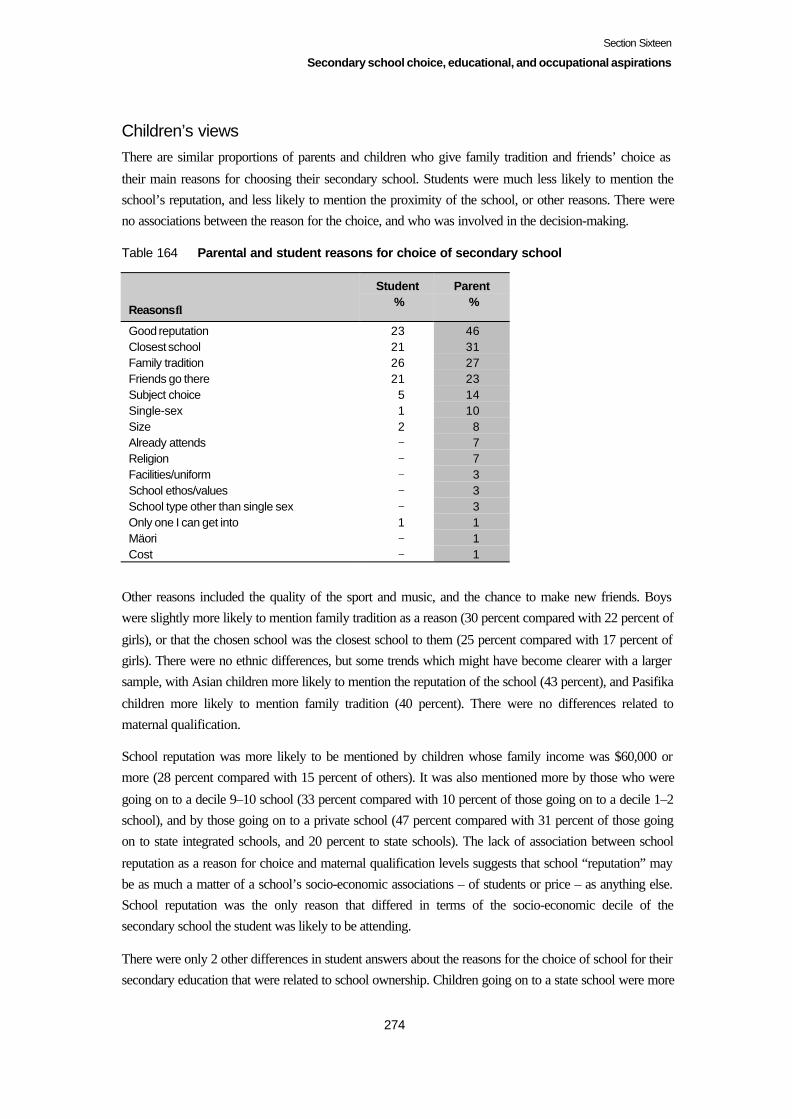
Section Sixteen
Secondary school choice, educational, and occupational aspirations
274
Children’s viewsThere are similar proportions of parents and children who give family tradition and friends’ choice as
their main reasons for choosing their secondary school. Students were much less likely to mention theschool’s reputation, and less likely to mention the proximity of the school, or other reasons. There wereno associations between the reason for the choice, and who was involved in the decision-making.
Table 164 Parental and student reasons for choice of secondary school
Reasons↓
Student %
Parent %
Good reputation 23 46Closest school 21 31Family tradition 26 27Friends go there 21 23Subject choice 5 14Single-sex 1 10Size 2 8Already attends − 7Religion − 7Facilities/uniform − 3School ethos/values − 3School type other than single sex − 3Only one I can get into 1 1Mäori − 1Cost − 1
Other reasons included the quality of the sport and music, and the chance to make new friends. Boyswere slightly more likely to mention family tradition as a reason (30 percent compared with 22 percent of
girls), or that the chosen school was the closest school to them (25 percent compared with 17 percent ofgirls). There were no ethnic differences, but some trends which might have become clearer with a largersample, with Asian children more likely to mention the reputation of the school (43 percent), and Pasifika
children more likely to mention family tradition (40 percent). There were no differences related tomaternal qualification.
School reputation was more likely to be mentioned by children whose family income was $60,000 ormore (28 percent compared with 15 percent of others). It was also mentioned more by those who were
going on to a decile 9–10 school (33 percent compared with 10 percent of those going on to a decile 1–2school), and by those going on to a private school (47 percent compared with 31 percent of those goingon to state integrated schools, and 20 percent to state schools). The lack of association between school
reputation as a reason for choice and maternal qualification levels suggests that school “reputation” maybe as much a matter of a school’s socio-economic associations – of students or price – as anything else.School reputation was the only reason that differed in terms of the socio-economic decile of thesecondary school the student was likely to be attending.
There were only 2 other differences in student answers about the reasons for the choice of school for theirsecondary education that were related to school ownership. Children going on to a state school were more
Section Sixteen
Secondary school choice, educational, and occupational aspirations
275
likely to mention that it was the closest school (30 percent compared with 6 percent of those going on to
state integrated schools, and 13 percent of those going on to private schools); and those going on to stateintegrated schools, more likely to mention religion (13 percent).
Looking at parental responses, there was only 1 significant difference related to maternal qualification,with friends’ decisions mentioned most for children whose mothers had a university qualification (31
percent). There are no family income-related differences for the major reasons for secondary schoolchoice, but some differences for minor reasons: single-sex schools were more likely to be chosen by highand very high-income families (13 percent compared with 6 percent of mid-low-income families), and
for girls (16 percent compared with 4 percent of boys). Religion was a reason for 1 percent of the low-income families, compared with 7 percent of others.
Twenty-seven percent of those who had chosen private schools, and 24 percent of those who had chosenstate integrated schools for their secondary education were already attending those schools.
The association between school reputation and school ownership found for the children’s answers was
not evident in the reasons parents gave for the choice of secondary school. Like the children though, therewere associations with proximity and religion, and associations with size and single-sex schooling. Stateschools were more likely to be chosen because they were the closest school (46 percent of these choices
compared with 16 percent of choices of state integrated schools, and 13 percent of choices of privateschools), and less likely to be chosen for their size (6 percent compared with 17 percent of choices ofstate integrated schools, and 13 percent of private schools), or offering single-sex schooling (8 percent of
choices, compared with 17 percent of choices of state integrated schools and 18 percent of privateschools). Choices of state integrated schools were most likely to include religion as a reason (27 percent).
There were few differences associated with school socio-economic decile. Those parents who hadmentioned a decile 1–2 school were just as likely as those who had mentioned a decile 9–10 school to
give as their reasons the reputation of the school, the fact that it was the closest school, family tradition, orsubject choice. This suggests either that parents are not operating with a single “league table” based ononly one kind of criterion – or that these reasons are operating within the range of schools they see as
available in terms of their location and the cost of transport. (We did not ask parents or students to list allthe schools they had considered, or ones they had wondered about but ruled out of consideration, whichwould give a richer context for understanding school choice and what affects it.) Single-sex was more
likely to be a reason for choosing a decile 9–10 school (17 percent) and religion, a decile 1–2 school (17percent).
Do different population sub-groups show different patterns of school choice and satisfaction with theirchild’s school progress?
The simple answer is yes, in terms of current school attendance and the characteristics of chosen future
secondary schools. The patterns are as one would expect: more attendance and choice of low-decileschools by low-income families and those where the mother has no qualification, and conversely, moreattendance at, and choice of, high-decile schools by high-income families and those where the mother has
a university qualification. But these differences are clearest at either end of the decile spectrum, and in
Section Sixteen
Secondary school choice, educational, and occupational aspirations
276
relation to private schools; there are no significant distinctions in the decile 5–8 schools.
Päkehä/European children were less likely to be looking ahead to decile 1–2 secondary schools, but therewere otherwise no significant ethnic differences in our sample.
On the whole, the existing differences in patterns of current school attendance related to differences offamily resources are set to continue in the secondary schools attended by the study children, though there
are not widespread differences related to family resources in the reasons given by parents and children.While there are some expected differences, they are not consistent across both parents and children, andare not clearcut in relation to school decile. School reputation was just as likely to be mentioned by
parents whose child was looking to attend a low-decile as a high-decile school. This may be related to thelack of difference in parental satisfaction levels with their child’s education among parents with differenteducational and income levels, and from different ethnic backgrounds.
Children were perhaps more conscious of assumptions that high socio-economic meant high quality, and
the differences between children’s and parents’ views, given that both played a part in most of thedecision-making about the next secondary school, certainly underlines the importance of finding outmore about how children see schools, and what they use as evidence about school quality.
Looking forward to secondary school
Fifty-nine percent of the 12-year-olds were looking forward to going to secondary school, and 26 percentfluctuated or were unsure. Only 15 percent were definitely not looking forward to moving on to
secondary school. Boys were more likely to vary in their feelings about going on to secondary school (67percent compared with 50 percent of girls), while girls were more definite that they were not lookingforward to secondary school (34 percent compared with 19 percent of boys). There were no differencesrelated to family resources.
The main reasons why students felt positive about going on to secondary school were that they felt readyfor a change (32 percent), they thought they would learn interesting things or have more challenge (25percent), and they looked forward to having more choice and being more independent (22 percent). Nine
percent mentioned friends who were already attending secondary school, and 5 percent, sportingopportunities.
Those who were not looking forward to secondary school, or who felt unsure about it, thought the workcould be too hard (18 percent), or they feared the social environment of secondary school (14 percent).Thirteen percent felt confused about moving on, and thought they did not know what to expect.
In the age-14 analysis, we will see how these feelings about secondary school are related to actualexperiences and engagement.
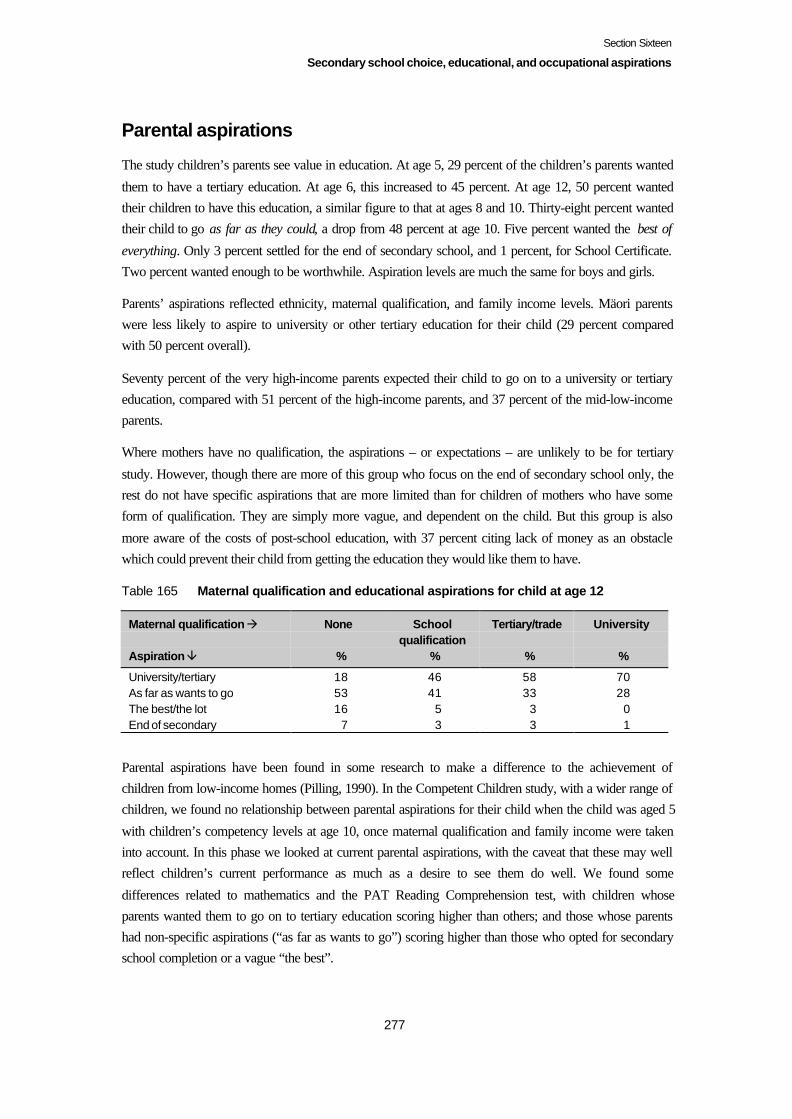
Section Sixteen
Secondary school choice, educational, and occupational aspirations
277
Parental aspirations
The study children’s parents see value in education. At age 5, 29 percent of the children’s parents wanted
them to have a tertiary education. At age 6, this increased to 45 percent. At age 12, 50 percent wantedtheir children to have this education, a similar figure to that at ages 8 and 10. Thirty-eight percent wantedtheir child to go as far as they could, a drop from 48 percent at age 10. Five percent wanted the best of
everything. Only 3 percent settled for the end of secondary school, and 1 percent, for School Certificate.Two percent wanted enough to be worthwhile. Aspiration levels are much the same for boys and girls.
Parents’ aspirations reflected ethnicity, maternal qualification, and family income levels. Mäori parentswere less likely to aspire to university or other tertiary education for their child (29 percent comparedwith 50 percent overall).
Seventy percent of the very high-income parents expected their child to go on to a university or tertiaryeducation, compared with 51 percent of the high-income parents, and 37 percent of the mid-low-incomeparents.
Where mothers have no qualification, the aspirations – or expectations – are unlikely to be for tertiary
study. However, though there are more of this group who focus on the end of secondary school only, therest do not have specific aspirations that are more limited than for children of mothers who have someform of qualification. They are simply more vague, and dependent on the child. But this group is also
more aware of the costs of post-school education, with 37 percent citing lack of money as an obstaclewhich could prevent their child from getting the education they would like them to have.
Table 165 Maternal qualification and educational aspirations for child at age 12
Maternal qualification à
Aspiration â
None
%
Schoolqualification
%
Tertiary/trade
%
University
%
University/tertiary 18 46 58 70As far as wants to go 53 41 33 28The best/the lot 16 5 3 0End of secondary 7 3 3 1
Parental aspirations have been found in some research to make a difference to the achievement ofchildren from low-income homes (Pilling, 1990). In the Competent Children study, with a wider range ofchildren, we found no relationship between parental aspirations for their child when the child was aged 5
with children’s competency levels at age 10, once maternal qualification and family income were takeninto account. In this phase we looked at current parental aspirations, with the caveat that these may wellreflect children’s current performance as much as a desire to see them do well. We found some
differences related to mathematics and the PAT Reading Comprehension test, with children whoseparents wanted them to go on to tertiary education scoring higher than others; and those whose parentshad non-specific aspirations (“as far as wants to go”) scoring higher than those who opted for secondaryschool completion or a vague “the best”.
Section Sixteen
Secondary school choice, educational, and occupational aspirations
278
Thirty-eight percent of the parents did not see anything getting in the way of their child having the
education they would like them to have. The main obstacles seen when the children were aged 12 was thechild’s own choice (24 percent), lack of money (21 percent, somewhat lower than the 30 percent at age10, and the 38 percent at age 8), and the child’s attitude or temperament (15 percent, an increase from 10
percent at age 10). Other obstacles mentioned by 2–3 percent each were limited skills or ability, health,peer pressure, possibility of early pregnancy, government policy changes, and curriculum or teachers whowere not responsive to the child’s needs. One percent mentioned a lack of choice in school or course.
There were no significant differences in these obstacles related to family characteristics (given that thereare some family-related differences in educational aspirations).
However, boys were somewhat more likely to be seen as making choices or having attitudes that couldstop them getting the kind of education their parent would like them to receive. Twenty-eight percent of
the boys were seen as potentially lacking the desire to go on to further education, compared with 20percent of the girls, and 20 percent as potentially lacking the attitude or temperament to continue,compared with 10 percent of the girls.62 This may be why parents were more likely to be saving for girls’education after primary school than boys’: 50 percent compared with 40 percent for boys.
Forty-five percent of the parents said they were saving for their child’s post-primary education, slightlyincreased from the 40 percent at ages 8 and 10. Three percent said that another relative was saving for thiseducation, slightly down on the 6 percent at age 10. Saving was most likely to be occurring for children
whose mothers had a university qualification (60 percent), and in the very high-income families (56percent compared with 26 percent of the low-income families). Pasifika and Asian families were alsomore likely to be saving for their child’s education after primary school (62 percent compared with 43percent of Päkehä/European and Mäori).
Occupational interests
The next table compares student and parent views of the kind of occupation the student might do when
they are an adult. Just under a fifth of the parents did not have a clear view of this, compared with 7percent of the students. Other than that, the overall views are similar, with the exception of sport: 22percent of the students thought they might earn money through sport when they were adult, comparedwith 6 percent of their parents.
62 That parents of some boys were seeing potential conflict between educational participation and the boys’ ownattitude to education is interesting, since this perspective is consistent with boys scoring less well on some of theclassroom behaviour items in the competency measures.
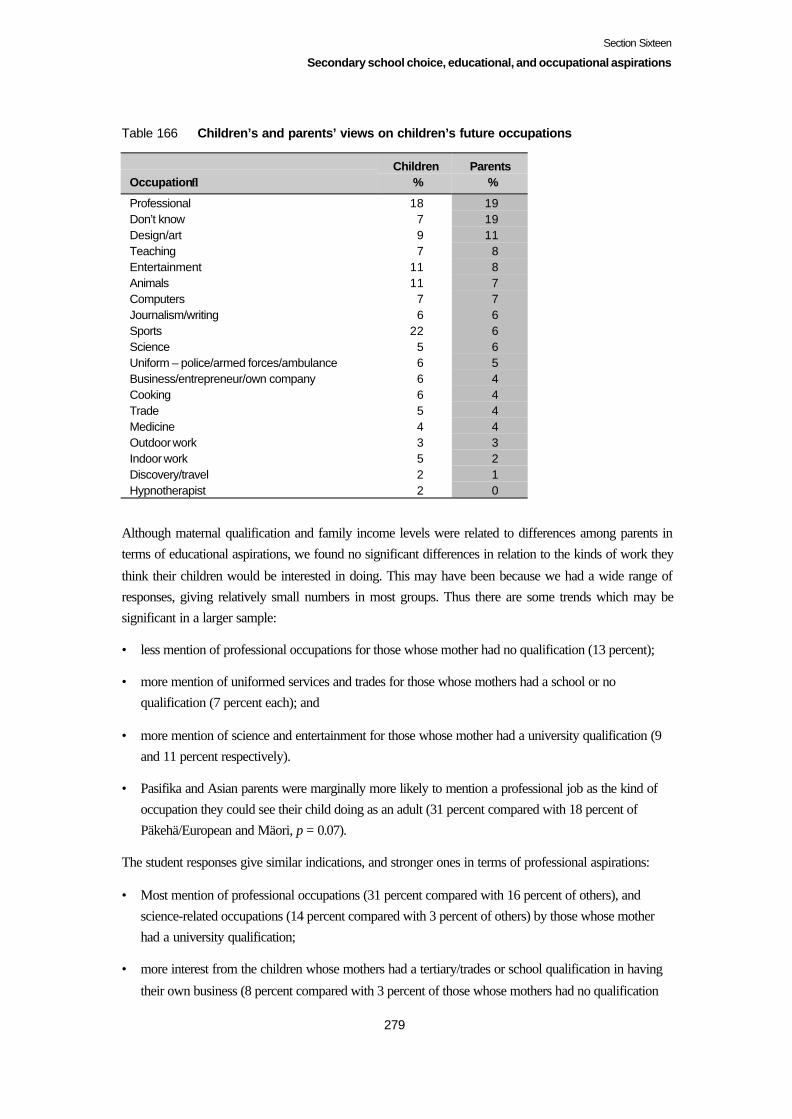
Section Sixteen
Secondary school choice, educational, and occupational aspirations
279
Table 166 Children’s and parents’ views on children’s future occupations
Occupation↓Children
%Parents
%
Professional 18 19Don’t know 7 19Design/art 9 11Teaching 7 8Entertainment 11 8Animals 11 7Computers 7 7Journalism/writing 6 6Sports 22 6Science 5 6Uniform – police/armed forces/ambulance 6 5Business/entrepreneur/own company 6 4Cooking 6 4Trade 5 4Medicine 4 4Outdoor work 3 3Indoor work 5 2Discovery/travel 2 1Hypnotherapist 2 0
Although maternal qualification and family income levels were related to differences among parents interms of educational aspirations, we found no significant differences in relation to the kinds of work they
think their children would be interested in doing. This may have been because we had a wide range ofresponses, giving relatively small numbers in most groups. Thus there are some trends which may besignificant in a larger sample:
• less mention of professional occupations for those whose mother had no qualification (13 percent);
• more mention of uniformed services and trades for those whose mothers had a school or noqualification (7 percent each); and
• more mention of science and entertainment for those whose mother had a university qualification (9and 11 percent respectively).
• Pasifika and Asian parents were marginally more likely to mention a professional job as the kind ofoccupation they could see their child doing as an adult (31 percent compared with 18 percent ofPäkehä/European and Mäori, p = 0.07).
The student responses give similar indications, and stronger ones in terms of professional aspirations:
• Most mention of professional occupations (31 percent compared with 16 percent of others), andscience-related occupations (14 percent compared with 3 percent of others) by those whose motherhad a university qualification;
• more interest from the children whose mothers had a tertiary/trades or school qualification in having
their own business (8 percent compared with 3 percent of those whose mothers had no qualification
Section Sixteen
Secondary school choice, educational, and occupational aspirations
280
or a university qualification), or working with animals (13 percent compared with 7 percent of theothers);
• most interest in the uniformed services from those whose mother had a school qualification (9 percentcompared with 4 percent of others); and
• least interest in teaching among children whose mothers had no qualification (2 percent comparedwith 8 percent of others).
In relation to family income levels, there were fewer differences:
• most interest in science among children from very high-income families (9 percent compared with 3percent of others);
• most interest in trades among children from low-income families (10 percent); and
• least interest in entertainment (4 percent) among children from low-income families.
Note that the differences that are evident are not in relation to the new careers opened up by ICT, massmedia, and the commercialisation of sport; they are there in terms of what children may be familiar with,what may be talked about in their own home or known to them through their relationships with familynetworks, rather than through the Internet.
Maternal qualification seems more relevant than family income to children’s thoughts – at the age of 12,before they may be aware of particular educational and cost pathways – about their future occupation.When we looked at whether these aspirations differed in relation to family income levels, we found only
3 trends – greater interest in professional occupations among those whose family incomes were high orvery high, consistent trends of interest increasing with income level for journalism/writing, anddecreasing for trades.
Thoughts of future occupations also show some gender differences. Girls were much more likely to beseen by their parents as interested in:
• teaching (15 percent compared with 2 percent of boys);• journalism or writing (9 percent compared with 3 percent of boys);• entertainment (13 percent compared with 3 percent of boys);
• animals (11 percent compared with 4 percent of boys); or• medicine (6 percent compared with 2 percent of boys).
Boys were much more likely to be seen as interested in:
• sports (9 percent compared with 3 percent of girls);• computers (11 percent compared with 3 percent of girls);
• uniformed forces (e.g. police, army) (8 percent compared with 1 percent of girls);• outdoor work (7 percent compared with no girls); or• trade (6 percent compared with 2 percent of girls).
Section Sixteen
Secondary school choice, educational, and occupational aspirations
281
Summary
Choice of secondary school
The choice of secondary school had been made or narrowed down to a selection from 2 or 3 schools for91 percent of the Year 8 students, and 84 percent of the Year 7 students. Twenty-seven percent of thosewho had chosen private schools, and 24 percent of those who had chosen state integrated schools for theirsecondary education were already attending these schools.
The school characteristics of the chosen schools are similar to those chosen by the study parents whentheir children were younger, but with a decrease in the proportion choosing decile 9–10 schools, and acorresponding increase in those choosing schools in the adjacent decile band, 7–8. This shift may reflectthe reality of school enrolment policies as the time to move on to secondary school became close.
Differentiation in the patterns of primary school attended in relation to family income and maternalqualification occurred largely at the ends of the socio-economic decile spectrum, and in relation to privateschools. The same pattern is evident in relation to choice of secondary school. However, there were still
substantial proportions of parents from low-income families and those where the mother had noqualification who wanted their child to attend a decile 9–10 school. Very high-income families decidingon a non-state school were likely to favour a private school; while high-income and Pasifika families
opted for state integrated schools. Two or more schools were being weighed against each other by ahigher proportion of families where the mother had a post-school qualification.
School decision-making was largely a shared process. However, students were more likely than theirparents to see this decision as shared between student and parents, or to see the decision on school as
theirs alone. It was more likely for parents to make the decision on their own for children whose motherdid not have a post-school qualification, and there were indications that this was also the case for Pasifikachildren.
Parents were twice as likely as age-12 children to mention a good reputation as one of their main reasons
for the secondary school they chose, and somewhat more likely to mention the proximity of the school.Just over a quarter of both parents and children mentioned family tradition, and just under a quarter ofeach group, the fact that friends would be or were already going there. There were no associationsbetween the reasons given, and who had been involved in the decision-making.
Maternal qualification levels were not reflected in the reasons given by children for the choice ofsecondary school, but family income was, with school reputation mentioned more by those with high orvery high-incomes. School reputation was also more likely to be mentioned as a major reason by those
going on to decile 9–10 schools: this was the only difference in reason related to school socio-economicdecile. Children going on to private schools were more likely to mention reputation; those going on tostate schools, proximity, and those going on to state integrated or private schools, religion.
Family income differences were not reflected in the most frequent reasons given by parents for choice of
secondary school, but were in relation to single-sex and religion. Single-sex schools were more likely to
Section Sixteen
Secondary school choice, educational, and occupational aspirations
282
be chosen for daughters than sons. Maternal qualification was largely unrelated to parental reasons,
though friends’ decisions were mentioned most for children whose mothers had a university qualification.Among parents, there was no association between school decile and reputation.
On the whole, the existing differences in patterns of current school attendance related to differences offamily resources are set to continue in the secondary schools attended by the study children, though there
are not substantial differences related to family resources in the reasons given by parents and children.While there are some expected differences, they are not consistent across both parents and children, andare not clearcut in relation to school decile.
Attitudes to secondary school
Fifty-nine percent of the 12-year-olds were looking forward to going to secondary school, and 26 percentfluctuated or were unsure. Only 15 percent were definitely not looking forward to moving on tosecondary school. Boys varied more in their feelings, but twice as many girls as boys were not lookingforward to secondary school.
The main reasons why students felt positive about going on to secondary school were that they felt readyfor a change, they thought they would learn interesting things or have more challenge, and they lookedforward to having more choice and being more independent (22 percent). Those who were not looking
forward to secondary school, or who felt unsure about it, thought the work could be too hard, or theyfeared the social environment of secondary school. Thirteen percent felt confused about moving on, andthought they did not know what to expect.
Parental aspirations
Half the parents now wanted their child to have a tertiary education, and only 4 percent settled forsecondary school only. Parents’ aspirations reflected ethnicity, maternal qualification, and family incomelevels. Mäori parents were less likely to aspire to university or other tertiary education for their child, as
were those where the mother had no qualification. The latter tended to be more aware of the costs of post-school education as a potential obstacle to their child getting the education they would like them to have.Otherwise, there were no differences in the obstacles seen that were related to differences in family
characteristics. The main obstacles foreseen were the child’s own choice, lack of money, and the child’sattitude or temperament, with boys more prone than girls to not realising their parental aspirationsthrough their own choice or attitude.
Aspirations for the children at age 12 that included tertiary education were highest among the very high-income families, and those where the mother had a university qualification.
Forty-five percent of the parents said they were saving for their child’s post-primary education, slightlyincreased from the 40 percent at ages 8 and 10. Saving was most likely to be occurring for childrenwhose mothers had a university qualification, and in the very high-income families, and in Pasifika andAsian families.
Section Sixteen
Secondary school choice, educational, and occupational aspirations
283
Occupational interestsAround a fifth of the study children were interested in professional occupations, and in sports. Only 7
percent of the children could not think of an occupation that they would like to do as an adult. Maternalqualification and family income levels were not significantly related to parental views of what wouldinterest their child, though there were some trends which are consistent: more mention of professional
occupations, and science for those whose mothers have a university qualification; science was also morelikely to be mentioned by children from very high-income homes. The uniformed services appealed moreto those whose mothers had a school-level qualification, or none. Gender made some difference to theparents’ ideas of future occupations, but not the children’s.
284
Section Seventeen
Fitting it all together
In this section, we present 2 sets of analysis which aim to bring as much of the data as possible into singlemodels, to form an overall picture of the main factors related to children’s performance at age 12, and toanswer the following research question:
What weight do these aspects of children’s lives play in their competencies compared to each other:
family resources, school experiences, home-based and out-of-school activities, and early-childhoodeducation experiences?
The purpose of models is to provide a picture which accounts for as much of the variance in children’sperformance as possible. Often, the final model selected is “parsimonious” in that it aims to include only
variables making a statistically significant improvement to the model. In this study, we have gathered asmuch material as feasible on the study children’s activities, home and school resources, and earlychildhood education. To some extent, this gives us an embarrassment of riches when it comes to the
building of “overall picture” models, not the least because many of the variables are likely to occurtogether in the reality of children’s lives, and their co-occurrence makes it difficult to clearly see theindividual contribution of each specific variable once the variables are included in the same model. The
variables that “survive” in a final model are likely to be ones which have greater association with theoutcome variable/s than others. Their presence has a double meaning, and needs interpretation both interms of the variable itself, and what it may be connected with. Often the type of variable – whether it is
continuous or categorical, and if the latter, how many possible values it has – has a bearing on whether itcan be used in particular kinds of analysis, and how it “behaves” in the analytical process.
We provide 2 kinds of model in this section, each providing a different vantage point on the relation ofthese key aspects of the study children’s lives with their competency levels at age 12. The first uses
ANOVA analysis, which is restricted to a single outcome variable with many explanatory variables. Thesecond uses structural equation modelling, which is not restricted to a single outcome variable, but wherethe restrictions on the variable types can be limiting.
Section Seventeen
Fitting it all together
285
Results from ANOVA analysis
To start our modelling process, we first compiled summary pictures of all the variables which seemedmost related to mathematics, the PAT Reading Comprehension test, Perseverance, Communication, and
Individual Responsibility scores at age 12. We based our selection on whether the ANOVA analysesshowed sizeable differences in percentage points scores between different categories of a variable. Thesesummary pictures are given in Appendix 4. We used the models developed in the previous Competent
Children phase as a starting point, and then added the “history factors” and the variables showing sizeabledifferences with age-12 competency levels, one at a time, to see whether the new variable added to thevariance accounted for by the model, and whether it displaced an existing variable in the model. We also
added family income and maternal qualification, and for mathematics and the PAT ReadingComprehension test, earlier levels of performance, at age 5 and age 10.
We have used ANOVA analysis (also known as regression using dummy variables) as it is the mostappropriate analysis for data where the outcome variable (achievement of some kind) is approximatelycontinuous, and the explanatory variables are measured on, at best, an ordered categorical scale.63
For each factor considered, we are posing the question, “Does this factor of interest show any signs ofRESIDUAL impact after accounting for all the other factors which we acknowledge are occurring in oursample at differing levels for the different children we have in each subgroup of the children relative to
the factor of interest?” The model in effect adjusts the individual scores to account for these differinglevels of each of the other factors before considering if there is or is not some impact associated with thefactor in question. This provides a stringent test for the significance of an association. If there is such
residual impact then this suggests the factor of interest could be “important” in some way. It iscontributing something extra beyond all of the other factors in explaining the variation seen in the wholesample. A corollary to this is the suggestion that when a factor shows no residual impact, its effects have
already been accounted for by the earlier factors (at least to the extent that what is left cannot bedifferentiated from “noise” or background variability). In such a case, for example for maternalqualification, the suggestion is that the earlier factors pick up a similar structure in the data as we see
associated with the maternal qualification factor. From this we may suggest that at least part of what it isthat the more educated mothers are supporting or encouraging for their children is being expressedthrough those earlier factors (such as some of the mathematics activities, for example). These situations
63 See the Glossary in Appendix 1 for an explanation of these terms. A paper on NZCER’s website, Somecomments on ANOVA and Regression Models, by David Harte, a consultant statistician from Statistics ResearchAssociates Ltd., discusses the different types of analysis possible in the family of linear models, the types of dataappropriate for use with such models, and demonstrates the equivalence of “analysis of variance” and “regressionwith dummy variables”.

Section Seventeen
Fitting it all together
286
give us some insight into what it is about having a highly-educated mother or about being in a high-income family that is contributing to a difference for these children.64
In the descriptions below, we give both the initial and final models, since the displacement of onevariable by another adds further insight into the underlying processes which are occurring over time, andallows a comparison with the models which accounted for the most variance in scores at age 10.
Mathematics
Our starting model accounted for 43.5 percent of the variance in age-12 mathematics scores. Five of the 8variables in this model are to do with actual use of mathematics at home 2 years earlier; the other 3 can bethought of as standing in their own right but also as “indicator” variables. Enjoyment of reading, for
example, signals the use of time to read (to gain knowledge, understanding, and make connections). Wefound at age 10 that the ECE socio-economic mix was linked to the incidence of the quality indicatorswhich were associated with children’s competency levels (Wylie and Thompson, 2003). That children
who always help out at home, rather than often, tells us something about the costs of lack of timeavailable for other activities which may better support or foster mathematics knowledge andunderstanding.
Table 167 Starting model for effects of variables in model accounting for variance in age
12 mathematics scores
Variable (comparison in brackets, first level given is “the best”)
p-value fromANOVA withthis variable
fitted last
Size oflargestcontrast
s.e. Prob forthis
contrast
ECE socio-economic status (middle-class vs. wide)(middle-class vs. low-to-middle)(middle-class vs. low)
< 0.0001 14.014.113.8
2.73.14.0
< 0.0001< 0.0001
0.0006Helps out at home at 10 (often cf. always) 0.014 9.9 3.0 0.001At home tells the time at 10 (yes cf. no) 0.024 8.5 3.7 0.024Child enjoys reading at 10 (yes cf. qualified yes)
(yes cf. no)0.001 9.8
7.83.23.1
0.0020.011
At home uses proportions (otherthan ½ and ¼) at 10
(yes cf. no) 0.021 6.3 2.7 0.021
Home maths – tables over 10 at 10 (yes cf. no) 0.0005 8.8 2.5 0.0005At home uses scales to weigh at 10 (yes cf. no) 0.0007 8.7 2.5 0.0007At home uses ruler to measure (yes cf. no) 0.032 7.2 3.4 0.032
After fitting current variables showing sizeable associations, most of the “history” factors, and variables
from earlier phases which had shown associations with children’s mathematics scores, and finally fitting
64 In this model, we are not attempting to fit interactions between all of the factors, because we would have manyempty cells. Such a model would require an estimate for each and every cell in the whole cross-classification, andwould be difficult to interpret.

Section Seventeen
Fitting it all together
287
family income and maternal qualification separately, we ended with the model below, which accounted
for 67.8 percent of the variance. Family income and maternal qualification did not displace any of thevariables or add to the model’s power. Thus, the categories of the variables below provide a guide to thekinds of experience which are associated with higher performance, whatever the level of family incomeand maternal qualification.

Section Seventeen
Fitting it all together
288
Table 168 Final model for effects of variables accounting for variance in age 12
mathematics scores
Variable (comparison in brackets)
p-valuefrom
ANOVAwith this
factorfitted last
Size oflargestcontrast(% pointscontrast)
s.e. ofthisdiff.
prob forthis
contrast
Length of ECE experience (≥48 mths cf. <24 mths)(≥48 mths cf. 24–35 mths)(≥48 mths cf. 36–47 mths)
p=0.012 10.15.47.2
3.42.92.9
0.0040.0660.013
Talks about fractions at age 6 (yes cf. no) p=0.002 6.0 2.0 0.003Computer ownership at age 8 (yes cf. no) p=< 0.0001 11.3 2.2 < 0.0001Home writing at age 8, does wordpuzzles
(yes cf. no) p=0.025 5.1 2.2 0.025
At home uses proportions (otherthan ½ and ¼) at 10
(yes cf. no) p=0.004 7.0 2.4 0.004
Home maths – tables over 10 at 10 (yes cf. no) p=< 0.0001 9.1 2.2 < 0.0001Lessons out of school in fine arts,age 10
(yes cf. no extra lessons)(yes cf. extra lessons but not in finearts)
p=0.002 21.018.4
5.85.7
0.00040.001
School socio-economic decile atage 10
(9–10 cf. 1–2)(7–8 cf. 1–2)(5–6 cf. 1–2)(3–4 cf. 1–2)
p=0.014 16.016.622.622.0
7.26.47.16.6
0.0290.0110.0020.001
At home at age 12 student can dowhat likes
(rarely/never cf. always)(usually cf. always)(rarely/never cf. occasionally)(usually cf. occasionally)
p=0.005 9.98.08.86.8
4.53.63.82.4
0.0290.0290.0220.006
At home at age 12 student feelsclose to family
(usually cf. always) p=0.005 11.6 3.0 0.0001
At school at age 12 the rules arefair
(usually cf. rarely/never)(occasionally cf. rarely/never)
p=0.018 14.711.9
5.86.1
0.0120.053
At school at age 12, could do betterif tried
(rarely/never cf. usually) p=0.037 8.5 3.4 0.012
Home maths at 12 uses ruler tomeasure accurately
(yes cf. no) p=0.0008 7.9 2.3 0.0008
Time spent on homework at age 12given it is done
(3.5–4hrs cf.0.5–1)(3.5–4hrs cf.1.25–2)(3.5–4hrs cf.2.25–3)(3.5–4hrs cf.6+)(4.5–5hrs cf.0.5–1)(4.5–5hrs cf.1.25–2)(4.5–5hrs cf.2.25–3)(4.5–5hrs cf.6+)
p=0.017 9.88.47.99.79.07.77.18.9
3.53.33.24.43.93.73.64.6
0.0060.0100.0140.0280.0220.0390.0520.054
Enjoys reading at age 12 (yes cf. no/not really)(yes cf. Qualified yes)
p=0.008 8.65.7
3.12.7
0.0060.038
History of school socio-economicdecile
(high cf. mostly 1–2)(medium cf. mostly 1–2)(mixed cf. mostly 1–2)
p=0.0008 34.531.928.6
7.77.06.6
< 0.0001< 0.0001< 0.0001
* “High” for history of school decile means high (9–10) at ages 5, 6 & 8 and high or medium (3–10) at age 12.* “Medium” for history of school decile means deciles 3–8 at ages 5, 8, 10, & 12.The mean scores are percentages, not raw scores. The differences between the categories for each variable in the model arethose which exist after allowing for all the other variables in the model.
Section Seventeen
Fitting it all together
289
In this model, we see all the main categories of the variables which could affect children’s age-12
performance: children’s activities – their use of mathematics, their enjoyment of reading, the time spenton homework, and whether the help they give at home takes time from other activities which involvemathematics more; family resources in the form of earlier computer ownership, the school socio-
economic decile (related to where families live as well as money available for transport), and in the formof the child’s sense of support at home; school resources related to socio-economic decile and how fairlystudents feel treated; and early childhood education, in the form of total length of experience.
Both previous and current experience and responses occur in this model. The continuing contribution of
ECE and early knowledge of fractions (proportions and patterns) to mathematics performance at age 12 isconsistent with our finding (Section Three) on the importance of mathematics and related knowledge andpractice occurring early in children’s lives.
Model with age-10 score for mathematicsWhen we added age-10 scores for mathematics to the model,65 4 of the variables in the model weredisplaced, indicating that they were subsumed in age-10 mathematics performance. They were:
• length of early childhood education;• home writing at age 8 – word puzzles,
• uses proportions (other than ½ and ¼) at home at age 10; and• fine arts lessons out of school at age 10.
The size of the contrasts between different categories of the variables was also reduced. This modelaccounted for 71.4 percent of the variance in children’s mathematics scores at age 12.
When we added age 5 scores for mathematics to the model, 3 of the variables were displaced. The length
of early childhood education was not one of them, which is consistent with the 1-factor ANOVA analysisshowing it making a contribution to age-12 scores. The displaced variables were:
• school socio-economic decile at age 10;• home writing at age 8 – word puzzles; and• student feels they could do better at school if they tried.
This model accounted for 67.6 percent of the variance, somewhat less than the model which includedage-10 performance.
65 The variables in the existing model can be thought of as “fixed” effects (one either has talked about fractions orone has not); the scores on the competency measures are snapshot measures of something which they may notexactly measure or capture, and so they can be thought of as “random”. Mixing fixed and random effects wouldpose problems if we were trying to provide an exact estimate of the effects of the model, but we have used these“mixed” models to add further insight into our interpretation of the processes that are at work in children’sperformance.
Section Seventeen
Fitting it all together
290
Reading comprehensionThe model which accounted for the highest proportion of variance in the children’s PAT ReadingComprehension scores at age 10 (53.9 percent) included these variables:
Homework (yes cf. no)Early childhood education socio-economic mix (middle class cf. low)TV watching at age 10 (none cf. 2–3 hours daily)Parental support for class (fantastic cf. little)Child feels they are doing well at school through solving aproblem by working hard
(agree cf. not sure)
Child enjoys reading (yes cf. qual. yes or no)Child read library books at age 6 (yes cf. no)ECS was a print-saturated environment (4th quartile rating cf. 1 st quartile
rating)At home uses proportions other than ½ and ¼ (yes cf. no)Home maths – tables over 10 (yes cf. no)
These variables accounted for 48.2 percent of the age-12 PAT Reading Comprehension test scores.
After working through all the age-12 variables that showed a sizeable association, the history factors, andvariables from earlier phases which had shown associations, family income, and maternal qualification,
the final model (below) accounted for 61.8 percent of the variance in age-12 PAT ReadingComprehension test scores.
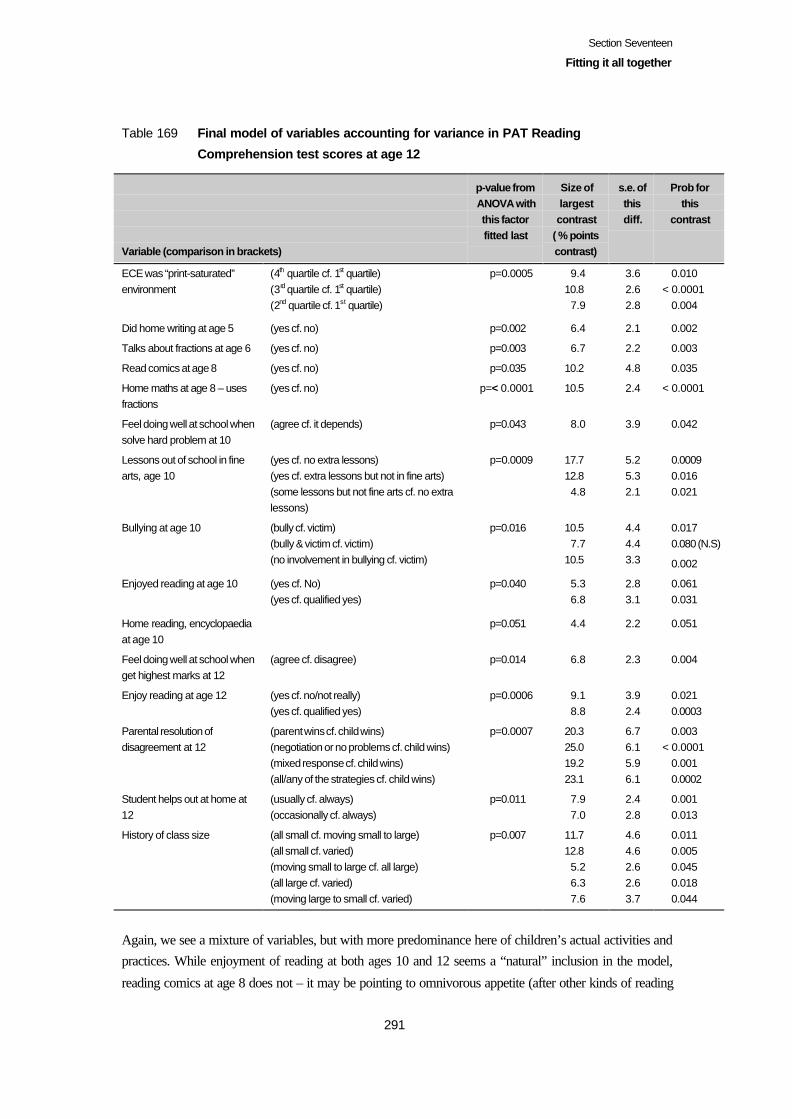
Section Seventeen
Fitting it all together
291
Table 169 Final model of variables accounting for variance in PAT Reading
Comprehension test scores at age 12
Variable (comparison in brackets)
p-value fromANOVA withthis factorfitted last
Size oflargestcontrast
( % pointscontrast)
s.e. ofthisdiff.
Prob forthis
contrast
ECE was “print-saturated”environment
(4th quartile cf. 1st quartile)(3rd quartile cf. 1st quartile)(2nd quartile cf. 1st quartile)
p=0.0005 9.410.87.9
3.62.62.8
0.010< 0.0001
0.004
Did home writing at age 5 (yes cf. no) p=0.002 6.4 2.1 0.002
Talks about fractions at age 6 (yes cf. no) p=0.003 6.7 2.2 0.003
Read comics at age 8 (yes cf. no) p=0.035 10.2 4.8 0.035
Home maths at age 8 – usesfractions
(yes cf. no) p=< 0.0001 10.5 2.4 < 0.0001
Feel doing well at school whensolve hard problem at 10
(agree cf. it depends) p=0.043 8.0 3.9 0.042
Lessons out of school in finearts, age 10
(yes cf. no extra lessons)(yes cf. extra lessons but not in fine arts)(some lessons but not fine arts cf. no extralessons)
p=0.0009 17.712.84.8
5.25.32.1
0.00090.0160.021
Bullying at age 10 (bully cf. victim)(bully & victim cf. victim)(no involvement in bullying cf. victim)
p=0.016 10.57.7
10.5
4.44.43.3
0.0170.080 (N.S)
0.002
Enjoyed reading at age 10 (yes cf. No)(yes cf. qualified yes)
p=0.040 5.36.8
2.83.1
0.0610.031
Home reading, encyclopaediaat age 10
p=0.051 4.4 2.2 0.051
Feel doing well at school whenget highest marks at 12
(agree cf. disagree) p=0.014 6.8 2.3 0.004
Enjoy reading at age 12 (yes cf. no/not really)(yes cf. qualified yes)
p=0.0006 9.18.8
3.92.4
0.0210.0003
Parental resolution ofdisagreement at 12
(parent wins cf. child wins)(negotiation or no problems cf. child wins)(mixed response cf. child wins)(all/any of the strategies cf. child wins)
p=0.0007 20.325.019.223.1
6.76.15.96.1
0.003< 0.0001
0.0010.0002
Student helps out at home at12
(usually cf. always)(occasionally cf. always)
p=0.011 7.97.0
2.42.8
0.0010.013
History of class size (all small cf. moving small to large)(all small cf. varied)(moving small to large cf. all large)(all large cf. varied)(moving large to small cf. varied)
p=0.007 11.712.85.26.37.6
4.64.62.62.63.7
0.0110.0050.0450.0180.044
Again, we see a mixture of variables, but with more predominance here of children’s actual activities andpractices. While enjoyment of reading at both ages 10 and 12 seems a “natural” inclusion in the model,
reading comics at age 8 does not – it may be pointing to omnivorous appetite (after other kinds of reading
Section Seventeen
Fitting it all together
292
have been tried in the model). There appears to be a “floor” in terms of ECE quality of being “print-
saturated” which continues to have associations with children’s reading comprehension – 7 years later.Early use of symbols – through writing and fractions – is also important, perhaps pointing to theimportance of a solid basis for later reading for understanding. Talking of fractions involves making
comparisons and analytical thought. Fine arts lessons occur in the models for both readingcomprehension and mathematics, suggesting value not just in eye-hand co-ordination (which also occursin sport), but in the conceptual work that occurs in painting and drawing. However, there is also anindicative association favouring other kinds of lessons out of school compared to having none.
It is interesting that a view of doing well at school based on solving problems leaves a trace from age 10,but that the association between current views of how one does well are related to getting the highestmarks, not problem-solving. This may simply indicate a greater use of marks in the students’ classes atage 12, and greater student awareness of what marks might mean.
Children’s experiences of home are not related here, but their winning disputes with parents is, perhapsindicating where children’s (and parents’) energy goes, rather than in reading, the use of symbols, the useof dialogue. Being at the other end of power relations also leaves traces. The inclusion of bullying
experiences 2 years earlier is consistent with the analysis reported in Section Eleven, that this is oneexperience which can leave clear marks.
School resources are limited to the history of class size – suggesting that children whose class sizes variedtended to have lower average scores than others, and that perhaps other factors (for example, movements
between schools) are involved in each of the categories (since there is no difference after all the othervariables in the table have been accounted for between children whose class size has always been smalland those who have always been in large classes). It is interesting that the associations with school decile
evident for mathematics are not evident for reading comprehension. We have seen in the analysis ofquartile movements across time that it is much harder for children from low-income homes or whosemothers have no qualification to progress from the bottom quartile for mathematics, with an indication
that it is also harder for those in these categories to retain performance above the median. Perhaps what ishappening for students in the decile 1–2 schools is that their teachers are working with a critical mass ofstudents struggling with mathematics, rather than having a wider spread of performance to work with,and for whom mathematics may seem less relevant.
Model with age-10 score for reading comprehensionIncluding children’s age-10 PAT Reading Comprehension test score in the model subsumed a largenumber of the variables included in the final model above:
• Feel doing well at school when get highest marks at 12
• Feel doing well at school when solve hard problem at 10• ECE was “print-saturated” environment• Parental resolution of disagreement at 12
• Bullying at age 10• Home reading, encyclopaedia at age 10
Section Seventeen
Fitting it all together
293
• Read comics at age 8
• Enjoyed reading at age 10• Did home writing at age 5• Enjoys reading at age 12.
None of the variables that remained were about reading itself. They were the fraction use at earlier ages,
fine arts lessons, whether children always helped out at home, and the history of class size. The modelwhich included age 10 scores accounted for 74.5 percent of the variance in age-12 PAT ReadingComprehension test scores. The size of the contrasts was reduced for the fraction and fine arts variables.
Models with age 5 and age-8 scoresIncluding age 5 scores for early literacy into the final model did not result in the displacement of any ofthe existing variables, and the size of the contrasts between categories of the variables remained much thesame. The proportion of variance accounted for rose slightly to 64.3 percent. So the variables in the final
model for age-12 PAT Reading Comprehension test were making some contribution past age 5, but mosthad been subsumed by age 10. We used the same model again but included age-8 PAT ReadingComprehension test scores to see when these variables might have become less important for later
performance. Most of those that were no longer evident at age 10 had been displaced by age-8 scores(this model accounted for 61.1 percent of the variance in age-12 scores).
CommunicationOur models for the social and attitudinal competencies account for much less of the variance in children’s
scores than those for mathematics and reading comprehension. We used the age-10 model which hadaccounted for 47.4 percent of the variance in children’s age-10 Communication scores, taking outmaternal qualification and the ECE socio-economic mix to include at the end of the model development.The resulting model accounted for 22 percent of the variance in children’s age-12 Communication scores.
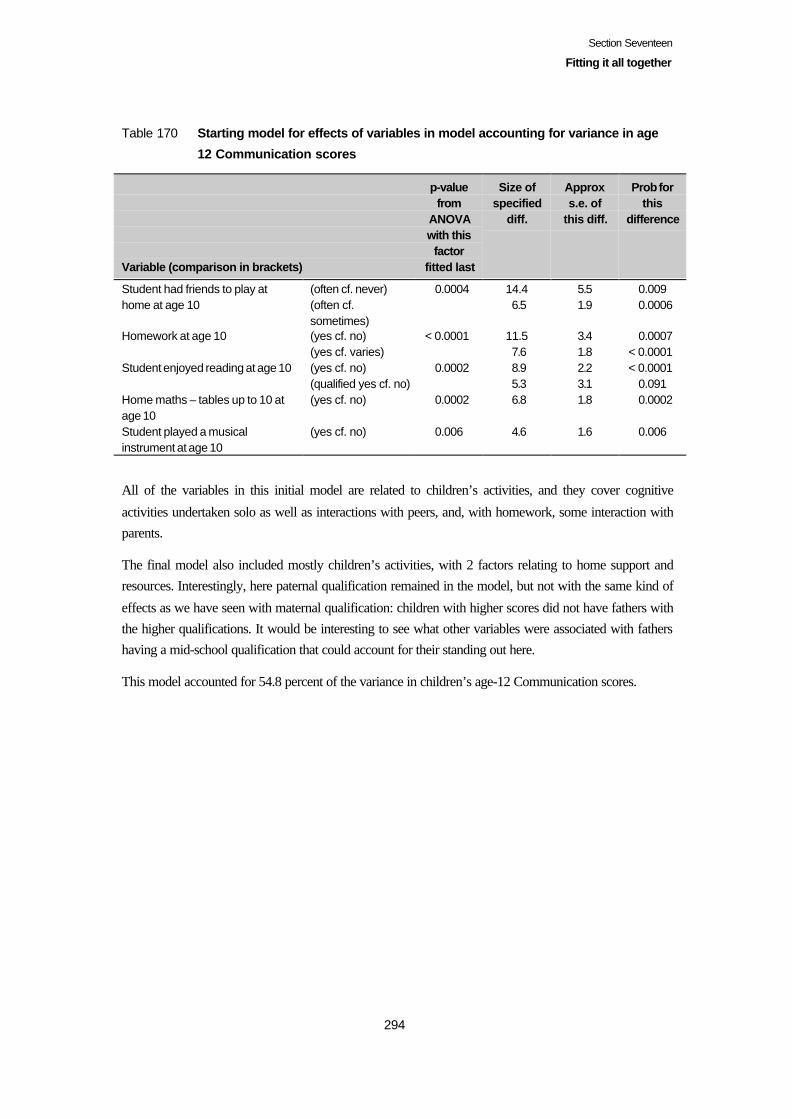
Section Seventeen
Fitting it all together
294
Table 170 Starting model for effects of variables in model accounting for variance in age
12 Communication scores
Variable (comparison in brackets)
p-valuefrom
ANOVAwith this
factorfitted last
Size ofspecified
diff.
Approxs.e. of
this diff.
Prob forthis
difference
Student had friends to play athome at age 10
(often cf. never)(often cf.sometimes)
0.0004 14.46.5
5.51.9
0.0090.0006
Homework at age 10 (yes cf. no)(yes cf. varies)
< 0.0001 11.57.6
3.41.8
0.0007< 0.0001
Student enjoyed reading at age 10 (yes cf. no)(qualified yes cf. no)
0.0002 8.95.3
2.23.1
< 0.00010.091
Home maths – tables up to 10 atage 10
(yes cf. no) 0.0002 6.8 1.8 0.0002
Student played a musicalinstrument at age 10
(yes cf. no) 0.006 4.6 1.6 0.006
All of the variables in this initial model are related to children’s activities, and they cover cognitive
activities undertaken solo as well as interactions with peers, and, with homework, some interaction withparents.
The final model also included mostly children’s activities, with 2 factors relating to home support andresources. Interestingly, here paternal qualification remained in the model, but not with the same kind of
effects as we have seen with maternal qualification: children with higher scores did not have fathers withthe higher qualifications. It would be interesting to see what other variables were associated with fathershaving a mid-school qualification that could account for their standing out here.
This model accounted for 54.8 percent of the variance in children’s age-12 Communication scores.
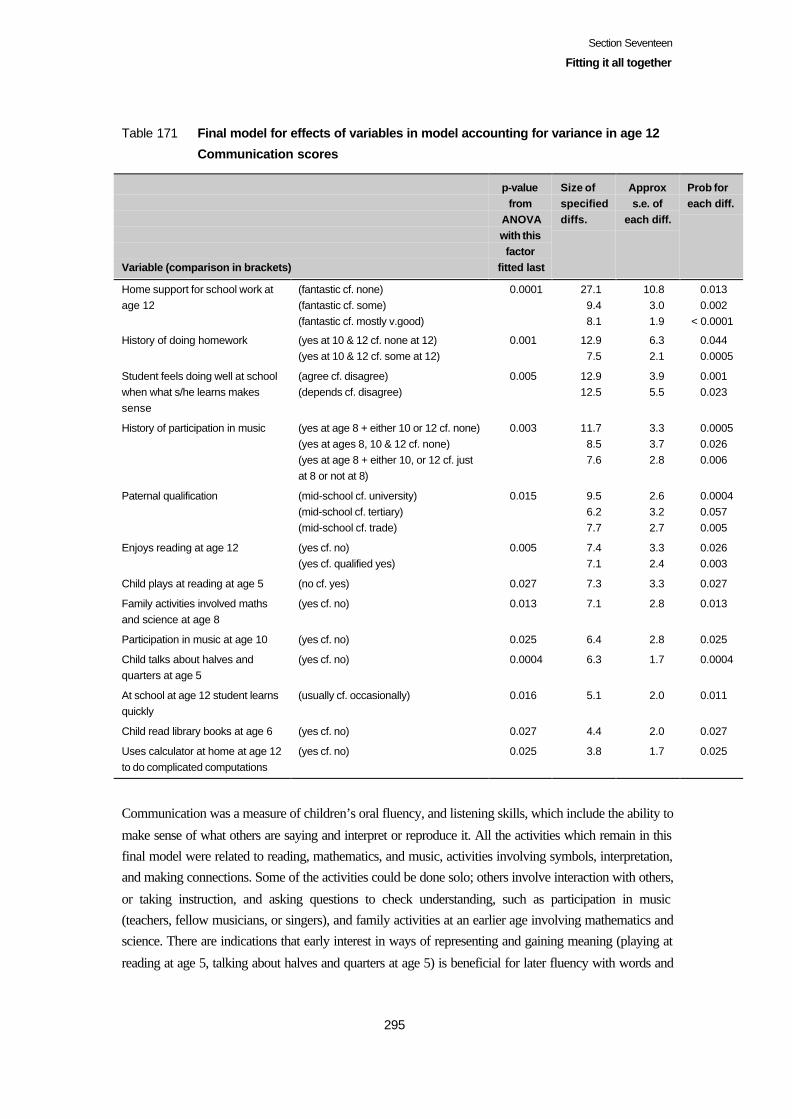
Section Seventeen
Fitting it all together
295
Table 171 Final model for effects of variables in model accounting for variance in age 12
Communication scores
Variable (comparison in brackets)
p-valuefrom
ANOVAwith thisfactor
fitted last
Size ofspecifieddiffs.
Approxs.e. of
each diff.
Prob foreach diff.
Home support for school work atage 12
(fantastic cf. none)(fantastic cf. some)(fantastic cf. mostly v.good)
0.0001 27.19.48.1
10.83.01.9
0.0130.002
< 0.0001
History of doing homework (yes at 10 & 12 cf. none at 12)(yes at 10 & 12 cf. some at 12)
0.001 12.97.5
6.32.1
0.0440.0005
Student feels doing well at schoolwhen what s/he learns makessense
(agree cf. disagree)(depends cf. disagree)
0.005 12.912.5
3.95.5
0.0010.023
History of participation in music (yes at age 8 + either 10 or 12 cf. none)(yes at ages 8, 10 & 12 cf. none)(yes at age 8 + either 10, or 12 cf. justat 8 or not at 8)
0.003 11.78.57.6
3.33.72.8
0.00050.0260.006
Paternal qualification (mid-school cf. university)(mid-school cf. tertiary)(mid-school cf. trade)
0.015 9.56.27.7
2.63.22.7
0.00040.0570.005
Enjoys reading at age 12 (yes cf. no)(yes cf. qualified yes)
0.005 7.47.1
3.32.4
0.0260.003
Child plays at reading at age 5 (no cf. yes) 0.027 7.3 3.3 0.027
Family activities involved mathsand science at age 8
(yes cf. no) 0.013 7.1 2.8 0.013
Participation in music at age 10 (yes cf. no) 0.025 6.4 2.8 0.025
Child talks about halves andquarters at age 5
(yes cf. no) 0.0004 6.3 1.7 0.0004
At school at age 12 student learnsquickly
(usually cf. occasionally) 0.016 5.1 2.0 0.011
Child read library books at age 6 (yes cf. no) 0.027 4.4 2.0 0.027
Uses calculator at home at age 12to do complicated computations
(yes cf. no) 0.025 3.8 1.7 0.025
Communication was a measure of children’s oral fluency, and listening skills, which include the ability to
make sense of what others are saying and interpret or reproduce it. All the activities which remain in thisfinal model were related to reading, mathematics, and music, activities involving symbols, interpretation,and making connections. Some of the activities could be done solo; others involve interaction with others,
or taking instruction, and asking questions to check understanding, such as participation in music(teachers, fellow musicians, or singers), and family activities at an earlier age involving mathematics andscience. There are indications that early interest in ways of representing and gaining meaning (playing at
reading at age 5, talking about halves and quarters at age 5) is beneficial for later fluency with words and
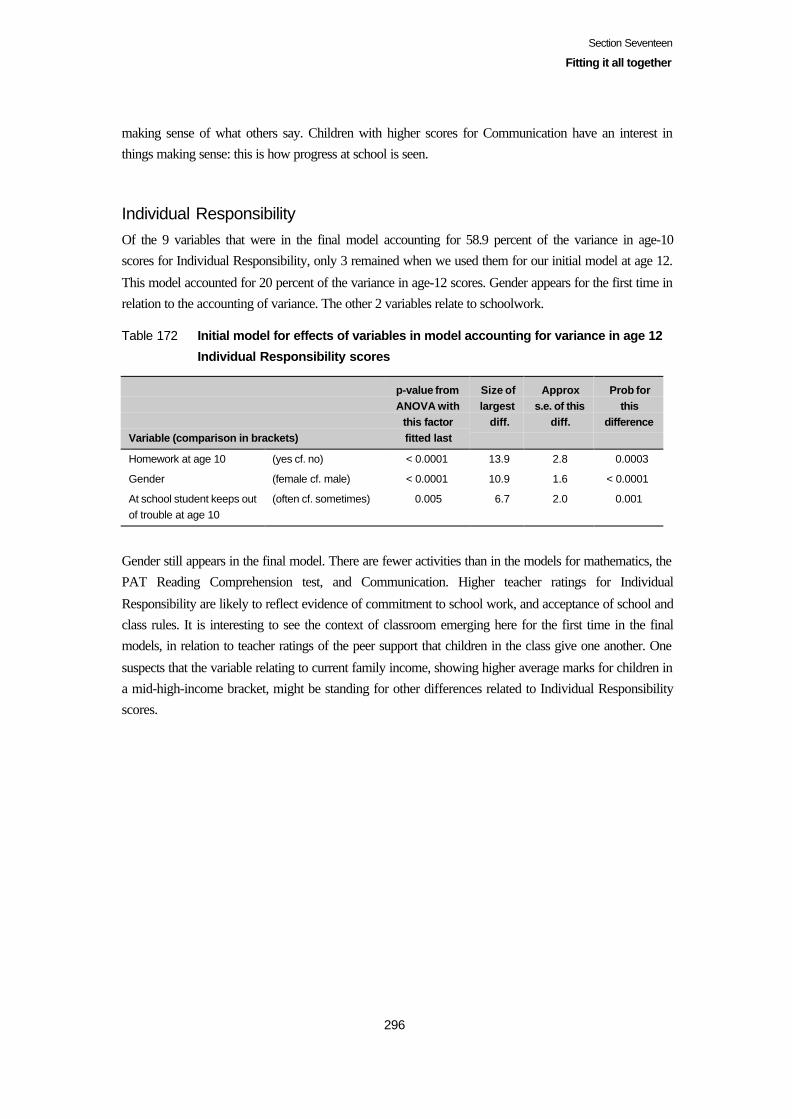
Section Seventeen
Fitting it all together
296
making sense of what others say. Children with higher scores for Communication have an interest inthings making sense: this is how progress at school is seen.
Individual ResponsibilityOf the 9 variables that were in the final model accounting for 58.9 percent of the variance in age-10scores for Individual Responsibility, only 3 remained when we used them for our initial model at age 12.
This model accounted for 20 percent of the variance in age-12 scores. Gender appears for the first time inrelation to the accounting of variance. The other 2 variables relate to schoolwork.
Table 172 Initial model for effects of variables in model accounting for variance in age 12
Individual Responsibility scores
Variable (comparison in brackets)
p-value fromANOVA with
this factorfitted last
Size oflargest
diff.
Approxs.e. of this
diff.
Prob forthis
difference
Homework at age 10 (yes cf. no) < 0.0001 13.9 2.8 0.0003
Gender (female cf. male) < 0.0001 10.9 1.6 < 0.0001
At school student keeps outof trouble at age 10
(often cf. sometimes) 0.005 6.7 2.0 0.001
Gender still appears in the final model. There are fewer activities than in the models for mathematics, thePAT Reading Comprehension test, and Communication. Higher teacher ratings for Individual
Responsibility are likely to reflect evidence of commitment to school work, and acceptance of school andclass rules. It is interesting to see the context of classroom emerging here for the first time in the finalmodels, in relation to teacher ratings of the peer support that children in the class give one another. One
suspects that the variable relating to current family income, showing higher average marks for children ina mid-high-income bracket, might be standing for other differences related to Individual Responsibilityscores.

Section Seventeen
Fitting it all together
297
Table 173 Final model for effects of variables in model accounting for variance in age 12
Individual Responsibility scores
Variable (comparison in brackets)
p-valuefrom
ANOVAwith thisfactor
fitted last
Size ofspecifieddifference
Approxs.e. ofeachdiff.
Prob foreach
difference
History of homework (yes at 10 & 12 cf. no at 12)(yes, varies or no at 10 & yes orvaries at 12 cf. no at 12)(yes at 10 & 12 cf. yes or variesat 12, regardless of 10)
< 0.0001 26.619.2
7.5
5.35.5
2.1
< 0.00010.0006
0.0004
Home maths, plays board gamesat age 8
(yes cf. no) 0.031 18.2 8.4 0.031
Gender (female cf. male) 0 10.6 1.7 < 0.0001
Home support for schoolwork (fantastic cf. infrequent)(fantastic cf. some)(fantastic cf. mostly v.good)
0.020 9.69.24.5
7.62.81.9
0.210.0010.019
Class Peer Support (fantastic cf. none or infrequent)(fantastic cf. sometimes)(mostly v.good cf. none orinfrequent)
(mostly v.good cf. sometimes)
0.003 9.19.47.77.9
5.93.65.62.3
0.120.0090.170.0008
Family activities maths andscience related at age 8
(yes cf. no) 0.0005 9.0 2.6 0.0005
Family Income at age 12 (>$50K–70K cf. >$30K–50K)(>$50K–70K cf. >$70K)(>$50K–70K cf. up to $30K)
0.053 6.95.64.4
2.82.32.7
0.0140.0150.11
At school, rules are fair (usually cf. rarely/never)(usually cf. occasionally)
0.064 10.74.2
6.82.2
0.120.052
At school teacher treats studentfairly
(usually cf. occasionally) 0.058 5.3 2.2 0.018
Read library books at age 6 (yes cf. no) 0.060 3.7 2.0 0.060
PerseveranceOf the 13 variables in the final model accounting for 50.5 percent of the variance in age-10 Perseverance
scores, only 6 remained in the initial model for age 12, accounting for 29.4 percent of the variance in age-12 Perseverance scores.
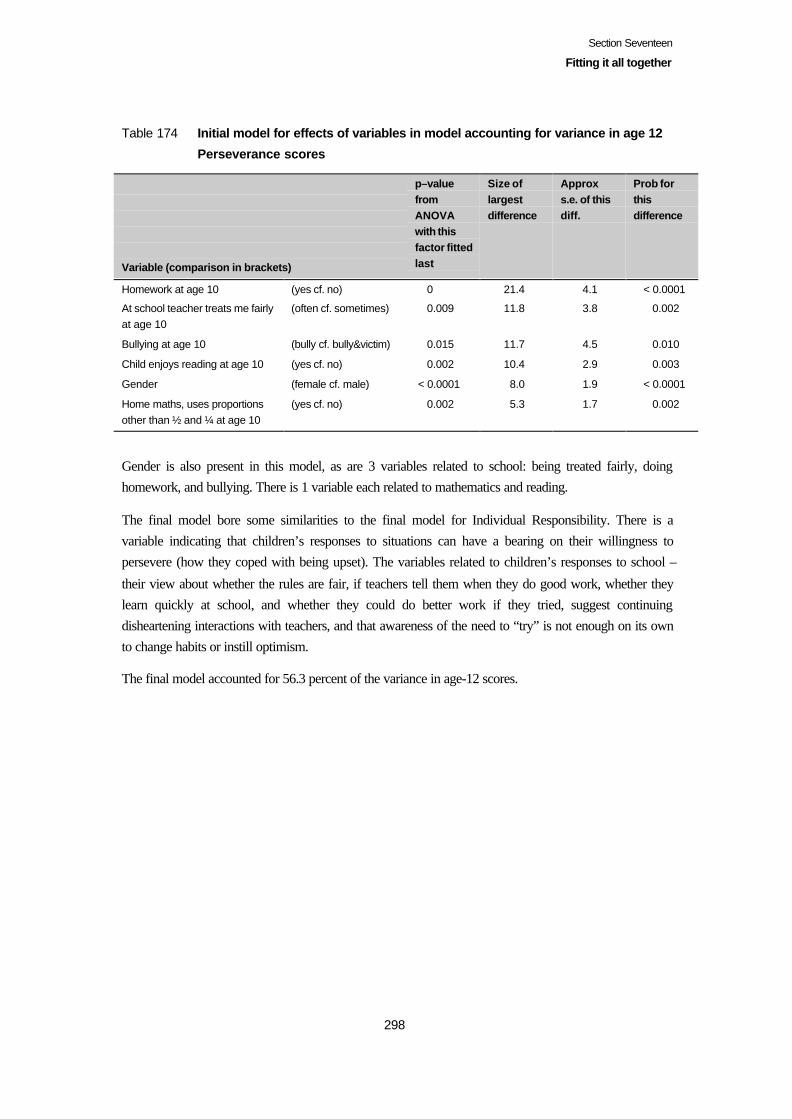
Section Seventeen
Fitting it all together
298
Table 174 Initial model for effects of variables in model accounting for variance in age 12
Perseverance scores
Variable (comparison in brackets)
p–valuefromANOVAwith thisfactor fittedlast
Size oflargestdifference
Approxs.e. of thisdiff.
Prob forthisdifference
Homework at age 10 (yes cf. no) 0 21.4 4.1 < 0.0001
At school teacher treats me fairlyat age 10
(often cf. sometimes) 0.009 11.8 3.8 0.002
Bullying at age 10 (bully cf. bully&victim) 0.015 11.7 4.5 0.010
Child enjoys reading at age 10 (yes cf. no) 0.002 10.4 2.9 0.003
Gender (female cf. male) < 0.0001 8.0 1.9 < 0.0001
Home maths, uses proportionsother than ½ and ¼ at age 10
(yes cf. no) 0.002 5.3 1.7 0.002
Gender is also present in this model, as are 3 variables related to school: being treated fairly, doinghomework, and bullying. There is 1 variable each related to mathematics and reading.
The final model bore some similarities to the final model for Individual Responsibility. There is avariable indicating that children’s responses to situations can have a bearing on their willingness topersevere (how they coped with being upset). The variables related to children’s responses to school –
their view about whether the rules are fair, if teachers tell them when they do good work, whether theylearn quickly at school, and whether they could do better work if they tried, suggest continuingdisheartening interactions with teachers, and that awareness of the need to “try” is not enough on its ownto change habits or instill optimism.
The final model accounted for 56.3 percent of the variance in age-12 scores.
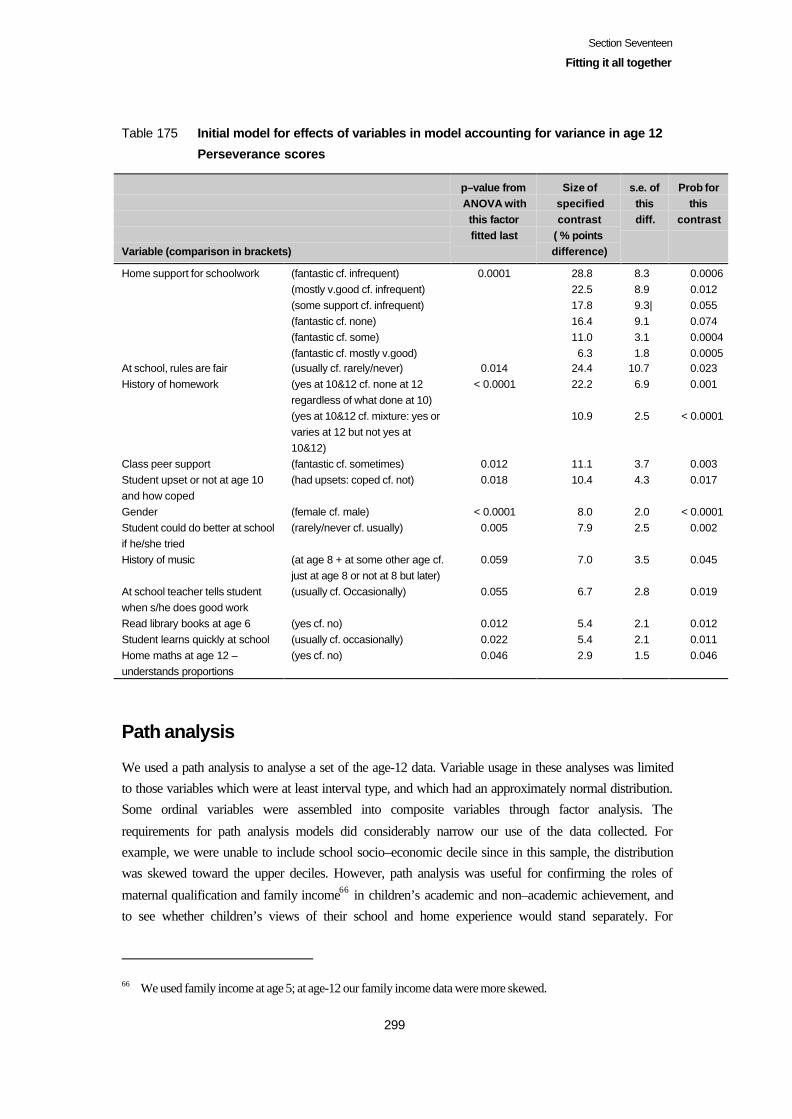
Section Seventeen
Fitting it all together
299
Table 175 Initial model for effects of variables in model accounting for variance in age 12
Perseverance scores
Variable (comparison in brackets)
p–value fromANOVA withthis factorfitted last
Size ofspecifiedcontrast
( % pointsdifference)
s.e. ofthisdiff.
Prob forthis
contrast
Home support for schoolwork (fantastic cf. infrequent)(mostly v.good cf. infrequent)(some support cf. infrequent)(fantastic cf. none)(fantastic cf. some)(fantastic cf. mostly v.good)
0.0001 28.822.517.816.411.06.3
8.38.99.3|9.13.11.8
0.00060.0120.0550.0740.00040.0005
At school, rules are fair (usually cf. rarely/never) 0.014 24.4 10.7 0.023History of homework (yes at 10&12 cf. none at 12
regardless of what done at 10)(yes at 10&12 cf. mixture: yes orvaries at 12 but not yes at10&12)
< 0.0001 22.2
10.9
6.9
2.5
0.001
< 0.0001
Class peer support (fantastic cf. sometimes) 0.012 11.1 3.7 0.003Student upset or not at age 10and how coped
(had upsets: coped cf. not) 0.018 10.4 4.3 0.017
Gender (female cf. male) < 0.0001 8.0 2.0 < 0.0001Student could do better at schoolif he/she tried
(rarely/never cf. usually) 0.005 7.9 2.5 0.002
History of music (at age 8 + at some other age cf.just at age 8 or not at 8 but later)
0.059 7.0 3.5 0.045
At school teacher tells studentwhen s/he does good work
(usually cf. Occasionally) 0.055 6.7 2.8 0.019
Read library books at age 6 (yes cf. no) 0.012 5.4 2.1 0.012Student learns quickly at school (usually cf. occasionally) 0.022 5.4 2.1 0.011Home maths at age 12 –understands proportions
(yes cf. no) 0.046 2.9 1.5 0.046
Path analysis
We used a path analysis to analyse a set of the age-12 data. Variable usage in these analyses was limitedto those variables which were at least interval type, and which had an approximately normal distribution.Some ordinal variables were assembled into composite variables through factor analysis. The
requirements for path analysis models did considerably narrow our use of the data collected. Forexample, we were unable to include school socio–economic decile since in this sample, the distributionwas skewed toward the upper deciles. However, path analysis was useful for confirming the roles of
maternal qualification and family income66 in children’s academic and non–academic achievement, andto see whether children’s views of their school and home experience would stand separately. For
66 We used family income at age 5; at age-12 our family income data were more skewed.
Section Seventeen
Fitting it all together
300
children’s views of school we used the factors described in Section Thirteen, engagement in school and
distressed at school, 2 factors from their views of how they could gauge how they were doing at school,and 3 factors drawn from their views of their classroom. Of these factors related to children’s views ofschool, only the factor engagement in school remained in the model. Another factor called “comfortable
at home”, drawn from their views of home, did not remain, nor did the sum of the activities parents saidthey did with their children, the sum of the groups children belonged to, nor the number of things theyhad in their bedroom.
An advantage of using path analysis in this context is that we can allow for more than one outcome
variable. That is, we can model mathematics, writing, and reading outcomes and so on, in the samemodel. Furthermore, path analysis allows for variables to take on an “intermediate” role, so we can regardreading performance, say, as being associated with or affected by maternal qualification, and in turn
influencing mathematics performance. In this model we focused on mathematics, readingcomprehension, writing, and Communication as outcome variables.
The model which emerged showed maternal qualification as having more and stronger direct “paths”than family income to the children’s mathematics, Burt Word Reading test, PAT Reading
Comprehension test, and writing scores at age 12. While family income is an important variable foraccounting for mathematics performance over and above the effect of maternal qualification, it is notneeded in addition to maternal qualification to account for PAT reading comprehension test performance.
The correlation between maternal qualification and family income (shown by a curved double–headedarrow on the diagram), is accounted for by the model, as are other significant correlations between eachof the exogenous (input) variables.
Engagement in school “fed into” both reading comprehension and writing scores, but none of the other
literacy measures, or mathematics. Communication scores fed most strongly into the Burt Word Readingtest scores (vocabulary), but also had direct links to mathematics, reading comprehension, and writing.
Overall, the model gives a strong sense of the role of language in children’s performance at age 12 formathematics and literacy, and shows that there is a considerable degree of interrelationship betweenlanguage, engagement in school, maternal qualification, and family income.
The model below explained 55 percent of the variance in mathematics scores, 49 percent of the variancein reading comprehension scores, 40 percent of the variance in writing scores, but only 19 percent of thevariance in the Burt Word Reading test scores.
In the graph that follows the strongest paths are shown with continuous black lines.

Section Seventeen
Fitting it all together
301
Figure 25 Paths between family resources, school engagement, communication,
mathematics, and literacy
MaternalQualification
Family Income at 5
SchoolEngagement
Communication(12)
Maths(12)
Writing(12)
Reading(12)
Burt Test(12)
0.350.51
0.57
0.40
0.30
0.38
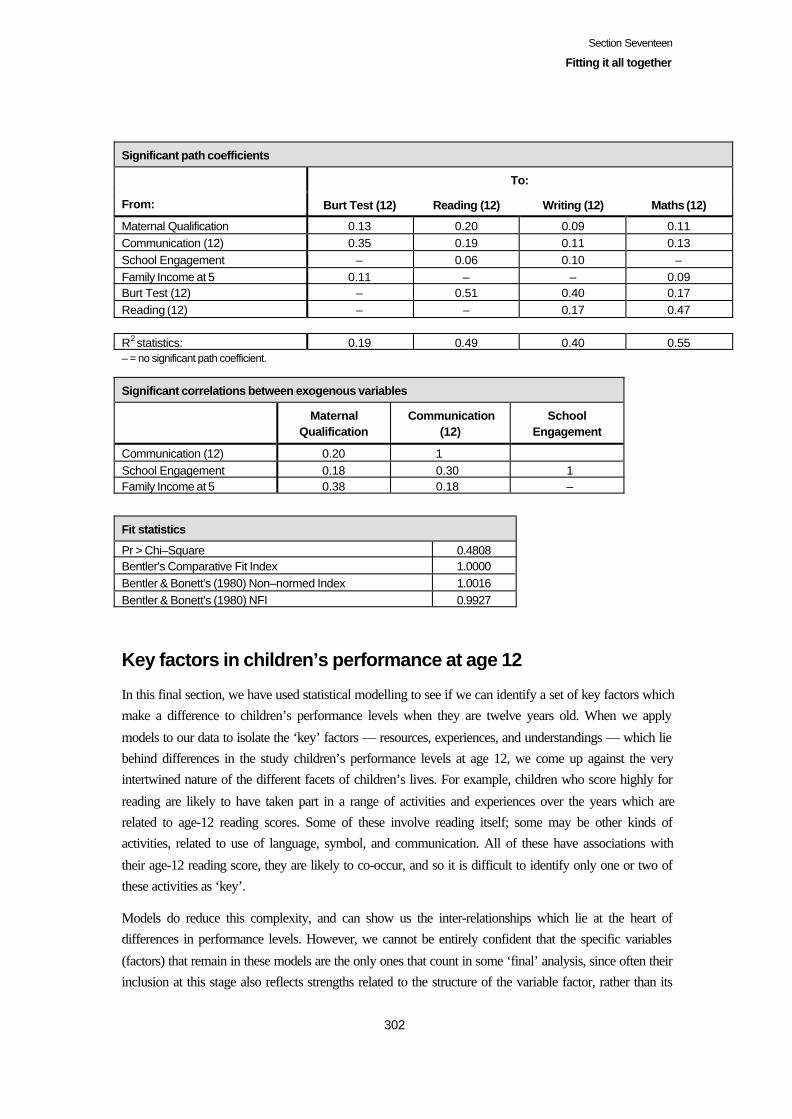
Section Seventeen
Fitting it all together
302
Significant path coefficients
To:
From: Burt Test (12) Reading (12) Writing (12) Maths (12)
Maternal Qualification 0.13 0.20 0.09 0.11Communication (12) 0.35 0.19 0.11 0.13School Engagement – 0.06 0.10 –Family Income at 5 0.11 – – 0.09Burt Test (12) – 0.51 0.40 0.17Reading (12) – – 0.17 0.47
R2 statistics: 0.19 0.49 0.40 0.55– = no significant path coefficient.
Significant correlations between exogenous variables
MaternalQualification
Communication(12)
SchoolEngagement
Communication (12) 0.20 1School Engagement 0.18 0.30 1Family Income at 5 0.38 0.18 –
Fit statistics
Pr > Chi–Square 0.4808Bentler's Comparative Fit Index 1.0000Bentler & Bonett's (1980) Non–normed Index 1.0016Bentler & Bonett's (1980) NFI 0.9927
Key factors in children’s performance at age 12
In this final section, we have used statistical modelling to see if we can identify a set of key factors whichmake a difference to children’s performance levels when they are twelve years old. When we apply
models to our data to isolate the ‘key’ factors — resources, experiences, and understandings — which liebehind differences in the study children’s performance levels at age 12, we come up against the veryintertwined nature of the different facets of children’s lives. For example, children who score highly for
reading are likely to have taken part in a range of activities and experiences over the years which arerelated to age-12 reading scores. Some of these involve reading itself; some may be other kinds ofactivities, related to use of language, symbol, and communication. All of these have associations with
their age-12 reading score, they are likely to co-occur, and so it is difficult to identify only one or two ofthese activities as ‘key’.
Models do reduce this complexity, and can show us the inter-relationships which lie at the heart ofdifferences in performance levels. However, we cannot be entirely confident that the specific variables
(factors) that remain in these models are the only ones that count in some ‘final’ analysis, since often theirinclusion at this stage also reflects strengths related to the structure of the variable factor, rather than its
Section Seventeen
Fitting it all together
303
content per se. Thus even these final models need some interpretation, or a reading of apparent
underlying principles, rather than using them as a literal recipe for how to nurture children so that they areperforming well at age 12.
Role of family resourcesLike many other studies of children’s development that have collected data on family resources as well as
school and class-level data, we have found that family resources play a major role67. They do not operatein a rigid manner, nor do they relate to children’s competency levels in a lock-step fashion, with everysingle level of family income or maternal qualification corresponding with a higher level of performance
by children on the cognitive competencies. But compare the proportions of those scoring at or above themedian for reading and mathematics at age 12 for different family income levels when the study childrenwere near age 5: around a third for those from low-income homes, around half for those from medium-
income homes, and around two-thirds for those from high-income homes. The range is wider in relationto maternal qualification. Around a fifth to a quarter of those whose mothers had no qualification scoredat or above the median for reading and mathematics at age 12, compared with around half for those
whose mothers had a school-level, trade, or tertiary level qualification, and around three-quarters to four-fifths of those whose mothers had a university qualification.
In the ANOVA models reported in this section, we see little trace of maternal qualification or familyincome once we also include in the kinds of activities and experiences which were also associated with
children’s competencies at age 12. This tells us that the kinds of activities and experiences which remainin the model and provide a parsimonious accounting for the variation in children’s performance at age 12are related also to differences in family resources. They also provide a guide to the kinds of activities andexperiences which can make a difference for children, whatever the level of maternal qualification.
Both the ANOVA and path analysis models give consistent and complementary pictures about theimportance of language experience and use in everyday life, from an early age, for the development ofnot just comprehension in reading, but also of understanding and reasoning skills in mathematics.
Language use and experience is also related to engagement in school, or the ability to make the most ofwhat school work and interactions have to offer. And they are related to family resource levels,particularly maternal qualification levels. In previous sections, we have described some of the activities,
behaviours and experiences which are associated with advantage in terms of family resources. These doinclude a greater use of reading and enjoyment of it, and more time spent in activities which are likely toextend knowledge, analytical skills, and communication skills. Some of these activities do not come
cheaply, such as the performing arts. Other experiences include a greater parental interest in theirchildren’s education, an interest which is more likely to be informed by the parents’ own educationalexperiences and confidence. And it includes more support for children to be assertive.
67 See Nechbya, T., McEwan, P., and Older-Aguiler, D. (1999).
Section Seventeen
Fitting it all together
304
By treating family income and parental qualification levels separately rather than as components of a
composite socio-economic status, we have been able to show that these factors do operate somewhatdifferently. Higher maternal qualification levels can act as a buffer for some of the disadvantages of lowfamily income; less so in reverse. This may be because so many activities and experiences which co-
occur with having some form of maternal qualification, particularly at the upper end, are the ones whichco-occur with engagement with the work of school, particularly around reading and use of language incommunication.
The role of participation and engagement
At the same time, there are also many similarities in the way that children from different backgroundsspend their time, react to adults and peers, and identify what is important to them. Though children whosemothers had a high qualification were likely to watch less television than those whose mothers had no
qualification, they did watch some television, and their tastes in programmes were not clearly distinctive.Differences in children’s activities and engagement were related more to gender than social class.
Children who were struggling with school, in a spiral of lack of achievement and lack of engagement(feeling supported, having trust, as well as interesting things to do), came from all family backgrounds.
Children who had been bullied, who experienced isolation, who had poor social skills, and who struggledto gain more positive meaning out of friendships, also came from all family backgrounds. Gender wasmore important in relation to performance in the social and attitudinal competencies than family
resources. What matters in the work of teachers and parents to arrest such negative spirals of reinforcingexperience, actions, and reactions, is not so much children’s social backgrounds, as their specific needs,and the patterns of experiences and habits that need to be reshaped.
The roles of current and early experiences
A longitudinal study can also compare the contribution of current and earlier experiences. There are twostriking findings related to the importance of children’s early experiences for their later performance.First, the continued contribution of aspects of early childhood education — and the fact that some of
these have grown over time, rather than diminishing. Second, the greater contribution of family incomelevels in these early years to children’s later competencies, than current or improved family income levelsin the 7 years since. These findings indicate that when we weigh up the costs of providing support for
children in their first few years, and therefore for their families, we need to take a long-term view. Itwould seem that some of the ground lost for some of the children in this study in those early years, is verydifficult to be regained in later years. Children from homes with high maternal qualification found it
easier to make up this ground than others. It is of concern that not only was it harder for children fromhomes with low levels of family resources to make up this ground, but also that children from thesefamily backgrounds who had been early high performers were more likely to lose ground over time.
Section Seventeen
Fitting it all together
305
The difficulty of catching up was particularly marked in relation to mathematics. This may be because of
the nature of mathematics, or it may be that we have historically as a country and education system putmore emphasis on reading, and the teaching of reading.
While this study points to the importance of the early years, before children reach school, and then thefirst three years of school, as the best window of opportunity for children to gain solid foundations for
continued learning, it also shows that adult responses to children’s lack of engagement, lack ofperformance, or their being upset, is not age-limited in terms of making a difference for individuals. Morechildren than we expected from our analysis of performance at earlier years moved from low levels of
performance at age 10 to performing at or above the median at age 12. Most parents of the study childrenhad worked with their child’s teacher at some stage to sort out difficulties their child had experienced.
What is of concern is that teachers of the study children at age 12 were less confident that they couldmake a difference to the learning of children who were struggling in their learning. This underlines the
importance of the government’s strong emphasis on providing more curriculum, pedagogical, andassessment leadership and resources to support teachers in their work with students, and the need to givepriority to learners who are struggling, in this support. We do need to ensure that engaging learning
experiences are available for students who make have fewer home resources than others to complementand support the work of school.
The importance of understanding cumulative experiencesMuch of the analysis of ‘risk’ and ‘resilience’ among children emphasises both the co-occurrence of risk
and supportive factors, and the need to see risk and resilience in terms of clusters of co-occurring factors,rather than single decisive factors (Kalil, 2003). The value of a longitudinal study such as this one is thatit can also show how this compounding in terms of occurrence can happen through time, and that an
accumulation of positive or negative experiences can tip a balance. For example, children who experiencea few changes of school are unaffected; in this study, it was the children who experienced more than 4 bythe age of 12 who showed some areas of lower performance. Current class size is unrelated to children’s
competency levels; it is only when we look at experiences of class size over time that we see some trends.Current amounts of time spent watching television show fewer associations with children’s competencylevels than do the cumulative amounts. This does have implications for our understanding of the
relationships between children’s experiences and opportunities and their performance, if we are limited tocurrent data only.
Many of the study children have been upset at different stages of the times when we have talked withtheir parents, but few at every stage; and most children do cope with being upset. Around half the study
children have had a teacher they did not like, but this has not affected their performance at age 12. Formany children, life has been a mixture of beneficial and less beneficial experiences, and it seems likelythat it is having a mixture which includes some critical mass of beneficial experiences which is in itselfprotective.

Section Seventeen
Fitting it all together
306
307
References
Alton–Lee, A., & Praat, A. (2000). Explaining and addressing gender differences in the New Zealandcompulsory school sector. A literature review. Wellington: Research Division, Ministry of Education.
Andersson, Bengt–Erik. (1993). Long–term effects of early day care in relation to family type and children’sgender. Department of Child and Youth Studies, Stockholm Institute of Education.
Broberg, A.G., Wessels, H., Lamb, M.E., & Hwang, C.P. (1997). Effects of day care on the development ofcognitive abilities in 8–year–olds: a longitudinal study, Developmental Psychology, 33 (1), 62–69.
Burtless, G. (1996). Introduction and Summary. In Burtless, G. (Ed.), Does money matter? The effect of schoolresources on student achievement and adult success. Washington, DC: Brookings Institution Press.
Caygill, R. (1993). The students. In H. Wagemaker (Ed), Achievement in reading literacy (pp. 59-88).Wellington: Research section, Ministry of Education.
Crooks, T., & Caygill, R. (1999). New Zealand’s national education monitoring project: Mäori studentachievement, 1995–1998. Paper given at the combined NZARE/AARE conference, Melbourne.
Currie, J. (2000). Early childhood intervention programs: what do we know? Joint Center for Poverty Researchpaper. Available on http://www.jcpr.org.
Effective Pre-school and Primary Provision Project (2003), The effective provision of pre-school education[EPPE] project – a longitudinal study funded by the DfES (1997-2003). Symposum at the European EarlyChildhood Educational Research Association (EECERA) Annual Conference, Glasgow, 3-6 September.
Fergusson, D.M., Horwood, L.J., & M. T. Lynskey. (1994). A longitudinal study of early childhood educationand subsequent academic achievement, Australian Psychologist, 29 (2), 110–115.
Fergusson, D. M., & Horwood, L.J. (1997). Gender differences in educational attainment in a New Zealandbirth cohort. NZ Journal of Educational Studies, 32(1), 83–96.
Hyslop, D., & Mare, D. (2001). Understanding changes in the distribution of household incomes in NewZealand between 1983-86 and 1995-98. Wellington: Treasury working paper 01-21. Available onwww.treasury.govt.nz/workingpapers/2001/01-21.asp
Kalil, A. (2003). Family resilience and good child outcomes – a review of the literature. Wellington: Centre forSocial Research and Evaluation, Ministry of Social Development. Available on www.msd.govt.nz.
Kontos, S., & Wilcox-Herzog, A. (1997). Teachers’ interactions with children: why are they so important?Research in review, Young Children 52 (2), 4–12.
Marks, G.N. (1998). Attitudes to school life: their influences on achievement and their effects on achievementand leaving school. Longitudinal Surveys of Australian Youth, Research Report No. 5. Melbourne:Australian Council for Educational Research.
Ministry of Education. (2003). New Zealand Schools Ngä Kura o Aotearoa 2002. Minister of Education. Areport on the compulsory schools’ sector in New Zealand 2002. Wellington: Author.
Munton, T., Mooney, A., Moss, P., Petrie, P., Clark, A., & Woolner, J. (2002). Research on ratios, group sizeand staff qualifications and training in early years and childcare settings. London: Department forEducation and Skills, Research report RR320.
308
Nash, R. & Harker, R. (1994). Progress at school. Stage one final report. Palmerston North: EducationalResearch and Development Centre, Massey University.
Nechbya, T., McEwan, P., & Older-Aguiler, D. (1999). The impact of community and family influences onchildren’s achievement in New Zealand: best evidence synthesis. Wellington: Ministry of Education.
NICHD Early Child Care Research Network. (2002). Child–care structureàprocessàoutcome: direct andindirect effects of child–care quality on young children’s development. Psychological Science, 13(3), 199–206.
Norton, P., Sanderson, K., Booth, T., & Stroombergen, A. (2000). A literature review of the effect of schoolresourcing on education outcomes. Wellington: Research Division, Ministry of Education.
Peisner–Feinberg, E.S., & Burchinal, M.R. (1997). Relations between preschool children’s child–careexperiences and concurrent development. Merrill–Palmer Quarterly, 43, 451–477.
Pilling, D. (1990). Escape from disadvantage. London: Falmer Press, in association with National Children’sBureau.
Pintrich, P.R., & Schunk, D.H. (1996). Motivation in education: theory, research, and applications.Englewood Cliffs, N.J: Merrill.
Smith, A.B., Grima, G., Gaffney, M., Powell, K., Masse, L., & Barnett, S. (2000). Early childhood Education –literature review for the Ministry of Education. Dunedin: Children’s Issues Centre, University of Otago.
Smith, E. (2003). Failing boys and moral panics: perspectives on the underachievement debate. British Journalof Educational Studies, 51 (3), 282–295.
Thrupp, M. (1999). Schools making a difference: let’s be realistic! School mix, school effectiveness, and thesocial limits of reform. Buckingham: Open University Press.
Wilkinson, I., Hattie, J.A., Parr, J.M., Townsend, M., Thrupp, M., Lauder, H., & Robinson, T. (2000).Influence of peer effects on learning outcomes: a review of the literature. Auckland: Auckland Uniservices,published by Research Division, Ministry of Education.
Wylie, C. (1998). Can Vouchers deliver better education? A review of the literature, with special reference toNew Zealand. Wellington: New Zealand Council for Educational Research.
Wylie, C. (2003a). Longitudinal research: the Competent Children project. In Davidson, C., & Tolich, M.(Eds.), Social science research in New Zealand, 2nd edition, pp. 217–228. Auckland: Pearson EducationNew Zealand Ltd.
Wylie, C. (2003b). Beating the odds – factors which can make a difference for New Zealand children fromlow–income homes. Paper given at Connecting policy, research and practice conference, April 29–30,2003, Wellington. Available on www.nzcer.org.
Wylie, C., Thompson, J., & Kerslake Hendricks A. (1996). Competent Children at 5 – families and earlyeducation. Wellington: New Zealand Council for Educational Research.
Wylie, C., & Thompson, J. (2003). The long–term contribution of early childhood education to children’sperformance – evidence from New Zealand. International Journal of Early Years Education 11(1), 69–78.
309
Appendix 1: Statistical techniques used
This section contains a description and justification of the statistical techniques used to analyse the age-12data. A general glossary is included to explain what most of the statistical terms (jargon) mean.
In each of the rounds of data analysis the point of departure of the analyst has been that:
• The data should be allowed to speak, rather than be tested against preconceived hypotheses. For thisreason exploratory data analysis (EDA) techniques were seen as particularly appropriate.
• The explanatory variables were measured on binary or ordinal scales, and so analysis of variance(ANOVA) techniques were more often appropriate than regression techniques (which assume theindependent or explanatory variables are measured on at least interval scales).
• The analysis from the latest round of data collection should be as comparable with earlier analyses aspossible.
The following sections describe each of the techniques that have been used, discuss briefly why thatanalysis was seen to be appropriate, and indicate where these techniques were used.
The techniques described below include those used “behind the scenes” as well as those directly reportedon.
In all the modelling, we used the 1 percent level of significance. If the p–value (the probability of gettingthe observed result by chance alone) was between 0.01 and 0.06, we reported the result as being“indicative”; in other words there is a possibility that there is a difference, which may be revealed infurther study, or might have been revealed had we had a larger sample.
Data preparation and exploration
Data cleaning is an ongoing task in the analysis of any large data set. Out–of–range values are fairly easy
to spot early on, but other inconsistencies between responses are only found by exhaustive testing. EDAtechniques do, among other things, help to bring such inconsistencies to light.
“Tukey (the father of EDA) suggested that we examine our data as a detective would examine thescene of a crime—not with a hypothesis (“I’ll bet the butler did it”) but with an open mind and asfew assumptions as possible. By letting the data speak to us we hope to learn the truths hiddenbeneath the random fluctuations, errors, and general confusion seen in real data … Recently,
310
growing interest in data mining has helped to fuel interest in ways to view data withoutpreconceived hypotheses.” (Velleman)
EDA techniques (Tukey, 1977; Velleman and Hoaglin, 1981; Hoaglin, Mosteller et al., 1983) were
primarily used to get an understanding of the nature of and underlying patterns in the data. Thetechniques used include:
• Plots to explore the distributions of the variables: stem–and–leaf plots, box plots, qq–plots (toillustrate the extent of the departure from normality of a variable, or of the residuals of a fitted model),
and histograms (with and without the best–fitting normal distribution).• Box plots to explore the distributional characteristics of a variable at different levels (factor levels) of
another (explanatory or independent) variable. Notched box plots indicate between which levels of
the explanatory variable there are likely to be significant differences in the dependent variable.• Scatter diagrams to explore the strength and nature of the association between 2 variables. Jittering, or
adding small amounts of “noise” to the variables, was used where one or both of the variables took on
only a few values—this allows each observation to be visible, where otherwise observations withidentical values are represented by only a single point on the plot.
• Pearson product–moment correlation coefficients were used to estimate the strength of linear
associations between variables (where the corresponding scatter–plot indicated that this wasappropriate).
• Partial correlation (Draper and Smith, 1998) was used to explore the relationship between pairs of
variables where one or more other variables were expected to have an impact on the variables ofinterest. For instance, competency measures in mathematics at age 10 and 12 are expected to becorrelated, but both are expected to be affected by or related to competency measures in mathematics
at ages 5, 6, and 8. Partial correlation gives an estimate of the correlation between the age-10 and 12measures after eliminating or accounting for the effects at ages 5, 6, and 8.
• Where a strong and linear relationship was found between variables, linear regression (Draper and
Smith 1998) was used to obtain other measures of the strength of the relationship. The regressioncoefficients measure the amount of change in the dependent variable per unit change in theexplanatory variable, and the coefficient of determination, R2, gives the proportion of the variance inthe dependent variable that is explained by the model.
Association rather than causality
In social research, where one cannot control or limit the variables involved, or constrain the great
variability that exists between individuals and the patterns of their experiences, it is particularly difficultto talk of relations found between variables as “causal”. The statistical techniques we have at our disposalwere often designed for experimental environments, rather than real life.
In all of our analyses, and the interpretation of them, any significant effects found should be seen as
indications of association between the explanatory and outcome variables, and should not be seen to be inany way causal. For instance, an association between Curiosity (a measure based on the judgment of the
311
child’s teacher) and performance on the cognitive tests, where children with high scores on the Curiosity
measure tended to do well on the cognitive tests, does not provide proof that it is the curiosity alonewhich has resulted in the above–average performance. Both may be manifestations of a child’s generalability level, or be the result of the teacher’s attention to the child, and the interaction between them.
Two variables (call them A and B) with such an association could have any one of the underlyingpatterns:
• changes in variable A are caused by variable B;• changes in variable A are caused by changes in variable C, which also affects the values of variable B,
but B itself has no direct effect on A;
• changes in both variables A and B are caused by changes in variable C, and changes in A are alsodirectly related to changes in the value of B;
• there is no real association between A and B, the apparent association is an artefact of the way in
which or the circumstances under which the variable/s were measured; or• there is no real association between A and B, the apparent association is just chance.
In social data such as ours, which of the possibilities is actually true usually cannot be determined. It is inlooking at consistencies between different particular associations found that one can build up a picture
which provides some insight into the processes at work; but “proof” of relations between individualfactors remains elusive given existing statistical techniques, and the sheer quantum of different aspects ofindividuals’ daily and cumulative existence.
Effect size
Several different measures of effect size have been proposed. Among the most commonly used are:
• Cohen’s d for the difference between two means. If M1 and M2 are the sample means and s12 and s2
2
the corresponding standard deviations, then:
21
222
211
21
)1()1( where
nnsnsn
MMd
+−+−=
−=
σ
σ
• The coefficient of determination, which is the square of the correlation coefficient, r2, measures theproportion of the variance accounted for by the relationship between the 2 variables, and is used to
measure the effect size for correlation and regression.• For analysis of variance, η2, the proportion of the total variance that is attributed to an effect can be
used:
total
effect2
SSSS
=η
In a 1–way ANOVA η2 = R2.
312
A balanced analysis of variance is one in which there are equal numbers of observations at each
level of a single factor, or at each of the possible combinations of factors where there are 2 ormore factors. A balanced design allows the estimation of the main effects and interaction effectsof the factors. In a balanced design, the sum of all the η2 would equal R2, the coefficient ofdetermination, as R2 = SSmodel/SStotal and SSmodel is the sum of the SSeffect terms.
In an unbalanced design (as all of our ANOVAs are—the number of boys was not equal to thenumber of girls; the number of children having mothers with no qualification was not equal to thenumber of children with mothers with school–level qualifications, and so on), the SSeffect terms are
not additive, and the choices for effect size would seem to be either to use R2, for the whole model,or to use analysis of contrast means and Cohen’s d (the only problem in this is the number ofpossible contrasts between all possible levels of all possible factors), or to estimate the effect ofthat factor as if fitted last in the model.
In this report, as in the earlier reports, we have given the p–value for the ANOVA tests, and the R2 value,which can be thought of as an overall effect size for the whole model fitted.
Combined measures
Before combining items or variables as measured into scales (for instance, the competency measures), weused one or more of the following techniques:
• Principal components analysis (PCA) (Jackson, 1991) and factor analysis (FA) (Mardia, Kent et al.,1979; Krzanowski, 1988) were used to investigate the dimensionality of the sets of questions. For
instance, we asked questions about the student’s communication, and these fell broadly into thecategories “receptive” (5 items) and “expressive” (5 items) communication (or how well the studentreceived and gave information, respectively). The question we needed to ask was whether these 10
items could or should be combined into 1 or 2 composite communication variables.• Cronbach’s alpha was also used, typically after the PCA or FA, to measure the reliability of the
composite measures.
Models used
Linear modelsMost of the models fitted were ANOVA models, as these were felt to be the most appropriate.
Analysis of variance and linear regression models belong to the same family of models. In all thesemodels it is assumed that:
• the sample is randomly and independently selected;• the error variance is normally distributed; and

313
• the error variance is constant for all observations (at all values of, or levels of, any independent orexplanatory variables).
The main difference between ANOVA, regression, and analysis of covariance (ANCOVA) models isthat in
• ANOVA models all explanatory variables or factors that are categorical, taking 2 or more possiblevalues within a very restricted range (gender, level of education, degree of satisfaction, etc). ANOVA
models allow the estimation of the change in the mean value from the overall mean at each level of afactor. For instance, to explore how achievement in, say mathematics varies depending on level offamily income, incomes can be grouped into 3 bands (“low”, “medium”, “high”) and we can use
ANOVA to test whether mathematics achievement is the same for each broad income level or not.Further, if there are differences, it is possible to investigate which income levels have approximatelyequal mathematics achievement, and which have higher levels of achievement.
• Regression models usually have explanatory variables that are measured on an interval scale, andwhich can take many possible values, or are continuous. Regression models allow the estimation ofthe change in the dependent (response) variable for each unit change in the independent variable. For
instance, with a regression model with achievement in, say, mathematics as the dependent variableand family income as the independent variable (in other words, where we try to explain achievementin mathematics by family income), the model will tell us by how much we could expect mathematics
achievement to improve for each dollar increase in family income. In addition the model assumes thatany increase in achievement is at a constant rate across all incomes (which may not be the case).
• ANCOVA models include both continuous co–variates (as regression models do) and discretevariables (as in ANOVA) in the same model.
ANOVAOne–factor ANOVA was used as an exploratory technique to see which of all the variables explained asatisfactory amount of the variability in the outcome or dependent variables of interest. Analysis of the
previous rounds of data had revealed that 2 of the possible variables that explained a large amount of thevariability were mother’s education and family income at age 5.
Residual plots were made to evaluate whether the assumptions of normality and equality of variancecould be made. Where there were marked departures, the dependent variable was transformed. Mosttransformations involved squaring, or taking the square–root, or log of the dependent variable.
For those variables where the result was significant (the p–value was < 0.01), 2–factor ANOVAs werefitted. Typically, but not exclusively, mother’s education, or family income at age 5, was fitted first, andthen the other factor of interest was fitted. This gave a measure of whether the variable of interest
accounted for significantly more variability in the response variable than mother’s education or familyincome alone did. Other “controlling factors” were fitted first in some of the analyses.
Multifactor analysis of variance models were fitted, using variables that in the 1– and 2–factor modelsaccounted for relatively large amounts of the variance in the dependent (outcome) variables. These
314
models were used to indicate some possible models in which all the independent or explanatory variables
included together accounted for a substantial amount of the total variability in the dependent variable,with each able to contribute significantly after all the other variables in the model have been accountedfor.
Analysis of contrastsResults of the ANOVAs are presented in terms of contrasts between the effects for different levels of thefactor of interest and the standard errors of these contrasts. For instance, for mother’s education, thecontrast might be the (model) difference in mean mathematics score between those whose mothers had
no education, and those whose mothers had a university degree. For each contrast the estimated standarderror is also given, calculated from the mean square error, and the number of observations in each groupin the contrast. If the mean difference is more than twice the associated standard error, it can be assumedto be significant, or at least indicative.
These contrasts are closely related to the effect size (Cohen, 1988; Rosnow and Rosenthal, 1996) for thedifference between the 2 means. There are several definitions of effect size, but they all involve the ratiobetween the difference between means (as above) and the pooled estimate of the standard deviation, or
the estimate of standard deviation assuming that the samples come from populations with equalvariances. In our report, we have an estimate of the standard error calculated from the error mean square,which is equivalent to a pooled estimate of variance.
Multivariate analysisMultivariate techniques provide a range of methods to attempt to find patterns in data sets consisting ofmany inter–related variables.
We have used multivariate techniques for EDA, in particular classification and regression trees, andmultidimensional scaling (MDS). We have used dimension–reducing techniques such as principal
components analysis (PCA) and factor analysis (FA). These techniques are used to represent manyvariables (if there are 2 variables, then the data can be represented in 2–dimensional space, for exampleby a scatter–plot; if there are 20 variables, then the data can be thought of as being able to be represented
in 20–dimensional space) by fewer new variables (and so in fewer dimensions). The new variables aretypically the means or weighted means of the original variables.
Multidimensional scaling (MDS)MDS (Cox and Cox, 1994) takes data measured in many dimensions (each variable represents a
dimension), and attempts to portray it in 2 or 3 dimensions. The technique attempts to measure thedistance between the original measures in k–space (if there are k variables), and by taking linearcombinations of the original variables, to represent these distances in 2 dimensions (or 3).
MDS can be used on interval, or ordinal, or even binary (0–1 or “yes”/“no”) data, or on a data set withvariables measured on a different types of scale.
315
For example, we used it to investigate the responses to the 14 options as to how the children might knowthey were doing well (Figure 18, p. 229).
Cluster analysisCluster analysis (Mardia, Kent et al. 1979; Krzanowski 1988) can be used to determine which individualsare more similar in terms of the variables of interest. It can also be used to cluster variables.
For example, we used it to investigate the extent to which the characteristics of the children as described
by the teacher could be used to define clusters of children, and whether these children had relativelysimilar competencies or not.
Classification and regression treesTree–based methods (Hastie, Tibshirani et al., 2001) may be used for classification problems, where the
outcome variable is binary (0–1 or “yes” / “no”), or categorical (with more than 2 categories), orregression problems, where the outcome variable is continuous.
The methodology requires weaker assumptions than the equivalent linear or generalised linear models,and in large data sets it can reveal relatively complex forms of structure, including interactions betweenvariables.
We used it mainly in a data–mining sense to explore relationships between age-12 variables and age-10variables.
Canonical correlationCanonical correlation (StatSoft manual at http://www.statsoftinc.com/textbook/stcanan.html and
www2.chass.ncsu.edu/garson/pa765/canonic.htm) allows us to investigate the relationship between twosets of variables, such as a set of 5 variables related to children’s perceptions of, and attitudes to, schooland learning, and another set, consisting of their scores on the competency measures.
Canonical correlation requires interval level data, and no multicollinearity (i.e., the variables within the 2
sets should not be very highly correlated, but variables in one set can be strongly correlated with variablesin the other set).
Structural equation modelling (SEM) and path AnalysisLinear structural equation modelling (Fox, 1984), of which path analysis is a subset, is an extension and
generalisation of the linear model. The method provides a means to model complex inter–relationshipsbetween variables. A model can be fitted in which, say, maternal qualification affects the variouscompetencies; the social competencies affect the cognitive competencies; maternal qualification affects
the choice of school type (which determines class size) which in turn affects the various competencies,and so on.
316
SEM has some minimum data requirements:
• variables must be at least interval type (i.e., not categorical or binary);
• variables should have an approximately normal distribution; and• variables must take on at least 4–5 different values.
SEM allows the use of composite variables. Composites can be constructed using factor analysis, and insome cases, by summing over logical collections of binary variables.
These models can only be fitted to relatively large data sets, or at least those in which there are at least 5times as many observations as there are parameters estimated by the model.
SEM is largely a confirmatory, rather than exploratory, technique. That is, researchers are more likely touse SEM to determine whether a certain model is valid, rather than using SEM to “find” a suitable model,although SEM analyses often involve a certain exploratory element.
A structural equation model implies estimation of the structure of the covariance matrix. Once the
model's parameters have been estimated, the resulting model–implied covariance matrix can be comparedto an empirical or data–based covariance matrix. If the 2 matrices are consistent with one another, thenthe structural equation model can be considered a plausible explanation for relations between themeasures.
The SAS procedure CALIS was used to perform SEM analyses. Maximum likelihood parametermethods of parameter estimation were used, and all analyses were performed on the covariance matrixusing standardised variables.
Factor analysis and principal components analysisThese dimension–reduction techniques were used mainly as EDA techniques, and when constructingcomposite variables (see above, Combined measures).
Quartile movement analysisThis is a method used to examine the young people’s performance relative to the rest of the study group
across time: Were there some young people whose competency scores increased (or decreased) moremarkedly than those of the rest of the group?
For each of the competencies of interest, the median, upper, and lower quartiles were calculated, and theindividual scores were recoded to a 1–4 scale, depending on which quartile group they fell into.
Movements between adjacent quartile groups are to be expected, particularly for individuals whose
scores were close to the quartile values. Of interest though, were larger changes, in particular betweenquartile groups 1 (the students with the lowest scores) and 4 (the students with the highest scores).
Partial correlationsIn an attempt to explore whether there were long–term trends in achievement or not, partial correlationwas used to measure, for example, the correlation between age-8 Mathematics and age-12 Mathematics,
317
after allowing for the age-10 score, so addressing the question “Is there some variability in the age-12score that is accounted for by the age -8 score but not by the age-10 score?”
The aim was to explore the extent to which the achievement could be considered to be a Markov process.If achievement could be considered to be a Markov process, then achievement at any age would dependonly on achievement at the previous age (writing at age 12 would depend only on writing at age 10,
which in turn would depend only on writing at age 8, …). Otherwise, achievement may depend onachievement at several earlier ages.
We used partial correlation to explore this idea.
What we didWe approached the data with an open mind, and used EDA techniques extensively.
We checked that all the assumptions required for the linear models were valid.
For all the ANOVAs we quote the R2 values, and give details on mean contrasts (see above).
What we did not doWe did not calculate effect sizes explicitly, as the measures we do calculate (r, R2, mean contrasts, andstandard errors) are closely related.
We have not fitted any models that require the assumption that the variables are measured on at least aninterval scale, where in fact the scale is ordinal at best.
Glossary
Box plot — one of the plots that show the shape of the distribution. The box plot shows the lowest andhighest values, the value of the quartiles and of the median. A box is drawn between the quartiles, and“whiskers” extend from the box to the highest and lowest values. A box plot shows the “average” value(median), and whether the distribution is approximately symmetric or skew. See also Notched Box plot.
Categorical variable — a discrete variable that has its possible values defined by categories and thecategories typically do not indicate the amount of the variable in question, e.g. gender, eye colour. Anordered categorical variable is one in which the categories are indicative of order, e.g. scales such as
“very satisfied”, …, “very dissatisfied”, or responses to a “how often” question that are on a scale from“every day” to “never”.
Chi–square test [of independence] — a test to determine whether 2 [ordered] categorical variables arelikely to be independent or not. The null hypothesis is that they are independent, and a small p–valuewould support the alternate hypothesis that they are not independent (are dependent).
Coefficient of determination, R2 — the proportion of variability that is accounted for by the modelledrelationship between the dependent and independent variables.

318
Confidence interval — an interval about a sample estimate (like the sample mean), such that there is a
known degree of confidence that the true population parameter (the population mean, say) will lie insidethat interval. What this means is that, if we were to take hundreds, or thousands, of samples from thesame theoretical population, and to calculate a 95 percent confidence interval for the mean of each
sample, then we expect that 95 percent of these confidence intervals will actually contain the populationmean, but in the remaining 5 percent of the cases the sample will be so extreme (the values measuredwere unusually high, or unusually low) that the upper limit of the confidence interval will be below the
mean (in a low–valued sample) or the lower limit of the confidence interval will be above the mean (in ahigh–valued sample).
Confidence level — the degree of confidence (usually 95 percent) that the population parameter liesinside a confidence interval.
Continuous variable — a variable that in theory can take on any one of infinitely many values (although
in practice it will be measured to a certain level of accuracy and so can take on only a finite—butrelatively large—number of possible values) in a certain range, e.g. physical measures such as height andweight.
Correlation coefficient — a measure of the strength of the relationship between 2 variables. A
correlation is positive if a high value of the one variable tends to be associated with a relatively high valueof the other variable (and a low value of the one variable with a low value of the other), and is negative ifa high value of the one variable tends to be associated with a relatively low value of the other variable.
Correlation coefficients take values between –1 and 1. Correlation coefficients are positive where thecorrelation is positive, and negative where the correlation is negative. The strength of the correlation ismeasured by the size of the correlation coefficient, with a value around 0 (say between –0.2 and 0.2)
indicating almost no relationship between the variables, a value of between –0.5 and –0.2 or between 0.2and 0.5 indicating a relatively weak relationship, a value between –0.75 and –0.5 or between 0.5 and 0.75indicating a moderately strong relationship, and values between –1 and –0.75 or between 0.75 and 1indicating a strong relationship.
It is possible to test the null hypothesis that there is no correlation, and a statistically significant resultindicates that there is a statistically significant correlation. This is not the same as a strong correlation, asfor very small sample sizes (like 10), only a very strong correlation will be statistically significant,
whereas for a very large sample (several hundred observations) it is possible to have statisticallysignificant correlations that are very weak (r < 0.2). This is one reason why it is important to consider theeffect size, In this case the coefficient of determination, r2, as well as the significance of the test.
There are several different measures of correlation. In this study, the Pearson product–moment
correlation coefficent was used. This correlation coefficient measures the strength of a linear (straightline) association between the variables.
Cronbach’s alpha — a statistic used to measure the reliability of items used to form a scale. Alphavalues, like positive correlation coefficients, lie between 0 (approximately no relationship between the
items) and 1 (the strongest possible relationship between the items), and values of 0.7 or higher are
319
considered to be acceptable, while values of 0.8 or higher are considered to indicate good reliability.Alpha values depend on the sample size, as well as the number of items.
Dependent variable(s) — one or more variables whose values are related to the values of anothervariable(s). Two variables are said to be dependent if the value of the one varies as the value of the othervaries. (Note: dependency cannot be taken to be indicative of causality.)
In a linear model sense, a dependent variable is the outcome variable, and the idea is to be able topredict values of that variable, given the values of the independent or explanatory variable(s).
Discrete variable — a variable that can take on only a few possible values, e.g. gender, year level atschool.
Distribution — the “shape” of the variable: Are most of the values low? most high? most in the middle?Are most relatively low with a few rather high ones? Are there equal numbers right across the range ofvalues?
Explanatory variable — in a linear model setting, the variable(s) that are thought to be able to predictthe value of the dependent or outcome variable.
Histogram — a bar plot of the distribution of a continuous variable. Because the variable is continuous,there is no space between the bars. This is one of the plots that show the shape of the distribution.
Hypothesis — see Null hypothesis.
Independence — in statistical terms, independence can be inferred where the values of one variable do
not appear to depend on the value of a second variable. So variables are either dependent, or they areindependent.
In a linear model sense, an independent or explanatory variable is not affected by the value of thedependent variable, but is likely to determine the value of the dependent variable to some extent.
Interval scale — on such a scale, it is possible to tell by how much 2 measures differ. For example, a
person 182cm is 18cm shorter than a person 200cm in height, and the 18cm has a unique, unambiguousand universally understandable meaning.
Item — one in a group of similar questions attempting to measure something that is impossible tomeasure directly. For instance, any one of the competencies was formed as a composite scale measure
from a number of separate items, such as questions about level of curiosity, or individual mathematicaltasks.
Markov process — a process in which each in a sequence of events depends only on its immediatepredecessor, and not at all on what happened earlier in the sequence.
Mean — the “average”, or total of the observed values divided by the sample size.
320
Median — another measure of the “average”: that number such that half the observations are larger than
the median, and half are smaller in size. The mean and median are equal if the distribution is symmetric,but not otherwise.
Multicollinearity — the situation in, for instance, multiple regression where 2 (or more) variables are sostrongly correlated (r > 0.7) that they are almost 2 measures of the same variable. The model cannot be fitwith both (or all) variables in the model.
Normal distribution — this is the most useful and fundamental of the statistical distributions. A normaldistribution is symmetric, and is completely determined by the value of the mean and SD. The normaldistribution is the basis for much of the theory underlying inferential statistics (tests of hypothesis), and somany tests have the requirement that the variable(s) used in the test should be normally distributed.
Notched box plot – A box plot where the box is “notched” or “waisted” and this waist indicates anapproximate 95 percent confidence interval for central tendency (“average”) of the distribution. Thenotch begins and ends at
nquartile 1quartile 3
medianstrd −
±.
Such a plot can be used to judge which factor level means are likely to be significantly different (thosewhere the notched sections of the bars do not overlap). For example, in Figure 3, “mostly low” mean islikely to be significantly lower than all the others; “high” mean is likely to be significantly higher than allthe others; “mixed” and “medium” means are not significantly different.
Null hypothesis — a statistical model that is assumed in order for a statistical test to be done. Where thetest results indicate that if the null hypothesis were true, then the observed outcome was very unlikely (thep–value was very small), the null hypothesis is rejected, and the alternate hypothesis (the opposite of thenull hypothesis) is accepted.
Ordinal scale — it is possible to tell which of 2 measures has more of the quantity of interest, but not totell how much more. For example, someone who responded “very satisfied” is likely to be more satisfiedthan someone who responded “satisfied”, but it is impossible to say how much more satisfied they were.
Outcome variable — the dependent variable, the outcome of which we are trying to model based on thevalue(s) of independent or explanatory variable(s).
p–value — the probability, if the null hypothesis is true, of getting a test statistic value more extreme thanthat observed. If p < 0.01, the test result is significant, and the null hypothesis is rejected. If 0.01 < p <0.06, the test result is “indicative”, in other words it indicates that the null hypothesis may not be true, butfurther research would be needed to be more certain.
Partial correlation — correlation between 2 variables, when the linear effects of one or more relatedvariables are removed. Used when there are 3 or more variables, all inter–correlated, to determine whichpairs of variables are actually correlated, and which only appear to be correlated, because they both are
actually correlated with a third variable. For example, mathematics scores at ages 5, 6, 8, 10, and 12 mayall be correlated. But the question is whether the scores at earlier ages relate to the score at age 12 directly
321
(or put a little differently, whether the age-12 score depends on all the earlier scores), in which case there
will be significant partial correlations, or whether the score at each age depends only on the score at theimmediately previous age, and not directly on any of the earlier scores, in which the partial correlationcoefficients will be close to 0 and will not be significant.
Quartile — an extension of the concept of the median. The upper and lower quartiles are values such
that a quarter of the observations are less than the lower quartile in value, and a quarter of theobservations are greater than the upper quartile in value. It also follows that a quarter of the observationsare between the lower quartile and the median, and a quarter of the observations are between the medianand the upper quartile. Half of the observations lie between the upper and lower quartiles.
Quantile — an extension of the concept of the median and quartiles. Examples of quantiles are deciles(there are 9 deciles, and 10 percent of the observations fall between any 2 adjacent deciles, as well asbetween the lowest value and the first decile and between the highest value and the ninth decile) and
percentiles (there are 99 percentiles, and 1 percent of the observations fall between any 2 adjacentpercentiles).
qq–plot — a quantile–quantile plot. Used to see if 2 data sets come from populations with a commondistribution, or if a sample comes from a particular distribution (usually the normal distribution). The
quantiles of the one data set are plotted against the quantiles of the other data set. If they have a commondistribution, the plots will be along a straight line (the 45° line if the same scale is used on the x and yaxes).
Reliability — the extent to which the items contributing to a scale appear to be measuring the same
thing. Reliability is important, because reliable scales are more variable, and so there is a better chancethat a statistician can develop a model to explain that variability. Scales with low reliability would havevalues clustered around the mean. Think of 3 people answering 2 questions, and suppose that the
responses to the first question were 1, 3, 5. If the scale was reliable, the responses to the second questionmay be 2, 3, 5 (similar to the responses to the first question, but not necessarily the same), which wouldgive a combined scale (if we just add the responses) of 1 + 2 = 3, 3 + 3 = 6, and 5 + 5 = 10. On the other
hand, responses to the second question if the scale was not reliable may have been 4, 4, 1, which wouldgive a combined scale of 1 + 4 = 5, 3 + 4 = 7, and 5 + 1 = 6, all of which are pretty close in value.
Regression — regression analysis attempts to fit a line to a scatter of points. Linear regression fits astraight line, but it is also possible to fit curved lines. Simple linear regression has a dependent variable
and a single independent variable; multiple regression has (usually) a single dependent variable and 2 ormore independent variables. For each independent variable, the slope coefficient measures the amount ofchange in the dependent variable for a unit change (change of 1) in the independent variable.
Sample size — the number of young people (or parents or teachers, depending on the instrument beingdiscussed) in the study.
Scale — this word can be used to mean a composite new variable formed from the values of a number ofitems attempting to measure some theoretical construct of interest.

322
Scatter plot — a simple plot to illustrate the strength of the relationship between 2 variables (represented
on the 2 axes). Each observation is represented by a dot, spot, or cross on the graph. If the relationship islinear, then these spots lie on either side of a straight line, that can be fitted using regression, so a scatterplot is a useful way to check assumptions of linearity in relationships.
Significance level — a magic, but arbitrary, number used to determine whether a test of hypothesis is
significant or not. One very commonly used level of significance is 5 percent, in which case any test witha p–value < 0.05 is found to be significant. In this study we have usually used a significance level of 0.01.
Skew distribution — one in which most of the observations lie at one end of the range, but there arevalues at the other extreme of the range (a typical example is income: most people have moderateincomes, but there is always a sizeable number of people with extremely high–incomes).
Standard deviation (SD) — a measure of how variable the variable is. In a symmetric distribution,about a two–thirds of the observations lie within one standard deviation of the mean (if the mean is 20and the SD is 5, then two–thirds of the observations will be between 15 = 20 – 5 and 25 = 20 + 5), andabout 95 percent will lie within 2 standard deviations of the mean (in the example, between 10 and 30).
Standard error (SE) — the SD is usually the measure of how variable the variable is. However, if 2samples from the same population were selected, common sense suggests that they would have differentsample values: different means and different SDs, for instance. This leads to the idea of the sampling
distribution of the sample mean (where the sample mean itself is treated like a variable), and the SE is theSD of the sampling distribution of the sample mean. If the SD = σ, then the corresponding SE n/σ=where n is the sample size. So the SE depends both on the SD and on the sample size (the bigger thesample, the smaller the SE).
Symmetric distribution — any distribution in which there are equal numbers of relatively high andrelatively low observations; the distribution is symmetric about the “average”.
Test statistic — a value calculated from the observed values, that will, by statistical theory, enable theresearcher to test a null hypothesis.
Variable — a quantity that varies between the individuals measured (e.g. gender, height, maths score,satisfaction with current school).
References
Cohen, J. (1988). Statistical Power Analysis for the Behavioral Sciences. Hillsdale, NJ: Lawrence EarlbaumAssociates.
Cox, T. F., Cox & M. A. A. (1994). Multidimensional Scaling. London: Chapman & Hall.Draper, N. R., & H. Smith. (1998). Applied Regression Analysis. New York: Wiley.Fox, J. (1984). Linear Statistical Models and Related Methods: With Applications to Social Research. New
York, Wiley.Hastie, T., Tibshirani R., Friedman, J. (2001). The Elements of Statistical Learning. Data Mining, Inference
and Prediction. New York, Springer.
323
Hoaglin, D. C., Mosteller F., Tukey, J. ( Eds.) (1983). Understanding Robust and Exploratory Data Analysis.New York: Wiley & Sons.
Jackson, J. E. (1991). A User's Guide to Principal Components. New York: John Wiley & Sons.Krzanowski, W. J. (1988). Principles of Multivariate Analysis: A User's Perspective. Oxford, UK: Clarendon
Press.Mardia, K. V., Kent J. T., Bibby, J.M. (1979). Multivariate Analysis. London: Academic Press.Rosnow, R. L. & Rosenthal R. (1996). "Computing contrasts, effect sizes, and counternulls on other people's
published data: General procedures for research consumers."Psychological Methods, 1, 331–340.Tukey, J. (1977). Exploratory Data Analysis. Reading: Addison-Wesley.Velleman, P. F.(1993). Learning Data Analysis with Data Desk. New York: FreemanVelleman, P. F., & Hoaglin D. C. (1981). Applications, Basics and Computing of Exploratory Data Analysis.
Boston: Duxbury.
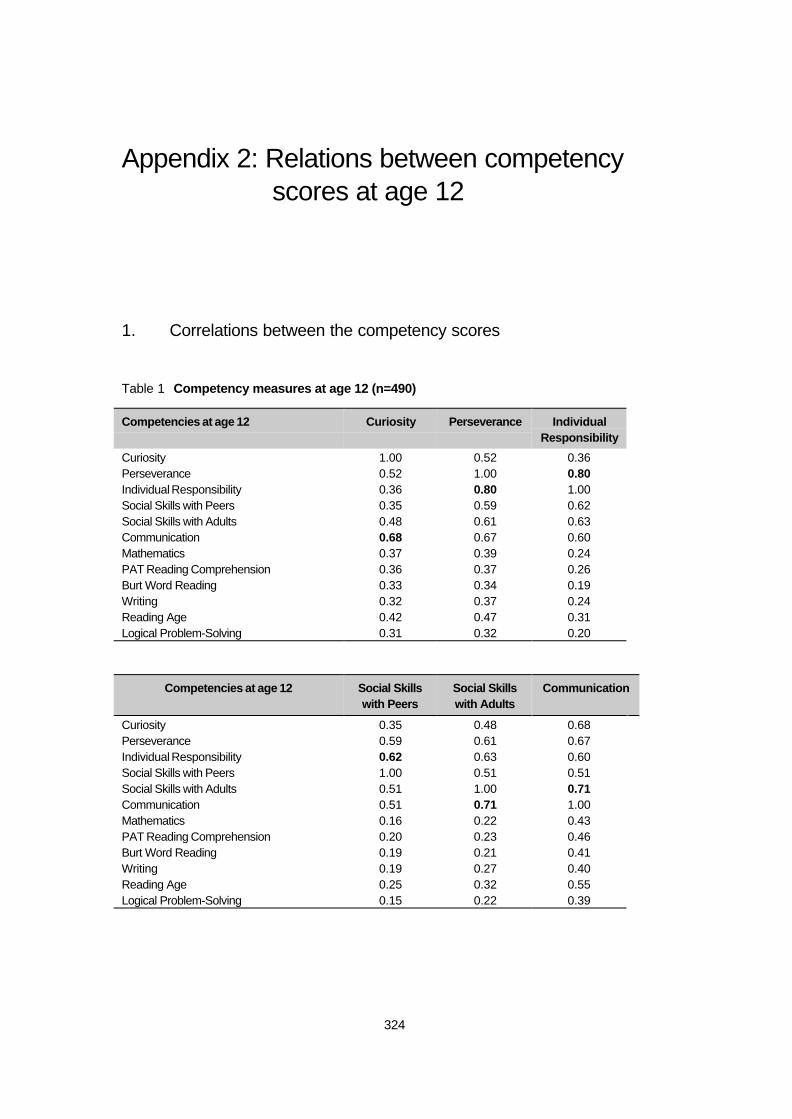
324
Appendix 2: Relations between competencyscores at age 12
1. Correlations between the competency scores
Table 1 Competency measures at age 12 (n=490)
Competencies at age 12 Curiosity Perseverance IndividualResponsibility
Curiosity 1.00 0.52 0.36Perseverance 0.52 1.00 0.80Individual Responsibility 0.36 0.80 1.00Social Skills with Peers 0.35 0.59 0.62Social Skills with Adults 0.48 0.61 0.63Communication 0.68 0.67 0.60Mathematics 0.37 0.39 0.24PAT Reading Comprehension 0.36 0.37 0.26Burt Word Reading 0.33 0.34 0.19Writing 0.32 0.37 0.24Reading Age 0.42 0.47 0.31Logical Problem-Solving 0.31 0.32 0.20
Competencies at age 12 Social Skillswith Peers
Social Skillswith Adults
Communication
Curiosity 0.35 0.48 0.68Perseverance 0.59 0.61 0.67Individual Responsibility 0.62 0.63 0.60Social Skills with Peers 1.00 0.51 0.51Social Skills with Adults 0.51 1.00 0.71Communication 0.51 0.71 1.00Mathematics 0.16 0.22 0.43PAT Reading Comprehension 0.20 0.23 0.46Burt Word Reading 0.19 0.21 0.41Writing 0.19 0.27 0.40Reading Age 0.25 0.32 0.55Logical Problem-Solving 0.15 0.22 0.39
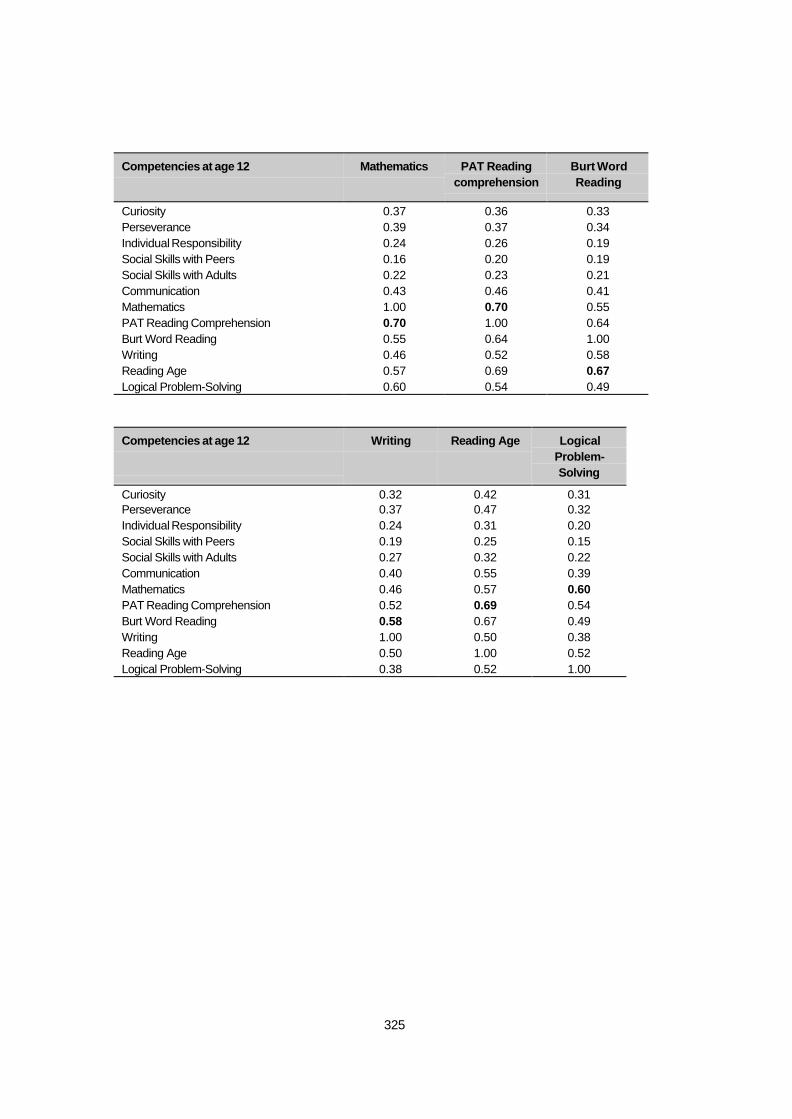
325
Competencies at age 12 Mathematics PAT Readingcomprehension
Burt WordReading
Curiosity 0.37 0.36 0.33Perseverance 0.39 0.37 0.34Individual Responsibility 0.24 0.26 0.19Social Skills with Peers 0.16 0.20 0.19Social Skills with Adults 0.22 0.23 0.21Communication 0.43 0.46 0.41Mathematics 1.00 0.70 0.55PAT Reading Comprehension 0.70 1.00 0.64Burt Word Reading 0.55 0.64 1.00Writing 0.46 0.52 0.58Reading Age 0.57 0.69 0.67Logical Problem-Solving 0.60 0.54 0.49
Competencies at age 12 Writing Reading Age LogicalProblem-Solving
Curiosity 0.32 0.42 0.31Perseverance 0.37 0.47 0.32Individual Responsibility 0.24 0.31 0.20Social Skills with Peers 0.19 0.25 0.15Social Skills with Adults 0.27 0.32 0.22Communication 0.40 0.55 0.39Mathematics 0.46 0.57 0.60PAT Reading Comprehension 0.52 0.69 0.54Burt Word Reading 0.58 0.67 0.49Writing 1.00 0.50 0.38Reading Age 0.50 1.00 0.52Logical Problem-Solving 0.38 0.52 1.00
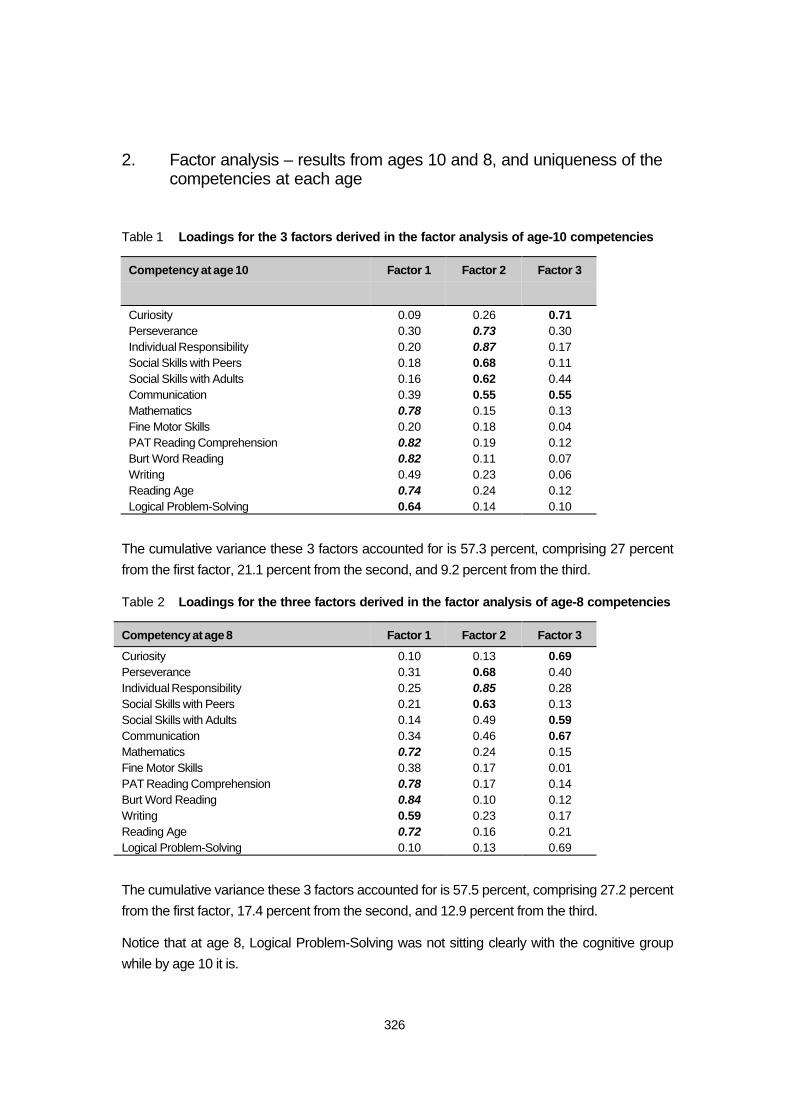
326
2. Factor analysis – results from ages 10 and 8, and uniqueness of thecompetencies at each age
Table 1 Loadings for the 3 factors derived in the factor analysis of age-10 competencies
Competency at age 10 Factor 1 Factor 2 Factor 3
Curiosity 0.09 0.26 0.71Perseverance 0.30 0.73 0.30Individual Responsibility 0.20 0.87 0.17Social Skills with Peers 0.18 0.68 0.11Social Skills with Adults 0.16 0.62 0.44Communication 0.39 0.55 0.55Mathematics 0.78 0.15 0.13Fine Motor Skills 0.20 0.18 0.04PAT Reading Comprehension 0.82 0.19 0.12Burt Word Reading 0.82 0.11 0.07Writing 0.49 0.23 0.06Reading Age 0.74 0.24 0.12Logical Problem-Solving 0.64 0.14 0.10
The cumulative variance these 3 factors accounted for is 57.3 percent, comprising 27 percentfrom the first factor, 21.1 percent from the second, and 9.2 percent from the third.
Table 2 Loadings for the three factors derived in the factor analysis of age-8 competencies
Competency at age 8 Factor 1 Factor 2 Factor 3
Curiosity 0.10 0.13 0.69Perseverance 0.31 0.68 0.40Individual Responsibility 0.25 0.85 0.28Social Skills with Peers 0.21 0.63 0.13Social Skills with Adults 0.14 0.49 0.59Communication 0.34 0.46 0.67Mathematics 0.72 0.24 0.15Fine Motor Skills 0.38 0.17 0.01PAT Reading Comprehension 0.78 0.17 0.14Burt Word Reading 0.84 0.10 0.12Writing 0.59 0.23 0.17Reading Age 0.72 0.16 0.21Logical Problem-Solving 0.10 0.13 0.69
The cumulative variance these 3 factors accounted for is 57.5 percent, comprising 27.2 percentfrom the first factor, 17.4 percent from the second, and 12.9 percent from the third.
Notice that at age 8, Logical Problem-Solving was not sitting clearly with the cognitive groupwhile by age 10 it is.
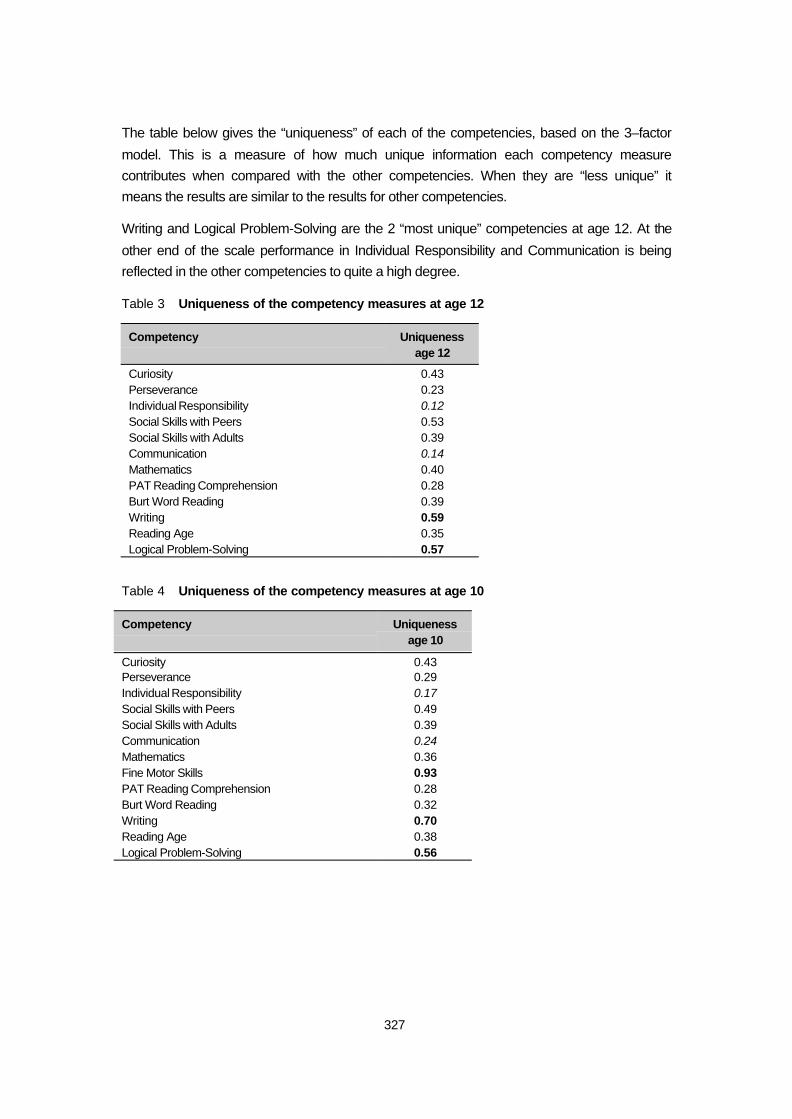
327
The table below gives the “uniqueness” of each of the competencies, based on the 3–factor
model. This is a measure of how much unique information each competency measurecontributes when compared with the other competencies. When they are “less unique” itmeans the results are similar to the results for other competencies.
Writing and Logical Problem-Solving are the 2 “most unique” competencies at age 12. At the
other end of the scale performance in Individual Responsibility and Communication is beingreflected in the other competencies to quite a high degree.
Table 3 Uniqueness of the competency measures at age 12
Competency Uniquenessage 12
Curiosity 0.43Perseverance 0.23Individual Responsibility 0.12Social Skills with Peers 0.53Social Skills with Adults 0.39Communication 0.14Mathematics 0.40PAT Reading Comprehension 0.28Burt Word Reading 0.39Writing 0.59Reading Age 0.35Logical Problem-Solving 0.57
Table 4 Uniqueness of the competency measures at age 10
Competency Uniquenessage 10
Curiosity 0.43Perseverance 0.29Individual Responsibility 0.17Social Skills with Peers 0.49Social Skills with Adults 0.39Communication 0.24Mathematics 0.36Fine Motor Skills 0.93PAT Reading Comprehension 0.28Burt Word Reading 0.32Writing 0.70Reading Age 0.38Logical Problem-Solving 0.56
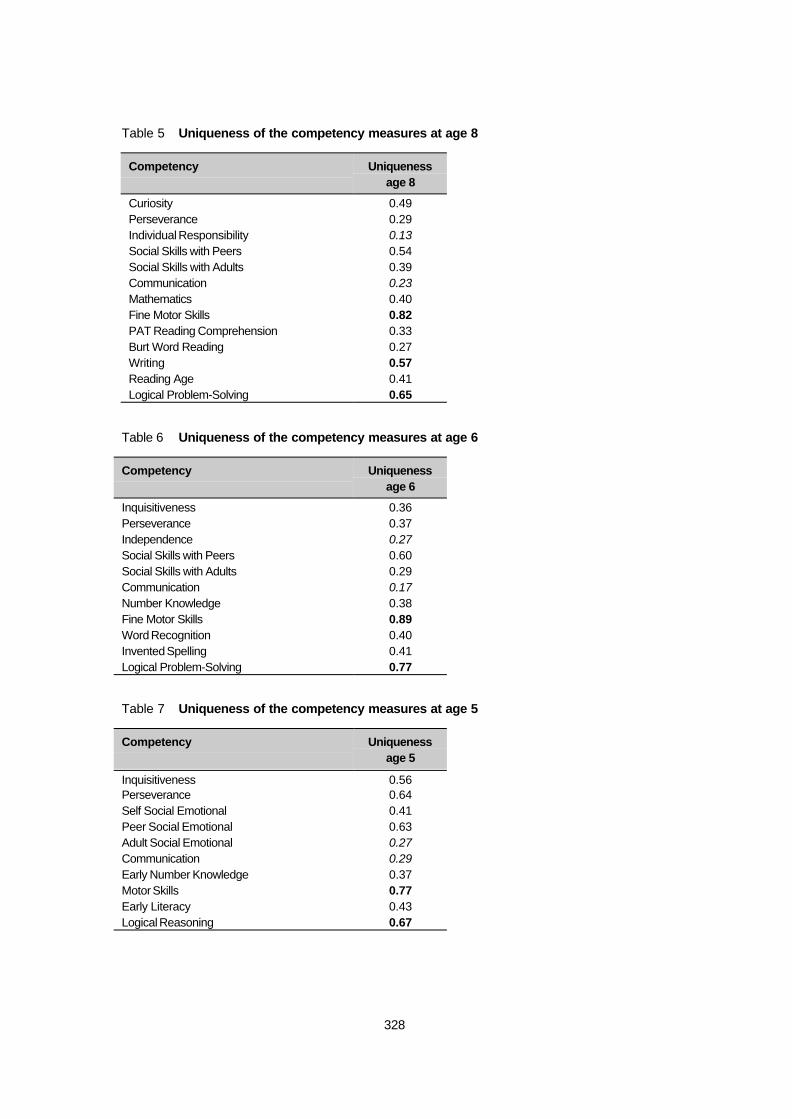
328
Table 5 Uniqueness of the competency measures at age 8
Competency Uniquenessage 8
Curiosity 0.49Perseverance 0.29Individual Responsibility 0.13Social Skills with Peers 0.54Social Skills with Adults 0.39Communication 0.23Mathematics 0.40Fine Motor Skills 0.82PAT Reading Comprehension 0.33Burt Word Reading 0.27Writing 0.57Reading Age 0.41Logical Problem-Solving 0.65
Table 6 Uniqueness of the competency measures at age 6
Competency Uniquenessage 6
Inquisitiveness 0.36Perseverance 0.37Independence 0.27Social Skills with Peers 0.60Social Skills with Adults 0.29Communication 0.17Number Knowledge 0.38Fine Motor Skills 0.89Word Recognition 0.40Invented Spelling 0.41Logical Problem-Solving 0.77
Table 7 Uniqueness of the competency measures at age 5
Competency Uniquenessage 5
Inquisitiveness 0.56Perseverance 0.64Self Social Emotional 0.41Peer Social Emotional 0.63Adult Social Emotional 0.27Communication 0.29Early Number Knowledge 0.37Motor Skills 0.77Early Literacy 0.43Logical Reasoning 0.67
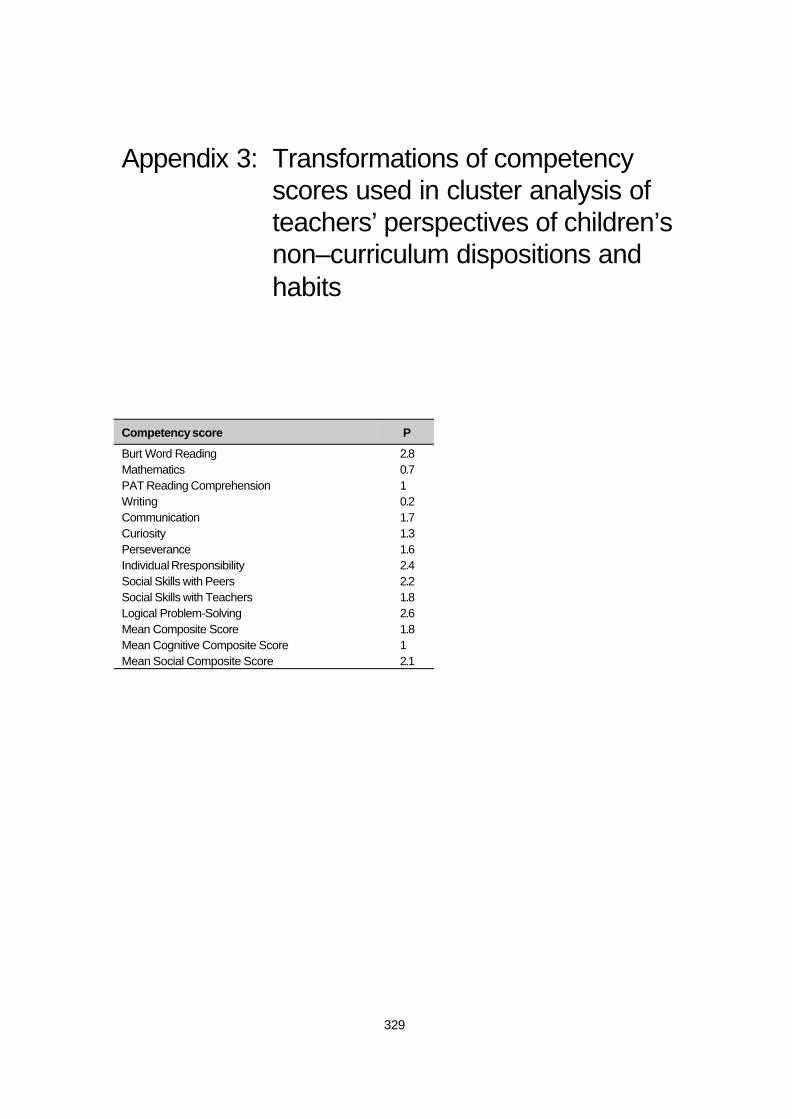
329
Appendix 3: Transformations of competencyscores used in cluster analysis ofteachers’ perspectives of children’snon–curriculum dispositions andhabits
Competency score P
Burt Word Reading 2.8Mathematics 0.7PAT Reading Comprehension 1Writing 0.2Communication 1.7Curiosity 1.3Perseverance 1.6Individual Rresponsibility 2.4Social Skills with Peers 2.2Social Skills with Teachers 1.8Logical Problem-Solving 2.6Mean Composite Score 1.8Mean Cognitive Composite Score 1Mean Social Composite Score 2.1

330
Appendix 4: Summaries of sizeable associations
MathematicsNumber
oflevels
Factor in order of association bysize of largest observed significant
sub–group difference
Factor levels withgenerally lowperformance
Factor levels withmiddling performance
Factor levels withgenerally highperformance
Largestobserveddifference
s.e ofgiven
difference
Percentvariance
formodel
4 levels History of school decile group mostly 1–2 all 3–8, or mixed all 9–10 39.9 5.4 21.3
4 levels Teacher view of achievement at age12
minimal/<average average to v.good v.good/excellent 38.5 2.8 33.3
4 levels Teacher view of achievement at age10
minimal/<average average to v.good v.good/excellent 37.9 2.9 34.9
6 levels Mother's education at the birth of thefirst child
none anything in between university 32.6 3.5 16.5
6 levels Parental aspiration for child at 12 School Cert. level far as wants, or uni/tert. enough to be worthwhile 30.8 10.8 9.7
3 levels Student learns most things prettyquickly
rarely/never occasionally usually 29.9 5.8 14.3
6 levels Father's education when child was 5 none mid or snr.sch.,trade or tert. university 29.6 3.7 16.7
5 levels School decile group at age 6 1–2 5–6 9–10 29.3 4.8 15.1
6 levels ECE type at near-age 5 A’oga Amata kindergarten FDC,PPres,CRCC&Plyctr 29.3 8.1 4.44 levels Teacher view of achievement at age 6 minimal/<average average to v.good v.good/excellent 29.1 3.8 22.2
5 levels Mother's education by time child is 12 none degree 27.5 4.2 13.1
5 levels TV watching at age 8 3 hours or more none 27.5 8.0 4.3
7 levels Parent's TV watching at age 12 >=4 hours daily amounts in between none 27.0 7.5 7.08 levels Time per.wk on computer out of school none or no computer 3.5–5 hours 25.3 4.1 8.3
5 levels TV watching at age 5 3 hours or more none 25.0 7.8 6.4
4 levels Parental support for class none or infrequent sometimes v.good or fantastic 24.7 6.4 5.7
3 levels Student feels close to family at home occasionally usually 24.3 6.7 3.25 levels School decile group at age 10 1–2 3–4, 7–8 9–10 23.9 3.3 12.3
5 levels School decile group at age 12 1–2 3–4, 5–6, 7–8 9–10 23.6 3.6 9.2
6 levels History upsets or not and how coped upsets each age, no coping 2 out of 3 upsets each age, coped, orvaried
22.9 6.4 3.2
5 levels TV watching at age 6 3 hours or more none 22.3 7.5 6.4
5 levels Student's current response to school bored, routine, ormixed
enjoys while to settle 22.3 7.9 2.2
4 levels Family income at age 5 >$20K–$30K >$30K–$60K >$60K 22.0 3.7 11.8
3 levels Student is comfortable at home occas./rarely/never usually 21.6 5.9 2.7
5 levels School decile group at age 8 1–2 9–10 21.5 3.6 9.5
3 levels Students keep out of trouble at school rarely/never occasionally usually 21.2 5.4 7.54 levels Student does what likes at home rarely/never occasionally usually 21.1 4.0 8.8
5 levels Parental handling disagreements at 12 student “wins” mixed appr. or parent“wins”
negotiation 21.0 5.7 3.5
5 levels Student's view of importance ofhomework
don't know it matters 21.0 6.1 4.8
4 levels Socio-economic mix of ECE all else middle–class 20.6 4.6 16.3
5 levels History of school ownership all state all private 20.5 8.6 3.25 levels History of class size class sizes up & down always small (up to 25) 20.4 6.8 3.9
4 levels Student helps out at home rarely/never usually 19.9 7.7 2.8
4 levels Ethnicity Pasifika Asian 19.7 7.1 7.0
5 levels TV watching at age 10 3 hours or more none 19.7 8.5 3.33 levels Student could do better work if he/she
triedusually occasionally rarely/never 19.3 3.4 8.8
3 levels Student feels doing well at schoolwhen work hard
disagree not sure/it depends agree 19.2 5.9 2.6
3 levels If computer at home, plays games on it no computer yes comp, yes games 19.1 3.3 7.0
3 levels Enjoyment of reading no qualified yes yes 18.6 3.1 8.1
4 levels Student has interesting things to do athome
usually occasionally always 18.3 7.0 2.6
4 levels Student gets bored at home always usually rarely/never 18.2 5.2 4.1
4 levels Student gets treated fairly at home rarely/never always 18.2 8.4 1.6
4 levels Family knows student done homework rarely/never usually 18.1 6.9 2.33 levels History of class size mixed always small (up to 25) 18.0 6.4 3.0
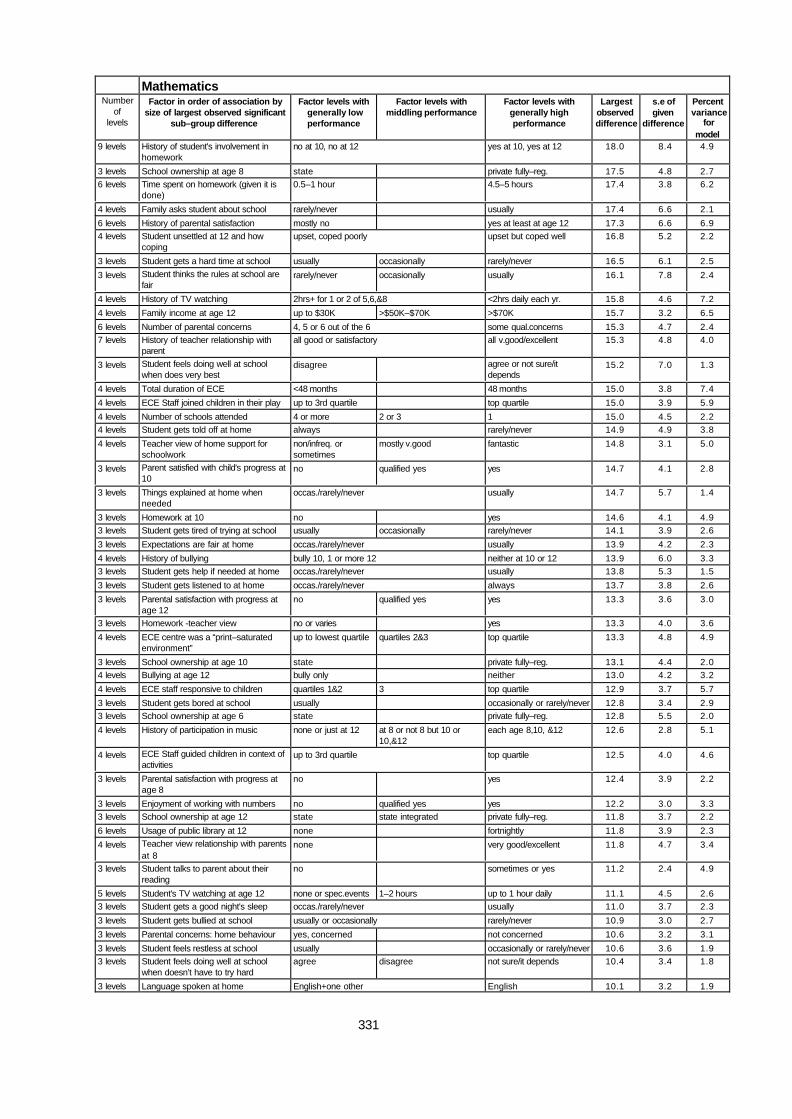
331
MathematicsNumber
oflevels
Factor in order of association bysize of largest observed significant
sub–group difference
Factor levels withgenerally lowperformance
Factor levels withmiddling performance
Factor levels withgenerally highperformance
Largestobserveddifference
s.e ofgiven
difference
Percentvariance
formodel
9 levels History of student's involvement inhomework
no at 10, no at 12 yes at 10, yes at 12 18.0 8.4 4.9
3 levels School ownership at age 8 state private fully–reg. 17.5 4.8 2.76 levels Time spent on homework (given it is
done)0.5–1 hour 4.5–5 hours 17.4 3.8 6.2
4 levels Family asks student about school rarely/never usually 17.4 6.6 2.1
6 levels History of parental satisfaction mostly no yes at least at age 12 17.3 6.6 6.94 levels Student unsettled at 12 and how
copingupset, coped poorly upset but coped well 16.8 5.2 2.2
3 levels Student gets a hard time at school usually occasionally rarely/never 16.5 6.1 2.5
3 levels Student thinks the rules at school arefair
rarely/never occasionally usually 16.1 7.8 2.4
4 levels History of TV watching 2hrs+ for 1 or 2 of 5,6,&8 <2hrs daily each yr. 15.8 4.6 7.2
4 levels Family income at age 12 up to $30K >$50K–$70K >$70K 15.7 3.2 6.5
6 levels Number of parental concerns 4, 5 or 6 out of the 6 some qual.concerns 15.3 4.7 2.47 levels History of teacher relationship with
parentall good or satisfactory all v.good/excellent 15.3 4.8 4.0
3 levels Student feels doing well at schoolwhen does very best
disagree agree or not sure/itdepends
15.2 7.0 1.3
4 levels Total duration of ECE <48 months 48 months 15.0 3.8 7.4
4 levels ECE Staff joined children in their play up to 3rd quartile top quartile 15.0 3.9 5.9
4 levels Number of schools attended 4 or more 2 or 3 1 15.0 4.5 2.24 levels Student gets told off at home always rarely/never 14.9 4.9 3.8
4 levels Teacher view of home support forschoolwork
non/infreq. orsometimes
mostly v.good fantastic 14.8 3.1 5.0
3 levels Parent satisfied with child's progress at10
no qualified yes yes 14.7 4.1 2.8
3 levels Things explained at home whenneeded
occas./rarely/never usually 14.7 5.7 1.4
3 levels Homework at 10 no yes 14.6 4.1 4.93 levels Student gets tired of trying at school usually occasionally rarely/never 14.1 3.9 2.6
3 levels Expectations are fair at home occas./rarely/never usually 13.9 4.2 2.3
4 levels History of bullying bully 10, 1 or more 12 neither at 10 or 12 13.9 6.0 3.33 levels Student gets help if needed at home occas./rarely/never usually 13.8 5.3 1.5
3 levels Student gets listened to at home occas./rarely/never always 13.7 3.8 2.6
3 levels Parental satisfaction with progress atage 12
no qualified yes yes 13.3 3.6 3.0
3 levels Homework -teacher view no or varies yes 13.3 4.0 3.6
4 levels ECE centre was a “print–saturatedenvironment”
up to lowest quartile quartiles 2&3 top quartile 13.3 4.8 4.9
3 levels School ownership at age 10 state private fully–reg. 13.1 4.4 2.04 levels Bullying at age 12 bully only neither 13.0 4.2 3.2
4 levels ECE staff responsive to children quartiles 1&2 3 top quartile 12.9 3.7 5.7
3 levels Student gets bored at school usually occasionally or rarely/never 12.8 3.4 2.93 levels School ownership at age 6 state private fully–reg. 12.8 5.5 2.0
4 levels History of participation in music none or just at 12 at 8 or not 8 but 10 or10,&12
each age 8,10, &12 12.6 2.8 5.1
4 levels ECE Staff guided children in context ofactivities
up to 3rd quartile top quartile 12.5 4.0 4.6
3 levels Parental satisfaction with progress atage 8
no yes 12.4 3.9 2.2
3 levels Enjoyment of working with numbers no qualified yes yes 12.2 3.0 3.33 levels School ownership at age 12 state state integrated private fully–reg. 11.8 3.7 2.2
6 levels Usage of public library at 12 none fortnightly 11.8 3.9 2.3
4 levels Teacher view relationship with parentsat 8
none very good/excellent 11.8 4.7 3.4
3 levels Student talks to parent about theirreading
no sometimes or yes 11.2 2.4 4.9
5 levels Student's TV watching at age 12 none or spec.events 1–2 hours up to 1 hour daily 11.1 4.5 2.63 levels Student gets a good night's sleep occas./rarely/never usually 11.0 3.7 2.3
3 levels Student gets bullied at school usually or occasionally rarely/never 10.9 3.0 2.7
3 levels Parental concerns: home behaviour yes, concerned not concerned 10.6 3.2 3.1
3 levels Student feels restless at school usually occasionally or rarely/never 10.6 3.6 1.93 levels Student feels doing well at school
when doesn’t have to try hardagree disagree not sure/it depends 10.4 3.4 1.8
3 levels Language spoken at home English+one other English 10.1 3.2 1.9
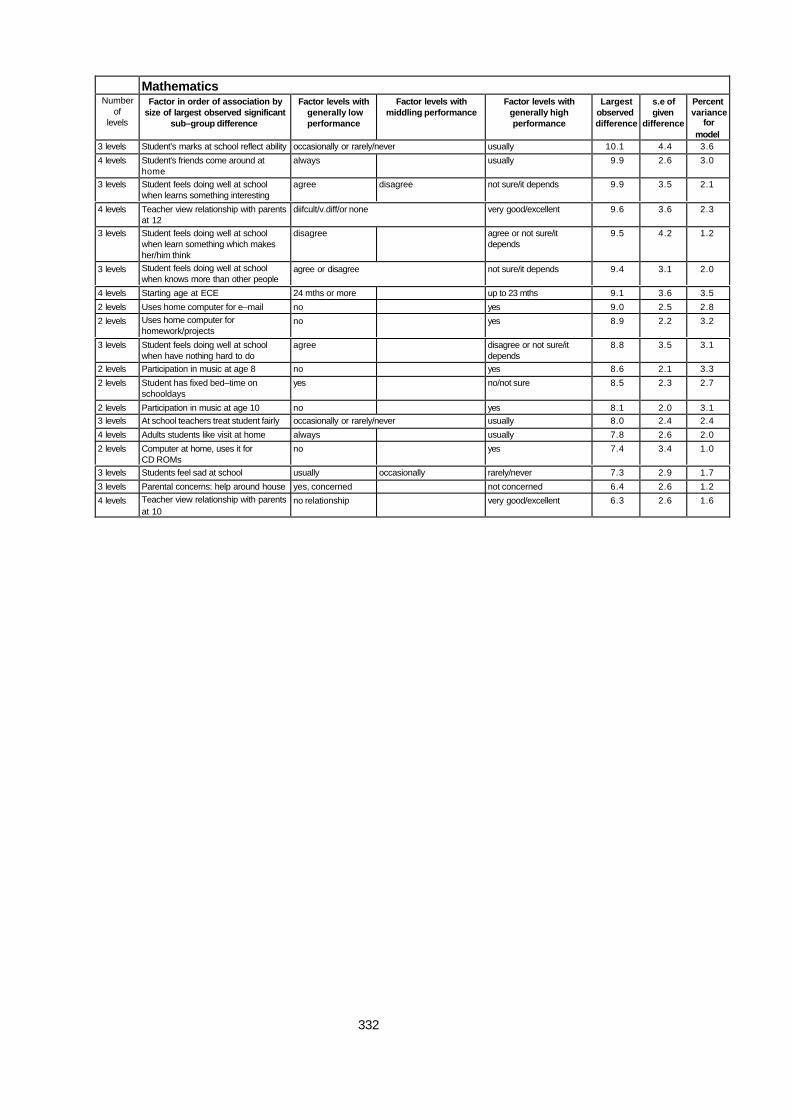
332
MathematicsNumber
oflevels
Factor in order of association bysize of largest observed significant
sub–group difference
Factor levels withgenerally lowperformance
Factor levels withmiddling performance
Factor levels withgenerally highperformance
Largestobserveddifference
s.e ofgiven
difference
Percentvariance
formodel
3 levels Student’s marks at school reflect ability occasionally or rarely/never usually 10.1 4.4 3.6
4 levels Student's friends come around athome
always usually 9.9 2.6 3.0
3 levels Student feels doing well at schoolwhen learns something interesting
agree disagree not sure/it depends 9.9 3.5 2.1
4 levels Teacher view relationship with parentsat 12
diifcult/v.diff/or none very good/excellent 9.6 3.6 2.3
3 levels Student feels doing well at schoolwhen learn something which makesher/him think
disagree agree or not sure/itdepends
9.5 4.2 1.2
3 levels Student feels doing well at schoolwhen knows more than other people
agree or disagree not sure/it depends 9.4 3.1 2.0
4 levels Starting age at ECE 24 mths or more up to 23 mths 9.1 3.6 3.5
2 levels Uses home computer for e–mail no yes 9.0 2.5 2.8
2 levels Uses home computer forhomework/projects
no yes 8.9 2.2 3.2
3 levels Student feels doing well at schoolwhen have nothing hard to do
agree disagree or not sure/itdepends
8.8 3.5 3.1
2 levels Participation in music at age 8 no yes 8.6 2.1 3.3
2 levels Student has fixed bed–time onschooldays
yes no/not sure 8.5 2.3 2.7
2 levels Participation in music at age 10 no yes 8.1 2.0 3.13 levels At school teachers treat student fairly occasionally or rarely/never usually 8.0 2.4 2.4
4 levels Adults students like visit at home always usually 7.8 2.6 2.0
2 levels Computer at home, uses it forCD ROMs
no yes 7.4 3.4 1.0
3 levels Students feel sad at school usually occasionally rarely/never 7.3 2.9 1.7
3 levels Parental concerns: help around house yes, concerned not concerned 6.4 2.6 1.2
4 levels Teacher view relationship with parentsat 10
no relationship very good/excellent 6.3 2.6 1.6
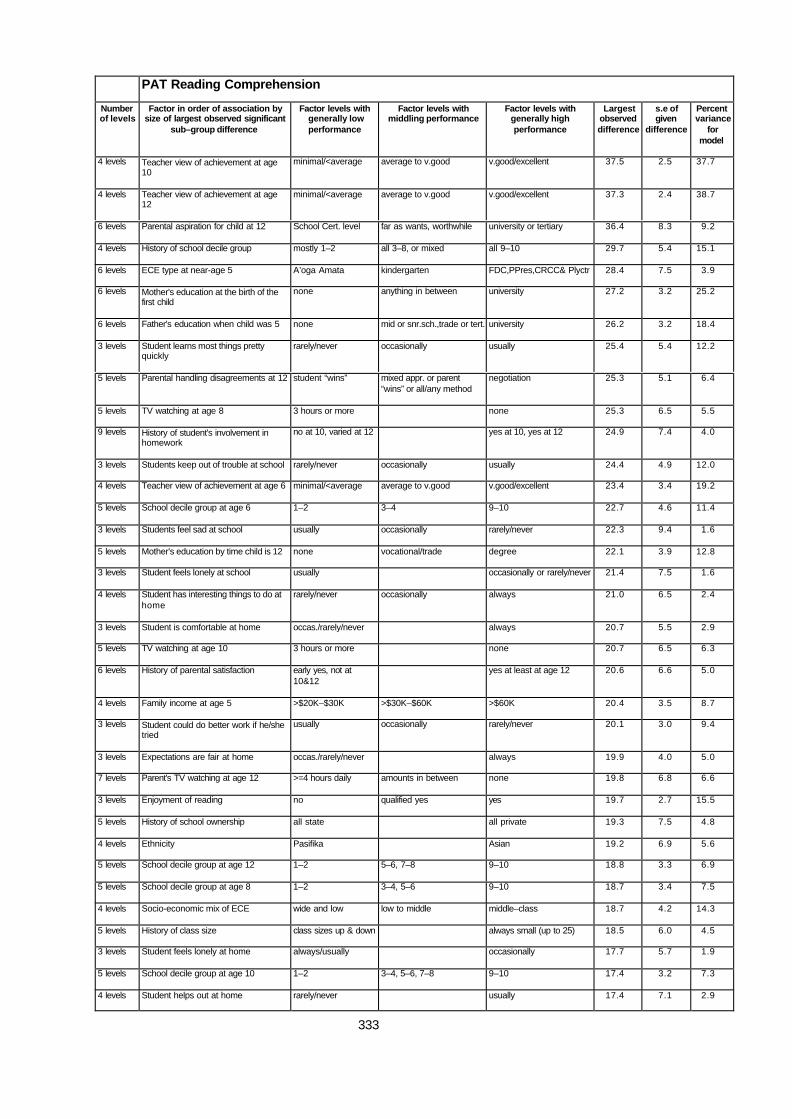
333
PAT Reading Comprehension
Numberof levels
Factor in order of association bysize of largest observed significant
sub–group difference
Factor levels withgenerally lowperformance
Factor levels withmiddling performance
Factor levels withgenerally highperformance
Largestobserveddifference
s.e ofgiven
difference
Percentvariance
formodel
4 levels Teacher view of achievement at age10
minimal/<average average to v.good v.good/excellent 37.5 2.5 37.7
4 levels Teacher view of achievement at age12
minimal/<average average to v.good v.good/excellent 37.3 2.4 38.7
6 levels Parental aspiration for child at 12 School Cert. level far as wants, worthwhile university or tertiary 36.4 8.3 9.2
4 levels History of school decile group mostly 1–2 all 3–8, or mixed all 9–10 29.7 5.4 15.1
6 levels ECE type at near-age 5 A’oga Amata kindergarten FDC,PPres,CRCC& Plyctr 28.4 7.5 3.9
6 levels Mother's education at the birth of thefirst child
none anything in between university 27.2 3.2 25.2
6 levels Father's education when child was 5 none mid or snr.sch.,trade or tert. university 26.2 3.2 18.4
3 levels Student learns most things prettyquickly
rarely/never occasionally usually 25.4 5.4 12.2
5 levels Parental handling disagreements at 12 student “wins” mixed appr. or parent“wins” or all/any method
negotiation 25.3 5.1 6.4
5 levels TV watching at age 8 3 hours or more none 25.3 6.5 5.5
9 levels History of student's involvement inhomework
no at 10, varied at 12 yes at 10, yes at 12 24.9 7.4 4.0
3 levels Students keep out of trouble at school rarely/never occasionally usually 24.4 4.9 12.0
4 levels Teacher view of achievement at age 6 minimal/<average average to v.good v.good/excellent 23.4 3.4 19.2
5 levels School decile group at age 6 1–2 3–4 9–10 22.7 4.6 11.4
3 levels Students feel sad at school usually occasionally rarely/never 22.3 9.4 1.6
5 levels Mother's education by time child is 12 none vocational/trade degree 22.1 3.9 12.8
3 levels Student feels lonely at school usually occasionally or rarely/never 21.4 7.5 1.6
4 levels Student has interesting things to do athome
rarely/never occasionally always 21.0 6.5 2.4
3 levels Student is comfortable at home occas./rarely/never always 20.7 5.5 2.9
5 levels TV watching at age 10 3 hours or more none 20.7 6.5 6.3
6 levels History of parental satisfaction early yes, not at10&12
yes at least at age 12 20.6 6.6 5.0
4 levels Family income at age 5 >$20K–$30K >$30K–$60K >$60K 20.4 3.5 8.7
3 levels Student could do better work if he/shetried
usually occasionally rarely/never 20.1 3.0 9.4
3 levels Expectations are fair at home occas./rarely/never always 19.9 4.0 5.0
7 levels Parent's TV watching at age 12 >=4 hours daily amounts in between none 19.8 6.8 6.6
3 levels Enjoyment of reading no qualified yes yes 19.7 2.7 15.5
5 levels History of school ownership all state all private 19.3 7.5 4.8
4 levels Ethnicity Pasifika Asian 19.2 6.9 5.6
5 levels School decile group at age 12 1–2 5–6, 7–8 9–10 18.8 3.3 6.9
5 levels School decile group at age 8 1–2 3–4, 5–6 9–10 18.7 3.4 7.5
4 levels Socio-economic mix of ECE wide and low low to middle middle–class 18.7 4.2 14.3
5 levels History of class size class sizes up & down always small (up to 25) 18.5 6.0 4.5
3 levels Student feels lonely at home always/usually occasionally 17.7 5.7 1.9
5 levels School decile group at age 10 1–2 3–4, 5–6, 7–8 9–10 17.4 3.2 7.3
4 levels Student helps out at home rarely/never usually 17.4 7.1 2.9
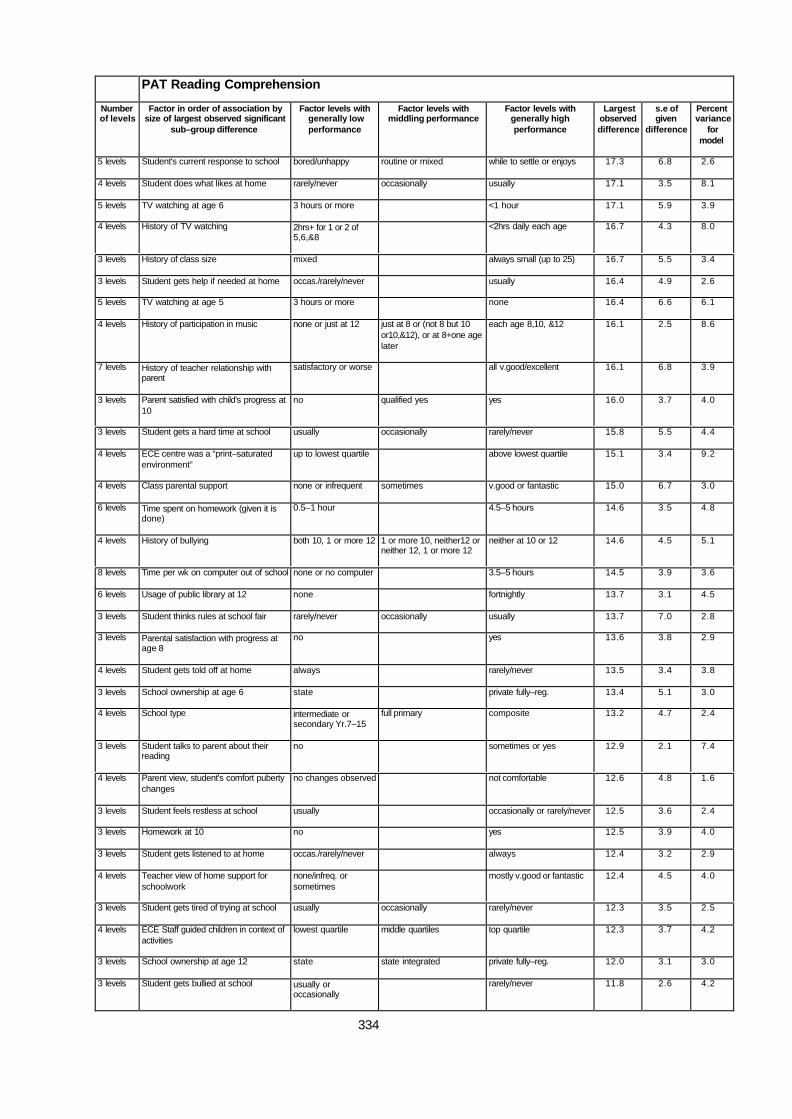
334
PAT Reading Comprehension
Numberof levels
Factor in order of association bysize of largest observed significant
sub–group difference
Factor levels withgenerally lowperformance
Factor levels withmiddling performance
Factor levels withgenerally highperformance
Largestobserveddifference
s.e ofgiven
difference
Percentvariance
formodel
5 levels Student's current response to school bored/unhappy routine or mixed while to settle or enjoys 17.3 6.8 2.6
4 levels Student does what likes at home rarely/never occasionally usually 17.1 3.5 8.1
5 levels TV watching at age 6 3 hours or more <1 hour 17.1 5.9 3.9
4 levels History of TV watching 2hrs+ for 1 or 2 of5,6,&8
<2hrs daily each age 16.7 4.3 8.0
3 levels History of class size mixed always small (up to 25) 16.7 5.5 3.4
3 levels Student gets help if needed at home occas./rarely/never usually 16.4 4.9 2.6
5 levels TV watching at age 5 3 hours or more none 16.4 6.6 6.1
4 levels History of participation in music none or just at 12 just at 8 or (not 8 but 10or10,&12), or at 8+one agelater
each age 8,10, &12 16.1 2.5 8.6
7 levels History of teacher relationship withparent
satisfactory or worse all v.good/excellent 16.1 6.8 3.9
3 levels Parent satisfied with child's progress at10
no qualified yes yes 16.0 3.7 4.0
3 levels Student gets a hard time at school usually occasionally rarely/never 15.8 5.5 4.4
4 levels ECE centre was a “print–saturatedenvironment”
up to lowest quartile above lowest quartile 15.1 3.4 9.2
4 levels Class parental support none or infrequent sometimes v.good or fantastic 15.0 6.7 3.0
6 levels Time spent on homework (given it isdone)
0.5–1 hour 4.5–5 hours 14.6 3.5 4.8
4 levels History of bullying both 10, 1 or more 12 1 or more 10, neither12 orneither 12, 1 or more 12
neither at 10 or 12 14.6 4.5 5.1
8 levels Time per wk on computer out of school none or no computer 3.5–5 hours 14.5 3.9 3.6
6 levels Usage of public library at 12 none fortnightly 13.7 3.1 4.5
3 levels Student thinks rules at school fair rarely/never occasionally usually 13.7 7.0 2.8
3 levels Parental satisfaction with progress atage 8
no yes 13.6 3.8 2.9
4 levels Student gets told off at home always rarely/never 13.5 3.4 3.8
3 levels School ownership at age 6 state private fully–reg. 13.4 5.1 3.0
4 levels School type intermediate orsecondary Yr.7–15
full primary composite 13.2 4.7 2.4
3 levels Student talks to parent about theirreading
no sometimes or yes 12.9 2.1 7.4
4 levels Parent view, student's comfort pubertychanges
no changes observed not comfortable 12.6 4.8 1.6
3 levels Student feels restless at school usually occasionally or rarely/never 12.5 3.6 2.4
3 levels Homework at 10 no yes 12.5 3.9 4.0
3 levels Student gets listened to at home occas./rarely/never always 12.4 3.2 2.9
4 levels Teacher view of home support forschoolwork
none/infreq. orsometimes
mostly v.good or fantastic 12.4 4.5 4.0
3 levels Student gets tired of trying at school usually occasionally rarely/never 12.3 3.5 2.5
4 levels ECE Staff guided children in context ofactivities
lowest quartile middle quartiles top quartile 12.3 3.7 4.2
3 levels School ownership at age 12 state state integrated private fully–reg. 12.0 3.1 3.0
3 levels Student gets bullied at school usually oroccasionally
rarely/never 11.8 2.6 4.2
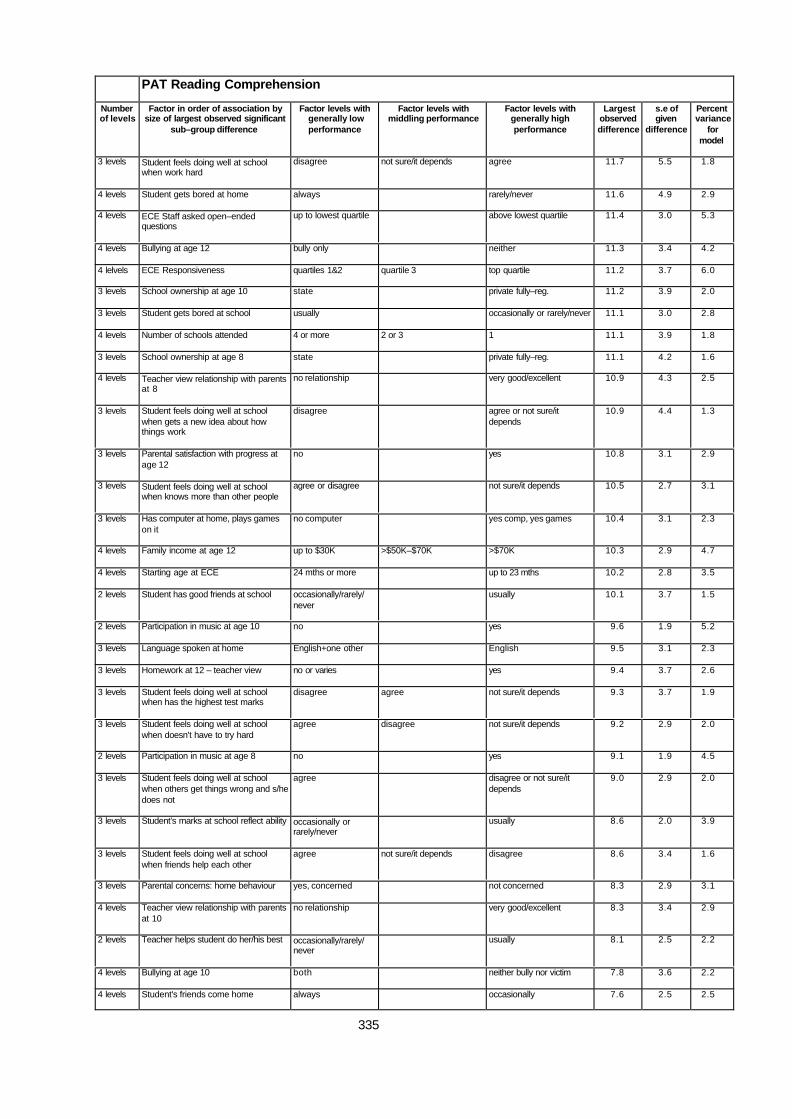
335
PAT Reading Comprehension
Numberof levels
Factor in order of association bysize of largest observed significant
sub–group difference
Factor levels withgenerally lowperformance
Factor levels withmiddling performance
Factor levels withgenerally highperformance
Largestobserveddifference
s.e ofgiven
difference
Percentvariance
formodel
3 levels Student feels doing well at schoolwhen work hard
disagree not sure/it depends agree 11.7 5.5 1.8
4 levels Student gets bored at home always rarely/never 11.6 4.9 2.9
4 levels ECE Staff asked open–endedquestions
up to lowest quartile above lowest quartile 11.4 3.0 5.3
4 levels Bullying at age 12 bully only neither 11.3 3.4 4.2
4 lelvels ECE Responsiveness quartiles 1&2 quartile 3 top quartile 11.2 3.7 6.0
3 levels School ownership at age 10 state private fully–reg. 11.2 3.9 2.0
3 levels Student gets bored at school usually occasionally or rarely/never 11.1 3.0 2.8
4 levels Number of schools attended 4 or more 2 or 3 1 11.1 3.9 1.8
3 levels School ownership at age 8 state private fully–reg. 11.1 4.2 1.6
4 levels Teacher view relationship with parentsat 8
no relationship very good/excellent 10.9 4.3 2.5
3 levels Student feels doing well at schoolwhen gets a new idea about howthings work
disagree agree or not sure/itdepends
10.9 4.4 1.3
3 levels Parental satisfaction with progress atage 12
no yes 10.8 3.1 2.9
3 levels Student feels doing well at schoolwhen knows more than other people
agree or disagree not sure/it depends 10.5 2.7 3.1
3 levels Has computer at home, plays gameson it
no computer yes comp, yes games 10.4 3.1 2.3
4 levels Family income at age 12 up to $30K >$50K–$70K >$70K 10.3 2.9 4.7
4 levels Starting age at ECE 24 mths or more up to 23 mths 10.2 2.8 3.5
2 levels Student has good friends at school occasionally/rarely/never
usually 10.1 3.7 1.5
2 levels Participation in music at age 10 no yes 9.6 1.9 5.2
3 levels Language spoken at home English+one other English 9.5 3.1 2.3
3 levels Homework at 12 – teacher view no or varies yes 9.4 3.7 2.6
3 levels Student feels doing well at schoolwhen has the highest test marks
disagree agree not sure/it depends 9.3 3.7 1.9
3 levels Student feels doing well at schoolwhen doesn’t have to try hard
agree disagree not sure/it depends 9.2 2.9 2.0
2 levels Participation in music at age 8 no yes 9.1 1.9 4.5
3 levels Student feels doing well at schoolwhen others get things wrong and s/hedoes not
agree disagree or not sure/itdepends
9.0 2.9 2.0
3 levels Student’s marks at school reflect ability occasionally orrarely/never
usually 8.6 2.0 3.9
3 levels Student feels doing well at schoolwhen friends help each other
agree not sure/it depends disagree 8.6 3.4 1.6
3 levels Parental concerns: home behaviour yes, concerned not concerned 8.3 2.9 3.1
4 levels Teacher view relationship with parentsat 10
no relationship very good/excellent 8.3 3.4 2.9
2 levels Teacher helps student do her/his best occasionally/rarely/never
usually 8.1 2.5 2.2
4 levels Bullying at age 10 both neither bully nor victim 7.8 3.6 2.2
4 levels Student's friends come home always occasionally 7.6 2.5 2.5
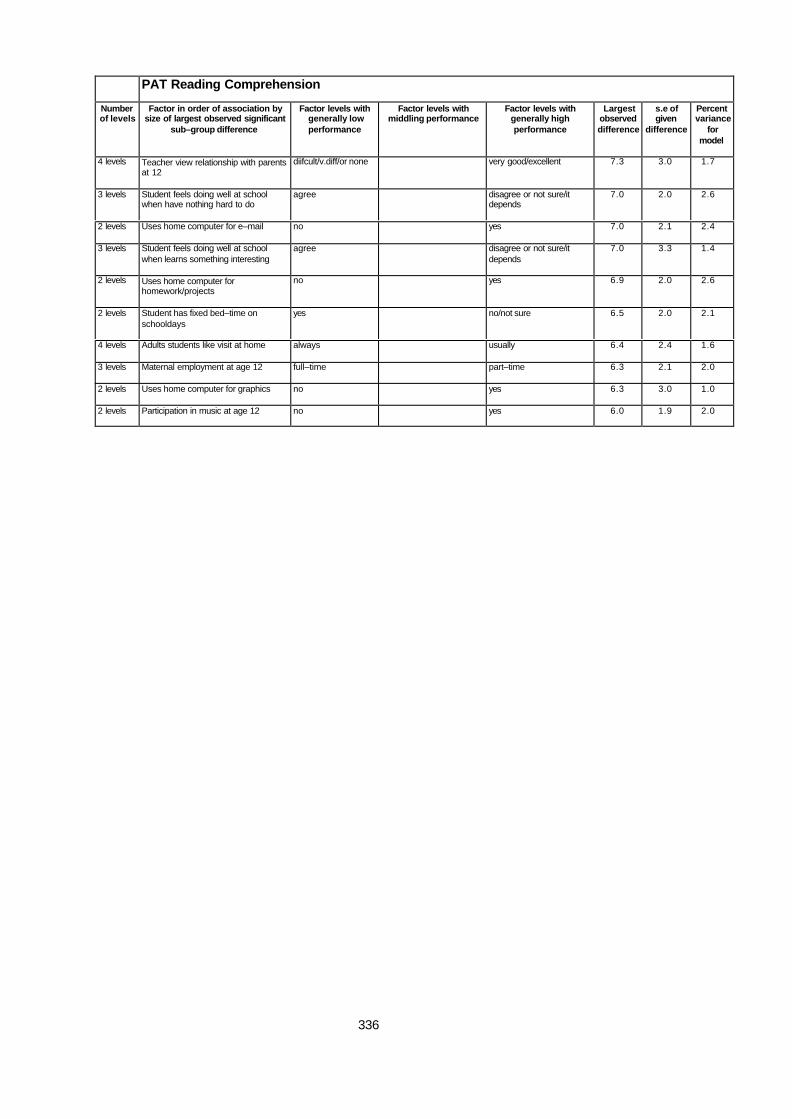
336
PAT Reading Comprehension
Numberof levels
Factor in order of association bysize of largest observed significant
sub–group difference
Factor levels withgenerally lowperformance
Factor levels withmiddling performance
Factor levels withgenerally highperformance
Largestobserveddifference
s.e ofgiven
difference
Percentvariance
formodel
4 levels Teacher view relationship with parentsat 12
diifcult/v.diff/or none very good/excellent 7.3 3.0 1.7
3 levels Student feels doing well at schoolwhen have nothing hard to do
agree disagree or not sure/itdepends
7.0 2.0 2.6
2 levels Uses home computer for e–mail no yes 7.0 2.1 2.4
3 levels Student feels doing well at schoolwhen learns something interesting
agree disagree or not sure/itdepends
7.0 3.3 1.4
2 levels Uses home computer forhomework/projects
no yes 6.9 2.0 2.6
2 levels Student has fixed bed–time onschooldays
yes no/not sure 6.5 2.0 2.1
4 levels Adults students like visit at home always usually 6.4 2.4 1.6
3 levels Maternal employment at age 12 full–time part–time 6.3 2.1 2.0
2 levels Uses home computer for graphics no yes 6.3 3.0 1.0
2 levels Participation in music at age 12 no yes 6.0 1.9 2.0
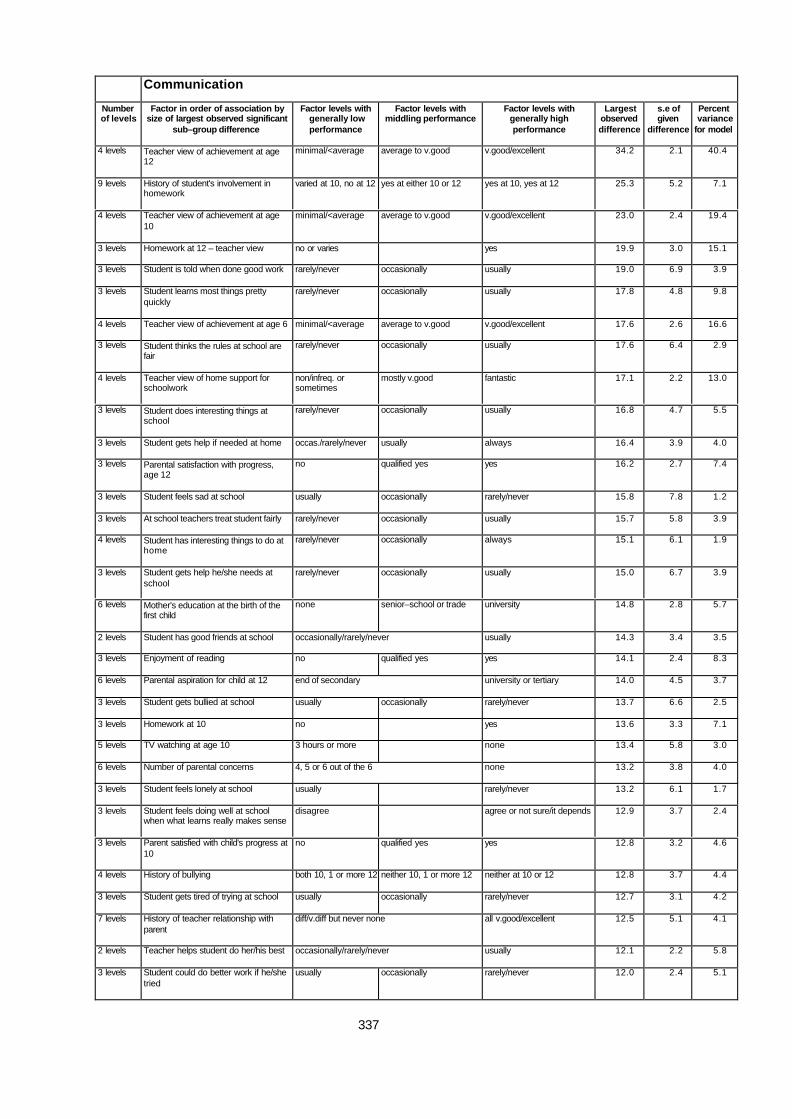
337
Communication
Numberof levels
Factor in order of association bysize of largest observed significant
sub–group difference
Factor levels withgenerally lowperformance
Factor levels withmiddling performance
Factor levels withgenerally highperformance
Largestobserveddifference
s.e ofgiven
difference
Percentvariance
for model
4 levels Teacher view of achievement at age12
minimal/<average average to v.good v.good/excellent 34.2 2.1 40.4
9 levels History of student's involvement inhomework
varied at 10, no at 12 yes at either 10 or 12 yes at 10, yes at 12 25.3 5.2 7.1
4 levels Teacher view of achievement at age10
minimal/<average average to v.good v.good/excellent 23.0 2.4 19.4
3 levels Homework at 12 – teacher view no or varies yes 19.9 3.0 15.1
3 levels Student is told when done good work rarely/never occasionally usually 19.0 6.9 3.9
3 levels Student learns most things prettyquickly
rarely/never occasionally usually 17.8 4.8 9.8
4 levels Teacher view of achievement at age 6 minimal/<average average to v.good v.good/excellent 17.6 2.6 16.6
3 levels Student thinks the rules at school arefair
rarely/never occasionally usually 17.6 6.4 2.9
4 levels Teacher view of home support forschoolwork
non/infreq. orsometimes
mostly v.good fantastic 17.1 2.2 13.0
3 levels Student does interesting things atschool
rarely/never occasionally usually 16.8 4.7 5.5
3 levels Student gets help if needed at home occas./rarely/never usually always 16.4 3.9 4.0
3 levels Parental satisfaction with progress,age 12
no qualified yes yes 16.2 2.7 7.4
3 levels Student feels sad at school usually occasionally rarely/never 15.8 7.8 1.2
3 levels At school teachers treat student fairly rarely/never occasionally usually 15.7 5.8 3.9
4 levels Student has interesting things to do athome
rarely/never occasionally always 15.1 6.1 1.9
3 levels Student gets help he/she needs atschool
rarely/never occasionally usually 15.0 6.7 3.9
6 levels Mother's education at the birth of thefirst child
none senior–school or trade university 14.8 2.8 5.7
2 levels Student has good friends at school occasionally/rarely/never usually 14.3 3.4 3.5
3 levels Enjoyment of reading no qualified yes yes 14.1 2.4 8.3
6 levels Parental aspiration for child at 12 end of secondary university or tertiary 14.0 4.5 3.7
3 levels Student gets bullied at school usually occasionally rarely/never 13.7 6.6 2.5
3 levels Homework at 10 no yes 13.6 3.3 7.1
5 levels TV watching at age 10 3 hours or more none 13.4 5.8 3.0
6 levels Number of parental concerns 4, 5 or 6 out of the 6 none 13.2 3.8 4.0
3 levels Student feels lonely at school usually rarely/never 13.2 6.1 1.7
3 levels Student feels doing well at schoolwhen what learns really makes sense
disagree agree or not sure/it depends 12.9 3.7 2.4
3 levels Parent satisfied with child's progress at10
no qualified yes yes 12.8 3.2 4.6
4 levels History of bullying both 10, 1 or more 12 neither 10, 1 or more 12 neither at 10 or 12 12.8 3.7 4.4
3 levels Student gets tired of trying at school usually occasionally rarely/never 12.7 3.1 4.2
7 levels History of teacher relationship withparent
diff/v.diff but never none all v.good/excellent 12.5 5.1 4.1
2 levels Teacher helps student do her/his best occasionally/rarely/never usually 12.1 2.2 5.8
3 levels Student could do better work if he/shetried
usually occasionally rarely/never 12.0 2.4 5.1
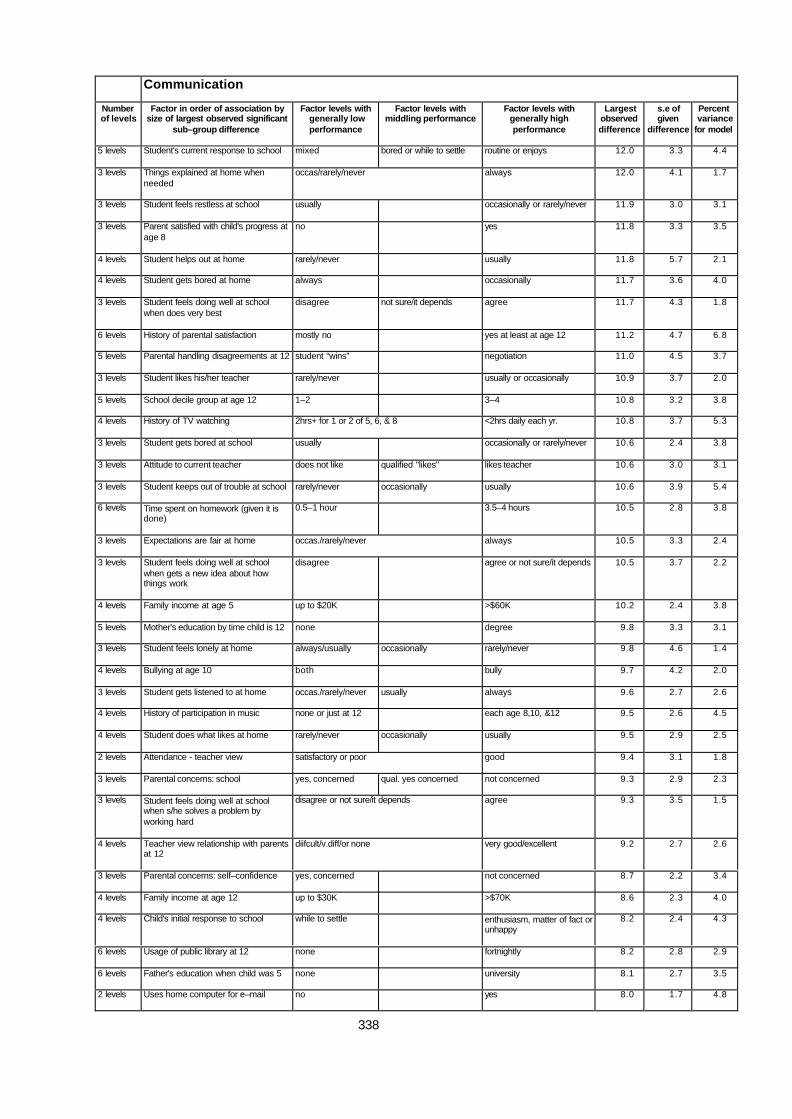
338
Communication
Numberof levels
Factor in order of association bysize of largest observed significant
sub–group difference
Factor levels withgenerally lowperformance
Factor levels withmiddling performance
Factor levels withgenerally highperformance
Largestobserveddifference
s.e ofgiven
difference
Percentvariance
for model
5 levels Student's current response to school mixed bored or while to settle routine or enjoys 12.0 3.3 4.4
3 levels Things explained at home whenneeded
occas/rarely/never always 12.0 4.1 1.7
3 levels Student feels restless at school usually occasionally or rarely/never 11.9 3.0 3.1
3 levels Parent satisfied with child's progress atage 8
no yes 11.8 3.3 3.5
4 levels Student helps out at home rarely/never usually 11.8 5.7 2.1
4 levels Student gets bored at home always occasionally 11.7 3.6 4.0
3 levels Student feels doing well at schoolwhen does very best
disagree not sure/it depends agree 11.7 4.3 1.8
6 levels History of parental satisfaction mostly no yes at least at age 12 11.2 4.7 6.8
5 levels Parental handling disagreements at 12 student “wins” negotiation 11.0 4.5 3.7
3 levels Student likes his/her teacher rarely/never usually or occasionally 10.9 3.7 2.0
5 levels School decile group at age 12 1–2 3–4 10.8 3.2 3.8
4 levels History of TV watching 2hrs+ for 1 or 2 of 5, 6, & 8 <2hrs daily each yr. 10.8 3.7 5.3
3 levels Student gets bored at school usually occasionally or rarely/never 10.6 2.4 3.8
3 levels Attitude to current teacher does not like qualified "likes" likes teacher 10.6 3.0 3.1
3 levels Student keeps out of trouble at school rarely/never occasionally usually 10.6 3.9 5.4
6 levels Time spent on homework (given it isdone)
0.5–1 hour 3.5–4 hours 10.5 2.8 3.8
3 levels Expectations are fair at home occas./rarely/never always 10.5 3.3 2.4
3 levels Student feels doing well at schoolwhen gets a new idea about howthings work
disagree agree or not sure/it depends 10.5 3.7 2.2
4 levels Family income at age 5 up to $20K >$60K 10.2 2.4 3.8
5 levels Mother's education by time child is 12 none degree 9.8 3.3 3.1
3 levels Student feels lonely at home always/usually occasionally rarely/never 9.8 4.6 1.4
4 levels Bullying at age 10 both bully 9.7 4.2 2.0
3 levels Student gets listened to at home occas./rarely/never usually always 9.6 2.7 2.6
4 levels History of participation in music none or just at 12 each age 8,10, &12 9.5 2.6 4.5
4 levels Student does what likes at home rarely/never occasionally usually 9.5 2.9 2.5
2 levels Attendance - teacher view satisfactory or poor good 9.4 3.1 1.8
3 levels Parental concerns: school yes, concerned qual. yes concerned not concerned 9.3 2.9 2.3
3 levels Student feels doing well at schoolwhen s/he solves a problem byworking hard
disagree or not sure/it depends agree 9.3 3.5 1.5
4 levels Teacher view relationship with parentsat 12
diifcult/v.diff/or none very good/excellent 9.2 2.7 2.6
3 levels Parental concerns: self–confidence yes, concerned not concerned 8.7 2.2 3.4
4 levels Family income at age 12 up to $30K >$70K 8.6 2.3 4.0
4 levels Child's initial response to school while to settle enthusiasm, matter of fact orunhappy
8.2 2.4 4.3
6 levels Usage of public library at 12 none fortnightly 8.2 2.8 2.9
6 levels Father's education when child was 5 none university 8.1 2.7 3.5
2 levels Uses home computer for e–mail no yes 8.0 1.7 4.8
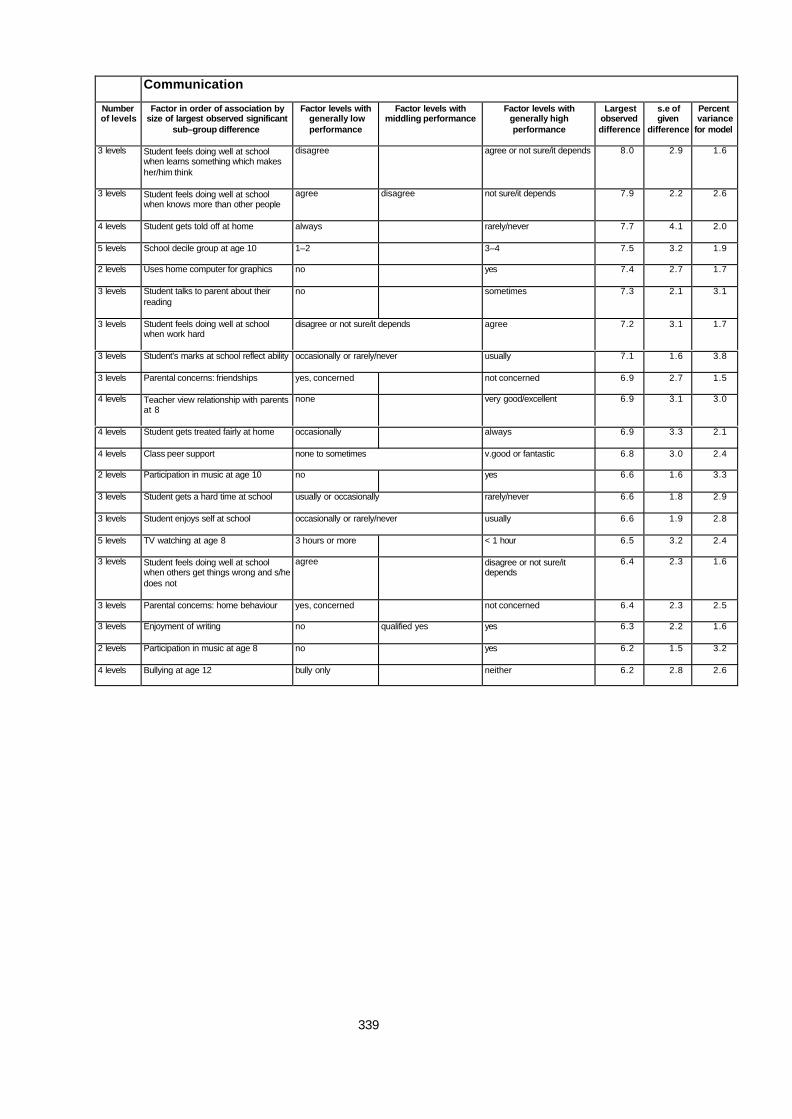
339
Communication
Numberof levels
Factor in order of association bysize of largest observed significant
sub–group difference
Factor levels withgenerally lowperformance
Factor levels withmiddling performance
Factor levels withgenerally highperformance
Largestobserveddifference
s.e ofgiven
difference
Percentvariance
for model
3 levels Student feels doing well at schoolwhen learns something which makesher/him think
disagree agree or not sure/it depends 8.0 2.9 1.6
3 levels Student feels doing well at schoolwhen knows more than other people
agree disagree not sure/it depends 7.9 2.2 2.6
4 levels Student gets told off at home always rarely/never 7.7 4.1 2.0
5 levels School decile group at age 10 1–2 3–4 7.5 3.2 1.9
2 levels Uses home computer for graphics no yes 7.4 2.7 1.7
3 levels Student talks to parent about theirreading
no sometimes 7.3 2.1 3.1
3 levels Student feels doing well at schoolwhen work hard
disagree or not sure/it depends agree 7.2 3.1 1.7
3 levels Student’s marks at school reflect ability occasionally or rarely/never usually 7.1 1.6 3.8
3 levels Parental concerns: friendships yes, concerned not concerned 6.9 2.7 1.5
4 levels Teacher view relationship with parentsat 8
none very good/excellent 6.9 3.1 3.0
4 levels Student gets treated fairly at home occasionally always 6.9 3.3 2.1
4 levels Class peer support none to sometimes v.good or fantastic 6.8 3.0 2.4
2 levels Participation in music at age 10 no yes 6.6 1.6 3.3
3 levels Student gets a hard time at school usually or occasionally rarely/never 6.6 1.8 2.9
3 levels Student enjoys self at school occasionally or rarely/never usually 6.6 1.9 2.8
5 levels TV watching at age 8 3 hours or more < 1 hour 6.5 3.2 2.4
3 levels Student feels doing well at schoolwhen others get things wrong and s/hedoes not
agree disagree or not sure/itdepends
6.4 2.3 1.6
3 levels Parental concerns: home behaviour yes, concerned not concerned 6.4 2.3 2.5
3 levels Enjoyment of writing no qualified yes yes 6.3 2.2 1.6
2 levels Participation in music at age 8 no yes 6.2 1.5 3.2
4 levels Bullying at age 12 bully only neither 6.2 2.8 2.6
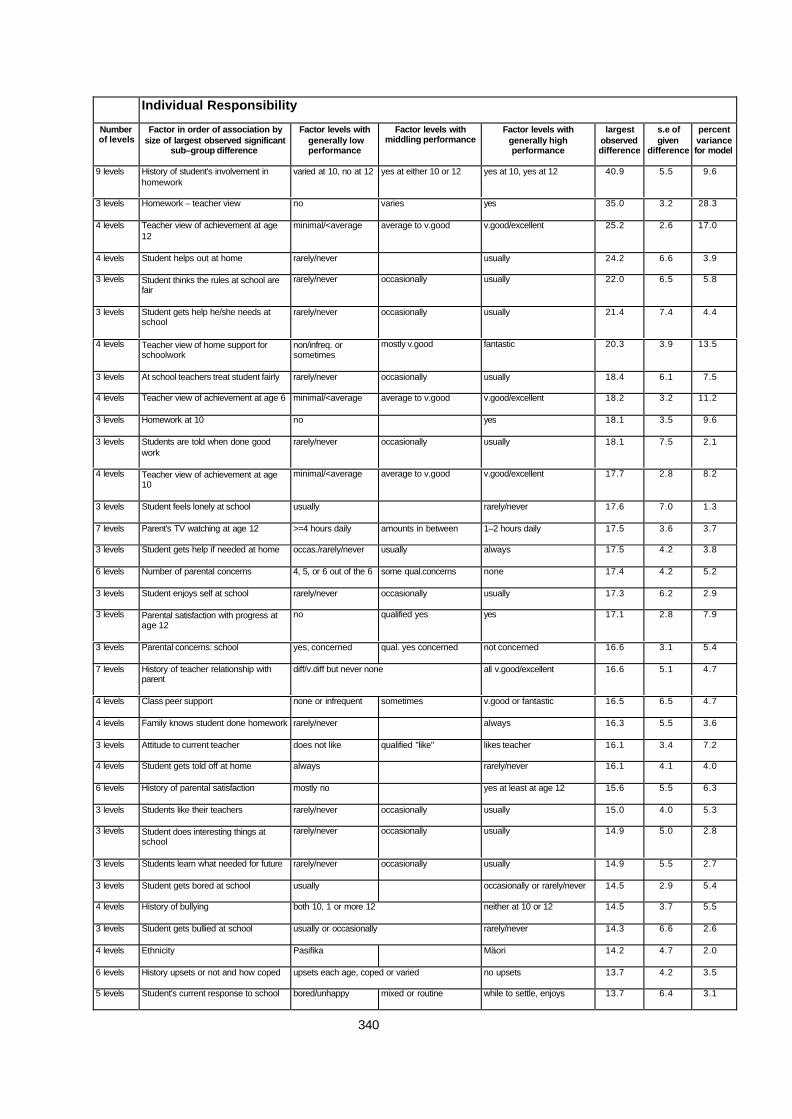
340
Individual Responsibility
Numberof levels
Factor in order of association bysize of largest observed significant
sub–group difference
Factor levels withgenerally lowperformance
Factor levels withmiddling performance
Factor levels withgenerally highperformance
largestobserveddifference
s.e ofgiven
difference
percentvariancefor model
9 levels History of student's involvement inhomework
varied at 10, no at 12 yes at either 10 or 12 yes at 10, yes at 12 40.9 5.5 9.6
3 levels Homework – teacher view no varies yes 35.0 3.2 28.3
4 levels Teacher view of achievement at age12
minimal/<average average to v.good v.good/excellent 25.2 2.6 17.0
4 levels Student helps out at home rarely/never usually 24.2 6.6 3.9
3 levels Student thinks the rules at school arefair
rarely/never occasionally usually 22.0 6.5 5.8
3 levels Student gets help he/she needs atschool
rarely/never occasionally usually 21.4 7.4 4.4
4 levels Teacher view of home support forschoolwork
non/infreq. orsometimes
mostly v.good fantastic 20.3 3.9 13.5
3 levels At school teachers treat student fairly rarely/never occasionally usually 18.4 6.1 7.5
4 levels Teacher view of achievement at age 6 minimal/<average average to v.good v.good/excellent 18.2 3.2 11.2
3 levels Homework at 10 no yes 18.1 3.5 9.6
3 levels Students are told when done goodwork
rarely/never occasionally usually 18.1 7.5 2.1
4 levels Teacher view of achievement at age10
minimal/<average average to v.good v.good/excellent 17.7 2.8 8.2
3 levels Student feels lonely at school usually rarely/never 17.6 7.0 1.3
7 levels Parent's TV watching at age 12 >=4 hours daily amounts in between 1–2 hours daily 17.5 3.6 3.7
3 levels Student gets help if needed at home occas./rarely/never usually always 17.5 4.2 3.8
6 levels Number of parental concerns 4, 5, or 6 out of the 6 some qual.concerns none 17.4 4.2 5.2
3 levels Student enjoys self at school rarely/never occasionally usually 17.3 6.2 2.9
3 levels Parental satisfaction with progress atage 12
no qualified yes yes 17.1 2.8 7.9
3 levels Parental concerns: school yes, concerned qual. yes concerned not concerned 16.6 3.1 5.4
7 levels History of teacher relationship withparent
diff/v.diff but never none all v.good/excellent 16.6 5.1 4.7
4 levels Class peer support none or infrequent sometimes v.good or fantastic 16.5 6.5 4.7
4 levels Family knows student done homework rarely/never always 16.3 5.5 3.6
3 levels Attitude to current teacher does not like qualified "like" likes teacher 16.1 3.4 7.2
4 levels Student gets told off at home always rarely/never 16.1 4.1 4.0
6 levels History of parental satisfaction mostly no yes at least at age 12 15.6 5.5 6.3
3 levels Students like their teachers rarely/never occasionally usually 15.0 4.0 5.3
3 levels Student does interesting things atschool
rarely/never occasionally usually 14.9 5.0 2.8
3 levels Students learn what needed for future rarely/never occasionally usually 14.9 5.5 2.7
3 levels Student gets bored at school usually occasionally or rarely/never 14.5 2.9 5.4
4 levels History of bullying both 10, 1 or more 12 neither at 10 or 12 14.5 3.7 5.5
3 levels Student gets bullied at school usually or occasionally rarely/never 14.3 6.6 2.6
4 levels Ethnicity Pasifika Mäori 14.2 4.7 2.0
6 levels History upsets or not and how coped upsets each age, coped or varied no upsets 13.7 4.2 3.5
5 levels Student's current response to school bored/unhappy mixed or routine while to settle, enjoys 13.7 6.4 3.1
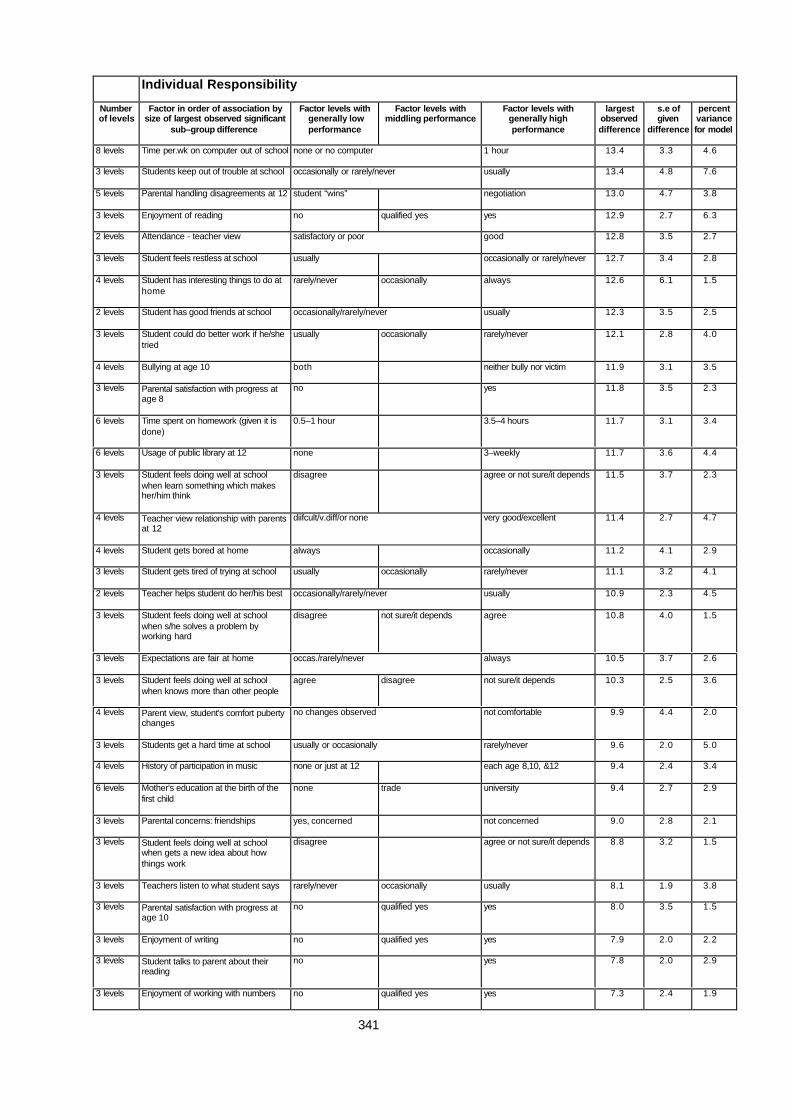
341
Individual Responsibility
Numberof levels
Factor in order of association bysize of largest observed significant
sub–group difference
Factor levels withgenerally lowperformance
Factor levels withmiddling performance
Factor levels withgenerally highperformance
largestobserveddifference
s.e ofgiven
difference
percentvariancefor model
8 levels Time per.wk on computer out of school none or no computer 1 hour 13.4 3.3 4.6
3 levels Students keep out of trouble at school occasionally or rarely/never usually 13.4 4.8 7.6
5 levels Parental handling disagreements at 12 student “wins” negotiation 13.0 4.7 3.8
3 levels Enjoyment of reading no qualified yes yes 12.9 2.7 6.3
2 levels Attendance - teacher view satisfactory or poor good 12.8 3.5 2.7
3 levels Student feels restless at school usually occasionally or rarely/never 12.7 3.4 2.8
4 levels Student has interesting things to do athome
rarely/never occasionally always 12.6 6.1 1.5
2 levels Student has good friends at school occasionally/rarely/never usually 12.3 3.5 2.5
3 levels Student could do better work if he/shetried
usually occasionally rarely/never 12.1 2.8 4.0
4 levels Bullying at age 10 both neither bully nor victim 11.9 3.1 3.5
3 levels Parental satisfaction with progress atage 8
no yes 11.8 3.5 2.3
6 levels Time spent on homework (given it isdone)
0.5–1 hour 3.5–4 hours 11.7 3.1 3.4
6 levels Usage of public library at 12 none 3–weekly 11.7 3.6 4.4
3 levels Student feels doing well at schoolwhen learn something which makesher/him think
disagree agree or not sure/it depends 11.5 3.7 2.3
4 levels Teacher view relationship with parentsat 12
diifcult/v.diff/or none very good/excellent 11.4 2.7 4.7
4 levels Student gets bored at home always occasionally 11.2 4.1 2.9
3 levels Student gets tired of trying at school usually occasionally rarely/never 11.1 3.2 4.1
2 levels Teacher helps student do her/his best occasionally/rarely/never usually 10.9 2.3 4.5
3 levels Student feels doing well at schoolwhen s/he solves a problem byworking hard
disagree not sure/it depends agree 10.8 4.0 1.5
3 levels Expectations are fair at home occas./rarely/never always 10.5 3.7 2.6
3 levels Student feels doing well at schoolwhen knows more than other people
agree disagree not sure/it depends 10.3 2.5 3.6
4 levels Parent view, student's comfort pubertychanges
no changes observed not comfortable 9.9 4.4 2.0
3 levels Students get a hard time at school usually or occasionally rarely/never 9.6 2.0 5.0
4 levels History of participation in music none or just at 12 each age 8,10, &12 9.4 2.4 3.4
6 levels Mother's education at the birth of thefirst child
none trade university 9.4 2.7 2.9
3 levels Parental concerns: friendships yes, concerned not concerned 9.0 2.8 2.1
3 levels Student feels doing well at schoolwhen gets a new idea about howthings work
disagree agree or not sure/it depends 8.8 3.2 1.5
3 levels Teachers listen to what student says rarely/never occasionally usually 8.1 1.9 3.8
3 levels Parental satisfaction with progress atage 10
no qualified yes yes 8.0 3.5 1.5
3 levels Enjoyment of writing no qualified yes yes 7.9 2.0 2.2
3 levels Student talks to parent about theirreading
no yes 7.8 2.0 2.9
3 levels Enjoyment of working with numbers no qualified yes yes 7.3 2.4 1.9
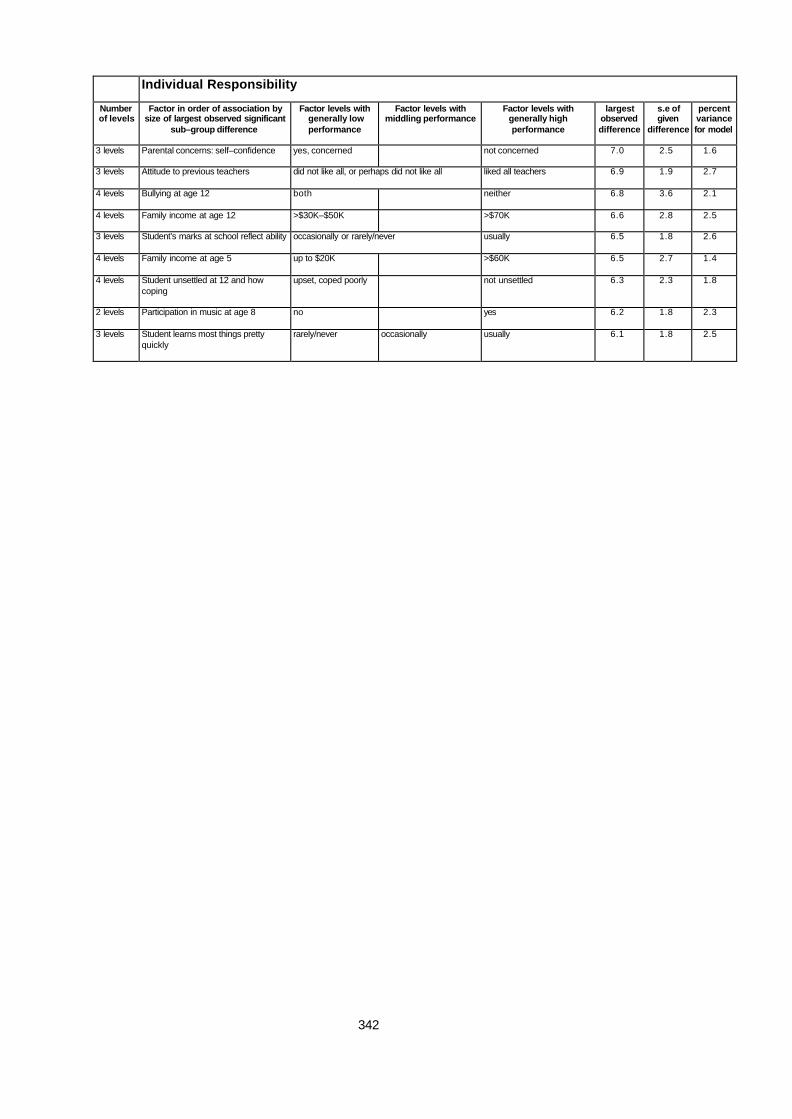
342
Individual Responsibility
Numberof levels
Factor in order of association bysize of largest observed significant
sub–group difference
Factor levels withgenerally lowperformance
Factor levels withmiddling performance
Factor levels withgenerally highperformance
largestobserveddifference
s.e ofgiven
difference
percentvariancefor model
3 levels Parental concerns: self–confidence yes, concerned not concerned 7.0 2.5 1.6
3 levels Attitude to previous teachers did not like all, or perhaps did not like all liked all teachers 6.9 1.9 2.7
4 levels Bullying at age 12 both neither 6.8 3.6 2.1
4 levels Family income at age 12 >$30K–$50K >$70K 6.6 2.8 2.5
3 levels Student’s marks at school reflect ability occasionally or rarely/never usually 6.5 1.8 2.6
4 levels Family income at age 5 up to $20K >$60K 6.5 2.7 1.4
4 levels Student unsettled at 12 and howcoping
upset, coped poorly not unsettled 6.3 2.3 1.8
2 levels Participation in music at age 8 no yes 6.2 1.8 2.3
3 levels Student learns most things prettyquickly
rarely/never occasionally usually 6.1 1.8 2.5

343
Perseverance
Numberof levels
Factor in order of association by sizeof largest observed significant sub–
group difference
Factor levels withgenerally lowperformance
Factor levels withmiddling performance
Factor levels withgenerally highperformance
largestobserveddifference
s.e ofgiven
difference
percentvariancefor model
9 levels History of student's involvement inhomework
varies at 10, no at 12 yes at either 10 or 12 yes at 10, yes at 12 45.9 5.3 38.0
3 levels Homework at 12 – teacher view no varies yes 40.6 3.1 33.4
4 levels Teacher view of achievement at age 12 minimal/<average average to v.good v.good/excellent 39.4 2.7 35.3
3 levels Student thinks the rules at school arefair
rarely/never occasionally usually 30.3 7.2 7.5
4 levels Teacher view of achievement at age 10 minimal/<average average to v.good v.good/excellent 27.3 3.0 18.2
3 levels Student gets help he/she needs atschool
rarely/never occasionally usually 26.7 8.2 5.2
4 levels Teacher view of achievement at age 6 minimal/<average average to v.good v.good/excellent 26.0 3.7 16.2
4 levels Student helps out at home rarely/never always 25.7 7.5 3.7
3 levels Homework at 10 no yes 23.9 3.8 13.9
4 levels Teacher view of home support forschoolwork
non/infreq.orsometimes
mostly v.good fantastic 23.5 4.3 15.5
6 levels History of parental satisfaction mostly no yes at least at age 12 23.1 6.0 10.4
5 levels Student's current response to school bored/unhappy mixed while to settle, enjoys orroutine
22.4 4.4 5.5
3 levels Student feels lonely at school usually occasionally or rarely/never 22.1 8.0 1.7
3 levels Student feels lonely at school usually occasionally rarely/never 22.1 8.0 1.7
3 levels Parental satisfaction with progress atage 12
no qualified yes yes 21.4 3.1 10.2
4 levels History of bullying both 10, 1 or more 12 neither 10, 1 or more 12 neither at 10 or 12 21.0 4.3 8.8
6 levels Number of parental concerns 4, 5, or 6 out of the 6 some qual.concerns none 20.2 4.7 6.9
3 levels Student enjoys self at school rarely/never occasionally usually 19.8 6.9 3.1
3 levels Parental concerns: school yes, concerned qual. yes concerned not concerned 18.7 3.5 5.6
3 levels Student gets help if needed at home occas./rarely/never usually always 18.7 4.6 4.1
4 levels Student gets told off at home always rarely/never 18.5 4.5 4.4
2 levels Attendance - teacher view satisfactory or poor good 18.4 3.8 4.5
4 levels Family knows student done homework rarely/never always 18.4 6.1 3.8
3 levels Enjoyment of reading no qualified yes yes 18.1 3.0 9.4
3 levels At school teachers treat student fairly rarely/never occasionally usually 17.9 6.8 6.1
3 levels Students keep out of trouble at school rarely/never occasionally usually 17.7 5.2 9.9
3 levels Students are told when done good work rarely/never occasionally usually 17.7 8.3 3.0
3 levels Student gets bored at school usually occasionally or rarely/never 17.5 3.2 6.3
3 levels Student gets tired of trying at school usually occasionally rarely/never 17.5 3.5 7.0
3 levels Student could do better work if he/shetried
usually occasionally rarely/never 17.4 3.1 6.5
7 levels Parent's TV watching at age 12 >=4 hours daily amounts in between none 17.4 7.2 3.6
3 levels Student does interesting things atschool
rarely/never occasionally usually 17.3 5.6 4.0
3 levels Students like their teachers rarely/never occasionally usually 17.2 4.5 4.2
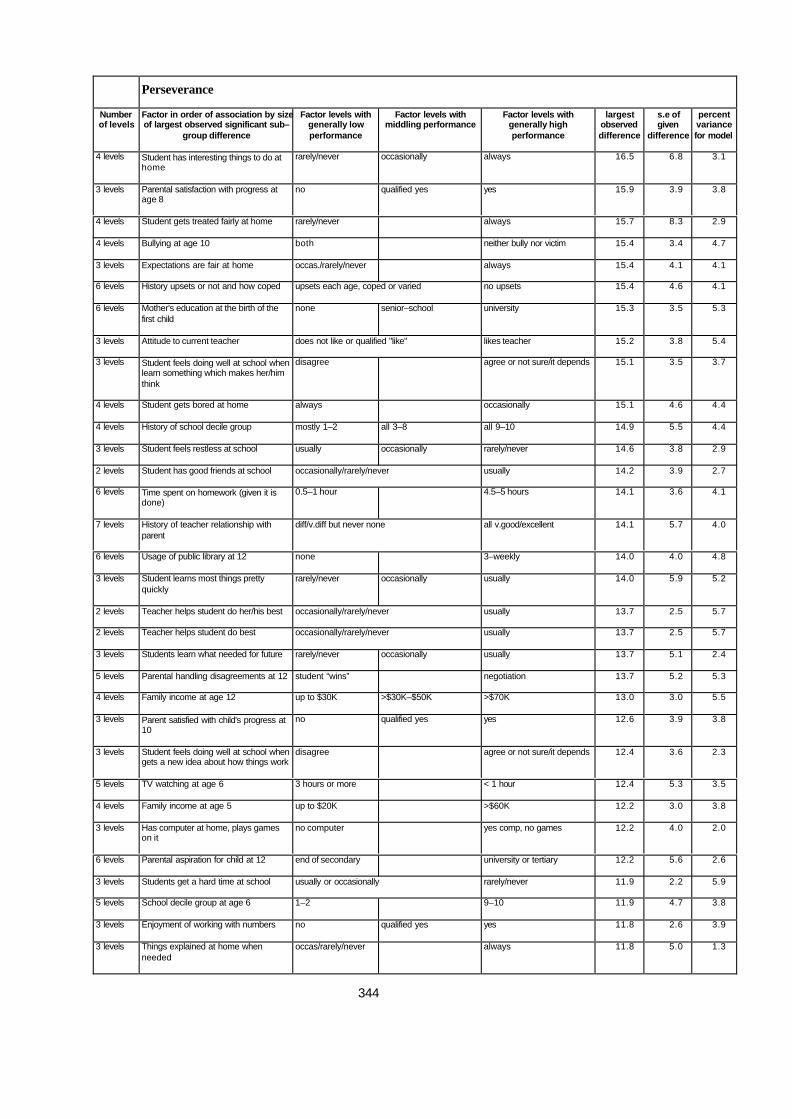
344
Perseverance
Numberof levels
Factor in order of association by sizeof largest observed significant sub–
group difference
Factor levels withgenerally lowperformance
Factor levels withmiddling performance
Factor levels withgenerally highperformance
largestobserveddifference
s.e ofgiven
difference
percentvariancefor model
4 levels Student has interesting things to do athome
rarely/never occasionally always 16.5 6.8 3.1
3 levels Parental satisfaction with progress atage 8
no qualified yes yes 15.9 3.9 3.8
4 levels Student gets treated fairly at home rarely/never always 15.7 8.3 2.9
4 levels Bullying at age 10 both neither bully nor victim 15.4 3.4 4.7
3 levels Expectations are fair at home occas./rarely/never always 15.4 4.1 4.1
6 levels History upsets or not and how coped upsets each age, coped or varied no upsets 15.4 4.6 4.1
6 levels Mother's education at the birth of thefirst child
none senior–school university 15.3 3.5 5.3
3 levels Attitude to current teacher does not like or qualified "like" likes teacher 15.2 3.8 5.4
3 levels Student feels doing well at school whenlearn something which makes her/himthink
disagree agree or not sure/it depends 15.1 3.5 3.7
4 levels Student gets bored at home always occasionally 15.1 4.6 4.4
4 levels History of school decile group mostly 1–2 all 3–8 all 9–10 14.9 5.5 4.4
3 levels Student feels restless at school usually occasionally rarely/never 14.6 3.8 2.9
2 levels Student has good friends at school occasionally/rarely/never usually 14.2 3.9 2.7
6 levels Time spent on homework (given it isdone)
0.5–1 hour 4.5–5 hours 14.1 3.6 4.1
7 levels History of teacher relationship withparent
diff/v.diff but never none all v.good/excellent 14.1 5.7 4.0
6 levels Usage of public library at 12 none 3–weekly 14.0 4.0 4.8
3 levels Student learns most things prettyquickly
rarely/never occasionally usually 14.0 5.9 5.2
2 levels Teacher helps student do her/his best occasionally/rarely/never usually 13.7 2.5 5.7
2 levels Teacher helps student do best occasionally/rarely/never usually 13.7 2.5 5.7
3 levels Students learn what needed for future rarely/never occasionally usually 13.7 5.1 2.4
5 levels Parental handling disagreements at 12 student “wins” negotiation 13.7 5.2 5.3
4 levels Family income at age 12 up to $30K >$30K–$50K >$70K 13.0 3.0 5.5
3 levels Parent satisfied with child's progress at10
no qualified yes yes 12.6 3.9 3.8
3 levels Student feels doing well at school whengets a new idea about how things work
disagree agree or not sure/it depends 12.4 3.6 2.3
5 levels TV watching at age 6 3 hours or more < 1 hour 12.4 5.3 3.5
4 levels Family income at age 5 up to $20K >$60K 12.2 3.0 3.8
3 levels Has computer at home, plays gameson it
no computer yes comp, no games 12.2 4.0 2.0
6 levels Parental aspiration for child at 12 end of secondary university or tertiary 12.2 5.6 2.6
3 levels Students get a hard time at school usually or occasionally rarely/never 11.9 2.2 5.9
5 levels School decile group at age 6 1–2 9–10 11.9 4.7 3.8
3 levels Enjoyment of working with numbers no qualified yes yes 11.8 2.6 3.9
3 levels Things explained at home whenneeded
occas/rarely/never always 11.8 5.0 1.3
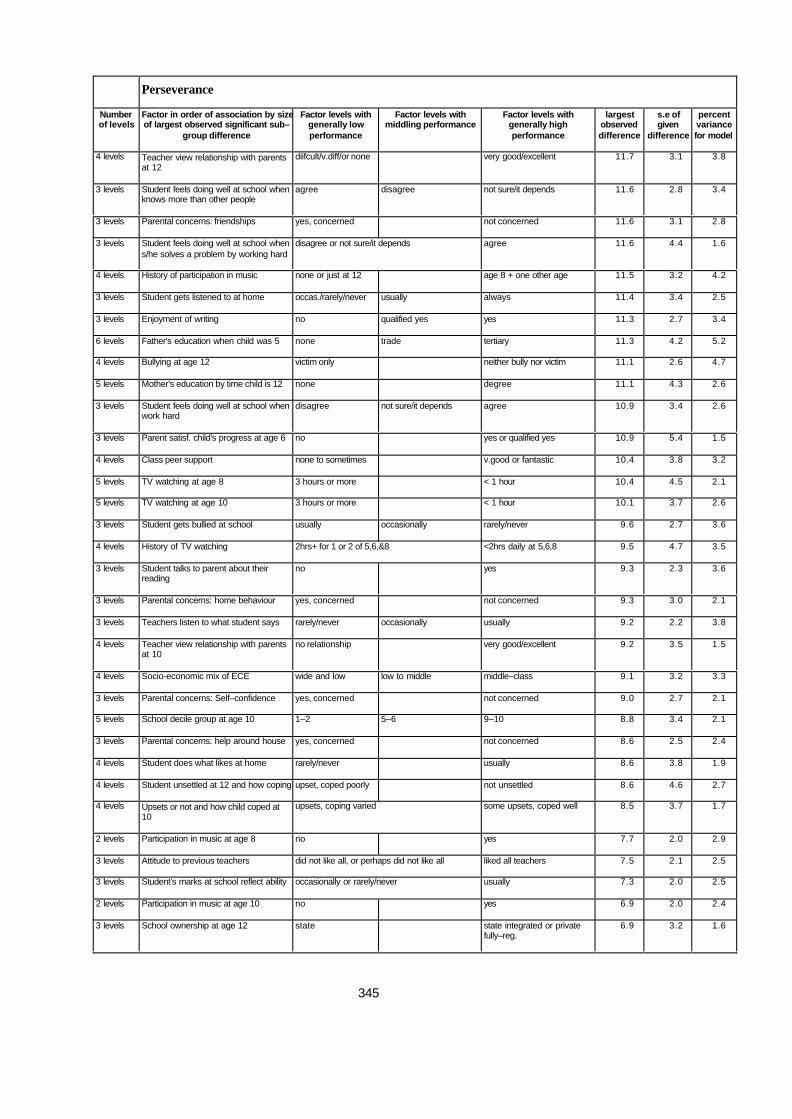
345
Perseverance
Numberof levels
Factor in order of association by sizeof largest observed significant sub–
group difference
Factor levels withgenerally lowperformance
Factor levels withmiddling performance
Factor levels withgenerally highperformance
largestobserveddifference
s.e ofgiven
difference
percentvariancefor model
4 levels Teacher view relationship with parentsat 12
diifcult/v.diff/or none very good/excellent 11.7 3.1 3.8
3 levels Student feels doing well at school whenknows more than other people
agree disagree not sure/it depends 11.6 2.8 3.4
3 levels Parental concerns: friendships yes, concerned not concerned 11.6 3.1 2.8
3 levels Student feels doing well at school whens/he solves a problem by working hard
disagree or not sure/it depends agree 11.6 4.4 1.6
4 levels History of participation in music none or just at 12 age 8 + one other age 11.5 3.2 4.2
3 levels Student gets listened to at home occas./rarely/never usually always 11.4 3.4 2.5
3 levels Enjoyment of writing no qualified yes yes 11.3 2.7 3.4
6 levels Father's education when child was 5 none trade tertiary 11.3 4.2 5.2
4 levels Bullying at age 12 victim only neither bully nor victim 11.1 2.6 4.7
5 levels Mother's education by time child is 12 none degree 11.1 4.3 2.6
3 levels Student feels doing well at school whenwork hard
disagree not sure/it depends agree 10.9 3.4 2.6
3 levels Parent satisf. child's progress at age 6 no yes or qualified yes 10.9 5.4 1.5
4 levels Class peer support none to sometimes v.good or fantastic 10.4 3.8 3.2
5 levels TV watching at age 8 3 hours or more < 1 hour 10.4 4.5 2.1
5 levels TV watching at age 10 3 hours or more < 1 hour 10.1 3.7 2.6
3 levels Student gets bullied at school usually occasionally rarely/never 9.6 2.7 3.6
4 levels History of TV watching 2hrs+ for 1 or 2 of 5,6,&8 <2hrs daily at 5,6,8 9.5 4.7 3.5
3 levels Student talks to parent about theirreading
no yes 9.3 2.3 3.6
3 levels Parental concerns: home behaviour yes, concerned not concerned 9.3 3.0 2.1
3 levels Teachers listen to what student says rarely/never occasionally usually 9.2 2.2 3.8
4 levels Teacher view relationship with parentsat 10
no relationship very good/excellent 9.2 3.5 1.5
4 levels Socio-economic mix of ECE wide and low low to middle middle–class 9.1 3.2 3.3
3 levels Parental concerns: Self–confidence yes, concerned not concerned 9.0 2.7 2.1
5 levels School decile group at age 10 1–2 5–6 9–10 8.8 3.4 2.1
3 levels Parental concerns: help around house yes, concerned not concerned 8.6 2.5 2.4
4 levels Student does what likes at home rarely/never usually 8.6 3.8 1.9
4 levels Student unsettled at 12 and how coping upset, coped poorly not unsettled 8.6 4.6 2.7
4 levels Upsets or not and how child coped at10
upsets, coping varied some upsets, coped well 8.5 3.7 1.7
2 levels Participation in music at age 8 no yes 7.7 2.0 2.9
3 levels Attitude to previous teachers did not like all, or perhaps did not like all liked all teachers 7.5 2.1 2.5
3 levels Student’s marks at school reflect ability occasionally or rarely/never usually 7.3 2.0 2.5
2 levels Participation in music at age 10 no yes 6.9 2.0 2.4
3 levels School ownership at age 12 state state integrated or privatefully–reg.
6.9 3.2 1.6

346
Perseverance
Numberof levels
Factor in order of association by sizeof largest observed significant sub–
group difference
Factor levels withgenerally lowperformance
Factor levels withmiddling performance
Factor levels withgenerally highperformance
largestobserveddifference
s.e ofgiven
difference
percentvariancefor model
4 levels Teacher view relationship with parentsat 8
good or satisfactory to difficult very good/excellent 6.7 2.2 2.1
3 levels Student feels doing well at school whenothers get things wrong and s/he doesnot
agree disagree or not sure/itdepends
6.6 2.8 1.7
2 levels Uses home computer for wordprocessing
no yes 6.0 2.1 1.8
Copyright © 2022 FDOKUMEN