Comparisons of Non-Gaussian Statistical Models in DNA Methylation Analysis
20
Int. J. Mol. Sci. 2014, 15, 10835-10854; doi:10.3390/ijms150610835 OPEN ACCESS International Journal of Molecular Sciences ISSN 1422-0067 www.mdpi.com/journal/ijms Article Comparisons of Non-Gaussian Statistical Models in DNA Methylation Analysis Zhanyu Ma 1, *, Andrew E. Teschendorff 2,3 , Hong Yu 1 , Jalil Taghia 4 and Jun Guo 1 1 Pattern Recognition and Intelligent System Lab., Beijing University of Posts and Telecommunications, No. 10 Xitucheng Road, Beijing 100876, China; E-Mails: [email protected] (H.Y.); [email protected] (J.G.) 2 Computational Systems Genomics, CAS-MPG Partner Institute for Computational Biology, Shanghai Institute for Biological Sciences, Chinese Academy of Sciences, 320 Yue Yang Road, Shanghai 200031, China; E-Mail: [email protected] 3 Statistical Genomics Group, Paul O’Gorman Building, UCL Cancer Institute, University College London, 72 Huntley Street, London WC1E 6BT, UK 4 Communication Theory Lab., KTH - Royal Institute of Technology, Osquldas väg 10, 10044 Stockholm, Sweden; E-Mail: [email protected] * Author to whom correspondence should be addressed; E-Mail: [email protected]; Tel.: +86-10-6228-3059. Received: 24 March 2014; in revised form: 12 May 2014 / Accepted: 10 June 2014 / Published: 16 June 2014 Abstract: As a key regulatory mechanism of gene expression, DNA methylation patterns are widely altered in many complex genetic diseases, including cancer. DNA methylation is naturally quantified by bounded support data; therefore, it is non-Gaussian distributed. In order to capture such properties, we introduce some non-Gaussian statistical models to perform dimension reduction on DNA methylation data. Afterwards, non-Gaussian statistical model-based unsupervised clustering strategies are applied to cluster the data. Comparisons and analysis of different dimension reduction strategies and unsupervised clustering methods are presented. Experimental results show that the non-Gaussian statistical model-based methods are superior to the conventional Gaussian distribution-based method. They are meaningful tools for DNA methylation analysis. Moreover, among several non-Gaussian methods, the one that captures the bounded nature of DNA methylation data reveals the best clustering performance.
-
Upload
independent -
Category
Documents
-
view
4 -
download
0
Transcript of Comparisons of Non-Gaussian Statistical Models in DNA Methylation Analysis

Int. J. Mol. Sci. 2014, 15, 10835-10854; doi:10.3390/ijms150610835OPEN ACCESS
International Journal of
Molecular SciencesISSN 1422-0067
www.mdpi.com/journal/ijms
Article
Comparisons of Non-Gaussian Statistical Models in DNAMethylation AnalysisZhanyu Ma 1,*, Andrew E. Teschendorff 2,3, Hong Yu 1, Jalil Taghia 4 and Jun Guo 1
1 Pattern Recognition and Intelligent System Lab.,Beijing University of Posts and Telecommunications, No. 10 Xitucheng Road,Beijing 100876, China; E-Mails: [email protected] (H.Y.); [email protected] (J.G.)
2 Computational Systems Genomics, CAS-MPG Partner Institute for Computational Biology,Shanghai Institute for Biological Sciences, Chinese Academy of Sciences, 320 Yue Yang Road,Shanghai 200031, China; E-Mail: [email protected]
3 Statistical Genomics Group, Paul O’Gorman Building, UCL Cancer Institute,University College London, 72 Huntley Street, London WC1E 6BT, UK
4 Communication Theory Lab., KTH - Royal Institute of Technology, Osquldas väg 10,10044 Stockholm, Sweden; E-Mail: [email protected]
* Author to whom correspondence should be addressed; E-Mail: [email protected];Tel.: +86-10-6228-3059.
Received: 24 March 2014; in revised form: 12 May 2014 / Accepted: 10 June 2014 /Published: 16 June 2014
Abstract: As a key regulatory mechanism of gene expression, DNA methylation patternsare widely altered in many complex genetic diseases, including cancer. DNA methylationis naturally quantified by bounded support data; therefore, it is non-Gaussian distributed.In order to capture such properties, we introduce some non-Gaussian statistical modelsto perform dimension reduction on DNA methylation data. Afterwards, non-Gaussianstatistical model-based unsupervised clustering strategies are applied to cluster the data.Comparisons and analysis of different dimension reduction strategies and unsupervisedclustering methods are presented. Experimental results show that the non-Gaussian statisticalmodel-based methods are superior to the conventional Gaussian distribution-based method.They are meaningful tools for DNA methylation analysis. Moreover, among severalnon-Gaussian methods, the one that captures the bounded nature of DNA methylation datareveals the best clustering performance.

Int. J. Mol. Sci. 2014, 15 10836
Keywords: non-Gaussian statistical models; dimension reduction; unsupervised learning;feature selection; DNA methylation analysis
1. Introduction
DNA methylation is a covalent modification of DNA, which can regulate the expression of genes [1].Recently, DNA methylation has attracted considerable interest, due its role in the etiology of complexdiseases, specially cancer [2], but also because it can be easily measured genome-wide from limitedamounts of DNA, allowing measurements in clinical specimens [3].
Relatively little is known about the taxonomy of cancers at the DNA methylation level. Hence, thereis currently a strong interest in performing unsupervised clustering of large-scale DNA methylationdata sets in order to identify novel cancer subtypes. DNA methylation data is quantified naturally interms of a beta-distribution. The DNA methylation beta-value, β, at a specific genomic locus providesan estimate of the fraction of cells that have that locus methylated. Although studies have consideredusing the logit-transform y = log2 β/(1− β) instead of β for subsequent statistical inferences [4], itwas shown in Zhuang et al. [5] that the logit-basis can, under certain circumstances, lead to worseinference, as it can aggravate the effects of outliers (i.e., β values close to zero or one): from a biologicalperspective, an outlier at β = 0.999 is not more interesting than one at β = 0.9, yet on the logit scale,they would be widely separated. Moreover, analyzing DNA methylation data in terms of beta-valueshelps interpretability. Thus, there is considerable benefit in performing statistical inferences from theoriginal beta-valued distributions. As a result of this, normalization, feature selection and clusteringmethods designed for beta-valued DNA methylation data have recently been investigated [6–15].
However, there still remains a significant shortage of methods, specially for the dimensionalreduction of large DNA methylation data sets. For instance, blind source separation (BSS) [16,17],independent/principal component analysis (ICA/PCA) [18,19] and nonnegative matrix factorization(NMF) [20,21] techniques have been extensively studied in the gene expression field. Due to the boundedsupport property of the beta-valued data, the DNA methylation level cannot be efficiently described bythese existing dimension reduction methods, which mainly assume the Gaussian distribution of the data.Therefore, the analysis results based on such mismatched models are not sufficiently promising.
Gaussian distribution is the ubiquitous probability distribution used in statistics [22–24]. It has ananalytically tractable probability density function (pdf), and analysis based on it can be derived inan explicit form. In practice, not all of the data we need to model are Gaussian distributed [25,26].Recent research showed that, when processing the non-Gaussian distributed data, applying suitablenon-Gaussian distribution to model the data can lead to better performance than that obtained by aconventional Gaussian distribution. The advantages of applying a non-Gaussian distribution have beendemonstrated in various real-life applications, including image processing [27,28], speech coding [29],document analysis [30], communication and compressive sensing systems [31], complex networkanalysis [32], decision-making in expert systems [33,34] and biomedical signal processing [35,36]. In

Int. J. Mol. Sci. 2014, 15 10837
particular, non-Gaussian statistical models have also been widely applied in bioinformatics [12,14,15],especially to the analysis of omics data. Indeed, omics data types are rarely Gaussianly distributed.
In this paper, we will introduce and compare some machine learning methods, which are based onnon-Gaussian statistical models, for DNA methylation data analysis. The analysis of DNA methylationdata includes two parts. (1) Dimensional reduction: DNA methylation array data is high-dimensional,typically involving on the order of 25 k up to 500 k dimensions (and even higher). As with otheromics data, the number of samples is typically on the order of 100. However, typically, most of thesalient variability in the data, e.g., variation distinguishing cancer from normal samples, or distinguishingdifferent cancer phenotypes, is captured by a much lower-dimensional space. Hence, we need to performsome forms of dimension reduction; (2) Unsupervised clustering: Cancers especially are known to behighly heterogeneous [37]. Hence, we expect an effective and accurate unsupervised learning methodto reveal such heterogeneity. Thus, although normal and cancer should be well discriminated, cancersamples may form multiple distinct clusters.
2. Results and Discussion
2.1. Data Description and Preprocessing
The DNA methylation data is obtained from Gene Expression Omnibus (GEO) website [38]. GEO isa public functional genomics data repository supporting MIAME-compliant data submissions. DatasetGSE32393 [39] is used for the evaluation of the above-mentioned dimension reduction and unsupervisedclustering methods. DNA methylation profiles were obtained across approximately 27, 578 CpGs inbreast tissues from women with and without breast cancer. Breast tissue samples were drawn from113 breast cancers and 23 non-neoplastic breast tissues.
We considered a DNA methylation data matrix over 5000 dimensions (specifically, CpGdinucleotides). The 5000 CpGs were selected as those with the highest variance across the 136 samples.A data matrix X with a size of 5000 × 136 was obtained. Figure 1 illustrates the effect ofdimension reduction. The data points in Figure 1b are separated better than those in Figure 1a, whichindicates that dimension reduction can potentially improve the clustering performance. From hereand thereafter, the stochastic neighbor embedding (t-SNE) method [40] (the t-SNE method can onlyapproximately illustrate the high-dimensional data for visualization convenience; it is not the exactrepresentation of the relations between data points) is applied to visualize the high-dimensional datain two-dimensional space.
In each dimension reduction method, we need to specify the number of dimensions for which tosearch. The random matrix theory (RMT) [41] was used for determining the underlying number ofdimensions. Although data is distinctly non-Gaussian (even after mean-centering each CpG), RMTprovides a reasonable approximation of the dimensionality, as shown by us previously in [16]. For ourdata matrix of 5000 × 136, we estimated a total of 14 dimensions. Hence, we set K = 14 in all of thefollowing experiments.

Int. J. Mol. Sci. 2014, 15 10838
Figure 1. Comparisons of DNA methylation data before and after dimension reduction.(a) Visualization of the original 27, 578 dimensional data; (b) visualization of the reduced5000 dimensional data.
cancer
heathy
(a)
health
cancer
(b)
2.2. Unsupervised Clustering
The level of DNA methylation can discriminate normal and cancer samples [42,43]. Cancersespecially are also known to be highly heterogeneous [37], which means that the cancer samples shouldbe grouped into more than one cluster. The above obtained matrix X still has more features than samples.Therefore, we need to further reduce the dimension and then apply an advanced clustering method togroup samples appropriately.
2.2.1. PCA (Principal Component Analysis) + VBGMM (Variational Bayesian Gaussian Mixture Model)
When implementing dimension reduction with Gaussian assumptions, PCA [22] is the widely usedmethod. After taking eigenvalue decomposition on the covariance matrix of the observed data, PCAkeeps K eigenvectors that correspond to the K largest eigenvalues. With PCA, a matrix of size14× 136 was obtained. For this reduced feature matrix, the variational Bayesian Gaussian mixturemodel (VBGMM) [22] was applied to estimate the number of clusters, as well as to cluster the data.The VBGMM estimated 10 clusters. Figure 2a illustrates the reduced features’ distribution, and theclustering results are shown in Figure 2b. The PCA + VBGMM misclustered nine samples, out of whichnine cancer samples are clustered as normal ones and no normal sample is recognized as a cancer one.
Int. J. Mol. Sci. 2014, 15 10839
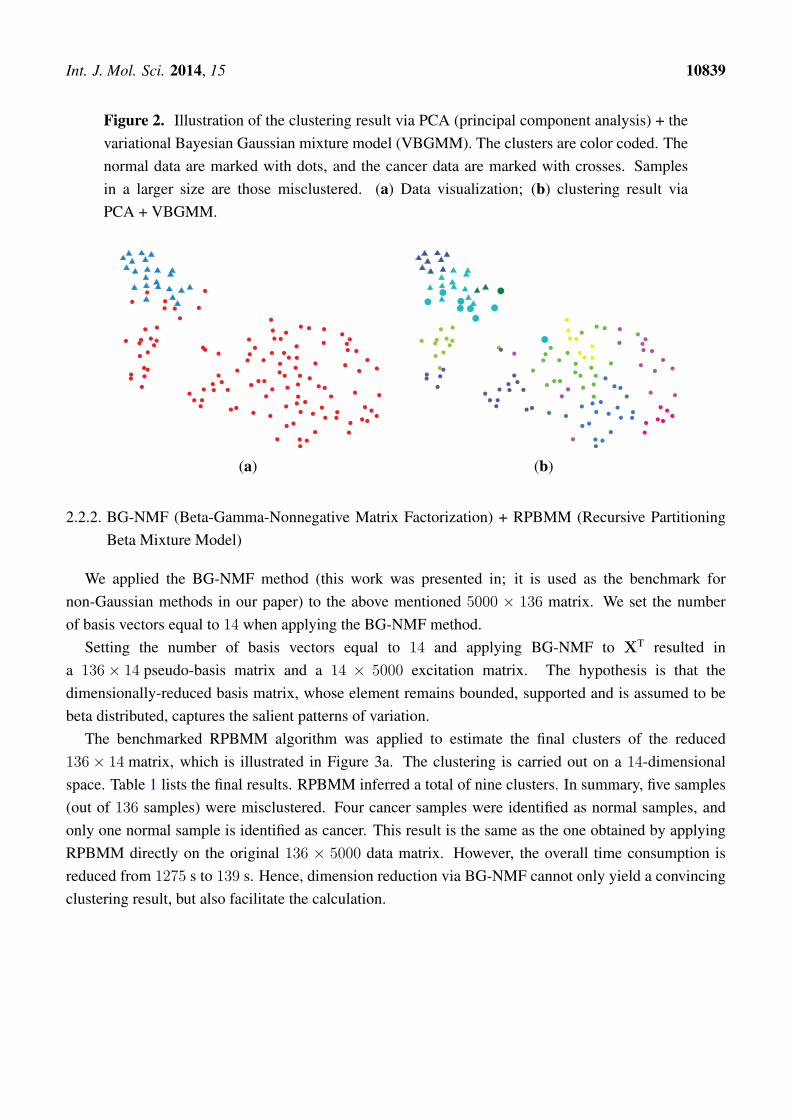
Figure 2. Illustration of the clustering result via PCA (principal component analysis) + thevariational Bayesian Gaussian mixture model (VBGMM). The clusters are color coded. Thenormal data are marked with dots, and the cancer data are marked with crosses. Samplesin a larger size are those misclustered. (a) Data visualization; (b) clustering result viaPCA + VBGMM.
(a) (b)
2.2.2. BG-NMF (Beta-Gamma-Nonnegative Matrix Factorization) + RPBMM (Recursive PartitioningBeta Mixture Model)
We applied the BG-NMF method (this work was presented in; it is used as the benchmark fornon-Gaussian methods in our paper) to the above mentioned 5000 × 136 matrix. We set the numberof basis vectors equal to 14 when applying the BG-NMF method.
Setting the number of basis vectors equal to 14 and applying BG-NMF to XT resulted ina 136× 14 pseudo-basis matrix and a 14 × 5000 excitation matrix. The hypothesis is that thedimensionally-reduced basis matrix, whose element remains bounded, supported and is assumed to bebeta distributed, captures the salient patterns of variation.
The benchmarked RPBMM algorithm was applied to estimate the final clusters of the reduced136× 14 matrix, which is illustrated in Figure 3a. The clustering is carried out on a 14-dimensionalspace. Table 1 lists the final results. RPBMM inferred a total of nine clusters. In summary, five samples(out of 136 samples) were misclustered. Four cancer samples were identified as normal samples, andonly one normal sample is identified as cancer. This result is the same as the one obtained by applyingRPBMM directly on the original 136 × 5000 data matrix. However, the overall time consumption isreduced from 1275 s to 139 s. Hence, dimension reduction via BG-NMF cannot only yield a convincingclustering result, but also facilitate the calculation.
Int. J. Mol. Sci. 2014, 15 10840
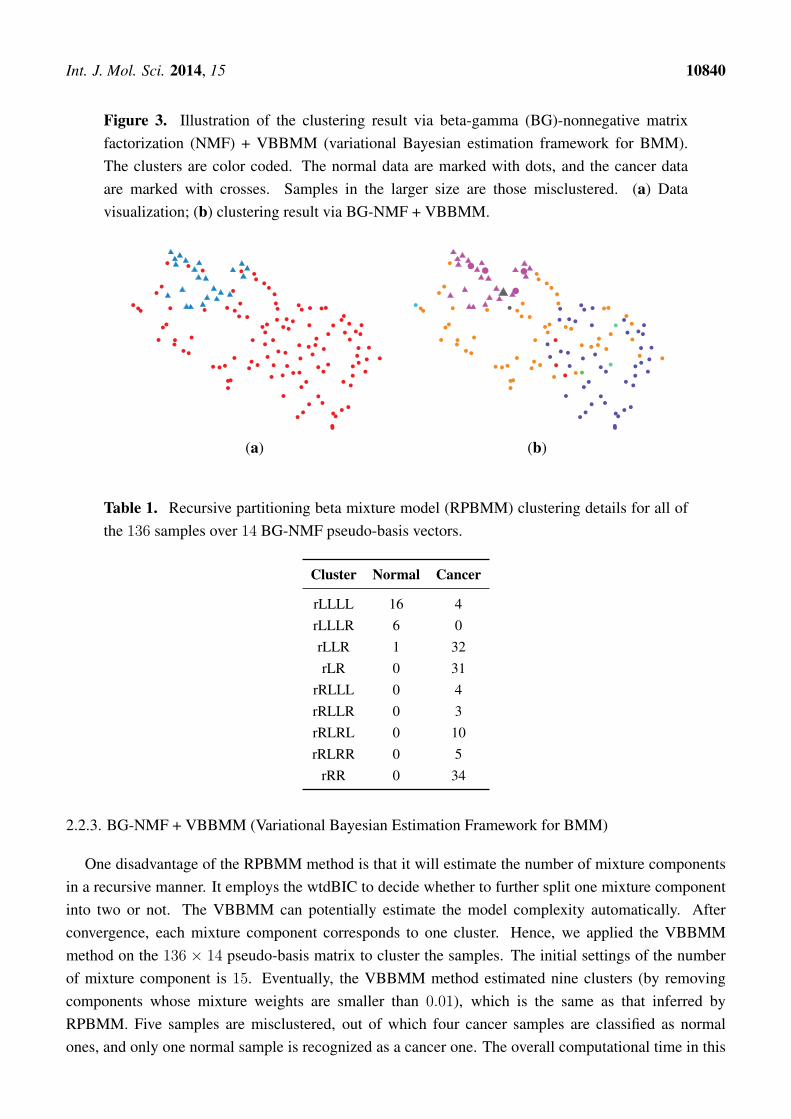
Figure 3. Illustration of the clustering result via beta-gamma (BG)-nonnegative matrixfactorization (NMF) + VBBMM (variational Bayesian estimation framework for BMM).The clusters are color coded. The normal data are marked with dots, and the cancer dataare marked with crosses. Samples in the larger size are those misclustered. (a) Datavisualization; (b) clustering result via BG-NMF + VBBMM.
(a) (b)
Table 1. Recursive partitioning beta mixture model (RPBMM) clustering details for all ofthe 136 samples over 14 BG-NMF pseudo-basis vectors.
Cluster Normal Cancer
rLLLL 16 4rLLLR 6 0rLLR 1 32rLR 0 31
rRLLL 0 4rRLLR 0 3rRLRL 0 10rRLRR 0 5
rRR 0 34
2.2.3. BG-NMF + VBBMM (Variational Bayesian Estimation Framework for BMM)
One disadvantage of the RPBMM method is that it will estimate the number of mixture componentsin a recursive manner. It employs the wtdBIC to decide whether to further split one mixture componentinto two or not. The VBBMM can potentially estimate the model complexity automatically. Afterconvergence, each mixture component corresponds to one cluster. Hence, we applied the VBBMMmethod on the 136 × 14 pseudo-basis matrix to cluster the samples. The initial settings of the numberof mixture component is 15. Eventually, the VBBMM method estimated nine clusters (by removingcomponents whose mixture weights are smaller than 0.01), which is the same as that inferred byRPBMM. Five samples are misclustered, out of which four cancer samples are classified as normalones, and only one normal sample is recognized as a cancer one. The overall computational time in this
Int. J. Mol. Sci. 2014, 15 10841
scenario is about 124 seconds, which is faster than BG-NMF + RPBMM. This is the main advantage ofapplying the BG-NMF + RPBMM method. The clustering results are illustrated in Figure 3.
2.2.4. SC (Spectral Clustering) + VBvMM (Variational Inference Framework-based Bayesian Analysisof the vMF Mixture Model)
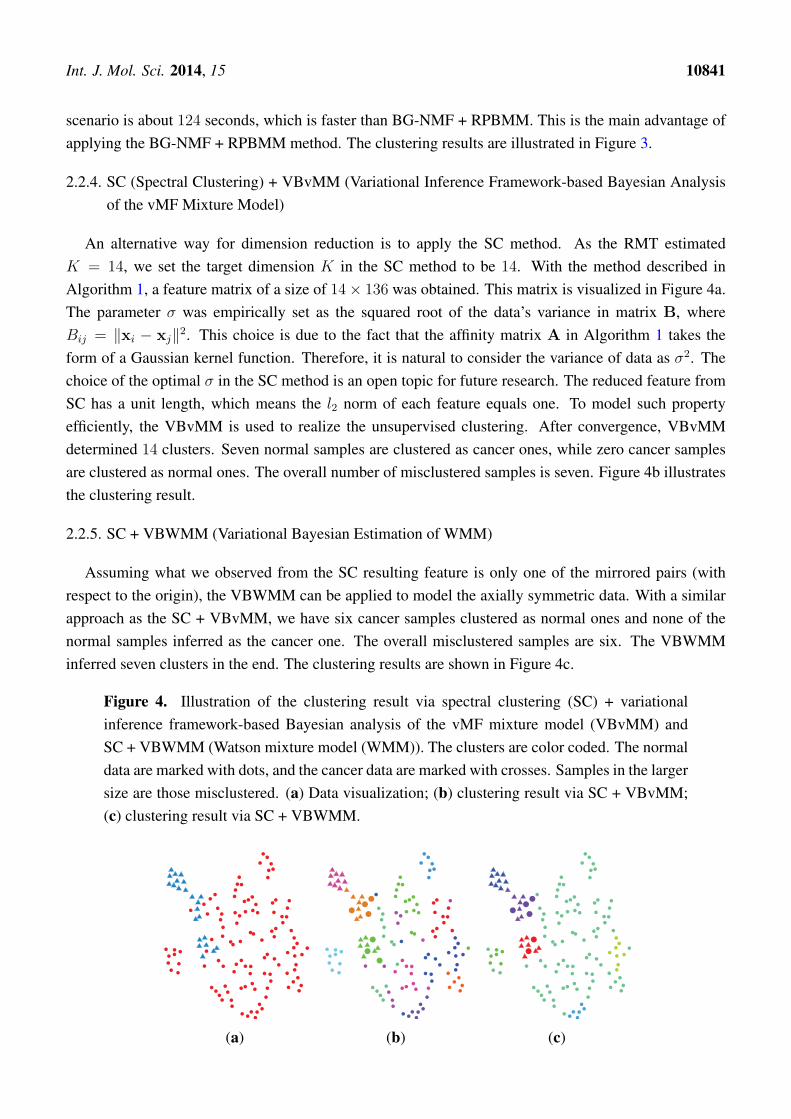
An alternative way for dimension reduction is to apply the SC method. As the RMT estimatedK = 14, we set the target dimension K in the SC method to be 14. With the method described inAlgorithm 1, a feature matrix of a size of 14× 136 was obtained. This matrix is visualized in Figure 4a.The parameter σ was empirically set as the squared root of the data’s variance in matrix B, whereBij = ∥xi − xj∥2. This choice is due to the fact that the affinity matrix A in Algorithm 1 takes theform of a Gaussian kernel function. Therefore, it is natural to consider the variance of data as σ2. Thechoice of the optimal σ in the SC method is an open topic for future research. The reduced feature fromSC has a unit length, which means the l2 norm of each feature equals one. To model such propertyefficiently, the VBvMM is used to realize the unsupervised clustering. After convergence, VBvMMdetermined 14 clusters. Seven normal samples are clustered as cancer ones, while zero cancer samplesare clustered as normal ones. The overall number of misclustered samples is seven. Figure 4b illustratesthe clustering result.
2.2.5. SC + VBWMM (Variational Bayesian Estimation of WMM)
Assuming what we observed from the SC resulting feature is only one of the mirrored pairs (withrespect to the origin), the VBWMM can be applied to model the axially symmetric data. With a similarapproach as the SC + VBvMM, we have six cancer samples clustered as normal ones and none of thenormal samples inferred as the cancer one. The overall misclustered samples are six. The VBWMMinferred seven clusters in the end. The clustering results are shown in Figure 4c.
Figure 4. Illustration of the clustering result via spectral clustering (SC) + variationalinference framework-based Bayesian analysis of the vMF mixture model (VBvMM) andSC + VBWMM (Watson mixture model (WMM)). The clusters are color coded. The normaldata are marked with dots, and the cancer data are marked with crosses. Samples in the largersize are those misclustered. (a) Data visualization; (b) clustering result via SC + VBvMM;(c) clustering result via SC + VBWMM.
(a) (b) (c)

Int. J. Mol. Sci. 2014, 15 10842
2.2.6. Discussion
The comparisons of the above-mentioned four methods are listed in Table 2. All of theabove-mentioned algorithms can yield appropriate unsupervised clustering results. In general,the non-Gaussian distribution-based methods are superior to the Gaussian distribution-basedmethod. This is due to the fact that the Gaussian distribution cannot describe the bounded/unitlength property of the features properly. Among all four non-Gaussian distribution-based methods,the BG-NMF + RPBMM/BG-NMF + VBBMM methods outperform the SC + VBvMM/SC + VBWMMmethods. This is mainly due to the fact that bounded support is an important property of DNAmethylation data [5]. The BG-NMF methods yield reduced features that retain the bounded propertyof the data, while the SC-related methods produced a feature (which has a unit length) that does notdirectly reflect the bounded support property. The BG-NMF + VBBMM performs the best among allthree proposed methods. It also outperforms the benchmarked BG-NMF + RPBMM method in termsof computational cost, which is because of the advantage that the variational Bayesian method canautomatically determine the complexity.
Table 2. Comparisons of the clustering performance of different methods.
Method Error Rate Cancer→Normal Normal→Cancer
PCA + VBGMM 6.62% 9 0
BGNMF + RPBMM 3.68% 4 1
BGNMF + VBBMM 3.68% 4 1
SC + VBvMM 5.15% 7 0
SC + VBWMM 4.41% 6 0
When looking at the misclustered samples, all of the BG-NMF related clustering methods misclusterfour or five cancer samples to normal and miscluster one normal sample to cancer, while the SC-relatedmethod estimated six or seven cancer samples to normal, but no normal sample to cancer. Misclusteringhappens since the data are highly-dimensionally correlated. Although we have reduced the dimensions toremove redundant features, it is still difficult to separate one type of data from the other. The SC-relatedmethods, however, do not miscluster any normal sample to cancer. We speculate that this is because theSC method embedded the data in a tight manner, so that a relatively “clearer” positive/negative boundarycan be obtained than the BG-NMF method. On the one hand, BGNMF-related methods have overallbetter clustering performance than the SC-related methods, but misclustered data in both ways. Onthe other hand, SC-related methods do not cluster any normal data to cancer, but have relatively worseoverall accuracy. These observations motivate us to improve the unsupervised clustering method so thatbetter clustering results can be obtained.

Int. J. Mol. Sci. 2014, 15 10843
In summary, for DNA methylation analysis, the bounded nature of the data plays an important role.Thus, such a property should be retained in both the dimension reduction and clustering methods.Furthermore, an appropriate unsupervised learning method is required for revealing the heterogeneitymore accurately.
3. Experimental Section
3.1. Non-Gaussian Statistical Distributions
The Gaussian distribution (both univariate and multivariate) has a symmetrical “bell” shape, andthe variable’s definition is on the interval (−∞,∞). Non-Gaussian statistical distributions refer to aset of distributions that have special properties that the Gaussian distribution cannot characterize. Forexample, the beta distribution is defined on the interval [0, 1] (in a general form, the beta distributioncould have definition on any interval [a,b]; after linear scaling, it can be represented with the standardbeta distribution [44]) and can have a symmetric or asymmetric shape [27]. The Dirichlet distribution,which is a multivariate generalization of the beta distribution, has a pdf with respect to the Lebesguemeasure on the Euclidean space [45]. The gamma distribution is defined on the interval (0,∞), andthe shape cannot be symmetric [46]. To model data whose l2 norm equals one, the von Mises–Fisher(vMF) distribution [47] and the Watson distribution [48] are usually applied. These distributions showcharacteristics that are significantly different from a Gaussian distribution.
In the remaining part of this section, we will introduce some typical non-Gaussian distributions thatcan be applied in DNA methylation analysis.
3.1.1. Beta Distribution
The beta distribution is characterized by two positive shape parameters u and v. The pdf of the betadistribution is:
Beta(x;u, v) =Γ(u+ v)
Γ(u)Γ(v)xu−1(1− x)v−1 (1)
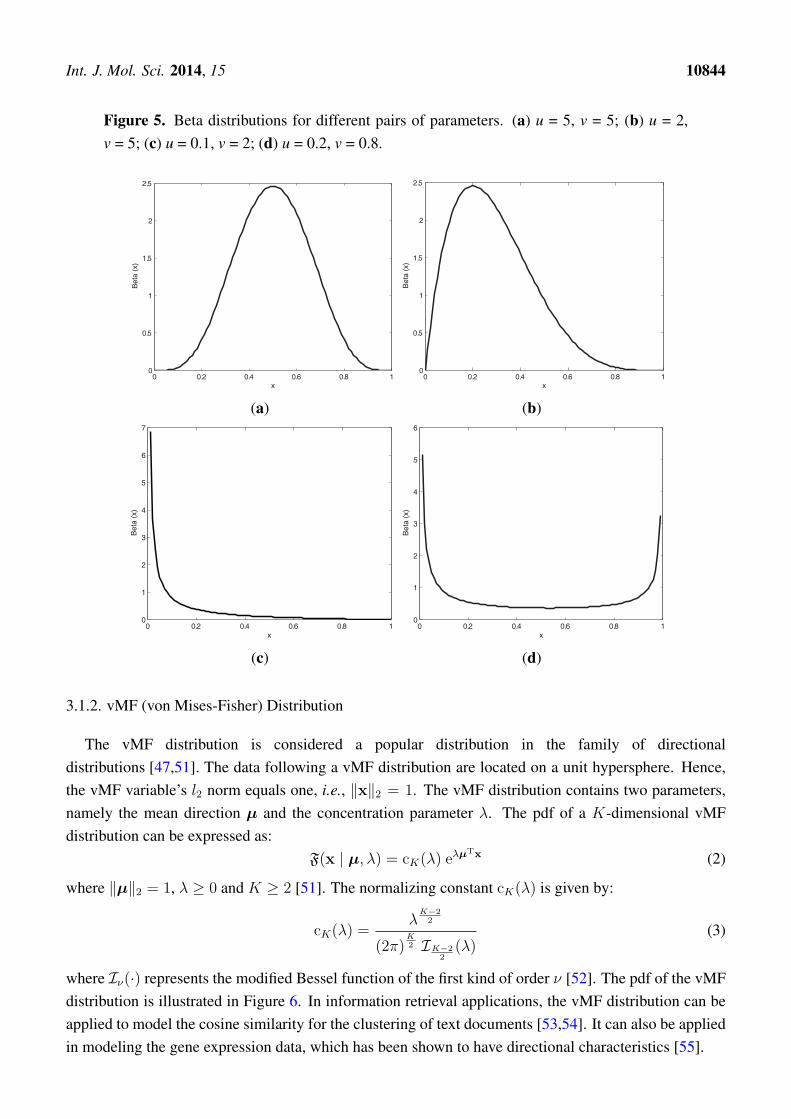
where Γ(·) is the gamma function. The beta distribution has a flexible shape, which is shown in Figure 5.In real applications, the beta distribution can be applied to model the distribution of a gray imagepixel [49], to describe the probability of human immunodeficiency virus (HIV) transmission [50] andto capture the bounded property of the DNA methylation level [8,15].
Int. J. Mol. Sci. 2014, 15 10844
Figure 5. Beta distributions for different pairs of parameters. (a) u = 5, v = 5; (b) u = 2,v = 5; (c) u = 0.1, v = 2; (d) u = 0.2, v = 0.8.
0 0.2 0.4 0.6 0.8 10
0.5
1
1.5
2
2.5
x
Be
ta (
x)
(a)
0 0.2 0.4 0.6 0.8 10
0.5
1
1.5
2
2.5
x
Be
ta (
x)
(b)
0 0.2 0.4 0.6 0.8 10
1
2
3
4
5
6
7
x
Be
ta (
x)
(c)
0 0.2 0.4 0.6 0.8 10
1
2
3
4
5
6
x
Be
ta (
x)
(d)
3.1.2. vMF (von Mises-Fisher) Distribution
The vMF distribution is considered a popular distribution in the family of directionaldistributions [47,51]. The data following a vMF distribution are located on a unit hypersphere. Hence,the vMF variable’s l2 norm equals one, i.e., ∥x∥2 = 1. The vMF distribution contains two parameters,namely the mean direction µ and the concentration parameter λ. The pdf of a K-dimensional vMFdistribution can be expressed as:
F(x | µ, λ) = cK(λ) eλµTx (2)
where ∥µ∥2 = 1, λ ≥ 0 and K ≥ 2 [51]. The normalizing constant cK(λ) is given by:
cK(λ) =λ
K−22
(2π)K2 IK−2
2(λ)
(3)
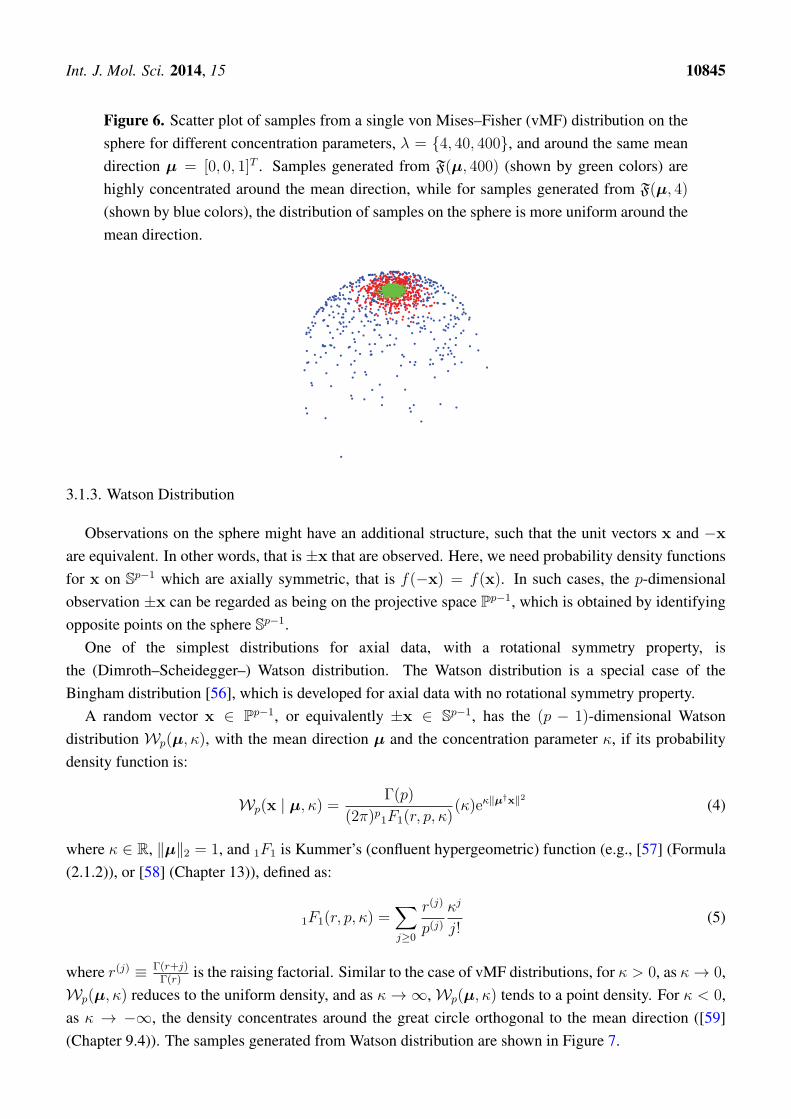
where Iν(·) represents the modified Bessel function of the first kind of order ν [52]. The pdf of the vMFdistribution is illustrated in Figure 6. In information retrieval applications, the vMF distribution can beapplied to model the cosine similarity for the clustering of text documents [53,54]. It can also be appliedin modeling the gene expression data, which has been shown to have directional characteristics [55].
Int. J. Mol. Sci. 2014, 15 10845
Figure 6. Scatter plot of samples from a single von Mises–Fisher (vMF) distribution on thesphere for different concentration parameters, λ = {4, 40, 400}, and around the same meandirection µ = [0, 0, 1]T . Samples generated from F(µ, 400) (shown by green colors) arehighly concentrated around the mean direction, while for samples generated from F(µ, 4)
(shown by blue colors), the distribution of samples on the sphere is more uniform around themean direction.
3.1.3. Watson Distribution
Observations on the sphere might have an additional structure, such that the unit vectors x and −x
are equivalent. In other words, that is ±x that are observed. Here, we need probability density functionsfor x on Sp−1 which are axially symmetric, that is f(−x) = f(x). In such cases, the p-dimensionalobservation ±x can be regarded as being on the projective space Pp−1, which is obtained by identifyingopposite points on the sphere Sp−1.
One of the simplest distributions for axial data, with a rotational symmetry property, isthe (Dimroth–Scheidegger–) Watson distribution. The Watson distribution is a special case of theBingham distribution [56], which is developed for axial data with no rotational symmetry property.
A random vector x ∈ Pp−1, or equivalently ±x ∈ Sp−1, has the (p − 1)-dimensional Watsondistribution Wp(µ, κ), with the mean direction µ and the concentration parameter κ, if its probabilitydensity function is:
Wp(x | µ, κ) = Γ(p)
(2π)p1F1(r, p, κ)(κ)eκ∥µ
†x∥2 (4)
where κ ∈ R, ∥µ∥2 = 1, and 1F1 is Kummer’s (confluent hypergeometric) function (e.g., [57] (Formula(2.1.2)), or [58] (Chapter 13)), defined as:
1F1(r, p, κ) =∑j≥0
r(j)
p(j)κj
j!(5)
where r(j) ≡ Γ(r+j)Γ(r)
is the raising factorial. Similar to the case of vMF distributions, for κ > 0, as κ → 0,Wp(µ, κ) reduces to the uniform density, and as κ → ∞, Wp(µ, κ) tends to a point density. For κ < 0,as κ → −∞, the density concentrates around the great circle orthogonal to the mean direction ([59](Chapter 9.4)). The samples generated from Watson distribution are shown in Figure 7.

Int. J. Mol. Sci. 2014, 15 10846
Figure 7. Scatter plot of samples from a single distribution, Wp(µ, κ), on the spherefor positive and negative concentration parameters κ, around the same mean direction,µ = [0, 1]T [60]. For larger concentration parameters, i.e., κ = 40 or κ = −40, samplesare more concentrated around the mean direction (shown by the red color). For smallerconcentration parameters, i.e., κ = 4 or κ = −4, samples are more uniformly distributedaround the mean direction (shown by the blue color). (a) κ > 0, κ ∈ {+4,+40}; (b) κ < 0,κ ∈ {−4,−40}.
−0.5
0.5
(a) (b)
3.2. Non-Gaussian Dimension Reduction Methods
When analyzing DNA methylation data, the high-dimensional property presents mathematicalchallenges, as well as opportunities. The main purpose of applying dimension reduction methodson microarray data is to extract the core features driving interesting biological variability [61].Such methods include principal component analysis (PCA) [22,62], nonnegative matrix factorization(NMF) [5,63] and singular value decomposition (SVD) [64].
3.3. Nonnegative Matrix Factorization for Bounded Support Data
Unlike PCA or ICA, NMF reveals the data’s nonnegativity during dimension reduction. TraditionalNMF decomposes the data matrix into a product of two nonnegative matrices as:
XP×T ≈ WP×KVK×T (6)
where XP×T , WP×K and VK×T contain nonnegative values Xpt, Wpk and Vkt, respectively, andp = 1, . . . , P , t = 1, . . . , T , k = 1, . . . , K, K << T .
The DNA methylation data are naturally bounded on interval [0, 1]. Conventional NMF strategies donot take such a nature into account. In order to capture such a bounded feature explicitly, we proposedan NMF for bounded support data [65]. Each bounded support element Xpt is assumed to be generatedfrom a beta distribution with parameters apt and bpt. With an observation matrix XP×T , two parameter

Int. J. Mol. Sci. 2014, 15 10847
matrices a and b of size P × T are obtained, respectively. Each parameter matrix, rather than theobservation matrix, is decomposed into a product of a basis matrix and an excitation matrix as:
aP×T ≈ AP×KHK×T
bP×T ≈ BP×KHK×T
(7)
With the above description, we assume that the matrix X (with element Xpt ∈ [0, 1]) is drawnaccording to the following generative model:
Apk ∼ Gamma(Apk;µ0, α0)
Bpk ∼ Gamma(Bpk; ν0, β0)
Hkt ∼ Gamma(Hkt; ρ0, ζ0)
Xpt ∼ Beta(Xpt;∑k
ApkHkt,∑k
BpkHkt)
(8)
where Gamma(x; k, θ) is the gamma density with parameters k, θ defined as:
Gamma(x; k, θ) =θk
Γ(k)xk−1e−θx, k, θ > 0 (9)
As the data is assumed to be beta distributed and the parameters of the beta distribution are assumedto be gamma distributed, this model is named BG-NMF.
For BG-NMF, the variational inference (VI) method [66] is applied to estimate the posteriordistributions. The expected value of Xpt is Xpt = apt
apt+bpt. If we take the point estimate to Apk, Bpk
and Hkt, then the expected value of Xpt can be approximated as:
Xpt ≈∑
k ApkHkt∑k ApkHkt +
∑k BpkHkt
(10)
which can be expressed in matrix form as:
X ≈ (A H)⊘ (A H+BH) (11)
where ⊘ means element-wise division. When placing sparsity constraints on the columns in H, thereconstruction in Equation (11) could be approximated as:
X ≈[A⊘ (A+B)
]H = W H (12)
Hence, the resulting pseudo-basis matrix W is low-dimensional while retaining the boundedsupport constraint.
3.3.1. Spectral Clustering for Non-Gaussian Reduced Features
Recently, spectral clustering (SC) has become one of the most popular clustering algorithms [67]. It isan alternative method for the K-means algorithm. When the natural clusters in RL are not correspondingto the convex region, the K-means algorithm cannot provide satisfactory clustering results. However,when mapping the data points to RK space via SC, they may form tight clusters [68]. SC analyzes

Int. J. Mol. Sci. 2014, 15 10848
the affinity matrix of data. Assuming that the data are likely to be clustered in K-dimensional space,the reduced features, each of which is K-dimensional, are extracted by taking eigenvalue analysis of anintermediate matrix M. The reduced features will then be used for clustering, with conventional methodslike K-means. The feature extraction procedure via the SC method [68] is summarized in Algorithm 1.With the above extracted features, the task of data clustering can be carried out in the reduced RK space.
Algorithm 1 Spectral clustering.
Input: Original data matrix X = {x1,x2, . . . ,xN}, each column is a L-dimensional vector.
1. Create the affinity matrix AN×N , where Aij =
{e
−∥xi−xj∥2
2σ2 i ̸= j
0 i = j;
2. Construct the intermediate matrix M = D− 12AD− 1
2 , where D is a diagonal matrix whose (i, i)thelement is the summation of the i-th row of A;3. Apply eigenvalue analysis on M and create a matrix YK×N , which contains K eigenvectors
corresponding to the largest K eigenvalues;4. Form a matrix Z from Y by normalizing each column of Y. Each column of Z has a unit length.
Output: Reduced K-dimensional feature zn for each data point xn.
3.4. Non-Gaussian Statistical Models for Unsupervised Clustering
The ultimate goal of dimension reduction is to benefit the clustering of DNA methylation data. Thedimension reduction methods introduced above yield features with special properties. The BG-NMFmethod provides a basis matrix (see Equation (12)), every element of which is on the interval [0, 1]. TheSC method constructs feature vectors with a unit length in the reduced K-dimensional space. These dataare obviously non-Gaussian distributed. It has been shown in several studies that applying a suitablenon-Gaussian distribution to model the non-Gaussian distributed data can improve the correspondingperformance [25,26,31]. To this end, we apply the non-Gaussian distribution that can nicely describe thedata distribution to realize the clustering task in the reduced feature space.
3.4.1. Recursive Partitioning Beta Mixture Model
For the beta-valued DNA methylation data, it is natural to consider the beta distribution as acandidate to model the underlying distribution. Since the DNA methylation data that show an obviousnormal/cancer status are multi-modal, a beta mixture model (BMM) can be applied for modeling. Onemixture component represents one cluster. In unsupervised clustering, selecting the optimal number ofclusters is a big challenge. One popular method designed for such purpose is the recursive partitioningbeta mixture model (RPBMM) [12]. The RPBMM navigates clusters in a BMM. It treats each mixturecomponent as a node and takes the weighted version of Bayesian information criterion (wtdBIC) todecide whether to stop further recursive partitioning of the current node. In the end, the optimal numberof clusters is determined. This is a recursive unsupervised learning method. In this paper, the clusteringresults based on the RPBMM method are taken as the benchmark.

Int. J. Mol. Sci. 2014, 15 10849
3.4.2. Variational Beta Mixture Model
Another way of carrying out model selection is to employ the variational Bayesian estimationframework for BMM (VBBMM). Under this circumstance, the joint posterior distribution of theweighting factors is modeled by a sparse Dirichlet distribution, so that the component with a very smallweight will be pruned from the mixture model. In [27], the extended variational inference strategy isapplied to derive an analytically tractable solution for estimating the parameters in a BMM. The proposedalgorithm can remove the redundant component. This closed-form solution avoids the cross-validationin the methods using BIC as the criterion (e.g., [12,44]). Hence, it is computationally efficient, and theunsupervised clustering is facilitated.
3.4.3. Variational von Mises-Fisher Mixture Model
The data with its l2 norm equaling one has a directional property. The von Mises-Fisher (vMF)distribution is suitable for such a type of data [47,69]. In order to decide the model complexity(in terms of free parameters) automatically based on the data, we proposed a variational inferenceframework-based Bayesian analysis of the vMF mixture model (VBvMM) in [47]. This methodcan potentially determine the model complexity and avoid the over-fitting problem associated withconventional approaches based on the expectation maximization. This variational vMM is a suitablemodel for the unsupervised clustering of directional data.
3.4.4. Variational Watson Mixture Model
The Watson distribution is a simple distribution for modeling axially symmetric data on the unithypersphere ([59] (Chapter 9.4)). By assuming that any data point has its axial mirror, it is natural tomodel the distribution of the data with the unit length (i.e., l2 norm equals one) and its axial mirrorby the Watson distribution. Similarly, when such data are multi-modally distributed, a Watson mixturemodel (WMM) can be applied. With a variational inference framework, Taghia et al. [60] proposed thevariational Bayesian estimation of WMM (VBWMM), where the model complexity can be determinedby pruning the irrelevant components. This variational WMM can also be applied for the purpose ofunsupervised clustering.
4. Conclusions
Cancer is characterized by alterations at the DNA methylation level. A Gaussian distribution,in general, cannot describe the DNA methylation data appropriately. Hence, the Gaussiandistribution-based unsupervised clustering does not provide convincing performance.
For the purpose of efficiently clustering DNA methylation data, we proposed several dimensionreduction methods and consequent unsupervised learning methods, which are all based on non-Gaussiandistributions. They all perform better than the Gaussian distribution-based method. In the dimensionreduction step, both the BG-NMF and the SC methods can remove the redundant dimensions efficiently.In unsupervised clustering, the VBBMM method, the VBvMM method and the VBWMM methodcan all reveal the heterogeneity of the DNA methylation data appropriately. Clustering performance

Int. J. Mol. Sci. 2014, 15 10850
demonstrates that the proposed non-Gaussian distribution-based methods are meaningful tools foranalyzing DNA methylation data. Experimental results also show that the BG-NMF + VBBMMmethod performs the best among all of the proposed methods and is faster than the benchmarkedBG-NMF + RPBMM method. Furthermore, for the reduced features inferred from both the BG-NMFmethod and the SC method, the consequent unsupervised clustering method needs to be improved, sothat better clustering accuracy can be obtained.
Moreover, the methodology introduced in this paper can be easily extended to analyze other DNAmethylation data sets. Some other non-Gaussian statistical models can also be applied for such purposes.
Acknowledgments
The authors would like to thank the editor for organizing the review process and thank the anonymousreviewers for their efforts in reviewing this manuscript and providing fruitful suggestions.
This work is partly supported by the “Fundamental Research Funds for the Central Universities”No. 2013XZ11, NSFC Grant No. 61273217, Chinese 111 program of Advanced Intelligence andNetwork Service under Grant No. B08004 and EU FP7 IRSESMobileCloud Project (Grant No. 612212).
Author Contributions
Z.M. provided the non-Gaussian statistical models and the BGNMF code, carried out the VBBMMexperiment, analyzed the results and wrote the manuscript. A.E. Teschendorff provided the DNAmethylation data, conducted the RPBMM experiment and helped in revising the manuscript andanalyzing the results. H.Y. provided the data visualization figures. J.T. implemented the VBvMM andVBWMM experiments. J.G. revised the manuscript.
Conflicts of Interest
The authors declare no conflict of interest.
References
1. Deaton, A.M.; Bird, A. CpG islands and the regulation of transcription. Genes Dev. 2011,25, 1010–1022.
2. Petronis, A. Epigenetics as a unifying principle in the aetiology of complex traits and diseases.Nature 2010, 465, 721–727.
3. Sandoval, J.; Heyn, H.; Moran, S.; Serra-Musach, J.; Pujana, M.A.; Bibikova, M.; Esteller, M.Validation of a DNA methylation microarray for 450,000 CpG sites in the human genome.Epigenetics 2011, 6, 692–702.
4. Du, P.; Zhang, X.; Huang, C.C.; Jafari, N.; Kibbe, W.A.; Hou, L.; Lin, S.M. Comparisonof Beta-value and M-value methods for quantifying methylation levels by microarray analysis.BMC Bioinform. 2010, 11, doi:10.1186/1471-2105-11-587.
Int. J. Mol. Sci. 2014, 15 10851
5. Zhuang, J.; Widschwendter, M.; Teschendorff, A.E. A comparison of feature selectionand classification methods in DNA methylation studies using the Illumina 27k platform.BMC Bioinform. 2012, 13, doi:10.1186/1471-2105-13-59.
6. Barfield, R.T.; Kilaru, V.; Smith, A.K.; Conneely, K.N. CpGassoc: An R function for analysis ofDNA methylation microarray data. Bioinformatics 2012, 28, 1280–1281.
7. Kilaru, V.; Barfield, R.T.; Schroeder, J.W.; Smith, A.K.; Conneely, K.N. MethLAB: A graphicaluser interface package for the analysis of array-based DNA methylation data. Epigenetics 2012,7, 225–229.
8. Laurila, K.; Oster, B.; Andersen, C.; Lamy, P.; Orntoft, T.; Yli-Harja, O.; Wiuf, C. A beta-mixturemodel for dimensionality reduction, sample classification and analysis. BMC Bioinform. 2011,12, doi:10.1186/1471-2105-12-215.
9. Koestler, D.C.; Marsit, C.J.; Christensen, B.C.; Karagas, M.R.; Bueno, R.; Sugarbaker, D.J.;Kelsey, K.T.; Houseman, E.A. Semi-supervised recursively partitioned mixture models foridentifying cancer subtypes. Bioinformatics 2010, 26, 2578–2585.
10. Kuan, P.F.; Wang, S.; Zhou, X.; Chu, H. A statistical framework for Illumina DNA methylationarrays. Bioinformatics 2010, 26, 2849–2855.
11. Houseman, E.A.; Christensen, B.C.; Karagas, M.R.; Wrensch, M.R.; Nelson, H.H.;Wiemels, J.L.; Zheng, S.; Wiencke, J.K.; Kelsey, K.T.; Marsit, C.J. Copy number variationhas little impact on bead-array-based measures of DNA methylation. Bioinformatics 2009,25, 1999–2005.
12. Houseman, E.A.; Christensen, B.C.; Yeh, R.F.; Marsit, C.J.; Karagas, M.R.; Wrensch, M.;Nelson, H.H.; Wiemels, J.; Zheng, S.; Wiencke, J.K.; et al. Model-based clustering of DNAmethylation array data: A recursive-partitioning algorithm for high-dimensional data arising as amixture of beta distributions. BMC Bioinform. 2008, 9, doi:10.1186/1471-2105-9-365.
13. Ji, Y.; Wu, C.; Liu, P.; Wang, J.; Coombes, K.R. Applications of beta-mixture models inbioinformatics. Bioinformatics 2005, 21, 2118–2122.
14. Teschendorff, A.E.; Marabita, F.; Lechner, M.; Bartlett, T.; Tegner, J.; Gomez-Cabrero, D.;Beck, S. A beta-mixture quantile normalization method for correcting probe design bias inIllumina Infinium 450 k DNA methylation data. Bioinformatics 2013, 29, 189–196.
15. Ma, Z.; Teschendorff, A.E. A variational Bayes beta Mixture Model for Feature Selection in DNAmethylation Studies. J. Bioinform. Comput. Biol. 2013, 11. doi:10.1142/S0219720013500054.
16. Teschendorff, A.E.; Zhuang, J.; Widschwendter, M. Independent surrogate variable analysis todeconvolve confounding factors in large-scale microarray profiling studies. Bioinformatics 2011,27, 1496–1505.
17. Zinovyev, A.; Kairov, U.; Karpenyuk, T.; Ramanculov, E. Blind source separation methods fordeconvolution of complex signals in cancer biology. Biochem. Biophys. Res. Commun. 2013,430, 1182–1187.
18. Teschendorff, A.E.; Journée, M.; Absil, P.A.; Sepulchre, R.; Caldas, C. Elucidatingthe altered transcriptional programs in breast cancer using independent component analysis.PLoS Comput. Biol. 2007, 3, e161.
Int. J. Mol. Sci. 2014, 15 10852
19. Flusberg, B.A.; Webster, D.R.; Lee, J.H.; Travers, K.J.; Olivares, E.C.; Clark, T.A.; Korlach, J.;Turner, S.W. Direct detection of DNA methylation during single-molecule, real-time sequencing.Nat. Methods 2010, 7, 461–465.
20. Wang, G.; Kossenkov, A.V.; Ochs, M.F. LS-NMF: A modified non-negative matrix factorizationalgorithm utilizing uncertainty estimates. BMC Bioinform. 2006, 7, 175.
21. Muller, F.J.; Schuldt, B.M.; Williams, R.; Mason, D.; Altun, G.; Papapetrou, E.P.; Danner, S.;Goldmann, J.E.; Herbst, A.; Schmidt, N.O.; et al. A bioinformatic assay for pluripotency inhuman cells. Nat. Methods 2011, 8, 315–317.
22. Bishop, C.M. Pattern Recognition and Machine Learning; Springer: Berlin/Heidelberg,Germany, 2006.
23. Rasmussen, C.E.; Williams, C.K.I. Gaussian Processes for Machine Learning; Adaptivecomputation and machine learning; MIT Press: Cambridge, MA, USA, 2006.
24. DasGupta, A. Probability for Statistics and Machine Learning: Fundamentals and AdvancedTopics; Springer Texts in Statistics; Springer: Berlin/Heidelberg, Germany, 2011.
25. Wegman, E.; Schwartz, S.; Thomas, J. Topics in Non-Gaussian Signal Processing; SpringerLondon, Limited: London, UK, 2011.
26. Ma, Z. Non-Gaussian Statistical Models and Their Applications. Ph.D. Thesis, KTH - RoyalInstitute of Technology, Stockholm, Sweden, 2011.
27. Ma, Z.; Leijon, A. Bayesian estimation of beta mixture models with variational inference.IEEE Trans. Pattern Anal. Mach. Intell. 2011, 33, 2160–2173.
28. Bouguila, N.; Ziou, D. High-dimensional unsupervised selection and estimation of a finitegeneralized dirichlet mixture model based on minimum message length. IEEE Trans. PatternAnal. Mach. Intell. 2007, 29, 1716–1731.
29. Ma, Z.; Leijon, A.; Kleijn, W.B. Vector quantization of LSF parameters with a mixture of dirichletdistributions. IEEE Trans. Audio, Speech, Lang. Process. 2013, 21, 1777–1790.
30. Blei, D.M.; Y., N.A.; Jordan, M.I. Latent dirichlet allocation. J. Mach. Learn. Res. 2003,3, 993–1022.
31. Kwon, H.J. Performance of Non-Gaussian Distribution Based Communication and CompressedSensing Systems. Ph.D. Thesis, University of California, San Diego, CA, USA, 2013.
32. Guo, J.; Guo, H.; Wang, Z. An activation force-based affinity measure for analyzing complexnetworks. Sci. Rep. 2011, doi:10.1038/srep00113.
33. Rodger, J.A. Toward reducing failure risk in an integrated vehicle health maintenance system:A fuzzy multi-sensor data fusion Kalman filter approach for IVHMS. Expert Syst. Appl. 2012,39, 9821–9836.
34. Rodger, J.A. A fuzzy nearest neighbor neural network statistical model for predicting demand fornatural gas and energy cost savings in public buildings. Expert Syst. Appl. 2014, 41, 1813–1829.
35. Ma, Z.; Tan, Z.H.; Prasad, S. EEG signal classification with super-Dirichlet mixture model. InProceedings of the IEEE Statistical Signal Processing Workshop (SSP), Ann Arbor, MI, USA,5–8 Auguest 2012; pp. 440–443.
36. Ma, Z.; Leijon, A.; Tan, Z.H.; Gao, S. Predictive distribution of the dirichlet mixture model bylocal variational inference. J. Signal Process. Syst. 2014, 74, 1–16.

Int. J. Mol. Sci. 2014, 15 10853
37. Curtis, C.; Shah, S.P.; Chin, S.F.; Turashvili, G.; Rueda, O.M.; Dunning, M.J.; Speed, D.;Lynch, A.G.; Samarajiwa, S.; Yuan, Y.; et al. The genomic and transcriptomic architectureof 2,000 breast tumours reveals novel subgroups. Nature 2012, 486, 346–352.
38. GEO. Gene Expression Omnibus. Available online: http://www.ncbi.nlm.nih.gov/geo/ (accessedon 12 June 2014).
39. Zhuang, J.; Jones, A.; Lee, S.H.; Ng, E.; Fiegl, H.; Zikan, M.; Cibula, D.; Sargent, A.;Salvesen, H.B.; Jacobs, I.J.; et al. The dynamics and prognostic potential of DNA methylationchanges at stem cell gene loci in women’s cancer. PLoS Genet. 2012, 8, e1002517.
40. Van der Maaten, L.; Hinton, G. Visualizing Data using t-SNE. J. Mach. Learn. Res. 2008,9, 2579–2605.
41. Plerou, V.; Gopikrishnan, P.; Rosenow, B.; Amaral, L.A.; Guhr, T.; Stanley, H.E. Random matrixapproach to cross correlations in financial data. Phys. Rev. E Stat. Nonlinear Soft Matter Phys.2002, 65, 066126.
42. Jones, P.A.; Baylin, S.B. The epigenomics of cancer. Cell 2007, 128, 683–692.43. Widschwendter, M.; Fiegl, H.; Egle, D.; Mueller-Holzner, E.; Spizzo, G.; Marth, C.;
Weisenberger, D.J.; Campan, M.; Young, J.; Jacobs, I.; et al. Epigenetic stem cell signaturein cancer. Nat. Genet. 2007, 39, 157–158.
44. Bouguila, N.; Ziou, D.; Monga, E. Practical Bayesian estimation of a finite Beta mixture throughgibbs sampling and its applications. Stat. Comput. 2006, 16, 215–225.
45. Kotz, S.; Balakrishnan, N.; Johnson, N.L. Continuous Multivariate Distributions. Volume 1:Models and Applications; Wiley: New York, NY, USA, 2004.
46. Krishnamoorthy, K. Handbook of Statistical Distributions with Applications; Statistics: A Seriesof Textbooks and Monographs; Taylor & Francis: Boca Ration, FL, USA, 2010.
47. Taghia, J.; Ma, Z.; Leijon, A. Bayesian estimation of the von-Mises Fisher mixturemodel with variational inference. IEEE Trans. Pattern Anal. Mach. Intell. 2012,doi:10.1109/TPAMI.2014.2306426.
48. Sra, S.; Karp, D. The multivariate Watson distribution: Maximum-likelihood estimation and otheraspects. J. Multivar. Anal. 2013, 114, 256–269.
49. Ma, Z.; Leijon, A. Beta mixture models and the application to image classification. In Proceedingsof the IEEE International Conference on Image Processing, Cairo, Egypt, 7–10 November 2009,pp. 2045–2048.
50. Regoes, R.R. The role of exposure history on HIV acquisition: Insights from repeated low-dosechallenge studies. PLoS Comput. Biol. 2012, 8, doi:10.1371/journal.pcbi.1002767.
51. Mardia, K.V.; Jupp, P.E. Directional Statistics; John Wiley and Sons: Hoboken, NJ, USA, 2009.52. Abramowitz, M.; Stegun, I.A. Handbook of Mathematical Functions; Dover Publications:
New York, NY, USA, 1965.53. Banerjee, A.; Dhillon, I.S.; Ghosh, J.; Sra, S. Clustering on the unit hypersphere using von
Mises-Fisher distributions. J. Mach. Learn. Res. 2005, 6, 1345–1382.54. López-Cruz, P.L.; Bielza, C.; Larrañaga, P. The von Mises Naive Bayes classifier for angular data.
In Advances in Artificial Intelligence; Lozano, J.A., Gámez, J.A., Moreno, J.A., Eds.; Springer:Berlin/Heidelberg, Germany, 2011; Volume 7023, pp. 145–154.
Int. J. Mol. Sci. 2014, 15 10854
55. Dhillon, I.S.; Marcotte, E.M.; Roshan, U. Diametrical clustering for identifying anti-correlatedgene clusters. Bioinformatics 2003, 19, 1612–1619.
56. Bingham, C. An antipodally symmetric distribution on the sphere. Ann. Stat. 1974, 2, 1201–1225.57. Andrews, G.; Askey, R.; Roy, R. Special Functions; Cambridge University Press: Cambridge,
UK, 1999.58. Daalhuis, A.B.O. The NIST Handbook of Mathematical Functions.; Olver, F.W., Lozier, D.W.,
Boisvert, R.F., Clark, C.W., Eds.; Cambridge University Press: Cambridge, UK, 2010;pp. 321–349.
59. Mardia, K.V.; Jupp, P.E. Directional Statistics; John Wiley and Sons: Hoboken, NJ, USA, 2000.60. Taghia, J.; Leijon, A. Variational inference for Watson mixture model. IEEE Trans. Pattern
Recognit. Mach. Intell. 2014, in press.61. Ochs, M.F.; Godwin, A.K. Microarrays in cancer: Research and applications. Biotechniques
2003, 34 (Suppl. P), S4–S15.62. Liu, J.; Morgan, M.; Hutchison, K.; Calhoun, V.D. A study of the influence of sex on genome
wide methylation. PLoS One 2010, 5, e10028.63. Jung, I.; Kim, D. LinkNMF: Identification of histone modification modules in the human genome
using nonnegative matrix factorization. Gene 2013, 518, 215–221.64. Bell, C.; Teschendorff, A.E.; Rakyan, V.K.; Maxwell, A.P.; Beck, S.; Savage, D.A. Genome-wide
DNA methylation analysis for diabetic nephropathy in type 1 diabetes mellitus. Med. Genomics2010, 3, doi:10.1186/1755-8794-3-33.
65. Ma, Z.; Teschendorff, A.E.; Leijon, A. Variational bayesian matrix factorization for boundedsupport data. IEEE Trans. Pattern Anal. Mach. Intell. 2014; in press.
66. Attias, H. A variational bayesian framework for graphical models. In Advances in NeuralInformation Processing Systems 12; MIT Press: Cambridge, MA, USA, 2000; pp. 209–215.
67. Luxburg, U. A tutorial on spectral clustering. Stat. Comput. 2007, 17, 395–416.68. Ng, A.Y.; Jordan, M.I.; Weiss, Y. On spectral clustering: Analysis and an algorithm. In
Advances in Neural Information Processing Systems; MIT Press: Cambridge, MA, USA, 2001;pp. 849–856.
69. Sra, S. A short note on parameter approximation for von Mises-Fisher distributions and a fastimplementation of Is(x). Comput. Stat. 2012, 27, 177–190.
c⃝ 2014 by the authors; licensee MDPI, Basel, Switzerland. This article is an open access articledistributed under the terms and conditions of the Creative Commons Attribution license(http://creativecommons.org/licenses/by/3.0/).