Comparison of the Performance of Empirical Models Used for the Prediction of the PVT Properties of...
18
This article was downloaded by:[Bello, O. O.] On: 22 March 2008 Access Details: [subscription number 791651203] Publisher: Taylor & Francis Informa Ltd Registered in England and Wales Registered Number: 1072954 Registered office: Mortimer House, 37-41 Mortimer Street, London W1T 3JH, UK Petroleum Science and Technology Publication details, including instructions for authors and subscription information: http://www.informaworld.com/smpp/title~content=t713597288 Comparison of the Performance of Empirical Models Used for the Prediction of the PVT Properties of Crude Oils of the Niger Delta O. O. Bello ab ; K. M. Reinicke b ; P. A. Patil b a Department of Chemical Engineering, Obafemi Awolowo University, Ile-Ife, Nigeria b Institute of Petroleum Engineering, Technische Universität Clausthal, Germany Online Publication Date: 01 January 2008 To cite this Article: Bello, O. O., Reinicke, K. M. and Patil, P. A. (2008) 'Comparison of the Performance of Empirical Models Used for the Prediction of the PVT Properties of Crude Oils of the Niger Delta', Petroleum Science and Technology, 26:5, 593 - 609 To link to this article: DOI: 10.1080/10916460701204685 URL: http://dx.doi.org/10.1080/10916460701204685 PLEASE SCROLL DOWN FOR ARTICLE Full terms and conditions of use: http://www.informaworld.com/terms-and-conditions-of-access.pdf This article maybe used for research, teaching and private study purposes. Any substantial or systematic reproduction, re-distribution, re-selling, loan or sub-licensing, systematic supply or distribution in any form to anyone is expressly forbidden. The publisher does not give any warranty express or implied or make any representation that the contents will be complete or accurate or up to date. The accuracy of any instructions, formulae and drug doses should be independently verified with primary sources. The publisher shall not be liable for any loss, actions, claims, proceedings, demand or costs or damages whatsoever or howsoever caused arising directly or indirectly in connection with or arising out of the use of this material.
-
Upload
independent -
Category
Documents
-
view
5 -
download
0
Transcript of Comparison of the Performance of Empirical Models Used for the Prediction of the PVT Properties of...
This article was downloaded by:[Bello, O. O.]On: 22 March 2008Access Details: [subscription number 791651203]Publisher: Taylor & FrancisInforma Ltd Registered in England and Wales Registered Number: 1072954Registered office: Mortimer House, 37-41 Mortimer Street, London W1T 3JH, UK
Petroleum Science and TechnologyPublication details, including instructions for authors and subscription information:http://www.informaworld.com/smpp/title~content=t713597288
Comparison of the Performance of Empirical ModelsUsed for the Prediction of the PVT Properties of CrudeOils of the Niger DeltaO. O. Bello ab; K. M. Reinicke b; P. A. Patil ba Department of Chemical Engineering, Obafemi Awolowo University, Ile-Ife, Nigeriab Institute of Petroleum Engineering, Technische Universität Clausthal, Germany
Online Publication Date: 01 January 2008To cite this Article: Bello, O. O., Reinicke, K. M. and Patil, P. A. (2008) 'Comparisonof the Performance of Empirical Models Used for the Prediction of the PVTProperties of Crude Oils of the Niger Delta', Petroleum Science and Technology,26:5, 593 - 609To link to this article: DOI: 10.1080/10916460701204685
URL: http://dx.doi.org/10.1080/10916460701204685
PLEASE SCROLL DOWN FOR ARTICLE
Full terms and conditions of use: http://www.informaworld.com/terms-and-conditions-of-access.pdf
This article maybe used for research, teaching and private study purposes. Any substantial or systematic reproduction,re-distribution, re-selling, loan or sub-licensing, systematic supply or distribution in any form to anyone is expresslyforbidden.
The publisher does not give any warranty express or implied or make any representation that the contents will becomplete or accurate or up to date. The accuracy of any instructions, formulae and drug doses should beindependently verified with primary sources. The publisher shall not be liable for any loss, actions, claims, proceedings,demand or costs or damages whatsoever or howsoever caused arising directly or indirectly in connection with orarising out of the use of this material.
Dow
nloa
ded
By:
[Bel
lo, O
. O.]
At:
11:1
6 22
Mar
ch 2
008
Petroleum Science and Technology, 26:593–609, 2008
Copyright © Taylor & Francis Group, LLC
ISSN: 1091-6466 print/1532-2459 online
DOI: 10.1080/10916460701204685
Comparison of the Performance of Empirical
Models Used for the Prediction of the PVT
Properties of Crude Oils of the Niger Delta
O. O. Bello,1;2 K. M. Reinicke,2 and P. A. Patil2
1Department of Chemical Engineering, Obafemi Awolowo University,
Ile-Ife, Nigeria2Institute of Petroleum Engineering, Technische Universität Clausthal, Germany
Abstract: A review of the literature has revealed the lack of a formal analysis of the
performance of empirical methods for the prediction of pressure volume temperature
(PVT) properties of Niger delta crude oils. This study presents an assessment of the
predictive accuracy of five bubble-point pressure (Pb ) correlations and five bubble-
point oil formation volume factor (Bob) correlations against a large measured PVT
data bank from Niger Delta crude oils. Statistical analysis techniques were used to
evaluate the performance and the accuracy of the commonly used empirical models for
estimating PVT properties of Niger crude oil in order to guide designers and operators
in selecting the best correlations for their particular applications. Agreement between
calculated and measured Pb and Bob values for the various models was very poor.
The model predictions of Pb and Bob can be different from the measured values
by 56% and 242%, respectively. Development of improved models for predicting the
PVT properties of Niger delta crude oils is urgently required.
Keywords: empirical models, Niger delta crude oil, PVT properties, statistical
analysis
INTRODUCTION
The prediction of pressure volume temperature (PVT) properties of crude
oil such as bubble-point pressure, bubble-point oil formation volume fac-
tor, isothermal compressibility, viscosity, density, saturation pressures, and
compressibility factor, among others, is achieved by one of three approaches:
Address correspondence to O. O. Bello, Institute of Petroleum Engineering,
Technische Universität Clausthal, Clausthal-Zellerfeld 38678, Germany. E-mail:
593
Dow
nloa
ded
By:
[Bel
lo, O
. O.]
At:
11:1
6 22
Mar
ch 2
008
594 O. O. Bello et al.
equation of state or compositional models (Elsharkawy et al., 2001, 2003;
Elsharkawy, 1999, 2002), neural network models (Elsharkawy and Gharbi,
2000; Gharbi and Elsharkawy, 1997, 1999; Gharbi, 1997), and empirical
models (Standing, 1947; Lasater, 1958; Vazuquez and Beggs, 1980; Glaso,
1980; Pedersen and Fredenslund, 1987; Al-Marhoun, 1988, 1992; Abdul-
Majeed and Salman, 1988; Asgapur et al., 1989; Labedi, 1990; Dokla and
Osman, 1992; Farshad et al., 1992; Macary and El-Batanoney, 1992; Saleh
et al., 1987; Omar and Todd, 1993; Ostermann et al., 1983; Mahmood and
Al-Marhoun, 1996; Elsharkawy et al., 1995; Hanafy et al., 1997; Ozdogan
and Yucel, 2001; Elsharkawy, 2003; Shanshool and Niazi, 2004; Al-Fattah
and Al-Marhoun, 1994; Almehaided, 1997a; Almehaided, 1997b; Petrosky,
1990).
Although the advantages of the existing empirical models are clear, no
quantitative analysis has been published in the literature to validate their accu-
racy with measured PVT properties of crude oils of the Niger Delta. A lack of
trust in design procedures using PVT empirical models has been related to the
range of PVT data available for correlation development (Elsharkawy, 2003b;
Ahmed et al., 1986; Elsharkawy and Elkamel, 2001; Abdul-Majeed, 1985;
Saleh et al., 1987; Sutton and Farshad, 1984, Petrosky and Farshad, 1993;
Boukadi et al., 2002; Elsharkawy et al., 1995), and few of the researchers have
provided information on the accuracy and limitations of their correlations.
This creates a problem for designers who wish to use a correlation but
do not know the limits of its applicability as far as accuracy is concerned.
The problem is even more acute if one tries to decide which of the many
available PVT correlations to use in a particular situation under invidious
choice.
With a production of 2.1 million barrels per day, Nigeria is the world’s
sixth largest oil producer. It has the ambition to increase this production to
5.0 million barrels per day by the year 2008. The most important technical
issues to be addressed in the context of these potential recovery increases of
Nigerian oil deposits is the evaluation of oil and gas reserves; fluid flow
through porous media; multiphase flow in pipes, surface, and subsurface
equipment design; and production system optimization, which depend heavily
upon reservoir fluid physical properties. The objective of this study was to
provide performance evaluation of the PVT empirical models of bubble-point
pressure and bubble-point oil formation volume factor against measured PVT
data of Nigerian crude oils.
METHODS OF COMPARISON
Various statistical methods may be used to determine the relative accuracy
of the PVT empirical models. This can be shown in terms of (1) the relative
average percentage error (APE), (2) the average absolute percentage error
(AAPE), and (3) the standard deviations (SDs). Equations for these measures
Dow
nloa
ded
By:
[Bel
lo, O
. O.]
At:
11:1
6 22
Mar
ch 2
008
Performance of PVT Models for Niger Delta Crude Oils 595
are given as follows:
PE D
�
Estimated � Measured
Measured
�
� 100; (1)
APE D
nX
iD1
.PEi /
n; (2)
APE D
nX
iD1
jPEi j
n; (3)
SD D
v
u
u
u
u
t
n
nX
iD1
.PEi /2 �
nX
iD1
PEi
!2
n2: (4)
The statistical results for the empirical models and the measured PVT data
from crude oils of the Niger delta are listed in Tables 4 and 5, respectively.
The accuracy of the empirical models was also checked by cross plots of
measured versus estimated PVT parameters and plots of error distribution
curve.
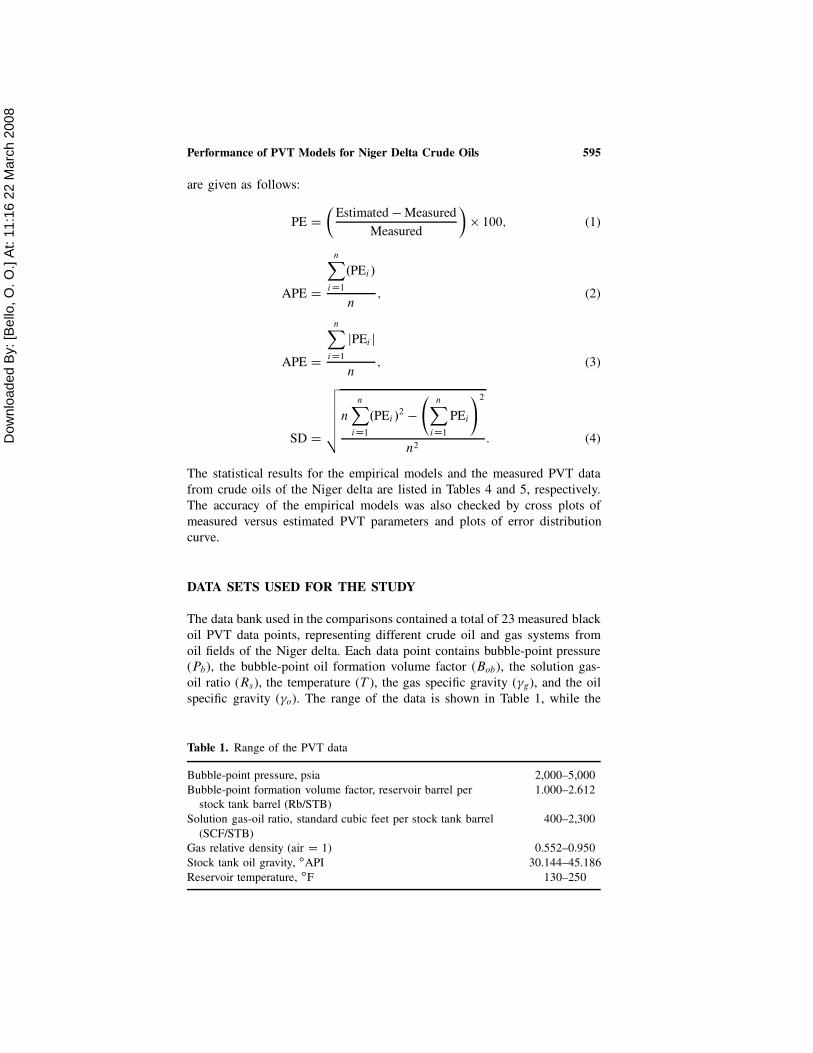
DATA SETS USED FOR THE STUDY
The data bank used in the comparisons contained a total of 23 measured black
oil PVT data points, representing different crude oil and gas systems from
oil fields of the Niger delta. Each data point contains bubble-point pressure
(Pb), the bubble-point oil formation volume factor (Bob), the solution gas-
oil ratio (Rs), the temperature (T ), the gas specific gravity ( g), and the oil
specific gravity ( o). The range of the data is shown in Table 1, while the
Table 1. Range of the PVT data
Bubble-point pressure, psia 2,000–5,000
Bubble-point formation volume factor, reservoir barrel per
stock tank barrel (Rb/STB)
1.000–2.612
Solution gas-oil ratio, standard cubic feet per stock tank barrel
(SCF/STB)
400–2,300
Gas relative density (air D 1) 0.552–0.950
Stock tank oil gravity, ıAPI 30.144–45.186
Reservoir temperature, ıF 130–250
Dow
nloa
ded
By:
[Bel
lo, O
. O.]
At:
11:1
6 22
Mar
ch 2
008
596 O. O. Bello et al.
Table 2. PVT data used for correlations evaluation
Serial
no.
Boi ,
Rb/STB
Pb ,
psia
Rs ,
SCF/STB T , ıF g o
ıAPI
gravity
1 1.978 4,229 2,142 200 0.67 0.817 41.7
2 2.215 4,455 2,049 203 0.65 0.802 44.93
3 1.788 4,557 1,395 206 0.65 0.832 38.57
4 1.278 3,233 571 144 0.61 0.873 30.58
5 1.33 2,956 600 150 0.65 0.845 35.96
6 1.603 3,885 1,236 182 0.61 0.825 40.02
7 1.633 4,158 1,238 189 0.65 0.827 39.6
8 1.651 4,443 1,240 195 0.65 0.837 37.56
9 1.577 3,824 1,296 170 0.69 0.814 42.33
10 1.204 3,863 1,321 170 0.65 0.814 42.33
11 1.66 4,041 1,428 177 0.65 0.814 42.33
12 1.736 4,513 1,432 194 0.65 0.83 38.98
13 1.585 3,663 1,235 178 0.69 0.814 42.33
14 1.624 3,961 1,238 190 0.7 0.825 40.02
15 1.844 4,533 1,694 194 0.7 0.83 38.98
16 1.333 2,646 501 186 0.7 0.85 34.97
17 1.359 2,926 552 187 0.7 0.85 34.97
18 1.34 4,424 2,278 203 0.65 0.83 38.98
19 2.49 4,655 2,315 215 0.65 0.829 39.19
20 1.369 2,287.7 626 174 0.851 0.8271 40.7
21 1.577 4,011 1,052 193 0.838 0.767 37.4
22 1.596 3,158 1,039 210 0.829 0.946 39.2
23 1.846 4,498 1,450 245 0.811 0.793 42.9
measured PVT data used for correlation evaluation is given in Table 2 in
Appendix C.
THE PVT MODELS TESTED
The PVT models used in the comparative study are listed below.
Bubble-point Pressure Correlations
The bubble-point pressure correlations tested against the measured PVT data
points from crude oils of the Niger delta were as follows:
(i) Standing
(ii) Lasater
(iii) Glaso
(iv) Al-Marhoun
(v) Dokla and Osman
Dow
nloa
ded
By:
[Bel
lo, O
. O.]
At:
11:1
6 22
Mar
ch 2
008
Performance of PVT Models for Niger Delta Crude Oils 597
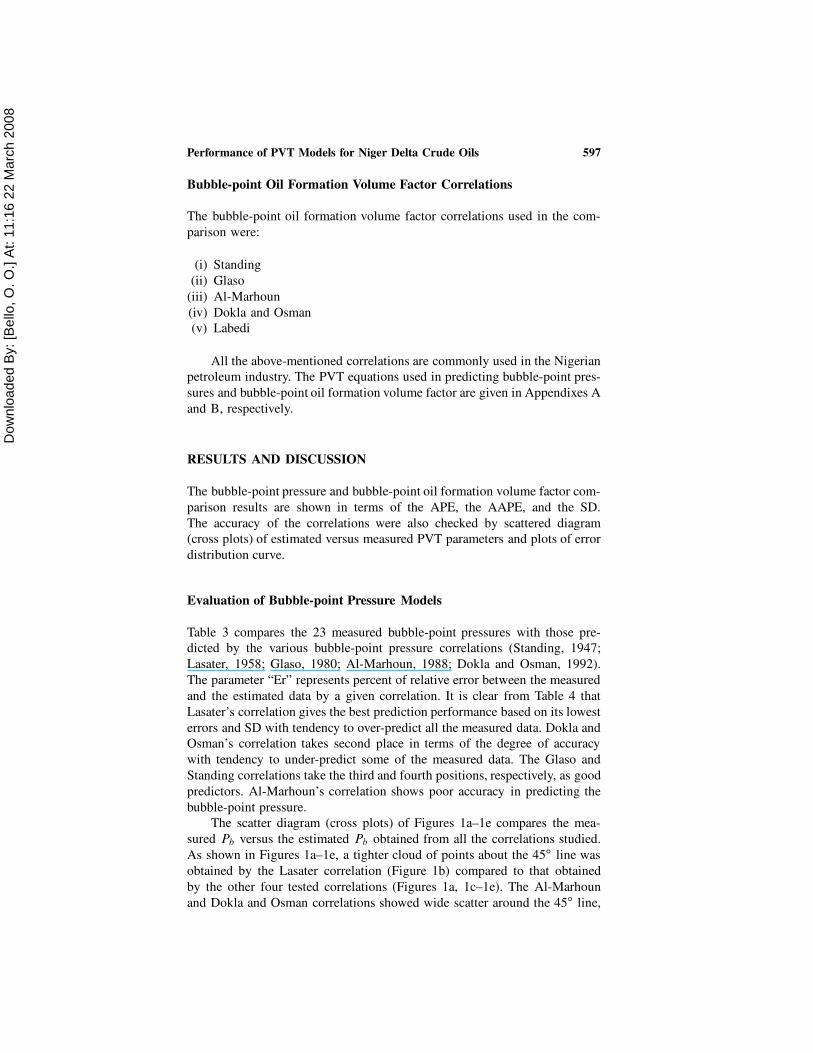
Bubble-point Oil Formation Volume Factor Correlations
The bubble-point oil formation volume factor correlations used in the com-
parison were:
(i) Standing
(ii) Glaso
(iii) Al-Marhoun
(iv) Dokla and Osman
(v) Labedi
All the above-mentioned correlations are commonly used in the Nigerian
petroleum industry. The PVT equations used in predicting bubble-point pres-
sures and bubble-point oil formation volume factor are given in Appendixes A
and B, respectively.
RESULTS AND DISCUSSION
The bubble-point pressure and bubble-point oil formation volume factor com-
parison results are shown in terms of the APE, the AAPE, and the SD.
The accuracy of the correlations were also checked by scattered diagram
(cross plots) of estimated versus measured PVT parameters and plots of error
distribution curve.
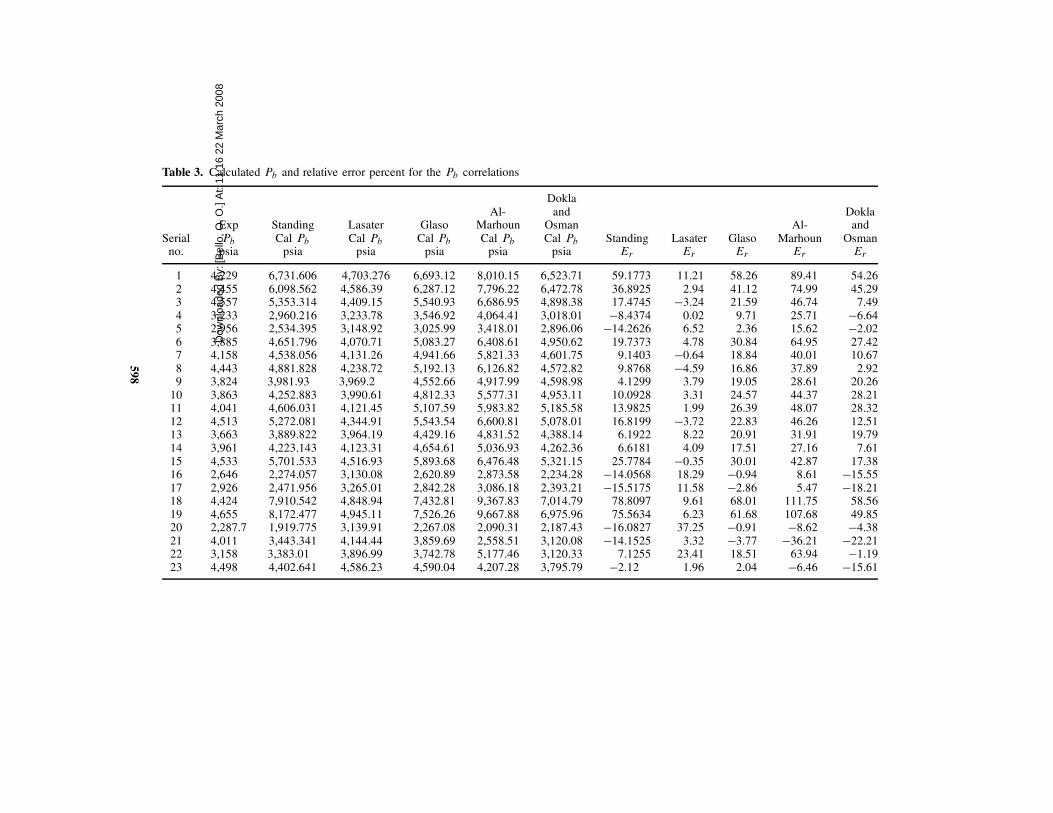
Evaluation of Bubble-point Pressure Models
Table 3 compares the 23 measured bubble-point pressures with those pre-
dicted by the various bubble-point pressure correlations (Standing, 1947;
Lasater, 1958; Glaso, 1980; Al-Marhoun, 1988; Dokla and Osman, 1992).
The parameter “Er” represents percent of relative error between the measured
and the estimated data by a given correlation. It is clear from Table 4 that
Lasater’s correlation gives the best prediction performance based on its lowest
errors and SD with tendency to over-predict all the measured data. Dokla and
Osman’s correlation takes second place in terms of the degree of accuracy
with tendency to under-predict some of the measured data. The Glaso and
Standing correlations take the third and fourth positions, respectively, as good
predictors. Al-Marhoun’s correlation shows poor accuracy in predicting the
bubble-point pressure.
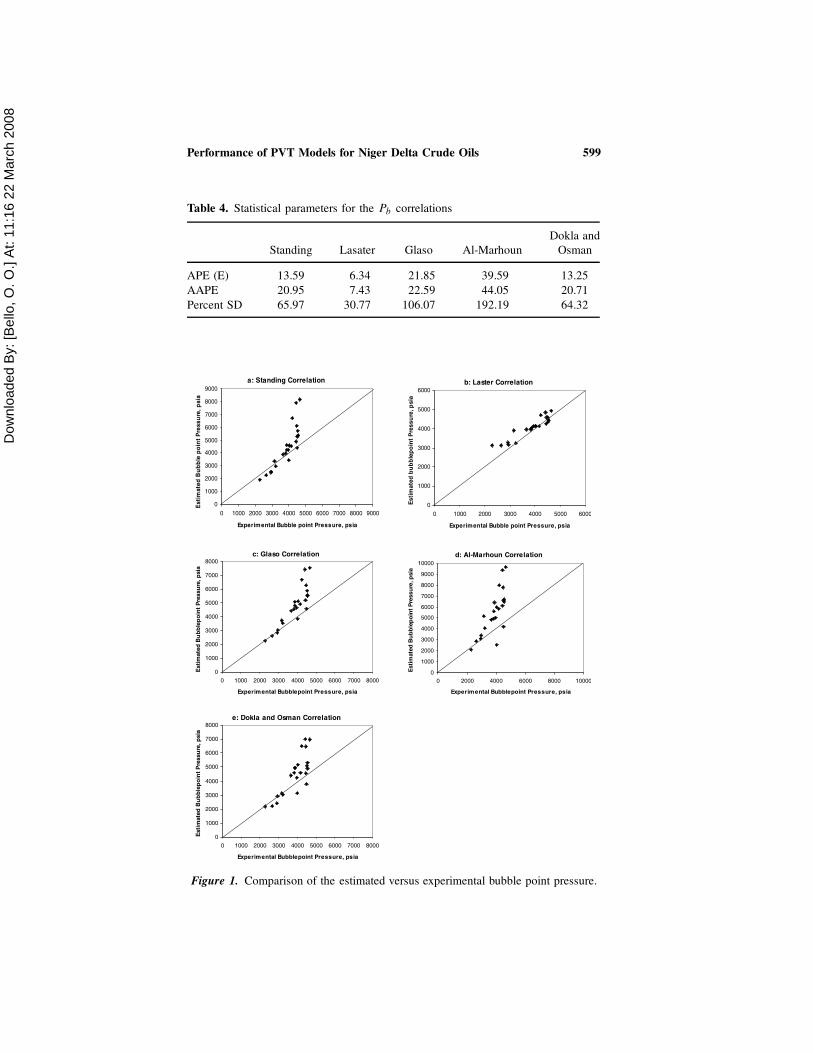
The scatter diagram (cross plots) of Figures 1a–1e compares the mea-
sured Pb versus the estimated Pb obtained from all the correlations studied.
As shown in Figures 1a–1e, a tighter cloud of points about the 45ı line was
obtained by the Lasater correlation (Figure 1b) compared to that obtained
by the other four tested correlations (Figures 1a, 1c–1e). The Al-Marhoun
and Dokla and Osman correlations showed wide scatter around the 45ı line,
Dow
nloa
ded
By:
[Bel
lo, O
. O.]
At:
11:1
6 22
Mar
ch 2
008
Table 3. Calculated Pb and relative error percent for the Pb correlations
Serialno.
ExpPb
psia
StandingCal Pb
psia
LasaterCal Pb
psia
GlasoCal Pb
psia
Al-MarhounCal Pb
psia
Doklaand
OsmanCal Pb
psiaStanding
Er
LasaterEr
GlasoEr
Al-Marhoun
Er
Doklaand
OsmanEr
1 4,229 6,731.606 4,703.276 6,693.12 8,010.15 6,523.71 59.1773 11.21 58.26 89.41 54.262 4,455 6,098.562 4,586.39 6,287.12 7,796.22 6,472.78 36.8925 2.94 41.12 74.99 45.293 4,557 5,353.314 4,409.15 5,540.93 6,686.95 4,898.38 17.4745 �3.24 21.59 46.74 7.494 3,233 2,960.216 3,233.78 3,546.92 4,064.41 3,018.01 �8.4374 0.02 9.71 25.71 �6.645 2,956 2,534.395 3,148.92 3,025.99 3,418.01 2,896.06 �14.2626 6.52 2.36 15.62 �2.026 3,885 4,651.796 4,070.71 5,083.27 6,408.61 4,950.62 19.7373 4.78 30.84 64.95 27.427 4,158 4,538.056 4,131.26 4,941.66 5,821.33 4,601.75 9.1403 �0.64 18.84 40.01 10.678 4,443 4,881.828 4,238.72 5,192.13 6,126.82 4,572.82 9.8768 �4.59 16.86 37.89 2.929 3,824 3,981.93 3,969.2 4,552.66 4,917.99 4,598.98 4.1299 3.79 19.05 28.61 20.26
10 3,863 4,252.883 3,990.61 4,812.33 5,577.31 4,953.11 10.0928 3.31 24.57 44.37 28.2111 4,041 4,606.031 4,121.45 5,107.59 5,983.82 5,185.58 13.9825 1.99 26.39 48.07 28.3212 4,513 5,272.081 4,344.91 5,543.54 6,600.81 5,078.01 16.8199 �3.72 22.83 46.26 12.5113 3,663 3,889.822 3,964.19 4,429.16 4,831.52 4,388.14 6.1922 8.22 20.91 31.91 19.7914 3,961 4,223.143 4,123.31 4,654.61 5,036.93 4,262.36 6.6181 4.09 17.51 27.16 7.6115 4,533 5,701.533 4,516.93 5,893.68 6,476.48 5,321.15 25.7784 �0.35 30.01 42.87 17.3816 2,646 2,274.057 3,130.08 2,620.89 2,873.58 2,234.28 �14.0568 18.29 �0.94 8.61 �15.5517 2,926 2,471.956 3,265.01 2,842.28 3,086.18 2,393.21 �15.5175 11.58 �2.86 5.47 �18.2118 4,424 7,910.542 4,848.94 7,432.81 9,367.83 7,014.79 78.8097 9.61 68.01 111.75 58.5619 4,655 8,172.477 4,945.11 7,526.26 9,667.88 6,975.96 75.5634 6.23 61.68 107.68 49.8520 2,287.7 1,919.775 3,139.91 2,267.08 2,090.31 2,187.43 �16.0827 37.25 �0.91 �8.62 �4.3821 4,011 3,443.341 4,144.44 3,859.69 2,558.51 3,120.08 �14.1525 3.32 �3.77 �36.21 �22.2122 3,158 3,383.01 3,896.99 3,742.78 5,177.46 3,120.33 7.1255 23.41 18.51 63.94 �1.1923 4,498 4,402.641 4,586.23 4,590.04 4,207.28 3,795.79 �2.12 1.96 2.04 �6.46 �15.61
59
8
Dow
nloa
ded
By:
[Bel
lo, O
. O.]
At:
11:1
6 22
Mar
ch 2
008
Performance of PVT Models for Niger Delta Crude Oils 599
Table 4. Statistical parameters for the Pb correlations
Standing Lasater Glaso Al-Marhoun
Dokla and
Osman
APE (E) 13.59 6.34 21.85 39.59 13.25
AAPE 20.95 7.43 22.59 44.05 20.71
Percent SD 65.97 30.77 106.07 192.19 64.32
Figure 1. Comparison of the estimated versus experimental bubble point pressure.
Dow
nloa
ded
By:
[Bel
lo, O
. O.]
At:
11:1
6 22
Mar
ch 2
008
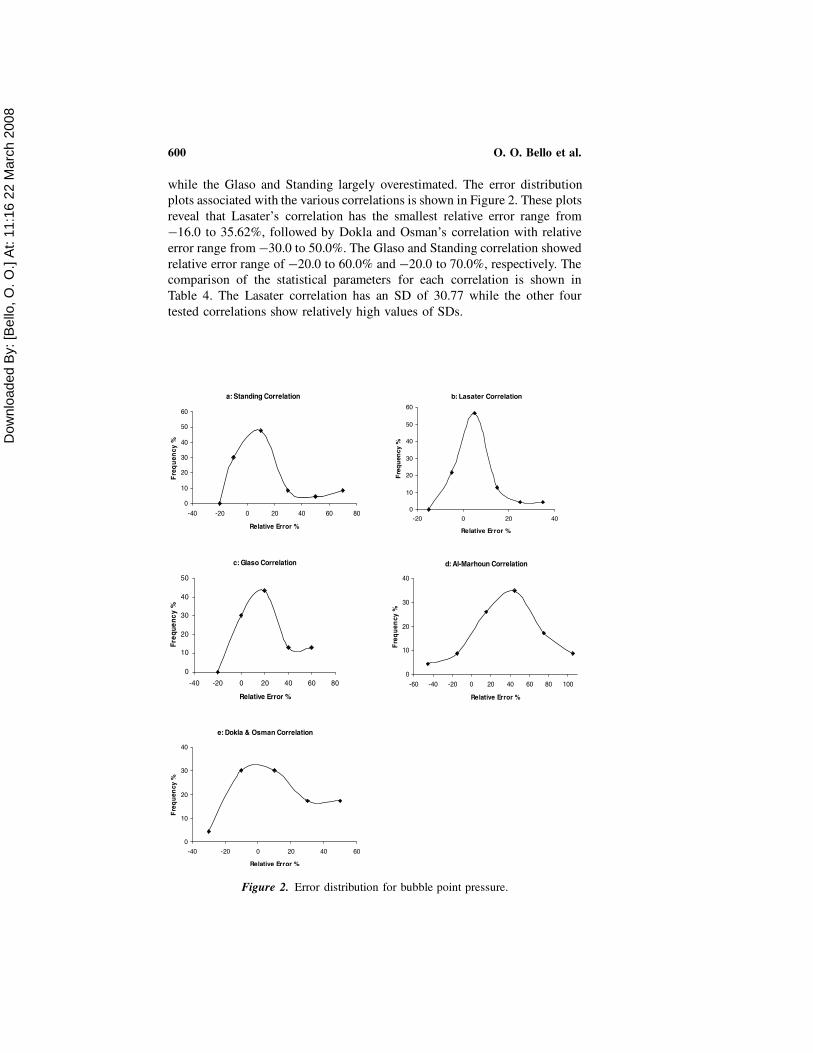
600 O. O. Bello et al.
while the Glaso and Standing largely overestimated. The error distribution
plots associated with the various correlations is shown in Figure 2. These plots
reveal that Lasater’s correlation has the smallest relative error range from
�16.0 to 35.62%, followed by Dokla and Osman’s correlation with relative
error range from �30.0 to 50.0%. The Glaso and Standing correlation showed
relative error range of �20.0 to 60.0% and �20.0 to 70.0%, respectively. The
comparison of the statistical parameters for each correlation is shown in
Table 4. The Lasater correlation has an SD of 30.77 while the other four
tested correlations show relatively high values of SDs.
Figure 2. Error distribution for bubble point pressure.
Dow
nloa
ded
By:
[Bel
lo, O
. O.]
At:
11:1
6 22
Mar
ch 2
008
Performance of PVT Models for Niger Delta Crude Oils 601
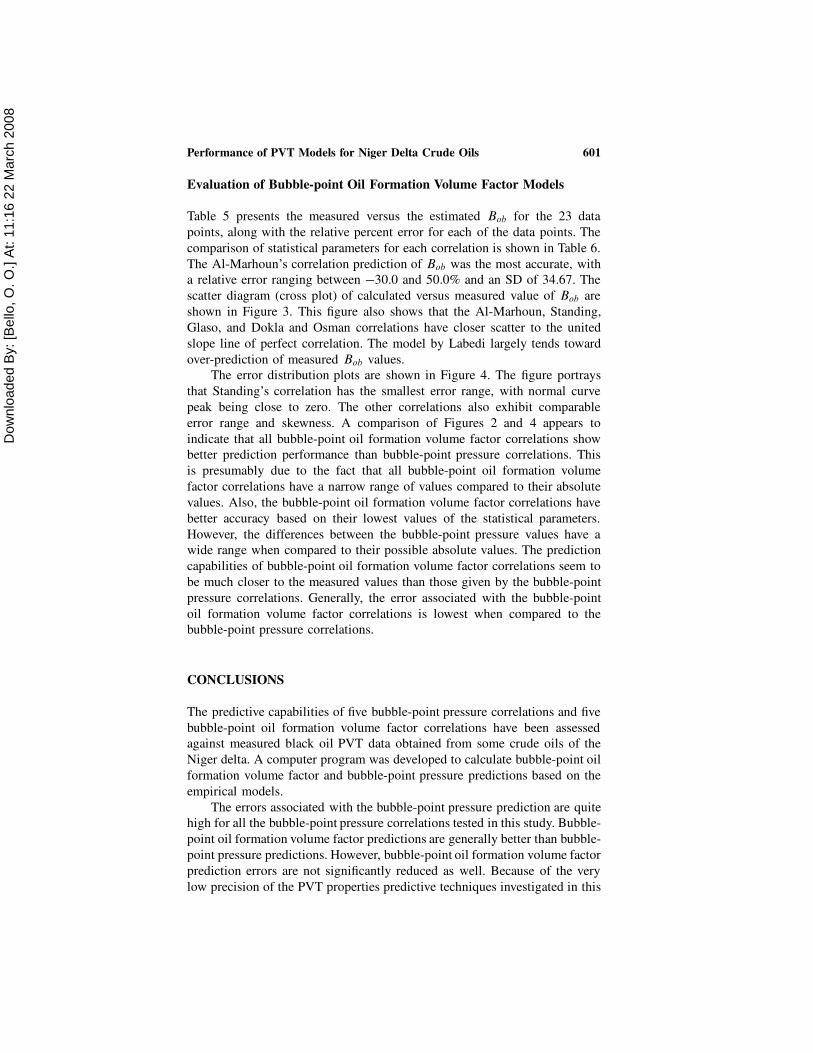
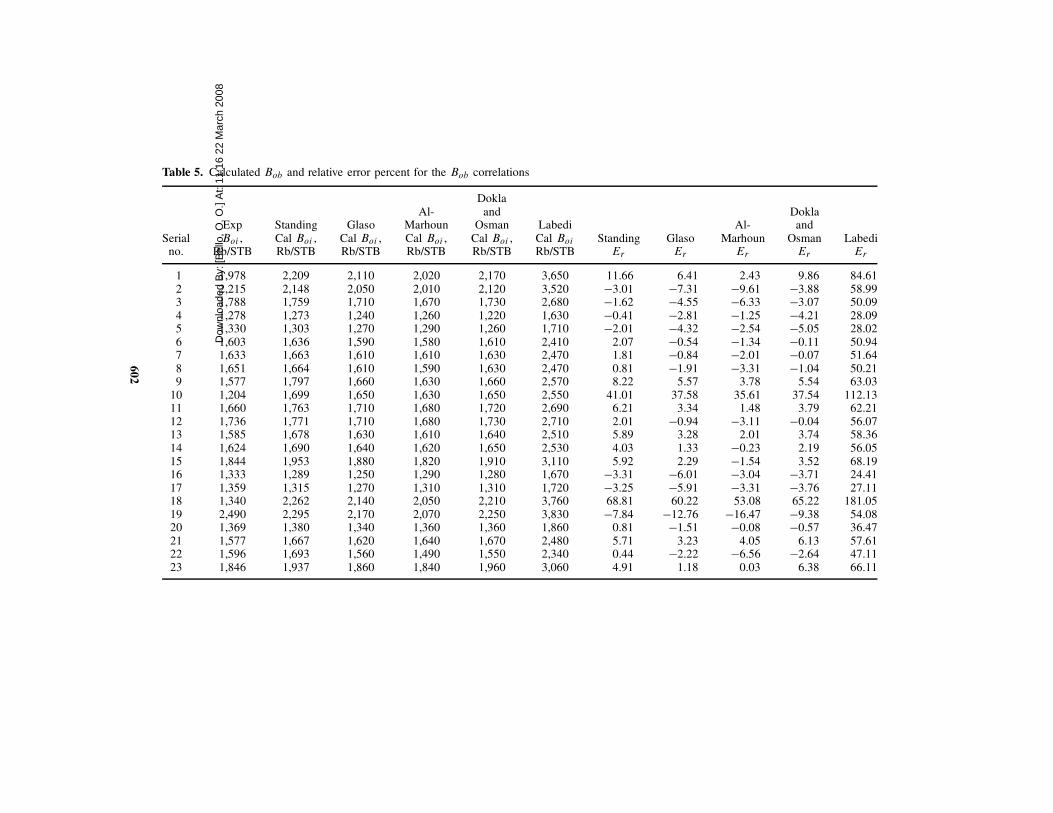
Evaluation of Bubble-point Oil Formation Volume Factor Models
Table 5 presents the measured versus the estimated Bob for the 23 data
points, along with the relative percent error for each of the data points. The
comparison of statistical parameters for each correlation is shown in Table 6.
The Al-Marhoun’s correlation prediction of Bob was the most accurate, with
a relative error ranging between �30.0 and 50.0% and an SD of 34.67. The
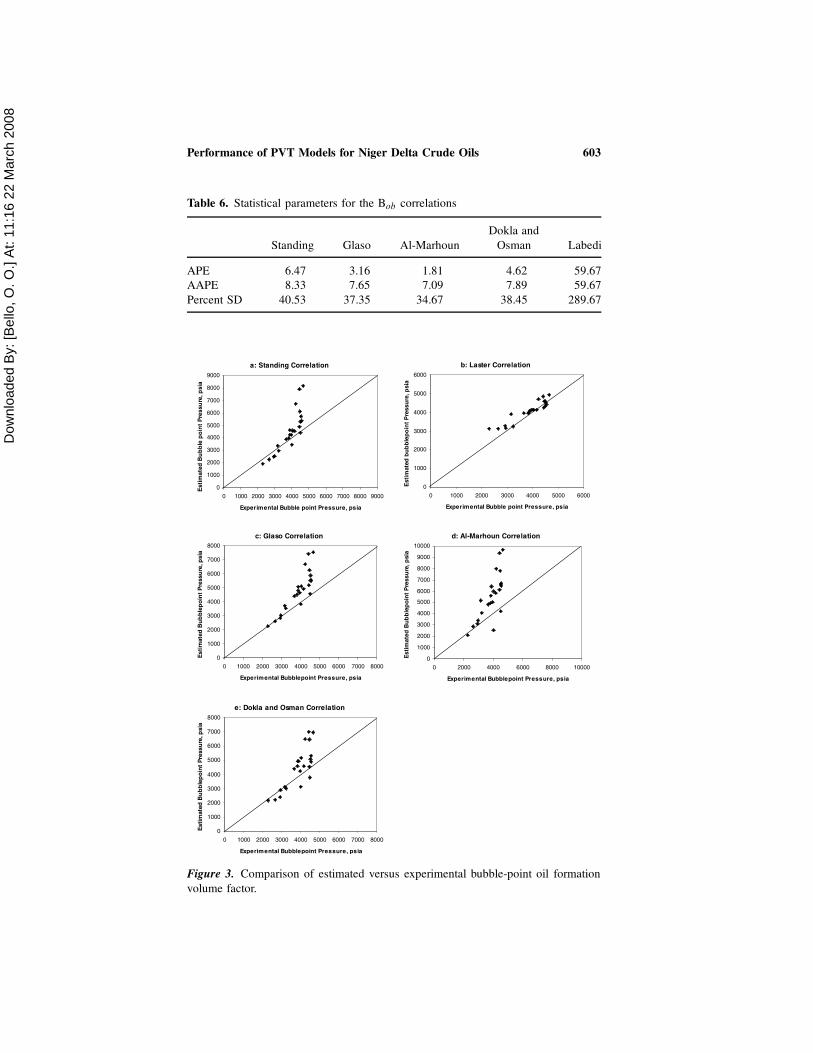
scatter diagram (cross plot) of calculated versus measured value of Bob are
shown in Figure 3. This figure also shows that the Al-Marhoun, Standing,
Glaso, and Dokla and Osman correlations have closer scatter to the united
slope line of perfect correlation. The model by Labedi largely tends toward
over-prediction of measured Bob values.
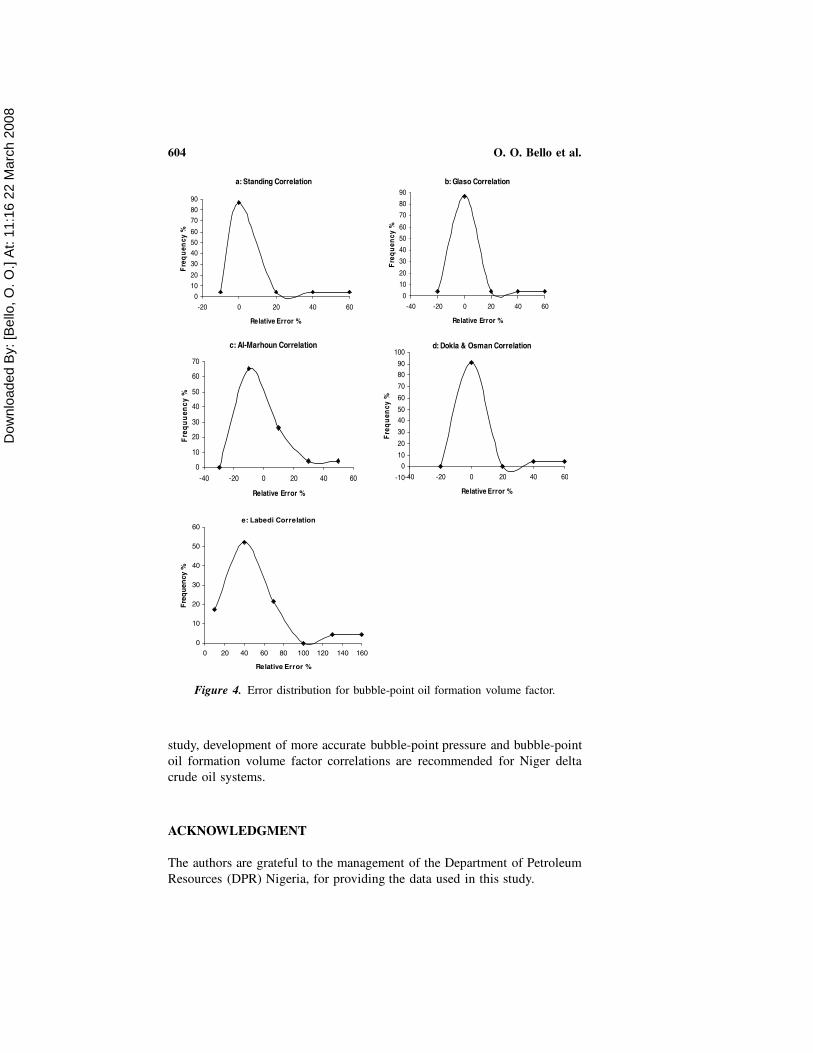
The error distribution plots are shown in Figure 4. The figure portrays
that Standing’s correlation has the smallest error range, with normal curve
peak being close to zero. The other correlations also exhibit comparable
error range and skewness. A comparison of Figures 2 and 4 appears to
indicate that all bubble-point oil formation volume factor correlations show
better prediction performance than bubble-point pressure correlations. This
is presumably due to the fact that all bubble-point oil formation volume
factor correlations have a narrow range of values compared to their absolute
values. Also, the bubble-point oil formation volume factor correlations have
better accuracy based on their lowest values of the statistical parameters.
However, the differences between the bubble-point pressure values have a
wide range when compared to their possible absolute values. The prediction
capabilities of bubble-point oil formation volume factor correlations seem to
be much closer to the measured values than those given by the bubble-point
pressure correlations. Generally, the error associated with the bubble-point
oil formation volume factor correlations is lowest when compared to the
bubble-point pressure correlations.
CONCLUSIONS
The predictive capabilities of five bubble-point pressure correlations and five
bubble-point oil formation volume factor correlations have been assessed
against measured black oil PVT data obtained from some crude oils of the
Niger delta. A computer program was developed to calculate bubble-point oil
formation volume factor and bubble-point pressure predictions based on the
empirical models.
The errors associated with the bubble-point pressure prediction are quite
high for all the bubble-point pressure correlations tested in this study. Bubble-
point oil formation volume factor predictions are generally better than bubble-
point pressure predictions. However, bubble-point oil formation volume factor
prediction errors are not significantly reduced as well. Because of the very
low precision of the PVT properties predictive techniques investigated in this
Dow
nloa
ded
By:
[Bel
lo, O
. O.]
At:
11:1
6 22
Mar
ch 2
008
Table 5. Calculated Bob and relative error percent for the Bob correlations
Serialno.
ExpBoi ,
Rb/STB
StandingCal Boi ,Rb/STB
GlasoCal Boi ,Rb/STB
Al-MarhounCal Boi ,Rb/STB
Doklaand
OsmanCal Boi ,Rb/STB
LabediCal Boi
Rb/STBStanding
Er
GlasoEr
Al-Marhoun
Er
Doklaand
OsmanEr
LabediEr
1 1,978 2,209 2,110 2,020 2,170 3,650 11.66 6.41 2.43 9.86 84.612 2,215 2,148 2,050 2,010 2,120 3,520 �3.01 �7.31 �9.61 �3.88 58.993 1,788 1,759 1,710 1,670 1,730 2,680 �1.62 �4.55 �6.33 �3.07 50.094 1,278 1,273 1,240 1,260 1,220 1,630 �0.41 �2.81 �1.25 �4.21 28.095 1,330 1,303 1,270 1,290 1,260 1,710 �2.01 �4.32 �2.54 �5.05 28.026 1,603 1,636 1,590 1,580 1,610 2,410 2.07 �0.54 �1.34 �0.11 50.947 1,633 1,663 1,610 1,610 1,630 2,470 1.81 �0.84 �2.01 �0.07 51.648 1,651 1,664 1,610 1,590 1,630 2,470 0.81 �1.91 �3.31 �1.04 50.219 1,577 1,797 1,660 1,630 1,660 2,570 8.22 5.57 3.78 5.54 63.03
10 1,204 1,699 1,650 1,630 1,650 2,550 41.01 37.58 35.61 37.54 112.1311 1,660 1,763 1,710 1,680 1,720 2,690 6.21 3.34 1.48 3.79 62.2112 1,736 1,771 1,710 1,680 1,730 2,710 2.01 �0.94 �3.11 �0.04 56.0713 1,585 1,678 1,630 1,610 1,640 2,510 5.89 3.28 2.01 3.74 58.3614 1,624 1,690 1,640 1,620 1,650 2,530 4.03 1.33 �0.23 2.19 56.0515 1,844 1,953 1,880 1,820 1,910 3,110 5.92 2.29 �1.54 3.52 68.1916 1,333 1,289 1,250 1,290 1,280 1,670 �3.31 �6.01 �3.04 �3.71 24.4117 1,359 1,315 1,270 1,310 1,310 1,720 �3.25 �5.91 �3.31 �3.76 27.1118 1,340 2,262 2,140 2,050 2,210 3,760 68.81 60.22 53.08 65.22 181.0519 2,490 2,295 2,170 2,070 2,250 3,830 �7.84 �12.76 �16.47 �9.38 54.0820 1,369 1,380 1,340 1,360 1,360 1,860 0.81 �1.51 �0.08 �0.57 36.4721 1,577 1,667 1,620 1,640 1,670 2,480 5.71 3.23 4.05 6.13 57.6122 1,596 1,693 1,560 1,490 1,550 2,340 0.44 �2.22 �6.56 �2.64 47.1123 1,846 1,937 1,860 1,840 1,960 3,060 4.91 1.18 0.03 6.38 66.11
60
2
Dow
nloa
ded
By:
[Bel
lo, O
. O.]
At:
11:1
6 22
Mar
ch 2
008
Performance of PVT Models for Niger Delta Crude Oils 603
Table 6. Statistical parameters for the Bob correlations
Standing Glaso Al-Marhoun
Dokla and
Osman Labedi
APE 6.47 3.16 1.81 4.62 59.67
AAPE 8.33 7.65 7.09 7.89 59.67
Percent SD 40.53 37.35 34.67 38.45 289.67
Figure 3. Comparison of estimated versus experimental bubble-point oil formation
volume factor.
Dow
nloa
ded
By:
[Bel
lo, O
. O.]
At:
11:1
6 22
Mar
ch 2
008
604 O. O. Bello et al.
Figure 4. Error distribution for bubble-point oil formation volume factor.
study, development of more accurate bubble-point pressure and bubble-point
oil formation volume factor correlations are recommended for Niger delta
crude oil systems.
ACKNOWLEDGMENT
The authors are grateful to the management of the Department of Petroleum
Resources (DPR) Nigeria, for providing the data used in this study.
Dow
nloa
ded
By:
[Bel
lo, O
. O.]
At:
11:1
6 22
Mar
ch 2
008
Performance of PVT Models for Niger Delta Crude Oils 605
REFERENCES
Abdul-Majeed, G. H. (1985). Evaluation of PVT correlations. SPE Paper
no. 14478. Dallas, TX: Society of Petroleum Engineers.
Abdul-Majeed, G. H. A., and Salman, N. H. (1988). An empirical correlation
for FVF prediction. J. Can. Pet. Tech. 27:118–122.
Ahmed, Y., Sugie, H., and Lu, B. C. Y. (1986). Comparative study of eight
equations of state for predicting hydrocarbon volumetric phase behaviour.
SPE Paper no. 15673. 61st SPE Annual Technical Conference and Ex-
hibition, October 5–8.
Al-Fattah, S. M., and Al-Marhoun, M. A. (1994). Evaluation of empirical
correlation for bubble-point oil formation volume factor. J. Pet. Sci. Eng.
11:341–350.
Al-Marhoun, M. A. (1988). PVT correlations for Middle East crude oils. J.
Pet. Technol. Tarns. AIME, 285, May 1988, pp. 650–666.
Al-Marhoun, M. A. (1992). New correlation for formation volume of oil and
gas mixtures. J. Can. Pet. Technol. 31:22–26.
Almehaided, R. A. (1997a). Improved PVT correlations for UAE crude oils.
SPE Paper no. 37691. SPE Middle East Oil Show and Conference,
Manamah, Bahrain, March 15–18, pp. 106–120.
Almehaided, R. A. (1997b). Improved correlations for fluid properties of
UAE crude oils. Pet. Sci. Technol. 21:1811–1831.
Asgapur, S., McLauchlin, L., Wong, D., and Cheung, V. (1989). Pressure
volume temperature correlation for Western Canadian gases and oils. J.
Can. Pet. Technol. 28:103–113.
Boukadi, F. H., Beniani, A. S., and Hashim, A. (2002). PVT empirical models
for saturated Omani crude oils. Pet. Sci. Technol. 20:89–100.
Dokla, M. E., and Osman, M. E. (1992). Correlation of PVT properties for
UAE crudes. SPE Paper no. 21342. SPE Formation Eval., March:41–46,
Elsharkawy, A. M. (1999). Models for predicting the viscosity of Middle-East
crude oils. Fuel 78:891–903.
Elsharkawy, A. M. (2002). Predicting the dew-point pressure for gas con-
densate reservoirs: Empirical models and equation of states. Fluid Phase
Equilibria 193:147–165.
Elsharkawy, A. M. (2003a). An empirical model for estimating the saturation
pressure of crude oils. J. Pet. Sci. Eng. 38:57–77.
Elsharkawy, A. M. (2003b). Predicting volumetric and transport properties of
sour gases and gas condensate using equation of states, corresponding
state models and empirical correlation. Pet. Sci. Technol. 21:1759–1787.
Elsharkawy, A. M., and Elkamel, A. (2001). The accuracy of predicting the
compressibility for sour natural gas. Pet. Sci. Technol. 19:711–731.
Elsharkawy, A. M., and Gharbi, R. B. (2000). Comparing classical and neural
regression techniques in modeling crude oil viscosity. Adv. Eng. Software
32:215–224.
Dow
nloa
ded
By:
[Bel
lo, O
. O.]
At:
11:1
6 22
Mar
ch 2
008
606 O. O. Bello et al.
Elsharkawy, A. M., Elgibaly, A. A., and Alikhan, A. A. (1995). Assessment
of PVT correlations for predicting the properties of Kuwaiti crude oils.
J. Pet. Sci. Eng. 13:219–232.
Elsharkawy, A. M., Hashim, Y. S. K., and Alikhan, A. A. (2001). Compress-
ibility factor for gas condensates. Energy Fuels 15:807–816.
Elsharkawy, A. M., Hassan, S. A., Hashim, Y. S. K., and Fahim, M. A.
(2003). New compositional models for calculating the viscosity of crude
oils. Ind. Eng. Chem. Res. 42:4132–4142.
Farshad, F. F., Leblance, J. L., Garber, J. D., and Osorio, J. G. (1992).
Empirical correlation for Columbian crude oils. SPE Paper no. 24538.
4th Latin American and Caribbean Petroleum Engineering Conference,
Port-of-Spain, Trinidad and Tobago, April 23–26, 1996.
Gharbi, R. B. C. (1997). Estimating the isothermal compressibility coefficient
of under-saturated Middle-East crudes using neural networks. Energy
Fuels 11:372–378.
Gharbi, R. B., and Elsharkawy, A. M. (1997). Neural network model for
estimating the PVT properties of Middle East crude oils. SPE paper
no. 37995. Proc. SPE Middle East Oil Show Conference, Vol. 1, Man-
amah, Bahrain, March 15–18, pp. 151–166.
Gharbi, R. B., and Elsharkawy, A. M. (1999). Universal network model for
estimating the PVT properties of crude oil systems. Energy Fuels 13:454–
458.
Glaso, O. (1980). Generalized pressure volume temperature correlations. Pet.
Technol. Trans., AIME 785–795.
Hanafy, H. H., Macary, S. A., Elnady, Y. M., Bayomi, A. A., and El-Bata-
money, M. H. (1997). Empirical PVT correlation applied to Egyptian
crude oils exemplify significance of using regional correlations. SPE Pa-
per no. 37295. SPE Oilfied Chemistry International Symposium, Febru-
ary 18–21.
Labedi, R. (1990). Use of production data to estimate volume factor, density
and compressibility of reservoir fluids. J. Pet. Sci. Eng. 4:357–390.
Lasater, J. A. (1958). Bubble point pressure correlation. Trans. AIME 213:
379–381.
Macary, S. M., and El-Batanoney, M. H. (1992). Derivation of PVT correla-
tions for the Gulf of Suez crude oils. EGPC, 11th Petroleum Exploration
and Production Conference.
Mahmood, M. M., and Al-Marhoun, M. A. (1996). Evaluation of empirically
derived PVT properties for Pakistani crude oils. J. Pet. Sci. Eng. 16:
275–290.
Omar, M. I., and Todd, A. C. (1993). Development of new modified black
oil correlation for Malaysian crudes. SPE Paper no. 25338. SPE Asia
Pacific Oil and Gas Conference, Singapore, February 8–10.
Ostermann, R. D., Ehlig-Economides, C. A., and Owalabi, O. O. (1983).
Correlation for the reservoir fluid properties of Alaskan crudes. SPE
Paper no. 11703.
Dow
nloa
ded
By:
[Bel
lo, O
. O.]
At:
11:1
6 22
Mar
ch 2
008
Performance of PVT Models for Niger Delta Crude Oils 607
Ozdogan, S., and Yucel, H. G. (2001). Correlations towards prediction of
petroleum fraction viscosities: An empirical approach. Fuel 80:447–449.
Pedersen, K. S., and Fredensluud, A. (1987). An improved corresponding
state model for the prediction of oil and gas viscosities and thermal
conductivities. Chem. Eng. Sci. 42:182–186.
Petrosky, J. (1990). PVT correlations for Gulf of Mexico crude oil. M.Sc.
Thesis, Lafayette, LA: University of Southern Louisiana.
Petrosky, G. E., and Farshad, F. F. (1993). Pressure volume temperature
correlation for the Gulf of Mexico crude oils. SPE Paper no. 26644.
Dallas, TX: Society of Petroleum Engineers.
Saleh, A. M., Maggoub, I. S., and Asaad, Y. (1987). Evaluation of dmpirically
derived PVT properties for Egyptian oils. SPE Paper no. 15721. Dallas,
TX: Society of Petroleum Engineers.
Shanshool, J., and Niazi, E. (2004). Viscosity-temperature correlation crude
oils. Oil Gas Eur. Mag. 4:185–187.
Standing, M. B. (1947). A pressure-volume-temperature correlation for mix-
ture of California oils and gases. Drilling and Production Practices,
Dallas, TX: API, pp. 275–287.
Sutton, R. P., and Farshad, F. F. (1984). Evaluation of empirical derived PVT
properties for Gulf of Mexico crude oils. SPE Paper no. 13172. Dallas,
TX: Society of Petroleum Engineers.
Vazuquez, M., and Beggs, H. D. (1980). Correlation for fluid physical prop-
erties prediction. J. Pet. Technol., Trans. AIME, 269:968–970.
APPENDIX A
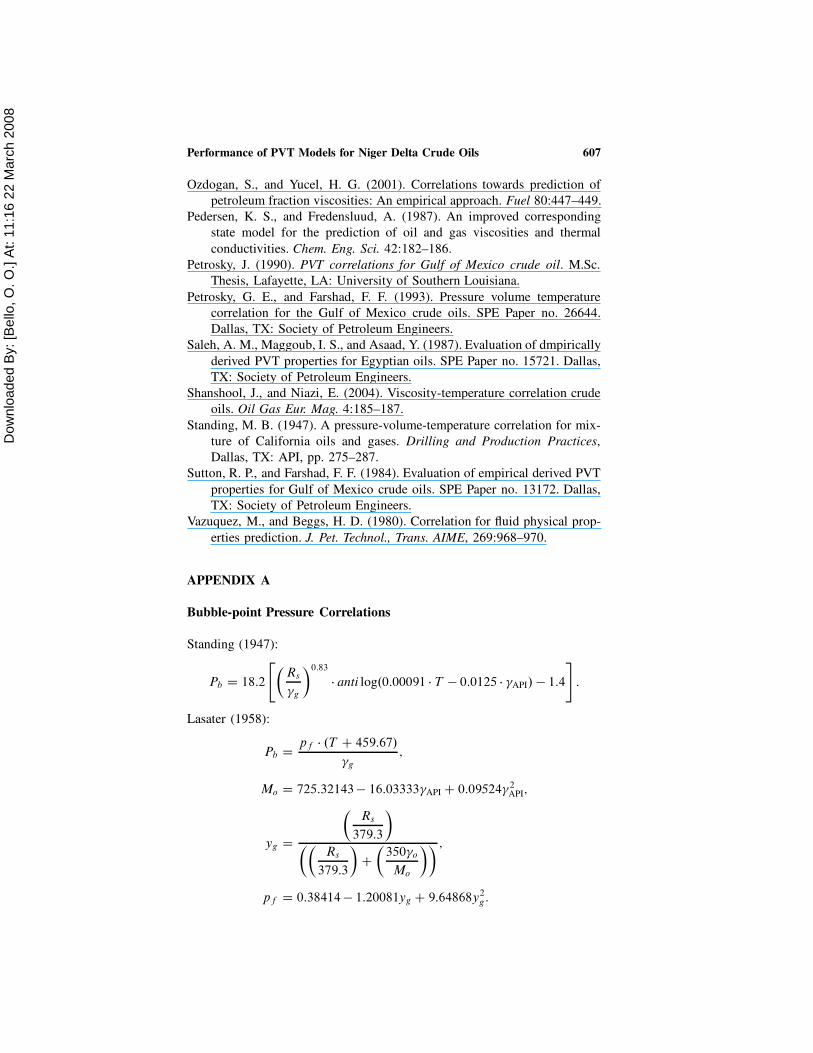
Bubble-point Pressure Correlations
Standing (1947):
Pb D 18:2
"
�
Rs
g
�0:83
� anti log.0:00091 � T � 0:0125 � API/ � 1:4
#
:
Lasater (1958):
Pb Dpf � .T C 459:67/
g
;
Mo D 725:32143 � 16:03333 API C 0:09524 2API;
yg D
�
Rs
379:3
�
��
Rs
379:3
�
C
�
350 o
Mo
�� ;
pf D 0:38414 � 1:20081yg C 9:64868y2g:
Dow
nloa
ded
By:
[Bel
lo, O
. O.]
At:
11:1
6 22
Mar
ch 2
008
608 O. O. Bello et al.
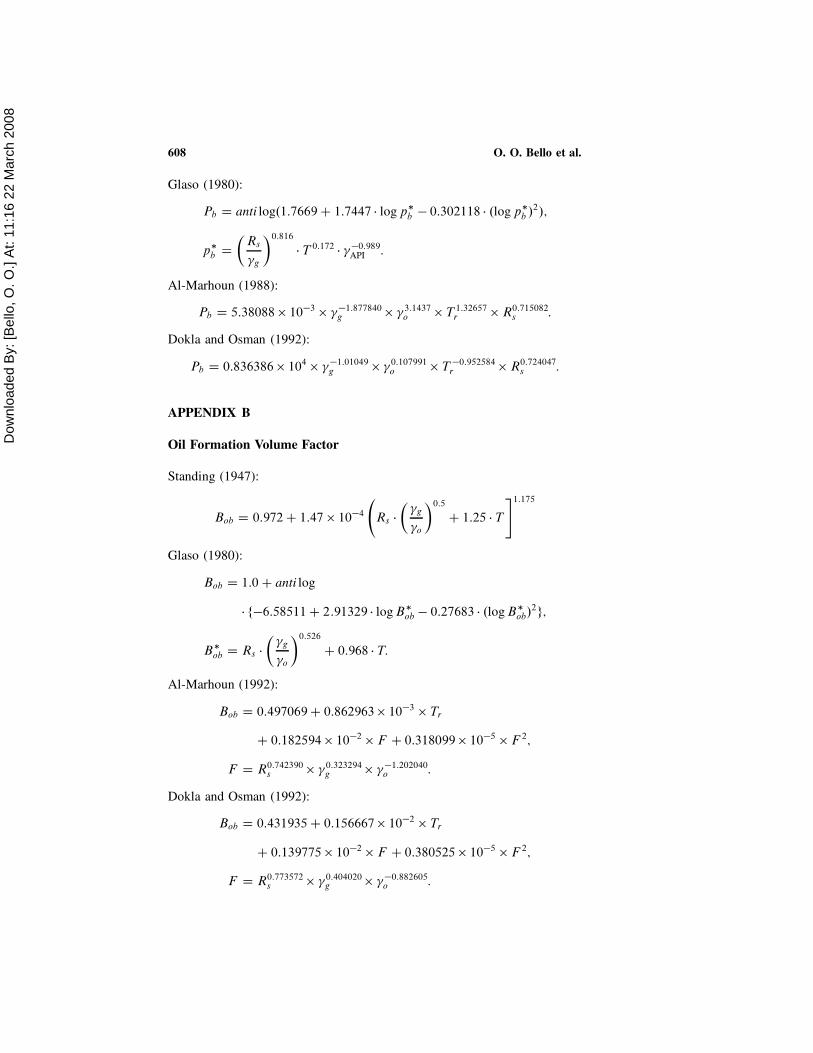
Glaso (1980):
Pb D anti log.1:7669 C 1:7447 � log p�
b � 0:302118 � .log p�
b /2/;
p�
b D
�
Rs
g
�0:816
� T 0:172 � �0:989API :
Al-Marhoun (1988):
Pb D 5:38088 � 10�3 � �1:877840g � 3:1437
o � T 1:32657r � R0:715082
s :
Dokla and Osman (1992):
Pb D 0:836386 � 104 � �1:01049g � 0:107991
o � T �0:952584r � R0:724047
s :
APPENDIX B
Oil Formation Volume Factor
Standing (1947):
Bob D 0:972 C 1:47 � 10�4
Rs �
�
g
o
�0:5
C 1:25 � T
#1:175
Glaso (1980):
Bob D 1:0 C anti log
� f�6:58511 C 2:91329 � log B�
ob � 0:27683 � .log B�
ob/2g;
B�
ob D Rs �
�
g
o
�0:526
C 0:968 � T:
Al-Marhoun (1992):
Bob D 0:497069 C 0:862963 � 10�3 � Tr
C 0:182594 � 10�2 � F C 0:318099 � 10�5 � F 2;
F D R0:742390s � 0:323294
g � �1:202040o :
Dokla and Osman (1992):
Bob D 0:431935 C 0:156667 � 10�2 � Tr
C 0:139775 � 10�2 � F C 0:380525 � 10�5 � F 2;
F D R0:773572s � 0:404020
g � �0:882605o :
Dow
nloa
ded
By:
[Bel
lo, O
. O.]
At:
11:1
6 22
Mar
ch 2
008
Performance of PVT Models for Niger Delta Crude Oils 609
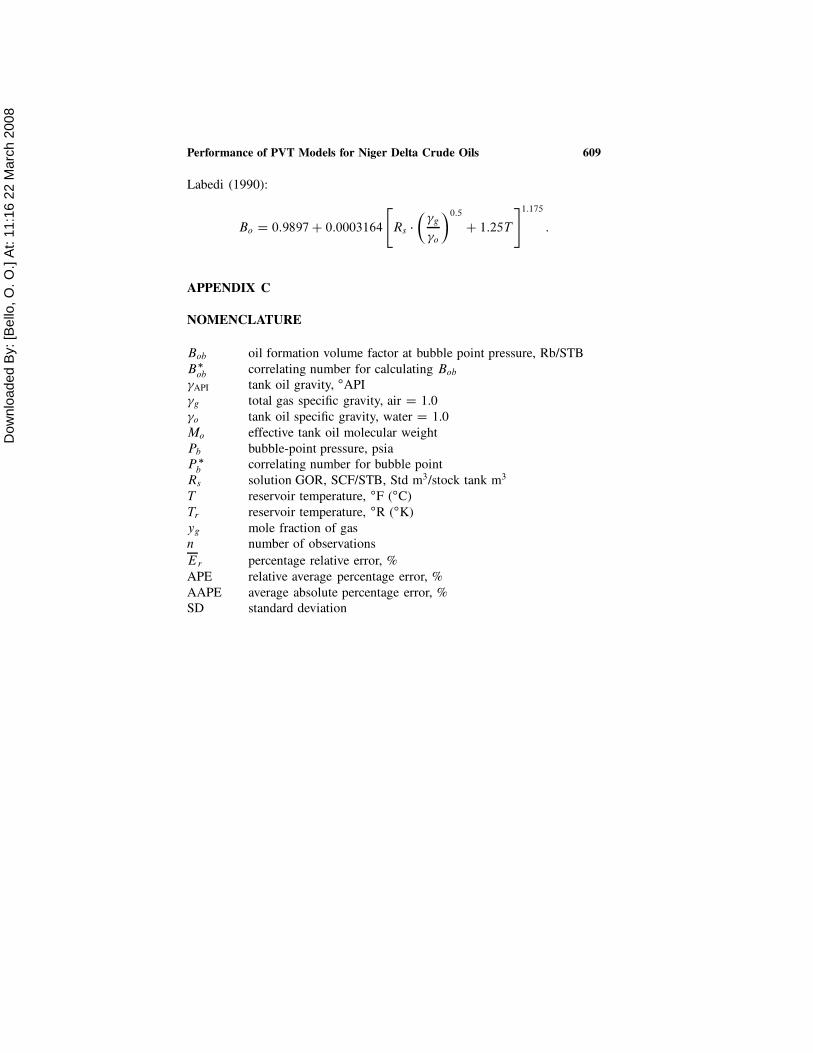
Labedi (1990):
Bo D 0:9897 C 0:0003164
"
Rs �
�
g
o
�0:5
C 1:25T
#1:175
:
APPENDIX C
NOMENCLATURE
Bob oil formation volume factor at bubble point pressure, Rb/STB
B�
ob correlating number for calculating Bob
API tank oil gravity, ıAPI
g total gas specific gravity, air D 1.0
o tank oil specific gravity, water D 1.0
Mo effective tank oil molecular weight
Pb bubble-point pressure, psia
P �
bcorrelating number for bubble point
Rs solution GOR, SCF/STB, Std m3/stock tank m3
T reservoir temperature, ıF (ıC)
Tr reservoir temperature, ıR (ıK)
yg mole fraction of gas
n number of observations
Er percentage relative error, %
APE relative average percentage error, %
AAPE average absolute percentage error, %
SD standard deviation