Structure Learning in Conditional Probability Models via an Entropic Prior and Parameter Extinction
JRRDJRRD Volume 44, Number 4, 2007
Pages 599–610
Journal of Rehabil itation Research & Development
Comparison of spectral and entropic measures for surface electromyography time series: A pilot study
Paul S. Sung, PhD, DHSc, PT;1* Ulrich Zurcher, PhD;2 Miron Kaufman, PhD2
Departments of 1Health Sciences and 2Physics, Cleveland State University, Cleveland, OH
Abstract—In a previous study, we reported that the mean squaredisplacement calculated from the surface electromyography(sEMG) signal of low back muscles exhibits a plateaulike behav-ior for intermediate times 20 ms < t < 400 ms. This property indi-cates the existence of correlations in the signal for times muchlonger than the inverse of the median frequency (MF), which iscalculated from the power spectrum 1/<f > = 1/(100 Hz) = 10 ms,where <f > is the MF. This result suggests the use of methodsfrom nonlinear analysis to characterize sEMG time series. In thisstudy, we applied these techniques to sEMG signals and calcu-lated the time-dependent entropy. The results showed that theentropy of physiological time series from nondisabled controlsubjects is higher than the entropy from subjects with low backpain (LBP). The entropy reveals properties of the sEMG signalthat are not captured by the power spectrum. In turn, this suggestsa possible benefit of entropy as a tool for the clinical assessmentof LBP. Because the two groups of subjects were not matched byage, the physiological origin of the observed differences betweengroups could be attributed to either LBP, age, or both. Additionalstudies with larger sample sizes and age-matched subjects areneeded to investigate the relationship between LBP and entropy.
Key words: clinical assessment, complexity, disability, elec-tromyography, entropy, fatigability, fluctuations, low backpain, nonlinear time series, time correlations.
INTRODUCTION
Low back pain (LBP) is one of the most commontypes of musculoskeletal pain [1–2]. The number of phy-
sician visits resulting from LBP is second only to cardio-vascular problems among chronic disorders. A clinicalassessment of LBP is important for physicians to objec-tively identify subjects with genuine pain and to assessthe efficacy of therapeutic interventions. Surface elec-tromyography (sEMG) is a noninvasive tool that might behelpful in the assessment of LBP. The signals recordedduring an sEMG test from surface electrodes are theinstantaneous algebraic summations of action potentialsfrom muscle fibers. These signals are recorded and thenprocessed with a power spectrum analysis. The medianfrequency (MF) is defined as the frequency at which thespectrum is divided into two equal parts [3]. The typicalMF range is from 70 to 120 Hz [4], which corresponds toa time scale of 10 to 20 ms.
The connection between fatigue and sEMG spectralparameters is the basis for the use of sEMG as an objec-tive and noninvasive method of assessment of back mus-cle endurance [5–6]. The original study linking LBP withfatigue was presented by De Luca [6]. He found that sub-jects with LBP have less endurance and thus smaller MF
Abbreviations: CSU = Cleveland State University, FFT = fastFourier transform, LBP = low back pain, MF = median fre-quency, ODI = Oswestry Disability Index, SD = standard devia-tion, sEMG = surface electromyography.*Address all correspondence to Paul S. Sung, PhD, DHSc,PT; Department of Health Sciences, Cleveland State Univer-sity, 2501 Euclid Avenue (HS 122), Cleveland, OH 44115; 216-687-5447; fax: 216-687-9316. Email: [email protected]: 10.1682/JRRD.2006.10.0132
599
600
JRRD, Volume 44, Number 4, 2007
slopes during sustained muscle contractions [4–5,7].However, contradictory results have been subsequentlyreported [4,8–9]. Humphrey et al. reported that MF slopeis not better than chance in predicting LBP in subjects [8].Thus, despite considerable efforts, a connection betweenspectral quantities and musculoskeletal pain and/or dys-function remains elusive.
Several groups have examined whether other quanti-ties derived from sEMG signals are better indicators forLBP. For example, Ng et al. examined changes in thesEMG amplitude during a sustained contraction [10].Another study found that amplitude-related characteristicsof motor units can help to avoid misleading interpretationsof sEMG changes [11]. Ravier et al. pursued a differentapproach and fitted the sEMG frequency spectrum to P( f )~ 1/f α behavior, where P is the power of the signal, f is thefrequency, and α > 0 is an exponent [3]. Such behavior wasoriginally derived for “self-organized” systems such asavalanches [12]. These results were obtained with nonlin-ear analysis of physiological time series which, in turn, isbased on the recent discovery that fluctuations in biologicalsignals are characterized by several time scales and ampli-tudes [12–13]. Costa et al. suggested that a relatively con-stant output of a physiological system implies largefluctuations of other system variables [14]. In this manner,the physiological system can adapt to sudden changes indemand and stimulus. The extent of fluctuations in physio-logical signals can be quantified by entropy calculatedfrom time series.
In our previous study, we reported the results of anonlinear analysis of sEMG time series from low backmuscles [15]. We calculated the mean square displace-ment Δ as a function of time t. We found that the meansquare displacement increases diffusively for short times(t < 30 ms) and then approaches a plateau value. Thiscrossover implies a transition from an absence of correla-tions in the signal to antipersistence behavior. Similartransitions from short- to long-time behavior have beenobserved for other physiological time series [16–17].Because the mean square displacement is related to theentropy S of the signal, S ~ lnΔ (where ln denotes the nat-ural logarithm), the plateau value can be used to charac-terize the sEMG signal [15]. This pilot study examinedwhether measures of complexity or measures based onthe frequency spectrum are better indicators for differen-tiating between control subjects (nondisabled) and thosewith LBP. Based on the proposed connection betweenentropies of physiological time series and disease, we
expect that subjects with LBP have lower entropy thancontrol subjects.
METHODS
Selection of SubjectsBecause of sex differences and variability in elec-
tromyographic amplitude and MF, only male subjects wereincluded in this study. Subjects were recruited from a com-munity in Cleveland, Ohio. The subjects in the controlgroup did not report a recent history of LBP based on ques-tionnaires. Subjects with LBP were defined as individualswho reported the continued presence of LBP symptoms forat least 2 months [18]. The characteristics of subjects areshown in Table 1. The two groups were matched except forage, with control subjects significantly younger than LBPsubjects.
Subjects in the LBP group were eligible to participateif they (1) reported LBP with or without pain referral intothe lower limbs, (2) were at least 21 years old, and(3) indicated a willingness to participate in the study.Patients were ineligible to participate if they had (1) overtneurological signs (sensory deficits or motor paralysis);(2) a diagnosed psychological illness that might interferewith the study protocol; (3) difficulty understanding writ-ten or spoken English (which precluded them from com-pleting questionnaires); (4) any spinal muscle damage or
Table 1.Summary of control (n = 10) and low back pain (LBP) (n = 10)subjects with selected demographics (Mann-Whitney U test).
Variable Control LBP p-ValueAge (yr)
Range 23–42 28–630.01*
Mean ± SD 30.20 ± 4.91 49.70 ± 10.82Height (cm)
Range 167–191 165–1840.68
Mean ± SD 177.12 ± 8.62 175.25 ± 7.05Body Weight (kg)
Range 67–95 60–1090.79
Mean ± SD 77.14 ± 10.27 80.81 ± 16.18Body Mass Index
Range 22.2–27.3 19.7–32.60.31
Mean ± SD 24.50 ± 1.73 26.17 ± 4.11*p < 0.05.SD = standard deviation.
601
SUNG et al. Spectral and entropic measures for sEMG time series
weakness from previous surgery around the trunk, oropen abdominal surgery; or (5) spinal fractures and acuteneurological symptoms. Volunteers without LBP wereeligible to participate if they met the study inclusion cri-teria. Participants were removed from the study if theyasked to withdraw.
Since results from an earlier study indicated theeffect of hand dominance on back pain, we used a modi-fied Edinburgh Handedness Inventory to determine thedominant side for activities of daily living [19]. All sub-jects received information about the purpose and meth-ods of the study and signed a consent form that theCleveland State University (CSU) Institutional ReviewBoard approved.
Level of DisabilityPatient disability was inferred from self-reported scores
on the Oswestry Disability Index (ODI), which was givento each subject during the initial testing sessions. The ODIis one of the most frequently used tools for measuringchronic disability and is presented as a percentage [20–21],where 0 percent indicates no disability and 100 percentindicates the worst possible disability [22]. The mean ODIscore for the LBP group was 21.2 ± 3.2 percent, with arange of 16.1 to 23.5 percent (values are shown as mean ±standard deviation [SD] unless otherwise noted). The con-trol group did not report any level of pain or disability.
Electromyographic RecordingWe used the modified Sorenson isometric fatigue test
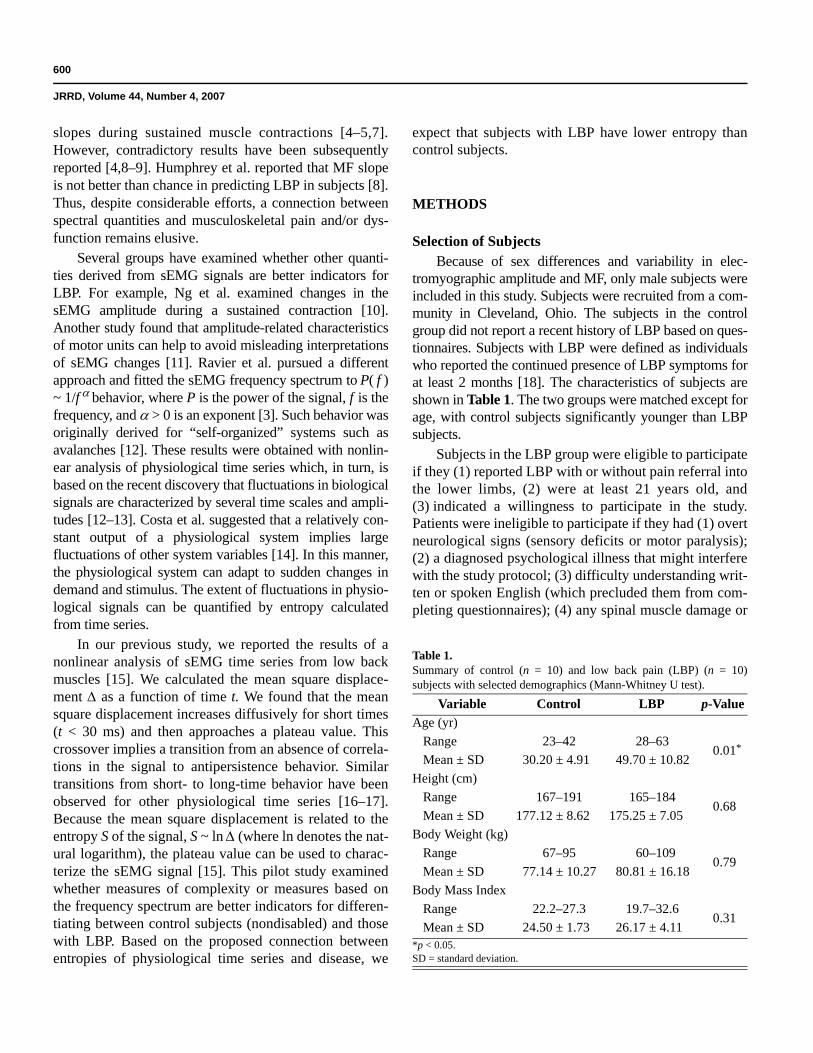
introduced by Mayer et al. [23]. Subjects were asked to liein a prone position on a table and to sustain their unsup-ported trunks horizontally against gravity for 1 minutewhile their lower body was strapped to the table at a 0°angle [24]. The subjects’ upper bodies were positionedwith their iliac crests at the edge of the table. Their lowerbodies were secured at the ankles with seat belt straps.The subjects held their arms across their chests with eachhand placed on the opposite shoulder, and they held a hor-izontal position until exhausted (Figure 1). We discontin-ued the tests once the subjects could no longer maintain ahorizontal position level to the table. The subjects wereallowed to reposition their upper bodies one time duringthe tests. Verbal encouragement was given throughoutthe test for all subjects.
The sEMG electrodes were placed bilaterally overthe erector spinae muscles at the lumbar 4–5 level, with a10 cm distance between electrodes of each pair. We pre-
pared the skin by shaving excess hair and rubbing theskin with alcohol to reduce impedance (typically 10 kΩ).Predetermined landmarks were used as a guideline forelectrode placement. The electrodes were placed over theerector spinae muscle parallel to the orientation of themuscle fibers. The electrode sites and the distance of theelectrodes were carefully determined for each subjectaccording to Zipp [25]. We collected sEMG data usingdifferential (interelectrode distance of 20 mm with 8 mmdiameter), preamplified (gain of 35), silver-silver chlo-ride sEMGs (Therapeutics Unlimited, Inc; Iowa City,Iowa) during the approximately 1-minute testing period.The analog signal was converted digitally at a rate of1024 Hz (AT-MIO-64E-3, National Instruments, Austin,Texas) and bandpass-filtered at 10 to 400 Hz. We per-formed data acquisition using AcqKnowledge® software(BIOPAC Systems, Inc; Goleta, California), and ana-lyzed the resulting data in MathCAD (The MathWorks,Inc; Natick, Massachusetts). Standard recommendationsof sEMG procedures were followed with regard to myo-electric manifestations of muscle fatigue during sustainedcontractions [26].
We used fast Fourier transform (FFT) to obtain thefrequency spectrum for each 1-second time interval, fromwhich we found the MF. Using linear regression, we thencalculated the extrapolated value of the initial MF and theMF slope during the 1-minute testing period.
Nonlinear Time Series AnalysisWe imported sEMG data files into the MathCAD pack-
age, which we then used for the subsequent mathematicalanalysis. The variance of the sEMG signal during 1-second
Figure 1.Modified Sorenson test for fatigue measurements. Subjects, with EMGelectrodes attached over muscles of low back, lay prone while liftingand holding their trunks off of table until completely exhausted.
602
JRRD, Volume 44, Number 4, 2007
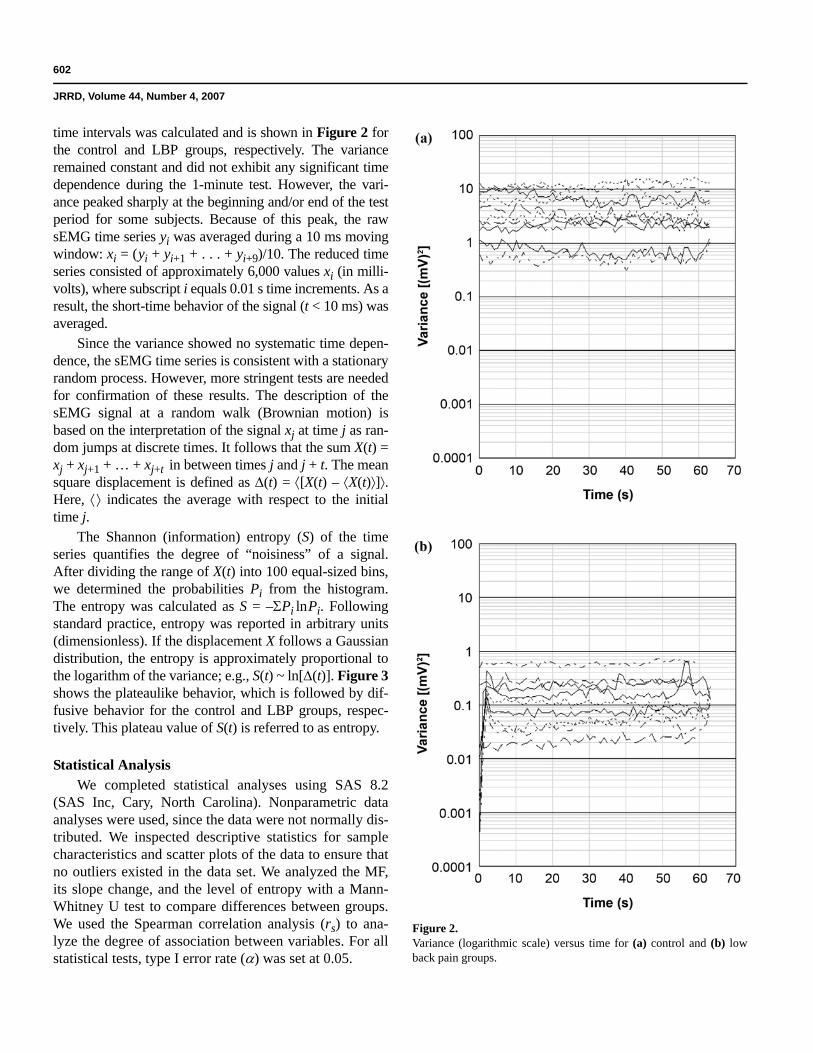
time intervals was calculated and is shown in Figure 2 forthe control and LBP groups, respectively. The varianceremained constant and did not exhibit any significant timedependence during the 1-minute test. However, the vari-ance peaked sharply at the beginning and/or end of the testperiod for some subjects. Because of this peak, the rawsEMG time series yi was averaged during a 10 ms movingwindow: xi = (yi + yi+1 + . . . + yi+9)/10. The reduced timeseries consisted of approximately 6,000 values xi (in milli-volts), where subscript i equals 0.01 s time increments. As aresult, the short-time behavior of the signal (t < 10 ms) wasaveraged.
Since the variance showed no systematic time depen-dence, the sEMG time series is consistent with a stationaryrandom process. However, more stringent tests are neededfor confirmation of these results. The description of thesEMG signal at a random walk (Brownian motion) isbased on the interpretation of the signal xj at time j as ran-dom jumps at discrete times. It follows that the sum X(t) =xj + xj+1 + … + xj+t in between times j and j + t. The meansquare displacement is defined as Δ(t) = ⟨[X(t) – ⟨X(t)⟩]⟩.Here, ⟨⟩ indicates the average with respect to the initialtime j.
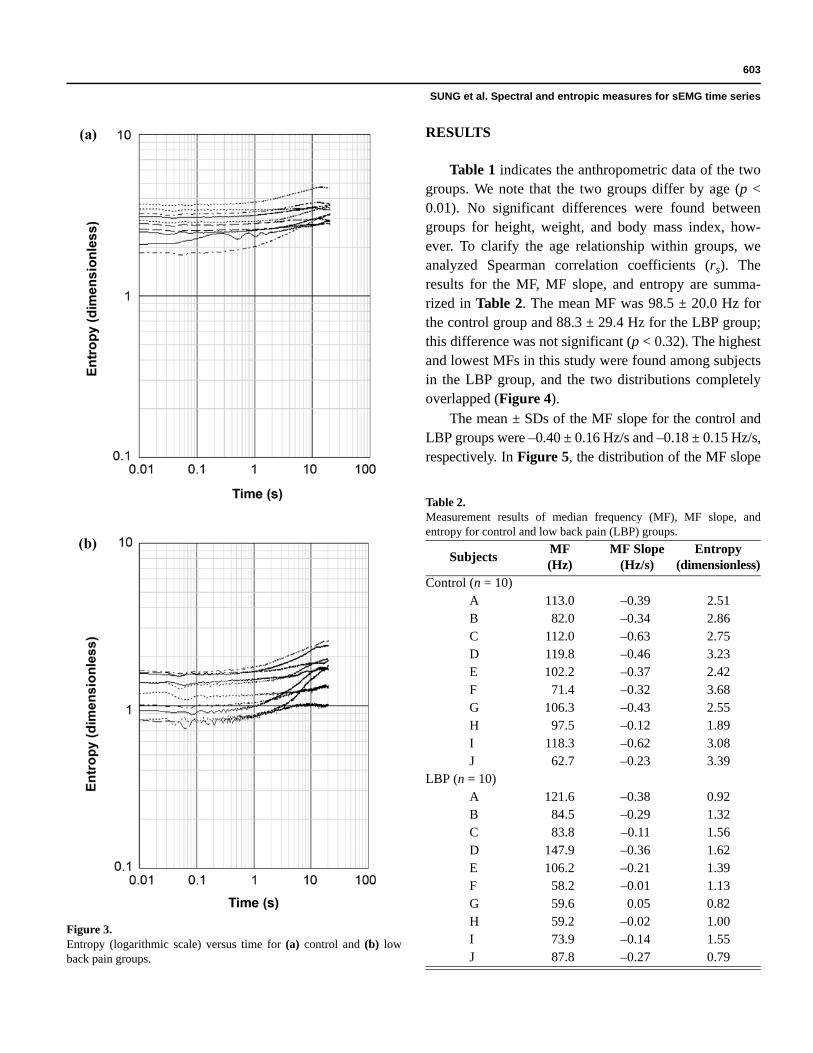
The Shannon (information) entropy (S) of the timeseries quantifies the degree of “noisiness” of a signal.After dividing the range of X(t) into 100 equal-sized bins,we determined the probabilities Pi from the histogram.The entropy was calculated as S = –ΣPi lnPi. Followingstandard practice, entropy was reported in arbitrary units(dimensionless). If the displacement X follows a Gaussiandistribution, the entropy is approximately proportional tothe logarithm of the variance; e.g., S(t) ~ ln[Δ(t)]. Figure 3shows the plateaulike behavior, which is followed by dif-fusive behavior for the control and LBP groups, respec-tively. This plateau value of S(t) is referred to as entropy.
Statistical AnalysisWe completed statistical analyses using SAS 8.2
(SAS Inc, Cary, North Carolina). Nonparametric dataanalyses were used, since the data were not normally dis-tributed. We inspected descriptive statistics for samplecharacteristics and scatter plots of the data to ensure thatno outliers existed in the data set. We analyzed the MF,its slope change, and the level of entropy with a Mann-Whitney U test to compare differences between groups.We used the Spearman correlation analysis (rs) to ana-lyze the degree of association between variables. For allstatistical tests, type I error rate (α) was set at 0.05.
Figure 2.Variance (logarithmic scale) versus time for (a) control and (b) lowback pain groups.
603
SUNG et al. Spectral and entropic measures for sEMG time series
RESULTS
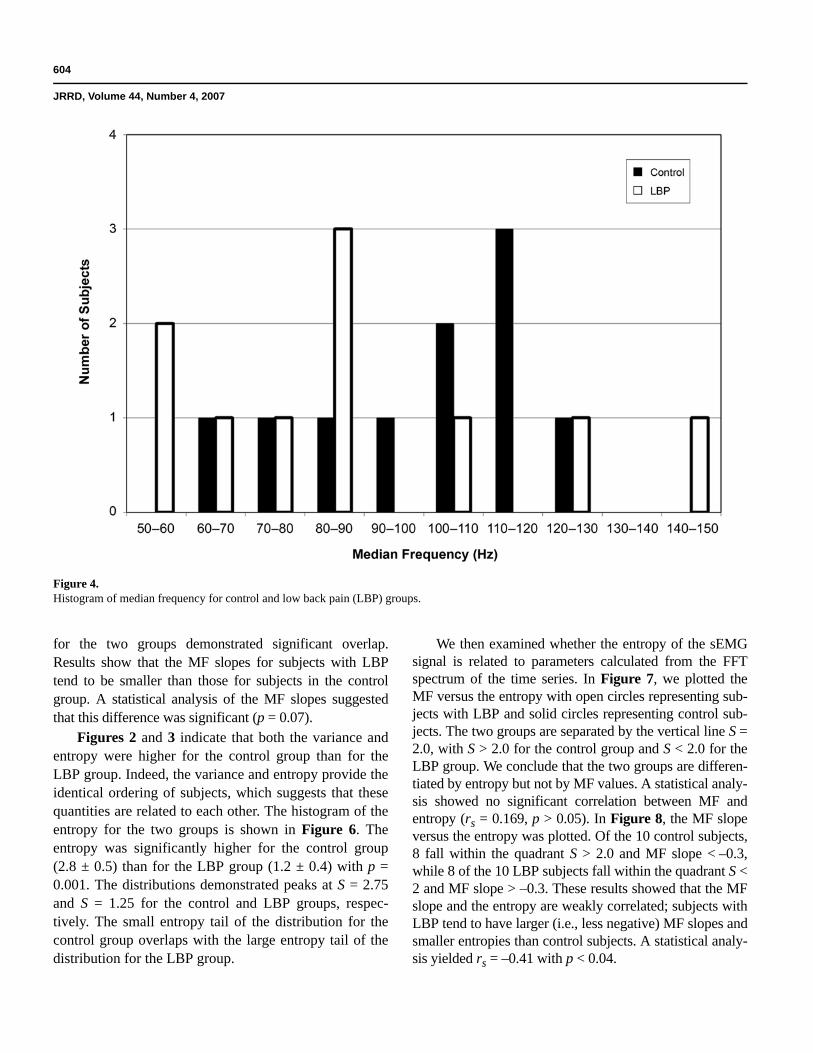
Table 1 indicates the anthropometric data of the twogroups. We note that the two groups differ by age (p <0.01). No significant differences were found betweengroups for height, weight, and body mass index, how-ever. To clarify the age relationship within groups, weanalyzed Spearman correlation coefficients (rs). Theresults for the MF, MF slope, and entropy are summa-rized in Table 2. The mean MF was 98.5 ± 20.0 Hz forthe control group and 88.3 ± 29.4 Hz for the LBP group;this difference was not significant (p < 0.32). The highestand lowest MFs in this study were found among subjectsin the LBP group, and the two distributions completelyoverlapped (Figure 4).
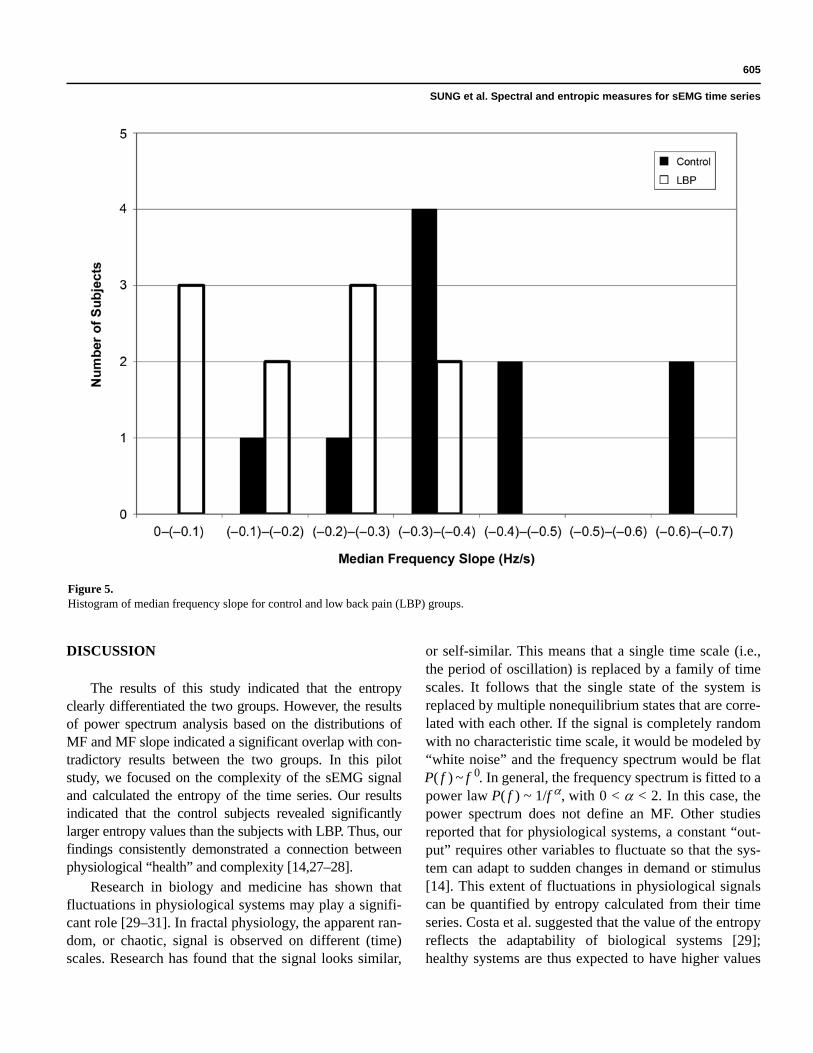
The mean ± SDs of the MF slope for the control andLBP groups were –0.40 ± 0.16 Hz/s and –0.18 ± 0.15 Hz/s,respectively. In Figure 5, the distribution of the MF slope
Figure 3.Entropy (logarithmic scale) versus time for (a) control and (b) lowback pain groups.
Table 2.Measurement results of median frequency (MF), MF slope, andentropy for control and low back pain (LBP) groups.
Subjects MF(Hz)
MF Slope(Hz/s)
Entropy(dimensionless)
Control (n = 10)A 113.0 –0.39 2.51B 82.0 –0.34 2.86C 112.0 –0.63 2.75D 119.8 –0.46 3.23E 102.2 –0.37 2.42F 71.4 –0.32 3.68G 106.3 –0.43 2.55H 97.5 –0.12 1.89I 118.3 –0.62 3.08J 62.7 –0.23 3.39
LBP (n = 10)A 121.6 –0.38 0.92B 84.5 –0.29 1.32C 83.8 –0.11 1.56D 147.9 –0.36 1.62E 106.2 –0.21 1.39F 58.2 –0.01 1.13G 59.6 0.05 0.82H 59.2 –0.02 1.00I 73.9 –0.14 1.55J 87.8 –0.27 0.79
604
JRRD, Volume 44, Number 4, 2007
for the two groups demonstrated significant overlap.Results show that the MF slopes for subjects with LBPtend to be smaller than those for subjects in the controlgroup. A statistical analysis of the MF slopes suggestedthat this difference was significant (p = 0.07).
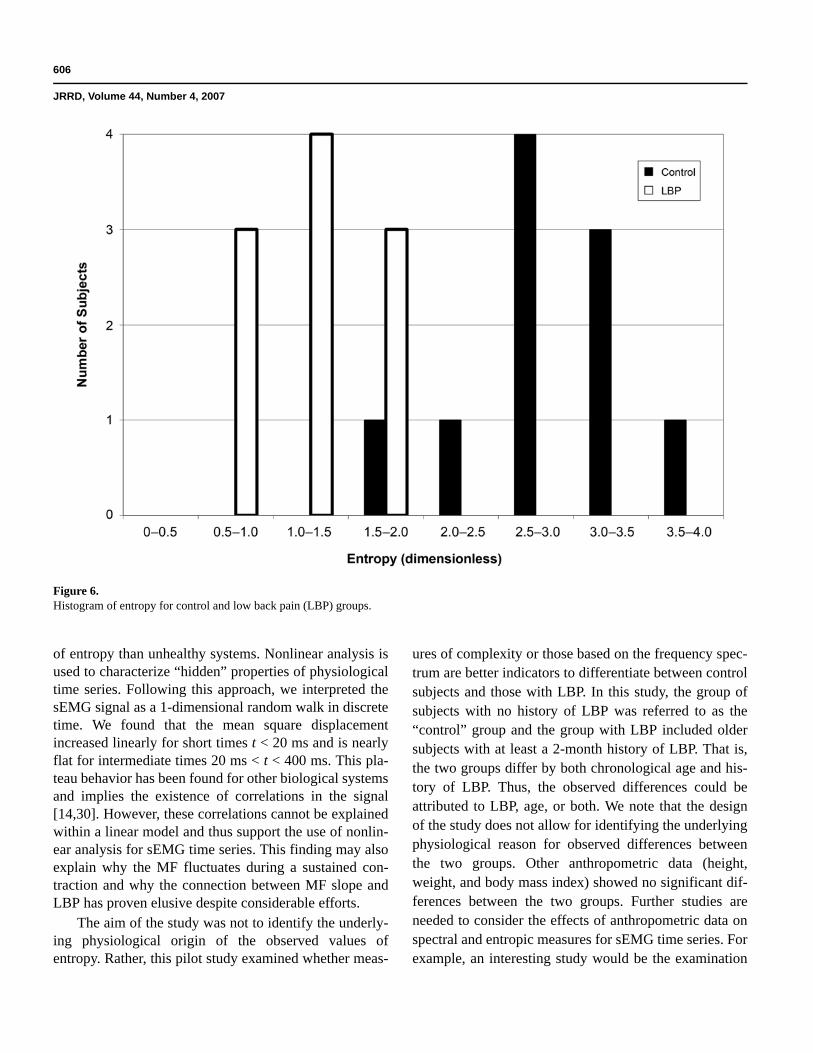
Figures 2 and 3 indicate that both the variance andentropy were higher for the control group than for theLBP group. Indeed, the variance and entropy provide theidentical ordering of subjects, which suggests that thesequantities are related to each other. The histogram of theentropy for the two groups is shown in Figure 6. Theentropy was significantly higher for the control group(2.8 ± 0.5) than for the LBP group (1.2 ± 0.4) with p =0.001. The distributions demonstrated peaks at S = 2.75and S = 1.25 for the control and LBP groups, respec-tively. The small entropy tail of the distribution for thecontrol group overlaps with the large entropy tail of thedistribution for the LBP group.
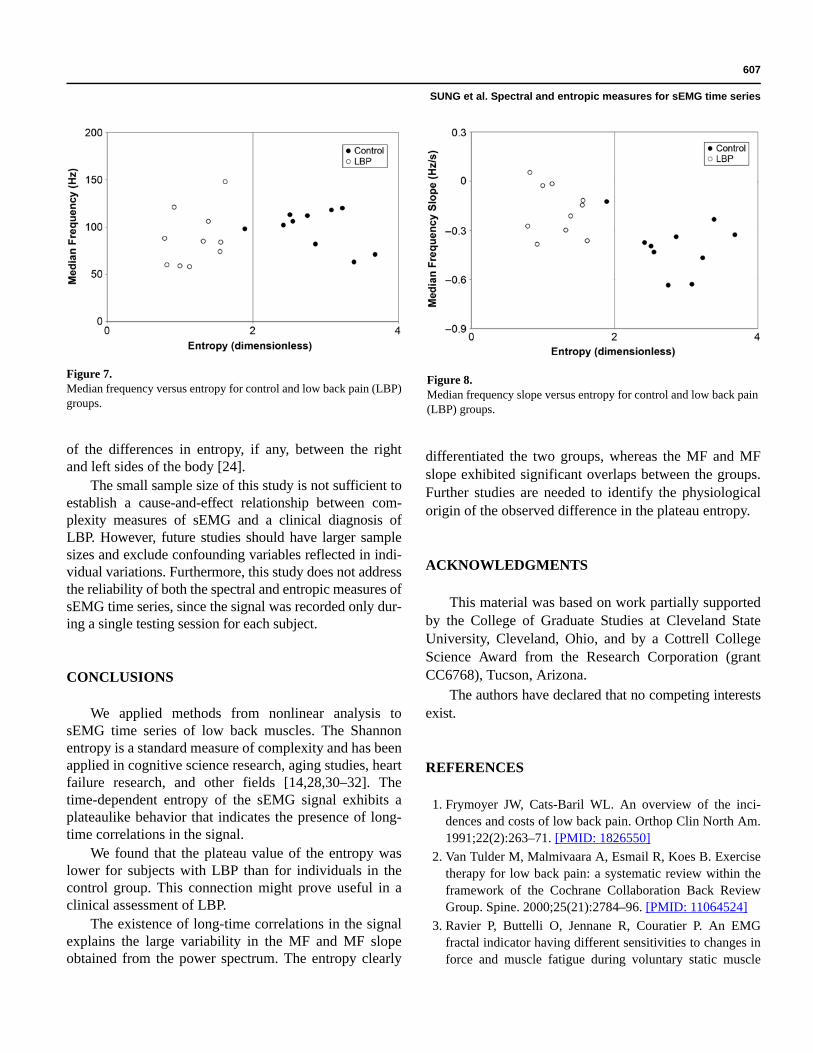
We then examined whether the entropy of the sEMGsignal is related to parameters calculated from the FFTspectrum of the time series. In Figure 7, we plotted theMF versus the entropy with open circles representing sub-jects with LBP and solid circles representing control sub-jects. The two groups are separated by the vertical line S =2.0, with S > 2.0 for the control group and S < 2.0 for theLBP group. We conclude that the two groups are differen-tiated by entropy but not by MF values. A statistical analy-sis showed no significant correlation between MF andentropy (rs = 0.169, p > 0.05). In Figure 8, the MF slopeversus the entropy was plotted. Of the 10 control subjects,8 fall within the quadrant S > 2.0 and MF slope < –0.3,while 8 of the 10 LBP subjects fall within the quadrant S <2 and MF slope > –0.3. These results showed that the MFslope and the entropy are weakly correlated; subjects withLBP tend to have larger (i.e., less negative) MF slopes andsmaller entropies than control subjects. A statistical analy-sis yielded rs = –0.41 with p < 0.04.
Figure 4.Histogram of median frequency for control and low back pain (LBP) groups.
605
SUNG et al. Spectral and entropic measures for sEMG time series
DISCUSSION
The results of this study indicated that the entropyclearly differentiated the two groups. However, the resultsof power spectrum analysis based on the distributions ofMF and MF slope indicated a significant overlap with con-tradictory results between the two groups. In this pilotstudy, we focused on the complexity of the sEMG signaland calculated the entropy of the time series. Our resultsindicated that the control subjects revealed significantlylarger entropy values than the subjects with LBP. Thus, ourfindings consistently demonstrated a connection betweenphysiological “health” and complexity [14,27–28].
Research in biology and medicine has shown thatfluctuations in physiological systems may play a signifi-cant role [29–31]. In fractal physiology, the apparent ran-dom, or chaotic, signal is observed on different (time)scales. Research has found that the signal looks similar,
or self-similar. This means that a single time scale (i.e.,the period of oscillation) is replaced by a family of timescales. It follows that the single state of the system isreplaced by multiple nonequilibrium states that are corre-lated with each other. If the signal is completely randomwith no characteristic time scale, it would be modeled by“white noise” and the frequency spectrum would be flatP( f ) ~ f 0. In general, the frequency spectrum is fitted to apower law P( f ) ~ 1/f α, with 0 < α < 2. In this case, thepower spectrum does not define an MF. Other studiesreported that for physiological systems, a constant “out-put” requires other variables to fluctuate so that the sys-tem can adapt to sudden changes in demand or stimulus[14]. This extent of fluctuations in physiological signalscan be quantified by entropy calculated from their timeseries. Costa et al. suggested that the value of the entropyreflects the adaptability of biological systems [29];healthy systems are thus expected to have higher values
Figure 5.Histogram of median frequency slope for control and low back pain (LBP) groups.
606
JRRD, Volume 44, Number 4, 2007
of entropy than unhealthy systems. Nonlinear analysis isused to characterize “hidden” properties of physiologicaltime series. Following this approach, we interpreted thesEMG signal as a 1-dimensional random walk in discretetime. We found that the mean square displacementincreased linearly for short times t < 20 ms and is nearlyflat for intermediate times 20 ms < t < 400 ms. This pla-teau behavior has been found for other biological systemsand implies the existence of correlations in the signal[14,30]. However, these correlations cannot be explainedwithin a linear model and thus support the use of nonlin-ear analysis for sEMG time series. This finding may alsoexplain why the MF fluctuates during a sustained con-traction and why the connection between MF slope andLBP has proven elusive despite considerable efforts.
The aim of the study was not to identify the underly-ing physiological origin of the observed values ofentropy. Rather, this pilot study examined whether meas-
ures of complexity or those based on the frequency spec-trum are better indicators to differentiate between controlsubjects and those with LBP. In this study, the group ofsubjects with no history of LBP was referred to as the“control” group and the group with LBP included oldersubjects with at least a 2-month history of LBP. That is,the two groups differ by both chronological age and his-tory of LBP. Thus, the observed differences could beattributed to LBP, age, or both. We note that the designof the study does not allow for identifying the underlyingphysiological reason for observed differences betweenthe two groups. Other anthropometric data (height,weight, and body mass index) showed no significant dif-ferences between the two groups. Further studies areneeded to consider the effects of anthropometric data onspectral and entropic measures for sEMG time series. Forexample, an interesting study would be the examination
Figure 6.Histogram of entropy for control and low back pain (LBP) groups.
607
SUNG et al. Spectral and entropic measures for sEMG time series
of the differences in entropy, if any, between the rightand left sides of the body [24].
The small sample size of this study is not sufficient toestablish a cause-and-effect relationship between com-plexity measures of sEMG and a clinical diagnosis ofLBP. However, future studies should have larger samplesizes and exclude confounding variables reflected in indi-vidual variations. Furthermore, this study does not addressthe reliability of both the spectral and entropic measures ofsEMG time series, since the signal was recorded only dur-ing a single testing session for each subject.
CONCLUSIONS
We applied methods from nonlinear analysis tosEMG time series of low back muscles. The Shannonentropy is a standard measure of complexity and has beenapplied in cognitive science research, aging studies, heartfailure research, and other fields [14,28,30–32]. Thetime-dependent entropy of the sEMG signal exhibits aplateaulike behavior that indicates the presence of long-time correlations in the signal.
We found that the plateau value of the entropy waslower for subjects with LBP than for individuals in thecontrol group. This connection might prove useful in aclinical assessment of LBP.
The existence of long-time correlations in the signalexplains the large variability in the MF and MF slopeobtained from the power spectrum. The entropy clearly
differentiated the two groups, whereas the MF and MFslope exhibited significant overlaps between the groups.Further studies are needed to identify the physiologicalorigin of the observed difference in the plateau entropy.
ACKNOWLEDGMENTS
This material was based on work partially supportedby the College of Graduate Studies at Cleveland StateUniversity, Cleveland, Ohio, and by a Cottrell CollegeScience Award from the Research Corporation (grantCC6768), Tucson, Arizona.
The authors have declared that no competing interestsexist.
REFERENCES
1. Frymoyer JW, Cats-Baril WL. An overview of the inci-dences and costs of low back pain. Orthop Clin North Am.1991;22(2):263–71. [PMID: 1826550]
2. Van Tulder M, Malmivaara A, Esmail R, Koes B. Exercisetherapy for low back pain: a systematic review within theframework of the Cochrane Collaboration Back ReviewGroup. Spine. 2000;25(21):2784–96. [PMID: 11064524]
3. Ravier P, Buttelli O, Jennane R, Couratier P. An EMGfractal indicator having different sensitivities to changes inforce and muscle fatigue during voluntary static muscle
Figure 7.Median frequency versus entropy for control and low back pain (LBP)groups.
Figure 8.Median frequency slope versus entropy for control and low back pain(LBP) groups.

608
JRRD, Volume 44, Number 4, 2007
contractions. J Electromyogr Kinesiol. 2005;15(2):210–21.[PMID: 15664150]
4. Sung PS. Multifidi muscles median frequency before andafter spinal stabilization exercises. Arch Phys Med Reha-bil. 2003;84(9):1313–18. [PMID: 13680567]
5. Mannion AF, Connolly B, Wood K, Dolan P. The use of sur-face EMG power spectral analysis in the evaluation of backmuscle function. J Rehabil Res Dev. 1997;34(4):427–39.[PMID: 9323646]
6. De Luca CJ. Myoelectrical manifestations of localizedmuscular fatigue in humans. Crit Rev Biomed Eng. 1984;11(4):251–79. [PMID: 6391814]
7. Roy SH, De Luca CJ, Emley M, Oddsson LI, Buijs RJ,Levins JA, Newcombe DS, Jabre JF. Classification of backmuscle impairment based on the surface electromyographicsignal. J Rehabil Res Dev. 1997;34(4):405–14.[PMID: 9323644]
8. Humphrey AR, Nargol AV, Jones AP, Ratcliffe AA,Greenough CG. The value of electromyography of the lum-bar paraspinal muscles in discriminating between chronic-low-back-pain sufferers and normal subjects. Eur Spine J.2005;14(2):175–84. [PMID: 15549487]
9. Mannion AF, Müntener M, Taimela S, Dvorak J. Compari-son of three active therapies for chronic low back pain:results of a randomized clinical trial with one-year follow-up. Rheumatology (Oxford). 2001;40(7):772–78.[PMID: 11477282]
10. Ng JK, Richardson CA, Jull GA. Electromyographicamplitude and frequency changes in the iliocostalis lumbo-rum and multifidus muscles during a trunk holding test.Phys Ther. 1997;77(9):954–61. [PMID: 9291952]
11. Dimitrova NA, Dimitrov GV. Amplitude-related charac-teristics of motor unit and M-wave potentials during fatigue.A simulation study using literature data on intracellularpotential changes found in vitro. J Electromyogr Kinesiol.2002;12(5):339–49. [PMID: 12223166]
12. Mandelbrot BB. The fractal geometry of nature. San Fran-cisco (CA): Freeman; 1982.
13. West BJ. Fractal physiology and chaos in medicine. Sin-gapore: World Scientific; 1990.
14. Costa MG, Goldberger AL, Peng CK. Multiscale entropyanalysis of biological signals. Phys Rev E Stat Nonlin SoftMatter Phys. 2005;71(2 Pt 1):021906. [PMID: 15783351]
15. Sung PS, Zurcher U, Kaufman M. Nonlinear analysis ofelectromyography time series as a diagnostic tool for lowback pain. Med Sci Monit. 2005;11(1):CS1–5.[PMID: 15614197]
16. Churilla AM, Gottschalke WA, Liebovitch LS, SelectorLY, Todorov AT, Yeandle S. Membrane potential fluctua-tions of human T-lymphocytes have fractal characteristicsof fractional Brownian motion. Ann Biomed Eng. 1996;24(1):99–108. [PMID: 8669722]
17. Gebber GL, Orer HS, Barman SM. Fractal noises andmotions in time series of presympathetic and sympatheticneural activities. J Neurophysiol. 2006;95(2):1176–84.[PMID: 16306172]
18. Klenerman L, Slade PD, Stanley IM, Pennie B, Reilly JP,Atchison LE, Troup JD, Rose MJ. The prediction of chro-nicity in patients with an acute attack of low back pain in ageneral practice setting. Spine. 1995;20(4):478–84.[PMID: 7747233]
19. Oldfield RC. The assessment and analysis of handedness: theEdinburgh inventory. Neuropsychologia. 1971;9(1):97–113.[PMID: 5146491]
20. Fairbank JC, Couper J, Davies JB, O’Brien JP. The Oswe-stry low back pain disability questionnaire. Physiotherapy.1980;66(8):271–73. [PMID: 6450426]
21. Ciccone DS, Just N, Bandilla EB. Non-organic symptomreporting in patients with chronic non-malignant pain.Pain. 1996;68(2–3):329–41. [PMID: 9121822]
22. Fairbank JC, Pynsent PB. The Oswestry Disability Index.Spine. 2000;25(22):2940–52. [PMID: 11074683]
23. Mayer TG, Kondraske G, Mooney V, Carmichael TW, But-sch R. Lumbar myoelectric spectral analysis for enduranceassessment. A comparison of normals with deconditionedpatients. Spine. 1989;14(9):986–91. [PMID: 2781412]
24. Sung PS, Spratt KF, Wilder DG. A possible methodologi-cal flaw in comparing dominant and nondominant sidedlumbar spine muscle responses without simultaneouslyconsidering hand dominance. Spine. 2004;29(17):1914–22.[PMID: 15534417]
25. Zipp P. Recommendations for the standardization of leadpositions in surface electromyography. Eur J Appl Physiol.1982;50(1):41–54.
26. Merletti R, Roy SH, Kupa E, Roatta S, Granata A. Model-ing of surface myoelectric signals—Part II: Model-basedsignal interpretation. IEEE Trans Biomed Eng. 1999;46(7):821–29. [PMID: 10396900]
27. Li JS, Huston JP. Non-linear dynamics of operant behav-ior: a new approach via the extended return map. Rev Neu-rosci. 2002;13(1):31–57. [PMID: 12013025]
28. Costa MG, Goldberger AL, Peng CK. Multiscale entropyanalysis: a new measure of complexity loss in heart failure.J Electrocardiol. 2003;36 Suppl:39–40.
29. Costa MG, Goldberger AL, Peng, CK. Multiscale entropyanalysis of complex physiologic time series. Phys Rev Lett.2002;89(6):068102. [PMID: 12190613]
30. Goldberger AL, Amaral LA, Hausdorff JM, Ivanov PCh,Peng CK, Stanley HE. Fractal dynamics in physiology: alter-ations with disease and aging. Proc Natl Acad Sci U S A.2002;99 Suppl 1:2466–72. [PMID: 11875196]
31. Liu JZ, Dai TH, Sahgal V, Brown RW, Yue GH. Nonlinearcortical modulation of muscle fatigue: a functional MRIstudy. Brain Res. 2002;957(2):320–29. [PMID: 12445974]

609
SUNG et al. Spectral and entropic measures for sEMG time series
32. Allen PA, Murphy MD, Kaufman M, Groth KE, BegovicA. Age differences in central (semantic) and peripheralprocessing: the importance of considering both responsetimes and errors. J Gerontol B Psychol Sci Soc Sci. 2004;59(5):P210–19. [PMID: 15358793]
Submitted for publication October 18, 2006. Accepted inrevised form April 19, 2007.
Copyright © 2022 FDOKUMEN