Comparison of POAM III ozone measurements with correlative aircraft and balloon data during SOLVE
21
Comparison of POAM III ozone measurements with correlative aircraft and balloon data during SOLVE Jerry D. Lumpe and Mike Fromm Computational Physics, Inc., Springfield, Virginia, USA Karl Hoppel and Richard M. Bevilacqua Naval Research Laboratory, Washington, District of Columbia, USA Cora E. Randall Laboratory for Atmospheric and Space Physics, University of Colorado, Boulder, Colorado, USA Edward V. Browell and William B. Grant Atmospheric Sciences Research, NASA Langley Research Center, Hampton, Virginia, USA Thomas McGee and John Burris NASA Goddard Space Flight Center, Greenbelt, Maryland, USA Laurence Twigg Science Systems and Applications, Inc., Lanham, Maryland, USA Erik C. Richard Aeronomy Laboratory, National Oceanic and Atmospheric Administration, Boulder, Colorado, USA Geoffrey C. Toon, James J. Margitan, and Bhaswar Sen Jet Propulsion Laboratory, California Institute of Technology, Pasadena, California, USA Klaus Pfeilsticker, Hartmut Boesch, and Richard Fitzenberger Institut fuer Umweltphysik, University Heidelberg, Heidelberg, Germany Florence Goutail and Jean-Pierre Pommereau Service d’Aeronomie du CNRS, Verrieres le Buisson, France Received 7 February 2001; revised 21 June 2001; accepted 17 July 2001; published 14 December 2002. [1] The Polar Ozone and Aerosol Measurement (POAM) III instrument operated continuously during the Stratospheric Aerosol and Gas Experiment (SAGE) III Ozone Loss and Validation Experiment (SOLVE) mission, making approximately 1400 ozone profile measurements at high latitudes both inside and outside the Arctic polar vortex. The wealth of ozone measurements obtained from a variety of instruments and platforms during SOLVE provided a unique opportunity to compare correlative measurements with the POAM III data set. In this paper, we validate the POAM III version 3.0 ozone against measurements from seven different instruments that operated as part of the combined SOLVE/THESEO 2000 campaign. These include the airborne UV Differential Absorption Lidar (UV DIAL) and the Airborne Raman Ozone and Temperature Lidar (AROTEL) instruments on the DC-8, the dual-beam UV-Absorption Ozone Photometer on the ER-2, the MkIV Interferometer balloon instrument, the Laboratoire de Physique Mole `culaire et Applications and Differential Optical Absorption Spectroscopy (LPMA/DOAS) balloon gondola, the JPL in situ ozone instrument on the Observations of the Middle Stratosphere (OMS) balloon platform, and the Syste `me D’Analyze par Observations Ze ´nithales (SAOZ) balloon sonde. The resulting comparisons show a remarkable degree of consistency despite the very different measurement techniques inherent in the data sets and thus provide a strong validation of the POAM III version 3.0 ozone. This is particularly JOURNAL OF GEOPHYSICAL RESEARCH, VOL. 108, NO. D5, 8316, doi:10.1029/2001JD000472, 2003 Copyright 2002 by the American Geophysical Union. 0148-0227/02/2001JD000472$09.00 SOL 59 - 1
Transcript of Comparison of POAM III ozone measurements with correlative aircraft and balloon data during SOLVE
Comparison of POAM III ozone measurements with correlative
aircraft and balloon data during SOLVE
Jerry D. Lumpe and Mike FrommComputational Physics, Inc., Springfield, Virginia, USA
Karl Hoppel and Richard M. BevilacquaNaval Research Laboratory, Washington, District of Columbia, USA
Cora E. RandallLaboratory for Atmospheric and Space Physics, University of Colorado, Boulder, Colorado, USA
Edward V. Browell and William B. GrantAtmospheric Sciences Research, NASA Langley Research Center, Hampton, Virginia, USA
Thomas McGee and John BurrisNASA Goddard Space Flight Center, Greenbelt, Maryland, USA
Laurence TwiggScience Systems and Applications, Inc., Lanham, Maryland, USA
Erik C. RichardAeronomy Laboratory, National Oceanic and Atmospheric Administration, Boulder, Colorado, USA
Geoffrey C. Toon, James J. Margitan, and Bhaswar SenJet Propulsion Laboratory, California Institute of Technology, Pasadena, California, USA
Klaus Pfeilsticker, Hartmut Boesch, and Richard FitzenbergerInstitut fuer Umweltphysik, University Heidelberg, Heidelberg, Germany
Florence Goutail and Jean-Pierre PommereauService d’Aeronomie du CNRS, Verrieres le Buisson, France
Received 7 February 2001; revised 21 June 2001; accepted 17 July 2001; published 14 December 2002.
[1] The Polar Ozone and Aerosol Measurement (POAM) III instrument operatedcontinuously during the Stratospheric Aerosol and Gas Experiment (SAGE) III OzoneLoss and Validation Experiment (SOLVE) mission, making approximately 1400 ozoneprofile measurements at high latitudes both inside and outside the Arctic polar vortex. Thewealth of ozone measurements obtained from a variety of instruments and platformsduring SOLVE provided a unique opportunity to compare correlative measurements withthe POAM III data set. In this paper, we validate the POAM III version 3.0 ozone againstmeasurements from seven different instruments that operated as part of the combinedSOLVE/THESEO 2000 campaign. These include the airborne UV Differential AbsorptionLidar (UV DIAL) and the Airborne Raman Ozone and Temperature Lidar (AROTEL)instruments on the DC-8, the dual-beam UV-Absorption Ozone Photometer on the ER-2,the MkIV Interferometer balloon instrument, the Laboratoire de Physique Moleculaire etApplications and Differential Optical Absorption Spectroscopy (LPMA/DOAS) balloongondola, the JPL in situ ozone instrument on the Observations of the Middle Stratosphere(OMS) balloon platform, and the Systeme D’Analyze par Observations Zenithales(SAOZ) balloon sonde. The resulting comparisons show a remarkable degree ofconsistency despite the very different measurement techniques inherent in the data sets andthus provide a strong validation of the POAM III version 3.0 ozone. This is particularly
JOURNAL OF GEOPHYSICAL RESEARCH, VOL. 108, NO. D5, 8316, doi:10.1029/2001JD000472, 2003
Copyright 2002 by the American Geophysical Union.0148-0227/02/2001JD000472$09.00
SOL 59 - 1
true in the primary 14–30 km region, where there are significant overlaps with all seveninstruments. At these altitudes, POAM III agrees with all the data sets to within 7–10%with no detectable bias. The observed differences are within the combined errors ofPOAM III and the correlative measurements. Above 30 km, only a handful of SOLVEcorrelative measurements exist and the comparisons are highly variable. Therefore, theresults are inconclusive. Below 14 km, the SOLVE comparisons also show a large amountof scatter and it is difficult to evaluate their consistency, although the number ofcorrelative measurements is large. The UV DIAL, DOAS, and JPL/OMS comparisonsshow differences of up to 15% but no consistent bias. The ER-2, MkIV, and SAOZcomparisons, on the other hand, indicate a high POAM bias of 10–20% at the loweraltitudes. In general, the SOLVE validation results presented here are consistent with thevalidation of the POAM III version 3.0 ozone using SAGE II and Halogen OccultationExperiment (HALOE) satellite data and in situ electrochemical cell (ECC) ozonesondedata. INDEX TERMS: 0340 Atmospheric Composition and Structure: Middle atmosphere—composition
and chemistry; 0394 Atmospheric Composition and Structure: Instruments and techniques; 0399 Atmospheric
Composition and Structure: General or miscellaneous; 0305 Atmospheric Composition and Structure:
Aerosols and particles (0345, 4801)
Citation: Lumpe, J. D., et al., Comparison of POAM III ozone measurements with correlative aircraft and balloon data during
SOLVE, J. Geophys. Res., 107, 8316, doi:10.1029/2001JD000472, 2002. [printed 108(D5), 2003]
1. Introduction
[2] The objectives of the Stratospheric Aerosol and GasExperiment (SAGE) III Ozone Loss and Validation Experi-ment (SOLVE) campaign were to examine the processescontrolling ozone at midlatitudes to high latitudes and toacquire multiple correlative data sets for validation of theSAGE III instrument. Successful completion of this objectiverequired a coordinated campaign of measurements in theArctic high-latitude region using a variety of instruments andplatforms. These included the NASA DC-8 and ER-2 air-craft, as well as balloon platforms, ground-based instrumentsand satellites. Of the latter the Polar Ozone and AerosolMeasurement (POAM) III instrument was the only source ofhigh-latitude satellite vertical profile measurements used inthe SOLVE campaign.[3] The initial motivation for introducing POAM III as
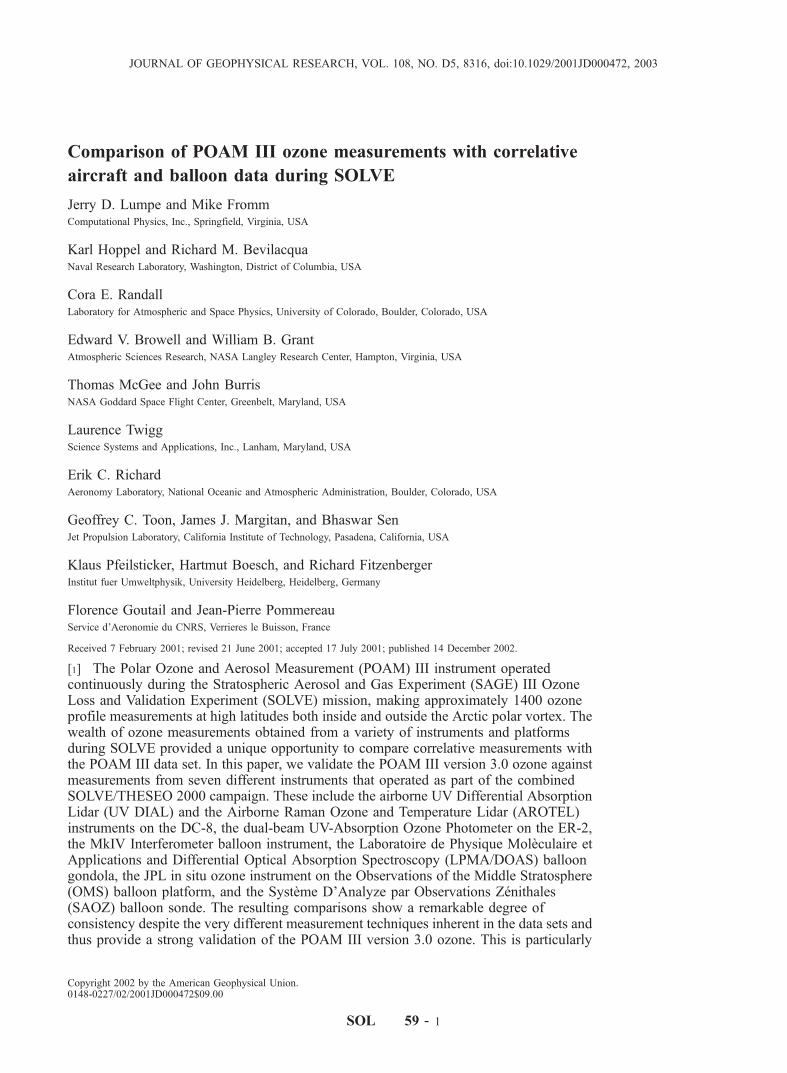
a component of SOLVE was primarily because its latitudecoverage and measurement suite make it an ideal valida-tion platform for SAGE III. Figure 1 shows the POAM IIIlatitude coverage in the Northern Hemisphere compared tothe predicted SAGE III ephemeris. The two instruments’coverage overlaps a number of times during the year,providing multiple opportunities for comparison. Further-more POAM III measures the same primary species asSAGE III—ozone, water vapor, nitrogen dioxide, andaerosol extinction. Both POAM III and its predecessorPOAM II have used SAGE II extensively in their satellitevalidation studies [Rusch et al., 1997; Randall et al.,2000, 2001] (C. E. Randall et al., Validation of POAMIII O3: Comparison to ozonesonde and satellite data,submitted to Journal of Geophysical Research, 2002,hereinafter referred to as Randall et al., submitted manu-script, 2002) and it is expected that both POAM III andSAGE III will eventually benefit from a detailed retrievalcomparison.[4] Of course, due to unforeseen launch delays, the
SAGE III instrument was not operational during theSOLVE campaign. Nevertheless, the wealth of high-latitudemeasurements made during SOLVE provide a valuable
resource for validation of the POAM III data set. In thispaper we present validation of the POAM III version 3.0ozone using a number of coincident ozone measurementsobtained during SOLVE. This study complements POAM IIIozone validation efforts, which concentrate on comparisonswith other satellite data sets and electrochemical cell (ECC)ozonesondes (Randall et al., submitted manuscript, 2002).The POAM III/SOLVE ozone validation presented hereincludes aircraft and balloon data (both in situ and remotelysensed).[5] This paper is not intended as a comprehensive inter-
comparison of the various SOLVE ozone data sets but ispresented strictly from the point of view of POAM III
Figure 1. Comparison of the POAM (solid line) andpredicted SAGE III (dashed line) Northern Hemispheremeasurement latitudes during the year. For POAM, this isinvariant from year to year. The SAGE III ephemeris willlikely change slightly depending on exact launch date andtime.
SOL 59 - 2 LUMPE ET AL.: POAM III OZONE MEASUREMENTS DURING SOLVE

validation. In addition to further quantifying the quality andscientific validity of the POAM III ozone data, it is hopedthat this study will prove useful in planning future valida-tion efforts for SAGE III. Absent an actual POAM III/SAGE III validation study, which is now underway sincethe SAGE III launch in December 2001, we feel this is oneof the most useful contributions to SAGE III resulting fromthe POAM III involvement in SOLVE. Of course, byhelping to validate the POAM III data products, this effortwill directly benefit the SAGE III validation in the future.[6] In this work, the POAM III ozone measurements are
compared with measurements from seven different instru-ments that operated as part of the combined SOLVE/THESEO 2000 campaign. These include the airborne UVDifferential Absorption Lidar (UV DIAL) and the AirborneRaman Ozone and Temperature Lidar (AROTEL) instru-ments on the DC-8, the dual-beam UV-Absorption OzonePhotometer on the ER-2, the MkIV balloon interferometer,the Laboratoire de Physique Moleculaire et Applicationsand Differential Optical Absorption Spectroscopy (LPMA/DOAS) balloon gondola, the JPL in situ Ozone instrumenton the Observations of the Middle Stratosphere (OMS)balloon platform, and the Systeme D’Analyze par Obser-vations Zenithales (SAOZ) balloon sonde. We first quantifythe agreement between POAM III and each of these instru-ments separately and then compare the results to see if theygive a consistent picture of the POAM III ozone validation,as well as maintaining consistency with the satellite andECC ozonesonde validation studies. We begin with anoverview of the POAM III ozone measurements and currentstatus of the version 3.0 validation in section 2. In section 3we compare the DC-8 data sets (UV DIAL and AROTEL),followed by the ER-2 comparisons in section 4, MkIV insection 5, DOAS in section 6, OMS/JPL Ozone in section 7,and finally the SAOZ comparisons in section 8. Section 9contains a summary and conclusions.
2. Overview of POAM III Measurements andVersion 3.0 Ozone Validation
[7] The POAM III instrument is a nine-channel photometerthat employs the technique of solar occultation to derivecomposition and temperature throughout the stratosphere andupper troposphere. By measuring atmospheric extinction inselect bands from 0.354 to 1.018 mm it is possible to retrievedensity profiles of ozone, nitrogen dioxide and water vapor,as well as temperature and wavelength-dependent aerosolextinction. The instrument and its basic operational character-istics are described in detail by Lucke et al. [1999].[8] POAM III has been in routine operation on the SPOT
4 satellite since 24 April 1998. It makes 14 measurementsper day in each hemisphere, at approximately constantlatitude but separated in longitude by 25�. This relativelycoarse horizontal sampling pattern is a consequence of thesolar occultation geometry. Northern Hemisphere (NH)measurements are made at satellite sunrise but actuallycorrespond to local sunset due to the retrograde orbit ofthe satellite. During the SOLVE time period (November1999 to March 2000) approximately 1400 NH measure-ments were made at latitudes between 63.5 and 69�N.[9] Ozone is retrieved operationally between 60 km and a
lower limit which is typically in the middle to upper
troposphere, depending on local cloud top height andatmospheric opacity, which determines the minimum alti-tude to which the Sun sensor can actively track the Sun. ThePOAM III version 3.0 retrieval algorithms and error anal-ysis are described by Lumpe et al. [2002]. The primaryozone information in the measurements comes from the603-nm channel, at the peak of the O3 Chappuis bands.Based on the analysis presented by Lumpe et al. [2002] thetotal random error (precision) of the POAM III ozoneretrievals is estimated to be 3–5% between 12 and 60km, increasing to 15% or more at and below 10 km. Inthe lowermost stratosphere and upper troposphere the ozoneretrieval becomes very sensitive to accurate removal of theaerosol extinction component. Maximum systematic errorsdue to cross section uncertainties are estimated to be at the1–2% level.[10] The vertical resolution of the ozone retrieval, as
defined by the width of the retrieval averaging kernels, is1 km throughout the stratosphere but degrades ratherquickly to 2–3 km in the upper troposphere [Lumpe etal., 2002]. Horizontal resolution perpendicular to the instru-ment line of sight (i.e., parallel to the terminator) is limitedby the size of the solar disk, which is approximately 30 kmat the tangent point. Parallel to the line of sight one measureof horizontal resolution can be taken to be the path length ofthe 1 km vertical shell sampling, which is approximately200 km. However, this number tends to underestimate theeffective horizontal resolution since the information contentin the slant path measurement is sharply peaked at thetangent point.[11] This paper focuses on validation of the POAM III
version 3.0 ozone using correlative data obtained duringthe SOLVE/THESEO 2000 campaign. Preliminary valida-tion of an earlier version of POAM III ozone was presentedby Lucke et al. [1999]. The version 3.0 ozone has also beenvalidated against version 6.0 Stratosphere Aerosol and GasExperiment (SAGE) II and version 19 Halogen OccultationExperiment (HALOE) satellite data, and balloon-borneECC ozonesondes by Randall et al. (submitted manuscript,2002a). The results of this analysis show that the POAMIII NH ozone agrees with SAGE II, HALOE and ECCozonesondes to within 5–7%, with no bias, in the altituderange from 12 to 50 km. Between 50 and 60 km POAMtends to be biased high with respect to HALOE by 5–10%,but this bias is not seen in the POAM/SAGE II compar-isons. Somewhat larger disagreements (15–20%) are seenbelow 12 km, with POAM III generally biased highrelative to both satellites and ECC ozonesondes. Unlessotherwise noted, for the remainder of this paper we willrefer to POAM III simply as POAM to simplify thenotation.
3. DC-8 Comparisons
3.1. Overview of DC-8 Coincidences
[12] The flight plans for the DC-8 were constructedspecifically to provide a number of direct coincidences withthe POAM measurements. These overlaps provide anexcellent opportunity to compare measurements made byPOAM and the DC-8 instruments in air masses that coincideclosely in both time and space. There were six suchcoincidences during SOLVE, occurring on 2 and 14 Decem-
LUMPE ET AL.: POAM III OZONE MEASUREMENTS DURING SOLVE SOL 59 - 3
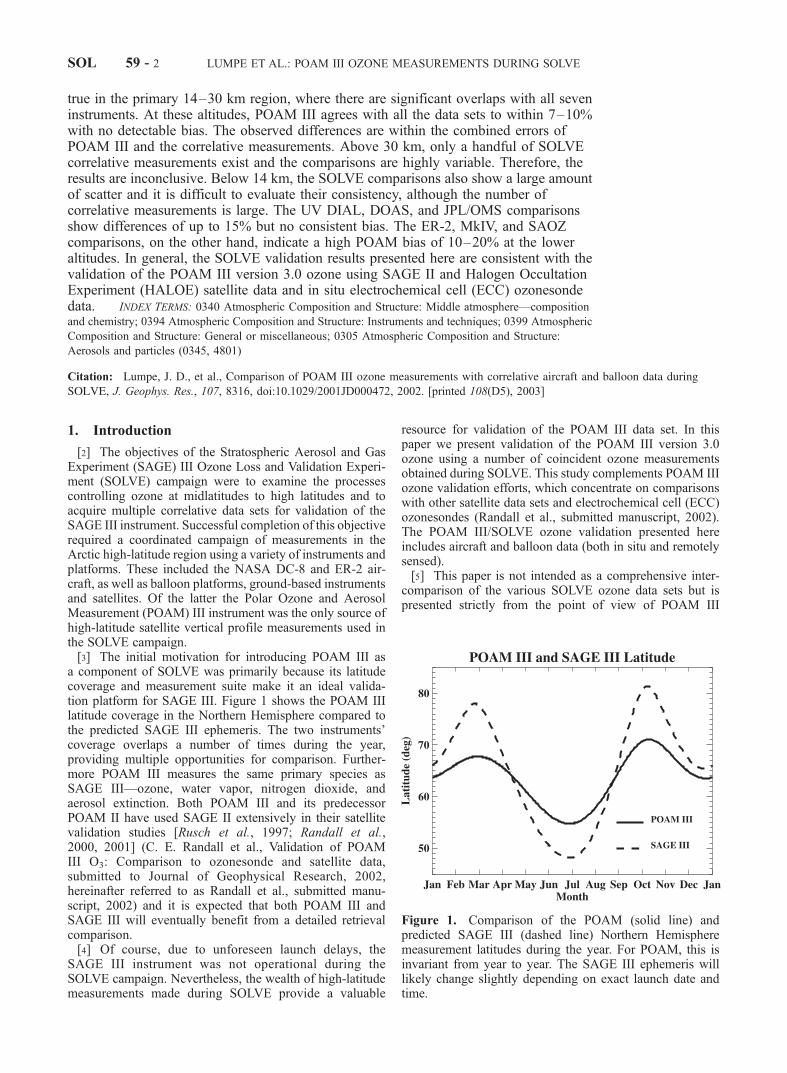
ber, 16 and 25 January, and 3 and 9 March. On a number ofthese flights the DC-8 executed multiple passes through thePOAM tangent point, in addition to dives, to maximize thenumber of coincident measurements made by both in situand remote sensing instruments aboard the aircraft.[13] Figure 2 shows the location of the coincident meas-
urements on each of these 6 days. The red symbol repre-sents the POAM 20 km tangent point and the red boxsurrounding this point represents the area defined by thecoincidence criteria used in the comparisons. We define acoincidence as any measurements made within ±1� inlatitude, ±2� in longitude and ±1 hour in time. These aresignificantly tighter criteria than typically used in POAMsatellite validation studies, but given the extent of theoverlaps they still yield a significant number of coincidentmeasurements, as discussed below. The blue line in Figure 2represents the DC-8 flight track on each day. Althoughdifficult to see on the scale of this plot the flight path doespass through the coincidence region on all days (moreextensively on some days than others). Only those DC-8measurements made within this red box (and satisfying thetime constraint described above) are used in the compar-isons. For reference, contours corresponding to the locationof the outer, middle and inner edge of the polar vortex at
450 K have also been plotted in the black solid and dashedlines. In Figure 2, and subsequently in this paper, theconvention of Nash et al. [1996] has been used to definethe vortex edge.[14] These maps are helpful because it is important to
take into account the position of the measurements relativeto the polar vortex in evaluating the ozone profile compar-isons below. For example, Figure 2 shows that on all 6 daysexcept 2 December 1999 the DC-8 traversed at least theinner edge of the vortex sometime during its flight. On 3days (2 and 14 December 1999 and 3 March 2000) thePOAM and DC-8 coincidences occur well inside the vortexinner edge whereas on the other days the coincidences arenear the vortex edge, where one might expect stronghorizontal gradients in the ozone. This will be discussedin more detail below.[15] In this paper the POAM ozone measurements are
compared with the two ozone lidars operating on the DC-8;the NASA Langley UV DIAL and the NASA GoddardAROTEL. Both of these instruments measure the ozoneprofile above the aircraft and therefore provide significantoverlap with the POAM measurements in the low to middlestratosphere. There is an added advantage in being able tocompare simultaneously with two instruments that are
Figure 2. Locations of the POAM and DC-8 coincidences for six DC-8 flights. The blue line on eachmap represents the DC-8 flight track. The red circle is the location of the POAM measurement for whichthe coincidence comparisons are made. It is surrounded by a red rectangle that represents the areadefined by the coincidence criteria (±1� latitude, ±2� longitude). Black contours (solid, dashed, andsolid) represent the vortex inner, middle, and outer edges, respectively, on the 450 K potentialtemperature surface.
SOL 59 - 4 LUMPE ET AL.: POAM III OZONE MEASUREMENTS DURING SOLVE
essentially measuring the same air mass continuously. This isa unique opportunity, which is further enhanced by the factthat all three instruments make the same fundamental meas-urement—ozone concentration as a function of altitude.
3.2. Coincident Data Sets
[16] The NASA Langley airborne UV DIAL system hasbeen used to measure ozone, aerosol, and cloud profilesduring four previous stratospheric ozone investigations,affording the opportunity for many intercomparisons withother ozonemeasuring instruments [Browell, 1989;Browell etal., 1990, 1993, 1998; Grant et al., 1998]. This system usestwo frequency-doubled Nd:YAG lasers to pump two high-conversion-efficiency, frequency-doubled, tunable dyelasers. In stratospheric O3 investigations, the two frequency-doubled dye lasers are operated independently with one tunedto 301 nm for the O3 DIAL on-line wavelength and the othertuned to 311 nm for the off-line wavelength. All of the beamsare transmitted in the zenith direction through a 40-cm-diameter fused silica window. The atmospheric backscatteredlaser returns are collected by a 36-cm-diameter telescope,optically separated, and directed on to different detectors.[17] The UV DIAL instrument measures ozone up to 10–
15 km above the aircraft with an accuracy of better than10%. Vertical resolution of the measurements is 750 m andhorizontal resolution is 70 km (5 min). Note that thehorizontal and vertical resolutions of the UV DIAL ozonemeasurements, although slightly better than POAM, arevery similar. The UV DIAL ozone has been compared withECC ozonesonde data from Ny Alesund (79�N, 12�E)during SOLVE (W. B. Grant et al., Estimation of Arcticpolar vortex ozone loss during the winter of 1999/2000using vortex-averaged airborne lidar ozone measurementsof N2O isopleth surfaces, submitted to Journal of Geo-physical Research, 2002). In the 15–20 km range the meandifference between the two measurements is �3% with astandard deviation of 4%. The sign of the difference is suchthat UV DIAL tends to biased low relative to the ECCozonesondes in this altitude range.[18] The Airborne Raman Ozone, Aerosol and Temper-
ature Lidar (AROTEL) is a DC-8 instrument conceived,designed and built by Goddard Space Flight Center incollaboration with scientists from Langley Research Center.The instrument was flown for the first time during the SOLVEcampaign. The instrument is a multiwavelength lidar: radia-tion at 1064, 532, and 355 nm are transmitted from aNd:YAGlaser, and 308-nm radiation is transmitted from a XeClexcimer laser. These wavelengths are transmitted nearlysimultaneously, and backscattered radiation is collected witha 16 inch telescope. This returned light at the transmittedwavelengths, as well as Raman scattered radiation at 387 and332 nm (N2 scattering from the transmitted 355 and 308 nmbeams) is wavelength separated using dichroic beamsplittersand detected using Hamamatsu R7400P phototubes.[19] Ozone data is extracted from the four UV signals
using the differential absorption lidar technique. The algo-rithm for ozone retrieval is essentially identical to thedescription by McGee et al. [1995], which describes theNDSC ground-based system. The only difference is in the useof a fourth order polynomial fitting function as opposed to thelinear function previously described. In order to ensurelinearity of signals, multiple detectors are used for each
wavelength. Beyond about 3 km above the aircraft the UVsignals are all photon counted; analog detection is used nearto the aircraft. Vertical resolution of the retrieved ozoneprofiles is approximately 1 km and the accuracy is betterthan 10%. A detailed description of the instrument is given byMcGee et al. (The AROTEL instrument: An airborne lidar forstratospheric ozone, aerosols and temperature, submitted toApplied Optics, 2001).
3.3. Comparison of POAM, UV DIAL, and AROTELOzone
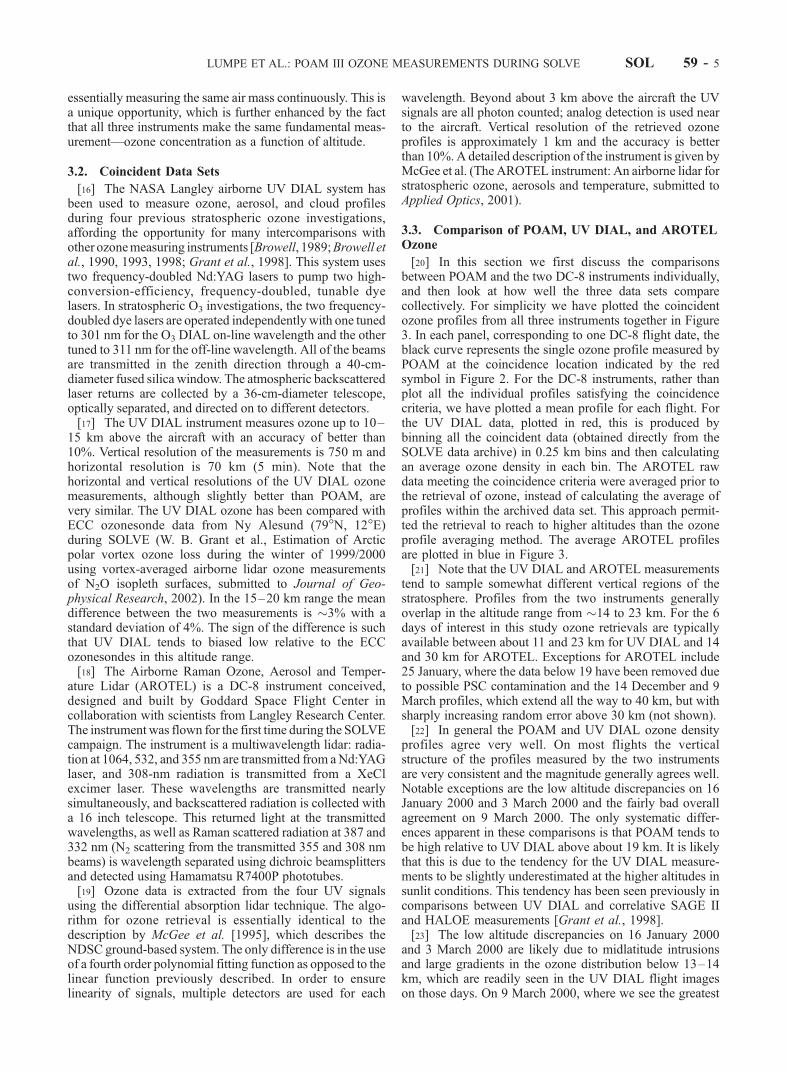
[20] In this section we first discuss the comparisonsbetween POAM and the two DC-8 instruments individually,and then look at how well the three data sets comparecollectively. For simplicity we have plotted the coincidentozone profiles from all three instruments together in Figure3. In each panel, corresponding to one DC-8 flight date, theblack curve represents the single ozone profile measured byPOAM at the coincidence location indicated by the redsymbol in Figure 2. For the DC-8 instruments, rather thanplot all the individual profiles satisfying the coincidencecriteria, we have plotted a mean profile for each flight. Forthe UV DIAL data, plotted in red, this is produced bybinning all the coincident data (obtained directly from theSOLVE data archive) in 0.25 km bins and then calculatingan average ozone density in each bin. The AROTEL rawdata meeting the coincidence criteria were averaged prior tothe retrieval of ozone, instead of calculating the average ofprofiles within the archived data set. This approach permit-ted the retrieval to reach to higher altitudes than the ozoneprofile averaging method. The average AROTEL profilesare plotted in blue in Figure 3.[21] Note that the UV DIAL and AROTEL measurements
tend to sample somewhat different vertical regions of thestratosphere. Profiles from the two instruments generallyoverlap in the altitude range from �14 to 23 km. For the 6days of interest in this study ozone retrievals are typicallyavailable between about 11 and 23 km for UV DIAL and 14and 30 km for AROTEL. Exceptions for AROTEL include25 January, where the data below 19 have been removed dueto possible PSC contamination and the 14 December and 9March profiles, which extend all the way to 40 km, but withsharply increasing random error above 30 km (not shown).[22] In general the POAM and UV DIAL ozone density
profiles agree very well. On most flights the verticalstructure of the profiles measured by the two instrumentsare very consistent and the magnitude generally agrees well.Notable exceptions are the low altitude discrepancies on 16January 2000 and 3 March 2000 and the fairly bad overallagreement on 9 March 2000. The only systematic differ-ences apparent in these comparisons is that POAM tends tobe high relative to UV DIAL above about 19 km. It is likelythat this is due to the tendency for the UV DIAL measure-ments to be slightly underestimated at the higher altitudes insunlit conditions. This tendency has been seen previously incomparisons between UV DIAL and correlative SAGE IIand HALOE measurements [Grant et al., 1998].[23] The low altitude discrepancies on 16 January 2000
and 3 March 2000 are likely due to midlatitude intrusionsand large gradients in the ozone distribution below 13–14km, which are readily seen in the UV DIAL flight imageson those days. On 9 March 2000, where we see the greatest
LUMPE ET AL.: POAM III OZONE MEASUREMENTS DURING SOLVE SOL 59 - 5
differences in the 14–20 km range, the measurements werevery near the vortex edge, and again very large horizontalgradients in ozone are evident in the UV DIAL ozone crosssection. Also, on this particular day the DC-8 coincidenceswere actually biased toward low latitudes relative to thePOAM point, which accentuates the sampling bias due tothe strong ozone gradients. For these reasons we believe thediscrepancies seen on this day, and at the low altitudes on16 January 2000 and 3 March 2000, are more indicative oftrue atmospheric variability than any fundamental error ineither measurement.[24] For the most part Figure 3 also shows quite good
agreement between the POAM and AROTEL profiles. Bothinstruments consistently reproduce small-scale verticalstructure in the ozone profile, although the lidar measure-ments often show more detailed vertical structure than thePOAM profiles (see, e.g., the 16 and 25 January profiles).There also appears to be a tendency on some days forPOAM to be low relative to AROTEL at the peak of theozone profile. For the most part however, the agreement inthe profiles above 20 km is good, and even up to 40 km forthe two AROTEL profiles that extend to that altitude. One
notable exception is on 3 March, where the AROTEL ozoneappears to have a noticeably smaller-scale height thanPOAM above the profile peak. The 9 March POAM/AROTEL comparison, like the POAM/UV DIAL compar-ison on that day, shows poor agreement overall below 25km. It is interesting to note, however, that the two lidarprofiles themselves do not agree very well on this day,showing very different vertical structure and a clear system-atic bias. At the present time this is not understood.[25] Figure 4 summarizes the ozone differences between
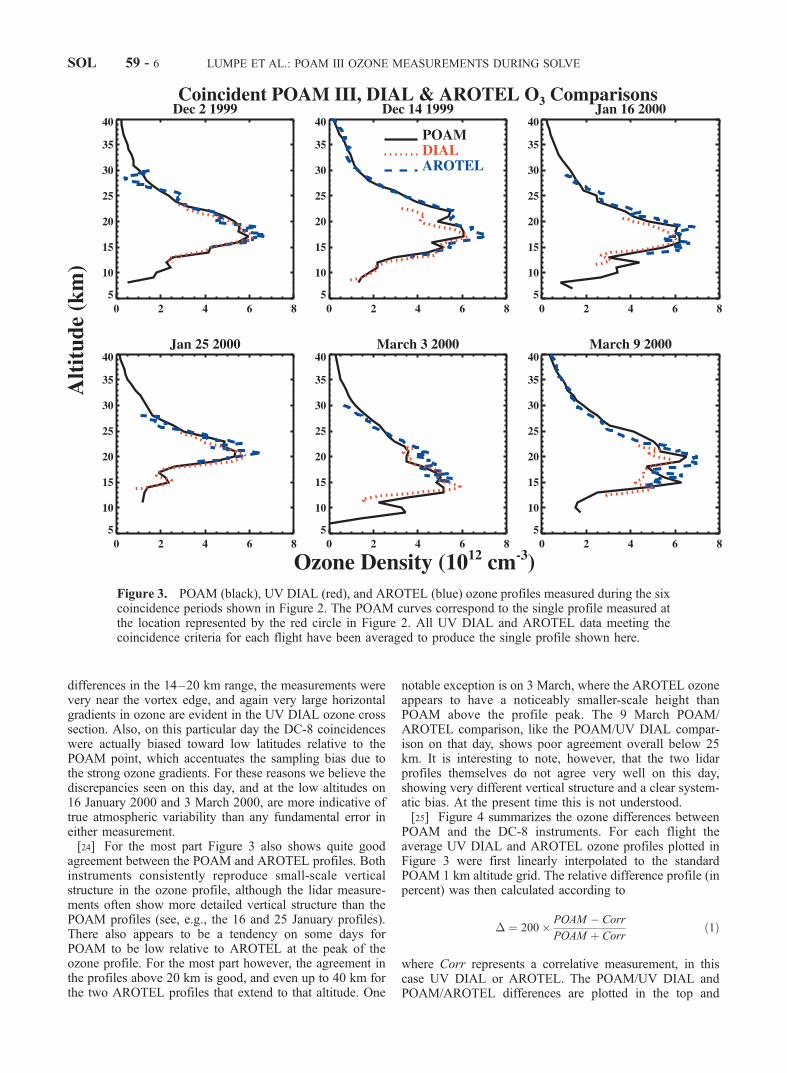
POAM and the DC-8 instruments. For each flight theaverage UV DIAL and AROTEL ozone profiles plotted inFigure 3 were first linearly interpolated to the standardPOAM 1 km altitude grid. The relative difference profile (inpercent) was then calculated according to
� ¼ 200� POAM � Corr
POAM þ Corrð1Þ
where Corr represents a correlative measurement, in thiscase UV DIAL or AROTEL. The POAM/UV DIAL andPOAM/AROTEL differences are plotted in the top and
Figure 3. POAM (black), UV DIAL (red), and AROTEL (blue) ozone profiles measured during the sixcoincidence periods shown in Figure 2. The POAM curves correspond to the single profile measured atthe location represented by the red circle in Figure 2. All UV DIAL and AROTEL data meeting thecoincidence criteria for each flight have been averaged to produce the single profile shown here.
SOL 59 - 6 LUMPE ET AL.: POAM III OZONE MEASUREMENTS DURING SOLVE
middle panels, respectively, of Figure 4. In each panel thecolored curves (red for UV DIAL, blue for AROTEL)correspond to the individual difference profiles for eachflight and the black profile is the mean of all six flights.Error bars correspond to the standard error of the meandifference.[26] The POAM/UV DIAL mean difference is within 5–
7% between 14 and 20 km, and less than 10% between 13and 21 km. At the lowest altitude point, 12 km, the meanerror is clearly dominated by the large differences on 16January 2000 and 3 March 2000 discussed above. Also, thegeneral tendency for UV DIAL to be biased somewhat lowrelative to POAM above 20 km is evident in the mean. Thefact that the UV DIAL ozone is biased low on average by afew percent from 11 to 20 km is consistent with the UVDIAL/ECC comparisons (Grant et al., submitted manu-script, 2002), and probably indicates a slight overestimatein the ozone absorption coefficient used in the DIALanalysis (note, however, this should not affect the trend
determination from UV DIAL data). Except for these smallsystematics, which we feel are understood, the two instru-ments agree to within the combined measurement uncer-tainties and these results are generally consistent withprevious POAM validation (Randall et al., submitted manu-script, 2002).[27] The mean POAM/AROTEL difference is within
10% at all altitudes below 37 km. The exception is thelocalized peak at 28–29 km where differences reach 10–20%, with POAM high (note, however, that this feature isdominated by the 12 December event where the AROTELprofile shows a pronounced minimum at this altitude whichis not seen by POAM). The results show a fairly consistentvertical structure in the difference profiles for all days, withdifferences generally changing from �10% at 18 km to+10% at 28 km. Note that above 30 km only two measure-ments, from the 14 December and 9 March flights, contrib-ute to the mean. While these also appear to be fairlyconsistent, given the small number of measurements in thisaltitude range it is difficult to tell how significant this resultis. The POAM/AROTEL differences in the 15–27 km rangeare generally consistent with the POAM satellite and ECCozonesonde validation, although the peak difference of�10% at 18–19 km (again a fairly systematic feature inthe six flights) is larger than the maximum differences seenin the work of Randall et al. (submitted manuscript, 2002).[28] In summary, the bottom panel of Figure 4 shows the
mean difference profiles for the POAM/UV DIAL andPOAM/AROTEL comparisons on the same plot. Again,ignoring the POAM/UV DIAL differences above 20 km,POAM agrees with both instruments to within 10% between13 and 27 km with larger errors (but oscillating about zero)in the POAM/AROTEL comparisons at the higher altitudes.It is interesting to note that there is a very similar systematicshape to the two mean difference profiles, as well as anearly constant offset. At this point these correlations in thedifferences between the UV DIAL and AROTEL compar-isons are not understood, but should be explored more in thefuture.
4. ER-2 Comparisons
[29] During the two SOLVE deployments the ER-2 air-craft made a total of 11 science flights out of Kiruna(neglecting transit flights). On each of those flights in situmeasurements of the ozone concentration were made fromthe Q-Bay of the aircraft by the dual-beam UV-AbsorptionOzone Photometer (hereafter referred to as simply ‘‘NOAAOzone’’) [Proffitt et al., 1989]. The instrument consists of a254-nm mercury lamp, two sample chambers that can beperiodically scrubbed of ozone, and two detectors thatmeasure the radiation directed from the lamp through thechambers. Ozone absorbs strongly at this wavelength andthe absorption cross section is accurately known; hence, theozone number density can be accurately calculated from thedifference in the detected signals from the two chambers.Since the two absorption chambers are identical, virtuallycontinuous measurements of ozone are made by alternatingthe ambient air sample and ozone scrubbed sample betweenthe two chambers. At a 1 s data collection rate, theminimum detectable concentration of ozone (one standarddeviation) is 1.5 � 1010 molecules/cm3 (0.6 ppbv at STP or
Figure 4. Ozone difference, as calculated by equation (1),for POAM/UV DIAL (top panel) and POAM/AROTEL(middle panel). Blue and red curves represent the differenceprofiles for each of the six flights, whereas the black curveis the mean difference of all flights. Error bars correspond tothe standard error of the mean difference. The bottom panelsimply compares the POAM/UV DIAL and POAM/AROTEL mean error profiles from the top two panels.
LUMPE ET AL.: POAM III OZONE MEASUREMENTS DURING SOLVE SOL 59 - 7

8 ppbv at 20 km). Measurement accuracy is predicted to be3% plus precision [Proffitt et al., 1989].[30] Because the NOAA Ozone measurements are made
in situ and the aircraft tends to maintain a more or lessconstant cruise altitude at approximately 18–20 km (asidefrom takeoff, landing and occasional dives), the POAM/ER-2 comparisons are necessarily heavily weighted to thisnarrow altitude range. In this region Randall et al. (sub-mitted manuscript, 2002) has shown that the POAM version3.0 ozone agrees to within 3–5% with coincident satelliteand ECC ozonesonde data in the Northern Hemisphere(with POAM in general somewhat low compared to thesatellites but high relative to the sondes).[31] Because of the problematic nature of comparing
satellite to in situ measurements, we have used three differ-ent approaches in comparing the POAM and ER-2 ozonedata: vortex-averaged, trajectory hunting, and direct coinci-dence measurements. In the first approach, vortex-averagedozone measurements from each instrument are compared forall of the ER-2 flights. This approach was initially moti-vated by the observation that the ER-2 ozone data frommost of the deep vortex-survey flights generally shows avery uniform ozone field within the interior of the vortex, atleast in the early winter (see discussion below). Thisuniformity is also apparent from the in-vortex measure-ments made by POAM over time periods of several days.The second method used to compare POAM and ER-2ozone data involves using a trajectory analysis to identifyand directly compare identical air parcels that were sampledby both instruments. Finally, we have also identified andcompared standard temporal and spatial coincidencesbetween the POAM and ER-2 ozone measurements. Unlikethe DC-8, no effort was made to incorporate specificunderflights of the POAM measurement locations into theER-2 flight plans during SOLVE. However, direct coinci-dences do exist on a number of days if the coincidencecriteria are relaxed considerably from those used for theDC-8 comparisons.[32] Results from these three different comparison tech-
niques are discussed separately in sections 4.1, 4.2, and 4.3below. All three techniques have their strengths and short-comings. The vortex-averaged method minimizes the effectof random errors, but depends upon having unbiased (or atleast the same) ER-2 and POAM vortex sampling. Thetrajectory hunting method would, in principle, be the bestway to ensure comparison of similar air parcels, but it relieson the accuracy of the trajectory analysis. Finally, the directcoincidence technique is the most straightforward andfrequently used validation method, but given the well-known trade-offs between constraining the closeness ofthe coincidences and obtaining a statistically significantnumber of samples, there is no guarantee that similar airparcels are sampled.
4.1. Vortex-Averaged Ozone Comparisons
[33] In order to compare the vortex-averaged ozonemeasured by POAM and the ER-2 it was first necessaryto isolate the in-vortex data obtained by each instrument ona given day. For the ER-2 the N2O and CO2 tracer data wereused to determine which time segments of the flightcorresponded to air sampled well within the interior of thevortex. All data meeting the vortex-discrimination criteria
was then binned in uniform 10 K potential temperature binsto create a single vortex-averaged vertical profile.[34] As discussed in a companion paper in this special
issue [Randall et al., 2002], POAM routinely made meas-urements both inside and outside the polar vortex on a dailybasis during SOLVE. This is because the center of thevortex was frequently displaced from the pole towardEurope or Asia and therefore POAM, measuring around acircle of latitude, would sample both in-vortex and extra-vortex air on a given day. However, because of the rela-tively coarse horizontal sampling afforded by the solaroccultation technique, on any given day only a handful ofevents might be well inside the vortex. Therefore, to obtaina statistically meaningful sample of in-vortex ozone meas-urements for each ER-2 flight day the POAM data wereaveraged over a 3-day time period centered on the flightdate (i.e., flight day ± 1 day). All POAM profiles measuredwithin the inner vortex boundary (as defined by the Nashcriteria) in that 3-day period were averaged together andinterpolated onto the same potential temperature grid as theER-2 data.[35] Figure 5 illustrates this procedure for four represen-
tative ER-2 flight days. For each day the ER-2 flight track isrepresented by the solid blue line, the inner and middleNash vortex edges (at 450 K) are represented by the blackand green contours, respectively, and all POAM measure-ments made during the 3-day averaging period are shown asred crosses. Only those POAM points and that portion ofthe ER-2 flight lying within the solid black contour con-tribute to the vortex-averaged profile (the POAM vortexdiscrimination uses the appropriate vortex boundary foreach of the 3 days used in the average). The number ofsuch points of course varies from flight to flight. On ER-2vortex survey flights, such as 5 March 2000, the entire ER-2flight occurs deep in the vortex whereas other flightscontain planned vortex edge crossings.[36] Figure 6 shows the vortex-averaged ozone profiles
measured by both instruments for the eleven ER-2 scienceflights out of Kiruna. The red circles represent the POAMpoints, black squares are the ER-2 points and the solid linesrepresent ± one standard deviation of the mean for eachflight. Clearly there is generally very good quantitativeagreement between the two data sets. POAM does appearbiased somewhat low relative to ER-2 on the 27 and 31January flights, but by no more than 5%. Figure 6 alsoshows an increasing tendency for POAM ozone to be highrelative to the ER-2 at the higher altitudes in late winter,beginning with the 5 March flight. In this late winter periodthe vortex had experienced a large amount of chemicalozone loss [Hoppel et al., 2002], and POAM measured largein-vortex ozone gradients [Randall et al., 2002]. Figure 6also suggests that while the POAM vortex-averaged stand-ard deviation is increasing over this late winter period, theER-2 variation is not. This suggests that the ER-2 waspreferentially sampling the most depleted vortex air, whilePOAM obtained more of a vortex survey. This view isreinforced by Figure 5, which shows the small slice of thevortex sampled by the ER-2 on 11 March relative to themore extensive POAM vortex sampling (the corresponding12 March map, which is not shown, yields the sameconclusion). Of course, it was not atypical for POAM tosample a larger portion of the vortex than the ER-2
SOL 59 - 8 LUMPE ET AL.: POAM III OZONE MEASUREMENTS DURING SOLVE

throughout the winter. However, increasing ozone gra-dients within the vortex (as a result of ozone loss) laterin the winter would serve to accentuate the effects of thissampling bias. Thus, we suggest that the increasingtendency for POAM to be biased high compared to theER-2 in the late winter comparisons is much more likelyto be the result of sampling biases rather than realmeasurement differences.[37] To illustrate this point, in Figure 7 we have plotted
the POAM and ER-2 ozone measurements at 460 K as afunction of equivalent latitude on 23 January and 11March (equivalent latitude is the latitude enclosing thesame area as a given potential vorticity contour). The redsymbols represent all the POAM measurements at 460 Kwithin ±1 day of flight date (both inside and outside thevortex) whereas black symbols represent the ER-2 ozonedata (in-vortex only). The vertical lines denote the middleand inner vortex edges. On 23 January the ozone insidethe vortex, as measured by both instruments, is quiteuniform. This situation is typical of the early and mid-winter flights and, as discussed previously, provided theoriginal justification for using vortex-averaged compari-sons. Clearly the situation is very different by 11 March.Here the POAM data show evidence of large ozonegradients within the vortex, with two distinct populationsof low and high ozone; the ER-2, however, preferentially
samples only that part of the vortex with depleted ozone.This explains why the vortex-averaged POAM ozone onthis day, and on all other days in the late winter period, isbiased high relative to the ER-2. This is purely a samplingbias, rather than a measurement error.[38] Finally, we note that the sharp structures in the 14
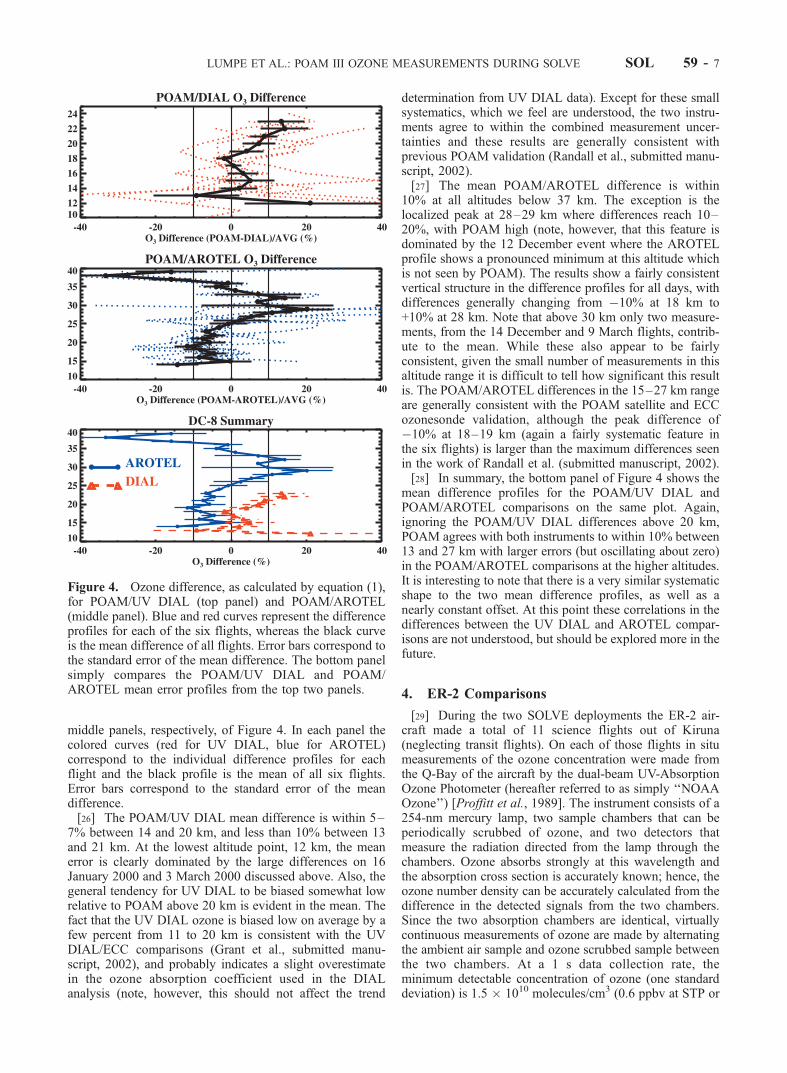
and 23 January 2000 ER-2 profiles are due to intrusions(midlatitude filaments) encountered by the ER-2 on thoseflights. This can be clearly seen by correlating the O3 andtracer data from different ER-2 instruments on those flights(not shown). While POAM can in principle also see suchfilaments, there is no guarantee that it sampled thesespecific features on those days. Even if a filament wereseen in one POAM measurement on the flight date it wouldbe smoothed out in the 3-day averaging.[39] In Figure 8 these results are summarized by plotting
the average ozone mixing ratio profiles, and their meandifference, for the eleven flights. The mean difference iswithin 5% at all levels between 350 and 450 K and within7% at 460 K. The only difference greater than 10% is at thehighest theta level, 470 K, which is clearly dominated bysampling biases discussed above. On the whole, the vortex-averaged comparisons show excellent agreement betweenPOAM and ER-2 ozone.
4.2. Trajectory Hunting Analysis
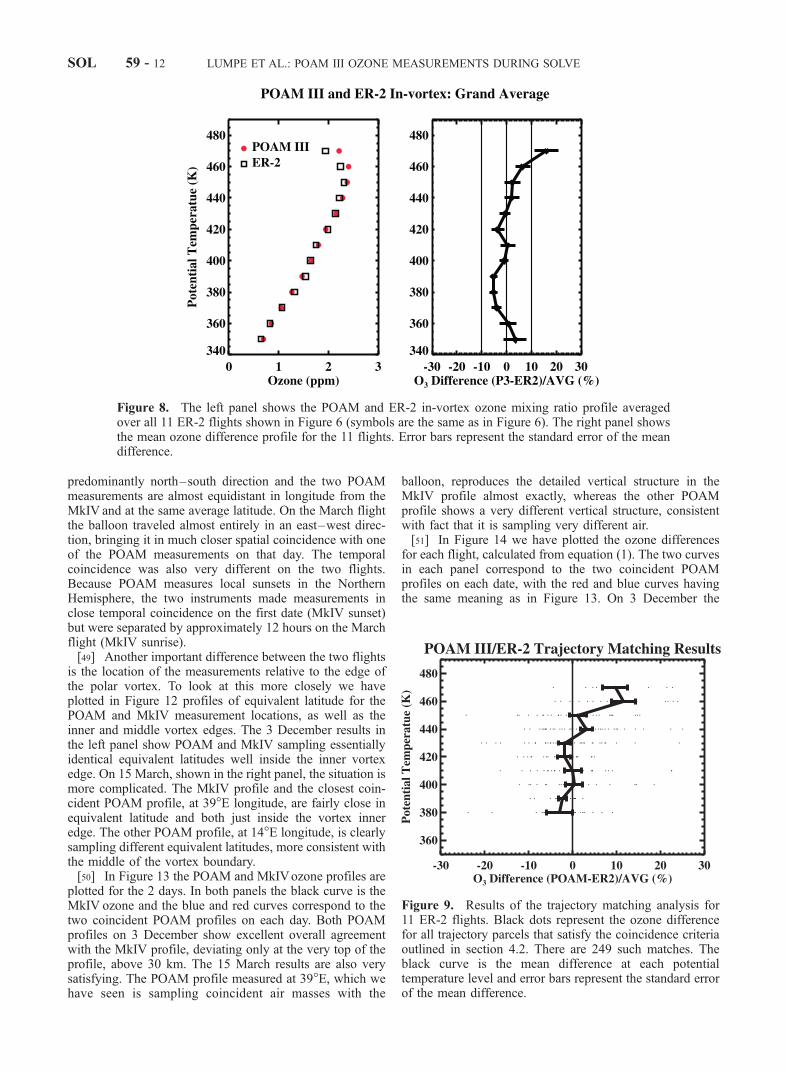
[40] The second method of comparing POAM and ER-2measurements is to look for air parcel trajectory matches.Forward and backward isentropic trajectories were run fromeach POAM measurement location at 10 K increments inthe vertical using the UKMO wind analysis. We thensearched for cases where these trajectories crossed theER-2 flight track within the following constraints: 300 kmhorizontal separation, 5 K separation in the vertical, and 1.2hours in time. The matches were further constrained to havea maximum trajectory length of ±5 days. Of course, it ispossible that within 5 days significant ozone chemicalchange could occur along the trajectory, but most of thematches found in the analysis were within 3 days, and fairlyevenly distributed between forward and backward trajecto-ries. A total of 249 matches were found to meet the abovecriteria in the vertical range from 380 to 470 K.[41] The results of the trajectory hunting analysis are
summarized in Figure 9. The small black dots representthe ozone difference for all of the 249 points that satisfiedthe match criteria. Note that there tends to be more scatter intrajectory-match comparisons relative to the vortex-aver-aged comparisons. This is expected both because there issome scatter introduced by trajectory inaccuracies and ofcourse the vortex-averaged approach, which averages overmany measurements, naturally tends to produce a smootherresult. The black curve in Figure 9 represents the meandifference for all the match events (after binning the data in10 K potential temperature bins) and the error bars corre-spond to the standard error of the mean difference. Compar-ing this result with Figure 8 shows that the trajectorymatching and vortex-averaged comparisons yield remark-ably similar results in terms of both the magnitude andvertical structure of the ozone difference. In particular, it isinteresting to note that the high POAM bias above 450 Kappears in both analyses. However, close inspection of thetrajectory matching results shows that there is no trend
Figure 5. Examples of POAM and ER-2 data used in thevortex-averaged ozone comparisons for four ER-2 flights.The blue curves correspond to the ER-2 flight track on eachday. The black and green contours represent the location ofthe inner and middle vortex edge, respectively, on the 450 Kpotential temperature surface. Red crosses show the locationof all POAM measurements made in the 3-day periodcentered on the ER-2 flight date. Only those POAM andER-2 measurements made inside the black contour are usedin the vortex-averaged comparisons.
LUMPE ET AL.: POAM III OZONE MEASUREMENTS DURING SOLVE SOL 59 - 9

toward increasing POAM biases later in the winter as wasobserved in the vortex-averaged comparisons. Furthermore,there is no observed bias with respect to forward or back-ward trajectories, which could produce a bias in the relativedifferences if chemical depletion is occurring along thetrajectories. Therefore, the consistency of this high bias inthe two approaches is not currently understood and deservesfurther study.
4.3. Comparison of POAM/ER-2 Direct Coincidences
[42] Finally, we present comparisons of POAM measure-ments made in direct temporal and spatial coincidencewith the ER-2 measurements. If the stringent coincidencecriteria used in the DC-8 analysis in section 3 are used forthe ER-2, very few coincident measurements are found.However, if the criteria are relaxed considerably manymore coincident data points are found. For the compar-isons presented here we chose the following criteria: ±3�in latitude, 10� in longitude and ±3 hour in time. Thesecriteria are similar to those typically used in the POAMsatellite validation studies [Randall et al., 2000; Rusch etal., 1997; Randall et al., 2001, 2002]. We further requiredthat both POAM and ER-2 measurements be made withinthe inner edge of the vortex.
[43] Coincident POAM and ER-2 measurements satisfy-ing these criteria were found for all the ER-2 flightsdiscussed in section 4.1 except the flight on 14 January.In addition, all of these coincident ER-2 measurementscontain some portion of the data obtained during takeoff,landing or the executed dives and stack maneuvers. There-fore they all contain ER-2 data over a range of altitudes,which allows for direct profile comparisons with POAM.For these comparisons we plot the coincident POAM andER-2 data versus altitude since this is the fundamentalvertical grid for the POAM data and is also availabledirectly for the ER-2 from the archived GPS altitudes.[44] Figure 10 shows the coincident POAM (in blue) and
ER-2 (in red) ozone mixing ratio profiles for each flight.The ER-2 profiles were constructed by binning all pointssatisfying the coincidence criteria into 1 km altitude binsand calculating a mean ozone mixing ratio in each bin. Theresulting profile was then linearly interpolated to the stand-ard POAM altitude grid. The altitude range of the coinci-dent ER-2 profiles varies considerably from flight to flightbut most flights provide a significant overlap with thePOAM profiles. In general the agreement is qualitativelyquite good, although occasional systematic differences doappear (e.g., 23 January below 16 km, 2 February, and 5
Figure 6. Vortex-averaged ozone mixing ratio profiles measured by POAM (red circles) and ER-2(black squares) for the 11 ER-2 flights indicated at the top of each panel. The solid black and red linesrepresent the standard error of the means for POAM and ER-2, respectively.
SOL 59 - 10 LUMPE ET AL.: POAM III OZONE MEASUREMENTS DURING SOLVE

March). Note that the comparisons do not show the increas-ing tendency toward higher POAM biases as was seen in thevortex-averaged and trajectory hunting comparisons. How-ever, there is little direct POAM/ER-2 overlap in the 460–470 K (�18 km) region where these biases occur, partic-ularly late in the winter.[45] Figure 11 shows the mean ozone difference profile
(black curve) obtained from averaging the coincident datafrom all ten flights. The numbers on the right axis representthe number of profiles that contribute to the mean at eachaltitude level. Between 11 and 19 km the differences arewithin 10%. However, there is a small but statisticallysignificant bias over most of this altitude range, with POAMhigher than ER-2 by an average of �5%. Below 11 kmPOAM is systematically higher than ER-2 by approximately20% on average.[46] For comparison the mean difference profiles from the
vortex-averaged and trajectory matching analyses areincluded in the blue and red curves, respectively, in Figure11. The result of these three independent approaches lead to
generally consistent conclusions at the ±5% level, withmean difference profiles at most altitudes overlappingwithin their standard errors. However, the vortex-averagedand trajectory matching results do not reproduce the POAMhigh bias between 12 and 17 km seen in the standardcoincidence comparisons. In fact, it could be argued thatthese two approaches show a low POAM bias of a fewpercent, at least below 18 km. This discrepancy is notcurrently understood. Finally, we note that these resultsare generally consistent with the conclusions of Danilin etal. [2002], who have also done a systematic comparison ofthe POAM and ER-2 ozone measurements during SOLVEusing both a trajectory hunting and direct coincidenceanalysis.
5. MkIV Balloon Comparisons
[47] The Jet Propulsion Laboratory MkIV Interferometer[Toon, 1991] is a high-resolution Fourier transform infrared(FTIR) spectrometer. Like POAM, the MkIV makes meas-urements of atmospheric composition using the solar occul-tation technique, but operates in the infrared rather than thevisible, and from a balloon rather than a satellite platform.In terms of optical design the MkIV is very similar to theATMOS instrument [Farmer, 1987] which flew four timeson the space shuttle. Following launch, the balloon rises tofloat altitude (typically 30–40 km) from which it thenobserves the sunrise or sunset. When operating at highlatitudes, such as during SOLVE, the sunrise/sunset tran-sition is relatively slow, taking approximately 2 hours.During occultation, the instrument measures the solar radi-ance through the atmosphere in the spectral range from 650to 5650 cm�1 (1.77–15.4 mm) at 0.01 cm�1 resolution.Normalization of the limb spectra by a high-Sun (unattenu-ated) spectrum removes the solar and instrumental featuresyielding atmospheric limb transmittance spectra. Thesetransmittance spectra are analyzed using a nonlinear leastsquares spectral fitting algorithm to determine slant columnabundances of various trace gases along the limb path fromthe depths of their absorption lines. Finally, the matrixequation relating the measured slant column abundances tothe calculated slant path distances is solved to yield the finalvolumemixing ratio profiles for each gas. TheMkIVretrievalalgorithms are described by Sen et al. [1998]. The effectivevertical resolution of the MkIV profiles is approximately 2km. The accuracy of the ozone retrieval, which is determinedprimarily by uncertainties in spectroscopic parameters usedin the line-by-line forward model, is estimated to be �5%.[48] The MkIV payload made two flights during SOLVE,
launching from the Esrange balloon facility just outside ofKiruna. On the first flight, 3 December 1999, MkIVmeasured a sunset occultation, whereas the second flighton 15 March 2000 was a sunrise event. During the time ittakes for the MkIV to record an occultation, the balloon candrift a significant distance horizontally, depending on thelocal wind fields. On each day POAM made two measure-ments close in latitude to the balloon position and bracket-ing it in longitude (see Figure 13 for details). The spatialseparation between the balloon and satellite measurementsis similar on both days, but the different character of theballoon track on the two flights introduces distinct differ-ences. On the December flight the balloon drifted in a
Figure 7. POAM (red circles) and ER-2 (black triangles)ozone measurements at 460 K on 23 January (top panel) and11 March (bottom panel). The POAM data include allmeasurements made within ±1 day of flight date. Only in-vortex ER-2 data are plotted. The vertical lines denote themiddle and inner vortex edges.
LUMPE ET AL.: POAM III OZONE MEASUREMENTS DURING SOLVE SOL 59 - 11
predominantly north–south direction and the two POAMmeasurements are almost equidistant in longitude from theMkIV and at the same average latitude. On the March flightthe balloon traveled almost entirely in an east–west direc-tion, bringing it in much closer spatial coincidence with oneof the POAM measurements on that day. The temporalcoincidence was also very different on the two flights.Because POAM measures local sunsets in the NorthernHemisphere, the two instruments made measurements inclose temporal coincidence on the first date (MkIV sunset)but were separated by approximately 12 hours on the Marchflight (MkIV sunrise).[49] Another important difference between the two flights
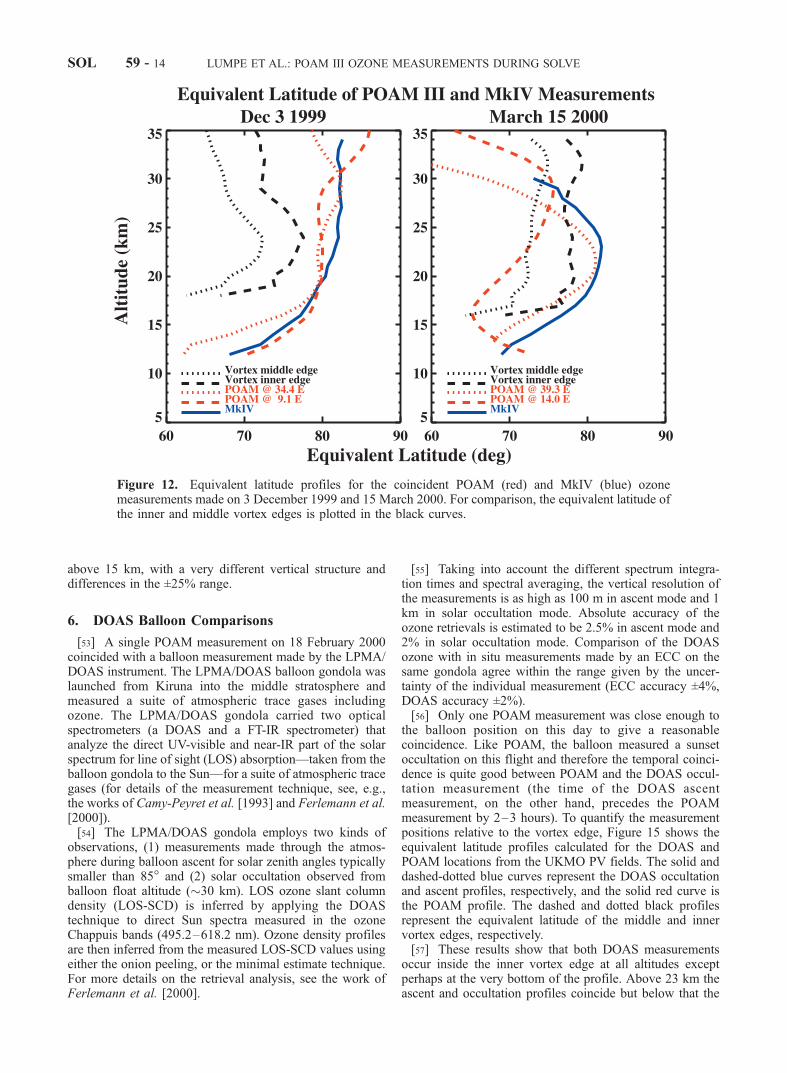
is the location of the measurements relative to the edge ofthe polar vortex. To look at this more closely we haveplotted in Figure 12 profiles of equivalent latitude for thePOAM and MkIV measurement locations, as well as theinner and middle vortex edges. The 3 December results inthe left panel show POAM and MkIV sampling essentiallyidentical equivalent latitudes well inside the inner vortexedge. On 15 March, shown in the right panel, the situation ismore complicated. The MkIV profile and the closest coin-cident POAM profile, at 39�E longitude, are fairly close inequivalent latitude and both just inside the vortex inneredge. The other POAM profile, at 14�E longitude, is clearlysampling different equivalent latitudes, more consistent withthe middle of the vortex boundary.[50] In Figure 13 the POAM and MkIVozone profiles are
plotted for the 2 days. In both panels the black curve is theMkIV ozone and the blue and red curves correspond to thetwo coincident POAM profiles on each day. Both POAMprofiles on 3 December show excellent overall agreementwith the MkIV profile, deviating only at the very top of theprofile, above 30 km. The 15 March results are also verysatisfying. The POAM profile measured at 39�E, which wehave seen is sampling coincident air masses with the
balloon, reproduces the detailed vertical structure in theMkIV profile almost exactly, whereas the other POAMprofile shows a very different vertical structure, consistentwith fact that it is sampling very different air.[51] In Figure 14 we have plotted the ozone differences
for each flight, calculated from equation (1). The two curvesin each panel correspond to the two coincident POAMprofiles on each date, with the red and blue curves havingthe same meaning as in Figure 13. On 3 December the
Figure 8. The left panel shows the POAM and ER-2 in-vortex ozone mixing ratio profile averagedover all 11 ER-2 flights shown in Figure 6 (symbols are the same as in Figure 6). The right panel showsthe mean ozone difference profile for the 11 flights. Error bars represent the standard error of the meandifference.
Figure 9. Results of the trajectory matching analysis for11 ER-2 flights. Black dots represent the ozone differencefor all trajectory parcels that satisfy the coincidence criteriaoutlined in section 4.2. There are 249 such matches. Theblack curve is the mean difference at each potentialtemperature level and error bars represent the standard errorof the mean difference.
SOL 59 - 12 LUMPE ET AL.: POAM III OZONE MEASUREMENTS DURING SOLVE

differences are within 10% with no obvious bias between 15and 30 km, which is quite good. Above 30 km and below 15km there is a systematic tendency for POAM to be biasedhigh relative to MkIV. The disagreement is 10–20% above30 km and larger below 15 km, where it averages 20% butreaches values as high as 30% or more. The POAM satellitevalidation (Rusch et al., submitted manuscript, 2001) showsno evidence of a high bias in the version 3.0 ozone between30 and 34 km. This is also not a known systematic bias of theMkIV instrument. However, it is useful to keep in mind thatthis is the upper limit of the MkIV retrieval range and theozone retrievals at or near the balloon float altitude becomevery sensitive to assumptions about the shape of the O3
profile above 33 km. These uncertainties are reflected in thelarger MkIV error bars, which increase from <0.1 ppm at 30km altitude to ±0.4 ppm at 34 km. Therefore the MkIV/POAM difference at these altitudes is probably not statisti-cally significant.[52] For the 15 March flight the agreement between MkIV
and the closest POAM measurement at 39�E is within 5–10% at almost all altitudes. The exception is the 15–18 kmregion, where there is some mismatch in the small-scalestructure seen in the two profiles, and the very lowest point at12 km. Nevertheless, the overall agreement between thesetwo profiles is very good, particularly when one keeps inmind the fact that the measurements were made almost 12hours apart. As expected, the second POAM profile on thisday does not agree with the MkIV nearly as well as the first
Figure 11. Summary of POAM/ER-2 ozone differencesobtained from three comparison techniques. The black curverepresents themeandifferenceobtained from thePOAM/ER-2direct coincidences on the 10 flights shown in Figure 10. Thenumber of coincident ER-2 data points at each altitude level isshown at the right edge. For comparison, the blue and redcurves are the mean differences from the vortex-averaged andtrajectory matching analyses, respectively (see Figures 8 and9). These have been interpolated to an altitude grid using amean vortex-averaged potential temperature profile. In allcases, the error bars represent the standard error of the meandifference.
Figure 10. POAM (blue) and ER-2 (red) ozone mixing ratios satisfying the coincidence criteria oneach of 10 ER-2 flights. The coincidence criteria used are ±3� latitude, ±10� longitude, and ±3 hours.The POAM profiles represent the single coincident measurement from each day. The ER-2 profiles areconstructed by binning all coincident ER-2 data for each flight into 1 km altitude bins.
LUMPE ET AL.: POAM III OZONE MEASUREMENTS DURING SOLVE SOL 59 - 13
above 15 km, with a very different vertical structure anddifferences in the ±25% range.
6. DOAS Balloon Comparisons
[53] A single POAM measurement on 18 February 2000coincided with a balloon measurement made by the LPMA/DOAS instrument. The LPMA/DOAS balloon gondola waslaunched from Kiruna into the middle stratosphere andmeasured a suite of atmospheric trace gases includingozone. The LPMA/DOAS gondola carried two opticalspectrometers (a DOAS and a FT-IR spectrometer) thatanalyze the direct UV-visible and near-IR part of the solarspectrum for line of sight (LOS) absorption—taken from theballoon gondola to the Sun—for a suite of atmospheric tracegases (for details of the measurement technique, see, e.g.,the works of Camy-Peyret et al. [1993] and Ferlemann et al.[2000]).[54] The LPMA/DOAS gondola employs two kinds of
observations, (1) measurements made through the atmos-phere during balloon ascent for solar zenith angles typicallysmaller than 85� and (2) solar occultation observed fromballoon float altitude (�30 km). LOS ozone slant columndensity (LOS-SCD) is inferred by applying the DOAStechnique to direct Sun spectra measured in the ozoneChappuis bands (495.2–618.2 nm). Ozone density profilesare then inferred from the measured LOS-SCD values usingeither the onion peeling, or the minimal estimate technique.For more details on the retrieval analysis, see the work ofFerlemann et al. [2000].
[55] Taking into account the different spectrum integra-tion times and spectral averaging, the vertical resolution ofthe measurements is as high as 100 m in ascent mode and 1km in solar occultation mode. Absolute accuracy of theozone retrievals is estimated to be 2.5% in ascent mode and2% in solar occultation mode. Comparison of the DOASozone with in situ measurements made by an ECC on thesame gondola agree within the range given by the uncer-tainty of the individual measurement (ECC accuracy ±4%,DOAS accuracy ±2%).[56] Only one POAM measurement was close enough to
the balloon position on this day to give a reasonablecoincidence. Like POAM, the balloon measured a sunsetoccultation on this flight and therefore the temporal coinci-dence is quite good between POAM and the DOAS occul-tation measurement (the time of the DOAS ascentmeasurement, on the other hand, precedes the POAMmeasurement by 2–3 hours). To quantify the measurementpositions relative to the vortex edge, Figure 15 shows theequivalent latitude profiles calculated for the DOAS andPOAM locations from the UKMO PV fields. The solid anddashed-dotted blue curves represent the DOAS occultationand ascent profiles, respectively, and the solid red curve isthe POAM profile. The dashed and dotted black profilesrepresent the equivalent latitude of the middle and innervortex edges, respectively.[57] These results show that both DOAS measurements
occur inside the inner vortex edge at all altitudes exceptperhaps at the very bottom of the profile. Above 23 km theascent and occultation profiles coincide but below that the
Figure 12. Equivalent latitude profiles for the coincident POAM (red) and MkIV (blue) ozonemeasurements made on 3 December 1999 and 15 March 2000. For comparison, the equivalent latitude ofthe inner and middle vortex edges is plotted in the black curves.
SOL 59 - 14 LUMPE ET AL.: POAM III OZONE MEASUREMENTS DURING SOLVE

ascent measurement samples higher equivalent latitude thanthe occultation. The POAM measurement is also coincidentin equivalent latitude with DOAS, and therefore inside theinner vortex edge, above 22 km but samples lower equiv-alent latitudes than either of the DOAS profiles at loweraltitudes. Due to the proximity to the vortex edge one mightexpect a fairly complicated situation, with significant hori-zontal gradients in the ozone. In particular it is interesting tonote that the POAM and DOAS measurements happen tostraddle the Scandinavian mountains. The LPMA/DOASprobed air masses in the very lee of the mountain range(with the ascent measurements more eastward than theoccultation measurements) whereas POAM probed airmasses mostly westward (upwind) from the mountains.Hence a pronounced dynamical disturbance of the ozonefield is probably to be anticipated.[58] In Figure 16 the POAM ozone profile is plotted in the
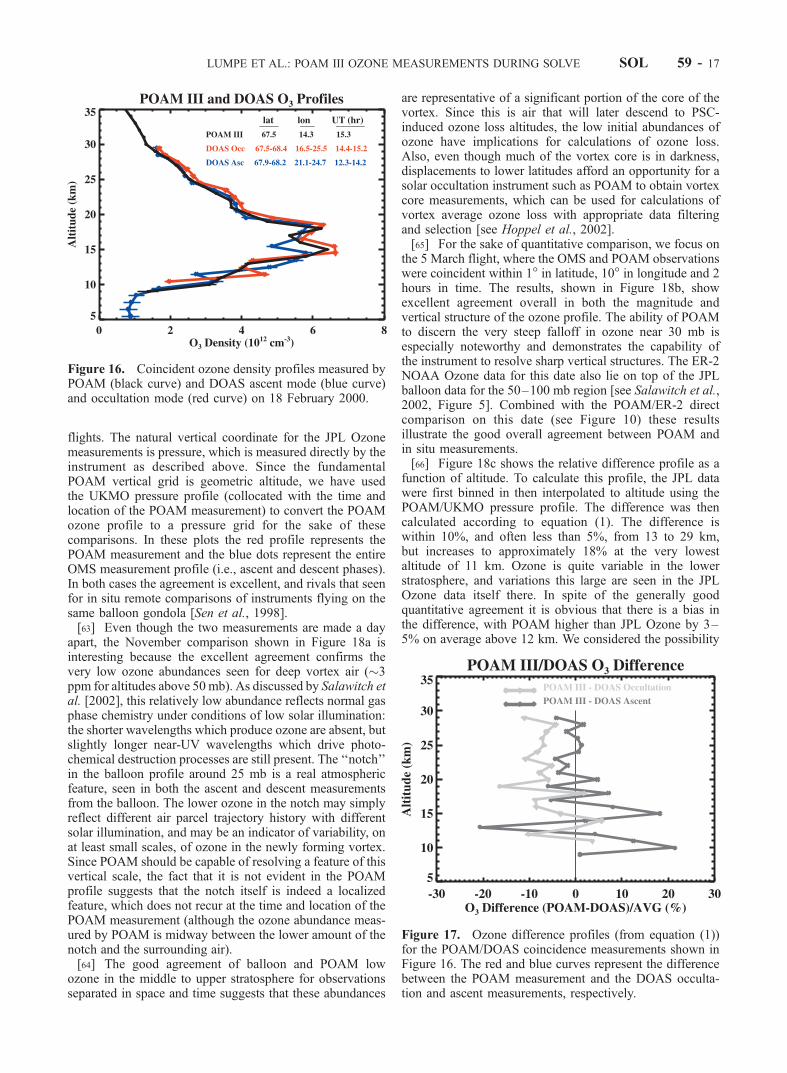
black curve along with the DOAS ascent and occultationprofiles in the blue and red curves, respectively. There isgood qualitative agreement between the three profiles. Inparticular the distinct notch structure in the peak of the ozoneprofile is well captured by both POAM and DOAS, althoughthe altitude of this structure is more consistent between thePOAM and DOAS/occultation profiles than the DOAS/ascent. Another feature captured well by all three measure-ments is the small positive inflection in the profile between19 and 25 km, which in this case is more consistent in thePOAM and DOAS/ascent data. It is also impressive how
well the DOAS profiles track the POAM profile all the waydown to its lowest point at 9 km.[59] The ozone difference profiles are plotted in Figure
17. The difference is calculated from equation (1) after firstinterpolating the DOAS data onto the standard POAMaltitude grid (the DOAS ascent data have already beensmoothed to a 1 km resolution consistent with POAM).The POAM and DOAS occultation profiles essentiallyagree to within 10% at all altitudes between 10 and 30km. However, there appears to be a fairly systematic bias inthe differences, with POAM generally lower than DOAS by3–5% from 11 to 18 km, increasing to 5–8% from 18 to 29km. The POAM and DOAS ascent differences, on the otherhand, appear to be zero-mean with no significant bias.However, the scatter in the difference profile does showstrong altitude dependence, with absolute differences lessthan 5% between 20 and 30 km but increasing to 20%below 15 km. Altogether these comparisons are remarkablygood given the expected natural atmospheric variability inthe ozone near the vortex edge.
7. OMS/JPL Ozone Comparisons
[60] The JPL balloon-borne in situ ozone instrument isvirtually identical to the ozone instrument on the ER-2aircraft. Ozone is measured in two chambers, one contain-ing unperturbed air, the other containing air scrubbed ofozone. The ratio of the absorption of 254-nm radiation
Figure 13. Coincident ozone mixing ratio profiles measured by MkIV (black curves) and POAM (blueand red curves) on 3 December 1999 and 15 March 2000. The two POAM profiles correspond to the twoclosest measurements to the balloon position on each day.
LUMPE ET AL.: POAM III OZONE MEASUREMENTS DURING SOLVE SOL 59 - 15

(generated by a single mercury lamp) in the two chambersis measured simultaneously, canceling out lamp intensityfluctuations. This ratio, coupled with the well-known O3
absorption cross section and the temperature (controlledand easily measured), pressure, and path length of thechambers is used to determine the mixing ratio of O3 inambient air. The mixing ratio of O3 is measured everysecond with an overall uncertainty (accuracy plus preci-sion) of 3–5%. Pressure is measured with a set ofcalibrated Baratrons with an accuracy of 1%. On theObservations of the Middle Stratosphere (OMS) balloonflights, in situ measurements are obtained on slow ascent(300 m/min) to 8 mb, a float of about 20 min, and a slowdescent (150 m/min) through most of the stratosphere,followed by a rapid descent on a parachute.[61] The JPL Ozone instrument flew on two OMS bal-
loon flights launched from Esrange during SOLVE, on 19November 1999 and 5 March 2000. Salawitch et al. [2002]use the data to quantify ozone loss in the vortex, andprovide a discussion of the location of the balloon flightsand comparisons to MkIV remote measurements as well asER-2 NOAA Ozone data. Both OMS flights sampled airdeep in the vortex. Unfortunately POAM was not operatingon 19 November (due to a safety shutdown for the Leonidmeteor shower) and therefore a direct coincidence with thisOMS flight does not exist. However, POAM did make ameasurement very close to Esrange on the following day(20 November) and this profile has been used as a basis for
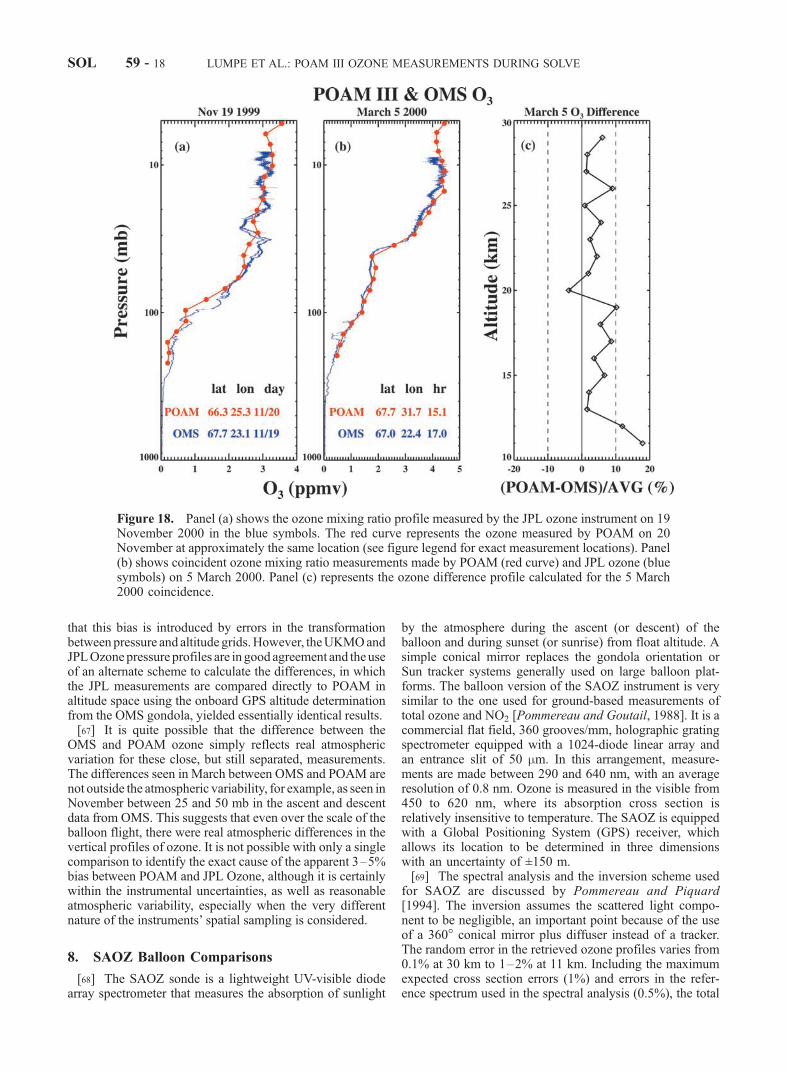
the POAM/OMS comparison for the November flight. Forthe 5 March OMS flight a good spatial and temporalcoincidence with POAM does exist.[62] Panels (a) and (b) of Figure 18 show the comparison
between POAM and the JPL in situ ozone data for the two
Figure 14. Ozone difference profiles (from equation (1)) for the POAM/MkIV coincidencemeasurements shown in Figure 13. For each day, the red and blue curves represent the differencebetween MkIV and the POAM profile of the same color in Figure 12.
Figure 15. Equivalent latitude profiles for the coincidentPOAM (red) and DOAS (blue) ozone measurements madeon 18 February 2000. For comparison, the equivalentlatitude of the inner and middle vortex edges is plotted inthe black curves.
SOL 59 - 16 LUMPE ET AL.: POAM III OZONE MEASUREMENTS DURING SOLVE
flights. The natural vertical coordinate for the JPL Ozonemeasurements is pressure, which is measured directly by theinstrument as described above. Since the fundamentalPOAM vertical grid is geometric altitude, we have usedthe UKMO pressure profile (collocated with the time andlocation of the POAM measurement) to convert the POAMozone profile to a pressure grid for the sake of thesecomparisons. In these plots the red profile represents thePOAM measurement and the blue dots represent the entireOMS measurement profile (i.e., ascent and descent phases).In both cases the agreement is excellent, and rivals that seenfor in situ remote comparisons of instruments flying on thesame balloon gondola [Sen et al., 1998].[63] Even though the two measurements are made a day
apart, the November comparison shown in Figure 18a isinteresting because the excellent agreement confirms thevery low ozone abundances seen for deep vortex air (�3ppm for altitudes above 50 mb). As discussed by Salawitch etal. [2002], this relatively low abundance reflects normal gasphase chemistry under conditions of low solar illumination:the shorter wavelengths which produce ozone are absent, butslightly longer near-UV wavelengths which drive photo-chemical destruction processes are still present. The ‘‘notch’’in the balloon profile around 25 mb is a real atmosphericfeature, seen in both the ascent and descent measurementsfrom the balloon. The lower ozone in the notch may simplyreflect different air parcel trajectory history with differentsolar illumination, and may be an indicator of variability, onat least small scales, of ozone in the newly forming vortex.Since POAM should be capable of resolving a feature of thisvertical scale, the fact that it is not evident in the POAMprofile suggests that the notch itself is indeed a localizedfeature, which does not recur at the time and location of thePOAM measurement (although the ozone abundance meas-ured by POAM is midway between the lower amount of thenotch and the surrounding air).[64] The good agreement of balloon and POAM low
ozone in the middle to upper stratosphere for observationsseparated in space and time suggests that these abundances
are representative of a significant portion of the core of thevortex. Since this is air that will later descend to PSC-induced ozone loss altitudes, the low initial abundances ofozone have implications for calculations of ozone loss.Also, even though much of the vortex core is in darkness,displacements to lower latitudes afford an opportunity for asolar occultation instrument such as POAM to obtain vortexcore measurements, which can be used for calculations ofvortex average ozone loss with appropriate data filteringand selection [see Hoppel et al., 2002].[65] For the sake of quantitative comparison, we focus on
the 5 March flight, where the OMS and POAM observationswere coincident within 1� in latitude, 10� in longitude and 2hours in time. The results, shown in Figure 18b, showexcellent agreement overall in both the magnitude andvertical structure of the ozone profile. The ability of POAMto discern the very steep falloff in ozone near 30 mb isespecially noteworthy and demonstrates the capability ofthe instrument to resolve sharp vertical structures. The ER-2NOAA Ozone data for this date also lie on top of the JPLballoon data for the 50–100 mb region [see Salawitch et al.,2002, Figure 5]. Combined with the POAM/ER-2 directcomparison on this date (see Figure 10) these resultsillustrate the good overall agreement between POAM andin situ measurements.[66] Figure 18c shows the relative difference profile as a
function of altitude. To calculate this profile, the JPL datawere first binned in then interpolated to altitude using thePOAM/UKMO pressure profile. The difference was thencalculated according to equation (1). The difference iswithin 10%, and often less than 5%, from 13 to 29 km,but increases to approximately 18% at the very lowestaltitude of 11 km. Ozone is quite variable in the lowerstratosphere, and variations this large are seen in the JPLOzone data itself there. In spite of the generally goodquantitative agreement it is obvious that there is a bias inthe difference, with POAM higher than JPL Ozone by 3–5% on average above 12 km. We considered the possibility
Figure 16. Coincident ozone density profiles measured byPOAM (black curve) and DOAS ascent mode (blue curve)and occultation mode (red curve) on 18 February 2000.
Figure 17. Ozone difference profiles (from equation (1))for the POAM/DOAS coincidence measurements shown inFigure 16. The red and blue curves represent the differencebetween the POAM measurement and the DOAS occulta-tion and ascent measurements, respectively.
LUMPE ET AL.: POAM III OZONE MEASUREMENTS DURING SOLVE SOL 59 - 17
that this bias is introduced by errors in the transformationbetween pressure and altitude grids.However, theUKMOandJPLOzonepressure profiles are in good agreement and the useof an alternate scheme to calculate the differences, in whichthe JPL measurements are compared directly to POAM inaltitude space using the onboard GPS altitude determinationfrom the OMS gondola, yielded essentially identical results.[67] It is quite possible that the difference between the
OMS and POAM ozone simply reflects real atmosphericvariation for these close, but still separated, measurements.The differences seen in March between OMS and POAM arenot outside the atmospheric variability, for example, as seen inNovember between 25 and 50 mb in the ascent and descentdata from OMS. This suggests that even over the scale of theballoon flight, there were real atmospheric differences in thevertical profiles of ozone. It is not possible with only a singlecomparison to identify the exact cause of the apparent 3–5%bias between POAM and JPL Ozone, although it is certainlywithin the instrumental uncertainties, as well as reasonableatmospheric variability, especially when the very differentnature of the instruments’ spatial sampling is considered.
8. SAOZ Balloon Comparisons
[68] The SAOZ sonde is a lightweight UV-visible diodearray spectrometer that measures the absorption of sunlight
by the atmosphere during the ascent (or descent) of theballoon and during sunset (or sunrise) from float altitude. Asimple conical mirror replaces the gondola orientation orSun tracker systems generally used on large balloon plat-forms. The balloon version of the SAOZ instrument is verysimilar to the one used for ground-based measurements oftotal ozone and NO2 [Pommereau and Goutail, 1988]. It is acommercial flat field, 360 grooves/mm, holographic gratingspectrometer equipped with a 1024-diode linear array andan entrance slit of 50 mm. In this arrangement, measure-ments are made between 290 and 640 nm, with an averageresolution of 0.8 nm. Ozone is measured in the visible from450 to 620 nm, where its absorption cross section isrelatively insensitive to temperature. The SAOZ is equippedwith a Global Positioning System (GPS) receiver, whichallows its location to be determined in three dimensionswith an uncertainty of ±150 m.[69] The spectral analysis and the inversion scheme used
for SAOZ are discussed by Pommereau and Piquard[1994]. The inversion assumes the scattered light compo-nent to be negligible, an important point because of the useof a 360� conical mirror plus diffuser instead of a tracker.The random error in the retrieved ozone profiles varies from0.1% at 30 km to 1–2% at 11 km. Including the maximumexpected cross section errors (1%) and errors in the refer-ence spectrum used in the spectral analysis (0.5%), the total
Figure 18. Panel (a) shows the ozone mixing ratio profile measured by the JPL ozone instrument on 19November 2000 in the blue symbols. The red curve represents the ozone measured by POAM on 20November at approximately the same location (see figure legend for exact measurement locations). Panel(b) shows coincident ozone mixing ratio measurements made by POAM (red curve) and JPL ozone (bluesymbols) on 5 March 2000. Panel (c) represents the ozone difference profile calculated for the 5 March2000 coincidence.
SOL 59 - 18 LUMPE ET AL.: POAM III OZONE MEASUREMENTS DURING SOLVE

accuracy of the SAOZ ozone (random + systematic) rangesfrom approximately 1.5% at 30 km to 3.4% at 11 km. Thevertical resolution of the measurements is 1.4 km and thedata are sampled at 1 km intervals.[70] As part of the THESEO 2000 campaign SAOZ
instruments made eight flights from Kiruna in Sweden(68�N, 21�E) or Andoya in Norway (69�N, 16�E) duringthe 1999/2000 winter. All of the SAOZ balloon launcheswere made at local sunset and thus coincide closely in timewith the POAM measurements (generally within 1 hour). Inselecting SAOZ data to compare with POAM we allow forthe fact that the SAOZ measurement events can cover asignificant horizontal distance due to the balloon drift. Wetherefore search for POAM coincidences among the SAOZascent and occultation measurements independently on eachday. For the comparisons shown here we have adopted aseparation criteria of ±2� in latitude and ±4� in longitude.Using this criteria there are coincidences with POAM on 5days: the Andoya flight on 17 November and the Kirunaflights on 28 January, 27 February, and 7 and 25 March. On27 February and 25 March only one of the two SAOZmeasurements (the occultation and ascent profiles, respec-tively) satisfied the coincidence criteria. On all other daysboth SAOZ profiles are retained. Despite the stated coinci-dence criteria, almost all of these SAOZ measurementsoccur within 1� in latitude and 3� longitude of the POAMtangent point.
[71] Both the SAOZ and POAM measurements occurredwell within the polar vortex on all these days except for 27February, where the measurements coincided with the innervortex edge, and 25 March, where both measurements werewell outside the vortex. Figure 19 shows the comparison ofthe POAM and SAOZ ozone profiles on each of these days.The black curve represents the POAM profile, while theblue and red curves are the SAOZ ascent and occultationmeasurements, respectively. For the most part, the agree-ment shown in Figure 19 is very good. Often the SAOZascent and occultation profiles show different verticalstructure in the profile, indicating a significant amount ofatmospheric variability even over the temporal and spatialscales spanned by the balloon measurement. The onlynotable exception to the good agreement between the twoinstruments is the 27 February coincidence, where POAMappears to be systematically low with respect to the SAOZoccultation profile. While these two measurements are madein close spatial proximity, as noted previously this is theonly occasion where both POAM and SAOZ are samplingnear the vortex edge instead of well inside or outside thevortex. One might therefore expect a greater degree ofnatural spatial variability in the ozone field in this situation.[72] Figure 20 shows the mean POAM/SAOZ ozone
difference profile, calculated by averaging over all coinci-dent ascent and occultation profiles shown in Figure 19.Between 14 and 27 km the absolute difference is within 5–
Figure 19. Ozone density profiles measured by POAM (black curve) and SAOZ ascent mode (bluecurve) and occultation mode (red curve) for coincident events on 5 different days. The coincidencecriteria used are discussed in section 8. The locations of the measurements are listed in the legend, withthe text color chosen to correspond to the ozone profiles.
LUMPE ET AL.: POAM III OZONE MEASUREMENTS DURING SOLVE SOL 59 - 19
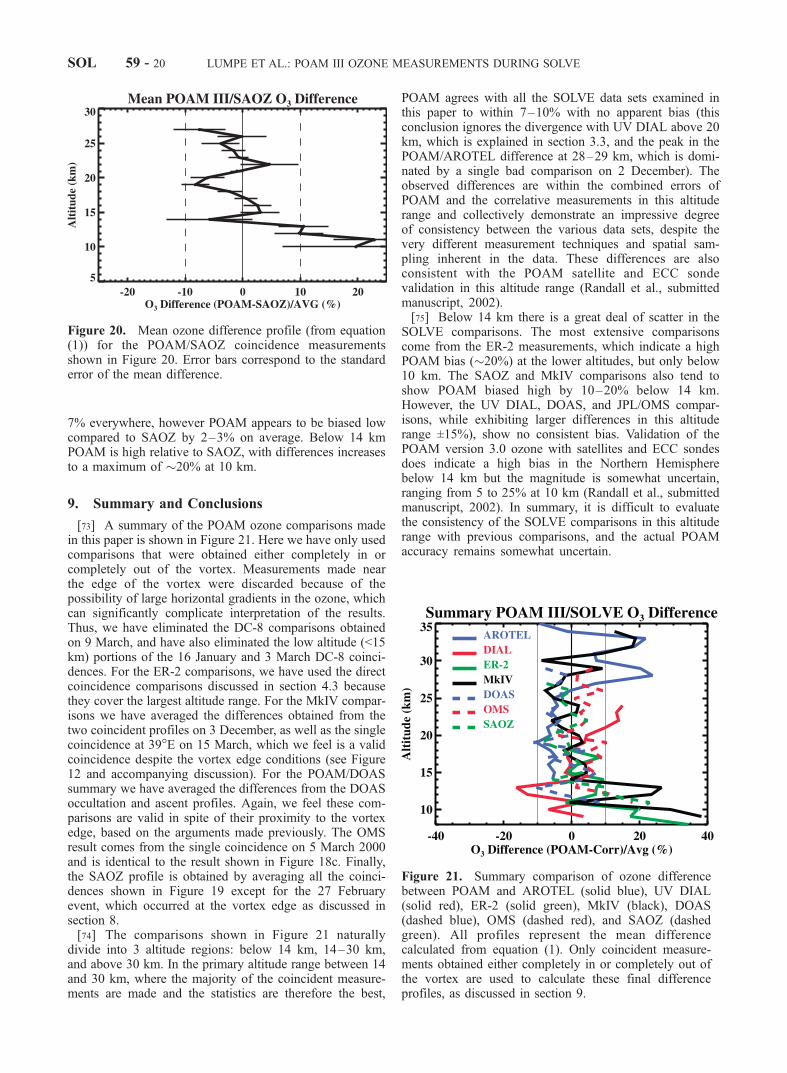
7% everywhere, however POAM appears to be biased lowcompared to SAOZ by 2–3% on average. Below 14 kmPOAM is high relative to SAOZ, with differences increasesto a maximum of �20% at 10 km.
9. Summary and Conclusions
[73] A summary of the POAM ozone comparisons madein this paper is shown in Figure 21. Here we have only usedcomparisons that were obtained either completely in orcompletely out of the vortex. Measurements made nearthe edge of the vortex were discarded because of thepossibility of large horizontal gradients in the ozone, whichcan significantly complicate interpretation of the results.Thus, we have eliminated the DC-8 comparisons obtainedon 9 March, and have also eliminated the low altitude (<15km) portions of the 16 January and 3 March DC-8 coinci-dences. For the ER-2 comparisons, we have used the directcoincidence comparisons discussed in section 4.3 becausethey cover the largest altitude range. For the MkIV compar-isons we have averaged the differences obtained from thetwo coincident profiles on 3 December, as well as the singlecoincidence at 39�E on 15 March, which we feel is a validcoincidence despite the vortex edge conditions (see Figure12 and accompanying discussion). For the POAM/DOASsummary we have averaged the differences from the DOASoccultation and ascent profiles. Again, we feel these com-parisons are valid in spite of their proximity to the vortexedge, based on the arguments made previously. The OMSresult comes from the single coincidence on 5 March 2000and is identical to the result shown in Figure 18c. Finally,the SAOZ profile is obtained by averaging all the coinci-dences shown in Figure 19 except for the 27 Februaryevent, which occurred at the vortex edge as discussed insection 8.[74] The comparisons shown in Figure 21 naturally
divide into 3 altitude regions: below 14 km, 14–30 km,and above 30 km. In the primary altitude range between 14and 30 km, where the majority of the coincident measure-ments are made and the statistics are therefore the best,
POAM agrees with all the SOLVE data sets examined inthis paper to within 7–10% with no apparent bias (thisconclusion ignores the divergence with UV DIAL above 20km, which is explained in section 3.3, and the peak in thePOAM/AROTEL difference at 28–29 km, which is domi-nated by a single bad comparison on 2 December). Theobserved differences are within the combined errors ofPOAM and the correlative measurements in this altituderange and collectively demonstrate an impressive degreeof consistency between the various data sets, despite thevery different measurement techniques and spatial sam-pling inherent in the data. These differences are alsoconsistent with the POAM satellite and ECC sondevalidation in this altitude range (Randall et al., submittedmanuscript, 2002).[75] Below 14 km there is a great deal of scatter in the
SOLVE comparisons. The most extensive comparisonscome from the ER-2 measurements, which indicate a highPOAM bias (�20%) at the lower altitudes, but only below10 km. The SAOZ and MkIV comparisons also tend toshow POAM biased high by 10–20% below 14 km.However, the UV DIAL, DOAS, and JPL/OMS compar-isons, while exhibiting larger differences in this altituderange ±15%), show no consistent bias. Validation of thePOAM version 3.0 ozone with satellites and ECC sondesdoes indicate a high bias in the Northern Hemispherebelow 14 km but the magnitude is somewhat uncertain,ranging from 5 to 25% at 10 km (Randall et al., submittedmanuscript, 2002). In summary, it is difficult to evaluatethe consistency of the SOLVE comparisons in this altituderange with previous comparisons, and the actual POAMaccuracy remains somewhat uncertain.
Figure 20. Mean ozone difference profile (from equation(1)) for the POAM/SAOZ coincidence measurementsshown in Figure 20. Error bars correspond to the standarderror of the mean difference.
Figure 21. Summary comparison of ozone differencebetween POAM and AROTEL (solid blue), UV DIAL(solid red), ER-2 (solid green), MkIV (black), DOAS(dashed blue), OMS (dashed red), and SAOZ (dashedgreen). All profiles represent the mean differencecalculated from equation (1). Only coincident measure-ments obtained either completely in or completely out ofthe vortex are used to calculate these final differenceprofiles, as discussed in section 9.
SOL 59 - 20 LUMPE ET AL.: POAM III OZONE MEASUREMENTS DURING SOLVE

[76] Above 30 km there are only the AROTEL and MkIVcomparisons, both of which seem to suggest a high POAMbias in this altitude range. However, there is a large amountof scatter in these results, which are based on only 4measurements (the AROTEL coincidences on 14 Decemberand 9 March and the two MkIV coincidences on 3 Decem-ber). It is worth noting that comparisons with HALOE andSAGE II do not rule out the possibility of a high POAM biasbetween 30 and 35 km, but the magnitude of the discrepancyis no more than 5% in the satellite comparisons (Randall etal., submitted manuscript, 2002). Therefore, we feel that theSOLVE comparison results are inconclusive above 30 km.[77] In conclusion, the SOLVE campaign has provided
abundant opportunities for validating POAM ozone. This isespecially true in the 14–30 km region. In this altituderange the comparisons with all seven correlative data setsconsidered in this study are remarkably consistent, andindicate agreement to well within the expected uncertaintiesin POAM ozone obtained both from formal error analysis[Lumpe et al., 2002] and other validation studies (Randall etal., submitted manuscript, 2002). However, the situation isnot as clear cut below 14 km or above 30 km where fewmeasurements and large scatter complicate the comparisons.The altitude region above 30 km is not an important issuebecause it is very clear that, in this altitude range, ozone canbe measured very well from satellites, and validationopportunities (apart from those obtained in dedicated cam-paigns) abound. The altitude region below 14 km is muchmore important. In this region, for a variety of reasons,ozone is much more difficult to measure by satellite-basedinstruments, and the accuracy of these measurements is notvery clear. However, long-term data sets provided bysatellites in this altitude region have significant scientificvalue, so their reliability must be carefully assessed. Obtain-ing a large number of high-precision measurements in thisaltitude region should be a very high priority in the planningof future satellite validation campaigns.
[78] Acknowledgments. This work was supported by the NASAScientific Data Purchase program through contract NAS13-99031. Theversion 3.0 POAM data are archived at the NASA Langley Research CenterEOSDIS Distributed Active Archive Center. We wish to thank RossSalawitch for his work in making the entire ER-2 data set available in avery convenient form in terms of his ‘‘merge files’’.[79] The balloon experiments have been operated by the teams of the
NASA National Scientific Balloon Facilities (NSBF), the Centre Nationald’Etude Spatiales (CNES), the Swedish Space Corporation (SSC), and theNorwegian Space Center (NSC), which are gratefully acknowledged.European SAOZ and LPMA/DOAS experiments were supported by theEC Environmental Programmes THESEO-Eurosolve EVK2-1999-00311and Alomar LSF.
ReferencesBrowell, E. V., Differential absorption lidar sensing of ozone, Proc. IEEE,77, 419–432, 1989.
Browell, E. V., et al., Airborne lidar observations in the wintertime Arcticstratosphere: Ozone, Geophys. Res. Lett., 17, 325–328, 1990.
Browell, E. V., C. F. Butler, M. A. Fenn, W. B. Grant, S. Ismail, M.Schoeberl, O. B. Toon, M. Loewenstein, and J. R. Podolske, Ozoneand aerosol changes observed during the 1992 Airborne Arctic Strato-spheric Expedition, Science, 261, 1155–1158, 1993.
Browell, E. V., S. Ismail, and W. B. Grant, Differential absorption lidar(DIAL) measurements from air and space, Appl. Phys. B, 67, 399–410,1998.
Danilin, M. Y., et al., Comparison of ER-2 aircraft and POAM III, MLS,and SAGE II satellite measurements during SOLVE using traditionalcorrelative analysis and trajectory hunting technique, J. Geophys. Res.,107, 10.1029/2001JD000781, in press, 2002.
Camy-Peyret, C., Flaud, A. Perrin, C. P. Rinsland, A. Goldman, and F.Murcray, Stratospheric N2O5, CH4, and N2O profiles from IR solar oc-cultation spectra, J. Atmos. Chem., 16, 31–40, 1993.
Farmer, C. B., High-resolution infrared spectroscopy of the Sun and theEarth’s atmosphere from space, Microchim. Acta [Wien], III, 189–214,1987.
Ferlemann, F., N. Bauer, R. Fitzenberger, H. Harder, H. Osterkamp, D.Perner, U. Platt, M. Schneider, P. Vradelis, and K. Pfeilsticker, Differen-tial Optical Absorption Spectroscopy Instrument for stratospheric bal-loon-borne trace gas studies, Appl. Opt., 39, 2377–2386, 2000.
Grant, W. B., M. A. Fenn, E. V. Browell, T. J. McGee, U. N. Singh, M. R.Gross, I. S. McDermid, L. Froidevaux, and P.-H. Wang, Correlativestratospheric ozone measurements with the airborne UV DIAL systemduring TOTE/VOTE, Geophys. Res. Lett., 25, 623–626, 1998.
Hoppel, K., R. Bevilacqua, C. Nedoluha, C. Deniel, F. Lefevre, J. Lumpe,M. Fromm, C. Randall, J. Rosenfield, and M. Rex, POAM III observa-tions of ozone loss for the 1999/2000 winter, J. Geophys. Res., 107,10.1029/2001JD000476, 2002.
Lucke, R. L., et al., The Polar Ozone and Aerosol Measurement (POAMIII) instrument and early validation results, J. Geophys. Res., 104,18,785–18,799, 1999.
Lumpe, J. D., R. M. Bevilacqua, K. W. Hoppel, and C. E. Randall, POAMIII retrieval algorithm and error analysis, J. Geophys. Res., 107, 10.1029/2002JD002137, in press, 2002.
McGee, T. J., M. Gross, U. N. Singh, J. J. Butler, and P. Kimvilakani, Animproved stratospheric ozone lidar, Opt. Eng., 34, 1421–1430, 1995.
Nash, E. R., P. A. Newman, J. E. Rosenfield, and M. R. Schoeberl, Anobjective determination of the polar vortex using Ertel’s potential vorti-city, J. Geophys. Res., 101, 9471–9478, 1996.
Pommereau, J. P., and F. Goutail, O3 and NO2 ground-based measurementsby visible spectrometry during Arctic Winter and Spring 1988, J. Geo-phys. Res., 891, 1988.
Pommereau, J. P., and J. Piquard, Ozone, nitrogen dioxide and aerosolvertical distributions by UV-visible solar occultation from balloons, Geo-phys. Res. Lett., 21, 1227–1230, 1994.
Proffitt, H., et al., In situ ozone measurements within the 987 Antarcticozone hole from a high-altitude Er-2 aircraft, J. Geophys. Res., 94,16,547–16,555, 1989.
Randall, C. E., R. M. Bevilacqua, J. D. Lumpe, K. W. Hoppel, D. W.Rusch, and E. P. Shettle, Comparisons of Polar Ozone and Aerosol Mea-surement (POAM) II and Stratospheric Aerosol and Gas Experiment(SAGE) II aerosol measurements from 1994 to 1996, J. Geophys. Res.,105, 3929–3942, 2000.
Randall, C. E., R. M. Bevilacqua, J. D. Lumpe, and K. W. Hoppel, Valida-tion of POAM III aerosols: Comparison to SAGE II and HALOE, J.Geophys. Res., 106, 27,525–27,536, 2001.
Randall, C. E., et al., Construction of 3D ozone fields using POAM duringSOLVE, J. Geophys. Res., 107, 10.1029/2001JD000471, in press, 2002.
Rusch, , et al., Validation of POAM II ozone measurements with coincidentMLS, HALOE, and SAGE II observations, J. Geophys. Res., 102,23,615–23,627, 1997.
Salawitch, R. J., et al., Chemical loss of ozone during the Arctic winter of1999–2000: An analysis based on balloon-borne observations, J. Geo-phys. Res., 107, 10.1029/2001JD000620, in press, 2002.
Sen, B., G. C. Toon, G. B. Osterman, J.-F. Blavier, J. J. Margitan, R. J.Salawitch, and G. K. Yue, Measurements of reactive nitrogen in thestratosphere, J. Geophys. Res., 103, 3571–3585, 1998.
Toon, G. C., The JPL MkIV interferometer, Opt. Photonic News, 2, 19–21,1991.
�����������������������M. Fromm and J. D. Lumpe, Computational Physics, Inc., 8001
Braddock Road, Springfield, VA 22151, USA. ([email protected])R. M. Bevilacqua and K. Hoppe, Naval Research Laboratory,
Washington, D.C., USA.C. E. Randall, Laboratory for Atmospheric and Space Physics, University
of Colorado, Boulder, CO, USA.E. V. Browell and W. B. Grant, Atmospheric Sciences Research, NASA
Langley Research Center, Hampton, VA, USA.J. Burris and T. McGee, NASA Goddard Space Flight Center, Greenbelt,
MD, USA.L. Twigg, Science Systems and Applications, Inc., Lanham, MD, USA.E. C. Richard, Aeronomy Laboratory, National Oceanic and Atmospheric
Administration, Boulder, CO, USA.J. J. Margitan, B. Sen, and G. C. Toon, Jet Propulsion Laboratory,
California Institute of Technology, Pasadena, CA, USA.H. Boesch, R. Fitzenberger, and K. Pfeilsticker, Institut fuer Umwelt-
physik, University Heidelberg, Heidelberg, Germany.F. Goutail and J. P. Pommereau, Service d’Aeronomie du CNRS, BP3,
91371, Verrieres le Buisson, France.
LUMPE ET AL.: POAM III OZONE MEASUREMENTS DURING SOLVE SOL 59 - 21