Does Size Matter? A Correlative Study in the Martial Arts
16
Does Size Matter? A Correlative Study in the Martial Arts Andrea Mendez 1 INTRODUCTION Intertwined into nearly every aspect of the Korean system of martial arts known as taekwondo is the quintessential structural tenet that expresses a method of self-defense that allows swift, agile bodies to overcome larger, bulky opponents. This tenet asserts that every successful student must coalesce a well-developed sense of power in the core with the well-trained lower body musculature that enables speed. Although expressed by taekwondo instructors in varied ways, the concept of this tenet is illustrated here by a quote: “The principles of Taekwondo techniques are based on the design of your body. For power you develop the larger, powerful muscles of the torso. The speed of the techniques comes from the fast, agile muscles of the arms and legs. As you progress in Taekwondo, you will learn to coordinate this speed and power, and develop a concentration to focus all of your body's strength into a small, hard striking surface like the edge of the hand or the heel of a foot. Taekwondo allows a woman to emphasize many of her natural physical strengths, such as power in the legs, while learning a method of self-defense efficient against a much larger opponent” (Johnson, Nathan. Martial Arts For the Mind). Task Statement Due to my personal experience in a taekwondo dojang, or training facility, I witnessed firsthand how smaller, lighter students consistently had the advantage over larger, more muscular opponents due to the development of speed and power. Therefore, I aim to test the validity of this tenet on a larger scale by determining whether there is a correlation between the weight of a competitive taekwondo practitioner and success within taekwondo. The results of determining this correlation will, in a more general sense, provide insight into how successful taekwondo is in its pursuit of an efficient method of self defense against unevenly matched opponents. Investigation Method Throughout my research, I will control the country and martial art system that I will analyze by only considering taekwondo practitioners in America. The amount of males and females will be the same with 25 practitioners of each gender. In addition, I will determine the level of success in taekwondo based on one main variable taken from an Internet source: the total number of competitions a practitioner has participated in. As additional variables that may affect the ones mentioned above, I will also record each practitioner's gender, age, and weight. To most relevantly interpret the trends among variables and existence of a correlation between factors, my analysis will rely on the utilization of the mean, median, summation, and standard deviation will be employed to ascertain the measure of central
Transcript of Does Size Matter? A Correlative Study in the Martial Arts
Does Size Matter?
A Correlative Study in the Martial Arts
Andrea Mendez
1
INTRODUCTION Intertwined into nearly every aspect of the Korean system of martial arts known
as taekwondo is the quintessential structural tenet that expresses a method of self-defense
that allows swift, agile bodies to overcome larger, bulky opponents. This tenet asserts that
every successful student must coalesce a well-developed sense of power in the core with
the well-trained lower body musculature that enables speed. Although expressed by
taekwondo instructors in varied ways, the concept of this tenet is illustrated here by a
quote:
“The principles of Taekwondo techniques are based on the design of your body. For
power you develop the larger, powerful muscles of the torso. The speed of the techniques
comes from the fast, agile muscles of the arms and legs. As you progress in Taekwondo,
you will learn to coordinate this speed and power, and develop a concentration to focus
all of your body's strength into a small, hard striking surface like the edge of the hand or
the heel of a foot. Taekwondo allows a woman to emphasize many of her natural physical
strengths, such as power in the legs, while learning a method of self-defense efficient
against a much larger opponent” (Johnson, Nathan. Martial Arts For the Mind).
Task Statement Due to my personal experience in a taekwondo dojang, or training facility, I
witnessed firsthand how smaller, lighter students consistently had the advantage over
larger, more muscular opponents due to the development of speed and power. Therefore,
I aim to test the validity of this tenet on a larger scale by determining whether there is a
correlation between the weight of a competitive taekwondo practitioner and success
within taekwondo. The results of determining this correlation will, in a more general
sense, provide insight into how successful taekwondo is in its pursuit of an efficient
method of self defense against unevenly matched opponents.
Investigation Method Throughout my research, I will control the country and martial art system that I
will analyze by only considering taekwondo practitioners in America. The amount of
males and females will be the same with 25 practitioners of each gender. In addition, I
will determine the level of success in taekwondo based on one main variable taken from
an Internet source: the total number of competitions a practitioner has participated in. As
additional variables that may affect the ones mentioned above, I will also record each
practitioner's gender, age, and weight.
To most relevantly interpret the trends among variables and existence of a
correlation between factors, my analysis will rely on the utilization of the mean, median,
summation, and standard deviation will be employed to ascertain the measure of central
Does Size Matter?
A Correlative Study in the Martial Arts
Andrea Mendez
2
tendency as well as the characteristic of the spread of data regarding whether data points
are clustered or spread apart.
Furthermore, a box and whisper plot will portray the clearest graphical
representation of the five number summaries, consisting of the minimum value,
maximum value, upper quartile, lower quartile, and median, that will aid in the
illustration of the overall characteristics of the data. Outliers will be clearly defined and
included to demonstrate any deviations from the observed trends, determine the reliability
of the results, and guide the construction of generalizations.
Correlation will be ascertained via scatter plot of the continuous data variables of
weight and competitions in addition to weight and medals. This will then be coalesced
with a line graph including Pearson’s Product-Moment Correlation and the line of
regression. By including this graph, I will be able to represent the strength, direction, and
linearity of the correlation.
Accounting for the previously mentioned variables will provide a holistic view of
possibly influential factors on weight and success in taekwondo, while coincidingly
focusing this study on testing a cherished fundamental principle of America’s most
popular martial art system.
GENERATED MEASUREMENT
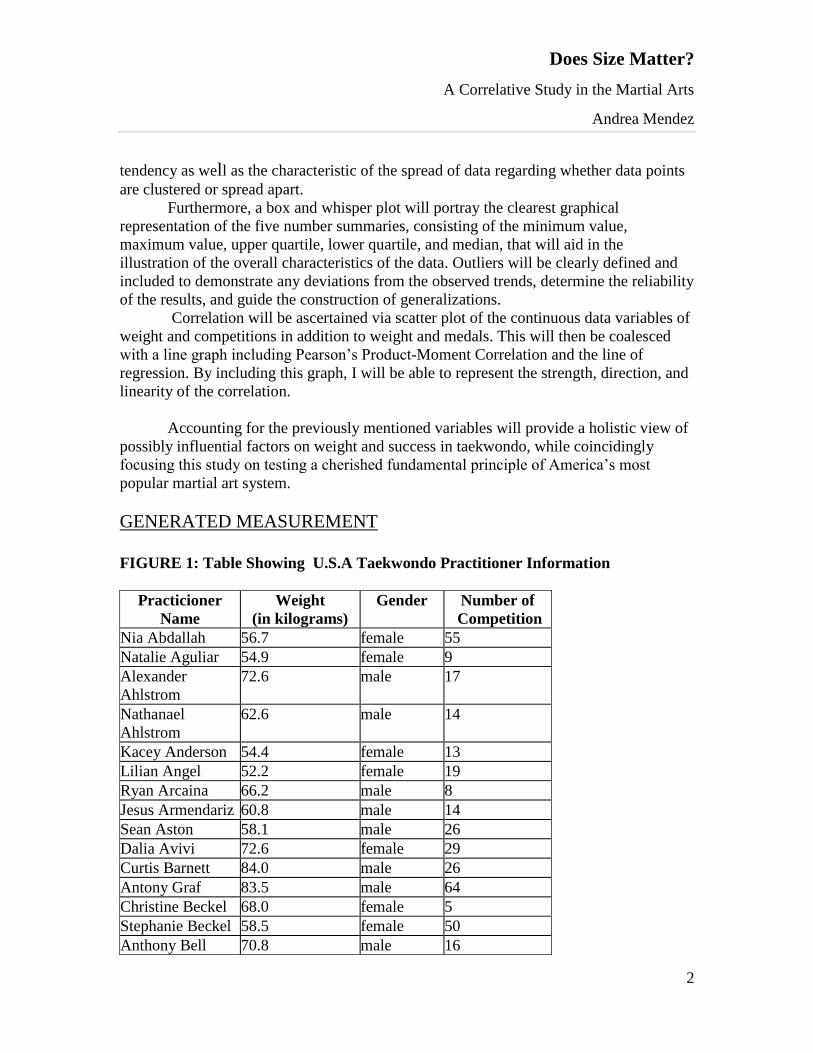
FIGURE 1: Table Showing U.S.A Taekwondo Practitioner Information
Practicioner
Name
Weight
(in kilograms)
Gender Number of
Competition
Nia Abdallah 56.7 female 55
Natalie Aguliar 54.9 female 9
Alexander
Ahlstrom
72.6 male 17
Nathanael
Ahlstrom
62.6 male 14
Kacey Anderson 54.4 female 13
Lilian Angel 52.2 female 19
Ryan Arcaina 66.2 male 8
Jesus Armendariz 60.8 male 14
Sean Aston 58.1 male 26
Dalia Avivi 72.6 female 29
Curtis Barnett 84.0 male 26
Antony Graf 83.5 male 64
Christine Beckel 68.0 female 5
Stephanie Beckel 58.5 female 50
Anthony Bell 70.8 male 16

Does Size Matter?
A Correlative Study in the Martial Arts
Andrea Mendez
3
Kristina Bowen 61.2 female 12
Barbara Brand 46.7 female 32
Caroline Bui 59.0 female 7
Christi Burke-
Maves
51.3 female 40
Lauren Cahoon
Hamon
77.1 female 36
Kenneth Carter Jr. 61.2 male 32
Danielle Harrison 72.3 female 20
Kristi George 58.1 female 26
Aziza Chambers 54.0 female 37
Kevin Chavez 54.9 male 2
Rene Chen 52.2 female 19
Muhammad
Chishti
69.9 male 19
Kelly Chu 50.8 female 18
Alexandra Cinque 58.5 female 25
Josh Coleman 77.1 male 28
Garth A. Cooley 81.6 male 54
Jon Marc Cortez 57.6 male 24
Daniel Cosmillo 77.1 male 16
Nikolau
Gottschalk
62.1 male 15
Samantha Cravens 57.6 female 8
Ally Creel 57.6 female 27
TJ Curry 79.4 male 11
Whitney Daniel 57.6 female 20
Jennifer Daye 61.2 female 16
Medhi Dehghani 86.2 male 43
Brandon DeSouza 76.2 male 15
Simone DeVito 49.9 female 41
Faith Dortch 66.7 female 14
Phil Drake 86.2 male 14
John Drath 78.0 male 9
Matt Dunlap 66.7 male 51
John Duhart II 53.5 male 31
Daniel Elkowitz 53.5 male 23
Candy Esparza 72.6 female 6
Luke Ford 79.8 male 21
Does Size Matter?
A Correlative Study in the Martial Arts
Andrea Mendez
4
All USA Taekwondo Athletes. United States Olympic Committee. 2011.< http://usa-
taekwondo.us/athletes>
DESCRIPTION: In the table above, the athletes chosen were listed in the order they
were found on the online database. The weights were converted from pounds to
kilometers using the conversion factor:1 kilogram = 2.20 pounds in order to ascertain
that the measurements were in accepted metric units. These kilogram values were
rounded to one decimal place in order to keep the data within three significant figures. No
outlier points have been omitted or singled out of the data in this particular table. The
numbers of medals include gold, medal, and bronze. The numbers of competitions
include all the competitions the practitioner participated in regardless of where or when
the competition was held or whether or not a medal was obtained.
MATHEMATICAL PROCESSES
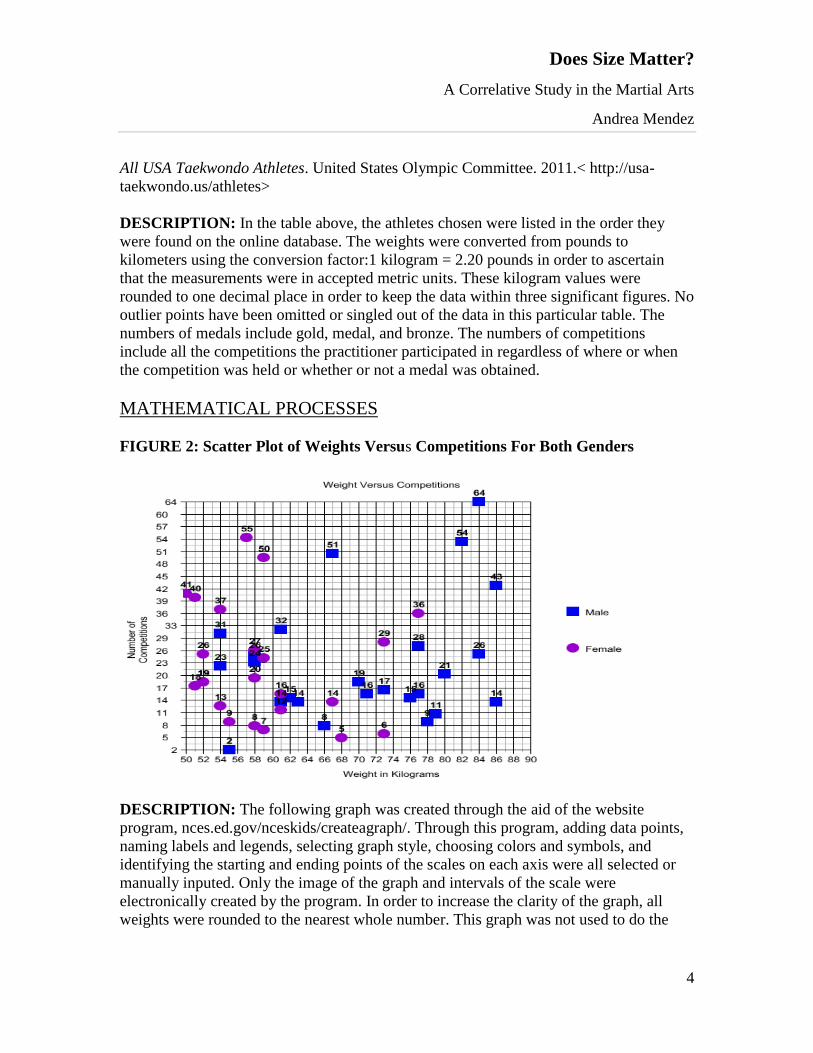
FIGURE 2: Scatter Plot of Weights Versus Competitions For Both Genders
DESCRIPTION: The following graph was created through the aid of the website
program, nces.ed.gov/nceskids/createagraph/. Through this program, adding data points,
naming labels and legends, selecting graph style, choosing colors and symbols, and
identifying the starting and ending points of the scales on each axis were all selected or
manually inputed. Only the image of the graph and intervals of the scale were
electronically created by the program. In order to increase the clarity of the graph, all
weights were rounded to the nearest whole number. This graph was not used to do the
Does Size Matter?
A Correlative Study in the Martial Arts
Andrea Mendez
5
find pearson’s coefficient or the regression line, but to visually demonstrate the differing
spreads of data between the male and female practitioners.
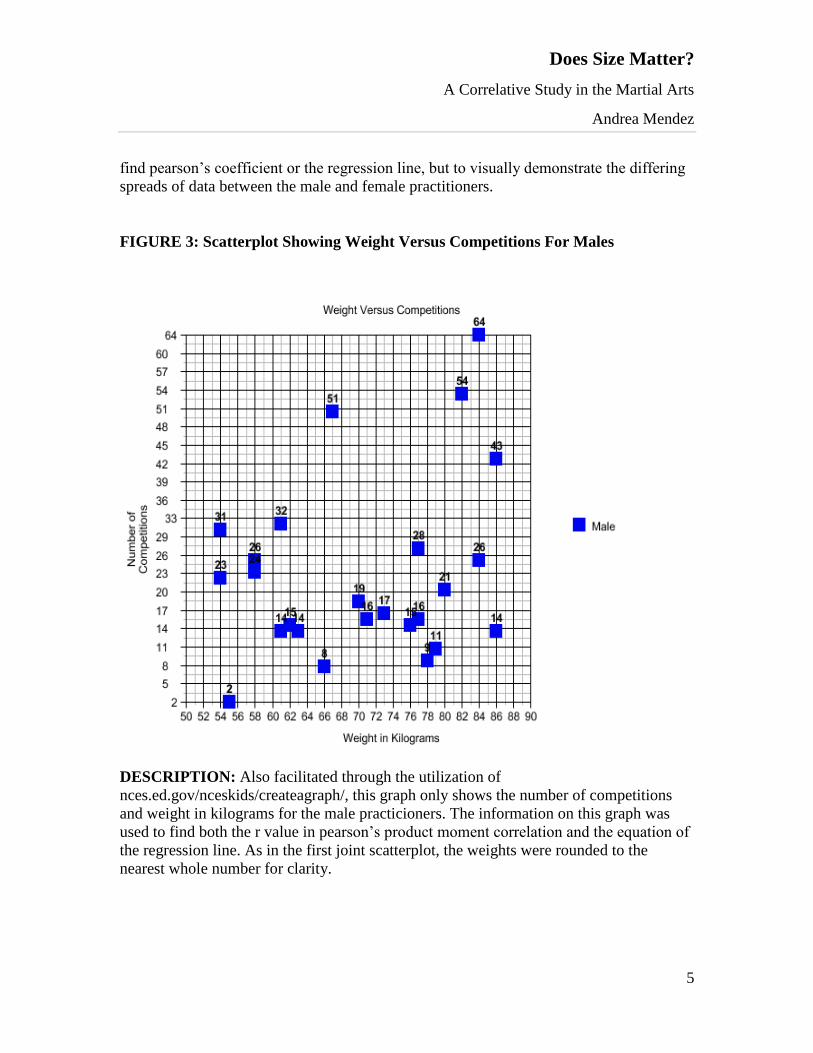
FIGURE 3: Scatterplot Showing Weight Versus Competitions For Males
DESCRIPTION: Also facilitated through the utilization of
nces.ed.gov/nceskids/createagraph/, this graph only shows the number of competitions
and weight in kilograms for the male practicioners. The information on this graph was
used to find both the r value in pearson’s product moment correlation and the equation of
the regression line. As in the first joint scatterplot, the weights were rounded to the
nearest whole number for clarity.

Does Size Matter?
A Correlative Study in the Martial Arts
Andrea Mendez
6
FIGURE 4: Scatterplot Showing Weight Versus Competitions For Females
DESCRIPTION: Just as with Figure 1, this graph was created through the utilization of
nces.ed.gov/nceskids/createagraph/. However, this graph only shows the number of
competitions and weight in kilograms for the female practitioners. The information on
this graph was used to find both the r value in pearson’s product moment correlation and
the equation of the regression line. As in the first joint scatterplot, the weights were
rounded to the nearest whole number for clarity.
Pearson’s Product-Moment Correlation With this process, the direction and strength of the correlation between two
variables can be ascertained. If the sign of r is -1, then the two variables are said to be in a
Does Size Matter?
A Correlative Study in the Martial Arts
Andrea Mendez
7
perfect negative correlation. However, if the sign of r is +1, then the two variables are
said to be in a perfect positive correlation. When the value of r is between +1 and -1, the
correlation is considered strong. When the value of r is close to 0, then the correlation is
considered weak. Depending on the how close the points of the scatterplot are to the
regression line, the correlation can be strongly, moderately, or weakly linear. The formula
is as follows:
1) where Sxy, or covariance, is the sum of all x values minus the mean of all x values
multiplied by the sum of all y values minus the mean of all y values
2) where SxSy is the square root of the covariance of the x values squared multiplied by
the covariance of the y values squared
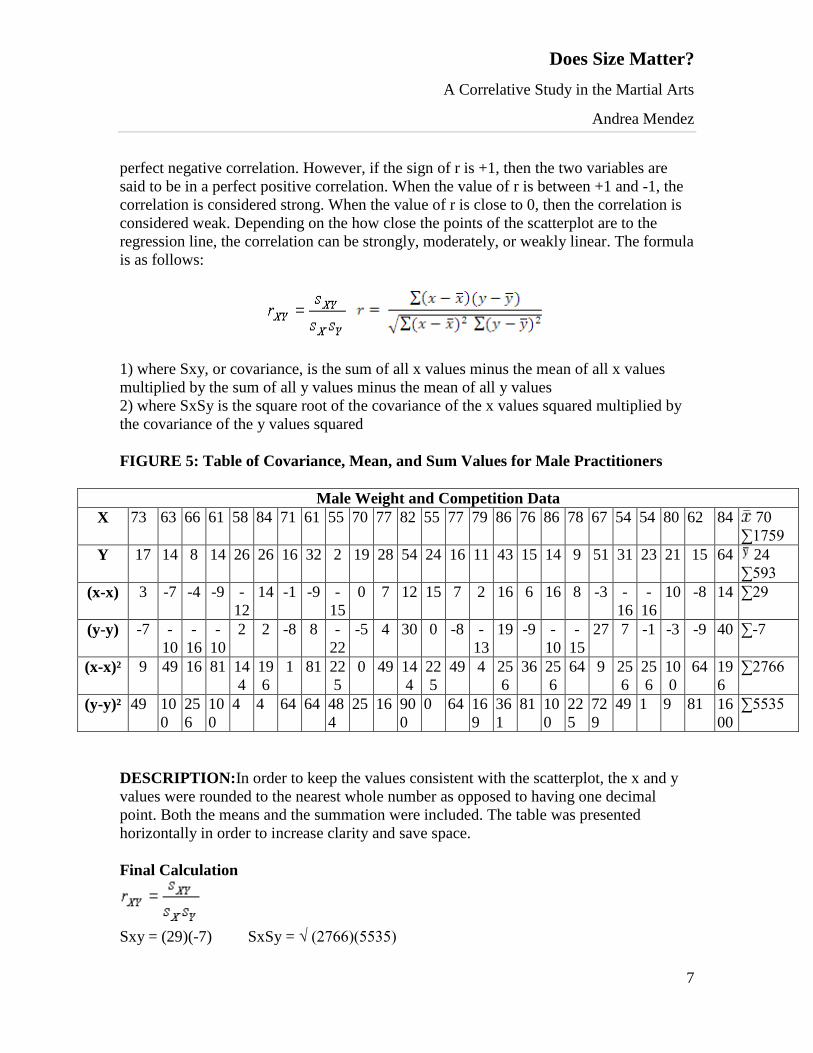
FIGURE 5: Table of Covariance, Mean, and Sum Values for Male Practitioners
Male Weight and Competition Data
X 73 63 66 61 58 84 71 61 55 70 77 82 55 77 79 86 76 86 78 67 54 54 80 62 84 70
∑1759
Y 17 14 8 14 26 26 16 32 2 19 28 54 24 16 11 43 15 14 9 51 31 23 21 15 64 24
∑593
(x-x) 3 -7 -4 -9 -
12
14 -1 -9 -
15
0 7 12 15 7 2 16 6 16 8 -3 -
16
-
16
10 -8 14 ∑29
(y-y) -7 -
10
-
16
-
10
2 2 -8 8 -
22
-5 4 30 0 -8 -
13
19 -9 -
10
-
15
27 7 -1 -3 -9 40 ∑-7
(x-x)² 9 49 16 81 14
4
19
6
1 81 22
5
0 49 14
4
22
5
49 4 25
6
36 25
6
64 9 25
6
25
6
10
0
64 19
6
∑2766
(y-y)² 49 10
0
25
6
10
0
4 4 64 64 48
4
25 16 90
0
0 64 16
9
36
1
81 10
0
22
5
72
9
49 1 9 81 16
00
∑5535
DESCRIPTION:In order to keep the values consistent with the scatterplot, the x and y
values were rounded to the nearest whole number as opposed to having one decimal
point. Both the means and the summation were included. The table was presented
horizontally in order to increase clarity and save space.
Final Calculation
Sxy = (29)(-7) SxSy = √ (2766)(5535)
Does Size Matter?
A Correlative Study in the Martial Arts
Andrea Mendez
8
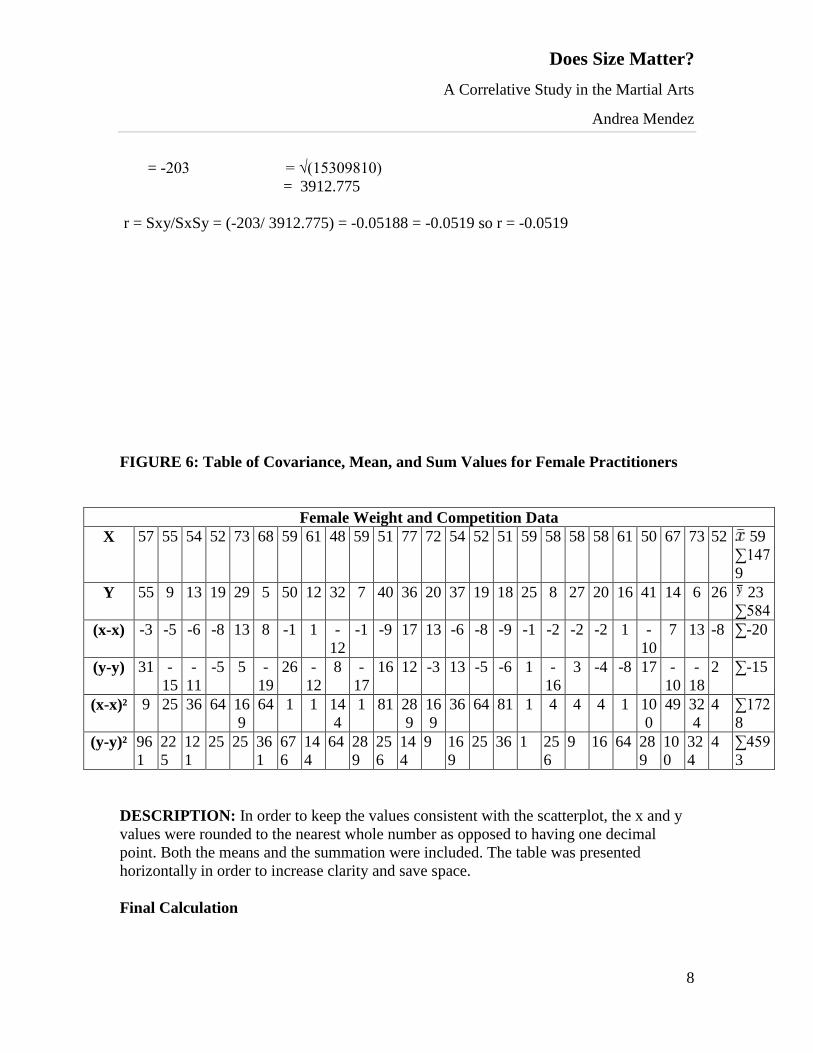
= -203 = √(15309810)
= 3912.775
r = Sxy/SxSy = (-203/ 3912.775) = -0.05188 = -0.0519 so r = -0.0519
FIGURE 6: Table of Covariance, Mean, and Sum Values for Female Practitioners
Female Weight and Competition Data
X 57 55 54 52 73 68 59 61 48 59 51 77 72 54 52 51 59 58 58 58 61 50 67 73 52 59
∑147
9
Y 55 9 13 19 29 5 50 12 32 7 40 36 20 37 19 18 25 8 27 20 16 41 14 6 26 23
∑584
(x-x) -3 -5 -6 -8 13 8 -1 1 -
12
-1 -9 17 13 -6 -8 -9 -1 -2 -2 -2 1 -
10
7 13 -8 ∑-20
(y-y) 31 -
15
-
11
-5 5 -
19
26 -
12
8 -
17
16 12 -3 13 -5 -6 1 -
16
3 -4 -8 17 -
10
-
18
2 ∑-15
(x-x)² 9 25 36 64 16
9
64 1 1 14
4
1 81 28
9
16
9
36 64 81 1 4 4 4 1 10
0
49 32
4
4 ∑172
8
(y-y)² 96
1
22
5
12
1
25 25 36
1
67
6
14
4
64 28
9
25
6
14
4
9 16
9
25 36 1 25
6
9 16 64 28
9
10
0
32
4
4 ∑459
3
DESCRIPTION: In order to keep the values consistent with the scatterplot, the x and y
values were rounded to the nearest whole number as opposed to having one decimal
point. Both the means and the summation were included. The table was presented
horizontally in order to increase clarity and save space.
Final Calculation
Does Size Matter?
A Correlative Study in the Martial Arts
Andrea Mendez
9
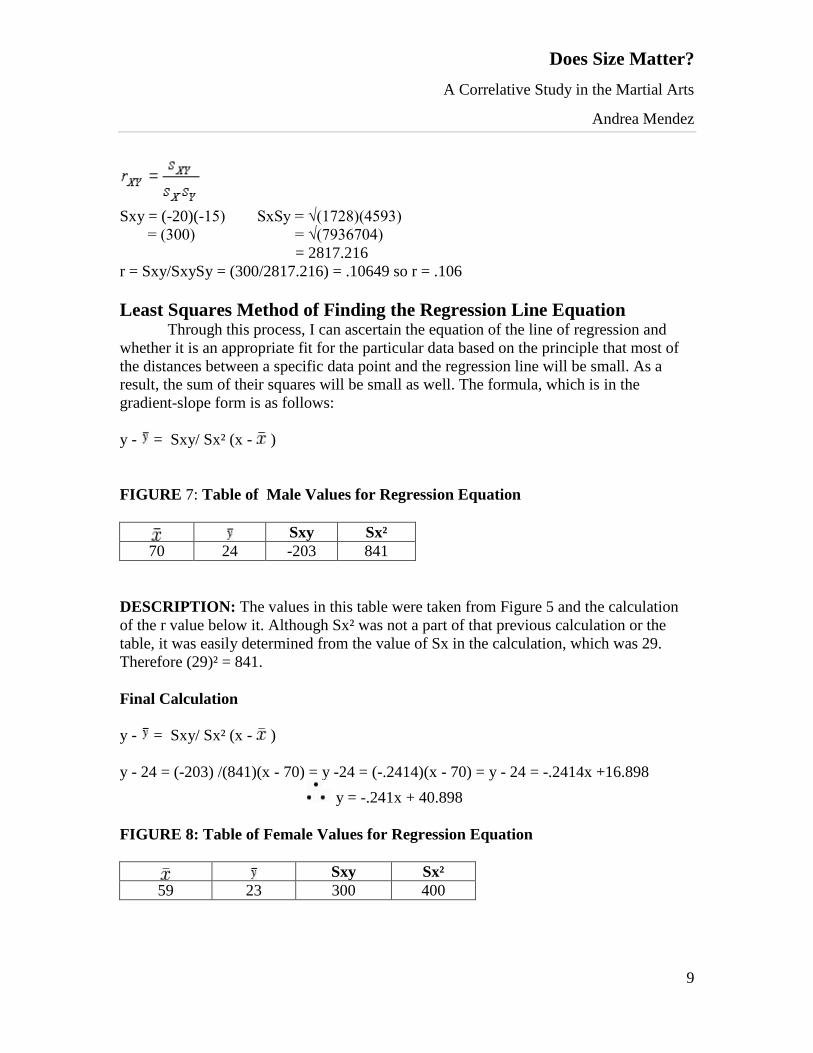
Sxy = (-20)(-15) SxSy = √(1728)(4593)
= (300) = √(7936704)
= 2817.216
r = Sxy/SxySy = (300/2817.216) = .10649 so r = .106
Least Squares Method of Finding the Regression Line Equation Through this process, I can ascertain the equation of the line of regression and
whether it is an appropriate fit for the particular data based on the principle that most of
the distances between a specific data point and the regression line will be small. As a
result, the sum of their squares will be small as well. The formula, which is in the
gradient-slope form is as follows:
y - = Sxy/ Sx² (x - )
FIGURE 7: Table of Male Values for Regression Equation
Sxy Sx²
70 24 -203 841
DESCRIPTION: The values in this table were taken from Figure 5 and the calculation
of the r value below it. Although Sx² was not a part of that previous calculation or the
table, it was easily determined from the value of Sx in the calculation, which was 29.
Therefore (29)² = 841.
Final Calculation
y - = Sxy/ Sx² (x - )
y - 24 = (-203) /(841)(x - 70) = y -24 = (-.2414)(x - 70) = y - 24 = -.2414x +16.898
y = -.241x + 40.898
FIGURE 8: Table of Female Values for Regression Equation
Sxy Sx²
59 23 300 400
Does Size Matter?
A Correlative Study in the Martial Arts
Andrea Mendez
10
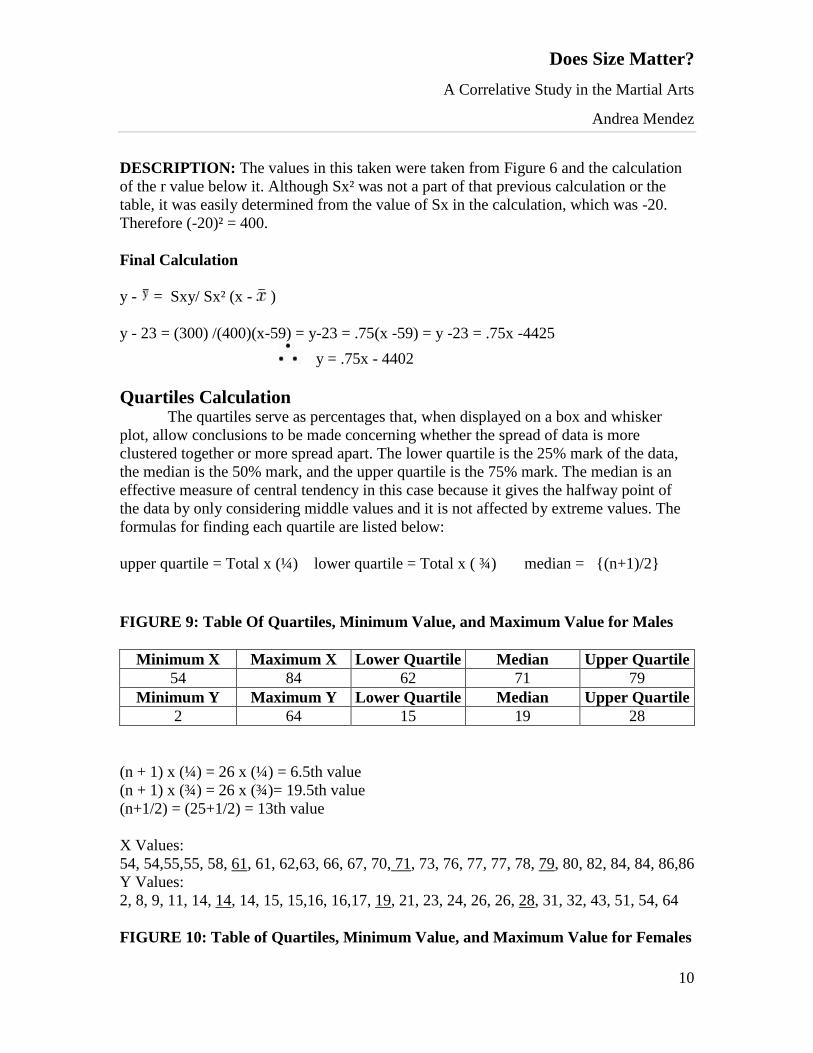
DESCRIPTION: The values in this taken were taken from Figure 6 and the calculation
of the r value below it. Although Sx² was not a part of that previous calculation or the
table, it was easily determined from the value of Sx in the calculation, which was -20.
Therefore (-20)² = 400.
Final Calculation
y - = Sxy/ Sx² (x - )
y - 23 = (300) /(400)(x-59) = y-23 = .75(x -59) = y -23 = .75x -4425
y = .75x - 4402
Quartiles Calculation The quartiles serve as percentages that, when displayed on a box and whisker
plot, allow conclusions to be made concerning whether the spread of data is more
clustered together or more spread apart. The lower quartile is the 25% mark of the data,
the median is the 50% mark, and the upper quartile is the 75% mark. The median is an
effective measure of central tendency in this case because it gives the halfway point of
the data by only considering middle values and it is not affected by extreme values. The
formulas for finding each quartile are listed below:
upper quartile = Total x (¼) lower quartile = Total x ( ¾) median = {(n+1)/2}
FIGURE 9: Table Of Quartiles, Minimum Value, and Maximum Value for Males
Minimum X Maximum X Lower Quartile Median Upper Quartile
54 84 62 71 79
Minimum Y Maximum Y Lower Quartile Median Upper Quartile
2 64 15 19 28
(n + 1) x (¼) = 26 x (¼) = 6.5th value
(n + 1) x (¾) = 26 x (¾)= 19.5th value
(n+1/2) = (25+1/2) = 13th value
X Values:
54, 54,55,55, 58, 61, 61, 62,63, 66, 67, 70, 71, 73, 76, 77, 77, 78, 79, 80, 82, 84, 84, 86,86
Y Values:
2, 8, 9, 11, 14, 14, 14, 15, 15,16, 16,17, 19, 21, 23, 24, 26, 26, 28, 31, 32, 43, 51, 54, 64
FIGURE 10: Table of Quartiles, Minimum Value, and Maximum Value for Females

Does Size Matter?
A Correlative Study in the Martial Arts
Andrea Mendez
11
Minimum X Maximum X Lower Quartile Median Upper Quartile
47 77 53 58 61
Minimum Y Maximum Y Lower Quartile Median Upper Quartile
5 55 13 20 32
(n + 1) x (¼) = 26 x (¼) = 6.5th value
(n + 1) x (¾) = 26 x (¾)= 19.5th value
(n+1/2) = (25+1/2) = 13th value
X Values:
48, 50,51, 51, 52, 52, 52, 54, 54, 55, 57, 58, 58, 58, 59, 59, 59, 61, 61, 67,68,72,73,73,77
Y Values:
5, 6, 7,8,9, 12,13,14,16, 19, 18,19, 20, 20,25,26,27,29,32, 36,37, 40, 41, 50, 55
FIGURE 11: Box Plot for Male X (Weight) Values
DESCRIPTION: Due to the inability of both the GDC and graph-making programs to
show labels on their generated box plots, I opted for the traditional method of hand-
drawn graphs and proceeded to take a picture of each. The same is true for the following
box plots. In this particular box and whisker plot, the distribution imitates that of a
perfect bell curve with symmetrical distribution, with the values being more clustered
together.
FIGURE 12: Box Plot for Male Y (Competition) Values

Does Size Matter?
A Correlative Study in the Martial Arts
Andrea Mendez
12
DESCRIPTION: The distribution of this graph is positively skewed, with the majority
of the number of competitions tending toward the higher values. However, the mean is
much nearer to the lower quartile than the upper quartile.
FIGURE 13: Box Plot for Female X (Weight) Values
DESCRIPTION: Similar to the male weights, the female weights remained clustered
together, however a slight positive skew is evident from the mean’s proximity to the
upper quartile and the larger amount of weights tending toward the higher values.
FIGURE 14: Box Plot for Female Y (Competition) Values
DESCRIPTION: This quartiles on this graph were more spread apart than on the others.
The positive skew is again evident and the scale in increments of 5 applies well as in
Figure 12.
Does Size Matter?
A Correlative Study in the Martial Arts
Andrea Mendez
13
INTERPRETATION AND VALIDITY
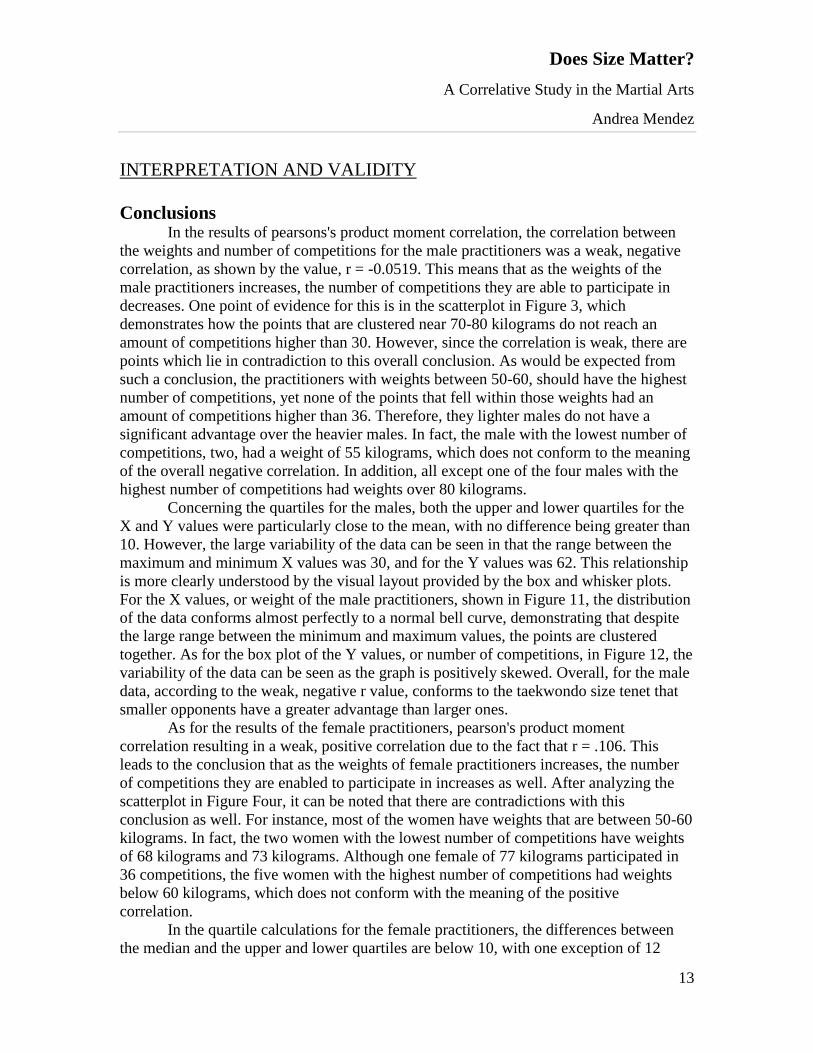
Conclusions In the results of pearsons's product moment correlation, the correlation between
the weights and number of competitions for the male practitioners was a weak, negative
correlation, as shown by the value, r = -0.0519. This means that as the weights of the
male practitioners increases, the number of competitions they are able to participate in
decreases. One point of evidence for this is in the scatterplot in Figure 3, which
demonstrates how the points that are clustered near 70-80 kilograms do not reach an
amount of competitions higher than 30. However, since the correlation is weak, there are
points which lie in contradiction to this overall conclusion. As would be expected from
such a conclusion, the practitioners with weights between 50-60, should have the highest
number of competitions, yet none of the points that fell within those weights had an
amount of competitions higher than 36. Therefore, they lighter males do not have a
significant advantage over the heavier males. In fact, the male with the lowest number of
competitions, two, had a weight of 55 kilograms, which does not conform to the meaning
of the overall negative correlation. In addition, all except one of the four males with the
highest number of competitions had weights over 80 kilograms.
Concerning the quartiles for the males, both the upper and lower quartiles for the
X and Y values were particularly close to the mean, with no difference being greater than
10. However, the large variability of the data can be seen in that the range between the
maximum and minimum X values was 30, and for the Y values was 62. This relationship
is more clearly understood by the visual layout provided by the box and whisker plots.
For the X values, or weight of the male practitioners, shown in Figure 11, the distribution
of the data conforms almost perfectly to a normal bell curve, demonstrating that despite
the large range between the minimum and maximum values, the points are clustered
together. As for the box plot of the Y values, or number of competitions, in Figure 12, the
variability of the data can be seen as the graph is positively skewed. Overall, for the male
data, according to the weak, negative r value, conforms to the taekwondo size tenet that
smaller opponents have a greater advantage than larger ones.
As for the results of the female practitioners, pearson's product moment
correlation resulting in a weak, positive correlation due to the fact that r = .106. This
leads to the conclusion that as the weights of female practitioners increases, the number
of competitions they are enabled to participate in increases as well. After analyzing the
scatterplot in Figure Four, it can be noted that there are contradictions with this
conclusion as well. For instance, most of the women have weights that are between 50-60
kilograms. In fact, the two women with the lowest number of competitions have weights
of 68 kilograms and 73 kilograms. Although one female of 77 kilograms participated in
36 competitions, the five women with the highest number of competitions had weights
below 60 kilograms, which does not conform with the meaning of the positive
correlation.
In the quartile calculations for the female practitioners, the differences between
the median and the upper and lower quartiles are below 10, with one exception of 12
Does Size Matter?
A Correlative Study in the Martial Arts
Andrea Mendez
14
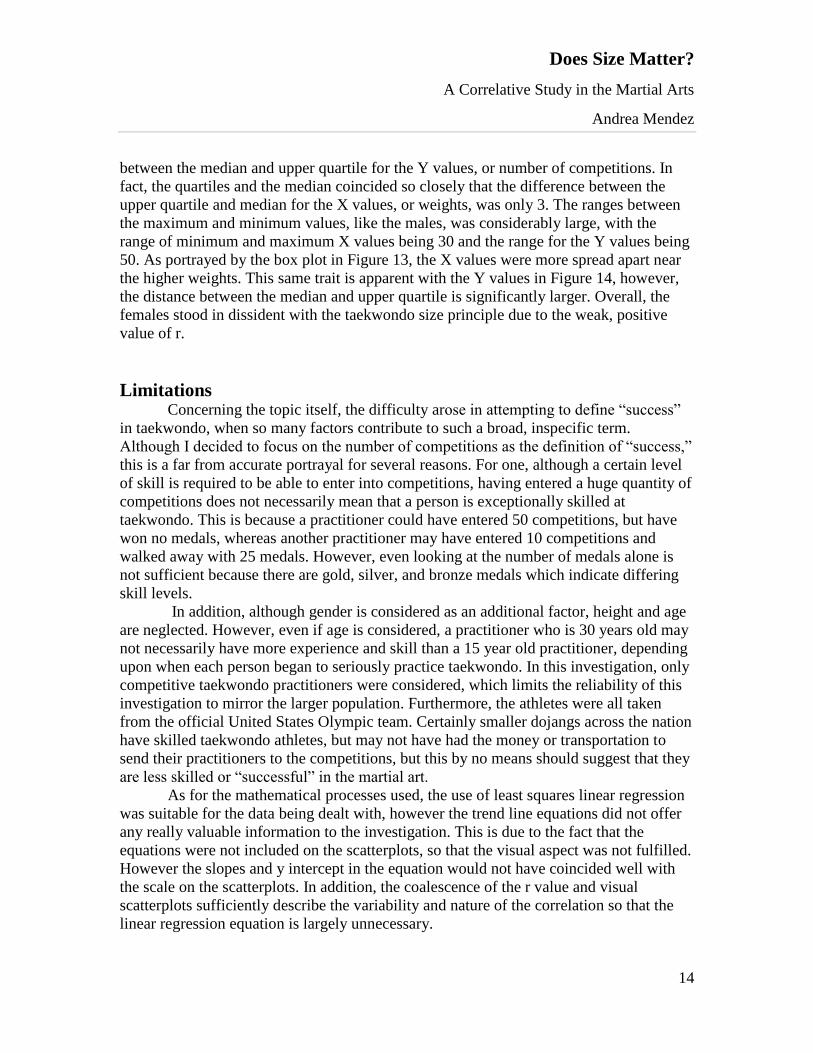
between the median and upper quartile for the Y values, or number of competitions. In
fact, the quartiles and the median coincided so closely that the difference between the
upper quartile and median for the X values, or weights, was only 3. The ranges between
the maximum and minimum values, like the males, was considerably large, with the
range of minimum and maximum X values being 30 and the range for the Y values being
50. As portrayed by the box plot in Figure 13, the X values were more spread apart near
the higher weights. This same trait is apparent with the Y values in Figure 14, however,
the distance between the median and upper quartile is significantly larger. Overall, the
females stood in dissident with the taekwondo size principle due to the weak, positive
value of r.
Limitations Concerning the topic itself, the difficulty arose in attempting to define “success”
in taekwondo, when so many factors contribute to such a broad, inspecific term.
Although I decided to focus on the number of competitions as the definition of “success,”
this is a far from accurate portrayal for several reasons. For one, although a certain level
of skill is required to be able to enter into competitions, having entered a huge quantity of
competitions does not necessarily mean that a person is exceptionally skilled at
taekwondo. This is because a practitioner could have entered 50 competitions, but have
won no medals, whereas another practitioner may have entered 10 competitions and
walked away with 25 medals. However, even looking at the number of medals alone is
not sufficient because there are gold, silver, and bronze medals which indicate differing
skill levels.
In addition, although gender is considered as an additional factor, height and age
are neglected. However, even if age is considered, a practitioner who is 30 years old may
not necessarily have more experience and skill than a 15 year old practitioner, depending
upon when each person began to seriously practice taekwondo. In this investigation, only
competitive taekwondo practitioners were considered, which limits the reliability of this
investigation to mirror the larger population. Furthermore, the athletes were all taken
from the official United States Olympic team. Certainly smaller dojangs across the nation
have skilled taekwondo athletes, but may not have had the money or transportation to
send their practitioners to the competitions, but this by no means should suggest that they
are less skilled or “successful” in the martial art.
As for the mathematical processes used, the use of least squares linear regression
was suitable for the data being dealt with, however the trend line equations did not offer
any really valuable information to the investigation. This is due to the fact that the
equations were not included on the scatterplots, so that the visual aspect was not fulfilled.
However the slopes and y intercept in the equation would not have coincided well with
the scale on the scatterplots. In addition, the coalescence of the r value and visual
scatterplots sufficiently describe the variability and nature of the correlation so that the
linear regression equation is largely unnecessary.
Does Size Matter?
A Correlative Study in the Martial Arts
Andrea Mendez
15
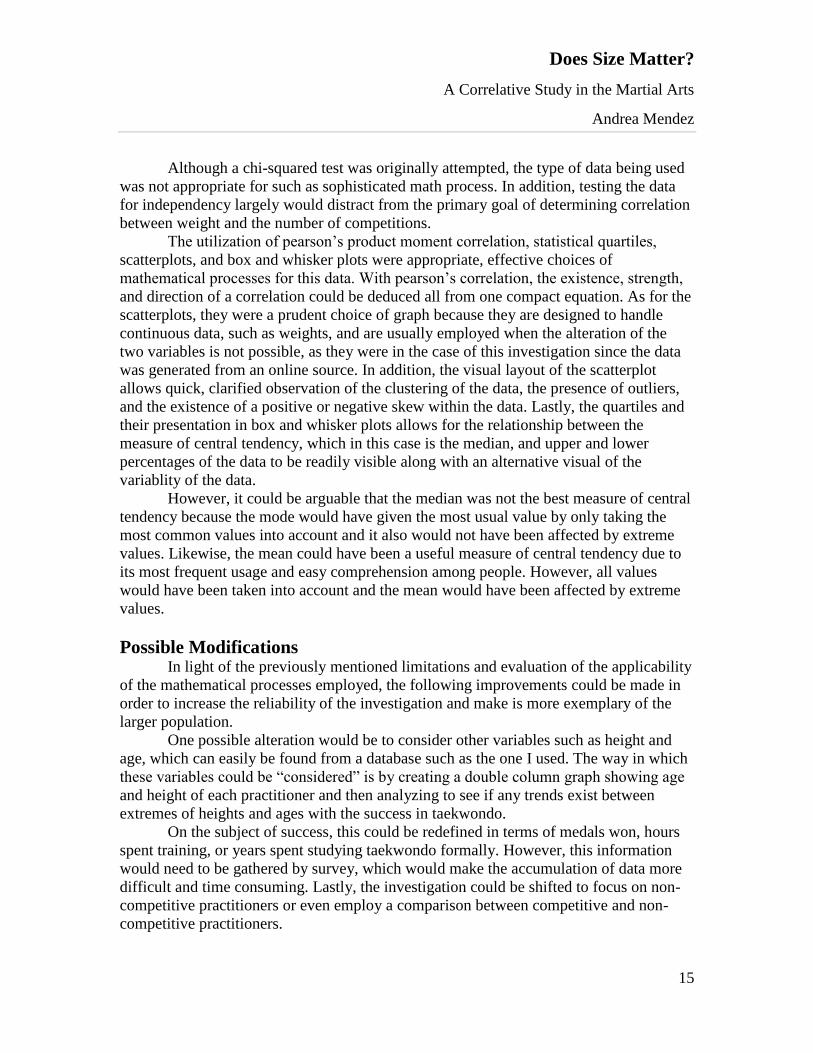
Although a chi-squared test was originally attempted, the type of data being used
was not appropriate for such as sophisticated math process. In addition, testing the data
for independency largely would distract from the primary goal of determining correlation
between weight and the number of competitions.
The utilization of pearson’s product moment correlation, statistical quartiles,
scatterplots, and box and whisker plots were appropriate, effective choices of
mathematical processes for this data. With pearson’s correlation, the existence, strength,
and direction of a correlation could be deduced all from one compact equation. As for the
scatterplots, they were a prudent choice of graph because they are designed to handle
continuous data, such as weights, and are usually employed when the alteration of the
two variables is not possible, as they were in the case of this investigation since the data
was generated from an online source. In addition, the visual layout of the scatterplot
allows quick, clarified observation of the clustering of the data, the presence of outliers,
and the existence of a positive or negative skew within the data. Lastly, the quartiles and
their presentation in box and whisker plots allows for the relationship between the
measure of central tendency, which in this case is the median, and upper and lower
percentages of the data to be readily visible along with an alternative visual of the
variablity of the data.
However, it could be arguable that the median was not the best measure of central
tendency because the mode would have given the most usual value by only taking the
most common values into account and it also would not have been affected by extreme
values. Likewise, the mean could have been a useful measure of central tendency due to
its most frequent usage and easy comprehension among people. However, all values
would have been taken into account and the mean would have been affected by extreme
values.
Possible Modifications In light of the previously mentioned limitations and evaluation of the applicability
of the mathematical processes employed, the following improvements could be made in
order to increase the reliability of the investigation and make is more exemplary of the
larger population.
One possible alteration would be to consider other variables such as height and
age, which can easily be found from a database such as the one I used. The way in which
these variables could be “considered” is by creating a double column graph showing age
and height of each practitioner and then analyzing to see if any trends exist between
extremes of heights and ages with the success in taekwondo.
On the subject of success, this could be redefined in terms of medals won, hours
spent training, or years spent studying taekwondo formally. However, this information
would need to be gathered by survey, which would make the accumulation of data more
difficult and time consuming. Lastly, the investigation could be shifted to focus on non-
competitive practitioners or even employ a comparison between competitive and non-
competitive practitioners.

Does Size Matter?
A Correlative Study in the Martial Arts
Andrea Mendez
16
Even so, no combination of modifications can be conjured that will completely
evaluate a practitioner’s success. However, these modifications can serve to evaluate the
proficiency of a practitioner in certain, specific areas of the martial art.