Comparison of PCR primer-based strategies for characterization of ammonia oxidizer communities in...
12
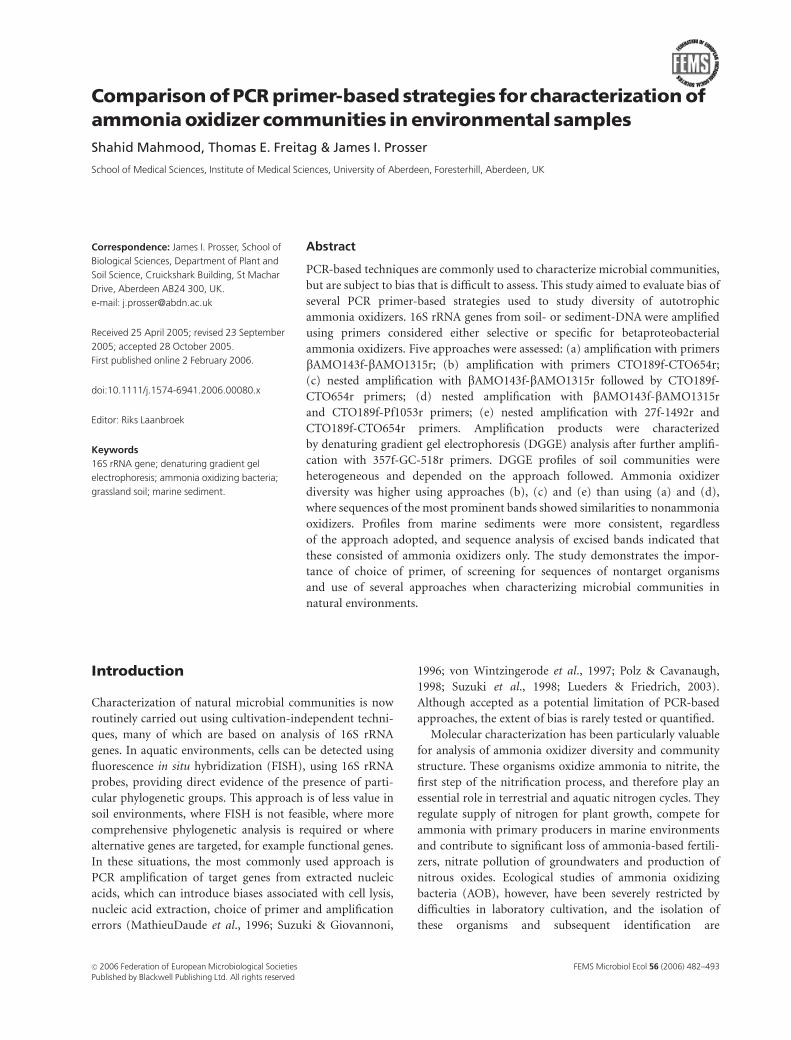
Comparison of PCR primer-based strategies for characterization of ammonia oxidizer communities in environmental samples Shahid Mahmood, Thomas E. Freitag & James I. Prosser School of Medical Sciences, Institute of Medical Sciences, University of Aberdeen, Foresterhill, Aberdeen, UK Correspondence: James I. Prosser, School of Biological Sciences, Department of Plant and Soil Science, Cruickshark Building, St Machar Drive, Aberdeen AB24 300, UK. e-mail: [email protected] Received 25 April 2005; revised 23 September 2005; accepted 28 October 2005. First published online 2 February 2006. doi:10.1111/j.1574-6941.2006.00080.x Editor: Riks Laanbroek Keywords 16S rRNA gene; denaturing gradient gel electrophoresis; ammonia oxidizing bacteria; grassland soil; marine sediment. Abstract PCR-based techniques are commonly used to characterize microbial communities, but are subject to bias that is difficult to assess. This study aimed to evaluate bias of several PCR primer-based strategies used to study diversity of autotrophic ammonia oxidizers. 16S rRNA genes from soil- or sediment-DNA were amplified using primers considered either selective or specific for betaproteobacterial ammonia oxidizers. Five approaches were assessed: (a) amplification with primers bAMO143f-bAMO1315r; (b) amplification with primers CTO189f-CTO654r; (c) nested amplification with bAMO143f-bAMO1315r followed by CTO189f- CTO654r primers; (d) nested amplification with bAMO143f-bAMO1315r and CTO189f-Pf1053r primers; (e) nested amplification with 27f-1492r and CTO189f-CTO654r primers. Amplification products were characterized by denaturing gradient gel electrophoresis (DGGE) analysis after further amplifi- cation with 357f-GC-518r primers. DGGE profiles of soil communities were heterogeneous and depended on the approach followed. Ammonia oxidizer diversity was higher using approaches (b), (c) and (e) than using (a) and (d), where sequences of the most prominent bands showed similarities to nonammonia oxidizers. Profiles from marine sediments were more consistent, regardless of the approach adopted, and sequence analysis of excised bands indicated that these consisted of ammonia oxidizers only. The study demonstrates the impor- tance of choice of primer, of screening for sequences of nontarget organisms and use of several approaches when characterizing microbial communities in natural environments. Introduction Characterization of natural microbial communities is now routinely carried out using cultivation-independent techni- ques, many of which are based on analysis of 16S rRNA genes. In aquatic environments, cells can be detected using fluorescence in situ hybridization (FISH), using 16S rRNA probes, providing direct evidence of the presence of parti- cular phylogenetic groups. This approach is of less value in soil environments, where FISH is not feasible, where more comprehensive phylogenetic analysis is required or where alternative genes are targeted, for example functional genes. In these situations, the most commonly used approach is PCR amplification of target genes from extracted nucleic acids, which can introduce biases associated with cell lysis, nucleic acid extraction, choice of primer and amplification errors (MathieuDaude et al., 1996; Suzuki & Giovannoni, 1996; von Wintzingerode et al., 1997; Polz & Cavanaugh, 1998; Suzuki et al., 1998; Lueders & Friedrich, 2003). Although accepted as a potential limitation of PCR-based approaches, the extent of bias is rarely tested or quantified. Molecular characterization has been particularly valuable for analysis of ammonia oxidizer diversity and community structure. These organisms oxidize ammonia to nitrite, the first step of the nitrification process, and therefore play an essential role in terrestrial and aquatic nitrogen cycles. They regulate supply of nitrogen for plant growth, compete for ammonia with primary producers in marine environments and contribute to significant loss of ammonia-based fertili- zers, nitrate pollution of groundwaters and production of nitrous oxides. Ecological studies of ammonia oxidizing bacteria (AOB), however, have been severely restricted by difficulties in laboratory cultivation, and the isolation of these organisms and subsequent identification are FEMS Microbiol Ecol 56 (2006) 482–493 c 2006 Federation of European Microbiological Societies Published by Blackwell Publishing Ltd. All rights reserved
-
Upload
independent -
Category
Documents
-
view
0 -
download
0
Transcript of Comparison of PCR primer-based strategies for characterization of ammonia oxidizer communities in...
ComparisonofPCRprimer-based strategies for characterizationofammonia oxidizer communities in environmental samplesShahid Mahmood, Thomas E. Freitag & James I. Prosser
School of Medical Sciences, Institute of Medical Sciences, University of Aberdeen, Foresterhill, Aberdeen, UK
Correspondence: James I. Prosser, School of
Biological Sciences, Department of Plant and
Soil Science, Cruickshark Building, St Machar
Drive, Aberdeen AB24 300, UK.
e-mail: [email protected]
Received 25 April 2005; revised 23 September
2005; accepted 28 October 2005.
First published online 2 February 2006.
doi:10.1111/j.1574-6941.2006.00080.x
Editor: Riks Laanbroek
Keywords
16S rRNA gene; denaturing gradient gel
electrophoresis; ammonia oxidizing bacteria;
grassland soil; marine sediment.
Abstract
PCR-based techniques are commonly used to characterize microbial communities,
but are subject to bias that is difficult to assess. This study aimed to evaluate bias of
several PCR primer-based strategies used to study diversity of autotrophic
ammonia oxidizers. 16S rRNA genes from soil- or sediment-DNA were amplified
using primers considered either selective or specific for betaproteobacterial
ammonia oxidizers. Five approaches were assessed: (a) amplification with primers
bAMO143f-bAMO1315r; (b) amplification with primers CTO189f-CTO654r;
(c) nested amplification with bAMO143f-bAMO1315r followed by CTO189f-
CTO654r primers; (d) nested amplification with bAMO143f-bAMO1315r
and CTO189f-Pf1053r primers; (e) nested amplification with 27f-1492r and
CTO189f-CTO654r primers. Amplification products were characterized
by denaturing gradient gel electrophoresis (DGGE) analysis after further amplifi-
cation with 357f-GC-518r primers. DGGE profiles of soil communities were
heterogeneous and depended on the approach followed. Ammonia oxidizer
diversity was higher using approaches (b), (c) and (e) than using (a) and (d),
where sequences of the most prominent bands showed similarities to nonammonia
oxidizers. Profiles from marine sediments were more consistent, regardless
of the approach adopted, and sequence analysis of excised bands indicated that
these consisted of ammonia oxidizers only. The study demonstrates the impor-
tance of choice of primer, of screening for sequences of nontarget organisms
and use of several approaches when characterizing microbial communities in
natural environments.
Introduction
Characterization of natural microbial communities is now
routinely carried out using cultivation-independent techni-
ques, many of which are based on analysis of 16S rRNA
genes. In aquatic environments, cells can be detected using
fluorescence in situ hybridization (FISH), using 16S rRNA
probes, providing direct evidence of the presence of parti-
cular phylogenetic groups. This approach is of less value in
soil environments, where FISH is not feasible, where more
comprehensive phylogenetic analysis is required or where
alternative genes are targeted, for example functional genes.
In these situations, the most commonly used approach is
PCR amplification of target genes from extracted nucleic
acids, which can introduce biases associated with cell lysis,
nucleic acid extraction, choice of primer and amplification
errors (MathieuDaude et al., 1996; Suzuki & Giovannoni,
1996; von Wintzingerode et al., 1997; Polz & Cavanaugh,
1998; Suzuki et al., 1998; Lueders & Friedrich, 2003).
Although accepted as a potential limitation of PCR-based
approaches, the extent of bias is rarely tested or quantified.
Molecular characterization has been particularly valuable
for analysis of ammonia oxidizer diversity and community
structure. These organisms oxidize ammonia to nitrite, the
first step of the nitrification process, and therefore play an
essential role in terrestrial and aquatic nitrogen cycles. They
regulate supply of nitrogen for plant growth, compete for
ammonia with primary producers in marine environments
and contribute to significant loss of ammonia-based fertili-
zers, nitrate pollution of groundwaters and production of
nitrous oxides. Ecological studies of ammonia oxidizing
bacteria (AOB), however, have been severely restricted by
difficulties in laboratory cultivation, and the isolation of
these organisms and subsequent identification are
FEMS Microbiol Ecol 56 (2006) 482–493c� 2006 Federation of European Microbiological SocietiesPublished by Blackwell Publishing Ltd. All rights reserved
traditionally based on a limited number of phenotypic
characteristics. Several molecular approaches have been
developed for characterization of ammonia oxidizer com-
munities since the initial sequencing of several AOB 16S
rRNA genes (Head et al., 1993), and the design and applica-
tion of PCR primers for amplification of AOB targeting 16S
rRNA genes (McCaig et al., 1994). Several studies have also
employed analysis of ammonia oxidizer functional genes, in
particular amoA genes that encode ammonia monooxygen-
ase, but also hydroxylamine oxidoreductase and cytochrome
c-544 (Rotthauwe et al., 1997; Bruns et al., 1998). 16S rRNA
gene-based analysis of AOB has been facilitated by the
observation that, with the exception of a few marine gam-
maproteobacterial strains, the majority of proteobacterial
AOB falls within a monophyletic group within the Betapro-
teobacteria. This has led to the design of a relatively large
number of probes, for FISH analysis, and primers, for PCR
amplification of 16S rRNA genes. These vary in the extent to
which they are inclusive of all known betaproteobacterial
AOB and are specific, excluding nonammonia oxidizers. The
specificity of the probe and primer sequences were compared
in (Purkhold et al., 2000), who concluded that the CTO
primers (Kowalchuk et al., 1997) are the most specific,
whereas the bAMO primers (McCaig et al., 1994) are the
most inclusive. Characterization of natural AOB commu-
nities by PCR amplification of 16S rRNA genes also involves
a range of approaches for the generation and analysis of PCR
products. These include direct and nested PCR amplifica-
tion, sequence analysis of representatives from clone libraries
and a number of fingerprinting techniques, most commonly
denaturing gradient gel electrophoresis (DGGE) (Muyzer
et al., 1993; Kowalchuk et al., 1997), but also temperature
gradient gel electrophoresis (TGGE) (Fouratt et al., 2003)
and single-strand conformation polymorphism (SSCP)
(Backman et al., 2003).
There is little information on the extent to which these
different approaches influence the outcome of environmen-
tal studies of AOB communities. The aim of this study was
to assess potential bias resulting from two different PCR
based approaches, direct and nested PCR amplification of
16S rRNA genes, using different combinations of AOB
‘specific’ primers. A final amplification step enabled direct
comparison of the different strategies on DGGE gels.
Although focusing on AOB, the findings are of relevance to
characterization of other bacterial groups using similar
approaches.
Materials and methods
Sampling of soil and marine sediments
Soil samples (top 8 cm depth) were collected from an
improved grassland soil at the Sourhope Research Station
located in the Borders region of Scotland (map reference NT
850 205). Further details of the vegetation cover, fertilizer
application and soil characteristics are given in (McCaig
et al., 1999). After sampling, soil was stored at 4 1C for 3 days
and passed through a 3.35-mm sieve to remove roots and
stones. Sediment samples were collected from Loch Duich, a
marine loch, located on the west coast of Scotland, from a
sediment core of 40 cm depth. Further details of the
sampling procedure are given in (Freitag & Prosser, 2003).
Before extraction of nucleic acids, the water content of
sediments was reduced to approximately 5% (w/v, weight
in volume) of the total water content by centrifugation at
16 000 g for 10 min. Soil and marine sediment samples were
stored at � 80 1C until extraction of DNA.
DNA extraction
DNA was extracted from 0.5 g soil or sediment samples
according to (Griffiths et al., 2000a). In brief, cells were lysed
for two cycles of 20 s with a Ribolyser cell disruptor (Hybaid
Ltd., Ashford, UK) at 4 m s�1 in 2 mL Blue Matrix Ribolyser
tubes (Hybaid Ltd.) containing 0.5 mL hexadecyltrimethyl-
ammonium bromide extraction buffer, 0.5 mL phenol-
chloroform–isoamyl alcohol [25 : 24 : 1 v/v (volume in
volume), pH 8.0] and ceramic and silica beads. Further
extraction and precipitation of nucleic acids involved re-
moval of phenol with an equal volume of chloroform–iso-
amyl alcohol (24 : 1) followed by precipitation from the
aqueous layer with two volumes of 30% (w/v) polyethylene
glycol 6000–1.6 M NaCl. Pelleted nucleic acids were washed
in ice-cold 70% (v/v) ethanol, air-dried and resuspended in
50 mL of RNase-free sterile water.
PCR amplification of 16S rRNA genes
16S rRNA gene amplification of extracted soil DNA was
achieved by PCR using primers considered to be either
inclusive of or specific for betaproteobacterial AOB using
five approaches (Table 1). Two involved direct amplification
using primer sets bAMO143f-bAMO1315r (McCaig et al.,
1994) or CTO189f-CTO654r (Kowalchuk et al., 1997).
bAMO143f-bAMO1315r primers amplify all known beta-
proteobacterial ammonia oxidizer sequences but can also
amplify closely related nonammonia oxidizer sequences.
CTO189f-CTO654r primers are specific for all known
betaproteobacterial ammonia oxidizers, with the exception
of some members of the Nitrosomonas oligotropha cluster
and with several mismatches with the Nitrosomonas com-
munis cluster. The remaining three approaches involved
nested PCR amplification with first round amplification
using bAMO143f-bAMO1315r or 1492r-27f (Lane, 1991)
primers, the latter comprising universal bacterial primers.
Secondary amplification was carried out using either
CTO189f-CTO654r or CTO189f in conjunction with the
FEMS Microbiol Ecol 56 (2006) 482–493 c� 2006 Federation of European Microbiological SocietiesPublished by Blackwell Publishing Ltd. All rights reserved
483Strategies for characterization of ammonia oxidizers
general bacterial primer Pf1053r (Edwards et al., 1989).
Amplification products generated by each of these ap-
proaches were characterized by DGGE analysis after a final
PCR amplification step with 357f-GC-518r primers (Muyzer
et al., 1993), which are not selective and are considered to be
universal bacterial primers. This final step generated a
161 bp 16S rRNA gene fragment and enabled comparison
of each approach following DGGE analysis. PCR amplifica-
tions were carried out in 50mL reaction volumes with a PCR
Express thermal cycler (Hybaid). The reaction mixture
contained 20 ng of template DNA, 0.2 mM of each primer,
1� PCR buffer (Bioline, London, UK), 250 mM each of
deoxynucleoside triphosphate, 1.5 mM MgCl2 (20 ng bovine
serum albumin was added to the primary PCR only) and 1 U
of BiotaqTM DNA polymerase (Bioline). The thermocycling
conditions for different primer sets are given in Table 2. PCR
amplification products were analysed by electrophoresis on
1% [weight in volume (w/v)] agarose gels and detected by
staining with ethidium bromide (Sambrook et al., 1989).
DGGE analysis
Denaturing gradient gel electrophoresis analysis of PCR
products was carried out using the D-Code Universal
Mutation Detection System (Bio-Rad, Hemel Hempstead,
UK). Briefly, 8% polyacrylamide gels containing gradients of
30–60 or 40–60% denaturant were prepared using a
gradient maker (Fisher Scientific, Loughborough, UK).
A denaturing solution strength of 100% was defined as 7 M
urea and 40% formamide (McCaig et al., 2001). Gels were
run for 16 h at 75 V in 1� Tris-acetate EDTA buffer at a
constant temperature of 60 1C. Following electrophoresis,
the gels were silver-stained and scanned. Silver-staining of
DGGE gels involved incubation of the gel in fixing
solution (10% ethanol10.5% acetic acid) for 10 min
followed by incubation in silver nitrate solution (0.2% silver
nitrate dissolved in the fixing solution) for 10 min, three
washings in double-distilled water (ddH2O) for 3 min,
incubation in developing solution (10% KOH10.05% for-
maldehyde) for 10–15 min. Gels were scanned after removal
of solution and washing with ddH2O for 2 min, fixation and
incubation for 10 min and further rinsing with ddH2O for
5–10 min. This protocol for rapid silver-staining of DGGE
gels enabled subsequent reamplification of excised DGGE
bands and significantly reduced the time required for
staining.
Recovery and purification of DNA template fromDGGE bands
Most of the major and some of the minor or less intense
bands that were either common or specific to different
AOB approaches were excised for sequencing. To ascertain
that the selected bands that migrate to similar positions
have identical sequences, several bands were excised from
different lanes but with identical positions and subjected to
sequencing after purification. Based on the judgment
that the bands with identical migratory positions yield
identical sequences, 15 distinct bands were excised from
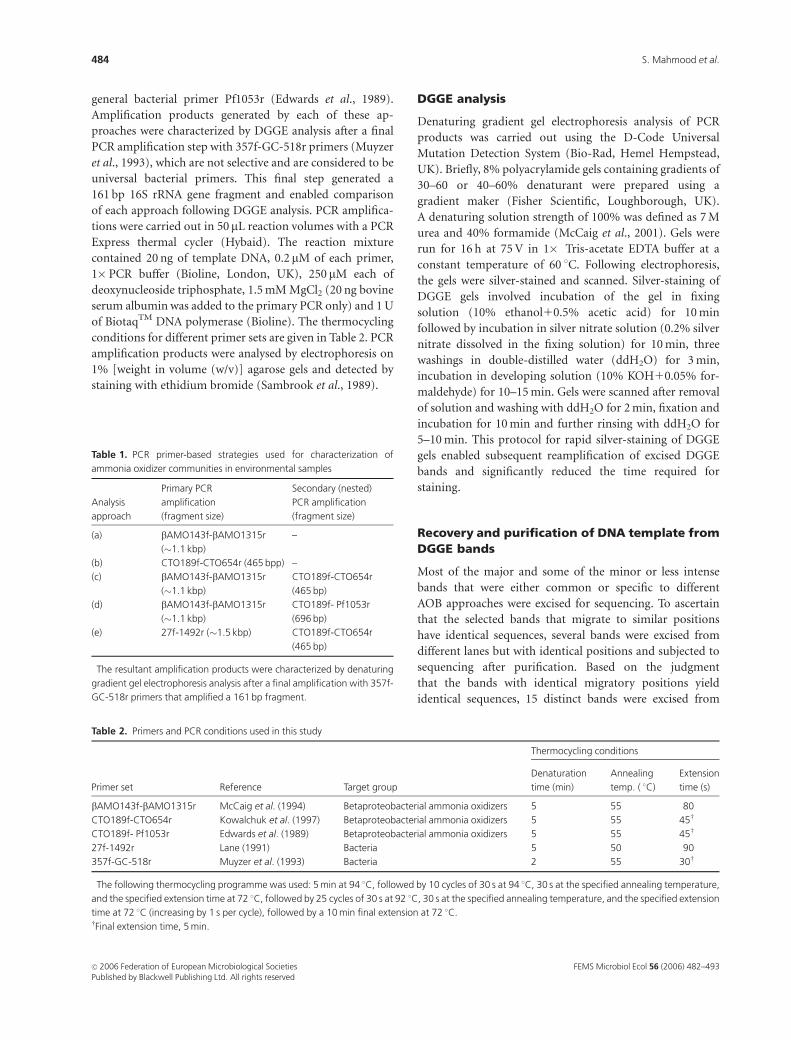
Table 2. Primers and PCR conditions used in this study
Primer set Reference Target group
Thermocycling conditions�
Denaturation
time (min)
Annealing
temp. ( 1C)
Extension
time (s)
bAMO143f-bAMO1315r McCaig et al. (1994) Betaproteobacterial ammonia oxidizers 5 55 80
CTO189f-CTO654r Kowalchuk et al. (1997) Betaproteobacterial ammonia oxidizers 5 55 45w
CTO189f- Pf1053r Edwards et al. (1989) Betaproteobacterial ammonia oxidizers 5 55 45w
27f-1492r Lane (1991) Bacteria 5 50 90
357f-GC-518r Muyzer et al. (1993) Bacteria 2 55 30w
�The following thermocycling programme was used: 5 min at 94 1C, followed by 10 cycles of 30 s at 94 1C, 30 s at the specified annealing temperature,
and the specified extension time at 72 1C, followed by 25 cycles of 30 s at 92 1C, 30 s at the specified annealing temperature, and the specified extension
time at 72 1C (increasing by 1 s per cycle), followed by a 10 min final extension at 72 1C.wFinal extension time, 5 min.
Table 1. PCR primer-based strategies used for characterization of
ammonia oxidizer communities in environmental samples
Analysis
approach�
Primary PCR
amplification
(fragment size)
Secondary (nested)
PCR amplification
(fragment size)
(a) bAMO143f-bAMO1315r
(�1.1 kbp)
–
(b) CTO189f-CTO654r (465 bpp) –
(c) bAMO143f-bAMO1315r
(�1.1 kbp)
CTO189f-CTO654r
(465 bp)
(d) bAMO143f-bAMO1315r
(�1.1 kbp)
CTO189f- Pf1053r
(696 bp)
(e) 27f-1492r (�1.5 kbp) CTO189f-CTO654r
(465 bp)
�The resultant amplification products were characterized by denaturing
gradient gel electrophoresis analysis after a final amplification with 357f-
GC-518r primers that amplified a 161 bp fragment.
FEMS Microbiol Ecol 56 (2006) 482–493c� 2006 Federation of European Microbiological SocietiesPublished by Blackwell Publishing Ltd. All rights reserved
484 S. Mahmood et al.
soil- and 11 from marine sediment-DGGE gels, respectively,
to cover most of the major and minor bands and to assist
unbiased comparisons between different AOB approaches.
DGGE bands of interest were excised with a sterile razor
and DNA was eluted by incubation of the crushed band
in 25 mL sterile ddH2O at 65 1C for 30 min, followed
by centrifugation at 5000 g for 1 min. The eluted DNA
(1mL) was used as template for PCR amplification with
primers 357f-GC-518r, under the conditions described
above, and the resultant amplified products were analysed
on an agarose gel to estimate product concentration. The
purity of amplification products was assessed by DGGE
analysis and, in most cases, products yielded several bands,
in addition to the band of interest, necessitating further
(typically 2–3) rounds of band excision, PCR amplification
and DGGE analysis to confirm purity. The migration
patterns of PCR products reamplified from excised bands
were verified by DGGE analysis and comparison with the
initial environmental PCR products on the same gel. Pur-
ified PCR products were subjected to a final cleaning step as
described by Boyle & Lew (1995).
DNA sequencing and phylogenetic analysis
Purified PCR products were sequenced with the 518r primer
(Muyzer et al., 1993) using the BigDye Terminator cycle-
sequencing kit (PE Biosystems, Warrington, UK) and
sequences were analysed using an ABI377 automated se-
quencer (PE Biosystems, UK). The BLASTN search tool
(Altschul et al., 1990) was used to determine sequence
homology and the most similar sequences in the GenBank
database. All 16S rRNA gene fragments have been deposited
in the GenBank database under accession numbers
AY958433 to AY958458.
Analysis of DGGE banding profiles
DGGE banding profiles were compared on the basis of
presence or absence of bands at certain positions in
each lane using PHORETIX 1D gel analysis software (version
4.0, Phoretix International, Newcastle upon Tyne, UK)
(McCaig et al., 2001). Binary similarity matrices were
produced using the Dice coefficient which allowed construc-
tion of dendrograms using the unweighted pairwise
grouping method with mathematical averages (UPGMA)
(Griffiths et al., 2000b; McCaig et al., 2001; Nicol et al.,
2003). In addition, comparisons based on DGGE bands
confirmed, by sequencing analysis, to be AOB were made
using PHORETIX 1D gel analysis software, and Sorenson’s
index of similarity (Sorensen, 1948) was used for pairwise
calculations of bands shared between PCR amplification
strategies.
Results
Analysis of soil ammonia oxidizer communities
No differences could be detected between DGGE profiles
obtained from triplicate soil samples generated by the same
amplification method and gels are therefore presented with
duplicates only (Fig. 1a). This enables comparison of profiles
on a single gel, avoiding consideration of variation between
gels. DGGE profiles of soil communities differed between
PCR approaches (Fig. 1a; Table 3). In general, the number of
shared bands, indicating different sequence types, was higher
in approaches (b), (c) and (e) than in approaches (a) and (d)
(Table 3). Sequence analysis of the excised bands indicated
that the community was composed mostly of uncultured
Nitrosospira spp. (Table 4). However, profiles generated by
methods (a) and (d) were dominated by three bands (S1–S3)
whose sequences were most closely related to the nonammo-
nia oxidizer Variovorax (Fig. 1, Table 4).
Qualitative and quantitative analyses confirmed simila-
rities in banding patterns between replicates and indicated
similarities between DGGE profiles generated by approaches
(a) and (d) and by approaches (b), (c) and (e) (Fig. 1b, Table
3). Both (a) and (d) involved primary PCR amplification
with bAMO143f-bAMO1315r primers, but secondary,
nested amplification using CTO189f-Pf1053r primers (ap-
proach (d)) had no significant effect on the number or
identity of the major bands in DGGE profiles. There was,
however, an increase in relative intensity of bands S5–S8 and
S15, suggesting some difference between the two ap-
proaches. Approaches (b), (c) and (e) involved amplifica-
tion with the complete CTO primer set and sequences of all
detectable bands were most closely related to AOB (Table 4),
demonstrating the specificity of these primers.
Identical DGGE profiles were generated by approaches
(c) and (e), which involved primary amplification by
bAMO143f-bAMO1315r or bacterial 27f-1492r primers,
respectively, and secondary amplification with CTO189f-
CTO654r primers. Bands S1 and S2 (Variovorax-like) were
absent in approaches (b), (c) and (e), whereas band S3
(Variovorax-like) decreased in relative intensity in approach
(c) and could not be seen in approaches (b) or (e) (Fig. 1a).
This suggests the effectiveness of CTO189f-CTO654r pri-
mers, when employed either for primary (b) or secondary
(c and e) PCR amplification of betaproteobacterial AOB.
However, approaches involving primary amplification by
bAMO143f-bAMO1315r primers also generated Vario-
vorax-like sequences. Bands S5 (Variovorax-like), S6 and S7
(Nitrosospira-like) could only be seen in approaches (a) and
(d) (Fig. 1a). This suggests a further difference in bias
between bAMO143f-bAMO1315r and CTO189f-CTO654r
primers. Although the former amplified Variovorax-like
strains (bands S1–S3 and S5) (potentially nonammonia
FEMS Microbiol Ecol 56 (2006) 482–493 c� 2006 Federation of European Microbiological SocietiesPublished by Blackwell Publishing Ltd. All rights reserved
485Strategies for characterization of ammonia oxidizers
oxidizers), they were able to amplify Nitrosospira-like strains
(bands S6 and S7) that otherwise could not be detected by
CTO189f-CTO654r primer-based strategies.
The relative intensity of band S8 (Nitrosospira-like strain)
was high in the CTO-based approaches (b)–(e) and extre-
mely low in approach (a), indicating that this particular
sequence type was present at relatively high abundance
within the AOB community, but at relatively low abundance
when compared with the Variovorax-like sequence types.
Bands S9, S10, S13 and S14 were only present in approaches
(b), (c) and (e) that employed CTO primers. Band S15
(Nitrosospira briensis-like sequence) was absent in approach
(a), probably as a result of low copy numbers compared to
Variovorax-like sequence types.
Analysis of marine ammonia oxidizercommunities
Reproducibility of DGGE profiles from triplicate marine
sediment samples was good, as for soil, and no differences
could be detected by visual comparison of migration
patterns. However, unlike soil samples, profiles were similar
for all amplification methods used (Fig. 2; Table 5). Closest
database matches for all sequences amplified from excised
bands were either cultivated ammonia oxidizers or environ-
mental clone sequences falling within the betaproteobacter-
ial ammonia oxidizer group, and there was no evidence of
sequences from nonammonia oxidizers (Table 6). Sequences
indicated that the AOB community consisted mainly of
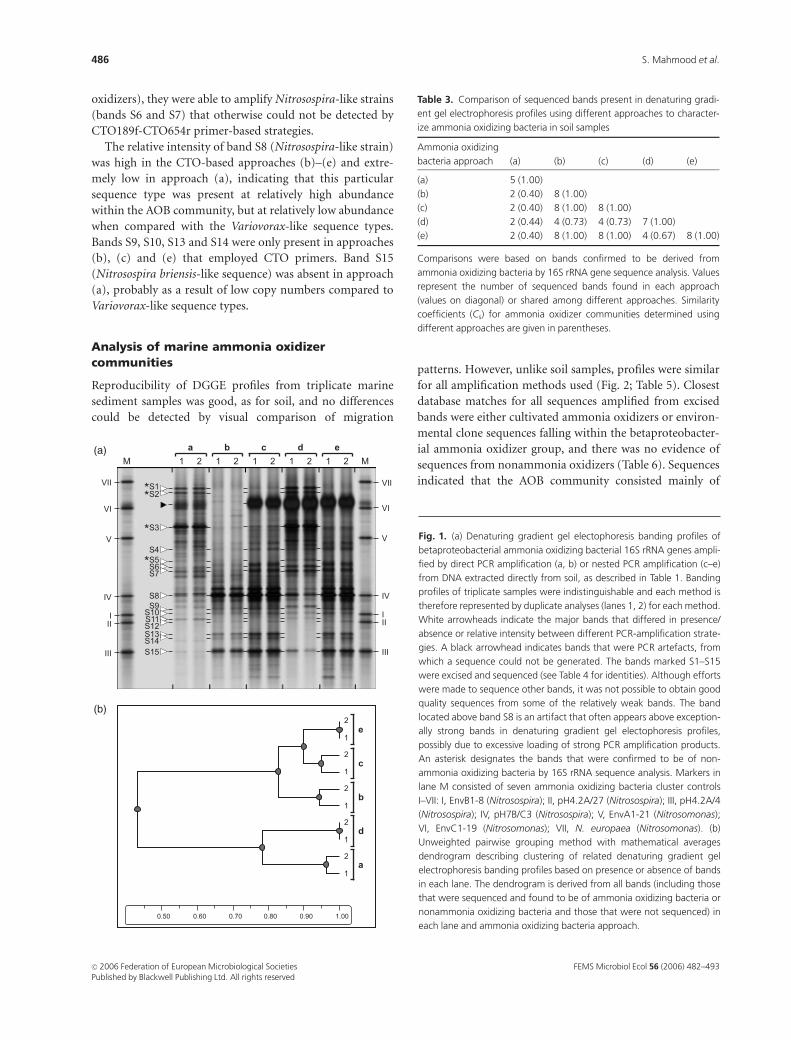
Fig. 1. (a) Denaturing gradient gel electophoresis banding profiles of
betaproteobacterial ammonia oxidizing bacterial 16S rRNA genes ampli-
fied by direct PCR amplification (a, b) or nested PCR amplification (c–e)
from DNA extracted directly from soil, as described in Table 1. Banding
profiles of triplicate samples were indistinguishable and each method is
therefore represented by duplicate analyses (lanes 1, 2) for each method.
White arrowheads indicate the major bands that differed in presence/
absence or relative intensity between different PCR-amplification strate-
gies. A black arrowhead indicates bands that were PCR artefacts, from
which a sequence could not be generated. The bands marked S1–S15
were excised and sequenced (see Table 4 for identities). Although efforts
were made to sequence other bands, it was not possible to obtain good
quality sequences from some of the relatively weak bands. The band
located above band S8 is an artifact that often appears above exception-
ally strong bands in denaturing gradient gel electophoresis profiles,
possibly due to excessive loading of strong PCR amplification products.
An asterisk designates the bands that were confirmed to be of non-
ammonia oxidizing bacteria by 16S rRNA sequence analysis. Markers in
lane M consisted of seven ammonia oxidizing bacteria cluster controls
I–VII: I, EnvB1-8 (Nitrosospira); II, pH4.2A/27 (Nitrosospira); III, pH4.2A/4
(Nitrosospira); IV, pH7B/C3 (Nitrosospira); V, EnvA1-21 (Nitrosomonas);
VI, EnvC1-19 (Nitrosomonas); VII, N. europaea (Nitrosomonas). (b)
Unweighted pairwise grouping method with mathematical averages
dendrogram describing clustering of related denaturing gradient gel
electrophoresis banding profiles based on presence or absence of bands
in each lane. The dendrogram is derived from all bands (including those
that were sequenced and found to be of ammonia oxidizing bacteria or
nonammonia oxidizing bacteria and those that were not sequenced) in
each lane and ammonia oxidizing bacteria approach.
Table 3. Comparison of sequenced bands present in denaturing gradi-
ent gel electrophoresis profiles using different approaches to character-
ize ammonia oxidizing bacteria in soil samples
Ammonia oxidizing
bacteria approach (a) (b) (c) (d) (e)
(a) 5 (1.00)
(b) 2 (0.40) 8 (1.00)
(c) 2 (0.40) 8 (1.00) 8 (1.00)
(d) 2 (0.44) 4 (0.73) 4 (0.73) 7 (1.00)
(e) 2 (0.40) 8 (1.00) 8 (1.00) 4 (0.67) 8 (1.00)
Comparisons were based on bands confirmed to be derived from
ammonia oxidizing bacteria by 16S rRNA gene sequence analysis. Values
represent the number of sequenced bands found in each approach
(values on diagonal) or shared among different approaches. Similarity
coefficients (Cs) for ammonia oxidizer communities determined using
different approaches are given in parentheses.
(a)
(b)
FEMS Microbiol Ecol 56 (2006) 482–493c� 2006 Federation of European Microbiological SocietiesPublished by Blackwell Publishing Ltd. All rights reserved
486 S. Mahmood et al.
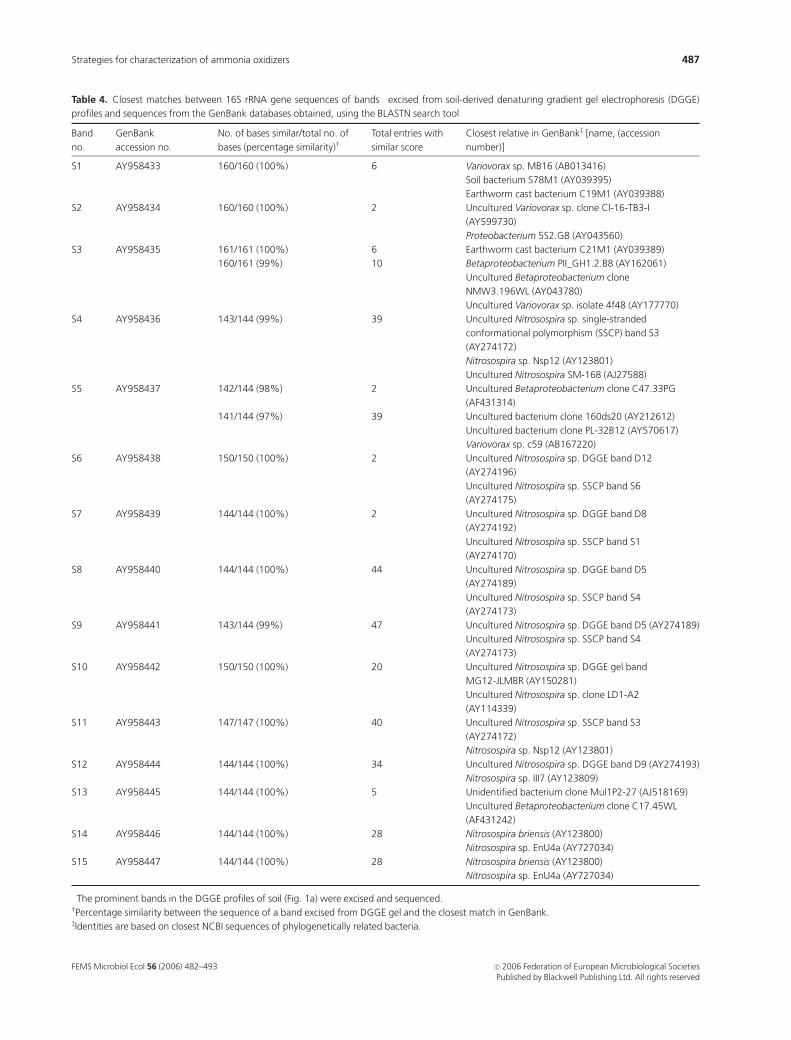
Table 4. Closest matches between 16S rRNA gene sequences of bands� excised from soil-derived denaturing gradient gel electrophoresis (DGGE)
profiles and sequences from the GenBank databases obtained, using the BLASTN search tool
Band
no.
GenBank
accession no.
No. of bases similar/total no. of
bases (percentage similarity)wTotal entries with
similar score
Closest relative in GenBankz [name, (accession
number)]
S1 AY958433 160/160 (100%) 6 Variovorax sp. MB16 (AB013416)
Soil bacterium S78M1 (AY039395)
Earthworm cast bacterium C19M1 (AY039388)
S2 AY958434 160/160 (100%) 2 Uncultured Variovorax sp. clone Cl-16-TB3-I
(AY599730)
Proteobacterium 5S2.G8 (AY043560)
S3 AY958435 161/161 (100%) 6 Earthworm cast bacterium C21M1 (AY039389)
160/161 (99%) 10 Betaproteobacterium PII_GH1.2.B8 (AY162061)
Uncultured Betaproteobacterium clone
NMW3.196WL (AY043780)
Uncultured Variovorax sp. isolate 4f48 (AY177770)
S4 AY958436 143/144 (99%) 39 Uncultured Nitrosospira sp. single-stranded
conformational polymorphism (SSCP) band S3
(AY274172)
Nitrosospira sp. Nsp12 (AY123801)
Uncultured Nitrosospira SM-168 (AJ27588)
S5 AY958437 142/144 (98%) 2 Uncultured Betaproteobacterium clone C47.33PG
(AF431314)
141/144 (97%) 39 Uncultured bacterium clone 160ds20 (AY212612)
Uncultured bacterium clone PL-32B12 (AY570617)
Variovorax sp. c59 (AB167220)
S6 AY958438 150/150 (100%) 2 Uncultured Nitrosospira sp. DGGE band D12
(AY274196)
Uncultured Nitrosospira sp. SSCP band S6
(AY274175)
S7 AY958439 144/144 (100%) 2 Uncultured Nitrosospira sp. DGGE band D8
(AY274192)
Uncultured Nitrosospira sp. SSCP band S1
(AY274170)
S8 AY958440 144/144 (100%) 44 Uncultured Nitrosospira sp. DGGE band D5
(AY274189)
Uncultured Nitrosospira sp. SSCP band S4
(AY274173)
S9 AY958441 143/144 (99%) 47 Uncultured Nitrosospira sp. DGGE band D5 (AY274189)
Uncultured Nitrosospira sp. SSCP band S4
(AY274173)
S10 AY958442 150/150 (100%) 20 Uncultured Nitrosospira sp. DGGE gel band
MG12-JLMBR (AY150281)
Uncultured Nitrosospira sp. clone LD1-A2
(AY114339)
S11 AY958443 147/147 (100%) 40 Uncultured Nitrosospira sp. SSCP band S3
(AY274172)
Nitrosospira sp. Nsp12 (AY123801)
S12 AY958444 144/144 (100%) 34 Uncultured Nitrosospira sp. DGGE band D9 (AY274193)
Nitrosospira sp. III7 (AY123809)
S13 AY958445 144/144 (100%) 5 Unidentified bacterium clone Mul1P2-27 (AJ518169)
Uncultured Betaproteobacterium clone C17.45WL
(AF431242)
S14 AY958446 144/144 (100%) 28 Nitrosospira briensis (AY123800)
Nitrosospira sp. EnU4a (AY727034)
S15 AY958447 144/144 (100%) 28 Nitrosospira briensis (AY123800)
Nitrosospira sp. EnU4a (AY727034)
�The prominent bands in the DGGE profiles of soil (Fig. 1a) were excised and sequenced.wPercentage similarity between the sequence of a band excised from DGGE gel and the closest match in GenBank.zIdentities are based on closest NCBI sequences of phylogenetically related bacteria.
FEMS Microbiol Ecol 56 (2006) 482–493 c� 2006 Federation of European Microbiological SocietiesPublished by Blackwell Publishing Ltd. All rights reserved
487Strategies for characterization of ammonia oxidizers
uncultured Nitrosospira, Nitrosomonas and some unidenti-
fied betaproteobacterial ammonia oxidizers (Table 6). The
majority of sequences had strong similarities to sequences
obtained by a cloning approach using the bAMO143f-
bAMO1315r primers in previous studies of sediment sam-
ples from the same site (Freitag & Prosser, 2003, 2004;
Freitag et al., 2003).
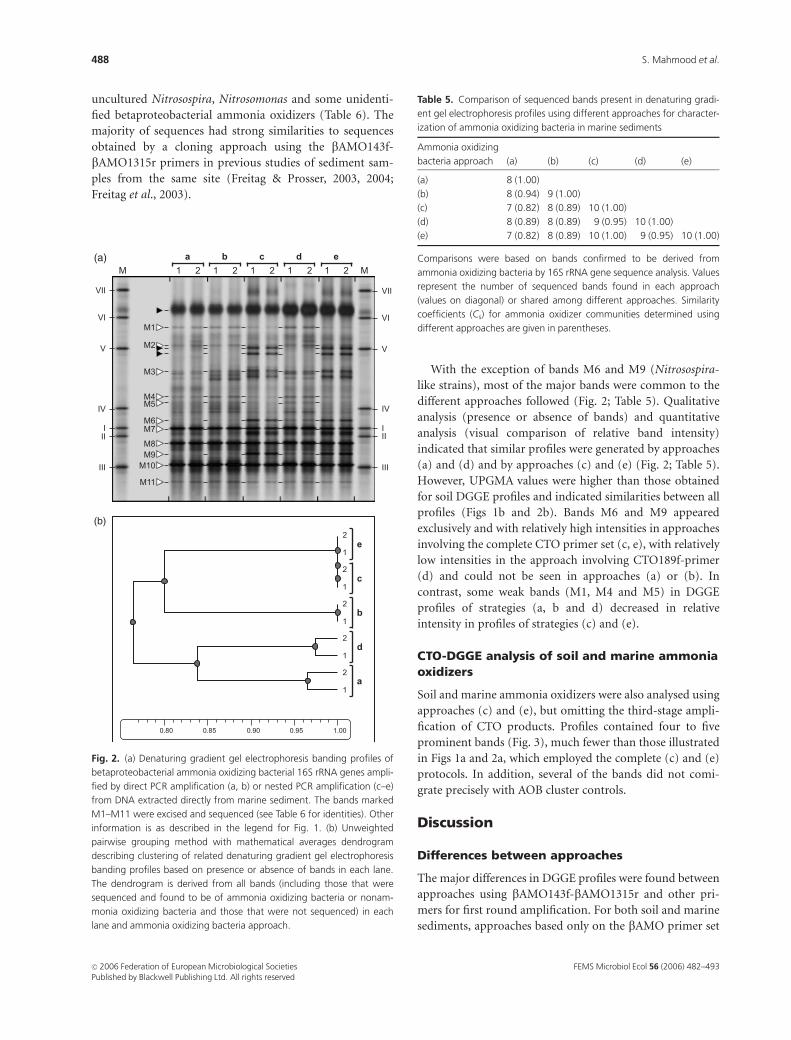
With the exception of bands M6 and M9 (Nitrosospira-
like strains), most of the major bands were common to the
different approaches followed (Fig. 2; Table 5). Qualitative
analysis (presence or absence of bands) and quantitative
analysis (visual comparison of relative band intensity)
indicated that similar profiles were generated by approaches
(a) and (d) and by approaches (c) and (e) (Fig. 2; Table 5).
However, UPGMA values were higher than those obtained
for soil DGGE profiles and indicated similarities between all
profiles (Figs 1b and 2b). Bands M6 and M9 appeared
exclusively and with relatively high intensities in approaches
involving the complete CTO primer set (c, e), with relatively
low intensities in the approach involving CTO189f-primer
(d) and could not be seen in approaches (a) or (b). In
contrast, some weak bands (M1, M4 and M5) in DGGE
profiles of strategies (a, b and d) decreased in relative
intensity in profiles of strategies (c) and (e).
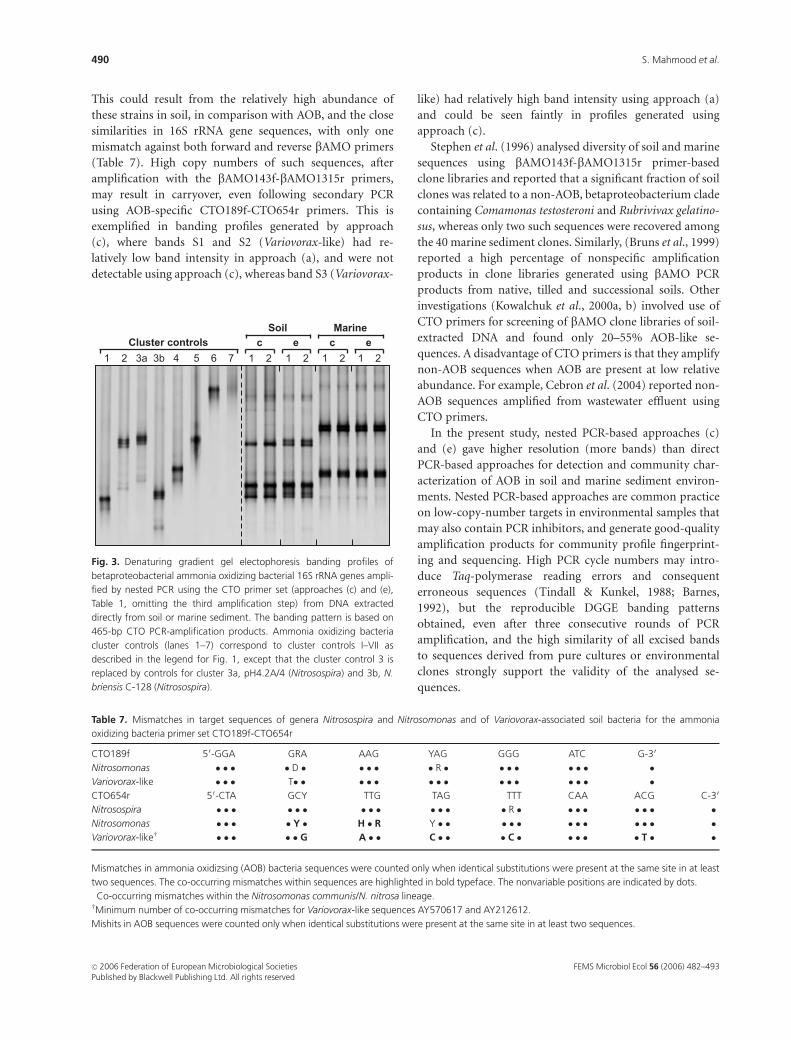
CTO-DGGE analysis of soil and marine ammoniaoxidizers
Soil and marine ammonia oxidizers were also analysed using
approaches (c) and (e), but omitting the third-stage ampli-
fication of CTO products. Profiles contained four to five
prominent bands (Fig. 3), much fewer than those illustrated
in Figs 1a and 2a, which employed the complete (c) and (e)
protocols. In addition, several of the bands did not comi-
grate precisely with AOB cluster controls.
Discussion
Differences between approaches
The major differences in DGGE profiles were found between
approaches using bAMO143f-bAMO1315r and other pri-
mers for first round amplification. For both soil and marine
sediments, approaches based only on the bAMO primer set
(a)
(b)
Fig. 2. (a) Denaturing gradient gel electrophoresis banding profiles of
betaproteobacterial ammonia oxidizing bacterial 16S rRNA genes ampli-
fied by direct PCR amplification (a, b) or nested PCR amplification (c–e)
from DNA extracted directly from marine sediment. The bands marked
M1–M11 were excised and sequenced (see Table 6 for identities). Other
information is as described in the legend for Fig. 1. (b) Unweighted
pairwise grouping method with mathematical averages dendrogram
describing clustering of related denaturing gradient gel electrophoresis
banding profiles based on presence or absence of bands in each lane.
The dendrogram is derived from all bands (including those that were
sequenced and found to be of ammonia oxidizing bacteria or nonam-
monia oxidizing bacteria and those that were not sequenced) in each
lane and ammonia oxidizing bacteria approach.
Table 5. Comparison of sequenced bands present in denaturing gradi-
ent gel electrophoresis profiles using different approaches for character-
ization of ammonia oxidizing bacteria in marine sediments
Ammonia oxidizing
bacteria approach (a) (b) (c) (d) (e)
(a) 8 (1.00)
(b) 8 (0.94) 9 (1.00)
(c) 7 (0.82) 8 (0.89) 10 (1.00)
(d) 8 (0.89) 8 (0.89) 9 (0.95) 10 (1.00)
(e) 7 (0.82) 8 (0.89) 10 (1.00) 9 (0.95) 10 (1.00)
Comparisons were based on bands confirmed to be derived from
ammonia oxidizing bacteria by 16S rRNA gene sequence analysis. Values
represent the number of sequenced bands found in each approach
(values on diagonal) or shared among different approaches. Similarity
coefficients (Cs) for ammonia oxidizer communities determined using
different approaches are given in parentheses.
FEMS Microbiol Ecol 56 (2006) 482–493c� 2006 Federation of European Microbiological SocietiesPublished by Blackwell Publishing Ltd. All rights reserved
488 S. Mahmood et al.
(a) generated fewest confirmed AOB sequences (Tables 3
and 5). Approaches (b), (c) and (e) were equally efficient (in
generating similar numbers of bands) for amplification of
AOB sequences from soil, followed by approach (d) (Table
3). For marine sediments, approaches (c)–(e) amplified
equal numbers of ammonia oxidizer sequences, followed by
approach (b) (Table 5). Despite these differences, banding
patterns derived from marine samples showed relatively
minor variation with the approach adopted.
Profiles derived from soil using the bAMO primer set
differed significantly from those using either bacterial or
CTO primers alone. The most likely explanation for this is
the preferential amplification of Variovorax-like sequences,
which were present on DGGE gels at high relative intensities.
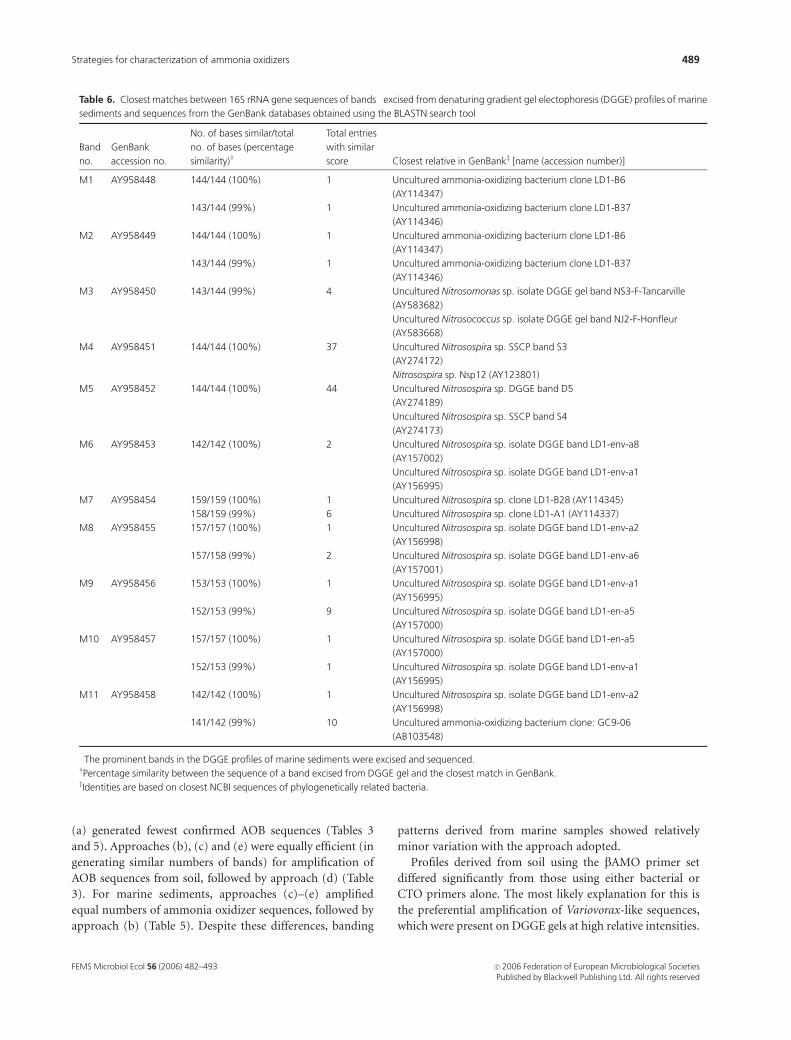
Table 6. Closest matches between 16S rRNA gene sequences of bands� excised from denaturing gradient gel electophoresis (DGGE) profiles of marine
sediments and sequences from the GenBank databases obtained using the BLASTN search tool
Band
no.
GenBank
accession no.
No. of bases similar/total
no. of bases (percentage
similarity)w
Total entries
with similar
score Closest relative in GenBankz [name (accession number)]
M1 AY958448 144/144 (100%) 1 Uncultured ammonia-oxidizing bacterium clone LD1-B6
(AY114347)
143/144 (99%) 1 Uncultured ammonia-oxidizing bacterium clone LD1-B37
(AY114346)
M2 AY958449 144/144 (100%) 1 Uncultured ammonia-oxidizing bacterium clone LD1-B6
(AY114347)
143/144 (99%) 1 Uncultured ammonia-oxidizing bacterium clone LD1-B37
(AY114346)
M3 AY958450 143/144 (99%) 4 Uncultured Nitrosomonas sp. isolate DGGE gel band NS3-F-Tancarville
(AY583682)
Uncultured Nitrosococcus sp. isolate DGGE gel band NJ2-F-Honfleur
(AY583668)
M4 AY958451 144/144 (100%) 37 Uncultured Nitrosospira sp. SSCP band S3
(AY274172)
Nitrosospira sp. Nsp12 (AY123801)
M5 AY958452 144/144 (100%) 44 Uncultured Nitrosospira sp. DGGE band D5
(AY274189)
Uncultured Nitrosospira sp. SSCP band S4
(AY274173)
M6 AY958453 142/142 (100%) 2 Uncultured Nitrosospira sp. isolate DGGE band LD1-env-a8
(AY157002)
Uncultured Nitrosospira sp. isolate DGGE band LD1-env-a1
(AY156995)
M7 AY958454 159/159 (100%) 1 Uncultured Nitrosospira sp. clone LD1-B28 (AY114345)
158/159 (99%) 6 Uncultured Nitrosospira sp. clone LD1-A1 (AY114337)
M8 AY958455 157/157 (100%) 1 Uncultured Nitrosospira sp. isolate DGGE band LD1-env-a2
(AY156998)
157/158 (99%) 2 Uncultured Nitrosospira sp. isolate DGGE band LD1-env-a6
(AY157001)
M9 AY958456 153/153 (100%) 1 Uncultured Nitrosospira sp. isolate DGGE band LD1-env-a1
(AY156995)
152/153 (99%) 9 Uncultured Nitrosospira sp. isolate DGGE band LD1-en-a5
(AY157000)
M10 AY958457 157/157 (100%) 1 Uncultured Nitrosospira sp. isolate DGGE band LD1-en-a5
(AY157000)
152/153 (99%) 1 Uncultured Nitrosospira sp. isolate DGGE band LD1-env-a1
(AY156995)
M11 AY958458 142/142 (100%) 1 Uncultured Nitrosospira sp. isolate DGGE band LD1-env-a2
(AY156998)
141/142 (99%) 10 Uncultured ammonia-oxidizing bacterium clone: GC9-06
(AB103548)
�The prominent bands in the DGGE profiles of marine sediments were excised and sequenced.wPercentage similarity between the sequence of a band excised from DGGE gel and the closest match in GenBank.zIdentities are based on closest NCBI sequences of phylogenetically related bacteria.
FEMS Microbiol Ecol 56 (2006) 482–493 c� 2006 Federation of European Microbiological SocietiesPublished by Blackwell Publishing Ltd. All rights reserved
489Strategies for characterization of ammonia oxidizers
This could result from the relatively high abundance of
these strains in soil, in comparison with AOB, and the close
similarities in 16S rRNA gene sequences, with only one
mismatch against both forward and reverse bAMO primers
(Table 7). High copy numbers of such sequences, after
amplification with the bAMO143f-bAMO1315r primers,
may result in carryover, even following secondary PCR
using AOB-specific CTO189f-CTO654r primers. This is
exemplified in banding profiles generated by approach
(c), where bands S1 and S2 (Variovorax-like) had re-
latively low band intensity in approach (a), and were not
detectable using approach (c), whereas band S3 (Variovorax-
like) had relatively high band intensity using approach (a)
and could be seen faintly in profiles generated using
approach (c).
Stephen et al. (1996) analysed diversity of soil and marine
sequences using bAMO143f-bAMO1315r primer-based
clone libraries and reported that a significant fraction of soil
clones was related to a non-AOB, betaproteobacterium clade
containing Comamonas testosteroni and Rubrivivax gelatino-
sus, whereas only two such sequences were recovered among
the 40 marine sediment clones. Similarly, (Bruns et al., 1999)
reported a high percentage of nonspecific amplification
products in clone libraries generated using bAMO PCR
products from native, tilled and successional soils. Other
investigations (Kowalchuk et al., 2000a, b) involved use of
CTO primers for screening of bAMO clone libraries of soil-
extracted DNA and found only 20–55% AOB-like se-
quences. A disadvantage of CTO primers is that they amplify
non-AOB sequences when AOB are present at low relative
abundance. For example, Cebron et al. (2004) reported non-
AOB sequences amplified from wastewater effluent using
CTO primers.
In the present study, nested PCR-based approaches (c)
and (e) gave higher resolution (more bands) than direct
PCR-based approaches for detection and community char-
acterization of AOB in soil and marine sediment environ-
ments. Nested PCR-based approaches are common practice
on low-copy-number targets in environmental samples that
may also contain PCR inhibitors, and generate good-quality
amplification products for community profile fingerprint-
ing and sequencing. High PCR cycle numbers may intro-
duce Taq-polymerase reading errors and consequent
erroneous sequences (Tindall & Kunkel, 1988; Barnes,
1992), but the reproducible DGGE banding patterns
obtained, even after three consecutive rounds of PCR
amplification, and the high similarity of all excised bands
to sequences derived from pure cultures or environmental
clones strongly support the validity of the analysed se-
quences.
Fig. 3. Denaturing gradient gel electophoresis banding profiles of
betaproteobacterial ammonia oxidizing bacterial 16S rRNA genes ampli-
fied by nested PCR using the CTO primer set (approaches (c) and (e),
Table 1, omitting the third amplification step) from DNA extracted
directly from soil or marine sediment. The banding pattern is based on
465-bp CTO PCR-amplification products. Ammonia oxidizing bacteria
cluster controls (lanes 1–7) correspond to cluster controls I–VII as
described in the legend for Fig. 1, except that the cluster control 3 is
replaced by controls for cluster 3a, pH4.2A/4 (Nitrosospira) and 3b, N.
briensis C-128 (Nitrosospira).
Table 7. Mismatches in target sequences of genera Nitrosospira and Nitrosomonas and of Variovorax-associated soil bacteria for the ammonia
oxidizing bacteria primer set CTO189f-CTO654r
CTO189f 50-GGA GRA AAG YAG GGG ATC G-30
Nitrosomonas � � � � D � � � � � R � � � � � � � �Variovorax-like � � � T� � � � � � � � � � � � � � �CTO654r 50-CTA GCY TTG TAG TTT CAA ACG C-30
Nitrosospira � � � � � � � � � � � � � R � � � � � � � �Nitrosomonas� � � � � Y � H � R Y � � � � � � � � � � � �Variovorax-likew � � � � � G A � � C � � � C � � � � � T � �
Mismatches in ammonia oxidizsing (AOB) bacteria sequences were counted only when identical substitutions were present at the same site in at least
two sequences. The co-occurring mismatches within sequences are highlighted in bold typeface. The nonvariable positions are indicated by dots.�Co-occurring mismatches within the Nitrosomonas communis/N. nitrosa lineage.wMinimum number of co-occurring mismatches for Variovorax-like sequences AY570617 and AY212612.
Mishits in AOB sequences were counted only when identical substitutions were present at the same site in at least two sequences.
FEMS Microbiol Ecol 56 (2006) 482–493c� 2006 Federation of European Microbiological SocietiesPublished by Blackwell Publishing Ltd. All rights reserved
490 S. Mahmood et al.
Differences between soil and marine sedimentprofiles
The major difference between profiles obtained from soil
and marine samples was the influence on the former of the
PCR strategy employed. The most likely explanation is the
low relative abundance, in the marine sediment samples, of
non-AOB with 16S rRNA gene sequences with high similar-
ity to bAMO primer sequences. Low recovery of AOB-
associated sequences from soil environments using the
bAMO primer set has been observed in other studies (Bruns
et al., 1999; Kowalchuk et al., 2000a, b), and Freitag &
Prosser (2004) reported that 61 and 100% of bAMO clones
generated from marine water and sediment samples, respec-
tively, incorporated the CTO primer motif. This suggests
that the use of the bAMO primer set may be generally more
appropriate in marine molecular surveys but the presence of
non-AOB sequence types should always be checked.
Benefits and limitations of different approaches
Amplification of non-AOB sequences by bAMO143f-bA-
MO1315r primers is a particular disadvantage when rela-
tively long sequences are required for the phylogenetic
discrimination of closely related Nitrosospira strains, which
frequently dominate soil AOB communities. In such cases,
labour-intensive and time-consuming screening of bAMO
clones with the CTO primer set is required and may generate
only incomplete clone libraries. CTO primers are selective
for known betaproteobacterial AOB, with the exception of
some members of the N. oligotropha cluster and with several
mismatches with the N. communis cluster (Purkhold et al.,
2000). However, when AOB are present at low abundance,
they can generate non-AOB sequences, frequently related to
Gammaproteobacteria (Backman et al., 2003), possibly in-
dicating insufficient stringency of PCR conditions. This was
not the case in this study, where AOB were at relatively high
abundance.
Approach (a) (direct PCR using bAMO143f-bA-
MO1315r) showed higher diversity (based on total number
of bands) than other approaches employed for soil but also
generated most non-AOB sequences. This approach also
amplified Nitrosospira-like strains that could not be ampli-
fied by the CTO189f-CTO654r primers. This may be due to
mismatches in the CTO primer set to these Nitrosospira-like
strains. However, the CTO primer set is generally considered
to be biased towards the Nitrosospira lineage (Purkhold
et al., 2000) and may limit AOB diversity studies in
environments where N. nitrosa and N. communis are pre-
valent (Koops & Pommerening-Roser, 2001). Because uni-
versal bacterial 27f-1492r primers are expected to amplify
most templates, and are considered to be unbiased against
AOB, they may be used for a primary PCR amplification of
environmental templates followed by AOB-specific CTO
primers (approach (e)).
Although amplification products of CTO primers are
suitable for cloning, sequencing and some basic phylo-
genetic analysis, fewer bands were obtained when CTO
products were analysed prior to third-stage amplification
(Fig. 3). Because the bands did not always comigrate with
AOB cluster controls, it is difficult to establish whether each
of the multiple bands represents a distinct sequence or
whether degeneracy of CTO primers generated multiple
bands in the profiles of AOB cluster controls. However, a
further round of PCR amplification using bacterial 357f-
GC-518r primers reveals a more complex community con-
sisting of at least 17–20 different bands, representing diverse
bacterial sequences (Figs 1a and 2a). Cloning of CTO
products of these samples might also have resulted in a
more complex profile than that depicted in CTO-DGGE
profiles (Fig. 3). The lower number of bands observed in
CTO-DGGE gels may result from the larger size of the CTO
amplification product (465 bp), reducing resolution. PCR
products of 357f-GC-518r primers can either be cloned or
bands of interest from DGGE gels can be excised (as in this
study) for sequencing, but their short length (161 bp)
restricts phylogenetic analysis. In this respect, a combined
approach of DGGE analysis following a nested PCR ap-
proach with CTO189f-CTO654r and 357f-GC-518r primers,
in conjunction with cloning and 357f-GC-518r DGGE
screening of CTO products, enables the analysis of AOB
communities within most environments. This analysis is,
however, restricted to amplification of the 16S rRNA gene,
which may itself bias community analysis, and additional
information may be provided by analysis of additional
targets, such as functional genes.
Conclusion
Of the five strategies evaluated, nested PCR amplification
with first-round amplification using 27f-1492r bacterial
primers and a second PCR using ammonia-oxidizer-specific
CTO189f-CTO654r primers was found to provide the best
approach for characterization of ammonia oxidizing com-
munities in soil and marine sediments. However, there are
concerns regarding possible bias in selectivity and specificity
of CTO189f-CTO654r primers, especially when applied to
environments containing low abundance of AOB. This study
therefore demonstrates the importance of correct choice of
primer strategies, the requirement for screening for se-
quences of nontarget organisms and the requirement for
multiple approaches, particularly during investigation of
previously unstudied environments. Although focussing on
AOB, these considerations are likely to apply equally to
molecular-based characterization of other microbial groups.
FEMS Microbiol Ecol 56 (2006) 482–493 c� 2006 Federation of European Microbiological SocietiesPublished by Blackwell Publishing Ltd. All rights reserved
491Strategies for characterization of ammonia oxidizers
Acknowledgements
This work was carried out as part of a Marie Curie
Individual Fellowship (contract No. QLK3-CT-2000-
52161) awarded by the European Commission.
References
Altschul SF, Gish W, Miller W, Myers EW & Lipman DJ (1990)
Basic local alignment search tool. J Mol Biol 215: 403–410.
Backman JSK, Hermansson A, Tebbe CC & Lindgren PE (2003)
Liming induces growth of a diverse flora of ammonia-
oxidising bacteria in acid spruce forest soil as determined by
SSCP and DGGE. Soil Biol Biochem 35: 1337–1347.
Barnes WM (1992) The fidelity of taq polymerase catalyzing PCR
is improved by an N-terminal deletion. Gene 112: 29–35.
Boyle JS & Lew AM (1995) An inexpensive alternative to
glassmilk for DNA purification. Trends Genet 11: 8–8.
Bruns MA, Fries MR, Tiedje JM & Paul EA (1998) Functional
gene hybridization patterns of terrestrial ammonia oxidizing
bacteria. Microb Ecol 36: 293–302.
Bruns MA, Stephen JR, Kowalchuk GA, Prosser JI & Paul EA
(1999) Comparative diversity of ammonia oxidizer 16S rRNA
gene sequences in native, tilled, and successional soils. Appl
Environ Microbiol 65: 2994–3000.
Cebron A, Coci M, Garnier J & Laanbroek HJ (2004) Denaturing
gradient gel electrophoretic analysis of ammonia- oxidizing
bacterial community structure in the lower Seine River: impact
of Paris wastewater effluents. Appl Environ Microbiol 70:
6726–6737.
Edwards U, Rogall T, Blocker H, Emde M & Bottger EC (1989)
Isolation and direct complete nucleotide determination of
entire genes – characterization of a gene coding for 16S-
ribosomal RNA. Nucleic Acids Res 17: 7843–7853.
Fouratt MA, Rhodes JS, Smithers CM, Love NG & Stevens AM
(2003) Application of temperature gradient gel electrophoresis
to the characterization of a nitrifying bioaugmentation
product. FEMS Microbiol Ecol 43: 277–286.
Freitag TE & Prosser JI (2003) Community structure of
ammonia-oxidizing bacteria within anoxic marine sediments.
Appl Environ Microbiol 69: 1359–1371.
Freitag TE & Prosser JI (2004) Differences between
betaproteobacterial ammonia-oxidizing communities in
marine sediments and those in overlying water. Appl Environ
Microbiol 70: 3789–3793.
Griffiths RI, Whiteley AS, O’Donnell AG & Bailey MJ (2000a)
Rapid method for coextraction of DNA and RNA from natural
environments for analysis of ribosomal DNA- and rRNA-
based microbial community composition. Appl Environ
Microbiol 66: 5488–5491.
Griffiths BS, Ritz K, Bardgett RD, et al. (2000b) Ecosystem
response of pasture soil communities to fumigation-induced
microbial diversity reductions: an examination of the
biodiversity-ecosystem function relationship. Oikos 90:
279–294.
Head IM, Hiorns WD, Embley TM, McCarthy AJ & Saunders JR
(1993) The phylogeny of autotrophic ammonia-oxidizing
bacteria as determined by analysis of 16S ribosomal RNA gene
sequences. J Gen Microbiol 139: 1147–1153.
Koops HP & Pommerening-Roser A (2001) Distribution and
ecophysiology of the nitrifying bacteria emphasizing cultured
species. FEMS Microbiol Ecol 37: 1–9.
Kowalchuk GA, Stephen JR, DeBoer W, Prosser JI, Embley TM &
Woldendorp JW (1997) Analysis of ammonia-oxidizing
bacteria of the beta subdivision of the class Proteobacteria in
coastal sand dunes by denaturing gradient gel electrophoresis
and sequencing of PCR-amplified 16S ribosomal DNA
fragments. Appl Environ Microbiol 63: 1489–1497.
Kowalchuk GA, Stienstra AW, Heilig GH, Stephen JR &
Woldendorp JW (2000a) Changes in the community structure
of ammonia-oxidizing bacteria during secondary succession of
calcareous grasslands. Environ Microbiol 2: 99–110.
Kowalchuk GA, Stienstra AW, Heilig GH, Stephen JR &
Woldendorp JW (2000b) Molecular analysis of ammonia-
oxidising bacteria in soil of successional grasslands of the
Drentsche A (The Netherlands). FEMS Microbiol Ecol 31:
207–215.
Lane DJ (1991) 16S/23S rRNA sequencing. Nucleic Acid
Techniques in Bacterial Systematics, (Stackebrandt E &
Goodfellow M, eds), pp. 115–175. Academic Press, Chichester,
UK.
Lueders T & Friedrich MW (2003) Evaluation of PCR
amplification bias by terminal restriction fragment length
polymorphism analysis of small-subunit rRNA and mcrA
genes by using defined template mixtures of methanogenic
pure cultures and soil DNA extracts. Appl Environ Microbiol
69: 320–326.
Mathieu-Daude F, Welsh J, Vogt T & McClelland M (1996) DNA
rehybridization during PCR: the ‘Cot effect’ and its
consequences. Nucleic Acids Res 24: 2080–2086.
McCaig AE, Embley TM & Prosser JI (1994) Molecular analysis of
enrichment cultures of marine ammonia oxidisers. FEMS
Microbiol Lett 120: 363–367.
McCaig AE, Glover LA & Prosser JI (1999) Molecular analysis of
bacterial community structure and diversity in unimproved
and improved upland grass pastures. Appl Environ Microbiol
65: 1721–1730.
McCaig AE, Glover LA & Prosser JI (2001) Numerical analysis of
grassland bacterial community structure under different land
management regimens by using 16S ribosomal DNA sequence
data and denaturing gradient gel electrophoresis banding
patterns. Appl Environ Microbiol 67: 4554–4559.
Muyzer G, Dewaal EC & Uitterlinden AG (1993) Profiling of
complex microbial populations by denaturing gradient gel
electrophoresis analysis of polymerase chain reaction-
amplified genes coding for 16S ribosomal RNA. Appl Environ
Microbiol 59: 695–700.
Nicol GW, Glover LA & Prosser JI (2003) Spatial analysis of
archaeal community structure in grassland soil. Appl Environ
Microbiol 69: 7420–7429.
FEMS Microbiol Ecol 56 (2006) 482–493c� 2006 Federation of European Microbiological SocietiesPublished by Blackwell Publishing Ltd. All rights reserved
492 S. Mahmood et al.
Polz MF & Cavanaugh CM (1998) Bias in template-to-product
ratios in multitemplate PCR. Appl Environ Microbiol 64:
3724–3730.
Purkhold U, Pommerening-Roser A, Juretschko S, Schmid MC,
Koops HP & Wagner M (2000) Phylogeny of all recognized
species of ammonia oxidizers based on comparative 16S rRNA
and amoA sequence analysis: implications for molecular
diversity surveys. Appl Environ Microbiol 66: 5368–5382.
Rotthauwe JH, Witzel KP & Liesack W (1997) The ammonia
monooxygenase structural gene amoA as a functional marker:
molecular fine-scale analysis of natural ammonia-oxidizing
populations. Appl Environ Microbiol 63: 4704–4712.
Sambrook J, Fritsch EF & Maniatis T (1989) Molecular Cloning. A
Laboratory Manual. Cold Spring Harbor Laboratory Press,
Cold Spring Harbor, NY, USA.
Sorensen T (1948) A method of establishing groups of equal
amplitude in plant sociology based on similarity of species
content and its application to analyses of the vegetation
on Danish commons. K Dan Vidensk Selsk Biol Skr 5: 1–34.
Stephen JR, McCaig AE, Smith Z, Prosser JI & Embley TM (1996)
Molecular diversity of soil and marine 16S rRNA gene
sequences related to beta-subgroup ammonia-oxidizing
bacteria. Appl Environ Microbiol 62: 4147–4154.
Suzuki MT & Giovannoni SJ (1996) Bias caused by template
annealing in the amplification of mixtures of 16S rRNA genes
by PCR. Appl Environ Microbiol 62: 625–630.
Suzuki M, Rappe MS & Giovannoni SJ (1998) Kinetic bias in
estimates of coastal picoplankton community structure
obtained by measurements of small-subunit rRNA gene PCR
amplicon length heterogeneity. Appl Environ Microbiol 64:
4522–4529.
Tindall KR & Kunkel TA (1988) Fidelity of DNA synthesis by the
Thermus aquaticus DNA polymerase. Biochemistry 27:
6008–6013.
von Wintzingerode F, Gobel UB & Stackebrandt E (1997)
Determination of microbial diversity in environmental
samples: pitfalls of PCR-based rRNA analysis. FEMS Microbiol
Rev 21: 213–229.
FEMS Microbiol Ecol 56 (2006) 482–493 c� 2006 Federation of European Microbiological SocietiesPublished by Blackwell Publishing Ltd. All rights reserved
493Strategies for characterization of ammonia oxidizers