Study on non-catalytic and catalytic reactivity of Biodiesel and ...
Upload
khangminh22Category
view
2download
0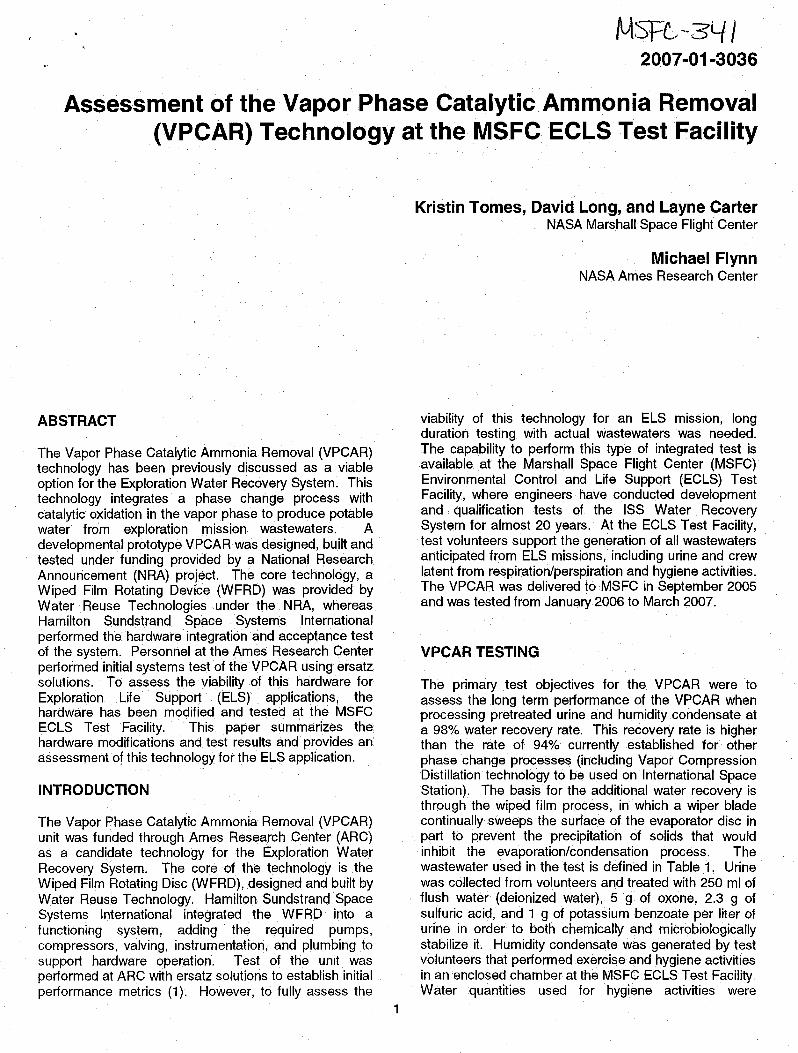
Ivl^"^^2007-01-3036
Assessment of the vapor Phase Catalytic Ammonia. Removal(VPCAR) Technology at the MSFC ECLS Test. Facility
Kristin Tomes, .David Long, and Layne CarterNASA Marshall Space Flight Center
Michael FlynnNASA Ames Research Center
ABSTRACT
The Vapor Phase Catalytic Ammonia. Removal (VPCAR)technology has been previously discussed as a viableoption for. the Exploration . Water Recovery System. Thistechnology . integrates a . phase. change . ,process withcatalytic oxidation in the vapor phase to produce potablewater' from exploration mission wastewaters. Adevelopmental prototype VPCAR was designed, built andtested under funding provided by a National Research.Announcement (NRA) project. The core technology, aWiped Film Rotating Device (WFRD) was provided byWater -Reuse Technologies .under the NRA, whereas..Hamilton Sundstrand .Space .'Systems. Internationalperformed the hardware integration and acceptance test.of the system. Personnel at the-Ames Research Centerperformed initial systems test of the VPCAR using ersatzsolutions. To assess the viability of this hardware .forExploration. Life: Support (ELS) . applications,. thehardware has been modified and tested at fhe MSFC'ECLS Test .facility. This paper summarizes thee,hardware modifications and test resulfs and provides anassessment of this technology for the ELS application.
INTRODUCTION...
The Vapor Phase Catalytic Ammonia Removal (VPCAR)unit was funded through Ames Research Center (ARC)as a candidate technology for the Exploration WaterRecovery System. The core of the technology is theWiped Film Rotating Disc (WFRD), designed and built byWater Reuse'Technology. Hamilton-Sundstrand'SpaceSystems International .integrated the WFRD into afunctioning system., adding the required pumps,compressors;, valuing, instrumentation; and plumbing fosupport hardware operatior ►. Test of the unit wasperformed at ARC with ersatz solutions to establish initialperformance metrics (1). However, to fully assess the
viability of this technology for an ELS. mission, longduration testing. with actual. wastewaters was needed.The capability to perform this type of integrated test isavailable. at the Marshall Space Flight Center (MSFC)Environmental Control and Life Support (ECLS) Test.Facility, where engineers have conducted developmentand qualification tests of the ISS Water RecoverySystem for almost 20 years: At the ECLS Test Facility,test volunteers support the generation of all wastewatersanticipated from ELS missions, including urine and crewlatent from respiration/perspiration and hygiene activities.The VPCAR was delivered to MSFC in September 2005and was tested from January 2006 to March 2007.
VPCAR TESTING
The primary . test objectives for the. VPCAR were toassess the long term performance of the VPCAR whenprocessing pretreated urine: and humidity condensate ata 98% water recovery rate. This recovery rate is higherthan the- rate of ' 94% currently -established for e otherphase- change processes (including Vapor CompressionDistillation technology to be used on International SpaceStation). The basis for the additional water recovery isthrough the wiped film process, in which a wiper bladecontinually-sweeps the. surface of the evaporator disc inpart to prevent. the precipitation of solids #hat wouldinhibit the evaporation/condensation process. Thewastewater used in the test is defined in Table 1. Urine.was collected from volunteers and treated with 250 ml offlush water (deionized water), 5 g of ozone, 2.3 g ofsulfuric acid, and 1 g of potassium benzoate . per fiter ofurine in order to both chemically and microbiologicallystabilize it. Humidity condensate was generated by testvolunteers that performed .exercise and hygiene activitiesin an enclosed .chamber at the MSFC ECLS Test Facility.Water '.quantities used. for hygiene activities' were
1

consistent with that used on the International SpaceStation.. .The condensate was collected with acondensing heat exchanger and delivered'to the VPCARwaste tank for processing withthe pretreated urine. Acondensate supplement ersatz was added to thecondensate to add contaminants hat are not present- inthe test facility condensate at concentrations expected inan ELS mission.
Table 1. VPCAR Wastewater DefinitionWastewater Water Quantit
HumidityCondensate
8.91 kg/day (1'9. 81b/day)
Handwash 11 er daFull BodyWash
6 per day
Wet Shave 3 shaves/daOral H iene 11 toothbrush/daPretreatedUrine
10.48 kg/day (23.1 Ib/day)
CondensateSu lement
1.43 kg/day (3.15 Ib/day)
VPCAR Description
A simplified schematic of the. VPCAR. process isprovided in Figure 1. The wastewater is fed to theW FRD evaporators at a pressure of 40-100 tors and atemperature of 50 -60 °C. The WFRD is composed of 4evaporators operating in parallel, each with a wiper bladethat 'serves to maintain a thin liquid .film on theevaporator surface fior optimum thermal efficiency whilealso preventing precipitation on the evaporator surface.The vapor phase generated under these conditions isremoved , by the compressor. and senf to the catalyticreactor at an 'elevated temperature and pressure.Nonvolatile species remain in the waste brine,-which iscirculated through the evaporators with periodic additionof feed and removal of brine to maintain' the waterrecovery rate. The compressed vapor is mixed withgaseous. oxygen .and passed through an oxidationreactor to react the volatile organics. The vapor phase. isthen fed.. to two'_condensers, ..one between each set ofevaporators. The compressor insures hat .thecondenser is operated at a higher temperature than the.evaporator: Because the evaporators and condensersare separated by only a thin_metaldisk, the latent heatfrom the condensing water transfers itself to theevaporator to support the evaporation of the incomingfeed' water, thus recycling the thermal. energy. Theproduct water is pumped out of the condenser while theexcess oxygen 'and non-condensable gases areremoved by the vacuum pump.
Ih the VPCAR delivered to MSFC, a reduction reactorwas,also employed for. further treatment of the vaporphase. However, this reactor was removed at MSFCsince the targeted contaminants can be more readilyremoved by the habitat's Trace Contaminant: ControlSystem that will be :present on any manned missionusing a Water Recovery System. A vacuum pump is
used to remove the non-condensables (vented to theenvironment) and maintain the system. at vacuumconditions. Water vapor in the vacuum line iscondensed and removed prior to the vacuum pump.
Feed Oxygen
Stream Supply
Oxidation Reactor Compressor
1^-y^ Heat Exchanger o4^ Hi ,.
VII -^ 9 ^ ^^; Stream
Wiiped-Film Rotating-DiskEvaporator
Nun
Vacuum ^/ Pump p
Pump / P3 68Heat Exchanger
H2 ^I
5
PumpHeat Exchanger 10 ^ pp
ri H3 •
Catiin Product Bleed
Vent Stream Stream
Figure 1. VPCAR Schematic
VPCAR Operation
The objective of the test was to operate the VPCARcontinuously with the system in standby only duringwastewater. transfers. All facility tanks were on scalesthat read into the data stream to record changes in massfor all .fluids entering and leaving the system. in order tomaintain an accurate mass balance.
Initially .the .VPCAR was operated without .allowing anybrine to leave the system in order to reach 98% recovery.Based on volume calculations of the brine loop, it wasdetermined' that approximately 45 kg (100: Ibs). of feedmust be processed to achieve this recovery rata Dncethe brine loop was concentrated, brine was metered outof the loop while feed waterwas added to maintain a98%'recovery rate. This was done based on a softwarealgorithm that allowed 0.023 kg (0:05 Ibs) of brine toleave; the system for every 1 . :13 kg (2.5 Ibs) of feedadded to the loop according to scale weights:
Oxygen was; injected into the system at a rate of 500mUmin, 2068 torr (40 psig), which correspondsto a massflow rate of 1.06 kg/hr, to feed the oxidation reactor.System requirements were to run at a rate: of 1 Umin,1551-2585 torr (30-50 psig), which corresponds to 2.12kg/hr. However, during checkout testing; this higher flowrate caused the compressor power to increase due'to thevacuum system not being .able to 'remove the excessoxygen as quickly as it should.' Water . quality wasmonitored to ensure. that it was not affected bythe loweroxygen flow rate.
2

r
Samples were taken of the condensate, pretreated urine,combined waste, brine, and : product water to assessVPCAR performance. Sample analysis ensured thatproduct water quality. was acceptable and helped to verifythe recovery rate based on the percent solids in the brineloop.
RESULTS
Three separate . attempts were made to, operate theVPCAR for an extended. duration. f=or each test run, thebrine loop was first concentrated to a aolidsconcentration corresponding to 98% recovery. Thesystem is designed to produce. 5.8 kg/hr' (13 lb/r); but ineach run the production rate initially averaged only 1.4-2.7 kg/ hr (3-6 Ib/hr). Furthermore, he production rateof product water would decrease even lower toapproximately 0.23 . kg/hr (0.5 Ib/hr) once the brine foopwas concentrated.
Test Run 1
The first attempt to run at 98% recovery was a 7 day test.During the first day of testing, .feed was taken in to beprocessed but no water was produced. However, thesystem' began producing water during test day 2.Concentration was reached during this day and the brineejection logic was initiated. Near the end of day 2, theproduction rate began to' decrease and the systempressures and temperatures dropped. Testing . wasallowed to continue through day 7, though the productionrate and system pressures/temperatures never. returnedto theirprevious operating values.
Based' on the results of ,this test, two systemmodifications were made. ,First, the product water pump(Pump l B) was not functioning correctly, thus the pumpgears were replaced. Because #his pump could noteffectively.move water from the condenser to the producttank, a' majority of th'e water went out the vacuum Jine toa cold trap that was then pumped'to the product tank. Inorder to quantify how much product was leaving thesystem' through the vacuum line, a three way solenoid.valve was used to direct any water collected in the coldtrap to', go to' a separate collection' container. Also, toaddress concerns that the loss in production was due toprecipitation on the evaporator surface, a citric acid flushwas performed to help remove any scaling inside theevaporators that might have been affecting heat' transferfrom the condenser to the evaporator.
Test Run 2
The second' test run lasted for 2 days. Again, theproduction rate, -temperatures, ..and pressures were atacceptable levels for the first day"and a half of testing.The production rate then began to decrease and asignificant rubbing. noise from inside`the WFRD becameevident. The citric acid 'flush was repeated to again
attempt to remove any scaling that might have formedinside the: evaporators..
Subsequent attempts to operate the VPCAR were notsuccessfuh The rubbing noise inside the WFRD becameworse, and there were times when the rotating sumpslocked up and would not rotate without manuallyadjusting them. Finally, the motor shaft driving theW FRD broke as shown. in .Figure 2.
Figure 2. Broken WFRD Motor Shaft
A new motor shaft was manufactured that addressedsome of the design issues of the shaft as received. Atthe point of diameter change on the shaft, a'full radiuswas added to provide strength that would. preventfatigue. During this. time, the .evaporators weredisassembled to investigate'.. the reason for the lowproduction . rate. There were several significant findingsduring disassembly. Figure 3 shows each evaporatorlabeled 'to make discussion of these' findings "easier tounderstand.
LL LR RL; RR
Figure 3. WFRD Evaporator Labels.
In each of the four evaporators, crystalline brine wasfound inside the evaporator covers with the worst beingin the LL evaporator.. Figure 4 shows the precipitation ineach evaporator. Samples were taken for analysis withthe results provided in Table 2 The data was generated
3

F^un*4.Cryo^a^Gn^wdhina^e duhngTeat
LR
bv 3^4goftheooUd in^UnJc^okr^oo^ook^^n.Chbh^.Nhh^^andBmm^emm^n^dotao1ob|^duetoihainke^^ronoeof1hewahouoorgank^acidopram^n8 ^ Hovwavor.^^^heaeopn1anninankohadbeenprooen\.^heywmu|dhmveb*eninvepy|mwquar^kieo^
^ab|a^—Anokm^u of (^ryu^oUine Brine
'not^e1en1o^eUu^8y/n^o^^r^noo^^horganmmo^a.`^
^ ^
^^b^a
8n^kmnp^kuptubafn^n^LL connpon^dto^mnm,ac ^oxup^uoe ^
^ ^ . . ^^^ '—^_ _-,--_^'
F^ure5^ 8nokonBr^eP^kuoTubeodur^oT^o Run^
|
4

the .precipitation and oil, the pickup tubes were repaired,system tubing contaminated with the oil was replaced,and the hardware was reassembled. .Furthermore, thetubing that feeds the WFRD was leaking significantly intothe 1-G sump: This caused the level sensor in fhe sumpto frequently require the sump to be pumped out (back tothe feed). Two failed. tubes were repaired and anotherreinforced. Finally, the system was operated .with:deionized water to flush out any residual. oil left , in theplumbing.
Test Run 3
The final attempt at a . long duration run at 98% recoverylasted 14 days. The production rate was initially at anacceptable level and the system reached concentrationduring day 5 (due to the amount of time the system wasoperated on a daily basis before . continuous run wasinitiated) at which time the brine ejection logic wasenabled. At this point, the brine loop was at 25.5%solids. The last brine sample taken was on test day 11and the percent solids .had increased to 30.8% eventhough thelogic was set to maintain 98%'recovery.
Production rate began to drop near the end of test day 7and continued to decrease for the. remainder of the est.
As with the previous two tests, pressures andtemperatures decreased and did not return to their initialoperational values. Figure 7 shows plots of T2, T12, T9,and T10 during a 5 ..hour .operational period of goodproduction rate as compared to a 5 hour operationalperiod of low production rate.
T2, which is the temperature of the feed before enteringthe W FRD, vvaried a small amount between good and lowproduction times. ' . .This is due to the- fact that facilitysoftware was set to control the feed temperature to65.6 C (150'F). T12„however, is the temperature insidethe WFRD that dictates. when the solenoid valve willopen to allow flow to the product tank. As can be seen,T12 dropped approximately ',1.5 C when the productionrate decreased.
T9 is the temperature of the oxidation reactor. effluent.stream before ..entering the' Water Reuse TechnologyHeat Exchanger (WRT HX): During normal productionthis temperature cycled around 176.7 ' C (350 F):However, once production rate began to drop; T9dropped to just under 65.6 C (150 F). T10 is thetemperature of the oxidation reactor effluent as it .leaves t
the W RT HX and '.which is used to control the coolantflow through the 1NRT HX. Facility software is set tocontrol this temperature to 104.4 C (220 F) which is doneduring normal':operation. Once',production rate dropped,T10 never exceeded 82.2 C (1'80 F) thus not requiringcoolant to enter the system:
5

_--6111=` Qc;:;^ ••1^^2
Run 3, Day 5, Good Production Rate - System Temperatures.
66.87
66.25
65:62
^ 65
ma_m^ 64.37fE
°: 63.75
63.12
62.5
„^..,.-.n .-- ^^
-
--^C"; g 4 ^ ^ ^ j
^1 SI 3^ ^t i Sid ;^ ^ ,Sq ^ S E ^^S S^
so .— i a` i^ ^i^iiLUL_ ? _...^::._^^`, ^€ __" ^ r_..,.g_ o,....____,' $S:trde;
.: -"^'S` if'`3 `S
y`a^
It i
ISI.
-4 ^^ >^. 8
9
--,,
56.87
52.5
48.12
43.75
0c^.
N
39.38
K11
^
35
30.63..
26.25
58 58.05. 58.1 58.15 58.2 58.25 58.3
Julian Date (5 hour scale)
--^E---- T? 2Run 3, Day 13, Low Production Rate -System Temperatures
67.14
65.71
U 64.29
w
Z31
a
s2.a6
Y 61.43
60
58.57
60
55
50
045 ^
N40 ^
35
30
25
67.9 67.95 68 68.05 68.1 68.15
S ' Ef j^ l{,i^ I^ ^IfS _ ^' f 3'^.^^t
1 .^IE;f° 3 ?cv iJ f"" I^_ . ^;lr-,S'S
• 'TSB ' Itrt
'f ,
"^:r;1,,^ S ^ St^^f i`,^ . ,fit ^^- ;^'^S 1^
"++ ^'^ S ^ ^ ^^ ^ ! ft. t 4R ^S 1 t Ei€€ .^,.5'^
^ 1 ^L € } ; S ^S
ji
a ;'' lei '.
dt ^''
^a S^ SS ^ ^ .
^^ ^.
`
` .
^ ^
.d S ' ..^....F
3
Julian Date (5 hour scale)
6

---^---T^ x^
Run , 3, Day 5, Good Production Rate -Coolant and Reactor Temperatures
Y.»r-•" '
F i u f f E i^^ i +t .^i *^`° ^ t ^`+
i
i
i
PID ontrol to 104.1 C
ir
^;^-^ .t eY^^Ft^--^>"< -r.^- ;?®r - ^^^ ' • 'S---^S_ ^-^+ S,,g; r^i,^,.. ^i••-'^' :r ii^ ;%K : ^ ^'^A,
60
55
50
a
0
45 ^
3N
40
35
30
i w 2558 '58.05 58.1 ', 58.15 58.2 58.25 .58.3
Julian Date (5 hour scale)
--^^— Ti c ^.-....
Run 3, Day 13, Low Production Rate - Coolant and Reactor Temperatures
84.38PlD Contro never activated
56.87^
^ _^ --81.25
M1'% f) ^!-tea Y ^^ (t
^^^ 52.578.12
^^r'- ' 4
tj l •- 48.12N '. f°'.
^
O1'm 75 ^.t Q.^.
y,,a ,,
' 43.75cn...
ii
^
.71.87{ ^
mrj
^,m
a'..
m
.39.381. -
68.75 , t
35
65.62 F 1 W, ^,^^
30.6362.5
^^f26.25
67:9 ..67.95 68 68.05 68.1 68.15
Julian Date (5 hour scale)
' Figure 7. Comparison of System Temperatures during. Good and Low Production Periods
7

Solids Coming Out of Evaporator
During this test run, the .rubbing noise inside the WFRDcontinued to get worse. Several shaft positionadjustments were made in an attempt to alleviate therubbing, but never succeeded. in addition, an imbalancein the WFRD shaft was observed. This imbalanceoccurred anytime the. brine was fed to the evaporators.When the evaporators .were operated without the brinefeed, there was not a rotational issue. Finally, whileobserving the imbalance, the motor shaft that drives theWFRD broke in the same location as noted in Figure 2.Following this failure, no further testing of the VPCARwas pursued.
Before the rotating sumps were removed from thesystem, brine samples were taken from each evaporator,the brine tank, and the gravity sump for comparison.Table 2 shows the sample data. These. resultsshow thatthe concentration level inside the evaporators is higherthan that of the brine tank as seen by the %solids value.When taking . system . samples, a sample .port justupstream of the brine tank is used. This data shows thatthe solids concentration level inside the system isactually higher than the concentration level in the brineremoved from the system.
Table 3. Final Brine Sample DataSampleLocation
%Solids H
ConductivityS/cm
Brine Tank 22.4 3.2 105,000G'ravi Sum 28.5 4.3 117,000LL'Eva orator 34.0 4.3 117,000i_R Eva orator 39.0 4.3 117,000RL'Eva orator 36.5 4.3 117,600RR Eva orator 39.0. 4.3 118,200
The evaporators were disassembled to look for anysource of rotational imbalance.. A' significant amount-ofprecipitation was seen on the rotating . sumps and shaftthat seemed to be "baked on" brine. This was notevident during the previous disassembly. Most likely, therepair performed on the feed tubes eliminated asignificant source of Jiquid ,into the 1-G sump. As aresult, the limited brine hat escaped the evaporator hadmore opportunity to "bake" onto the surfaces. As withthe previous disassembly, precipitation had occurred inthe evaporators.... However, the precipitation was notsolid crystalline as before. It is likely that the precipitation'.observed during '.the disassembly following Test. Run 2was `initiated in previous testing. at .Ames Research.Center, and . only. increased during tests at MSFC untilthe interference with the pickup tubes occurred.. Sincethe disassembly following Test Rur ► 3 occurred within aweek of stopping the .test, there was not enough time forthe .precipitation to crystallize. During this disassembly,test engineers also determinedthat the WFRD dry film'sleeve had come lose. This sleeve allows the sumps torotate around the shaft smoothly, and was-most likely thesource of the rubbing sound. The sleeve is similar inappearance to Vespel. See Figure 8 for disassembly..photographs.
8

'•}::{i:}r:::} l;j?• titi4. •<i':ji\r'v' ti^}^::::::•.^:•:^v.'•%}iii.'•::::;i{isti•}::r::si:::4:;i:•ii:;:}:}}:$•}{'f,.ti$4):..;^•.,.; •.yn}:•~''•••i:•}:4}h•: ^'•^:.•.:•:{ti:: r,.;:.•.:•}}}•.; •:: .;:y}:}:? : •: }:};}'•i: r4'•.4•: n}.4'.: •. v..
^:::;<>:^i:<:}^^.`..r.}<^ .;:.;::,::,. •. ,..::<.:.:<:.::.};;::<>:.:}:>;:::;::}:.<;:;>:;::;:;::,}f^:.s System Modifications and Hardware Failures
...} ^>
.:.::-:^:4::::::::::: ,:.::::. •.,i.:,^:::-<.:::>>::>:::::•^»>:r.>:^::::>:>:>:<::<::«::::<:::: Several- modifications were made to both hardware andsoftware to im rove the o eration of the VPCA.}:..^..::::. ^.. - R or to
.::.::::::::..::......^.
.r.;:.}::,^;h.::::. '.^. ,,:::::.^ ::::::::::::.::4:;-:::::: insure the test confi uration ro erl assessed '::'4• {}} .. g p p y it as acandidate S c...,. :>:;}>::»}::»;>::>^i<::< r^ EL to hnolo Throu hout s ste
:ti^:i '?f': :..................
:::^i.- :v::: •::::.-:
v.,};,; •: <:..-N;„.^;^„{^ checkouts and testin there were various com onents,..^.: •^...:.:::::.::::. 9 P
:^:^ • ^^' ..::^:<
^.: Q {: h:^• .... ^?. }:: r :: that fa' eit d and were re aired or re<^:F^`^^<»^^<'^ ..{^.. laced. Hardwa e
..,:,f... .. ^:; :....,,.... ::.<::::__^.•. :^:,..,: ^ failures 'did occur to ancilla co
"}:,.:4::•}:.::.}••.:, m onents that are not,;:. •^...}:::? v related to VPCAR desi n but are address
yam: ^^`t.. '
.} ,. ^,^ .^.,. .:^.•^. g ed herein for....s;:;p..:.
::;.;^ ^.«.:1.:..,: .: ^ ^ .. ^ ^,, completeness. Some failures .are indicative of desi n:^^t g>:.. ^. :^:•;.,.:>:..^.. ^<: issues and are further addressed sa such. F'
::,. •: shows the final s stem schematic at the end of testi
:• g.:f •.:.:::::::::::::::
...:..
F<^^^^^^^^^^•^^^^•••r•••^-.^ •• •• ^ ••••^ ^^^^ -: 'with all modifications included.Broken Dry..Film Bearing Sleeve
{
. 4t2?•.. +^-- :tG•^i^2}?7sk.-::::i:::::;::;::;:::::::i::i::i.'•i:•i: .: r:#iBroken Dry Film Bearing Sleeve
Figure 8. Disassembly Findings from Test Run 3
9

I ^
. Rack 2 I Rack 1 I Back Mass e, I --^--^
_ ____,-(,. PreSSUre Fk>,v .(acne) I ^ L _ — _ ^
— — , ^(^'I To C^In l se Regulala(^nl ydler ^ ^+ popset -;b =',
Q I I Faclllly ®i 4I..-. ^ ..;^{.....0{_ ^.-..p ^•e •. GzChlllg ! I _/?_ ° (Nq I same
Air ln)ecllon l - 2 - IrFaclllly P ( ^__^ i (ispav `^j'
Chiller(^^}[ I r
1
V r r
-0_._^_..------------------ r ^ I
FacIIIIY I ^,
__ _ ^ ^__ -
WFRD
r ^r
iI — -------- • r a.,- ®' • Q•
QI (^ ;Y..l . c^ m (
I
'[
,
I ^ „ ^ .,
.. - ' - - --- -^^F-^- e ^ ^ - S.MwN^„ I
i
' r
• ,•
• N2 • • ^ ..: ^ 46 mm '
u • i , n :. uii v (i E • i ^ S I"F3I N5^i^ ^
• —^? ^?.^, a • r
i
I h ^ r wc) t ^4I ^ ^ -------- ---I ^ ^ .....-...• € a I '---^-----'--- - - '+ -- ^^
, I ^3& ^ ^ r^ _.
8'
1
_ t
-.-. ..._ -.--.;-- .e. - .i-...Na
Ia 9
Mcl ^ ^--- sr (I I n w N9 ^ e ^ M°' • Se ^, I ^,
i^ IFIII Poh
es,z r HX-B ^. . ^-w v^vai^>)rIr ^ ^ I1 r ^ ^
a
^ ^ _IFaclllly
I I I mnioea^oa .BankiL... —_ __ : nm
^U _
_ _ _ °"az meL= e>may
Po
> cmcoQ (^-I.
cal^lo
^ VP RD Wlpetl Fllm Rdaling Dlsk ^ Solenokl valveVacuum Pump ^ Relld Valve FM113
' Hx Hey Enxhanger^ Neetlle Valve
comuooa r Temp/Pressure sensor nProtluct w>ne r>en US ^–• Gear PUmpvAth lM gnal RelldWatar Prdrealetl ^ VTank sm^ Sample POh cwia wee
cooa>o:>^. Urine ® Glulck Dlscomect Palr
ems urine FM Fxlllty Mass (scale) ^ Filler ---•-•- c>:ones
^y.^ FK Facmry CorMUCIM1y Sensor ^ Check Valve _uFJ Oxyg Injection,
-^'^" ,.,!
FT FxIIIty Temperature Sensor ^ c INar
V ^ Melering ValvePetlstallk PUmp '.. .- -- I I on uoss
FM112FM711 FMt14
aHantl Valve;, r>pr li„ FromFadO^Ckond^e VPCAR: Schematic flow. diagram
Figure 9. Final Configuration VPCAR Schematic Flow Diagram
System Modifications. - W RT HX Coolant Flow -The V1valve regulating coolant flow through the W RT HX didnot function .properly when the hardware was received.The coolant is supposed to regulate the fluid temperaturejust downstream of the W RT HX to 104.4 C (220 F);however the valve did not open properly to do this.: TheV1, valve was replaced with a metering hand valve andgear pump that was controlled by facility software tomaintain a temperature around 104.4 C (220 F).
Heat Exchanger A (HX A)- initially the circulating feedloop, which. was cooled to 18.3 C (65 F), was .routedthrough heat exchanger A to .provide cooling for thevapor leaving the condenser. However, the need to coolthe feed line proved unnecessary, so the plumbing forHX A .was changed to have a facility chiller provide thenecessary. coolant for the vacuum line. The feed loopwas routed to only circulate through the facility storagetank without passing through any .other systemcomponents first.
Gravity Sump Control -Originally the software causedthe gravity sump to empty to the brine tank each time L3,the float valve inside the sump, went high. This did notallow the system to maintain its desired concentrationlevel because of the quantity of brine leaving the system.Software was modified to return the gravity sump into thefeed stream instead of dumping to the brine tank.However, if L3 remained high for more than 20 seconds.,
then it sent the brine in the sump to the brine tank. Also,the float valve that triggered. L3 in the gravity sump failedduring testing. It was replaced with an identical part andfunctioned properly for the remainder of the test.
During the inspection of the failed float valve, asignificant amount of black particles could be seen insidethe bottom of the sump. These were determined to befrom the drive belts inside the WFRD. A mesh screenwas sealed over the opening of the sump to catch anyparticles that might get into the system fluid lines andcause other hardware damage.
Air Injection - An air injection pump was added to thefeed loop to provide 5% free gas in the feed #o meetrequirements for free gas in the waste water. This gasquantity is representative of the quantity observed on theInternational . Space Station and expected during ELSmissions. This pump was controlled by facility softwareand allowed air injection at a rate of 40 ml/min:
System Feed Heater - In order to facilitate evaporation inthe WFRD, the feed ,entering the system passed firstthrough an inline heater to raise the temperature: Thiswas only necessary during the initial operation. Aftersteady. state was achieved, the. inline heater wasmanually turned off to prevent overheating and causing asystem shutdown. Early in system checkouts at MSFC,this feed heater failed. It was replaced by two 300 W
10

facility heaters installed in series and controlled by facilitysoftware to a temperature range of 54.4 - 65.6 C (130 -150 F) based on T1. This prevented <any systemshutdowns .due to the feed heater not being turned .offmanually.
Feed Line Pressure Transducer -The°feed line pressure'transducer, which controls vvhen feed is taken into thesystem, failed during #esting. Due to lead times, a newpressure transducer could not be ordered. to completetesting, so a facility sensor was used. This one allowed'.feed pressure to be properly monitored for the remainderof testing.
Solenoid Valves -Three solenoid valves failed (S7, S8,and S10) and were replaced during testing.Replacement valves- were similar to the original ones and
.functioned. properly. for the remainder . of the test...
Bellows Fitting. Downstream of WRT HX =-Before thestart. of the second test run, a significant vacuum .leakwas found in a flexible bellows fitting downstream of theWRT HX before entering the WFRD. Due to ..timeconstraints on ordering a new fitting, the leak was sealedwith a .high. temperature RTV sealant and allowed to fullycure. This kept the fitting from leaking for the remainderof testing.
WFRD Housing Feed Tubes...- During the firstdisassembly of the WFRD rotating sumps, tvvo of thethree feed tubes attached to the WFRD .housing. werefound to be broken . (see Figure 10). This allowed feed toleak into the WFRD housing and cause the gravity sumpto be high on a , regular basis... The two .broken tubeswere repaired and the third was reinforced to prevent.leakage. After the repair, the gravity sump stayed lowalmost continuously. However, sincethe WFRD housingwas dryer, any brine that splashed out of the rotatingsumps . became baked onto the shaft. and WFRDcomponents.. as seen in Figure 11. This is a normaloccurrence when there is no feed leaking into the WFRDhousing.
Figure 11. Precipitation in WFRD
Failures Related to Design Issues - Pumps B and C -The initial system configuration had pumps B and C,product and brine respectively, at an elevation lower thanGhat of the W FRD. This allowed for gravity to assist withmoving fluid through the system. Since there is nogravity assistance in a microgravity situation, both pumpswere initially elevated to remove this help. However,neither pump was able. to overcome the vacuum level ofthesystem and were returned to their original positions.
During initial operation, the system would not produceenough product water to keep a steady flow through theproduct water pump . (pump B). This caused it to run dryand damage the gears. After multiple failures with thegear - .pump heads for Band C, both pumps wereremoved from the system.. Beforetest run 2, they werereplaced with one 4-channel peristaltic pump similar indesign to that used by the Urine Processor Assembly.Thisl modification made a significant impact on theoperation of the system. ..During system checkouts andtest run 1 it could take up to 3 hours for any productwater to leave the. system. Once the peristaltic pumpwas .installed, the system began producing water almostimmediately.
A pressure ransducer was added to the outlef side ofthe product'lines of the pump to ensure that there wasgood flow to the product tank. The solenoid valve thatallows. product water to empty into thefacility tank doesnot stay open continuously until T12 reaches 48.9 C
11

(120 F). As pressure builds inside the product'lines fromthe product water, additional -stress is put on theperistaltic tubing. Software was added to cause theproduct water solenoid valve, S4, to open when thepressure reached 2070 torr (40'psia) and allow flow tothe tank.: The peristaltic pump .internal tubing failedduring the third test run. This allowed product water. toleave. the system _through he vacuum line, thusincreasing the amount of water passing through thevacuum pump. At this point software was modified tocause S4 to open when the pressure reached 1550 torr(30 psia), The tubing was replaced . and the pumpoperated well for the remainder of testing.
Pump DDrain -Because any `uncondensed productwater left the system through the vacuum line, there wasa water collection trap set up just downstream of HX A toprevent any of the fluid from passing through the vacuumpump. Originally, the pump that drained this collectiontrap, pump D, was sent through the system-lubricationline to the product water. tank.. However, to have anaccurate mass balance of how much product water thesystem was actually making, pump'D was rerouted to afacility collection bucket. A three-way solenoid valve wasadded upstream of the pump to allow software to sendany water in the collection trap. back into the systemlubrication line for the first 15 minutes of operation andthen to the facility collection bucket for the duration ofoperation'
Product. Water Line -Once the peristaltic pump wasadded to the system to replace the brine and productwater pumps,. it was observed that . much of the productwater was leaving the WFRD before it had condensed. A.facility heat exchanger was added on the product waterline upstream of the peristaltic pump inlet to help. thisvapor condense. 'When the peristaltic. pump was addedto the system, clear tubing was used . to connect it to theWFRD. `The ability of the peristaltic pump to move twophase flow .showed that vapor; . was leaving thecondenser, however since there was no clear tubingwhen the gear. pumps were connected it can not bedetermined if the cause of the vapor. leaving the WFRDis due to the ability of the peristaltic pump or the
.operation of the system.
Vacuum Pump - Due to the nature: of the VPCARoperation, the vacuum pump runs continuously.Because of the large flow rate of excess oxygen andother non-condensables in the VPCAR system, asignificant amount of product water was pulled .throughthe vacuum line and did not fully. collect in the water trapupstream of the pump. Since the scroll vacuum pump isnot designed to pump water vapor, this mode ofoperation eventually degraded the pump performance tothe point that it could not pull down the system to anappropriate starting pressure without the help of a facilitypump. Anew scroll was placed inside the pump and itoperated well. However, by the end of the final test runthe pump operation had again started to decline.
Water Quality
Due to the duration. of the test, limited water quality datawas acquired. TOC ranged from. 1 to 8 mg/L in theproduct water tank (see Figure 12}. The only organicidentified in the limited analyses was urea at aconcentration of 6.7 mg/L on Day 6. Urea accounted forall of the measured TOC on this day, though this was thelowest TOC value measured .during the-test. Given the#act that no alcohols (C1-C4) or acetone were identifiedin 2 separate product water samples, it is likely that thecatalytic reactor was effective at removing thesecontaminants. Since urea is not very volatile and isrelatively easy to oxidize at elevated temperatures, it isvery possible that its presence in the . product .water isindicative of a leak from the evaporator into thecondenser. Additional testing. will be required to fullyassess the organic quality of the. product water, thoughlower TOC levels may be easily achieved with thedevelopment of an improved catalyst or a higher reactortemperature. Another possibility is the use of adsorbentmedia in a polishing' bed for the product water to reliablymeet <3 mg/L in the product water (current NASAspecification). The pH of the. product water ranged from4.4 to 6.7; while conductivity results ranged from 30 to 83µmhos/cm. Again, only limited analytical data wasavailable, but the ionic characterization indicates that thevast. majority of inorganic constituents . were identified.Though some ` inorganic- contaminants may havevolatilized and passed through the catalytic reactor, it isexpected that the inorganic species were eithercontamination #rom the product water plumbing,oxidation by-products from the catalytic reactor, or werepresent in the product water due to a leak from theevaporator. Table 4 provides a summary of theinorganic data: Phosphate, sulfate, chloride,magnesium, potassium, sodium, and zinc were .all.present in the product water samples at a concentrationapproximately 2.5 orders of magnitude reduced from thewaste water, supporting the possibility of a leak from theevaporator, Similarly; the 'only organic contaminantidentified in the product water (urea) was also present inthe waste water at a concentration approximately 2.5orders of magnitude greater. Other inorganiccontaminants..that were present at lower concentrationsin the waste water showed a Tess significant decrease inconcentration from the brine to the .product .water,possibly .due to contamination from the product water.plumbing. Though leak tests were performed of thesystem to verify no leaks in the region under vacuum, noleak test was done between the evaporator andcondenser. Further investigation of the hardware .andseal design would be required to .determine if a system-leak was the reason forahe contamination. If the sourceof the contamination is primarily from the .product waterplumbing, improved materials selection may eliminatethe contaminants; from the product water. Given theuncertainty in the potable water quality due to the limiteddata set and the potential for leakage from the brine, noconclusions. can be made regarding the need for post-treatment of the VPCAR product water.
12

Fgure 12. Product Tank Results for Total Organic. Carbons .^ .^..._..._.......:....v.......w........w....._ .................... -----_^..._.._--___..__..___.
a7
3 6
E 5v 4
3210
0002 0004 .0005.0006 0007 0010 0011 0012 0014
Test Day
Table 4. Summary of Inorganic Contaminants
ContaminantConcentration m LWaste Water Product Water
Chloride* 1810 5.8Fluoride"` 4.4 0.2.Nitrate" 23 0.4
Nitrite" 26 2Phosphate" 510 0.6Sulfate'` 2860 6.5Ammonium 136 2.7Calcium 63.3 Not detectedMagnesium ' 42:1 0.06Potassium 1610 3.6Sodium 1100 2.7Zinc 4.3 0.02Nickel 0.18 0.09Molybdenum 0.014 0.022Manganese 0:006 0.017f ron 0.23 0.29Copper 0.023 0.023-Chromium 0.049 0.055Aluminum 0:03 0.017
*Average of 4 data points, all other contaminants arefrom TestDay 6 of Test Run 3
DISCUSSION
Operational Issues
One objective of this test was to fully automate VPCARoperations using facility software, including transfer ofwaste water to the VPCAR waste tank. However,various .operational issues presented themselves overthe course of testing that: required almost' continuous,monitoring'.. of the .hardware to insure operation. .Thefollowing discussion will address these issues and theirpotential impact on the continuing development of theVPCAR technology.
Svstem Pressure Transducers
Several of the system pressure transducers requiredrecalibration on a regular basis. Keeping these
transducers .calibrated. was essential for VPCARprocess, including feed .intake and system startup. Oftentimes . the. actual pressure would . be approximately 10-12torr .lower than what the data stream was reading,however this amount was significant enough to effect
..system .operation. There were several instances wherethere would be a system. alarm. causing a shutdown dueto pressure ,deltas over the acceptable limit .when theactual pressures were much lower once the transducerswere calibrated. It is recommended that-a higher qualitypressure transducer be chosen for the VPCAR.
Svstem Vacuum Pump
As was previously discussed, the system vacuum pumphad difficulty. maintaining a system pressure low enoughfor start .up. .Even after the scroll was replaced in thepump, instill. had operational problems. In.order to startup the .system, either . a facility .vacuum pump wasrequired or the compressor had to be operated in manualmode to help' the system pump to achieve the startuppressure which is based on the vapor curve for T12. Byalleviating the.. amount of product water that leaves thesystem through the vacuum dine, the life of the vacuumpump would be extended and could prevent the need toassist it at startup,
Svstem Feed Intake Control Logic
Feed intake is based on the pressure difference betweenP7 and P2 (the pressure of,feed entering the WFRD andvapor; exiting the W FRD to the compressor respectively).A feed 'intake . setpoint is manually entered into thesoftware and then the. control logic pulls in feed based onthe P7-P2 pressure delta. However,..during. earlyoperation .the system requires a greater amount of feedintake: until it reaches a temperature and pressuresupporting a consistent ...production .rate. Once theproduction :rate increases, the ` P7-P2 delta greatlydecreases and can pull in too much feed if the setpoint isnot lowered. In order to alleviate the need of constantmonitoring, facility software.. was used to control thesetpoint baaed on temperature. However, there were stilltimes the setpoint had to be manually monitored. If therewas )ow production rate, less feed -would be required and-the setpoint would need 'to be adjusted to preventflooding inside -.the WFRD. Once production rateincreased again more feed was needed or it would rundry. Thus, the setpoint had to be adjusted based oncurrent system operation.
Compressor Temperatures
When the hardware was received, .there. were. 5thermocouples .placed on the body of the compressorthat were not read into the data stream. Before the thirdtest run these',. thermocouples were set to be monitoredcontinuously by facility software. Multiple systemshutdowns were observed due o one of the compressorthermocouples. exceeding the temperature .setpoint. To.cool the compressor, a facility fan was used to provide acontinuous air flow over the compressor.
13

Rotating Sump Lubrication
The rotating sumps inside the W FRD. rotate about a fixedshaft. with a dry film bearing sleeve. A lubrication line isset up to provide liquid lubrication to this bearing from theproduct water line. If the needle-valve controlling-flowinto the .lubrication line was closed too much, it would rundry and a loud rubbing noise could be heard from insidethe WFRD. However, opening the needle valve too farto insure adequate flow to the shaft would cause productwater to almost completely stop #lowing into the producttank. This was because the W FRD vacuum pump pulledso much product water into the vacuum line. It: wasobserved that a significant amount of product waterwould go to the pump D collection bucket when thishappened. Maintaining the needle valve for ...thelubrication flow at the right setting required constantadjustment to: prevent either of these -situations fromoccurring. It is recommended that a different lubricationmethod be set up for the shaft bearing.
Design Issues
Based on the testing at MSFC and a design assessmentby MSFC, ARC, and JSC engineering, the followingissues have been identified that must be addressedbefore further testing of the VPCAR is warranted.
First, the microgravity sump designed for this version ofthe VPCAR had only limited success.. The sump rotates.with the, evaporator drum, -but provides a radial gap ofapproximately 5 cm from the center shaft for vapor flow.During each startup and shutdown transition, splashingoccurred that resulted in brine escaping the sumpthrough the radial gap. A design modification must bemade to prevent brine leakage, with potential concepts'being a demister or dynamic seal
Efforts to achieve 98% recovery during this test wereunsuccessful. Precipitation during Test Run 2 resulted indamage to the pitottubes. Precipitation continuedduringTest .:Run 3, as evident by the increase in brine solids
-during the est. Though the wipers appeared to control.'.precipitation on the surface of the evaporator,precipitation continued to occur in the microgravitysump,'and was also observed in the brine dumped to the brinetank. '. Given the existing hardware design, 98% recoveryis not viable. This level of recovery is near or beyond thesolubility limit . for some inorganics in the brine, thus.:precipitation is inevitable. Several. issues. contribute #o:the precipitation, including concentration gradients in themicrogravity sump due to its centrifugal. force, inherent,variability in the feed solids, and. controlling the .solids'.concentration in the :small volume in the brine loop.'These 'issues have limited other .phase changeprocesses: to a maximum of 94% recovery, and will. limit'VPCAR as wel( pending additional design modifications
The VPCAR requires a vacuum with'significant capacityto maintain a vacuum on the system while also. addingoxygen at a rate of 0.5 — 1 liter/min.. This largevolumetric flow rate of gas in the vacuum .line also
includes a significant quantity of water vapor that is notremoved in the condenser. During the test,approximately 1/3 of the total . product water wascollected as condensate from the vacuum line, instead ofin the condenser. Though the vacuum #low rate maybereduced by reducing the oxygen required in the catalyticreactor, ultimately a condensing heat ..exchanger andgas/water separator will be required upstream of thevacuum pump.
The gear. pumps did not meet their performancerequirements during the test. Gear pumps are unable todevelop the necessary positive. suction .pressure toovercome the vacuum in the WFRD. Peristaltic pumpsworked in this application during the test, and will mostlikely be required in the flight application. Thoughperistaltic pumps work well in vacuum applications, thedisadvantage is a limited life due to the peristaltic tubing.
The VPCAR requires a significant. quantity. of gaseousoxygen for the catalytic reactor operation. -Though amore active catalyst may reduce the .oxygenrequirement, the ultimate oxygen requirement .will .stillexceed oxygen availability during a manned mission.VPCAR would require a direct interface with the OxygenGeneration . System, which would require an intermediatetank and compressor.
The VPCAR requires significantly higher powerconsumption. (3 KW) than other .phase changeprocesses. For example, the time-averaged powerconsumption for the ISS Water Recovery System isapproximately 560 W, and the VCD specifically requiresonly 490 W while producing approximately 4 Ib/hr of.distillate. Besides the impact to the overall poweravailability. for the mission, the additional powerconsumption places a significant burden on thermalmanagement processes; including the coolant systemand the habitat's temperature control system. This issuewill limit the applicability of the VPCAR for missions withpower and thermal constraints.
Also, the VPCAR must address acoustics to beconsidered a viable candidate for the Exploration . WaterRecovery System. Though no specific acousticmeasurements were .taken during the test, the noiselevels are obviously significantly above the .existingNASA standards of NC-40, .The mechanicaF design . ofthe VPCAR will require modifications specifically toaddress the acoustics, and most likely additional .noiseabatement measures will also be required external to thesystem to meet acoustics requirements.
Finally, the VPCAR has specific mechanical issues thatmust also be resolved. The compressor and motor shaftemploy oil-based lubrication, which is not viable for theflight hardware. .The motor-driven shaft that fracturedtwice during the test. must be redesigned to provide amore stable mechanism for shaft operation.
14

CONCLUSIONS
The specific objectives for this test could not beaccomplished due to the various hardware failuresencountered during operation. In spite of this limitation,however, significant findings were achieved that providecritical insight into the current state .of the VPCARtechnology and. a direction for future improvements.First, this test showed that the current design of theVPCAR cannot achieve 98% recovery.. Though theVPCAR WFRD design provides the potential to exceedthe water recovery of other phase change technologies,at this point additional design improvements andsubsequent testing must: be .performed to quantify theVPCAR advantage. Second, the VPCAR system .testedat MSFC must address the various design issuesspecified herein before proceeding with additional testingto justify a Technology Readiness Level (TRL) of 4.Finally, the VPCAR control scheme needs to be .evolvedto better control the VPCAR process.. The VPCARprocess... is a combination of interdependent unitoperations that must be optimized for the system toachieve maximum performance. This can only beaccomplished' by further testing to more fully understandthe thermodynamic processes in the VPCAR and how to.best control them through. the startup and nominaloperations.
In spite of these issues, the VPCAR continues topossess. advantageous design features. Vapor phaseoxidation is a more efficient. method for removal oforganics #han aqueous phase, though the resultingoxygen and power consumption must be fully assessed
to determine the viability of this technology forexploration missions. Furthermore, the wiper featurehas the potential to improve water recovery by reducingprecipitation effects on the evaporator surface, assumingthe incorporation of design and/or operationalmodifications prevent precipitation in other regions of thebrine loop from impacting system performance.Ultimately, further development of this technology wilt berequired to advance it to the point that it is a viablecandidate for exploration missions
REFERENCES
[1 ] Flynn, M. T., M. Tleimat, G. Quinn, T. Nalette, ".Performance Testing of the Vapor PhaseCatalytic Ammonia Removal EngineeringDevelopment Unit", SAE Technical Papers.Series No. 2005-01-3033, presented at the 35tHInternational Conference on EnvironmentalSystems, Rome, Italy, July 11-14,2005.
CONTACT
Layne CarterNASA Marshall Space Flight CenterE112256 544 7082lane car^erC^'nasa,gov
15
Copyright © 2022 FDOKUMEN