Comparison of Manual and Automated Determination of Hippocampal Volumes in MCI and Early AD
19
Comparison of Manual and Automated Determination of Hippocampal Volumes in MCI and Early AD Li Shen 1,2,* , Andrew J. Saykin 1,3 , Sungeun Kim 1 , Hiram A. Firpi 1 , John D. West 1 , Shannon L. Risacher 1 , Brenna C. McDonald 1 , Tara L. McHugh 3 , Heather A. Wishart 3 , and Laura A. Flashman 3 1 IU Center for Neuroimaging, Div. of Imaging Sciences, Dept. of Radiology, Indiana University School of Medicine, 950 W Walnut St., R2 E124, Indianapolis, IN 46202 2 Center for Computational Biology and Bioinformatics, Indiana University School of Medicine, 410 West 10th St., Suite 5000, Indianapolis, IN 46202 3 Department of Psychiatry, Dartmouth Medical School, DHMC, One Medical Center Dr., Lebanon, NH 03756 Abstract MRI-based hippocampal volume analysis has been extensively employed given its potential as a biomarker for brain disorders such as Alzheimer’s disease (AD), and accurate and efficient determination of hippocampal volumes from brain images is still a challenging issue. We compared an automated method, FreeSurfer (V4), with a published manual protocol for the determination of hippocampal volumes from T1-weighted MRI scans. Our study included MRI data from 125 older adult subjects: healthy controls with no significant cognitive complaints or deficits (HC, n=38), euthymic individuals with cognitive complaints (CC, n=39) but intact neuropsychological performance, and patients with amnestic mild cognitive impairment (MCI, n=37) or a clinical diagnosis of probable AD (AD, n=11). Pearson correlations and intraclass correlation coefficients (ICCs) were calculated to evaluate the relationship between results of the manual tracing and FreeSurfer methods and to estimate their agreement. Results indicated that these two methods derived highly correlated results with strong agreement. After controlling for the age, sex and intracranial volume in statistical group analysis, both the manual tracing and FreeSurfer methods yield similar patterns: both the MCI group and the AD group showed hippocampal volume reduction compared to both the HC group and the CC group, and the HC and CC groups did not differ. These comparisons suggest that FreeSurfer has the potential to be used in automated determination of hippocampal volumes for large-scale MCI/AD-related MRI studies, where manual methods are inefficient or not feasible. Keywords Magnetic resonance imaging; segmentation; hippocampus; cognitive complaints; mild cognitive impairment; Alzheimer’s disease Introduction The hippocampus has been extensively studied with neuroimaging techniques given its importance in learning and memory and its potential as an imaging biomarker for brain *[email protected], phone: 317 278 0498, fax: 317 274 1067. NIH Public Access Author Manuscript Brain Imaging Behav. Author manuscript; available in PMC 2011 March 1. Published in final edited form as: Brain Imaging Behav. 2010 March 1; 4(1): 86–95. doi:10.1007/s11682-010-9088-x. NIH-PA Author Manuscript NIH-PA Author Manuscript NIH-PA Author Manuscript
Transcript of Comparison of Manual and Automated Determination of Hippocampal Volumes in MCI and Early AD
Comparison of Manual and Automated Determination ofHippocampal Volumes in MCI and Early AD
Li Shen1,2,*, Andrew J. Saykin1,3, Sungeun Kim1, Hiram A. Firpi1, John D. West1, ShannonL. Risacher1, Brenna C. McDonald1, Tara L. McHugh3, Heather A. Wishart3, and Laura A.Flashman31 IU Center for Neuroimaging, Div. of Imaging Sciences, Dept. of Radiology, Indiana UniversitySchool of Medicine, 950 W Walnut St., R2 E124, Indianapolis, IN 462022 Center for Computational Biology and Bioinformatics, Indiana University School of Medicine, 410West 10th St., Suite 5000, Indianapolis, IN 462023 Department of Psychiatry, Dartmouth Medical School, DHMC, One Medical Center Dr., Lebanon,NH 03756
AbstractMRI-based hippocampal volume analysis has been extensively employed given its potential as abiomarker for brain disorders such as Alzheimer’s disease (AD), and accurate and efficientdetermination of hippocampal volumes from brain images is still a challenging issue. We comparedan automated method, FreeSurfer (V4), with a published manual protocol for the determination ofhippocampal volumes from T1-weighted MRI scans. Our study included MRI data from 125 olderadult subjects: healthy controls with no significant cognitive complaints or deficits (HC, n=38),euthymic individuals with cognitive complaints (CC, n=39) but intact neuropsychologicalperformance, and patients with amnestic mild cognitive impairment (MCI, n=37) or a clinicaldiagnosis of probable AD (AD, n=11). Pearson correlations and intraclass correlation coefficients(ICCs) were calculated to evaluate the relationship between results of the manual tracing andFreeSurfer methods and to estimate their agreement. Results indicated that these two methods derivedhighly correlated results with strong agreement. After controlling for the age, sex and intracranialvolume in statistical group analysis, both the manual tracing and FreeSurfer methods yield similarpatterns: both the MCI group and the AD group showed hippocampal volume reduction comparedto both the HC group and the CC group, and the HC and CC groups did not differ. These comparisonssuggest that FreeSurfer has the potential to be used in automated determination of hippocampalvolumes for large-scale MCI/AD-related MRI studies, where manual methods are inefficient or notfeasible.
KeywordsMagnetic resonance imaging; segmentation; hippocampus; cognitive complaints; mild cognitiveimpairment; Alzheimer’s disease
IntroductionThe hippocampus has been extensively studied with neuroimaging techniques given itsimportance in learning and memory and its potential as an imaging biomarker for brain
*[email protected], phone: 317 278 0498, fax: 317 274 1067.
NIH Public AccessAuthor ManuscriptBrain Imaging Behav. Author manuscript; available in PMC 2011 March 1.
Published in final edited form as:Brain Imaging Behav. 2010 March 1; 4(1): 86–95. doi:10.1007/s11682-010-9088-x.
NIH
-PA Author Manuscript
NIH
-PA Author Manuscript
NIH
-PA Author Manuscript
disorders such as Alzheimer’s disease (Apostolova, Dinov, et al., 2006; Apostolova, Dutton,et al., 2006; Becker, et al., 2006; Csernansky, et al., 2005; Saykin, et al., 2006; Thompson, etal., 2004; Wang, et al., 2007; L. Wang, et al., 2006), epilepsy (Hogan, et al., 2006) andschizophrenia (Csernansky, et al., 2002; Gerig, Styner, Shenton, & Lieberman, 2001; Shenton,Gerig, McCarley, Szekely, & Kikinis, 2002; Wang, Joshi, Miller, & Csernansky, 2001). Whileautomated and semi-automated methods for segmentation and quantification of the size andshape of the hippocampus were available and used in certain groups (Csernansky, et al.,2002; Csernansky, et al., 2005; Hogan, et al., 2006; D. Shen, Moffat, Resnick, & Davatzikos,2002; Wang, et al., 2007; L. Wang, et al., 2006), in most studies (Apostolova, Dinov, et al.,2006; Apostolova, Dutton, et al., 2006; Becker, et al., 2006; Bouix, Pruessner, Louis Collins,& Siddiqi, 2005; Gerig, et al., 2001; McHugh, et al., 2007; Saykin, et al., 2006; Shenton, etal., 2002; Thompson, et al., 2004; Yushkevich, et al., 2007), researchers employed manualtracing of hippocampal boundaries from magnetic resonance imaging (MRI) scans usingvarious software tools (e.g., Analyze (Mayo Clinic, 2008), BRAINS (Iowa Mental HealthClinical Research Center, 2008), 3D Slicer (NAMIC, 2008), ITK-SNAP (Yushkevich, et al.,2006)).
Accurate and efficient MRI segmentation of the hippocampus is still a challenging issue.Although experienced anatomic tracers can be reliable, manual segmentation is a timeconsuming process and may not be feasible for large-scale neuroimaging studies. For example,the Alzheimer’s Disease Neuroimaging Initiative (ADNI) (Mueller, et al., 2005) is a landmarkinvestigation sponsored by the NIH and industrial partners designed to collect longitudinalneuroimaging, biological and clinical information from 800 participants that will track theneural correlates of memory loss from an early stage. All ADNI participants have clinical andcognitive assessments and 1.5 Tesla structural MRI every 6 or 12 months for 2–3 years. Manualsegmentation is therefore not ideal given the thousands of MRI scans to be analyzed.
A feasible strategy for hippocampal segmentation in large-scale studies should minimizehuman interaction involved in the processing pipeline. Diffeomorphic mapping is a notablemethod for semi-automatic segmentation that has been used by Csernansky and colleagues inmany hippocampal studies (Csernansky, et al., 2002; Csernansky, et al., 2005; Hogan, et al.,2006; Wang, et al., 2007; L. Wang, et al., 2006). FreeSurfer (Dale, Fischl, & Sereno, 1999;Fischl, et al., 2002; Fischl, Sereno, & Dale, 1999) (available athttp://surfer.nmr.mgh.harvard.edu/) is an automated software tool for whole brainsegmentation and cortical parcellation. Because FreeSurfer is freely available on the web, ithas been widely used in neuroimaging field. One recent study (Tae, Kim, Lee, Nam, & Kim,2008) reported a comparison of hippocampal volumes measured using the authors’ manualmethod and FreeSurfer V3.04 on 21 female patients with major depressive disorder (MDD)and 20 controls. The intraclass correlation coefficients (ICCs, calculated based on Cronbach’salpha) for testing inter-rater reliability were at a level of 0.85 for both left and right hippocampi(no p values were reported). In this work, we examine data from a different and larger cohortusing a newer version of FreeSurfer, and perform a similar analysis comparing hippocampalvolume determined by FreeSurfer V4 and a published manual protocol (McHugh, et al.,2007).
Materials and methodsIn this report, we analyzed data from a well characterized cohort recruited from a study ofmemory circuitry in mild cognitive impairment (MCI) and early Alzheimer’s disease (AD).Here we briefly describe this data set, the two hippocampal segmentation methods examinedin the paper, and our methods for comparison.
Shen et al. Page 2
Brain Imaging Behav. Author manuscript; available in PMC 2011 March 1.
NIH
-PA Author Manuscript
NIH
-PA Author Manuscript
NIH
-PA Author Manuscript
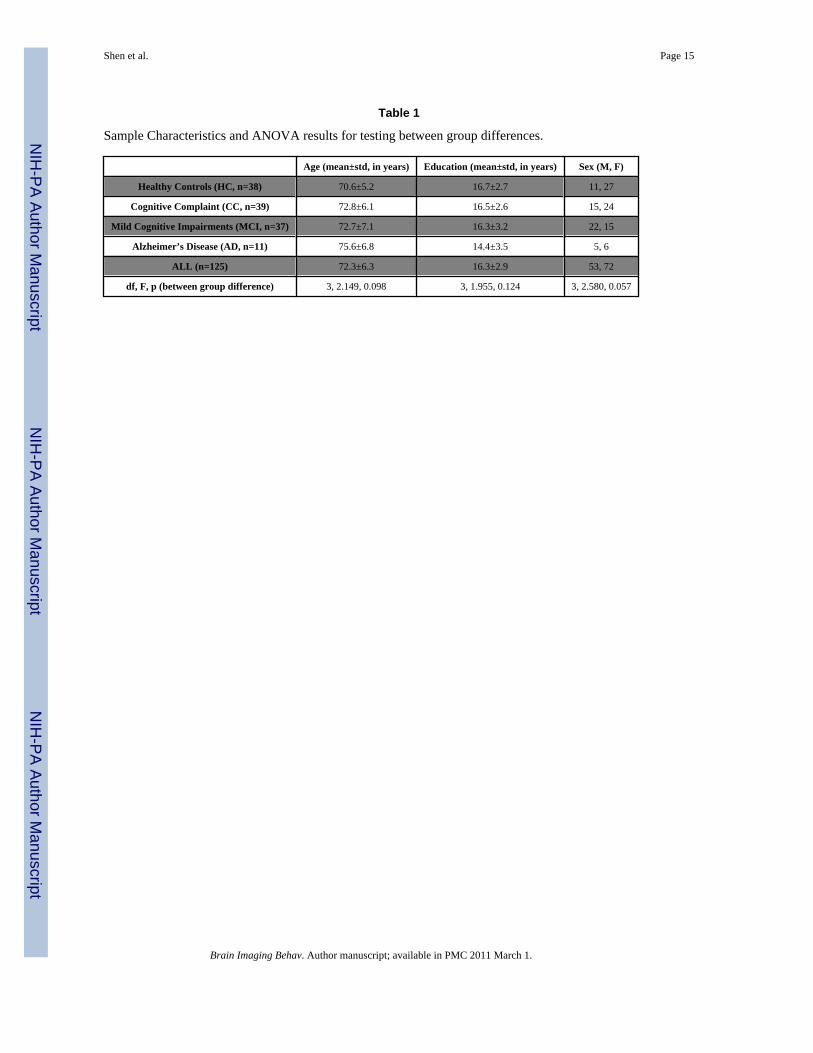
ParticipantsBaseline hippocampal data were available for 125 subjects from four categories: healthy olderadults with no significant cognitive complaints or deficits (HC, n=38), euthymic older adultswith cognitive complaints (CC, n=39) but intact neuropsychological performance, older adultswith amnestic MCI (MCI, n=37), and adults with a clinical diagnosis of probable AD (AD,n=11). Demographic characteristics are shown in Table 1.
Structural MRI volume scans were obtained on a GE Signa 1.5 T Horizon LX magnet withecho speed gradients using a standard head RF coil. A T1-weighted three-dimensional spoiledgradient echo (SPGR) coronal volume was acquired. Parameters were TR = 25, TE = 3 or min,flip angle = 40 degrees, 1 NEX, and slice thickness = 1.5 mm (no skip), yielding 124 contiguousslices with a 24-cm field of view and a 256×256 matrix with 0.9375 mm in-plane resolution.Further details about this data set are available in (Saykin, et al., 2006) and in (P. Wang, et al.,2006).
Manual and automated segmentationHippocampal and intracranial boundaries were obtained using (1) a manual protocol reportedin (McHugh, et al., 2007) using the BRAINS software package (Iowa Mental Health ClinicalResearch Center, 2008), and (2) a fully automated method using the FreeSurfer V4 package(Dale, et al., 1999; Fischl, et al., 2002; Fischl, et al., 1999).
In manual segmentation (Fig. 1), images were reformatted into isotropic 1-mm voxels andresampled into the plane perpendicular to the long axis of the hippocampus using the BRAINSsoftware (Iowa Mental Health Clinical Research Center, 2008). Manual traces were performedin the coronal plane with reference to markings placed in the axial and sagittal views to guideboundary determination. This protocol followed the guidelines of (Jack, 1994;Watson, et al.,1992) in segmenting the hippocampus with refinements in defining the posterior andanteromedial extents (Andreasen, et al., 1993;Torres, Flashman, O’Leary, Swayze, &Andreasen, 1997). Key features included: (1) tracing in the plane of the long axis of thehippocampus to obtain a better view of the hippocampal tail; (2) the “telegraphing” functionwas used to transfer boundary definition obtained in the axial and sagittal views to the coronalview for guiding boundary determination; and (3) key medial temporal lobe structures weretraced together to eliminate boundary overlap. Total incracranial volume (ICV) was also tracedto include the cortex, cerebellum, brainstem, and cerebrospinal fluid. Complete details aboutthe manual segmentation protocol and boundaries are available in (McHugh, et al., 2007). A3D binary image was reconstructed from each set of 2D hippocampal segmentation results.Two sample manual segmentation results are shown in the left column of Fig. 2.
In automated segmentation, FreeSurfer was employed to automatically label subcortical tissueclasses using an atlas-based Bayesian segmentation procedure. A subject-independentprobabilistic atlas was pre-computed from a training set of subjects whose brains weremanually labeled. These labels together with intensity values were mapped into Talairach spaceto enable voxelwise correspondence across subjects. A probabilistic atlas was then created bycomputing three types of probabilities for each voxel in Talairach space to encode probabilitiesof class labels, functions of neighborhood patterns and profiles of intensity values. Once theatlas was available, an individual brain MRI could be segmented as follows. Preprocessingsteps included an affine registration with Talairach space, intensity normalization, skull strip,and a high dimensional nonlinear volumetric alignment to the Talairach atlas. FreeSurfercalculated the probability of a class at each voxel location as the probability that the given classappeared at that location in the training set times the likelihood of getting the subject-specificintensity value from that class. An initial segmentation was generated by assigning each pointto the class for which the above probability was greatest. The neighborhood function was then
Shen et al. Page 3
Brain Imaging Behav. Author manuscript; available in PMC 2011 March 1.
NIH
-PA Author Manuscript
NIH
-PA Author Manuscript
NIH
-PA Author Manuscript
used to recalculate the class probabilities and re-segment the data using the new classprobabilities. This procedure was repeated until the result converged. Details for the FreeSurfermethod were reported in (Dale, et al., 1999; Fischl, et al., 2002; Fischl, et al., 1999). Thecomplete FreeSurfer analysis pipeline was performed without any manual intervention. TheFreeSurfer V4 package (v4.0.2) was installed on Quarry (a supercomputer located at IndianaUniversity), an IBM HS21 Bladeserver cluster running Red Hat Linux. The estimated left andright hippocampal volumes were extracted directly from the aseg.stats files. The estimated totalintracranial volume (ICV) was re-calculated using the talairach.xfm (new method used in postv4.2.0)) instead of the talaiarch_with_skull.lta transform (old method), which was found to bemore accurate according to the ICV page on the FreeSurfer website (FreeSurfer Wiki, 2009).Further details about the FreeSurfer method for ICV estimation were available in (Buckner, etal., 2004).
A sample FreeSurfer volume-based labeling is shown in Fig. 3. Based on each label map, weextracted the left and right hippocampi as two 3D binary images. To visually compare theFreeSurfer and manual tracing results, we transformed both results back to the original imagespace. Shown in Fig 2 are two sample manual tracing results (left) and the correspondingFreeSurfer results (right). FreeSurfer results tend to be larger and more inclusive than manualones and contain several local excursions on the surfaces.
Methods for comparisonStatistical analysis was performed using SPSS 16.0 (SPSS, Chicago, IL). Pearson correlationsand interclass correlation coefficients (ICCs) were calculated to evaluate the relationshipbetween volume generated by FreeSurfer and the manual tracing method and to estimate theiragreement. Given a variety of available ICC measures that may yield different values for thesame data, we briefly describe below (1) the goal of this study and (2) how to choose anappropriate ICC for our reliability test to achieve the goal.
Let D1 be the data used in this study and D2 be the data we will collect in the future. For D1,we have both FreeSurfer and manual tracing results available. Although our manual tracer isexperienced and reliable, manual tracing is a very time consuming process and won’t beapplicable for our future data set D2 that is much larger than D1. Therefore, our plan is to useFreeSurfer instead of manual tracing to process D2. The goal of this study is to perform afeasibility test for our plan and make sure that FreeSurfer can produce accurate results. Sincerunning FreeSurfer on the same data multiple times always generates the same result, the intra-rater reliability for FreeSurfer is 1.0. Therefore, the focus of this study is to examine the inter-rater reliability by comparing FreeSurfer and manual results using the existing data D1.
Thus, in our statistical scenario, we aim to collect all the data (i.e., D1∪D2) using one rater(i.e., FreeSurfer) and currently have two raters (i.e., FreeSurfer and manual tracing) on a subsetof the data (i.e., D1) for purposes of estimating inter-rater reliability measured by ICC. Wefollowed the procedure suggested in (McGraw & Wong, 1996) to select an appropriate ICCfor this type of reliability analysis. We employed a two-way mixed model, since the two raters(i.e., FreeSurfer and manual tracer) were a fixed effect while the target ratings (i.e.,hippocampal volumes) were a random effect in our study. We tested the single measurereliability instead of the average measure reliability, because our goal was to evaluate thereliability of the ratings for a typical single rater (i.e., FreeSurfer) rather than the mean of allthe ratings. We selected “consistency” as the model type instead of “absolute agreement”, sincewe were more interested in seeing the consistency of the relative standing of the measures thanabsolute agreement between two raters. In short, the SPSS option for this type of ICC analysiscan be summarized as the “two-way mixed model of single measure intraclass correlation withconsistency type”. The formula for computing this type of ICC is available in (McGraw &Wong, 1996) and can be found in the formula entry for Case 3 model ICC(C,1) in Table 4 of
Shen et al. Page 4
Brain Imaging Behav. Author manuscript; available in PMC 2011 March 1.
NIH
-PA Author Manuscript
NIH
-PA Author Manuscript
NIH
-PA Author Manuscript
(McGraw & Wong, 1996). In our experiments, we performed the above analysis within eachgroup as well as across groups.
In addition to comparing the FreeSurfer results directly with the manual tracing results toestimate their agreement, we performed a group analysis (SPSS General Linear Model)separately for each method examining whether hippocampal volumes differ significantlyamong the HC, CC, MCI, and AD groups. Our goal was to see if the FreeSurfer and manualtracing methods would yield a similar pattern of group differences. In these analyses, we alsotested effects of age, education, sex and ICV on volume measures determined by each method,and then involved age, sex and ICV as covariates in our linear models.
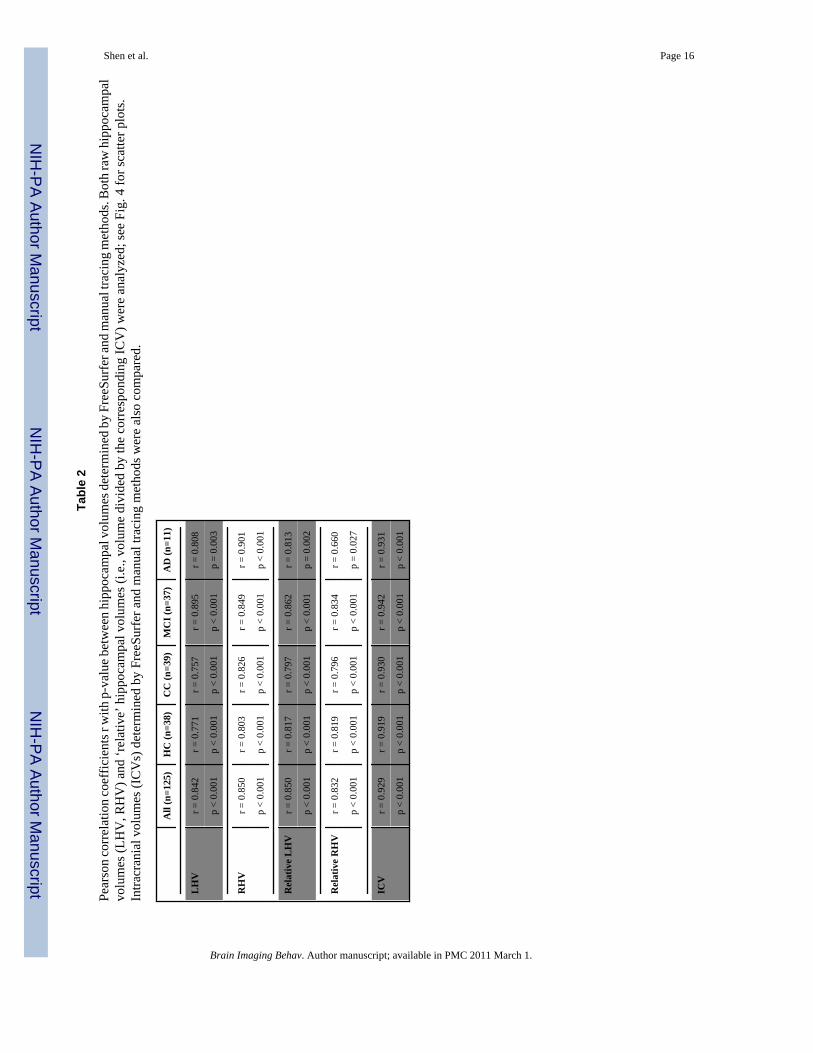
ResultsWe analyzed both raw hippocampal volumes and “relative hippocampal volumes to ICV” thatwere calculated as the raw volumes divided by the corresponding ICVs. Fig. 4 shows the plotsof the FreeSurfer measures against the manual tracing measures. A visual inspection of Fig. 4indicates that FreeSurfer volumes as unadjusted numbers are systematically larger than manualresults. After adjusting ICV, this trend gets substantially reduced. We computed and examinedPearson correlations across groups and within each group for not only hippocampal volumesbut also ICV measures, and Table 2 summarizes the results. The correlations within each groupand across groups for absolute and relative hippocampal measures are all significant at thelevel of r≥0.757 except r=0.66 for relative RHV in the AD group. The correlations for ICV areall significant at a higher level of r≥0.919.
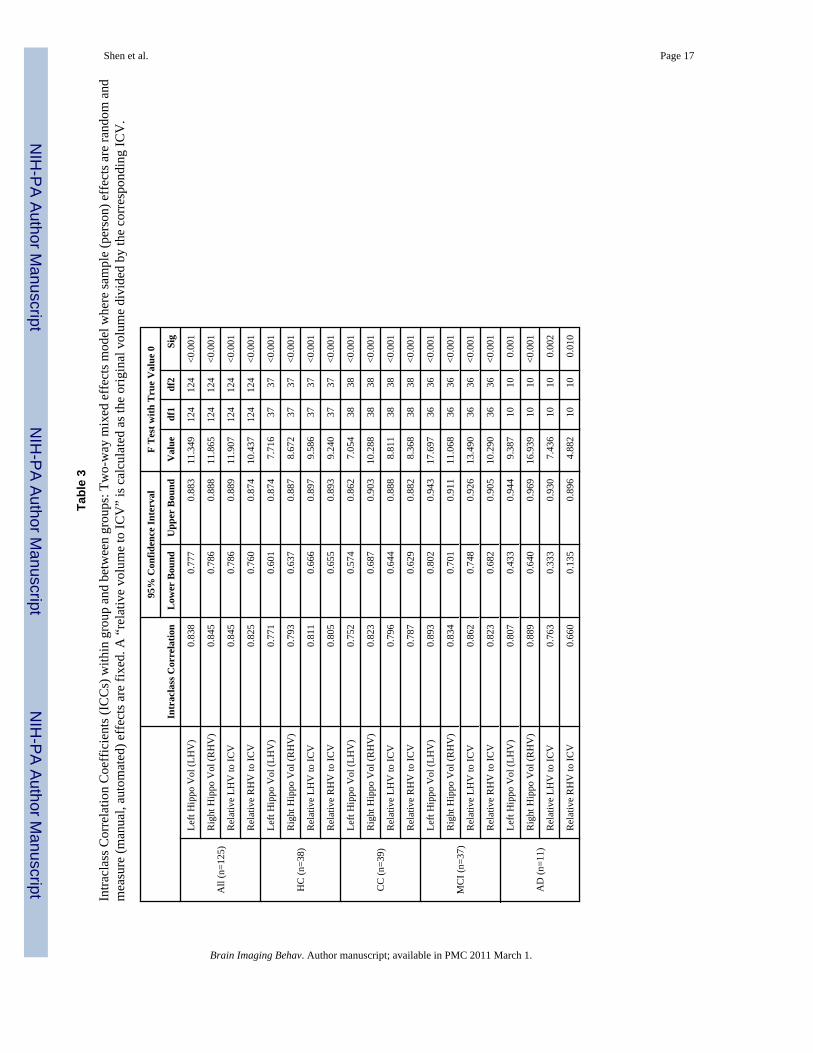
We also computed and examined ICCs for testing inter-rater reliability across groups andwithin each group. Table 3 provides inter-rater reliability results for the single measure ICCfor the entire set and each group respectively. As mentioned earlier, since our goal is to test ifFreeSurfer is a valid alternative method, single measure ICCs under a two-way mixed modelwith consistency type are most appropriate. These results show reliabilities are significant atlevels ranging from 0.75 to 0.89 within group and across groups. The only outlier is the “relativeright hippocampal volume (RHV) to ICV” in the AD group (ICC=0.66), whose low ICC levelcould be caused by a combination of several factors. First, the sample size (n=11) is relativelysmall compared with other groups. Second, the quality of ICV measures could be an additionalreason, given that we had ICC=0.889 for RHV without adjusting for ICV. For each participant,FreeSurfer and manual methods determine their own ICV values that are subsequently usedfor calculating their corresponding relative RHVs. Although the correlation betweenFreeSurfer and manual ICVs is significant at a level of r=0.929 (see Table 2), small disturbanceon either FreeSurfer or manual ICV estimate could cause a big change between the ICC forRHV and the ICC for relative RHV to ICV, given such a small sample size (n=11). A similarpattern was also observed in Pearson correlation results (Table 2): r=0.901 for RHV andr=0.660 for relative RHV for the AD group.
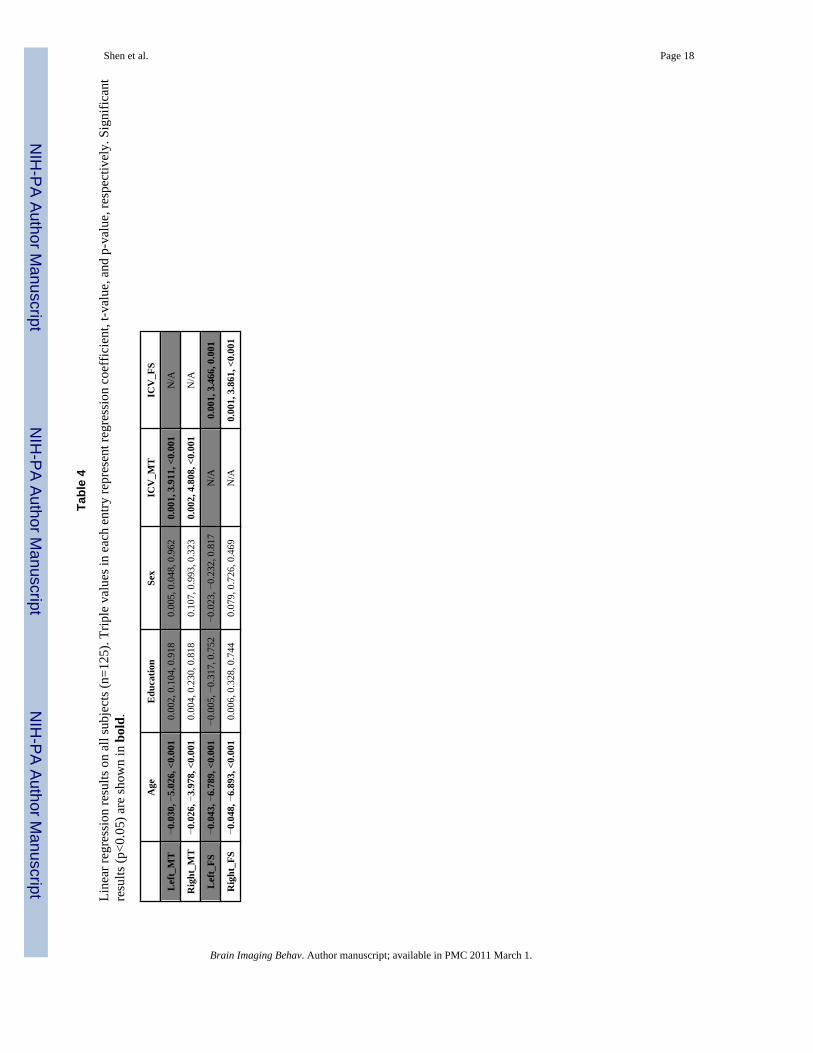
In addition to comparing the agreement of FreeSurfer directly with manual tracing, weperformed group analysis (SPSS General Linear Model) on data sets measured by both methodsto determine if a similar pattern of group differences would be obtained. We first examinedthe effects of age, education, sex and ICV on the left and right hippocampal volumes determinedby both FreeSurfer and manual methods, using a linear regression model; and the results weresummarized in Table 4. The following patterns were obtained in both methods: the effects ofage and ICV were significant (p ≤ 0.05) and the effects of education and sex were notsignificant. After that, we ran our linear models to examine the diagnostic group effect (HC,CC, MCI, and AD) on the hippocampal volume with age, sex and ICV as covariates. Age-,sex- and ICV- adjusted hippocampal volumes were plotted in Fig. 5. Similar between-groupdifferences were detected using manual tracing and FreeSurfer: (1) for manual tracing data,
Shen et al. Page 5
Brain Imaging Behav. Author manuscript; available in PMC 2011 March 1.
NIH
-PA Author Manuscript
NIH
-PA Author Manuscript
NIH
-PA Author Manuscript
we had degrees-of-freedom (df) =6, F=13.836, p<0.001 for left hippocampus and df=6,F=13.120, p<0.001 for right hippocampus; and (2) for FreeSurfer data, we had df=6, F=17.620,p<0.001 for left and df=6, F=15.788, p<0.001 for right.
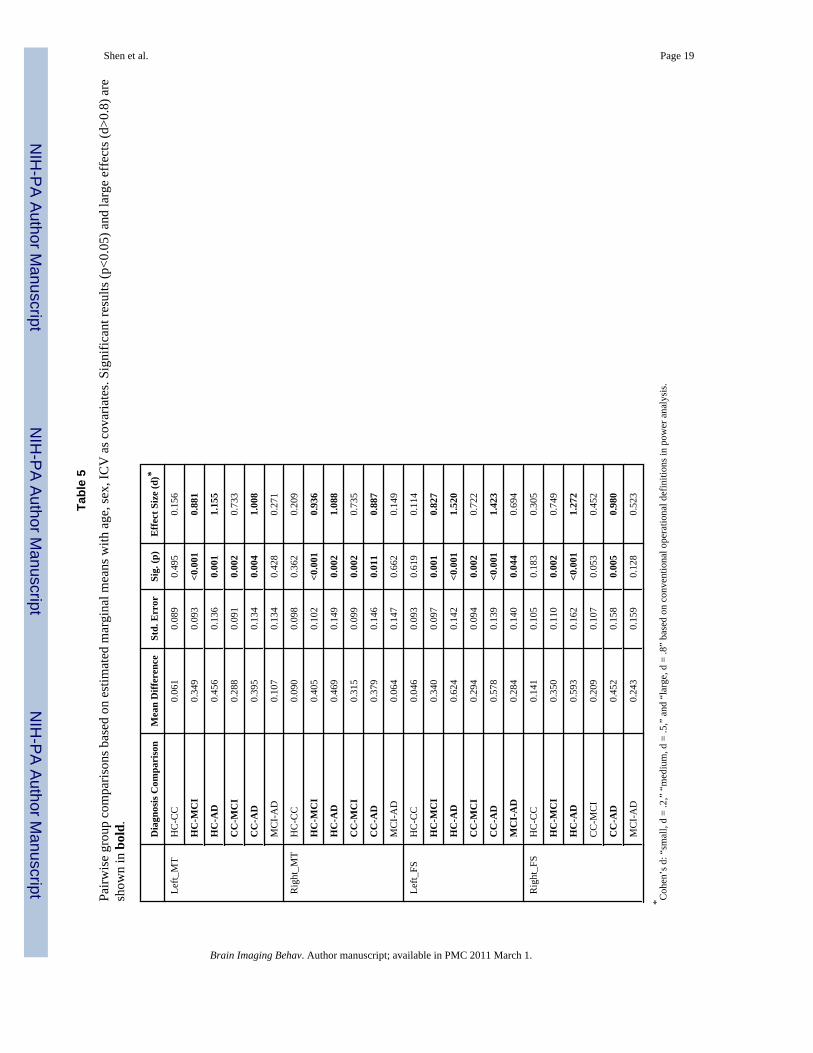
More detailed results on pairwise group comparisons were reported in Table 5. For bothFreeSurfer and manual tracing methods, the following patterns were observed. The AD groupshowed hippocampal volume reduction compared to both the HC (left p=0.001 and rightp=0.002 for manual tracing data, left and right both p<0.001 for FreeSurfer data) and CC (leftp=0.004 and right p=0.011 for manual tracing data, left p<0.001 and right p<0.001 forFreeSurfer data) groups. The MCI group also showed hippocampal volume reductioncompared to both the HC (left and right both p<0.001 for manual tracing data, left p=0.001and right p=0.002 for FreeSurfer data) and CC (left and right both p=0.002 for manual tracingdata, left p=0.002 and right p=0.053 for FreeSurfer data) groups. The HC and CC groups didnot differ (left p=0.495 and right p=0.362 for manual tracing data, left p=0.619 and rightp=0.183 for FreeSurfer data).
We did observe a disagreement between FreeSurfer and manual methods for detecting thevolume difference of the left hippocampus between MCI and AD: while the difference issignificant for FreeSurfer (p=0.044), it is not significant for manual method (p=0.428). Table5 summarized all the above pairwise comparison results as well as reported the correspondingeffect size for each case. Since the sex effect on each hippocampal volume measure was notsignificant (Table 4), we also tested another linear model without including sex as a covariate.That is, we only controlled the effects of age and ICV in the model, and the results were eitheridentical or extremely close to those reported in Table 5.
We also examined the difference between left and right hippocampal volumes within eachgroup and across groups using paired samples t-tests. Similar left and right differences weredetected using manual tracing and FreeSurfer: the left-right hippocampal volume differenceswere significant within each group and across groups (right>left, p ≤0.001).
As mentioned earlier, FreeSurfer volumes as unadjusted numbers are systematically larger thanmanual results (Fig. 4). After adjusting for age, sex and ICV, this systematic difference remainsto some extent (Fig. 5). By visual inspection of the entire sample (see Fig. 2 for two examples),we noticed that FreeSurfer results tend to (1) be more inclusive than manual tracing results,especially in the tail region, and (2) have quite a few local excursions on the surfaces. Toexamine whether this is the cause of the systematic difference shown in Fig. 5 (i.e., FreeSurferVolume > Manual Volume), detailed analysis of shape differences between these two sets ofresults would be a useful topic for future investigation.
DiscussionWe compared an automated method, FreeSurfer (V4), with a published manual protocol forthe determination of hippocampal volume from MRI scans, using data from an existing MCI/AD cohort. Although the two methods might not result in the same volume estimates, ourcorrelation and reliability analyses showed that the hippocampal volumes determined by themanual tracing method and the FreeSurfer method were not only significantly correlated toeach other at levels ranging from 0.76 to 0.90 but also showed significant agreement measuredby ICCs ranging from 0.75 to 0.89.
To test whether the two methods could detect between group differences with similarsensitivity, we conducted additional statistical analysis to examine the hippocampal volumedifference between left and right sides as well as among four groups: HC, CC, MCI and AD.Both the manual tracing method and the FreeSurfer method detected significant differencesbetween left and right hippocampal volumes within group and across groups. Both methods
Shen et al. Page 6
Brain Imaging Behav. Author manuscript; available in PMC 2011 March 1.
NIH
-PA Author Manuscript
NIH
-PA Author Manuscript
NIH
-PA Author Manuscript
also yielded the following patterns: The AD group and the MCI group showed hippocampalvolume reduction compared to both the HC and CC, and the HC and CC groups did not differ.We have hypothesized that the CC group may represent a pre-MCI stage of AD and thereforeeventually provide an earlier therapeutic opportunity than MCI as new disease modifyingagents are assessed. In this regard it is noteworthy that both manually traced and FreeSurfersegmented hippocampal volumes, adjusted for age, gender and ICV, were significantly reducedrelative to HC only in the MCI and AD groups, with the CC group showing an intermediatelevel between MCI and HC. Although volumetric methods did not identify differences betweenthe HC and CC groups, the CC group showed similar but more significant patterns of decreasedgray matter density relative to the HC group on whole brain and hippocampal ROI analyses,and further details are available in Saykin et al (2006).
In summary, the two methods could yield different volume estimates but produce similarcapacity for group discrimination, suggesting that the FreeSurfer method may be useful forautomated determination of hippocampal volumes for group testing in large-scale MCI/AD-related MRI studies. Reproducibility is also very important in that another use in clinical trialscould be as a biomarker for detecting the effects of putatively disease modifying treatments.
Although the convergent validity of hippocampal volume determined by FreeSurfer has beentested in this work and other similar studies (e.g., (Tae, et al., 2008)), future research shouldexamine alternative situations, such as data from different scanners, of different resolutions,contrast profiles, or with different signal to noise ratios. Another potentially important researchdirection is to assess if FreeSurfer can also generate more complex morphometricmeasurements beyond volume (e.g., orientation or shape features) (Shen et al., 2009) or ifadditional postprocessing steps need to be developed in order to achieve such a goal.
Overall, FreeSurfer represents an advance in robust automated volume determination thatagrees reasonably well with a manual tracing method for examining the hippocampus. Withadditional software enhancements, ever improving scan quality, and additional validation, thisand related automated methods are poised to make significant contributions to medical imageanalysis which in turn can provide robust biomarkers for research and clinical applications.
AcknowledgmentsSupported in part by NIA R01 AG19771, NIBIB R03 EB008674-01, NCI R01 CA101318, U54 EB005149 and NIAP30 AG10133 from the NIH, Foundation for the NIH, and grant #87884 from the Indiana Economic DevelopmentCorporation (IEDC). We thank Nick Schmansky and Bruce Fischl of Harvard Medical School and Randy Heiland ofIndiana University for help with running FreeSurfer on IU’s supercomputers.
ReferencesAndreasen NC, Cizadlo T, Harris G, Swayze V, O’Leary DS, Cohen G, et al. Voxel processing techniques
for the antemortem study of neuroanatomy and neuropathology using magnetic resonance imaging.Journal of Neuropsychiatry 1993;5:121–130.
Apostolova LG, Dinov ID, Dutton RA, Hayashi KM, Toga AW, Cummings JL, et al. 3D comparison ofhippocampal atrophy in amnestic mild cognitive impairment and Alzheimer’s disease. Brain 2006;129(Pt 11):2867–2873. [PubMed: 17018552]
Apostolova LG, Dutton RA, Dinov ID, Hayashi KM, Toga AW, Cummings JL, et al. Conversion of mildcognitive impairment to Alzheimer disease predicted by hippocampal atrophy maps. Arch Neurol2006;63(5):693–699. [PubMed: 16682538]
Becker JT, Davis SW, Hayashi KM, Meltzer CC, Toga AW, Lopez OL, et al. Three-dimensional patternsof hippocampal atrophy in mild cognitive impairment. Arch Neurol 2006;63(1):97–101. [PubMed:16401741]
Bouix S, Pruessner JC, Louis Collins D, Siddiqi K. Hippocampal shape analysis using medial surfaces.Neuroimage 2005;25(4):1077–1089. [PubMed: 15850726]
Shen et al. Page 7
Brain Imaging Behav. Author manuscript; available in PMC 2011 March 1.
NIH
-PA Author Manuscript
NIH
-PA Author Manuscript
NIH
-PA Author Manuscript
Buckner RL, Head D, Parker J, Fotenos AF, Marcus D, Morris JC, et al. A unified approach formorphometric and functional data analysis in young, old, and demented adults using automated atlas-based head size normalization: reliability and validation against manual measurement of totalintracranial volume. NeuroImage 2004;23:724–738. [PubMed: 15488422]
Csernansky JG, Wang L, Jones D, Rastogi-Cruz D, Posener JA, Heydebrand G, et al. Hippocampaldeformities in schizophrenia characterized by high dimensional brain mapping. Am J Psychiatry2002;159(12):2000–2006. [PubMed: 12450948]
Csernansky JG, Wang L, Swank J, Miller JP, Gado M, McKeel D, et al. Preclinical detection ofAlzheimer’s disease: hippocampal shape and volume predict dementia onset in the elderly.Neuroimage 2005;25(3):783–792. [PubMed: 15808979]
Dale AM, Fischl B, Sereno MI. Cortical surface-based analysis. I. Segmentation and surfacereconstruction. Neuroimage 1999;9(2):179–194. [PubMed: 9931268]
Fischl B, Salat DH, Busa E, Albert M, Dieterich M, Haselgrove C, et al. Whole brain segmentation:automated labeling of neuroanatomical structures in the human brain. Neuron 2002;33(3):341–355.[PubMed: 11832223]
Fischl B, Sereno MI, Dale AM. Cortical surface-based analysis. II: Inflation, flattening, and a surface-based coordinate system. Neuroimage 1999;9(2):195–207. [PubMed: 9931269]
FreeSurfer Wiki. eTIV - estimated Total Intracranial Volume, aka ICV. 2009. Available athttp://surfer.nmr.mgh.harvard.edu/fswiki/eTIV
Gerig, G.; Styner, M.; Shenton, ME.; Lieberman, JA. Shape versus size: Improved understanding of themorphology of brain structures. Paper presented at the 4th International Conference on MedicalImage Computing and Computer-Assisted Intervention (MICCAI 2001); Ultrecht, the Netherlands.2001 Oct 14–17.
Hogan RE, Wang L, Bertrand ME, Willmore LJ, Bucholz RD, Nassif AS, et al. Predictive value ofhippocampal MR imaging-based high-dimensional mapping in mesial temporal epilepsy:preliminary findings. AJNR Am J Neuroradiol 2006;27(10):2149–2154. [PubMed: 17110686]
Iowa Mental Health Clinical Research Center. BRAINS Software Package. 2008. Available athttp://www.psychiatry.uiowa.edu/mhcrc/IPLpages/BRAINS.htm
Jack CRJ. MRI-based hippocampal volume measurements in epilepsy. Epilepsia 1994;35(Suppl 6):S21–29. [PubMed: 8206012]
Mayo Clinic. Analyze. 2008. Available at http://www.mayo.edu/bir/Software/Analyze/Analyze.htmlMcGraw KO, Wong SP. Forming inferences about some intraclass correlation coefficients. Psychological
Methods 1996;1:30–46.McHugh TL, Saykin AJ, Wishart HA, Flashman LA, Cleavinger HB, Rabin LA, et al. Hippocampal
volume and shape analysis in an older adult population. Clin Neuropsychol 2007;21(1):130–145.[PubMed: 17366281]
Mueller SG, Weiner MW, Thal LJ, Petersen RC, Jack C, Jagust W, et al. The Alzheimer’s diseaseneuroimaging initiative. Neuroimaging Clin N Am 2005;15(4):869–877. xi–xii. [PubMed:16443497]
NAMIC. 3D Slicer Web Page. 2008. Available at http://www.slicer.orgSaykin AJ, Wishart HA, Rabin LA, Santulli RB, Flashman LA, West JD, et al. Older adults with cognitive
complaints show brain atrophy similar to that of amnestic MCI. Neurology 2006;67:834–842.[PubMed: 16966547]
Shen D, Moffat S, Resnick SM, Davatzikos C. Measuring size and shape of the hippocampus in MRimages using a deformable shape model. Neuroimage 2002;15(2):422–434. [PubMed: 11798276]
Shen L, Firpi HA, Saykin AJ, West JD. Parametric surface modeling and registration for comparison ofmanual and automated segmentation of the hippocampus. Hippocampus 2009;19(6):588–595.[PubMed: 19405146]
Shenton ME, Gerig G, McCarley RW, Szekely G, Kikinis R. Amygdala-hippocampal shape differencesin schizophrenia: the application of 3D shape models to volumetric MR data. Psychiatry Res2002;115(1–2):15–35. [PubMed: 12165365]
Tae WS, Kim SS, Lee KU, Nam EC, Kim KW. Validation of hippocampal volumes measured using amanual method and two automated methods (FreeSurfer and IBASPM) in chronic major depressivedisorder. Neuroradiology. 2008
Shen et al. Page 8
Brain Imaging Behav. Author manuscript; available in PMC 2011 March 1.
NIH
-PA Author Manuscript
NIH
-PA Author Manuscript
NIH
-PA Author Manuscript
Thompson PM, Hayashi KM, De Zubicaray GI, Janke AL, Rose SE, Semple J, et al. Mappinghippocampal and ventricular change in Alzheimer disease. Neuroimage 2004;22(4):1754–1766.[PubMed: 15275931]
Torres IJ, Flashman LA, O’Leary DS, Swayze VI, Andreasen NC. Lack of an association between delayedmemory and hippocampal and temporal lobe size in patients with schizophrenia and healthy controls.Biological Psychiatry 1997;42(12):1087–1096. [PubMed: 9426878]
Wang L, Beg F, Ratnanather T, Ceritoglu C, Younes L, Morris JC, et al. Large deformationdiffeomorphism and momentum based hippocampal shape discrimination in dementia of theAlzheimer type. IEEE Trans Med Imaging 2007;26(4):462–470. [PubMed: 17427733]
Wang L, Joshi SC, Miller MI, Csernansky JG. Statistical analysis of hippocampal asymmetry inschizophrenia. Neuroimage 2001;14(3):531–545. [PubMed: 11506528]
Wang L, Miller JP, Gado MH, McKeel DW, Rothermich M, Miller MI, et al. Abnormalities ofhippocampal surface structure in very mild dementia of the Alzheimer type. Neuroimage 2006;30(1):52–60. [PubMed: 16243546]
Wang P, Saykin A, Flashman L, Wishart H, Rabin L, Santulli R, et al. Regionally specific atrophy of thecorpus callosum in AD, MCI and cognitive complaints. Neurobiol Aging 2006;27(11):1613–1617.[PubMed: 16271806]
Watson C, Andermann F, Gloor P, Jones-Gotman M, Peters T, Evans A, et al. Anatomic basis ofamygdaloid and hippocampal volume measurement by magnetic resonance imaging. Neurology1992;42(9):1743–1750. [PubMed: 1513464]
Yushkevich PA, Detre JA, Mechanic-Hamilton D, Fernandez-Seara MA, Tang KZ, Hoang A, et al.Hippocampus-specific fMRI group activation analysis using the continuous medial representation.Neuroimage 2007;35(4):1516–1530. [PubMed: 17383900]
Yushkevich PA, Piven J, Hazlett HC, Smith RG, Ho S, Gee JC, et al. User-guided 3D active contoursegmentation of anatomical structures: significantly improved efficiency and reliability. Neuroimage2006;31(3):1116–1128. [PubMed: 16545965]
Shen et al. Page 9
Brain Imaging Behav. Author manuscript; available in PMC 2011 March 1.
NIH
-PA Author Manuscript
NIH
-PA Author Manuscript
NIH
-PA Author Manuscript
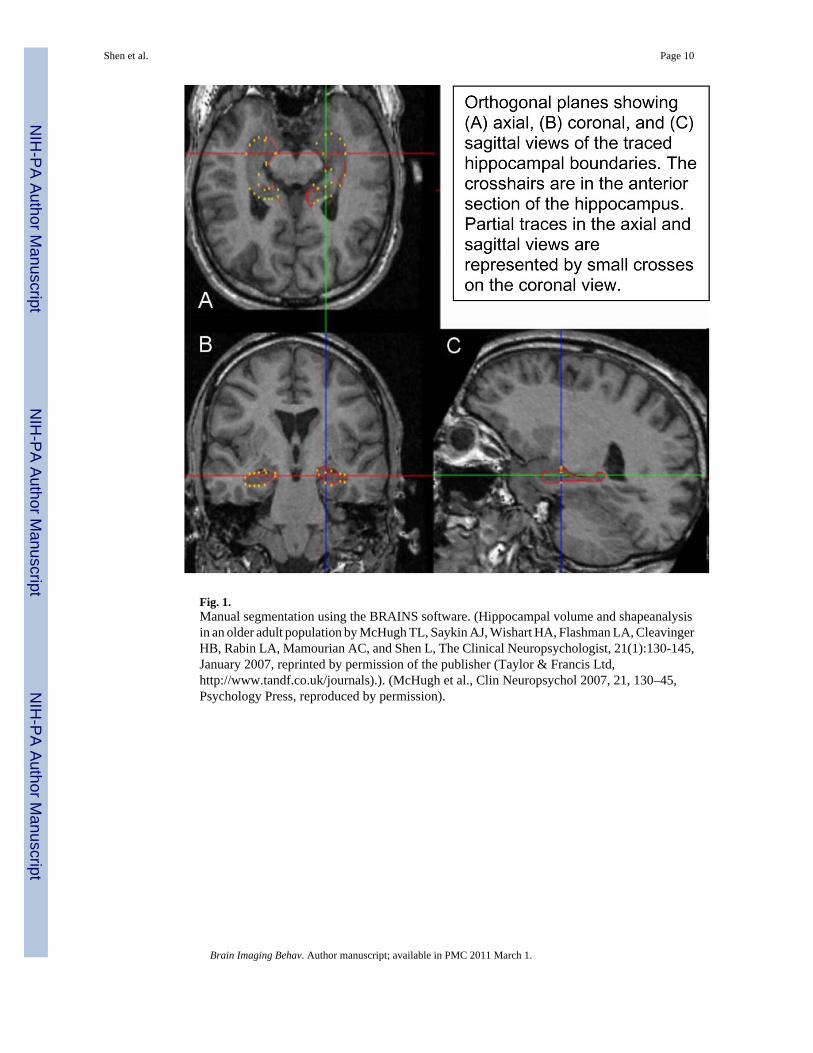
Fig. 1.Manual segmentation using the BRAINS software. (Hippocampal volume and shapeanalysisin an older adult population by McHugh TL, Saykin AJ, Wishart HA, Flashman LA, CleavingerHB, Rabin LA, Mamourian AC, and Shen L, The Clinical Neuropsychologist, 21(1):130-145,January 2007, reprinted by permission of the publisher (Taylor & Francis Ltd,http://www.tandf.co.uk/journals).). (McHugh et al., Clin Neuropsychol 2007, 21, 130–45,Psychology Press, reproduced by permission).
Shen et al. Page 10
Brain Imaging Behav. Author manuscript; available in PMC 2011 March 1.
NIH
-PA Author Manuscript
NIH
-PA Author Manuscript
NIH
-PA Author Manuscript
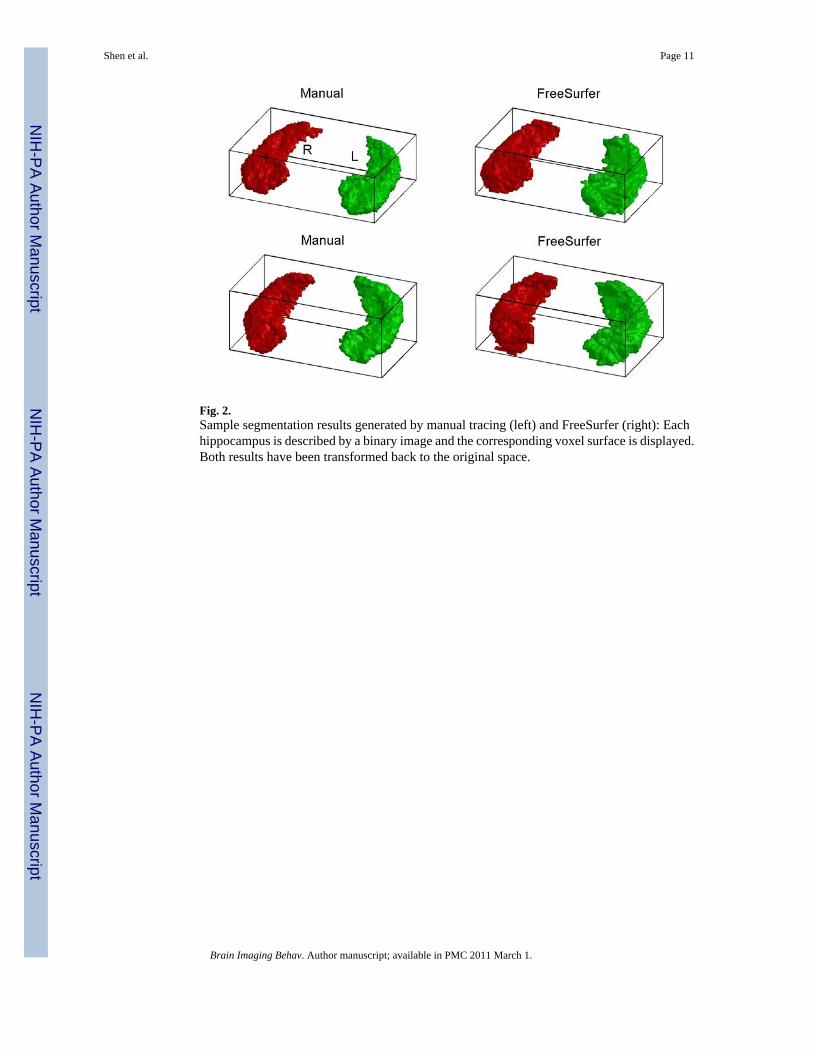
Fig. 2.Sample segmentation results generated by manual tracing (left) and FreeSurfer (right): Eachhippocampus is described by a binary image and the corresponding voxel surface is displayed.Both results have been transformed back to the original space.
Shen et al. Page 11
Brain Imaging Behav. Author manuscript; available in PMC 2011 March 1.
NIH
-PA Author Manuscript
NIH
-PA Author Manuscript
NIH
-PA Author Manuscript
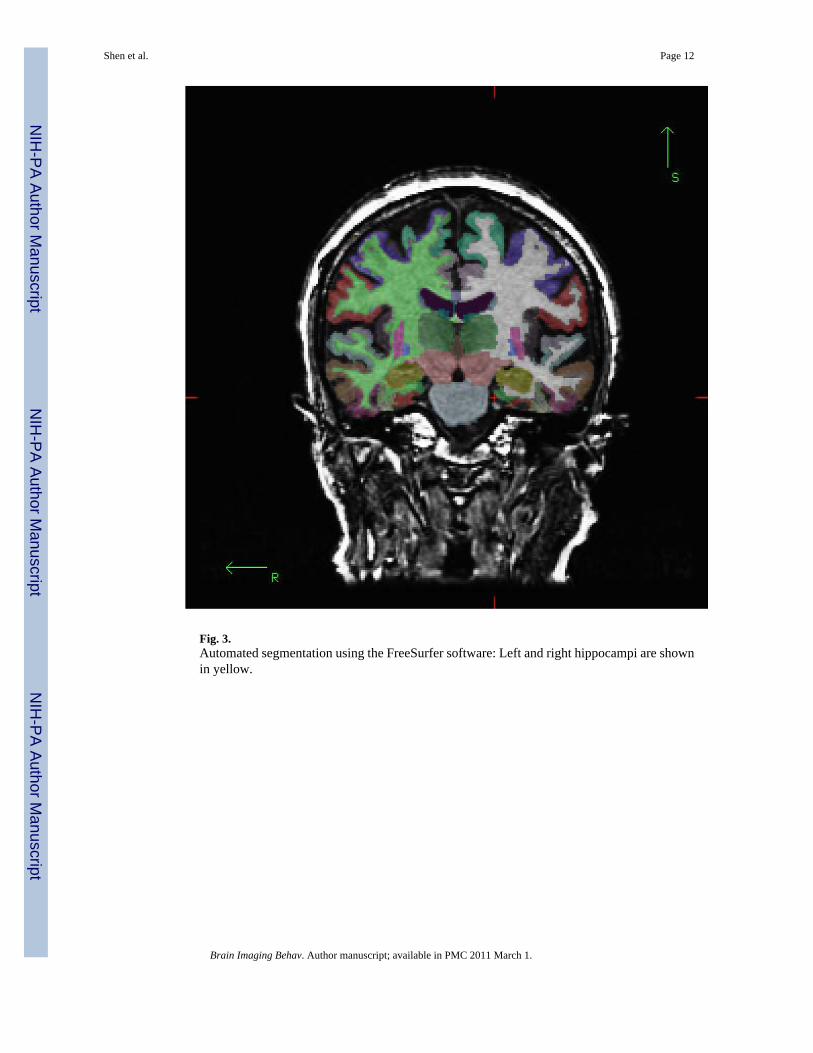
Fig. 3.Automated segmentation using the FreeSurfer software: Left and right hippocampi are shownin yellow.
Shen et al. Page 12
Brain Imaging Behav. Author manuscript; available in PMC 2011 March 1.
NIH
-PA Author Manuscript
NIH
-PA Author Manuscript
NIH
-PA Author Manuscript
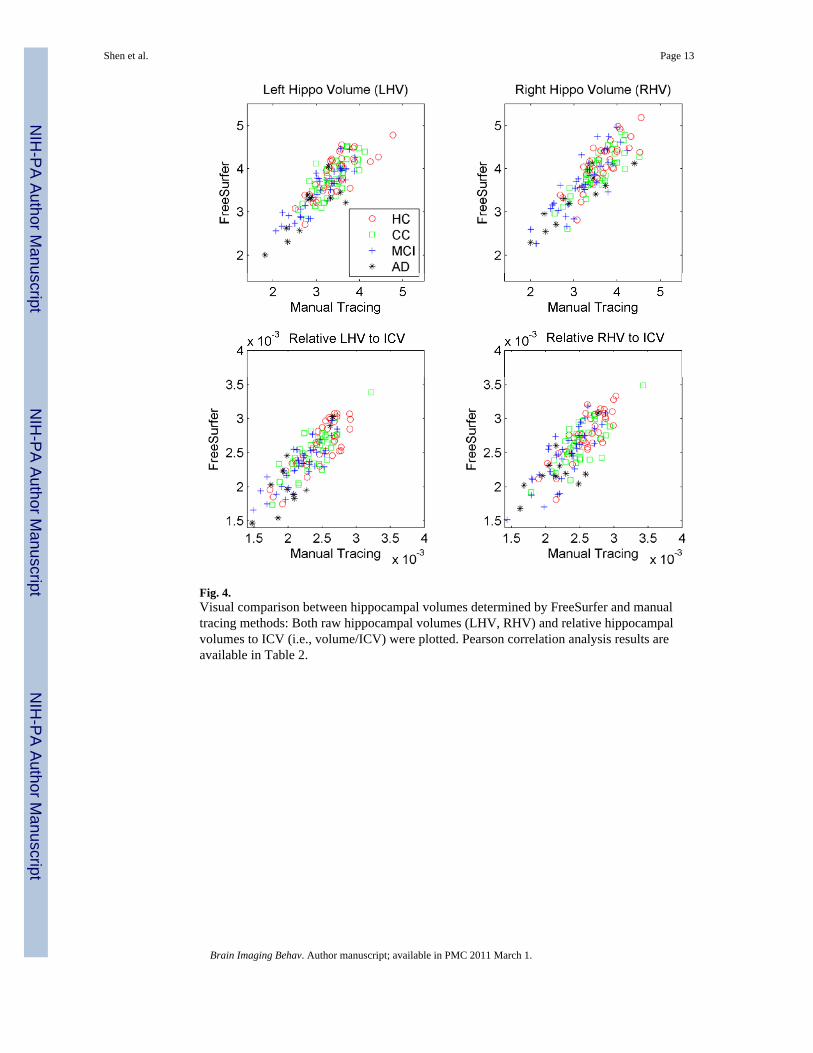
Fig. 4.Visual comparison between hippocampal volumes determined by FreeSurfer and manualtracing methods: Both raw hippocampal volumes (LHV, RHV) and relative hippocampalvolumes to ICV (i.e., volume/ICV) were plotted. Pearson correlation analysis results areavailable in Table 2.
Shen et al. Page 13
Brain Imaging Behav. Author manuscript; available in PMC 2011 March 1.
NIH
-PA Author Manuscript
NIH
-PA Author Manuscript
NIH
-PA Author Manuscript
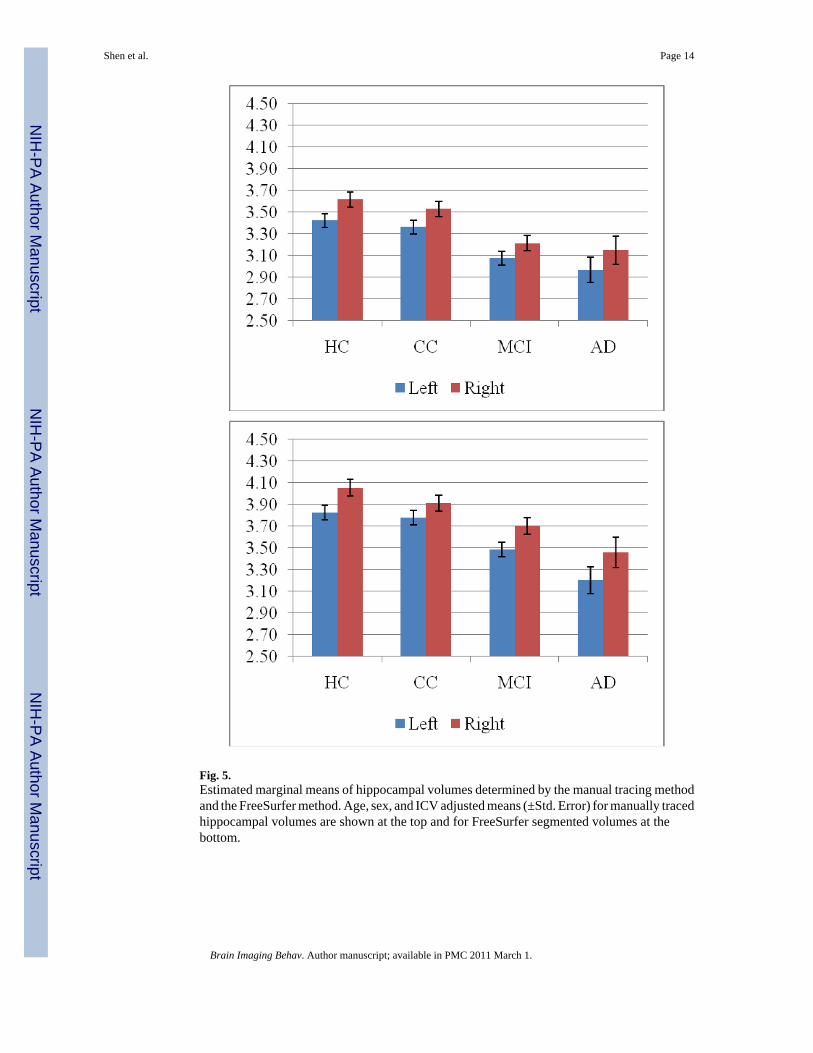
Fig. 5.Estimated marginal means of hippocampal volumes determined by the manual tracing methodand the FreeSurfer method. Age, sex, and ICV adjusted means (±Std. Error) for manually tracedhippocampal volumes are shown at the top and for FreeSurfer segmented volumes at thebottom.
Shen et al. Page 14
Brain Imaging Behav. Author manuscript; available in PMC 2011 March 1.
NIH
-PA Author Manuscript
NIH
-PA Author Manuscript
NIH
-PA Author Manuscript
NIH
-PA Author Manuscript
NIH
-PA Author Manuscript
NIH
-PA Author Manuscript
Shen et al. Page 15
Table 1
Sample Characteristics and ANOVA results for testing between group differences.
Age (mean±std, in years) Education (mean±std, in years) Sex (M, F)
Healthy Controls (HC, n=38) 70.6±5.2 16.7±2.7 11, 27
Cognitive Complaint (CC, n=39) 72.8±6.1 16.5±2.6 15, 24
Mild Cognitive Impairments (MCI, n=37) 72.7±7.1 16.3±3.2 22, 15
Alzheimer’s Disease (AD, n=11) 75.6±6.8 14.4±3.5 5, 6
ALL (n=125) 72.3±6.3 16.3±2.9 53, 72
df, F, p (between group difference) 3, 2.149, 0.098 3, 1.955, 0.124 3, 2.580, 0.057
Brain Imaging Behav. Author manuscript; available in PMC 2011 March 1.
NIH
-PA Author Manuscript
NIH
-PA Author Manuscript
NIH
-PA Author Manuscript
Shen et al. Page 16
Tabl
e 2
Pear
son
corr
elat
ion
coef
ficie
nts r
with
p-v
alue
bet
wee
n hi
ppoc
ampa
l vol
umes
det
erm
ined
by
Free
Surf
er an
d m
anua
l tra
cing
met
hods
. Bot
h ra
w h
ippo
cam
pal
volu
mes
(LH
V, R
HV
) and
‘rel
ativ
e’ h
ippo
cam
pal v
olum
es (i
.e.,
volu
me
divi
ded
by th
e co
rres
pond
ing
ICV
) wer
e an
alyz
ed; s
ee F
ig. 4
for s
catte
r plo
ts.
Intra
cran
ial v
olum
es (I
CV
s) d
eter
min
ed b
y Fr
eeSu
rfer
and
man
ual t
raci
ng m
etho
ds w
ere
also
com
pare
d.
All
(n=1
25)
HC
(n=3
8)C
C (n
=39)
MC
I (n=
37)
AD
(n=1
1)
LH
Vr =
0.8
42r =
0.7
71r =
0.7
57r =
0.8
95r =
0.8
08
p <
0.00
1p
< 0.
001
p <
0.00
1p
< 0.
001
p =
0.00
3
RH
Vr =
0.8
50r =
0.8
03r =
0.8
26r =
0.8
49r =
0.9
01
p <
0.00
1p
< 0.
001
p <
0.00
1p
< 0.
001
p <
0.00
1
Rel
ativ
e L
HV
r = 0
.850
r = 0
.817
r = 0
.797
r = 0
.862
r = 0
.813
p <
0.00
1p
< 0.
001
p <
0.00
1p
< 0.
001
p =
0.00
2
Rel
ativ
e R
HV
r = 0
.832
r = 0
.819
r = 0
.796
r = 0
.834
r = 0
.660
p <
0.00
1p
< 0.
001
p <
0.00
1p
< 0.
001
p =
0.02
7
ICV
r = 0
.929
r = 0
.919
r = 0
.930
r = 0
.942
r = 0
.931
p <
0.00
1p
< 0.
001
p <
0.00
1p
< 0.
001
p <
0.00
1
Brain Imaging Behav. Author manuscript; available in PMC 2011 March 1.
NIH
-PA Author Manuscript
NIH
-PA Author Manuscript
NIH
-PA Author Manuscript
Shen et al. Page 17
Tabl
e 3
Intra
clas
s Cor
rela
tion
Coe
ffic
ient
s (IC
Cs)
with
in g
roup
and
bet
wee
n gr
oups
: Tw
o-w
ay m
ixed
eff
ects
mod
el w
here
sam
ple
(per
son)
eff
ects
are
rand
om a
ndm
easu
re (m
anua
l, au
tom
ated
) eff
ects
are
fixe
d. A
“re
lativ
e vo
lum
e to
ICV
” is
cal
cula
ted
as th
e or
igin
al v
olum
e di
vide
d by
the
corr
espo
ndin
g IC
V.
Intr
acla
ss C
orre
latio
n
95%
Con
fiden
ce In
terv
alF
Tes
t with
Tru
e V
alue
0
Low
er B
ound
Upp
er B
ound
Val
uedf
1df
2Si
g
All
(n=1
25)
Left
Hip
po V
ol (L
HV
)0.
838
0.77
70.
883
11.3
4912
412
4<0
.001
Rig
ht H
ippo
Vol
(RH
V)
0.84
50.
786
0.88
811
.865
124
124
<0.0
01
Rel
ativ
e LH
V to
ICV
0.84
50.
786
0.88
911
.907
124
124
<0.0
01
Rel
ativ
e R
HV
to IC
V0.
825
0.76
00.
874
10.4
3712
412
4<0
.001
HC
(n=3
8)
Left
Hip
po V
ol (L
HV
)0.
771
0.60
10.
874
7.71
637
37<0
.001
Rig
ht H
ippo
Vol
(RH
V)
0.79
30.
637
0.88
78.
672
3737
<0.0
01
Rel
ativ
e LH
V to
ICV
0.81
10.
666
0.89
79.
586
3737
<0.0
01
Rel
ativ
e R
HV
to IC
V0.
805
0.65
50.
893
9.24
037
37<0
.001
CC
(n=3
9)
Left
Hip
po V
ol (L
HV
)0.
752
0.57
40.
862
7.05
438
38<0
.001
Rig
ht H
ippo
Vol
(RH
V)
0.82
30.
687
0.90
310
.288
3838
<0.0
01
Rel
ativ
e LH
V to
ICV
0.79
60.
644
0.88
88.
811
3838
<0.0
01
Rel
ativ
e R
HV
to IC
V0.
787
0.62
90.
882
8.36
838
38<0
.001
MC
I (n=
37)
Left
Hip
po V
ol (L
HV
)0.
893
0.80
20.
943
17.6
9736
36<0
.001
Rig
ht H
ippo
Vol
(RH
V)
0.83
40.
701
0.91
111
.068
3636
<0.0
01
Rel
ativ
e LH
V to
ICV
0.86
20.
748
0.92
613
.490
3636
<0.0
01
Rel
ativ
e R
HV
to IC
V0.
823
0.68
20.
905
10.2
9036
36<0
.001
AD
(n=1
1)
Left
Hip
po V
ol (L
HV
)0.
807
0.43
30.
944
9.38
710
100.
001
Rig
ht H
ippo
Vol
(RH
V)
0.88
90.
640
0.96
916
.939
1010
<0.0
01
Rel
ativ
e LH
V to
ICV
0.76
30.
333
0.93
07.
436
1010
0.00
2
Rel
ativ
e R
HV
to IC
V0.
660
0.13
50.
896
4.88
210
100.
010
Brain Imaging Behav. Author manuscript; available in PMC 2011 March 1.
NIH
-PA Author Manuscript
NIH
-PA Author Manuscript
NIH
-PA Author Manuscript
Shen et al. Page 18
Tabl
e 4
Line
ar re
gres
sion
resu
lts o
n al
l sub
ject
s (n=
125)
. Trip
le v
alue
s in
each
ent
ry re
pres
ent r
egre
ssio
n co
effic
ient
, t-v
alue
, and
p-v
alue
, res
pect
ivel
y. S
igni
fican
tre
sults
(p<0
.05)
are
show
n in
bol
d.
Age
Edu
catio
nSe
xIC
V_M
TIC
V_F
S
Lef
t_M
T−0
.030
, −5.
026,
<0.
001
0.00
2, 0
.104
, 0.9
180.
005,
0.0
48, 0
.962
0.00
1, 3
.911
, <0.
001
N/A
Rig
ht_M
T−0
.026
, −3.
978,
<0.
001
0.00
4, 0
.230
, 0.8
180.
107,
0.9
93, 0
.323
0.00
2, 4
.808
, <0.
001
N/A
Lef
t_FS
−0.0
43, −
6.78
9, <
0.00
1−0
.005
, −0.
317,
0.7
52−0
.023
, −0.
232,
0.8
17N
/A0.
001,
3.4
66, 0
.001
Rig
ht_F
S−0
.048
, −6.
893,
<0.
001
0.00
6, 0
.328
, 0.7
440.
079,
0.7
26, 0
.469
N/A
0.00
1, 3
.861
, <0.
001
Brain Imaging Behav. Author manuscript; available in PMC 2011 March 1.
NIH
-PA Author Manuscript
NIH
-PA Author Manuscript
NIH
-PA Author Manuscript
Shen et al. Page 19
Tabl
e 5
Pairw
ise
grou
p co
mpa
rison
s bas
ed o
n es
timat
ed m
argi
nal m
eans
with
age
, sex
, IC
V a
s cov
aria
tes.
Sign
ifica
nt re
sults
(p<0
.05)
and
larg
e ef
fect
s (d>
0.8)
are
show
n in
bol
d. Dia
gnos
is C
ompa
riso
nM
ean
Diff
eren
ceSt
d. E
rror
Sig.
(p)
Effe
ct S
ize
(d)*
Left_
MT
HC
-CC
0.06
10.
089
0.49
50.
156
HC
-MC
I0.
349
0.09
3<0
.001
0.88
1
HC
-AD
0.45
60.
136
0.00
11.
155
CC
-MC
I0.
288
0.09
10.
002
0.73
3
CC
-AD
0.39
50.
134
0.00
41.
008
MC
I-A
D0.
107
0.13
40.
428
0.27
1
Rig
ht_M
TH
C-C
C0.
090
0.09
80.
362
0.20
9
HC
-MC
I0.
405
0.10
2<0
.001
0.93
6
HC
-AD
0.46
90.
149
0.00
21.
088
CC
-MC
I0.
315
0.09
90.
002
0.73
5
CC
-AD
0.37
90.
146
0.01
10.
887
MC
I-A
D0.
064
0.14
70.
662
0.14
9
Left_
FSH
C-C
C0.
046
0.09
30.
619
0.11
4
HC
-MC
I0.
340
0.09
70.
001
0.82
7
HC
-AD
0.62
40.
142
<0.0
011.
520
CC
-MC
I0.
294
0.09
40.
002
0.72
2
CC
-AD
0.57
80.
139
<0.0
011.
423
MC
I-A
D0.
284
0.14
00.
044
0.69
4
Rig
ht_F
SH
C-C
C0.
141
0.10
50.
183
0.30
5
HC
-MC
I0.
350
0.11
00.
002
0.74
9
HC
-AD
0.59
30.
162
<0.0
011.
272
CC
-MC
I0.
209
0.10
70.
053
0.45
2
CC
-AD
0.45
20.
158
0.00
50.
980
MC
I-A
D0.
243
0.15
90.
128
0.52
3
* Coh
en’s
d: “
smal
l, d
= .2
,” “
med
ium
, d =
.5,”
and
“la
rge,
d =
.8”
base
d on
con
vent
iona
l ope
ratio
nal d
efin
ition
s in
pow
er a
naly
sis.
Brain Imaging Behav. Author manuscript; available in PMC 2011 March 1.