Comparison of human axillary odour profiles obtained by gas chromatography/mass spectrometry and...
11
Comparison of human axillary odour profiles obtained by gas chromatography/mass spectrometry and skin microbial profiles obtained by denaturing gradient gel electrophoresis using multivariate pattern recognition Yun Xu, a Sarah J. Dixon, a Richard G. Brereton, a, * Helena A. Soini, b Milos V. Novotny, b Karlheinz Trebesius, c Ingrid Bergmaier, c Elisabeth Oberzaucher, d Karl Grammer, d and Dustin J. Penn e a Centre for Chemometrics, School of Chemistry, University of Bristol, Cantocks Close, Bristol, BS8 1TS, UK b Institute for Pheromone Research and Department of Chemistry, Indiana University, 800 E. Kirkwood Ave, Bloomington, IN, 47405, USA c Vermicon AG, Emmy-Noether-Str. 2, 80992, Munich, Germany d Department for Anthropology, Ludwig Boltzmann Institute for Urban Ethology, Althanstrasse 14, A-1090, Vienna, Austria e Konrad Lorenz Institute for Ethology, Austrian Academy of Sciences, Savoyenstr. 1a, A-1160, Vienna, Austria Received 19 November 2006; Accepted 22 March 2007 Several studies have shown that microbial action is responsible for many compounds responsible for human odour. In this paper, we compare the pattern of microbial profiles and that of chemical profiles of human axillary odour by using multivariate pattern matching techniques. Approximately 200 subjects from Carinthia, Austria, participated in the study. The microbial profiles were represented by denaturing gradient gel electrophoresis (DGGE) analysis and the axillary odour profiles were determined in the sweat samples collected by a stir-bar sampling device and analysed by gas chromatography/mass spectrometry (GC/MS). Both qualitative and quantitative distance metrics were used to construct dissimilarity matrices between samples which were then used to represent the patterns of these two types of profiles. The distance matrices were then compared by using the Mantel test and the Procrustean test. The results show that on the overall dataset there is no strong correlation between microbial and chemical profiles. When the data are split into family groups, correlations vary according to family with a range of estimated p values from 0.00 to 0.90 that the null hypothesis (no correlation) holds. When 32 subjects who followed four basic rules of behaviour were selected, the estimated p-values are 0.00 using qualitative and <0.01 using quantitative distance metrics, suggesting excellent evidence that there is a connection between the microbial and chemical signature. KEY WORDS: multivariate pattern comparison; human odour profile; human microbial profile; gas chromatography/mass spectrometry; denaturing gradient gel electrophoresis. 1. Introduction It is well known that axillary microflora play very important roles in human odour production. Previous studies have shown that the population density of certain micro-organisms has strong association with the intensity of odour (Rennie et al., 1990, 1991). Certain areas of the human body possess a unique odour which is produced partially by microbial action, especially the human axillary odour is a combination of secretions from eccrine, apocrine, apoeccrine and sebaceous glands together with the local microflora (Sastry et al., 1980; Sato et al., 1987). Studies have also shown that axillary odour is absent if Gram-positive bacteria are eliminated from the skin (Marples, 1969; Gower et al., 1985). In this study, we compare the pattern of microbial profiles obtained by denaturing gradient gel electropho- resis (DGGE) with the pattern of chemical human axillary odour obtained by gas chromatography/mass spectrometry (GC/MS) and explore the common trends between these two types of profile. Samples were taken from approximately 200 test subjects. Most subjects were sampled twice for the microbial signature, and five times for the chemical signature, each sample taken over dif- ferent fortnights. Our previous studies have shown that there is strong statistical evidence that both in GC/MS and DGGE data, reproducible signals exist for individ- ual characterisation (Penn et al., 2007; Xu et al., in preparation). In this paper, pair-wise dissimilarity matrices (both qualitative and quantitative distance metrics) were calculated on both GC/MS and DGGE profiles to determine the patterns of these two types of data. The similarity of these two patterns was evaluated by the permuted Mantel test. We also transformed the dissimilarity matrices to sample-latent variable matrices using Principal Co-ordinates Analysis and then com- pared the patterns of these two matrices by using a test based on Procrustes analysis. * To whom correspondence should be addressed. E-mail: [email protected]. Metabolomics, Vol. 3, No. 4, December 2007 (ȑ 2007) DOI: 10.1007/s11306-007-0054-6 427 1573-3882/07/1200-0427/0 ȑ 2007 Springer ScienceþBusiness Media, Inc.
Transcript of Comparison of human axillary odour profiles obtained by gas chromatography/mass spectrometry and...

Comparison of human axillary odour profiles obtained by gas
chromatography/mass spectrometry and skin microbial profiles
obtained by denaturing gradient gel electrophoresis using multivariate
pattern recognition
Yun Xu,a Sarah J. Dixon,a Richard G. Brereton,a,* Helena A. Soini,b Milos V. Novotny,b Karlheinz Trebesius,c
Ingrid Bergmaier,c Elisabeth Oberzaucher,d Karl Grammer,d and Dustin J. Penne
aCentre for Chemometrics, School of Chemistry, University of Bristol, Cantocks Close, Bristol, BS8 1TS, UKbInstitute for Pheromone Research and Department of Chemistry, Indiana University, 800 E. Kirkwood Ave, Bloomington, IN, 47405, USA
cVermicon AG, Emmy-Noether-Str. 2, 80992, Munich, GermanydDepartment for Anthropology, Ludwig Boltzmann Institute for Urban Ethology, Althanstrasse 14, A-1090, Vienna, Austria
eKonrad Lorenz Institute for Ethology, Austrian Academy of Sciences, Savoyenstr. 1a, A-1160, Vienna, Austria
Received 19 November 2006; Accepted 22 March 2007
Several studies have shown that microbial action is responsible for many compounds responsible for human odour. In this
paper, we compare the pattern of microbial profiles and that of chemical profiles of human axillary odour by using multivariate
pattern matching techniques. Approximately 200 subjects from Carinthia, Austria, participated in the study. The microbial profiles
were represented by denaturing gradient gel electrophoresis (DGGE) analysis and the axillary odour profiles were determined in the
sweat samples collected by a stir-bar sampling device and analysed by gas chromatography/mass spectrometry (GC/MS). Both
qualitative and quantitative distance metrics were used to construct dissimilarity matrices between samples which were then used to
represent the patterns of these two types of profiles. The distance matrices were then compared by using the Mantel test and the
Procrustean test. The results show that on the overall dataset there is no strong correlation between microbial and chemical profiles.
When the data are split into family groups, correlations vary according to family with a range of estimated p values from 0.00 to
0.90 that the null hypothesis (no correlation) holds. When 32 subjects who followed four basic rules of behaviour were selected, the
estimated p-values are 0.00 using qualitative and <0.01 using quantitative distance metrics, suggesting excellent evidence that there
is a connection between the microbial and chemical signature.
KEY WORDS: multivariate pattern comparison; human odour profile; human microbial profile; gas chromatography/mass
spectrometry; denaturing gradient gel electrophoresis.
1. Introduction
It is well known that axillary microflora play veryimportant roles in human odour production. Previousstudies have shown that the population density ofcertain micro-organisms has strong association with theintensity of odour (Rennie et al., 1990, 1991). Certainareas of the human body possess a unique odour whichis produced partially by microbial action, especially thehuman axillary odour is a combination of secretionsfrom eccrine, apocrine, apoeccrine and sebaceous glandstogether with the local microflora (Sastry et al., 1980;Sato et al., 1987). Studies have also shown that axillaryodour is absent if Gram-positive bacteria are eliminatedfrom the skin (Marples, 1969; Gower et al., 1985).
In this study, we compare the pattern of microbialprofiles obtained by denaturing gradient gel electropho-resis (DGGE) with the pattern of chemical human
axillary odour obtained by gas chromatography/massspectrometry (GC/MS) and explore the common trendsbetween these two types of profile. Samples were takenfrom approximately 200 test subjects. Most subjects weresampled twice for the microbial signature, and five timesfor the chemical signature, each sample taken over dif-ferent fortnights. Our previous studies have shown thatthere is strong statistical evidence that both in GC/MSand DGGE data, reproducible signals exist for individ-ual characterisation (Penn et al., 2007; Xu et al., inpreparation). In this paper, pair-wise dissimilaritymatrices (both qualitative and quantitative distancemetrics) were calculated on both GC/MS and DGGEprofiles to determine the patterns of these two types ofdata. The similarity of these two patterns was evaluatedby the permuted Mantel test. We also transformed thedissimilarity matrices to sample-latent variable matricesusing Principal Co-ordinates Analysis and then com-pared the patterns of these two matrices by using a testbased on Procrustes analysis.
* To whom correspondence should be addressed.
E-mail: [email protected].
Metabolomics, Vol. 3, No. 4, December 2007 (� 2007)DOI: 10.1007/s11306-007-0054-6 427
1573-3882/07/1200-0427/0 � 2007 Springer ScienceþBusiness Media, Inc.
2. Experimental
2.1. Test subjects
A total number of 196 subjects participated in thisstudy. These individuals are from an isolated populationin Carinthia, Southern Austria, belonging to 17 differentfamilies, coded by a single letter (e.g. A). The sampleswere taken from July to August, 2005, the odour sam-ples were collected five times for each subject, once perfortnight while microbial samples were collected twice,(on the third and fourth fortnights). In this paper,we only consider the fortnights when the microbialand odour samples were collected simultaneously. Thesubjects were also asked to fill in a survey when thesamples were taken which contains information abouttheir living habits, such as when was the last washing ofarmpit, and when was the last usage of deodorant asdiscussed in greater detail in Section 4. Due to experi-mental reasons, some subjects only provided one sampleover fortnights 3 and 4 and they were excluded from theanalysis, making the number of subjects reported in thispaper less than the full population. A total of P = 177subjects are analysed in this study, each sampled twiceto give 2P samples, each with a corresponding GC/MSand microbial profile.
2.2. Human axillary odour samples collection andGC/MS analysis
The volatile and semivolatile compounds from arm-pits were collected by using a newly designed skin rollerdevice. A stir bar is attached to the device and rolledover the skin to collect chemical compounds. The stirbar was then subjected to the GC/MS analysis. Stir barsampling on the skin surface is likely to favour com-pounds which bind in the oily layer present on thehuman skin: in fact, the relatively long storage stabilitytime of 20 days under cooled conditions supports thehypothesis. Compounds with high volatility and of veryhydrophilic characteristics would be discriminatedagainst using this sampling approach. During the sameday, reproducibility for typical skin compounds takenfrom five individuals was 3–25% (RSD, relative stan-dard deviation, three samples per individual). The longterm RSD of the internal standard is 14.3%. Moredetailed information about the characteristics and thereproducibility of both the sampling device and the GC/MS experiments are given elsewhere (Soini et al., 2006).
The GC equipment for quantitative analysis consistedof an Agilent 6890N gas chromatograph connected to a5973i MSD mass spectrometer (Agilent Technologies,Palo Alto, CA) with a Thermal Desorption Autosampler(TDSA,Gerstel,Mulheim an derRuhr). Positive electronionisation (EI) mode at 70 eV was used with a scanningrate of 4.51 scans/s over the mass range of m/z 35–350.The ion source and quadrupole temperatures were set at230 �C and 150 �C, respectively.The separation capillary
was DB-5MS (20 m·0.18 mm, i.d., 0.18 lm film thick-ness) from Agilent Technologies (Wilmington, DE).Samples were thermally desorbed in a TDSA automatedsystem, followed by injection into the column with aCooled Injection System, CIS-4. The TDSAoperated in asplitless mode. The temperature program for desorptionwas 20 �C (0.5 min), then 60 �C/min to 250 �C (3 min).The temperature of the transfer linewas set at 280 �C.TheCIS was cooled with liquid nitrogen to )80 �C. Afterdesorption and cryotrapping, the CIS was heated at12 �C/s to 280 �C with the hold time of 10 min. The CISinlet was operated in the solvent vent mode, with a ventpressure of 14 psi, a vent flow of 50 mL/min, and a purgeflow of 50 mL/min. The temperature program in the GCoperation was 50 �C for 1 min, then increasing to 160 �Cat the rate of 5 �C/min, followedby the second rampat therate of 3 �C/min to 200 �C (hold time 16 min). The carriergas head pressure was 14 psi (flow rate, 0.7 mL/min atconstant flow mode). The GC temperature programlasted for 52.33 min, with mass spectrometric detectioncommencing after a deadtime of 1.88 min (solvent delay).To increase throughput, two instruments of identicalspecifications were used to analyse the samples. Theconfiguration of both instruments was the same, and testshad been done to ensure reference samples analysed oneach instrumentwere of acceptable similarity. Therewas aslight difference in scan rates between the two instru-ments, with instrument 1 sampling 13,481 scans over theanalysis period, and instrument 2 sampling 13,460 due toslightly different software versions. In the mass spec-trometry software (Agilent ChemStation) a parameter isset, below which a scan will be recorded as having zerointensity. This is the detection limit of the instrument, andcan be set by the instrument operator. In this work, it wasset to 300: this number is essentially arbitrary and willdependon the specific instrument, but in the context of thecurrent study the smallest peaks which were visible abovethe noise were of height around 600 units. Typical peakheights in a mass channel range from 1000 to 100,000(varying from sample to sample). Themass resolutionwasreduced to unity before analysis. During the analysis,test runs using quality control samples were performedon a regular basis to ensure that the instruments wereperforming acceptably.
2.3. Microbial sampling and DGGE analysis
2.3.1. Fixation of samplesMicrobial samples were taken in Greifenburg (Carinthia,Austria) from the armpit of different subjects. Samplingof the axillary microflora of the armpit was performed bythe washing-scrub method of Williamson and Kligman(1965). A plastic cylinder open at both ends was placedon the armpit. About 1.5 mL detergent solution wasfilled into the cylinder. A glass stirrer was moved withconstant pressure over the skin to detach the micro-organisms. The solution was removed and transferred to
Y. Xu et al./Comparison of human axillary odour profiles428

a sterilised reaction tube and the procedure was repeated.The obtained solutions were fixed with ethanol at a ratio1:1. The total sample volume of 6 mL consisted of 3 mLsampling buffer containing the microbes (sample) and3 mL of 96% ethanol.
2.3.2. DNA extractionAbout 1.3 mL of the sample was centrifuged (10 min,14,000 rpm) and the supernatant was discarded. Thisstep was repeated once, by adding 1.3 mL sample to thepellet and an additional centrifugation step (10 min,14,000 rpm). The obtained pellet was washed in 200 lL1· phosphate-buffered saline (PBS). After centrifugation(10 min, 14,000 rpm) the pellet was resuspended in100 lL 6% Chelex� 100 solution (BioRad, Munich,Germany) according to Rodrıguez-Lazaro et al. (2004),and incubated at 56 �C for 20 min. The sample was thenthoroughly mixed and incubated further at 100 �C for8 min. Subsequently, the sample was mixed and cooledfor 5 min on ice. Next a centrifugation step (10 min,14,000 rpm) was performed. The supernatant contain-ing the DNA was removed.
2.3.3. PCR amplification of target DNA for DGGEThe extracted genomic DNA was amplified using theforward primer 341F-GC (Muyzer et al., 1993) with aGC clamp 5¢-CGC CCG CCG CGC GCG GCG GGCGGG GCG GGG GCA CGG GGG GCC TAC GGGAGG CAG CAG -3¢ and the reverse primer 518R 5¢-ATT ACC GCG GCT GCT GG-3¢. The final 50 lLreaction mixture contained: 2 lL template DNA,25 pmol primers each, 2.5 U of Taq DNA polymerase(Promega, Mannheim, Germany), 1-fold PCR buffer(Promega), 75 mM MgCl2 (Promega), 10 mM dNTPs,(Promega). The PCR protocol included a 5 min initialdenaturation at 94 �C, 30 cycles of 94 �C for 0.5 min,44 �C for 1 min, 72 �C for 1.5 min followed by 10 minat 72 �C for final extension in a Primus 96 thermocycler(MWG, Ebersberg, Germany). PCR products werestored at )20�C until further use.
2.3.4. DGGE analysisDGGE analysis was performed on DcodeTM-System(Bio-Rad). Samples were loaded onto a 8% (w/v)acrylamide gel (37.5:1 acrylamide-bisacrylamide) in 1·TAE buffer with a denaturant gradient ranging from20% to 60% prepared in accordance with Muyzer et al.(1995). (100% denaturant contains 7 M urea andvolume ratio of 40% formamide.)
To standardise DGGE gels, reference standards wereapplied to each gel. The reference standard consisted ofa mixture of PCR products of 11 different bacterialspecies which are commonly found in human skinsamples (Trebesius et al., in preparation). The bandingpattern resulted from PCR products obtained by thesame primer pair as described above.
The electrophoresis was performed at 60 �C, initiallyat 25 V for 15 min following at 130 V for 4 h. The gelwas silver stained based on Sanguinetti et al. (1994) bythe following procedure. About 150 mL of fixing solu-tion (10% ethanol, 0.5% acetic acid) was applied to thegel and shook gently for 3 min. Subsequently, thegel was incubated for 10 min at room temperature in asilver nitrate solution (0.2% AgNO3, 10% ethanol,0.5% acetic acid). After discharging the silver nitratesolution a washing step in distilled H2O for 2 minfollowed. Hereafter, 150 mL of ‘‘developer solution’’was applied to the gel (3% NaOH containing, 300 lL of37% formaldehyde) for 5 min, while shaking gently.The staining procedure was stopped by incubating thegel for 5 min in 10% ethanol, 0.5% acetic acid solution.
A typical example of a DGGE gel is presented infigure 1.
2.4. Software
The GC/MS instrument was controlled by AgilentChemStation software versions D.01.00 (system 1) andD.01.02 (system 2). The GC/MS data was exported toAIA/netCDF (network Common Data Format) formatand then imported into MATLAB (The Mathworks,Inc., Natick, MA) using a freely available conversiontool (available at http:// mexcdf.sourceforge.net/). Thestained gel was transferred on an overhead transparencysheet and documented on a SnapScan 1236 scanner(Agfa, Ridgefield Park, NJ). The scanning mode wastransparent, 300 dpi and 24 Bit colour. The resultantpictures were converted to TIFF files for processing andimported into MATLAB by using Image ProcessingToolbox. All data processing was performed usingMATLAB version 7.0.4.365, Release 14, Service Pack 2.
Figure 1. A typical DGGE gel.
Y. Xu et al./Comparison of human axillary odour profiles 429

3. Data analysis methods
3.1. Data preparation
3.1.1. DGGE data preparationThe images of scanned DGGE gels were processed by anin-house image digitisation software. For each lane(sample) on the gel, the bands were detected and theirpositions recorded. The position of each band was thencorrected with respect to the positions of referencestandards to cope with different separation behaviourbetween gels. The detailed description is given in aseparate paper (Xu et al., in preparation) and notrepeated here for brevity.
The main difficulty in this study is the bandassignment. DGGE is a 1-D technique hence the onlyuseful information for the band assignment is theposition information and there is no spectroscopic orother information which can help in identifying whichband is which. When there were many lanes and gels, itis often hard to assign some bands unambiguously, i.e.when two bands come from different lanes/gels withslightly different positions, it is difficult to decidewhether these two bands originate from the samemicro-organism or two different ones. However, dataanalysis methods such as PCA (Wold et al., 1987;Brereton, 2003) based on a sample-feature matrixrequire each variable to originate from the samesource, otherwise the results will be influenced by theincorrect assignments of variables. To overcome thisproblem, we used a pair-wise dissimilarity matrixbetween sample profiles rather than a full sample-variable matrix since it is much easier to measure thedissimilarity between two samples as the number ofambiguous assignment of the bands is small whencomparing two lanes, rather than using global bandassignments. Previously we developed a fuzzy distancemetric to measure this dissimilarity. The metric isweighted by a fuzzy function and the value of thisfunction depends on the difference of the positions oftwo bands, so it does not require an accurate assign-ment of each band and tolerates slight imprecision ofthe positional information. We briefly summarise themethod here which will be described elsewhere (Xuet al., in preparation): in this paper we use the squareroot of the intensities rather than the raw intensities tobe comparable to the GC/MS data, otherwise themethod is identical.
The first step is to correct the position of bands ineach lane according to a reference lane consisting ofextracts from 11 microbes, the corrected position relatesto how close the bands are to the microbial extracts inthe nearest reference lane, for example a band that isdetected half way between bands 3 and 4 in the referencelane will be given a value of 3.5. These positions relativeto the reference bands are then used for subsequentanalysis as follows.
The next step is to determine a dissimilarity measurebetween the reference band corrected profiles in eachlane. Suppose lane i hasNi bands and lane j hasNj bands,and also assume Ni £Nj. A Ni · Nj position differencematrix is constructed; each row representing the posi-tional difference of one band in lane i to all the bands inlane j. The minimum value in each row will be the nearestband. For each dissimilarity metric calculation, there canbe Ni comparisons at most. However, sometimes two ormore bands in lane i share the same nearest neighbour inlane j. In such case, we only consider the closest pair andthe others will be discarded (i.e. consider them as uniquebands in lane i). We denote the number of band pairs kthat have been identified as b (b £Ni).
Both quantitative and qualitative (presence/absencecriterion) fuzzy weighted distance metrics are used tomeasure the dissimilarity between two DGGE samples.The quantitative metric takes into account band inten-sities as well as uncertainties in position using the fol-lowing equation:
dði; jÞ ¼ 1�
Pb
k¼1
ffiffiffiffiffiffiffiffiffiffiffiffiffixik:xjkp � wk
� �
ffiffiffiffiffiffiffiffiffiffiffiffiffiffiffiffiffiffiffiffiffiffiffiffiffiffiPNi
n¼1xinPNj
n¼1xjn
s ð1Þ
where b is the number of pairs being considered (seeabove) each matched pair being denoted by k, where xikand xjk are the integrated intensities of the band pair k inlanes i and j. The qualitative distance metric is thesquare root of the fuzzy weighted Jaccard distance(Jaccard, 1908) metric defined as
dði; jÞ ¼
ffiffiffiffiffiffiffiffiffiffiffiffiffiffiffiffiffiffiffiffiffiffiffiffiffiffiffiffiffiffiffiffiffiffiffiffiffiffiffiffiffiffiffiffiffiffiffiffiffiffiffiffiffiffiffiffiffiffiffiffiffiffiffiffiffiffiffiffi
1�
Pb
k¼1wk
Pp
k¼1wk þNi þNj � b�
Pp
k¼1wk
vuuuuuut
¼
ffiffiffiffiffiffiffiffiffiffiffiffiffiffiffiffiffiffiffiffiffiffiffiffiffiffiffiffiffiffiffiffi
1�
Pb
k¼1wk
Ni þNj � b
vuuut
ð2Þ
The fuzzy weight function wk = H(Ddk) is determinedby the absolute difference in the corrected position (Ddk)of the band pair k (=1 to p) defined by
wk ¼ HðDdkÞ ¼1
2� erfcðA � Ddk � SÞ ð3Þ
where function erfc(x) is the complementary errorfunction (Zwillinger, 1997), defined by efrcðxÞ ¼2p �R1x e�t
2
dt and t is an integration factor, from x to+¥. S and A are two adjustable free parameters whichcontrol the sensitivity to the positional difference of the
Y. Xu et al./Comparison of human axillary odour profiles430

weight function. With an appropriate setting of S and Athis function has the following properties.
(a) When the difference is small enough, the output is 1or very close to 1,
(b) when the difference is moderate, the output isbetween 0 and 1 and decays exponentially withincreasing Dd,
(c) when the difference is large enough, the output is 0or very close to 0.
In this paper, S is set to 5 and A to 30. If the correctedpositional difference is closer than about 0.1 they areassumed to be a perfect match, if differing by more than0.2 they are assumed not to match at all.
3.1.2. GC/MS data preparationA peak table was constructed based on all the GC/MStotal ion chromatograms which is a matrix whose rowscorrespond to samples and whose columns correspondto summed peak areas over all significant masses ofthe corresponding compounds. The method for peakidentification and alignment has been described in detailin Dixon et al. (2006). The peaks corresponding toknown background compounds such as siloxanes orig-inating from stir bars or vial septa were identified basedon their mass spectra and removed from the peak table.Next, peaks that occur in 4 or less samples in the overalldataset are removed as they are unlikely to have anydiagnostic significance. A further reduction in the size ofthe peak table is performed to consider only those peaksthat are detected in at least 4 out of 5 fortnights in atleast one subject leaving NGCMS = 373 peaks in totalover all subjects: this is so as to retain peaks that arelikely to relate to stable biological signatures which aredetected in the majority of samples from one or moreindividuals. Finally peak areas were scaled as follows:the square root of the peak areas were computed, thesepeak areas were summed to a constant total of 1 in eachchromatogram. The reason we square root peak areas isthat there can be large peaks in some chromatogramsthat could dominate the profile, hence distorting dataafter normalisation; a common alternative of log scalingis not suitable in this study because many peaks are notdetected in chromatograms so a large number of zeronumbers would need to be replaced, square root scalingis a common alternative for reducing contrasts. Moredetailed discussion about these data transformationmethods can be found elsewhere (Box and Cox, 1964;Huber et al., 2002).
In order to compare the patterns of the GC/MS andDGGE data, we constructed two pair-wise distancematrices for each data set, one using qualitative dis-tance metric and another using quantitative distancemetric. For the quantitative distance between GC/MS iand j we use
dði; jÞ ¼ 1�
PNGCMS
k¼1½ðxik � xjkÞ�
xik k � xj���� ð4Þ
where xik is the normalised square root intensity of peakk in chromatogram i and xi is the vector containing allNGCMS (=373) intensities of this chromatogram. Forthe qualitative distance we use the square root of theJaccard distance (Jaccard, 1908)
dði; jÞ ¼ffiffiffiffiffiffiffiffiffiffiffiffiffiffiffiffiffiffiffiffiffiffiffiffiffiffiffi
1� a
aþ bþ c
r
ð5Þ
where a are the number of peaks that are common toboth samples, and b and c the number of peaks uniqueto one of the two samples.
The reason we square root the distances will beexplained in Section 3.2.2.
3.2. Comparison of multivariate patterns
3.2.1. Mantel testTo compare two distance matrices directly, the Manteltest (Mantel, 1967) is a commonly used and effectivemethod. Given two distance matrices A and B withdimensions of N·N, the lower (or upper) triangularparts of the matrices are unfolded into two vectors:a ¼ fa11; a21; . . . aN1; a22; . . . aN2; . . . ; aNNg andb ¼ fb11; b21; . . . bN1; b22; . . . bN2; . . . ; bNNg where amn andbmn are the mth row and nth column of the elements inmatrices A and B respectively. The correlation coeffi-cient r between a and b is then calculated.
The significance of the correlation is determinedusing a Monte Carlo simulation. The order of theelements in one vector is permuted while the otherremains unchanged and the correlation coefficientbetween these two vectors is calculated. This process isrepeated sufficiently large number of times and thecorrelation coefficients obtained by these permutationsare used to form an empirical null distribution. Thesignificance of the correlation coefficient r calculatedabove is computed to provide an indication as towhether this belongs to the null distribution or not.For an estimate of the significance of the correlationcoefficient we can calculate the proportion of times theMonte Carlo simulation results in a correlation coeffi-cient greater than the observed value r (one tailed test)or the absolute value is greater than r (two tailed test).These approximate to probabilities and are denoted byp values below. In this paper we use the two sidedMantel test.
3.2.2. Multidimensional scaling and the Procrustean testA major drawback of the Mantel test is that it is notpossible to visualise the data structure as it is based on a
Y. Xu et al./Comparison of human axillary odour profiles 431

single number (the correlation coefficient), between twosets of data. Multidimensional scaling (MDS) is a set ofmethods that can transform the pattern represented by apair-wise distance matrix back to a matrix of samplesand latent variables. MDS constructs a new sample-latent variable matrix and the relative configuration ofthe data points has been preserved and can be visualised,if appropriate, by using 2-D or 3-D scatter plots. Weused a common MDS method called Principal Coordi-nate Analysis (PCO) (Gower, 1966) to transform thedistance matrices to sample-feature matrices. A briefdescription of PCO is given below.
Given an N·N symmetric distance matrix D, eachelement dij in D represents the distance from sample i tosample j.
(1)
A ¼ ðaijÞ= � 1
2� d2ij
� �
ð6Þ
(2) Calculate Gower�s centred matrix G using
G ¼ I� 1
N1 � 10
� �
� A � I� 1
N1 � 10
� �
ð7Þ
where I is the identity matrix and 1 is a column of 1s oflength N.(3) Perform eigen-decomposition on matrix G so that
G ¼ Q � K �Q0 ð8Þ
where K is a diagonal matrix with eigenvalues on thediagonal in descending order. Q is a square matrixwhose columns are corresponding orthonormal eigen-vectors. It is important to point out that the eigen-values and eigenvectors here are defined by linearalgebra: each pair of eigenvalues k and correspondingeigenvectors q of the square matrix G satisfiesG � q ¼ k � q. The definition of an eigenvalue often usedin the chemical PCA literature (Wold et al., 1987;Brereton, 2003), the sum of squares of scores, has asimilar property to the eigenvalues as defined above:however unlike eigenvalues in PCA literature, linearalgebra defined eigenvalues cannot be guaranteed to benon-negative for all types of matrices. A matrix Ghaving all diagonal elements of K positive is calledpositive definite ; if one or a few diagonal elements ofK are 0 and others are all positive G is denoted apositive semi-definite matrix (p.s.d). In context of PCO,non-negative eigenvalues can only be guaranteed whenthe Euclidean distance has been used for determiningdissimilarities (Gower, 1966).(4) If l dimensions are desired for modelling the data,
retain the first l columns in Q and first l rows and lcolumns in K, the PCO scores matrix T can be
obtained by T = QÆK1/2 with imaginary elements ifthere are negative eigenvalues.
It is important to pay special attention to the values ofthe diagonal elements of K. If a non-Euclidean distanceis used to construct the distance matrix, it is possiblethat one or a few eigenvalues in K are negative. In suchcase, the original distance matrix cannot be perfectlyembedded into Euclidean space because some PCs existin imaginary space. However, if the magnitude of thenegative eigenvalues is relatively small compared to thatof positive eigenvalues, the negative part is usuallyindicative of noise. The rationale behind such method-ology is given by the Wielandt-Hoffman theorem(Golub and Loan, 1996): the best approximation of amatrix G whose eigenvalues K contain negative elementsis by setting all negative elements in K to zero to give amatrix K and then reconstructing G using Q and the newmatrix K. This method can be justified as noise reduc-tion so long as the negative eigenvalues are small relativeto the positive ones and has been extensively used inPCO and kernel learning related literature (Krzanowskiand Marrior, 1994; Graepel et al., 1998; Peres-Neto andJackson, 2001; Pekalska et al., 2002). In our study, thequantitative dissimilarity matrices given by equations (3)and (4) contain only a few very small negative eigen-values but Jaccard distance matrices often result in somevery large negative eigenvalues. Fortunately, as dem-onstrated by Gower and Legendre (1986), although theJaccard distance itself is non-Euclidean, the squarerooted Jaccard distance has Euclidean properties andhence can be perfectly embedded into Euclidean dis-tance space. The square rooted fuzzy weighted Jaccarddistance sometimes still has some negative eigenvaluesbut such imperfection has been largely reduced, reflectedby the ratios of the sum of absolute negative eigenvaluesover that of positive eigenvalues are significantly lowerthan before and never exceed 10%, hence we just ignoreall PCs with negative eigenvalues and keep those withpositive eigenvalues. Hence in equations (2) and (5) weuse the square root of the Jaccard dissimilarity metric.
Once the pair-wise distance matrices are transformedto sample-latent variable matrices using PCO there arevarious methods available to measure the correlationbetween these matrices. We employ the ProcrusteanTest (Jackson, 1995) to measure the correlationbetween the two types of data inputs (GC/MS andDGGE). The most attractive aspect of this method isthat it is possible to superimpose two patterns on thesame scatter plot and visualise the matching. The testinvolves two steps.
(1) The Procrustean transformation (Rohlf and Slice,1990) is performed on one data matrix and the otherused as the target. The transformed matrix as well asthe matching error when it is compared to the targetmatrix is calculated as follows. Given two matricesA and B to be compared, we set matrix A as the
Y. Xu et al./Comparison of human axillary odour profiles432

target and transform B to match A as closely aspossible. The Procrustean transformation involvesthree basic operations:
(a) Translation. Column mean centre both A and B andscale both matrices so that the sum of squares of allthe elements in each matrix equals 1. The meanvector and the root sum of squares of all elements inA has is computed for further use, as discussed be-low. We denote the matrices after the translation asAscl and Bscl.
(b) Rotation. The rotation matrix R is obtained byperforming Singular Value Decomposition (Gentle,1998) on the matrix A¢sclBscl to get A0sclBscl¼ USV0,R = VU¢ and in this application all N non-zerocomponents are retained. Note that SVD, unlikeeigen-decomposition, always results in a positivediagonal matrix S.
(c) Scaling. The scaling factor is obtained by
s ¼PN
n¼1snn Ak k, where ||A|| is the root sum of square
for all the elements in matrix A. The transformedmatrix obtained from B can be calculated byBtrans ¼ s � Bscl � Rþ 1 � a where a is the row vector ofmeans of matrix A and 1 is column vector of 1s. Thematching error e is given by e = ||Btrans)A||.
(2) Evaluate the significance level of the matching errorusing a Monte Carlo simulation procedure. Like theMantel test, a null distribution of the matching erroris derived by permuting the order of samples in one
data matrix (the order of the variables remains thesame) while keeping the other unchanged. Procrus-tean transformation is performed on this new pair ofmatrices and the matching error computed as de-scribed above. This process is repeated a largenumber of times and the matching errors form thenull distribution. The null distribution is then usedto assess the significance level of the observedmatching error and to give p values as describedabove for the Mantel test.
Since the matching error can never be negative, theProcrustean test is always a one-tailed test. One can alsovisualise the matching of two most significant compo-nents of the data matrices by superimposing theProcrustean transformed matrix with the target matrixin a 2-D or 3-D scatter plot.
It is necessary to note that the p values of both theMantel test and the Procrustean test are estimatedfrom empirical null distributions which are formed byusing Monte Carlo simulations. If none of therandomised resampling experiments produced a higher(or lower) value than the true observed value, theestimated p value is reported as 0. Such a case sug-gests that the observed value is significantly differentfrom the null distribution. However this does notnecessarily mean that the probability of the observedvalue derived from the null distribution is actually 0,i.e. that the null hypothesis can be rejected at 100%confidence level.
-0.1 -0.05 0 0.05 0.10
200
400
600
800
Correlation Coefficient
stiH
fo.o
N
-0.03 -0.02 -0.01 0 0.01 0.02 0.030
200
400
600
800
Correlation Coefficient
stiH
fo.o
N
0.68 0.685 0.69 0.695 0.70
200
400
600
800
Matching Error
stiH
fo.o
N
0.965 0.97 0.975 0.98 0.985 0.990
200
400
600
800
Matching Errorsti
Hfo
.oN
Null Distribution Observed Value
p=0.0914 p=0.3396
p=0.0774 p=0.3483
(a) (b)
(d)(c)
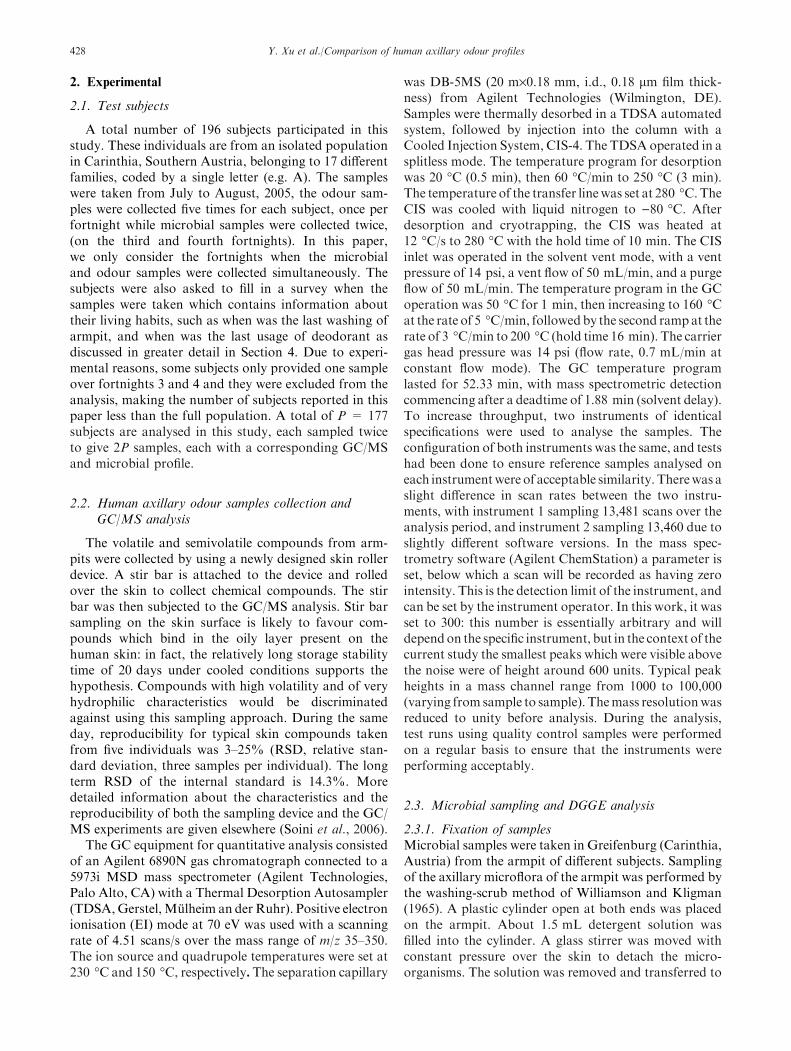
Figure 2. Mantel test and Procrustean test applied to the full data set of 354 samples: (a) Mantel test on qualitative distance matrices; (b) Mantel
test on quantitative distance matrices; (c) Protest on qualitative distance matrices and (d) Protest on quantitative distance matrices. A total of
10,000 permutations are performed and for the purpose of the bar chart, data are divided into 50 equally spaced bins between the lowest and light
values on the graph, the number of hits is the number of time the relevant parameter falls within a bin.
Y. Xu et al./Comparison of human axillary odour profiles 433

4. Results
The first step was to compare the patterns of the GC/MS and DGGE profiles by using all 2P (=354 pairs ofsamples). The null distributions for the Mantel andProcrustean test were obtained using 10,000 permuta-tions. Both the two-sided Mantel test and Procrusteantest suggest that there is a weak correlation (p<0.1)between these two data blocks when qualitative distancemetrics were used while no significant correlation can befound when quantitative distance metrics were used. Theresults are presented in figure 2, using 50 equally spacedbins as illustrated.
We then performed such a comparison on each ofthe family groups separately. At first sight, the resultsfor each family give apparently inconsistent conclu-sions. Some families showed very significant correlationbetween two data blocks while some families do notshow any significant correlation at all. When thequalitative distance metrics were used, the strongestcorrelation between the DGGE and GC/MS signalscome from family D (11 members, 22 samples), boththe Mantel test and Procrustean test result in a value ofp = 0, i.e. not a single case in 10,000 random permu-tations results in such high correlation and theobserved value of correlation coefficient or matchingerror of the Procrustean transformation is also faraway from the corresponding null distribution. FamilyA (17 members, 34 samples) also shows very strongcorrelation at the level of p = 0 but the observedvalues are closer to the null distributions compared tofamily D. The superimposed PCO scores plots of twodata blocks of these two families are shown in figure 3.To interpret these graphs, it is necessary to observehow close the corresponding DGGE and GC/MSsamples appear. Each family member has a uniqueidentifying number, and the scores of the two samplesfrom each individual are averaged after the Procrustestransformation, for simplicity. Note, for example infigure 3(b) that the two samples for individual 86appear in the top right corner, 83 in the bottom leftcorner, and 91 and 88 are in the middle. Had therebeen no correlation we would expect these pairedsamples to appear more or less randomly. Families G,P and Q also show strong correlations (p<0.05);families B, C, J show weak correlations (p<0.1) butcorrelations between the two blocks for families E, H,L, M, N, O, R, S and U are consistent with the ran-dom model for the null distribution at a level ofp>0.1. When the quantitative distance metrics wereused, only three families, G, P and Q show correlationswhose p values varied from 0.01 to 0.07. The resultsfrom all 17 families are summarised in table 1.
However it is important to consider that humanodour can be significantly influenced by many environ-mental factors, so we examined the behaviour surveyswhich the subjects filled in when the samples were taken.
We found that there are considerable variations inhuman behaviour, such as the time elapsed from the lastarmpit washing, the time from the last use of deodorantor soap and whether the suggested T-shirt (chemicalfree) was worn. This variation was suspected to influ-ence the GC/MS volatile compound profiles. We expectthat such variations can impact subject�s odour, as wellas their microbial profiles. Hence we defined four subjectscreening rules to reduce possible influence from envi-ronmental factors.
(1) The time of the last armpit washing must be between12 and 48 h.
(2) The time of the last usage of deodorant must be noless than 48 h.
(3) The suggested T-shirt must be worn before thesampling.
(4) The suggested soap must be used in the last armpitwashing.
-0.25 -0.2 -0.15 -0.1 -0.05 0 0.05 0.1 0.15 0.2-0.25
-0.2
-0.15
-0.1
-0.05
0
0.05
0.1
0.15
0.2
1
2
4
5
7
9
10
15
17
18
20
24
25
27
28
30
31
1
2
4
5
7
9
10
15
17
18
20
24
25
27
28
30
31
GC/MSDGGE
-0.4 -0.3 -0.2 -0.1 0 0.1 0.2 0.3-0.2
-0.15
-0.1
-0.05
0
0.05
0.1
0.15
0.2
0.25
83
84
85
86
87
88
89 90
91 92 93
83
84
85
86
87
88
8990
9192
93
GC/MSDGGE
(a)
(b)
Figure 3. Superimposed scatter plots of PCO scores of the first two
components of the GC/MS data and Procrustean transformed DGGE
data on families A and D. (a) Family A; (b) Family D. Each number in
the figure represents one test subject; the PCO scores of two repeats of
one testing subject have been averaged to avoid making the plots too
crowded.
Y. Xu et al./Comparison of human axillary odour profiles434

By applying these four rules, only 32 of the 177subjects meet all the requirements. The Mantel test andProtest were applied to these subjects using a null dis-tribution based on 64 rather than 354 samples. The
results show very strong correlation between two datablocks at the level of p = 0 with the qualitative distancemetrics and p<0.01 with the quantitative distancemetrics (see figure 4). For comparison purpose, we alsorandomly selected another 32 subjects from theremaining 145 subjects that had not obeyed thesebehavioural rules (excluding the 32 individuals above)and did the same experiment and repeat the computa-tions 10 times with different random selections of sub-jects. The results showed that 1 experiment resulted instrong correlation at the level of p<0.01 and 1 exper-iment resulted in weak correlation at the level of p<0.1using a qualitative distance metric; 1 experiment resultedin strong correlation at the level of p<0.05 with thequantitative distance metric. The results are summarisedin table 2.
We also compared the null distributions for thequalitative and quantitative distance metrics generatedby Monte Carlo simulation both for the overall popu-lation and for each family separately. Although the nulldistribution generation procedures are exactly the sameand the only difference involves using different distancemetrics, the characteristics of the null distributions arevery different. For the Mantel test, both null distribu-tions of qualitative and quantitative distances are cen-tred around 0 as expected (as a correlation coefficient of0 implies that there is no link between two blocks ofdata) but the distributions of the qualitative distancemetrics always appeared to have much larger standard
-0.4 -0.2 0 0.2 0.40
200
400
600
800
Correlation Coefficient
stiH
fo.o
N
-0.2 -0.1 0 0.1 0.20
200
400
600
800
Correlation coefficient
stiH
fo.o
N
0.4 0.42 0.44 0.460
200
400
600
800
Matching Error
stiH
fo.o
N
0.7 0.75 0.8 0.850
200
400
600
800
Matching Error
stiH
fo.o
N
p=0 p=0.0082
p=0 p=0.0054
(a)
(c)
(b)
(d)
Figure 4. Mantel test and Procrustean test applied to the selected data set of 32 subjects (64 samples) that obeyed four behavioural rules over the
period of sampling. (a) Mantel test on qualitative distance matrices; (b) Mantel test on quantitative distance matrices; (c) Protest on qualitative
distance matrices and (d) Protest on quantitative distance matrices. A total of 10,000 permutations are performed and for the purpose of the bar
chart, data are divided into 50 equally spaced bins between the lowest and light values on the graph, the number of hits are the number of time the
relevant parameter falls within a bin.
Table 1
The results of Mantel test and Protest on all families
Family
Number
of
subjects
p-value of Mantel test p-value of Protest
Qualitative
distance
metric
Quantitative
distance
metric
Qualitative
distance
metric
Quantitative
distance
metric
A 17 0 0.1676 0 0.1231
B 15 0.0571 0.2895 0.0615 0.137
C 12 0.0641 0.2764 0.0607 0.2514
D 11 0 0.1457 0 0.1512
E 8 0.4075 0.4806 0.5837 0.8977
G 9 0.0423 0.067 0.0431 0.045
H 11 0.3114 0.355 0.2451 0.3055
J 10 0.0912 0.3181 0.0634 0.2181
L 15 0.2088 0.1112 0.4714 0.4755
M 8 0.5007 0.5592 0.5884 0.5983
N 10 0.128 0.4324 0.1076 0.3478
O 5 0.1763 0.2691 0.1136 0.2919
P 9 0.0016 0.0185 0 0.0112
Q 10 0.0095 0.0139 0.0032 0.0103
R 10 0.4331 0.3271 0.4174 0.6425
S 9 0.4053 0.4513 0.4187 0.519
U 8 0.2989 0.3587 0.2985 0.3056
All 177 0.0914 0.3396 0.0774 0.3483
All p-values less than 0.1 are in italic and bold.
Y. Xu et al./Comparison of human axillary odour profiles 435

deviation compared to those of the quantitativedistances, i.e. the histogram of the p.d.f. (probabilitydistribution function) of the null distribution for thequalitative distance metric is much broader. It maysuggest that for qualitative distance matrices, the per-mutation process has much higher influence on thecalculated correlation coefficient for each simulation.For the Procrustes test, matching errors are used toform the null distribution. The most obvious differenceis that the null distribution for the qualitative distancealways has much lower average (centre of the p.d.f.)compared to that of the quantitative distance. It sug-gests that when the qualitative distance metric is used,the matching error calculated from Procrustes analysiscould be low even if there is in fact no real correlation,hence should be interpreted only in the light of MonteCarlo simulations.
5. Conclusion
Based on the results of the Mantel test and theProcrustean test, it appears that there is no strong cor-relation for the overall population between microbialand chemical odour profiles. However when divided intoindividual families, some strong correlations arerevealed and it is probable that correlations are over-whelmed by environmental factors such as the personalhabits and living conditions of the subjects. When weselect individuals whose behaviour follows certain rules,there is indeed a significant correlation between themicrobial and chemical odour profiles: the differencesbetween the families could also be interpreted in termsof the different personal behaviour patterns in certainfamily groups. We also notice that in most cases, thecorrelation between human odour profiles and microbialprofiles is usually stronger when the qualitative distancemetrics were used compared to quantitative distance
metrics. This is interpreted in part as the amount ofsweat sampled not being precisely controlled and themethod for DGGE gels is only semi-quantitative soquantitative dissimilarity metrics are more sensitive tosuch variations, whereas qualitative patterns based onpresence/absence of microbes and chemicals are morerobust.
Acknowledgements
Alexandra Katzer is thanked for her superb organisa-tional skills. Hejun Duan of the Centre for Chemo-metrics is thanked for helping organise the GC/MSdata, and Fan Gong for preliminary help in the micro-bial analysis. This work was sponsored by ARO Con-tract DAAD19-03-1-0215. Opinions, interpretations,conclusions, and recommendations are those of theauthors and are not necessarily endorsed by the UnitedStates Government.
References
Brereton, R.G. (2003). Chemometrics: Data Analysis for the Labora-
tory and Chemical Plant. Wiley, Chichester.
Box, G.E.P. and Cox, D.R. (1964). An analysis of transformations.
J. R. Stat. Soc. B 26, 211–252.
Dixon, S.J., Brereton, R.G., Soini, H.A., Novotny, M.V. and Penn
D.J. (2006). An automated method for peak detection and
alignment in gas chromatography-mass spectrometry as applied
to a large metabolomic dataset from human sweat. J. Chemomet.
in press.
Gentle, J.E. (1998). Numerical Linear Algebra for Applications in
Statistics. Springer-Verlag, Berlin.
Golub, G.H. and Loan, C.F.V. (1996). Matrix Computations. The
Johns Hopkins University Press, London.
Gower, J.C. (1966). Some distance properties of latent root and vector
methods used in multivariate analysis. Biometrika 53, 325–338.
Gower, D.B., Bird, S., Sharma, P. and House, F.R. (1985). Axillary
5a-androst-16-en-3-one in men and women: Relationships with
olfactory activity to odorous 16-androstenes. Cell. Mol. Life Sci.
41, 1134–1136.
Gower, J.C. and Legendre, P. (1986). Metric and Euclidean properties
of dissimilarity coefficients. J. Classif. 3, 5–48.
Graepel, T., Herbrich, R., Bollmann-Sdorra, P. and Obermayer, K.
(1998). Classification on pairwise proximity data in Jordan, MI,
Kearns, MJ and Solla, SA (Eds), Proceedings of the 1998 Con-
ference on Advances in Neural Information Processing Systems.
MIT Press, Cambridge, MA, pp. 438–444.
Huber, W., von Heydebrek, A., Sultmann, H., Poustka, A. and
Vingron, M. (2002). Variance stabilization applied to micro-
array data calibration and to the quantification of differential
expression. Bioinformatics 18(suppl. 1), S96–S104.
Jaccard, P. (1908). Bull. Soc. Vaud. Sci. Nat. 44, 223–270.
Jackson, D.A. (1995). Protest: A Procrustean randomization test of
community environment concordance. Ecoscience 2, 297–303.
Krzanowski, W.J. and Marrior, F.H.C. (1994). Multivariate Analysis,
Part I. Distributions, Ordination and Inference. Arnold, London.
Mantel, N.A. (1967). The detection of disease clustering and a gener-
alized regression approach. Can. Res. 27, 209–220.
Marples, M.J. (1969). Life on the human skin. Sci. Am. 220, 108–115.
Muyzer, G., de Waal, E.C. and Uitterlinden, A.G. (1993). Profiling of
complex microbial populations by denaturing gradient gel
Table 2
The results of Mantel test and Protest on randomly selected sets of 32subjects chosen among the 145 subjects that had not obeyed the four
basic behavioural rules
Run
p-value of Mantel test p-value of Protest
Qualitative
distance
metric
Quantitative
distance
metric
Qualitative
distance
metric
Quantitative
distance
metric
1 0.2145 0.5412 0.1947 0.4922
2 0.3388 0.4178 0.4408 0.7998
3 0.0092 0.0412 0.0088 0.0359
4 0.3919 0.4082 0.6147 0.7912
5 0.1987 0.3024 0.1471 0.2921
6 0.3014 0.3954 0.4157 0.6955
7 0.4001 0.4413 0.7041 0.8589
8 0.1687 0.3011 0.1577 0.4998
9 0.0821 0.1498 0.0714 0.1501
10 0.2687 0.3541 0.2514 0.6562
All p-values less than 0.1 are in italic and bold.
Y. Xu et al./Comparison of human axillary odour profiles436

electrophoresis analysis of polymerase chain reaction-amplified
genes encoding for 16S rRNA. Appl. Environ. Microbiol. 59,
695–700.
Muyzer, G., Hottentrager, S., Teske, A. and Wawer, C. (1995).
Denaturing gradient gel electrophoresis of PCR-amplified 16S
rRNA: A new molecular approach to analyse the genetic
diversity of mixed microbial communities in Akkermans, A.D.,
Elsas, J.D.van and Bruijin, F.J.de (Eds), Molecular Microbial
Ecology Manual. Kluwer Academic Publishers, Dordrecht, The
Netherlands, pp. 1–23.
Pekalska, E., Paclik, P. and Duin, R.P.W. (2002). A generalized Kernel
approach to dissimilarity-based classification. J. Mach. Learn.
Res. 2, 175–221.
Penn, D.J., Oberzaucher, E., Grammer, K., Fischer, G., Soini, H.A.,
Wiesler, D., Novotny, M.V., Dixon, S.J., Xu, Y. and Brereton,
R.G. (2007). Individual and gender fingerprints in body odour.
J. R. Soc.: Interface 4, 331–340.
Peres-Neto, P.R. and Jackson, D.A. (2001). How well do multivariate
data sets match? The advantages of a Procrustean superimpo-
sition approach over the Mantel test. Oecologia 129, 169–178.
Rennie, P.J., Gower, D.B., Holland, K.T., Mallet, A.I. and Watkins,
W.J. (1990). The skin microflora and the formation of human
axillary odour. Int. J. Cosmet. Sci. 12, 197–208.
Rennie, P.J., Gower, D.B. and Holland, K.T. (1991). In-vitro and
in-vivo studies of human axillary odour and the cutaneous
microflora. Br. J. Dermatol. 124, 596–602.
Rodrıguez-Lazaro, D.A., Jofre, T., Aymerich, M., Hugas, M. and Pla,
M. (2004). Rapid quantitative detection of Listeria monocytog-
enes by Real-Time PCR. Appl. Environ. Microbiol. 70, 6299–
6301.
Rohlf, F.J. and Slice, D.E. (1990). Extensions of the Procrustes
method of the optimal superimposition of landmarks. Syst.
Zool. 39, 40–59.
Sanguinetti, C.J., Dias Neto, E. and Simpson, A.J.G. (1994). Rapid
silver staining and recovery of PCR products separated on
polyacrylamide gels. Biotechniques 17, 915–919.
Sastry, S.D., Buck, K.T., Janak, J., Dressler, M. and Preti, G. (1980).
Volatiles emitted by humans in Waller, G.R. and Dermer, O.C.
(Eds), Biochemical Applications of Mass Spectrometry. John
Wiley & Sons, New York, pp. 1085–1129.
Sato, K., Leidal, R. and Sato, F. (1987). Morphology and development
of an apoeccrine sweat gland in human axillae. Am. J. Physiol.
Regul. Integr. Comp. Physiol. 252, R166–180.
Soini, H.A., Bruce, K.E., Klouckova, I., Brereton, R.G., Penn, D.J.
and Novotny, M.V. (2006). In-situ surface sampling of biolog-
ical objects and preconcentration of their volatiles for chro-
matographic analysis. Anal. Chem. 78, 7161–7168.
Wold, S., Esbensen, K. and Geladi, P. (1987). Principal component
analysis. Chemom. Intell. Lab. Syst. 2, 37–52.
Williamson, P. and Kligman, A.M. (1965). A new method for the
quantitative investigation of cutaneous bacteria. J. Invest.
Dermatol. 45, 498–503.
Zwillinger, D. (1997). Handbook of Differential Equations. (third ed.).
Academic Press, Boston.
Y. Xu et al./Comparison of human axillary odour profiles 437