REVISED PROJECT PROFILES FOR PMEGP
231
0 REVISED PROJECT PROFILES FOR PMEGP Volume- II Prepared for: DIRECTORATE OF INDUSTRIES & COMMERCE, Shilpodyog Bhawan, Pt. J.N. Complex, Gorkhabasti, Agartala – 799006. APRIL, 2012 Prepared by: NORTH EASTERN INDUSTRIAL CONSULTANTS LTD. A joint venture of SIDBI; IFCI Ltd; ICICI Bank Ltd; IIBI; SBI; UBI & State IDCs. Agartala :: Aizawl :: Dimapur :: Imphal :: Silchar
-
Upload
khangminh22 -
Category
Documents
-
view
0 -
download
0
Transcript of REVISED PROJECT PROFILES FOR PMEGP

0
REVISED PROJECT PROFILES
FOR PMEGP
Volume- II
Prepared for:
DIRECTORATE OF INDUSTRIES & COMMERCE, Shilpodyog Bhawan, Pt. J.N. Complex, Gorkhabasti, Agartala – 799006.
APRIL, 2012
Prepared by:
NORTH EASTERN INDUSTRIAL CONSULTANTS LTD. A joint venture of SIDBI; IFCI Ltd; ICICI Bank Ltd; IIBI; SBI; UBI & State IDCs.
Agartala :: Aizawl :: Dimapur :: Imphal :: Silchar

1
CONTENT Sl.No. Project Profile on Page No. ELECTRICAL/ ELECTRONIC PRODUCTS 01. Boosters & Voltage stabilizers 1 02. Black Insulting tape 5 03. PVC coated electrical wire 9 04. Assembling unit of emergency lights 12 05. Inverters manufacturing unit 16 06. UPS Assembling 20 JUTE & TEXTILE INDUSTRIES 07. Garments 25 08. Hosiery 28 09. Jute Bag Manufacturing Unit 32 10. Surgical Bandages 36 11. Mosquito Net 39 12. Diversified Jute Handicrafts 42 MISCELLANEOUS INDUSTRIES 12. Paper Dish, Plates, Cup etc. 47 13. Offset printing press 52 14. Exercise Book, Register, File Covers etc. 57 15. Umbrella assembling 61 16. Leather shoe manufacturing 64 17. Vermicompost 68 18. Corrugated Cardboard boxes 72 19. Wooden furniture 76 20. Confectionery 79 21. Paper Bags 83 22. Carbon paper 86 23. Decorative Paper 90 24. Gummed Paper tape 93 25. School Chalk 97 26. Pottery 101 27. School Bag/ rain ware etc. 105 28. Marble/ granite cutting, Polishing and fitting 108 29. Rubber Stamp 112 30. Paper Napkin, Toilet roll, Tissue paper etc. 116 31. Decorative Glassware/ glass toys 119 32. Flexographic Printing 122 33. Leather/ Rexene/ Foam canvas bags 126 34. Dustbin 129 PLASTIC INDUSTRIES 35. Pilfer-proof Plastic Caps for Water-Bottles 134 36. Disposable Plastic Cup, Glass etc. 137 37. Plastic files, albums & folder 141 38. Blow moulded Plastic container/ bottles etc. 145

2
Sl.No. Project Profile on Page No. 39. Rigid PVC pipes of smaller diameters 148 40. Disposable Plastic syringe 151 41. Low density polythene films and bags 155 42. Plastic moulded household items 158 SERVICE UNIT 43. Two Wheeler repairing & Servicing Unit 163 44. Automobile Workshop 166 45. Laundry & Dry cleaning Service 170 46. Gym & Fitness centre 173 47. Creche 176 48. Pathological Laboratory 179 49. Dhaba 182 50. Tent House/Decorator Service 185 51. Beauty Parlour 188 52. Watch repairing & servicing 191 53. Sound System rental services 194 54. Photocopying/ Lamination/ PCO 197 55. Tyre Re-Treading 200 56. Testing and grinding of Diesel Engine Pump nozzle 204 57. Screen Printing (on fabric) unit 207 58. Refrigerator & AC Repairing 212 59. Repair & Maintenance of TV Radio etc. 216 60. Ceiling Fan assembling & repairing 219 61. Mobile Set Repairing 222 62. Fax Photocopier etc. repairing & servicing 225

3
ELECTRICAL/
ELECTRONIC
PRODUCTS

4
BOOSTERS AND VOLTAGE STABILISERS
Introduction: Booster is an electric apparatus commonly used with various electronic equipments like TVs, refrigerators, air conditioners etc. The booster safeguards these equipments against incoming voltage variations and boosts the voltage from lower to the required level automatically. Installed Capacity: The minimum economic capacity of a unit manufacturing boosters and voltage stabilizers is 3,000 nos boosters and 7,500 nos. stabilizers per annum based on a single shift operation of 300 days working schedule in a year. Process of Manufacture: Booster: The assembling of boosters involves manufacture of three sub-assemblies. Various electronic components and electromagnetic relays are first assembled to form a circuit which operates the relays to choose the proper tapping of the voltage when the input voltage varies in limits. The second operation involves assembling of the transformer and finally the assembling of the transformer and finally the assembling of transformer and electronic circuit is done. This is followed by testing of the assembly on various parameters e.g the output voltage. Etc. Stabilizer: The core of the stabilizer is wound with predetermined number of turns with the help of a coil winding machine and stampings are fitted inside the coil. The whole core is impregnated with varnish and dried. Then all the components are assembled and fixed in a box type container with indicators and connections are made with switches. Finally the assembly is tested for ripple, stability, temperature coefficient, transient recovery time. etc. Raw Materials: The Unit shall need following raw materials for the manufacture of 3000 nos boosters and 7500 nos voltage stabilizers at 100% capacity utilization is estimated as follows. a. Boosters : 1. Stamping 350kgs 2. Chassis 3,000kgs 3. Dial and name plate 6,000kgs 4. Voltmeter 3,000kgs 5.Rotary switch 3,000kgs 6.Electric circuit 3,000kgs 7.Lead, knobs, plugs etc 3,000 sets 8. Super enameled copper wire electromagnetic relays, etc as required. b. Boosters : 1. Copper wire 240kgs 2. Voltmeters 7500kgs 3 Fuse 7500kgs 4. Cabinets 7500kgs 5. Switch 7500kgs 6. Knobs, hardware, fuse wire,etc. as required And these will be cost Rs. 45,08,000/- and It is available indigenously and dealers such as the following: 1. Artisan Industries Inc.73 Pond Street, Waltham, MA 02451, U.S.A.. 2. GAYATRI ENGINEER, 30, Electronic Estate, Ground Floor, Satara Rd., Pune – 411009
Power: The Unit will need a total connected Load of 15 KW at 400/440 Volts, 50 HC, AC, three phase & 4 wire. The annual consumption of power is estimated at 10, 295 KWHrs. Costing Rs. 20,384/=. The power is readily available from the State Electricity supply Corporation through its Grid. Water: The Unit will need 500 liters of water per day is estimated. It is available from both ground water sources and public supply.

5
Manpower: Apart from the two skilled persons all manpower is readily available in Tripura. The requirement and annual costs of manpower at the installed capacity is shown below:
Sl.No. Category of Manpower No. of persons Annual Costs
1 Manager 1 Rs. 92,400
2 Office Assistants 2 Rs, 1,05,600
3. Skilled Worker 2 Rs.1,32,000
4. Unskilled Workers 4 Rs. 1,32,000
Total 9 Rs. 4,62,000
CAPITAL COST ESTIMATE 1. Land & Building with a covered area of 120 Sq. Mtrs.: On rent 2. Plant & Machinery (a) Winding machine Impregnation tank Rs. 6,00,000 (b) Baking oven, Hand drill, testing equipments Rs. 1,80,000 (c) Variable transformer Rs. 60,000 (d) Freight, Tax,etc. on above Rs. 1,20,000 Rs. 9,60,000 3. Miscellaneous Fixed Assets (a) Electrification Rs. 1,10,000 (b) Water Installation Rs. 27,500 © Furniture & Miscellaneous others Rs. 22,500 Rs. 2,20,000 4. Provision for c contingencies Rs. 55,000 5. Preliminary & Pre-operative expenses Rs. 1,37,500 Total fixed Costs: Rs. 13,72,500 6. Working Capital: (a) Raw Materials for 1 months Rs. 4,12,500 (b) Utilities for 1 month Rs. 1,698 (c) Wages & Salaries for 1 Month Rs. 38,500 (d) Other expenses for 1 month Rs. 98,402 Total Working Capital:Rs. 5,51,000 TOTAL PROJECT COST: Rs. 19,23,600 Means of finance: URBAN RURAL 1. Composite Loan: Rs. 13,46,520 Rs. 11,54,160 2. Subsidy: Rs. 4,80,900 Rs. 6,73,260 3. Promoters’ Contribution: Rs. 96,180 Rs. 96,180 4. Debt. Equity Ratio: 2.33:1 1.50:1 Profitability: (Rs. in Thousands) Sl. No.
Description 1st Yr. 2nd Yr. 3rd Yr. 4th Yr. 5th Yr.
1. Capacity Utilized 60% 70% 80% 80% 80%
2. Annual sales Realization 4782 5579 6376 6376 6376
3. Annual Costs in
(a) Raw Materials 2970 3465 3960 3960 3960
(b) Power 15 18 21 21 21
(c) Wages & Salaries 429 451 462 474 486
(d) Repair & Maintenance 53 53 53 53 53
(e) Administrative overheads 132 139 145 153 161

6
(f) Selling expenses 712 837 956 956 956
(g) Depreciation 132 132 132 132 132
(h) Interest on Composite Loan 150 122 89 54 22
Total Cost 4593 5217 6818 5803 5791
Variable Costs 3697 4320 4937 4937 4937
4. Annual Profit 189 362 558 573 585
5. Return on Investment 982% 18.82% 29.01% 28.79% 30.42%
6. Return on sales 3.95% 6.48% 8.75% 8.98% 9.17%
7. Annual Contribution 1085 - - - -
8. Break Even Point 49.54% - - - -
9. Cash Accrual 321 494 690 705 717
10. Debt Servicing Capacity 471 616 779 759 739
11. Repayment of Loan 218 255 291 291 292
12. Debt Serviced 364 377 380 345 313
13. Pay Back Period 1 Years 2 months 11 days
14. Debt Service Coverage Ratio 1:28:1
Cash Flow Statement: (Rs. in thousands) Sl. No.
Description Pre-ope- rative Period
O p e r a t I n g Y e a r s
1st 2nd 3rd 4th 5th
1. Increase in promoter’s capital 96 - - - - -
2. Increase in subsidy 480 - - - - -
3. Increase in Composite Loan 1346 - - - - -
4. Depreciation - 132 132 132 132 132
5. Profit before interests - 339 489 647 627 607
A. Total Sources 1923 471 616 779 759 739
6. Increase in capital investments 1372 - - - - -
7. Increase in Working Capital 551 - - - - -
8. Interests - 150 122 89 54 22
9. Repayment of Loan - 218 255 291 291 292
B. Total Disposals 1923 368 377 380 345 314
C. Opening Balance - - 103 342 741 1155
D. Net Surplus - 103 239 399 414 425
E. Closing Balance - 103 342 741 1155 1580
Projected Balance Sheets (Rs. in thousand) Sl. No.
Description Amount as at the end of the
1st Yr. 2nd Yr. 3rd Yr. 4th Yr. 5th Yr.
1. Capital Account of the promoters 96 285 647 1205 1778
2. Surplus from operation 189 362 558 573 585
NET WORTH 285 647 1205 1778 2363
3. Subsidy 480 480 480 480 480
Composite Loan 1129 874 583 292 -
A. Total Liabilities 1894 2001 2268 2550 2843
1. Gross Fixed Assets 1372 1372 1372 1372 1372
Less Depreciation 132 264 396 528 660
NET BLOCK 1240 1108 976 844 712
2. Current Assets/W/C 551 551 551 551 551
3. Cash & Bank Balance 103 342 741 1155 1580
B. Total Assets 1894 2001 2268 2550 2843

7
Sources of Machinery
1. ZEAL SERVICES, 13, Konark Udyog, Off Karve Rd., Nr.Satyam Indl.Est., B / H.RESCON, Erandawane, Pune – 411038. Phone : (020 ) 25421547 / 32940517 2. PIPE TECH HYDRAULIC, Shop No.110, A - 2, Swapnanagari, Udyam Ngr., Nehru Ngr., Telco Rd., Pimpri, Pune - 411018, Phone : (020 ) 27502091

8
BLACK INSULATING TAPE
Introduction: Cotton selvedge tape for electrical insulation purposes as per IS:1923-1973 and IS:2448 (Part-I)-1963 of Bureau of Indian standards are often referred to as Black Tape. These are used in manufacture of ovens, Furnaces, Motors, etc. and in household electrical wirings & equipments. These are resistant to pressure & temperature. Electrical insulation is the main feature of Black Tapes. It is also used by cable manufacturers to cover conductors. Market: Black insulating tapes are used to cover joints of two conductors and hence an item of everyday use of all electrifications. Joining of more than one cable/ conductor is unavoidable in electrification works and hence Black Tape is a need for electrification works. With massive Electric generation and hence distribution network under implementation in Tripura, therefore, large demand for Black insulating tapes exist. These are sold through all Electrical stores in the state. Installed Capacity: Operating for single shift of 8 hours per day for 300 working days per annum, the unit shall have an annual installed capacity to produce 2.64 Lakh rolls of Black insulation tapes. Process of Manufacture: The unit will purchase 54 inch wide evenly and firmly woven cotton fabrics, free from weaving defects. Normally the fabric is Black in colour. Rubber compound with 12.50 percent Crepe Rubber, 5 percent National Rubber, 49.50 percent asbestos powder, 12.50 percent Resin, 0.50 percent Carbon Black and 20 percent castor oil are made in Mixing Mill so that the Rubber mix is made into a homogeneous mass. This Rubber mass is mixed with turpentine oil/ Benzene in the same Mixing Mill. This fluid is spread over the cotton fabric in a spreading Machine by using Doctors Blade Technique so that the cost of Rubber solution is uniform. The coated fabric is cut to the required width on a slitting Machine and wound on a winding machine into rolls of desired length. These are then labeled on sides of Rolls and packed in polyethylene. Process Flow Sheet:
Sales Raw Materials: The principal raw material of the unit will be petroleum based solvent as double the quantum of all other raw materials taken together shall be solvent. It will be available from Assam Oil Division of Indian Oil Corporation. All other raw materials are available comparatively cheap in Bagra market and China Market in Kolkata. The annual requirement at the installed capacity and costs are shown below:
Sl.No. Description Quantity required Cost in Rs.
1. Benzene 3000 Liters 2,14,500/-
2. Asbestos Powder 743 kilograms 49,368/-
3. Castor oil 300 Liters 18,150/-
4. Crepe Rubber 188 kilograms 31,020/-
5. Resin 187 kilograms 5,143/-
6. National Rubber 75 kilograms 6,600/-
7. Carbon Black 8 kilograms 220/-
8. Zinc oxide 8 kilograms 1,100/-
9. Labels 1,50,000 Numbers 5,500/-
10. Polyethylene films 100 kilograms 33,000/-
Total: 46,427/-
Mastication
& Mixing
Spreading of
solution on cloth
Winding Slitting Packing

9
Power: At 400/440 Volts, 50 Hz, AC, 3 Phase and 4 Wire the Unit will need 7KW of total connected load, which is locally available. The annual consumption of power is estimated at 10,800KWHrs costing Rs. 19,440/=. Water: The Unit will need 1000 Liters of water per day, the cost of drawing of which is shown with power cost. Manpower: The Unit will need to obtain a production chemist from outside the state. All other manpower are locally available. The requirement and annual cost of manpower is shown below:
Sl.No. Category of Manpower No. of Persons Annual Cost
1. Manager cum Chemist 1 1,32,000/-
2. Administrative & Sales Staff 3 1,78,200/-
3. Skilled Worker 2 1,32,000/-
4. Unskilled Worker 4 1,32,000/-
Total: 10 5,71,200/-
Capital Cost Estimate: 1. Land & Building: Covered area 186 sq.M. On Rent 2. Plant & Machinery a) 25 Cmx50 Cm Mixing Mill with all accessories 3,84,000/- b) Double Roll Spreading Machine 2,70,000/- c) Slitting Machine 54,000/- d) Sigma Mixer 54,000/- e) Misc. tools & equipments 60,000/- f) H.V. Break Down Tester, Laboratory Oven, adhesion Test & Pin hole 78,000/- testing equipments Rs. 9,00,000/- 3. Miscellaneous Fixed Asset a) Electrification Rs. 93,500/- b) Water Installation Rs. 11,000/- c) Furniture & Miscellaneous others Rs. 60,500/- Rs. 1,65,000/- 4. Provision for contingencies Rs. 49,500/- 5. Preliminary & pre-operative expenses Rs. 82,500/- Total Fixed Investment Rs. 11,97,000/- 6. Working Capital (for 3 months) a) Raw Materials Rs. 91,068/- b) Power Rs. 5,346/- c) Salary & Wages Rs.1,43,550/- d) Miscellaneous expenses Rs. 62,536/- Total: Rs.3,02,500/- Total Project Cost: Rs.14,99,500/- Means of Finance: Urban Rural a. Composite loan under PMEGP Rs. 10,49,650/- Rs.8,99,700/- b. Subsidy Rs. 3,74,875/- Rs.5,24,825/- c. Promoters contribution Rs. 74,975/- Rs. 74,975/-d. Debt Equity Ratio 2.33:1 1.50:1

10
Profitability: (Rs. In Thousands) Sl. No.
Description 1st Year 2nd Year 3rd year 4th Year 5th Year
1. Capacity utilized 60% 70% 80% 80% 80%
2. Annual Sales Realization 1,529 1,783 2,038 2,038 2,038
3. Annual Costs
(a) Raw Materials 219 255 292 292 292
(b) Power 18 18 19 19 19
(c) Wages & Salaries 521 546 570 520 570
(d) Repair & Maintenance 78 78 78 78 78
(e) Administrative overheads 110 115 121 127 134
(f) Selling expenses 230 267 306 306 306
(g) Depreciation 119 119 119 119 119
(h) Interest 120 98 72 44 15
Total: 1414 1496 1577 1555 1533
Total Variable Cost 466 540 617 617 617
4. Annual profit 115 287 461 483 505
5. Return on investment 7.67 19.14 30.75 32.22 33.68
6. Return on sales 7.52 16.09 22.13 23.69 24.77
7. Annual Contribution 1063 - - - -
8. Break Even Point as percent of capacity
56.16 - - - -
9. Cash accrual 234 406 580 602 602
10. Debt servicing capacity 354 604 652 646 639
11. Repayment of Composite Loan 170 198 227 227 227
12. Debt serviced 290 296 299 271 242
13. Pay Back Period 1 years 8 months 19 days
14. Debt Service Coverage Ratio (DSCR)
1.22:1
Cash Flow Statement: (Rs. In Thousands) Sl. No.
Description Pre-operative Period
O p e r a t i n g Y e a r s
First Second Third Fourth Fifth
1. Increase in Promoter’s capital 75 - - - - -
2. Increase in subsidy 375 - - - - -
3 Increase in loan 1050 - - - - -
4. Depreciation - 119 119 119 119 119
5. Profit before interests - 235 385 533 527 520
A. TOTAL SOURCES 1500 354 504 652 646 639
6. Increase in capital investment 1197 - - - - -
7. Increase in Current Assets 303 - - - - -
8. Interests - 120 98 72 44 15
9. Repayment of loan - 170 198 227 227 227
B. TOTAL DISPOSALS 1500 290 296 299 271 242
C. OPENING BALANCE - - 64 272 625 1000
D. NET SURPLUS - 64 208 353 375 397
E. CLOSING BALANCE - 64 272 625 1000 1397

11
Projected Balance sheet:
Sl.No. Description Amount in Rs Thousands as at the end of the
1st Yr. 2nd Yr. 3rd Yr. 4th Yr. 5th Yr.
1. Capital Account of the Promoter
75 190 477 938 1421
2. Surplus from operations 115 287 461 483 505
NET WORTH: 190 477 988 1421 1926
3. Subsidy 375 375 375 375 375
4. Loan Account 880 687 455 228 -
A. TOTAL LIABILITIES 1445 1534 1768 2024 2301
1. Gross Fixed Assets 1197 1197 1197 1197 1197
Less Depreciation 119 236 357 476 595
NET BLOCK 1078 959 840 721 602
2 Current Assets 303 303 303 303 303
3. Cash & Bank Balance 64 272 625 1000 1397
B. TOTAL ASSETS 1445 1534 1768 2024 2301
Machinery Suppliers:
1. Baranagore Metal Casting Co., 109 B.T. Road, Kolkata-700035 2. H.P. Singh & Co., 75, Ganesh Chandra Avenue, Kolkata-700013. 3. Premier Engineers, Post Box No. 11, SIRHIND-140406.

12
PVC COATED ELECTRICAL WIRES Introduction: Electrical wires need coating for insulation and hence safety. Coated Wires and Cables form Electrical use need to confirm to Bureau of Indian standards specification IS:694-1977, IS:5831-1970 and IS:8130-1976. Market: PVC coated Electrical wires/ cables are used primarily in house wiring and other internal wiring works. With better coverage of Electric grid, increased housing activities for residence, commercial and industrial purposes the market for PVC coated Electrical cables have increased manifold. Installed Capacity: Assuming that the unit will work for single shift of 8 hours per day for 300 working days per annum that the coverage size of wire shall be 1.5 sq.mm the annual installed capacity is estimated at 36,000 coils of 100 Meters of length each. Process of Manufacture: The PVC compound granules and E.C. grade Aluminium wire are fed to the PVC Extruder. The machine cost the wire with PVC Comnpound and exlude the coated wire through the water cooling tank where the PVC hardens. The wire is printed and winded into costs of 100 meters of length. These are then tested as per Bureau of Indian Standard specifications and packed for sales. Process Flow: Wire PVC Compound
Sales
Raw Material: The unit will need E.C. grade Aluminium wires, cable grade PVC Compound and Polyethylene Films as its raw materials, all of which need to be purchased from outside the state. Cables can be purchased from dealers in Pollock street Kolkata or M/s Kothari Brothers, 55, Ezra Street (4th Floor), Kolkata-700001. PVC Compound is available from National Organic Chemical Industries Ltd, BoB Building, Parliament Street, New Delhi besides others. The requirement and annual cost of raw-materials at the installed capacity is shown below:
Sl.No. Raw/ Packing Material Quantity per year Cost per annum
1. E.C. Grade Aluminium wire 24 M.T. 23,00,000/-
2. Cable Grade PVC Compound 36 M.T. 20,00,000/-
3. LDPE Film for packing L.S. 2,08,000/-
Total: 45,08,000/-
Power: The Unit will need a total connected Load of 15 KW at 400/440 Volts, 50 HC, AC, three phase & 4 wire. The annual consumption of power is estimated at 10, 295 KWHrs. Costing Rs. 18,531/=. The power is readily available from the State Electricity supply Corporation through its Grid. Water: The Unit will need 500 liters of water per day. It is available from both ground water sources and public supply. Manpower: Apart from the two skilled persons all manpower is readily available in Tripura. The requirement and annual costs of manpower at the installed capacity is shown below:
Sl.No. Category of Manpower No. of persons Annual Costs
1 Manager 1 Rs. 84,000
2 Office Assistants 2 Rs, 96,000
3. Skilled Worker 2 Rs. 1,20,000
4. Unskilled Workers 4 Rs. 1,20,000
Total 9 Rs. 4,20,000
Capital Cost Estimate: 1. Land & Building : Covered area 74 sq.M. On Rent 2. Plant & Machinery a). PVC Extruder & 65 mm Srew Diameter with cooling tank Rs. 4,75,000/-
Extrusion Cooling Coiling Testing
Packing
13
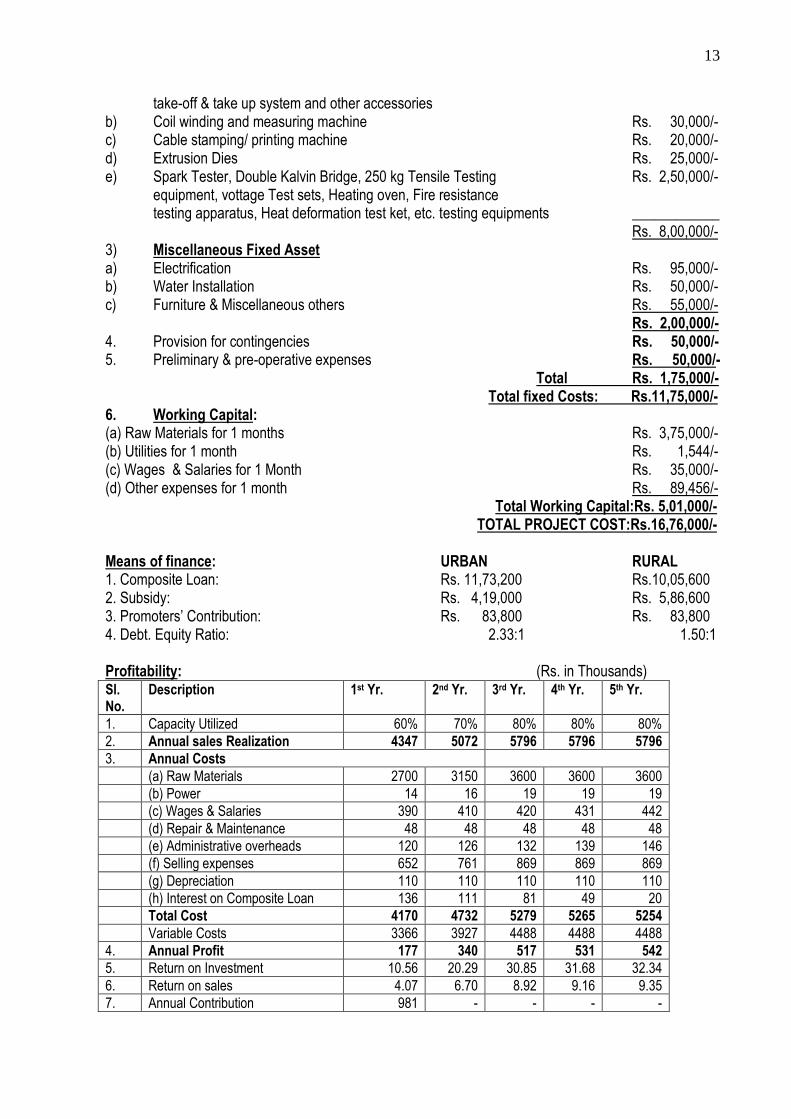
take-off & take up system and other accessories b) Coil winding and measuring machine Rs. 30,000/- c) Cable stamping/ printing machine Rs. 20,000/- d) Extrusion Dies Rs. 25,000/- e) Spark Tester, Double Kalvin Bridge, 250 kg Tensile Testing Rs. 2,50,000/- equipment, vottage Test sets, Heating oven, Fire resistance testing apparatus, Heat deformation test ket, etc. testing equipments ____________ Rs. 8,00,000/- 3) Miscellaneous Fixed Asset a) Electrification Rs. 95,000/- b) Water Installation Rs. 50,000/- c) Furniture & Miscellaneous others Rs. 55,000/- Rs. 2,00,000/- 4. Provision for contingencies Rs. 50,000/- 5. Preliminary & pre-operative expenses Rs. 50,000/- Total Rs. 1,75,000/- Total fixed Costs: Rs.11,75,000/- 6. Working Capital: (a) Raw Materials for 1 months Rs. 3,75,000/- (b) Utilities for 1 month Rs. 1,544/- (c) Wages & Salaries for 1 Month Rs. 35,000/- (d) Other expenses for 1 month Rs. 89,456/- Total Working Capital:Rs. 5,01,000/- TOTAL PROJECT COST:Rs.16,76,000/- Means of finance: URBAN RURAL 1. Composite Loan: Rs. 11,73,200 Rs.10,05,600 2. Subsidy: Rs. 4,19,000 Rs. 5,86,600 3. Promoters’ Contribution: Rs. 83,800 Rs. 83,800 4. Debt. Equity Ratio: 2.33:1 1.50:1 Profitability: (Rs. in Thousands) Sl. No.
Description 1st Yr. 2nd Yr. 3rd Yr. 4th Yr. 5th Yr.
1. Capacity Utilized 60% 70% 80% 80% 80%
2. Annual sales Realization 4347 5072 5796 5796 5796
3. Annual Costs
(a) Raw Materials 2700 3150 3600 3600 3600
(b) Power 14 16 19 19 19
(c) Wages & Salaries 390 410 420 431 442
(d) Repair & Maintenance 48 48 48 48 48
(e) Administrative overheads 120 126 132 139 146
(f) Selling expenses 652 761 869 869 869
(g) Depreciation 110 110 110 110 110
(h) Interest on Composite Loan 136 111 81 49 20
Total Cost 4170 4732 5279 5265 5254
Variable Costs 3366 3927 4488 4488 4488
4. Annual Profit 177 340 517 531 542
5. Return on Investment 10.56 20.29 30.85 31.68 32.34
6. Return on sales 4.07 6.70 8.92 9.16 9.35
7. Annual Contribution 981 - - - -

14
8. Break Even Point 49.17 - - - -
9. Cash Accrual 2.87 450 627 641 652
10. Debt Servicing Capacity 423 561 708 690 672
11. Repayment of Loan 173 220 260 260 260
12. Debt Serviced 309 331 341 309 280
13. Pay Back Period 2 Years 8 months 11 days
14. Debt Service Coverage Ratio 1:95:1
Cash Flow Statement: (Rs. in thousands) Sl. No.
Description Pre-ope- rative Period
O p e r a t I n g Y e a r s
1st 2nd 3rd 4th 5th
1. Increase in promoter’s capital 84 - - - - -
2. Increase in subsidy 419 - - - - -
3. Increase in Composite Loan 1173 - - - - -
4. Depreciation - 110 110 110 110 110
5. Profit before interests - 313 451 508 580 562
A. Total Sources 1676 423 561 708 690 672
6. Increase in capital investments 1175 - - - - -
7. Increase in Working Capital 501 - - - - -
8. Interests - 136 111 81 49 20
9. Repayment of Loan - 173 220 260 260 260
B. Total Disposals 1676 309 331 341 309 280
C. Opening Balance - - 114 344 711 1092
D. Net Surplus - 114 230 367 381 392
E. Closing Balance - 114 344 711 1092 1484
Projected Balance Sheets: (Rs. in thousand) Sl. No.
Description Amount as at the end of the
1st Yr. 2nd Yr. 3rd Yr. 4th Yr. 5th Yr.
1. Capital Account of the promoters 84 261 601 1118 1649
2. Surplus from operation 177 340 517 531 542
NET WORTH 261 601 1118 1649 2191
3. Subsidy 419 419 419 419 419
Composite Loan 1000 780 520 260 -
A. Total Liabilities 1680 1800 2657 2328 2610
1. Gross Fixed Assets 1175 1175 1175 1175 1175
Less Depreciation 110 220 330 440 550
NET BLOCK 1065 955 845 735 625
2. Current Assets/W/C 501 501 501 501 501
3. Cash & Bank Balance 114 344 711 1092 1484
B. Total Assets 1680 1800 2057 2328 2610
Machinery Suppliers: 1. Kolsite Industries, P.B. No. 7368, 31, Shah Industrial Estate, Andheri (W), Mumbai-400058 2. R.H. Windsor (India) Ltd, E-6, U Road, Thana Industrial Estate, Thana. 3. Brimco Pvt. Ltd, Brimco House, 55, Government Industrial Estate, Kandivli Estate, Mumbai. 4. Boolani Engineering Corporation, 402, Veer Savarkar Road, Pravadevi estate, Mumbai-400025.

15
ASSEMBLING OF EMERGENCY LIGHTS
Introduction: In our country power cuts is a common problem whether it is a rural area or an urban one. Besides, this common problem, there are many places which suffer from insufficient current supply. Therefore, such conditions lead to suspension in the work of offices, shops, hotels, schools, hospitals, etc. Solution to this problem (at least to an extent) is emergency lights. Usually emergency light has a lamp fitted in it 60 watt and has a change over relay circuit-with the help of which as soon as the normal current stops, lamp of this light lits. When the normal current gets back, relay lamp stops and the circuit get disconnected as well. A battery and a battery charging unit is also fitted into the unit and when emergency light is not required, it keeps getting charged. Emergency light is mainly a combination of tube light and reflector having following factors:-
1. 6 Volts 20 Watt tubelight 2. Change-over relay circuit (when the normal current supply stops, lamp gets started.) 3. Charging unit 4. Back up battery for emergency light. 5. Other hardware components.
Market: Since, power cuts is troublesome for every one, hence emergency light is the most appropriate solution especially for offices, shops, departmental stores, hotels, hospitals and others. It would not be wrong even if we say that it is a requirement of every house. These are possibilities of constant increase in the demand for emergency light considering the unpredictability of power supply. Hence, these are bright channels for success if the entrepreneur makes these following the exact procedure and taking care of the quality of his product. Production Process: The production process is mainly of assembling work. Different components are assembled according to the circuit diagram. A lamp and a reflector is fitted into the front portion of the unit. Then the assembled plate is fitted into the cover, finally, these equipments are tested and sent to the markets. Production Target: About 3600 emergency lights would be made annually. Usually the cost of emergency light is between Rs. 600 to 800 with the battery. In the given unit back-up battery would be used and each piece of emergency light would cost Rs. 700/- making the total annual income to be Rs. 25,20,000/-. Raw Materials: Raw Materials required by the Unit are locally available in Agartala and Silchar in Assam. The monthly costs of raw materials are shown below:
Sl.No. Description No Rate Cost
i) On-off switch 600 20/- 12,000/-
ii) Transformer 150 250/- 37,500/-
iii) Diody by 127 225 15/- 3,375/-
iv) Transistor 2 N 3055 125 30/- 3,750/-
v) Transistor SL 100 125 10/- 1,250/-
vi) Transistors B C-109C 125 20/- 2,500/-
vii) Resistors 470 ohms 125 1/- 125/-
viii) Resistors 680 ohms 125 1/- 125/-
ix) Resistors 1 K 125 1/- 125/-
x) Resistors 220 hms 2 w 125 300/- 37,500/-

16
xi) 6V/SA Dry Accumulator 125 110/- 13,750/-
xii) 10 W Tube light 225 80/- 18,000/-
xiii) Flexible wire - - 500/-
xiv) LED 5 mm with holder 125 5/- 625
xv) Soldering wire - - 1,000/-
xvi) Soldering flux 125 15/- 1,875/-
xvii) Printed circuit board 125 20/- 2,500/-
xviii) Plastic casings 125 100/- 12,500/-
xix) Bulb 6 watt 125 5/- 625/-
xx) Packing material 38,99500/-
Total Raw Material: 1,84,870/-
Power: The Unit shall need 10KW of total connected Load at 400/440 Volts, 50Hz,AC, 3 Phase & 4 Wire. The power is available from the State Electric Supply Corporation Grid. Annual consumption of power at the installed capacity is estimated at 18,000 KW Hrs. Costing Rs. 33,300/- Water: The Unit will need 1000 Ltrs. of clean and Soft Water per day, which may be locally available. Manpower: The requirements and costs of Manpower for the Unit at the installed capacity is shown below. Manpower shall be locally available.
Sl. No.
Category of Manpower No. of persons Annual Costs
1. Manager 1 Self
2. Administrative & Sales Clerk 1 Rs. 48,000
3. Skilled Workers 2 Rs. 72,000
4. Unskilled Workers 1 Rs. 24,000
Total: 6 Rs. 1,44,000/-
Financial Aspect of the Unit A. Capital Cost Estimate: 1) Land & Building 500 sq.ft. On Rent 2) Plants & Machinery
Sl.No. Description Quantity Cost
i) Digital MultiMatre 5 1,00,000/-
ii) Soldering Iron 2 7,000/-
iii) Portable drilling machine 1 10,500/-
iv) D.C. power supply 1 7,000/-
v) Hand drilling machine 1 3,31,500/-
vi) Single coil winding 1 6,000/-
vii) Hand operated tools like nose pliers, tape set, side cutter, pliers, screw driver spanner set, bendi wise, de-solder gun etc.
1,25,000/-
ix) Packing and forwarding of machines, electric charges, over transportation
25,000/-
Total: Rs.5,80,000/-
3. Miscellaneous Fixed Assets (a) Electrification Rs. 75,000/- (b) Water Installations Rs. 40,000/-

17
(c)Miscellaneous others Rs. 35,000/- Rs. 1,50,000/- 4. Provision for contingencies Rs. 40,000/- 5. Preliminary & Pre-operative expenses Rs. 80,000/-
Total fixed Costs: Rs. 8, 50,000/- 6. Working Capital: (a) Raw Materials for three months Rs. 5,54,612/- (b) Power cost for three months Rs. 8,325/- (c )Wages & Salaries for three months Rs. 73,500/- (d) Other expenses for three months Rs. 1,84,175/- Total Working Capital: Rs. 8,20,612/- TOTAL PROJECT COST:Rs.16,70,612/-
(Say Rs. 16,71,000)
Means of Finance: Urban Rural 1. Loan: Rs. 10,86,000 Rs. 9,19,050 2. Subsidy: Rs. 4,18,000 Rs. 5,84,850 3. Promoters’ Capital: Rs. 1,67,000 Rs. 1,67,100 4. Debt. : Equity Ratio: 2.33:1 1.50: 1 Profitability: (Rs in Thousands)
Sl. No.
Description 1st Yr. 2nd Yr. 3rd Yr. 4th Yr. 5th Yr.
1. Capacity Utilization 60% 70% 80% 80% 80%
2. Annual sales Realization 2495 2911 3326 3326 3326
3. Annual Costs in
(a) Raw Materials 1331 1553 1775 1775 1775
(b) Power 25 29 33 33 33
(c)Wages & Salaries 294 301 309 317 325
(d) Repair & Maintenance 32 32 32 32 32
(e) Administrative overheads 150 158 165 174 182
(f) Selling expenses 374 437 499 499 499
(g) Depreciation 80 80 80 80 80
(h) Interest 109 88 64 38 13
Total costs 2395 2678 2957 2948 2939
Total Variable Costs 1730 - - - -
4. Annual Operating Profit 100 233 369 378 387
5. Annual Contribution 765 - - - -
6. Break Even Point 52.16%
7. Return on Investment 5.98% 13.94% 22,08% 22.62% 23.16%
8. Return on sales 4.01% 8.00% 11.09% 11.37% 11.64%
9. Cash Accrual 180 313 449 458 467
10. Debt Servicing Capacity 289 401 513 496 480
11. Repayment of Loan 176 205 235 235 235
12. Debt Serviced 285 293 299 273 248
13. Pay Back Period 3 Years 3 Months 20 Days
14. Debt Service Coverage Ratio 1.56 : 1

18
Cash Flow Statement: (Rs. in Thousands)
Sl. No.
Description Pre-operative period
Operating years
1st 2nd 3rd 4th 5th
1. Increase in Promoters’ Capital
167 - - - - -
2. Increase in Subsidy 418 - - - - -
3. Increase in Loan 1086 - - - - -
4. Depreciation - 80 80 80 80 80
5. Profit before interest - 209 321 433 416 400
A Total Sources 1671 289 401 513 496 480
6. Increase in Capital Investment
850 - - - - -
7. Increase in Current Assets 821 - - - - -
8. Interests - 109 88 64 38 13
9. Repayment of Loan - 176 205 235 235 235
B. Total Assets 1671 285 293 299 273 248
C. Opening balance - - 4 112 326 549
D. Net Surplus - 4 108 214 223 232
E. Closing Balance - 4 112 326 549 781
Projected Balance Sheets:
Sl. No.
Description Amount in Rupees Thousand as at the end of the
1st Yr. 2nd Yr. 3rd Yr. 4th Yr. 5th Yr.
1. Capital Account of Promoters 167 267 500 869 1247
2. Surplus from operations 100 233 369 378 387
Net Worth 267 500 869 1247 1634
3. Subsidy 418 418 418 418 418
4. Loan Account 910 705 470 235 -
A. Total Liabilities 1595 1623 1757 1900 2052
1. Gross Fixed Assets 850 850 850 850 850
Less Depreciation 80 160 240 320 400
Net Block 770 690 610 530 450
2. Current Assets 821 821 821 821 821
3. Cash & Bank balance 4 112 326 549 781
B. Total Assets 1595 1623 1757 1900 2052

19
INVERTERS Introduction : Various sophisticated electronic and mechanical equipment require continuous and un-fluctuating power supply for effective functioning. Computer, fax machine, automatic teller machines, ATM counter, process control equipment tolerate break in AC power supply even for 1/10th of a second. Any power supply aberration would result in erasement of data in computers and cause process disorders in industries. Hence these equipment/ system should be backed up by alternate power source, which should be instantly supply the required power in case of power breakdown to run the computers / process uninterrupted. Product : Invertors consists of a converter , the converter is a battery chargers which has a step down transformer. The AC output from this transformer is converted to DC by passing through a rectifier, when the mains are an this DC output is issued to charge the battery and also an input to inverter which converters DC into AC output when the mains fail, charged battery acts as the input sources for the inverter. Market; The electrical power production in our country is much less than the demand. Through government is making efforts to bridge the gap between demand and supply by inviting private sector participation , the condition is expected to continue as demand is growing at a much further pace. It is clear that the demand the shortfall in power generation would continue is carrying years and there is growing need to have continuous power for sophisticated equipment in railway, telecom, computer institute, Post Office, Bank, ATM counter, Medical equipment etc. the usage of ups is household sector where PCS are installed is also increasing. Suggested Capacity: The minimum economic capacity for Inverter is 15,000 nos. per annum. On one shift basis on a 300 days working schedule in year. Raw Materials; The main raw materials required for manufacture of UPS are Capacitors, b. Resistors, c. PCB, d. Potentiometers etc, e. ICs Transistors IGBT Diodes, thyristors, f. Transformer coils, Chokes, Really, Mosfet, g. Switches, Buttons, Fuse, Circuit breaker, h. Cabinet etc. Raw materials are to be sourced mainly from the open market at present availability and supply of the raw materials is not problem e.g Capacitors, b. Resistors, c. PCB, d. Potentiometers etc, e. ICs Transistors IGBT Diodes, thyristors, f. Transformer coils, Chokes, Really, Mosfet, g. Switches, Buttons, Fuse, Circuit breaker, h. Cabinet etc. to be sourced from open local markets and out side of Tripura. Utilities : The unit will require a total connected load of 200 KVA and a maximum demand of 190 KVA. Water requirement is about 500KL per annum. Manpower: The unit will provide employment to the following 7 persons and all of whom are locally available. 1 Manager cum Supervisor Self Self 2. Skilled Engineer 4nos Rs.22,500/- 3. Office Boy 1 no Rs. 2,200/- 4. Sales Man 1no Rs. 3,300/- Total Rs.27,500/-

20
Manufacturing Process: UPS consists of components like transformer switches power devices and PCBs. The electronic control is in PCB, which consists of components like KS, transistors, resistors etc. The process of assembly of UPS involved the following steps.
1. Assembly 2. Fixing of various components. 3. Wiring 4. Battery assembly 5. Functional testing
Flow Chart : CAPITAL COST ESTIMATE: Land and Building: 1000Sq. ft. On Rent Plant & Machinery ; 1. Colour Poltter curve tracer for CAD/CAM computer Rs. 1,02,000/-
optical & other accessories. 2. Programmed multiple drilling Machine. Rs. 8,400/- 3. Winding Machine Rs. 1,800/- 4. Flow soldering machine Rs. 6,600/- 5. Surface mounting equipment Rs. 9,000/- 6. Storage oscilloscope 150 Mhz Rs. 8,200/- 7. CAD/CAM computer for PCB design Rs. 8,400/- 8. Testing equipment, Power analyzer Rs. 8,400/- 9. Impregnation & vacuum machine. Rs. 7,200/-
Total Rs. 1,60,000/- Add Vat 4% Rs. 18,334/-
Transportation Rs. 6,600/- Net Rs. 1,84,934/- Miscellaneous Fixed Assets: 1. Chair & Working Table Rs. 16,500/- 2. Fan & Lighting and wearing Rs. 16,500/- 3. Interior decoration Rs. 38,500/- Total Rs. 71,500/- Add Vat12.5%Rs. 8,935/- Installation Charges Rs. 2,063/- Total Rs. 82,498/- Preliminary & Preoperative Exp.: Rs. 4,950/- Total Fixed Capital: Rs. 2,72,382/- Working Capital: 1. Salary & Wages Rs. 27,500/- 2. Administrative expenses Rs. 13,666/- 3. Selling expenses Rs. 3,300/-
Assembling Fixing of Various
Components Wiring
Battery
Assembl
y
Connection
Fixing
Function
Testing Picketing
Sales

21
4. Raw Materials Rs. 2,20,000/- 5. Utilities Rs. 3,850/- Total: Rs. 2,68,316/- Total Cost of the Project: Rs. 5,40,698/- Means of Finance Urban Rural a. Composite loan under PMEGP 70% Rs. 3,78,488/- 60% Rs. 3,24,419/- b. Subsidy 25% Rs. 1,35,175/- 35% Rs. 1,89,243/- c. Margin Money 5% Rs. 27,035/- 5% Rs. 27,035/- Total Rs. 5,40,698 /- Rs. 5,40,698/- d. Debt Equity Ratio 2.33:1 1.50:1 Profitability: (Rs. In Thousands) Sl.No Description 1st Year 2nd Year 3rd year 4th Year 5th Year
1. Capacity utilized as percent of installed capacity
60% 70% 80% 80% 80%
2. Annual Sales 2138 2495 2851 2851 2851
3. Annual Costs
(a) Raw Materials 1584 1793 2112 2112 2112
(b) Utilities 27 32 37 37 37
(c) Selling expenses 23 28 32 32 32
4 Variable Cost 1634 1858 2181 2181 2181
(a) Wages & Salaries 198 231 264 264 264
(b) Administrative expenses 98 115 131 131 131
(c) Depreciation 27 27 27 27 27
(d) Interest on Composite Loan 44 34 25 15 5
5 Fixed & Semi Variable Cost 367 407 447 437 427
6 Total Cost 2001 2260 2628 2618 2608
7. Annual profit 137 235 223 233 243
8 Return on investment 25.37% 43.51% 41.29% 43.14% 45.00%
9. Return on sales 6.40% 9.41% 7.82% 8.17% 8.52%
10. Annual Contribution 504
11 Break Even Point in percent 43.69%
12 Cash accrual 164 262 250 260 270
13. Debt servicing capacity 208 296 275 275 275
14 Repayment of Composite Loan 61 71 82 82 82
15. Debt serviced 105 105 106 96 86
16 Pay Back Period 1 years 11 month 22 days
17. Debt Service Coverage Ratio (DSCR)
1.98:1
Cash Flow Statement: (Rs. In Thousands) Sl. No.
Description Pre-operative Period
O p e r a t i n g Y e a r s
First Second Third Fourth Fifth
1. Increase in Promoter’s capital 27 NIL NIL NIL NIL NIL
2. Increase in composite loan 378 NIL NIL NIL NIL NIL
3 Increase in Subsidy 135 NIL NIL NIL NIL NIL
4. Depreciation 27 27 27 27 27
22
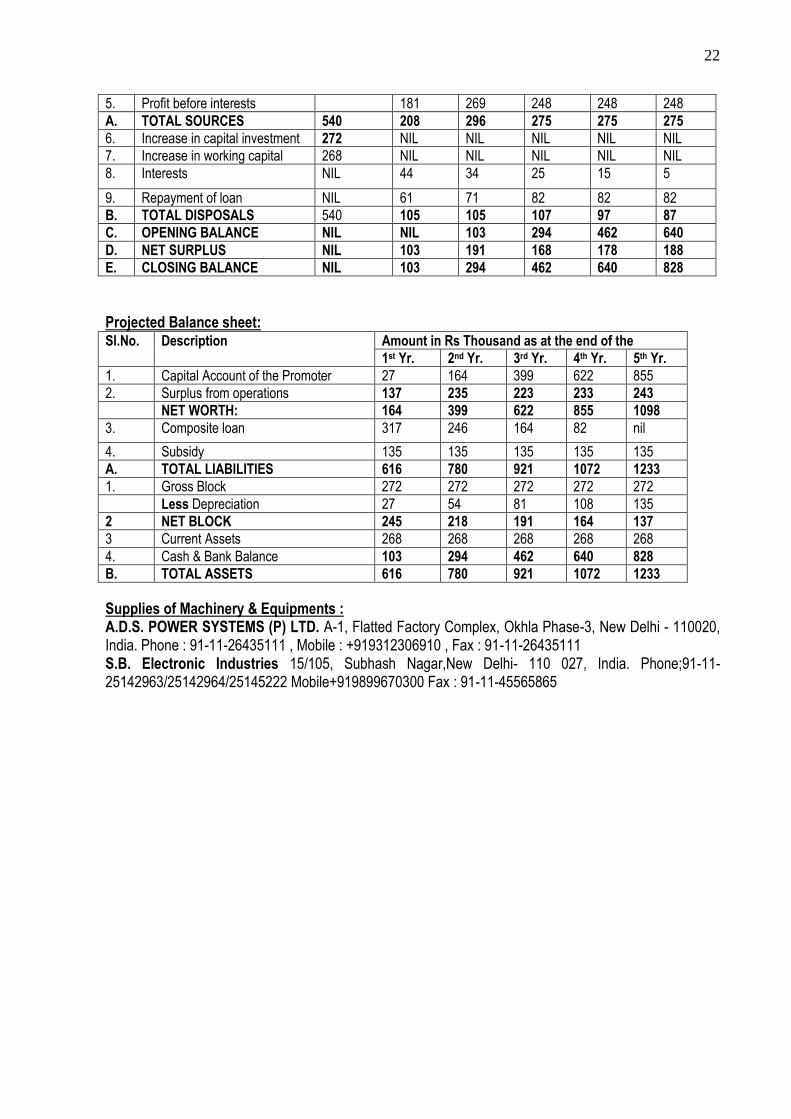
5. Profit before interests 181 269 248 248 248
A. TOTAL SOURCES 540 208 296 275 275 275
6. Increase in capital investment 272 NIL NIL NIL NIL NIL
7. Increase in working capital 268 NIL NIL NIL NIL NIL
8. Interests NIL 44 34 25 15 5
9. Repayment of loan NIL 61 71 82 82 82
B. TOTAL DISPOSALS 540 105 105 107 97 87
C. OPENING BALANCE NIL NIL 103 294 462 640
D. NET SURPLUS NIL 103 191 168 178 188
E. CLOSING BALANCE NIL 103 294 462 640 828
Projected Balance sheet: Sl.No. Description Amount in Rs Thousand as at the end of the
1st Yr. 2nd Yr. 3rd Yr. 4th Yr. 5th Yr.
1. Capital Account of the Promoter 27 164 399 622 855
2. Surplus from operations 137 235 223 233 243
NET WORTH: 164 399 622 855 1098
3. Composite loan 317 246 164 82 nil
4. Subsidy 135 135 135 135 135
A. TOTAL LIABILITIES 616 780 921 1072 1233
1. Gross Block 272 272 272 272 272
Less Depreciation 27 54 81 108 135
2 NET BLOCK 245 218 191 164 137
3 Current Assets 268 268 268 268 268
4. Cash & Bank Balance 103 294 462 640 828
B. TOTAL ASSETS 616 780 921 1072 1233
Supplies of Machinery & Equipments : A.D.S. POWER SYSTEMS (P) LTD. A-1, Flatted Factory Complex, Okhla Phase-3, New Delhi - 110020, India. Phone : 91-11-26435111 , Mobile : +919312306910 , Fax : 91-11-26435111 S.B. Electronic Industries 15/105, Subhash Nagar,New Delhi- 110 027, India. Phone;91-11-25142963/25142964/25145222 Mobile+919899670300 Fax : 91-11-45565865

23
UPS ASSEMBLING UNIT
Introduction : Various sophisticated electronic and mechanical equipment require continuous and un-fluctuating power supply for effective functioning. Computer, fax machine, automatic teller machines, ATM counter, process control equipment tolerate break in AC power supply even for 1/10 th of a second. Any power supply aberration would result in easement of data in computers and cause process disorders in industries. Hence these equipment/ system should be backed up by alternate power source, which should be instantly supply the required power in case of power breakdown to run the computers /process uninterrupted. Market; The electrical power production in our country is much less than the demand. Through government is making efforts to bridge the gap between demand and supply by inviting private sector participation , the condition is expected to continue as demand is growing at a much further pace. It is clear that the demand the shortfall in power generation would continue is carrying years and there is growing need to have continuous power for sophisticated equipment in railway, telecom, computer institute, Post Office, Bank, ATM counter, Medical equipment etc. the usage of ups is household sector where PCS are installed is also increasing. Suggested Capacity: The minimum economic capacity for UPS is 15,000 nos per annum On one shift basis on a 300 days working schedule in year. Manufacturing Process: UPS consists of components like transformer switches power devices and PCBs. The electronic control is in PCB, which consists of components like KS, transistors, resistors etc. The process of assembly of UPS involved the following steps. 1. Assembly 2. Fixing of various components. 3. Wiring 4. Battery assembly 5. Functional testing Raw Materials; The main raw materials required for manufacture of UPS are Capacitors, b. Resistors, c. PCB, d. Potentiometers etc, e. ICs Transistors IGBT Diodes, thyristors, f. Transformer coils, Chokes, Really, Mosfet, g. Switches, Buttons, Fuse, Circuit breaker, h. Cabinet etc. Raw materials are to be sourced mainly from the open market. Raw materials may be sourced from open indigenous markets. These may cost Rs.2,20,000/- per annum. Utilities : The unit will require a total connected load of 5 KVA. The annual consumption of power is estimated at 11,356 KWHrs costing Rs. 46,560/-. Water requirement is about 500 Liters per day. Manpower: The unit will need to provide employment to the following 7 persons and all man power is available from local area. 1. Manager cum Supervisor Self Self 2. Skilled 4nos Rs.22,500/- 3. Office Boy/Peon 1 no Rs. 2,200/- 4. Sales Man 1no Rs. 3,300/- Total Rs.27,500/-

24
CAPITAL COST ESTIMATE: Land and Building: 200Sq. Mtrs. On Rent Plant & Machinery ; 1. Colour Plotter curve tracer for CAD/CAM computer Rs. 1,87,200/-
optical & other accessories. 2. Programmed multiple drilling Machine. 3. Winding Machine 4. Flow soldering machine 5. Surface mounting equipment 6. Storage oscilloscope 150 Mhz 7. CAD/CAM computer for PCB design 8. Testing equipment 9. Power analyzer 10. Impregnation & vacuum machine. ____________ Total: Rs. 1,87,200/- Miscellaneous Fixed Assets: 1. Chair & Working Table Rs. 32,500/- 2. Fan & Lighting and wearing Rs. 15,000/- 3. Interior decoration Rs. 35,000/- Total: Rs. 82,500/- Preliminary & Preoperative Exp.: Rs. 4,950/-
Total Fixed Capital: Rs. 2,74,650/- Working Capital (P.m) 1. Salary & Wages Rs. 27,500/- 2. Administrative expenses Rs. 13,666- 3. Selling expenses Rs. 3,300/- 4. Raw Materials Rs. 2,20,000/- 5. Utilities Rs. 3,880/- Total: Rs. 2,68,316/-
Total Cost of the Project :Rs. 5,42,966/- Means of Finance: Urban Rural a. Composite loan under PMEGP 70% Rs. 3,80,076/- 60% Rs. 3,25,780/- b. Subsidy 25% Rs. 1,35,742/- 35% Rs. 1,90,038/- c. Margin Money 5% Rs. 27,148/- 5% Rs. 27,148/-
Total Rs. 5,42,966/- Rs. 5,42,966/- d. Debt Equity Ratio 2.33:1 1.50:1 Profitability: (Rs. In Thousands) Sl.No Description 1st Year 2nd Year 3rd year 4th Year 5th Year
1. Capacity utilized as percent of installed capacity
60% 70% 80% 80% 80%
2. Annual Sales 2,138 2,495 2,851 2,851 2,851
3. Annual Costs
(a) Raw Materials 1,58 1,848 2,112 2,112 2,112
(b) Utilities 27 32 37 37 37
(c) Selling expenses 24 28 31 31 31
4 Variable Cost 1,635 1,908 2,180 2,180 2,180
(d) Wages & Salaries 198 231 264 264 264
(e) Administrative expenses 98 115 131 131 131
25
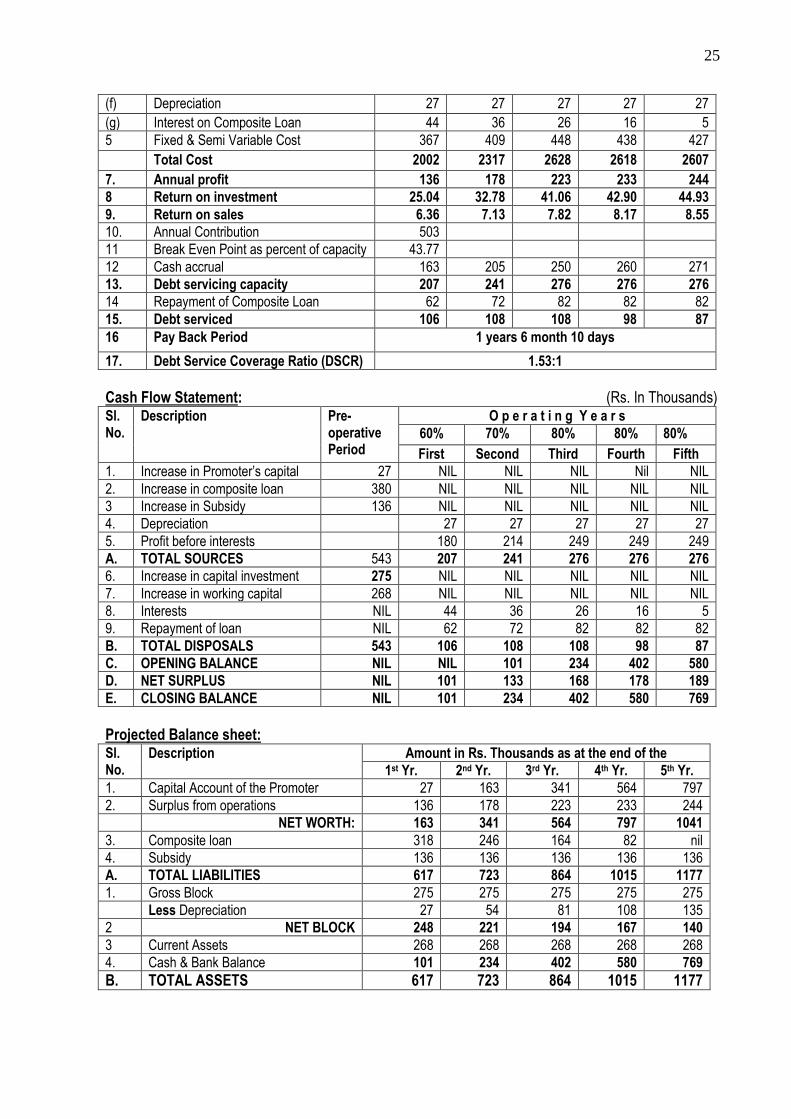
(f) Depreciation 27 27 27 27 27
(g) Interest on Composite Loan 44 36 26 16 5
5 Fixed & Semi Variable Cost 367 409 448 438 427
Total Cost 2002 2317 2628 2618 2607
7. Annual profit 136 178 223 233 244
8 Return on investment 25.04 32.78 41.06 42.90 44.93
9. Return on sales 6.36 7.13 7.82 8.17 8.55
10. Annual Contribution 503
11 Break Even Point as percent of capacity 43.77
12 Cash accrual 163 205 250 260 271
13. Debt servicing capacity 207 241 276 276 276
14 Repayment of Composite Loan 62 72 82 82 82
15. Debt serviced 106 108 108 98 87
16 Pay Back Period 1 years 6 month 10 days
17. Debt Service Coverage Ratio (DSCR) 1.53:1
Cash Flow Statement: (Rs. In Thousands) Sl. No.
Description Pre- operative Period
O p e r a t i n g Y e a r s
60% 70% 80% 80% 80%
First Second Third Fourth Fifth
1. Increase in Promoter’s capital 27 NIL NIL NIL Nil NIL
2. Increase in composite loan 380 NIL NIL NIL NIL NIL
3 Increase in Subsidy 136 NIL NIL NIL NIL NIL
4. Depreciation 27 27 27 27 27
5. Profit before interests 180 214 249 249 249
A. TOTAL SOURCES 543 207 241 276 276 276
6. Increase in capital investment 275 NIL NIL NIL NIL NIL
7. Increase in working capital 268 NIL NIL NIL NIL NIL
8. Interests NIL 44 36 26 16 5
9. Repayment of loan NIL 62 72 82 82 82
B. TOTAL DISPOSALS 543 106 108 108 98 87
C. OPENING BALANCE NIL NIL 101 234 402 580
D. NET SURPLUS NIL 101 133 168 178 189
E. CLOSING BALANCE NIL 101 234 402 580 769
Projected Balance sheet: Sl. No.
Description Amount in Rs. Thousands as at the end of the
1st Yr. 2nd Yr. 3rd Yr. 4th Yr. 5th Yr.
1. Capital Account of the Promoter 27 163 341 564 797
2. Surplus from operations 136 178 223 233 244
NET WORTH: 163 341 564 797 1041
3. Composite loan 318 246 164 82 nil
4. Subsidy 136 136 136 136 136
A. TOTAL LIABILITIES 617 723 864 1015 1177
1. Gross Block 275 275 275 275 275
Less Depreciation 27 54 81 108 135
2 NET BLOCK 248 221 194 167 140
3 Current Assets 268 268 268 268 268
4. Cash & Bank Balance 101 234 402 580 769
B. TOTAL ASSETS 617 723 864 1015 1177
26
Supplies of Machinery & Equipments : 1. A. D. S. POWER SYSTEMS (P) LTD. A-1, Flatted Factory Complex, Okhla Phase-3, New Delhi -
110020, Phone : 91-11-26435111 , Mobile : +919312306910 , Fax : 91-11-26435111 2. S. B. Electronic Industries, 15/105, Subhash Nagar, New Delhi – 110027. Phone : 91-11-
25142963/ 25142964/25145222, Mobile : +919899670300, Fax : 91-11-45565865

27
JUTE & TEXTILES
INDUSTRIES

28
GARMENTS
Introduction: The business of Garments is now a developed business in its own right. Peoples’ indication towards the readymade clothes is rising day-by-day. This indication can be attributed to their busy schedules and the attractive designs as well as variety in the readymade clothes. Although there is a considerably big range under ‘readymade’ clothes but here we shall deal with children wear and Ladies Garments. Market of such clothes is quite large and material required for making such clothes is also not a problem even on local level. Market: As it is an item of daily use and necessity, their marketing will not be problem provided the consumers are properly educated above the gains and advantages of readymade garments vis-à-vis made to order only. These items have got bright export potential and at present this industry is thriving on exports only. Target: Target set in the given unit is of sales worth Rs. 34,68,000/-.
Process of Manufacture: Fabrics are cut to proper size & shapes. These are stitched together as per specification. These are then interlocked. Button holes are made. Buttons are stitched manually. The finished products are then manually Ironed and packed. Raw Materials: Fabrics, appliqués, Packing Boxes, Polythene Bags, Buttons, Yarn, etc shall be the raw materials for the Unit. Product-wise cost estimates of them are shown below:
Sl.No. Details Cost (in Rs.)
1. Jeans Pants (for children) 15,000/-
2. Gaberdine Pants (for children) 13,500/-
3. Tericot Pants (for children) 15,000/-
4. Tericot shirts (for children) 6,000/-
5. Baba suits 12,000/-
6. Frock (for children) 17,500/-
7. T- shirt 25,500/-
8. Salwar – kurta sets 44,500/-
9. Ladies Gowns 15,000/-
10. other products 50,000/-
Total: 2,14,000/-
Raw Materials Suppliers:
1) Ankur, 208/5, Rash Behari Avenue, Kolkata – 29. 2) GIRIRAJ GARMENTS READYMADE HOUSE, 13, Ganguly Lane, Burrabazar, Kolkata – 700 007. 3) Goenkas, Shikh Mandir, H.B.Road, Fancy Bazar, Ghy – 781001.
Power: The power is available from the state Electric supply corporation Grid. The annual consumption of power is estimated Rs. 17,400/-. Manpower: Manpower required by the unit including skilled workers is locally available. The requirement and annual costs of manpower at the installed capacity is shown below:

29
Sl.No. Category of Manpower No. of Persons Annual Cost
1. Manager 1 Self
2. Sales & Administrative staff 3 1,38,600/-
3. Skilled Workers 5 2,97,000/-
4. Unskilled Workers 2 66,000/-
Total 11 5,01,600/-
Financial Aspect of the unit: 1) Land & Building: 92 Sq. Mtrs. Rented 2) Plant & Machinery a) 4 No.s of Sewing Machine Rs. 34,560/- b) Misc. Hand Tools Rs. 3,840/- Rs. 38,400/- 3) Miscellaneous Fixed Asset a) Electrification Rs. 27,500/- b) Furniture & Miscellaneous others Rs. 82,500/- Rs.1,10,000/- 4. Provision for contingencies Rs. 8,800/- 5. Preliminary & pre-operative expenses Rs. 16,500/- Total Fixed Investment Rs. 1,70,500/- 6. Working Capital a) Raw Material Rs. 1,04,720/- b) Utilities Rs. 1,595/- c) Salary & Wages Rs. 1,25,565/- d) Other expenses Rs. 27,005/- Total working capital: Rs. 2,58,885/- Total Project Cost: Rs. 4,29,385/- Means of Finance: Urban Rural 1. Composite loan 3,00,570/- 2,57,631/- 2. Promoter’s contribution 21,469 /- 21,469/- 3. Subsidy 1,07,346/- 1,50,285/- 4. Debt equity ratio 2.33:1 1.50:1 Profitability: (Rs. In Thousands)
Sl.No. Description 1st year 2nd year 3rd year 4th year 5th year 1. Capacity utilized 60% 70% 80% 80% 80%
2. Annual Sales Realization. 1288 2670 3051 3051 3051
3. Annual Costs
a) Raw Materials 1256 1537 1784 1784 1784
b) Utilities 11 13 15 15 15
c) Selling expenses 181 211 242 242 242
Variable Cost 1448 1761 2041 2041 2041
d) Wages & Salaries 501 514 527 559 560
e) Administrative expenses 198 231 264 264 264
f) Depreciation 17 17 17 17 17
g) Interest on Composite Loan 34525 27925 20309 12186 4062
4. Total Cost 2199 2551 2869 2893 2886
5. Annual Profit 89 119 182 158 165
6. Return on Investment 20.74% 27.73% 42.42% 36.82% 38.46%

30
7. Return on sales 3.89% 4.46% 5.96% 5.17% 5.40%
8. Annual contribution 840 - - - -
9. Break Even Point
10. Cash accrual 106 136 199 1751 182
11. Debt Servicing Capacity 141 164 202 187 186
12. Repayment of Composite Loan 49 57 65 65 65
13. Debt Serviced 83 84 85 77 69
14. Pay Back Period 1 year 7 months 27 days
15. Debt Service Coverage Ratio 1.69:1
Cash Flow Statement: (Rs. In Thousands) Sl. No.
Description Pre-ope-rative Period
O p e r a t i n g Y e a r s
First Second Third Fourth Fifth
1. Increase in Promoter’s contribution
21 - - - - -
2. Increase in Term loan 300 - - - -
3. Subsidy 107 - - - - -
4. Depreciation - 17 17 17 17 17
5. Profit before interests - 124 147 202 170 169
A. TOTAL SOURCES 429 141 164 219 187
1866.
Increase in capital investment
170 - - - - -
7. Increase in working capital 259 - - - - -
8. Interest - 35 28 20 12 4
9. Repayment of Loan - 49 57 65 65 65
B. TOTAL DISPOSALS 429 84 85 85 77 69
C. OPENING BALANCE NIL NIL 57 136 270 380
D. NET SURPLUS NIL 57 79 134 110 117
E. CLOSING BALANCE NIL 551 136 270 380 497
Projected Balance sheet:
Sl.No. Description Amount in Rupees Thousand as at the end of the
1st Yr. 2nd Yr. 3rd Yr. 4th Yr. 5th Yr. 1. Capital Account of Promoter 21 110 229 411 569
2. Surplus from operation 89 119 182 158 165
NET WORTH: 110 229 411 569 734
3. Subsidy 107 107 107 107 107
4. Loan Account 252 196 130 65 - TOTAL LIABILITIES 469 531 648 741 841
1. Gross Block 170 170 170 170 170
Less Depreciation 17 34 51 68 85
NET BLOCK 153 136 119 102 85
2. Working capital 259 259 259 259 259 3. Cash & Bank Balance 57 136 270 380 497
TOTAL ASSETS 469 531 648 741 841
Suppliers of Machinery: 1. Giribala Udyog, Bottola, Agartala 2. Oriental Machineries Pvt. Ltd., Lake Road, Haradhan Sangha, Agartala

31
HOSIERY
Introduction: Hosiery projects including knitting of yarn into fabric and use of such fabrics for manufacturing Garments and undergarments have excellent domestic and export market. Products like undergarments and children wear from knitted fabrics are comparatively cheap and comfortable. Because of these properties Hosiery products are consumed in all strata of society. Bureau of Indian standards has specified IS:4964(P-II)- 1975, IS:4965-1975, IS-298, IS-13003 and IS-1895 for cotton knitted and stitched Hosiery products. Till recently cotton knitwear produced were only undergarments. However, now Children wear and Sports wear is added to product range of cotton knitwear. Cotton knitwear are more elastic, sweat absorbing and these provide better comfort to wearer compared to woven fabrics. Market: Seventy five percent of Indian export of knitwear is of cotton as Indian Cotton Knitwear has found wide acceptance in Europe, USA, Middle East & Canada. At present about twenty five percent of Indian apparel export is constituted by cotton knitwear. Most of the production of cotton knitted fabrics in India is located in North-Western India while cotton knitted garments manufacturers are located all over the country. The domestic market for cotton knitted undergarments is also very large as items like vests (Baryan/ Ganjee) and Briefs are consumed all over the country. In Tripura alone annually more than 5 Million vests (Ganjee) and 2.5 Million Underwear Briefs are consumed. There is also excellent export potential to Bangladesh for these products. Therefore, a cotton knitwear unit may have good marketing scope in Tripura. Capacity: Operating single shift of 8 hours per day for 300 working days per annum the proposed Unit may have an annual installed capacity to produce 16250 Dozens of vests and 8750 Dozens of Briefs. Process of Manufacture: Knitted Cotton fabrics shall be purchased by the unit from manufacturers. These fabrics are cut as per design. These are stitched, over locked and chain locked. In case of Briefs elastic tapes are attached, where necessary. Finished vests/Briefs are tested, packed and then bulk-packed. Process Flow:
Raw Materials: Bleached Cotton Knitted Fabrics of 34 Count & Ribbed 40 counts are the principal raw materials of the Unit. These are available from M/S Bombay Textiles, 82/1A, G.T. Road, Kolkata-700 002, M/S Sham Lal Dev Raj, Banjman Road, Ludhiana, M/S S.K. Oswal Hosiery. Purnabazar, Ludhiana, M/s Popular Hosiery mill, Near Model basti, New Delhi- 110 006 etc. Packing Material including Brown Board, Polyethylene Bags, Printed Duplex Board Boxes, etc. need to be of best possible quality. These are available in Kolkata & Guwahati. Other inputs like 20s cotton yarn, Sewing thread, needles, Lubricants for machinery, etc. are locally available. The requirement at the installed capacity and annual costs are shown below:
Sl.No. Raw/ Packing material Quantity Cost
1. Bleached Cotton knitted fabrics of 34 counts 16,250 kilograms 35,75,000/-
2. Bleached Cotton Ribbed knitted fabrics of 40 counts 4,375 kilograms 7,33,907/-
3. Twisted Sewing Threads 660 cones 1,08,900/-
4. Packing Material 50,000 sets 5,50,000/-
5. Elastic Tapes 5,105 Meters 42,116/-
6. Consumable like Lubricants, needles, betts etc. L.S. 1,65,000/-
Total: 51,74,924/-
Knitted
Fabric
Cutting Stitching Packing Sales
32
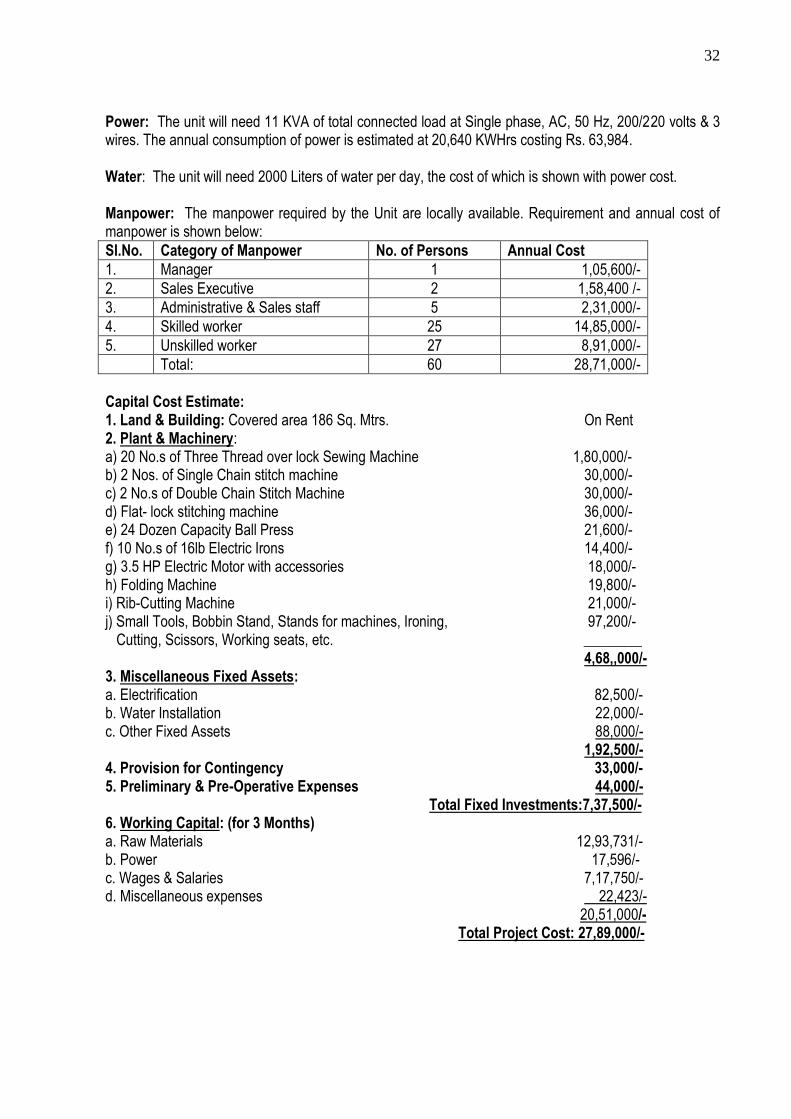
Power: The unit will need 11 KVA of total connected load at Single phase, AC, 50 Hz, 200/220 volts & 3 wires. The annual consumption of power is estimated at 20,640 KWHrs costing Rs. 63,984. Water: The unit will need 2000 Liters of water per day, the cost of which is shown with power cost. Manpower: The manpower required by the Unit are locally available. Requirement and annual cost of manpower is shown below:
Sl.No. Category of Manpower No. of Persons Annual Cost
1. Manager 1 1,05,600/-
2. Sales Executive 2 1,58,400 /-
3. Administrative & Sales staff 5 2,31,000/-
4. Skilled worker 25 14,85,000/-
5. Unskilled worker 27 8,91,000/-
Total: 60 28,71,000/-
Capital Cost Estimate: 1. Land & Building: Covered area 186 Sq. Mtrs. On Rent 2. Plant & Machinery: a) 20 No.s of Three Thread over lock Sewing Machine 1,80,000/- b) 2 Nos. of Single Chain stitch machine 30,000/- c) 2 No.s of Double Chain Stitch Machine 30,000/- d) Flat- lock stitching machine 36,000/- e) 24 Dozen Capacity Ball Press 21,600/- f) 10 No.s of 16lb Electric Irons 14,400/- g) 3.5 HP Electric Motor with accessories 18,000/- h) Folding Machine 19,800/- i) Rib-Cutting Machine 21,000/- j) Small Tools, Bobbin Stand, Stands for machines, Ironing, 97,200/- Cutting, Scissors, Working seats, etc. ________ 4,68,,000/- 3. Miscellaneous Fixed Assets: a. Electrification 82,500/- b. Water Installation 22,000/- c. Other Fixed Assets 88,000/- 1,92,500/- 4. Provision for Contingency 33,000/- 5. Preliminary & Pre-Operative Expenses 44,000/- Total Fixed Investments:7,37,500/- 6. Working Capital: (for 3 Months) a. Raw Materials 12,93,731/- b. Power 17,596/- c. Wages & Salaries 7,17,750/- d. Miscellaneous expenses 22,423/- 20,51,000/- Total Project Cost: 27,89,000/-

33
Means of Finance: Urban Rural 1. Composite Loan Under PMEGP Rs. 19,52,300/- Rs. 16,73,400/- 2. Subsidy Rs. 6,97,250/- Rs 9,76,150/- 3. Promoter’s Capital Rs. 1,39,450/- Rs. 1,39,450/- 4. Debt: Equity Ratio 2.33: 1 1.50: 1 Profitability: (Rs. in Thousands)
Sl. No.
Description 1st Year 2nd Year 3rd Year 4th Year 5th Year
1. Capacity Utilization 60% 70% 80% 80% 80%
2. Annual Sales Realization 6782 7912 9042 9042 9042
3. Annual Costs in
a. Raw Materials 3105 3622 4140 4140 4140
(b) Power 46 53 59 59 59
© Wages & Salaries 1921 2170 2420 2482 2543
(d) Repair & Maintenance 25 25 25 25 25
(e) Administrative overheads 110 116 121 128 134
(f) Selling expenses 1018 1187 1356 1356 1356
(g) Depreciation 73 73 73 73 73
(h) Interest 231 187 137 82 28
Total: 6529 7433 8331 8345 8358
Total Variable Cost 4169 4862 5555 5555 5555
4. Annual profit 253 479 711 697 684
5. Return on investment 9.88% 18.04% 26.36% 25.80% 25.20%
6. Return on sales 4.01% 6.27% 8.02% 7.85% 7.66%
7. Annual Contribution 2613
8. Break Even Point 54.19%
9. Cash accrual 326 552 784 770 757
10. Debt servicing capacity 557 739 921 852 785
11. Repayment of Loan 317 369 422 422 422
12. Debt serviced 548 556 559 504 450
13. Pay Back Period 3 years 3 months 19 days
14. Debt Service Coverage Ratio 1.50:1
Cash Flow Statement: (Rs. in Thousands)
Sl. No.
Description Pre-ope-rative Period
O p e r a t i n g Y e a r s
First Second Third Fourth Fifth
1. Increase in Promoter’s capital 140 - - - - -
2. Increase in subsidy 697 - - - - -
3 Increase in loan 1952 - - - - -
4. Depreciation - 73 73 73 73 73
5. Profit before interests - 484 666 848 779 712
A. TOTAL SOURCES 2789 557 739 921 852 785
6. Increase in fixed investment 738 - - - - -
7. Increase in Working Capital 2051 - - - - -
8. Interests - 231 187 137 82 28
9. Repayment of loan - 317 369 422 422 422
B. TOTAL DISPOSALS 2789 548 556 559 504 450
C. OPENING BALANCE - - 9 192 554 902
D. NET SURPLUS - 9 183 362 348 335
E. CLOSING BALANCE - 9 192 554 902 1237

34
Projected Balance sheet:
Sl.No. Description Amount in Rs. Thousands as at the end of the
1st Yr. 2nd Yr. 3rd Yr. 4th Yr. 5th Yr.
1. Capital Account of the Promoter 140 393 872 1583 2280
2. Surplus from operations 253 479 711 697 684
NET WORTH: 393 872 1583 2280 2964
3. Subsidy 697 697 697 697 697
4. Loan Account 1635 1266 844 422 -
A. TOTAL LIABILITIES 2725 2835 3124 3399 3661
1. Gross Fixed Assets 738 738 738 738 738
Less Depreciation 73 146 219 292 365
NET BLOCK 665 592 519 446 373
2 Closing Stocks 2051 2051 2051 2051 2051
3. Cash & Bank Balance 9 192 554 902 1237
B. TOTAL ASSETS 2725 2835 3124 3399 3661
Suppliers of Machinery: 1. Giribala Udyog, Agartala. 2. H.P. Singh & Co., B.G.C. Avenue, Kolkata.

35
JUTE BAGS
Introduction: Decorated, coloured, Silky-lustre, light in weight jute bags (Both for ladies and school going children) are being preferred in the society due to their good appearance, durability and reasonable cost. As it is easy to their fabricate the jute bags, so jute bags of various shapes and sizes can be manufactured. In modern days packing/ carrying materials are playing a prominent and distinctive role in domestic as well as export fields. The jute bags (Tea bags) are used to carry the precise article of daily use and tea in various quantities. All the machinery and raw material used for manufacturing id such products are available from indigenous sources. Marketing: These items have a very good demand in the domestic market. Much emphasis is given to this Industry to cater to the growing demand of foreign buyers. The products like any other consumer durable have the prospect of attracting wide range of people from all walks of life. With more than cores of population in the country and with the rising standards of living and economic up-liftment of the people from the poverty line, there exists an ever increasing demand of the products both in the internal as well as the external market Monthly Production & Sales : Assuming that the Unit will operate for single shift per day for 25 working days per month the following capacity and sales are estimated: Sl.No Descriptions Rate Qty Total 1. Different types of ladies bag 181.50/- 1000 Rs.1,81,500/- 2. Tea Bag 46.75 500 Rs. 23,375/- 3. Shopping Bag 27.5/- 1000 Rs. 27,500/- 4. Water battle./ Carry bag. 16.5/- 500 Rs 8,250/-. 5. Different types of folder etc 33/- 500 Rs 16,500/- 6. Other Jute product (wall designe, etc) Rs. 39,875/- Total Rs. 2,97,000/- Production Procedure: Components are first cut as per design and then stitched together as per specifications Raw Materials: Raw materials are to be sourced mainly from the open market and JRMB Agartala Requirements and costs of Raw Materials are shown below: SlNo Details Mtr./Doz/Qty Rate Amount (Rs.) 1. Laminated Jute cloth 500 mtr 52.80/- 26,400/- 2. Cloth/PVC buckle, nylon bit 25mtr 550/- 13,750/- 3. Sewing thread 1000 6.60/- 6,600/- 4. Zip fastener 1000 27.50/- 27,500/- 5. Packing materials. 16,500/- 6. Closely woven jute fabric 200 49.50/- 9,900/- 7. Belerow 200 55/- 11,000/- 8. Card/ Paste board 3,300/- 9. Rubber coated Jute fabrics 22,000/- Chain, Rivets, still frame,
handle, wax, salutation flour, dyes, labels, lock, Roap
10. Jute Cotton cloth 500mtr 80/- 44,000/- 11. Eyelete, Runner 5,500/- Total 1,86,450/- Add:Vat 12.5% Rs. 23,306/-

36
Add; Freights Rs. 10,243/- Total Rs. 2,19,999/- Power: Consumption of power is estimated at 4756 KWHrs. costing Rs.19,500/- per annum. Water: Requirement of water mainly for washing and cleaning of Raw Jute, Silk Screen print developing etc and drinking purpose. The unit shall avail of the PHE water supply already available at the site and it can also install its own tube well supply for the purpose. Manpower:The unit will employ 7 persons and all man power to be arranged from local area. 1. Manager cum Supervisor Self Self 2. Skilled Engineer 3nos Rs.16,500/- 3. Office Boy 1 no Rs. 2,200/- 4. Sales Man 1no Rs. 3,300/- 5. Designer 1 no Rs. 5,500/- Total Rs.27,500/- Capital Cost Estimate: Land and Building; 60 Sq. Mtrs of covered area On Rent Plant & Machinery Sl.No. Descriptions Rate (Rs.) Qty Total 1. Lock stitch sewing machine 13,200/- 5 66,000/- (Foot operated) 2. Tape, Scissors, Needles etc 2,400/- 5 sets 12,000/- 3. Weigning scale 1,680/- 5 sets 8,400/- 4. Electric Heater 1,200/- 5 nos 6,000/- 5. Screen Printing Machine (Equipments) 69,600/- 1,62,000/- Add Vat 12.5% 20,250/- Add Freights 4,950/- Total 1,87,200/- Miscellaneous Fixed Assets : 1. Different types of racks & furniture (Iron make) Rs.22,000/- 2. Show case one no Rs.27,500/- 3. Chair, Working Table and Signboard Rs.11,000/- 4. Fan& Lightings Rs.11,000/- Rs. 71,500/- Add Vat 12.5% Rs. 8,938/-
Installation Charges Rs. 2,062/- Total: Rs.82,500/- Preliminary & Preoperative Exp.: Rs. 4,950/-
Fixed Capital : Rs.2,59,050/- Working Capital (P.m) 1. Salary & Wages Rs. 27,500/- 2. Administrative expenses Rs. 13,666/- 3. Selling expenses Rs. 3,300/- 4. Raw Materials Rs.2,20,000/- 5. Utilities Rs. 3,850/- Total Rs.2,68,316/- Total Cost of the Project: Rs.5,42,966/-

37
Means of Finance: Urban Rural a. Composite loan under PMEGP 70% Rs.3,80,076/- 60% Rs.3,25,780/- b. Subsidy 25% Rs.1,35,742/- 35% Rs.1,90,038/- c. Margin Money 5% Rs. 27,148/- 5% Rs. 27,148/-
Total Rs.5,42,966/- Rs.5,42,966/- d. Debt Equity Ratio 2.33:1 1.50:1 Profitability: (Rs. In Thousands)
Sl.No Description 1st Year 2nd Year 3rd year 4th Year 5th Year
1. Capacity utilized as percent of installed capacity
60 70 80 80 80
2. Annual Sales 2,138 2,495 2,851 2,851 2,851
3. Annual Costs
(a) Raw Materials 1,58 1,848 2,112 2,112 2,112
(b) Utilities 27 32 37 37 37
(c) Selling expenses 24 28 31 31 31
4 Variable Cost 1,635 1,908 2,180 2,180 2,180
(a) Wages & Salaries 198 231 264 264 264
(b) Administrative expenses 98 115 131 131 131
(c) Depreciation 27 27 27 27 27
(d) Interest on Composite Loan 44 36 26 16 5
5 Fixed & Semi Variable Cost 367 409 448 438 427
6. Total Cost 2002 2317 2628 2618 2607
7. Annual profit 136 178 223 233 244
8 Return on investment in % 25.04 32.78 41.06 42.90 44.93
9. Return on sales in % 6.36 7.13 7.82 8.17 8.55
10. Annual Contribution 503
11 Break Even Point as percent of installed capacity
43.77
12 Cash accrual 163 205 250 260 271
13. Debt servicing capacity 207 241 276 276 276
14 Repayment of Composite Loan 62 72 82 82 82
15. Debt serviced 106 108 108 98 87
16 Pay Back Period 1 years 6 month 10 days
17. Debt Service Coverage Ratio (DSCR)
1.53:1
Cash Flow Statement: (Rs. In Thousands)
Sl. No.
Description Pre-operative Period
O p e r a t i n g Y e a r s
60% 70% 80% 80% 80%
First Second Third Fourth Fifth
1. Increase in Promoter’s capital
27 NIL NIL NIL NIL
NIL
2. Increase in composite loan 380 NIL NIL NIL NIL NIL
3 Increase in Subsidy 136 NIL NIL NIL NIL NIL
4. Depreciation 27 27 27 27 27

38
5. Profit before interests 180 214 249 249 249
A. TOTAL SOURCES 543 207 241 276 276 276
6. Increase in capital investment
275 NIL NIL NIL NIL NIL
7. Increase in working capital 268 NIL NIL NIL NIL NIL
8. Interests NIL 44 36 26 16 5
9. Repayment of loan NIL 62 72 82 82 82
B. TOTAL DISPOSALS 543 106 108 108 98 87
C. OPENING BALANCE NIL NIL 101 234 402 580
D. NET SURPLUS NIL 101 133 168 178 189
E. CLOSING BALANCE NIL 101 234 402 580 769
Projected Balance sheet:
Sl.No. Description Amount in Rs. Thousands as at the end of the
1st Yr. 2nd Yr. 3rd Yr. 4th Yr. 5th Yr.
1. Capital Account of the Promoter 27 163 341 564 797
2. Surplus from operations 136 178 223 233 244
NET WORTH: 163 341 564 797 1041
3. Composite loan 318 246 164 82 nil
4. Subsidy 136 136 136 136 136
A. TOTAL LIABILITIES 617 723 864 1015 1177
1. Gross Block 275 275 275 275 275
Less Depreciation 27 54 81 108 135
2 NET BLOCK 248 221 194 167 140
3 Current Assets 268 268 268 268 268
4. Cash & Bank Balance 101 234 402 580 769
B. TOTAL ASSETS 617 723 864 1015 1177
Supplies of Machinery & Equipments : 1. M/s Giribala Udyog, Agartala, Tripura, Supplies of Raw Materials : 2. Simantani, Agartala JRMB, Near Apanjan Club, Agartala 3. Bhagabati Udyog, 44, Burtolla Street, Kolkata-700 007, West Bengal, India Phone : +(91)-(33)-22731046/22692855, Mobile : +(91)-9830616860

39
SURGICAL BANDAGES Introduction: A surgical dressing is a continuous strip or piece of woven material used to bandage wounds and burns. The length, width and shape of the bandage varies according to requirements. The main characteristics of a good bandage are capability to absorb discharges from a wound, comfortable to the wound, permit loss of moisture, etc. Market: Surgical bandage industry has grown with the growth of medical/ veterinary facilities. It is one of the basic requirements of medical/ veterinary institutions. It is also a basic input of sanitary pad and filter industry. With more than of 638 states- run medical institutions Tripura has large demand for surgical bandage. It has six hospitals out of which two are attached to medical colleges. 82 PHC/ RH, 539 Dispensaries and six satellite dispensaries/ health sub centres also functions in the state. Besides 42 Ayurvedic and 76 Homeopathic medical institutions function in the state. All the institutions consume surgical bandage. Manufacturing Process: Good quality bleached cotton gauge cloth made from 4 S to 24 S coarse cotton yarn is used for the manufacture of surgical bandages. The cloth is manually wound on rolls in lengths of about 3 to 10 metres each. The cloth in rolled form is then removed from the rolls and compressed. The compressed rolls are then cut into rolls of varying widths (45 mm to 150 mm) depending upon the requirements and sterilized with high pressure steam. The rolls are then dried and packed individually by wrapping with paper. Process Flow:
Suggested Capacity: The minimum economic capacity of a unit manufacturing surgical bandages is 1 million pcs. Per annum based on a 30 days working schedule in a year. Raw Material: The unit will require 2 lakh meters of bleached gauge cloth per annum for the manufacture of 1 million pcs of surgical bandages (basis 150 mm wide x 3 meters long bandages) per annum at 100 % capacity utilization. These can be obtained locally. Utility: The unit may require a total amount of electricity and water annually Rs. 18,000/-. Its annual requirement of water is estimated at about 1,000 kl. Manpower: Three skilled person and one sales man will need for the unit, all of whom are locally available. The annual cost of manpower is estimated Rs. 1,92,000/-.
Sl.No. Type of Manpower No. of Persons Annual Costs
1. Manager 1 Self
2. Skilled worker 3 1,44,000/-
3. Sales man 1 48,000/-
Total: 5 1,92,000/-
Gauge cloth Winding Compressing Roll cutting
Sterilization Drying Packing

40
Financial Aspect of the Unit A. Fixed Capital 1. Land & Building 500 sq.ft. Rented 2. Plant & Machinery i) Cloth winding machine ii) Rolling & bandages making machine iii) Bandage compressing machine iv) Bandage rolls cutting machine v) Baby boiler vi) Sterilizer vii) Centrifugal dehydrating unit Total: 4,80,000/- 3. Preliminary & pre-operative expenditure Rs. 27,500/- 4. Furniture & fixture Rs. 27,500/- 5. Electrification & water installation Rs. 13,200/- 6. Misc. fixed asset Rs. 11,000/- Total Fixed Cost Rs. 5,59,200/- B. Working Capital 1) Raw Material Rs. 4,40,000/- 2) Salary & Wages Rs. 17,600/- 3) Utilities Rs. 1,650/- 4) Misc. expenditure Rs. 22,000/- Total Working Capital: Rs. 4,81,250/- Total Project Cost: Rs.10,40,450/- Means of Finance Urban Rural 1. Composite Loan 7,28,315/- 6,24,270/- 2. Promoter’s contribution 52,022/- 52,022/- 3. Subsidy 2,60,113/- 3,64,158/- 4. Debt equity ratio 2.33:1 1.5:1 Profitability: (Rs. In Thousands)
Sl. No. Description 1st year 2nd year 3rd year 4th year 5th year 1. Capacity utilized as percent of
installed capacity 60 70 80 80 80
2. Annual Sales Realization 3795 4428 5060 5060 5060
3. Annual Costs
a) Raw Materials 3168 3696 4224 4224 4224
b) Utilities 12 13 15 15 15
c) Selling expenses 16 18 21 21 21
Variable Cost 3196 3777 4260 4260 4260
d) Wages & Salaries 126 147 169 169 169
e) Administrative expenses 142 166 190 190 190
f) Depreciation 55 55 55 55 55
g) Interest on Composite Loan 84 68 47 27 7
Fixed & Semi Variable Cost 407 436 461 441 421
4. Total Cost 3603 4163 4721 4701 4681
5. Annual Profit 192 265 339 359 379

41
6. Return on Investment 18.46% 25.48% 32.59% 34.51% 36.44%
7. Return on sales 5.05% 5.98% 6.69% 7.09% 7.49%
8. Annual contribution 599 701 800 800 800
9. Break Even Point as percent of capacity
40.76%
10. Cash accrual 247 320 394 414 434
11. Debt Servicing Capacity 331 388 441 441 441
12. Repayment of Composite Loan 118 138 157 157 157
13. Debt Serviced 202 206 204 184 164
14. Pay Back Period 1 year 7 months 20 days
15. Debt Service Coverage Ratio 1.64:1
Cash Flow Statement: (Rs. In Thousands)
Sl. No.
Description Pre-operative Period
O p e r a t i n g Y e a r s
First Second Third Fourth Fifth
1. Increase in Promoter’s contribution
52 - - - - -
2. Increase in Term loan 728 481 - - - -
3. Subsidy 260 - - - - -
4. Depreciation - 55 55 55 55 55
5. Profit before interests - 276 333 386 386 386
A. TOTAL SOURCES 1040 812 388 441 441 441
6. Increase in capital investment 1040 - - - - -
7. Increase in working capital - 481 - - - -
8. Interest - 84 69 47 27 7
9. Repayment of Term Loan - 118 138 159 157 157
B. TOTAL DISPOSALS 1040 683 206 204 184 164
C. OPENING BALANCE NIL NIL 129 311 548 805
D. NET SURPLUS NIL 129 182 237 257 277
E. CLOSING BALANCE NIL 129 311 549 805 1082
Projected Balance sheet:
Sl.No. Description Amount in Rs. Thousands as at the end of the
1st Yr. 2nd Yr. 3rd Yr. 4th Yr. 5th Yr. 1. Capital Account of Promoter 52 244 509 848 1207
2. Surplus from operation 192 265 339 359 379
NET WORTH: 244 509 848 1207 1586
3. Subsidy 260 260 260 260 260
4. Term loan outstanding 610 472 315 158 - TOTAL LIABILITIES 1114 1241 1423 1625 1847
1. Gross Block 559 559 559 559 559
Less Depreciation 55 110 165 220 275
NET BLOCK 504 449 324 339 284
2. Working capital 481 481 481 481 481 3. Cash & Bank Balance 129 311 548 805 1082
TOTAL ASSETS 1114 1241 1423 1625 1847
Suppliers of Machinery 1) Goldman Automatics Pvt. Ltd. 1, Vardhaman Industrial Estate, Village Road, Mumbai-400078 2) A.D. International, No.- 12, Surekha Building, 2423/29, Shardha Nand Marg, Delhi – 710006.

42
MOSQUITO NET INTRODUCTION: Mosquito causes various diseases including Malaria and Dengue. Therefore, prevention of these diseases is of utmost importance. Mosquito net is a proven device for preventing mosquito bites. Having realized the importance of Mosquito nets in prevention of Malaria the Government is supplying Mosquito nets among the poorer section of the population. This has created an opportunity of utilizing the local skills in tailoring with the excellent market for Mosquito nets. MARKET: The main product of the proposed unit is Mosquito Net of double-bed size. However in compliance
with demand the unit may also produce nets of single as well as extra large sizes. The primary market of the product is the Tripura State itself. The unit also plant to sell the products in Assam as well. Bulk supply of mosquito nets to the State Health Department may boost the marketing of the product. The market is fast expanding as a result of creation of awareness to prevent Malaria, Filaria, Dengue, etc diseases and distribution of Mosquito Nets by both State and Central Governments.
PRODUCTION CAPACITY: The annual installed capacity is estimated on the basis of the following assumption:
Working hours/shift - 8 No. of shift/day - 1 Working days - 300 days/ year Capacity utilization -1st year 2nd year 3rd year & onwards 60% 70% 80% Installed Capacity - 20,000 mosquito nets per year
MANUFACTURING PROCESS: In conformity with the size, colour and design of the mosquito net to be manufactured, the raw materials like net, markin cloths, lace, etc. are cut in measured sizes. Then the parts of the cut raw materials are stitched together carefully to yield the final product. Process Flow: RAW MATERIALS: The main raw materials required for the proposed unit include net, mar kin cloths, lace, yarn
etc. Such raw materials are readily available at Agartala. However for more varieties of quality and design of products the unit envisages import of nets from Bangladesh against the license already possessed by the proprietor.
Raw Materials required by the Unit a) Net 1,65,000/- b) Markin cloth 40,500/- c) Lace 13,500/- d) Reels of yarn 1,800/- 2,20,800/- MANPOWER: the Unit shall need the following manpower all of whome are locally available: Sl.No. Particulars Amount a) Cutting Master & Tailor 10 person @2500 p.m. Rs. 25,000/- b) Sales man 2 person @ Rs. 3,000/- Rs. 6,000/- 12 Persons Rs. 31,000/-
Selection of
raw materials
Cutting according
to size
Stitching Ready for sale

43
PROJECT COST: 1. Land & Building admeasuring 1,250 Sq. Ft. Rented 2. Plant & Machinery : Rs. 48,000/- 10 nos. feet operated Sewing Machine with Standard tools @ Rs. 3,800/- per machine and
Rs. 200/- per tool set inclusive of scales, Scissors etc. for each unit.
3. Miscellaneous Fixed Assets: i. Wooden tools, cutting tables, office furniture, Rs. 30,800/- Working & storage etc. (LS) ii. Electrification for lighting and air circulation Rs. 5,500/- iii. Water installation for drinking and ablution Rs. 2,200/- Sub Total:Rs. 38,500/- 4. Preliminary & Preoperative Expenses Rs. 6,600/- 5. Provision for contingencies Rs. 4,400/-
Total Fixed Cost: Rs. 97,500/- 6. Working Capital a) Raw Material Rs. 2,42,880/- b) Repair & Maintenance: Rs. 550/- c) Salary & Wages Rs. 34,100/- d) Utilities Rs. 550/- e) Administrative expenditure Rs. 13,750/- f) Selling expenses Rs. 1,870/- Total working capital: Rs. 2,93,700/- Total Project Cost: Rs. 3,91,200/- Means of Finance Urban Rural 1. Composite loan 2,73,840 /- 2,34,720 /- 2. Promoters Capital 19,560/- 19,560/- 3. Subsidy 97,800/- 1,36,920/- 4. Debt Equity ratio 2.33:1 1.5:1 Profitability: (Rs. In Thousands)
Sl.No. Description 1st year 2nd year 3rd year 4th year 5th year 1. Capacity utilized as percent of
installed capacity 60 70 80 80 80
2. Annual Sales Realization 2310 2695 3080 3080 3080
3. Annual Costs
a) Raw Materials 1749 2040 2332 2332 2332
b) Utilities 4 5 5 5 5
c) Selling expenses 13 16 18 18 18
Variable Cost 1766 2061 2355 2355 2355
d) Wages & Salaries 245 286 327 327 327
e) Administrative expenses 99 115 132 132 132
f) Depreciation 9 9 9 9 9
g) Interest on Composite Loan 33 26 18 10 3
Fixed & Semi Variable Cost 386 436 486 478 471
4. Total Cost 2152 2497 2841 2833 2826
5. Annual Profit 158 198 239 247 254
6. Return on Investment 40.40% 50.63% 61.12% 63.62% 64.96%

44
7. Return on sales 6.83% 7.35% 7.76% 8.01% 8.25%
8. Annual contribution 544 634 725 725 725
9. Break Even Point as percent of capacity
42.57%
10. Cash accrual 167 207 248 256 263
11. Debt Servicing Capacity 200 233 266 266 266
12. Repayment of Composite Loan
44 52 59 59 59
13. Debt Serviced 77 78 77 69 62
14. Pay Back Period 2 year 7 month 2 days
15. Debt Service Coverage Ratio 2.59:1
Cash Flow Statement: (Rs. In Thousands)
Sl. No.
Description Pre-operative Period
O p e r a t i n g Y e a r s
First Second Third Fourth Fifth
1. Increase in Promoter’s contribution
20 - - - - -
2. Increase in Term loan 274 - - - - -
3. Subsidy 97 - - - - -
4. Depreciation - 9 9 9 9 9
5. Profit before interests - 191 224 257 257 257
A. TOTAL SOURCES 391 200 233 266 266 266
5. Increase in capital investment 98 - - - - -
6. Increase in working capital 293 - - - - -
7. Interest - 33 26 18 10 3
8. Repayment of Term Loan - 44 52 59 59 59
B. TOTAL DISPOSALS 391 77 78 77 69 62
C. OPENING BALANCE NIL NIL 123 278 467 664
D. NET SURPLUS NIL 123 18 189 197 204
E. CLOSING BALANCE NIL 123 278 467 664 868
Projected Balance sheet:
Sl.No. Description Amount in Rs. Thousands as at the end of the
1st Yr. 2nd Yr. 3rd Yr. 4th Yr. 5th Yr.
1. Capital Account of Promoter 20 178 376 615 862
2. Surplus from operation 158 198 239 247 254
NET WORTH: 178 376 615 862 1116
3. Subsidy 97 97 97 97 97
4. Term loan outstanding 229 177 118 59 -
TOTAL LIABILITIES 504 650 830 1018 1213
1. Gross Block 98 98 98 98 98
Less Depreciation 9 18 27 36 45
NET BLOCK 88 79 70 61 52
2. Working capital 293 293 293 293 293
3. Cash & Bank Balance 123 278 467 664 868
TOTAL ASSETS 504 650 830 1018 1213
Suppliers of Machinery:
1. M/s S.R.Brothers, Motor-Stand Road, AGARTALA- 799 001. 2. Giribala Udyog, HGB Road, AGARTALA- 799 001.

45
DIVERSIFIED JUTE HANDICRAFTS
Introduction: Handicrafts yield very good prices in markets away from the location of production and hence these are better exportable products. Even within India Urban areas are proven to be better markets for Handicrafts. Dyed Jute Yarn and fabrics with Bamboo and other materials are used for manufacturing Handicrafts items. With excellent local skills in Bamboo Handicrafts and Boutique designs the State shows tremendous potential in Handicrafts manufacturing, especially by using Jute and Bamboo. As Bamboo Handicrafts produced in Tripura needs widening of product range, diversified Jute Handicrafts may cash on the handicrafts market already developed. Market: Jute Handicrafts have excellent domestic and export markets. Normally sales in metropolitan cities and other larger cities yield better sales realization for Handicrafts. Trip[ura with its reputation for quality artistic handicrafts have better marketing scope for Handicrafts. Installed Capacity: Assuming operations for Single Shift per day for 300 working days per annum the annual installed capacity of 15,000 pieces of Jute Handicrafts is estimated. These may yield an annual sales realization of Rs.7,50,00/-. Manufacturing Process: Braid making, weaving, making of Bamboo sticks, weaving of Mats on frame, Yarn and product Dyeing, Assembling, finishing and packing are the operations involved to manufacture Handicrafts. Process Flow Chart Raw Material processing Sizing Weaving Assembling Packing Testing Finishing Gluing Raw Materials: All the raw- materials required by the Unit are locally available. Jute Yarn, Raw Jute and Fabrics with accessories are available at the Jute Raw- Materials Depot operated by M/s Simantini, Near Aponjon Club, Bhattapukur, Agartala at subsidized rates. The monthly requirement and costs of raw- materials are shown below: 1. Raw Jute and Jute Yarn Rs. 15,000/- 2. Jute Fabrics Rs. 1,000/- 3. Cane and Bamboo Rs. 5,000/- 4. Cotton Thread Rs. 1,000/- 5. Dyes Rs. 3,000/- 6. Chemicals Rs. 2,000/- 7. Beads Rs. 1, 500/- 8. Fevicol Rs. 500/- 9. Needles, Glass bands, Hook, etc accessories Rs. 500/- 10. Miscellaneous others Rs. 1,500/- Total: Rs. 31,000/- Power: As the process does not need any power a domestic connection of 1 KW Load may suffice. The annual consumption of power is estimated at 2857KWHrs costing Rs. 6,000/- at the installed capacity.
Sale
s

46
Water: The Unit will need 1000 Liters of water per day, cost of which is shown in power cost. Manpower: Manpower required by the Unit are locally available. The requirement and annual cost of manpower is shown below:
Sl. No.
Description of Manpower No of Person Annual Cost
1 Skilled Worker 1 Rs. 52,800/-
2 Weaver (Part Time) 1 Rs. 26,400/-
3 Tailor (Part Time) 1 Rs. 26,400/-
4. Wages for Katha Stitch, Bandhani, etc 1 Rs. 6,600/-
Total: 4 Rs. 1,12,200/-
CAPITAL COST ESTIMATE: 1. Land & Building: Covered area 56 Sq. Mtrs. On rent 2. Machinery & Equipments: a) Two No.s of Stitching Machine Rs. 22,800/- b) Two No.s of Small sized Frame Looms Rs. 12,000/- c) One Colour mixing Pot Rs. 6,000/- d) One Combined Wood Working Machine Rs 66,000/- e) Miscellaneous Hand Tools Rs. 12,000/- Total: Rs. 1,18,800/- 1. Miscellaneous Fixed Assets:
a) Electrification Rs. 11,000/- b) Water Installation Rs. 5,500/- c) Miscellaneous others Rs. 4,950/- Total: Rs. 21,450/-
4. Provision for Contingency Rs. 6,600/- 5. Preliminary & Preoperative Expenses Rs. 6,050/- Total Fixed Costs: Rs. 1,52,900/- 4. Working Capital (For Three Months):
a) Raw Materials Rs. 1,02,300/- b) Utilities Rs. 1,650/- c) Wages and Salaries Rs. 28,050/- d) Miscellaneous other expenses Rs. 5,500/- Total Working Capital: Rs. 1,37,500/- TOTAL PROJECT COST:Rs. 2,90,400/-
Means of Finance: Urban Rural 1. Composite Loan Under PMEGP Rs. 2,03,280/- Rs. 1,88,760/- 2. Subsidy Rs. 72,600/- Rs. 1,01,640/- 3. Promoter’s Contribution Rs. 14,520/- Rs. 14,520/- 4. Debt: Equity Ratio 2.33: 1 1.50: 1

47
Profitability: (Rs. In Thousands)
Sl.No. Description 1st Year 2nd Year 3rd year 4th Year 5th Year
1. Capacity utilized in percent 60% 70% 80% 80% 80%
2. Annual Sales Rs. 495 577 660 660 660
3. Annual Costs in Rs.
(a) Raw Materials 216 286 327 327 327
(b) Utilities 4 5 6 6 6
(c) Wages & Salaries 67 79 90 90 90
(d) Administrative expenses 32 37 42 42 42
(e) Selling expenses 34 40 46 46 46
(f) Depreciation 15 15 15 15 15
(g) Interest on Composite Loan 22 17 13 8 3
Total Cost 420 479 339 534 529
Variable Cost 284 331 379 379 379
4 Annual profit 75 98 121 126 131
5 Return on investment 25.84% 33.79% 41.72% 43.44% 45.17%
6 Return on sales 15.15% 16.98% 18.33% 19.09% 19.84%
7 Annual Contribution 211
8 Break Even Point in percent 38.67%
9 Cash accrual 90 113 136 141 146
10. Debt servicing capacity 112 130 149 149 149
11 Repayment of Loan 33 38 44 44 44
12 Debt serviced 55 55 57 52 47
13 Pay Back Period Two Years Two Months One Day
14 Debt Service Coverage Ratio (DSCR)
2. 71 : 1
Cash Flow Statement: (Rs. In Thousands)
Sl. No.
Description Pre-ope-rative Period
O p e r a t i n g Y e a r s
First Second Third Fourth Fifth
1. Increase in Promoter’s capital 14 - - - - -
2. Increase in composite loan 203 - - - - -
3 Increase in Subsidy 73 - - - - -
4. Depreciation - 15 15 15 15 15
5. Profit before interests - 97 115 134 134 134
A. TOTAL SOURCES 290 112 130 149 149 149
6. Increase in capital investment 153 - - - - -
7. Increase in working capital 137 - - - - -
8. Interests - 22 17 13 8 3
9. Repayment of loan - 23 38 44 44 44
B. TOTAL DISPOSALS 290 55 55 57 52 47
C. OPENING BALANCE - - 57 132 224 321
D. NET SURPLUS - 57 75 92 97 102
E. CLOSING BALANCE - 57 132 224 321 423

48
Projected Balance sheet:
Sl. No.
Description Amount in Rs. Thousands as at the end of the
1st Yr. 2nd Yr. 3rd Yr. 4th Yr. 5th Yr.
1. Capital Account of the Promoter
14 89 187 308 434
2. Surplus from operations 75 98 121 126 131
NET WORTH: 89 187 308 434 565
3. Composite loan 170 132 88 44 ---
4. Subsidy 73 73 73 73 73
A. TOTAL LIABILITIES 332 392 469 551 638
1. Gross Block 153 153 153 153 153
Less Depreciation 15 30 45 60 75
2 NET BLOCK 138 123 108 93 78
3 Current Assets 137 137 137 137 137
4. Cash & Bank Balance 57 132 224 321 423
B. TOTAL ASSETS 332 392 469 551 638
Suppliers of Plant & Machinery:
1. Giribala Udyog, Agartala 2. NSIC Ltd., Kunjaban, Agartala 3. Weavers Providers, Ranibari, Panbazar, Guwahati- 781 001

49
MISCELLANEOUS
INDUSTRIES

50
PAPER DISH, PLATES, CUP ETC INTRODUCTION: Paper crockery such as paper plates, dish, cups, saucers etc is finding extensive usages these days for serving eatables in parties, functions and social gathering. Paper cups also are widely used as containers for ice-cream. These are also used as curd cups and coffee cups. In India paper cups, dish, plates and saucers are the mostly commonly used disposable crockery. Market; Besides general market requirements, paper crockery is required in large quantities by the caterers of railways and other establishments. Because of their disposables nature and comparatively much lower prices, these are quite often preferred over porcelain, glass or metal containers for certain specific requirements. The demand for paper plates, dish and cups and saucers is likely to grow substantially in future both in urban as well as rural areas. Installed Capacity: Assuming operations for Single Shift per day for 300 working days per annum the following annual installed capacity and turnover is estimated: Sl.No Descriptions Rate Amount (Rs.) 1. Plate / Dish Best quality 40,000 nos. 2.20 88,000/- 2. Plate /Dish Normal quality 30,000 nos 1.60 43,500/- 3. Cup Normal 35,000 nos 0.05 33,250/- 4. Ice cream Cup 25,000 nos 1.10 27,500/- Total: 1,99,925 /- Manufacturing Process for Paper Cup: Paper is first printed on the printing press. The printed part is cut to size and given the desired shape by die cutting. The bottom part and the upper part of the cup are then assembled to cup chape in screw press. For wax coating machine. For paper plates (saucers) the paper is printed and cut to circles. The cut circles are passed in screw press for obtaining the desired shape. Process Flow Chart Paper/Cloth Roll Gluing Sand application Pre-drying Testing & Cutting Roll Forming Drying Gluing Inspection Packing Marketing
Manufacturing Process for Paper Dish/Plate:
Feed the pre printing and pre cutting cup-fan-wall paper to the entrance,
Feed the rolling cup-bottom paper to the entrance,
The cup-fan-wall paper auto sealing on the body sealing mold >>>become cone shape, the cup-bottom auto punching(cutting) in the machine

51
After pre-heating, bottom heating, then the cup-bottom knurling to the cup cone body,
Curling process: curling the cup top to circular shape,
Pattern rolling, in here, you can add another system to send the finished paper cups to the working desk.
Package the finished paper cups in plastic bag or other hermetic Pc bags to protect the cup top shape becoming ugly or breached.
Package the plastic bags in a cardboard box............
The general structure of paper cup (bowl) shaping machine is composed of five parts. They are the first stage, the middle stage, the second stage, the third stage and its outer shell.
The first stage: mainly finishes transmission of the paper cup's sidewall paper, shaping sidewall and transferring them to the middle stage after shaped.
The medium stage: mainly finishes transmission of the cup-bottom paper, shaping cup-bottom, joining the shaped sidewall and cup-bottom, automatic transmission and discharging of the shaped cup, and curling the shaped cup's edge.
The third stage: mainly includes 45 angle separating, preheating, curing bottom, rouletting, curling rim and so on mechanisms, which are the important parts in finishing paper cup machines
The fourth stage: mainly includes motor, reduction gear and so on. A frequency converter used to finish adjusting machine production speed and providing power.
Flow Chart:
Raw Materials; The row materials required for the unit are mainly Paper, paraffin wax, ink, gum and packaging materials required per month is as below and the materials available from Sony Industries, 196-A-6, 52 House Colony, S.N. Puram Road, Thiruthangal-626130, SIVAKASI. Tamil Nadu, India. Sl.No Descriptions Qty/ Kg /Ton Amount 1. Paper ;Grey Board, Mill Board, 66,000/- 66,000/- 2. Card Board Single PE Cup paper Single colour printing ton 3,850/- 3,850/-
Printed
PE-
Coated
Paper
Cutting
Body
Bottom
Forming
in
Machine
Checking
of Quality
Packing SALES

52
2. Paraffin wax on L.S 11,000/- 11,000/- 3. Ink, Gum etc on L.S 5,500/- 5,500/- 4. Packing cost on L.S 5,500/- 5,500/- 91,850/-
Add Tax 12.5%: 11,481/- Add Transportation: 2,200/-
TOTAL: 1,05,531/- Power: Electricity power requirement for the unit is only for administration and production and generator is only use for office. Monthly 1340 KWHrs of power shall be consumed which may cost Rs.5,500/- and Electricity power is available from Tripura Sate Electric Crop. Ltd. Water; Water required by the unit is mainly for production and office. The amount required for this purpose Rs.1,100/- per month. Manpower: The requirement and cost of manpower to be recruited locally are shown below: Sl.No Descriptions No Amount(Rs.) 1. Manager / Accountant cum Supervisor Self Self 2. Skilled Worker 2 6,600/- 3. Semi skilled worker 1 2,200/- 4. Sales Representative 1 3,850/- 5. Helper 1 1,650/- 5 Total 14,300/- CAPITAL COST ESTIMATE: A. LAND & BUILDING with a built up area1000sq. mtrs. On rent B. PLANT AND MACHINERY ; SL. NO DESCRIPTIONS QTY AMOUNT 1. LBZ-LA Single Side PE Coated 01 5,61,000/-
paper Cup machine. 2 HZ-D paper Plate Machine 01 4,50,000/- 3. Gen Set 01 1,00,410/- Total: 11,11,410/- Miscellaneous Fixed Assets 1 Electrification 44,000/- 2. Water installation 16,500/- 3. Furniture & Fixtures including a Computer set 69,300/- Total: 1,29,800/-
Total Fixed Assets: 12,41,210/- Working Capital (P.m) 1. Raw Materials 1,05,600/- 2. Salary & Wages 14,300/- 3. Miscellaneous exp 16,500/- 5. Utilities & water 6,600/- Total : 1,43,000/-
Total Project Cost: 13,84,210/-

53
Means of Finance : Urban Rural 1. Composite Loan under PMEGP 70% 9,68,948/- 60% 8,30,526/- 2. Subsidy 25% 3,46,052/- 35% 4,84,474/- 3. Margin Money 5% 69,210/- 5% 69,210/ 4. Debt Equity Ratio : 2.33:1 1.50:1 Profitability: (Rs. In Thousands) Sl.No. Description 1st Year 2nd Year 3rd year 4th Year 5th Year
1. Capacity utilized as percent of installed capacity
60% 70% 80% 80% 80%
2. Annual Sales Rs. 1439 1679 1919 1919 1919
3. Annual Costs in Rs.
(a) Raw Materials 760 886 1013 1013 1013
(b) Utilities 48 55 63 63 63
(c) Wages & Salaries 103 120 137 137 137
(d) Administrative expenses 94 98 103 108 114
(e) Selling expenses 72 84 96 96 96
(f) Depreciation 124 124 124 124 124
(g) Interest on Composite Loan 109 88 65 39 13
4. Total Cost 1310 1455 1601 1580 1560
Variable Cost 880 1025 1172 1172 1172
5. Annual profit 129 224 318 339 359
8 Return on investment 9.32 16.18 22.97 24.49 25.93
9. Return on sales 8.96 13.34 16.57 17.66 18.70
10. Annual Contribution 559 - - - -
11 Break Even Point as percent of capacity
46.15% - - - -
12 Cash accrual 253 348 442 463 483
13. Debt servicing capacity 362 436 507 502 496
14 Repayment of Composite Loan 157 183 209 209 209
15. Debt serviced 266 271 274 248 222
16 Pay Back Period 2 Years 7 Months 24 days
17. Debt Service Coverage Ratio (DSCR)
1.36 : 1
Cash Flow Statement: (Rs. In Thousands) Sl. No.
Description Pre-operative Period
O p e r a t i n g Y e a r s
60% 70% 80% 80% 80%
First Second Third Fourth Fifth
1. Increase in Promoter’s capital 69 - - - - -
2. Increase in composite loan 969 - - - - -
3 Increase in Subsidy 346 - - - - -
4. Depreciation - 124 124 124 124 124
5. Profit before interests - 238 312 383 378 370
A. TOTAL SOURCES 1384 362 436 507 502 494

54
6. Increase in capital investment 1241 - - - - -
7. Increase in working capital 143 - - - - -
8. Interests - 109 88 65 39 13
9. Repayment of loan - 157 183 209 209 209
B. TOTAL DISPOSALS 1384 266 271 274 248 222
C. OPENING BALANCE - - 96 261 454 148
D. NET SURPLUS - 96 165 233 254 272
E. CLOSING BALANCE - 96 261 494 748 1020
Projected Balance sheet: Sl. No.
Description Amount in Rs. Thousands as at the end of the
1st Yr. 2nd Yr. 3rd Yr. 4th Yr. 5th Yr.
1. Capital Account of the Promoter
69 198 422 740 1079
2. Surplus from operations 123 224 318 339 359
NET WORTH: 198 422 740 1079 1438
3. Composite loan 812 629 420 211 nil
4. Subsidy 346 346 346 346 346
A. TOTAL LIABILITIES 1356 1397 1506 1636 1784 1. Gross Block (F C) 1241 1241 1241 1241 1241
Less Depreciation 124 248 372 496 620
2 NET BLOCK 1117 993 869 745 621
3 Current Assets 143 143 143 143 143
4. Cash & Bank Balance 96 261 494 748 1020
B. TOTAL ASSETS 1356 1397 1506 1636 1784
Suppliers of Machinery & Equipments : 1. Sony Industries,
196-A-6, 52 House Colony, S.N Puram Road, Thruthangal-626130, Sivakasi, Tamilnadu, 04562-232695

55
OFFSET PRINTING PRESS
Introduction: The introduction of the offset process has revolutionized the printing industry and nowadays all modern printing process are of the offset type. The offset printing process has a number of advantages, being the most speedy and economical for large scale printing requirements besides offering excellent quality of print. Market Prospect: The State of Tripura is maximum area surrounded by Bangladesh, measuring near about 839 Km with Bangladesh. One side attested with Assam and Mizoram area covered 53 KM, 109 KM respectively. The State of Tripura has four districts, such as West, South, Dhalai and North Tripura and now the estimated population of Tripura approximately 35 lacks. The demand for printing press or works are directly related to the development programmes particularly of education, industry, trade and commerce, etc. day to day increasing population give an indication of the increases in demand for paper based allied activities. Thereafter day by day living standard of men trend towards high and due to this reason in marriage party celebration programme, birthday, meeting etc. purpose people are using printing materials. Raw Materials availability: Raw materials are to be sourced mainly from the open market. At present availability and supply of the raw materials is not problem e.g newsprint to be sourced from open markets or government supply while inks, chemicals etc are to be supplied from the markets or directly from outside sources. The unit required raw materials will be Rs.54,48,000/- per annum. OFFSET PRINTING PROCESS: Offset printing process involves the following sub process: A. Composing: With the induction of computers in the typesetting industry (Commonly referred to as D.T.P), the job of the typesetter which involves the lying-out of the text and graphics in a printable format to create Master or C.R.C (Camera Ready Copies) has become highly efficient and cost effective. This function which requires a very high level precision and skill has become highly automated with the proper induction of computers and computer based technology. B.Plate making;The plates are in the common – mans parlance which are used to print multiple copies of the Masters or CRC s. Such masters are first prepared by the DTP section of the press by the use of computers. The plates are prepared by electro-chemical processes using 1. Whirler: to apply photo sensitive chemicals on the plates. 2. Process Camera – to produce the negatives of the original masters. 3. Print Down Frame – to expose the negatives of the plates. Thus the negatives are exposed on to the plates which are then installed on the offset press to create the final impressions on paper. C.Printing: This job involves the transfer of the image on the plates to paper. The paper of stock in printers or Stock in printers parlance is first trimmed to the required size with the use of the paper guillotine and the required fed to the press for final printing. D. Binding & finishing: This part of the printing process is the most labor intensive as it involves the manual folding & collating of the printed paper . Various types of binding methods (wire stitching, thread binding, perfect binding , spiral binding etc) may be used as per the choice of the customers. Finishing involves the final trimming of the bound book to the required dimensions.

56
Flow Chart : TYPESETTING PLATE MAKING Whirler, Process Camera. Print Down Frame
Printing
Binding & Finish Product Raw Materials: The raw materials required for the unit are mainly various types of Paper, Ink, gum and packaging materials required per month is as below: Sl.No Descriptions Qty / Reem Rate Amount 1. Different types of Paper :
Demai sheet single 560 380/- 2,12,800/- Demai sheet double 150 950/- 1,42,500/- Glosy paper 100 20/- per sheet 2,000/- Ivory sheet 100 15/- per sheet 1,500/- Xerox paper A4 size 100 215 /- 21,500/-
2. INK Yellow 05 395 1,975/- Green 05 480 2,400/- Black 10 4,20/- 4,200/- Cyan 10 4,20/- 4,200/- Magenta 10 3,95/- 3,950/- Blue 10 315/- 3,150/- 3. Multicolor ink set 02 4,000/- 8,000/- 4. Laser printer Tonner 45,825/- Total 4,54,000/- Power: Consumption of power and fuel have been arrived at on the basis of consumption norms of the industry. The energy rate has been considered on the basis of existing power tariffs of the electricity department. Electricity power requirement for the unit is only for administration and production and generator is only use for office and also requirement oil, lubricants for machine. The amount required for this purpose Rs.48,600/- on lum sump per month. Water: The unit will need 4000 Liters of water per day the cost of drawing of which is shown with power cost. Manpower: The requirements and costs of manpower, to be recruited locally are shown below:
Sl.No. Category of Manpower No. of Persons Annual Cost
1. Manager 1 72,000/-
2. Administrative & Sales Staff 3 1,26,000/-
3. Skilled Worker 1 60,000/-
4. Unskilled Worker 3 60,000/-
Total: 7 3,18,000/-

57
CAPITAL COST ESTIMATE: A. LAND & BUILDING On Rent. B. PLANT AND MACHINERY ; 1 DTP System Comprising of
Computers 03nos 30,000/- 90,000/- Laser Printer Mono 01no 9,000/- 9,000/- Laser printer Colour all in one 01 35,000/- 35,000/- Scanner 01 4,000/- 4,000/- 2. Prepress equipment: Plate developer & etc 01 40,000/- 40,000/- 3. Colour Off set Press 01 3,00,000/- 3,92,000/- 4. 10 KVA Gen Set Honda Make 01 80,000/- 5. Furniture & Fixtures and office Decoration on LS 1,00,000/- Total 7,50,000/- C.Miscellaneous Fixed Assets 1 Working Table 1 25,000/- 25,000/- 2. Showcase 1 25,000/- 25,000/- 3. Decoration of Machine Room & office 45,000/- 4. Signboard/ Fan /Chair etc 35,000/- 5. Paper Cutting Machine 02 20,000/- 6. Wire stitching machine treadle operated 01 9,000/- 7. Perforating Machine 01 3,000/- 8. Hand Numbering Machine 01 13,000/-
Total 1,75,000/- 1. Provision for contingencies Rs. 50,000/- 2. Preliminary & Preoperative expenses Rs. 50,000/- Total Rs.1,00,000/- Total Fixed Capital Rs.10,25,000/- E. Working Capital (for 3 months) a) Raw Materials Rs. 4,54,000/-. b) Power Rs. 4,050/- c) Salary & Wages Rs. 26,500/- d) Miscellaneous expenses Rs. 10,450/- Total: Rs. 4,95,000/- Total Project Cost: Rs.15,20,000/- Means of Finance: Urban Rural a. Composite loan under PMEGP Rs.10,64,000/- Rs. 9,12,000/- b. Subsidy Rs. 3,80,000/- Rs. 5,32,000/- c. Promoters contribution Rs. 76,000/- Rs. 76,000/- d. Debt Equity Ratio 2.33:1 1.50:1 Profitability: (Rs. in Thousands)
Sl. No.
Description 1st Year 2nd Year 3rd year 4th Year 5th Year
1. Capacity utilized 60% 70% 80% 80% 80%
2. Annual Sales Realization 4,828 5,632 6,437 6,437 6,437

58
3. Annual Costs in Rs.
(a) Raw Materials 3,269 3,814 4,358 4,358 4,358
(b) Power 36 39 41 41 41
(c) Wages & Salaries 294 306 319 327 335
(d) Repair & Maintenance 41 41 41 41 41
(e) Administrative overheads 50 53 55 58 61
(f) Selling expenses 724 845 966 966 966
(g) Depreciation 100 100 100 100 100
(h) Interest 122 99 72 43 14
Total: 4,636 5,297 5,952 5,934 5,916
Total Variable Cost 4,029 4,698 5,365 5,365 5,365
4. Annual profit 192 335 485 503 521
5. Return on investment 12.63% 22.04% 31.91% 33.09% 34.28%
6. Return on sales 3.98% 5.95% 7.53% 7.81% 8.09%
7. Annual Contribution 799 - - - -
8. Break Even Point 45.58% - - - -
9. Cash accrual 292 435 585 603 621
10. Debt servicing capacity 414 534 657 646 635
11. Repayment of Loan 169 205 230 230 230
12. Debt serviced 291 304 302 273 244
13. Pay Back Period 2 years 6 months 23 days
14. Debt Service Coverage Ratio (DSCR)
2.04:1
Cash Flow Statement: (Rs. in Thousands)
Sl. No.
Description Pre-operative Period
O p e r a t i n g Y e a r s
First Second Third Fourth Fifth
1. Increase in Promoter’s capital 76 - - - - -
2. Increase in subsidy 380 - - - - -
3 Increase in loan 1,064 - - - - -
4. Depreciation - 100 100 100 100 100
5. Profit before interests - 314 434 557 546 535
A. TOTAL SOURCES 1,520 414 534 657 646 635
6. Increase in capital investment 1,025 - - - - -
7. Increase in Current Assets 495 - - - - -
8. Interests - 122 99 72 43 14
9. Repayment of loan - 169 205 230 230 230
B. TOTAL DISPOSALS 1,520 291 304 302 273 244
C. OPENING BALANCE - - 123 353 708 1,081
D. NET SURPLUS - 123 230 355 373 391
E. CLOSING BALANCE - 123 353 708 1,081 1,472

59
Projected Balance sheet:
Sl.No. Description Amount in Rs. Thousand as at the end of the
1st Yr. 2nd Yr. 3rd Yr. 4th Yr. 5th Yr.
1. Capital Account of the Promoter
76 268 603 1,088 1,591
2. Surplus from operations 192 335 485 503 521
NET WORTH: 268 603 1,088 1,591 2,112
3. Subsidy 380 380 380 380 380
4. Loan Account 895 690 460 230 -
A. TOTAL LIABILITIES 1,543 1,673 1,928 2,201 2,492
1. Gross Fixed Assets 1,025 1,025 1,025 1,025 1,025
Less Depreciation 100 200 300 400 500
NET BLOCK 925 825 725 625 525
2 Current Assets 495 495 495 495 495
3. Cash & Bank Balance 123 353 708 1,081 1,472
B. TOTAL ASSETS 1,543 1,673 1,928 2,201 2,492
Names and Address of Machinery and Equipments Suppliers:
G. B. Tech (India) 51, Emca Chamber Daryaganj, Opposite Hotel Atithi Palace,, Darya Ganj, New Delhi - 011 2324 3661 & Creed Engineering Pvt Ltd. 4, South Patel Nagar Mk, New Delhi - 011 25847206
60
EXERCISE BOOK, REGISTERS , FILE COVERS ETC Introduction: File covers, file boards and letter pads are the items of common use in the various government offices Government of India undertakings, private sector and other intuitions, These are generally sold in the printed forms. Market Potential; Due to the rapid industrialization taking place in the country, the demand for office stationery is increasing day by day. File covers and file boards assume an important position as a stationery materials. These are used for keeping the day to day correspondence , old office records, important papers etc, in order, These are used in huge quantity by governmental offices/ establishments, various commercial establishments, traders, schools, colleges etc every year. Letter heads can be printed on the printing press utilizing its spare capacity. Production Targets / Suggested Capacity:The economic capacity per annum by working one shift for 300 working days per annum
File cover 8,40,000 nos. Rs. 25,41,000/- File Boards 3,60,000 nos. Rs. 7,92,000/- Jib work (Printing of letters heads) 2,10,000 nos. Rs. 2,31,000/-
Rs. 35,64,000/- Raw Materials; The main raw materials required for manufacture of Exercise Book, Registers, File Cover Manufacturing Unit Require Mill Board/Gray Board/ Card Board/ White Paper, Cotton tape, File covers Fitting and Miscellaneous items. The above Raw materials are to be sourced mainly from the open market at present availability and supply of the raw materials is not a problem e.g Mill Board/Gray Board/ card Board/ White Paper, Cotton tape, File covers Fitting and Miscellaneous items etc. to be sourced from open local markets and out side of Tripura. The requirement and costs of raw materials are as below: Mill Board/Gray Board/ card Board/ White Paper, Cotton tape, Rs.1,87,000/- File covers Fitting and Miscellaneous items Add:Vat 12.5% Rs. 23,375/- Add; Freights: Rs. 9,625/- Total: Rs.2,20,000/- Utilities : The unit will require a total connected load of 300 KWH and Water requirement is about 500KL per annum. Manpower: The unit will need to provide employment to the following 7 persons and all man power is available from local area. 1. Manager cum Supervisor Self Self 2. Skilled 4nos Rs.22,500/- 3. Office Boy/Peon 1 no Rs. 2,200/- 4. Sales Man 1no Rs. 3,300/- Total Rs.27,500/- Manufacturing Process: Board is first cut to the required size of the file covers or for file board. For the covers, it is printed as desired and then creased and bonded on the bending machine. Necessary attachments if desired, are fixed on the covers. File boards cut to size are pasted with paper. Flaps and tapes are then fixed on the board to give it final shape.

61
CAPITAL COST ESTIMATE: Land & Building: 60 Sq. Mtrs. On Rent. Plant & Machinery ; 1. Board Cutter Food, operated, dab front and guides 42” Rs.1,87,200/-
optical & other accessories. 2. Programmed multiple bending, Creasing Machine for
office file with five step metal gauge treadle drive 24’ size with extra die cliper.
3. Adjustable file bending machine to suit off ice clip or lever files without changing dies with cast iron machine finished table, treadle driven 24”
4 Punching and Pressing Machine for lever files treadle driven with two hole punching for clip or ring and corner pressing dies 24’
5 Deb press with two pillers size 15”x20”x12 6. Chandleir type plates printing press complete with all
standard equipments and accessories with 2HP Motor with starter size 11”x16”
7. Gumming machine 8. Backing press Compression type with
Geared type size 18”. Total: Rs.1,87,200/- Miscellaneous Fixed Assets: 1. Chair & Working Table Rs. 16,500/- 2. Fan & Lighting and wearing Rs. 16,500/- 3. Interior decoration Rs. 38,500/- Total Rs. 71,500/- Add Vat 12.5% Rs. 8,938/- Installation Charges Rs. 2,062/- Total Rs. 82,500/- Preliminary & Preoperative Exp.: Rs. 4,950/- Total Fixed Capital : Rs.2,74,650/- Working Capital (P.m) 1. Salary & Wages Rs. 27,500/- 2. Administrative expenses Rs. 13,666- 3. Selling expenses Rs. 3,300/- 4. Raw Materials Rs.2,20,000/- 5. Utilities Rs. 3,880/- Total Rs.2,68,316/-
Total Cost of the Project: Rs.5,42,966/- Means of Finance: Urban Rural a. Composite loan under PMEGP 70% Rs.3,80,076/- 60% Rs.3,25,780/- b. Subsidy 25% Rs.1,35,742/- 35% Rs.1,90,038/- c. Margin Money 5% Rs. 27,148/- 5% Rs. 27,148/-
Total Rs.5,42,966/- Rs.5,42,966/- d. Debt Equity Ratio 2.33:1 1.5:1

62
Name & Address of machinery and Equipments Suppliers: 1. M/S Indo Europa Trading Co. Pvt Ltd, 9 Dalal Street, fort, Bombay 4000023. 2. M/S Akemo Paper machines, D23 NDSE part I, New Delhi, 110004 3. M/S Nagpal Industries, Bartan Market, Sadar Bazar , Delhi 110006 Names and Address of Raw Materials Suppliers; 1. Titaghur paper Mills Co Ltd, Chartered Bank Building, Kalkata, 2. Bengal paper Mills Co ltd, 14 Netaji Subhash Road, kolkata, 3. Rohtas Industries Ltd, Dalmia Nagar. Profitability: (Rs. In Thousands) Sl.No.
Description 1st Year 2nd Year 3rd year 4th Year 5th Year
1. Capacity utilized as percent of installed capacity
60 70 80 80 80
2. Annual Sales Rs. 2,138 2,495 2,851 2,851 2,851
3. Annual Costs in Rs.
(a) Raw Materials 1,58 1,848 2,112 2,112 2,112
(b) Utilities 27 32 37 37 37
(c) Selling expenses 24 28 31 31 31
4 Variable Cost 1,635 1,908 2,180 2,180 2,180
(a) Wages & Salaries 198 231 264 264 264
(b) Administrative expenses 98 115 131 131 131
(c) Depreciation 27 27 27 27 27
(d) Interest on Composite Loan 44 36 26 16 5
5 Fixed & Semi Variable Cost 367 409 448 438 427
6. Total Cost 2002 2317 2628 2618 2607
7. Annual profit 136 178 223 233 244
8 Return on investment 25.04 32.78 41.06 42.90 44.93
9. Return on sales 6.36 7.13 7.82 8.17 8.55
10. Annual Contribution 503
11 Break Even Point as percent of capacity
43.77
12 Cash accrual 163 205 250 260 271
13. Debt servicing capacity 207 241 276 276 276
14 Repayment of Composite Loan 62 72 82 82 82
15. Debt serviced
106 108 108 98 87
16 Pay Back Period 1 years 6 month 10 days
17. Debt Service Coverage Ratio (DSCR)
1.53:1

63
Cash Flow Statement: (Rs. In Thousand) Sl. No.
Description Pre-opera-tive Period
O p e r a t i n g Y e a r s
60% 70% 80% 80%
80%
First Second Third Fourth Fifth
1. Increase in Promoter’s capital
27 NIL NIL NIL NIL NIL
2. Increase in composite loan 380 NIL NIL NIL NIL NIL
3 Increase in Subsidy 136 NIL NIL NIL NIL NIL
4. Depreciation 27 27 27 27 27
5. Profit before interests 180 214 249 249 249
A. TOTAL SOURCES 543 207 241 276 276 276
6. Increase in capital investment
275 NIL NIL NIL NIL NIL
7. Increase in working capital 268 NIL NIL NIL NIL NIL
8. Interests NIL 44 36 26 16 5
9. Repayment of loan NIL 62 72 82 82 82
B. TOTAL DISPOSALS 543 106 108 108 98 87
C. OPENING BALANCE NIL NIL 101 234 402 580
D. NET SURPLUS NIL 101 133 168 178 189
E. CLOSING BALANCE NIL 101 234 402 580 769
Projected Balance sheet: Sl.No. Description Amount in Rs Thousand as at the end of the
1st Yr. 2nd Yr. 3rd Yr. 4th Yr. 5th Yr.
1. Capital Account of the Promoter 27 163 341 564 797
2. Surplus from operations 136 178 223 233 244
NET WORTH: 163 341 564 797 1041
3. Composite loan 318 246 164 82 nil
4. Subsidy 136 136 136 136 136
A. TOTAL LIABILITIES 617 723 864 1015 1177 1. Gross Block 275 275 275 275 275
Less Depreciation 27 54 81 108 135
2 NET BLOCK 248 221 194 167 140
3 Current Assets 268 268 268 268 268
4. Cash & Bank Balance 101 234 402 580 769
B. TOTAL ASSETS 617 723 864 1015 1177
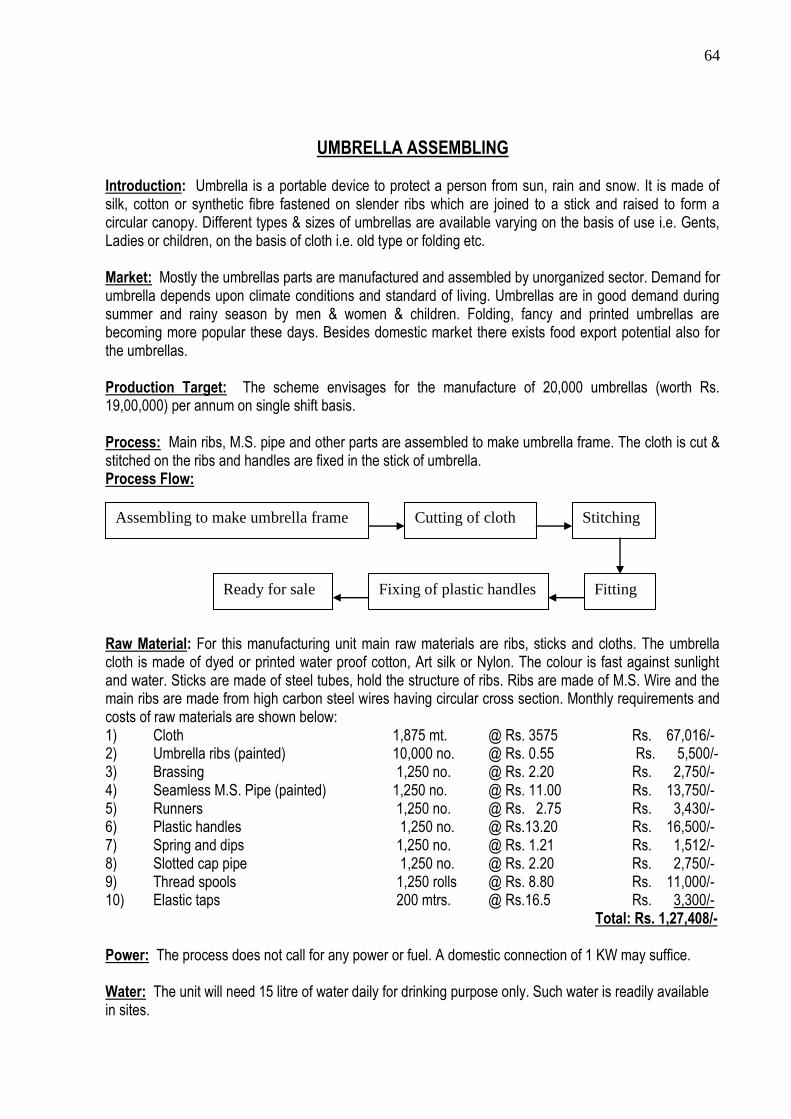
64
UMBRELLA ASSEMBLING Introduction: Umbrella is a portable device to protect a person from sun, rain and snow. It is made of silk, cotton or synthetic fibre fastened on slender ribs which are joined to a stick and raised to form a circular canopy. Different types & sizes of umbrellas are available varying on the basis of use i.e. Gents, Ladies or children, on the basis of cloth i.e. old type or folding etc. Market: Mostly the umbrellas parts are manufactured and assembled by unorganized sector. Demand for umbrella depends upon climate conditions and standard of living. Umbrellas are in good demand during summer and rainy season by men & women & children. Folding, fancy and printed umbrellas are becoming more popular these days. Besides domestic market there exists food export potential also for the umbrellas. Production Target: The scheme envisages for the manufacture of 20,000 umbrellas (worth Rs. 19,00,000) per annum on single shift basis. Process: Main ribs, M.S. pipe and other parts are assembled to make umbrella frame. The cloth is cut & stitched on the ribs and handles are fixed in the stick of umbrella. Process Flow:
Raw Material: For this manufacturing unit main raw materials are ribs, sticks and cloths. The umbrella cloth is made of dyed or printed water proof cotton, Art silk or Nylon. The colour is fast against sunlight and water. Sticks are made of steel tubes, hold the structure of ribs. Ribs are made of M.S. Wire and the main ribs are made from high carbon steel wires having circular cross section. Monthly requirements and costs of raw materials are shown below: 1) Cloth 1,875 mt. @ Rs. 3575 Rs. 67,016/- 2) Umbrella ribs (painted) 10,000 no. @ Rs. 0.55 Rs. 5,500/- 3) Brassing 1,250 no. @ Rs. 2.20 Rs. 2,750/- 4) Seamless M.S. Pipe (painted) 1,250 no. @ Rs. 11.00 Rs. 13,750/- 5) Runners 1,250 no. @ Rs. 2.75 Rs. 3,430/- 6) Plastic handles 1,250 no. @ Rs.13.20 Rs. 16,500/- 7) Spring and dips 1,250 no. @ Rs. 1.21 Rs. 1,512/- 8) Slotted cap pipe 1,250 no. @ Rs. 2.20 Rs. 2,750/- 9) Thread spools 1,250 rolls @ Rs. 8.80 Rs. 11,000/- 10) Elastic taps 200 mtrs. @ Rs.16.5 Rs. 3,300/- Total: Rs. 1,27,408/- Power: The process does not call for any power or fuel. A domestic connection of 1 KW may suffice. Water: The unit will need 15 litre of water daily for drinking purpose only. Such water is readily available in sites.
Assembling to make umbrella frame Cutting of cloth Stitching
Fitting Fixing of plastic handles Ready for sale

65
Manpower: The unit will need 3 skilled workers and one helper, which are readily available in Tripura. The annual cost of these 4 workers is estimated at Rs. 1,97,000/-. Financial Aspect: i) Land & Building 500 sq.ft. Rented (ii) Plant & Machinery: 1. Sewing machine 2 no. Rs. 14,400/- 2. Hand tools L.S. Rs. 6,000/- 3. Testing equipments L.S. Rs. 18,000/- 4. Workshop & office furniture Rs. 30,000/- Total:Rs. 68,400/- (iii) Preliminary & pre-operative Rs. 11,000/- (iv) Electrification & Installation Rs. 5,500/- (v) Other fixed assets Rs. 5,500/- Total Fixed Cost: Rs. 90,400/- B. Working Capital (i) Raw Materials Rs. 1,27,408/- ii) Salary & Wages Rs. 16,500/- iii) Utilities Rs. 330/- iv) Misc. expenditure Rs. 11,000/- Total working capital: Rs. 1,55,238/- Total Project Cost: Rs. 2,45,638/- Means of Finance: Urban Rural 1) Composite loan Rs. 1,71,947/- Rs. 1,47,383/- 2) Promoters contribution Rs. 12,282/- Rs. 12,282/- 3) Subsidy Rs. 61,409/- Rs. 85,973/- 4) Debt equity ratio 2.33:1 1.50:1 Profitability: (Rs. In Thousands)
Sl.No. Description 1st year 2nd year 3rd year 4th year 5th year 1. Capacity utilized as percent of
installed capacity 60 70 80 80 80
2. Annual Sales Realization 1254 1463 1672 1672 1672
3. Annual Costs
a) Raw Materials 917 1070 1223 1223 1223
b) Utilities 2 3 3 3 3
c) Selling expenses 24 28 32 32 32
Variable Cost 943 1101 1258 1258 1258
d) Wages & Salaries 119 139 158 158 158
e) Administrative expenses 55 65 74 74 74
f) Depreciation 9 9 9 9 9
g) Interest on Composite Loan 20 17 12 7 3
Fixed & Semi Variable Cost 203 230 253 248 244
4. Total Cost 1146 1331 1511 1506 1502
5. Annual Profit 108 132 161 166 170
6. Return on Investment 44.0 53.87 65.71 67.75 69.38
7. Return on sales 8.61 9.02 9.62 9.92 10.16
8. Annual contribution 311 - - - -
9. Break Even Point as percent of 39.16%

66
capacity
10. Cash accrual 117 141 170 175 179
11. Debt Servicing Capacity 137 158 182 182 182
12. Repayment of Composite Loan 28 33 37 37 37
13. Debt Serviced 48 50 49 44 40
14. Pay Back Period 2 year 10 month 20 days
15. Debt Service Coverage Ratio 2.89:1
Cash Flow Statement: (Rs. In Thousands)
Sl. No.
Description Pre-operative Period
O p e r a t i n g Y e a r s
First Second Third Fourth Fifth
1. Increase in Promoter’s contribution
12 - - - - -
2. Increase in Term loan 172 - - - - -
3. Subsidy 61 - - - - -
4. Depreciation - 9 9 9 9 9
5. Profit before interests - 128 149 173 173 173
A. TOTAL SOURCES 245 137 158 182 182 182
6. Increase in capital investment 90 - - - - -
7. Increase in working capital 155 - - - - -
8. Interest - 20 17 12 7 3
9. Repayment of Term Loan - 28 33 37 37 37
B. TOTAL DISPOSALS 245 48 50 49 44 40
C. OPENING BALANCE NIL NIL 89 197 330 468
D. NET SURPLUS NIL 89 108 133 138 142
E. CLOSING BALANCE NIL 89 197 330 468 610
Projected Balance sheet:
Sl.No. Description Amount in Rs Thousands as at the end of the
1st Yr. 2nd Yr. 3rd Yr. 4th Yr. 5th Yr.
1. Capital Account of Promoter 12 120 252 413 579
2. Surplus from operation 108 132 161 166 170
NET WORTH: 120 252 413 579 749
3. Subsidy 61 61 61 61 61
4. Term loan outstanding 144 111 74 37 -
TOTAL LIABILITIES 325 424 548 677 810
1. Gross Block 90 90 90 90 90
Less Depreciation 9 18 27 36 45
NET BLOCK 81 72 63 54 45
2. Working capital 155 155 155 155 155 3. Cash & Bank Balance 89 197 330 468 610
TOTAL ASSETS 325 424 548 677 810
Supplier of Umbrella Component (1) Arun & Company, 157 Netaji Subhas Road, 3rd Floor, Kolkata – 700 001. (2) Mohendra Dutta Grand Sons Pvt. Ltd. 25 A, Benia Tola Lane, Kolkata – 9, (3) Parashnath Industries pvt. Ltd.147 M.G. Road, Kolkata – 7.

67
LEATHER SHOE MANUFACTURING
Introduction: In India, shoes are manufactured by cottage, small-scale and large scale industries. The 14 large scale industries produce less than 7%. Rest of the 93% of the production is done by cottage and small-scale industries and most of the work in these units are done by hand. There is not much difference in between cottage and small-scale industries, except the fact that in the cottage industries there are only 3 to 4 workers while in small-scale industries the number of workers is much more. Certain small scale units have installed machines which bring quality in shoe manufacturing and also increase the production. Making shoes manually requires a lot of skill and time. The demand both in India and on international front has increased along with increased importance of punctuality of export commitments has led to a requirements, partial mechanization of these units. This change has long come in western countries and the production process has also significantly developed. Market: Due to high increase in demand for shoes and considerable change in the manufacturing process, the shoe-making units can be established anywhere. It is quite an appropriate units for concentrated production and can be established at the district level. Along with the indegeneous market, it has a high demand outside. Leather shoe manufacturing units that daily produce 20 to 50 pairs are viable. In the given unit initially 20 pairs would be manufactured daily and the production can be increased eventually keeping the increased demand in view. Capacity: The project aims at manufacturing 500 pairs of shoes in a month considering 25 working days in a month and 8 hrs. as the working time in a day. Considering the varying design and the raw materials used in the manufacturing process the selling price would differ accordingly. Process: Various new manufacturing methods are in trend these days like joint method, transparent vulcanization etc. By employing such method we can manufacture light shoes. In the joint process, a small nail is hammered on the upper part of the shoe. Meanwhile the lunar surface of upper part and the sole is made rough, adhesive is applied to these two surfaces, the pointed position of the nail that pierces from the upper portion of the shoe is pressed against the sole. Finally both surfaces are put in cementing press and thus the whole shoe is manufactured. Specialties of manufacturing the shoe with this process are following:
1. Production process is quite an easy one 2. Less time is consumed in production 3. It is easy to connect the parts and do away with the unwanted strips. 4. Shoes are light and comfortable.
The inner surface of the upper part are cut cleanly to avoid any stretches and shrinks. The portion of the shoe to be given shape is first drawn on the leather, later the edge are made thin. The upper part of the shoe and sole is reasonably made rough. If the roughness is more then the leather fibre would weaken while it is less rough, the adhesive would not stick to it. One important point the thin edges of the upper part of the shoe should not be roughed much otherwise the mistake would rather be permanent and apparent and cannot be mended. To spread the adhesive eventually, it is important to apply it with a brush which would eventually give a stronger point. After applying adhesive on the sole and inner surface of the upper part of the shoe, it is not disturbed until the nails cover part is not shown, this would happen depending upon the moisture and temperature.

68
Process Flow:
Raw Material: The raw material for the unit is mainly various types of leathers and sole. The sole is made of either rubber of leather. The raw material can be obtained from local tanneries or from the following addresses. 1) AGRA FINE LEATHER TANNERY 23/A, Chandranath Roy Road, Kolkata – 39. 2) Leather & Leather 45 Roffi Ahmed Kidwai Road, Kolkata – 16. Power: The annual consumption of power is estimated at 4240 kw Hr. costing rs.16,324. Water: The unit will need 50 Ltrs. Of water per day, which may be readily available at site. Manpower: The unit will need 2 skilled worker and a helper which are readily available in the state. The annual cost of these 3 workers is estimated at Rs. 1,45,200/-. Financial aspect of the Unit A. Fixed Cost i) Land & Building 100 sq.ft. of open space and shed Rented is required. 2) Plants & Machinery (i) Upper sewing machine 1 No. Rs. 21,600/- (ii) Sewing machine 1 No. Rs. 11,400/- (iii) Pores and small holes making 1 No. Rs. 6,000/- Machine (for putting lacs) (iv) Tools for correcting the stitch 1 No Rs. 1,440 /- (v) Seal cutting machine 1 No. Rs. 4,200/- (vi) Butting machine with exhaust Rs. 12,000/- Machine (polishing machine)
(vii) Cementing machine 1 Rs. 18,600/- (viii) Machine for making the covers even 1 Rs. 12,000/- (ix) Machine for making the shoe comfortable 1 Rs. 6,000/- (x) Mould costs (i) Wooden mould 100 pieces Rs. 19,200/- (ii) mould for other pair 100 pieces Rs. 1,440/-
Total: Rs. 1,13,880/-
Assembling
of lace and
sole cover
Finishing &
coloring Packing Sales
Leather Manual
cutting of upper
Upper
Sewing
Hole
punching Fitting in moulds Buffing
Roughing of sole Adhesive
application
Cementin
g

69
3. Electrification & Installation charges Rs. 27,500/- 4. Office furniture Rs. 16,500/- 5. Preliminary & Preoperative expenditure Rs. 8,250/- Total Fixed Cost: Rs. 1,66,130 /- 6. Working Capital: (3 months) a. Raw Material Quantity Rate Cost (i) Chrome leather for the upper 3000 sq.ft. 26 Rs. 85,800/- Part of the shoe (ii) Lining leather cream of goat/ sheep 3000 sq.ft. 17 Rs. 56,100/- E.E.I. leather (iii) Bark leather for the front part of 300 kg. 43 Rs. 14,190/- the shoe (iv) Sole 600 kg. 52 Rs. 34,320/- (v) Other raw materials Rs. 16,500/- Total Raw Material: Rs. 2,06,910/-
b. Salary & Utilities: Rs. 36,300/- c. Utility Rs. 5,500/- d. Misc. expenditure Rs. 16,500/- Total Working Capital: Rs.2,65,210/- Total Project Cost: Rs 4,31,340/- Means of Finance: Urban Rural 1) Composite loan Rs. 3,01,938/- Rs. 2,58,804/- 2) Promoter’s contribution Rs. 21,567/- Rs. 21,567/- 3) Subsidy Rs. 1,07,835/- Rs. 1,50,969/- 4) Debt equity ratio 2..33:1 1.50:1 Profitability: (Rs. In Thousands)
Sl.No. Description 1st year 2nd year 3rd year 4th year 5th year 1. Capacity utilized as percent of
installed capacity 60 70 80 80 80
2. Annual Sales Realization in Rs. 792 924 1056 1056 1056
3. Annual Costs in Rs.
a) Raw Materials 497 579 662 662 662
b) Utilities 13 15 18 18 18
c) Selling expenses 12 14 16 16 16
Variable Cost 522 608 696 696 696
d) Wages & Salaries 87 102 116 116 116
e) Administrative expenses 28 32 37 37 37
f) Depreciation 16 16 16 16 16
g) Interest on Composite Loan 35 29 21 13 4
Fixed & Semi Variable Cost 166 179 190 182 173
4. Total Cost 688 787 886 878 869
5. Annual Profit 104 137 170 178 187
6. Return on Investment 25.10% 35.39% 43.31% 45.20% 47.09%
7. Return on sales 13.37% 16.15% 17.30% 18.05% 18.81%
8. Annual contribution 270 - - -
9. Break Even Point as percent of 36.88%

70
capacity
10. Cash accrual 120 153 186 194 203
11. Debt Servicing Capacity 155 182 207 207 207
12. Repayment of Composite Loan 49 57 66 65 65
13. Debt Serviced 84 86 87 78 69
14. Pay Back Period 1 year 10 months 24 days
15. Debt Service Coverage Ratio 1.90:1
Cash Flow Statement: (Rs. In Thousands)
Sl. No.
Description Pre-operative Period
O p e r a t i n g Y e a r s
First Second Third Fourth Fifth
1. Increase in Promoter’s contribution
21 - - - - -
2. Increase in Term loan 302 - - - -
3. Subsidy 108 - - - - -
4. Depreciation - 16 16 16 16 16
5. Profit before interests - 139 166 191 191 191
A. TOTAL SOURCES 431 155 182 207 207 207
6. Increase in capital investment 166 - - - - -
7. Increase in working capital 265 - - - - -
8. Interest - 35 29 21 13 4
9. Repayment of Term Loan - 49 57 66 65 65
B. TOTAL DISPOSALS 431 84 86 87 78 69
C. OPENING BALANCE NIL NIL 71 167 287 416
D. NET SURPLUS NIL 71 96 120 129 138
E. CLOSING BALANCE NIL 71 167 287 416 554
Projected Balance sheet:
Sl.No. Description Amount in Rs. Thousands as at the end of the
1st Yr. 2nd Yr. 3rd Yr. 4th Yr. 5th Yr.
1. Capital Account of Promoter 21 125 262 432- 610-
2. Surplus from operation 104 137 170 178 187
NET WORTH: 125 262 432 610 797
3. Subsidy 108 108 108 108 108
4. Term loan outstanding 253 196 130 65 -
TOTAL LIABILITIES 486 566 670 783 905
1. Gross Block 166 166 166 166 166
Less Depreciation 16 32 48 64 80
NET BLOCK 150 134 118 102 86
2. Working capital 265 265 265 265 265
3. Cash & Bank Balance 71 167 287 416 554
TOTAL ASSETS 486 566 670 783 905
Suppliers of Machinery 1) Bata India Company Ltd. Engineering Division, 24 Parganas, Bata Nagar- 743873. 2) Leather & Packing Machine Corporation, ½ 3, B, Asafali Road, New Delhi – 110002.

71
VERMICOMPOST Introduction: Vermi-compost is a measure produced by composting waste materials by using earthworm. Earthworm digest as low as two percent of the food consumed by it and hence excrete about ninety eight percent of food consumed. The excreta of earthworm is always considered as a natural manure. The modern method of controlled feeding and collection of excreta is known as vermin-composting. It has already become a popular process of manufacturing Bio-fertilizer and in some places like Bangalore municipal waste is processed by Vermi-composting techniques. Market: With massive propagation of Chemical fertilizer and pesticides in last few decades demerits of such fertilizer and pesticides came into focus of the world. It was found that such fertilizers and pesticides harm not only human health but also the environment and the very soil on which agriculture is done. Alternatives like manure and compost are therefore found to be better fertilizer. Balanced fertilizer can be achieved by vermi-composting where right balance of N.P. and K can be ensured. Other natural fertilizers find it difficult. Thus vermi-compost is one step ahead in natural fertilizers. By mixing Neem and Tobacco extracts with others vermi-compost can be made to serve properties of fertilizer as well as pesticide. In Tripura vermicompost is propagated by Spice Board and Khadi & Village Industries Commission. These Agencies are not promoting NPK Balanced vermicomposting, though it is possible within the technology propagated. Plantations are bulk consumers of vermicomposts. Tea gardens and Rubber plantations in the state prefer bio-fertilizer including compost, manure and vermicompost. Out of 10.42 thousand Tonnes of fertilizer consumed in Tripura in 1997-98 plantations consume 2,500 Tonnes. At present about 900 Tonnes of the fertilizer consumed in bio-fertilizer. The state had 375 recognised resellers of fertilizer in 1996-97. Capacity: The unit shall need to work 365 days for three shifts. Worker shall however work for single shift per day, where they will mix the feed in tank, collect and pack vermicompost. As care need not be taken every-day all unskilled workers shall be employed on daily contract basis. The annual installed capacity is estimated at 30 Tonnes of vermicompost. Process: The process of vermicomposting already adopted in Tripura involve preparation of feedstock in vermicomposting pits, mixing them occasionally, collection of excreta of earthworms by brush, sundrying vermicompost to semi-dry condition, pulverizing and packing. Process Flow: Raw Materials: Though bio-degradable solid wastes of kitchen, farm, etc. enable one to produce vermicompost, these become rich in N but slightly deficient in P & K. Therefore, mixing of materials rich in P & K helps. Also to enhance porosity of the raw materials use of Saw dust/cut hay are done. These are available locally. Proper spices of Earthworm are also available at Agartala. The unit annually required raw materials will be Rs.2,20,800/-
Mixing Collection of excreta
of earth warm
Sun-drying Pulverizing
Packing

72
Water: Vermicomposting calls for keeping solid waste mix wet for better health of earthworms. Daily sprinkling calls for 60 Ltrs. of water. Such water is readily available in vermicomposting sites. Power: The process do not call for any power or fuel Manpower: One unskilled person can take care of mixing, collection of vermicompost and its sun drying. Breaking and packing calls for two more unskilled workers. Marketing and accounting shall however call for regular workers. The cost of manpower shall be Rs.31,000/- per quarter. Capital Cost estimate: 1. Land admeasuring 1728 sq.ft. Own 2. Shed and vermicomposting tanks Rs. 40,000/- 3. Water installation Rs. 7,500/- 4. Electrification Rs. 7,500/- 5. Office furniture & equipments Rs. 20,000/- 6. Provision for contingency Rs. 7,500/- 7. Preliminary & pre-operative expenses Rs. 2,500/- 8. Working Capital a) Raw Material Rs. 2,20,800/- b) Repair & Maintenance: Rs. 500/- c) Salary & Wages Rs. 31,000/- d) Utilities Rs. 500/- e) Administrative expenditure Rs. 12,500/- f) Selling expenses Rs. 1,700/- Total working capital: Rs. 2,67,000/- Total Project Cost: Rs. 3,52,000/- Means of Finance Urban Rural 1. Composite loan 2,46,400/- 2,11,200/- 2. Promoters Capital 17,600/- 17,600/- 3. Subsidy 88,000/- 1,23,200/- 4. Debt Equity ratio 2.33:1 1.50:1 Profitability:
Sl.No. Description 1st year 2nd year 3rd year 4th year 5th year 1. Capacity utilized as percent
of installed capacity 60 70 80 80 80
2. Annual Sales Realization in Rs.
21,00,000 24,50,000 28,00,000 28,00,000 28,00,000
3. Annual Costs in Rs.
a) Raw Materials 15,89,760 18,54,720 21,19,680 21,19,680 21,19,680
b) Utilities 3,600 4,200 4,800 4,800 4,800
c) Selling expenses 12,240 14,280 16,320 16,320 16,320
Variable Cost 16,05,600 18,73,200 21,40,800 21,40,800 21,40,800
d) Wages & Salaries 2,23,200 2,60,400 2,97,600 2,97,600 2,97,600
e) Administrative expenses 90,000 1,05,000 1,20,000 1,20,000 1,20,000
f) Depreciation 8,500 8,500 8,500 8,500 8,500

73
g) Interest on Composite Loan 28,302 22,892 15,816 9,157 24,97
Fixed & Semi Variable Cost 3,59,002 3,96,792 4,41,916 4,35,257 4,28,597
4. Total Cost 19,64,602 22,69,992 25,82,716 25,76,057 25,69,397
5. Annual Profit 1,35,398 1,80,008 2,17,284 2,23,943 2,30,603
6. Return on Investment 38.46% 51.13% 61.12% 63.62% 65.51%
7. Return on sales 6.45% 7.35% 7.76% 7.99% 8.2%
8. Annual contribution 4,94,400 5,76,800 6,59,200 6,59,200 6,59,200
9. Break Even Point as percent of capacity
43.56%
10. Cash accrual 1,43,898 1,88,508 2,25,784 2,32,443 2,39,103
11. Debt Servicing Capacity 1,72,200 2,11,400 2,41,600 2,40,943 2,41,600
12. Repayment of Composite Loan
39,957 46,616 53,276 53,276 53,276
13. Debt Serviced 68,259 69,508 69,092 62,433 55,773
14. Pay Back Period 2 year 6 month 7 days
15. Debt Service Coverage Ratio
2.52:1
Cash Flow Statement: (Rs. In Thousands)
Sl. No.
Description Pre-operative Period
O p e r a t i n g Y e a r s
First Second Third Fourth Fifth
1. Increase in Promoter’s contribution
17,600 - - - - -
2. Increase in Term loan 2,46,400 - - - -
3. Subsidy 88,000 - - - - -
4. Depreciation - 8,500 8,500 8,500 8,500 8,500
5. Profit before interests - 1,63,700 2,02,900 2,33,100 2,33,100 2,33,100
A. TOTAL SOURCES 3,52,000 4,39,200 2,11,400 2,41,600 2,41,600 2,41,600
5. Increase in capital investment
3,52,000 - - - - -
6. Increase in working capital
2,67,000 - - - -
7. Interest - 28,302 22,892 15,816 9,157 2,497
8. Repayment of Term Loan - 39,957 46,616 53,276 53,276 53,275
B. TOTAL DISPOSALS 3,52,000 3,35,259 69,508 69,092 62,433 55,773
C. OPENING BALANCE NIL NIL 1,03,941 2,45,833 4,18,341 5,97,508
D. NET SURPLUS NIL 1,03,941 1,41,892 1,72,508 1,79,167 1,85,828
E. CLOSING BALANCE NIL 1,03,941 2,45,833 4,18,341 5,97,508 7,83,336
Projected Balance sheet:
Sl.No. Description Amount in Rs. Thousands as at the end of the
1st Yr. 2nd Yr. 3rd Yr. 4th Yr. 5th Yr.
1. Capital Account of Promoter
17,600 1,52,998 3,33,006 5,50,290 7,74,233
2. Surplus from operation 1,35,398 1,80,008 2,17,284 2,23,943 2,30,603
NET WORTH: 1,52,998 3,33,006 5,50,290 7,74,233 10,04,836
3. Subsidy 88,000 88,000 88,000 88,000 88,000
4. Term loan outstanding 2,06,443 1,59,827 1,06,551 53,275 -
TOTAL LIABILITIES 4,47,441 5,80,833 7,44,841 9,15,508 10,92,836
1. Gross Block 85,000 85,000 85,000 85,000 85,000

74
Less Depreciation 8,500 17,000 25,500 34,000 42,500
NET BLOCK 76,500 68,000 59,500 51,000 42,500
2. Working capital 2,67,000 2,67,000 2,67,000 2,67,000 2,67,000
3. Cash & Bank Balance 1,03,941 2,45,833 4,18,341 5,97,508 7,83,336
TOTAL ASSETS 4,47,441 5,80,833 7,44,841 9,15,508 10,92,836
Suppliers of Machineries & Equipments
1) M/s Archana Machinery stores, M.S. Road, Fancybazar, Guwahati- 781001. 2) M/s S.D. Nanda & Sons, 50, Shradhananda Marg,, New Delhi. 3) M/s International Machines Tools Corporation, 5, Bank street, Mumbai-23.

75
CORRUGATED CARDBOARD BOXES
Introduction: Corrugated Cardboard Boxes are important packaging material with the use of containers for shipping & Railway transport its use has increased manifold. These need to conform to IS: 2771- 1965 of Bureau of Indian Standards. Corrugated cardboard boxes have replaced conventional wooden boxes as transport/ shipping containers, primarily because of their light-weight and get good strengths. Market: Corrugated Cardboard Boxes are consumed en-bulk in Biscuit, Cosmetics, Medicines, Preserved Fruits, Electrical, Electronics, Chemical etc. industries. The all-India demand for Corrugated Cardboard Boxes is of the order of 16, 50, 000 Tonnes per annum. The demand is growing at the rate of 10 percent per annum. In Tripura Corrugated Cardboard boxes are bulk-consumed by two Biscuit factories, one Medicine formulary, Two Fruit preservation Units, North Eastern Regional Agricultural Marketing Corporation Ltd., One IMFL Bottling Plant, etc. besides other smaller consumers. The annual demand for Corrugated Cardboard Boxes from bulk consumers alone is of the order of 1000 Tonnes, which is equivalent to about 15, 00, 000 Numbers of Boxes. There is no Unit in the State catering to this demand. Corrugated Cardboard Boxes have good export potential to Bangladesh as well. Installed Capacity: Assuming that the Unit will operate for single shift of eight hours per day for three hundred working days per annum, the annual installed capacity is estimated at 240 Tonnes. Process of Manufacture: Corrugated Cardboard is made of One Corrugated paper sheet pasted on another liner paper. Depending upon the strength requirement the number of Corrugated Sheets and hence liner sheets are increased. Two Kraft Paper Rolls are fed to the Corrugation Machine. Glue, prepared by boiling Corn Starch with water, is also fed to the Corrugation Machine. The Corrugated Cardboard obtained from the Corrugation Machine has one Corrugated Sheet with one liner. It is allowed to dry naturally for two and half hours. These Boards are cut in Board Cutter. These sized Boards are then pasted in the Sheet Pasting Machine to obtain thicker Boards and to paste the liner at the unlined side of Corrugated Sheet. Pasted boards are kept in the Sheet Press. The Boards are then Punched, Slotted, Creased and Corners are cut mechanically. Then these are stitched into Boxes. Printing on Boards is done after Sheet Pressing. Printing shall be out- sourced by the Unit. Process Flow Sheet: ZGlue Glue Kraft Paper Corrugated Cardboards Stitching Wire Raw Materials: Kraft Paper shall be the principal raw material of the unit, it is available from (i) Saraogi paper Mills (P) Ltd, Kishanganj – 855 107. (ii) Kamrup Paper Mills (P) Ltd, Amingaon, Guwahati – 781031 etc. starch is the other principal raw-material available from M/S Anil Starch Ltd; Mumbai. The other raw materials are available in Agartala market. The annual requirement at the installed capacity and costs are shown below:
Glue Preparation Corrugated
Board Making
Air
Drying
Cutting
Pasting Pressing Punching Slotting
Creasing
g Corner cutting Stitching
Sales

76
Sl.No. Raw Material Quantity per year Cost per annum
1 Kraft Paper in Rolls 235 MT. 51,70,000
2. Starch Glue 5.10 MT. 11,22,000
3. Stitching wire 2.90 MT 8,13,450
4. Misc. consumables L.S. 17,050
Total: Rs. 71,22,500
Power: The unit will need a total connected Load of 26.4 KW at 400/440 volts, 50 Ha, AC, 3 phase & 4 wires. The power shall be available from the State Power Supply Corporation through a Step-Down-Transformer. The annual consumption of power is estimated at 26,856 KW Hrs costing Rs. 53,175/-. Water: The unit shall need 3000 Liters of water per day, which may be readily available at the site. Manpower: Apart from the production supervisor and Corrugation machine operator all the manpower required are locally available. The annual requirement and cost of manpower are shown below:
Sl.No. Category of Manpower No. of Persons Annual Cost
1. Manager 1 99,000
2. Clerk cum Typist 1 46,200
3. Production Supervisor 1 84,700
4. Skilled Workers 3 1,78,200
5. Unskilled workers 9 2,97,000
Total: 15 6,99,600
Capital Cost Estimate: 1. Land & Building : Covered Area 260 sq. Mtrs. On Rent 2. Plant & Machinery (a) 52” Size Corrugated Machine Rs. 6,00,000/- (b) 52” x 62” Board Cutter Rs. 49,500/- (c) 72” sheet Pasting Machine Rs. 82,500/- (d) 55” x 75” sheet Press Rs. 1,10,000 /- (e) 75” creasing-cutting Machine Rs. 2,20,000/- (f) 12” size corner cutting cum slotting machine Rs. 55,000/- (g) Two No.s of Board stitching machine Rs. 55,000/- (h) Miscellaneous hand tools, glue preparation stove, vessel etc. Rs. 55,000/- Rs. 13,97,000/- 3. Miscellaneous Fixed assets (a) Electrification Rs. 1,10,000/- (b) Water Installation Rs. 27,500/- (c) Furniture & fixtures Rs. 82,500/- Rs. 2,20,000/- 4. Provision for contingencies Rs. 82,500/- 5. Preliminary & Pre-operative expenses Rs. 82,500/- Total Fixed Costs Rs. 17,82,000/- 6. Working Capital (for 1 month) (a) Raw Materials Rs. 5,93,541/- (b) Power Rs. 4,431/- (c) Wages & Salaries Rs. 58,300/- (d) Miscellaneous expenses Rs. 20,228/- Total: Rs. 6,76,500/- Total Project Cost: Rs. 24,58,500/-

77
Means of Finance: 1. Composite Loan under PMEGP Rs. 17,20,950/- Rs. 14,75,100/- 2. Subsidy Rs. 6,14,625/- Rs. 8,60,475/- 3. Promoter’s Contribution Rs. 1,22,925/- Rs. 1,22,925/- 4. Debt Equity Ratio 2.33:1 1.50:1 Profitability: (Rs. In Thousands)
Sl.No. Description 1st year 2nd year 3rd year 4th year 5th year 1. Capacity utilized as percent of
installed capacity 60% 70% 80% 80% 80%
2. Annual Sales Realization in Rs. 6732 7854 8976 8976 8976
3. Annual Costs in Rs.
a) Raw Materials 4274 4986 5698 5698 5698
b) Power 32 37 43 43 43
c) Wages & Salaries 581 620 661 678 694
d) Repair & Maintenance 75 75 75 75 75
e) Administrative expenses 110 116 121 128 134
f) Selling expenses 1010 1178 1346 1346 1346
g) Depreciation 128 178 178 178 178
h) Interest 198 161 117 70 23
Total: 6458 7351 8239 8216 8191
Total variable Cost 5316 6201 7087 7087 7087
4. Annual Profit 274 503 737 760 785
5. Return on Investment 11.14% 20.46% 29.98% 30.91% 31.93%
6. Return on sales 4.07 6.40 8.21 8.46 8.74
7. Annual contribution 1416 - - - -
8. Break Even Point as percent of capacity
48.38%
9. Cash accrual 452 681 915 938 963
10. Debt Servicing Capacity 650 842 1032 1008 986
11. Repayment of Composite Loan 279 326 372 372 372
12. Debt Serviced 477 487 489 442 395
13. Pay Back Period 2 years 7 months 18 days
14. Debt Service Coverage Ratio 1.97:1
Cash Flow Statement: (Rs. In Thousands) Sl. No.
Description Pre-operative Period
O p e r a t i n g Y e a r s
First Second Third Fourth Fifth
1. Increase in Promoter’s contribution
123 - - - - -
2. Increase in Subsidy 614 - - - - -
3. Increase in Loan 1721 - - - - -
4. Depreciation - 178 178 178 178 178
5. Profit before interests - 472 664 854 830 808
A. TOTAL SOURCES 2458 650 842 1032 1008 986
6. Increase in Fixed Assets 1782 - - - - -
7. Increase in Current Assets 676 - - - - -

78
8. Interest - 198 161 117 70 23
9. Repayment of Term Loan - 279 326 372 372 372
B. TOTAL DISPOSALS 2458 477 487 489 442 395
C. OPENING BALANCE NIL NIL 173 528 1071 1637
D. NET SURPLUS NIL 173 355 543 566 591
E. CLOSING BALANCE NIL 173 528 1071 1637 2228
Projected Balance sheet:
Sl.No. Description Amount in Rs. Thousands as at the end of the
1st Yr. 2nd Yr. 3rd Yr. 4th Yr. 5th Yr. 1. Capital Account of Promoter 123 397 900 1637 2397
2. Surplus from operation 274 503 737 760 785
NET WORTH: 397 900 1637 2397 3182
3. Subsidy 614 614 614 614 614
4. Loan Account 1442 1116 744 372 - TOTAL LIABILITIES 2453 2630 2995 3383 3796
1. Gross Fixed Assets 1782 1782 1782 1782 1782
Less Depreciation 178 350 534 712 890
NET BLOCK 1604 1426 1248 1070 892
2. Current Assets 676 676 676 676 676 3. Cash & Bank Balance 173 528 1071 1637 2228
TOTAL ASSETS 2453 2630 2995 3383 3796
Machinery Suppliers:
1. Assam Printers House, Parameswari Building, Tokoubari, Guwahati – 781001. 2. Raman Industries, 33 & 33/1, Biplabi Barin Ghosh Sarani, Kolkata – 700 067. 3. Well man machinery Corporation, 43/3, Feeder Road, Belgharia, Kolkata – 700056.
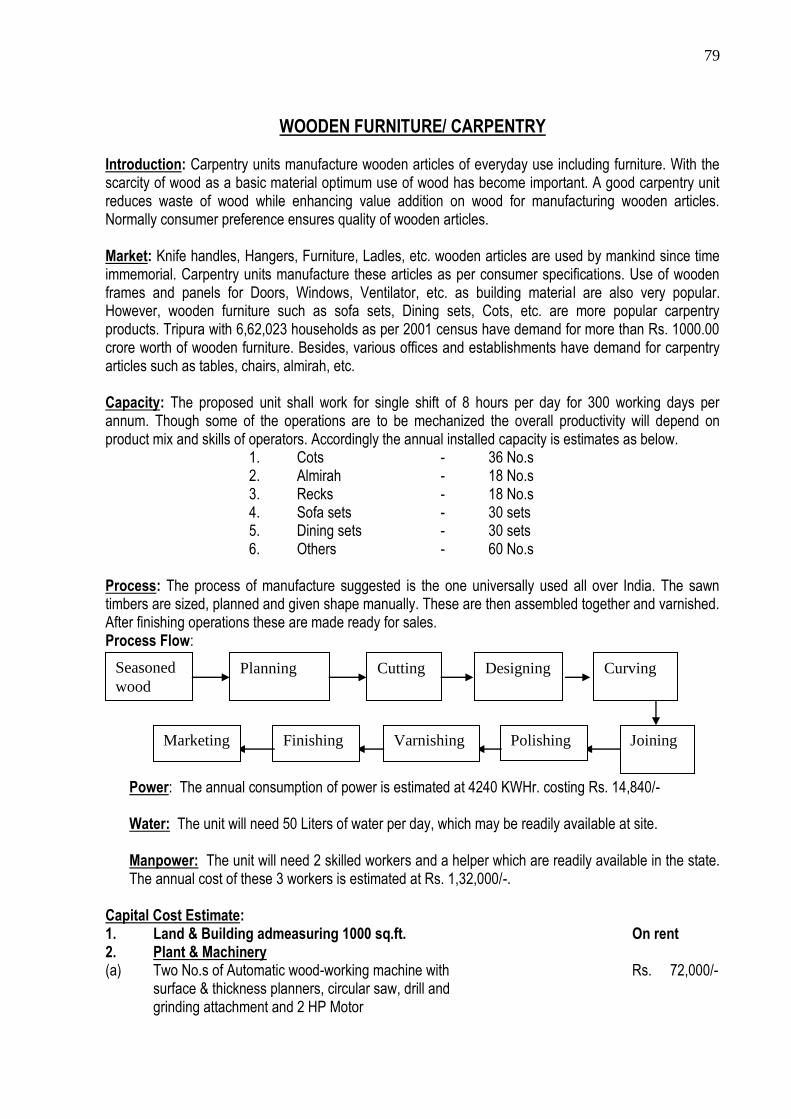
79
WOODEN FURNITURE/ CARPENTRY
Introduction: Carpentry units manufacture wooden articles of everyday use including furniture. With the scarcity of wood as a basic material optimum use of wood has become important. A good carpentry unit reduces waste of wood while enhancing value addition on wood for manufacturing wooden articles. Normally consumer preference ensures quality of wooden articles. Market: Knife handles, Hangers, Furniture, Ladles, etc. wooden articles are used by mankind since time immemorial. Carpentry units manufacture these articles as per consumer specifications. Use of wooden frames and panels for Doors, Windows, Ventilator, etc. as building material are also very popular. However, wooden furniture such as sofa sets, Dining sets, Cots, etc. are more popular carpentry products. Tripura with 6,62,023 households as per 2001 census have demand for more than Rs. 1000.00 crore worth of wooden furniture. Besides, various offices and establishments have demand for carpentry articles such as tables, chairs, almirah, etc. Capacity: The proposed unit shall work for single shift of 8 hours per day for 300 working days per annum. Though some of the operations are to be mechanized the overall productivity will depend on product mix and skills of operators. Accordingly the annual installed capacity is estimates as below.
1. Cots - 36 No.s 2. Almirah - 18 No.s 3. Recks - 18 No.s 4. Sofa sets - 30 sets 5. Dining sets - 30 sets 6. Others - 60 No.s
Process: The process of manufacture suggested is the one universally used all over India. The sawn timbers are sized, planned and given shape manually. These are then assembled together and varnished. After finishing operations these are made ready for sales. Process Flow:
Power: The annual consumption of power is estimated at 4240 KWHr. costing Rs. 14,840/- Water: The unit will need 50 Liters of water per day, which may be readily available at site. Manpower: The unit will need 2 skilled workers and a helper which are readily available in the state. The annual cost of these 3 workers is estimated at Rs. 1,32,000/-.
Capital Cost Estimate: 1. Land & Building admeasuring 1000 sq.ft. On rent 2. Plant & Machinery (a) Two No.s of Automatic wood-working machine with Rs. 72,000/- surface & thickness planners, circular saw, drill and grinding attachment and 2 HP Motor
Seasoned
wood
Planning Cutting Designing Curving
Joining Polishing Varnishing Finishing Marketing

80
(b) Miscellaneous hand tools Rs. 10,000/- (c) CST, freight, etc Rs. 10,000/- (d) Erection & installation costs Rs. 2,900/- Rs. 94,900/- 3. Miscellaneous Fixed Assets (a) Electrification for a connected load of 2 KW Rs. 27,000/- (b) Water installations for one kiloleter Rs. 10,500/- (c) Furniture, fixtures, etc. Rs. 10,000/- Rs. 47,500/- Total Fixed Cost: Rs.1,42,400/-. 4. Working Capital: (3 months) a. Raw Material Rs.1,88,100/-b. Salary & Utilities: Rs. 33,000/- c. Utility Rs. 5,000/- d. Misc. expenditure Rs. 15,000/- Total Working Capital: Rs. 2,41,100/-
Total Project Cost:Rs. 3,83,500/- Means of Finance: Urban Rural 1) Composite loan 2,68,450/- 2,30,100/- 2) Promoter’s contribution 19,175/- 19,175/- 3) Subsidy 95,875/- 1,34,225/- 4) Debt equity ratio 2..33:1 1.5:1 Profitability:
Sl.No. Description 1st year 2nd year 3rd year 4th year 5th year 1. Capacity utilized as percent of
installed capacity 60 70 80 80 80
2. Annual Sales Realization in Rs. 7,20,000 8,40,000 9,60,000 9,60,000 9,60,000
3. Annual Costs in Rs.
a) Raw Materials 4,51,440 5,26,680 6,01,920 6,01,920 6,01,920
b) Utilities 12,000 14,000 16,000 16,000 16,000
c) Selling expenses 10,800 12,600 14,400 14,400 14,400
Variable Cost 4,74,240 5,43,280 6,22,320 6,22,320 6,22,320
d) Wages & Salaries 79,200 92,400 1,05,600 1,05,600 1,05,600
e) Administrative expenses 25,200 29,400 33,600 33,600 33,600
f) Depreciation 14,240 14,240 14,240 14,240 14,240
g) Interest on Composite Loan 30,836 24,941 18,139 10,883 3,628
Fixed & Semi Variable Cost 1,49,476 1,60,981 1,71,579 1,64,323 1,57,068
4. Total Cost 6,23,716 7,04,261 7,93,899 7,86,643 7,79,388
5. Annual Profit 96,284 1,35,739 1,66,101 1,73,357 1,80,612
6. Return on Investment 25.10% 35.39% 43.31% 45.20% 47.09%
7. Return on sales 13.37% 16.15% 17.30% 18.05% 18.81%
8. Annual contribution 2,45,760 2,96,720 3,37,680 3,37,680 3,37,680
9. Break Even Point as percent of capacity
36.49%
10. Cash accrual 1,10,524 1,49,979 1,84,240 1,87,597 1,94,852
11. Debt Servicing Capacity 1,41,360 1,74,920 2,02,379 1,98,480 1,98,480
12. Repayment of Composite Loan 43,532 50,788 58,043 58,043 58,044
13. Debt Serviced 74,368 75,729 76,182 68,926 61,672

81
14. Pay Back Period 1 year 10 months 24 days
15. Debt Service Coverage Ratio 1.90:1
Cash Flow Statement:
Sl. No.
Description Pre-operative Period
O p e r a t i n g Y e a r s
First Second Third Fourth Fifth
1. Increase in Promoter’s contribution
19,175 - - - - -
2. Increase in Term loan 2,68,450 2,41,100 - - - -
3. Subsidy 95,875 - - - - -
4. Depreciation - 14,240 14,240 14,240 14,240 14,240
5. Profit before interests - 1,27,120 1,60,680 1,84,240 1,84,240 1,84,240
A. TOTAL SOURCES 3,83,500 3,82,460 1,74,920 1,98,480 1,98,480 1,98,480
6. Increase in capital investment
3,83,500 - - - - -
7. Increase in working capital - 2,41,100 - - - -
8. Interest - 30,836 24,941 18,139 10,883 3,628
9. Repayment of Term Loan - 43,532 50,788 58,043 58,043 58,044
B. TOTAL DISPOSALS 3,83,500 3,15,468 75,729 76,182 68,926 61,672
C. OPENING BALANCE NIL NIL 66,992 1,66,183 2,88,481 4,18,035
D. NET SURPLUS NIL 66,992 99,191 1,22,298 1,29,554 1,36,808
E. CLOSING BALANCE NIL 66,992 1,66,183 2,88,481 4,18,035 5,54,843
Projected Balance sheet:
Sl.No. Description Amount in Rupees as at the end of the
1st Yr. 2nd Yr. 3rd Yr. 4th Yr. 5th Yr.
1. Capital Account of Promoter
19,175 15,459 2,51,198 - -
2. Surplus from operation
96,284 1,35,739 1,66,101 1,73,357 1,80,612
NET WORTH: 1,15,459 2,51,198 4,17,299 5,90,656 7,71,268
3. Subsidy 95,875 95,875 95,875 95,875 95,875
4. Term loan outstanding
2,24,918 1,74,130 1,16,087 58,044 -
TOTAL LIABILITIES 4,36,252 5,21,203 6,29,261 7,44,575 8,67,143
1. Gross Block 1,42,400 1,42,400 1,42,400 1,42,400 1,42,400
Less Depreciation 14,240 28,480 42,720 56,960 71,200
NET BLOCK 1,28,160 1,13,920 99,680 85,440 71,200
2. Working capital 2,41,100 2,41,100 2,41,100 2,41,100 2,41,100
3. Cash & Bank Balance 66,992 1,66,183 2,88,481 4,18,035 5,54,843
TOTAL ASSETS 4,36,252 5,21,203 6,29,261 7,44,575 8,67,143
Suppliers of Machinery: 1. Maneklal and Sons, 115/116, Narayan Dhuru Street, Bombay 400 03, 2. Jayems Engg, Co, M.G. Road, Ernakulam, Cochin 682019, Kerala. 3. Batliboi & Co (P) Ltd, M.G Road, Ernakulam, Cochin 682019, Kerala

82
CONFECTIONARY
Introduction: Confectionary products have been in existence from time immemorial. Confectionary products are generally divided into hard candy (sugar cream), lozenges, caramels, toffee, chocolates & sugar coated candies. The development of confectionary industry in linked with the progress of sugar industry and its production fluctuates with the availability of sugar and its price. Confectionary Industry thus comprises an important segment of industrial activity in the food processing industry and has made considerable progress in the country, since Independence. Confectionary is mainly consumed by children as their most favourable edible sweets. It is also distributed on different festivals to the guests like birthday parties, marriage-celebrations, parties, etc. The consumption of these sweets is increasing day by day. To meet this ever growing demand, many units in urban and the semi-urban areas have come up. But there is a still good scope for new small scale units to manufacture quality production to meet the ever growing demand in the country. Market: Quality confectionary is of great nutritional value and forms an important part of a balanced diet for all age groups particularly amongst the children Confectionary is one of the important mass consumption items and has a demand in urban and rural areas. It is estimated that there are at present over 5,000 small and cottage scale units in the country manufacturing a wide range of products. Most of the small scale confectionary units are catering to the semi-urban and the rural markets, whereas large units are marketing their products mostly in the urban areas and export markets. Manufacture of confectionery products is techno-economically feasible in the small scale sector and offers a substantial scope for further development in the small towns, villages and backward areas of the country to provide additional employment and better utilization of the surplus sugar resources available presently in the country to meet the local demands. Target: Assuming that the Unit shall operate for single shift of eight hours per day for three hundred days per annum (a) Quantity 66000 Kg. (b) Value Rs. 37,62,000/- Process: These are manufactured by preparing a solution of cane sugar to which invert sugar or glucose syrup or a chemical reagent (doctor), for bringing about partial inversion, is added. The syrup is cooked to
a temperature of 310-320F, in an open pan or a steam jacketed kettle. In the open fire boiling process, however, a certain amount of caramelisation takes place which imparts characteristic flavour to the product. Alternative process, therefore, consists of cooking the syrup in a steam jacketed kettle to a
temperature of 310-320F, in an open pan or a vacuum cooker under suction and cooked under vacuum
to 310-320F. Vacuum cooking gives a light coloured products and prevents caramelisation. A supersaturated sugar solution with a glass like consistency is obtained. The product is then quickly cooled by spreading on an oiled, water cooled table, plat or cast iron slab. Flavouring and colouring materials are added and the product is thoroughly mixed. It is cut into various shapes by frame cutters worked manually. Process Flow:
Cane Sugar Sol Cooking Cooking with
sugar solution
Cooling
Mixing of colour
and flavour
Cutting Packing

83
Raw Material: The requirement at installed capacity and cost of Raw Materials are shown below:
Sl.No. Item Total
1. Sugar 1,31,250/-
2. Glucose Syrup commercial 52,500/-
3. Condensed Milk, coca powder, butter etc. 15,000/-
4. Chemical flavour & colour etc. 7,500/-
5. Packing Material 20,000/-
Total; 2,26,250/-
Power: The power is available from the state Electric supply corporation Grid. The annual consumption of power is estimated Rs. 6,000/- Water: The unit need to use very clean water for the process as it is producing food items. The unit will need 5000 liters of clean and soft water. It is available from both ground water sources and public supply. Fuel: Total amount required for fuel is estimated Rs. 60,000/-. Manpower: Manpower required by the unit including skilled workers is locally available. The requirement and annual costs of manpower at the installed capacity is shown below:
Sl.No. Category of Manpower No. of Persons Annual Cost
1. Manager 1 self
2. Skilled Worker 2 96,000/-
3. Sales man 1 48,000/-
4. Unskilled Worker 2 84,000/-
Total: 6 2,28,000/-
Financial Aspect: 1. Land & Building : On Rent 2. Plant & Machinery (1) Furnace 2 No. Rs. 12,000/- (2) Toffee sizing machine 1 No. Rs. 3,000/- (3) Pedal press with one set of die 1 No. Rs. 5,000/- (4) Plasto plast rotary machine with motor cutter and an 1 No. Rs. 52,000/- drying unit (5) Lozenges machine hand driver 1 No. Rs. 1,500/- (6) Extro roller for lozenges machine 5 No. Rs. 4,000/- (7) Toffee cutter (High speed steel blade) Rs. 500/- (8) Boiling Pan 2 No. Rs. 4,000/- (9) Wooden working table with aluminium top 1 No. Rs. 2,000/- (10) Sugar grinder 1 No. Rs. 5,000/- (11) Mixer machine small size 1 No. Rs. 5,500/- (12) Cooling table 1 No. Rs. 1,200/- (13) Polythene bag sealing machine 1 No. Rs. 1,000/- (14) Packing machine 1 No. Rs. 50,000/- (15) Platform weighing scale 1 No. Rs. 1,800/- (16) Misc. equipment eg. Siever, lablles, spartula, thermometer, jugs Buckets drums etc. Rs. 2,500/- Rs. 1,51,000/-

84
3. Miscellaneous Fixed Asset a) Electrification Rs. 5,000/- b) Water installation Rs. 5,000/- c) Furniture & Miscellaneous others Rs. 15,000/- Rs. 25,000/- 4. Provision for contingencies Rs. 8,800/- 5. Preliminary & pre-operative expenses Rs. 23,000/- Total Fixed Investment: Rs. 2,07,800/- 6. Working Capital (P.M.) a) Raw Material Rs. 2,26,250/- b) Utilities Rs. 7,000/- c) Salary & Wages Rs. 19,000/- d) Other expenses Rs. 15,000/- Total working capital:Rs. 2,67,250/- Total Project Cost: Rs. 4,75,050/- Means of Finance: Urban Rural 1. Composite loan 3,32,535/- 2,85,030/- 2. Promoter’s contribution 23,753/- 23,753/- 3. Subsidy 1,18,762/- 1,66,267/- 4. Debt equity ratio 2.33:1 1.50:1 Profitability:
Sl.No. Description 1st year 2nd year 3rd year 4th year 5th year 1. Capacity utilized as percent of
installed capacity 60% 70% 80% 80% 80%
2. Annual Sales Realization in Rs. 22,57,200 26,33,400 30,09,600 30,09,600 30,09,600
3. Annual Costs in Rs.
a) Raw Materials 16,29,000 19,00,500 21,72,000 21,72,000 21,72,000
b) Utilities 50,400 58,800 67,200 67,200 67,200
c) Selling expenses 1,78,485 2,08,233 2,37,981 2,37,981 2,37,981
Variable Cost 18,57,885 21,67,533 24,77,181 24,77,181 24,77,181
d) Wages & Salaries 1,36,800 1,59,600 1,82,400 1,82,400 1,82,400
e) Administrative expenses 1,08,000 1,26,000 1,44,000 1,44,000 1,44,000
f) Depreciation 20,780 20,780 20,780 20,780 20,780
g) Interest on Composite Loan 38,197 30,894 22,469 13,481 4,494
Fixed & Semi Variable Cost 3,03,777 3,37,274 3,69,649 3,60,661 3,51,674
4. Total Cost 21,61,662 25,04,807 28,47,130 28,37,842 28,28,855
5. Annual Profit 95,538 1,28,593 1,62,470 1,71,758 1,80,745
6. Return on Investment 20.11% 27.06% 34.20% 36.15% 38.04%
7. Return on sales 2.54% 3.42% 4.32% 4.57% 4.80%
8. Annual contribution 3,99,315 - - - -
9. Break Even Point 45.64%
10. Cash accrual 1,16,318 1,49,373 1,83,250 1,92,538 2,01,525
11. Debt Servicing Capacity 1,54,515 1,80,267 2,05,719 2,06,019 2,06,019
12. Repayment of Composite Loan 53,925 62,912 71,899 71,899 71,900
13. Debt Serviced 92,122 93,806 94,368 85,380 76,394
14. Pay Back Period 1 year 8 months 1 day
15. Debt Service Coverage Ratio 1.67:1

85
Cash Flow Statement:
Sl. No.
Description Pre-operative Period
O p e r a t i n g Y e a r s
First Second Third Fourth Fifth
1. Increase in Promoter’s contribution
23,753 - - - - -
2. Increase in Term loan 3,32,535 2,67,250 - - - -
3. Subsidy 1,18,762 - - - - -
4. Depreciation - 20,780 20,780 20,780 20,780 20,780
5. Profit before interests - 1,33,735 1,59,487 1,84,939 1,85,239 1,85,239
A. TOTAL SOURCES - 4,21,765 1,80,267 2,05,719 2,06,019 2,06,019
6. Increase in capital investment
- - - - - -
7. Increase in working capital - 2,67,250 - - - -
8. Interest - 38,197 30,894 22,469 13,481 4,494
9. Repayment of Term Loan - 53,925 62,912 71,899 71,899 71,900
B. TOTAL DISPOSALS NIL NIL 93,806 94,368 85,380 76,394
C. OPENING BALANCE NIL NIL 62,393 1,48,854 2,60,205 3,80.844
D. NET SURPLUS NIL 62,393 86,461 1,11,351 1,20,639 1,29,625
E. CLOSING BALANCE NIL 62,393 1,48,854 2,60,205 3,80,844 5,10,469
Projected Balance sheet:
Sl.No. Description Amount in Rupees as at the end of the
1st Yr. 2nd Yr. 3rd Yr. 4th Yr. 5th Yr. 1. Capital Account of
Promoter 23,753 - - - -
2. Surplus from operation
95,538 1,28,593 1,62,470 1,71,758 1,80,745
NET WORTH: 1,19,291 2,47,884 4,10,354 5,82,112 7,62,857
3. Subsidy 1,18,762 1,18,762 1,18,762 1,18,762 1,18,762
4. Term loan outstanding
2,78,610 2,15,698 1,43,799 71,900 -
TOTAL LIABILITIES 5,16,663 5,82,344 6,72,915 7,72,774 8,81,619
1. Gross Block 2,07,800 2,07,800 2,07,800 2,07,800 2,07,800
Less Depreciation 20,780 41,560 62,340 83,120 1,03,900
NET BLOCK 1,87,020 1,66,240 1,45,460 1,24,680 1,03,900
2. Working capital 2,67,250 2,67,250 2,67,250 2,67,250 2,67,250 3. Cash & Bank Balance 62,393 1,48,854 2,60,205 3,80,844 5,10,469
4. TOTAL ASSETS 5,16,663 5,82,344 6,72,915 7,72,774 8,81,619
Machinery Suppliers:
1) Oriental Machinery Pvt. Ltd. Mission Court, 15, Rajendra nath Mukherjee Road, Kolkata-700 001. 2) Gurbachan Singh Mistri 3605, Merigate, Delhi-110 006.

86
PAPER BAGS
Introduction: Paper bags are common packaging material being used by bakers and confectioners, grocers, textile and cloth merchants, dry cleaners, sweet-meat dealers etc. Due to some distinct advantages particularly lower prices over the other conventional packaging medium, paper bags are even used by the hawkers and vendors on the footpath of packing fruits, vegetable and candys etc. Market Potential : The introduction of shopping complex and consumers stores in the semi-urban and rural areas are creating additional demand for paper bags. Paper bags manufactures , therefore, may be taken up as a profitable manufacturing activity in selected areas. Installed Capacity: Assuming that the Unit shall operate for single shift of eight hours per day for three hundred days per annum. It is also assumed that the annual sales realization at the installed capacity is estimated 1,50,00,000 nos. number of various sizes bags with a sales value of Rs. 32,40,000/- Manufacturing Process: The whole process involved in the manufacture of paper bags is automatic starting with printing and ending with stacki9ng up of finished bags. The paper rolls may be initially cut in to proper width and they are fed into the printing unit first. After the printing work, the roll goes into the bag making section, where it is folded, pasted , shared and stacked. The bag making machine also have automatic mechanism for glueing. Raw Material: The requirement at installed capacity and cost of Raw Materials are shown below: 1) Paper sheets 40”x60”, 18000 sheets, 1,00,000/- 2) Paper in Roll colours & White 500 Reams 75,000/- 3) Printing Ink, Chemicals etc 25,000/- 4) Packing Materials, etc. 20,000/- 2,20,000/- The required Raw materials for this unit can be obtained from local wholesale market. Power : Consumption of power and fuel have been arrived at on the basis of consumption norms of the industry.The unit will require a total connected load of 30 KWH and Water requirement is about 50KL per annum. Water: Requirement of water mainly for washing of film developing etc and drinking purpose. The unit shall avail of the PHE water supply already available at the site and it can also install its own tube well supply for the purpose. Manpower: The unit will need to provide employment to the following 7 persons and all man power is available locally. 1. Manager cum Supervisor Self Self 2. Skilled 4nos Rs.22,500/- 3. Office Boy/Peon 1 no Rs. 2,200/- 4. Sales Man 1no Rs. 3,300/- Total Rs.27,500/-

87
CAPITAL COST ESTIMATE: Land & Building: 500 Sq. ft. On Rent Plant & Machinery: a. Automatic paper bags making machine ball bearing type with high speed rollers with two colour printing units Rs.1,20,000/- b. Stereo Press Rs. 15,000/- c. Stereo Grinder Rs. 15,000/- d. Rolls slitter motorized machine Rs. 30,000/- e. Testing equipment scale etc Rs. 7,200/- Total: Rs.1,87,200/ Miscellaneous Fixed Assets: 1. Chair & Working Table Rs. 15,000/- 2. Fan & Lighting and wearing Rs. 22,500/- 3. Interior decoration Rs. 45,000/- Total: Rs. 82,500/- Preliminary & Preoperative Exp.: Rs. 4,950/- Total Fixed Capital :Rs. 2,74,650/- Working Capital (P.m) 1. Salary & Wages Rs. 27,500/- 2. Administrative expenses Rs. 13,666- 3. Selling expenses Rs. 3,300/- 4. Raw Materials Rs.2,20,000/- 5. Utilities Rs. 3,880/- Total: Rs.2,68,316/-
Total Cost of the Project : Rs.5,42,966/- Means of Finance : Urban Rural a. Composite loan under PMEGP 70% Rs.3,80,076/- 60% Rs.3,25,780/- b. Subsidy 25% Rs.1,35,742/- 35% Rs.1,90,038/- c. Margin Money 5% Rs. 27,148/- 5% Rs. 27,148/-
Total Rs. 5,42,966/- Rs. 5,42,966/- d. Debt Equity Ratio 2.33:1 1.50:1 Profitability: (Rs. In Thousands) Sl.No. Description 1st Year 2nd Year 3rd year 4th Year 5th Year
1. Capacity utilized as percent of installed capacity
60 70 80 80 80
2. Annual Sales 2,138 2,495 2,851 2,851 2,851
3. Annual Costs
(a) Raw Materials 1,584 1,848 2,112 2,112 2,112 (b) Utilities 27 32 37 37 37
(c) Selling expenses 24 28 31 31 31
4 Variable Cost 1,635 1,908 2,180 2,180 2,180
(a) Wages & Salaries 198 231 264 264 264
(b) Administrative expenses 98 115 131 131 131
(c) Depreciation 27 27 27 27 27
(d) Interest on Composite Loan 44 36 26 16 5
5 Fixed & Semi Variable Cost 367 409 448 438 427
Total Cost 2002 2317 2628 2618 2607
7. Annual profit 136 178 223 233 244
8 Return on investment 25.04 32.78 41.06 42.90 44.93
9. Return on sales 6.36 7.13 7.82 8.17 8.55

88
10. Annual Contribution 503
11 Break Even Point as percent of capacity
43.77
12 Cash accrual 163 205 250 260 271
13. Debt servicing capacity 207 241 276 276 276
14 Repayment of Composite Loan 62 72 82 82 82
15. Debt serviced 106 108 108 98 87
16 Pay Back Period 1 years 6 month 10 days
17. Debt Service Coverage Ratio (DSCR)
1.53:1
Cash Flow Statement: (Rs. In Thousands)
Sl. No.
Description Pre-operative Period
O p e r a t i n g Y e a r s
60% 70% 80% 80% 80%
First Second Third Fourth Fifth
1. Increase in Promoter’s capital 27 NIL NIL NIL NIL NIL
2. Increase in composite loan 380 NIL NIL NIL NIL NIL
3 Increase in Subsidy 136 NIL NIL NIL NIL NIL
4. Depreciation 27 27 27 27 27
5. Profit before interests 180 214 249 249 249
A. TOTAL SOURCES 543 207 241 276 276 276
6. Increase in capital investment 275 NIL NIL NIL NIL NIL
7. Increase in working capital 268 NIL NIL NIL NIL NIL
8. Interests NIL 44 36 26 16 5
9. Repayment of loan NIL 62 72 82 82 82
B. TOTAL DISPOSALS 543 106 108 108 98 87
C. OPENING BALANCE NIL NIL 101 234 402 580
D. NET SURPLUS NIL 101 133 168 178 189
E. CLOSING BALANCE NIL 101 234 402 580 769
Projected Balance sheet: Sl.No. Description Amount in Rs. Thousands as at the end of the
1st Yr. 2nd Yr. 3rd Yr. 4th Yr. 5th Yr.
1. Capital Account of the Promoter 27 163 341 564 797
2. Surplus from operations 136 178 223 233 244
NET WORTH: 163 341 564 797 1041
3. Composite loan 318 246 164 82 nil
4. Subsidy 136 136 136 136 136
A. TOTAL LIABILITIES 617 723 864 1015 1177 1. Gross Block 275 275 275 275 275
Less Depreciation 27 54 81 108 135
2 NET BLOCK 248 221 194 167 140
3 Current Assets 268 268 268 268 268
4. Cash & Bank Balance 101 234 402 580 769
B. TOTAL ASSETS 617 723 864 1015 1177
Supplies of Machinery & Equipments :
1. Titaghur paper Mills Co Ltd , Titaghur , Bihar, 2. 2. Paper & Pulp Conversion Ltd, 376 Shukrawar Peth, Poona, 3. 3.Rohtas Industries Ltd, Dalmianagar, Bihar.

89
CARBON PAPER
Introduction: Type writer carbon paper is a plain, pigment coated, tissue paper sheet used for duplicating typewritten manuscript. Due to its being a consumable item and with the increase in the number of offices, banks, commercial establishment etc. Carbon paper is a form 0f copying paper. The first carbon paper was produced by crudely coating a heavy absorbent paper with a mixture of grease and carbon black. India has also done a tremendous improvement in this sector since 1950. when most of the carbon papers were imported. Now we are in a position to export the same also. Product ; The best paper used for the preparation of the carbon paper is the tissue paper. Which is specially produced for the purpose. The tissue must have a smooth surface, uniformly high density and good formation and must be free from porosity. A wide variety of carbon papers are produced to satisfy different end use into two broads classes, these are : 1. Single use carbon and 2 Multiple use carbon. Market : The typewriter carbon paper is the most important of the carbon paper family and therefore, finest materials and methods are used for its manufacture. These carbon paper can be used from 3 to 30 times depending upon the quality of the paper and ink formulation and coated weights. The producers of carbon paper is increasing with a 4.5% compound growth rate. The growth rate in demand is about 5%. Installed Capacity: Operating single shift of 8 hours per day for 300 working days per annum the unit shall have an annual installed capacity to produce 6,00,000 boxes per annum. Process of Manufacture: Manufacture of carbon paper involves manufacturing of coating ink and coating of the tissue paper base with ink. This ink is manufactured by dispersing or grounding the pigment with the ink vehicle. This operation is carried out in the heated mill. Process Flow:
Raw Materials: The main raw materials required for manufacture of carbon paper is paper, Pigment, Oils, Waxes etc. packing materials. Raw materials are to be sourced mainly from the open market and other way the same product may be collected from Bandana International, mangalmurti Appartments, Opp NKGSB, Thane, Maharastra, 401105, India. The annual requirement at the installed capacity and costs of Raw Materials will be Rs. 64,75,000/- Power: The unit will need a total connected Load of 26.4 KW at 400/440 volts, 50 Ha, AC, 3 phase & 4 wires. The power shall be available from the State Power Supply Corporation through a Step-Down-Transformer. The annual consumption of power is estimated at 26,856 KW Hrs costing Rs. 48,341/-. Water: The unit shall need 3000 Liters of water per day, which may be readily available at the site. Manpower: The chemist for the unit shall need to be recruited from outside the state. Other manpower are locally available. The requirement and annual cost of manpower is shown below:
Heating & Agitation
of ingredients
Cooling Packing

90
Sl.No. Category of Manpower No. of Persons Annual Cost
1. Manager 1 90,000
2. Clerk cum Typist 1 42,000
3. Production Supervisor 1 77,000
4. Skilled Workers 3 1,62,000
5. Unskilled workers 9 2,70,000
Total: 15 6,36,000
Capital Cost Estimate: 1) Land & Building : Covered area 190 sq. Mtrs. On Rent 2) Plant & Machinery a. Coating Machine Rs. 5,75,000/- b. Chilling Plant Rs .1,75,000/- c. Printing Machine Rs. 2,00,000/- d. Sheeting machine etc. Rs. 1,45,000/- e) Analytical instruments, weighing/ measuring equipments etc. Rs. 1,75,000/- Rs.12,70,000/- 3) Miscellaneous Fixed Asset a) Electrification Rs. 1,00,000/- b) Water Installation Rs 50,000/- c) Furniture, Fixtures, etc. Rs. 50,000/- Rs. 2,00,000/- 4. Provision for contingencies Rs. 85,000/- 5. Preliminary & pre-operative expenses Rs. 65,000/- Rs. 1,50,000/- Total Fixed Capital Rs. 16,20,000/- 6. Working Capital (for 1 month) (a) Raw Materials Rs. 5,39,583/- (b) Power Rs. 4,028/- (c) Wages & Salaries Rs. 53,000/- (d) Miscellaneous expenses Rs. 18,389/- Total: Rs. 6,15,000/- Total Project Cost Rs. 22,35,000/- Means of Finance: 1. Composite Loan under PMEGP Rs. 15,64,000/- Rs. 13,41,000/- 2. Subsidy Rs. 5,59,000/- Rs. 7,82,250/- 3. Promoter’s Contribution Rs. 1,12,000/- Rs. 1,11,750/- 4. Debt Equity Ratio 2.33:1 1.50:1 Profitability: (Rs. In Thousands)
Sl.No. Description 1st year 2nd year 3rd year 4th year 5th year 1. Capacity utilized as percent of
installed capacity 60% 70% 80% 80% 80%
2. Annual Sales Realization in Rs. 6120 7140 8160 8160 8160
3. Annual Costs in Rs.
a) Raw Materials 3885 4533 5180 5180 5180
b) Power 29 34 39 39 39

91
c) Wages & Salaries 528 564 601 616 631
d) Repair & Maintenance 68 68 68 68 68
e) Administrative expenses 100 105 110 116 122
f) Selling expenses 918 1071 1224 1224 1224
g) Depreciation 155 155 155 155 155
h) Interest 180 146 106 64 21
Total: 5863 6676 7483 7462 7440
Total variable Cost 4832 5641 6443 6443 6443
4. Annual Profit 257 464 677 698 720
5. Return on Investment 11.50% 20.76% 30.29% 31.23% 32.21%
6. Return on sales 4.20% 6.50% 8.30% 8.55% 8.82%
7. Annual contribution 1288 - - - -
8. Break Even Point as percent of capacity
48.03%
9. Cash accrual 412 619 832 853 875
10. Debt Servicing Capacity 592 765 938 917 896
11. Repayment of Composite Loan 244 300 340 340 340
12. Debt Serviced 424 446 446 404 361
13. Pay Back Period 2 years 7 months 18 days
14. Debt Service Coverage Ratio 1.97:1
Cash Flow Statement: (Rs. In Thousands) Sl. No.
Description Pre-operative Period
O p e r a t i n g Y e a r s
First Second Third Fourth Fifth
1. Increase in Promoter’s contribution
112 - - - - -
2. Increase in Subsidy 559 - - - - -
3. Increase in Loan 1564 - - - - -
4. Depreciation - 155 155 155 155 155
5. Profit before interests - 437 610 783 762 741
A. TOTAL SOURCES 2235 592 765 938 917 896
6. Increase in Fixed Assets 1620 - - - - -
7. Increase in Current Assets 615 - - - - -
8. Interest - 180 146 106 64 21
9. Repayment of Term Loan - 244 300 340 340 340
B. TOTAL DISPOSALS 2235 424 446 446 404 361
C. OPENING BALANCE NIL NIL 168 487 979 1492
D. NET SURPLUS NIL 168 319 492 513 535
E. CLOSING BALANCE NIL 168 487 979 1492 2027
Projected Balance sheet: (Rs. In Thousands)
Sl.No. Description Amount in Rupees as at the end of the
1st Yr. 2nd Yr. 3rd Yr. 4th Yr. 5th Yr. 1. Capital Account of Promoter 112 369 833 1510 2208
2. Surplus from operation 257 464 677 698 720
NET WORTH: 369 833 1510 2208 2928
3. Subsidy 559 559 559 559 559
4. Loan Account 1320 1020 680 340 -

92
TOTAL LIABILITIES 2248 2412 2749 3107 3487
1. Gross Fixed Assets 1620 1620 1620 1620 1620
Less Depreciation 155 310 465 620 775
NET BLOCK 1465 1310 1155 1000 845
2. Current Assets 615 615 615 615 615 3. Cash & Bank Balance 168 487 979 1492 2027
TOTAL ASSETS 2248 2412 2749 3107 3487
Machine Suppliers:
1. Pioneer papers, Uco Bank Lane, Vpo Jugiana, G. T. Road, Ludhiana, Punjab India 2. Divyabharti Enterprises Pvt. Ltd. - India. 406, Adamji Building, 4th Floor, 413, Narsi Natha Street,
Mumbai - 400009., Maharashtra India 3. Vandana International - India . 301, Mangalmurti Apts, Navghar Road, Bhayandar (E), Thane,
Thane-401105, Maharashtra India. 4. Shalin Sales - India , 3, Celler, Khadia Shopping Center, Khadia Old Gate, Khadia, Ahnedabad,
Gujarat India.

93
DECORATIVE PAPER Introduction : Decorative papers are widely employed for packing of presentation articles and gifts. These are also used for nursery education for creating colour sense in the children. Children of higher classes can utilize it for their artistic skill. Market potential : The decorative papers are used for marketing paper decorations like flowers etc. during festive season. Thus there appears to be a fairly good demand for the decorative papers in the country. Manufacturing process of Decorative Papers: Paper in the form of rolls is fed to a rotogravure printing machine where in it is coated with a colour on one side. These are then cut into sheets of suitable sizes, which are passed through a varnishing machine for giving it a gloss and shine and making it more pleasing and presentable. Flow Chart :
Production Capacity: The production target has been kept as 108 MT per annum which will be total value s of Rs. 30,05,000 p.a. Manpower: The unit will need the following manpower, all of whom are locally available.
Sl.No. Type of Manpower No. of Persons Annual Costs
1. Part-time pathologist 1 Rs. 96,000
2. Receptionist cum Clerk 2 Rs. 84,000
3. Paramedical staff 2 Rs. 1,08,000
4. Unskilled worker 2 Rs. 48,000
Total: 7 Rs. 3,36,000
Capital Cost Estimate:
(a) Land & Building: 800 sq.ft Rented
(b) Plant & Machinery
(i) Roto- Grauvre Printing Machine 30” for 2 colour printing with 1,20,500/-
(ii) Paper Cutting Machine 43” 45,000/-
(iii) Paper varnishing machine with drying arrangement 30’x40’ 34,000/-
(iv) Cost of Knives, tanks etc 45,500/-
(v) Cost of office equipments and machinery tools 35,000/-
Total 2,80,000/-
Cutting
Processing Process in
Sizes
Shape in
Machine
Final
Cutting
Sales
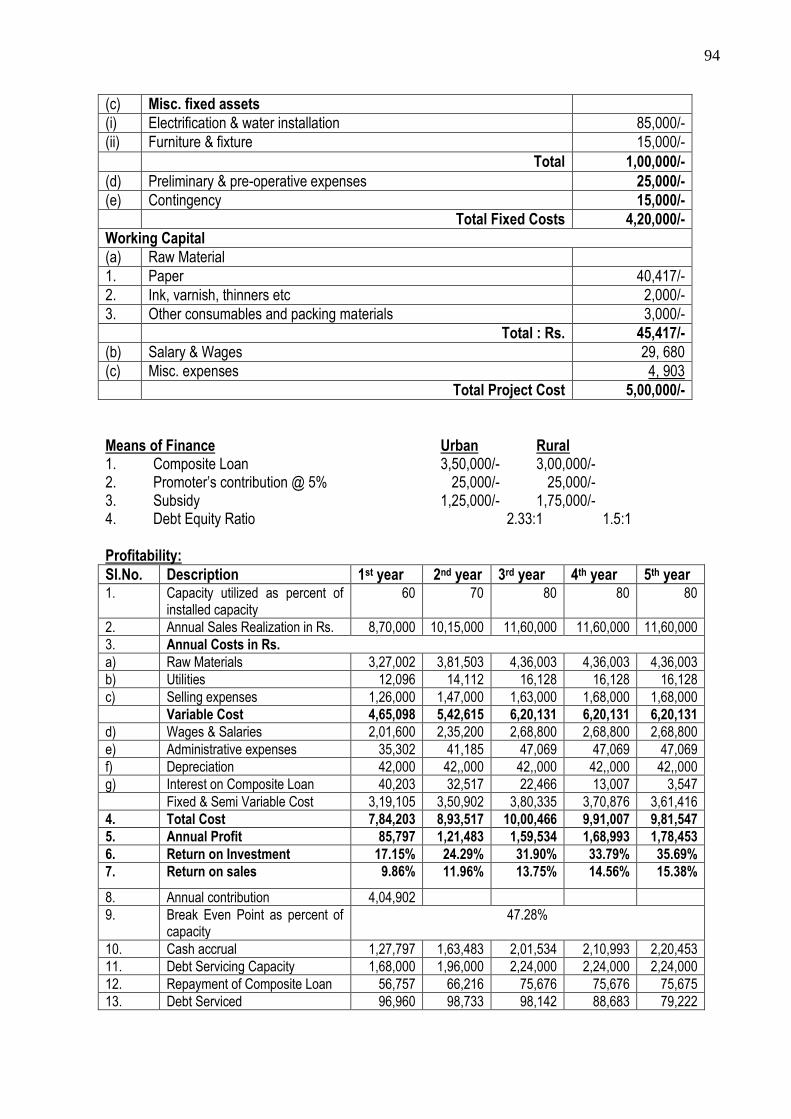
94
(c) Misc. fixed assets
(i) Electrification & water installation 85,000/-
(ii) Furniture & fixture 15,000/-
Total 1,00,000/-
(d) Preliminary & pre-operative expenses 25,000/-
(e) Contingency 15,000/-
Total Fixed Costs 4,20,000/-
Working Capital
(a) Raw Material
1. Paper 40,417/-
2. Ink, varnish, thinners etc 2,000/-
3. Other consumables and packing materials 3,000/-
Total : Rs. 45,417/-
(b) Salary & Wages 29, 680
(c) Misc. expenses 4, 903
Total Project Cost 5,00,000/-
Means of Finance Urban Rural 1. Composite Loan 3,50,000/- 3,00,000/- 2. Promoter’s contribution @ 5% 25,000/- 25,000/- 3. Subsidy 1,25,000/- 1,75,000/- 4. Debt Equity Ratio 2.33:1 1.5:1 Profitability:
Sl.No. Description 1st year 2nd year 3rd year 4th year 5th year 1. Capacity utilized as percent of
installed capacity 60 70 80 80 80
2. Annual Sales Realization in Rs. 8,70,000 10,15,000 11,60,000 11,60,000 11,60,000
3. Annual Costs in Rs.
a) Raw Materials 3,27,002 3,81,503 4,36,003 4,36,003 4,36,003
b) Utilities 12,096 14,112 16,128 16,128 16,128
c) Selling expenses 1,26,000 1,47,000 1,63,000 1,68,000 1,68,000
Variable Cost 4,65,098 5,42,615 6,20,131 6,20,131 6,20,131
d) Wages & Salaries 2,01,600 2,35,200 2,68,800 2,68,800 2,68,800
e) Administrative expenses 35,302 41,185 47,069 47,069 47,069
f) Depreciation 42,000 42,,000 42,,000 42,,000 42,,000
g) Interest on Composite Loan 40,203 32,517 22,466 13,007 3,547
Fixed & Semi Variable Cost 3,19,105 3,50,902 3,80,335 3,70,876 3,61,416
4. Total Cost 7,84,203 8,93,517 10,00,466 9,91,007 9,81,547
5. Annual Profit 85,797 1,21,483 1,59,534 1,68,993 1,78,453
6. Return on Investment 17.15% 24.29% 31.90% 33.79% 35.69%
7. Return on sales 9.86% 11.96% 13.75% 14.56% 15.38%
8. Annual contribution 4,04,902
9. Break Even Point as percent of capacity
47.28%
10. Cash accrual 1,27,797 1,63,483 2,01,534 2,10,993 2,20,453
11. Debt Servicing Capacity 1,68,000 1,96,000 2,24,000 2,24,000 2,24,000
12. Repayment of Composite Loan 56,757 66,216 75,676 75,676 75,675
13. Debt Serviced 96,960 98,733 98,142 88,683 79,222

95
14. Pay Back Period 1 year 8 month 22 days
15. Debt Service Coverage Ratio 1.73:1
Cash Flow Statement
Sl. No.
Description Pre-operative Period
O p e r a t i n g Y e a r s
First Second Third Fourth Fifth
1. Increase in Promoter’s contribution
25,000 - - - - -
2. Increase in Term loan 3,50,000 80,000 - - - -
3. Subsidy 1,25,000 - - - - -
4. Depreciation - 42,000 42,000 42,000 42,000 42,000
5. Profit before interests - 1,26,000 1,54,000 1,82,000 1,82,000 1,82,000
A. TOTAL SOURCES 5,00,000 2,48,000 1,96,000 2,24,000 2,24,000 2,24,000
6. Increase in capital investment
5,00,000 - - - - -
7. Increase in working capital - 80,000 - - - -
8. Interest - 40,203 32,517 22,466 13,007 3,547
9. Repayment of Term Loan - 56,757 66,216 75,676 75,676 75,676
B. TOTAL DISPOSALS 5,00,000 1,76,960 98,733 98,142 88,683 79,222
C. OPENING BALANCE NIL NIL 71,040 1,68,307 2,94,165 4,29,482
D. NET SURPLUS NIL 71,040 97,267 1,25,858 1,35,317 1,44,778
E. CLOSING BALANCE NIL 71,040 1,68,307 2,94,165 4,29,482 5,74,260
Projected Balance sheet:
Sl.No. Description Amount in Rupees as at the end of the
1st Yr. 2nd Yr. 3rd Yr. 4th Yr. 5th Yr. 1. Capital Account of
Promoter 25,000 1,10,797 2,32,280 3,91,814 8,60,807
2. Surplus from operation
85,797 1,21,483 1,59,354 1,68,993 1,78,453
NET WORTH: 1,10,797 2,32,280 3,91,814 5,60,807 7,39,260
3. Subsidy 1,25,000 1,25,000 1,25,000 1,25,000 1,25,000
4. Term loan outstanding
2,93,243 2,27,027 1,51,351 75,675 -
TOTAL LIABILITIES 5,29,040 5,84,307 6,68,165 7,61,482 8,64,260
1. Gross Block 4,20,000 4,20,000 4,20,000 4,20,000 4,20,000
Less Depreciation 42,000 84,000 1,26,000 1,68,000 2,10,000
NET BLOCK 3,78,000 3,36,000 2,94,000 2,52,000 2,10,000
2. Working capital 80,000 80,000 80,000 80,000 80,000 3. Cash & Bank Balance 71,040 1,68,307 2,94,165 4,29,482 5,74,260
TOTAL ASSETS 5,29,040 5,84,307 6,68,165 7,61,482 8,64,260
Suppliers of Machinery:
1. Indo Europa Trading Co, 1390 Chandni Chowk, Delhi-6. 2. Industrial Paper machines (P) Ltd, 32 Phase I, Naraina Industrial Area, New Delhi.. 3. Laxmi Board and paper Mills Pvt Ltd, 23 Raman street, 3rd floor, Bombay.

96
GUMMED PAPER TAPE Introduction : Gummed Paper Tapes afford security against pilferage and tamper as it cannot be peeled off. These types are easy to stick and give attractive look to the cartons and packages. These tapes can be printed attractively in any colour of choice and after an excellent advertising value, identification and individuality. Almost all the raw materials used for the manufacture of gummed tapes i.e kraft paper, adhesives. cores, printing inks and other allied materials are available indigenously. Market: The gummed paper type plays an important role in the field of packaging industries. The demand of tapes is increasing with the increasing outputs of the industries. With more and more sophistication being introduced in packaging and trend for displaying and advertising contents on package the demand for gummed paper tape is likely to increase considerably in future. Suggested Capacity: The minimum economic capacity for Gummed paper tape is 215MT and approximately value will be Rs.32,40,000/- per annum on one shift basis on a 300 days working schedule in year. Raw Materials; The main raw materials required for manufacture of Gummed Paper Tape are Kraft paper in rolls, Animal Glue of standard quality, Glycerine preservatives and other miscellaneous chemicals, Plastic cores, Bituminised packaging paper reels , labels etc. Raw materials are to be sourced mainly from the open market at present availability and to be sourced from and out side of Tripura.( 1. Orient Paper Mills Ltd, Brajraj Nagar, Orissa, 2. Star paper Miills Ltd, Sahranpur U.P, 3. Andhra Paper Mills Ltd, Rajanahendry, A.P), The unit required raw materials Rs.2,20,000/-p.a. Utilities : The unit will require a total connected load of 200 KVA and a maximum demand of 190 KVA. Water requirement is about 500KL per annum. Manpower: The unit will need to provide employment to the following 7 persons and all man power is available from local area. 1. Manager cum Supervisor Self Self 2. Skilled 4nos Rs.22,500/- 3. Office Boy/Peon 1 no Rs. 2,200/- 4. Sales Man 1no Rs. 3,300/- Total Rs.27,500/- Manufacturing Process: Kraft paper in reels is coated uniformly in one side with a water soluble adhesive composition on a coating machine. It is dried in a drying chamber and wound. The coated rolls are then slit into various sizes (width and length). If required, printing is done on the uncoated side of the gummed tape reels. Flow Chart :
Assemblin
g
Fixing of Various
Components Wiring
Composition Printing Function
Testing Picketing
Sales

97
CAPITAL COST ESTIMATE: Land and Building: 1000Sq. ft. On Rent Plant & Machinery ; 1. Glue preparation tank ( stainless steel, fitted with stirrer Rs. 75,000/-
for mixing glue, valves for unloading, reduction gear, heaters etc.) 2. Complete coating & rewinding machine size 40” with rollers and Rs. 65,000/-
adjustments, glue coating stainless steel tank with mild steel jacket, main drive with V-Belts and chain, extra mild steel core for the rewinding unit.
3. Complete drying chamber Rs. 34,000/- 4. Complete slitting, Printed rewinding unit equipped with Rs. 13,200/-
necessary steel rolls for printing, reduction drive etc. Total: Rs.1,87,200/- Miscellaneous Fixed Assets: 1. Chair & Working Table Rs. 17,000/- 2. Fan & Lighting and wearing Rs. 20.500/- 3. Interior decoration Rs. 45,000/- Total:Rs. 82,500/-Preliminary & Preoperative Exp.: Rs. 4,950/- Total Fixed Capital: Rs.2,74,650/- Working Capital (P.m) 1. Salary & Wages Rs. 27,500/- 2. Administrative expenses Rs. 13,666- 3. Selling expenses Rs. 3,300/- 4. Raw Materials Rs.2,20,000/- 5. Utilities Rs. 3,880/- Total Rs. 2,68,316/-
Total Cost of the Project : Rs. 5,42,966/- Means of Finance: Urban Rural a. Composite loan under PMEGP 70% Rs.3,80,076/- 60% Rs.3,25,780/- b. Subsidy 25% Rs.1,35,742/- 35% Rs.1,90,038/- c. Margin Money 5% Rs. 27,148/- 5% Rs. 27,148/-
Total Rs. 5,42,966/- Rs. 5,42,966/- d. Debt Equity Ratio 2.33:1 1.50:1 Profitability: (Rs. In Thousands) Sl.No. Description 1st Year 2nd Year 3rd year 4th Year 5th Year
1. Capacity utilized as percent of installed capacity
60 70 80 80 80
2. Annual Sales Rs. 2,138 2,495 2,851 2,851 2,851
3. Annual Costs in Rs.
(a) Raw Materials 1,584 1,848 2,112 2,112 2,112 (b) Utilities 27 32 37 37 37
(c) Selling expenses 24 28 31 31 31
4 Variable Cost 1,635 1,908 2,180 2,180 2,180
(a) Wages & Salaries 198 231 264 264 264
(b) Administrative expenses 98 115 131 131 131
(c) Depreciation 27 27 27 27 27
(d) Interest on Composite Loan 44 36 26 16 5

98
5 Fixed & Semi Variable Cost 367 409 448 438 427
Total Cost 2002 2317 2628 2618 2607
7. Annual profit 136 178 223 233 244
8 Return on investment 25.04 32.78 41.06 42.90 44.93
9. Return on sales 6.36 7.13 7.82 8.17 8.55
10. Annual Contribution 503
11 Break Even Point as percent of capacity
43.77
12 Cash accrual 163 205 250 260 271
13. Debt servicing capacity 207 241 276 276 276
14 Repayment of Composite Loan 62 72 82 82 82
15. Debt serviced 106 108 108 98 87
16 Pay Back Period 1 years 6 month 10 days
17. Debt Service Coverage Ratio (DSCR)
1.53:1
Cash Flow Statement: (Rs. In Thousands) Sl. No.
Description Pre-opera-tive Period
O p e r a t i n g Y e a r s
60% 70% 80% 80%
80%
First Second Third Fourth Fifth
1. Increase in Promoter’s capital
27 NIL NIL NIL NIL NIL
2. Increase in composite loan 380 NIL NIL NIL NIL NIL
3 Increase in Subsidy 136 NIL NIL NIL NIL NIL
4. Depreciation 27 27 27 27 27
5. Profit before interests 180 214 249 249 249
A. TOTAL SOURCES 543 207 241 276 276 276
6. Increase in capital investment
275 NIL NIL NIL NIL NIL
7. Increase in working capital 268 NIL NIL NIL NIL NIL
8. Interests NIL 44 36 26 16 5
9. Repayment of loan NIL 62 72 82 82 82
B. TOTAL DISPOSALS 543 106 108 108 98 87
C. OPENING BALANCE NIL NIL 101 234 402 580
D. NET SURPLUS NIL 101 133 168 178 189
E. CLOSING BALANCE NIL 101 234 402 580 769
Projected Balance sheet: Sl.No. Description Amount in Rs. Thousands as at the end of the
1st Yr. 2nd Yr. 3rd Yr. 4th Yr. 5th Yr.
1. Capital Account of the Promoter 27 163 341 564 797
2. Surplus from operations 136 178 223 233 244
NET WORTH: 163 341 564 797 1041
3. Composite loan 318 246 164 82 nil
4. Subsidy 136 136 136 136 136
A. TOTAL LIABILITIES
617 723 864 1015 1177

99
1. Gross Block 275 275 275 275 275
Less Depreciation 27 54 81 108 135
2 NET BLOCK 248 221 194 167 140
3 Current Assets 268 268 268 268 268
4. Cash & Bank Balance 101 234 402 580 769
B. TOTAL ASSETS
617 723 864 1015 1177
Supplies of Machinery & Equipments : 1. Knit Bone and Fertilizer Co, Jaboyr, UP, 2. Raymond Chemical Mfg Co, Near Oshiwara Bridge, Bombay-62. 3. Spin Tex Products, 463, Ideal Indl, Estate, Lower Parel Bridge, Bombay-13.

100
SCHOOL CHALK
Introduction: Chalk crayons are round and tapered sticks of different colours. Chalks are used for writing on Black Board and making on coloured surfaces. IS: 2694-1963 specify Indian standard for Moulded white school chalks. IS: 4222-1967 specifies Indian standard for Moulded coloured chalks. Market: Chalks have an indispensable role in all educational institutions including Schools, Colleges and Universities. Besides, in informal education like Adult education chalks are required. In Tripura 1849 primary/ Jr. Basic, 1005 Middle/ Sr. Basic, 416 High School, 245 Higher Secondary Schools, 31 colleges and two Universities exist. Besides 3877 Anganwadi centres and 1225 Social Education Centres are using chalk crayon. These educational institutions annually consume about 2, 00,000 boxes of white chalks per annum. Besides, small quantities of coloured chalks are also used. Thus there is good marketing scope for chalk crayon manufacturing units. Installed Capacity: Operating single shift of 8 hours per day for 300 working days per annum the unit will have an installed capacity to produce 90,000 boxes of chalk crayon containing 100 sticks per box. Process of Manufacture: Gypsum is washed, dried and then pulverized in Atta Chakki to a fineness of
100 to 120 meshes. The gypsum powder is calcined powder is calcinations drum at 120C to 130C for half an hour. This calcined Gypsum powder is mixed with china-clay/ ball clay in an enamel bowl. Whitening and colours are also mixed here. Water is added to the mix and vigorously stirred to form homogeneous slurry. Meanwhile moulds are lubricated with lard oil & kerosene in 1:4 proportion. The homogeneous slurry is poured in these moulds so that no air bubble is formed. The slurry is allowed to get set in moulds and excess slurry is manually removed. Chalks are removed from moulds and placed on wooden trays so that no breakage takes place. These trays are kept in shade for natural drying. After chalks are dry enough these are sun-dried. Dry chalks are tested and packed in Cardboard Boxes. Inter-chalk gaps are filled by saw dust or paddy husks. Boxes are then labeled and made ready for sales. Process Flow: Sales Raw Material: Gypsum and China/Ball clay are the principal raw-materials of the unit. Gypsum of Blutan are available from M/s Chamin Eastern, Bonda, Guwahati. Quality Ball Clay is available in Meghalaya Mineval Development Corporation, Laitunkhra, Shillong. This corporation is also selling China Clay. However, Ball clay is a cheaper alternative available in Coal Mines. Cardboard boxes are available in Kolkata. Gypsum and China Clay are also available in Kolkata in Chinabazar and Bawni Market. The annual requirement and cost of Raw Materials at the installed capacity are shown below:
Pulverizing of
Gypsum
Calcination Mixing with
China clay
Making
slurry
Pouring in
Moulds
Removal from
mould
Drying Packing

101
Sl.No. Raw/ Packing Material Quantity Cost
1. Gypsum 34,000 kilograms 2,67,800/-
2. China/ Ball Clay 2,600 kilograms 50,200/-
3. Colours/ whitening agent 100 kilograms 99,000/-
4. Lurd Oil & kerosene 225 Liters 30,000/-
5. Cardboard boxes & Labels 91,000 sets 1,05,000/-
Total: 5,52,000/-
Water: There should be a tube well or water supply tap connection near the unit for arrangement of water. Annual requirement of water is estimated at about 3000 Ltrs. Power: The annual expenditure will be Rs.24,000/- for 13,333 KWHrs of electricity consumed. Manpower: The manpower required by the unit is locally available. The requirement and annual cost of manpower is shown below: Sl.No. Category No of persons Annual Cost 1. Manager 1 Self 2. Skilled worker 3 Rs.1,44,000/- 3. Assistant 2 Rs. 72,000/- Total 6 Total Rs.2,16,000/- Capital Cost Estimate: 1. Land & Building : Covered area 935 sq.M. On Rent 2. Plant & Machinery a) Small Atta Chakki (stone Grinder) with Motor & 60,000/- other accessories b) Calcination Drums with heating stove & pans 15,000/- c) Eleven Numbers of 100 cavity Aluminium moulds 25,000/- d) Platform balance, wooden trays and other hand tools 8,000/- e) Seive of 100 mesh, slurry making enamel bowl, ladle, 5,000/- slurry pouring vessel, etc Rs. 1,13,000/- 3. Miscellaneous Fixed Asset a) Electrification Rs.10,000/- b) Water Installation Rs.10,000/- c) Furniture & Miscellaneous others Rs.30,000/- Rs.50,000/- Total Fixed Costs: Rs.1,63,000/- B. Working Capital :for 3 months
1. Raw materials Rs. 1,38,000/- 2. Power Rs. 6,000/- 3. Wages and salaries Rs. 23,000/- 4. Misc. expenses Rs. 2,500/- Total Working Capital: Rs. 1,69,500/-
Total Project Cost: Rs.3,32,500/-

102
Means of Finance: Urban Rural a. Composite loan under PMEGP 70% Rs.2,32,750/- 60% Rs.1,99,500/- b. Subsidy 25% Rs. 83,125/- 35% Rs.1,16,375/- c. Margin Money 5% Rs. 16,625/- 5% Rs. 16,625/- d. Debt Equity Ratio 2.33:1 1.5:1
Profitability: Sl.No. Description 1st Year 2nd Year 3rd year 4th Year 5th Year
1. Capacity utilized as percent of installed capacity
60 70 80 80 80
2. Annual Sales Rs. 7,22,100 8,42,450 9,62,800 9,62,800 9,62,800
3. Annual Costs in Rs.
(a) Raw Materials 3,31200 386400 441600 441600 441600 (b) Utilities 25200 29400 33600 33600 33600
(c) Selling expenses 3600 4200 4800 4800 4800
4 Variable Cost 360000 420000 480000 480000 480000
(a) Wages & Salaries 129600 151200 172800 172800 172800
(b) Administrative expenses 72000 84000 96000 96000 96000
(c) Depreciation 16300 16300 16300 16300 16300
(d) Interest on Composite Loan 26735 21624 15726 9436 3145
5 Fixed & Semi Variable Cost 244635 273124 300826 294536 288245
6 Total Cost 604635 693124 780826 774536 768245
7. Annual profit 117465 149326 181974 188264 194555
8 Return on investment 35.32 44.91 54.72 56.62 58.57
9. Return on sales 16.26 17.72 18.90 19.55 20.20
10. Annual Contribution 362100 422450 482800 482800 482800 11 Break Even Point as percent of
capacity 40.53
12 Cash accrual 133765 165626 198274 204564 210855
13. Debt servicing capacity 160500 187250 214000 214000 214000 14 Repayment of Composite Loan 37743 44034 50324 50324 50325 15. Debt serviced 54478 65658 66050 59760 53470
16 Pay Back Period 2 yrs 5 month 22 days
17. Debt Service Coverage Ratio (DSCR) 2.48:1
Cash Flow Statement Sl. No.
Description Pre-opera-tive Period
O p e r a t i n g Y e a r s
60% 70% 80% 80%
80%
First Second Third Fourth Fifth
1. Increase in Promoter’s capital
16625 NIL NIL NIL NIL
NIL
2. Increase in composite loan 232750 NIL NIL NIL NIL NIL
3 Increase in Subsidy 83125 NIL NIL NIL NIL NIL
4. Depreciation --- 16300 16300 16300 16300 16300
5. Profit before interests ---- 144200 170950 197700 197700 197700
A. TOTAL SOURCES 332500 330000 187250 214000 214000 214000
6. Increase in capital investment
332500 NIL NIL NIL NIL NIL

103
7. Increase in working capital NIL 169500 NIL NIL NIL NIL
8. Interests NIL 26735 21624 15726 9436 3145
9. Repayment of loan NIL 37743 44034 50324 50324 50325
B. TOTAL DISPOSALS 332500 233978 65658 66050 59760 53470
C. OPENING BALANCE NIL NIL 96022 217614 365564 519804
D. NET SURPLUS NIL 96022 121592 147950 154240 160530
E. CLOSING BALANCE NIL 96022 217614 365564 519804 680334
Projected Balance sheet: Sl.No. Description Amount in Rupees as at the end of the
1st Yr. 2nd Yr. 3rd Yr. 4th Yr. 5th Yr.
1. Capital Account of the Promoter 16625 134090 283416 465390 653654
2 Surplus from operations 117465 149326 181974 188264 194555
NET WORTH: 134090 283416 465390 653654 848209
3. Composite loan 195007 150973 100649 50325 Nil
4. Subsidy 83125 83125 83125 83125 83125
A. TOTAL LIABILITIES 412222 517514 649164 787104 931334
1. Gross Block 163000 163000 163000 163000 163000
Less Depreciation 16300 32600 48900 65200 81500
2 NET BLOCK 146700 130400 114100 97800 81500
3 Current Assets 169500 169500 169500 169500 169500
4. Cash & Bank Balance 96022 217614 365564 519804 680334
B. TOTAL ASSETS 412222 517514 649164 787104 931334
Machinery Suppliers:
1. K.C. Trunk Factory, Fancybazar, Guwahati. 2. Archana Machinery Stores, M.S. Road, Near Alka Hotel, Fancy bazaar, Guwahati-781001. 3. Small Machinery Manufacturing Co., 22, R.C. Kar Road, Shyambazar, Kolkata-700004

104
POTTERY
Introduction: Pottery is a traditional industry. It provided earthenware like Drinking Glass, Cooking pots, earthen plates, Diya (Pradip), Pots for water (Kalash), Pots for storage etc to do traditional villagers. With replacement of earthen fragile utensils by steel, Brass, Plastic, china-clay, etc made utensils these products have lost their market. However, certain earthern products like Diya, Kalash and pot for dahi still have substantial demand. Besides, for Hindu religions functions small quantities of earthern cooking pots, drinking glasses, etc. are still consumed. As such traditional potters are now producing those products of sizeable demand with Images for Hindu festivals. The Khadi & Village Industries Commission in its Training cum Production Centre at Dharamtul in Assam has experimented with some new products with success. Such products include earthen water Filter, Piggybank, Flower, Pots, etc. These and Blue pottery were attempted to be propagated in Tripura through a Khadi & Village Industries Board operated Training cum Production Centre at Teliamurah. This scheme envisages production of these along with some traditional products. Market: Earthen Lamp (Diya/Pradip) is a popular product associated with worship and festivals of Hindus. Its demand peaks just before Diwali festival. Sweetmeat makers make Curd (Dahi) in earthen pots of one liter, 500 milliliter and 250 Milliliter earthen pots. Curd pots demand is steady throughout the year. Earthen water Filter also keeps the filtered water cool. Thus these shall be preferred. Also in seasons Earthen Drinking glasses, plates, pot (kalash) etc. shall be in demand. These may enable a number of pottery units to survive. Installed Capacity: The unit shall operate for single shift of 8 hours per day for 300 working days per annum to have an annual installed capacity to produce the following: 1. Earthen Lamp 60,000 Nos. Worth Rs. 60,000/- 2. Curd-Pots a) 1 Ltr. Capacity 10,500 Nos. Worth Rs. 84,000/- b) 500 ml capacity 19,500 Nos. Worth Rs. 97,500/- c) 250 ml capacity 30,000 Nos. Worth Rs. 1,05,000/- 3. Water Filter 30 Nos. Worth Rs. 2,89,500/- 4. Misc. others 750 Nos. Worth Rs. 26,250/- Process of Manufacture: The Red-burning Plastic clays are weathered and mixed with water allowed to age for about a wook. These clays are then crushed and mixed homogeneously by use of wooden hammer. Wet clay is placed in potters wheel to give the clay shape. The moulded products are carefully collected on wooden plants and allowed to dry in sheds. Then these are dried in Sun again. When these
claywares are dry these are burned in coal fired updraft kiln to 600C to 700C so that partial vitrification takes place and products get a pleasing light red colour. In case of water Filter the two parts are cast in Moulds and dried in shade before burning. After burning the top part in filled with Water-Filter-Candle and placed over the bottom part. Process Flow:
Weathering
of Clay
Mixing
Water
Ageing Pugging Moulding
Drying
Casting
Burning Cooling Finishing Sales

105
Raw Materials: The Clay required for potteryis available in most localities in the State. Clay is dug out and stored in the Pottery Unit site for use as and when required. The unit required Rs. 2,00,000/-p.a. Utilities : The unit will require a total connected load of 200 KVA and a maximum demand of 190 KVA. Water requirement is about 500KL per annum. Water: The water required for the unit per day shall be 100 Liters. Manpower: The unit will provide employment to the following 6 persons and all of whom are locally available. 1 Manager cum Supervisor Self Self 2. Skilled Engineer 4nos Rs.20,000/- 3. Office Boy 1 no Rs. 2,000/- 4. Sales Man 1no Rs. 3,000/- Total Rs.25,000/- Capital Cost Estimate: 1) Land & Building : Covered area 56 sq. Mtrs. On Rent 2) Plant & Machinery a) Two Potters wheel Rs. 35,000/- b) One Up-draft coal fired kiln of 5 diameter Rs. 45,000/- c) Wooden pallets, planks, Misc. hand tools Rs. 55,000/- d) 3 moulds for water filter Rs. 21,000/- Rs.1,56,000/- 3. Miscellaneous Fixed Assets a) Electrification Rs. 17,500/- b) Water Installation Rs. 5,500/- c) Furniture & Miscellaneous others Rs. 55,000/- Rs.75,000/- 4. Provision for contingencies Rs. 2,000/- 5. Preliminary & pre-operative expenses Rs. 2,500/- Total Fixed Capital: Rs.2,35,500/- 6. Working Capital: 1. Salary & Wages Rs. 25,000/- 2. Administrative expenses Rs. 12,424/- 3. Selling expenses Rs. 3,000/- 4. Raw Materials Rs.2,00,000/- 5. Utilities Rs. 3,500/- Total Rs.2,43,924/- Total Cost of the Project : Rs.4,94,424/- Means of Finance Urban Rural a. Composite loan under PMEGP 70% Rs.3,35,597/- 60% Rs.2,87,654/- b. Subsidy 25% Rs.1,19,856/- 35% Rs.1,67,799/- c. Margin Money 5% Rs. 23,971/- 5% Rs. 23,971/-
Total Rs.4,79,424/- Rs. 4,79,424/- d. Debt Equity Ratio 2.33:1 1.50:1

106
Profitability: Sl.No Description 1st Year 2nd Year 3rd year 4th Year 5th Year
1. Capacity utilized as percent of installed capacity
60 70 80 80 80
2. Annual Sales Rs. 19,44,000 22,68,000 25,92,000 25,92,000 25,92,000
3. Annual Costs in Rs.
(a) Raw Materials 14,40,000 16,80,000 19,20,000 19,20,000 19,20,000 (b) Utilities 25,200 29,400 33,600 33,600 33,600
(c) Selling expenses 21,600 25,200 28,800 28,800 28,800
4 Variable Cost 14,86,800 17,34,600 19,82,400 19,82,400 19,82,400
(a) Wages & Salaries 1,80,000 2,10,000 2,40,000 2,40,000 2,40,000
(b) Administrative expenses 89,453 1.04,362 1,19,270 1,19,270 1,19,270
(c) Depreciation 23,550 23,550 23,550 23,550 23,550
(d) Interest on Composite Loan 38,548 31,179 22,675 13,605 4,535
5 Fixed & Semi Variable Cost 3,31,551 3,69,091 4,05,495 3,96,425 3,87,355
6 Total Cost 18,18,351 21,03,691 23,87,895 23,78,825 23,69,755
7. Annual profit 1,25,649 1,64,309 2,04,105 2,13,175 2,22,245
8 Return on investment
9. Return on sales
10. Annual Contribution 4,57,200 5,33,400 6,09,600 6,09,600 6,09,600
11 Break Even Point as percent of capacity
43.51 48.44
12 Cash accrual 1,49,199 1,87,859 2,22,655 2,23,725 2,45,795
13. Debt servicing capacity 1,87,749 2,19,038 2,50,330 2,50,330 2,50,330
14 Repayment of Composite Loan 54,420 63,491 72,562 72,562 72,562
15. Debt serviced 92,968 94,670 95,237 86,167 77,097
16 Pay Back Period 2 years 7 month 6 days
17. Debt Service Coverage Ratio (DSCR) 4.6:1
Cash Flow Statement Sl. No.
Description Pre-opera-tive Period
O p e r a t i n g Y e a r s
60% 70% 80% 80% 80%
First Second Third Fourth Fifth
1. Increase in Promoter’s capital
23,971 NIL NIL NIL NIL NIL
2. Increase in composite loan
3,35,597 NIL NIL NIL NIL NIL
3 Increase in Subsidy 1,19,856 NIL NIL NIL NIL NIL
4. Depreciation 23,550 23,550 23,550 23,550 23,550
5. Profit before interests 1,64,197 1,95,488 2,26,780 2,26,780 2,26,780
A. TOTAL SOURCES 4,79,424 1,87,747 2,19,038 2,50,330 2,50,330 2,50,330
6. Increase in capital investment
2,35,500 NIL NIL NIL NIL NIL
7. Increase in working capital
2,43,924 NIL NIL NIL NIL NIL
8. Interests NIL 38,548 31,179 22,675 13,605 4,535
9. Repayment of loan NIL 54,420 63,491 72,562 72,562 72,562
B. TOTAL DISPOSALS 4,79,424 92,968 94,670 95,237 86,237 77,097
C. OPENING BALANCE NIL NIL 94,779 2,19,147 3,74,240 5,38,403
D. NET SURPLUS NIL 94,779 1,24,368 1,55,093 1,64,163 1,73,233
E. CLOSING BALANCE NIL 94,779 2,19,147 3,74,240 5,38,403 7,71,636

107
Projected Balance sheet:
Sl.No. Description Amount in Rupees as at the end of the
1st Yr. 2nd Yr. 3rd Yr. 4th Yr. 5th Yr.
1. Capital Account of the Promoter
23,971 1,49,620 3,13,929 5,18,034 7,31,209
2. Surplus from operations 1,25,649 1,64,309 2,04,105 2,13,175 2,22,245
NET WORTH: 1,49,620 3,13,929 5,18,034 7,31,209 9,53,454
3. Composite loan 2,81,177 2,17,686 1,45,124 72,562 nil
4. Subsidy 1,19,856 1,19,856 1,19,856 1,19,856 1,19,856
A. TOTAL LIABILITIES 5,50,653 6,51,471 7,83,014 9,23,627 10,73,310
1. Gross Block 2,35,500 2,35,500 2,35,500 2,35,500 2,35,500
Less Depreciation 23,550 47,100 70,650 94,200 117750
2 NET BLOCK 211950 188400 164850 141300 117750
3 Current Assets 243924 243924 243924 243924 243924
4. Cash & Bank Balance 94,779 2,19,147 3,74,240 5,38,403 7,71,636
B. TOTAL ASSETS 5,50,653 6,51,471 7,83,014 9,23,627 10,73,310
Sources of Machinery: 1. KVIC, Tripura State Office, Kamarpukurpar, Agartala 2. Kusum Engineering Co. 25, Swallow Lane, Kolkata 3. Amic Industries Pvt. Ltd. 10, Bt. Road, Kolkata – 700056.

108
SCHOOL BAGS/ RAIINWARE
Introduction : Decorated, coloures, Silky-lustre, light in weight jute and Rexin bags (Both for ladies and school going children) and rain ware are being preferred in the society due to their good appearance, durability and reasonable cost. In modern days packing/ carrying materials are playing a prominent and distinctive role in domestic as well as export fields. The Jute and Rexin rain ware bags are used to carry the precise article of daily use and tea in various quantities. All the machinery and raw material used for manufacturing id such products are available from indigenous sources. Marketing: These items have a very good demand in the domestic market. Much emphasis is given to this Industry to cater to the growing demand of foreign buyers. The products like any other consumer durable have the prospect of attracting wide range of people from all walks of life. With more than cores of population in the country and with the rising standards of living and economic up-liftment of the people from the poverty line, there exists an ever increasing demand of the products both in the internal as well as the external market Monthly Production & Sales : Assuming that the Unit will operate for single shift per day for 25 working days per month the following capacity and sales are estimated: Sl.No Descriptions Rate Qty Total 1. School Bags 85/- 1000 Rs. 85,000/- 2. Design School Bags 125/- 1,000 Rs. 1,25,000/- 3. Children’s Rain ware 100/- 300 Rs. 30,000/- 5. Adult Rain ware 200/- 150 Rs. 30,000/- Total Rs. 2,70,000/- Production Procedure: Components are first cut as per design and then stitched together as per specifications. Raw Materials: The main raw materials required for manufacture of School Bags and Rain ware are Rubber Laminated Jute cloth, Cloth/PVC buckle, nylon bit, Sewing thread, Zip fastener Packing materials, Rexin, Card/ Paste board, Chain, Rivets, still frame, handle, wax, salutation flour, dyes, labels, lock, Jute Cotton cloth, Eyelete, Runner to be sourced from open local markets and out side of Tripura. The above materials cost would be Rs. 2.20 lacks. Utilities: The unit will require a total connected load of 3 KW and Water requirement is about 50KL per annum. Water: Requirement of water mainly for washing and cleaning, Silk Screen print developing etc and drinking purpose. The unit shall avail of the PHE water supply. It can also install its own tube well for the purpose. Manpower: The unit will need to provide employment to the following 7 persons and all man power is available from local area. 1. Manager cum Supervisor Self Self 2. Skilled Workers 4nos Rs.22,500/- 3. Office Boy/Peon 1 no Rs. 2,200/- 4. Sales Man 1no Rs. 3,300/- Total Rs.27,500/-

109
Capital Cost Estimate: Land and Building; 500 Sq. ft of covered area On Rent Plant & Machinery 1. Lock stitch sewing machine 15,000/- 5 Rs. 75,000/- 2. Tape, Scissors, Needles etc 5,000/- 5 sets Rs. 25,000/- 3. Weigning scale 2,000/- 5 sets Rs. 10,000/- 4. Electric Heater 2,000/- 5 nos Rs. 1 0,000/- 5. Screen Printing Machine (Equipments) Rs. 67200/- Total: Rs.1,87,200/- Miscellaneous Fixed Assets : 1. Different types of racks & furniture (Iron make) Rs. 50,000/- 2. Show case one no Rs. 15,000/- 3. Chair, Working Table and Signboard Rs. 10,000/- 4. Fan& Lightings Rs. 7,500/-
Total: Rs. 82,500/- Preliminary & Preoperative Expenses Rs. 4,950/- Fixed Capital: Rs.2,74,650/- Working Capital (P.m) 1. Salary & Wages Rs. 27,500/- 2. Administrative expenses Rs. 13,666- 3. Selling expenses Rs. 3,300/- 4. Raw Materials Rs. 2,20,000/- 5. Utilities Rs. 3,880/- Total: Rs. 2,68,316/-
Total Cost of the Project: Rs. 5,42,966/- Means of Finance: Urban Rural a. Composite loan under PMEGP 70% Rs.3,80,076/- 60% Rs.3,25,780/- b. Subsidy 25% Rs.1,35,742/- 35% Rs.1,90,038/- c. Margin Money 5% Rs. 27,148/- 5% Rs. 27,148/-
Total Rs.5,42,966/- Rs. 5,42,966/- d. Debt Equity Ratio 2.33:1 1.50:1 Profitability: (Rs. In Thousands) Sl.No. Description 1st Year 2nd Year 3rd year 4th Year 5th Year
1. Capacity utilized as percent of installed capacity
60 70 80 80 80
2. Annual Sales Rs. 2,138 2,495 2,851 2,851 2,851
3. Annual Costs in Rs.
(a) Raw Materials 1,584 1,848 2,112 2,112 2,112 (b) Utilities 27 32 37 37 37
(c) Selling expenses 24 28 31 31 31
4 Variable Cost 1,635 1,908 2,180 2,180 2,180
(a) Wages & Salaries 198 231 264 264 264
(b) Administrative expenses 98 115 131 131 131
(c) Depreciation 27 27 27 27 27
(d) Interest on Composite Loan 44 36 26 16 5
5 Fixed & Semi Variable Cost 367 409 448 438 427
Total Cost 2002 2317 2628 2618 2607
7. Annual profit 136 178 223 233 244
8 Return on investment 25.04 32.78 41.06 42.90 44.93

110
9. Return on sales 6.36 7.13 7.82 8.17 8.55
10. Annual Contribution 503
11 Break Even Point as percent of capacity
43.77
12 Cash accrual 163 205 250 260 271
13. Debt servicing capacity 207 241 276 276 276
14 Repayment of Composite Loan 62 72 82 82 82
15. Debt serviced 106 108 108 98 87
16 Pay Back Period 1 years 6 month 10 days
17. Debt Service Coverage Ratio (DSCR)
1.53:1
Cash Flow Statement: (Rs. In Thousands) Sl. No.
Description Pre-operative Period
O p e r a t i n g Y e a r s
60% 70% 80% 80% 80%
First Second Third Fourth Fifth
1. Increase in Promoter’s capital
27 NIL NIL NIL NIL NIL
2. Increase in composite loan 380 NIL NIL NIL NIL NIL
3 Increase in Subsidy 136 NIL NIL NIL NIL NIL
4. Depreciation 27 27 27 27 27
5. Profit before interests 180 214 249 249 249
A. TOTAL SOURCES 543 207 241 276 276 276
6. Increase in capital investment
275 NIL NIL NIL NIL NIL
7. Increase in working capital 268 NIL NIL NIL NIL NIL
8. Interests NIL 44 36 26 16 5
9. Repayment of loan NIL 62 72 82 82 82
B. TOTAL DISPOSALS 543 106 108 108 98 87
C. OPENING BALANCE NIL NIL 101 234 402 580
D. NET SURPLUS NIL 101 133 168 178 189
E. CLOSING BALANCE NIL 101 234 402 580 769
Projected Balance sheet: Sl. No. Description Amount in Rs. Thousands as at the end of the
1st Yr. 2nd Yr. 3rd Yr. 4th Yr. 5th Yr.
1. Capital Account of the Promoter 27 163 341 564 797
2. Surplus from operations 136 178 223 233 244
NET WORTH: 163 341 564 797 1041
3. Composite loan 318 246 164 82 nil
4. Subsidy 136 136 136 136 136
A. TOTAL LIABILITIES 617 723 864 1015 1177 1. Gross Block 275 275 275 275 275
Less Depreciation 27 54 81 108 135
2 NET BLOCK 248 221 194 167 140
3 Current Assets 268 268 268 268 268
4. Cash & Bank Balance 101 234 402 580 769
B. TOTAL ASSETS 617 723 864 1015 1177
Supplies of Machinery & Equipments: 1. M/s Giribala Udyog, Agartala, Tripura, Supplies of Raw Materials: 1. Simantini, Agartala JRMB, Near Apanjan Club, Agartala 2. Bhagabati Udyog, 44, Burtolla Street, Kolkata-700 007.Phone : +(91)-(33)-22731046/22692855,

111
Marble /Granite Cutting, Polishing & Fitting
Introduction: Granite tiles are manufactured from natural granite blocks. They are produced in a variety of colours depending upon the colour of granite block from which they are produced. They have a highly polished surface and are manufactured in different sizes, the common sizes being 300mmx300mmx10mm, 300mmx600mmx12mm, 450mmx450mmx12mm and 600mmx600mmx12mm. Polished granite tile is a decorative building material and is used as substitute for marble. Polished Granite tiles are preferred because of their glossy finish, durability and aesthetic value. In addition to being used as a flooring material, granite is also used for building, gravestones, table tops, craftworks, etc. Marble is a crystalline form of limestone, but commercially any carbonate rock capable of taking a polish is called marble. Marble is an excellent architectural material and is used as a roofing and flooring material in addition of building, hotels, auditoriums etc. Demand: There is a good demand for these burnt clay tiles at present. In certain cases where cement flooring is considered as high investment, clay flooring tiles are ideally suited. The market for these tiles is spread all over the country. The glass flooring tiles are easy to wash and clean. They are brilliant in appearances, attractive and durable. Owing to the rise of standard of living of people, Industrial revolution there is a great market for these tiles. It is also visualized that the demand of these tiles will increase in future. Manufacturing Process; Marbles: It is proposed to process marble slabs into tiles. Sawed marble slabs of required thickness are procured from block sawing units and fed to a polishing machine for grinding and polishing. These are then inspected for surface defects and cut into the desired tile dimensions with the help of an edge cutting machine. Subsequently the tiles are sorted out and packed. Flooring tiles –Granite: It is proposed to process granite slabs into tiles. The manufacturing operations involve: grinding and polishing of sawed granite slabs procured from outside units: edge cutting of the slabs to set the required tile dimensions and inspection of surface defects, imperfections, etc. sorting and packing. Flow Chart: Raw Materials: All the raw materials are available indigenously. The annual requirement of main raw materials for the manufacturer of 20,000 sq ft each granite tiles and marble tiles per annum at 100% capacity utilization is estimated as follows a. Roofing/ flooring tiles-marble 1. Marble slabs 2. Grinding and polishing material b. Flooring tiles-granite 1. Granite slabs 2. Consumables like polishing abrasives as required.
Collect Raw
materials
(Stone)
Polishing
for
Grinding
Cutting Inspections
for
defective
product
Sorting Packing Ready for
Sale

112
The above materials cost would be Rs. 45,00,000/- and above machinery collected from Silica on Traders, 115 Sabita Bagh, Allahabad, and D.K. Trivedi & Sons, Gandhi Nagar, Abu Road. Power: Power requirement for the unit is only for administration and production and generator is only use for office and also requirement oil, lubricants for machine. The amount required for this purpose Rs.20,384/- per month. Water: The Unit will need 1000 liters of water per day. It is available from both ground water sources and public supply. Manpower: The unit will provide employment to 9 persons, all of whom are readily available in Tripura. The requirement and annual costs of manpower at the installed capacity is shown below:
Sl.No. Category of Manpower No. of persons Annual Costs
1 Manager 1 Rs. 92,400
2 Office Assistants 2 Rs, 1,05,600
3. Skilled Worker 2 Rs. 1,32,000
4. Unskilled Workers 4 Rs. 1,32,000
Total 9 Rs. 4,62,000
CAPITAL COST ESTIMATE 1. Land & Building with a covered area of 500 Sq. Mtrs. On rent 2. Plant & Machinery (a) Flooring/Roofing tiles –Marble: Rs.4,32,000/- 1. Grinding and Polishing machines with 3HP motor 2. Edge cutting machine with 7.5HP motor 3. Overhead water tank 500 ltrs cap with pump machine 4. Misc tools and fixtures (b) Flooring tiles-Granite : Rs.3,90,000/-
1. Grinding and polishing machines 2. Cross cutter with disc motor 3. chamfering/ finishing machine
(c) Installation Rs. 18,000/- (d) Freight, Taxes, etc. on above Rs. 1,20,000/- Rs. 9,60,000/- 3. Miscellaneous Fixed Assets (a) Electrification Rs. 1,10,000/- (b) Water Installation Rs. 27,500/- (c) Furniture & Miscellaneous others Rs. 82,500/- Total : Rs. 2,20,000/- 4. Provision for c contingencies Rs. 55,000/- 5. Preliminary & Pre-operative expenses Rs. 1,37,500/- Total fixed Costs: Rs.13,72,500/ 6. Working Capital: (a) Raw Materials for 1 months Rs. 4,12,500/- (b) Utilities for 1 month Rs. 1,698/- (c) Wages & Salaries for 1 Month Rs. 38,500/- (d) Other expenses for 1 month Rs. 98,402/- Total Working Capital: Rs. 5,51,100/- TOTAL PROJECT COST: Rs.19,23,600/-

113
Means of finance: URBAN RURAL 1. Composite Loan: Rs. 13,46,520 Rs.11,54,160 2. Subsidy: Rs. 4,80,900 Rs. 6,73,260 3. Promoters’ Contribution: Rs. 96,180 Rs. 96,180 4. Debt. Equity Ratio: 2.33:1 1.50:1 Profitability: (Rs. in Thousands)
Sl. No.
Description 1st Yr. 2nd Yr. 3rd Yr. 4th Yr. 5th Yr.
1. Capacity Utilized 60% 70% 80% 80% 80%
2. Annual sales Realization 4782 5579 6376 6376 6376
3. Annual Costs
(a) Raw Materials 2970 3465 3960 3960 3960
(b) Power 15 18 21 21 21
(c) Wages & Salaries 429 451 462 474 486
(d) Repair & Maintenance 53 53 53 53 53
(e) Administrative overheads 132 139 145 153 161
(f) Selling expenses 712 837 956 956 956
(g) Depreciation 132 132 132 132 132
(h) Interest on Composite Loan 150 122 89 54 22
Total Cost 4593 5217 6818 5803 5791
Variable Costs 3697 4320 4937 4937 4937
4. Annual Profit 189 362 558 573 585
5. Return on Investment 982 18.82 29.01 28.79 30.42
6. Return on sales 3.95 6.48 8.75 8.98 9.17
7. Annual Contribution 1085 - - - -
8. Break Even Point 49.54 - - - -
9. Cash Accrual 321 494 690 705 717
10. Debt Servicing Capacity 471 616 779 759 739
11. Repayment of Loan 218 255 291 291 292
12. Debt Serviced 364 377 380 345 313
13. Pay Back Period 1 Years 2 months 11 days
14. Debt Service Coverage Ratio 1:28:1
Cash Flow Statement: (Rs. in thousands)
Sl. No.
Description Pre-ope- rative Period
O p e r a t I n g Y e a r s
1st 2nd 3rd 4th 5th
1. Increase in promoter’s capital 96 - - - - -
2. Increase in subsidy 480 - - - - -
3. Increase in Composite Loan 1346 - - - - -
4. Depreciation - 132 132 132 132 132
5. Profit before interests - 339 489 647 627 607
A. Total Sources 1923 471 616 779 759 739
6. Increase in capital investments 1372 - - - - -
7. Increase in Working Capital 551 - - - - -
8. Interests - 150 122 89 54 22
9. Repayment of Loan - 218 255 291 291 292

114
B. Total Disposals 1923 368 377 380 345 314
C. Opening Balance - - 103 342 741 1155
D. Net Surplus - 103 239 399 414 425
E. Closing Balance - 103 342 741 1155 1580
Projected Balance Sheets (Rs. in thousand)
Sl. No.
Description Amount as at the end of the
1st Yr. 2nd Yr. 3rd Yr. 4th Yr. 5th Yr.
1. Capital Account of the promoters 96 285 647 1205 1778
2. Surplus from operation 189 362 558 573 585
NET WORTH 285 647 1205 1778 2363
3. Subsidy 480 480 480 480 480
Composite Loan 1129 874 583 292 -
A. Total Liabilities 1894 2001 2268 2550 2843
1. Gross Fixed Assets 1372 1372 1372 1372 1372
Less Depreciation 132 264 396 528 660
NET BLOCK 1240 1108 976 844 712
2. Current Assets/W/C 551 551 551 551 551
3. Cash & Bank Balance 103 342 741 1155 1580
B. Total Assets 1894 2001 2268 2550 2843
Address for Plant & Machinery: 1. Kanaiya Lal Ghatiwala, Partania Ka Mandir, Johari Baxar, Jaipur, 2. Raj Kamal Silica Works, PO Shankergarh, Distt Allahabad. 3.Premnath Engineering Works, B-4 (G.I.), Industrial Area, Wazirpur, 91-11-27372684

115
RUBBER STAMP
Introduction: The word "stamp," as used in historical documents, is not particularly explanatory. Neither is its cousin phrase "hand stamp." Early historical references to either can easily be mistaken for references to rubber stamps though this is not always correct. The small, round vulcanizer called "dental pot" vulcanizer was used to manufacture the first rubber stamps. A rubber stamp used to be something that people would only use for putting their return address label on an envelope. But now they are being used for all kinds of applications, both for business and arts and crafts. We’ve had different kinds of stamps come online over the years, including signature stamps, holiday stamps, thank you stamps, and other custom messaging. Truly the customers are limited only by their imagination. But overall the trend has been that more and more customers are willing to design and customize their own stamps, for whatever their needs, and use them more frequently. It’s definitely become a very popular option on a number of levels. The ease of getting stamps has also increased, so people are more apt to use them as an option. What was once a very standard, rigid product has become much more personal.
Market Potential: Rubber stamps have become popular over the last few years. Previously, rubber stamps were used for business purposes only. Today rubber stamps are used extensively for crafts. Nowadays, one can create all sorts of designs by using rubber stamps. For this purpose, rubber stamps carved with different designs is essential, as well as ink pad that is used to transfer the designs from these rubber stamps onto a medium like pieces of cloth, paper, or card. Decorative rubber stamps, also called art stamps, are used extensively in homemade craft projects. Art stamps can be used to decorate scrapbooks or to add color and variety to photo albums. Art stamps are also used on letters, greetings cards, birthday and Christmas cards, banners and flyers to give a personalized touch. Art stamps can also be used to decorate notebooks, stationery and holiday wrapping paper. Art rubber stamps can be painted with fabric paint to create a decorative border design on a piece of fabric or an existing garment. The paint used should blend nicely with the fabric to give a personal touch to items such as T-Shirts, tablecloths and napkins. Since rubber stamps can also be used on hard surfaces like wood or metal, hard items such as trunks, jewelry boxes and picture frames can also be decorated with rubber stamps. One can create elegant decorative borders, decorate a child's room, or design walls and ceilings with rubber stamps. Pocket stamp, Rubber hand stamp, Wood rubber stamp, Dater stamps, Magnetic rubber stamp, Self inking stamp, Pre inked rubber stamp, Number rubber stamps, Mini stamp set, Stamp pad, Rubber stamp pad, Handy stamp, Custom rubber stamp, Toy stamp, Craft stamp, etc is the product range of Rubber Stamp. Production Target: Assuming that the Unit will operate for Single Shift of 8 hours per day for 300 working days the annual installed capacity is estimated 30,000 nos. and estimated sales value will be Rs.32,40,000/- Manufacturing Process: After a rubber stamp design is selected for manufacture, a drawing of the design is photographed, and multiple copies of the image are transferred to an aluminum plate. The plate is then bathed in acid that eats away the exposed metal so the design is etched or raised above the plate. The engraved plate (a positive image) is placed on a sheet of Bakelite, a registered brand of resins and plastics that can be used to produce finely detailed molds, in the rubber stamp press or vulcanizer. Under heat and pressure in the vulcanizer, the engraved plate leaves a negative mold in the resin sheet. A sheet of rubber is then laid over the Bakelite mold, and both are heated in a vulcanizer to produce the final positive image in rubber. Typically, a sheet of rubber stamps is subjected to 900 lb (408.6 kg) per square inch of pressure for about 3 minutes to complete vulcanization. The mold or rubber sheet is then removed
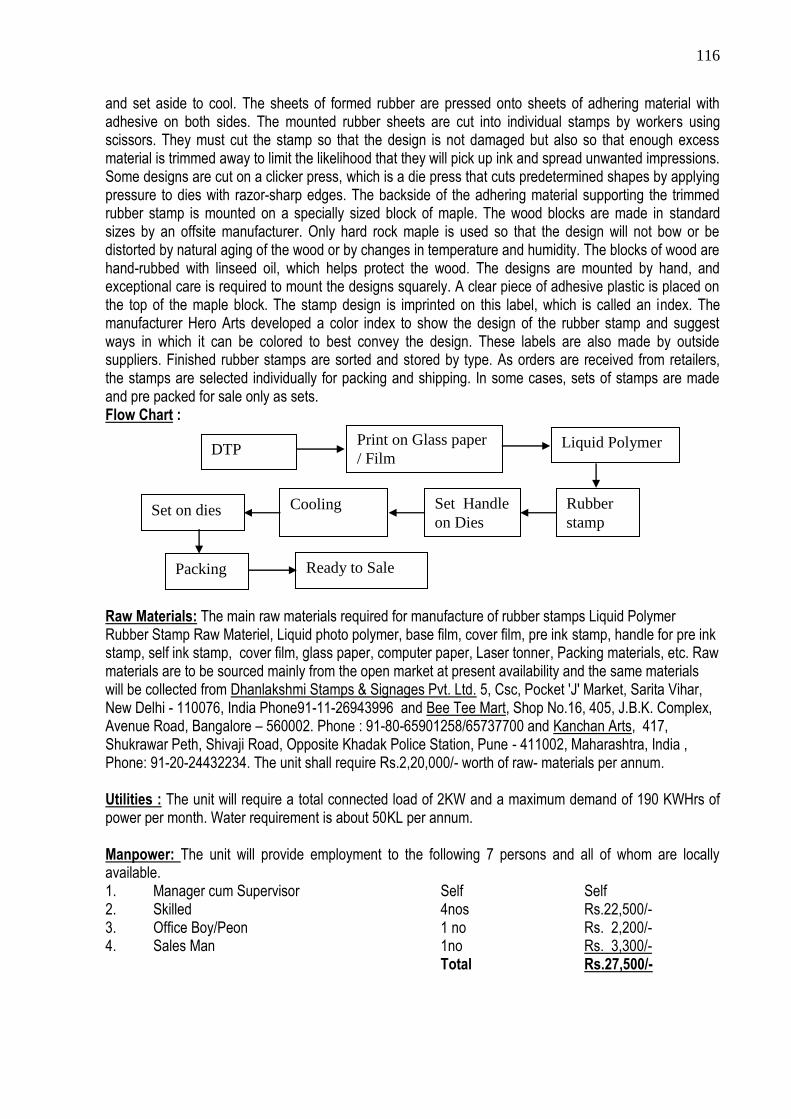
116
and set aside to cool. The sheets of formed rubber are pressed onto sheets of adhering material with adhesive on both sides. The mounted rubber sheets are cut into individual stamps by workers using scissors. They must cut the stamp so that the design is not damaged but also so that enough excess material is trimmed away to limit the likelihood that they will pick up ink and spread unwanted impressions. Some designs are cut on a clicker press, which is a die press that cuts predetermined shapes by applying pressure to dies with razor-sharp edges. The backside of the adhering material supporting the trimmed rubber stamp is mounted on a specially sized block of maple. The wood blocks are made in standard sizes by an offsite manufacturer. Only hard rock maple is used so that the design will not bow or be distorted by natural aging of the wood or by changes in temperature and humidity. The blocks of wood are hand-rubbed with linseed oil, which helps protect the wood. The designs are mounted by hand, and exceptional care is required to mount the designs squarely. A clear piece of adhesive plastic is placed on the top of the maple block. The stamp design is imprinted on this label, which is called an index. The manufacturer Hero Arts developed a color index to show the design of the rubber stamp and suggest ways in which it can be colored to best convey the design. These labels are also made by outside suppliers. Finished rubber stamps are sorted and stored by type. As orders are received from retailers, the stamps are selected individually for packing and shipping. In some cases, sets of stamps are made and pre packed for sale only as sets. Flow Chart : Raw Materials: The main raw materials required for manufacture of rubber stamps Liquid Polymer Rubber Stamp Raw Materiel, Liquid photo polymer, base film, cover film, pre ink stamp, handle for pre ink stamp, self ink stamp, cover film, glass paper, computer paper, Laser tonner, Packing materials, etc. Raw materials are to be sourced mainly from the open market at present availability and the same materials will be collected from Dhanlakshmi Stamps & Signages Pvt. Ltd. 5, Csc, Pocket 'J' Market, Sarita Vihar, New Delhi - 110076, India Phone91-11-26943996 and Bee Tee Mart, Shop No.16, 405, J.B.K. Complex, Avenue Road, Bangalore – 560002. Phone : 91-80-65901258/65737700 and Kanchan Arts, 417, Shukrawar Peth, Shivaji Road, Opposite Khadak Police Station, Pune - 411002, Maharashtra, India , Phone: 91-20-24432234. The unit shall require Rs.2,20,000/- worth of raw- materials per annum. Utilities : The unit will require a total connected load of 2KW and a maximum demand of 190 KWHrs of power per month. Water requirement is about 50KL per annum. Manpower: The unit will provide employment to the following 7 persons and all of whom are locally available. 1. Manager cum Supervisor Self Self 2. Skilled 4nos Rs.22,500/- 3. Office Boy/Peon 1 no Rs. 2,200/- 4. Sales Man 1no Rs. 3,300/- Total Rs.27,500/-
DTP Print on Glass paper
/ Film Liquid Polymer
Rubber
stamp
Set Handle
on Dies
Cooling Set on dies
Packing Ready to Sale

117
CAPITAL COST ESTIMATE: Land and Building: 1000Sq. ft. On Rent Plant & Machinery ; 1. A4 FL Photopolymer Plate Making Rs. 47,000/- 2. A4 LR Liquid Resin Stamp Making Rs. 38,000/- 3. A4 FB Flexobag Stamp Making Rs. 47,000/- 4. A4 LT Rubber Stamp Making Machine Rs. 19,000/- (Model LY340 and DC-K40 laser) 5. Desktiop Computer with laser printer & UPS Rs. 36,200/- Rs.1,87,200/- Miscellaneous Fixed Assets: 1. Chair & Working Table Rs. 35,500/- 2. Fan & Lighting and wiring Rs. 12,000/- 3. Interior decoration Rs. 35,000/- Total Rs. 82,500/- Preliminary & Preoperative Exp.: Rs. 4,950/- Total Fixed Capital: Rs.2,74,650/- Working Capital (P.m) 1. Salary & Wages Rs. 27,500/- 2. Administrative expenses Rs. 13,666- 3. Selling expenses Rs. 3,300/- 4. Raw Materials Rs.2,20,000/- 5. Utilities Rs. 3,880/- Total Rs.2,68,316/-
Total Cost of the Project:Rs.5,42,966/- Means of Finance: Urban Rural a. Composite loan under PMEGP 70% Rs.3,80,076/- 60% Rs.3,25,780/- b. Subsidy 25% Rs.1,35,742/- 35% Rs.1,90,038/- c. Margin Money 5% Rs. 27,148/- 5% Rs. 27,148/-
Total Rs.5,42,966/- Rs.5,42,966/- d. Debt Equity Ratio 2.33:1 1.50:1 Profitability: (Rs. In Thousands) Sl.No. Description 1st Year 2nd Year 3rd year 4th Year 5th Year
1. Capacity utilized as percent of installed capacity
60 70 80 80 80
2. Annual Sales 2,138 2,495 2,851 2,851 2,851
3. Annual Costs
(a) Raw Materials 1,58 1,848 2,112 2,112 2,112 (b) Utilities 27 32 37 37 37
(c) Selling expenses 24 28 31 31 31
4 Variable Cost 1,635 1,908 2,180 2,180 2,180
(a) Wages & Salaries 198 231 264 264 264
(b) Administrative expenses 98 115 131 131 131
(c) Depreciation 27 27 27 27 27
(d) Interest on Composite Loan 44 36 26 16 5
5 Fixed & Semi Variable Cost 367 409 448 438 427
Total Cost 2002 2317 2628 2618 2607
7. Annual profit 136 178 223 233 244
8 Return on investment 25.04 32.78 41.06 42.90 44.93

118
9. Return on sales 6.36 7.13 7.82 8.17 8.55
10. Annual Contribution 503
11 Break Even Point as percent of capacity
43.77
12 Cash accrual 163 205 250 260 271
13. Debt servicing capacity 207 241 276 276 276
14 Repayment of Composite Loan 62 72 82 82 82
15. Debt serviced 106 108 108 98 87
16 Pay Back Period 1 years 6 month 10 days
17. Debt Service Coverage Ratio (DSCR)
1.53:1
Cash Flow Statement: (Rs. In Thousands) Sl. No.
Description Pre-operative Period
O p e r a t i n g Y e a r s
60% 70% 80% 80% 80%
First Second Third Fourth Fifth
1. Increase in Promoter’s capital 27 NIL NIL NIL Nil NIL
2. Increase in composite loan 380 NIL NIL NIL NIL NIL
3 Increase in Subsidy 136 NIL NIL NIL NIL NIL
4. Depreciation 27 27 27 27 27
5. Profit before interests 180 214 249 249 249
A. TOTAL SOURCES 543 207 241 276 276 276
6. Increase in capital investment 275 NIL NIL NIL NIL NIL
7. Increase in working capital 268 NIL NIL NIL NIL NIL
8. Interests NIL 44 36 26 16 5
9. Repayment of loan NIL 62 72 82 82 82
B. TOTAL DISPOSALS 543 106 108 108 98 87
C. OPENING BALANCE NIL NIL 101 234 402 580
D. NET SURPLUS NIL 101 133 168 178 189
E. CLOSING BALANCE NIL 101 234 402 580 769
Projected Balance sheet: Sl.No. Description Amount in Rs Thousands as at the end of the
1st Yr. 2nd Yr. 3rd Yr. 4th Yr. 5th Yr.
1. Capital Account of the Promoter 27 163 341 564 797
2. Surplus from operations 136 178 223 233 244
NET WORTH: 163 341 564 797 1041
3. Composite loan 318 246 164 82 nil
4. Subsidy 136 136 136 136 136
A. TOTAL LIABILITIES 617 723 864 1015 1177 1. Gross Block 275 275 275 275 275
Less Depreciation 27 54 81 108 135
2 NET BLOCK 248 221 194 167 140
3 Current Assets 268 268 268 268 268
4. Cash & Bank Balance 101 234 402 580 769
B. TOTAL ASSETS 617 723 864 1015 1177
Supplies of Machinery & Equipments : Addprint India Enterprises Private Limited, 40-42, 2nd Floor, Image House, Manohardas Street, 1st Cross-lane of Bora Bazar, Fort, Mumbai- 400 001. Niral Business Institute, 230, Gala Complex, 2nd Floor, Gala Industrial Estate, Dumping Road, Mulund(West), Mumbai, Maharashtra, India, 400 080.

119
PAPER NAPKIN, TOILET ROLL, TISSUE PAPER, ETC
Introduction: Paper napkins, toilet roll and tissues are physical form of the basic material paper and fall in the category of light weight sanitary tissues. Paper napkins have become increasingly popular with the catering industry due to its manifold usages and special qualities. These include high absorption, hygienic and lightweight characteristics. Facial tissue paper through recently introduced in the India market has fast become popular due to its lightness, absorbent and hygienic characteristics. Disposable nature oh these paper products further adds to their popular appeal. As these napkins and facial tissues can be printed in attractive colours bearing the name and insignia of concerns, they are widely used by almost all the big hotels, restaurants, cinema houses etc. Market Potential: Paper napkin, toilet and tissue paper are wide usage in hotels, restaurants, cinema houses and homes. With the government s increased emphasis for popularizing tourism, a number of new hotels, tourist resorts, holiday homes etc. are fast coming up the country. This is bound to increase the demands for paper conversion products like toilet paper rolls sheet etc. Installed Capacity: The minimum economic capacity of t a unit producing paper napkin, toilet paper and tissue paper 600MT per annum based on a single shift operation, for 300 operating days working schedule in a year. Process of Manufacture: Paper napkins including tissue and Tissues. Tissue paper rolls are fed to the two colour flexographic printing, where the printing, the paper is cut as per the required size with the help of an attachment provided in the printing machine. The machine process of imparting softness, strength and smoothness to the paper. This is achieved by passing the tissue through a nip formed between a brush roll and pattened backing roll. Toilet paper rolls are slitted on a roll making machine and rewound on the paper or wooden core to the required sizes. These are then packed in numbers as desired. Raw Materials: All the raw materials including a. Paper napkins including tissue napkins, paper cartons, Cores, Inks, Thinners, Tissue paper packing materials etc. are available indigenously. The above raw materials are to be sourced mainly from the open market. At present availability and supply of the raw materials is not a problem and Annual Cost will be Rs. 45,08,000/=. and also the same materials to be collect from Birla Hi Tech Machines, 92 DSIDC Shed Scheme - 1, Okhla Industrial Area, Phase II, New Delhi - 110 020 (India), Phone : +(91)-(11)-26389665 / 26220875, Mobile : +(91)-9811019798. Power: Power requirement for the unit per month is 4,971 KWHrs. costing Rs.20,384/- per month. Water: The Unit will need 500 liters of water per day out of which 4000 Liters. It is available from both ground water sources and public supply. Manpower: The unit will provide employment to 9 persons, all of whom are readily available in Tripura. The requirement and annual costs of manpower at the installed capacity is shown below:
Sl.No. Category of Manpower No. of persons Annual Costs
1 Manager 1 Rs. 92,400
2 Office Assistants 2 Rs, 1,05,600
3. Skilled Worker 2 Rs. 1,32,000
4. Unskilled Workers 4 Rs. 1,32,000
Total 9 Rs. 4,62,000
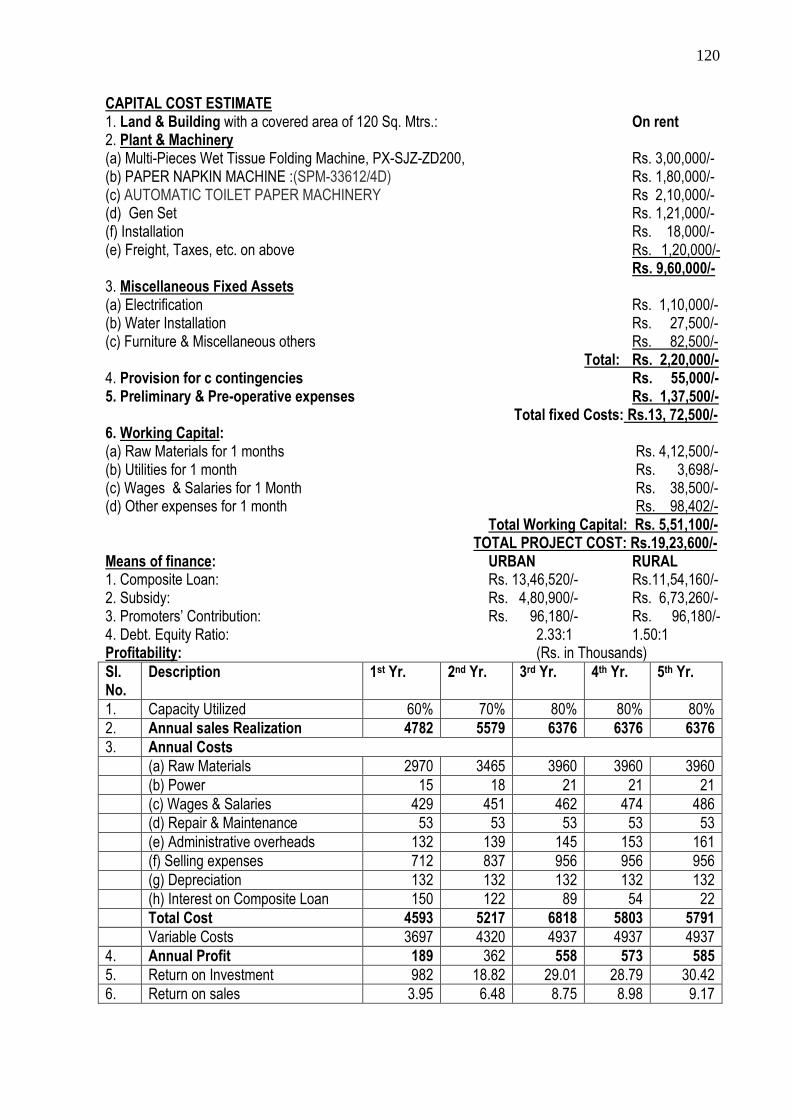
120
CAPITAL COST ESTIMATE 1. Land & Building with a covered area of 120 Sq. Mtrs.: On rent 2. Plant & Machinery (a) Multi-Pieces Wet Tissue Folding Machine, PX-SJZ-ZD200, Rs. 3,00,000/- (b) PAPER NAPKIN MACHINE :(SPM-33612/4D) Rs. 1,80,000/- (c) AUTOMATIC TOILET PAPER MACHINERY Rs 2,10,000/- (d) Gen Set Rs. 1,21,000/- (f) Installation Rs. 18,000/- (e) Freight, Taxes, etc. on above Rs. 1,20,000/- Rs. 9,60,000/- 3. Miscellaneous Fixed Assets (a) Electrification Rs. 1,10,000/- (b) Water Installation Rs. 27,500/- (c) Furniture & Miscellaneous others Rs. 82,500/- Total: Rs. 2,20,000/- 4. Provision for c contingencies Rs. 55,000/- 5. Preliminary & Pre-operative expenses Rs. 1,37,500/- Total fixed Costs: Rs.13, 72,500/- 6. Working Capital: (a) Raw Materials for 1 months Rs. 4,12,500/- (b) Utilities for 1 month Rs. 3,698/- (c) Wages & Salaries for 1 Month Rs. 38,500/- (d) Other expenses for 1 month Rs. 98,402/- Total Working Capital: Rs. 5,51,100/- TOTAL PROJECT COST: Rs.19,23,600/- Means of finance: URBAN RURAL 1. Composite Loan: Rs. 13,46,520/- Rs.11,54,160/- 2. Subsidy: Rs. 4,80,900/- Rs. 6,73,260/- 3. Promoters’ Contribution: Rs. 96,180/- Rs. 96,180/- 4. Debt. Equity Ratio: 2.33:1 1.50:1 Profitability: (Rs. in Thousands)
Sl. No.
Description 1st Yr. 2nd Yr. 3rd Yr. 4th Yr. 5th Yr.
1. Capacity Utilized 60% 70% 80% 80% 80%
2. Annual sales Realization 4782 5579 6376 6376 6376
3. Annual Costs
(a) Raw Materials 2970 3465 3960 3960 3960
(b) Power 15 18 21 21 21
(c) Wages & Salaries 429 451 462 474 486
(d) Repair & Maintenance 53 53 53 53 53
(e) Administrative overheads 132 139 145 153 161
(f) Selling expenses 712 837 956 956 956
(g) Depreciation 132 132 132 132 132
(h) Interest on Composite Loan 150 122 89 54 22
Total Cost 4593 5217 6818 5803 5791
Variable Costs 3697 4320 4937 4937 4937
4. Annual Profit 189 362 558 573 585
5. Return on Investment 982 18.82 29.01 28.79 30.42
6. Return on sales 3.95 6.48 8.75 8.98 9.17

121
7. Annual Contribution 1085 - - - -
8. Break Even Point 49.54 - - - -
9. Cash Accrual 321 494 690 705 717
10. Debt Servicing Capacity 471 616 779 759 739
11. Repayment of Loan 218 255 291 291 292
12. Debt Serviced 364 377 380 345 313
13. Pay Back Period 1 Years 2 months 11 days
14. Debt Service Coverage Ratio 1:28:1
Cash Flow Statement: (Rs. in thousands) Sl. No.
Description Pre-operative Period
O p e r a t I n g Y e a r s
1st 2nd 3rd 4th 5th
1. Increase in promoter’s capital 96 - - - - -
2. Increase in subsidy 480 - - - - -
3. Increase in Composite Loan 1346 - - - - -
4. Depreciation - 132 132 132 132 132
5. Profit before interests - 339 489 647 627 607
A. Total Sources 1923 471 616 779 759 739
6. Increase in capital investments 1372 - - - - -
7. Increase in Working Capital 551 - - - - -
8. Interests - 150 122 89 54 22
9. Repayment of Loan - 218 255 291 291 292
B. Total Disposals 1923 368 377 380 345 314
C. Opening Balance - - 103 342 741 1155
D. Net Surplus - 103 239 399 414 425
E. Closing Balance - 103 342 741 1155 1580
Projected Balance Sheets (Rs. in thousand) Sl. No.
Description Amount as at the end of the
1st Yr. 2nd Yr. 3rd Yr. 4th Yr. 5th Yr.
1. Capital Account of the promoters 96 285 647 1205 1778
2. Surplus from operation 189 362 558 573 585
NET WORTH 285 647 1205 1778 2363
3. Subsidy 480 480 480 480 480
Composite Loan 1129 874 583 292 -
A. Total Liabilities 1894 2001 2268 2550 2843
1. Gross Fixed Assets 1372 1372 1372 1372 1372
Less Depreciation 132 264 396 528 660
NET BLOCK 1240 1108 976 844 712
2. Current Assets/W/C 551 551 551 551 551
3. Cash & Bank Balance 103 342 741 1155 1580
B. Total Assets 1894 2001 2268 2550 2843
Suppliers Address: 1. PEIXIN INTERANTIONAL GROUP FUJIAN PEIXIN MACHINERY MAKING INDUSTRIAL CO. LTD. Shuangyang Overseas Chinese Economic-Develop Area, Luojiang, Quanzhou, Fujian , P.C: 362000, Tel: (86)-(0595)22458888/ 22456588
/22456988/22456782,Fax: (86)-(0595)22456781,Website: www.peixin.com,E-mail: [email protected] 2. Mr. Ashwani Birla, Birla Hi Tech Machines, 92 DSIDC Shed Scheme - 1, Okhla Industrial Area, Phase- II, New Delhi-110 020 (India) Phone : +(91)-(11)-26389665 / 26220875, Mobile : +(91)-9811019798

122
DECORATIVE GLASS WARE/GLASS TOYS
Introduction: Glass toys and biological birds, animals and model sets are decorative articles made out of glass tubes either transparent or colored. These can very well be produced in small scale sector only with the help of a few equipment and little techniques. They are used for the decoration purpose of displaying in all the houses, throughout the world. There is good prospect of the self employment in this industry as the capita investment for this industry is proportionately low. Market Potential: Decorative Glassware and toys and hollow biological birds, animals and models have get good demand in the market and the taste for this item is increasing with medium and affluent class of people. Process of Manufacture: Soda and amber glass tubes of different sizes and colours should be used for different types of toys. The glass tubes are softened over the burner flame of petrol gas blow drawn and bent so as to get the desired shape to the legs, body, feat, hands and so on and so forth. The parts are attached by lowing process. Available charts of animals and birds in the market can also serve as guide. Articles made out of glass tubes are more attractive and valuable, if they are silvered. Production Target: Assuming that the Unit will operate for Single Shift of 8 hours per day for 300 working days the annual installed capacity is estimated 60,000 nos of hollow glass toys per annum is envisaged in this project and estimated sales value will be Rs.3,60,000/- Raw Materials: The main raw materials required for manufacture of Decorative Glassware/ Glass Toys are Soda glass tube clear, amber glass tubes, other colored tubes and rods and chemical for silvering, packing materials, cardboards etc. to be sourced from open local markets and out side of Tripura.
Sl.No. Details Cost (in Rs.)
1. Additional parts (for replacements) 10,000/-
2. Soldering wire, soldering paste 2,000/-
3. others 2,500/-
Total: 14,500/-
Power: The power is available from the state Electric supply corporation Grid. The annual consumption of power is estimated at 1390 KWHrs costing Rs. 5,700/- Water: The unit will need 500 liters of clean and soft water per day. It is available from both ground water sources and public supply. Manpower: In the unit, is required a good technician whose remuneration would be Rs. 5,000/- per month. CAPITAL COST ESTIMATE 1. Land & Building with a covered area of 120 Sq. Mtrs.: On Rent 2. Plant & Machinery (a) Petrol gas plant – direct blow Rs.1,00,500/- (b) oxygen regulators & 1 cylinder (c) Blowing work benches & stools etc (d) Burners (f) Racks, beakers, conical flasks, measuring cylinder for silvering work,

123
(g) Cost of office equipments & other installation charges 3. Miscellaneous Fixed Assets (a) Electrification Rs. 3,000/- (b) Furniture & Miscellaneous others Rs. 15,000/- Total: Rs. 18,000/- 4. Provision for contingencies 5. Preliminary & Pre-operative expenses Rs. 2,500/- Total fixed Costs: Rs. 20,500/- Total Fixed Investment Rs. 1,21,000/ 6. Working Capital (P.M.) a) Raw Material Rs. 14,500/- b) Utilities Rs. 500/- c) Salary & Wages Rs. 5,000/- d) Other expenses Rs. 10,000/- Total: Rs 30,000/- Total working capital for 3 months: Rs. 90,000/- Total Project Cost: Rs. 2,11,000/- Means of Finance: Urban Rural 1. Composite loan 1,47,700/- 1,26,600/- 2. Promoter’s contribution 10,550/- 10,550/- 3. Subsidy 52,750/- 73,850/- 4. Debt equity ratio 2.33:1 1.50:1 Profitability:
Sl.No. Description 1st year 2nd year 3rd year 4th year 5th year 1. Capacity utilized 60% 70% 80% 80% 80%
2. Annual Sales Realization in Rs. 3,30,00 3,85,000 4,40,000 4,40,000 4,40,000
3. Annual Costs in Rs.
a) Raw Materials 1,04,400 1,21,800 1,39,200 1,39,200 1,39,200
b) Utilities 3,600 4,200 4,800 4,800 4,800
c) Selling expenses 22,000 25,700 29,000 29,000 29,000
Variable Cost 1,30,000 1,51,700 1,73,000 1,73,000 1,73,000
d) Wages & Salaries 36,000 42,000 48,000 48,000 48,000
e) Administrative expenses 72,000 84,000 96,000 96,000 96,000
f) Depreciation 12,100 12,100 12,100 12,100 12,100
g) Interest on Composite Loan 16,966 13,722 9,980 5,988 1,996
4. Total Cost 2,67,066 3,03,522 3,39,080 3,35,088 3,31,096
5. Annual Profit 62,934 81,478 1,00,920 1,04,912 1,08,904
6. Return on Investment 29.82% 38.61% 47.82% 49.72% 51.61%
7. Return on sales 11.44% 14.81% 18.34% 19.07% 19.80%
8. Annual contribution 2,00,000/- - - - -
9. Break Even Point 41.11%
10. Cash accrual 75,034 93,578 1,13,020 1,17,012 1,21,004
11. Debt Servicing Capacity 92,000 1,07,300 1,23,000 1,23,000 1,23,000
12. Repayment of Composite Loan 23,951 27,943 31,935 31,935 31,936
13. Debt Serviced 40,917 41,665 41,915 37,923 33,931
14. Pay Back Period 2 year 2 months 26 days
15. Debt Service Coverage Ratio 2.25:1

124
Cash Flow Statement
Sl. No.
Description Pre-ope-rative Period
O p e r a t I n g Y e a r s
First Second Third Fourth Fifth
1. Increase in Promoter’s contribution
10,550 - - - - -
2. Increase in Term loan 1,47,700 90,000 - - - -
3. Subsidy 52,750 - - - - -
4. Depreciation - 12,100 12,100 12,100 12,100 12,100
5. Profit before interests - 79,900 95,200 1,10,900 1,10,900 1,10,900
A. TOTAL SOURCES 2,11,000 1,82,000 1,07,300 1,23,000 1,23,000 1,23,000
6. Increase in capital investment 2,11,000 - - - - -
7. Increase in working capital - 90,000 - - - -
8. Interest - 16,966 13,722 9,980 5,988 1,996
9. Repayment of Term Loan - 23,951 27,943 31,935 31,935 31,936
B. TOTAL DISPOSALS 2,11,000 1,30,917 41,665 41,915 37,923 33,932
C. OPENING BALANCE NIL NIL 51,083 1,16,718 1,97,803 2,82,880
D. NET SURPLUS NIL 51,083 65,635 81,085 85,077 89,068
E. CLOSING BALANCE NIL 51,083 1,16,718 1,97,803 2,82,880 3,71,948
Projected Balance Sheet:
Sl.No. Description Amount in Rupees as at the end of the
1st Yr. 2nd Yr. 3rd Yr. 4th Yr. 5th Yr. 1. Capital Account of Promoter 10,550 73,484 1,54,962 2,55,882 3,60,794
2. Surplus from operation 62,934 81,478 1,00,920 1,04,912 1,08,904
NET WORTH: 73,484 1,54,962 2,55,882 3,60,794 4,69,698
3. Subsidy 52,750 52,750 52,750 52,750 52,750
4. Term loan outstanding 1,23,749 95,806 63,871 31,936 - TOTAL LIABILITIES 2,49,983 3,03,518 3,72,503 4,45,480 5,22,448
1. Gross Block 1,21,000 1,21,000 1,21,000 1,21,000 1,21,000
Less Depreciation 12,100 24,200 36,300 48,400 60,500
NET BLOCK 1,08,900 96,800 84,700 72,600 60,500
2. Working capital 90,000 90,000 90,000 90,000 90,000 3. Cash & Bank Balance 51,083 1,16,718 1,97,803 2,82,880 3,71,948
TOTAL ASSETS 2,49,983 3,03,518 3,72,503 4,45,480 5,22,448
Address of Suppliers of Machinery Equipments : 1. M/S Toshniwal Brothers Pvt Ltd, 607 A, 1st Main, 2nd srage, Rajajingar, Bangalore, 2. M/S Jain Scientific Glass Works, Ambala Cantt, Panjab 3. M/S Monohar Glass Works, Station Road, Ferozabad, UP,

125
FLEXOGRAPHIC PRINTING
Introduction: Now-a-days Flexographic Printing is a popular printing technology. Solvent Flexographic printing is one of the most economic form of outdoor advertisement where visuals can be customized according to the space available. Flexographic printing can be used in hoarding printing, vinyl printing , board printing , canvas printing , glass lamination printing wall wrap printing , banner printing , backdrop printing , it comes under the category of large format flex printing in which there is no need of pre- press process .
Market Potential: Flex printing is used for the outdoor publicity in the form of hoardings, dealer boards, kiosks, flex printing can also be used for banner printing, out door banner printing is for short time , banner printing is very cheap and effective, banner printing is used for instant impact in the market, flex printing banner are far better then hand made banners as they have better results and long life. Wide format digital Flex printing services for a wide range of high quality promotional materials such as billboards, advertising hoardings, building wraps, vehicle wraps and point-of-sale displays. we do graphic design services, high resolution scanning, mounting and laminating. Prints from digital printing are created for indoor uses or outdoor uses, for digital printing using UV inks for outdoors, dye pigmented inks for indoors and solvent inks for indoor or outdoor without having to laminate the prints.Large format digital Flex printing services are popular printing services for promotional displays, advertising signage, portable displays, display panels, banners, in-store points of sale, showcases, presentations, posters and interior design
Raw Materials: Raw materials are to be sourced mainly from the open market. At present availability and supply of the raw materials is not problem e.g. (for digital flex printing we use inkjet media, traslite, common paper, art paper, photographic paper, vinyl, canvas, backlit and many more, ink, Tonner, CD, etc) Cost will be Rs. 3,75,000/- and also the same materials to be collect from Fujifilm Sericol India Pvt Ltd Shirur, Pune-412216 and Third Eye Technologies, 372, vr lay out, kr. puram, Coimbatore, Tamil Nadu, India, Zip/Postal : 641006, Telephone : 91-422-256-9442. Flex Printing Process: Flex printing process involves Type Setting: with computers (Commonly referred to as D.T.P), the job of the typesetter which involves the lying-out of the text and graphics in a printable format to create Master or C.R.C (Camera Ready Copies) has become highly efficient and cost effective. This function which requires a very high level precision and skill has become highly automated with the proper induction of computers and computer based technology. After DTP and design setting in computer and then the same use some special design and completion of the total processing go for printing. Flow Chart :
Power: Power requirement for the unit shall be 3.75 KW. The monthly consumption of power is estimated at 4520KWHrs costing Rs.18,531/-.
Type Setting DTP & Design
Making
Correction Format setting
Printing Process Flex Setting &
Printing Cutting Finished
Products & Sale

126
Water: The Unit will need 500 liters of water per day. It is available from both ground water sources and public supply. Manpower: The monthly requirements and costs of manpower, to be recruited locally are shown below: 1. Manager / Accountant cum Supervisor Self Self 2. Skilled Worker 4 4,000/- 16,000/- 3. Semi skilled worker 4 3,000/- 12,000/- 4. Sales Representative 1 3,500/- 3,500/- 5. Helper 1 3,500/- 3,500/- Total: 35,000/- CAPITAL COST ESTIMATE: A. Land & Building On Rent. B. Plant & Machinery: 1. DTP System Comprising of
Computers 02nos 30,000/- Rs. 60,000/- Laser Printer Mono 01no 9,000/- Rs. 9,000/- Laser printer Colour all in one 01 35,000/- Rs. 35,000/- Scanner 01 4,000/- Rs. 4,000/- 2. Digital Flex Machine D420 01 5,79,000/- Rs. 5,79,000/- 3. Automatic Cutting Machine 02 10,000/- Rs. 20,000/- 4. Perforating Machine 01 3,000/- Rs. 3,000/- 5. Other equipments one set Rs. 10,000/- 6. 10 KVA Gen Set Honda Make 01 63,480/- Rs. 63,480/-
Total: Rs. 8,00,000/- C. Miscellaneous Fixed Assets 1. Decoration of Machine Room & office Rs. 95,000/- 2. Signboard/ Fan /Chair etc Rs. 25,000/- 3. Wiring/Electrification/ Rs. 40,000/- 4. 1.5 Ton LG A/C 1 Rs. 40,000/- Total:Rs 2,00,000/- D. Preliminary & Preoperative expenses Rs. 50,000/- E. Provision for c contingencies Rs.1,25,000/- Total Fixed Capital: Rs.11,75,000/- F. Working Capital: (a) Raw Materials for 1 months Rs. 3,75,000/- (b) Utilities for 1 month Rs. 1,544/- (c) Wages & Salaries for 1 Month Rs. 35,000/- (d) Other expenses for 1 month Rs. 89,456/- Total Working Capital: Rs. 5,01,000/- TOTAL PROJECT COST: Rs. 16,76,000/- Means of finance:
URBAN RURAL 1. Composite Loan: Rs. 11,73,200 Rs.10,05,600 2. Subsidy: Rs. 4,19,000 Rs. 5,86,600 3. Promoters’ Contribution: Rs. 83,800 Rs. 83,800 4. Debt. Equity Ratio: 2.33:1 1.50:1

127
Profitability: (Rs. In Thousands)
Sl. No.
Description 1st Yr. 2nd Yr. 3rd Yr. 4th Yr. 5th Yr.
1. Capacity Utilized 60% 70% 80% 80% 80%
2. Annual sales Realization 4347 5072 5796 5796 5796
3. Annual Costs
(a) Raw Materials 2700 3150 3600 3600 3600
(b) Power 14 16 19 19 19
(c) Wages & Salaries 390 410 420 431 442
(d) Repair & Maintenance 48 48 48 48 48
(e) Administrative overheads 120 126 132 139 146
(f) Selling expenses 652 761 869 869 869
(g) Depreciation 110 110 110 110 110
(h) Interest on Composite Loan 136 111 81 49 20
Total Cost 4170 4732 5279 5265 5254
Variable Costs 3366 3927 4488 4488 4488
4. Annual Profit 177 340 517 531 542 5. Return on Investment 10.56 20.29 30.85 31.68 32.34
6. Return on sales 4.07 6.70 8.92 9.16 9.35
7. Annual Contribution 981 - - - -
8. Break Even Point 49.17 - - - -
9. Cash Accrual 2.87 450 627 641 652
10. Debt Servicing Capacity 423 561 708 690 672
11. Repayment of Loan 173 220 260 260 260
12. Debt Serviced 309 331 341 309 280
13. Pay Back Period 2 Years 8 months 11 days
14. Debt Service Coverage Ratio 1:95:1
Cash Flow Statement: (Rs. in thousands)
Sl. No.
Description Pre-ope- rative Period
O p e r a t I n g Y e a r s
1st 2nd 3rd 4th 5th
1. Increase in promoter’s capital 84 - - - - -
2. Increase in subsidy 419 - - - - -
3. Increase in Composite Loan 1173 - - - - -
4. Depreciation - 110 110 110 110 110
5. Profit before interests - 313 451 508 580 562
A. Total Sources 1676 423 561 708 690 672
6. Increase in capital investments 1175 - - - - -
7. Increase in Working Capital 501 - - - - -
8. Interests - 136 111 81 49 20
9. Repayment of Loan - 173 220 260 260 260
B. Total Disposals 1676 309 331 341 309 280
C. Opening Balance - - 114 344 711 1092
D. Net Surplus - 114 230 367 381 392
E. Closing Balance - 114 344 711 1092 1484

128
Projected Balance Sheets: (Rs. in thousand)
Sl. No.
Description Amount as at the end of the
1st Yr. 2nd Yr. 3rd Yr. 4th Yr. 5th Yr.
1. Capital Account of the promoters 84 261 601 1118 1649
2. Surplus from operation 177 340 517 531 542
NET WORTH 261 601 1118 1649 2191
3. Subsidy 419 419 419 419 419
Composite Loan 1000 780 520 260 -
A. Total Liabilities 1680 1800 2657 2328 2610
1. Gross Fixed Assets 1175 1175 1175 1175 1175
Less Depreciation 110 220 330 440 550
NET BLOCK 1065 955 845 735 625
2. Current Assets/W/C 501 501 501 501 501
3. Cash & Bank Balance 114 344 711 1092 1484
B. Total Assets 1680 1800 2057 2328 2610
Suppliers of Machinery 1. Admark, G 98 3rd Floor K K Market, Nr Shankar Maharaj Math, Pune Satara Road, Balaji Nagar, Pune – 411043, +(91)-20-66239071 2.Horizon Graphics, A -5, 1 St Floor Shreeyash Complex, Opp Mandar Lodge, 597 Narayan Peth N C Kelkar Marg, Narayan Peth, Pune – 411030, +(91)-20-66821236

129
LEATHER / REXIN/ FOAM CANVAS BAG
Introduction : Decorated, coloures, Silky-lustre, light in weight Leather, Rexin and foam bags (Both for ladies and school going children) are being preferred in the society due to their good appearance, durability and reasonable cost. All the machinery and raw material used for manufacturing id such products are available from indigenous sources. Marketing: These items have a very good demand in the domestic market. Much emphasis is given to this Industry to cater to the growing demand of foreign and local buyers. The products like any other consumer durable have the prospect of attracting wide range of people from all walks of life. Production Target: Assuming that the Unit will operate for Single Shift of 8 hours per day for 300 working days and the annual installed capacity of sales value will be Rs.35,64,000/- Production Procedure: Components are first cut as per design and then stitched together as per specifications. Raw Materials: The main raw materials required for manufacture of School Bags and Rain ware are Laminated Jute cloth, Cloth/PVC buckle, nylon bit, Sewing thread, Zip fastener Packing materials, Closely woven jute fabric, Belerow, Rexin, Card/ Paste board Rubber coated Jute fabrics, Chain, Rivets, still frame, handle, wax, salutation flour, dyes, labels, lock, Roop, Jute Cotton cloth, Eyelete, Runner to be sourced from open local markets and out side of Tripura. The above materials cost would be Rs. 2.20,000/- per month. Power: Consumption of power and fuel have been arrived at on the basis of consumption norms of the industry. The energy rate has been considered on the basis of existing power tariffs of the electricity department and approximately it will be cost Rs.21,450/- per annum. Water :Requirement of water mainly for washing and cleaning of Raw Jute, Silk Screen print developing etc and drinking purpose. The unit shall avail of the PHE water supply already available at the site and it can also install its own tube well supply for the purpose. Manpower: The unit will employ 7 persons and all man power to be arranged from local area. 1. Manager cum Supervisor Self Self 2. Skilled worker 3nos Rs.16,500/- 3. Office Boy 1 no Rs. 2,200/- 4. Sales Man 1no Rs. 3,300/- 5. Designer 1 no Rs. 5,500/- Total Rs.27,500/- Capital Cost Estimate: Land and Building; 500 Sq. ft of covered area On Rent Plant & Machinery 1. Lock stitch sewing machine 11,000/- 5 66,000/- (Foot operated) 2. Tape, Scissors, Needles etc 2,000/- 5 sets 12,000/- 3. Weigning scale 1,400/- 5 sets 8,400/-

130
4. Electric Heater 1,000/- 5 nos 6,000/- 5. Screen Printing Machine (Equipments) 69,600/- 1,62,000/- Add Vat 12.5% 20,250/- Add Freights 4,950/- Total Rs.1,87,200/- Miscellaneous Fixed Assets : 1. Different types of racks & furniture (Iron make) Rs.22,000/- 2. Show case one no Rs.27,500/- 3. Chair, Working Table and Signboard Rs.11,000/- 4. Fan& Lightings Rs.11,000/- Rs.71,500/- Add Vat 12.5% Rs. 8,937/-
Installation Charges: Rs. 2,063/- Total: Rs.82,500/- Preliminary & Preoperative Exp.: Rs. 4,950/- Fixed Capital : Rs.2,74,650/- Working Capital (P.m) 1. Salary & Wages Rs. 27,500/- 2. Administrative expenses Rs. 13,666/- 3. Selling expenses Rs. 3,300/- 4. Raw Materials Rs.2,20,000/- 5. Utilities Rs. 3,850/- Total Rs.2,68,316/- Total Cost of the Project: Rs.5,42,966/- Means of Finance: Urban Rural a. Composite loan under PMEGP 70% Rs.3,80,075/- 60% Rs.3,25,780/- b. Subsidy 25% Rs.1,35,742/- 35% Rs.1,90,038/- c. Margin Money 5% Rs. 27,148/- 5% Rs. 27,148/- Total Rs.5,42,966/- Rs.5,42,966/- d. Debt Equity Ratio 2.33:1 1.5:1 Profitability: (Rs. In Thousands) Sl.No Description 1st Year 2nd Year 3rd year 4th Year 5th Year
1. Capacity utilized as percent of installed capacity
60 70 80 80 80
2. Annual Sales 2,138 2,495 2,851 2,851 2,851
3. Annual Costs
(a) Raw Materials 1,58 1,848 2,112 2,112 2,112
(b) Utilities 27 32 37 37 37
(c) Selling expenses 24 28 31 31 31
4 Variable Cost 1,635 1,908 2,180 2,180 2,180
(a) Wages & Salaries 198 231 264 264 264
(b) Administrative expenses 98 115 131 131 131
(c) Depreciation 27 27 27 27 27
(d) Interest on Composite Loan 44 36 26 16 5
5 Fixed & Semi Variable Cost 367 409 448 438 427
Total Cost 2002 2317 2628 2618 2607
7. Annual profit 136 178 223 233 244
8 Return on investment 25.04 32.78 41.06 42.90 44.93
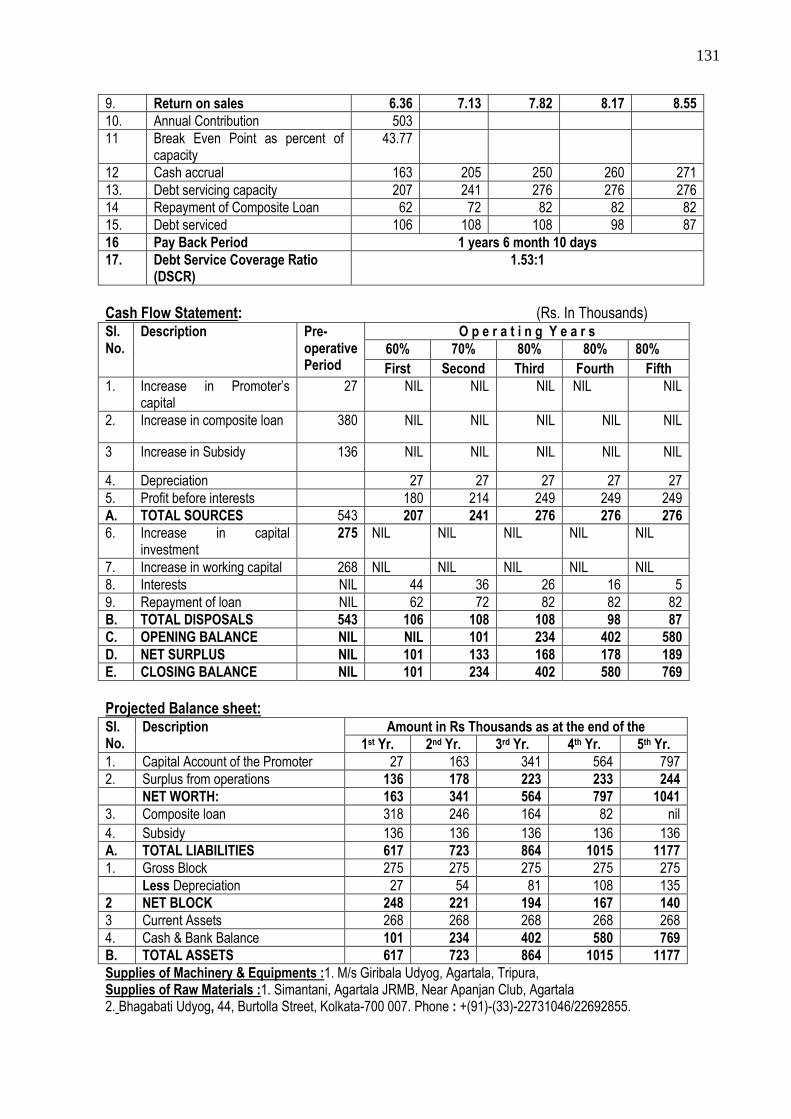
131
9. Return on sales 6.36 7.13 7.82 8.17 8.55
10. Annual Contribution 503
11 Break Even Point as percent of capacity
43.77
12 Cash accrual 163 205 250 260 271
13. Debt servicing capacity 207 241 276 276 276
14 Repayment of Composite Loan 62 72 82 82 82
15. Debt serviced 106 108 108 98 87
16 Pay Back Period 1 years 6 month 10 days
17. Debt Service Coverage Ratio (DSCR)
1.53:1
Cash Flow Statement: (Rs. In Thousands) Sl. No.
Description Pre-operative Period
O p e r a t i n g Y e a r s
60% 70% 80% 80% 80%
First Second Third Fourth Fifth
1. Increase in Promoter’s capital
27 NIL NIL NIL NIL NIL
2. Increase in composite loan 380 NIL NIL NIL NIL NIL
3 Increase in Subsidy 136 NIL NIL NIL NIL NIL
4. Depreciation 27 27 27 27 27
5. Profit before interests 180 214 249 249 249
A. TOTAL SOURCES 543 207 241 276 276 276
6. Increase in capital investment
275 NIL NIL NIL NIL NIL
7. Increase in working capital 268 NIL NIL NIL NIL NIL
8. Interests NIL 44 36 26 16 5
9. Repayment of loan NIL 62 72 82 82 82
B. TOTAL DISPOSALS 543 106 108 108 98 87
C. OPENING BALANCE NIL NIL 101 234 402 580
D. NET SURPLUS NIL 101 133 168 178 189
E. CLOSING BALANCE NIL 101 234 402 580 769
Projected Balance sheet: Sl. No.
Description Amount in Rs Thousands as at the end of the
1st Yr. 2nd Yr. 3rd Yr. 4th Yr. 5th Yr.
1. Capital Account of the Promoter 27 163 341 564 797
2. Surplus from operations 136 178 223 233 244
NET WORTH: 163 341 564 797 1041
3. Composite loan 318 246 164 82 nil
4. Subsidy 136 136 136 136 136
A. TOTAL LIABILITIES 617 723 864 1015 1177
1. Gross Block 275 275 275 275 275
Less Depreciation 27 54 81 108 135
2 NET BLOCK 248 221 194 167 140
3 Current Assets 268 268 268 268 268
4. Cash & Bank Balance 101 234 402 580 769
B. TOTAL ASSETS 617 723 864 1015 1177
Supplies of Machinery & Equipments :1. M/s Giribala Udyog, Agartala, Tripura, Supplies of Raw Materials :1. Simantani, Agartala JRMB, Near Apanjan Club, Agartala 2. Bhagabati Udyog, 44, Burtolla Street, Kolkata-700 007. Phone : +(91)-(33)-22731046/22692855.

132
DUST BIN Introduction: Dust bin is a metallic container and mainly used in office, hospitals and also in road sides for dropping unwanted articles, papers and broken pieces of various articles. These are produced in different sizes depending upon their use. This item is reserved exclusively to be manufactured in small scale sectors. Market: With the increases in number of commercial as well as government establishments the demand for this product is also ever on increase. Although, these are being partially replaced by dust bins made of plastic material, still due to their rigidity and long life they are preferred particularly in Government establishments. Further in view of this item being exclusively reserved for purchase from all scale sector, there appear to be a good market for this product particularly in rural and backward areas. Installed Capacity: Assuming operations for Single Shift per day for 300 working days per annum the annual installed capacity of 15,000 numbers of dust bins metallic office type per annum. The unit has annual turnover will be 18,35,00/-p.a Manufacturing Process: This item is to be produced with the help of proper sheet metal machines and avoid manual work wherever necessary. These are to be produced cut of 18 gauge to 22 gauge B.P /C.R sheet. The manufacturing process broadly involves the following operations: 1. Marking and cutting of sheets to size 2. Forming of sheet by bending 3. Assembling and Finishing Process Flow Chart Raw Material processing Sizing Assembling Forming Raw Materials: All the raw- materials required by the Unit are locally available (such as B.P/C.R sheet, M.S Rivets, Paints & Primer and packing materials etc) and monthly requirement and costs of raw- materials will be Rs. 92,500/- Power: As the process does not need any power a domestic connection of 1 KW Load may suffice. The annual consumption of power is estimated at 2857KWHrs costing Rs. 24,000/- at the installed capacity. Water: The Unit will need 100 Liters of water per day, cost of which is shown in power cost. Manpower: Manpower required by the Unit are locally available. The requirement and annual cost of manpower is shown below:
Sl. No. Particulars Qty Rate Amount (Rs.)
1 Manager / Supervisor Self ---
2 Skilled worker 2 5,000/- 1,20,000/-
3. Sales man 1 3,500/- 42,000/-
4. Helper 1 2,000/- 24,000/-
Total 1,86,000/-
Finishing Cutting Packing Sale

133
CAPITAL COST ESTIMATE: 1. Land & Building: Covered area 150 Sq. Mtrs. On rent 2. Machinery & Equipments: a. Hand lever shearing machine 300mmx3mm cutting machine 2nos Rs. 46,000/- b. Hand operated bending machine with rollers, size 36’x18” guage 2nos Rs. 40,000/- c. Sheet metal Welding tools & equipments Rs. 35,026/- d. Installation of Machinery charges Rs. 29,000/- Total: Rs.150,026/- 3.Miscellaneous Fixed Assets:
a) Electrification Rs. 10,000/- b) Water Installation Rs. 5,500/- c) Miscellaneous others Rs. 4,500/- Total: Rs. 20,000/- Total Fixed Costs: Rs. 170,026/-
B. WORKING CAPITAL:
Sl. No. Particulars Amount (Rs.)
1. Raw Materials 92,500/-
2. Salary & Wages 15,500/-
3. Utilities 2,000/-
4. Misc. Exp. 20,500/-
Total: 1,30,500/-
PROJECT COST
Sl. No. Description Amount (Rs.)
1 Land & building On Rent
2 Plant & Machineries 1,50,526.00
3 Miscellaneous Fixed Assets 20,000.00
4 Working Capital 1,30,500.00
Total
Say
3,01,026.00 Rs. 3,00,000/-
F. MEANS OF FINANCE
Sl. No. Sources of Funds Urban Rural
1 Composite Loan 2,10,000/- 1,80,000/-
2 Promoter’s contribution 15,000/- 15,000/-
3. Subsidy 75,000/- 1,05,000/-
4. Debt Equity Ratio 2.33:1 1.5:1
Profitability:
Sl.No. Description 1st Year 2nd Year 3rd year 4th Year 5th Year
1. Capacity utilized as percent of installed capacity
60 70 80 80 80
2. Annual Sales Realization 11,01,000 12,84,500 14,68,000 14,68,000 14,68,000
3. Annual costs in Rs.
(a) Raw Materials 6,66,000 7,77,000 8,88,000 8,88,000 8,88,000
(b) Utilities 14,400 16,800 19,200 19,200 19,200
(c) Wages & Salaries 1,76,400 1,82,850 1,89,401 1,93,656 1,98,017

134
(d) Repair & maintenance 4,800 4,800 4,800 4,800 4,800
(e) Administrative overheads 36,000 37,800 39,690 41,675 43,758
(f) Selling expenses 1,10,100 1,28,450 1,46,800 1,46,800 1,46,800
(g) Depreciation 16,385 16,385 16,385 16,385 16,385
(h) Interest on Composite Loan 24,122 19,510 14,189 8,514 2,838
Total: 10,48,207 11,83,595 13,37,840 13,30,655 13,24,642
Total variable costs 7,90,500 - - - -
4. Annual profit 52,793 1,00,905 1,30,160 1,37,345 1,43,358
5. Net cash Accrual 69,178 1,17,290 1,46,545 1,53,730 1,59,743
6. Return on investment in 17.59% 33.63% 43.38% 45.78% 47.79%
7. Return on sales 4.80% 7.85% 8.86% 9.35% 9.77%
8. Contribution 1,48,500/- - - - -
9. Break Even Point as % of installed capacity
38.66% - - - -
10. Debt servicing capacity 93,300 1,36,800 1,60,734 1,62,244 1,62,581
11. Repayment of Term Loan 34,054 39,730 45,405 45,405 45,405
12. Debt serviced 58,176 59,240 59,594 53,919 48,243
13. Pay back: 1 year 7 months 6 days
13. D S C R 1.60:1
L. Cash Flow Statement
Sl. No.
Description Pre-operative Period
O p e r a t i n g Y e a r s
First Second Third Fourth Fifth
1. Increase in Promoter’s contribution
15,000 - - - - -
2. Increase in composite loan 2,10,000 1,30,500 - - - -
3. Subsidy 75,000 - - - - -
4. Depreciation - 16,385 16,385 16,385 16,385 16,385
5. Profit before interests - 76,915 1,20,415 1,44,349 1,45,852 1,46,196
A. TOTAL SOURCES 3,00,000 2,23,800 1,36,800 1,60,734 1,62,244 1,62,581
6. Increase in capital investment
3,00,000 - - - - -
7. Increase in working capital - 1,30,500 - - - -
8. Interest - 24,122 19,510 14,189 8,514 2,838
9. Repayment of Term Loan - 34,054 39,730 45,405 45,405 45,406
B. TOTAL DISPOSALS 3,00,000 1,88,676 59,240 59,594 53,919 48,244
C. OPENING BALANCE Nil Nil 35,124 1,12,684 2,13,824 3,22,149
D. NET SURPLUS Nil 35,124 77,560 1,01,140 1,08,325 1,44,337
E. CLOSING BALANCE Nil 35,124 1,12,684 2,13,824 3,22,149 4,36,486
Projected Balance sheet:
Sl.No. Description Amount in Rupees as at the end of the
1st Yr. 2nd Yr. 3rd Yr. 4th Yr. 5th Yr.
1. Capital Account of the Promoter
15,000 67,793 1,68,698 2,98,858 4,36,203
2. Reserve & Surplus from operation
52,793 1,00,905 1,30,160 1,37,345 1,43,358
NET WORTH: 67,793 1,68,698 2,98,858 4,36,205 5,79,561

135
3. Term loan outstanding 1,75,946 1,36,216 90,811 45,406 -
TOTAL LIABILITIES 3,18,739 3,79,914 4,64,669 5,56,609 6,54,561
1. Gross Block 94,500 94,500 94,500 94,500 94,500
Less Depreciation 16,385 32,770 49,155 65,540 81,925
NET BLOCK 1,53,115 1,36,730 1,20,345 1,03,960 87,575
2. Working Capital 1,30,500 1,30,500 1,30,500 1,30,500 1,30,500
3. Cash & Bank Balance 35,124 1,12,684 2,13,824 3,22,149 4,36,486
TOTAL ASSETS 3,18,739 3,79,914 4,64,669 5,56,609 6,54,561
Suppliers of Plant & Machinery:
4. Maneklal & Sons, 119, Narayan dhuru Street, Bombay, 5. Cimotee, 44B, Seshdare Purna, Main Road, Calcutta, 3. Ashok Metal Industries, Tagore Road, Rajkot, Gujrat.

136
PLASTIC PRODUCTS

137
Pilfer Proof Plastic Cap for Mineral Water Bottles Introduction: In the recent years a number of Units manufacturing Purified Drinking Water has come up all over the Country. These Units need to pack Purified Drinking Water in PET Bottles with Pilfer Proof Plastic tear- Off Caps. In Tripura four such Units are selling more than 20, 000 Bottles of Purified Drinking Water per day. Product : Plastic Caps for Mineral Water Bottles are made of Food Grade Polyethylene. These are normally of Blue colour. These caps are meant for one use only. These are Pilfer Proof with a tear off ring at the bottom/ open end. Market : Pilfer proof Plastic Caps for Purified Drinking Water Bottles are now procured by local Mineral Water Plants from Kolkata. These are high volume, Light Weight products involving high transportation costs. The average daily requirements of such caps in Tripura is 20,000 Numbers. Besides more Mineral Water Plants are coming up in the State. Therefore there is high marketing scope for such caps in the State. Manufacturing Process: Food Grade Polyethylene granules are fed into the barrel of the injection moulding machine through a hopper. The barrel carries a screw or ram/plunger which applies a pressure to make a fluid in melted resin towards the nozzle. The molten Polyethylene is forced into moulds to shape Caps. Moulds are cooled and caps are ejected by the machine. Extra runner are removed manually and caps are fed into rotary drums for polishing. Caps are counted and packed in Corrugated Cardboard Boxes for sales Process Flow: Raw Materials: The principal raw materials shall be 30, 000 Kilograms of Food- Grade Polyethylene and its cost will be Rs.17,90,000/- per annum including the cost of Corrugated Cardboard boxes. Raw Materials shall be available from Indian Petrochemicals Pvt Ltd, Vadodara and Guwahati Office of the Reliance Industries. Power & Water : The unit will need a connected load of 16 KW at 400/440 volts, 50 Hz, AC, 3 phase & 4wires. The annual consumption of power is estimated at 19,200 KWHrs costing Rs. 78,720/-. It will need 1,000 Liters of water per day costing Rs. 12,000 per annum. Manpower: The Chemist cum Manager of the unit may not be locally available. All other manpower may be available in Tripura. The requirement and annual cost of manpower, is shown below: Sl.No. Category of Manpower No. of Persons Annual Cost
1. Manager cum Chemist 1 96,000/-
2. Administrative & Sales Staff 2 84,000/-
3. Skilled Worker 2 1,20,000/-
4. Unskilled Worker 4 1,20,000/-
Total: 9 4,20,000/-
Mixing Plasticizing Raw materials
Injection Moulding
Runner removal
Finishing
Packing Sales

138
Financial Aspect of the unit: 1) Land & Building Rented 2) Plant & Machinery: a. Hydraulic injection Moulding Machine Rs.5,65,000/- b. Moulds Rs. 50,000/- c. Chilling plant Rs. 35,000/- d. High speed mixer Rs. 35,000/- e. Grinder Rs. 30,000/- Total Rs.7,15,000/- 3) Miscellaneous Fixed Asset a) Electrification Rs. 60,000/- b) Furniture & Miscellaneous others Rs. 45,000/- Total Rs. 1,05,000/- 4. Provision for contingencies Rs. 44,000/- 5. Preliminary & pre-operative expenses Rs. 56,000/- Total Fixed Investment Rs. 9,20,000/- 6. Working Capital (for 3 months) a) Raw Materials Rs. 4,47,500/- b) Power & Water Rs. 22,680/- c) Salary & Wages Rs. 1,05,000/- d) Miscellaneous expenses Rs. 14,820/- Total: Rs. 5,90,000/- Total Project Cost: Rs.15,10,000/- Means of Finance Urban Rural a. Composite loan under PMEGP Rs10,57,000/- Rs. 9,06,000/- b. Subsidy Rs.3,77,500/- Rs. 5,28,500/- c. Promoters contribution Rs. 75,500/- Rs. 75,500/- d. Debt Equity Ratio 2.33:1 1.50:1 Profitability: (Rs. in Thousands)
Sl. No.
Description 1st Year 2nd Year 3rd year 4th Year 5th Year
1. Capacity utilized 60% 70% 80% 80% 80%
2. Annual Sales Realization 2,343 2733 3123 3123 3123
3. Annual Costs in Rs.
(a) Raw Materials 1074 1253 1432 1432 1432
(b) Power & water 68 77 86 86 86
(c) Wages & Salaries 372 392 411 421 432
(d) Repair & Maintenance 46 46 46 46 46
(e) Administrative overheads 100 105 110 116 122
(f) Selling expenses 351 410 468 468 468
(g) Depreciation 92 92 92 92 92
(h) Interest 122 99 72 43 18
Total: 2225 2474 2717 2704 2696
Total Variable Cost 1493 1740 1986 1986 1986
4. Annual profit 118 259 406 419 427
5. Return on investment 7.81% 17.15% 26.88% 27.75% 28.28%
6. Return on sales 5.04% 9.48% 13.00% 13.42% 13.67%
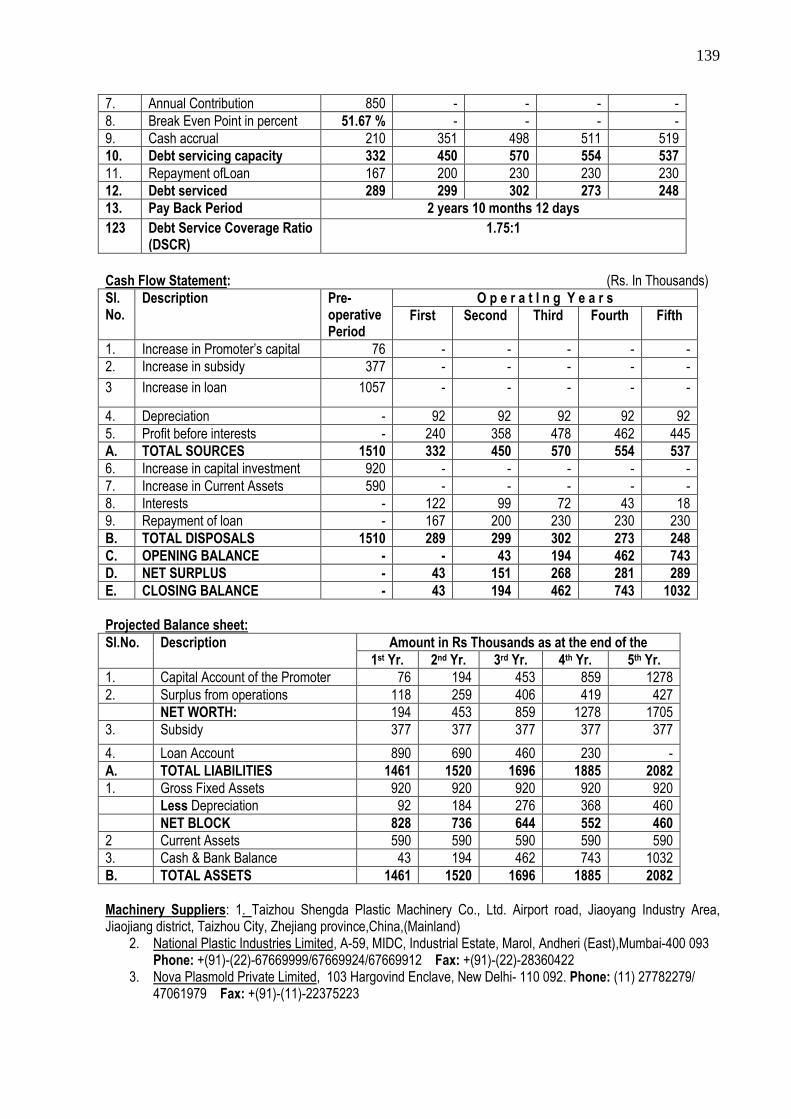
139
7. Annual Contribution 850 - - - -
8. Break Even Point in percent 51.67 % - - - -
9. Cash accrual 210 351 498 511 519
10. Debt servicing capacity 332 450 570 554 537
11. Repayment ofLoan 167 200 230 230 230
12. Debt serviced 289 299 302 273 248
13. Pay Back Period 2 years 10 months 12 days
123 Debt Service Coverage Ratio (DSCR)
1.75:1
Cash Flow Statement: (Rs. In Thousands)
Sl. No.
Description Pre-operative Period
O p e r a t I n g Y e a r s
First Second Third Fourth Fifth
1. Increase in Promoter’s capital 76 - - - - -
2. Increase in subsidy 377 - - - - -
3 Increase in loan 1057 - - - - -
4. Depreciation - 92 92 92 92 92
5. Profit before interests - 240 358 478 462 445
A. TOTAL SOURCES 1510 332 450 570 554 537
6. Increase in capital investment 920 - - - - -
7. Increase in Current Assets 590 - - - - -
8. Interests - 122 99 72 43 18
9. Repayment of loan - 167 200 230 230 230
B. TOTAL DISPOSALS 1510 289 299 302 273 248
C. OPENING BALANCE - - 43 194 462 743
D. NET SURPLUS - 43 151 268 281 289
E. CLOSING BALANCE - 43 194 462 743 1032
Projected Balance sheet:
Sl.No. Description Amount in Rs Thousands as at the end of the
1st Yr. 2nd Yr. 3rd Yr. 4th Yr. 5th Yr.
1. Capital Account of the Promoter 76 194 453 859 1278
2. Surplus from operations 118 259 406 419 427
NET WORTH: 194 453 859 1278 1705
3. Subsidy 377 377 377 377 377
4. Loan Account 890 690 460 230 -
A. TOTAL LIABILITIES 1461 1520 1696 1885 2082
1. Gross Fixed Assets 920 920 920 920 920
Less Depreciation 92 184 276 368 460
NET BLOCK 828 736 644 552 460
2 Current Assets 590 590 590 590 590
3. Cash & Bank Balance 43 194 462 743 1032
B. TOTAL ASSETS 1461 1520 1696 1885 2082
Machinery Suppliers: 1. Taizhou Shengda Plastic Machinery Co., Ltd. Airport road, Jiaoyang Industry Area, Jiaojiang district, Taizhou City, Zhejiang province,China,(Mainland)
2. National Plastic Industries Limited, A-59, MIDC, Industrial Estate, Marol, Andheri (East),Mumbai-400 093 Phone: +(91)-(22)-67669999/67669924/67669912 Fax: +(91)-(22)-28360422
3. Nova Plasmold Private Limited, 103 Hargovind Enclave, New Delhi- 110 092. Phone: (11) 27782279/ 47061979 Fax: +(91)-(11)-22375223

140
DISPOSABLE PLASTIC CUP & GLASS
INTRODUCTION: Disposable Plastic Cup, Glass is a great innovation in our modern age. Plastic cup, glass also are widely used as containers for ice-cream. These are also used as curd cups and coffee cups. In India plastic cups, dish, plates and saucers are the mostly commonly used disposable crockery. Market: Besides general market requirements, plastic crockery is required in large quantities by the caterers of railways and other establishments. Because of their disposables nature and comparatively much lower prices, these are quite often preferred over porcelain, glass or metal containers for certain specific requirements. The demand for paper plates, dish and cups and saucers is likely to grow substantially in future both in urban as well as rural areas. Installed Capacity: Assuming operations for Single Shift per day for 300 working days per annum and installed capacity and turnover is estimated Rs.1,99,925/- Manufacturing Process for Plastic Glass/Cup: Plastic is first printed on the printing press. The printed part is cut to size and given the desired shape by die cutting. The bottom part and the upper part of the Glass/ cup are then assembled to cup shape in screw press. For wax coating machine For plastic Glass/Cup / plates (saucers) the plastic is printed and cut to circles. The cut circles are passed in screw press for obtaining the desired shape. Process Flow Chart Paper/Cloth Roll Gluing Sand application Pre-drying Testing & Cutting Roll Forming Drying Gluing Inspection Packing Marketing Raw Materials; The row materials required for the unit are mainly Paper, paraffin wax, ink, gum and packaging materials required per month is as below and the materials available from Shree Raj Rajendra,A/35, Patel Sizing Estate, Opposite Jay Chemical Industries, Ahmedabad, Gujarat, India- 380 023,Telephone: +(91)-(79)-22972509. Mobile: +(91)-8141555255 / 9099250000. Sl.No Descriptions Qty/ Kg /Ton Rate Amount 1. Paper ;Grey Board,
Mill Board, Card Board Single PE Cup paper 66,000/- Rs. 66,000/- Single colour printing ton 3,850/- Rs. 3,850/- 2. Paraffin wax on L.S 40,000/- Rs. 11,000/- 3. Ink, Gum etc on L.S 5,000/- Rs. 800/- 4. Packing cost on L.S 5,000/- Rs. 1,850/- Rs. 83,500/-
Add Tax 12.5%: Rs. 11,480/- Add Transportation:Rs. 2,200/-
TOTAL: Rs. 1,05,530/-
Sale
s

141
Power: Electric Connected Load requirement for the unit is 8.75 KW only. The annual consumption of power is estimated at 16098 KWHrs costing Rs 5,500/- per month. Power available from Tripura Sate Electric Crop. Ltd. Water; Water required by the unit is mainly for production and office. The amount required for this purpose Rs.1,100/- on lum sump per month. Manpower: The requirement and cost of manpower to be recruited locally are shown below: Sl.No Descriptions No Amount(Rs.) 1. Manager / Accountant cum Supervisor Self Self 2. Skilled Worker 2 6,600/- 3. Semi skilled worker 1 2,200/- 4. Sales Representative 1 3,850/- 5. Helper 1 1,650/- 5 Total 14,300/- CAPITAL COST ESTIMATE: A. LAND & BUILDING with a built up area1000sq. mtrs. On rent B. PLANT AND MACHINERY ; 1. Plastic Cup & Glass making machine Model: FJL-660SB-C 01 Rs.4,55,000/- 2. Plastic Glass making machine 01 Rs.5,60,000/- 3. Gen Set 01 Rs. 96,400/- Total: Rs.11,11,400/- Miscellaneous Fixed Assets: 1 Electrification Rs. 44,000/- 2. Water installation Rs. 16,500/- 3. Furniture & Fixtures including a Computer set Rs. 69,300/- Total: Rs. 1,29,800/-
Total Fixed Assets: Rs. 12,41,200/- Working Capital (P.m) 1. Raw Materials Rs. 1,05,600/- 2. Salary & Wages Rs. 14,300/- 3. Miscellaneous exp Rs. 16,500/- 5. Utilities & water Rs. 6,600/- Total : Rs. 1,43,000/-
Total Project Cost: Rs. 13,84,200/-
Means of Finance : Urban Rural 1. Composite Loan under PMEGP 70% 9,68,948/- 60% 8,30,526/- 2. Subsidy 25% 3,46,052/- 35% 4,84,474/- 3. Margin Money 5% 69,210/- 5% 69,210/-
Total: 11,75,000/- 11,75,000/- 5. Debt Equity Ratio : 2.33:1 1.50:1

142
Profitability: (Rs. In Thousands) Sl.No. Description 1st Year 2nd Year 3rd year 4th Year 5th Year
1. Capacity utilized as percent of installed capacity
60% 70% 80% 80% 80%
2. Annual Sales 1439 1679 1919 1919 1919
3. Annual Costs
(a) Raw Materials 760 886 1013 1013 1013
(b) Utilities 48 55 63 63 63
(c) Wages & Salaries 103 120 137 137 137
(d) Administrative expenses 94 98 103 108 114
(e) Selling expenses 72 84 96 96 96
(f) Depreciation 124 124 124 124 124
(g) Interest on Composite Loan 109 88 65 39 13
4. Total Cost 1310 1455 1601 1580 1560
Variable Cost 880 1025 1172 1172 1172
5. Annual profit 129 224 318 339 359
6. Return on investment 9.32 16.18 22.97 24.49 25.93
7. Return on sales 8.96 13.34 16.57 17.66 18.70
8. Annual Contribution 559 - - - -
9. Break Even Point as percent of capacity
46.15% - - - -
10 Cash accrual 253 348 442 463 483
11 Debt servicing capacity 362 436 507 502 496
12 Repayment of Composite Loan 157 183 209 209 209
13 Debt serviced 266 271 274 248 222
14 Pay Back Period 2 Years 7 Months 24 days
15 Debt Service Coverage Ratio (DSCR)
1.36 : 1
Cash Flow Statement: (Rs. In Thousands) Sl. No.
Description Pre-operative Period
O p e r a t i n g Y e a r s
60% 70% 80% 80% 80%
First Second Third Fourth Fifth
1. Increase in Promoter’s capital 69 - - - - -
2. Increase in composite loan 969 - - - - -
3 Increase in Subsidy 346 - - - - -
4. Depreciation - 124 124 124 124 124
5. Profit before interests - 238 312 383 378 370
A. TOTAL SOURCES 1384 362 436 507 502 494
6. Increase in capital investment 1241 - - - - -
7. Increase in working capital 143 - - - - -
8. Interests - 109 88 65 39 13
9. Repayment of loan - 157 183 209 209 209
B. TOTAL DISPOSALS 1384 266 271 274 248 222
C. OPENING BALANCE - - 96 261 454 148
D. NET SURPLUS - 96 165 233 254 272
E. CLOSING BALANCE - 96 261 494 748 1020

143
Projected Balance sheet:
Suppliers of Plant & Machinery : 1.The Techno House, 10/B-2, Road-3/A, Khulshi Hills, Chittagong, Chittagong, Bangladesh ctg-4225, 880-31-2555-341
Sl. No.
Description Amount in Rs. Thousands as at the end of the
1st Yr. 2nd Yr. 3rd Yr. 4th Yr. 5th Yr.
1. Capital Account of the Promoter 69 198 422 740 1079
2. Surplus from operations 123 224 318 339 359
NET WORTH: 198 422 740 1079 1438
3. Composite loan 812 629 420 211 nil
4. Subsidy 346 346 346 346 346
A. TOTAL LIABILITIES 1356 1397 1506 1636 1784 1. Gross Block (F C) 1241 1241 1241 1241 1241
Less Depreciation 124 248 372 496 620
2 NET BLOCK 1117 993 869 745 621
3 Current Assets 143 143 143 143 143
4. Cash & Bank Balance 96 261 494 748 1020
B. TOTAL ASSETS 1356 1397 1506 1636 1784

144
PLASTIC FILES /ALBUMS /AND FOLDERS Introduction: Plastic File covers, file boards and albums etc. are the items of common use in the various government offices, Government of India undertakings, Private sector and other intuitions, College, School and houses These are generally sold in the printed forms also. Market Potential; Due to the rapid industrialization taking place in the country, the demand for office stationery is increasing day by day. File covers and file boards assume an important position as a stationery materials. These are used for keeping the day to day correspondence, old office records, important papers etc, in order, These are used in huge quantity by governmental offices/ establishments, various commercial establishments, traders, schools, colleges etc every year. Production Targets / Suggested Capacity: The installed capacity by working one shift for 300 working days per annum shall be as follows:
Plastic File cover 8,40,000 nos. Rs. 23,10,000/- Albums 3,60,000 nos. Rs. 7,20,000/- Printed Folders 14,000 nos. Rs. 2,10,000/-
Total Rs.32,40,000/- Manufacturing Process: Board is first cut to the required size of the file covers or for file board. For the covers, it is printed as desired and then creased and bonded on the bending machine. Necessary attachments if desired, are fixed on the covers. File boards cut to size are pasted with paper. Flaps and tapes are then fixed on the board to give it final shape. Process Flow Chart : Raw Materials: The main raw materials required for manufacture of File, Album, Folders are Raw plastic, Various colour, Chemicals, dies, Cotton tape, File covers Fitting and Miscellaneous items, clips etc. The above Raw materials are to be sourced mainly from the open market at present availability and supply of the raw materials is not a problem. The costs of raw materials will be Rs.2,20,000/- Utilities : The unit will require a total connected load of 1 KW and Water requirement is about 500KL per annum. Manpower: The unit will need to provide employment to the following 7 persons and all man power is available from local area. 1. Manager cum Supervisor Self Self 2. Skilled 4nos Rs.22,500/- 3. Office Boy/Peon 1 no Rs. 2,200/- 4. Sales Man 1no Rs. 3,300/- Total Rs.27,500/-
Raw Materials
Assembling Formulation &
Compounding with Raw
Plastic
Dies- fixing of
Different types Raw Materials
Testing
Cutting
Finished
goods
Quality
testing Ready to
Sale

145
CAPITAL COST ESTIMATE: Land & Building: 160 Sq. Mtrs. On Rent. Plant & Machinery ; 1. Plastic Cutter Food, operated, dab front and guides 42”
optical & other accessories. 2. Programmed multiple bending, Creasing Machine for
office file with five step metal gauge treadle drive 24’ size with extra die cliper.
3. Adjustable file bending machine to suit off ice clip or lever files without changing dies with cast iron machine finished table, treadle driven 24”
4 Punching and Pressing Machine for lever files treadle driven with two hole punching for clip or ring and corner pressing dies 24’
5 Deb press with two pillers size 15”x20”x12 6. Chandleir type plates printing press complete with all
standard equipments and accessories with 2HP Motor with starter size 11”x16”
7. Gumming machine 8. Backing press Compression type with
Geared type size 18”. Total: Rs. 1,87,200/-
Miscellaneous Fixed Assets: 1. Chair & Working Table Rs. 27,500/- 2. Fan & Lighting and wearing Rs. 20,000/- 3. Interior decoration Rs. 35,000/- Total Rs. 82,500/- Preliminary & Preoperative Exp.: Rs. 4,950/- Total Fixed Capital : Rs. 2,74,650/- Working Capital (P.m) 1. Salary & Wages Rs. 27,500/- 2. Administrative expenses Rs. 13,666- 3. Selling expenses Rs. 3,300/- 4. Raw Materials Rs. 2,20,000/- 5. Utilities Rs. 3,880/- Total: Rs. 2,68,316/-
Total Cost of the Project: Rs. 5,42,966/- Means of Finance: Urban Rural a. Composite loan under PMEGP 70% Rs.3,80,076/- 60% Rs.3,25,780/- b. Subsidy 25% Rs.1,35,742/- 35% Rs.1,90,038/- c. Margin Money 5% Rs. 27,148/- 5% Rs. 27,148/-
Total Rs.5,42,966/- Rs.5,42,966/- d. Debt Equity Ratio 2.33:1 1.50:1

146
Profitability: (Rs. In Thousands)
Sl.No.
Description 1st Year 2nd Year 3rd year 4th Year 5th Year
1. Capacity utilized as percent of installed capacity
60 70 80 80 80
2. Annual Sales 2,138 2,495 2,851 2,851 2,851
3. Annual Costs
(a) Raw Materials 1,58 1,848 2,112 2,112 2,112
(b) Utilities 27 32 37 37 37
(c) Selling expenses 24 28 31 31 31
4 Variable Cost 1,635 1,908 2,180 2,180 2,180
(a) Wages & Salaries 198 231 264 264 264
(b) Administrative expenses 98 115 131 131 131
(c) Depreciation 27 27 27 27 27
(d) Interest on Composite Loan 44 36 26 16 5
5 Fixed & Semi Variable Cost 367 409 448 438 427
Total Cost 2002 2317 2628 2618 2607
7. Annual profit 136 178 223 233 244
8 Return on investment 25.04 32.78 41.06 42.90 44.93
9. Return on sales 6.36 7.13 7.82 8.17 8.55
10. Annual Contribution 503
11 Break Even Point as percent of capacity
43.77
12 Cash accrual 163 205 250 260 271
13. Debt servicing capacity 207 241 276 276 276
14 Repayment of Composite Loan 62 72 82 82 82
15. Debt serviced 106 108 108 98 87
16 Pay Back Period 1 years 6 month 10 days
17. Debt Service Coverage Ratio (DSCR)
1.53:1
Cash Flow Statement: (Rs. In Thousands) Sl. No.
Description Pre-operative Period
O p e r a t i n g Y e a r s
60% 70% 80% 80% 80%
First Second Third Fourth Fifth
1. Increase in Promoter’s capital 27 NIL NIL NIL NIL NIL
2. Increase in composite loan 380 NIL NIL NIL NIL NIL
3 Increase in Subsidy 136 NIL NIL NIL NIL NIL
4. Depreciation 27 27 27 27 27
5. Profit before interests 180 214 249 249 249
A. TOTAL SOURCES 543 207 241 276 276 276
6. Increase in capital investment 275 NIL NIL NIL NIL NIL
7. Increase in working capital 268 NIL NIL NIL NIL NIL
8. Interests NIL 44 36 26 16 5
9. Repayment of loan NIL 62 72 82 82 82
B. TOTAL DISPOSALS 543 106 108 108 98 87
C. OPENING BALANCE NIL NIL 101 234 402 580
D. NET SURPLUS NIL 101 133 168 178 189
E. CLOSING BALANCE NIL 101 234 402 580 769

147
Projected Balance sheet:
Sl. No.
Description Amount in Rs. Thousands as at the end of the
1st Yr. 2nd Yr. 3rd Yr. 4th Yr. 5th Yr.
1. Capital Account of the Promoter
27 163 341 564 797
2. Surplus from operations 136 178 223 233 244
NET WORTH: 163 341 564 797 1041
3. Composite loan 318 246 164 82 nil
4. Subsidy 136 136 136 136 136
A. TOTAL LIABILITIES 617 723 864 1015 1177
1. Gross Block 275 275 275 275 275
Less Depreciation 27 54 81 108 135
2 NET BLOCK 248 221 194 167 140
3 Current Assets 268 268 268 268 268
4. Cash & Bank Balance 101 234 402 580 769
B. TOTAL ASSETS 617 723 864 1015 1177
Name & Address of machinery and Equipments : 1. M/S Indo Europa Trading Co. Pvt Ltd, 9 Dalal Street, fort, Bombay 4000023. 2. M/S Akemo Paper machines, D23 NDSE part I, New Delhi, 110004 3. M/S Nagpal Industries, Bartan Market, Sadar Bazar , Delhi 110006 Names and Address of Raw Materials ; 1. Titaghur paper Mills Co Ltd, Chartered Bank Building, Kalkata, 2. Bengal paper Mills Co ltd, 14 Netaji Subhash Road, kolkata, 3. Rohtas Industries Ltd, Dalmia Nagar.

148
BLOW MOULDED PLASTIC CONTAINER/BOTTLES
INTRODUCTION: Thermo-Plastic materials like high density polythene, polypropylene, PVC, PET, etc. can be blow moulded into containers of different shapes and sizes for packing pharmaceuticals, chemicals, solvents, acids etc. These are light weight, flexible, chemical resistance and attractive with colour possibilities for packing’s applications. Presently Blow Moulded plastic containers up to 1/2/5/10 /20 ltrs. capacity are reserved for small scale sector. Market Potential: There is very good demand for Blow Moulded containers and bottles in our country. Now-a-days these containers are used for storage of water and other commodities by every household even in villages and are replacing conventional brass and copper containers. They are cheap, light in weight and durable. Installed Capacity: Assuming operations for Single Shift per day for 300 working days per annum the following annual installed capacity and turnover is estimated: Containers and bottle 70 MT ` Rs. 16,00,000/- Process of manufacture: Plastic material in the form of granules are subjected to heat and pressure in an extruder and the semi molten plastic is extruded through the nozzle in form of hollow tube known as parison. Adjustments have been provided in the machine to very wall thickness of the parison. Suitable parison is then inserted in a female mould and air blow into parison to force it against the sides of the mould. The material is then cooled before removal from the mould. The article is then trimmed to remove flashes & Runners. Process Flow Chart : Raw Materials: The raw materials required for the unit are mainly HDPE/Polypropylene / PVC granule, colours pigments, screen printing accessories, etc. Raw materials are to be sourced mainly from the open market . The cost of the raw materials required per month will be Rs. 2,20,000/- Power: The unit will require a total connected load of 5.5 KW. Annual Consumption of Power is estimated at 10580KWHr.s costing Rs. 46,560. Water: The unit shall avail of the PHE water supply already available at the site. Daily requirement of water is estimated at 2,000 Liters, cost of which is shown with power cost. Manpower: The unit will provide employment to 6 persons, all of whom are available locally. Requirement and monthly costs of manpower is shown below: 1. Manager cum Supervisor Self Self 2. Skilled 4nos Rs.22,500/- 3. Office Boy/Peon 1 no Rs. 2,200/- 4. Sales Man 1no Rs. 3,300/- Total: Rs.27,500/-
Raw Materials Formulation &
Compounding
Dies- fixing Raw Materials
Testing
Removal of Runners
Finished
goods
Quality
testing Sale Blow Moulding

149
CAPITAL COST ESTIMATE: A. Land & Building with a covered area of 650Sq. Mtrs. On rent B. Plant & Machinery 1. Blow- moulding Machine with all accessories Rs. 1,14,000/- 2. Moulds, dies, tools etc, Rs. 73,200/- Total: Rs. 1,87,200/- C. Miscellaneous Fixed Assets : 1. Different types of racks & furniture (Iron make) Rs. 30,000/- 2. Show case one no Rs. 20,000/- 3. Chair, Working Table and Signboard Rs. 20,000/- 4. Fan& Lightings Rs. 12,500/- Rs. 82,500/-D. Preliminary & Preoperative Exp.: Rs. 4,950/- Total Fixed C0st: Rs. 2,74,650/ E. Working Capital (P.m) 1. Salary & Wages Rs. 27,500/- 2. Administrative expenses Rs. 13,666- 3. Selling expenses Rs. 3,300/- 4. Raw Materials Rs. 2,20,000/- 5. Utilities Rs. 3,880/- Total: Rs. 2,68,316/-
Total Cost of the Project: Rs. 5,42,966/- Means of Finance: Urban Rural a. Composite loan under PMEGP 70% Rs.3,80,076/- 60% Rs.3,25,780/- b. Subsidy 25% Rs.1,35,742/- 35% Rs.1,90,038/- c. Margin Money 5% Rs. 27,148/- 5% Rs. 27,148/-
Total Rs.4,79,424/- Rs. 4,79,424/- d. Debt Equity Ratio 2.33:1 1.50:1
Profitability: (Rs. In Thousands) Sl.No Description 1st Year 2nd Year 3rd year 4th Year 5th Year
1. Capacity utilized as percent of installed capacity
60 70 80 80 80
2. Annual Sales 2,138 2,495 2,851 2,851 2,851
3. Annual Costs
(a) Raw Materials 1,58 1,848 2,112 2,112 2,112
(b) Utilities 27 32 37 37 37
(c) Selling expenses 24 28 31 31 31
4 Variable Cost 1,635 1,908 2,180 2,180 2,180
(a) Wages & Salaries 198 231 264 264 264
(b) Administrative expenses 98 115 131 131 131
(c) Depreciation 27 27 27 27 27
(d) Interest on Composite Loan 44 36 26 16 5
5 Fixed & Semi Variable Cost 367 409 448 438 427
Total Cost 2002 2317 2628 2618 2607
7. Annual profit 136 178 223 233 244
8 Return on investment 25.04 32.78 41.06 42.90 44.93
9. Return on sales 6.36 7.13 7.82 8.17 8.55
10. Annual Contribution 503

150
11 Break Even Point as percent of capacity 43.77
12 Cash accrual 163 205 250 260 271
13. Debt servicing capacity 207 241 276 276 276
14 Repayment of Composite Loan 62 72 82 82 82
15. Debt serviced 106 108 108 98 87
16 Pay Back Period 1 years 6 month 10 days
17. Debt Service Coverage Ratio (DSCR) 1.53:1
Cash Flow Statement: (Rs. In Thousands) Sl. No.
Description Pre-operative Period
O p e r a t i n g Y e a r s
60% 70% 80% 80% 80%
First Second Third Fourth Fifth
1. Increase in Promoter’s capital
27 NIL NIL NIL NIL NIL
2. Increase in composite loan 380 NIL NIL NIL NIL NIL
3 Increase in Subsidy 136 NIL NIL NIL NIL NIL
4. Depreciation 27 27 27 27 27
5. Profit before interests 180 214 249 249 249
A. TOTAL SOURCES 543 207 241 276 276 276
6. Increase in capital investment
275 NIL NIL NIL NIL NIL
7. Increase in working capital 268 NIL NIL NIL NIL NIL
8. Interests NIL 44 36 26 16 5
9. Repayment of loan NIL 62 72 82 82 82
B. TOTAL DISPOSALS 543 106 108 108 98 87
C. OPENING BALANCE NIL NIL 101 234 402 580
D. NET SURPLUS NIL 101 133 168 178 189
E. CLOSING BALANCE NIL 101 234 402 580 769
Projected Balance sheet:
Sl. No.
Description Amount in Rs. Thousands as at the end of the
1st Yr. 2nd Yr. 3rd Yr. 4th Yr. 5th Yr.
1. Capital Account of the Promoter 27 163 341 564 797
2. Surplus from operations 136 178 223 233 244
NET WORTH: 163 341 564 797 1041
3. Composite loan 318 246 164 82 nil
4. Subsidy 136 136 136 136 136
A. TOTAL LIABILITIES 617 723 864 1015 1177
1. Gross Block 275 275 275 275 275
Less Depreciation 27 54 81 108 135
2 NET BLOCK 248 221 194 167 140
3 Current Assets 268 268 268 268 268
4. Cash & Bank Balance 101 234 402 580 769
B. TOTAL ASSETS 617 723 864 1015 1177
Raw Materials Suppliers: Hoechst dyes & Chemical Ltd, Hoechst House, 193 Backbay Reclamation, Scheme III, nariman point, Bombay 21. Machinery Suppliers; Brimco machinery Corporation, Plot 55 Govt, Kandivil Industrial Estate, Kandivil (West), Bombay 67.

151
RIGID PVC PIPES
Introduction: By virtue of their certain intrinsic values of processing the combinations of excellent properties the rigid PVC pipes are fast replacing the conventional metal pipes in many applications. There are as electrical conduit is well established in the building construction PVC conduits have been accepted by all the electricity boards. Their use in tube wells is a recent innovation and due to their chemical resistant properties, these may find applications in chemical plants also. Market Potential: The demand of PVC pipe and fittings is related to the consumption of PVC pipes and keeping in view the growing trends in the utilization of PVC pipes for a variety of applications, the demand for fittings is likely to grow substantially. Manufacturing Process for PVC Pipes: PVC pipes are made from polyvinyl chloride (PVC). This rigidity can be controlled by controlling the percentage of plasticizer at the time of compounding. The production of rigid PVC pipes consists of plasticizing and homogenizing PVC compound and extrusion of it by the extruder through its circular slit. This circular slit governs the size of the pipe to be extruded. Different dies are used for manufacturing different sizes of pipes. The pipe is then passed through a vacuum sizing tank where in the dimensions of the pipe can be accurately set. This also helps in the surface finish of the pipe. The rigid pipe is cut in an in- line motorized cutting device into required sizes. Process Flow Chart : Raw Materials; The raw materials required for the unit are mainly PVC Resin, DOP, Stabilizer, Colourant, etc. Raw materials are to be sourced mainly from the open market or directly from Manufacturers. The unit will require Raw Materials worth Rs.1,05,600/- per month. Power: Connected Load requirement for the unit is 25 KW. Annual consumption of Power is estimated at 39,000 KWHrs costing Rs. 1,59,900. Power is available from Tripura Sate Electric Crop. Ltd. Water; Water required by the unit is 3000 Liters per day. The amount required for this purpose is Rs.1,100/- per month. Manpower: The requirement and cost of manpower to be recruited locally are shown below: Sl.No Descriptions No Amount(Rs.) 1. Manager / Accountant cum Supervisor Self Self 2. Skilled Worker 2 6,600/- 3. Semi skilled worker 1 2,200/- 4. Sales Representative 1 3,850/- 5. Helper 1 1,650/- 5 Total 14,600/- CAPITAL COST ESTIMATE: A. LAND & BUILDING with a built up area1000sq. mtrs. On rent
Raw Materials
Assemble
Formulation &
Compounding
Dies- fixing Extrusion
Cooling Cutting
Finished
goods
Quality
testing Sales

152
B. PLANT AND MACHINERY : 2. High Speed (Mixer), Honschel type 01 Rs. 42,600/- 2 Dies and Mandrel sets 01 Rs. 36,000/- 3. Sharp grinder, heavy duty, fitted with elect. Motor, Rs. 12,000/- 4. Weighting Balance 01 Rs. 6,000/- 5. 65MM PVC RIGID pipe extrusion Plant 01 Rs. 9,13,400/- 6. Instrument laboratory equipped with testing facilities Rs. 48,000/- 7. Chemical testing laboratory consisting of Rs. 53,000/-
chemical balance etc Total: Rs.11,11,000/- C. Miscellaneous Fixed Assets 1 Electrification Rs. 44,000/- 2. Water installation Rs. 16,500/- 3. Furniture & Fixtures including a Computer set Rs. 69,500/-
Total: Rs. 1,30,000/- Total Fixed Assets: Rs. 12,41,000/
D. Working Capital (P.m) 1. Raw Materials Rs. 1,05,600/- 2. Salary & Wages Rs. 14,300/- 3. Miscellaneous exp Rs. 16,500/- 5. Utilities & water Rs. 6,600/- Total : Rs. 1,43,000/-
Total Project Cost:Rs. 13,84,000/-
Means of Finance: Urban Rural 1. Composite Loan under PMEGP 70% 9,69,000/- 60% 8,31,000/- 2. Subsidy 25% 3,46,000/- 35% 4,84,000/- 3. Margin Money 5% 69,000/- 5% 69,000/- Total: 13,84,000/- 13,84,000/- 4. Debt Equity Ratio: 2.33:1 1.50:1 Profitability: (Rs. In Thousands) Sl.No. Description 1st Year 2nd Year 3rd year 4th Year 5th Year
1. Capacity utilized as percent of installed capacity
60% 70% 80% 80% 80%
2. Annual Sales 1439 1679 1919 1919 1919
3. Annual Costs
(a) Raw Materials 760 886 1013 1013 1013
(b) Utilities 48 55 63 63 63
(c) Wages & Salaries 103 120 137 137 137
(d) Administrative expenses 94 98 103 108 114
(e) Selling expenses 72 84 96 96 96
(f) Depreciation 124 124 124 124 124
(g) Interest on Composite Loan 109 88 65 39 13
4. Total Cost 1310 1455 1601 1580 1560
Variable Cost 880 1025 1172 1172 1172
5. Annual profit 129 224 318 339 359
6. Return on investment 9.32 16.18 22.97 24.49 25.93
7. Return on sales 8.96 13.34 16.57 17.66 18.70
8. Annual Contribution 559 - - - -

153
9. Break Even Point as percent of capacity
46.15% - - - -
10 Cash accrual 253 348 442 463 483
11 Debt servicing capacity 362 436 507 502 496
12 Repayment of Composite Loan 157 183 209 209 209
13 Debt serviced 266 271 274 248 222
14 Pay Back Period 2 Years 7 Months 24 days
15 Debt Service Coverage Ratio (DSCR)
1.36 : 1
Cash Flow Statement: (Rs. In Thousand) Sl. No.
Description Pre-operative Period
O p e r a t i n g Y e a r s
60% 70% 80% 80% 80%
First Second Third Fourth Fifth
1. Increase in Promoter’s capital 69 - - - - -
2. Increase in composite loan 969 - - - - -
3 Increase in Subsidy 346 - - - - -
4. Depreciation - 124 124 124 124 124
5. Profit before interests - 238 312 383 378 370
A. TOTAL SOURCES 1384 362 436 507 502 494
6. Increase in capital investment 1241 - - - - -
7. Increase in working capital 143 - - - - -
8. Interests - 109 88 65 39 13
9. Repayment of loan - 157 183 209 209 209
B. TOTAL DISPOSALS 1384 266 271 274 248 222
C. OPENING BALANCE - - 96 261 454 148
D. NET SURPLUS - 96 165 233 254 272
E. CLOSING BALANCE - 96 261 494 748 1020
Projected Balance sheet: Sl. No.
Description Amount in Rs Thousands as at the end of the
1st Yr. 2nd Yr. 3rd Yr. 4th Yr. 5th Yr.
1. Capital Account of the Promoter 69 198 422 740 1079
2. Surplus from operations 123 224 318 339 359
NET WORTH: 198 422 740 1079 1438
3. Composite loan 812 629 420 211 nil
4. Subsidy 346 346 346 346 346
A. TOTAL LIABILITIES 1356 1397 1506 1636 1784
1. Gross Block (F C) 1241 1241 1241 1241 1241
Less Depreciation 124 248 372 496 620
2 NET BLOCK 1117 993 869 745 621
3 Current Assets 143 143 143 143 143
4. Cash & Bank Balance 96 261 494 748 1020
B. TOTAL ASSETS 1356 1397 1506 1636 1784
Suppliers of Machinery & Equipments : 1.RH Windsor (India) Ltd, Plot E-16, U Road, Thana Industrial Estate, Thana, Bombay, 2.Precision Plastic Tools & Products Co. 1st floor, Room no;9,19 India Exchange Place, Kalkata

154
DISPOSABLE PLASTIC SYRINGE Introduction: Disposable syringes are a great innovation in the field of medical equipment. They are used for infrastructures injections and are disposed off immediately after usage. The major advantage of using disposable syringes is that no in-faction is transmitted since the injections is disposed off immediately after use. Many attributes are attached to the fast growing popularity of disposable syringes. The cost effectiveness, light weight, break resistance, design flexibility and fast production cycle of these have encouraged industries to convert from the manufacture of conventional glass syringes to disposable syringes. Made of plastic with nozzle and with one needle for each syringes these are available in sterilized from with the help of Ethylene oxide or gamma rays thereby avoiding the cumbersome process of sterilization required by glass syringes. Thus such disposable syringes offer complete protection against any infection like the virus of AIDS to be communicated through the blood to another patient. In India even though the concept is still based-cally restricted to urban areas, the production of disposable syringes is lamentably poor, With growing popularity, there exists a tremendous market potential for the disposable syringes. Disposable plastic syringes are basically injection moulded from polypropylene. The syringes are made in various sizes viz 1ml, 2mk,5ml and 10 ml and in different designs. The syringes are made by assembling three components are packed sterilized conditions. Market : With the replacement of traditional glass syringes by disposable syringes for convenience, safety. The demand for plastic disposable syringes is growing at very fast rate. Due to the fear of AIDS and other infections it is now have become a common practice to use sterilized disposable plastic syringes. Uses:
Veterinary Pharmaceuticals – multiple and single dose products for small and large animals; oral, intramammary, and rectal administration
Industrial – primary disposable product packaging for adhesives, sealants, caulks, greases, lubricants, inks, colorants, additives, catalysts, and abrasives
Consumer – DIY adhesives, sealants, lubricants, flavoring, and marinades Sample Collection – packaging, dispensing, and testing of toxic substances and soil Human Health – disposable plastic syringes medication dispensers for oral, pediatric, geriatric,
and feminine care Pesticide and Insecticides – disposable plastic syringes and packaging for controlled dispensing
of pastes and baits
Suggested Capacity: The minimum economic capacity of a unit producing disposable plastic syringes is 70 lakhs pieces per annum based on two shift operation for 300 operating days working schedule in a year. Manufacturing Process: The production process comprises of manufacturing a two piece syringe consisting of a barrel or cylinder and a plunger. The raw materials are fed with an automatic feeding arrangement for moulding. The injection moulding machines used for the purpose are fully automatic and give mass production with uninterrupted output out put. The moulds which are used are interchangeable and have appropriate cavities for the different sizes and also have a facility for proper cooling systems. The camping stroke , the hydraulic mould heights adjustment, hydraulic ejector with multi stroking facility, clamping force regulating etc. are employed suitably to manufacture the product. The syringes are marked and calibrated by lines indicating measuring space or volume.

155
Sterilisation: Sterillisation of the syringes is proposed to be carried out using Ethylene oxide plant. Glass is available in cylinders as well as in tankers from M/S National Organic & Chemical Ltd, Bombay. Printing: Printing machines are employed to print and label each individual pack, inner packs and transit boxes , descriptions, date and other relevant information related to the product usages and safety. Packing: Packing machines for packaging the product are of automatic type of producing soft blister packing. Flow Chart: Raw Materials; All the raw materials required are available indigenously. Polypropylene, b. Ethylene Oxide gas, c. Printing Ink, d. Miscellaneous stores, e. Packing materials. These Raw materials are sourced mainly from the open market. At present availability and supply of the raw materials is not a problem and Cost will be Rs. 3,75,000/- and also the same materials can be imported from Dakumar machinery Co.Ltd, 369# XinJiang Rd, Xinqian Street, Huangyan Taizhou, Zhejiang, China , P.C. 318020. Tel:86-576-81106895,/86-576-81106937, Fax: 86-576- 84018996 and Ajit Enterprises, D-145 Industrial Focal Point Patiala, Power: Electricity requirement for the unit is 4 KW. The annual consumption of Power is estimated at 4,520 KWHrs. Costing Rs. 18,528/- Water: The Unit will need 500 liters of water per day. It is available from both ground water sources and public supply. Manpower: The unit will provide employment to around 9 persons. Monthly requirements and costs of manpower, to be recruited locally are shown below: Sl.No Descriptions No Rate Amount(Rs.) 1. Manager / Accountant cum Supervisor Self Self 2. Skilled Worker 2 4,500/- 9,000/- 3. Semi skilled worker 2 4,000/- 8,000/- 4. Sales Representative 1 3,500/- 3,500/- 5. Helper 1 1,500/- 1,500/- 6. Machine operator 3 3,000/- 9,000/- 7. Computer operator 1 2,000/- 2,000/- 8. Watch & Guard 1 2,000/- 2,000/- Total 35,000/- CAPITAL COST ESTIMATE: A. LAND & BUILDING On Rent. B. PLANT AND MACHINERY ; 1. Automatic Plastic Injections Moulding Machine 01 Rs. 2,65,000/-
Plastic Injection Molding Machine (AIM 680-1380)
Assembling
R.M
Moulding Sterlisation Printing
Packing Sales

156
2. Ethylene Oxide gas Sterilizer 01 Rs. 1,00,000/- 3. Bilster Packing Machine 01 Rs. 65,000/- 4. Set of Mouldes & dies 01 Rs. 93,000/- 5. Laboratory testing equipment 01 Rs. 65,000/- 6. Desktop Computer, Printer & UPS 01 Rs. 40,000/- 7. Gen Set 01 Rs. 1,72,000/-
Total Rs. 8,00,000/- C. Miscellaneous Fixed Assets 1. Decoration of Machine Room & office Rs. 85,000/- 2. Signboard/ Fan /Chair etc Rs. 45,000/- 3. Wiring/Electrification/ Rs. 30,000/- 4. 1.5 Ton LG A/C Rs. 40,000/- Total Rs. 2,00,000/- D. Preliminary & Preoperative expenses: Rs. 50,500/- E. Provision for c contingencies Rs. 1,25,000/- Total Fixed Capital: Rs.11,75,000/- F. Working Capital: (a) Raw Materials for 1 months Rs. 3,75,000/- (b) Utilities for 1 month Rs. 1,544/- (c) Wages & Salaries for 1 Month Rs. 35,000/- (d) Other expenses for 1 month Rs. 89,456/- Total Working Capital: Rs. 5,01,000/- TOTAL PROJECT COST: Rs.16,76,000/- Means of finance:
URBAN RURAL 1. Composite Loan: Rs. 11,73,200 Rs.10,05,600 2. Subsidy: Rs. 4,19,000 Rs. 5,86,600 3. Promoters’ Contribution: Rs. 83,800 Rs. 83,800 4. Debt. Equity Ratio: 2.33:1 1.50:1 Profitability: (Rs. In Thousands) Sl. No.
Description 1st Yr. 2nd Yr. 3rd Yr. 4th Yr. 5th Yr.
1. Capacity Utilized 60% 70% 80% 80% 80%
2. Annual sales Realization 4347 5072 5796 5796 5796
3. Annual Costs
(a) Raw Materials 2700 3150 3600 3600 3600
(b) Power 14 16 19 19 19
(c) Wages & Salaries 390 410 420 431 442
(d) Repair & Maintenance 48 48 48 48 48
(e) Administrative overheads 120 126 132 139 146
(f) Selling expenses 652 761 869 869 869
(g) Depreciation 110 110 110 110 110
(h) Interest on Composite Loan 136 111 81 49 20
Total Cost 4170 4732 5279 5265 5254
Variable Costs 3366 3927 4488 4488 4488
4. Annual Profit 177 340 517 531 542
5. Return on Investment 10.56 20.29 30.85 31.68 32.34
6. Return on sales 4.07 6.70 8.92 9.16 9.35
7. Annual Contribution 981 - - - -

157
8. Break Even Point 49.17 - - - -
9. Cash Accrual 2.87 450 627 641 652
10. Debt Servicing Capacity 423 561 708 690 672
11. Repayment of Loan 173 220 260 260 260
12. Debt Serviced 309 331 341 309 280
13. Pay Back Period 2 Years 8 months 11 days
14. Debt Service Coverage Ratio 1:95:1
Cash Flow Statement: (Rs. in thousands)
Sl. No.
Description Pre-operative Period
O p e r a t I n g Y e a r s
1st 2nd 3rd 4th 5th
1. Increase in promoter’s capital 84 - - - - -
2. Increase in subsidy 419 - - - - -
3. Increase in Composite Loan 1173 - - - - -
4. Depreciation - 110 110 110 110 110
5. Profit before interests - 313 451 508 580 562
A. Total Sources 1676 423 561 708 690 672
6. Increase in capital investments 1175 - - - - -
7. Increase in Working Capital 501 - - - - -
8. Interests - 136 111 81 49 20
9. Repayment of Loan - 173 220 260 260 260
B. Total Disposals 1676 309 331 341 309 280
C. Opening Balance - - 114 344 711 1092
D. Net Surplus - 114 230 367 381 392
E. Closing Balance - 114 344 711 1092 1484
Projected Balance Sheets: (Rs. in thousand)
Sl. No.
Description Amount as at the end of the
1st Yr. 2nd Yr. 3rd Yr. 4th Yr. 5th Yr.
1. Capital Account of the promoters 84 261 601 1118 1649
2. Surplus from operation 177 340 517 531 542
NET WORTH 261 601 1118 1649 2191
3. Subsidy 419 419 419 419 419
Composite Loan 1000 780 520 260 -
A. Total Liabilities 1680 1800 2657 2328 2610
1. Gross Fixed Assets 1175 1175 1175 1175 1175
Less Depreciation 110 220 330 440 550
NET BLOCK 1065 955 845 735 625
2. Current Assets/W/C 501 501 501 501 501
3. Cash & Bank Balance 114 344 711 1092 1484
B. Total Assets 1680 1800 2057 2328 2610
Address: ASHOK MACHINE, KANTA GAS STREET, NEHRUNAGER, DHEBER ROAD, ATIKA, RAJKOT.

158
LOW DENSITY POLYETHYLENE FILMS AND BAGS
Introduction: Low Density Polyethylene (LDPE) is Thermoplastic raw material used for packaging. LDPE sheets are transparent, tough, non-toxic, Chemically fairly inert and impermeable by moisture. It is therefore, popular material for packing food, textile, etc. It is used primarily as Bags. Bureau of Indian Standard Specify its quality as per IS-LDPE-2508-1977 and IS-2508-1977. Market: LDPE Films and Bags are used for packing by Small Bakeries, Confectionery, Textile Shops, Hosiery producers, Grocery shops, etc. in Tripura. Bakeries, Dal-mutt manufacturers, Bag wholesalers are bulk consumers of LDPE Bags in Tripura. In Tripura even curry is packed in LDPE Bags by small restaurants and hence LDPE Bags are very popular packaging material. Thus there is excellent scope for marketing LDPE Bags in the State. Installed Capacity: Assuming that the Unit will operate for Single Shift of 8 hours per day for 300 working days the annual installed capacity is estimated at 90 MT of LDPE Blown Films & /or equivalent quantum of Bags. Process of Manufacture: LDPE Granules are matter and extruded though the Die of the Blown Film plant. In the plant air is blown into the molten LDPE to form blown films. Films are cooled to give permanent shape in the Plant by the air. Sizing rings of the Plant cuts the film to sizes. The film is then drawn through a pair of nip-rolls in the plant to the winding machine. The cooled blown film winded in rolls is then placed in the Bag-making machine, where bags of various sizes are made by use of dies. Bags so made are packed so that each package contain are kilogram of Bags. Raw Materials: The Unit shall need 95 MT of LDPE Granules per annum at the installed capacity costing Rs. 45,08,000/=. It is available indigenously from Petrochemical Units and dealers such as the following:
1. Alkali & chemical corporation of India, 24, Chowranghee, Kolkata 2. Satyam Plastic Works, 2, JB Market, Jail Road, Guwahati, 781 001. 3. Classic Plastic Pvt. Ltd., 32, Ezra Street, R-668, Sixth Floor, Kolkata, - 700 001. 4. Sunny Deys, 129/1, Bangur Avenue, Block-B, 1st Floor, Kolkata- 700 055. 5. Unitech Plastics Pvt. Ltd., 25 A & B, Radha Madhab Dutta Garden Lane, Kolkata- 700 010.
Power: The Unit will need a total connected Load of 15 KW at 400/440 Volts, 50 HC, AC, three phase & 4 wire. The annual consumption of power is estimated at 10, 295 KWHrs. Costing Rs. 20,384/=. The power is readily available from the State Electricity supply Corporation through its Grid. Water: The Unit will need 5000 liters. Of water per day out of which 4000 Liters. Shall be recycled by using a 0.5 HP pump of the blown film Plant. Therefore, the consumption of 1000 Liters. of water per day is estimated. It is available from both ground water sources and public supply. Manpower: Apart from the two skilled persons operating the blown films & Bag Making Plant all manpower is readily available in Tripura. The requirement and annual costs of manpower at the installed capacity is shown below:
Sl.No. Category of Manpower No. of persons Annual Costs
1 Manager 1 Rs. 92,400
2 Office Assistants 2 Rs, 1,05,600
3. Skilled Worker 2 Rs. 1,32,000
4. Unskilled Workers 4 Rs. 1,32,000
Total 9 Rs. 4,62,000

159
CAPITAL COST ESTIMATE
1. Land & Building with a covered area of 120 Sq. Mtrs.: On rent 2. Plant & Machinery (a) One Blown Film Plant with 65 mm extruder, Rs. 6,00,000 42”nip rollers, Air Computers or, water pump, etc. with 12 HP Motors. (b) One Automatic Bag Making machine with dies Rs. 1,80,000 (c) Testing equipments Rs. 60,000 (d) Freight, Tax,etc. on above Rs. 1,20,000 Rs. 9,60,000 3. Miscellaneous Fixed Assets (a) Electrification Rs. 1,10,000 (b) Water Installation Rs. 27,500 © Furniture & Miscellaneous others Rs. 82,500 Total: Rs. 2,20,000 4. Provision for c contingencies Rs. 55,000 5. Preliminary & Pre-operative expenses Rs. 1,37,500 Total fixed Costs: Rs.13, 72,500 6. Working Capital: (a) Raw Materials for 1 months Rs. 4,12,500 (b) Utilities for 1 month Rs. 1,698 © Wages & Salaries for 1 Month Rs. 38,500 (d) Other expenses for 1 month Rs. 98,402 Total Working Capital: Rs. 5,51,100 TOTAL PROJECT COST: Rs.19,23,600
Means of finance: URBAN RURAL 1. Composite Loan: Rs. 13,46,520 Rs. 11,54,160 2. Subsidy: Rs. 4,80,900 Rs. 6,73,260 3. Promoters’ Contribution: Rs. 96,180 Rs. 96,180 4. Debt. Equity Ratio: 2.33:1 1.50:1 Profitability: (Rs. In Thousands) Sl.No. Description 1st Yr. 2nd Yr. 3rd Yr. 4th Yr. 5th Yr.
1. Capacity Utilized 60% 70% 80% 80% 80%
2. Annual sales Realization 4782 5579 6376 6376 6376
3. Annual Costs
(a) Raw Materials 2970 3465 3960 3960 3960
(b) Power 15 18 21 21 21
(c) Wages & Salaries 429 451 462 462 462
(d) Repair & Maintenance 53 53 53 53 53
(e) Administrative overheads 132 139 145 153 161
(f) Selling expenses 712 837 956 956 956
(g) Depreciation 132 132 132 132 132
(h) Interest on Composite Loan 150 122 89 54 22
Total Cost 4593 5214 5818 5803 5791
Variable Costs 3697 4320 4937 4937 4937
4. Annual Profit 189 362 558 573 585
5. Return on Investment 9.82% 18.82% 29.01% 29.79% 30.42%
6. Return on sales 3.95% 6.48% 8.75% 8.98% 9.17%

160
7. Annual Contribution 1085 - - - -
8. Break Even Point 49.54 - - - -
9. Cash Accrual 321 497 690 705 717
10. Debt Servicing Capacity 471 616 779 759 739
11. Repayment of Loan 218 225 291 291 292
12. Debt Serviced 368 377 380 345 313
13. Pay Back Period 1 Years 2 months 11 days
14. Debt Service Coverage Ratio 1:28:1
Cash Flow Statement: (Rs. in thousands)
Sl. No.
Description Pre- operative Period
O p e r a t I n g Y e a r s
1st 2nd 3rd 4th 5th
1. Increase in promoter’s capital 96 - - - - -
2. Increase in subsidy 480 - - - - -
3. Increase in Composite Loan 1346 - - - - -
4. Depreciation - 132 132 132 132 132
5. Profit before interests - 339 489 647 627 607
A. Total Sources 1925 471 616 779 759 739
6. Increase in capital investments 1372 - - - - -
7. Increase in Working Capital 551 - - - - -
8. Interests - 150 122 89 54 22
9. Repayment of Loan - 218 225 291 291 292
B. Total Disposals 1923 368 371 380 345 314
C. Opening Balance - - 103 342 791 1155
D. Net Surplus - 103 239 399 414 425
E. Closing Balance - 103 342 741 1155 1580
Projected Balance Sheets: (Rs. in thousand)
Sl. No.
Description Amount as at the end of the 1st Yr. 2nd Yr. 3rd Yr. 4th Yr. 5th Yr.
1. Capital Account of the promoters 96 285 647 1205 1778
2. Surplus from operation 189 362 558 573 585
NET WORTH 285 647 1205 1778 2363
3. Subsidy 480 480 480 480 480
Composite Loan 1129 874 583 292 -
A. Total Liabilities 1894 2001 2268 2550 2843
1. Gross Fixed Assets 1372 1372 1372 1372 1372
Less Depreciation 132 264 396 528 660
NET BLOCK 1240 1108 976 844 712
2. Current Assets/W/C 551 551 551 551 551
3. Cash & Bank Balance 103 342 741 1155 1580
B. Total Assets 1894 2001 2268 2550 2843
Sources of Machinery
1. Kolsite Industries, 31,Shah Industrial Estate, Andheri (W), Mumbai – 400 058 2. Neptune Plastic & Metal Industries, 18, R.N. Mukherjee Road, 7th Floor, Kolkata- 700011. 3. R.H. Winsor (India) Ltd., E-6, U Road, Thana Industrial Estate, THANE.

161
PLASTIC MOULDED HOUSEHOLD ITEMS. Introduction: In human life, plastic items have great utility. There is hardly, any aspect of human activity which is untouched by the use of plastics. Light weight, durables, reasonable costs, fine finishing and different colours are the qualities found in plastic and are the reasons as well for replacing wood, iron and other metallic items. Seeing the wide use of plastic these days, it is also called the ‘plastic era’. Market: There are a no. of objects of daily use that are made of plastic. In the context, certain small objects made out of less than 45 gms-soap case, pencil box, plastic spoons, comb, battery caps, taps furniture parts or the wheels of coolers etc. If set up at home, this unit, can be reasonable lucrative. In the given unit such small plastic objects have been discussed. Production process: The plastic material is fed into the hopper of the injection moulding machine, which essentially has a injection unit and a multifamily mould system. The mould is held in between the two platens which are kept closed by the looking pressure and the material which get plasticized in the barrel, is injected under higher pressure into the mould which results in a moulded article. The article. The articles are then finished by removing the injection feed etc. Then the second stage processing operation viz. butting, polishing, printing are carried out on the articles. These are then kept inside plastic water proof paper covers and packed. Process flow: Production Target:
Sl.No. Products Quantity Rate
1. Soap Case 35,000/- Rs. 5,25,000/-
2. Tiffin Box 20,000/- Rs. 5,00,000/-
3. Pencil Box 25,000/- Rs. 5,00,000/-
4. Mug 35,000/- Rs. 5,25,000/-
5. Jug 2,000/- Rs. 7,00,000/-
6. Combs 80,000/- Rs. 4,00,000/-
Total: Rs. 31,50,000/-
Raw Materials: The principal raw material of the Unit is Injection Moulding Grade Polypropylene, which is available from M/s Indian Pertrochemicals Ltd, Vadodara. The annual requirements and costs of raw- materials at the installed capacity is shown below: a) Polypropylene: Injection moulding grade 36 M.T. Rs. 20,00,000/- b) Mould releasing agent/lubricant L.S. Rs. 23,18,000/- c) Packing Boxes & Paper etc. L.S. Rs 1,90,000/- Total Raw Material: Rs. 45,08,000/-
Plastic material Injection moulding
machine
Moulded article Buffing
Polishing Printing Packing Sales

162
Power: The Unit will need a total connected Load of 15 KW at 400/440 Volts, 50 HC, AC, three phase & 4 wire. The annual consumption of power is estimated at 10, 295 KWHrs. Costing Rs. 18,531/=. The power is readily available from the State Electricity supply Corporation through its Grid. Water: The Unit will need 5000 liters. Of water per day out of which 4000 Liters. Shall be recycled by using a 0.5 HP pump. Therefore, the consumption of 1000 Liters. of water per day is estimated. It is available from both ground water sources and public supply. Manpower: Apart from the two skilled persons operating the blown films & Bag Making Plant all manpower is readily available in Tripura. The requirement and annual costs of manpower at the installed capacity is shown below:
Sl.No. Category of Manpower No. of persons Annual Costs
1 Manager 1 Rs. 84,000
2 Office Assistants 2 Rs, 96,000
3. Skilled Worker 2 Rs. 1,20,000
4. Unskilled Workers 4 Rs. 1,20,000
Total 9 Rs. 4,20,000
Capital Cost Estimate: A. Fixed Capital 1) Land & Building 1,000 sq.ft. Rented 2) Plant & Machinery i) Semi automatic hydraulic injection Rs. 2,00,000/- moulding machine with all accessories ii) Scrap grinder Rs. 75,000/- iii) Buffing, polishing and hot stamping machine Rs. 75,000/- iv) Moulds (4 sets) Rs. 2,00,000/-v) Small hand tools, greasing and costing equipments Rs. 10,000/- vi) Testing instruments such as micrometer, balance etc. Rs. 15,000/- vii) Installation and electrification Rs. 2,00,000/- viii) Office equipments and workshop furniture Rs. 25,000/- Total: Rs. 8,00,000/ 3. Miscellaneous Fixed Assets (a) Electrification Rs. 1,00,000/- (b) Water Installation Rs. 25,000/- © Furniture & Miscellaneous others Rs. 75,000/- Total: Rs. 2,00,000/- 4. Provision for c contingencies Rs. 50,000/- 5. Preliminary & Pre-operative expenses Rs. 1,25,000/-
Total fixed Costs: Rs.11, 75,000/- 6. Working Capital: (a) Raw Materials for 1 months Rs. 3,75,000/- (b) Utilities for 1 month Rs. 1,544/- (c) Wages & Salaries for 1 Month Rs. 35,000/- (d) Other expenses for 1 month Rs. 89,456/- Total Working Capital: Rs. 5,01,000/- TOTAL PROJECT COST: Rs.16,76,000/-

163
Means of finance: URBAN RURAL 1. Composite Loan: Rs. 11,73,200 Rs.10,05,600 2. Subsidy: Rs. 4,19,000 Rs. 5,86,600 3. Promoters’ Contribution: Rs. 83,800 Rs. 83,800 4. Debt. Equity Ratio: 2.33:1 1.50:1 Profitability: (Rs. In Thousands) Sl. No.
Description 1st Yr. 2nd Yr. 3rd Yr. 4th Yr. 5th Yr.
1. Capacity Utilized 60% 70% 80% 80% 80%
2. Annual sales Realization 4347 5072 5796 5796 5796
3. Annual Costs
(a) Raw Materials 2700 3150 3600 3600 3600
(b) Power 14 16 19 19 19
(c) Wages & Salaries 390 410 420 431 442
(d) Repair & Maintenance 48 48 48 48 48
(e) Administrative overheads 120 126 132 139 146
(f) Selling expenses 652 761 869 869 869
(g) Depreciation 110 110 110 110 110
(h) Interest on Composite Loan 136 111 81 49 20
Total Cost 4170 4732 5279 5265 5254
Variable Costs 3366 3927 4488 4488 4488
4. Annual Profit 177 340 517 531 542
5. Return on Investment 10.56 20.29 30.85 31.68 32.34
6. Return on sales 4.07 6.70 8.92 9.16 9.35
7. Annual Contribution 981 - - - -
8. Break Even Point 49.17 - - - -
9. Cash Accrual 2.87 450 627 641 652
10. Debt Servicing Capacity 423 561 708 690 672
11. Repayment of Loan 173 220 260 260 260
12. Debt Serviced 309 331 341 309 280
13. Pay Back Period 2 Years 8 months 11 days
14. Debt Service Coverage Ratio 1:95:1
Cash Flow Statement: (Rs. in thousands) Sl. No.
Description Pre-operative Period
O p e r a t I n g Y e a r s
1st 2nd 3rd 4th 5th
1. Increase in promoter’s capital 84 - - - - -
2. Increase in subsidy 419 - - - - -
3. Increase in Composite Loan 1173 - - - - -
4. Depreciation - 110 110 110 110 110
5. Profit before interests - 313 451 508 580 562
A. Total Sources 1676 423 561 708 690 672
6. Increase in capital investments 1175 - - - - -
7. Increase in Working Capital 501 - - - - -
8. Interests - 136 111 81 49 20
9. Repayment of Loan - 173 220 260 260 260
B. Total Disposals 1676 309 331 341 309 280
C. Opening Balance - - 114 344 711 1092
D. Net Surplus - 114 230 367 381 392
E. Closing Balance - 114 344 711 1092 1484

164
Projected Balance Sheets: (Rs. in thousand)
Sl. No.
Description Amount as at the end of the 1st Yr. 2nd Yr. 3rd Yr. 4th Yr. 5th Yr.
1. Capital Account of the promoters 84 261 601 1118 1649
2. Surplus from operation 177 340 517 531 542
NET WORTH 261 601 1118 1649 2191
3. Subsidy 419 419 419 419 419
Composite Loan 1000 780 520 260 -
A. Total Liabilities 1680 1800 2657 2328 2610
1. Gross Fixed Assets 1175 1175 1175 1175 1175
Less Depreciation 110 220 330 440 550
NET BLOCK 1065 955 845 735 625
2. Current Assets/W/C 501 501 501 501 501
3. Cash & Bank Balance 114 344 711 1092 1484
B. Total Assets 1680 1800 2057 2328 2610
Suppliers of Plastic moulds and machinery 1) Bijali Industries 77/1 Bidhan Sarani, Kolkata – 6 2) Luna Plastic Works Pvt. Ltd. 8, Cossipore Road, Kolkata – 2. 3) J.L. Enterprises, 50/1, Tanupukur Road, Dhakuria, Kolkata – 31.
165
SERVICE UNITS

166
TWO WHEELER REPAIRING & SERVICING UNIT Introduction: Two wheelers in the present time have become a necessity of every lower middle and middle class. Various new models have been introduced in the market. Even in the village two wheelers have become a necessity. With departments and various organizations ending the loan facility to all the employees the number of two wheelers has registered a sharp increase. Market: The efficiency and workability of every vehicle depends on its regular servicing and through examinations by the specialist of two wheelers. Every vehicle should be compulsory taken for examination and servicing on a quarterly basis. Besides, frequent repair work is also required due to frequent wear & tear in the vehicles. Therefore, if a servicing and repairing unit is set up there are good possibilities of its success. Since servicing & repairing of vehicles requires a specific type of training / experience, it is expected of entrepreneurs to be fully trained in the job. Capacity: Various types of services will be provided in the unit for example, complete of the vehicles, washing, oiling/ greasing and job on engine, etc, besides these services, replacement of spare parts will be also be done. Overall services provided to the customers in a year will amount to total receipts of about Rs.12,03,500/- Process: The process of servicing / Repairing of two wheeler vehicles first & foremost involves complete examination to detect the defect in the vehicles. After thoroughly examining the vehicle, a complete estimate, of all the expenditures involved and the components/ spare parts to be fitted in the vehicles is given to the customer and then the vehicle is serviced / repaired as per the requirements. Raw Materials: Raw materials to be used in the unit are available in the local market. The annual requirements and costs of raw- materials are shown below:
a. Gear oil Rs. 52,800/- b. Lubrication grease Rs. 26,400/-
c. Spare parts like grip cover, head light, break shoes, Rs.5,28,000/- fluid pin, nut, gear, wires, cloth wires, rubber mats, silencer, seat covers, other rubber parts, wipe cloth for vehicles etc.
Total Rs. 6,07,200 /- Water: There should be a tube well or water supply tap connection near the unit for arrangement of water. Annual requirement of water is estimated at about 3000 Ltrs. Power: The annual expenditure will be Rs.26,400/- for 13,333 KWHrs of electricity consumed.. Manpower; Three skilled worker / labour and two assistant labour can take care of the unit. Management, Marketing and accounting the promoter can do himself the activities. The requirement cost of manpower is shown below: Sl.No. Category No of persons Annual Cost 1. Manager 1 Self 2. Skilled worker 3 Rs.1,58,400/- 3. Assistant 2 Rs. 79,200/- Total 6 Total Rs.2,37,600 /-

167
CAPITAL COST ESTIMATE: A. Fixed Capital 1. Land & Building 1000 sq .ft Rented 2. Plant & Machinery a. Air Compressor Rs. 18,000/- b. Service machine/ Pressure machine to wash vehicles Rs. 19,800/- c. Water pump Rs. 10,800/- d. Water tank Rs. 15,000/- e. Work place for servicing Rs. 24,000/- f. Tools (6-7)no 32 nos, spanners/ Rs. 48,000/- fixes, screw drivers ( 3 sizes), hammers,
Tyres, and other equipments like compressor, tester such grinder, Hand grinder, hand drill etc. --------------- Rs. 1,35,600/-
3. Furniture & Fixtures Rs. 11,000/- 4. Preliminary & Preoperative expenses Rs. 16,500/- 5. Electrification & Water Rs. 27,500/- Total Fixed Costs: Rs. 1,90,600/- B. Working Capital:for 3 months
1. Raw materials Rs. 1,51,800/- 2. Power Rs. 6,600/- 3. Wages and salaries Rs. 25,300/- 4. Misc. expenses Rs. 2,750/- Total Working Capital: Rs. 1,86,450/-
Total Project Cost: Rs. 3,77,050/- Means of Finance: Urban Rural a. Composite loan under PMEGP 70% Rs.2,63,935 /- 60% Rs. 2,26,230/- b. Subsidy 25% Rs. 94,263/- 35% Rs. 1,31,968/- c. Margin Money 5% Rs. 18,852/- 5% Rs. 18,852/- Debt Equity Ratio 2.33:1 1.50:1 Profitability: (Rs. In Thousands) Sl.No. Description 1st Year 2nd Year 3rd year 4th Year 5th Year
1. Capacity utilized as percent of installed capacity
60 70 80 80 80
2. Annual Sales 794 927 1059 1059 1059
3. Annual Costs in
(a) Raw Materials 364 425 486 486 486
(b) Utilities 28 32 37 37 37
(c) Selling expenses 4 5 5 5 5
4 Variable Cost 396 462 528 528 528
(a) Wages & Salaries 143 166 190 190 190
(b) Administrative expenses 79 92 106 106 106
(c) Depreciation 19 19 19 19 19
(d) Interest on Composite Loan 31 25 18 11 4
5 Fixed & Semi Variable Cost 272 283 333 326 319
6 Total Cost 668 745 861 854 847
7. Annual profit 126 182 198 205 212

168
8 Return on investment 33.42% 48.27% 52.51% 54.37% 56.23%
9. Return on sales 15.86% 19.63% 18.69% 19.35% 20.01%
10. Annual Contribution 398 - - - -
11 Break Even Point as percent of capacity
41.00% - - - -
12 Cash accrual 145 201 217 224 231
13. Debt servicing capacity 176 226 235 235 235
14 Repayment of Composite Loan 43 50 57 57 57
15. Debt serviced 54478 65658 66050 59760 53470
16 Pay Back Period 2 yrs 5 month 22 days
17. Debt Service Coverage Ratio (DSCR)
2.48:1
Cash Flow Statement: (Rs. In Thousands) Sl. No.
Description Pre-operative Period
O p e r a t i n g Y e a r s
60% 70% 80% 80% 80%
First Second Third Fourth Fifth
1. Increase in Promoter’s capital 19 NIL NIL NIL NIL NIL
2. Increase in composite loan 264 NIL NIL NIL NIL NIL
3 Increase in Subsidy 94 NIL NIL NIL NIL NIL
4. Depreciation --- 19 19 19 19 19
5. Profit before interests ---- 157 207 216 216 216
A. TOTAL SOURCES 377 176 226 235 235 235
6. Increase in capital investment 191 NIL NIL NIL NIL NIL
7. Increase in working capital 186 NIL NIL NIL NIL NIL
8. Interests NIL 31 25 18 11 4
9. Repayment of loan NIL 43 50 57 57 57
B. TOTAL DISPOSALS 377 74 75 75 68 61
C. OPENING BALANCE NIL NIL 102 253 413 560
D. NET SURPLUS NIL 102 151 160 167 174
E. CLOSING BALANCE NIL 102 253 413 580 754
Projected Balance sheet: Sl.No. Description Amount in Rs. Thousands as at the end of the
1st Yr. 2nd Yr. 3rd Yr. 4th Yr. 5th Yr.
1. Capital Account of the Promoter 19 145 327 525 730
2 Surplus from operations 126 182 198 205 212
NET WORTH: 145 327 525 730 942
3. Composite loan 221 171 114 57 Nil
4. Subsidy 94 94 94 94 94
A. TOTAL LIABILITIES 460 592 733 881 1036 1. Gross Block 191 191 191 191 191 Less Depreciation 19 38 57 76 95 2 NET BLOCK 172 153 134 115 96
3 Current Assets 186 186 186 186 186 4. Cash & Bank Balance 102 253 413 580 754
B. TOTAL ASSETS 460 592 733 881 1036

169
AUTOMOBILE WORKSHOP Introduction: In land locked hilly areas Road Transport is the principal mode of transport. As such in NE Region “vehicle- on- road” is very large. These vehicles need regular repair & maintenance. Automobile Workshop (Repair & Servicing) is therefore an important servicing industry for ensuring better transport services in locations like NE Region. Automobile Workshop provides services of preventive maintenance of motor vehicles as well as for repairs and overhauls. Preventive maintenance cuts the down time and increases life of the vehicle a reliable and well equipped automobile workshop is a must for this purpose. Usually such Workshop particularly undertakes servicing of cars with the active collaboration of car manufactures as an authorized station. Market: Automobile servicing, Auto-electric repair, Engine alignment & repair, body repair & denting works etc are frequently required services of any vehicle. Vehicles need to use roads in various conditions and hence often breaks down. Such vehicles are pulled by crane to repair & service centers. The skill of the mechanic/engineer is the key to trouble-shooting in vehicles. In Tripura in 2001 as many as 45,199 vehicles were operating. The number has increased many- fold since then. From mere 415 accidents by various types of vehicles the average annual accidents have increased to more than 1300 per annum. The demand for Automobile repair & servicing has increase by 5 times since 2001. Therefore, there is good scope for Automobile repair & servicing workshops, especially along the National Highway and larger towns. Capacity: The proposed automobile repairing and servicing unit shall operate for single shift of 8 hours per day for 300 working days per annum. Based on average need of services during this period the unit may be able to repair & service 2400 vehicles per annum at the full capacity. Process: The process of repair & service of automobile depend or the extent of damage of vehicle. This is assessed by expert mechanic/engineer of the unit. As per this assessment denting, repair, etc works are done. Raw Materials: Raw materials are to be sourced mainly from the open market. At present availability and supply of the raw materials is not problem e.g spare parts, paints etc to be sourced from open markets.The requirements of raw materials for automobile workshop operations are as under: a. Spare parts b. Lubricants & Greases c. Electrical accessories d. Paints e. Detergents & Chemicals f. Upholstery & other consumable materials. Power: The unit will require a total connected load of 12.5 KVA. Annual consumption of power is estimated at 14,634 KWHrs costing Rs. 60,000/-. Water: The unit shall avail of the PHE water supply already available at the site and it can also install its own tube well for the purpose. Water requirements is 2000 Liters per day. Products: The workshop will have facilities for a. General Servicing of the motor car, b. Car washing and cleaning, c. Cleaning of upholstery, d. Wheel alignment and balancing, e. Exhaust gas checking and tuning of engine, f. Change of oils (Engine oil and gear), g. Engine overhaul & re-boring, h. Removal of

170
dents and painting, i. Repair & Replacement of components, j. Greasing of components and k. Electrical repair and replacement. Manpower: Manpower required by the Unit are locally available. The requirements and costs of manpower is shown below:
Sl.No. Designation Nos. Amount (Rs.)
1. Manager cum Chief Mechanic Self -
2 Skilled worker 2 10,000/-
3. Semi-skilled 1 3,000/-
4. Helper 2 4,000/-
Total: 17,000/-
Capital Cost: 1. Land : The unit requires about 5000 sq. mtrs of land. On rent 2. Building with covered area of 2000 sq. mtrs to be constructed: Rs. 1,50,000/- 3. Plant & Machinery:
Sl.No. Machinery Equipments Nos. Amount (Rs.)
1. Electro Mechanical 2 post Lift 1 1,51,112
2. Car washer (LL03) 1 65,334
3. Compressor TS07 1 88,889
4. Pneumatic gun 2 16,889
5. Spark plug Tester 1 16,445
6. Hydrolic Jack (Troly Type) 2 8,000
7. Double Ended Spanner (6x7-30x32mm) 2 1,065
8. Ring Spanner (6x7-30x32mm) 2 1,760
9. Ball pin hammer 2 365
10 Plus 165mm long 2 311
11 Socket set 9-14m(22 sockets+5Accessories) (2,9,10,11,12,13,14,15,16,17,18,19,21,22)
2 5,387
12 Plug Wrench 2no 116
13 Screw Drivers: 902, 824, 827, 929,etc 2 each 500
Total 3,56,173
VAT, Installation, etc 69,454
Total 4,25,627
4. Miscellaneous Fixed Assets: i) Electrification Rs. 6,000/- ii) Furniture & fixture Rs. 5,500/- iii) First aid box Rs. 2,000/-
Rs. 13,500/- 5. Preliminary & Pre-operative expenses Rs. 5,000/- Total Fixed Capital: Rs. 5,94,127/- 6. Working Capital (P.M.)
Raw Materials (A) Diesel, Petrol, Kerosine, Lubricants, Painting L.S. Rs. 22,000/-
materials, Grease, other consumable materials (B) Spare parts Rs. 15,500
(C) Salary & Wages Rs. 17,000/-

171
(D) Utilities Rs. 5,000/- (E) Misc. Overheads: Rs. 15,788/- Total Working Capital per month: Rs. 75,288/-
Total Cost of the Project : Rs. 6,69,415/- Means of Finance: Urban Rural 1. Composite Loan under PMEGP 70% Rs. 4,68,591/- 60%Rs. 4,01,649/- 2. Subsidy 25% Rs. 1,67,354/- 35%Rs. 2,34,295/- 3. Margin Money 5% Rs. 33,470/- 5% Rs. 33,471/- Total Rs. 6,69,415/- Rs. 6,69,415/- 4. Debt equity Ratio: 2.33:1 1.50:1 Profitability:
Sl.No.
Description 1st Year 2nd Year 3rd year 4th Year 5th Year
1. Capacity utilized as percent of installed capacity
60 70 80 80 80
2. Annual Sales Rs. 7,92,000 9,24,000 10,56,000 10,56,000 10,56,000
3. Annual Costs in Rs.
(a) Raw Materials 2,70,000 3,15,000 3,60,000 3,60,000 3,60,000
(b) Utilities 36,000 42,000 48,000 48,000 48,000
(c) Interest on Working capital 6,647 6,588 7,529 7.529 7,529
(d) Selling expenses 36,000 42,000 48,000 48,000 48,000
4 Variable Cost 3,48,647 4,05,588 4,63,529 4,63,529 4,63,529
(a) Wages & Salaries 1,22,400 1,42,800 1,63,200 1,63,200 1,63,200
(b) Administrative expenses 77,674 90,619 1,03,565 1,03,565 1,03,565
(c) Depreciation 59,412 59,412 59,412 59,412 59,412
(d) Interest on Composite Loan 53,825 43,535 31,661 18,997 6,332
5 Fixed & Semi Variable Cost 3,13,311 3,36,366 3,57,838 3,45,174 3,32,509
6 Total Cost 6,61,958 7,41,954 8,21,367 8,08,703 7,96,038
7. Annual profit 1,30,042 1,82,046 2,34,633 2,47,297 2,59,962
8 Return on investment 13.13% 21.45% 31.59% 33.30% 35.00%
9. Return on sales 9.88% 13.79% 17.76% 18.73% 19.69%
10. Annual Contribution 4,43,353 5,18,412 5,92,471 5,92,471 5,92,471
11 Break Even Point as percent of capacity
42.40 45.42 48.31 46.61 44.88
12 Cash accrual 1,89,454 2,41,458 2,94,045 3,06,709 3,19,374
13. Debt servicing capacity 2,43,279 2,84,993 3,25,706 3,25,706 3,25,706
14 Repayment of Composite Loan 75,988 88,652 1,01317 1,01317 1,01317
15. Debt serviced 1,29,813 1,32,187 1,32,978 1,20,314 1,07,649
16 Pay Back Period 2 years 5 month 2 days
17. Debt Service Coverage Ratio (DSCR)
2.42:1

172
Cash Flow Statement:
Sl. No.
Description Pre-operative Period
O p e r a t i n g Y e a r s
First Second Third Fourth Fifth
1. Increase in Promoter’s capital
33,470 NIL NIL NIL NIL NIL
2. Increase in composite loan 4,68,591 NIL NIL NIL NIL NIL
3 Increase in Subsidy 1,67,354 NIL NIL NIL NIL NIL
4. Depreciation NIL 59,412 59,412 59,412 59,412 59,412
5. Profit before interests NIL 1,83,867 2,25,581 2,66,294 2,66,294 2,66,294
A. TOTAL SOURCES 6,69,415 2,43,279 2,84,993 3,25,706 3,25,706 3,25,706
6. Increase in capital investment
5,94,127 NIL NIL NIL NIL NIL
7. Increase in working capital 75,288 NIL NIL NIL NIL NIL
8. Interests NIL 53,825 43,535 31,661 18,997 6,332
9. Repayment of loan NIL 75,988 88,652 1,01317 1,01317 1,01317
B. TOTAL DISPOSALS 6,69,415 1,29,813 1,32,187 1,32,978 1,20,314 1,07,649
C. OPENING BALANCE NIL NIL 1,13,466 2,66,272 4,59,000 6,64,392
D. NET SURPLUS NIL 1,13,466 1,52,806 1,92,728 2,05,392 2,18,057
E. CLOSING BALANCE NIL 1,13,466 2,66,272 4,59,000 6,64,392 8,82,449
Projected Balance sheet: Sl. No.
Description Amount in Rupees as at the end of the
1st Yr. 2nd Yr. 3rd Yr. 4th Yr. 5th Yr.
1. Capital Account of the Promoter 33,470 1,63,512 3,45,558 5,80,191 8,27,488
2. Surplus from operations 1,30,042 1,82,046 2,34,633 2,47,297 2,59,962
NET WORTH: 1,63,512 3,45,558 5,80,191 8,27,488 10,87,450
3. Composite loan 3,92,603 3,03,951 2,02,634 1,01,317 NIL
4. Subsidy 1,67,354 1,67,354 1,67,354 1,67,354 1,67,354
A. TOTAL LIABILITIES 7,23,469 8,16,863 9,50,179 10,96,159 12,54,804
1. Gross Block 5,94,127 5,94,127 5,94,127 5,94,127 5,94,127
Less Depreciation 59,412 1,18,824 1,78,236 2,37,648 2,97,060
2 NET BLOCK 5,34,715 4,75,303 4,15,891 3,56,479 2,97,067
3 Current Assets 75,288 75,288 75,288 75,288 75,288
4. Cash & Bank Balance 1,13,466 2,66,272 4,59,000 6,64,392 8,82,449
B. TOTAL ASSETS 7,23,469 8,16,863 9,50,179 10,96,159 12,54,804
Names and Address of Machinery and Equipments Suppliers: 1. MODERN MACHINE TOOLS, DHEBAR ROAD, OPPOSITE MEHTA PETROL PUMP, RAJKOT - 360 001, Phone: +(91)-(281)-2234640
2. JUPITER MACHINE TOOLS, JUPITER HOUSE, ROAD NO- 27, SHANTI NAGAR, WAGLE ESTATE THANE - 400 604. Phone: +(91)-(22)-25803729/25820843 Fax: +(91)-(22)-25804823
3. KANCHAN MACHINE TOOLS, S. NO. 1, KUDALE PATIL COMPLEX, OPPOSITE PUSHPAK MANGAL KARYALYA, MANIKBAUG, PUNE - 411 051. Phone: +(91)-(20)-56286812

173
LOUNDRY & DRY CLEANING SERVICE Introduction: Dry cleaning is an important Service enterprise which caters to the requirements of washing and cleaning of garments. It is especially suited in the urban areas, where demand from middle and upper middle class households exists. Dry cleaning is mainly suitable for cleaning of costly fabrics and garments like Suits, Silk and Acrylic garments, Saries, Blankets, Sweaters, Coats, Jackets, etc. Dry cleaning is also suitable to clean clothes and garments made of sensitive fabrics. Market/Demand: The market mainly exists in the urban and sub-urban areas with comparatively higher income levels. The demand will come mainly from the households and institutions like hotels, hospitals, boarding homes, etc. Dry cleaning services have always had a good scope in the urban areas. In such areas, many working couples and families regularly use dry cleaning and laundry services due to its convenience. Considering the increasing urbanization and rise of income levels, the demand for dry cleaning services has increased. Dry cleaning is also becoming important as it saves time and removes the drudgery of washing/ cleaning clothes. Besides households and the hotel and tourism industry, there is also good demands from organizations like police/military etc. Capacity: Various types of press of Sharee Shirt/ pant etc. Coat and Dry cleaning of Garments Jacket Coat Pant Sharee will be provided in the unit. Overall services provided to the customers in a year will amount to total receipts of about Rs.12,03,500/- Raw Materials: Various types of raw materials (i.e Detergents, Chemicals, acid etc. Patching papers and consumables to be used in the unit. These are available in the local market. Rs.31,350/- to be required for this unit. Power: The power is available from the state Electric supply corporation Grid. The annual consumption of power is estimated Rs. 1,80,000/-. Water : There should be a tube well or water supply tap connection near the unit for arrangement of water. Annual requirement of water is estimated at 450000 Ltrs. Manpower: Manpower required by the unit including skilled workers is locally available. The requirement and annual costs of manpower at the installed capacity is shown below:
Sl.No. Category of Manpower No. of Persons Annual Cost in Rs. 1. Manager 1 Self
2. Skilled Worker 2 1,20,000/-
3. Helper 2 96,000/-
Total 5 2,16,000/-
Financial Aspects of the Projects: A. Fixed Capital 1. Land & Building 3000 sq .ft Rented 2. Plant & Machinery
Sl.No. Descriptions Qty. Amount
i) Dry cleaning machine of 10 kg capacity automatic reversing with timer
1 55,000/-
ii) Hydro extractor 10 kg capacity complete with single phase motor
1 33,000/-

174
iii) Drying tumbler 10 kg capacity automatic reversing, electrically heated with timer, blower etc.
1 35,000/-
iv) Electric Irons 5 15,000/-
v) Wiring & Installation charges 4,550/-
Total 1,42,550/-
B. Miscellaneous Fixed Assets
Sl.No. Particulars Amount (Rs.)
i) Different types of Racks with Glass and wooden make 1 No 20,000/-
ii) Showcase 1no 15,000/-
iii) Chair/Working Table and Signboard/ Air condition, fan, Lighting
1 no 22,700/-
Total 57,700/-
6. Working Capital (P.M.) a) Raw Material Rs. 31,350/- b) Utilities Rs. 1,800/- c) Salary & Wages Rs. 18,000/- d) Other expenses Rs. 15,000/- Total: Rs. 66,150/- Total working capital for 3 months: Rs. 1,98,450/- Total Project Cost: Rs. 3,98,700/- Means of Finance: Urban Rural 1. Composite loan 2,79,090/- 2,39,220/- 2. Promoter’s contribution 19,935/- 19,935/- 3. Subsidy 99,675/- 1,39,545/- 4. Debt equity ratio 2.33:1 1.50:1 Profitability: Sl.No. Description 1st year 2nd year 3rd year 4th year 5th year
1. Capacity utilized 60% 70% 80% 80% 80%
2. Annual Sales Realization in Rs. 6,45,000 7,52,500 8,60,000 8,60,000 8,60,000
3. Annual Costs in Rs.
a) Raw Materials 2,25,720 2,63,340 3,00,960 3,00,960 3,00,960
b) Utilities 12,960 15,120 17,280 17,280 17,280
c) Selling expenses 47,550 55,470 63,400 63,400 63,400
Variable Cost 2,.86,230 3,33,930 3,81,640 3,81,640 3,81,640
d) Wages & Salaries 1,29,600 1,51,200 1,72,800 1,72,800 1,72,800
e) Administrative expenses 1,08,000 1,26,000 1,44,000 1,44,000 1,44,000
f) Depreciation 20,025 20,025 20,025 20,025 20,025
g) Interest on Composite Loan 32,058 25,929 17,915 10,372 2,829
Fixed & Semi Variable Cost 2,89,683 3,23,154 3,54,740 3,47,197 3,39,654
4. Total Cost 5,75,913 6,57,084 7,36,380 7,28,837 7,21,294
5. Annual Profit 69,087 95,416 1,23,620 1,31,163 1,38,706
6. Return on Investment 17.32% 23.93% 31.00% 32.89% 34.78%
7. Return on sales 6.42% 8.87% 11.49% 12.20% 12.90%
8. Annual contribution 3,58,770 - - - -
9. Break Even Point 48.44%
10. Cash accrual 89,112 1,15,441 1,43,645 1,51,188 1,58,731
11. Debt Servicing Capacity 1,21,170 1,41,370 1,61,560 1,61,560 1,61,560

175
12. Repayment of Composite Loan 45,258 52,801 60,344 60,344 60,344
13. Debt Serviced 77,316 78,730 78,259 70,716 63,173
14. Pay Back Period 1 year 6 months 21 days
15. Debt Service Coverage Ratio 1.56:1
Cash Flow Statement:
Sl. No.
Description Pre-operative Period
O p e r a t i n g Y e a r s
First Second Third Fourth Fifth
1. Increase in Promoter’s contribution
19,935 - - - - -
2. Increase in Term loan 2,79,090 1,98,450 - - - -
3. Subsidy 99,675 - - - - -
4. Depreciation - 20,025 20,025 20,025 20,025 20,025
5. Profit before interests - 1,01,145 1,21,345 1,41,535 1,41,535 1,41,535
A. TOTAL SOURCES 3,98,700 3,19,620 1,41,370 1,61,560 1,61,560 1,61,560
6. Increase in capital investment
3,98,700 - - - - -
7. Increase in working capital
- 1,98,450 - - - -
8. Interest - 32,058 25,929 17,915 10,372 2,829
9. Repayment of Term Loan
- 45,258 52,801 60,344 60,344 60,344
B. TOTAL DISPOSALS 3,98,700 2,75,766 78,730 78,259 70,716 63,173
C. OPENING BALANCE NIL NIL 43,854 1,06,494 1,89,795 2,80,639
D. NET SURPLUS NIL 43,854 62,640 83,301 90,844 98,387
E. CLOSING BALANCE NIL 43,854 1,06,494 1,89,795 2,80,639 3,79,026
Projected Balance sheet:
Sl.No. Description Amount in Rupees as at the end of the
1st Yr. 2nd Yr. 3rd Yr. 4th Yr. 5th Yr.
1. Capital Account of Promoter
19,935 89,022 1,84,438 3,08,058 4,39,221
2. Surplus from operation
69,087 95,416 1,23,620 1,31,163 1,38,706
NET WORTH: 89,022 1,84,438 3,08,058 4,39,221 5,77,927
3. Subsidy 99,675 99,675 99,675 99,675 99,675
4. Term loan outstanding 2,33,832 1,81,031 1,20,687 60,343 -
TOTAL LIABILITIES 4,22,529 4,65,144 5,28,420 5,99,239 6,77,602
1. Gross Block 2,00,250 2,00,250 2,00,250 2,00,250 2,00,250
Less Depreciation 20,025 40,050 60,075 80,10 1,00,125
NET BLOCK 1,80,225 1,60,200 1,40,175 1,20,150 1,00,125
2. Working capital 1,98,450 1,98,450 1,98,450 1,98,450 1,98,450
3. Cash & Bank Balance 43,854 1,06,494 1,89,795 2,80,639 3,79,026
TOTAL ASSETS 4,22,529 4,65,144 5,28,420 5,99,239 6,77,602

176
GYMNESSIUM & FITNESS CENTRE Introduction: Health and beautiful body is desired by everyone youth. From ancient times, many techniques have been in use to achieve the objective. Earlier, akhadas (traditional wrestling centres) were the local point of body building and similar activities but as time changed, health clubs and gymnasiums have replaced them. Men have been attracted towards health clubs/ gyms mainly for body building purpose while women seek a slim and trim body that is fit in all sense. This is the reason why health clubs for women are often called as slimming centres or body shaping centres. Not only have women become more and more health conscious but they are also viewing fitness as a major problem. With the urge to look beautiful and healthy, increasing health clubs and gyms are here to stay. Market: Today body shaping and fitness has attained scientific approach, with machines and exercises being prescribed for different parts of the body. Individual attention and personalized treatment according to the needs by professionally trained instructor and glitter to this service industry. Customers are not only told and shown the right way to use machines and exercise, they are also prescribed the right kind and amount of exercises depending upon individual needs and capacity. Since the objective of health clubs of men and women are different, men need health clubs for body building while women go to health clubs for weight reduction, the machinery used in both are different. Entrepreneur can establish a health club for men or women depending upon the local demand. Raw Material: This unit does not have any raw material as such consumables like powder, Oil, towels/ napkins etc. will be the only things required. On which Rs. 5,500/- will be spent monthly and the raw materials can be obtained from local whole-sale markets. Manpower: Two trained trainer and one assistant will need for the unit, all of whom are locally available. The annual cost of manpower is estimated Rs. 1,58,400/-.
Sl.No. Particulars No. Salary per month
1. Manager/ Trainer 1 5,500/-
2. Assistant Trainer 1 4,400/-
3. Assistant 1 3,300/-
Total: 3 13,200/-
Service Target: The revenue from this unit will be generated through the fee paid by customers in lieu of services provided. Generally monthly fee is charged with a one timer registration fee or security deposit charged at the time of admission. People coming to the club will be divided into 8-10 batches, each having a maximum time of 1-2 hours at the machines Rs. 385/- per month will be charged per person for this. Total receipts of Rs. 6,00,600/- are expected if 130 customers are given admission every month. CAPITAL COST ESTIMATE: 1) Land & Building Rented 2) Machinery & equipments Gym/ Fitness centre for Men i) Bench press Rs. 22,482/- ii) Single pulley pull down 1 Rs. 21,456/- iii) Leg press 1 Rs. 21,048/- iv) Arm wrestling machine 1 Rs. 19,470/-

177
v) Bicep machine 1 Rs. 19,134/- vi) Hip flexer with parallel fans 1 Rs. 10,725/- vii) Walker machine 1 Rs. 22,656/- viii) Cycle 2 Rs. 7,780/- ix) Dumbels 200 Rs. 14,400/- x) Abdominal Board 1 Rs. 9,480/- xi) Twister 1 Rs. 2,730/- Total: Rs. 1, 72,416/-Fitness centre for Women (i) Rock climber 1 Rs. 34,200/- (ii) Ski machine 1 Rs. 17,160/- (iii) Body jacks 1 Rs. 16,800/- (iv) Tread mill 1 Rs. 30,000/- (v) Recumbent bike 1 Rs. 6,000/- (vi) Rowing machine 1 Rs. 24,000/- (vii) Step tech. 1 Rs. 11,400/- (viii) Double burner 1 Rs. 11,400/- Total: Rs. 1,50,260/- 3) Expenditure on interiors: Rs. 25,000/- 4) Preliminary & pre-operative expenditure: Rs. 22,000/- 5) Electrification & installation Rs. 13,200/- Total Fixed Cost: Rs. 3,86,076/- Working capital: 1) Raw Material: - Rs. 5,500/- 2) Salary & Wages - Rs. 13,200/- 3) Utilities - Rs. 2,750/- 4) Misc. expenditure - Rs. 8,250/- Total Working Capital: Rs. 29,700/- Total Project Cost: Rs. 4,15,776/- Means of Finance Urban Rural 1. Composite Loan Rs. 2,91,043/- Rs. 2,49,465/-2. Promoter’s contribution Rs. 20,789/- Rs. 20,789/- 3. Subsidy Rs. 1,03,944/- Rs. 1,45,522/-4. Debt equity ratio 2.33:1 1.50:1 Profitability: (Rs. In Thousands) Sl.No. Description 1st year 2nd year 3rd year 4th year 5th year
1. Capacity utilized as percent of installed capacity
60 70 80 80 80
2. Annual Sales Realization in Rs. 360 420 480 480 480
3. Annual Costs in Rs.
a) Raw Materials 40 46 53 53 53
b) Utilities 20 23 26 26 26
c) Selling expenses 12 14 16 16 16
d) Wages & Salaries 95 111 127 127 127
e) Administrative overheads 59 69 79 79 79
f) Depreciation 38 38 38 38 38
g) Interest on Composite Loan 30 25 18 11 4
4. Total Cost 294 326 357 350 343
Variable Cost 46 69 79 79 79

178
5. Annual Profit 66 94 123 130 137
6. Return on Investment 15.86% 22.59% 29.56% 31.25% 32.93%
7. Return on sales 18.33% 22.38% 25.12% 27.08% 28.54%
8. Annual contribution 314
9. Break Even Point as percent of capacity
47.38%
10. Cash accrual 104 132 161 168 175
11. Debt Servicing Capacity 134 157 179 179 179
12. Repayment of Composite Loan 47 55 63 63 63
13. Debt Serviced 77 80 81 74 67
14. Pay Back Period 1 year 11 months 1 days
15. Debt Service Coverage Ratio 1.92:1
Cash Flow Statement: (Rs. In Thousands)
Sl. No.
Description Pre- ope rative Period
O p e r a t i n g Y e a r s
First Second Third Fourth Fifth
1. Increase in Promoter’s contribution
21 - - - - -
2. Increase in Term loan 291 - - - -
3. Subsidy 104 - - - - -
4. Depreciation - 38 38 38 38 38
5. Profit before interests - 96 119 141 141 141
A. TOTAL SOURCES 416 134 157 179 179 179
6. Increase in capital investment 386 - - - - -
7. Increase in working capital 30 - - - - -
8. Interest - 30 25 18 11 4
9. Repayment of Term Loan - 47 55 63 63 63
B. TOTAL DISPOSALS 416 77 80 81 74 67
C. OPENING BALANCE NIL NIL 57 134 232 337
D. NET SURPLUS NIL 57 77 98 105 112
E. CLOSING BALANCE NIL 57 134 232 337 449
Projected Balance sheet:
Sl.No. Description Amount in Rs. Thousands as at the end of the
1st Yr. 2nd Yr. 3rd Yr. 4th Yr. 5th Yr.
1. Capital Account of Promoter 21 87 181 304 434
2. Surplus from operation 66 94 123 130 137
NET WORTH: 87 181 304 434 571
3. Subsidy 104 104 104 104 104
4. Term loan outstanding 244 189 126 63 -
TOTAL LIABILITIES 435 477 534 601 675
1. Gross Block 386 386 386 386 386
Less Depreciation 38 76 114 152 190
NET BLOCK 348 310 272 234 196
2. Working capital 30 30 30 30 30
3. Cash & Bank Balance 57 134 232 337 449
TOTAL ASSETS 435 477 534 601 675
Machinery Supplier 1) UNITED IMPORTERS CORPORATION, 26, Jawaharlal Nehru Road, 1st Floor, Kolkata – 87. 2) COMMERCE INTERNATIONAL, 8, Camac Street, Kolkata – 17. 3) G.S. MARKETING ASSOCIATES, 108/9, Monohar Pukur Road, Kolkata – 2
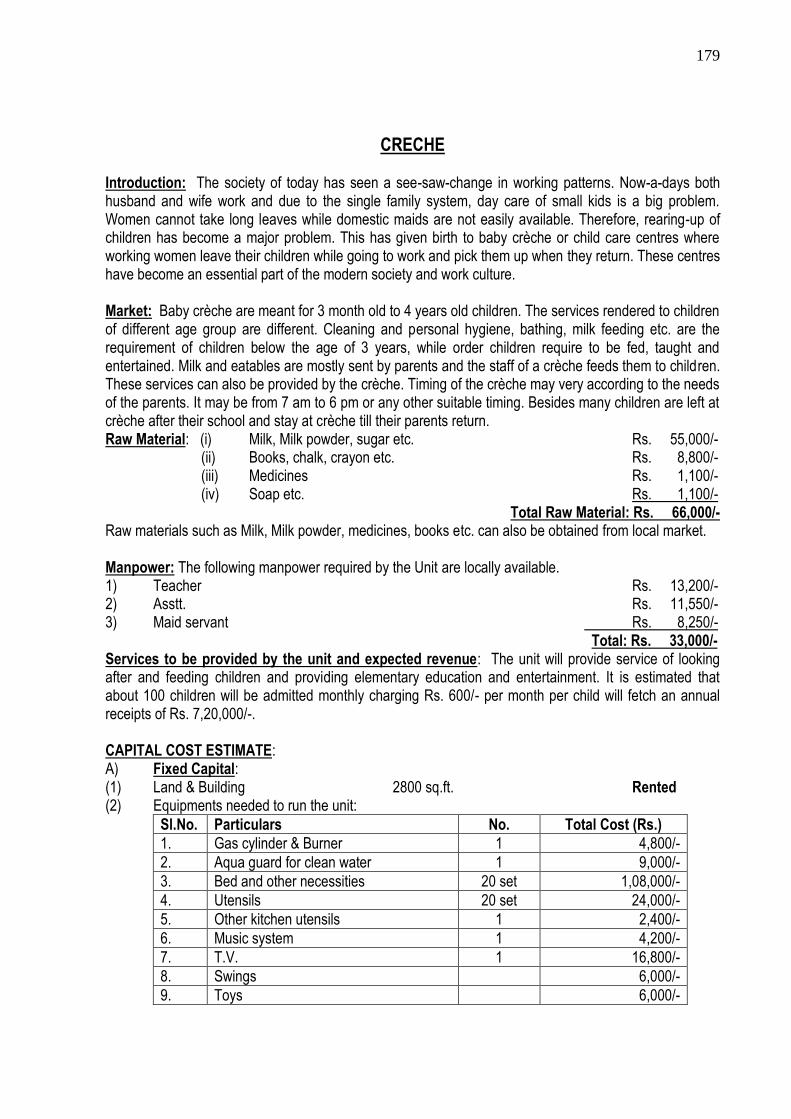
179
CRECHE
Introduction: The society of today has seen a see-saw-change in working patterns. Now-a-days both husband and wife work and due to the single family system, day care of small kids is a big problem. Women cannot take long leaves while domestic maids are not easily available. Therefore, rearing-up of children has become a major problem. This has given birth to baby crèche or child care centres where working women leave their children while going to work and pick them up when they return. These centres have become an essential part of the modern society and work culture. Market: Baby crèche are meant for 3 month old to 4 years old children. The services rendered to children of different age group are different. Cleaning and personal hygiene, bathing, milk feeding etc. are the requirement of children below the age of 3 years, while order children require to be fed, taught and entertained. Milk and eatables are mostly sent by parents and the staff of a crèche feeds them to children. These services can also be provided by the crèche. Timing of the crèche may very according to the needs of the parents. It may be from 7 am to 6 pm or any other suitable timing. Besides many children are left at crèche after their school and stay at crèche till their parents return. Raw Material: (i) Milk, Milk powder, sugar etc. Rs. 55,000/-
(ii) Books, chalk, crayon etc. Rs. 8,800/- (iii) Medicines Rs. 1,100/- (iv) Soap etc. Rs. 1,100/-
Total Raw Material: Rs. 66,000/- Raw materials such as Milk, Milk powder, medicines, books etc. can also be obtained from local market. Manpower: The following manpower required by the Unit are locally available. 1) Teacher Rs. 13,200/- 2) Asstt. Rs. 11,550/- 3) Maid servant Rs. 8,250/- Total: Rs. 33,000/- Services to be provided by the unit and expected revenue: The unit will provide service of looking after and feeding children and providing elementary education and entertainment. It is estimated that about 100 children will be admitted monthly charging Rs. 600/- per month per child will fetch an annual receipts of Rs. 7,20,000/-. CAPITAL COST ESTIMATE: A) Fixed Capital: (1) Land & Building 2800 sq.ft. Rented (2) Equipments needed to run the unit:
Sl.No. Particulars No. Total Cost (Rs.)
1. Gas cylinder & Burner 1 4,800/-
2. Aqua guard for clean water 1 9,000/-
3. Bed and other necessities 20 set 1,08,000/-
4. Utensils 20 set 24,000/-
5. Other kitchen utensils 1 2,400/-
6. Music system 1 4,200/-
7. T.V. 1 16,800/-
8. Swings 6,000/-
9. Toys 6,000/-

180
10. Bucket/ tub/ water storage equipment 6,000/-
11. Blackboard 1,200/-
12. Books for children 6,000/-
13. Chairs for children 6,000/-
14. Other facilities 24,000/-
Total: 2,24,400/-
3) Electrification Rs. 5,300/- 4) Preliminary & pre-operative expenses Rs. 5,500/- 5) Other Misc. Fixed assets Rs. 22,000/- Total fixed assets: Rs. 2,55,200/- B. Working capital: (For 3 months) 1) Raw Material Rs. 66,000/- 2) Salary & Wages Rs. 33,000/- 3) Utilities Rs. 3,300/- 4) Misc. expenses Rs. 29,700/- Total Working Capital: Rs. 1,32,000/- Total Project Cost: Rs. 3,87,200/- Means of Finance Urban Rural 1. Composite Loan Rs. 2,71,040/- Rs. 2,32,320/-2. Promoter’s contribution Rs. 19,360/- Rs. 19,360/- 3. Subsidy Rs. 96,800/- Rs. 1,35,520/- 4. Debt equity ratio 2.33:1 1.50:1 Profitability: (Rs. In Thousands) Sl.No. Description 1st year 2nd year 3rd year 4th year 5th year
1. Capacity utilized as percent of installed capacity
60 70 80 80 80
2. Annual Sales Realization 475 554 634 634 634
3. Annual Costs
a) Raw Materials 158 185 211 211 211
b) Utilities 8 9 11 11 11
c) Selling expenses 12 14 16 16 16
Variable Cost 178 208 238 238 238
d) Wages & Salaries 79 92 106 106 106
e) Administrative expenses 67 79 90 90 90
f) Depreciation 25 25 25 25 25
g) Interest on Composite Loan 31 25 18 11 4
Fixed & Semi Variable Cost 202 221 239 232 225
4. Total Cost 380 429 477 470 465
5. Annual Profit 95 125 157 164 171
6. Return on Investment 26.37% 34.72% 43.30% 45.19% 47.08%
7. Return on sales 20.45% 23.07% 25.18% 26.28% 27.38%
8. Annual contribution 2,70,000
9. Break Even Point as percent of capacity 40.36%
10. Cash accrual 1,09,864 1,37,814 1,66,555 1,72,893 1,79,231
11. Debt Servicing Capacity 1,36,800 1,59,600 1,82,400 1,82,400 1,82,400
12. Repayment of Composite Loan 44 51 59 59 59
13. Debt Serviced 64,963 66,151 66,548 60,210 53,871 14. Pay Back Period 2 year 1 month 6 days 15. Debt Service Coverage Ratio 3.10:1

181
Cash Flow Statement: (Rs. In Thousands) Sl. No.
Description Pre-operative Period
O p e r a t i n g Y e a r s
First Second Third Fourth Fifth
1. Increase in Promoter’s contribution
19 - - - - -
2. Increase in Term loan 271 - - - -
3. Subsidy 97 - - - - -
4. Depreciation - 25 25 25 25 25
5. Profit before interests - 126 150 175 175 175
A. TOTAL SOURCES 387 151 175 200 200 200
6. Increase in capital investment
255 - - - - -
7. Increase in working capital 132 - - - - -
8. Interest - 31 25 18 11 4
9. Repayment of Term Loan - 44 51 59 59 59
B. TOTAL DISPOSALS 387 75 76 77 70 63
C. OPENING BALANCE NIL NIL 76 175 298 428
D. NET SURPLUS NIL 76 99 123 130 137
E. CLOSING BALANCE NIL 76 175 298 428 565
Projected Balance sheet:
Sl.No. Description Amount in Rs. Thousands as at the end of the
1st Yr. 2nd Yr. 3rd Yr. 4th Yr. 5th Yr.
1. Capital Account of Promoter 19 114 239 396 560
2. Surplus from operation 95 125 157 164 171
NET WORTH: 114 239 396 560 731
3. Subsidy 97 97 97 97 97
4. Term loan outstanding 227 176 117 58 -
TOTAL LIABILITIES 438 512 610 715 828
1. Gross Block 255 255 255 255 255
Less Depreciation 25 50 75 100 125
NET BLOCK 230 205 180 155 130
2. Working capital 132 132 132 132 132
3. Cash & Bank Balance 76 175 298 428 565
TOTAL ASSETS 438 512 610 715 828
Suppliers of Raw Material/ Equipments These can be obtained locally.

182
PATHOLOGICAL LABORATORY
Introduction: Modern Medical Science depends to a large extent on scientific tests for diagnosis of diseases. Tests of Blood, Sputum, Urine, etc is unavoidable to diagnose diseases. Importance of Radiology and Pathology as parts of Medical Science is increasing every day. With Computerization and development of modern diagnostic machinery Ultra-sound Scanning, X-Ray and Pathology has developed manifolds in the recent years. Besides, Medical Practitioners are relying on these branches of medical science reliable. These help in not only diagnosis of the exact nature of the disease but also the exact type of cause of it. A Pathological laboratory backed by modern machinery, expert Para-Medical manpower and good pathologist is not only a significant aid to the community health but also an excellent commercial venture. Pathological laboratory is considered as an industry for financing purpose. Market: As indicated earlier Pathological Laboratory is an essential; infrastructure for community health as it assists in diagnosis of the exact nature of disease and its cause. Now-a-days all medical practitioner recommend tests before diagnosis and prescribing specific medicines. Prior to these tests only medicines meant for symptom cures are prescribed. Actual treatment commence after these tests and hence exact diagnosis. As such Pathological Laboratories, with or without Clinic/ Nursing Home/ Hospital, has come up all over the Country. In Tripura two Medical Colleges with Hospitals, four District Hospitals, five other Hospitals, 82 Public Health Centres and 540 Dispensaries exist. Besides, 38 Ayurvedic and 75 Homeopathic medical institutions exist. These engage more than 860 Doctors. Besides, almost equal number of Doctors is practicing privately, All these Doctors need services of Pathological Laboratories. In 2003- 04 Tripura treated 2, 215, 698 Patients, which may have increased to more than 3, 500, 000 patents in 2009- 10. Considering this as the number of Pathological tests required there is a demand enough to sustain more than 350 Pathological Laboratories. Against this demand mere 150 or so of Pathological Laboratories exist in the State. Therefore, there is very good marketing scope for Pathological Laboratories in the State. Capacity: The Pathological laboratory shall operate for single shift of 8 hours per day for 300 working days per annum. The annual installed capacity is estimated at 40,000 Test valued at Rs. 20,00,000/-. Process of Manufacture: Pathological tests are done by expert paramedical workers as per prescription of Medical Practitioners. Samples of Blood, Urine, Sputum etc are taken as per standard practices in sterilized containers under the supervision of paramedical staff. These are then either tested manually or by Auto analyzer or by using standard kits. Results are then interpreted by Registered pathologists. Inputs: The Unit shall need Reagents & Chemicals with standard Test-kits for various pathological tests. The annual cost of these at the installed capacity is estimated at Rs. 3,76,200/-. Besides, papers, stationery and computer inputs worth Rs. 31,350/- shall be necessary. Power: The power is available from the state Electric supply corporation Grid. The annual consumption of power is estimated Rs. 1,80,000/-. Water: The unit will need 3000 liters of clean and soft water. It is available from both ground water sources and public supply. Manpower: Manpower required by the unit including skilled workers is locally available. The requirement and annual costs of manpower at the installed capacity is shown below:

183
Sl.No. Category of Manpower No. of Persons Annual Cost
1. Manager 1 Self
2. Skilled Worker 2 1,20,000/-
3. Helper 2 96,000/-
Total 5 2,16,000/-
Capital Cost Estimate: 1. Land & Building admeasuring 30 Sq.Mtrs. Own 2. Plant & Machinery including one Auto-analyser, one Incubator, one Rs. 1,42,550/- Polarimeter, one Laboratory autoclave, one set of equipments, one Heamometer, Blood Pressure testing equipments, one Digital Analytical Balance, one pH-meter, one Hot Air Oven,two Water Bath,one Muffle Furnace, One Bioplan Research Microscope, one Hot-plate 3. Miscellaneous Fixed Assets including modification of Electrification Rs. 27,000/- & Water installation, initial set of Test kits, furniture & fixtures and a Computer set Total: Rs. 1,69,550/- 4. Provision for contingencies Rs. 20, 000/- 5. Preliminary & Preoperative expenses Rs. 10, 700/-
Total Fixed Investment: Rs. 2,00,250/ 6. Working Capital (P.M.) a) Raw Material Rs. 31,350/- b) Utilities Rs. 1,800/- c) Salary & Wages Rs. 18,000/- d) Other expenses Rs. 15,000/- Total: Rs. 66,150/- Total working capital for 3 months: Rs. 1,98,450/- Total Project Cost: Rs. 3,98,700/- Means of Finance: Urban Rural 1. Composite loan Rs. 2,79,090/- Rs. 2,39,220/- 2. Promoter’s contribution Rs. 19,935/- Rs. 19,935/- 3. Subsidy Rs. 99,675/- Rs. 1,39,545/-4. Debt equity ratio 2.33:1 1.50:1 Profitability: Sl.No. Description 1st year 2nd year 3rd year 4th year 5th year
1. Capacity utilized 60% 70% 80% 80% 80%
2. Annual Sales Realization in Rs. 6,45,000 7,52,500 8,60,000 8,60,000 8,60,000
3. Annual Costs in Rs.
a) Raw Materials 2,25,720 2,63,340 3,00,960 3,00,960 3,00,960
b) Utilities 12,960 15,120 17,280 17,280 17,280
c) Selling expenses 47,550 55,470 63,400 63,400 63,400
Variable Cost 2,.86,230 3,33,930 3,81,640 3,81,640 3,81,640
d) Wages & Salaries 1,29,600 1,51,200 1,72,800 1,72,800 1,72,800
e) Administrative expenses 1,08,000 1,26,000 1,44,000 1,44,000 1,44,000
f) Depreciation 20,025 20,025 20,025 20,025 20,025
g) Interest on Composite Loan 32,058 25,929 17,915 10,372 2,829
Fixed & Semi Variable Cost 2,89,683 3,23,154 3,54,740 3,47,197 3,39,654
4. Total Cost 5,75,913 6,57,084 7,36,380 7,28,837 7,21,294
5. Annual Profit 69,087 95,416 1,23,620 1,31,163 1,38,706

184
6. Return on Investment 17.32% 23.93% 31.00% 32.89% 34.78%
7. Return on sales 6.42% 8.87% 11.49% 12.20% 12.90%
8. Annual contribution 3,58,770 - - - -
9. Break Even Point 48.44%
10. Cash accrual 89,112 1,15,441 1,43,645 1,51,188 1,58,731
11. Debt Servicing Capacity 1,21,170 1,41,370 1,61,560 1,61,560 1,61,560
12. Repayment of Composite Loan 45,258 52,801 60,344 60,344 60,344
13. Debt Serviced 77,316 78,730 78,259 70,716 63,173
14. Pay Back Period 1 year 6 months 21 days
15. Debt Service Coverage Ratio 1.56:1
Cash Flow Statement:
Sl. No.
Description Pre-ope-rative Period
O p e r a t i n g Y e a r s
First Second Third Fourth Fifth
1. Increase in Promoter’s contribution
19,935 - - - - -
2. Increase in Term loan 2,79,090 1,98,450 - - - -
3. Subsidy 99,675 - - - - -
4. Depreciation - 20,025 20,025 20,025 20,025 20,025
5. Profit before interests - 1,01,145 1,21,345 1,41,535 1,41,535 1,41,535
A. TOTAL SOURCES 3,98,700 3,19,620 1,41,370 1,61,560 1,61,560 1,61,560
6. Increase in capital investment
3,98,700 - - - - -
7. Increase in working capital - 1,98,450 - - - -
8. Interest - 32,058 25,929 17,915 10,372 2,829
9. Repayment of Term Loan - 45,258 52,801 60,344 60,344 60,344
B. TOTAL DISPOSALS 3,98,700 2,75,766 78,730 78,259 70,716 63,173
C. OPENING BALANCE NIL NIL 43,854 1,06,494 1,89,795 2,80,639
D. NET SURPLUS NIL 43,854 62,640 83,301 90,844 98,387
E. CLOSING BALANCE NIL 43,854 1,06,494 1,89,795 2,80,639 3,79,026
Projected Balance sheet:
Sl. No.
Description Amount in Rupees as at the end of the
1st Yr. 2nd Yr. 3rd Yr. 4th Yr. 5th Yr.
1. Capital Account of Promoter 19,935 89,022 1,84,438 3,08,058 4,39,221
2. Surplus from operation 69,087 95,416 1,23,620 1,31,163 1,38,706
NET WORTH: 89,022 1,84,438 3,08,058 4,39,221 5,77,927
3. Subsidy 99,675 99,675 99,675 99,675 99,675
4. Term loan outstanding 2,33,832 1,81,031 1,20,687 60,343 -
TOTAL LIABILITIES 4,22,529 4,65,144 5,28,420 5,99,239 6,77,602
1. Gross Block 2,00,250 2,00,250 2,00,250 2,00,250 2,00,250
Less Depreciation 20,025 40,050 60,075 80,10 1,00,125
NET BLOCK 1,80,225 1,60,200 1,40,175 1,20,150 1,00,125
2. Working capital 1,98,450 1,98,450 1,98,450 1,98,450 1,98,450
3. Cash & Bank Balance 43,854 1,06,494 1,89,795 2,80,639 3,79,026
TOTAL ASSETS 4,22,529 4,65,144 5,28,420 5,99,239 6,77,602
Supplies of Machinery & Equipments :
Blue Horizon, Gopal Nivas, 135, S.G.Marg, Princess Street, Mumbai – 4000002. Ph:022-22062887
Biosystem International, "India House", 56/6 Popatwadi, 1st Floor, Near Hanuman Temple,
Mumbai – 400002. Ph:022-22016510

185
DHABA Introduction : Way-side restaurant cum drivers' resting places are called Dhaba. Dhaba normally have good toilet, resting cots and restaurant facilities, besides Truck & Car parking space adjacent to arterial roads. Dhaba performs well if it is located midway between two major destinations about 6 to 12 hours journey apart. Market : Dhaba are specially preferred by Truck operators. Therefore, Dhabas just outside towns with traffic restrictions, near truck parking bays and midway between two major towns have good sales. For example locations like outskirts of Agartala. Chakmaghat, Kumarghat to Sanitala and Churaibari along Assam-Agartala Road are good locations for Dhaba. In Agartala Subroom route locations between Matabari to Shantirbazar may have better scope for Dhabas. Operators of Truck, Bus and small vehicles prefer to park their vehicles, respond to natures' call and have refreshments in such locations. Truck Drivers and workers often take bath in Dhabas, with fast increasing vehicle population need for Dhabas have increased. Description: The proposed Dhaba shall have excellent Toilet block with bath facilities and separate ladies & gentleman's toilets. It will have a restaurant, adequate parking facilities for six trucks or equivalent, an open shed with five costs for rest. Restaurant, Bathroom and Water closets shall be used against necessary payments. The restaurant shall have adequate facility to feed forty persons at a time. Apart from toilet block all facilities shall be in temporary sheds. Fuel: The unit will use Commercial LPG Cylinders as its fuel for kitchen. Annually 48 cylinders costing Rs. 24,000/- may be required. Water: The Dhaba shall consume 1500 Ltrs. of water per day which shall be available from ground water source at site. The water for drinking and cooking shall be filtered. Electricity : Dhaba need to attract vehicle operators from distance and hence lighting of it is of importance. A connected load of 2 KW may suffice. Annually 5000 KWHrs of power may be consumed which may cost Rs. 17,500/-. Manpower : The Dhaba will need one manager, one sweeper, one cook, two helpers of cook and two waiters. These may cost Rs. 2,10,000/- per annum. Capital Cost Estimate: 1. Land admeasuring 1 kani or 17280 sq.ft. Own 2. Site development Rs. 24,000/- 3. Toilet block Rs. 60,000/- 4. Temporary sheds Rs. 1,20,000/- 5. Kitchen equipments Rs. 36,000/- 6. 4 cots of steel with nylon rope bed Rs. 12,000/- 7. Provision for contingencies Rs. 18,000/- 8. Preliminary & Pre-operators expenses Rs. 18,000/- Rs. 2,88,000/- B. Working capital for 3 months (a) Fuel Rs. 6,600/- (b) Food Articles & other raw materials Rs. 1,48,500/-

186
(c) Electricity Rs. 4,950/- (d) Wages & salaries Rs. 57,750/- (e) Miscellaneous expenses Rs. 16,500/- Total Working Capital: Rs. 2,34,300/- Total Project cost: Rs. 5,22,300/- Means of Finance: Urban Rural 1. Composite loan under PMEGP 3,65,610/- 3,13,380/- 2. Promoters Capital 26,115/- 26,115/- 3. Subsidy 1,30,575/- 1,82,805/- 4. Debt equity ratio 2.33:1 11.5:1 Profitability: (Rs. In Thousands)
Sl.No. Description 1st year 2nd year 3rd year 4th year 5th year 1. Capacity utilized as percent of
installed capacity 60% 70% 80% 80% 80%
2. Annual Sales Realization 792 924 1056 1056 1056
3. Annual Costs
a) Raw Materials 356 416 475 475 475
b) Utilities 16 18 21 21 21
c) Selling expenses 4 5 5 5 5
Variable Cost 376 439 501 501 501
d) Wages & Salaries 139 162 185 185 185
e) Administrative expenses 107 125 143 143 143
f) Depreciation 28 28 28 28 28
g) Interest on Composite Loan 42 34 25 15 5
Fixed & Semi Variable Cost 316 349 381 371 361
4. Total Cost 692 788 882 872 862
5. Annual Profit 100 136 174 184 194
6. Return on Investment 20.83% 28.06% 35.53% 37.42% 39.31%
7. Return on sales 13.10% 15.13% 16.78% 17.66% 18.55%
8. Annual contribution 416 - - - -
9. Break Even Point as percent of capacity
45.57%
10. Cash accrual 128 164 202 212 222
11. Debt Servicing Capacity 170 198 227 227 227
12. Repayment of Composite Loan 59 69 80 79 79
13. Debt Serviced 101 103 105 94 84
14. Pay Back Period 1 year 9 month days
15. D.S.C.R. 1.76:1
Cash Flow Statement: (Rs. In Thousands)
Sl. No.
Description Pre-operative Period
O p e r a t i n g Y e a r s
First Second Third Fourth Fifth
1. Increase in Promoter’s contribution
26 - - - - -
2. Increase in composite loan 366 - - - -
3. Subsidy 130 - - - - -
4. Depreciation - 28 28 28 28 28
5. Profit before interests - 142 170 199 199 199
A. TOTAL SOURCES 522 170 198 227 227 227

187
6. Increase in capital investment 288 - - - - -
7. Increase in working capital 234 - - - - -
8. Interest - 42 34 25 15 5
9. Repayment of Term Loan - 59 69 80 79 79
B. TOTAL DISPOSALS 522 101 103 105 94 84
C. OPENING BALANCE NIL NIL 69 164 286 419
D. NET SURPLUS NIL 69 95 122 133 143
E. CLOSING BALANCE NIL 69 164 286 419 562
Projected Balance sheet:
Sl.No. Description Amount in Rs. Thousands as at the end of the
1st Yr. 2nd Yr. 3rd Yr. 4th Yr. 5th Yr.
1. Capital Account of Promoter 26 126 262 436 620
2. Surplus from operation 100 136 174 184 194
NET WORTH: 126 262 436 620 814
3. Subsidy 130 130 130 130 130
4. Term loan outstanding 307 238 158 79 -
TOTAL LIABILITIES 563 630 724 829 944
1. Gross Block 288 288 288 288 288
Less Depreciation 28 56 84 112 140
NET BLOCK 260 232 204 176 148
2. Working capital 234 234 234 234 234
3. Cash & Bank Balance 69 164 286 419 562
TOTAL ASSETS 563 630 724 829 944
Suppliers of Machinery & Raw Material
Kitchen equipments, Bed and other raw materials such as oil, Rice, Pulses, wheat etc. can be obtained easily from local whole sale markets.

188
DECORATOR/ TENT HOUSE SERVICE
Introduction: Decorator Service is a very useful enterprise in an urban area and even in the rural areas as well. It is a service unit which provides many useful articles like shamianas, utensils, etc. on hire/rented basis for organising functions like wedding receptions, gathering and various types of events. A decorator service unit is thus a very useful enterprise where all articles for organising an event successfully can be conveniently taken on hire. Market: The number of festivals and other events in the social calendar of a state like Tripura, there is a large scope for such enterprises. At present there are very few units engaged this line of business. For organising numerous social cultural and religious events/festivals, the need for a decorator service unit is very important as all articles necessary for holding such a function are available under one roof. Now-a-days with increasing income levels and changing takes many people prefer to hold large functions/ gatherings of various events. This gives good scope for the services of a decorator service type of enterprise. Considering present trends, the market for such services in expected to grow further. Target: 1) By renting of various articles: Rs. 4,95,000/- 2) By decoration: Rs. 1,10,000/- Total: Rs. 6,05,000/- Power: The power is available from the state Electric supply corporation Grid. The annual consumption of power is estimated Rs. 1,980/-. Total amount required for fuel is estimated Rs. 4,620/-. Manpower: manpower required by the unit are locally available. The annual needs and costs of manpower is shown below:
Sl.No. Category of Manpower No. of persons Annual Costs
1 Manager cum Supervisor 1 Self
2 Helper 3 1,56,400/-
Total: 4 1,58,400/-
Financial Aspect: 1) Land & Building - Rented 2) Plant & Machinery
i) 4 stroke Hero Honda Generator 1 No. Rs. 72,000/- ii) V.I.P. Chair 50 nos. @ Rs. 750 Rs. 45,000/- iii) Ordinary chair 400 nos. Rs. 60,000/-
iv) Table 100 Nos. Rs. 60,000/- v) Screens 4m x 2m for 1 ps. for 50 Nos. Rs. 24,000/- vi) plastic drums 10 nos. Rs. 18,000/- vii) PVC water tank 2000 ltr. Capacity 2 Nos. Rs. 31,800/-
for storage water viii) Utensils Rs. 60,000/- ix) Other decorative item like flower set, karnish lamp etc. Rs. 30,000/- x) Gas oven 3 Nos. Rs. 18,000/-
Total: Rs. 4,78,800/- 3) Miscellaneous Fixed Asset a) Electrification Rs. 550/-

189
b) Furniture & Miscellaneous others Rs. 5,500/- Rs. 6,050/- 4. Provision for contingencies Rs. 22,248/- 5. Preliminary & pre-operative expenses Rs. 58,300/- Total Fixed Costs: Rs. 5,65,398/- 6. Working Capital (P.M.) a) Utilities Rs. 550/- c) Salary & Wages Rs. 13,200/- d) Other expenses Rs. 11,000/- Total: Rs. 24,750/- Total Project Cost: Rs. 5,90,148/- Means of Finance: Urban Rural 1. Composite loan Rs. 4,13,104/- Rs. 3,54,089/-2. Promoter’s contribution Rs. 29,507/- Rs. 29,507/- 3. Subsidy Rs. 1,47,537/- Rs. 2,06,552/-4. Debt equity ratio 2.33:1 1.50:1 Profitability: (Rs. In Thousands)
Sl.No. Description 1st year 2nd year
3rd year 4th year 5th year
1. Capacity utilized as percent of installed capacity
60% 70% 80% 80% 80%
2. Annual Sales Realization 363 424 484 484 484
3. Annual Costs in
a) Raw Materials - - - - -
b) Utilities 4 5 5 5 5
c) Selling expenses 24 28 33 33 33
Variable Cost 28 33 38 38 38
d) Wages & Salaries 95 111 127 127 127
e) Administrative expenses 79 92 106 106 106
f) Depreciation 56 56 56 56 56
g) Interest on Composite Loan 46 37 26 15 4
Fixed & Semi Variable Cost 276 296 315 304 293
4. Total Cost 304 329 352 342 331
5. Annual Profit 59 95 131 142 153
6. Return on Investment 10.00% 16.10% 22.20% 4.03% 25.93%
7. Return on sales 16.25% 22.40% 27.06% 29.33% 31.61%
8. Annual contribution 335
9. Break Even Point 49.43%
10. Cash accrual 115 151 187 198 209
11. Debt Servicing Capacity 161 188 213 213 213
12. Repayment of Composite Loan 67 79 89 89 89
13. Debt Serviced 113 116 115 104 93
14. Pay Back Period 1 year 8 months 12 days
15. Debt Service Coverage Ratio 1.02:1
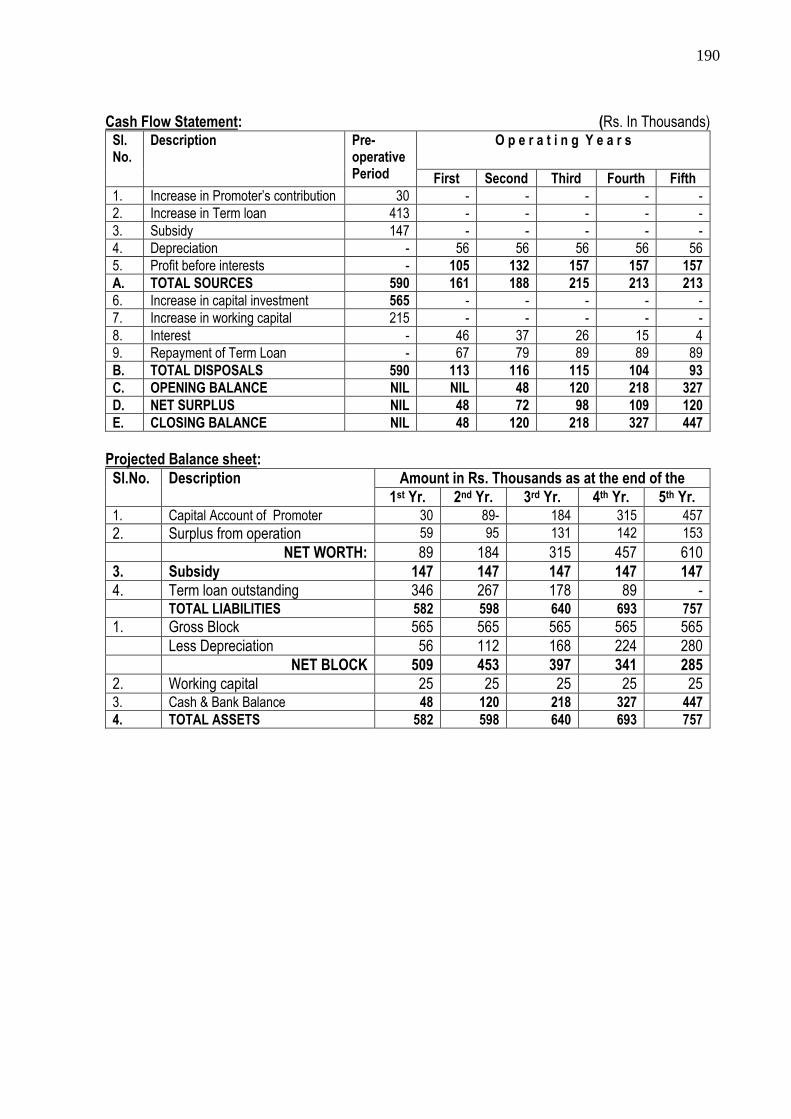
190
Cash Flow Statement: (Rs. In Thousands)
Sl. No.
Description Pre-operative Period
O p e r a t i n g Y e a r s
First Second Third Fourth Fifth
1. Increase in Promoter’s contribution 30 - - - - -
2. Increase in Term loan 413 - - - - -
3. Subsidy 147 - - - - -
4. Depreciation - 56 56 56 56 56
5. Profit before interests - 105 132 157 157 157
A. TOTAL SOURCES 590 161 188 215 213 213
6. Increase in capital investment 565 - - - - -
7. Increase in working capital 215 - - - - -
8. Interest - 46 37 26 15 4
9. Repayment of Term Loan - 67 79 89 89 89
B. TOTAL DISPOSALS 590 113 116 115 104 93
C. OPENING BALANCE NIL NIL 48 120 218 327
D. NET SURPLUS NIL 48 72 98 109 120
E. CLOSING BALANCE NIL 48 120 218 327 447
Projected Balance sheet:
Sl.No. Description Amount in Rs. Thousands as at the end of the
1st Yr. 2nd Yr. 3rd Yr. 4th Yr. 5th Yr. 1. Capital Account of Promoter 30 89- 184 315 457
2. Surplus from operation 59 95 131 142 153
NET WORTH: 89 184 315 457 610
3. Subsidy 147 147 147 147 147
4. Term loan outstanding 346 267 178 89 - TOTAL LIABILITIES 582 598 640 693 757
1. Gross Block 565 565 565 565 565
Less Depreciation 56 112 168 224 280
NET BLOCK 509 453 397 341 285
2. Working capital 25 25 25 25 25 3. Cash & Bank Balance 48 120 218 327 447
4. TOTAL ASSETS 582 598 640 693 757

191
BEAUTY PARLOUR Introduction: The urge to look beautiful has always been there in women. Earlier natural herbs were used to look beautiful but with modernization, came make-up and the beauty parlour culture. Beauty parlours have not only given women a self-employment opportunity but also has satisfied their urge to look beautiful. Though men and women have exclusive beauty parlours, the present unit will discuss only beauty parlours, the present unit will discuss only beauty parlour for women. Market: The clientele of the beauty parlour would include young girls, working women and housewives who go to beauty parlour at least once a month. Bridal make-up and personalized services for special occasions also enhance business of beauty parlours. Besides traning other women in the profession could also be yet another source of income. Target: The targeted services and expected receipts
Sl.No. Type of service No. of customers Rate per service Total receiptsin Rs
1. Eye brow 100 10.00 1,000
2. Manucure 25 80 2,000
3. Padicure 15 100 1,500
4. Head message 15 80 1,200
5. Hair bleaching 30 100 3,000
6. Arm bleaching 35 80 2,800
7. Face bleaching 60 80 4,800
8. Stomach bleaching 10 80 800
9. Waxing 35 100 3,500
10. Facial 50 150 7,500
11. Hair style 115 55 6,325
12. Hair cutting 110 65 7,150
13. Synthetic dye 20 150 2,000
14. Bridal make-up 5 600 3,000
15. Perming 5 500 2,500
16. Make-up 5 225 1,125
17. Mehendi (drawing in hand & applying in hair)
225 5,000
18. Other services - - 5,000
Annual Receipt 60,200 x 12 7,22,400
4. Raw Material: The Raw Materials can be obtained from local market. The requirement at installed capacity and cost of Raw Materialsas different types of Cosmetics shall be Rs. 24,200/- Power: The power is available from the state Electric supply corporation Grid. The consumption of power is estimated Rs. 6,600/- Water: The unit will need 1,000 Liters of clean and soft water per day. It is available from both ground water sources and public supply.
Manpower: Manpower required by the unit including skilled workers is locally available. The requirement and annual costs of manpower at the installed capacity is shown below:

192
Sl.No. Category of Manpower No. of Persons Annual Cost
1. Beautician 2 1,05,600/-
2. Assistant 1 39,600/-
Total: 3 1,45,200/-
Financial Aspect: 1. Land & Building : Rented 2. Plant & Machinery
(a) Hydro dryer 1 Rs. 8,400/- (b) Ozone Machine 1 Rs. 3,600/- (c) Massage Machine 2 Rs. 3,600/- (d) Dyers table 2 Rs. 2,400/- (e) Mirror (big) 2 Rs. 1,800/- (f) Drressing table 2 Rs. 13,200/- (g) Revolving chair 3 Rs. 15,000/- (h) Other equipments - Rs. 30,000/-
Total: Rs. 78,000/- 3) Miscellaneous Fixed Asset a) Electrification Rs. 11,000/- b) Water Installation Rs. 5,500/- c) Furniture & Miscellaneous others Rs. 16,500/- Rs. 33,000/- 4. Provision for contingencies Rs. 5,225/- 5. Preliminary & pre-operative expenses Rs. 13,750/- Total Fixed Cost: Rs. 1,29,975/- 6. Working Capital (P.M.) a) Raw Material Rs. 72,600/- b) Utilities Rs. 2,640/- c) Salary & Wages Rs. 36,300/- d) Other expenses Rs. 26,400/- Total: Rs. 1,37,940/- Total Project Cost: Rs. 2,67,915/- Means of Finance: Urban Rural 1. Composite loan Rs. 1,87,540/- Rs. 1,60,749/-2. Promoter’s contribution Rs. 13,396/- Rs. 13,396/-3. Subsidy Rs. 66,979/- Rs. 93,770/-4. Debt equity ratio 2.33:1 1.50:1 Profitability: (Rs. In Thousands) Sl.No. Description 1st year 2nd year 3rd year 4th year 5th year
1. Capacity utilized as percent of installed capacity
60% 70% 80% 80% 80%
2. Annual Sales Realization 477 556 636 636 636
3. Annual Costs
a) Raw Materials 174 203 250 250 250
b) Utilities 6 7 8 8 8
c) Selling expenses 43 58 76 76 76
Variable Cost 223 268 334 334 334
d) Wages & Salaries 87 102 116 116 116
e) Administrative expenses 63 74 84 84 84

193
f) Depreciation 13 13 13 13 13
g) Interest on Composite Loan 22 18 13 8 2
Fixed & Semi Variable Cost 185 207 226 221 216
4. Total Cost 408 475 560 555 550
5. Annual Profit 69 81 76 81 86
6. Return on Investment 25.74% 30.22% 28.35% 30.22% 32.08%
7. Return on sales 14.46% 14.58% 11.94% 12.73% 13.52%
8. Annual contribution 254 - - - -
9. Break Even Point 43.70
10. Cash accrual 82 94 89 94 99
11. Debt Servicing Capacity 104 112 102 102 102
12. Repayment of Composite Loan 30 36 41 41 41
13. Debt Serviced 52 54 54 49 44
14. Pay Back Period 2 years 7 days
15. Debt Service Coverage Ratio 2.03:1
Cash Flow Statement: (Rs. In Thousands)
Sl. No.
Description Pre-operative Period
O p e r a t i n g Y e a r s
First Second Third Fourth Fifth
1. Increase in Promoter’s contribution 13 - - - - -
2. Increase in Term loan 188 - - - - -
3. Subsidy 67 - - - - -
4. Depreciation - 13 13 13 13 13
5. Profit before interests - 91 99 89 89 89
A. TOTAL SOURCES 268 104 112 102 102 102
6. Increase in capital investment 130 - - - - -
7. Increase in working capital 138 - - - - -
8. Interest - 22 18 13 8 2
9. Repayment of Term Loan - 30 36 41 41 41
B. TOTAL DISPOSALS 268 52 54 54 49 43
C. OPENING BALANCE NIL NIL 52 110 158 211
D. NET SURPLUS NIL 52 58 48 53 59
E. CLOSING BALANCE NIL 52 110 158 211 270
Projected Balance sheet:
Sl.No. Description Amount in Rs. Thousands as at the end of the
1st Yr. 2nd Yr. 3rd Yr. 4th Yr. 5th Yr.
1. Capital Account of Promoter 13 82 163 239 320
2. Surplus from operation 69 81 76 81 86
NET WORTH: 82 163 239 323 406
3. Subsidy 67 67 67 67 67
4. Term loan outstanding 158 122 81 40 -
TOTAL LIABILITIES 307 352 387 427 473
1. Gross Block 130 130 130 130 130
Less Depreciation 13 26 39 52 65
NET BLOCK 117 104 91 78 65
2. Working capital 138 138 138 138 138
3. Cash & Bank Balance 52 110 158 211 270
4. TOTAL ASSETS 307 352 387 427 473

194
WATCH REPAIRING & SERVICING Introduction & Market: Now-a-days almost every office going personal, school/college going students, working class people are having their own wrist watch. A number of houses are having good looking wall clocks or table clocks. These watches require periodical servicing & repairing from time to time. Target: Assuming that the Unit shall operate for single shift of eight hours per day for three hundred days per annum the annual installed capacity is estimated at 1) By repairing & servicing of watches Rs. 2,47,500/- 2) By placement of spare parts assuming 10% marginal profit of purchase Rs.10,72,500/- items Total:Rs.13,20,000/- Raw Material: The requirement at installed capacity and cost of Raw Materials are shown below: Auto wheel, rotter, balance, complete, lever escape wheel, Centre record wheel, S. L..S date wheel, minute wheel, setting lever, Mattch at wheel, key seam, buttom, coil, E.C.B., Battery plout, case, dial, hands main spring, battery set off, day spring, glass, winding pinion, straps, etc. Power: The power is available from the state Electric supply corporation Grid. The consumption of power is estimated Rs. 4,620/- Water: The unit will need 20 Liters of clean and soft water per day for drinking purpose. It is available from both ground water sources and public supply. Manpower: Manpower required by the unit including skilled workers is locally available. The requirement and annual costs of manpower at the installed capacity is shown below:
Sl.No. Category of Manpower No. of Persons Annual Cost
1. Manager 1 self
2. Skilled worker 2 1,05,000/-
Total: 3 1,05,000/-
Financial Aspect: 1. Land & Building : Rented 2. Plant & Machinery No. Amount(Rs.) a) Grinding & buffering machine 1 1,760/- b) Gum for soldering “DEEKS” in wooden box 5 nozzles 1 1,100/- c) Punch box, set of 80 riveting punches riveting tools & 10 stakes 2 2,750/- d) Anvil, blow pipe, brushes, button cell tester, calipers, diamond poger set, draw tong, draw plates drills, eye glass, eye magnifier, file needle, file rafler, file burnisher, micrometer, glass fitting machine, grinder hand with handle, hammers, hand removers, pliers, spanner terry set, screw drivers, pin tongues, case opener etc. 38,500/- Total: Rs. 44,110/- 3) Miscellaneous Fixed Asset a) Electrification Rs. 5,500/- b) Furniture & Miscellaneous others Rs. 16,500/- Total:Rs. 22,000/- 4. Provision for contingencies Rs. 3,300/- 5. Preliminary & pre-operative expenses Rs. 5,500/- Total Rs. 74,910/-

195
6. Working Capital (P.M.) a) Raw Material Rs. 71,500/- b) Utilities Rs. 550/- c) Salary & Wages Rs. 8,800/- d) Other expenses Rs. 7,700/- Total: Rs. 88,550/- Total working capital for 3 months: Rs. 2,65,650/- Total Project Cost: Rs. 3,40,560/- Means of Finance: Urban Rural 1. Composite loan Rs. 2,38,392/- Rs. 2,34,336/-2. Promoter’s contribution Rs. 17,028/- Rs. 17,028/-3. Subsidy Rs. 85,140/- Rs. 1,19,196/-4. Debt equity ratio 2.33:1 1.50:1 Profitability: (Rs. In Thousands)
Sl.No. Description 1st year 2nd year 3rd year 4th year 5th year
1. Capacity utilized as percent of installed capacity
60% 70% 80% 80% 80%
2. Annual Sales Realization 792 924 1056 1056 1056
3. Annual Costs in
a) Raw Materials 515 601 686 686 686
b) Utilities 4 5 5 5 5
c) Selling expenses 61 71 81 81 81
Variable Cost 580 677 772 772 772
d) Wages & Salaries 63 74 84 84 84
e) Administrative expenses 55 65 74 74 74
f) Depreciation 7 7 7 7 7
g) Interest on Composite Loan 29 24 17 10 3
Fixed & Semi Variable Cost 154 170 182 175 168
4. Total Cost 734 847 954 947 940
5. Annual Profit 58 77 107 109 116
6. Return on Investment 17.05 22.64 30.00 32.05 34.11
7. Return on sales 7.32 8.33 9.65 10.32 10.98
8. Annual contribution 212 - - - -
9. Break Even Point 43.52%
10. Cash accrual 65 84 109 116 123
11. Debt Servicing Capacity 94 108 126 126 126
12. Repayment of Composite Loan 39 45 52 52 52
13. Debt Serviced 68 69 69 62 55
14. Pay Back Period 1 year 4 months 24 days
15. Debt Service Coverage Ratio 1.51:1

196
Cash Flow Statement: (Rs. In Thousands)
Sl. No.
Description Pre-operative Period
O p e r a t i n g Y e a r s
First Second Third Fourth Fifth
1. Increase in Promoter’s contribution
17 - - - - -
2. Increase in Term loan 238 - - - -
3. Subsidy 85 - - - - -
4. Depreciation - 7 7 7 7 7
5. Profit before interests - 87 101 119 119 119
A. TOTAL SOURCES 340 94 108 126 126 126
6. Increase in capital investment 75 - - - - -
7. Increase in working capital 265 - - - - -
8. Interest - 29 24 17 10 3
9. Repayment of Term Loan - 39 45 52 52 52
B. TOTAL DISPOSALS 340 68 69 69 62 55
C. OPENING BALANCE NIL NIL 26 65 122 186
D. NET SURPLUS NIL 26 39 57 64 71
E. CLOSING BALANCE NIL 26 65 122 186 257
Projected Balance sheet:
Sl.No. Description Amount in Rs. Thousands as at the end of the
1st Yr. 2nd Yr. 3rd Yr. 4th Yr. 5th Yr.
1. Capital Account of Promoter 17 75 152 254 363
2. Surplus from operation 58 77 102 109 116
NET WORTH: 75 152 254 363 479
3. Subsidy 85 85 85 85 85
4. Term loan outstanding 199 154 102 50 -
TOTAL LIABILITIES 359 391 441 498 564
1. Gross Block 75 75 75 75 75
Less Depreciation 7 14 21 28 35
NET BLOCK 68 61 54 47 40
2. Working capital 265 265 265 265 265
3. Cash & Bank Balance 26 65 122 186 257
4. TOTAL ASSETS 359 391 441 498 564

197
SOUND SYSTEM RENTAL SERVICES
Introduction & Market: The state of Tripura is buzzing with cultural activities. About hundreds of programmes are held every year during Puja season. However, lack of proper Music Sound system has affected the quality of such programmes. As artists are being hired from places like Kolkata, Mumbai and other parts of the country, the lack of proper arrangements have become a stumbling block towards pulling larger audiences for such programmes. The established singers and musians have also shown their reluctance in participating in the programmes in absence of adequate sound facilities. Target: By providing music sound system on hire @ Rs. 8,250/- per programme (considering 50 programmes per year) the annual sales realization in estimated as Rs. 4,12,500/-. Power: The power is available from the state Electric supply corporation Grid. The consumption of power is estimated Rs. 4,620/-. Manpower: The requirement and annual costs of manpower at the installed capacity is shown below:
Financial Aspect: 1. Land & Building : Rented 2. Plant & Machinery
Sl.No. Description Quantity Amount (Rs.)
1. Box (big) 2 nos. 36,000/-
2. Box with Monitor 2 nos. 14,400/-
3. Cable 2 coils 4,320/-
4. Microphone ‘Sure’-14 A 2 nos. 4,200/-
5. Microphone ‘Sure’-SM 58 2 nos. 12,600/-
6 Stabilizer-5 KV 1 no. 6,000/-
7. Relay-RV3 1 no 9,360/-
8. Relay – DD3 1 no. 6,600/-
9. Microphone ‘Sure’-608 2 Nos. 3,120/-
10. Wire 1 coil 1,680/-
11. 500 W stranger 1 no. 10,800/-
12. 250 W AHUJA 1 no. 12,360/-
13. Mixing Machine 30,000/-
Total: 1,50,840/-
3) Miscellaneous Fixed Asset a) Electrification Rs. 11,000/- b) Furniture & Miscellaneous others Rs. 16,500/- Total: Rs. 27,500/- 4. Provision for contingencies Rs. 8,277/- 5. Preliminary & pre-operative expenses Rs. 21,753/- Total Fixed Costs: Rs. 1,95,800/-
Sl.No. Category of Manpower No. of Persons Annual Cost
1. Manager 1 self
2. Assistant 1 52,800/-
Total: 2 52,800/-

198
6. Working Capital (P.M.) a) Raw Material Rs. Nil b) Utilities Rs. 550/- c) Salary & Wages Rs. 4,400/- d) Other expenses Rs. 7,700/- Total: Rs. 12,650/- Total Project Cost: Rs. 2,08,450/- Means of Finance: Urban Rural 1. Composite loan Rs. 1,45,915/- Rs. 1,25,070/-2. Promoter’s contribution Rs. 10,422/- Rs. 10,422/-3. Subsidy Rs. 52,113/- Rs. 72,958/-4. Debt equity ratio 2.33:1 1.50:1 Profitability: (Rs. In Thousands) Sl.No. Description 1st year 2nd year 3rd year 4th year 5th year
1. Capacity utilized as percent of installed capacity
60% 70% 80% 80% 80%
2. Annual Sales Realization 248 288 330 330 330
3. Annual Costs in
a) Raw Materials - - - - -
b) Utilities 4 5 5 5 5
c) Selling expenses 11 13 15 15 15
Variable Cost 15 18 20 20 20
d) Wages & Salaries 32 37 42 42 42
e) Administrative expenses 55 65 74 74 74
f) Depreciation 19 19 19 19 19
g) Interest on Composite Loan 18 14 10 6 2
Fixed & Semi Variable Cost 124 135 145 141 137
4. Total Cost 139 153 165 161 157
5. Annual Profit 109 135 165 169 173
6. Return on Investment 26.33% 32.96% 39.845 70.79% 41.75%
7. Return on sales 52.11% 65.23% 78.83% 80.235 82.65%
8. Annual contribution 233 - - - -
9. Break Even Point 31.92%
10. Cash accrual 128 154 184 188 192
11. Debt Servicing Capacity 146 168 194 194 194
12. Repayment of Composite Loan 24 28 32 32 32
13. Debt Serviced 42 42 42 38 34
14. Pay Back Period 3 years 6 months 28 days
15. Debt Service Coverage Ratio 3.04:1

199
Cash Flow Statement: (Rs. In Thousands)
Sl. No.
Description Pre-operative Period
O p e r a t i n g Y e a r s
First Second Third Fourth Fifth
1. Increase in Promoter’s contribution
10 - - - - -
2. Increase in Term loan 146 - - - - -
3. Subsidy 52 - - - - -
4. Depreciation - 19 19 19 19 19
5. Profit before interests - 127 149 175 175 175
A. TOTAL SOURCES 208 146 168 194 194 194
6. Increase in capital investment 196 - 168 - - -
7. Increase in working capital - 12 - - - -
8. Interest - 18 14 10 6 2
9. Repayment of Term Loan - 24 28 32 32 32
B. TOTAL DISPOSALS 208 42 42 42 38 34
C. OPENING BALANCE NIL NIL 104 233 382 538
D. NET SURPLUS NIL 104 126 150 156 160
E. CLOSING BALANCE NIL 104 230 382 538 700
Projected Balance sheet:
Sl. No.
Description Amount in Rs. Thousands as at the end of the
1st Yr. 2nd Yr. 3rd Yr. 4th Yr. 5th Yr.
1. Capital Account of Promoter 10 119 254 419 588
2. Surplus from operation 109 135 165 169 173
NET WORTH: 119 254 419 588 761
3. Subsidy 52 52 52 52 52
4. Term loan outstanding 122 94 62 30 -
TOTAL LIABILITIES 293 400 533 670 813
1. Gross Block 196 196 196 196 196
Less Depreciation 19 38 57 76 95
NET BLOCK 177 158 139 120 101
2. Working capital 12 12 12 12 12
3. Cash & Bank Balance 104 230 382 538 700
4. TOTAL ASSETS 293 400 533 670 813

200
PHOTOCOPYING/ LAMINATION/ PCO
Introduction: Photocopying/ Lamination/ PCO unit is now-a-days a popular service oriented enterprise, especially in the urban areas. Such a unit basically contains a photo copier commonly known as Xerox machine, which is used for producing true and instant copies of all types of text, document, certificates etc. The PCO centre serve as a facility for communication especially to those people who do not have telephone connections or fax machine. A photocopier/ lamination machine/ PCO/ Fax can be easily handled by practically anyone with hardly any training and requires little space for operation. Market: There is a good market for the services of a photo copying/ lamination/ PCO unit especially in the urban areas where there is a large scale requirements of printed information and text. The demand is mainly from offices, schools, colleges and business establishments which increasingly require the services of photocopiers/ lamination/ Fax. Such a combined unit has a very good scope. Target: Assuming that the Unit shall operate for single shift of eight hours per day for three hundred days per annum the annual installed capacity is estimated at (1) By sale of 3,30,000 copies per annum @ Rs. 1.00 per copy - Rs. 3,30,000/- (2) By lamination of documents - Rs. 2,50,000/- (3) From Fax/ STD/ ISD/ Local call - Rs. 2,40,000/- Total: Rs. 8,20,000/- Raw Materials: The requirement at installed capacity and cost of Raw Materials are shown below: 1. Paper - Rs. 3,658/- 2 Toner - Rs. 7,500/- 3. Lamination Paper - Rs. 3,000/- 4. Xeroxing paper roll for telephone prill - Rs. 10,000/- 5. Paper roll for fax machine - Rs. 3,000/- 6. Miscellaneous others including replacement - Rs. 10,000/- of Toner drum Total: Rs. 37,158/- Power: The power is available from the State Electric supply corporation Grid. The consumption of power is estimated Rs. 14,400/-. Water: The unit will need 20Liter of clean and soft water per day. It is available from both ground water sources and public supply. Manpower: Manpower required by the unit including skilled workers is locally available. The requirement and annual costs of manpower at the installed capacity is shown below:
Sl.No. Category of Manpower No. of Persons Annual Cost
1. Supervisor 1 Self
2. Operator 1 42,000/-
Total: 42,000/-
Financial Aspect : 1) Land & Building - Rented 2) Plant & Machinery a) Photo copying machine - Rs. 99,500/- b) Stabilizer - Rs. 5,000/- c) Lamination machine - Rs. 12,000/-

201
d) Telephone system with billing equipments - Rs. 30,000/- e) Fax machine - Rs. 7,000/- Total: Rs.1,53,500/- 3) Miscellaneous Fixed Asset a) Electrification Rs. 5,000/- b) Furniture & Miscellaneous others Rs. 10,000/- Rs. 15,000/- 4. Provision for contingencies Rs. 8,425/- 5. Preliminary & pre-operative expenses Rs 22,125/- Total: Rs. 1,99,050/- 6. Working Capital (P.M.) a) Raw Material Rs. 37,200/- b) Utilities Rs. 1,500/- c) Salary & Wages Rs. 3,500/- d) Other expenses Rs. 5,000/- Total: Rs. 47,200/- Total working capital for 3 months: Rs. 1,41,600/- Total Project Cost: Rs. 3,40,650/- Means of Finance: Urban Rural 1. Composite loan Rs. 2,38,455/- Rs.2,04,390/-2. Promoter’s contribution Rs. 17,033/- Rs. 17,033/-3. Subsidy Rs. 85,162/- Rs.1,19,227/-4. Debt equity ratio 2.33:1 1.50:1 Profitability: Sl.No. Description 1st year 2nd year 3rd year 4th year 5th year
1. Capacity utilized as percent of installed capacity
60% 70% 80% 80% 80%
2. Annual Sales Realization in Rs. 4,92,000 5,74,000 6,56,000 6,56,000 6,56,000
3. Annual Costs in Rs.
a) Raw Materials 2,67,870 3,12,480 3,57,120 3,57,120 3,57,120
b) Utilities 10,800 12,600 14,400 14,400 14,400
c) Selling expenses 34,800 40,600 46,400 46,400 46,400
Variable Cost 3,13,440 3,65,680 4,17,920 4,17,920 4,17,920
d) Wages & Salaries 25,200 29,400 33,600 33,600 33,600
e) Administrative expenses 36,000 42,000 48,000 48,000 48,000
f) Depreciation 19,905 19,905 19,905 19,905 19,905
g) Interest on Composite Loan 27,390 22,154 16,112 9,667 3,222
Fixed & Semi Variable Cost 1,08,495 1,13,459 1,17,617 1,11,172 1,04,727
4. Total Cost 4,21,935 4,79,139 5,35,537 5,29,092 5,22,647
5. Annual Profit 70,065 94,861 1,20,463 1,26,908 1,33,353
6. Return on Investment 20.56% 27.84% 35.36% 37.25% 39.14%
7. Return on sales 8.54% 11.56% 14.69% 15.47% 16.26%
8. Annual contribution 1,78,560 - - - -
9. Break Even Point 36.45%
10. Cash accrual 89,970 1,14,766 1,40,368 1,46,813 1,53,258
11. Debt Servicing Capacity 1,17,360 1,36,920 1,56,480 1,56,480 1,56,480
12. Repayment of Composite Loan 38,668 45,113 51,558 51,558 51,558
13. Debt Serviced 66,058 67,267 67,670 67,670 67,670
14. Pay Back Period 1 year 9 months 7 days
15. Debt Service Coverage Ratio 1.78:1
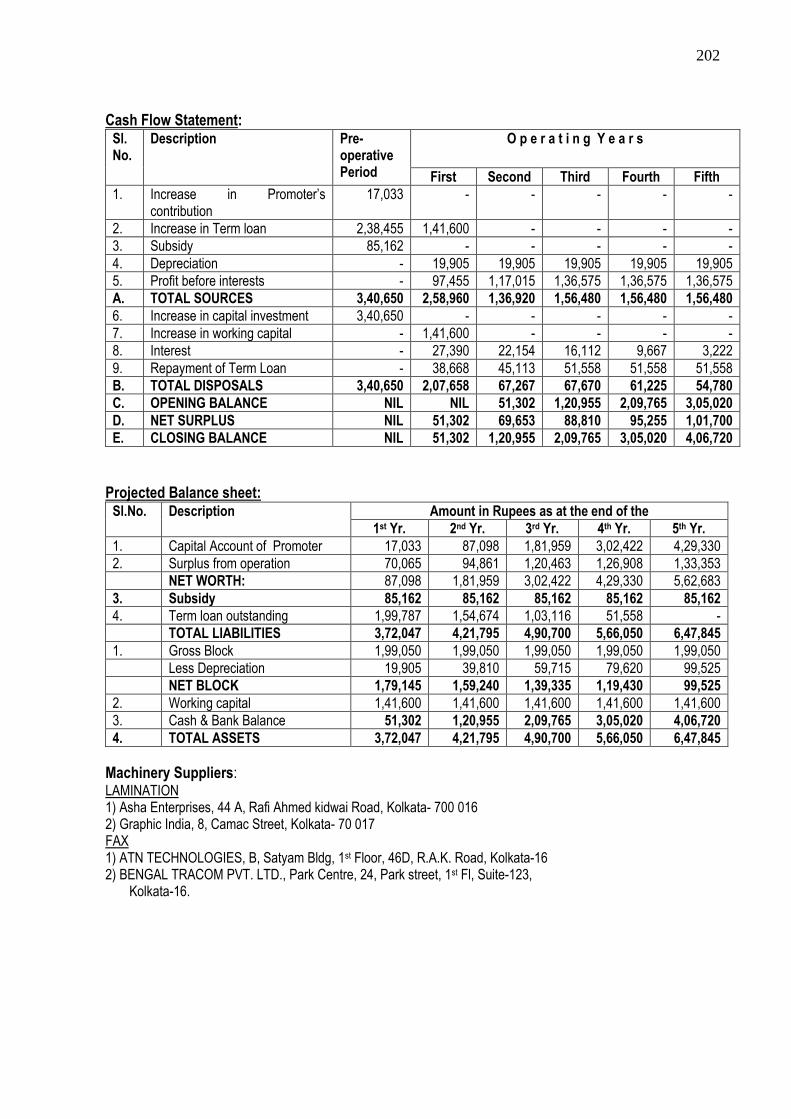
202
Cash Flow Statement: Sl. No.
Description Pre-operative Period
O p e r a t i n g Y e a r s
First Second Third Fourth Fifth
1. Increase in Promoter’s contribution
17,033 - - - - -
2. Increase in Term loan 2,38,455 1,41,600 - - - -
3. Subsidy 85,162 - - - - -
4. Depreciation - 19,905 19,905 19,905 19,905 19,905
5. Profit before interests - 97,455 1,17,015 1,36,575 1,36,575 1,36,575
A. TOTAL SOURCES 3,40,650 2,58,960 1,36,920 1,56,480 1,56,480 1,56,480
6. Increase in capital investment 3,40,650 - - - - -
7. Increase in working capital - 1,41,600 - - - -
8. Interest - 27,390 22,154 16,112 9,667 3,222
9. Repayment of Term Loan - 38,668 45,113 51,558 51,558 51,558
B. TOTAL DISPOSALS 3,40,650 2,07,658 67,267 67,670 61,225 54,780
C. OPENING BALANCE NIL NIL 51,302 1,20,955 2,09,765 3,05,020
D. NET SURPLUS NIL 51,302 69,653 88,810 95,255 1,01,700
E. CLOSING BALANCE NIL 51,302 1,20,955 2,09,765 3,05,020 4,06,720
Projected Balance sheet:
Sl.No. Description Amount in Rupees as at the end of the
1st Yr. 2nd Yr. 3rd Yr. 4th Yr. 5th Yr.
1. Capital Account of Promoter 17,033 87,098 1,81,959 3,02,422 4,29,330
2. Surplus from operation 70,065 94,861 1,20,463 1,26,908 1,33,353
NET WORTH: 87,098 1,81,959 3,02,422 4,29,330 5,62,683
3. Subsidy 85,162 85,162 85,162 85,162 85,162
4. Term loan outstanding 1,99,787 1,54,674 1,03,116 51,558 -
TOTAL LIABILITIES 3,72,047 4,21,795 4,90,700 5,66,050 6,47,845
1. Gross Block 1,99,050 1,99,050 1,99,050 1,99,050 1,99,050
Less Depreciation 19,905 39,810 59,715 79,620 99,525
NET BLOCK 1,79,145 1,59,240 1,39,335 1,19,430 99,525
2. Working capital 1,41,600 1,41,600 1,41,600 1,41,600 1,41,600
3. Cash & Bank Balance 51,302 1,20,955 2,09,765 3,05,020 4,06,720
4. TOTAL ASSETS 3,72,047 4,21,795 4,90,700 5,66,050 6,47,845
Machinery Suppliers: LAMINATION 1) Asha Enterprises, 44 A, Rafi Ahmed kidwai Road, Kolkata- 700 016 2) Graphic India, 8, Camac Street, Kolkata- 70 017 FAX 1) ATN TECHNOLOGIES, B, Satyam Bldg, 1st Floor, 46D, R.A.K. Road, Kolkata-16 2) BENGAL TRACOM PVT. LTD., Park Centre, 24, Park street, 1st Fl, Suite-123,
Kolkata-16.

203
TYRE RETREADING Introduction: Next to fuel, Tyre cost is the largest operating cost of vehicle operation. As such ways and means to reduce tyre cost are searched by all vehicle operators. Re-use of vehicle Tyres by Re-Treading at comparatively cheaper. Over the years technology for tyre retreading has improved to such an extent that now a retreated tyre lasts more than a new tyre, whereas a retreaded tyre costs less than fifty percent of a new tyre. Due to nature of terrain and poor infrastructural development Tripura depend on Road for most of its goods and passenger transport. Therefore tyre retreading is a need in the State.
Market: Retreading of vehicle Tyres is a need for the landlocked state like Tripura depending more on roads for transport. As the State depends mostly on Road transport its vehicle population is increasing very fast. Besides, the State is increasing vehicles for public transport. From 90,454 vehicles in 2004-05 the vehicle population has increased to about 1,80,000 in 2009-10 and the increase has been very high in 2010-11. Out of these vehicles about 36.75 percent are using retreaded tyres. In pre-cured Tyre Retreading Brands like Indag, MRF etc. are preferred, and hence franchise agreement with such Brands are essential for better market penetration. Conventional ‘hot’ process tyre retreading, however, do not need such franchise. Market trend indicate preference to pre-cured (cold) Tyre Retreading. Installed Capacity: Operating Single shift of 8 hours per day for 300 working days per annum the unit will annual installed capacity to retread 7200 Tyres. Process of Manufacture: Casings/ damaged Tyres purchased/ received are inspected for detecting damages and repaired by patching with Readymade patches. The outer surface of the tyre is then buffed in the Buffing machine. The buffed tyre is coated by Rubber solution and pre-cured Treads are placed on the Rubber solution inside flexible casings. These casings are then placed in the curing machine where steam vulcanize and fix the tread on the tyre casing. Process Flow:
Sales Raw Material: It is assumed that out of 24 Tyres per day only 8 shall be retreading on job basis. Remaining 16 tyres shall be retreaded for sales by procuring worn-out Tyres/ casings shall be available from markets inside the State. Pre-cured Treads and solutions shall be purchased from franchise providers. The requirement and cost of raw-materials per annum at the installed capacity is shown below:
Sl.No. Raw Material Annual Requirement Cost
1. Pre-cured tread for Tyres of various sizes
65,000 kgs. 65,00,000/-
2. Bonding Gum & solutions 6,500 Liters 12,00,000/-
3. Patches, Buffing knives etc. L.S. 4,00,000/-
Total: 81,00,000/-
Inspection Manual Repair Buffing Tread & solution Application
Placing in casings Curing Release from casing

204
Power: The Unit will require a connected Load of 10 KW at 400/440 volts, 50Ha, AC, 3 Phase & 4 wire. The power is available from the state Electric Supply Corporation Grid. The Annual Consumption of power is estimated at 19200 KW Hrs. Costing Rs. 34,560/- Water: The daily requirement of water is estimated at 500 liters. Manpower: Apart from two machine operators all the manpower is available locally. The requirement of manpower and annual costs are shown below:
Sl. No. Category of Manpower No. of persons Annual Costs
1. Manager 1 Self
2. Administrative & Sales Clerk 2 Rs. 96,000
3. Skilled Workers 3 Rs. 1,80,000
4. Unskilled Workers 3 Rs. 90,000
Total: 9 Rs. 3,66,000
Capital Cost Estimate: 1) Land & Building : Covered area 186 sq. Mtrs. On Rent 2) Plant & Machinery a) One Tyre Buffing Machine with Motor & all accessories Rs. 1, 50,000/- b) One Non IBR coal fired Boiler Rs. 55,000/- c) One Tyre curing Machine Rs. 75,000/- d) Aluminium moulds & casings for various sizes of Tyres : 1 Each Rs. 78,000/- Rs. 3,58,000/- 3. Miscellaneous Fixed Assets (a) Electrification Rs. 75,000/- (b) Water Installation Rs. 10,000/- © Miscellaneous others Rs. 40,000/- Rs. 1,25,000/- 4. Provision for contingencies Rs. 27,000/- 5. Preliminary & Pre-operative expenses Rs. 25,000/- Total fixed Costs: Rs.5, 10,000/- 6. Working Capital: (a) Three months Raw Materials Rs. 1,68,750/- (b) Three months power cost Rs. 8,640/- (c ) Three months Wages & Salaries Rs. 91,500/- (d) One months Other expenses Rs. 40,800/- Total Working Capital: Rs. 3,09,690/-
TOTAL PROJECT COST: Rs. 8,19,690/- (Say Rs. 8,20,000/-)
Means of finance: URBAN RURAL 1. Composite Loan: Rs. 5,74,000 Rs. 4,92,000 2. Subsidy: Rs. 2,05,000 Rs. 2,87,000 3. Promoters’ Contribution: Rs. 41,000 Rs. 41,000 4. Debt. Equity Ratio: 2.33:1 1.50:1

205
Profitability: (Rs. in Thousands)
Sl. No.
Description 1st Yr. 2nd Yr. 3rd Yr. 4th Yr. 5th Yr.
1. Capacity Utilization 60% 70% 80% 80% 80%
2. Annual sales Realization 1206 1407 1608 1608 1608
3. Annual Costs in
(a) Raw Materials 405 473 540 540 540
(b) Power 28 31 35 35 35
(c) Repair & Maintenance 11 11 11 11 11
(d) Wages and salaries 366 370 375 375 375
(e) Administrative overheads 90 95 99 104 109
(f) Selling expenses 119 139 158 158 158
(g) Depreciation 60 60 60 60 60
(h) Interest 66 54 39 23 10
Total Operating Costs 1145 1233 1317 1306 1298
Total Variable Costs 552 643 733 733 733
4. Annual Profit 61 174 291 302 310
5. Return on Investment 7.44% 21.22% 35.37% 36.83% 37.80%
6. Return on sales 5.06% 12.37% 18.10% 18.78% 19.28%
7. Annual Contribution 654 - - - -
8. Break Even Point 54.40%
9. Cash Accrual 121 234 351 362 370
10. Debt Servicing Capacity 187 288 390 385 320
11. Repayment of Loan 89 110 125 125 125
12. Debt Serviced 155 164 164 148 135
13. Pay Back Period 2 Years 7 months 13 days
14. Debt Service Coverage Ratio 1:83:1
Cash Flow Statement: (Rs in Thousands)
Sl. No.
Description Pre- operative period
Operating years
1st 2nd 3rd 4th 5th
1. Increase in Promoters’ Capital 41 - - - - -
2. Increase in Subsidy 205 - - - - -
3. Increase in Loan 574 - - - - -
4. Depreciation - 60 60 60 60 60
5. Profit before interest - 127 228 330 325 320
A Total Sources 820 187 288 390 385 380
6. Increase in Capital Investment 510 - - - - -
7. Increase in Current Assets 310 - - - - -
8. Interests - 66 54 39 23 10
9. Repayment of Loan - 89 110 125 125 125
B. Total Disposals 820 155 164 164 148 135
C. Opening balance - - 32 156 382 619
D. Net Surplus - 32 124 226 237 245
E. Closing Balance - 32 156 382 619 864

206
Projected Balance Sheets:
Sl. No.
Description Amount in Thousand Rs. Thousands as at the end of
1st Yr. 2nd Yr. 3rd Yr. 4th Yr. 5th Yr.
1. Capital Account of Promoters
41 102 276 567 869
2. Surplus from operations 61 174 291 302 310
Net Worth 102 276 567 869 1179
3. Subsidy 205 205 205 205 205
4. Loan 485 375 250 125 -
A. Total Liabilities 792 856 1022 1199 1384
1. Gross Fixed Assets 510 510 510 510 510
Less Depreciation 60 120 180 240 300
Net Block 450 390 330 270 210
2. Current Assets 310 310 310 310 310
3. Cash & Bank balance 32 156 382 619 864
B. Total Assets 792 856 1022 1199 1384

207
TESTING AND GRINDING OF DIESEL ENGINE PUMP NOZZLE
Introduction: Frequent test and grinding of Nozzle of Diesel Engine is a need. Nozzle of Diesel Engine gets choked due to deposits of Carbon and other materials. This is one of the most common problem of Diesel Engines and hence need remedies. iesel Engines & Generators, Buses, Trucks, Cars, Tractors, motorcycles & other vehicles need these services very frequently. Market: With the increase in prices of Petrol, Diesel Engine driven vehicles have become very popular. Thus along with large vehicles like Bus, Truck, Minibus, Tractor, etc. smaller vehicles with Diesel Engines have increased manifold. Besides, Diesel Engine operated Generators are new providing services during Load-shedding in almost every urban localities. Therefore, the demand for testing of Diesel Engine Pumps and grinding/ reconditioning of Nozzle has increased manifold. This automobile servicing unit therefore have good marketing potential. Installed Capacity: assuming that the unit will operate for single shift of 8 hours per day for 300 working days per annum the annual installed capacity is estimated at the following: 1. Diesel Pump Testing 3600 Nos. with a sales value of Rs. 5,04,000/- 2. Nozzle testing 3600 Nos. with a sales value of Rs. 72,000/- 3. Nozzle Grinding 3600 Nos. with a sales value of Rs. 1,26,000/- Total: Rs. 7,02,000/- Process of Manufacture: Diesel Engines of vehicles/ Generators are located on the Diesel Fuel pump test bench. After detecting fault the nozzle is also tested. Based on the findings Nozzle grinding and/ or reconditioning is done in the machine. Process Flow: Raw Materials: The unit do not need any raw-material as the job-work involved is that of testing & Grinding. However, small quantities of Diesel and Kerosene oils are required. Annually 500 Liters each of Diesel and Kerosene oil costing Rs. 31,350/- may be required at the installed capacity.
Power: The power is available from the state Electric supply corporation Grid. The annual consumption of power is estimated Rs. 1,80,000/-. Water: The unit will need 3000 liters of clean and soft water. It is available from both ground water sources and public supply. Manpower: Manpower required by the unit including skilled workers is locally available. The requirement and annual costs of manpower at the installed capacity is shown below:
Sl.No. Category of Manpower No. of Persons Annual Cost 1. Manager 1 Self
2. Skilled Worker 2 1,20,000/-
3. Helper 2 96,000/-
Total 5 2,16,000/-
Removal of Fuel Pump from vehicle/
Generator manually
Fuel Pump
Test Nozzle Test Nozzle
Grinding
Refitting the Fuel
Pump

208
Capital Cost Estimate: 1) Land & Building On Rent 2) Plant & Machinery i) Diesel Fuel-Pump Test bench Rs. 95,000/- ii) Nozzle grinding & reconditioning Machine Rs. 30,000/- iii) Nozzle Tester Rs. 7,000/- iv) Tools Rs. 10,550/- Rs. 1,42,550/- 3) Miscellaneous Fixed Asset a) Electrification Rs. 6,000/- b) Water Installation Rs. 6,000/- c) Furniture & Miscellaneous others Rs. 15,000/- Rs. 27,000/- 4. Provision for contingencies Rs. 10,000/- 5. Preliminary & pre-operative expenses Rs. 20,700/- Rs. 30,700/-
Total Fixed Investment Rs. 2,00,250/- 6. Working Capital (P.M.) a) Raw Material Rs. 31,350/- b) Utilities Rs. 1,800/- c) Salary & Wages Rs. 18,000/- d) Other expenses Rs. 15,000/- Total: Rs. 66,150/- Total working capital for 3 months: Rs. 1,98,450/- Total Project Cost: Rs. 3,98,700/- Means of Finance: Urban Rural 1. Composite loan Rs. 2,79,090/- Rs. 2,39,220/- 2. Promoter’s contribution Rs. 19,935/- Rs. 19,935/- 3. Subsidy Rs. 99,675/- Rs. 1,39,545/-4. Debt equity ratio 2.33:1 1.50:1 Profitability:
Sl.No. Description 1st year 2nd year
3rd year 4th year 5th year
1. Capacity utilized 60% 70% 80% 80% 80%
2. Annual Sales Realization in Rs. 6,45,000 7,52,500 8,60,000 8,60,000 8,60,000
3. Annual Costs in Rs.
a) Raw Materials 2,25,720 2,63,340 3,00,960 3,00,960 3,00,960
b) Utilities 12,960 15,120 17,280 17,280 17,280
c) Selling expenses 47,550 55,470 63,400 63,400 63,400
Variable Cost 2,.86,230 3,33,930 3,81,640 3,81,640 3,81,640
d) Wages & Salaries 1,29,600 1,51,200 1,72,800 1,72,800 1,72,800
e) Administrative expenses 1,08,000 1,26,000 1,44,000 1,44,000 1,44,000
f) Depreciation 20,025 20,025 20,025 20,025 20,025
g) Interest on Composite Loan 32,058 25,929 17,915 10,372 2,829
Fixed & Semi Variable Cost 2,89,683 3,23,154 3,54,740 3,47,197 3,39,654
4. Total Cost 5,75,913 6,57,084 7,36,380 7,28,837 7,21,294
5. Annual Profit 69,087 95,416 1,23,620 1,31,163 1,38,706

209
6. Return on Investment 17.32% 23.93% 31.00% 32.89% 34.78%
7. Return on sales 6.42% 8.87% 11.49% 12.20% 12.90%
8. Annual contribution 3,58,770 - - - -
9. Break Even Point 48.44%
10. Cash accrual 89,112 1,15,441 1,43,645 1,51,188 1,58,731
11. Debt Servicing Capacity 1,21,170 1,41,370 1,61,560 1,61,560 1,61,560
12. Repayment of Composite Loan 45,258 52,801 60,344 60,344 60,344
13. Debt Serviced 77,316 78,730 78,259 70,716 63,173
14. Pay Back Period 1 year 6 months 21 days
15. Debt Service Coverage Ratio 1.56:1
Cash Flow Statement:
Sl. No.
Description Pre-operative Period
O p e r a t i n g Y e a r s
First Second Third Fourth Fifth
1. Increase in Promoter’s contribution
19,935 - - - - -
2. Increase in Term loan 2,79,090 1,98,450 - - - -
3. Subsidy 99,675 - - - - -
4. Depreciation - 20,025 20,025 20,025 20,025 20,025
5. Profit before interests - 1,01,145 1,21,345 1,41,535 1,41,535 1,41,535
A. TOTAL SOURCES 3,98,700 3,19,620 1,41,370 1,61,560 1,61,560 1,61,560
6. Increase in capital investment
3,98,700 - - - - -
7. Increase in working capital - 1,98,450 - - - -
8. Interest - 32,058 25,929 17,915 10,372 2,829
9. Repayment of Term Loan - 45,258 52,801 60,344 60,344 60,344
B. TOTAL DISPOSALS 3,98,700 2,75,766 78,730 78,259 70,716 63,173
C. OPENING BALANCE NIL NIL 43,854 1,06,494 1,89,795 2,80,639
D. NET SURPLUS NIL 43,854 62,640 83,301 90,844 98,387
E. CLOSING BALANCE NIL 43,854 1,06,494 1,89,795 2,80,639 3,79,026
Projected Balance sheet:
Sl.No. Description Amount in Rupees as at the end of the
1st Yr. 2nd Yr. 3rd Yr. 4th Yr. 5th Yr. 1. Capital Account of
Promoter 19,935 89,022 1,84,438 3,08,058 4,39,221
2. Surplus from operation
69,087 95,416 1,23,620 1,31,163 1,38,706
NET WORTH: 89,022 1,84,438 3,08,058 4,39,221 5,77,927
3. Subsidy 99,675 99,675 99,675 99,675 99,675
4. Term loan outstanding 2,33,832 1,81,031 1,20,687 60,343 - TOTAL LIABILITIES 4,22,529 4,65,144 5,28,420 5,99,239 6,77,602
1. Gross Block 2,00,250 2,00,250 2,00,250 2,00,250 2,00,250
Less Depreciation 20,025 40,050 60,075 80,10 1,00,125
NET BLOCK 1,80,225 1,60,200 1,40,175 1,20,150 1,00,125
2. Working capital 1,98,450 1,98,450 1,98,450 1,98,450 1,98,450 3. Cash & Bank Balance 43,854 1,06,494 1,89,795 2,80,639 3,79,026
TOTAL ASSETS 4,22,529 4,65,144 5,28,420 5,99,239 6,77,602

210
SCREEN PRINTING (ON FABRIC) UNIT Introduction: The selection of clothes reflects a persons personally, and every persons has a different choice of taste for the specific colours and design of the clothes. In this context, we can say that the most commonly used and reasonable way to produce varying and favourite designs of people is screen printing. Market: Screen printing is appropriate means for different kinds of clothes like sarees, its borders, T-shirts, vest coats, Dupattas, scarf, sport shirts, curtains, wall-hanging, banners and many other Screen-printing would be especially used in those cases where the printing work is limited and has considerable variety of designs involved. Therefore, this work is most appropriate for people who have creative inclinations. The work can be obtained by the entrepreneur from different schools, makers of ready-made clothes shop keepers, different business groups, entrepreneur from different business groups, entrepreneurs sports clubs etc., in addition to this group, the printer can also take up work given by college going girls and women, in general. Other than these sources, sufficient work can be obtained from the political parties. Installed Capacity: In the given unit, it is presumed that screen printing is possible over 18000 metre cloth annually consisting of all kinds of clothes such sarees, sport shirts, advertisements, banners, dupattas, curtains, wall hanging and so on. Out of it 12000 metres cloth would be purchased while 6000 meters would be sponsored by the customer over which the artist would do his job of painting. Hence from both types of work, he would get following income. a. Purchasing & printing the cloth Rs. 11,00,000/- b. Printing depending over the job work Rs. 5,50,000/- Total Income: Rs. 16,50,000/- Process: The design, figure and others that has to be printed over the cloth/ fabric, their figure or photo is prepared by the artist. After this frames made out of light wood on conduit pipes are covered by bottling cloth. Then P.V.A. (silicate 63) and Ammonia bi-chromate solution are applied on the bottling cloth. This frame is used as negative & it is dried-up in shade. After this, it is placed over the exposure box fitted with tube light and respective design is taken over the frame. Over the exposure the space for the figure is created on the frame and the colours of only the figure are imposed on the frame as it is required. After exposure the Enamel paint is applied on both sides and thus the screen is prepared. After the screen is made, binding paste and pigment colours are mixed and prepared. Later the cloth to be printed, is well pressed and fitted over the table. After this, screen with a figure is placed over the cloth and then screen is removed. It is fixed on the table and the colour is put over it and evenly disturbed by a rubber squeezy so that the colour passes on the cloth through the exposed figure. The screen as mentioned is removed and cloth to be printed is placed over it. Similarly remaining clothes are printed. Printed cloths are dried & pressed before packing and sales.

211
Process flow: Raw Material: Raw Materials to be used in this unit would be the following: Sl. No. Details Total Cost
1. Screen Printing film paper (roll of 10x2 feet) 13,200/-
2. Different colours & chemicals 11,000/-
3. Sponge 550/-
4. Bowls for mixing spoon 550/-
5. spoon 275/-
6. Binder 5,500/-
7. Fixer 2,200/-
8. Cloth for printing 38,500/-
9. Others like glue, nails, paper, pins, cotton, Kerosene, thinner,etc. 5,500/-
Total: 77,275/-
Every month 500 mtrs. of cloth would be printed depending over job work and the rest would be purchased and worked over. Power: The power is available from the state Electric supply corporation Grid. The annual consumption of power is estimated Rs. 15,840/-. Water: The unit will need 5000 liters of clean and soft water per day. It is available from both ground water sources and public supply. Manpower: Manpower required by the unit including skilled workers is locally available. The requirement and annual costs of manpower at the installed capacity is shown below:
Sl.No. Category of Manpower No. of Persons Annual Cost
1. Manager 1 Self
2. Trained worker 2 11,000/-
3. Assistant 1 3,850/-
Total 4 14,850/-
Wooden frame covered by bolting cloth
Application of P.V.A or
Ammonia-bi-Chromate sol Drying in shade
Fitted over the exposure box with tube light
Placing of respective design/ logo etc.
Frame with design
Application of enamel paint on both side of frame
Screen Cloth Pressing Fitting over
the table
Placing of designed
screen
Putting of
colour mixer
Evenly
distributed
by squeeze
Removing
of screen
Printed
cloth
Drying
Pressing sale
s

212
Financial Aspect of the unit: 1) Land & Building Rented 2) Plant & Machinery Major Machineries to be used in this particular unit would be following:
Sl.No. Details No. Total Cost (in Rs.)
1. Enlarger 1 24,000/-
2. Ink Drier 1 18,000/-
3. Heater 1 1,800/-
4. Dark Room (6x8”) 1 12,000/-
5. Colour Mixer 1 5,400/-
6. Exposing table 1 9,000/-
7. Wooden stand for screen 1 2,400/-
8. Designing table 1 3,600/-
9. Printing table 1 6,000/-
10. Bolting cloth 6,600/-
11. Display Board 1 1,800/-
12. Masking Board 1 1,800/-
13. Screen Frames 16x12”, 18x24”, 2x2 feet 30 5,400/-
14. Squeezy 4”, 6”, 10”, 12” 14 5,880/-
Total: 1,03,680/-
3) Miscellaneous Fixed Asset a) Electrification Rs. 11,000/- b) Water Installation Rs. 5,500/- c) Furniture & Miscellaneous others Rs. 16,500/- Total: Rs. 33,000/- 4. Provision for contingencies Rs. 6,402/- 5. Preliminary & pre-operative expenses Rs. 16,808/- Total Fixed Investment:Rs. 1,59,890/-6. Working Capital a) Raw Material Rs. 77,275/- b) Utilities Rs. 1,650/- c) Salary & Wages Rs. 14,850/- d) Other expenses Rs. 16,500/- Total: Rs. 1,10,275/- Total working capital for 3 months: Rs. 3,30,825/- Total Project Cost: Rs. 4,90,715/- Means of Finance: Urban Rural 1. Composite loan Rs. 3,43,500/- Rs. 2,94,429/- 2. Promoter’s contribution Rs. 24,536/- Rs. 24,536/- 3. Subsidy Rs. 1,22,679/- Rs. 1,71,750/-4. Debt equity ratio 2.33:1 1.50:1

213
Profitability: (Rs. In Thousands)
Sl.No. Description 1st year 2nd year 3rd year 4th year 5th year
1. Capacity utilized as percent of installed capacity
60% 70% 80% 80% 80%
2. Annual Sales Realization 990 1155 1320 1320 1320
3. Annual Costs in
a) Raw Materials 556 649 742 742 742
b) Utilities 12 14 15 15 15
c) Selling expenses 76 89 102 102 102
Variable Cost 644 752 852 859 859
d) Wages & Salaries 107 125 142 142 142
e) Administrative expenses 119 138 158 158 158
f) Depreciation 16 16 16 16 16
g) Interest on Composite Loan 40 33 24 14 5
Fixed & Semi Variable Cost 282 312 340 330 321
4. Total Cost 926 1064 1199 1189 1189
5. Annual Profit 64 91 121 131 140
6. Return on Investment 13.03% 18.53% 24.64% 26.68% 28.51%
7. Return on sales 6.46% 7.87% 9.16% 9.92% 10.60%
8. Annual contribution 335 - - - -
9. Break Even Point 48.53
10. Cash accrual 80 107 137 147 156
11. Debt Servicing Capacity 120 140 161 161 161
12. Repayment of Composite Loan 56 65 75 74 74
13. Debt Serviced 96 98 99 88 79
14. Pay Back Period 1 year 3 months 10 days
15. Debt Service Coverage Ratio 1.28:1
Cash Flow Statement: (Rs. In Thousands)
Sl. No.
Description Pre-operative Period
O p e r a t i n g Y e a r s
First Second Third Fourth Fifth
1. Increase in Promoter’s contribution
24 - - - - -
2. Increase in Term loan 344 - - - - -
3. Subsidy 123 - - - - -
4. Depreciation - 16 16 16 16 16
5. Profit before interests - 104 124 145 145 145
A. TOTAL SOURCES 491 120 140 161 161 161
6. Increase in capital investment 160 - - - - -
7. Increase in working capital 331 - - - - -
8. Interest - 40 33 24 14 5
9. Repayment of Term Loan - 56 65 35 74 74
B. TOTAL DISPOSALS 491 96 98 99 88 79
C. OPENING BALANCE NIL NIL 24 66 128 201
D. NET SURPLUS NIL 24 42 62 73 82
E. CLOSING BALANCE NIL 24 66 128 201 283

214
Projected Balance sheet:
Sl.No. Description Amount in Rs. Thousands as at the end of the
1st Yr. 2nd Yr. 3rd Yr. 4th Yr. 5th Yr.
1. Capital Account of Promoter 24 88 179 300 431
2. Surplus from operation 64 91 121 131 140
NET WORTH: 88 179 30 431 571
3. Subsidy 123 123 123 123 123
4. Term loan outstanding 288 223 148 74 -
TOTAL LIABILITIES 499 525 571 628 694
1. Gross Block 160 160 160 160 160
Less Depreciation 16 32 48 64 80
NET BLOCK 144 128 112 96 80
2. Working capital 331 331 331 331 331
3. Cash & Bank Balance 24 66 128 201 283
TOTAL ASSETS 499 525 571 628 694
Suppliers of Printing Material
1) Jain Silk Screen Centre, 3, Burtolla Street, Kolkata – 7 2) SHIVA CHEMICAL28, B.T. RD, Kolkata – 2.

215
REFRIGERATOR & AC REPAIRING Introduction: Refrigerators and air conditioners have become almost a necessity in every house, business establishment, shops, hospitals, offices, laboratories etc. the no. of which is constantly increasing. Along with this, there is a problem that these equipment often get out of order, repair of these require good workshops. Besides, the repairing regular maintenance of these equipments smooth functioning. Therefore, if unit are established in cities dealing with the repairs and servicing of refrigerators and air-conditions then it just not prove helpful to the customers but would also give sufficient work to the unit owners. But to start this unit a prerequisite condition for the entrepreneur is to either have technical knowledge himself or to have an expert in technical details in the repairing work of these equipments. Market: Work can be obtained from different mediums for this unit. Customers come to the workshops to get their equipment repaired; owners can also keep in contact with the customers; owners can take an yearly maintenance contract from big organisations.
Target: 500 refrigerators and air conditions are estimated to be repaired in this unit. Every equipment’s repairing/ servicing charges would vary from 100 to 500/- adding the charges of repair replacement of spare parts in actual basis. Thus, income from service charges and replacement would be Rs. 10.75 lakh. Raw Materials:
Sl.No. Details Quantity Total Cost
1. Cooling coil 1 3,300/-
2. Fan motor 1 1,870/-
3. Fan blade (clockwise and anticlock wise) 2 660/-
4. Blower (Anticlockwise and clockwise) 2 1,100/-
5. Starting capacitors (80-100 MFD. and 100-120 MFD) 4 1,760/-
6. Running capacitors 4 2,035/-
7. 63 M.F.D. capacitors 2 165/-
8. Relay 2 1,100/-
9. Over load protector 4 770/-
10. Selector switch 4 3,300/-
11. Thermostert 2 935/-
12. Air filter 6 825/-
13. Filter 6 550/-
14. Copper pipe (5/8, 5/16, ¼, 3/16) 4 5,500/-
15. Gas cylinder (10 kg. of 22 no.) 1 7,150/-
16. Gas cylinder (12 no.) 2,750/-
17. Welding rods 1 kg. 495/-
Total: 34,485/-
Power: The power is available from the state Electric supply corporation Grid. The annual consumption of power is estimated Rs. 1,98,000/-. Water: The unit will need 3000 liters of clean and soft water. It is available from both ground water sources and public supply. Manpower: Manpower required by the unit including skilled workers is locally available. The requirement and annual costs of manpower at the installed capacity is shown below:

216
Sl.No. Category of Manpower No. of Persons Annual Cost
1. Manager 1 Self
2. Skilled Worker 2 1,32,000/-
3. Helper 2 1,05,600/-
Total 5 2,37,600/-
Financial Aspect of the unit: 1) Land & Building 50 sq.ft. Rented 2) Plant & Machinery:
Sl.No. Details No. Cost
1. Compressor (1.5 tonn) 1 33,600/-
2. Vacuum pump (with motor) 1 18,000/-
3. Hand grinder 1 18,000/-
4. Motor winding machine 1 15,000/-
5. Charging set 1 13,200/-
6. Spray painting set 1 15,000/-
7. Spanners set 2 13,200/-
8. Electric welding set 1 11,400/-
9. Drilling machine (E lectrical) 1 8,400/-
10. Gas welding set 1 6,600/-
11. Clamp tester 1 5,040/-
12. Wice 1 4,560/-
13. Multi metre 1 3,240/-
14. Squeezing and flaring tool set 1 1,200/-
15. Hand shut off valve 2 540/-
16. Ampier and volt. meter 4 960/-
17. Tube cutter 1 660/-
18. Blow lamp 1 600/-
19. Punching pliers 1 480/-
20. Pressure gauge 1 420/-
21. Compound gauge 1 480/-
22. Charging line 2 480/-
Total: 1,71,060/-
3) Miscellaneous Fixed Asset a) Electrification Rs. 16,500/- b) Furniture & Miscellaneous others Rs. 13,200/- Total: Rs. 29,700/- 4. Provision for contingencies Rs. 9,795/- 5. Preliminary & pre-operative expenses Rs. 24,475/- Total Fixed Investment Rs. 2,34,530/- 6. Working Capital (P.M.) a) Raw Material Rs. 34,485/- b) Utilities Rs. 1,900/- c) Salary & Wages Rs. 19,800/- d) Other expenses Rs. 16,500/- Total: Rs. 72,765/-

217
Total working capital for 3 months: Rs. 2,18,295/- Total Project Cost: Rs. 4,52,825/-
Means of Finance: Urban Rural 1. Composite loan 3,16,978/- 2,71,695/- 2. Promoter’s contribution 22,641/- 22,641/- 3. Subsidy 1,13,206/- 1,58,489 /- 4. Debt equity ratio 2.33:1 1.50:1 Profitability: (Rs. In Thousands) Sl.No. Description 1st year 2nd year 3rd year 4th year 5th year
1. Capacity utilized 60% 70% 80% 80% 80%
2. Annual Sales Realization 710 827 946 946 946
3. Annual Costs in
a) Raw Materials 248 290 331 331 331
b) Utilities 14 17 19 19 19
c) Selling expenses 52 61 70 70 70
Variable Cost 314 368 420 420 420
d) Wages & Salaries 143 166 190 190 190
e) Administrative expenses 119 139 158 158 158
f) Depreciation 23 23 23 23 23
g) Interest on Composite Loan 37 30 21 12 3
Fixed & Semi Variable Cost 322 358 399 383 374
4. Total Cost 636 726 812 803 794
5. Annual Profit 74 101 134 143 152
6. Return on Investment 16.33% 22.29% 29.58% 31.53% 33.53%
7. Return on sales 10.42% 12.21% 14.16% 15.11% 16.06%
8. Annual contribution 396 - - - -
9. Break Even Point 48.78%
10. Cash accrual 97 124 157 166 175
11. Debt Servicing Capacity 134 154 178 178 178
12. Repayment of Composite Loan 51 60 69 69 68
13. Debt Serviced 88 90 90 81 72
14. Pay Back Period 1 year 6 months 21 days
15. Debt Service Coverage Ratio 1.56:1
Cash Flow Statement: (Rs. In Thousands)
Sl. No.
Description Pre-operative Period
O p e r a t i n g Y e a r s
First Second Third Fourth Fifth
1. Increase in Promoter’s contribution
23 - - - - -
2. Increase in Term loan 317 - - - - -
3. Subsidy 113 - - - - -
4. Depreciation - 23 23 23 23 23
5. Profit before interests - 111 131 155 155 155
A. TOTAL SOURCES 453 134 154 178 178 178
6. Increase in capital investment 235 - - - - -
7. Increase in working capital 218 - - - - -
8. Interest - 37 30 21 12 3
9. Repayment of Term Loan - 51 60 69 69 68
B. TOTAL DISPOSALS 453 88 90 90 81 71

218
C. OPENING BALANCE NIL NIL 46 110 198 295
D. NET SURPLUS NIL 46 64 88 97 107
E. CLOSING BALANCE NIL 46 110 198 295 402
Projected Balance sheet:
Sl. No.
Description Amount in Rs. Thousands as at the end of the
1st Yr. 2nd Yr. 3rd Yr. 4th Yr. 5th Yr. 1. Capital Account of Promoter 23 97 198 332 475
2. Surplus from operation 74 101 134 143 152
NET WORTH: 97 198 337 475 627
3. Subsidy 113 113 113 113 113
4. Term loan outstanding 266 206 137 68 - TOTAL LIABILITIES 476 517 582 656 740
1. Gross Block 235 235 235 235 235
Less Depreciation 23 46 69 92 115
NET BLOCK 212 189 166 143 120
2. Working capital 218 218 218 218 218 3. Cash & Bank Balance 46 110 198 295 402
TOTAL ASSETS 476 517 582 656 740
Suppliers of Machinery: 1. Advance Refrigeration Corp. 3 Mangoe Lane, Kolkata-1. 2. Himalaya cooling Industry, 138 D, Picnic Garden Road, Kolkata-39.

219
REPAIR & MAINTENANCE OF T.V., RADIO ETC.
Introduction: Asian Games in Delhi in the year 1982 saw the advent of Doordarshan. After that, television became an environment medium and lower-middle class people. Introduction of cable television has provided people with many channels at their disposal, increasing the television viewership. Moreover, the revolutionary changes in television has boosted to the demand for television. Now, T.V. sets is just not a common in urban areas but rural areas as well. Nonetheless, just like other electronic items T.V. sets also face problems, which calls for replacement/ repair certain parts of television sets. Since T.V. sets are not convenient to shift from one place to another, customer looks for some workshop at the locality. Before setting up this unit it is advisable for the entrepreneurs to acquire good knowledge or get good training from an institute of repute. Target: In the given unit 700 colour T.V. sets and 400 radio sets etc. would be repaired in a year. Keeping the rate as Rs. 3,85,000/- for repairing colour T.V. sets and Rs. 88,000 for repairing others, would be additional income from sales of spare parts. Then the income from this unit per annum would be around Rs. 6,05,000/-. Process: First of all, the television set, radio or other is checked with certain instruments and part that seems to be obsolete is taken out by solder iron or nose pliers. This work is done in accordance to customers needs and contention. Raw Material:
Sl.No. Details Cost (in Rs.)
1. Additional parts (for replacements) 11,000/-
2. Soldering wire, soldering paste 2,200/-
3. others 2,750/-
Total: 15,950/-
Power: The power is available from the state Electric supply corporation Grid. The annual consumption of power is estimated Rs. 6,270/- Water: The unit will need 500 liters of clean and soft water. It is available from both ground water sources and public supply. Manpower: In the unit, is required a good technician whose remuneration would be Rs. 5,500/- per month. Financial Aspect of the unit: 1) Land & Building 100-150 Sq.ft. Rented 2) Plant & Machinery:
Sl.No. Details No. Cost
1. Cathod ray oscilloscope 1 42,000/-
2. A.M/ F.M. signal generators 1 12,000/-
3. T.V. Pattern generator 1 45,600/-
4. Multimetre 3 12,600/-
5. Soldering Iron, cutter, noze plier 2,400/-
6. Other hand tools 6,000/-
Total: 1,20,600/-

220
3) Miscellaneous Fixed Asset a) Electrification Rs. 550/- b) Furniture & Miscellaneous others Rs. 1,650/- 4. Provision for contingencies Rs. 5,610/- 5. Preliminary & pre-operative expenses Rs. 14,740/- Total Fixed Investment Rs. 1,43,150/- 6. Working Capital (P.M.) a) Raw Material Rs. 15,950/- b) Utilities Rs. 550/- c) Salary & Wages Rs. 5,500/- d) Other expenses Rs. 11,000/- Total: Rs 33,000/- Total working capital for 3 months: Rs. 99,000/- Total Project Cost: Rs. 2,42,150/- Means of Finance: Urban Rural 1. Composite loan 1,69,505/- 1,45,290/- 2. Promoter’s contribution 12,108/- 12,108/- 3. Subsidy 60,537/- 84,752/- 4. Debt equity ratio 2.33:1 1.50:1 Profitability: (Rs. In Thousands) Sl.No. Description 1st year 2nd year 3rd year 4th year 5th year
1. Capacity utilized 60% 70% 80% 80% 80%
2. Annual Sales Realization in Rs. 363 424 484 484 484
3. Annual Costs in Rs.
a) Raw Materials 115 134 153 153 153
b) Utilities 4 5 5 5 5
c) Selling expenses 24 28 32 32 32
Variable Cost 143 167 190 190 190
d) Wages & Salaries 40 46 53 53 53
e) Administrative expenses 79 92 106 106 106
f) Depreciation 14 14 14 14 14
g) Interest on Composite Loan 20 16 11 7 2
4. Total Cost 296 335 374 370 365
5. Annual Profit 67 89 119 114 119
6. Return on Investment 27.68% 26.77% 45.45% 47.10% 49.17%
7. Return on sales 18.45% 20.99% 24.59% 23.55% 24.58%
8. Annual contribution 220 - - - -
9. Break Even Point 41.72%
10. Cash accrual 81 103 124 128 133
11. Debt Servicing Capacity 101 119 135 135 135
12. Repayment of Composite Loan 28 32 37 37 37
13. Debt Serviced 48 48 48 44 40
14. Pay Back Period 1 year 8 months 26 days
15. Debt Service Coverage Ratio 1.68

221
Cash Flow Statement: (Rs. In Thousands) Sl. No.
Description Pre-ope-rative Period
O p e r a t I n g Y e a r s
First Second Third Fourth Fifth
1. Increase in Promoter’s contribution
12 - - - - -
2. Increase in Term loan 170 - - - - -
3. Subsidy 60 - - - - -
4. Depreciation - 14 14 14 14 14
5. Profit before interests - 87 105 121 121 121
A. TOTAL SOURCES 242 101 119 135 135 135
6. Increase in capital investment 143 - - - - -
7. Increase in working capital 99 - - - -
8. Interest - 20 16 11 7 2
9. Repayment of Term Loan - 28 32 37 37 38
B. TOTAL DISPOSALS 242 48 48 48 44 99
C. OPENING BALANCE NIL NIL 53 124 211 302
D. NET SURPLUS NIL 53 71 87 91 97
E. CLOSING BALANCE NIL 53 124 211 302 399
Projected Balance sheet:
Sl.No. Description Amount in Rs. Thousands as at the end of the
1st Yr. 2nd Yr. 3rd Yr. 4th Yr. 5th Yr. 1. Capital Account of Promoter 12 79 168 278 392
2. Surplus from operation 67 89 110 114 119
NET WORTH: 79 168 278 392 511
3. Subsidy 60 60 60 60 60
4. Term loan outstanding 142 110 73 36 - TOTAL LIABILITIES 281 338 411 488 571
1. Gross Block 143 143 143 143 143
Less Depreciation 14 28 42 56 70
NET BLOCK 129 115 101 87 73
2. Working capital 99 99 99 99 99 3. Cash & Bank Balance 53 124 211 302 399
TOTAL ASSETS 281 338 411 488 571
Machinery Suppliers: 1. Avenue Electricals, 3A, Madan Street, Kolkata- 72. 2. SPACE –TEC, #B, Madan Street, Kolkata-72.

222
CEILING FAN ASSEMBLING & REPAIRING Introduction: Electric Ceiling fan is a common electrical appliance used for providing good air circulation. It is manufactured in sweep diameters of 900 mm, 1050mm, 1200mm,1400mm and 1500mm. Out of these fans of 1200 mm and 1400mm size are most commonly used. Ceiling fans employ fractional horse power AC motors to operate. Market : Ceiling fans are now have become an integral part of any type of building viz hours, offices, schools, college, factories, hospitals and almost all types of commercial establishments. With the overall growth, urbanization and rural electrification the demand for ceiling and exhaust fan are growing day by day. Installed Capacity: The minimum economic capacity of a unit manufacturing Ceiling fan is 5000 nos. and 2000 nos. servicing per annum based on one shift operation of 300 days working schedule in a year. Thus, income from service charges and production would be Rs. 24 lakh per annum. Raw Materials: The main raw materials required for manufacture of Ceiling fan is steel sheet for stamping, aluminum casting for body and cover, aluminum sheets for blades assembly, copper winding wire, ball bearings, down rods, capacitor 4 UF for motor, regulators, bushes, resistance wires, insulated materials, painting materials, hardwares and other miscellaneous materials like nuts, bolts, ball, and packing materials etc. Thus cost would be Rs.16,20,000/- and Raw materials are to be sourced mainly from the open market at present availability in Tripura. Process: Manufacturing Process / steps are as follows:
1. The rotor casting are purchased and turned to the required dimension. 2. The armature core is cleaned and coil winding is done on it with automatic coil winding machine. 3. The rotor casting and blades are painted and baked in the oven. 4. The armature and rotor are assembled along with body part. 5. Blades are fitted along with other fittings.
Process Flow: Power: The power is available from the state Electric supply corporation Grid. The annual consumption of power is estimated Rs. 14,400/- Water: The unit will need 5000 liters of clean and soft water per day. It is available from both ground water sources and public supply. Manpower: Manpower required by the unit including skilled workers is locally available. The requirement and annual costs of manpower at the installed capacity is shown below:
Raw
materials
Assembling
Cutting Wiring &
Coiling Fitting
Painting Ready for
Sale
Finishing
Packing

223
Sl.No. Category of Manpower No. of Persons Annual Cost
1. Manager 1 Self
2. Skilled Worker 2 96,000/-
3. Unskilled Worker 1 36,000/-
Total 4 1,32,000/-
Financial Aspect of the unit: 1) Land & Building Rented 2) Plant & Machinery: Rs. 78,000/- a. SS and SC lathes, 6 bed length, heavy duty, with motors, cooling pump etc, b. Coil winding machine, Power Hacksaw, Hand pressure, Air compressors, c. A/C High Voltage testers, Maggers, etc, 3) Miscellaneous Fixed Asset a) Electrification Rs. 6,000/- b) Furniture & Miscellaneous others Rs. 29,400/- Total: Rs. 35,400/- 4. Provision for contingencies Rs. 4,800/- 5. Preliminary & pre-operative expenses Rs. 12,600/- Total Fixed Investment Rs. 1,30,800/- 6. Working Capital (P.M.) a) Raw Material Rs. 1,48,500/- b) Utilities Rs. 1,320/- c) Salary & Wages Rs. 12,100/- d) Other expenses Rs. 16,500/- Total: Rs. 1,94,920/- Total working capital for 3 months : Rs. 5,84,760/- Total Project Cost: Rs. 7,15,560/- Means of Finance: Urban Rural 1. Composite loan 5,00,892/- 4,29,336/- 2. Promoter’s contribution 35,778/- 35,778/- 3. Subsidy 1,78,890/- 2,50,446 /- 4. Debt equity ratio 2.33:1 1.50:1 Profitability: (Rs. In Thousands) Sl.No. Description 1st year 2nd year 3rd year 4th year 5th year
1. Capacity utilized 60% 70% 80% 80% 80%
2. Annual Sales Realization 1584 1842 2112 2112 2112
3. Annual Costs in
a) Raw Materials 1069 1247 1496 1426 1426
b) Utilities 10 11 13 13 13
c) Selling expenses 121 142 162 162 162
Variable Cost 1200 1400 1601 1601 1601
d) Wages & Salaries 87 102 116 116 116
e) Administrative expenses 119 139 158 158 158
f) Depreciation 13 13 13 13 13
g) Interest on Composite Loan 55 45 31 18 5
Fixed & Semi Variable Cost 274 299 318 305 292

224
4. Total Cost 1474 1699 1919 1906 1893
5. Annual Profit 110 149 193 206 219
6. Return on Investment 15.36% 20.81% 26.95% 28.77% 30.58%
7. Return on sales 6.92% 8.11% 9.13% 9.75% 10.36%
8. Annual contribution 384 - - - -
9. Break Even Point as percent of capacity 42.81%
10. Cash accrual 123 162 206 219 232
11. Debt Servicing Capacity 178 207 237 237 237
12. Repayment of Composite Loan 82 95 108 108 108
13. Debt Serviced 137 140 139 126 119
14. Pay Back Period 1 year 3 months 24 days
15. Debt Service Coverage Ratio 1.30:1
Cash Flow Statement: (Rs. In Thousands)
Sl. No.
Description Pre-operative Period
O p e r a t i n g Y e a r s
First Second Third Fourth Fifth
1. Increase in Promoter’s contribution
36 - - - - -
2. Increase in Term loan 501 - - - - -
3. Subsidy 179 - - - - -
4. Depreciation - 13 13 13 13 13
5. Profit before interests - 165 194 224 224 224
A. TOTAL SOURCES 716 178 207 237 237 237
6. Increase in capital investment 131 - - - - -
7. Increase in working capital - 585 - - - -
8. Interest - 55 45 31 18 5
9. Repayment of Loan - 82 95 108 108 108
B. TOTAL DISPOSALS 716 137 140 139 126 113
C. OPENING BALANCE NIL NIL 41 108 206 317
D. NET SURPLUS NIL 41 67 98 111 124
E. CLOSING BALANCE NIL 41 108 206 317 441
Projected Balance sheet: Sl.No. Description Amount in Rs. Thousands as at the end of the
1st Yr. 2nd Yr. 3rd Yr. 4th Yr. 5th Yr.
1. Capital Account of Promoter 36 146 295 488 694
2. Surplus from operation 110 149 193 206 219
NET WORTH: 146 295 488 694 913
3. Subsidy 179 179 179 179 179
4. Term loan outstanding 419 324 216 108 -
TOTAL LIABILITIES 744 798 883 981 1092
1. Gross Block 131 131 131 131 131
Less Depreciation 13 26 39 52 65
NET BLOCK 118 105 92 79 66
2. Working capital 585 585 585 585 585
3. Cash & Bank Balance 41 108 206 317 441
TOTAL ASSETS 744 798 883 981 1092
Machinery Suppliers: 1. Rinki Engineering Works, Wz-88, Ramgardh Colony, Gali No. 11, Near Moti Nagar,011-25410966
2.K.D.Dowls & Keys , 9-A, Sanjay Colony, Sec-22, 91-129-2233616/4019500/4120842

225
MOBILE SET REPAIRING Introduction: Now-a-days MOBILE is a most popular and necessity item in our daily life. The Mobile Industry has shown quick response in bringing new products to the market. The Mobile industry has started making serious globalization effects. It is building up a critical class of skills and knowledge which is expected to enable than to help achieve globalization. Market: Considering the growth and demand of mobile in the country, there will be good demand for mobile Servicing Unit in the country. This industry has grown both in terms of physical output as well as range of products introduced in the market. Suggested Capacity; The minimum economic capacity of a Mobile Servicing Centre shall be to installation , software, downloading etc 50,000 per annum based on one /two shift operation (8 hours) for 300 days working schedule in a year. Raw Materials: Raw materials are to be sourced mainly from the open market. The annual requirements and costs of raw materials, to be sourced from local market, is shown below.
1. Mobile Testing equipments, (Line tester), Rs.1,35,000/- connector, Networking software, Blank CD, Flash .
Power: Consumption of power and fuel have been arrived at on the basis of consumption norms of the industry. The energy rate has been considered on the basis of existing power tariffs of the electricity department and approximately it will be cost Rs.14,400/- per annum. Water: Requirement of water mainly for washing of film developing etc and drinking purpose. The unit shall avail of the PHE water supply already available at the site. Manpower: The unit will provide employment to 4 persons including staff and engineers for factory administration and sales, labour etc. and all man power to be arrange from local area. The annual needs and costs of manpower is shown below:
Sl.No. Category of Manpower No. of Persons Annual Cost
1. Manager 1 Self
2. Skilled Worker 2 96,000/-
3. Unskilled Worker 1 36,000/-
Total 4 1,32,000/-
CAPITAL COST ESTIMATE: 1) Land & Building : Covered area 950 Sq. Mtrs Rented 2) Plant & Machinery: Rs.78,000/-
Product Number: 4202R, Model: Willtek 4202R Product Number / Model: 4107M/S / Willtek 4107M/S (Description: Radio communication service analyzer,
GSM900/1800/1900, level accuracy 1dB. 3) Miscellaneous Fixed Asset a) Electrification Rs. 11,000/- b) Furniture & Miscellaneous others Rs. 22,550/- 4. Provision for contingencies Rs. 4,800/-

226
5. Preliminary & pre-operative expenses Rs. 10,450/- Total Fixed Investment Rs. 1,30,800/- 6. Working Capital (P.M.) a) Raw Material Rs. 1,48,500/- b) Utilities Rs. 1,320/- c) Salary & Wages Rs. 12,100/- d) Other expenses Rs. 16,500/- Total: Rs. 1,94,920/- Total working capital for 3 months:Rs. 5,84,760/- Total Project Cost:Rs. 5,15,560/- Means of Finance: Urban Rural 1. Composite loan 5,00,892/- 4,29,336/- 2. Promoter’s contribution 35,778/- 35,778/- 3. Subsidy 1,78,890/- 2,50,446 /- 4. Debt equity ratio 2.33:1 1.50:1 Profitability: (Rs. In Thousands) Sl.No. Description 1st year 2nd year 3rd year 4th year 5th year
1. Capacity utilized 60% 70% 80% 80% 80%
2. Annual Sales Realization 1584 1842 2112 2112 2112
3. Annual Costs in
a) Raw Materials 1069 1247 1496 1426 1426
b) Utilities 10 11 13 13 13
c) Selling expenses 121 142 162 162 162
Variable Cost 1200 1400 1601 1601 1601
d) Wages & Salaries 87 102 116 116 116
e) Administrative expenses 119 139 158 158 158
f) Depreciation 13 13 13 13 13
g) Interest on Composite Loan 55 45 31 18 5
Fixed & Semi Variable Cost 274 299 318 305 292
4. Total Cost 1474 1699 1919 1906 1893
5. Annual Profit 110 149 193 206 219
6. Return on Investment 15.36% 20.81% 26.95% 28.77% 30.58%
7. Return on sales 6.92% 8.11% 9.13% 9.75% 10.36%
8. Annual contribution 384 - - - -
9. Break Even Point as percent of capacity 42.81%
10. Cash accrual 123 162 206 219 232
11. Debt Servicing Capacity 178 207 237 237 237
12. Repayment of Composite Loan 82 95 108 108 108
13. Debt Serviced 137 140 139 126 119
14. Pay Back Period 1 year 3 months 24 days
15. Debt Service Coverage Ratio 1.30:1
Cash Flow Statement: (Rs. In Thousands)
Sl. No.
Description Pre-operative Period
O p e r a t i n g Y e a r s
First Second Third Fourth Fifth
1. Increase in Promoter’s contribution
36 - - - - -
2. Increase in Term loan 501 - - - - -

227
3. Subsidy 179 - - - - -
4. Depreciation - 13 13 13 13 13
5. Profit before interests - 165 194 224 224 224
A. TOTAL SOURCES 716 178 207 237 237 237
6. Increase in capital investment 131 - - - - -
7. Increase in working capital - 585 - - - -
8. Interest - 55 45 31 18 5
9. Repayment of Loan - 82 95 108 108 108
B. TOTAL DISPOSALS 716 137 140 139 126 113
C. OPENING BALANCE NIL NIL 41 108 206 317
D. NET SURPLUS NIL 41 67 98 111 124
E. CLOSING BALANCE NIL 41 108 206 317 441
Projected Balance sheet:
Sl.No. Description Amount in Rupees as at the end of the
1st Yr. 2nd Yr. 3rd Yr. 4th Yr. 5th Yr.
1. Capital Account of Promoter 36 146 295 488 694
2. Surplus from operation 110 149 193 206 219
NET WORTH: 146 295 488 694 913
3. Subsidy 179 179 179 179 179
4. Term loan outstanding 419 324 216 108 -
TOTAL LIABILITIES 744 798 883 981 1092
1. Gross Block 131 131 131 131 131
Less Depreciation 13 26 39 52 65
NET BLOCK 118 105 92 79 66
2. Working capital 585 585 585 585 585
3. Cash & Bank Balance 41 108 206 317 441
TOTAL ASSETS 744 798 883 981 1092
Suppliers of Machinery 1. Jianglong Industrial&Trading Co.Ltd, Yangjiang South Rd. No.2 Industrial Zone Yangjiang. Guangdong. China 529500, Tel:(86 662) 3675778/(86 662) 3665286. Fax:(86 662) 3675779/(86 662) 3506528.E-mail: 2. G. S. Hydraulics, Mumbai – 400080. 3. Paras Engineering Co, Navi Mumbai - 410208,

228
FAX PHOTOCOPIER ETC. REPAIRING & SERVICING
Introduction; Information Technology is becoming pervasive in the country as more organization take to using fax and photocopier. The Fax and Copier has shown quick response in bring new products to the market. The Fax and copier has started making serious globalization effects. It is building up a critical class of skills and knowledge which is expected to enable than to help achieve globalization. The unit Suggested Capacity; The minimum economic capacity of a Fax & Copier Repairing and servicing Centre shall be to repair fax and copier 200 nos per annum based on one shift operation for 240 days working schedule in a year. Raw Materials availability: Raw materials are to be sourced mainly from the open market. At present availability and supply of the raw materials is not problem e.g Fax & copier logic card, tonner head, drum, lenses, board, nozeele of fax, Main Board, copier card, etc to be sourced from open local markets and cost will be Rs.26,40,000 p.a Power : Consumption of power and fuel have been arrived at on the basis of consumption norms of the industry. The unit will require a total connected load of 300 KWH and Water requirement is about 500KL per annum. . Water: Requirement of water mainly for washing of film developing etc and drinking purpose. The unit shall avail of the PHE water supply already available at the site and it can also install its own tube well supply for the purpose. Manpower: The unit will provide employment to the following 6 persons, all of whom are locally available: 1. Manager cum Supervisor Self Self 2. Skilled 4nos Rs.22,500/- 3. Office Boy/Peon 1 no Rs. 2,200/- 4. Sales Man 1no Rs. 3,300/- Total Rs.27,500/- CAPITAL COST ESTIMATE: Land & Building: 500 Sq. ft. On Rent Plant & Machinery: a. Equipments Rs. 45,000/- b. Testing tools (Line tester etc) Rs. 25,000/- c. One KVA on line Numeric UPS, Rs. 37,200/- d. one Desktop Computer Rs. 60,000/- e. one Printer ( DMP ) Rs. 20,000/- Total: Rs. 1,87,200/- Miscellaneous Fixed Assets: 1. Chair & Working Table Rs. 35,000/- 2. Fan & Lighting and wearing Rs. 12,500/- 3. Interior decoration Rs. 35,000/- Total: Rs. 82,500/- Preliminary & Preoperative Exp.: Rs. 4,950/- Total Fixed Capital : Rs. 2,74,650/- Working Capital: 1. Salary & Wages Rs. 27,500/- 2. Administrative expenses Rs. 13,666-

229
3. Selling expenses Rs. 3,300/- 4. Raw Materials Rs. 2,20,000/- 5. Utilities Rs. 3,880/- Total: Rs. 2,68,316/-
Total Cost of the Project: Rs. 5,42,966/- Means of Finance: Urban Rural a. Composite loan under PMEGP 70% Rs. 3,80,076/- 60% Rs. 3,25,780/- b. Subsidy 25% Rs. 1,35,742/- 35% Rs. 1,90,038/- c. Margin Money 5% Rs. 27,148/- 5% Rs. 27,148/-
Total Rs. 5,42,966/- Rs. 5,42,966/- d. Debt Equity Ratio 2.33:1 1.50:1 Profitability: (Rs. In Thousands) Sl.No Description 1st Year 2nd Year 3rd year 4th Year 5th Year
1. Capacity utilized as percent of installed capacity
60% 70% 80% 80% 80%
2. Annual Sales 2,138 2,495 2,851 2,851 2,851
3. Annual Costs in
(a) Raw Materials 1,58 1,848 2,112 2,112 2,112
(b) Utilities 27 32 37 37 37
(c) Selling expenses 24 28 31 31 31
Variable Cost 1,635 1,908 2,180 2,180 2,180
(a) Wages & Salaries 198 231 264 264 264
(b) Administrative expenses 98 115 131 131 131
(c) Depreciation 27 27 27 27 27
(d) Interest on Composite Loan 44 36 26 16 5
Fixed & Semi Variable Cost 367 409 448 438 427
Total Cost 2002 2317 2628 2618 2607
4 Annual profit 136 178 223 233 244
5 Return on investment 25.04% 32.78% 41.06% 42.90% 44.93%
6 Return on sales 6.36% 7.13% 7.82% 8.17% 8.55%
7 Annual Contribution 503
8 Break Even Point as percent of capacity
43.77%
9 Cash accrual 163 205 250 260 271
10 Debt servicing capacity 207 241 276 276 276
11 Repayment of Composite Loan 62 72 82 82 82
12 Debt serviced 106 108 108 98 87
13 Pay Back Period 1 years 6 month 10 days
14 Debt Service Coverage Ratio (DSCR)
1.53:1
Cash Flow Statement: (Rs. In Thousands) Sl. No.
Description Pre-operative Period
O p e r a t i n g Y e a r s
60% 70% 80% 80% 80%
First Second Third Fourth Fifth
1. Increase in Promoter’s capital 27 NIL NIL NIL NIL NIL
2. Increase in composite loan 380 NIL NIL NIL NIL NIL
3 Increase in Subsidy 136 NIL NIL NIL NIL NIL
4. Depreciation 27 27 27 27 27

230
5. Profit before interests 180 214 249 249 249
A. TOTAL SOURCES 543 207 241 276 276 276
6. Increase in capital investment 275 NIL NIL NIL NIL NIL
7. Increase in working capital 268 NIL NIL NIL NIL NIL
8. Interests NIL 44 36 26 16 5
9. Repayment of loan NIL 62 72 82 82 82
B. TOTAL DISPOSALS 543 106 108 108 98 87
C. OPENING BALANCE NIL NIL 101 234 402 580
D. NET SURPLUS NIL 101 133 168 178 189
E. CLOSING BALANCE NIL 101 234 402 580 769
Projected Balance sheet: Sl.No. Description Amount in Rs. Thousands as at the end of the
1st Yr. 2nd Yr. 3rd Yr. 4th Yr. 5th Yr.
1. Capital Account of the Promoter 27 163 341 564 797
2. Surplus from operations 136 178 223 233 244
NET WORTH: 163 341 564 797 1041
3. Composite loan 318 246 164 82 nil
4. Subsidy 136 136 136 136 136
A. TOTAL LIABILITIES 617 723 864 1015 1177
1. Gross Block 275 275 275 275 275
Less Depreciation 27 54 81 108 135
2 NET BLOCK 248 221 194 167 140
3 Current Assets 268 268 268 268 268
4. Cash & Bank Balance 101 234 402 580 769
B. TOTAL ASSETS 617 723 864 1015 1177
Supplies of Machinery & Equipments : 1. P&S UNIQUE SYSTEM, Lake Road, Agartala, Pin;799001, 2. Computer Link, Swasti Market, Agartala, Tripura 3. M/S Coral Business Systems Pvt Ltd, 73 Zone 2 , M.P. Nagar, Bhopal