Comparison of earth science achievement between animation-based and graphic-based testing design
35
Comparison of Earth Science Achievement Between Animation-Based and Graphic-Based Testing Designs Huang-Ching Wu & Chun-Yen Chang & Chia-Li D. Chen & Ting-Kuang Yeh & Cheng-Chueh Liu Published online: 2 September 2009 # Springer Science + Business Media B.V. 2009 Abstract This study developed two testing devices, namely the animation-based test (ABT) and the graphic-based test (GBT) in the area of earth sciences covering four domains that ranged from astronomy, meteorology, oceanography to geology. Both the students’ achievements of and their attitudes toward ABT compared to GBT were investigated. The purposes of this study were fourfold as follows: (1) to examine the validity and the reliability of ABT, (2) to compare the difference of ABT and GBT in student achievements, (3) to investigate the impact of ABT versus GBT on student achievements with different levels of prior knowledge and (4) to explore the ABT participants’ attitudes toward ABT in comparison with GBT. A total of 314 students, divided into two groups, participated in the study. Upon completion of the test, the students who took the ABT were given the survey, Attitude toward Animated Assessment Scale (AAAS). The results of the study indicated that ABT was a valid and reliable way of testing. While no significant difference was found between the test formats in student achievements in general, practical significance existed when the study further compared the impact of ABT versus GBT in student achievements with various levels of prior knowledge. It was found that low prior knowledge students performed better in ABT while high prior knowledge students performed better in GBT. Finally, more than 60% of the participants who took ABT were satisfied and held positive attitudes toward ABT. Res Sci Educ (2010) 40:639–673 DOI 10.1007/s11165-009-9138-9 H.-C. Wu : C.-Y. Chang : T.-K. Yeh Department of Earth Sciences, National Taiwan Normal University, Taipei, Taiwan C.-Y. Chang Graduate Institute of Science Education, Taipei, Taiwan C.-Y. Chang : C.-L. D. Chen : T.-K. Yeh : C.-C. Liu Science Education Center, National Taiwan Normal University, Taipei, Taiwan C.-Y. Chang (*) 88, Section 4, Ting-Chou Road, Taipei 11650, Taiwan e-mail: [email protected] URL: http://ese.geos.ntnu.edu.tw/~chunyen
Transcript of Comparison of earth science achievement between animation-based and graphic-based testing design

Comparison of Earth Science Achievement BetweenAnimation-Based and Graphic-Based Testing Designs
Huang-Ching Wu & Chun-Yen Chang &
Chia-Li D. Chen & Ting-Kuang Yeh & Cheng-Chueh Liu
Published online: 2 September 2009# Springer Science + Business Media B.V. 2009
Abstract This study developed two testing devices, namely the animation-based test(ABT) and the graphic-based test (GBT) in the area of earth sciences covering four domainsthat ranged from astronomy, meteorology, oceanography to geology. Both the students’achievements of and their attitudes toward ABT compared to GBT were investigated. Thepurposes of this study were fourfold as follows: (1) to examine the validity and thereliability of ABT, (2) to compare the difference of ABT and GBT in student achievements,(3) to investigate the impact of ABT versus GBT on student achievements with differentlevels of prior knowledge and (4) to explore the ABT participants’ attitudes toward ABT incomparison with GBT. A total of 314 students, divided into two groups, participated in thestudy. Upon completion of the test, the students who took the ABT were given the survey,Attitude toward Animated Assessment Scale (AAAS). The results of the study indicatedthat ABT was a valid and reliable way of testing. While no significant difference was foundbetween the test formats in student achievements in general, practical significance existedwhen the study further compared the impact of ABT versus GBT in student achievementswith various levels of prior knowledge. It was found that low prior knowledge studentsperformed better in ABT while high prior knowledge students performed better in GBT.Finally, more than 60% of the participants who took ABT were satisfied and held positiveattitudes toward ABT.
Res Sci Educ (2010) 40:639–673DOI 10.1007/s11165-009-9138-9
H.-C. Wu : C.-Y. Chang : T.-K. YehDepartment of Earth Sciences, National Taiwan Normal University, Taipei, Taiwan
C.-Y. ChangGraduate Institute of Science Education, Taipei, Taiwan
C.-Y. Chang : C.-L. D. Chen : T.-K. Yeh : C.-C. LiuScience Education Center, National Taiwan Normal University, Taipei, Taiwan
C.-Y. Chang (*)88, Section 4, Ting-Chou Road, Taipei 11650, Taiwane-mail: [email protected]: http://ese.geos.ntnu.edu.tw/~chunyen
Keywords Animation . Computerized assessment . Achievement . Attitude
Introduction
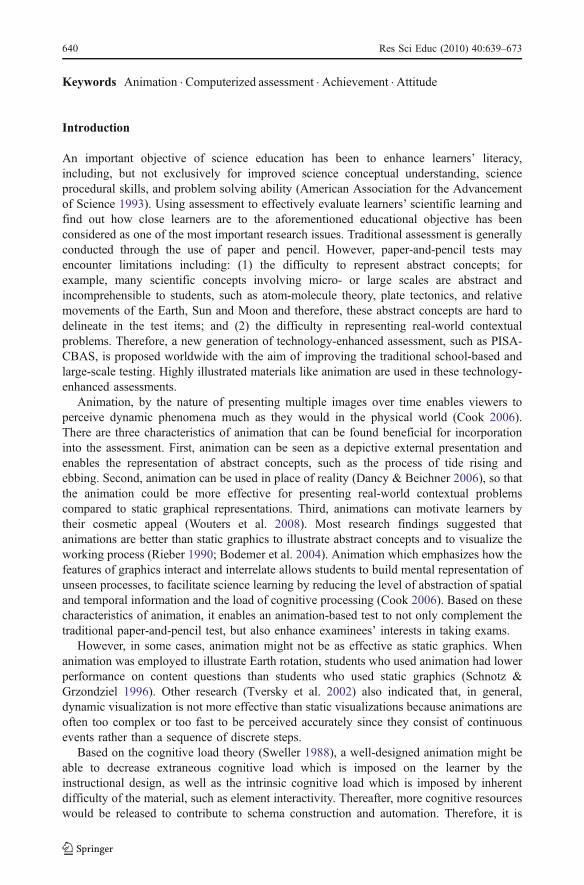
An important objective of science education has been to enhance learners’ literacy,including, but not exclusively for improved science conceptual understanding, scienceprocedural skills, and problem solving ability (American Association for the Advancementof Science 1993). Using assessment to effectively evaluate learners’ scientific learning andfind out how close learners are to the aforementioned educational objective has beenconsidered as one of the most important research issues. Traditional assessment is generallyconducted through the use of paper and pencil. However, paper-and-pencil tests mayencounter limitations including: (1) the difficulty to represent abstract concepts; forexample, many scientific concepts involving micro- or large scales are abstract andincomprehensible to students, such as atom-molecule theory, plate tectonics, and relativemovements of the Earth, Sun and Moon and therefore, these abstract concepts are hard todelineate in the test items; and (2) the difficulty in representing real-world contextualproblems. Therefore, a new generation of technology-enhanced assessment, such as PISA-CBAS, is proposed worldwide with the aim of improving the traditional school-based andlarge-scale testing. Highly illustrated materials like animation are used in these technology-enhanced assessments.
Animation, by the nature of presenting multiple images over time enables viewers toperceive dynamic phenomena much as they would in the physical world (Cook 2006).There are three characteristics of animation that can be found beneficial for incorporationinto the assessment. First, animation can be seen as a depictive external presentation andenables the representation of abstract concepts, such as the process of tide rising andebbing. Second, animation can be used in place of reality (Dancy & Beichner 2006), so thatthe animation could be more effective for presenting real-world contextual problemscompared to static graphical representations. Third, animations can motivate learners bytheir cosmetic appeal (Wouters et al. 2008). Most research findings suggested thatanimations are better than static graphics to illustrate abstract concepts and to visualize theworking process (Rieber 1990; Bodemer et al. 2004). Animation which emphasizes how thefeatures of graphics interact and interrelate allows students to build mental representation ofunseen processes, to facilitate science learning by reducing the level of abstraction of spatialand temporal information and the load of cognitive processing (Cook 2006). Based on thesecharacteristics of animation, it enables an animation-based test to not only complement thetraditional paper-and-pencil test, but also enhance examinees’ interests in taking exams.
However, in some cases, animation might not be as effective as static graphics. Whenanimation was employed to illustrate Earth rotation, students who used animation had lowerperformance on content questions than students who used static graphics (Schnotz &Grzondziel 1996). Other research (Tversky et al. 2002) also indicated that, in general,dynamic visualization is not more effective than static visualizations because animations areoften too complex or too fast to be perceived accurately since they consist of continuousevents rather than a sequence of discrete steps.
Based on the cognitive load theory (Sweller 1988), a well-designed animation might beable to decrease extraneous cognitive load which is imposed on the learner by theinstructional design, as well as the intrinsic cognitive load which is imposed by inherentdifficulty of the material, such as element interactivity. Thereafter, more cognitive resourceswould be released to contribute to schema construction and automation. Therefore, it is
640 Res Sci Educ (2010) 40:639–673

important to recognize the specific conditions under which the use of animation might bemost effective and to follow the appropriate principles while designing the animation sothat observers’ cognitive resources will not be overwhelmed. Dancy and Beichner (2006)stated that animation appears to be most valuable under the following conditions: (1) Theanimation is an integral part of the questions and not just a good-looking addition, and (2)The animation could clarify the misreading or misinterpretation of a situation caused by thestatic form of a question. Research has specified three general principles to effectivelyincorporate animation into instructional design. First, interactivity is an importantcomponent of successful animations (Tversky et al. 2002; Cook 2006). Interactive controlsenable observers to manage the pace of the animation so that the information conveyedthrough the animation can be perceived more accurately. Second, the graphics of animationshould be designed with less detail than realistic ones to reduce learners’ informationprocessing demands. However, the apparent simplicity may also be a drawback to theanimation. Lowe (2003) discovered that over-simplifying dynamic information wouldreduce learners’ mental effort to expend on important processing activities. Therefore, it isessential that the design of the animation is appropriately simplified. Third, adding theannotation such as arrows or highlights or other guiding devices into animation may directobservers’ attention to the critical changes and relations (Tversky et al. 2002). Lowe further(2003) suggested that since learners may have some negative consequences for learningwithout directions (Kirschner et al. 2006), they could benefit from animations designed toprovide a more directive learning environment with the incorporation of specific visual andtemporal guidance. All in all, if the animation was designed to be interactive, appropriatelysimplified and annotated, it would be more likely to decrease learners’ cognitive load andthus release cognitive resources for genuine comprehension and learning.
In our opinions, integrating animations into test design could provide science educationresearchers with an insightful perspective and some practical strategies in reducingstudents’ cognitive load and facilitating their comprehension of the test items. Dexter(2006) mentioned that technology assists in the assessment of the learning outcomes.However, limited research has investigated the impacts and applications of animationincorporated assessments in the field of science education. Therefore, the aims of this studyare to examine the effectiveness of Animation Based Test (ABT) in comparison withGraphic Based Test (GBT) in students’ earth science achievements and to survey students’general attitudes toward ABT and GBT. The following research questions guided this study:
1. Is ABT a valid form of assessment?2. Is ABT a reliable form of assessment?3. Is there any difference in students’ earth science achievements between the use of ABT
and GBT?4. Is there any difference in students’ earth science achievements associated with different
levels of prior knowledge between the use of ABT and GBT?5. What are students’ attitudes toward ABT?
Method
Participants
The participants of the study consisted of 314 tenth graders randomly chosen from a total of640 students in a normal high school, which ranked in the middle tier among the 20 senior
Res Sci Educ (2010) 40:639–673 641

high schools in Taipei. These participants varied in their levels of prior knowledge in earthsciences. Due to the limited number of earth science teachers and learning materials, half ofthe tenth graders (Group A), comprised of 194 participants, studied the earth sciencecurriculum in the first semester while the other half (Group B), comprised of 120participants, studied in the second semester. Since this study was conducted at thebeginning of the second semester, Group A had already learned the curriculum while GroupB was still learning.
Design of the Experiment
A comparative experimental design was employed in the study. The 314 students wererandomly assigned to two groups according to their learning statuses: the group which hadalready learned the curriculum (Group A) and the group which was still in the process oflearning (Group B). ABT and GBT were both completed by each group. There were twomain purposes for this design. First, by examining the students’ score differences as theirlearning statuses varied with the test format being held constant, the discriminating powerof the tests was evaluated such that the students with higher scores for earth scienceknowledge were distinguished from those with lower scores. Second, by examining thestudents’ score differences as their test formats varied with the learning statuses heldconstant, the impact of the test formats on student achievement was determined. That is, theparticipants’ test scores were compared to determine whether a significant difference onstudent achievements existed between ABT and GBT. The rationale behind the division ofthe subject pool into two groups can be best illustrated by Table 1. Finally, the students whoparticipated in ABT were given the “Attitude toward Animation Assessment Scale”(AAAS) questionnaire to survey their perceptions toward ABT.
Instrumentation
The animation-based test (ABT) was designed using the software of Director MX 2004.Other than the difference in the formats of the test, animated vs. graphic, the content, thesequence of the items and the layouts for both ABT and GBT were identical. Each test
Table 1 Design of the experiment
Learning Status
Test Format
Curriculum
Learned
(Group A)
Curriculum in
Progress
(Group B)
For the purpose of
determining the
discriminating power
of the test
ABT A-ABT B-ABT
GBT A-GBT B-GBT
For the purpose of determining the
impact of test format on student
achievements
642 Res Sci Educ (2010) 40:639–673
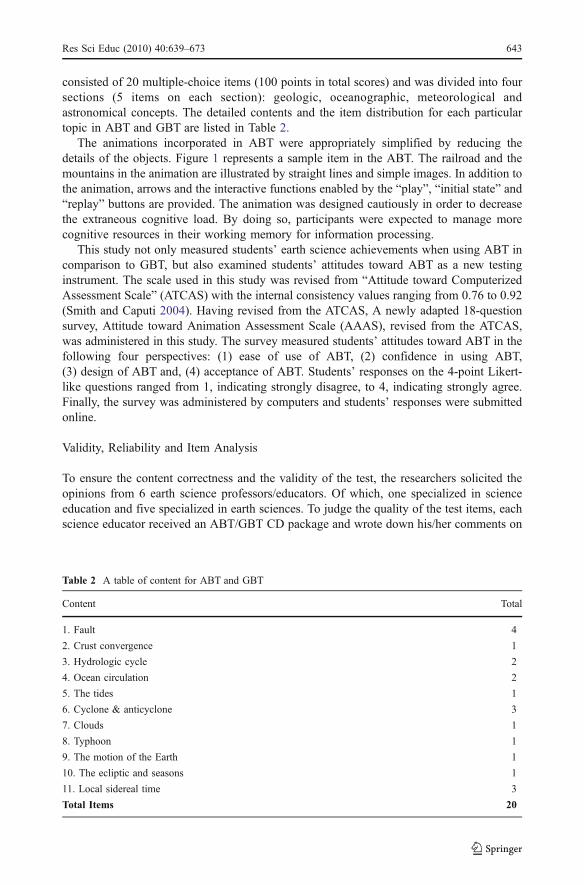
consisted of 20 multiple-choice items (100 points in total scores) and was divided into foursections (5 items on each section): geologic, oceanographic, meteorological andastronomical concepts. The detailed contents and the item distribution for each particulartopic in ABT and GBT are listed in Table 2.
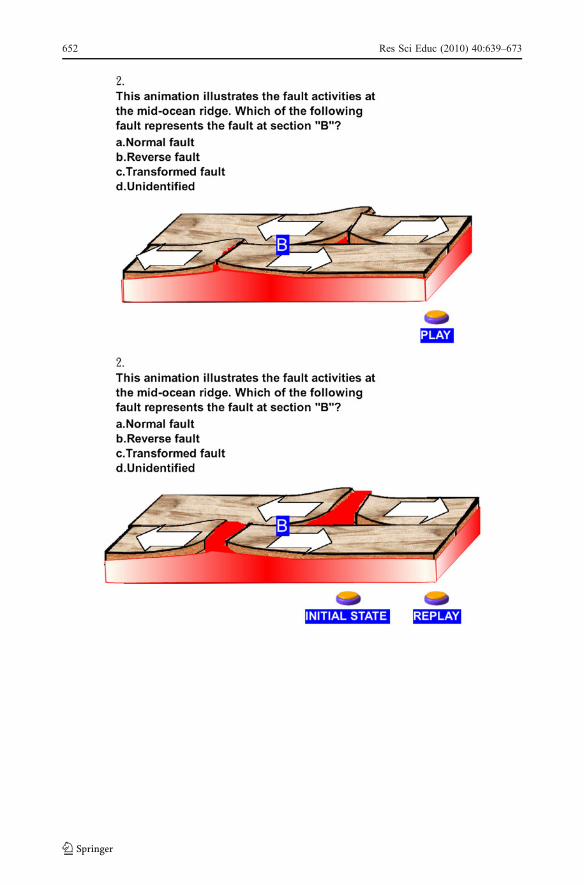
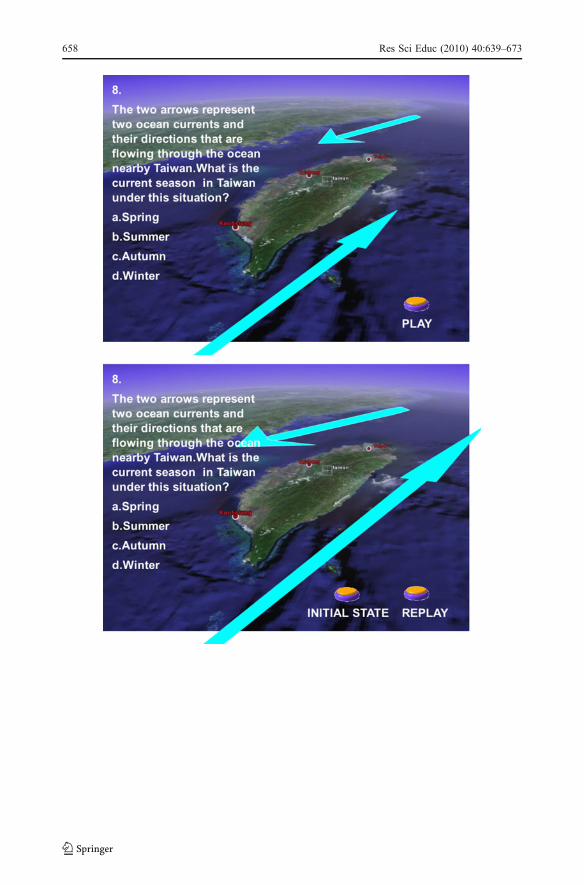
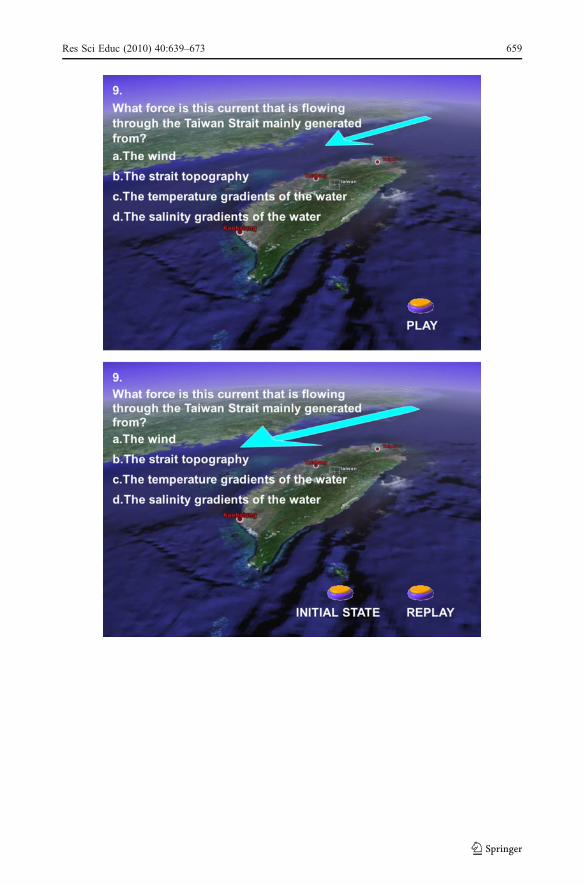
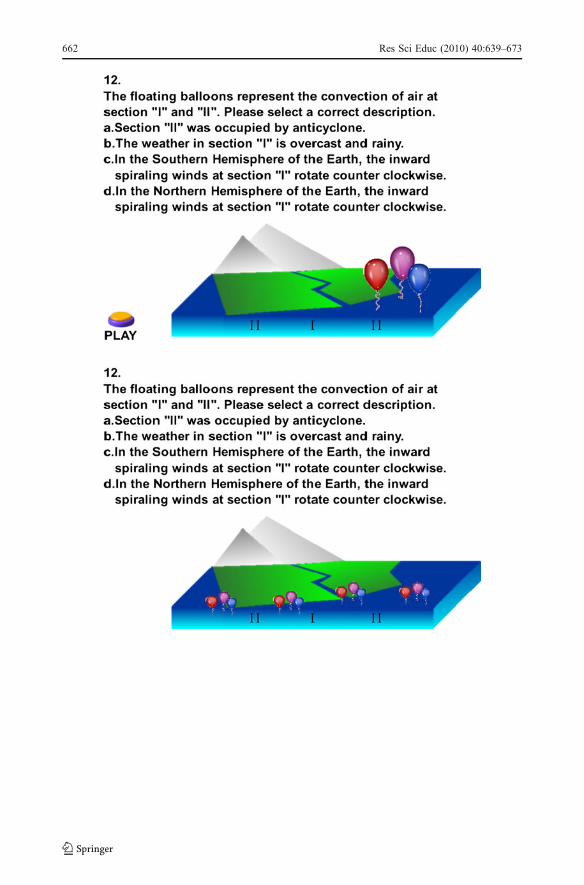
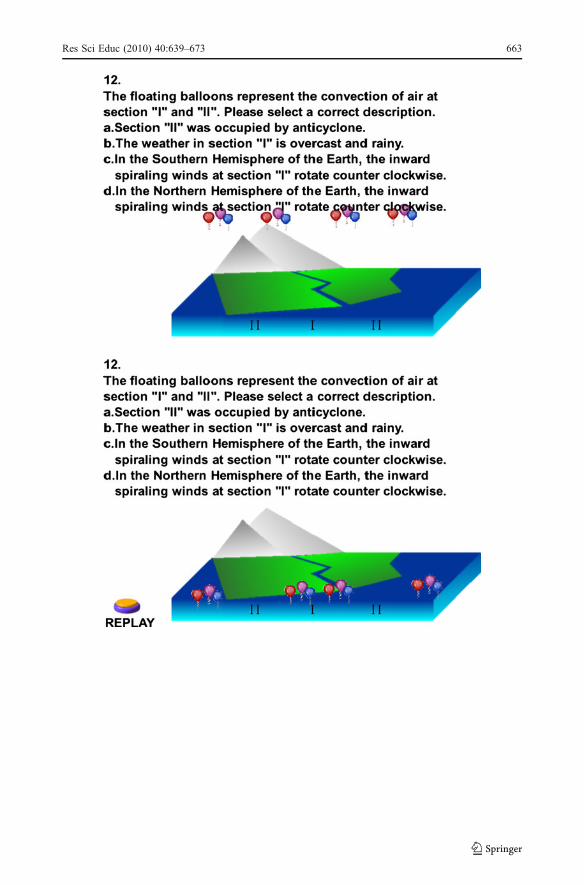
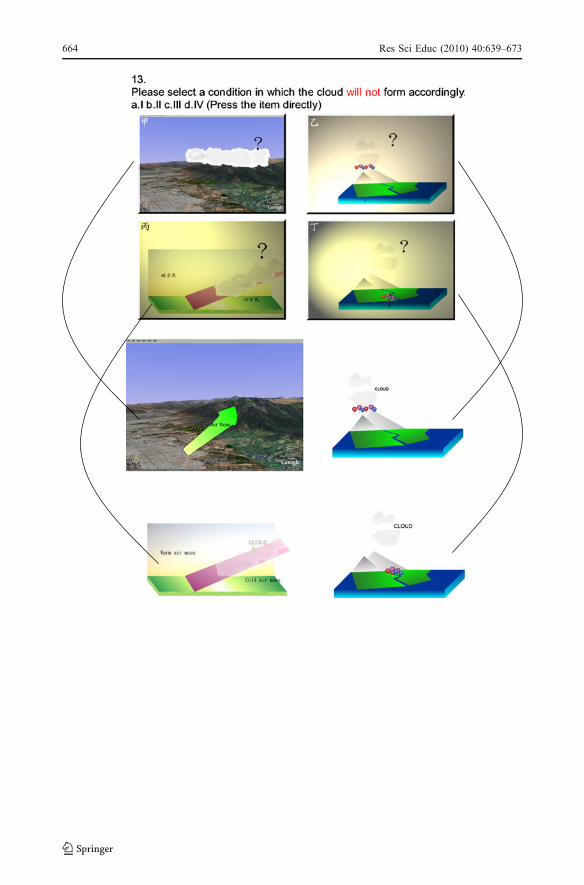
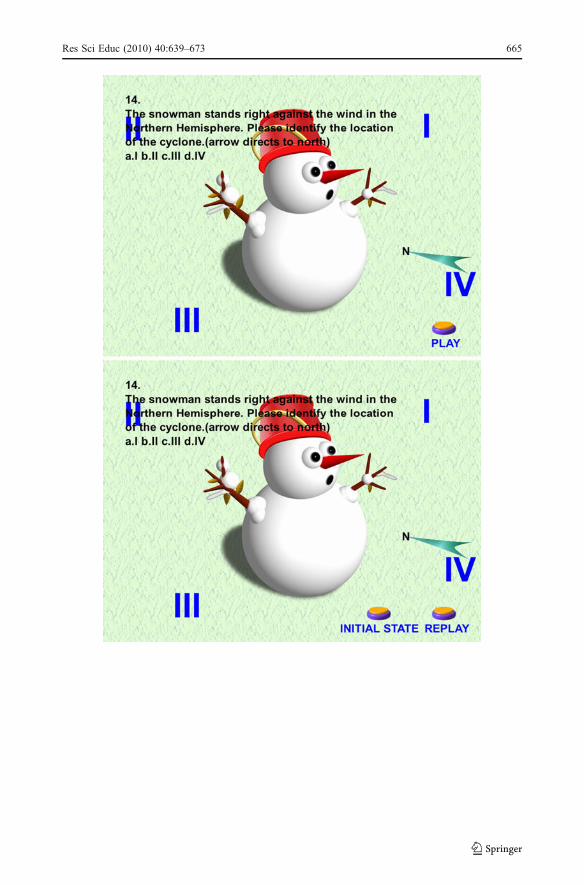
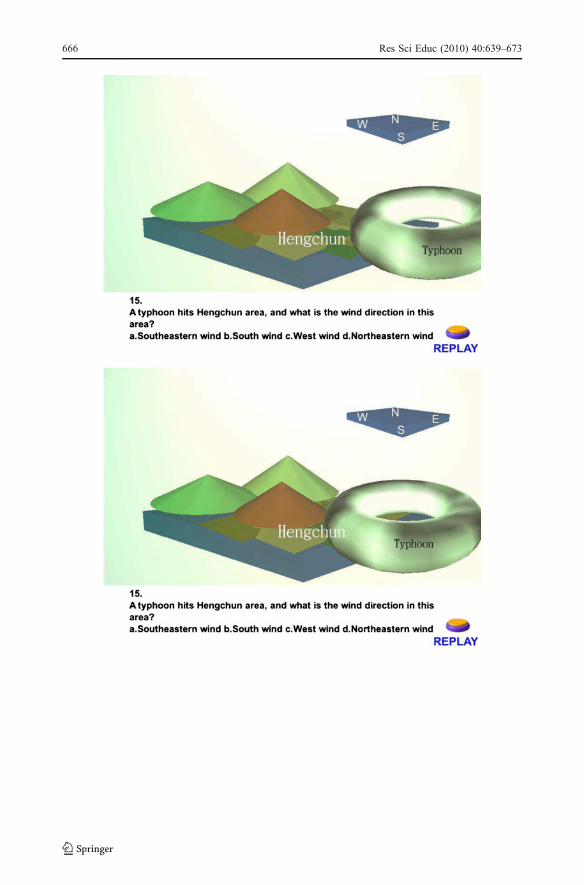
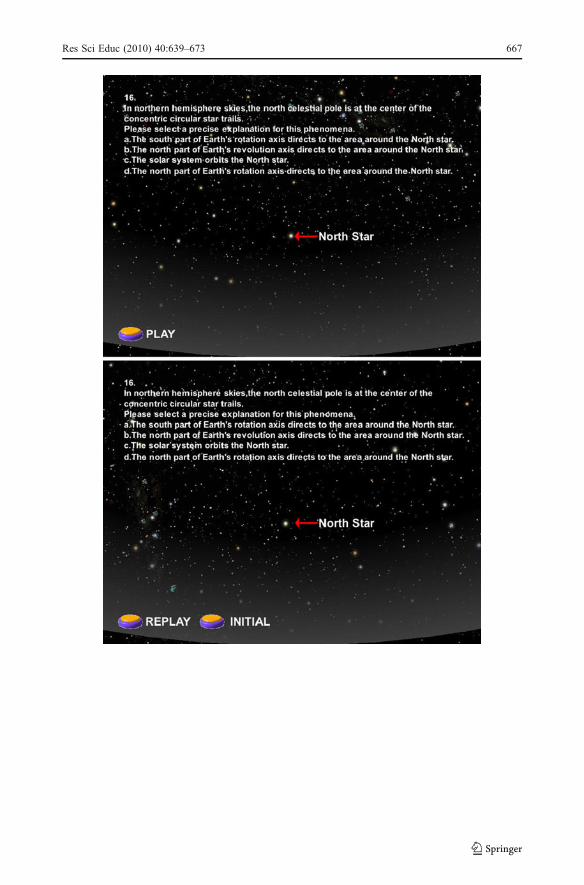
The animations incorporated in ABT were appropriately simplified by reducing thedetails of the objects. Figure 1 represents a sample item in the ABT. The railroad and themountains in the animation are illustrated by straight lines and simple images. In addition tothe animation, arrows and the interactive functions enabled by the “play”, “initial state” and“replay” buttons are provided. The animation was designed cautiously in order to decreasethe extraneous cognitive load. By doing so, participants were expected to manage morecognitive resources in their working memory for information processing.
This study not only measured students’ earth science achievements when using ABT incomparison to GBT, but also examined students’ attitudes toward ABT as a new testinginstrument. The scale used in this study was revised from “Attitude toward ComputerizedAssessment Scale” (ATCAS) with the internal consistency values ranging from 0.76 to 0.92(Smith and Caputi 2004). Having revised from the ATCAS, A newly adapted 18-questionsurvey, Attitude toward Animation Assessment Scale (AAAS), revised from the ATCAS,was administered in this study. The survey measured students’ attitudes toward ABT in thefollowing four perspectives: (1) ease of use of ABT, (2) confidence in using ABT,(3) design of ABT and, (4) acceptance of ABT. Students’ responses on the 4-point Likert-like questions ranged from 1, indicating strongly disagree, to 4, indicating strongly agree.Finally, the survey was administered by computers and students’ responses were submittedonline.
Validity, Reliability and Item Analysis
To ensure the content correctness and the validity of the test, the researchers solicited theopinions from 6 earth science professors/educators. Of which, one specialized in scienceeducation and five specialized in earth sciences. To judge the quality of the test items, eachscience educator received an ABT/GBT CD package and wrote down his/her comments on
Table 2 A table of content for ABT and GBT
Content Total
1. Fault 4
2. Crust convergence 1
3. Hydrologic cycle 2
4. Ocean circulation 2
5. The tides 1
6. Cyclone & anticyclone 3
7. Clouds 1
8. Typhoon 1
9. The motion of the Earth 1
10. The ecliptic and seasons 1
11. Local sidereal time 3
Total Items 20
Res Sci Educ (2010) 40:639–673 643

a checklist. The comments were generally constructive. For example, a geologist suggestedthat the slope of a thrust fault in animation should be smoothed to less than 30 degrees sincea steep slope is unlikely to occur in reality. Based on the comments provided, modificationswere made accordingly. Through the review of the test items by the earth scienceprofessors/educators, the content validity was improved.
The reliability of the ABT and GBT were measured using the Kuder-RichardsonFormula 20 (KR-20). According to Fraenkel and Wallen (1993), reliability coefficientsshould be at least 0.70 and preferably higher. The result indicated a reliability coefficient of0.70 for both tests which demonstrated that they were appropriate measures. To determinethe reliability of the Attitude toward Animation Assessment Scale (AAAS) which surveyedparticipants’ perceptions toward the ABT, the Cronbach’s Alpha reliability coefficient wascalculated. The result demonstrated a 0.78 of reliability coefficient. Since the scores in ABTand GBT were fairly consistent, scoring variation would be limited if they wereadministered to the same student again. The study further conducted an item analysis forthe ABT by calculating the item difficulty and item discrimination for each of the 20 itemsin ABT. The item difficulty of the 20 items in ABT ranged from 0.20–0.91 with an averageof 0.51 and the item discrimination ranged from 0.12–0.57 with an average of 0.36. Ingeneral, the acceptable range for item difficulty is between 0.30 and 0.90 and for itemdiscrimination is above 0.25. Though slightly lower than the acceptable range, for thepurpose of this study, the ranges of item difficulty and discrimination are still consideredreasonable.
Data Analysis
An independent sample t-test was conducted to examine whether the mean scores weresignificantly different between the participants who had learned the earth sciencecurriculum and the participants who were still in the process of learning the curriculum.In order to test whether an interaction effect existed between the learner statuses(curriculum learned or curriculum in progress) and the test formats (ABT or GBT), atwo-way ANOVA was conducted.
The magnitude of the differences between the means of the two groups was assessedthrough the use of effect size (ES). The ES takes into account the size of the differencebetween the means, regardless of whether or not it is statistically significant. It can beobtained by dividing the mean difference of the two groups by the common standard
Fig. 1 A sample item of ABT
644 Res Sci Educ (2010) 40:639–673
deviation. As suggested by Cohen (1988), 0.20 represents a small ES, 0.50 a medium ES,and 0.80 a large ES. Most researchers consider an ES of 0.50 or larger as an importantfinding.
Results
Discriminating Power Testing
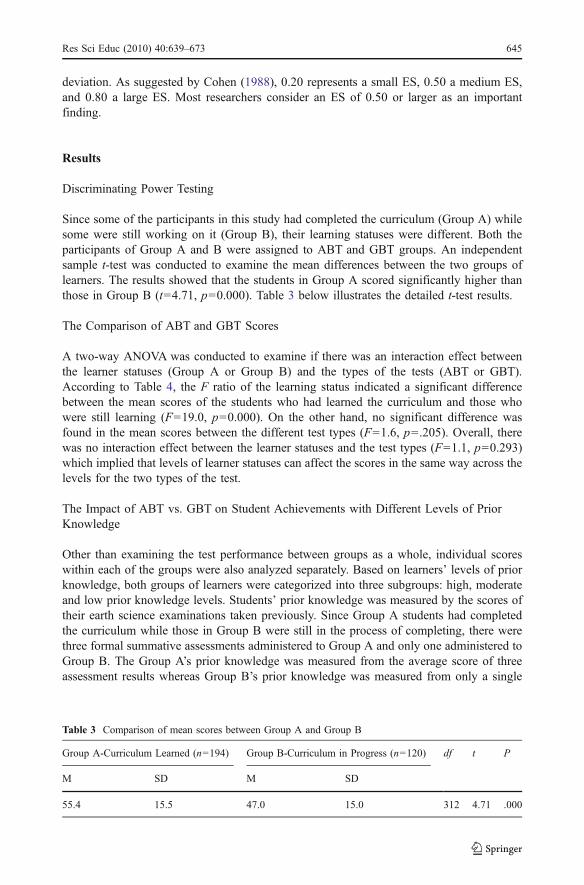
Since some of the participants in this study had completed the curriculum (Group A) whilesome were still working on it (Group B), their learning statuses were different. Both theparticipants of Group A and B were assigned to ABT and GBT groups. An independentsample t-test was conducted to examine the mean differences between the two groups oflearners. The results showed that the students in Group A scored significantly higher thanthose in Group B (t=4.71, p=0.000). Table 3 below illustrates the detailed t-test results.
The Comparison of ABT and GBT Scores
A two-way ANOVA was conducted to examine if there was an interaction effect betweenthe learner statuses (Group A or Group B) and the types of the tests (ABT or GBT).According to Table 4, the F ratio of the learning status indicated a significant differencebetween the mean scores of the students who had learned the curriculum and those whowere still learning (F=19.0, p=0.000). On the other hand, no significant difference wasfound in the mean scores between the different test types (F=1.6, p=.205). Overall, therewas no interaction effect between the learner statuses and the test types (F=1.1, p=0.293)which implied that levels of learner statuses can affect the scores in the same way across thelevels for the two types of the test.
The Impact of ABT vs. GBT on Student Achievements with Different Levels of PriorKnowledge
Other than examining the test performance between groups as a whole, individual scoreswithin each of the groups were also analyzed separately. Based on learners’ levels of priorknowledge, both groups of learners were categorized into three subgroups: high, moderateand low prior knowledge levels. Students’ prior knowledge was measured by the scores oftheir earth science examinations taken previously. Since Group A students had completedthe curriculum while those in Group B were still in the process of completing, there werethree formal summative assessments administered to Group A and only one administered toGroup B. The Group A’s prior knowledge was measured from the average score of threeassessment results whereas Group B’s prior knowledge was measured from only a single
Table 3 Comparison of mean scores between Group A and Group B
Group A-Curriculum Learned (n=194) Group B-Curriculum in Progress (n=120) df t P
M SD M SD
55.4 15.5 47.0 15.0 312 4.71 .000
Res Sci Educ (2010) 40:639–673 645

assessment result. Table 5 shows the comparison of students’ prior knowledge scoresbetween Group A and B.
For Group A, there were significant differences in the average scores between ABT andGBT groups. The average score of 57.2 for ABT group was significantly higher than theaverage score of 52.9 for GBT group (t=1.91, p=0.05, d=0.3, small effect size). The meanscores for the three subgroups were also examined. Students of low prior knowledgeobtained 53.9 on ABT and 43.5 on GBT (t=1.94, p=0.06, d=0.7, approaching large effectsize).
For Group B, the overall scores for the two types of the tests did not differ significantlyfrom each other (t=0.14, p=0.89, d=0.1, small effect size). While further examination ofthe mean scores for the subgroups showed the high prior knowledge students scored higheron GBT than ABT, it was not statistically significant (t=1.44, p=0.16, d=0.7, approachinglarge effect size). On the contrary, students with low prior knowledge obtained a higheraverage score on ABT in comparison with GBT with no statistical significance (t=0.94,p=0.36, d=0.7, approaching large effect size). Though both findings were statisticallyinsignificant, the medium to large effect size may indicate some practical significance since
Table 5 Comparison between ABT and GBT scores within Group A and Group B in relation to differentlevels of prior knowledge
Level of prior knowledge ABT score GBT score t (p) Cohen’s d
n Mean SD n Mean SD
Group A 114 57.2 15.03 80 52.9 15.99 1.91 (0.05*) 0.3
Low 19 53.9 14.51 18 43.5 15.05 1.94 (0.06) 0.7
Mid 65 56.7 15.23 49 52.8 14.95 1.44 (0.15) 0.3
High 30 62.3 13.87 13 60.9 16.95 0.25 (0.80) 0.1
Group B 79 47.2 15.31 41 46.8 14.30 0.14 (0.89) 0.1
Low 13 48.2 17.28 8 38.3 10.41 0.94 (0.36) 0.7
Mid 50 45.6 14.50 21 44.1 13.76 0.44 (0.66) 0.1
High 16 50.6 15.71 12 59.4 10.50 1.44 (0.16) 0.7
*p<0.05
Table 4 Descriptive data for students’ scores and the results of ANOVA
Test type
ABT group GBT group
Learner Status Mean (SD) Mean (SD)
Group A-Curriculum Learned 57.2 (15.0) 52.9 (16.0)
Group B-Curriculum in Progress 47.2 (15.3) 46.8 (14.3)
Source SS df MS F Sig.
SSa (Test-type) 375.5 1 375.5 1.6 0.205
SSb (Status) 4430.1 1 4430.1 19.0 0.000
SSab 258.0 1 258.0 1.1 0.293
646 Res Sci Educ (2010) 40:639–673

most researchers consider that any effect size of 0.50 or larger is an important finding(Fraenkel and Wallen 1993). Figure 2 depicts the comparison between ABT and GBTscores in association with students’ prior knowledge for Group A and B.
Note that several researchers have suggested the inadequacy of merely using the result ofstatistical significance testing for statistical inference since the achievement of statisticalsignificance may depend upon the sample size (Cohen 1988; Daniel 1998; McLean andErnest 1998). Specifically, it is easier to achieve a statistical significance when the samplesize is large rather than small and vice versa. With the small sample size in this study, forexample, it would be more likely to obtain a statistically insignificant result. On the otherhand, statistical significance and the coefficient of effect size together can provide differenttypes of information. Therefore, the results of a medium or large effect size that occurred inseveral findings of this study may represent a possibility of achieving statistical significancewhen a future study is replicated with a larger sample size. Hence, the findings with nostatistical significance yet a medium or large effect size may still provide useful practicalsignificance to the study.
Student Perceptions Toward ABT
Upon completion of the tests, students who took the ABT were given the Attitudetoward Animation Assessment Scale (AAAS) to survey their attitudes toward the tests.Students’ attitudes were categorized into the following four aspects: (1) ease of use ofABT, (2) confidence in using ABT, (3) design of ABT and (4) acceptance of ABT. Thefour aspects explained 51% variances of the data. Table 6 presents the frequency of eachaspect. The satisfaction index was derived from summing up the percentages of studentschoosing “strongly agree” and “agree”. The results demonstrated that over 60% of thestudents who took the ABT were satisfied with it. Finally, the ABT participants were alsoasked to provide a general rating on their perceptions toward ABT from 1 to 10, with 1indicating extremely unsatisfied and 10 being extremely satisfied. The average rating was 8,which reflected the wide acceptance and positive perceptions among the participants.
Fig. 2 ABT and GBT scores for Group A (the left one) and B in relation to different levels of priorknowledge
Res Sci Educ (2010) 40:639–673 647

Discussion
Quality of the Test
Researchers have suggested that performance on an assessment should increase inaccordance with the increased expertise, which thereby would be an indication of stabilityand validity of the test (Bakx and Sijtsma 2002). In this study, the students who had learnedthe curriculum (Group A) scored significantly higher than those who were still learning(Group B). This finding revealed that the discriminating power of the ABT and GBT weresupported. The validity, reliability, item difficulty and item discrimination serve asindicators for determining the quality of the test. The validity and reliability for theanimation-based test were acceptable, yet the item difficulty and item discrimination neededto be improved. The items of extremely low difficulty that everyone was most likely toanswer correctly should be replaced by more difficult ones and vice versa in order todiscriminate among the students. In addition, the distracters that were not chosen by anytest takers should be replaced or eliminated since they did not discriminate the students ofhigher competencies from those of the lower ones.
Critical readers might reasonably challenge this part of the results as being expected; thatthe administered tests of this study can measure the differences between students whoalready learned a curriculum and those who were still learning. However, the result waspurposely included to show that the test designed in this study clearly distinguishedstudents’ levels of knowledge. By doing so, the tests may serve as better indicators ofstudents’ achievements.
Interaction Between Levels of Prior Knowledge and the Animation Effectiveness
The result of this study revealed that among the tenth graders who participated in the study,only those with low prior knowledge in earth sciences benefited more from ABT whilethose of high prior knowledge levels benefited more from GBT. As aforementioned,through the use of animations, learners can develop good and valid mental representations.The forming of mental representation is crucial for learners to understand complexphenomena because the internal representations that can be run by the learners havestructures which parallel to the real phenomena and short-term mental constructs (Alessiand Trollip 2001). The animation-based test of this study, therefore, could function as ascaffold for the test-takers in developing good internal mental representations to makeinferences with, and in facilitating their mental processes in information accessing andtherefore reduce their testing barriers. Hence, the results of this study revealed that the lowprior knowledge students tend to benefit more from animations than students of high priorknowledge. This finding also corresponded to one of Mayer’s (Mayer 2001) guidelines for
Table 6 Frequency of four aspects in AAAS
Strongly Agree Agree Disagree Strongly Disagree Satisfaction Index(strongly agree + agree)
Ease of use 20.5 41.6 26.0 11.9 62.1
Confidence 25.3 42.1 23.4 9.2 67.4
Design 10.8 47.1 34.1 8.0 57.9
Acceptance 15.7 49.4 26.2 8.7 65.1
648 Res Sci Educ (2010) 40:639–673

multimedia design named individual differences principle which stated that design effectsare especially stronger for low-knowledge participants than for high-knowledge partic-ipants. The rationale behind it was that high-knowledge learners were able to form mentalrepresentation from words or graphics alone whereas low-knowledge learners may find itdifficult to construct mental representation in working memory at the same time.
From the perspectives of cognitive psychology, Sweller’s cognitive load theorysuggested that effective instructional designs may decrease extraneous cognitive load toallow the available cognitive resources to be fully devoted to learning. For schemaacquisition to occur, instruction should be designed to decrease working memory load sincethe information presented in the instruction must first be processed by working memory.Therefore, the cognitive load theory stresses the importance of a well-designed instructionto reduce the load in the working memory so that the changes in long term memoryassociated with schema acquisition can be facilitated (Sweller 1988; van Merrienboer andSweller 2005). As for the case of testing, when test-takers are exposed to the static graphics,it may increase their working memory load since they have to generate more inferences infinding relationships that are not explicit. Also as suggested by Lowe (2004), when test-takers are exposed to static graphics, it requires them to infer the situational dynamicsbecause the static depictions can present only implicit representations of dynamic contents.This process can be seen as imposing a processing burden from a purely textualrepresentation. In contrast, animations have the advantage of presenting the situationaldynamic explicitly and can appropriately decrease extraneous cognitive load and allow test-takers’ processing capacities to be devoted mostly to comprehending the content directly.Therefore, as the result in this study, animations may serve as an aid to free up the cognitiveresources for inference-making for the students of low prior knowledge, hence the higherscore in ABT than GBT. However, this effect is comparatively weak for the high priorknowledge students. The advantage of guided instruction begins to recede when learnershave sufficient high prior knowledge to provide “internal” guidance (Kirschner et al. 2006).Since high prior knowledge students can easily retrieve the previously constructed schemas,their cognitive loads on working memory are reduced by enabling the use of abundantschemas. Therefore, high prior knowledge students can process information with lowcognitive load regardless of whether the animation is supplied or not.
In addition, the expertise reversal effect, in certain cases may occur when animation thatis effective for inexperienced learners becomes ineffective or imposes negative influencesfor experienced learners (Clark et al. 2006; Kalyuga et al. 2003). In this study, students ofhigh prior knowledge level in the curriculum in progress group (Group B) had thetendencies to score higher in their GBT as opposed to ABT. Based on the expertise reversaleffect, test-takers with high prior knowledge must integrate and cross-reference redundantinformation from animation with their schemas. This activity may place excessive andunnecessary load on their working memory and hence influence the testing results. Thiseffect carries the implication that instructional design should be tailored to the level ofexperience of participants. That is to say, the original static testing format is likely to be thebest format for the high-prior knowledge students, while the animated format is effectivefor the low-prior knowledge students.
Motivation and the Effectiveness of ABT
The results of this study have revealed participants’ generally positive perceptions towardthe use of ABT. Since motivation plays an important role in student learning, finding ateaching method that could enhance learners’ motivation may become a common goal for
Res Sci Educ (2010) 40:639–673 649

most of the instructors. Malone’s motivation theory (Malone and Lepper 1987) suggestedthree relevant factors: challenge, curiosity and control. Generally, students may have atendency to view tests or assessments as being boring or intimidating which ultimatelyleads to low motivation. However, by administering ABT as an alternative testing device,the animation utilized in ABT may enhance students’ sensory curiosity, which according toMalone’s theory is aroused by visual or auditory stimuli and therefore attracts attention(Alessi and Trollip 2001). In addition, while allowing students’ control over the ABT panelwhen they pressed the buttons to display the animation or submitted their answers, learners’intrinsic motivation may be enhanced (Lepper et al. 1996). Hence, previous research hasconcluded positive effects while evaluating the effectiveness of incorporating animationinto students’ learning processes (Ainsworth and VanLabeke 2004). In this study, animationhas found to be motivating not only in students’ learning processes but also in their testingprocesses.
Since previous research in the area of animation based test is very limited, this study canbe seen as a pioneer study to evaluate students’ attitudes and achievements on ABT. In spiteof the limitation of the small sample size in sub-groups of this study, the findings of thecurrent study may still serve as a basis for providing some very valuable implications forfuture replicated studies. As stated by Chang et al. (2007), solving a problem requiresstudents to fully understand the problem, to make appropriate inferences, and finally to findsolutions to the problem. All in all, this study has found that animations may function in away to assist low prior knowledge students in developing mental models, to help them fullyunderstand the problem and to release more cognitive resources in order to makeappropriate inferences. Nevertheless, it is very important to note that the conclusions drawnfrom the present study may still need to be further replicated in the future. Therefore,similar research involving a larger sample size in related fields is strongly recommended.
Acknowledgement The work in this study was supported by the National Science Council of Taiwan undercontracts NSC 97-2631-S-003 -003 and NSC 98-2631-S-003 -002. The authors especially thank Nan-husenior high school’searth science teacher Dong jia-ju and 10th grade students for their kindly help to thisproject.
650 Res Sci Educ (2010) 40:639–673

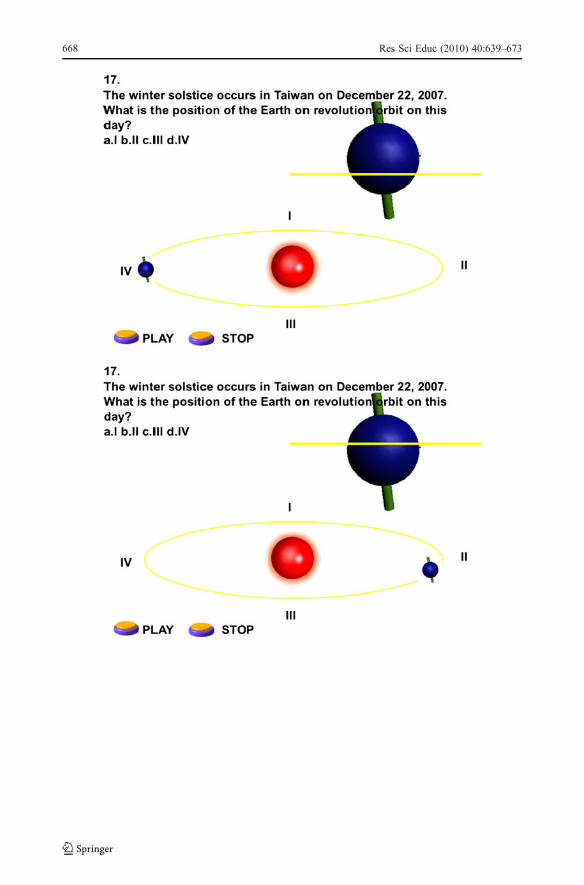
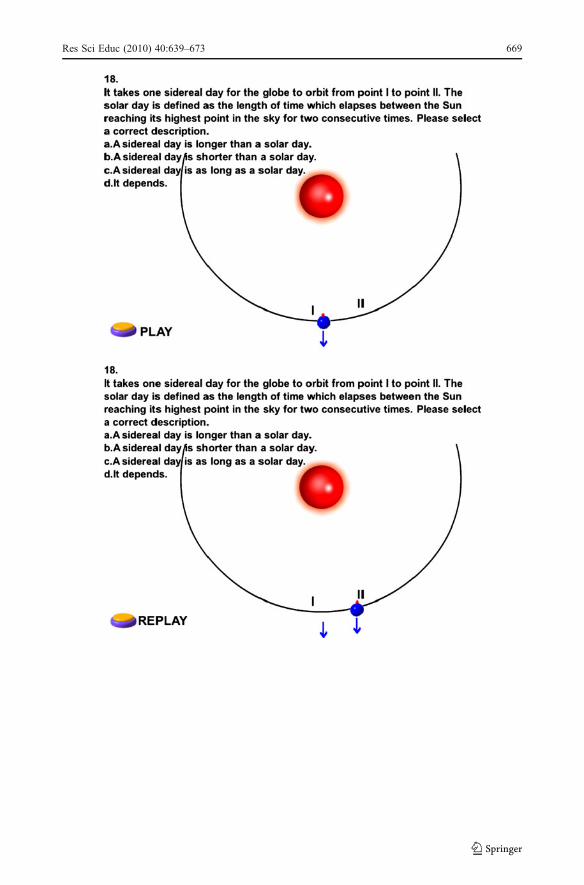
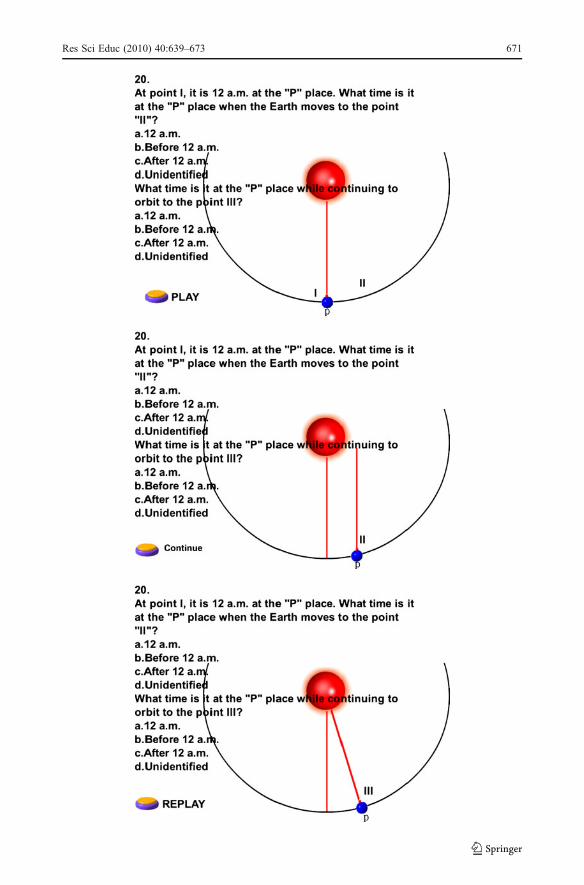
Appendix
Res Sci Educ (2010) 40:639–673 651
652 Res Sci Educ (2010) 40:639–673

Res Sci Educ (2010) 40:639–673 653
654 Res Sci Educ (2010) 40:639–673
Res Sci Educ (2010) 40:639–673 655
656 Res Sci Educ (2010) 40:639–673

Res Sci Educ (2010) 40:639–673 657
658 Res Sci Educ (2010) 40:639–673
Res Sci Educ (2010) 40:639–673 659

660 Res Sci Educ (2010) 40:639–673

Res Sci Educ (2010) 40:639–673 661
662 Res Sci Educ (2010) 40:639–673
Res Sci Educ (2010) 40:639–673 663
664 Res Sci Educ (2010) 40:639–673
Res Sci Educ (2010) 40:639–673 665
666 Res Sci Educ (2010) 40:639–673
Res Sci Educ (2010) 40:639–673 667
668 Res Sci Educ (2010) 40:639–673
Res Sci Educ (2010) 40:639–673 669

670 Res Sci Educ (2010) 40:639–673
Res Sci Educ (2010) 40:639–673 671
References
American Association for the Advancement of Science. (1993). Benchmarks for science literacy. New York:Oxford University Press.
Ainsworth, S., & VanLabeke, N. (2004). Multiple forms of dynamic representation. Learning andInstruction, 14(3), 241–255. doi:10.1016/j.learninstruc.2004.06.002.
Alessi, S. M., & Trollip, S. R. (2001). Multimedia for learning: methods and development (3rd ed.). Boston,MA: Allyn & Bacon.
Bakx, A. W. E. A., & Sijtsma, K. (2002). Development and evaluation of a students-centered multimediaself-assessment instrument for social-communicative competence. Instructional Science, 30, 335–359.doi:10.1023/A:1019820629644.
Bodemer, D., Ploetzner, R., Feuerlein, I., & Spada, H. (2004). The active integration of information duringlearning with dynamic and interactive visualizations. Learning and Instruction, 14, 325–341.doi:10.1016/j.learninstruc.2004.06.006.
Chang, C. Y., Barufaldi, J. P., Lin, M. C., & Chen, Y. C. (2007). Assessing tenth-grade students’ problemsolving ability online in the area of earth sciences. Computers in Human Behavior, 23, 1971–1981.doi:10.1016/j.chb.2006.02.014.
Clark, R., Ngyuyen, F., & Sweller, J. (2006). Efficiency in learning: evidence-based guidelines to managecognitive load. San Francisco, CA: Wiley.
Cohen, J. (1988). Statistical power analysis for the behavioral sciences (2nd ed.). Hillsdale, NJ: LawrenceErlbaum.
Cook, M. P. (2006). Visual representation in science education: the influence of prior knowledge andcognitive load theory on instructional design principles. Science Education, 90, 1073–1091.doi:10.1002/sce.20164.
Dancy, M. H., & Beichner, R. (2006). Impact of animation on assessment of conceptual understanding inphysics. Physics Education Research, 2, 010104. doi:10.1103/PhysRevSTPER.2.010104.
Daniel, L. G. (1998). Statistical significance testing: a historical overview of misuse and misinterpretationwith implication for the editorial policies of educational journals. Research in the Schools, 5(2), 23–32.
Dexter, S. (2006). Educational theory into practice software. In D. Gibson, C. Aldrich & M. Prensky (Eds.),Games and simulations in online learning: research & development frameworks (pp. 223–234).Hershey, PA: Idea Group.
Fraenkel, J. R., & Wallen, N. E. (1993). How to design and evaluate research in education (2nd ed.). NewYork: McGraw-Hill.
Kalyuga, S., Ayres, P., Chandler, P., & Sweller, J. (2003). The expertise reversal effect. EducationalPsychologist, 38(1), 23–21. doi:10.1207/S15326985EP3801_4.
Kirschner, P. A., Sweller, J., & Clark, R. E. (2006). Why minimal guidance during instruction does not work:an analysis of the failure of constructivist, discovery, problem-based, experiential, and inquiry-basedteaching. Educational Psychologist, 41(2), 75–86. doi:10.1207/s15326985ep4102_1.
Lepper, M. R., Keavney, M., & Drake, M. (1996). Intrinsic motivation and extrinsic rewards: a commentaryon Cameron and Pierce’s meta-analysis. Review of Educational Research, 66, 5–32.
Lowe, R. K. (2003). Animation and learning: selective processing of information in dynamic graphics.Learning and Instruction, 13, 157–176. doi:10.1016/S0959-4752(02)00018-X.
Lowe, R. (2004). Interrogation of a dynamic visualization during learning. Learning and Instruction, 14,257–274. doi:10.1016/j.learninstruc.2004.06.003.
Malone, T. W., & Lepper, M. R. (1987). Making learning fun: A taxonomy of intrinsic motivations forlearning. In R. E. Snow & M. J. Farr (Eds.), Aptitude, learning and instruction: III. Cognitive andaffective process analyses (pp. 223–253). Hillsdale, NJ: Erlbaum.
Mayer, R. E. (2001). Multimedia learning. Cambridge, UK: Cambridge University Press.McLean, J. E., & Ernest, J. M. (1998). The role of statistical significance testing in educational research.
Research in the Schools, 5(2), 15–22.Rieber, L. P. (1990). Using computer animated graphics in science instruction with children. Journal of
Educational Psychology, 82, 135–140. doi:10.1037/0022-0663.82.1.135.Schnotz, W., & Grzondziel, H. (1996). Knowledge acquisition with static and animated pictures in computer-
based learning. Paper presented at the Annual Meeting of the American Educational ResearchAssociation, New York.
Smith, B., & Caputi, P. (2004). The development of the attitude towards the computerized assessment scale.Journal of Educational Computing Research, 31, 407–422. doi:10.2190/R6RV-PAQY-5RG8-2XGP.
Sweller, J. (1988). Cognitive load during problem solving: effects on learning. Cognitive Science, 12, 257–285.Tversky, B., Morrison, J. B., & Betrancourt, M. (2002). Animation: can it facilitate? International Journal of
Human-Computer Studies, 57, 247–262. doi:10.1006/ijhc.2002.1017.
672 Res Sci Educ (2010) 40:639–673

van Merrienboer, J. J. G., & Sweller, J. (2005). Cognitive load theory and complex learning: recentdevelopments and future directions. Educational Psychology Review, 17(2), 147–177. doi:10.1007/s10648-005-3951-0.
Wouters, P., Paas, F., & van Merrienboer, J. J. G. (2008). How to optimize learning from animated models: areview of guidelines based on cognitive load. Review of Educational Research, 78(3), 645–675.doi:10.3102/0034654308320320.
Res Sci Educ (2010) 40:639–673 673