Comparison of concentrations and stereoisomer ratios of mecoprop, dichlorprop and metolachlor in...
8
Comparison of concentrations and stereoisomer ratios of mecoprop, dichlorprop and metolachlor in Ontario streams, 2006–2007 vs. 2003–2004 Perihan Binnur Kurt-Karakus a , Terry F. Bidleman a, * , Derek C.G. Muir b , John Struger b , Ed Sverko b , Steve J. Cagampan b , Jeff M. Small b , Liisa M. Jantunen a a Center for Atmospheric Research Experiments, Environment Canada, 6248 Eighth Line, Egbert, L0L 1N0 ON, Canada b Water Science and Technology Directorate, Environment Canada, 867 Lakeshore Road, Burlington, L7R 4A6 ON, Canada Stereoisomer proportions of chiral herbicides in streams of Ontario, Canada reveal switches in pesticide product usage and in-watershed degradation. article info Article history: Received 21 April 2009 Received in revised form 29 October 2009 Accepted 3 November 2009 Keywords: Herbicides Pesticides Streamwater Enantiomers Stereoisomers Ontario abstract Mecoprop, dichlorprop and metolachlor concentrations and enantiomer signatures were determined in Ontario streams in 2006–2007 and compared to results from 2003 to 2004. Median concentrations of dichlorprop and metolachlor were not significantly different between the two campaigns, but mecoprop was higher in 2006–2007. Concentrations of mecoprop and dichlorprop in Lake Ontario surface water were 1–2 orders of magnitude lower than stream averages. Enantiomer fractions (EFs) > 0.5 of mecoprop in high-concentration stream water samples during 2006–2007 were related to replacement of racemic mecoprop by single (þ) enantiomer mecoprop-P after 2004. EFs <0.5 in low-concentration samples suggested enantioselective degradation and/or interconversion. Metolachlor profiles were expressed as SF, the fraction of herbicidally active/(active þ inactive) stereoisomers. Samples with higher concen- trations of metolachlor had SFs similar to S-metolachlor which is enriched in the active stereoisomers. Low concentrations were associated with lower and more variable SFs, suggesting mixed input of racemic and S-metolachlor or stereoselective degradation. Crown Copyright Ó 2009 Published by Elsevier Ltd. All rights reserved. 1. Introduction Approximately 25% of currently used pesticides are chiral with at least one asymmetric element, resulting in mixtures of stereo- isomers which differ greatly in biological activities (Hegeman and Laane, 2002). Increasing attention is being focused on the biological activities of the individual stereoisomers and efforts are being made to replace mixtures of isomers by products which either consist of a single enantiomer or are enriched in active stereoiso- mers (Garrison, 2006). While these single or enriched enantiomer products decrease the pesticide loadings to the environment, their fate in the environment and possible interconversions between the enantiomers/stereoisomers should also be considered. Enan- tiomer-specific degradation of chiral pesticides, racemization of single enantiomer pesticides and interconversion of the enantio- mers have been reported in different environmental media such as soils (Garrison et al., 1996; Buser and Mu ¨ller, 1997; Mu ¨ ller and Buser, 1997; Buser et al., 2002; Buerge et al., 2003; Monkiedje et al., 2007), lake and river water and sediments (Buser and Mu ¨ ller, 1998), activated sludge (Zipper et al., 1999). Mecoprop [(RS)-2-(4-chloro-2-methylphenoxy) propanoic acid], dichlorprop [(RS)-2-(2,4-dichlorophenoxy) propanoic acid] and metolachlor [(aRS,1RS)-2-chloro-6 0 -ethyl-N-(2-methoxy-1- methylethyl)acet-o-toluidide] are three herbicides that are heavily relied upon in Canada. Mecoprop and dichlorprop are used to control broad leaf weeds in cereals and grassland; agricultural usage in Canada during 2003 was 252 and 112 tonnes, respectively (Brimble et al., 2005). In Ontario, 9.45 tonnes of dichlorprop was used in agriculture in 2003, while agricultural use of mecoprop was only 0.70 tonne (Brimble et al., 2005; McGee et al., 2004). Much more mecoprop was applied in urban areas of Ontario as a lawn herbicide, 252 tonnes in 1993 (Grabusky et al., 2004). Mecoprop and dichlorprop possess an asymmetrically substituted carbon atom which makes them chiral. The R(þ) enantiomers are herbi- cidally active (Åberg, 1956), while the S() enantiomers show antiauxin properties (Loos, 1975). The racemic herbicides have been or are being replaced with single R(þ) enantiomer products that have been registered and produced since 1980s in many countries * Corresponding author. Tel.: þ1 705 458 3322; fax: þ1 705 458 3301. E-mail address: [email protected] (T.F. Bidleman). Contents lists available at ScienceDirect Environmental Pollution journal homepage: www.elsevier.com/locate/envpol 0269-7491/$ – see front matter Crown Copyright Ó 2009 Published by Elsevier Ltd. All rights reserved. doi:10.1016/j.envpol.2009.11.003 Environmental Pollution 158 (2010) 1842–1849
Transcript of Comparison of concentrations and stereoisomer ratios of mecoprop, dichlorprop and metolachlor in...
lable at ScienceDirect
Environmental Pollution 158 (2010) 1842–1849
Contents lists avai
Environmental Pollution
journal homepage: www.elsevier .com/locate/envpol
Comparison of concentrations and stereoisomer ratios of mecoprop, dichlorpropand metolachlor in Ontario streams, 2006–2007 vs. 2003–2004
Perihan Binnur Kurt-Karakus a, Terry F. Bidleman a,*, Derek C.G. Muir b, John Struger b, Ed Sverko b,Steve J. Cagampan b, Jeff M. Small b, Liisa M. Jantunen a
a Center for Atmospheric Research Experiments, Environment Canada, 6248 Eighth Line, Egbert, L0L 1N0 ON, Canadab Water Science and Technology Directorate, Environment Canada, 867 Lakeshore Road, Burlington, L7R 4A6 ON, Canada
Stereoisomer proportions of chiral herbicides in streams of Ontario,degradation.
Canada reveal switches in pesticide product usage and in-watershed
a r t i c l e i n f o
Article history:Received 21 April 2009Received in revised form29 October 2009Accepted 3 November 2009
Keywords:HerbicidesPesticidesStreamwaterEnantiomersStereoisomersOntario
* Corresponding author. Tel.: þ1 705 458 3322; faxE-mail address: [email protected] (T.F. Bidle
0269-7491/$ – see front matter Crown Copyright � 2doi:10.1016/j.envpol.2009.11.003
a b s t r a c t
Mecoprop, dichlorprop and metolachlor concentrations and enantiomer signatures were determined inOntario streams in 2006–2007 and compared to results from 2003 to 2004. Median concentrations ofdichlorprop and metolachlor were not significantly different between the two campaigns, but mecopropwas higher in 2006–2007. Concentrations of mecoprop and dichlorprop in Lake Ontario surface waterwere 1–2 orders of magnitude lower than stream averages. Enantiomer fractions (EFs) > 0.5 of mecopropin high-concentration stream water samples during 2006–2007 were related to replacement of racemicmecoprop by single (þ) enantiomer mecoprop-P after 2004. EFs <0.5 in low-concentration samplessuggested enantioselective degradation and/or interconversion. Metolachlor profiles were expressed asSF, the fraction of herbicidally active/(active þ inactive) stereoisomers. Samples with higher concen-trations of metolachlor had SFs similar to S-metolachlor which is enriched in the active stereoisomers.Low concentrations were associated with lower and more variable SFs, suggesting mixed input ofracemic and S-metolachlor or stereoselective degradation.
Crown Copyright � 2009 Published by Elsevier Ltd. All rights reserved.
1. Introduction
Approximately 25% of currently used pesticides are chiral withat least one asymmetric element, resulting in mixtures of stereo-isomers which differ greatly in biological activities (Hegeman andLaane, 2002). Increasing attention is being focused on the biologicalactivities of the individual stereoisomers and efforts are beingmade to replace mixtures of isomers by products which eitherconsist of a single enantiomer or are enriched in active stereoiso-mers (Garrison, 2006). While these single or enriched enantiomerproducts decrease the pesticide loadings to the environment, theirfate in the environment and possible interconversions between theenantiomers/stereoisomers should also be considered. Enan-tiomer-specific degradation of chiral pesticides, racemization ofsingle enantiomer pesticides and interconversion of the enantio-mers have been reported in different environmental media such assoils (Garrison et al., 1996; Buser and Muller, 1997; Muller and
: þ1 705 458 3301.man).
009 Published by Elsevier Ltd. All
Buser, 1997; Buser et al., 2002; Buerge et al., 2003; Monkiedje et al.,2007), lake and river water and sediments (Buser and Muller, 1998),activated sludge (Zipper et al., 1999).
Mecoprop [(RS)-2-(4-chloro-2-methylphenoxy) propanoicacid], dichlorprop [(RS)-2-(2,4-dichlorophenoxy) propanoic acid]and metolachlor [(aRS,1RS)-2-chloro-60-ethyl-N-(2-methoxy-1-methylethyl)acet-o-toluidide] are three herbicides that are heavilyrelied upon in Canada. Mecoprop and dichlorprop are used tocontrol broad leaf weeds in cereals and grassland; agriculturalusage in Canada during 2003 was 252 and 112 tonnes, respectively(Brimble et al., 2005). In Ontario, 9.45 tonnes of dichlorprop wasused in agriculture in 2003, while agricultural use of mecoprop wasonly 0.70 tonne (Brimble et al., 2005; McGee et al., 2004). Muchmore mecoprop was applied in urban areas of Ontario as a lawnherbicide, 252 tonnes in 1993 (Grabusky et al., 2004). Mecopropand dichlorprop possess an asymmetrically substituted carbonatom which makes them chiral. The R(þ) enantiomers are herbi-cidally active (Åberg, 1956), while the S(�) enantiomers showantiauxin properties (Loos, 1975). The racemic herbicides have beenor are being replaced with single R(þ) enantiomer products thathave been registered and produced since 1980s in many countries
rights reserved.
P.B. Kurt-Karakus et al. / Environmental Pollution 158 (2010) 1842–1849 1843
(Muller and Buser, 1997). Racemic mecoprop was phased out inCanada and replaced with pure R(þ) mecoprop (mecoprop-P)between 2004 and 2005 (PMRA, 2004). Only racemic dichlorprop iscurrently registered in Canada.
Metolachlor usage in Canada during 2003 was 555 tonnes, ofwhich nearly 98% was used in Ontario (Brimble et al., 2005). Appli-cations in Ontario were mainly on maize (57%) and soybeans (34%),and to a lesser extent on other crops (McGee et al., 2004). Fourstereoisomers of metolachlor result from its two chiral elements;one on a carbon atom and the other due to hindered rotation aroundthe C–N axis (atropisomerism) (Blaser, 2002; Buser and Muller,1995). The four stereoisomers are designated aR,10R; aR,10S; aS,10R;aS,10S, where a ¼ axial chirality and 10 ¼ carbon chirality (Buser andMuller,1995). Metolachlor contains two pairs of enantiomers (aR,10R;aS,10S and aR,10S; aS,10R) and two pairs of diastereomers (aR,10R;aS,10R and aR,10S; aS,10S). In racemic metolachlor, the enantiomers ineach pair are in a 1:1 relationship, although the ratios of diastereo-mers need not be 1:1 (Buser and Muller, 1995). Racemic metolachlorwas first introduced to the market in 1976 and 95% of its herbicidalactivity resides in the aR,10S and aS,10S stereoisomers (Buser et al.,2000b). These two stereoisomers are enriched in the product knownas S-metolachlor, which is reported to achieve the same herbicidaleffect at about 60% of the racemic product use rate (Garrison, 2006).Registrations for racemic metolachlor in Canada expired at the end of2006 and only formulations containing S-metolachlor have beensold since (Pest Management Regulatory Agency 2008, personalcommunication).
This is the second of two papers that reports concentrations andstereoisomer composition of mecoprop, dichlorprop and metola-chlor in Ontario streams. In the first paper, results were presentedfrom a study conducted in 2003–2004 comprising 393 samples(Kurt-Karakus et al., 2008). In the present paper, we report theresults from a follow-up study of 203 stream water samplescollected in 2006–2007. The aim of this second campaign was toassess the changes in herbicide concentrations and stereoisomerproportions following the product substitutions that took placesince 2004.
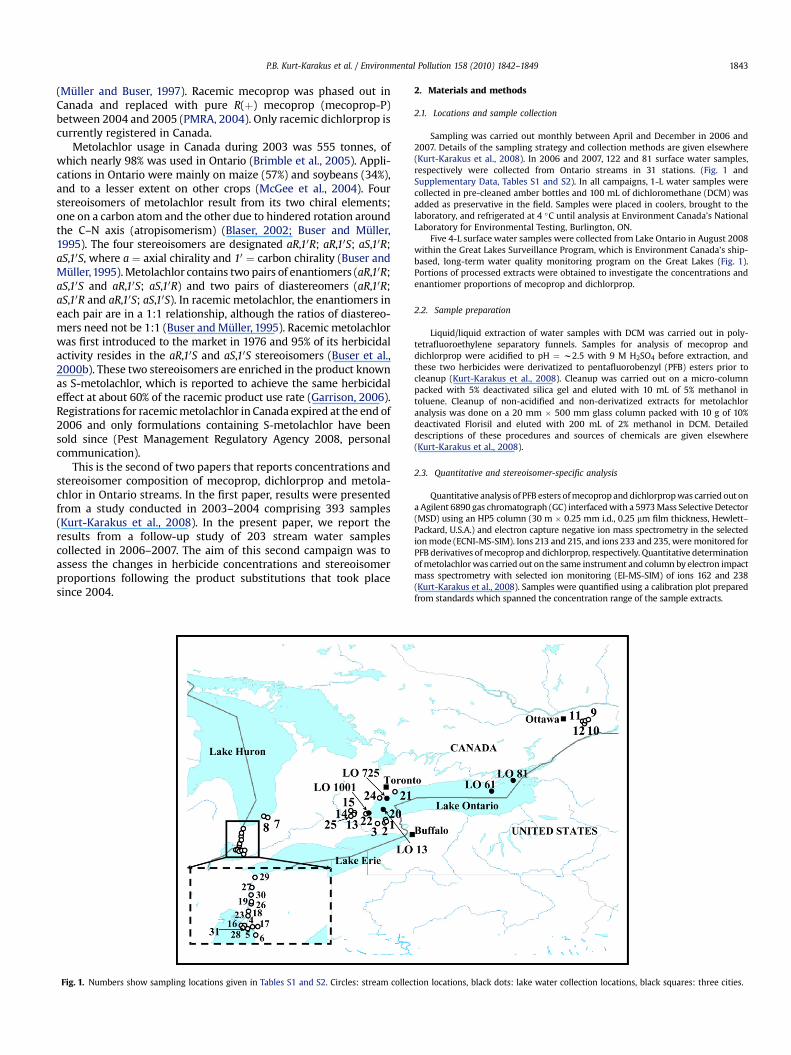
Fig. 1. Numbers show sampling locations given in Tables S1 and S2. Circles: stream collec
2. Materials and methods
2.1. Locations and sample collection
Sampling was carried out monthly between April and December in 2006 and2007. Details of the sampling strategy and collection methods are given elsewhere(Kurt-Karakus et al., 2008). In 2006 and 2007, 122 and 81 surface water samples,respectively were collected from Ontario streams in 31 stations. (Fig. 1 andSupplementary Data, Tables S1 and S2). In all campaigns, 1-L water samples werecollected in pre-cleaned amber bottles and 100 mL of dichloromethane (DCM) wasadded as preservative in the field. Samples were placed in coolers, brought to thelaboratory, and refrigerated at 4 �C until analysis at Environment Canada’s NationalLaboratory for Environmental Testing, Burlington, ON.
Five 4-L surface water samples were collected from Lake Ontario in August 2008within the Great Lakes Surveillance Program, which is Environment Canada’s ship-based, long-term water quality monitoring program on the Great Lakes (Fig. 1).Portions of processed extracts were obtained to investigate the concentrations andenantiomer proportions of mecoprop and dichlorprop.
2.2. Sample preparation
Liquid/liquid extraction of water samples with DCM was carried out in poly-tetrafluoroethylene separatory funnels. Samples for analysis of mecoprop anddichlorprop were acidified to pH ¼ w2.5 with 9 M H2SO4 before extraction, andthese two herbicides were derivatized to pentafluorobenzyl (PFB) esters prior tocleanup (Kurt-Karakus et al., 2008). Cleanup was carried out on a micro-columnpacked with 5% deactivated silica gel and eluted with 10 mL of 5% methanol intoluene. Cleanup of non-acidified and non-derivatized extracts for metolachloranalysis was done on a 20 mm � 500 mm glass column packed with 10 g of 10%deactivated Florisil and eluted with 200 mL of 2% methanol in DCM. Detaileddescriptions of these procedures and sources of chemicals are given elsewhere(Kurt-Karakus et al., 2008).
2.3. Quantitative and stereoisomer-specific analysis
Quantitative analysis of PFB esters of mecoprop and dichlorprop was carried out ona Agilent 6890 gas chromatograph (GC) interfaced with a 5973 Mass Selective Detector(MSD) using an HP5 column (30 m � 0.25 mm i.d., 0.25 mm film thickness, Hewlett–Packard, U.S.A.) and electron capture negative ion mass spectrometry in the selectedion mode (ECNI-MS-SIM). Ions 213 and 215, and ions 233 and 235, were monitored forPFB derivatives of mecoprop and dichlorprop, respectively. Quantitative determinationof metolachlor was carried out on the same instrument and column by electron impactmass spectrometry with selected ion monitoring (EI-MS-SIM) of ions 162 and 238(Kurt-Karakus et al., 2008). Samples were quantified using a calibration plot preparedfrom standards which spanned the concentration range of the sample extracts.
tion locations, black dots: lake water collection locations, black squares: three cities.

P.B. Kurt-Karakus et al. / Environmental Pollution 158 (2010) 1842–18491844
Enantioselective analysis of mecoprop and dichlorprop PFB esters was done byGC-ECNI-MS-SIM using an Agilent 6890 GC-5973 MSD and a Rtx-bDEXcst column(30 m, 0.25 mm i.d. � 0.25 mm film thickness, Restek Corporation, Bellefonte, PA,U.S.A.). Analysis of metolachlor isomers was carried out by high performance liquidchromatography-tandem mass spectrometry (LC–MS/MS). The LC instrument wasinterfaced with an API 2000 triple quadrupole mass spectrometer and the ion sourcewas operated in the atmospheric pressure chemical ionization mode. The iontransition monitored was 284.2–251.1.
Separation of four isomers of metolachlor was obtained on a Daicel column(Chiralcel OD-H; 250 � 4.6 mm, Chiral Technologies, Inc., West Chester, PA, U.S.A.)using 0.2% 2-propanol in n-hexane. The stereoisomer elution order was aR,10R;aR,10S; aS,10R and aS,10S (Polcaro et al., 2004). Details regarding these procedures,sources of chromatographic supplies and example chromatograms of compoundseparations are given in the main paper and Supporting Information of Kurt-Karakuset al. (2008).
Stereoisomer data for mecoprop and dichlorprop are expressed as enantiomerfraction (EF) (Equation (1)) and for metolachlor as SF, the fraction of herbicidallyactive/(active þ inactive) stereoisomers (Equation (2)).
EF ¼ Rð þ Þ½Rð þ Þ þ Sð � Þ� (1)
SF ¼ aS;10Sþ aR;10SaS;10Sþ aR;10Sþ aR;10Rþ aS;10R
(2)
Table 1Seasonality of herbicide concentrations in Ontario streams in 2006–2007 and compariso
Year Seasona Range Medianb
Mecoprop2006 Spring <0.5–103 12
Summer <0.5–602 29Fall–Winter <0.5–106 19Overall <0.5–602 21
2007 Spring <0.5–706 57Summer <0.5–829 91Fall–Winter <0.5–623 120Overall <0.5–829 79
2006–2007 Overall <0.5–829 44
2003–2004 Overall <0.5–103000 24
Dichlorprop2006 Spring <0.5–5.5 2.5
Summer <0.5–31 2.1Fall–Winter <0.5–16 2.8Overall <0.5–31 2.3
2007 Spring <0.5–21 2.8Summer <0.5–14 5.4Fall–Winter <0.5 ndOverall <0.5–21 4.5
2006–2007 Overall <0.5–31 3.2
2003–2004 Overall <0.5–110 2.2
Metolachlor2006 Spring <1.7–5160 44
Summer <1.7–906 120Fall–Winter <1.7–139 87Overall <1.7–5160 87
2007 Spring <1.7–230 114Summer <1.7–48 40Fall–Winter <1.7–2820 716Overall <1.7–2820 121
2006–2007d Overall <1.7–5160 16
2006–2007e Overall <24–5160 94
2003–2004e Overall <24–5290 92
a Spring: April–May; summer: June–July–August; winter: September, October, Novemb Median for samples > MQL.c Mean for all samples, 1/2 MQL was assumed for non-detectable concentrations.d With MQL ¼ 1.7 ng L�1.e With MQL ¼ 24 ng L�1.
In a previous paper, the stereoisomer ratio S/R ¼ active/inactive isomers, wasreported (Kurt-Karakus et al., 2008). The relationship between SF and S/R is:
SF ¼ S=RðS=RÞ þ 1
(3)
3. Quality control
Blanks were prepared for every 1 in 12 samples and were treatedin the same manner as samples by extracting and cleaning-up 1 L ofMilli-Q water. No peaks of target compounds were detected inblanks. Quantitation was done using calibration plots prepared withexternal standards. The recovery surrogate chemicals 2,3,dichlor-ophenoxyacetic acid (2,3-D) (287 ng) and trifluralin-d14 (46.3 ng)were added in acid herbicide (mecoprop and dichlorprop) andneutral herbicide (metolachlor) analysis, respectively. Averagerecoveries (�SD) of 2,3-D and trifluralin-d14 were 107�15% (rangingfrom 62 to 129%) and 98 � 16% (ranging from 60 to 130%), respec-tively. Recoveries of spiked unlabelled compounds were: mecoprop90 � 12%, ranging from 62% to 108% (201 ng; n ¼ 48), dichlorprop91�12%, ranging from 62% to 109% (201 ng; n¼ 48) and metolachlor101�5%, ranging from 90% to 110% (25 ng; n¼ 12). Results were not
n with 2003–2004 concentrations, ng L�1.
Meanc SD Positive/SSamples %Detection
20 33 14/24 5837 100 34/69 4913 28 12/29 4128 78 60/122 49
105 183 15/25 60162 262 16/25 6479 134 16/31 52113 196 47/81 58
62 144 107/203 53
380 5211 224/393 57
1.1 1.5 8/24 331.6 4.4 18/69 261.1 3.1 6/29 211.4 3.6 32/122 26
1.6 4.2 6/25 241.6 3.3 5/25 20nd nd 0/31 01.1 3.0 11/81 14
1.3 3.4 43/203 21
6.4 14 125/393 32
511 1421 14/24 58107 205 35/69 5130 46 10/29 34168 662 59/122 48
40 66 9/25 574 11.1 2/25 86119 518 3/31 5259 323 14/81 70
128 553 179/203 88
132 552 73/203 36
153 389 201/393 51
ber, December.
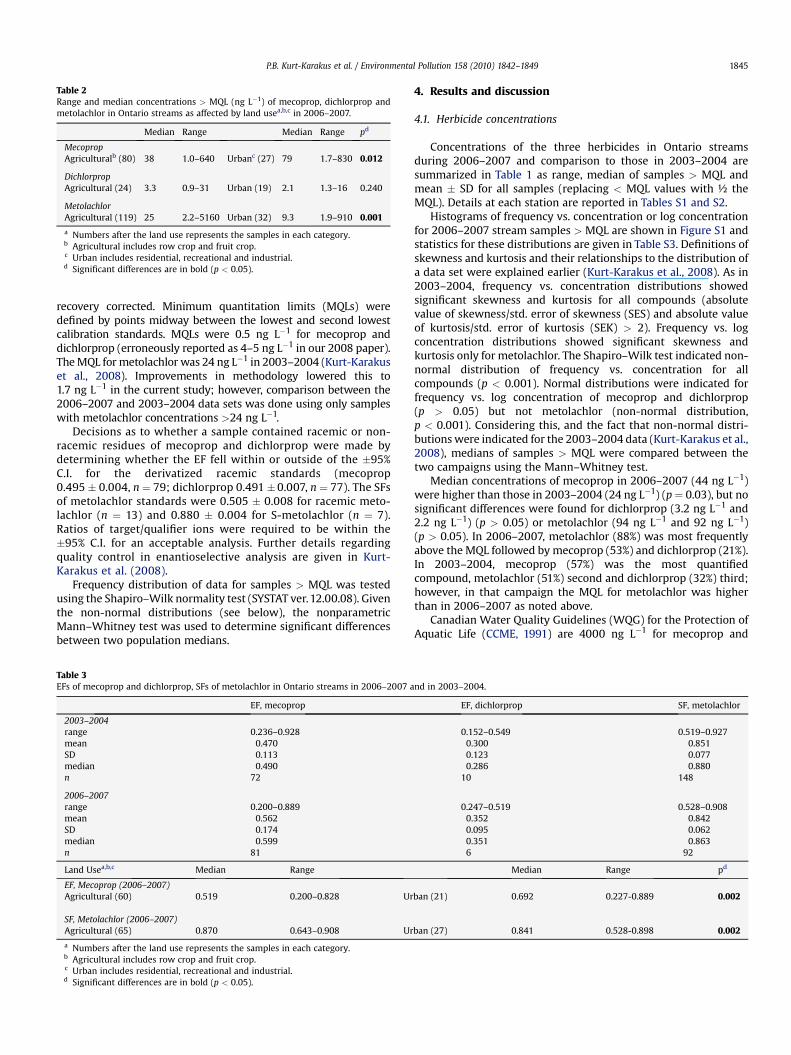
Table 2Range and median concentrations > MQL (ng L�1) of mecoprop, dichlorprop andmetolachlor in Ontario streams as affected by land usea,b,c in 2006–2007.
Median Range Median Range pd
MecopropAgriculturalb (80) 38 1.0–640 Urbanc (27) 79 1.7–830 0.012
DichlorpropAgricultural (24) 3.3 0.9–31 Urban (19) 2.1 1.3–16 0.240
MetolachlorAgricultural (119) 25 2.2–5160 Urban (32) 9.3 1.9–910 0.001
a Numbers after the land use represents the samples in each category.b Agricultural includes row crop and fruit crop.c Urban includes residential, recreational and industrial.d Significant differences are in bold (p < 0.05).
P.B. Kurt-Karakus et al. / Environmental Pollution 158 (2010) 1842–1849 1845
recovery corrected. Minimum quantitation limits (MQLs) weredefined by points midway between the lowest and second lowestcalibration standards. MQLs were 0.5 ng L�1 for mecoprop anddichlorprop (erroneously reported as 4–5 ng L�1 in our 2008 paper).The MQL for metolachlor was 24 ng L�1 in 2003–2004 (Kurt-Karakuset al., 2008). Improvements in methodology lowered this to1.7 ng L�1 in the current study; however, comparison between the2006–2007 and 2003–2004 data sets was done using only sampleswith metolachlor concentrations >24 ng L�1.
Decisions as to whether a sample contained racemic or non-racemic residues of mecoprop and dichlorprop were made bydetermining whether the EF fell within or outside of the �95%C.I. for the derivatized racemic standards (mecoprop0.495 � 0.004, n ¼ 79; dichlorprop 0.491 �0.007, n ¼ 77). The SFsof metolachlor standards were 0.505 � 0.008 for racemic meto-lachlor (n ¼ 13) and 0.880 � 0.004 for S-metolachlor (n ¼ 7).Ratios of target/qualifier ions were required to be within the�95% C.I. for an acceptable analysis. Further details regardingquality control in enantioselective analysis are given in Kurt-Karakus et al. (2008).
Frequency distribution of data for samples > MQL was testedusing the Shapiro–Wilk normality test (SYSTAT ver. 12.00.08). Giventhe non-normal distributions (see below), the nonparametricMann–Whitney test was used to determine significant differencesbetween two population medians.
Table 3EFs of mecoprop and dichlorprop, SFs of metolachlor in Ontario streams in 2006–2007 a
EF, mecoprop
2003–2004range 0.236–0.928mean 0.470SD 0.113median 0.490n 72
2006–2007range 0.200–0.889mean 0.562SD 0.174median 0.599n 81
Land Usea,b,c Median Range
EF, Mecoprop (2006–2007)Agricultural (60) 0.519 0.200–0.828 Ur
SF, Metolachlor (2006–2007)Agricultural (65) 0.870 0.643–0.908 Ur
a Numbers after the land use represents the samples in each category.b Agricultural includes row crop and fruit crop.c Urban includes residential, recreational and industrial.d Significant differences are in bold (p < 0.05).
4. Results and discussion
4.1. Herbicide concentrations
Concentrations of the three herbicides in Ontario streamsduring 2006–2007 and comparison to those in 2003–2004 aresummarized in Table 1 as range, median of samples > MQL andmean � SD for all samples (replacing < MQL values with ½ theMQL). Details at each station are reported in Tables S1 and S2.
Histograms of frequency vs. concentration or log concentrationfor 2006–2007 stream samples > MQL are shown in Figure S1 andstatistics for these distributions are given in Table S3. Definitions ofskewness and kurtosis and their relationships to the distribution ofa data set were explained earlier (Kurt-Karakus et al., 2008). As in2003–2004, frequency vs. concentration distributions showedsignificant skewness and kurtosis for all compounds (absolutevalue of skewness/std. error of skewness (SES) and absolute valueof kurtosis/std. error of kurtosis (SEK) > 2). Frequency vs. logconcentration distributions showed significant skewness andkurtosis only for metolachlor. The Shapiro–Wilk test indicated non-normal distribution of frequency vs. concentration for allcompounds (p < 0.001). Normal distributions were indicated forfrequency vs. log concentration of mecoprop and dichlorprop(p > 0.05) but not metolachlor (non-normal distribution,p < 0.001). Considering this, and the fact that non-normal distri-butions were indicated for the 2003–2004 data (Kurt-Karakus et al.,2008), medians of samples > MQL were compared between thetwo campaigns using the Mann–Whitney test.
Median concentrations of mecoprop in 2006–2007 (44 ng L�1)were higher than those in 2003–2004 (24 ng L�1) (p¼ 0.03), but nosignificant differences were found for dichlorprop (3.2 ng L�1 and2.2 ng L�1) (p > 0.05) or metolachlor (94 ng L�1 and 92 ng L�1)(p > 0.05). In 2006–2007, metolachlor (88%) was most frequentlyabove the MQL followed by mecoprop (53%) and dichlorprop (21%).In 2003–2004, mecoprop (57%) was the most quantifiedcompound, metolachlor (51%) second and dichlorprop (32%) third;however, in that campaign the MQL for metolachlor was higherthan in 2006–2007 as noted above.
Canadian Water Quality Guidelines (WQG) for the Protection ofAquatic Life (CCME, 1991) are 4000 ng L�1 for mecoprop and
nd in 2003–2004.
EF, dichlorprop SF, metolachlor
0.152–0.549 0.519–0.9270.300 0.8510.123 0.0770.286 0.880
10 148
0.247–0.519 0.528–0.9080.352 0.8420.095 0.0620.351 0.8636 92
Median Range pd
ban (21) 0.692 0.227-0.889 0.002
ban (27) 0.841 0.528-0.898 0.002
0
25
50
75
100
< 0.5 = 0.5 > 0.5 < 0.5 = 0.5 > 0.5 < 0.88 0.88-0.90 > 0.90
EF SFMecoprop Dichlorprop Metolachlor
2003-2004
2006-2007
na
EF
Per
cent
age
( )
Fig. 2. Distribution of EFs of mecoprop and dichlorprop and SFs of metolachlor in Ontario streams in 2003–2004 and 2006–2007. For dichlorprop, na ¼ not available, no sampleswith racemic EF.
P.B. Kurt-Karakus et al. / Environmental Pollution 158 (2010) 1842–18491846
7800 ng L�1 for metolachlor. In 2003–2004, 1.2% of the sampleswith mecoprop concentrations > MQL exceeded the WQG, butmetolachlor did not exceed the WQG. In 2006–2007, all sampleswere below the WQG for mecoprop and metolachlor.
Land use practices were categorized: A; urban, including resi-dential, industrial and recreational, B; agricultural, includingfruitland and row crops. Table 2 gives comparisons between themedian concentrations > MQL in samples from different land usepractice areas. The following relationships among medians weresignificant in 2006–2007. Mecoprop: urban > agricultural(p ¼ 0.012); metolachlor: agricultural > urban (p ¼ 0.001). Signif-icant differences between medians in 2003–2004 were mecoprop:urban > agricultural (p ¼ 0.007), dichlorprop: agricultural > urban(p < 0.001); metolachlor: agricultural > urban (p < 0.001).
Range, median and mean � SD concentrations (ng L�1) ofmecoprop at Lake Ontario stations (Fig. 1) were 1.7–53. 1.80 and12.7 � 22.6, respectively. Similarly for dichlorprop these valueswere: 0.26�1.1, 0.30 and 0.44�0.35, respectively (Table S4).Compared to average concentrations detected in Ontario streamsin 2006–2007 (62 � 144 and 1.3 � 3.4 for mecoprop anddichlorprop), average concentrations in Lake Ontario were about3–5 times lower. Mecoprop was higher in Hamilton Harbour (LO1001) and Toronto Harbour (LO 725) and lower at the central andeastern open lake stations in Lake Ontario (LO 61 and LO 81).Despite its proximity to urban centres, the mecoprop concentra-tion at the western station LO 13 was similar to those at the othertwo open lake sites. Dichlorprop was elevated in HamiltonHarbour, but not in Toronto Harbour, compared to concentrationsat open lake stations.
0.000
0.250
0.500
0.750
1.000
0 400
EF
Concentr
2003 - 2004
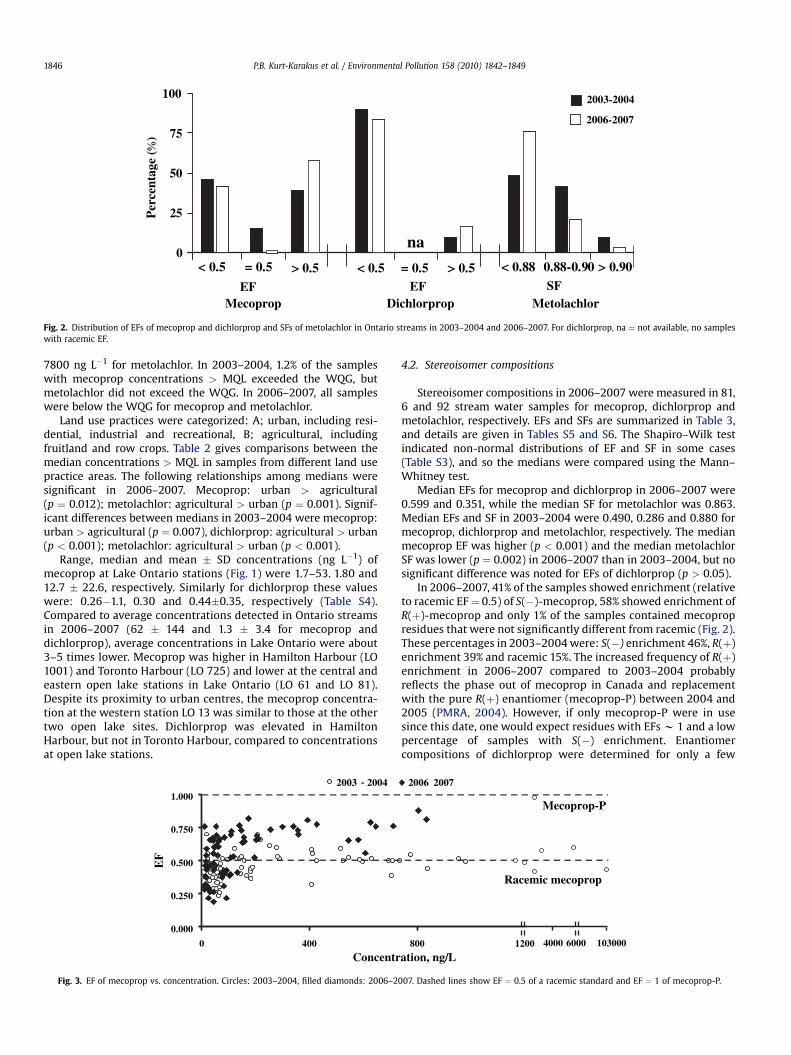
Fig. 3. EF of mecoprop vs. concentration. Circles: 2003–2004, filled diamonds: 2006–2
4.2. Stereoisomer compositions
Stereoisomer compositions in 2006–2007 were measured in 81,6 and 92 stream water samples for mecoprop, dichlorprop andmetolachlor, respectively. EFs and SFs are summarized in Table 3,and details are given in Tables S5 and S6. The Shapiro–Wilk testindicated non-normal distributions of EF and SF in some cases(Table S3), and so the medians were compared using the Mann–Whitney test.
Median EFs for mecoprop and dichlorprop in 2006–2007 were0.599 and 0.351, while the median SF for metolachlor was 0.863.Median EFs and SF in 2003–2004 were 0.490, 0.286 and 0.880 formecoprop, dichlorprop and metolachlor, respectively. The medianmecoprop EF was higher (p < 0.001) and the median metolachlorSF was lower (p ¼ 0.002) in 2006–2007 than in 2003–2004, but nosignificant difference was noted for EFs of dichlorprop (p > 0.05).
In 2006–2007, 41% of the samples showed enrichment (relativeto racemic EF¼ 0.5) of S(�)-mecoprop, 58% showed enrichment ofR(þ)-mecoprop and only 1% of the samples contained mecopropresidues that were not significantly different from racemic (Fig. 2).These percentages in 2003–2004 were: S(�) enrichment 46%, R(þ)enrichment 39% and racemic 15%. The increased frequency of R(þ)enrichment in 2006–2007 compared to 2003–2004 probablyreflects the phase out of mecoprop in Canada and replacementwith the pure R(þ) enantiomer (mecoprop-P) between 2004 and2005 (PMRA, 2004). However, if only mecoprop-P were in usesince this date, one would expect residues with EFs w 1 and a lowpercentage of samples with S(�) enrichment. Enantiomercompositions of dichlorprop were determined for only a few
800 1200 4000 6000 103000
ation, ng/L
2006 2007
Racemic mecoprop
Mecoprop-P
007. Dashed lines show EF ¼ 0.5 of a racemic standard and EF ¼ 1 of mecoprop-P.
0.400
0.600
0.800
1.000
0 500 1000 1500 2000
2006 - 20072003 - 2004
4000 6000
Racemic Metolachlor
S-metolachlorS
F
Concentration, ng/L
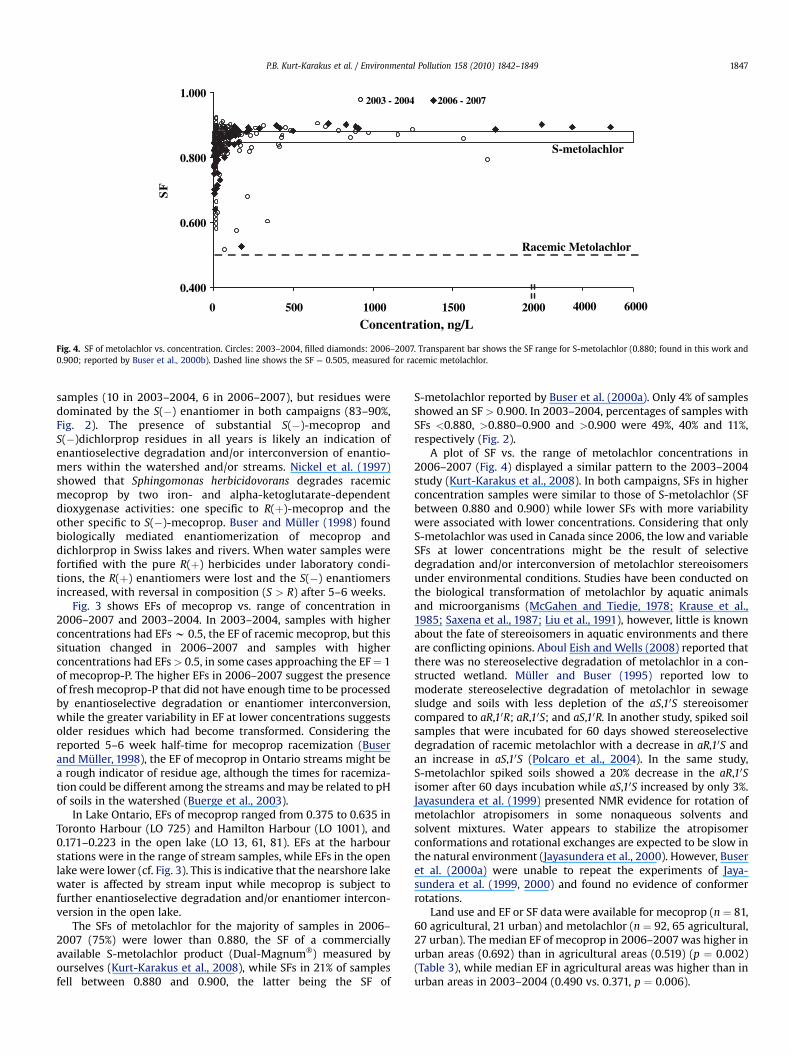
Fig. 4. SF of metolachlor vs. concentration. Circles: 2003–2004, filled diamonds: 2006–2007. Transparent bar shows the SF range for S-metolachlor (0.880; found in this work and0.900; reported by Buser et al., 2000b). Dashed line shows the SF ¼ 0.505, measured for racemic metolachlor.
P.B. Kurt-Karakus et al. / Environmental Pollution 158 (2010) 1842–1849 1847
samples (10 in 2003–2004, 6 in 2006–2007), but residues weredominated by the S(�) enantiomer in both campaigns (83–90%,Fig. 2). The presence of substantial S(�)-mecoprop andS(�)dichlorprop residues in all years is likely an indication ofenantioselective degradation and/or interconversion of enantio-mers within the watershed and/or streams. Nickel et al. (1997)showed that Sphingomonas herbicidovorans degrades racemicmecoprop by two iron- and alpha-ketoglutarate-dependentdioxygenase activities: one specific to R(þ)-mecoprop and theother specific to S(�)-mecoprop. Buser and Muller (1998) foundbiologically mediated enantiomerization of mecoprop anddichlorprop in Swiss lakes and rivers. When water samples werefortified with the pure R(þ) herbicides under laboratory condi-tions, the R(þ) enantiomers were lost and the S(�) enantiomersincreased, with reversal in composition (S > R) after 5–6 weeks.
Fig. 3 shows EFs of mecoprop vs. range of concentration in2006–2007 and 2003–2004. In 2003–2004, samples with higherconcentrations had EFs w 0.5, the EF of racemic mecoprop, but thissituation changed in 2006–2007 and samples with higherconcentrations had EFs > 0.5, in some cases approaching the EF¼ 1of mecoprop-P. The higher EFs in 2006–2007 suggest the presenceof fresh mecoprop-P that did not have enough time to be processedby enantioselective degradation or enantiomer interconversion,while the greater variability in EF at lower concentrations suggestsolder residues which had become transformed. Considering thereported 5–6 week half-time for mecoprop racemization (Buserand Muller, 1998), the EF of mecoprop in Ontario streams might bea rough indicator of residue age, although the times for racemiza-tion could be different among the streams and may be related to pHof soils in the watershed (Buerge et al., 2003).
In Lake Ontario, EFs of mecoprop ranged from 0.375 to 0.635 inToronto Harbour (LO 725) and Hamilton Harbour (LO 1001), and0.171–0.223 in the open lake (LO 13, 61, 81). EFs at the harbourstations were in the range of stream samples, while EFs in the openlake were lower (cf. Fig. 3). This is indicative that the nearshore lakewater is affected by stream input while mecoprop is subject tofurther enantioselective degradation and/or enantiomer intercon-version in the open lake.
The SFs of metolachlor for the majority of samples in 2006–2007 (75%) were lower than 0.880, the SF of a commerciallyavailable S-metolachlor product (Dual-Magnum�) measured byourselves (Kurt-Karakus et al., 2008), while SFs in 21% of samplesfell between 0.880 and 0.900, the latter being the SF of
S-metolachlor reported by Buser et al. (2000a). Only 4% of samplesshowed an SF > 0.900. In 2003–2004, percentages of samples withSFs <0.880, >0.880–0.900 and >0.900 were 49%, 40% and 11%,respectively (Fig. 2).
A plot of SF vs. the range of metolachlor concentrations in2006–2007 (Fig. 4) displayed a similar pattern to the 2003–2004study (Kurt-Karakus et al., 2008). In both campaigns, SFs in higherconcentration samples were similar to those of S-metolachlor (SFbetween 0.880 and 0.900) while lower SFs with more variabilitywere associated with lower concentrations. Considering that onlyS-metolachlor was used in Canada since 2006, the low and variableSFs at lower concentrations might be the result of selectivedegradation and/or interconversion of metolachlor stereoisomersunder environmental conditions. Studies have been conducted onthe biological transformation of metolachlor by aquatic animalsand microorganisms (McGahen and Tiedje, 1978; Krause et al.,1985; Saxena et al., 1987; Liu et al., 1991), however, little is knownabout the fate of stereoisomers in aquatic environments and thereare conflicting opinions. Aboul Eish and Wells (2008) reported thatthere was no stereoselective degradation of metolachlor in a con-structed wetland. Muller and Buser (1995) reported low tomoderate stereoselective degradation of metolachlor in sewagesludge and soils with less depletion of the aS,10S stereoisomercompared to aR,10R; aR,10S; and aS,10R. In another study, spiked soilsamples that were incubated for 60 days showed stereoselectivedegradation of racemic metolachlor with a decrease in aR,10S andan increase in aS,10S (Polcaro et al., 2004). In the same study,S-metolachlor spiked soils showed a 20% decrease in the aR,10Sisomer after 60 days incubation while aS,10S increased by only 3%.Jayasundera et al. (1999) presented NMR evidence for rotation ofmetolachlor atropisomers in some nonaqueous solvents andsolvent mixtures. Water appears to stabilize the atropisomerconformations and rotational exchanges are expected to be slow inthe natural environment (Jayasundera et al., 2000). However, Buseret al. (2000a) were unable to repeat the experiments of Jaya-sundera et al. (1999, 2000) and found no evidence of conformerrotations.
Land use and EF or SF data were available for mecoprop (n ¼ 81,60 agricultural, 21 urban) and metolachlor (n ¼ 92, 65 agricultural,27 urban). The median EF of mecoprop in 2006–2007 was higher inurban areas (0.692) than in agricultural areas (0.519) (p ¼ 0.002)(Table 3), while median EF in agricultural areas was higher than inurban areas in 2003–2004 (0.490 vs. 0.371, p ¼ 0.006).

P.B. Kurt-Karakus et al. / Environmental Pollution 158 (2010) 1842–18491848
The median SF of metolachlor in 2006–2007 was higher inagricultural land (0.870) than in urban areas (0.841) (p ¼ 0.002).(Table 3). In 2003–2004, the median SF of metolachlor was lower inagricultural vs. urban areas (0.878 vs. 0.888, p ¼ 0.027)
5. Conclusions
Concentrations of the three herbicides in Ontario streamsranged over several orders of magnitude in the 2006–2007 and2003–2004 campaigns. Medians for dichlorprop and metolachlorin quantifiable samples were not significantly different betweenthe two surveys, while the median for mecoprop was about a factorof two higher in 2006–2007. Differences in median concentrationsin urban vs. agricultural watersheds were found in both campaigns.Mecoprop, largely an urban pesticide in Ontario, was higher instreams draining urban watersheds. Metolachlor has mainly agri-cultural usage and was higher in streams draining watersheds inthese areas.
The influence of substituting mecoprop-P for racemic mecopropafter 2004 was seen in 2006–2007 by a greater frequency of R(þ)enantiomer enrichment and higher median EFs. In both campaigns,SFs of metolachlor in high-concentration samples were close to thatof S-metolachlor and the median SF was slightly higher in 2003–2004 than in 2006–2007. Residues with SFs close to that of S-metolachlor were expected in 2006–2007, but not 2003–2004when equal quantities of S-metolachlor and racemic metolachlorwere reportedly used. Residues of all three herbicides in low-concentration samples showed an increased proportion of theherbicidally inactive stereoisomers, and this was also true ofmecoprop in Lake Ontario. Stereoselective degradation and/orrearrangement in the watershed might explain these observations.The situation of metolachlor appears complex and requires furtherinvestigation to determine the environmental fate ofstereoisomers.
Many other chiral CUPs are used in Canada. Some are racemicproducts while others are in transition from being sold as race-mates to single enantiomer formulations. Our results suggest thatenvironmental degradation of these three herbicides in Ontariowatersheds leads to residues with reduced herbicidal activityrelative to the applied products. However, this may not be univer-sally true, as others have shown great variability in degradationstereoselectivity (e.g., Buerge et al., 2003; Garrison, 2006). There isa need to track the stereochemical composition of other chiral CUPsas an indicator of product substitutions and to assess the potentialtoxicity of residues.
Acknowledgements
The authors are grateful to the Pesticide Science Fund, admin-istered jointly by Environment Canada and Health Canada, forfinancial support, to Syngenta, Inc. for providing analytical stan-dards of metolachlor stereoisomers, and to Shawn Janse, Universityof Guelph Muck Crops Research Station, for a sample of commercialDual-Magnum� S-metolachlor. We also thank Alice Dove, WaterQuality Monitoring and Surveillance Division of EnvironmentCanada, Burlington, ON, for providing extracts of Lake Ontariowater samples collected during Lake Ontario cruise number 2008-00-006.
Appendix. Supplementary material
Supplementary data associated with this article can be found inthe online version at doi:10.1016/j.envpol.2009.11.003
References
Åberg, B., 1956. In: Wain, R.L., Wightman, F. (Eds.), The Chemistry and Mode of Actionof Plant Growth Substances. Butterworth Scientific Publications, London, p. 102.
Aboul Eish, M.Y.Z., Wells, M.J.M., 2008. Monitoring stereoselective degradation ofmetolachlor in a constructed wetland: use of statistically valid enantiomericand diastereomeric fractions as opposed to ratios. J. Chromatogr. Sci. 46,269–275.
Blaser, H.-U., 2002. The chiral switch of (S)-metolachlor: a personal account of anindustrial odyssey in asymmetric catalysis. Adv. Synth. Catal. 344, 17–31.
Brimble, S., Bacchus, P., Caux P.-Y., 2005. Pesticide utilization in Canada: A compi-lation of current sales and use data. Environment Canada GoC Cat. No. En4–56/2005E-PDF. ISBN 0-662-42085-3.
Buerge, I.J., Poiger, T., Muller, M.D., Buser, H.-R., 2003. Enantioselective degradationof metalaxyl in soils: chiral preference changes with soil pH. Environ. Sci.Technol. 37, 2668–2674.
Buser, H.-R., Hany, R., Muller, M.D., Poiger, T., Rentsch, D., 2000a. Comment on theinfluence of the chemical environment on metolachlor conformations. J. Agric.Food Chem. 2000 (48), 4448–4449.
Buser, H.-R., Poiger, T., Muller, M.D., 2000b. Changed enantiomer composition ofmetolachlor in surface water following the introduction of the enantiomericallyenriched product to the market. Environ. Sci. Technol. 34, 2690–2696.
Buser, H.-R., Muller, M.D., 1995. Environmental behavior of acetamide pesticidestereoisomers. 1. Stereo- and enantioselective determination using chiral high-resolution gas chromatography and chiral high-performance liquid chroma-tography. Environ. Sci. Technol. 29, 2023–2030.
Buser, H.-R., Muller, M.D., 1997. Conversion reactions of various phenoxyalkanoic acidherbicides in soil. 2. Elucidation of the enantiomerizationprocess of chiral phenoxyacids from incubation in a D2O/soil system. Environ. Sci. Technol. 31, 1960–1967.
Buser, H.-R., Muller, M.D., 1998. Occurrence and transformation reactions of chiraland achiral phenoxyalkanoic acid herbicides in lakes and rivers in Switzerland.Environ. Sci. Technol. 32, 626–633.
Buser, H.-R., Muller, M.D., Poiger, T., Palmer, M.E., 2002. Environmental behavior ofthe chiral acetamide pesticide metalaxyl: enantioselective degradation andchiral stability in soil. Environ. Sci. Technol. 36, 221–226.
CCME (Canadian Council of Ministers of the Environment)., 1991. Appendix IXd Aprotocol for the derivation of water quality guidelines for the protection ofaquatic life. In: Canadian Water Quality Guidelines, Canadian Council ofResource and Environment Ministers, 1987. Prepared by the Task Force onWater Quality Guidelines. [Updated and reprinted with minor revisions andeditorial changes in Canadian environmental quality guidelines, Chapter 4,CCME, 1999, Winnipeg].
Garrison, A.W., Schmitt, P., Kettrup, A., 1996. Enantiomeric selectivity in the envi-ronmental degradation of dichlorprop as determined by high-performancecapillary electrophoresis. Environ. Sci. Technol. 30, 2449–2455.
Garrison, A.W., 2006. Probing the enantioselectivity of chiral pesticides. Environ.Sci. Technol. 40, 16–23.
Grabusky, J., Martin, P.A., Struger, J., 2004. Pesticides in Ontario: A critical assess-ment of potential toxicity of urban use products to wildlife, with considerationfor endocrine disruption. Volume 3. Phenoxy herbicides, chlorothalonil andchlorpyrifos. Technical report series #410, Environment Canada, CanadianWildlife Service, Environmental Conservation Branch, Ontario Region.
Hegeman, W.J.M., Laane, R.W.P.M., 2002. Enantiomeric enrichment of chiral pesti-cides in the environment. Rev. Environ. Contam. Toxicol. 173, 85–116.
Jayasundera, S., Schmidt, W., Hapeman, C.J., Torrents, A.,1999. Influence of the chemicalenvironment on metolachlor conformations. J. Agric. Food Chem. 47, 4435–4442.
Jayasundera, S., Schmidt, W., Hapeman, C.J., Torrents, A., 2000. Rebuttal on: influ-ence of the chemical environment on metolachlor conformations. J. Agric. FoodChem. 48, 4450–4451. 2000.
Krause, A., Hancoc, W.G., Minard, R.D., Freyer, A.J., Honeycutt, R.C.,LeBaron, H.M., Paulson, D.L., Liu, S.Y., Bollag, J.M., 1985. Microbial trans-formation of herbicide metolachlor by a soil actinomycete. J. Agric. FoodChem. 33, 584–589.
Kurt-Karakus, P.B., Bidleman, T.F., Muir, D.C.G., Cagampan, S.J., Struger, J., Sverko, E.,Small, J.M., Jantunen, L.M., 2008. Chiral current-use herbicides in Ontariostreams. Environ. Sci. Technol. 42, 8452–8458.
Liu, S.Y., Freyer, A.J., Bollag, J.M., 1991. Microbial dechlorination of the herbicidemetolachlor. J. Agric. Food Chem. 39, 631–636.
Loos, M.A., 1975. Phenoxyalkanoic acids. In: Kearney, P.C., Kaufman, D.D. (Eds.),Herbicides: Chemistry, Degradation and Mode of Action, vol. 1. Marcel DekkerInc., New York, pp. 2–101.
McGahen, L.L., Tiedje, J.M., 1978. Metabolism of two new acylanilide herbicides,Antor herbicide (H-22234) and Dual (metolachlor) by the soil fungus Chaeto-mium globosum. J. Agric. Food Chem. 26, 414–419.
McGee, B., Berges, H., Callow, K., 2004. Survey of Pesticide Use in Ontario, 2003.Estimates of Pesticides Used on Field Crops, Fruit and Vegetable Crops, andOther Agricultural Crops. Ontario Ministry of Agriculture and Food, Guelph, ON,ISBN 0-7743-9959-7.
Monkiedje, A., Zuehlke, S., Maniepi, S.J.N., Spiteller, M., 2007. Elimination of racemicand enantioenriched metalaxyl based fungicides under tropical conditions inthe field. Chemosphere 69, 655–663.
Muller, M.D., Buser, H.-R., 1995. Environmental behavior of acetamide pesticidestereoisomers. 2. Stereo- and enantioselective degradation in sewage sludgeand soil. Environ. Sci. Technol. 29, 2031–2037.

P.B. Kurt-Karakus et al. / Environmental Pollution 158 (2010) 1842–1849 1849
Muller, M.D., Buser, H.-R.,1997. Conversion reactions of various phenoxyalkanoic acidherbicides in soil. 1. Enantiomerization and enantioselective degradation of thechiral 2-phenoxypropionic acid herbicides. Environ. Sci. Technol. 31, 1953–1959.
Nickel, K., Suter, M.J.-F., Kohler, H.-P.E., 1997. Involvement of two alpha-keto-glutaratedependent dioxygenases in enantioselective degradation of (R)- and (S)-meco-prop by Sphingomonas herbicidovorans MH.J. Bacteriol 179, 6674–6679.
PMRA (Pest Management Regulatory Agency), May 2004. Reevaluation DecisionDocument. Mecoprop RRD2004-09. Pest Management Regulatory Agency, Ottawa.
Polcaro, C.M., Berti, A., Mannina, L., Marra, C., Sinibaldi, M., Viel, S., 2004. ChiralHPLC resolution of neutral pesticides. J. Liquid Chrom. Relat. Tech. 27, 49–61.
Saxena, A., Zhang, R., Bollag, J.M., 1987. Microorganisms capable of metabolizing theherbicide metolachlor. Appl. Environ. Microbiol. 53, 390–396.
Zipper, C., Bolliger, C., Fleischmann, T., Suter, M.J.-F., Angst, W., Muller, M.D.,Kohler, H.-P.E., 1999. Fate of the herbicide mecoprop, dichlorprop and 2,4-D inaerobic and anaerobic sewage sludge as determined by laboratory batch studiesand enantiomer-specific analysis. Biodegradation 10, 271–278.