Comparison of aerodynamically and model-derived roughness lengths (zo) over diverse surfaces,...
11
Comparison of aerodynamically and model-derived roughness lengths (z o ) over diverse surfaces, central Mojave Desert, California, USA David J. MacKinnon a, * , Gary D. Clow b , Richard K. Tigges b , Richard L. Reynolds b , P.S. Chavez Jr. a a U.S. Geological Survey, 2255 N. Gemini Drive, Flagstaff, AZ 86001, USA b U.S. Geological Survey, MS 980, Box 25046, Federal Center, Denver, CO 80225, USA Received 20 October 2002; received in revised form 30 March 2004; accepted 31 March 2004 Available online 2 July 2004 Abstract The vulnerability of dryland surfaces to wind erosion depends importantly on the absence or the presence and character of surface roughness elements, such as plants, clasts, and topographic irregularities that diminish wind speed near the surface. A model for the friction velocity ratio has been developed to account for wind sheltering by many different types of co-existing roughness elements. Such conditions typify a monitored area in the central Mojave Desert, California, that experiences frequent sand movement and dust emission. Two additional models are used to convert the friction velocity ratio to the surface roughness length (z o ) for momentum. To calculate roughness lengths from these models, measurements were made at 11 sites within the monitored area to characterize the surface roughness element. Measurements included (1) the number of roughness species (e.g., plants, small-scale topography, clasts), and their associated heights and widths, (2) spacing among species, and (3) vegetation porosity (a measurement of the spatial distribution of woody elements of a plant). Documented or estimated values of drag coefficients for different species were included in the modeling. At these sites, wind-speed profiles were measured during periods of neutral atmospheric stability using three 9-m towers with three or four calibrated anemometers on each. Modeled roughness lengths show a close correspondence (correlation coefficient, 0.84 – 0.86) to the aerodynamically determined values at the field sites. The geometric properties of the roughness elements in the model are amenable to measurement at much higher temporal and spatial resolutions using remote-sensing techniques than can be accomplished through laborious ground-based methods. A remote-sensing approach to acquire values of the modeled roughness length is particularly important for the development of linked surface/atmosphere wind-erosion models sensitive to climate variability and land-use changes in areas such as the southwestern United States, where surface roughness has large spatial and temporal variations. D 2004 Elsevier B.V. All rights reserved. Keywords: Aerodynamic roughness; Boundary layer; Wind erosion; Deflation; Desertification processes 0169-555X/$ - see front matter D 2004 Elsevier B.V. All rights reserved. doi:10.1016/j.geomorph.2004.03.009 * Corresponding author. www.elsevier.com/locate/geomorph Geomorphology 63 (2004) 103 – 113
Transcript of Comparison of aerodynamically and model-derived roughness lengths (zo) over diverse surfaces,...
www.elsevier.com/locate/geomorph
Geomorphology 63 (2004) 103–113
Comparison of aerodynamically and model-derived
roughness lengths (zo) over diverse surfaces,
central Mojave Desert, California, USA
David J. MacKinnona,*, Gary D. Clowb, Richard K. Tiggesb,Richard L. Reynoldsb, P.S. Chavez Jr.a
aU.S. Geological Survey, 2255 N. Gemini Drive, Flagstaff, AZ 86001, USAbU.S. Geological Survey, MS 980, Box 25046, Federal Center, Denver, CO 80225, USA
Received 20 October 2002; received in revised form 30 March 2004; accepted 31 March 2004
Available online 2 July 2004
Abstract
The vulnerability of dryland surfaces to wind erosion depends importantly on the absence or the presence and character of
surface roughness elements, such as plants, clasts, and topographic irregularities that diminish wind speed near the surface. A
model for the friction velocity ratio has been developed to account for wind sheltering by many different types of co-existing
roughness elements. Such conditions typify a monitored area in the central Mojave Desert, California, that experiences frequent
sand movement and dust emission. Two additional models are used to convert the friction velocity ratio to the surface roughness
length (zo) for momentum. To calculate roughness lengths from these models, measurements were made at 11 sites within the
monitored area to characterize the surface roughness element. Measurements included (1) the number of roughness species
(e.g., plants, small-scale topography, clasts), and their associated heights and widths, (2) spacing among species, and (3)
vegetation porosity (a measurement of the spatial distribution of woody elements of a plant). Documented or estimated values of
drag coefficients for different species were included in the modeling. At these sites, wind-speed profiles were measured during
periods of neutral atmospheric stability using three 9-m towers with three or four calibrated anemometers on each. Modeled
roughness lengths show a close correspondence (correlation coefficient, 0.84–0.86) to the aerodynamically determined values
at the field sites.
The geometric properties of the roughness elements in the model are amenable to measurement at much higher temporal and
spatial resolutions using remote-sensing techniques than can be accomplished through laborious ground-based methods. A
remote-sensing approach to acquire values of the modeled roughness length is particularly important for the development of
linked surface/atmosphere wind-erosion models sensitive to climate variability and land-use changes in areas such as the
southwestern United States, where surface roughness has large spatial and temporal variations.
D 2004 Elsevier B.V. All rights reserved.
Keywords: Aerodynamic roughness; Boundary layer; Wind erosion; Deflation; Desertification processes
0169-555X/$ - see front matter D 2004 Elsevier B.V. All rights reserved.
doi:10.1016/j.geomorph.2004.03.009
* Corresponding author.

D.J. MacKinnon et al. / Geomorphology 63 (2004) 103–113104
1. Introduction
Surfaces most responsive to wind erosion are
nearly flat, contain loose sand-sized particles, and
lack objects (roughness elements that are non-erodible
by the wind) that would otherwise shelter or cover the
surface. On such surfaces, the threshold wind stress, at
which erosion begins, depends only on the median
diameter of the loose sand-sized particles on the
surface (Greeley and Iversen, 1985). This rather
simple relation becomes far more complex for most
natural surfaces having non-erodible roughness ele-
ments, such as small-scale topographic irregularities,
clasts (rocks greater than 1 mm in diameter), and
plants. In the presence of these roughness elements,
the threshold wind stress can be much greater than
that for a barren surface (Musick et al., 1996). The
quantitative role of these non-erodible elements in
sheltering the surface against wind erosion is the
subject of ongoing research. Relatively recent studies
by Raupach (1992), Raupach et al. (1993), and
Marticorena et al. (1997), in particular, have derived
mathematical expressions for the threshold wind stress
and for the related surface roughness length in terms
of height, width, spacing, and wind-drag properties of
the non-erodible elements. Raupach (1994) proposed
a much more simplified model than Raupach et al.
(1993) for the wind field near the ground in suffi-
ciently dense vegetation. Here the dense sheltering
‘‘displaces’’ the wind field upward to eliminate con-
tact with the ground surface and any subsequent wind
erosion. In this paper, we only consider relatively low
roughness densities, typical of wind erosion areas,
where the wind field reaches the ground and the
partial sheltering effects of vegetation and other forms
of roughness can be described by both Raupach et
al.’s (1993) physical roughness model and Raupach
(1992) and Marticorena et al.’s (1997) model of the
surface roughness length.
The Raupach et al. (1993) algorithm that links the
threshold wind stress to dimensionless surface rough-
ness parameters applies to only a single roughness
species (such as one plant type) residing on a bare
surface. Their algorithm, therefore, is not fully appli-
cable to surfaces that are covered by two or more
different types (species) of roughness, as is common
in many dryland areas susceptible to wind erosion.
The algorithms of Raupach (1992) and Marticorena et
al. (1997) that link the threshold wind stress to the
surface roughness length apply only to a cover of
limited extent.
This paper expands the roughness model of
Raupach et al. (1993) to account for surfaces
covered by many different types of non-erodible
roughness elements, and it modifies an algorithm
parameter of Marticorena et al. (1997) to account
for the high aerodynamically determined roughness
lengths measured at some of our field sites. These
changes are then combined into a new model that
derives the surface roughness length in terms of
the properties of the non-erodible elements. Finally,
the model-derived roughness lengths are compared
to the aerodynamically determined roughness
lengths for 11 field sites in the central Mojave
Desert as a validation test. This new roughness
model will become part of a wind-erosion model
accounting for complex distributions of surface
roughness that may change in response to climate
variability (Lancaster, 1997).
2. Background: roughness models and their role in
wind-erosion models
The new roughness model uses traditional terms to
describe the shear stress (s) imposed by the wind on
the surface in terms of air density (q), wind speed (U),
atmospheric stability, and the momentum roughness
length zom. Within the ‘‘surface sublayer’’ (i.e., the
fully turbulent region within the atmospheric bound-
ary layer (ABL) where turbulence production by wind
shear exceeds that due to buoyancy), the wind stress is
given by
s ¼ qUðzÞ
Fmðzom; zÞ
� �2; ð1Þ
where Fm is the integral momentum function defined
by
Fmðzom; zÞ ¼Z z
zom
/mðzÞkz
dz: ð2Þ
The form of the similarity-based dimensionless
velocity gradient /m depends on atmospheric stability,
D.J. MacKinnon et al. / Geomorphology 63 (2004) 103–113 105
and thus is normally expressed in terms of the
Monin–Obukhov stability parameter f=(z/L),
/mðfÞ ¼1þ bmf ðfz0Þ
ð1� cmfÞ�1=4 ðf < 0Þ
8<: ð3Þ
(Yaglom, 1997); L is the Monin–Obukhov length.
Field experiments provide values for the parameteri-
zation constants. For example, Businger et al. (1971)
found bm = 4.7, cm = 15, and k = 0.35. In terms of the
stability parameter f, Fm can be expressed as
Fmðfom; fÞ ¼1
k
Z f
fom
/mðfÞf
df; ð4Þ
where fom= (zom/L). Substituting the functional form
of /m into Eq. (4), the momentum function becomes
Fmðfom ; fÞ
¼
1
kln
ffom
� �þ bmðf � fomÞ
� �f > 0
1
kln
ffom
� �� �f ¼ 0
1
kln
ffom
� �þ ln
ðw2om þ 1Þðwom þ 1Þ2
ðw2m þ 1Þðwm þ 1Þ2
þ 2½arctanðwmÞ � arctanðwomÞ�" #
f < 0
8>>>>>>>>>><>>>>>>>>>>:
ð5Þ
where wm=(1� cmf)� 1/4 and wom=(1� cmfom)� 1/4.
Returning to Eq. (1), the dependence of the surface
wind stress on the surface roughness (described by
parameter zom, or fom) is embodied in the integral
momentum function Fm. The familiar scaling velocity
u (i.e., ‘‘friction’’ velocity) is given by,
u* ¼ UðzÞFmðzom; zÞ
; ð6Þ
revealing its dependence on the momentum roughness
length zom through Fm. With this definition, the wind
stress can be written simply as s = qu*2.
The above relations are valid for both aerodynam-
ically smooth and aerodynamically rough surfaces.
However, the focus of this paper is on aerodynami-
cally rough surfaces, for which the viscous length
scale (v/u*) is much less than the momentum rough-
ness length, zom. By convention, the momentum
roughness length for rough airflow is also known as
the ‘‘surface roughness length’’, zo.
The roughness length has two roles in wind-erosion
models. First, the threshold wind stress at which eolian
erosion begins depends on zo (e.g., Marticorena et al.,
1997). Second, the free-stream wind field above the
ABL is driven by regional pressure gradients that
evolve over time by well-known atmospheric equa-
tions of motion. Within the ABL, the wind field is a
result of the complex transfer of free-stream wind
momentum downward to overcome the drag caused
by the non-erodible roughness elements, and depends
on regional atmospheric dynamics, atmospheric sta-
bility, topography at local and regional scales, and on
the surface roughness length zo (Grell et al., 1995).
Thus, the roughness length has an important feedback
on the wind field and associated surface stress. This
feedback is important, because wind-erosion rates
depend on the amount that the wind stress exceeds
the threshold value at which erosion occurs (Gillette,
1988). Therefore, roughness models play a critical
dual role in wind-erosion modeling by affecting both
the shear stress imposed by the wind on the surface as
well as the threshold stress at which erosion initiates.
2.1. Aerodynamically derived surface roughness
length, zoA
The traditional method for calculating the aerody-
namically derived roughness length zoA is based on
wind-speed measurements during thermally neutral
atmospheric conditions, f = 0 (Brutsaert, 1982). Super-scripts A and M are used here to distinguish aerody-
namically derived andmodel-derived values for zo. The
aerodynamic roughness zoA is obtained from a least-
squares fit to the wind-speed measurements made
simultaneously at three or more heights within the
dynamic portion of the surface sublayer where winds
generally maintain a logarithmic profile; zoA is defined
to be the height above the surface at which the wind
speed would drop to zero if the logarithmic profile is
extrapolated down into the interfacial sublayer. Under
thermally neutral conditions, the roughness length is
also a characteristic measure of the drag on the wind
field caused by non-erodible roughness elements: zoA
increases in proportion to the size, spacing, and drag
properties of these elements. Many researchers have
used the aerodynamically derived roughness length to
characterize the excess momentum extracted from the
wind field by upwind roughness elements (e.g., Brut-
saert, 1982; Lee, 1990; Wolfe, 1993; Wolfe and Nick-
ling, 1996).

D.J. MacKinnon et al. / Geomorphology 63 (2004) 103–113106
The aerodynamically derived roughness length
may not be a reliable measure of the effects of surface
roughness under all conditions. In some field experi-
ments, winds are suddenly displaced upward (dis-
placement height) in a manner that may not be
explained by roughness length alone (Brutsaert,
1982; Lee, 1990). In such cases, typically character-
ized by dense stands of vegetation, the wind stress no
longer reaches the surface. Therefore, the use of a
surface roughness length as a measure of the drag
imposed by the surface roughness elements becomes
invalid.
Within the porous canopies typical of desert flora,
Wolfe (1993) found, however, that wind passes
through all roughness elements and may contact the
surface. Because the bare surface still extracts mo-
mentum in an environment covered by porous rough-
ness elements, the surface roughness length can
increase to very large values before all wind stress
is prevented from affecting the bare surface. At high
roughness densities for porous roughness elements,
the wind profile does not show an abrupt displace-
ment upward. Wind data collected by Lee (1990) in
deserts with porous vegetation were re-evaluated by
Wolfe (1993) to show that the data better fit a wind-
profile model without a zero-plane displacement
height and with rather large roughness lengths (as
much as 3.8 cm). Wolfe (1993) aerodynamically
derived values of roughness length substantially ex-
ceed the largest values (0.6 cm) reported by Marti-
corena et al. (1997). Wolfe’s results are consistent
with the largest roughness lengths (as much as 7.1
cm) measured at some of the sites reported in this
paper.
2.2. Model-derived roughness length, zoM
A useful concept in modeling surface roughness
lengths is the ‘‘efficient friction velocity ratio’’, feff,
defined by Marticorena et al. (1997) as the ratio of the
threshold friction velocity of a bare surface u*ts to the
threshold friction velocity of a surface covered by
non-erodible roughness elements, u*t. Marticorena et
al. (1997) showed that feff[u (u*ts/u*t)] depends pri-
marily on the amount that the roughness length zoM for
a covered surface exceeds the roughness length of a
bare surface zosM. In this way, sheltering of a surface
(expressed as a ratio of threshold friction velocities)
can be expressed in terms of covered- and barren-
surface roughness lengths, feffu feff(zoM, zos
M).
Marticorena et al. (1997) also showed that their
efficient friction velocity ratio feff is equivalent to the
‘‘friction velocity ratio’’ Rtu (u*ts/u*t) defined by
Raupach et al. (1993). This is an important relation,
because Raupach et al. (1993) derived Rt in terms of
measurable height, width, separation, and drag-coef-
ficient parameters for a single species of roughness
elements on a bare surface. The equivalence of feff and
Rt provides a connection between the measurable
roughness quantities and zoM.
3. Modification and linking of roughness models:
theory and methods
The approach in this paper makes use of the
algorithms of Raupach (1992), Raupach et al.
(1993) and Marticorena et al. (1997) to determine
model-derived values of the surface roughness length
zoM in terms of the properties of the roughness
elements. By modifying the algorithm of Raupach
et al. (1993), we are able to consider surfaces con-
sisting of multiple species of roughness elements.
Roughness features are assigned to a particular spe-
cies or group based on similarities in mean height,
width, mutual separation, and drag coefficient. Differ-
ences between species reflect different plant types or
different surface components (e.g., clasts or dirt
mounds).
We also modify a parameter in Marticorena et al.
(1997; Eq. (9), p. 23280) feff algorithm to accommo-
date evidence for high roughness length values in
porous vegetation (Wolfe, 1993; this study).
3.1. Stress partitioning among multiple roughness
species
Stress partitioning on one species of many indi-
vidual roughness elements lying on a bare surface,
developed by Raupach et al. (1993), was expanded
to incorporate stress partitioning among multiple
species of many, individual roughness elements.
The first aspect of the expansion involves the total
wind stress st imposed on the surface, which we
consider to be a sum of the wind stress experienced
by each roughness species above the surface (sR1,

D.J. MacKinnon et al. / Geomorphology 63 (2004) 103–113 107
sR2, . . ., sRn) plus the stress experienced by the
surface itself ss,
st ¼ ss þXni¼1
sRi: ð7Þ
The surface stress ss is related to the stress on the
bare (exposed) surface ssV by,
ss ¼ 1�Xni¼1
riki
!ssV ð8Þ
where riki is the fraction of basal area covered by
species i; the dimensionless roughness parameters r,k, b are formally defined in the next section. The ratio
of the shear-stress on an individual roughness species
to the total shearing stress for n roughness species
(derived by analogy to Eq. (7) of Raupach et al.,
1993, p. 3025) is
sRist
¼ biki
1þXni¼1
biki
0BBB@
1CCCA; ð9Þ
where biki is the total non-dimensional shear stress on
species i per unit surface area. The ‘‘1’’ in the
denominator on the right-hand side of Eq. (9) results
from the ratio of the total non-dimensional shearing
stress on the surface (considered similar to a species
of roughness) per unit surface area being equal to 1.
Denoting the threshold friction velocity of a bare
surface by u*tsV , we define Rtu (u*tsV /ut), or equivalent-
ly Rt ¼ffiffiffiffiffiffiffiffiffiffiffissV=st
psince u* = s/q. Utilizing Eqs. (7)–(9),
Rt can be expressed in terms of the roughness param-
eters ri, ki, bi for the n species,
Rt¼ 1�Xni¼1
miriki
!1Xni¼1
mibiki
!" #�1=2
: ð10Þ
An additional parameter mi is included to account
for the non-uniformity of surface wind stress around
the roughness elements species. Eq. (10) reduces to Eq.
(11) below of Raupach et al. (1993, p. 3025) when there
is only one roughness species (i) on the bare surface.
Ri ¼ ½ð1� mirikiÞð1þ mibikiÞ��1=2: ð11Þ
Eq. 10 can be rewritten in terms of Eq. (11) by first
inverting and squaring Eq. (10) and second by noting
that for most common situations mirikib1 in Eq. (11)
and more generallyPn
i¼1 mirikib 1 in Eq. (10). The
latter follows becausePn
i¼1 riki (Eq. (6)), the fractionof surface area covered by all roughness species, is
typically much less than one for stress partitioning to
apply. Setting mirikic 0, expanding the r.h.s. of Eq.
(10) and collecting terms similar to Eq. (11) yields
1
R2t
cXni¼1
1
R2i
� ðn� 1Þ ð12Þ
This approximation is useful for assessing the
contribution of each roughness species to the total
threshold friction velocity ratio Rt. (By expanding all
terms in Eq. (10), it can be shown that Eq. (12)
remains valid under the less restrictive conditions of
mirikib1 instead ofPn
i¼1mirikib1.
3.2. Parameterization of expanded theory for appli-
cation to field data
In order to use Eqs. (10) and (11) to model the
roughness length zo, we must define the roughness-
element parameters r, k, b, and m for each species in
terms of the roughness-element height h, width w,
mutual separation D between roughness elements of
the same species, and the drag coefficient Cd, and then
establish an equation that relates Rt to zoM (the modeled
roughness length). Following Raupach et al. (1993),
the dimensionless roughness parameters for the ith
species are:
riubasal area
frontal area
� �i
¼ wi1wi2
wihið13Þ
kiufrontal area
associated ground area
� �i
¼ pwihi
4D2i
; and ð14Þ
biuCdi
Cds
; ð15Þ
where wi1 and wi2 are two orthogonal width measure-
ments across a roughness element, wi is the average of
these two widths, and Cdsis the drag coefficient for a
bare surface. Raupach (1992) and Raupach et al.
D.J. MacKinnon et al. / Geomorphology 63 (2004) 103–113108
(1993) found Cdsto be between 0.0018 and 0.003 in
their study. However, we use Cds, which is consistent
with the field data of Wyatt and Nickling (1997) and
bounded by the former results. Finally,
0:16VmV1:0; ð16Þ
where m is near 1.0 for solid objects and decreases as
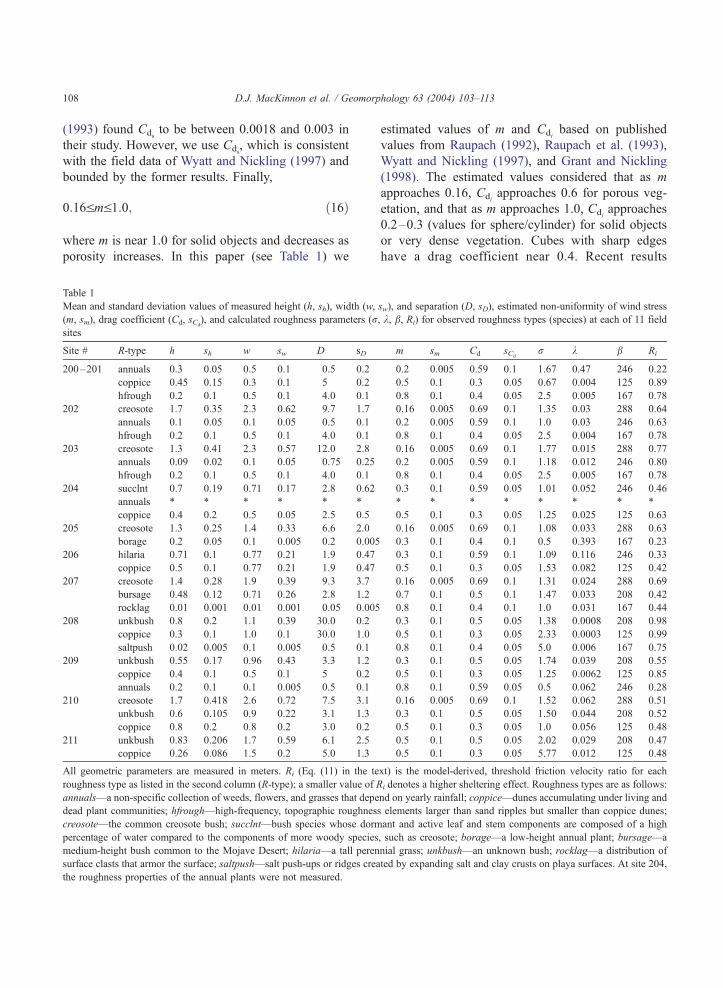
porosity increases. In this paper (see Table 1) we
Table 1
Mean and standard deviation values of measured height (h, sh), width (w,
(m, sm), drag coefficient (Cd, sCd), and calculated roughness parameters (r
sites
Site # R-type h sh w sw D sD
200–201 annuals 0.3 0.05 0.5 0.1 0.5 0.2
coppice 0.45 0.15 0.3 0.1 5 0.2
hfrough 0.2 0.1 0.5 0.1 4.0 0.1
202 creosote 1.7 0.35 2.3 0.62 9.7 1.7
annuals 0.1 0.05 0.1 0.05 0.5 0.1
hfrough 0.2 0.1 0.5 0.1 4.0 0.1
203 creosote 1.3 0.41 2.3 0.57 12.0 2.8
annuals 0.09 0.02 0.1 0.05 0.75 0.25
hfrough 0.2 0.1 0.5 0.1 4.0 0.1
204 succlnt 0.7 0.19 0.71 0.17 2.8 0.62
annuals * * * * * *
coppice 0.4 0.2 0.5 0.05 2.5 0.5
205 creosote 1.3 0.25 1.4 0.33 6.6 2.0
borage 0.2 0.05 0.1 0.005 0.2 0.005
206 hilaria 0.71 0.1 0.77 0.21 1.9 0.47
coppice 0.5 0.1 0.77 0.21 1.9 0.47
207 creosote 1.4 0.28 1.9 0.39 9.3 3.7
bursage 0.48 0.12 0.71 0.26 2.8 1.2
rocklag 0.01 0.001 0.01 0.001 0.05 0.005
208 unkbush 0.8 0.2 1.1 0.39 30.0 0.2
coppice 0.3 0.1 1.0 0.1 30.0 1.0
saltpush 0.02 0.005 0.1 0.005 0.5 0.1
209 unkbush 0.55 0.17 0.96 0.43 3.3 1.2
coppice 0.4 0.1 0.5 0.1 5 0.2
annuals 0.2 0.1 0.1 0.005 0.5 0.1
210 creosote 1.7 0.418 2.6 0.72 7.5 3.1
unkbush 0.6 0.105 0.9 0.22 3.1 1.3
coppice 0.8 0.2 0.8 0.2 3.0 0.2
211 unkbush 0.83 0.206 1.7 0.59 6.1 2.5
coppice 0.26 0.086 1.5 0.2 5.0 1.3
All geometric parameters are measured in meters. Ri (Eq. (11) in the te
roughness type as listed in the second column (R-type); a smaller value of R
annuals—a non-specific collection of weeds, flowers, and grasses that depe
dead plant communities; hfrough—high-frequency, topographic roughnes
creosote—the common creosote bush; succlnt—bush species whose dorm
percentage of water compared to the components of more woody species
medium-height bush common to the Mojave Desert; hilaria—a tall peren
surface clasts that armor the surface; saltpush—salt push-ups or ridges crea
the roughness properties of the annual plants were not measured.
estimated values of m and Cdibased on published
values from Raupach (1992), Raupach et al. (1993),
Wyatt and Nickling (1997), and Grant and Nickling
(1998). The estimated values considered that as m
approaches 0.16, Cdiapproaches 0.6 for porous veg-
etation, and that as m approaches 1.0, Cdiapproaches
0.2–0.3 (values for sphere/cylinder) for solid objects
or very dense vegetation. Cubes with sharp edges
have a drag coefficient near 0.4. Recent results
sw), and separation (D, sD), estimated non-uniformity of wind stress
, k, b, Ri) for observed roughness types (species) at each of 11 field
m sm Cd sCdr k b Ri
0.2 0.005 0.59 0.1 1.67 0.47 246 0.22
0.5 0.1 0.3 0.05 0.67 0.004 125 0.89
0.8 0.1 0.4 0.05 2.5 0.005 167 0.78
0.16 0.005 0.69 0.1 1.35 0.03 288 0.64
0.2 0.005 0.59 0.1 1.0 0.03 246 0.63
0.8 0.1 0.4 0.05 2.5 0.004 167 0.78
0.16 0.005 0.69 0.1 1.77 0.015 288 0.77
0.2 0.005 0.59 0.1 1.18 0.012 246 0.80
0.8 0.1 0.4 0.05 2.5 0.005 167 0.78
0.3 0.1 0.59 0.05 1.01 0.052 246 0.46
* * * * * * * *
0.5 0.1 0.3 0.05 1.25 0.025 125 0.63
0.16 0.005 0.69 0.1 1.08 0.033 288 0.63
0.3 0.1 0.4 0.1 0.5 0.393 167 0.23
0.3 0.1 0.59 0.1 1.09 0.116 246 0.33
0.5 0.1 0.3 0.05 1.53 0.082 125 0.42
0.16 0.005 0.69 0.1 1.31 0.024 288 0.69
0.7 0.1 0.5 0.1 1.47 0.033 208 0.42
0.8 0.1 0.4 0.1 1.0 0.031 167 0.44
0.3 0.1 0.5 0.05 1.38 0.0008 208 0.98
0.5 0.1 0.3 0.05 2.33 0.0003 125 0.99
0.8 0.1 0.4 0.05 5.0 0.006 167 0.75
0.3 0.1 0.5 0.05 1.74 0.039 208 0.55
0.5 0.1 0.3 0.05 1.25 0.0062 125 0.85
0.8 0.1 0.59 0.05 0.5 0.062 246 0.28
0.16 0.005 0.69 0.1 1.52 0.062 288 0.51
0.3 0.1 0.5 0.05 1.50 0.044 208 0.52
0.5 0.1 0.3 0.05 1.0 0.056 125 0.48
0.5 0.1 0.5 0.05 2.02 0.029 208 0.47
0.5 0.1 0.3 0.05 5.77 0.012 125 0.48
xt) is the model-derived, threshold friction velocity ratio for each
i denotes a higher sheltering effect. Roughness types are as follows:
nd on yearly rainfall; coppice—dunes accumulating under living and
s elements larger than sand ripples but smaller than coppice dunes;
ant and active leaf and stem components are composed of a high
, such as creosote; borage—a low-height annual plant; bursage—a
nial grass; unkbush—an unknown bush; rocklag—a distribution of
ted by expanding salt and clay crusts on playa surfaces. At site 204,

D.J. MacKinnon et al. / Geomorphology 63 (2004) 103–113 109
(Crawley and Nickling, 2003) derived values of m for
regularly arrayed solid roughness elements between
0.53 and 0.58 which are consistent with those used in
our estimation scheme.
Using Eqs. (5) and (6) for neutral atmospheric
thermal conditions (f = 0), the result is the well-knowninertial-sublayer logarithmic law, which describes the
wind profile at height (z = h) equal to the tallest
roughness element according to
UðhÞu*
¼ Fmðzom; hÞ ¼1
kln
h
zMo
� �; ð17Þ
where zom = zoM (for notation consistency with Marti-
corena et al., 1997) is the modeled momentum rough-
ness length for a bare surface covered with roughness
elements. Eq. (17) is similar to Raupach (1992; 1994)
with the additional assumptions that there is no
displacement height in the wind profile (d = 0 in
Raupach, 1992, Eq. (27); 1994, Eq. (4)) and that there
is no variation in the form of the logarithmic law just
above the inertial sublayer at height h of the tallest
roughness species (wh = 0 in Raupach, 1992, Eq. (27);
1994, Eq. (4)). The former condition appears valid for
sparsely leafed desert vegetation (Wolfe, 1993), and
the latter condition may also be valid because the
sparse vegetation diffuses the momentum deficit grad-
ually through the canopy and does not create sharp
wake boundaries.
Raupach (1992, Eq. (27); 1994, Eq. (4)) showed
that the left-hand side of our Eq. (17) can be written in
terms of the total stress, which is our Eq. (7), without
strong mutual sheltering among the roughness ele-
ments, as
UðhÞu*
¼ 1
C1=2ds
1þXni¼1
mibiki
!1=2c
Rt
C1=2ds
ð18Þ
where the right-hand side of Eq. (18) follows from our
Eqs. (10) and (11) with the condition that for our
data (see Table 1)Pn
i¼1mirikib1. Noting that, as
ki! 0, the surface becomes bare of roughness ele-
ments, so that zoM! zos
M in our Eq. (17) and noting
that, as Rt! 1, so that u*! u*s in our Eq. (18).
Combining these changes, Eq. (17) can be rewritten
as,
Rtuu*tsV
u*t
� �¼
u*su*
� �¼ 1� ln
zMozMos
� �=ln
h
zMos
� �� �: ð19Þ
Marticorena et al. (1997) developed a relation
similar to our Eq. (19) but argued for another
length-scale dependency. Field tests of threshold
wind speeds on soils devoid of plants and other
large-scale roughness elements illustrate the impor-
tance of small-scale topographic irregularities and
particles on the surface, either as aggregates of soil
particles or rock fragments as large as gravel
(Marticorena et al., 1997). The irregularities and
particles shelter the surface against wind erosion,
creating a large increase in threshold friction veloc-
ity as the surface roughness increases. Based on
wind-profile matching arguments between and
above the largest roughness elements, Marticorena
et al. (1997) propose that the ratio of the bare-
surface friction velocity to the total friction velocity
is,
feffuu*su*
� �¼ 1� ln
zMozMos
� �=ln a
x
zMos
� �p� �� �: ð20Þ
This relation assumes that a logarithmic wind
profile develops between roughness elements that
are not too closely spaced. Both field experiments
and wind tunnel measurements indicate ac 0.35 and
pc 0.8 for a wide range of surface roughness con-
ditions. Marticorena et al. (1997) suggested that the
validity of Eq. (17) is probably limited to roughness
densities k < 0.05 (Arya, 1975).
Marticorena et al. (1997) found that the effective
friction velocity ratio feff is insensitive to the param-
eter x (roughness factor) in Eq. (20). At least for
their study area (Chihauhaun Desert, southwestern
USA), the best agreement with their data occurs
with x = 10 cm. Eq. (20) is plotted for this value of x
(solid curve) in Fig. 1 along with measurements (+)
by Marticorena et al. (1997). The plots show that,
for the same roughness length zoM, surfaces of clay
or biologic crusts have much higher threshold fric-
tion velocities than surfaces of loose or disrupted
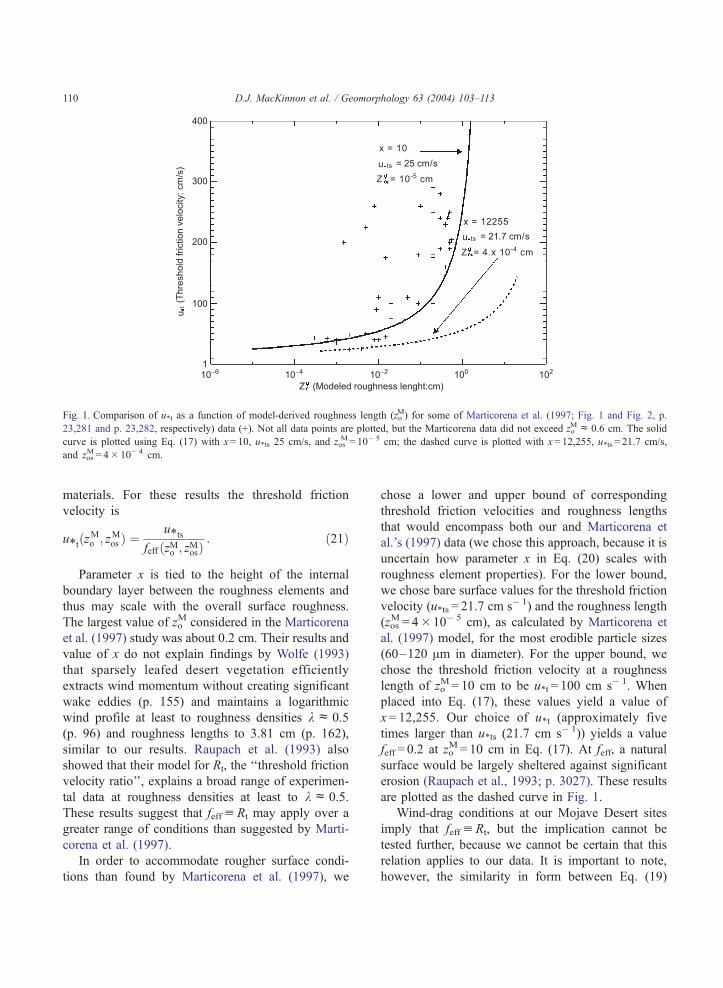
Fig. 1. Comparison of u*t as a function of model-derived roughness length (zoM) for some of Marticorena et al. (1997; Fig. 1 and Fig. 2, p.
23,281 and p. 23,282, respectively) data (+). Not all data points are plotted, but the Marticorena data did not exceed zoMc 0.6 cm. The solid
curve is plotted using Eq. (17) with x= 10, u*ts 25 cm/s, and zosM = 10� 5 cm; the dashed curve is plotted with x= 12,255, u*ts = 21.7 cm/s,
and zosM = 4 10� 4 cm.
D.J. MacKinnon et al. / Geomorphology 63 (2004) 103–113110
materials. For these results the threshold friction
velocity is
u*tðzMo ; zMos Þ ¼
u*tsfeff ðzMo ; zMosÞ
: ð21Þ
Parameter x is tied to the height of the internal
boundary layer between the roughness elements and
thus may scale with the overall surface roughness.
The largest value of zoM considered in the Marticorena
et al. (1997) study was about 0.2 cm. Their results and
value of x do not explain findings by Wolfe (1993)
that sparsely leafed desert vegetation efficiently
extracts wind momentum without creating significant
wake eddies (p. 155) and maintains a logarithmic
wind profile at least to roughness densities kc 0.5
(p. 96) and roughness lengths to 3.81 cm (p. 162),
similar to our results. Raupach et al. (1993) also
showed that their model for Rt, the ‘‘threshold friction
velocity ratio’’, explains a broad range of experimen-
tal data at roughness densities at least to kc 0.5.
These results suggest that feffuRt may apply over a
greater range of conditions than suggested by Marti-
corena et al. (1997).
In order to accommodate rougher surface condi-
tions than found by Marticorena et al. (1997), we
chose a lower and upper bound of corresponding
threshold friction velocities and roughness lengths
that would encompass both our and Marticorena et
al.’s (1997) data (we chose this approach, because it is
uncertain how parameter x in Eq. (20) scales with
roughness element properties). For the lower bound,
we chose bare surface values for the threshold friction
velocity (u*ts = 21.7 cm s� 1) and the roughness length
(zosM = 4 10� 5 cm), as calculated by Marticorena et
al. (1997) model, for the most erodible particle sizes
(60–120 Am in diameter). For the upper bound, we
chose the threshold friction velocity at a roughness
length of zoM = 10 cm to be u*t = 100 cm s� 1. When
placed into Eq. (17), these values yield a value of
x = 12,255. Our choice of u*t (approximately five
times larger than u*ts (21.7 cm s� 1)) yields a value
feff = 0.2 at zoM = 10 cm in Eq. (17). At feff, a natural
surface would be largely sheltered against significant
erosion (Raupach et al., 1993; p. 3027). These results
are plotted as the dashed curve in Fig. 1.
Wind-drag conditions at our Mojave Desert sites
imply that feffuRt, but the implication cannot be
tested further, because we cannot be certain that this
relation applies to our data. It is important to note,
however, the similarity in form between Eq. (19)
D.J. MacKinnon et al. / Geomorphology 63 (2004) 103–113 111
(Raupach, 1992) and Eq. (20) (Marticorena et al.,
1997) also lends support to the implication that
feffuRt.
4. Discussion and conclusions
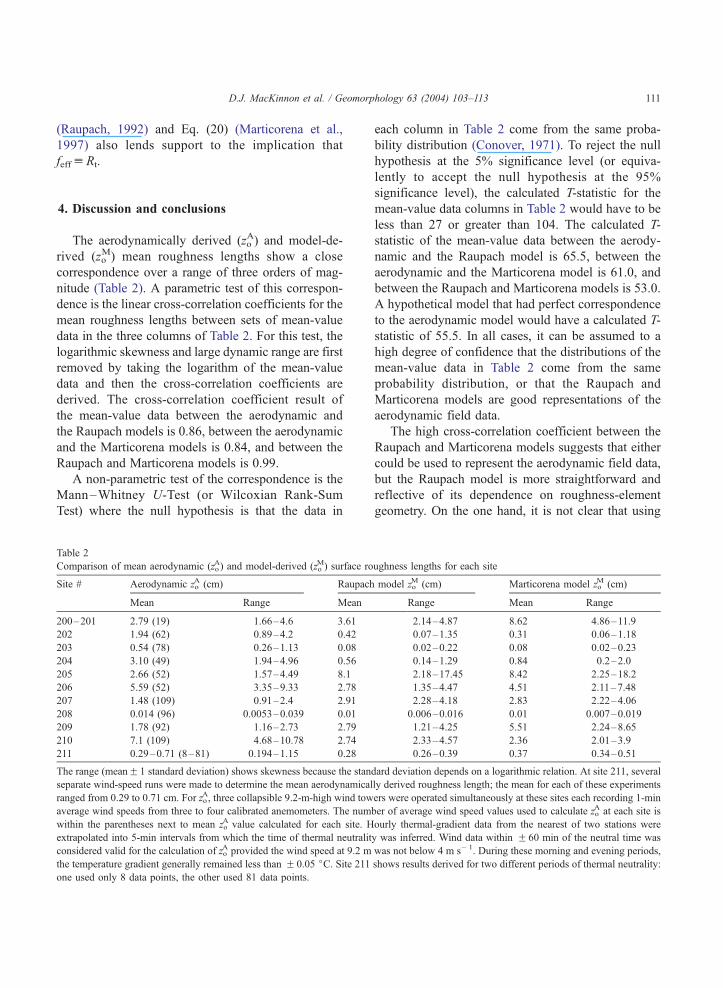
The aerodynamically derived (zoA) and model-de-
rived (zoM) mean roughness lengths show a close
correspondence over a range of three orders of mag-
nitude (Table 2). A parametric test of this correspon-
dence is the linear cross-correlation coefficients for the
mean roughness lengths between sets of mean-value
data in the three columns of Table 2. For this test, the
logarithmic skewness and large dynamic range are first
removed by taking the logarithm of the mean-value
data and then the cross-correlation coefficients are
derived. The cross-correlation coefficient result of
the mean-value data between the aerodynamic and
the Raupach models is 0.86, between the aerodynamic
and the Marticorena models is 0.84, and between the
Raupach and Marticorena models is 0.99.
A non-parametric test of the correspondence is the
Mann–Whitney U-Test (or Wilcoxian Rank-Sum
Test) where the null hypothesis is that the data in
Table 2
Comparison of mean aerodynamic (zoA) and model-derived (zo
M) surface ro
Site # Aerodynamic zoA (cm) Raupach
Mean Range Mean
200–201 2.79 (19) 1.66–4.6 3.61
202 1.94 (62) 0.89–4.2 0.42
203 0.54 (78) 0.26–1.13 0.08
204 3.10 (49) 1.94–4.96 0.56
205 2.66 (52) 1.57–4.49 8.1
206 5.59 (52) 3.35–9.33 2.78
207 1.48 (109) 0.91–2.4 2.91
208 0.014 (96) 0.0053–0.039 0.01
209 1.78 (92) 1.16–2.73 2.79
210 7.1 (109) 4.68–10.78 2.74
211 0.29–0.71 (8–81) 0.194–1.15 0.28
The range (meanF 1 standard deviation) shows skewness because the stand
separate wind-speed runs were made to determine the mean aerodynamical
ranged from 0.29 to 0.71 cm. For zoA, three collapsible 9.2-m-high wind tow
average wind speeds from three to four calibrated anemometers. The num
within the parentheses next to mean zoA value calculated for each site. H
extrapolated into 5-min intervals from which the time of thermal neutralit
considered valid for the calculation of zoA provided the wind speed at 9.2 m
the temperature gradient generally remained less than F 0.05 jC. Site 211one used only 8 data points, the other used 81 data points.
each column in Table 2 come from the same proba-
bility distribution (Conover, 1971). To reject the null
hypothesis at the 5% significance level (or equiva-
lently to accept the null hypothesis at the 95%
significance level), the calculated T-statistic for the
mean-value data columns in Table 2 would have to be
less than 27 or greater than 104. The calculated T-
statistic of the mean-value data between the aerody-
namic and the Raupach model is 65.5, between the
aerodynamic and the Marticorena model is 61.0, and
between the Raupach and Marticorena models is 53.0.
A hypothetical model that had perfect correspondence
to the aerodynamic model would have a calculated T-
statistic of 55.5. In all cases, it can be assumed to a
high degree of confidence that the distributions of the
mean-value data in Table 2 come from the same
probability distribution, or that the Raupach and
Marticorena models are good representations of the
aerodynamic field data.
The high cross-correlation coefficient between the
Raupach and Marticorena models suggests that either
could be used to represent the aerodynamic field data,
but the Raupach model is more straightforward and
reflective of its dependence on roughness-element
geometry. On the one hand, it is not clear that using
ughness lengths for each site
model zoM (cm) Marticorena model zo
M (cm)
Range Mean Range
2.14–4.87 8.62 4.86–11.9
0.07–1.35 0.31 0.06–1.18
0.02–0.22 0.08 0.02–0.23
0.14–1.29 0.84 0.2–2.0
2.18–17.45 8.42 2.25–18.2
1.35–4.47 4.51 2.11–7.48
2.28–4.18 2.83 2.22–4.06
0.006–0.016 0.01 0.007–0.019
1.21–4.25 5.51 2.24–8.65
2.33–4.57 2.36 2.01–3.9
0.26–0.39 0.37 0.34–0.51
ard deviation depends on a logarithmic relation. At site 211, several
ly derived roughness length; the mean for each of these experiments
ers were operated simultaneously at these sites each recording 1-min
ber of average wind speed values used to calculate zoA at each site is
ourly thermal-gradient data from the nearest of two stations were
y was inferred. Wind data within F 60 min of the neutral time was
was not below 4 m s� 1. During these morning and evening periods,
shows results derived for two different periods of thermal neutrality:

D.J. MacKinnon et al. / Geomorphology 63 (2004) 103–113112
the height of the tallest roughness element in the
Raupach model is always the best choice when
multiple roughness elements of different heights are
present. On the other hand, multiple roughness ele-
ments could be considered as one composite element
whose height is equal to the tallest element.
The greatest disparities in the comparison of the
aerodynamic and modeled roughness lengths may be
attributed to: (1) local inhomogeneities in the wind
field and errors in uniform instrument response, (2)
inadequate documentation of the physical dimensions
and distributions of non-erodible roughness elements,
(3) inadequate estimates of drag coefficients and wind-
stress non-uniformity, and (4) inadequacies in the
roughness-length models. More work needs to be done
to test the functional form of the friction velocity ratio
model as described by Eqs. (10) and (11) and the
roughness length models as described by Eqs. (19) and
(20); a much better method is needed to determine the
roughness parameters associated with porous objects.
An important result is that the individual threshold
friction velocity ratios (Ri) for sites characterized by
annual plants and grasses (sites 200–201, 202, 203,
209; Table 1) and the low-height ‘‘borage’’ (site 205)
generally show values equal to or less than the values
for the other sites. At site 204, the modeled roughness
lengths were much lower than the aerodynamically
measured roughness length, possibly because the
roughness properties of annual plants there were not
measured and included in the models.
Where present, therefore, the annual plants appear
to play a major role in sheltering ground surfaces
relative to the other species at a site. The presence or
absence of the annual vegetation produces large
variations in the model-derived sheltering. For exam-
ple, removing the roughness contribution of the annu-
als from site 200 to site 201 diminishes the model-
derived roughness length from approximately 6 cm
(Table 2) to 5.2 10� 4 cm. The latter roughness
length is only slightly higher than those of the bare
surfaces (110� 5 cm) described by Marticorena et
al. (1997) or used in this paper (4 10� 4 cm). In
terms of the threshold friction velocity, the annual
plants produce a value 4.3 times higher than that
produced by the bare surface, whereas the threshold
friction velocity with the annual plants removed is
only 1.4 times higher than the friction velocity of the
bare surface. Such variability in the leafy vegetation
of a species suggests that any measurements or
estimates of roughness must account for all the
roughness elements and the drag properties of each
species present. Our models show this dramatic de-
pendency in sheltering (magnitude of zo) through the
drag coefficient ratio, b. As an example, relatively
minor leaf drop or breaking of stems following a
period of drought dramatically increase the vulnera-
bility of surfaces to wind erosion. Two related param-
eters, m (non-uniformity factor of wind stress) and Cd
(drag coefficient of roughness species) in Raupach et
al. (1993) basic model and in our extended model
need a more physically based connection to rough-
ness-element parameters than has been developed.
The importance of annual plants and of related
interannual climatic variability is underscored by mon-
itoring observations in the study area. We have mon-
itored this area since autumn 1999 for sand movement,
dust emission, meteorological phenomena, and vege-
tation change. Densest and highest vegetation charac-
terized the area during spring 2001 compared to the
preceding and following spring seasons. The extent of
vegetation was closely related to rainfall during the
prior 3-month periods. The January–February–March
precipitation for 2001 was about 75 mm, in contrast to
20 mm for this period in 2000 and 6 mm in 2002.
Analyses of wind speed and associated sand-flux data
acquired from two permanent stations near our zo-
measurement sites show higher values of sand flux
during spring 2000 than spring 2001 for similar
forcing wind speeds. This relation indicates that the
surface had a lower threshold friction velocity during
spring 2000 than it did during spring 2001. The
observed increase in plant cover, including annual
vegetation, in the study area over this period is
consistent with the observed changes in sand flux at
the two monitoring stations. Relations among wind,
dust emission, annual vegetation, and antecedent pre-
cipitation in the Sonoran Desert similarly show that
antecedent precipitation induced germination and sub-
sequent growth of annual plants that sheltered the
surface during windstorms (MacKinnon et al., 1990).
Because zo shows such a sensitive response to
measured roughness geometry and drag coefficients,
it would be useful to make more accurate field
measurements of these properties employing some
other method than measuring rods and tapes, such
as automatically extracted parameters from remotely
D.J. MacKinnon et al. / Geomorphology 63 (2004) 103–113 113
sensed image data. For example, 20 cm (spatial
resolution in width), stereo, color–infrared image data
recently acquired for the Mojave study sites can
resolve the width (w), height (h), and separation (D)
parameters for bushes larger than a few tens of
centimeters. Radar can also be used to obtain small-
scale topographic roughness, such as coppice dunes,
salt pushups, and surface clasts. The roughness prop-
erties of small annual plants are the most difficult to
obtain directly by remote-sensing data, but change-
detection methods using Landsat image data are
capable of showing an integrated ‘‘greening’’ from
these plants between dry and wet periods and thus
give some indication of the presence, absence, and
density of vegetation change. Airborne LIDAR may
also be used to determine the heights and cover
density of annual vegetation when the vegetation is
relatively dense and can be distinguished from the
ground. Remote-sensing methods may thus provide
the means to obtain accurate and statistically signifi-
cant measurements of surface roughness for environ-
ments that vary spatially and temporally.
Acknowledgements
We are grateful to two anonymous reviewers for
their comments that greatly improved the manuscript.
Frank Urban supplied meteorological data from the
study area.
We are grateful to Rob Fulton (California Desert
Studies Consortium, California State University at
Fullerton) for logistical help. This work was supported
by the Earth Surface Dynamics Program of the U.S.
Geological Survey.
References
Arya, S.P.S., 1975. A drag partition theory for determining the
large-scale roughness parameter and wind stress on Arctic pack
ice. J. Geophys. Res. 80, 3447–3454.
Brutsaert, W., 1982. Evaporation into the Atmosphere: Theory, His-
tory, and Applications. D. Reidel Publishing, Boston. 299 pp.
Businger, J.A., Wyngaard, J.C., Izumi, Y., Bradley, E.F., 1971.
Flux-profile relationships in the atmospheric surface layer.
J. Atmos. Sci. 28, 181–189.
Conover, W.J., 1971. Practical Nonparametric Statistics. Wiley,
New York. 462 pp.
Crawley, D.M., Nickling, W.G., 2003. Drag partition for regu-
larly arrayed rough surfaces. Boundary-Layer Meteorol. 107,
445–468.
Gillette, D.A., 1988. Threshold friction velocities for dust produc-
tion for agricultural soils. J. Geophys. Res. 93, 12645–12662.
Grant, P.F., Nickling, W.G., 1998. Direct field measurement of wind
drag on vegetation for applications to windbreak design and
modeling. Land Degrad. Dev. 9, 57–66.
Greeley, R., Iversen, J.D., 1985. Wind as a Geologic Process on
Earth, Mars, Venus and Titan. Cambridge Univ. Press, New
York. 333 pp.
Grell, G.A., Dudhia, J., Stauffer, D.R., 1995. A description of the
fifth-generation Penn State/NCAR mesoscale model (MM5),
NCAR Technical Note NCAR/TN-398 + STR. 122 pp.
Lancaster, N., 1997. Response of aeolian geomorphic systems to
minor climate change: examples from the southern California
deserts. Geomorphology 19, 333–347.
Lee, J.A., 1990. The effect of desert shrubs on shear stress from the
wind: an exploratory study. Unpublished PhD Thesis. Depart-
ment of Geography, Arizona State University. 181 pp.
MacKinnon, D.J., Elder, D.F., Helm, P.J., Tuesink, M.F., Nist, C.A.,
1990. A method of evaluating effects of antecedent precipitation
on dust storms and its application to Yuma, Arizona, 1981–
1988. Clim. Change 17, 331–360.
Marticorena, B., Bergametti, G., Gillette, D., Belnap, J., 1997.
Factors controlling threshold friction velocity in semiarid and
arid areas of the United States. J. Geophys. Res. 102 (D19),
23277–23287.
Musick, H.B., Trujillo, S.M., Truman, C.R., 1996. Wind-tunnel
modeling of the influence of vegetation structure on the saltation
threshold. Earth Surf. Processes Landf. 21, 589–605.
Raupach, M.R., 1992. Drag and drag partition on rough surfaces.
Boundary-Layer Meteorol. 71, 211–216.
Raupach, M.R., Gillette, D.A., Leys, J.F., 1993. The effect of
roughness elements on wind erosion threshold. J. Geophys.
Res. 98 (D2), 3023–3029.
Raupach, M.R., 1994. Simplified expressions for vegetation
roughness length and zero-plane displacement as functions of
canopy height and area index. Boundary-Layer Meteorol. 71,
211–216.
Wolfe, S.A., 1993. Sparse vegetation as a surface control on wind
erosion. PhD Dissertation, University of Guelph. 257 pp.
Wolfe, S.A., Nickling, W.G., 1996. Shear stress partitioning in
sparsely vegetated desert canopies. Earth Surf. Processes Landf.
21, 607–619.
Wyatt, V.E., Nickling, W.G., 1997. Drag and shear stress partition-
ing in sparse desert creosote communities. Can. J. Earth Sci. 34,
1486–1498.
Yaglom, A.M., 1997. Comments on wind and temperature flux-
profile relationships. Boundary-Layer Meteorol. 11, 89–102.