COMPARISON ECONOMIC BETWEEN U.S AND INDIA
21
កលវ ិ ាល័យប ា រកព ុ PAÑÑĀSĀSTRA UNIVERSITY OF CAMBODIA ECONOMIC COMPARISION BETWEEN U.S AND INDIA NOVEMBER 10, 2014 SUBMITTED BY GROUP 2 1. AY SATHYA 44912 2. LENG LEAKSMY 36383 3. KOV RAKSA 25836 4. MOS THEN 44600 5. OUM RANY 49296 6. MENG MOLIKA 53505 SUBMITTED TO PROFESSOR: UM VUTHDARA TERM PAPER FOR COURSE COMPARATIVE ECONOMIC SYSTEM
Transcript of COMPARISON ECONOMIC BETWEEN U.S AND INDIA
សាកលវទិ្យាល័យបញ្ញា សាស្ត្រកម្ពុជា PAÑÑĀSĀSTRA UNIVERSITY OF CAMBODIA
ECONOMIC COMPARISION
BETWEEN U.S AND INDIA
NOVEMBER 10, 2014
SUBMITTED BY GROUP 2
1. AY SATHYA 44912
2. LENG LEAKSMY 36383
3. KOV RAKSA 25836
4. MOS THEN 44600
5. OUM RANY 49296
6. MENG MOLIKA 53505
SUBMITTED TO PROFESSOR: UM VUTHDARA
TERM PAPER FOR COURSE COMPARATIVE
ECONOMIC SYSTEM
Page | 1
Table of Contents
I. Introduction .................................................................................................................................... 2
1.1. Background of Study ................................................................................................................. 2
1.2. Interesting in topic and Problem Statement .............................................................................. 3
1.3. Objective and Significant of Study ............................................................................................ 3
1.4. Scope of Study ........................................................................................................................... 3
II. History of Economic Development ............................................................................................... 4
2.1. United State of America ............................................................................................................ 4
2.2. The Republic of India ................................................................................................................ 6
III. Comparison of Economy ............................................................................................................... 7
3.1. Saving and Investment .............................................................................................................. 8
3.2. Education and Health Care .................................................................................................... 10
3.3. Export and Import ................................................................................................................... 12
IV. Discussion and Finding ................................................................................................................ 14
V. Overall Assessment and Study .................................................................................................... 15
VI. Conclusion and Recommendation .............................................................................................. 18
References ................................................................................................................................................. 20
Page | 2
I. Introduction
1.1. Background of Study
Within the study of comparative economic system, we are concerning to the differences
of economic growth between United Stated and India. Due to the economic is an important
sector for country’s development, therefore, economic consider as a main factor for building
one state to become strong. The comparative economic system could be a guideline for state
to review and see their lacking point which they could be a guideline for state to review and
see their lacking point which they could have opportunities to take it for improving the state’s
capacity building by looking those developed countries of system they use and the policies
they created and implemented. By the comparing a system of economic, we can realize and
well understanding of which system is better than which one. And it could help to the
policymaker to reconsider when they created policy for implementing. Comparative
economic system is widely recognized to compare the system, the policies and the
institutions, which looking on the saving and investment, education and health care sector,
import and export the productivities, social capital (Democracy and Freedom), financial
capital like macroeconomic stability and diversity natural resources which consider as a
natural capital. We already realized that India and U.S used to have experience under the
colonization of Britain. And recently, we see that the increasing of economic growth rank in
the world of India and U.S are following up with each other. According to newspaper which
released on April 30th, 2014, India has pulled Japan to become the third largest economy
while U.S have been fail into the second largest economy of the world (Sneha Shankar 2014)
By concerning to this point, this research paper will find out the core factor that make
these both countries become the largest economy. As well as the paper will examine the role
of responsibility of government in term of economic growth. It is a basic essential to study
about the decision making is really affecting an influence to the whole countries.
In order to improve this quality of this paper for reader, we have to understanding about
that system, policies and institutions which state apply into their own nations. To help reader
more understanding, we also provide some basic concept relate with the economic theories
such as the Adam Smith, David Richardo, and some economist scholars who have different
view and perspective. We are not only providing the concept, however, we will also use
critical thinking to analyze those concept by applying into our research paper to become more
effective for readers.
Page | 3
1.2. Interesting in topic and Problem Statement
We choose these two states to compare due to the fact that they were under England’s
colonization. However, U.S’s economy tends to develop much faster than India’s. Due to the
data, India is the world’s third largest economy in the world, while U.S is one step further.
Therefore, we would like to know the reasons behind this and want to study deeper.
Moreover, U.S and India are both a federal state and have the same economic system;
consequently, it is more likely to compare these states.
1.3. Objective and Significant of Study
We are going to examine and differentiate the two countries economic system which is
between United State of American and The Republic of India such as investment and saving,
education and import and export. There are three purposes for choosing this topic:
1. To define and observe the key role actors in leading each country's economy and
study about their system level (international level, organization level, state level,
and individual level).
2. This topic is chosen for the purpose of sharing information. Our group members
seek to share all of the knowledge that we know or get from the topic to all our
beloved classmates and the teacher as well.
About significant of this study is that we can improve our knowledge and know-how of
comparing system level, can transform our country from being low-developing country to
advanced one by following good example of the developed country's economic development,
and know the flow of mixed & free market processes.
1.4. Scope of Study
During our research, our group just mention in economic sector in order to compare and
to contrast between U.S and India to reach our objective and study. Especially, we are talking
about economy, it seems to be so broad, so our paper is just mention on Saving & Investment
about each country, Export and Import of each country; whether how both country depend
on. The last point that we will mention is Education and Health of the citizen in these both
countries. As we know people are the forces of economic growth. On the other hand, all the
data of economy in India and U.S, we still raise up only from 1990 to 2012. To do this, it can
provide the comfortable reading to the reader as well.
Page | 4
II. History of Economic Development
2.1. United State of America
Once the world’s leading economic superpower, in the twentieth century America
assumed the role of financial capital of the world. As America’s trade deficit continues to
increase, much of America’s massive debt is now controlled by China, and a transfer of
power seems to be in progress. But even amidst recession, the model of the American Dream
is still clinging to life. During the colonial America was a predominately agricultural
economy. Even as the economy expanded over the decades of the eighteenth century, the
colonies only inched toward industrialization by the year of the Declaration of Independence
in 1776. The economy of the thirteen original colonies was actually relatively stable, in stark
contrast to the twentieth and twenty-first centuries. Moreover, from the writing of the United
States Constitution in 1787, America’s economy saw tremendous growth. The Constitution
provided a kind of “economic charter,” laying out regulation of both commerce and money
by Congress. Most importantly, it opened the market of the United States territory. Open
borders allowed for an internal free flow of goods and ideas. One exception was an unpopular
tax on whiskey enacted in 1791 to help pay the national debt established and expanded as a
consequence of the Revolutionary War. From 1788, “the U.S. experienced productivity
growth of about 2% per year.”
On the 1848 discovery of gold in California not only drew hundreds of thousands of
people out West; it also shifted the balance of economic attention of the United States. By the
onset of the Civil War in 1861, gold not only backed American currency, but because of its
role in Northern industry, it was indirectly a primary funder of the Northern war effort.
Before long, however, both the North and the South resorted to paper currency. Inflation was
rampant on both sides but particularly in the South, which lacked the institutional and
bureaucratic power of the North, who had both “an established Treasury and a revenue-
gathering system”. Leading up to the war, the opposing political parties were divided by the
question of slavery. The answer to that question, ultimately decided by Union victory, would
determine the very appearance of the economy of the United States. Elected in 1860,
Abraham Lincoln and his Republican party had Northern industrial interests to preserve,
which led to the establishment of a new tariff on foreign goods in 1861. And, because of the
war, industry in the North further flourished. The industrial economy of the North would
persevere.
Page | 5
The two most influential economic events of the twentieth century in America are the
Great Depression and World War II (1929 – 1945). While the precise causes of the Great
Depression are both numerous and challenging to pinpoint, the economic effects were
disastrous. At its peak, unemployment was nearly 25 percent of the workforce as hundreds of
banks failed (about 40 percent) and hundreds of millions of deposits were lost. In summary,
after “increasingly stock speculation, the stock market crash of 1929 wiped out millions of
investors and crippled confidence among business executives and consumers”. Under the
watch of President Franklin Delano Roosevelt, America launched a vast economic stimulus
program called the “New Deal.” The program was designed to rebuild the confidence lost
during the Depression and put people back to work through government-sponsored works
projects. The new Federal Deposit Insurance Corporation (FDIC) lured people back to banks
while the Public Works Administration provided vast tracts of inexpensive housing. A close
relationship between the private sector of the economy and the American government was
developed as a result of the Great Depression. That relationship would continue into World
War II, when the nation’s industrial sector was mobilized and coordinated by the government
to contribute products directly to the war effort. The gross national product (GNP) of the
United States increased over 50 percent between 1941 and 1945 and unemployment hit its
lowest point ever at 1.2 percent.
Into the modern era (1950s – Present), while portions of Asia and Europe lay in literal
ruins, the United States continued to grow after the war, both in population and economically.
The postwar “baby boom” was one of many results of the American military returning home.
Most significantly, consumer spending and numbers of consumers increased substantially.
The American “middle class” became dominant. Suburbs exploded with the passing of the
Federal-Aid Highway Act of 1956. By now the United States was the richest nation in the
world. As a result, America was developing an extensive infrastructure to match its wealth.
The completion of the Interstate Highway System “remains the largest public works project
in the history of the world”. Finally, the strong interrelationship between the government and
the ever-expanding industrial sector (the “military-industrial complex”) helped establish the
United States as the economic superpower of the world going into the Cold War a dominance
that would be cemented with the collapse of the Soviet Union. The middle of the twentieth
century saw a brief expansion of labor unions and then labor policy. Most important to
American workers were expanded labor rights regulated by the federal government, as well
as the Civil Rights movement of the 1960s. President Lyndon Johnson’s “Great Society”
Page | 6
further expanded and guaranteed access to opportunity by minorities in America while
Congress helped support new federal spending in the form of programs such as Medicare and
Food Stamps. As president from 1977 to 1981, Jimmy Carter was hit hard by such discontent
as the trade deficit increased dramatically, inflation hit its highest point since World War I,
and unemployment had climbed to 9 percent. With the country in another recession, President
Ronald Reagan was subsequently elected on promises of smaller government as well as lower
taxes and increased deregulation. But Reagan did not also decrease public spending. The
result of increased expenditures (particular in the military and defense) but decreased taxes
was significant increases in both the budget deficit and the national debt as the U.S.
government was forced to borrow heavily from other countries. The economy of the 1990s
was driven by the rise of technology and the Internet, whose companies made startling gains
on the stock market. Personal and business technology alike broadened and streamlined
access to the global marketplace. Economic optimism was based upon high-tech “dot.com”
industries who built their success from low interest rates and enthusiastic investors during an
era of low unemployment and low inflation.1
2.2. The Republic of India
In order to understand about the economic growth of India, we should look at history of
India before first 45 years after got independence and the last 20 years as a free economy
market. After 200 years under colonize of Britain, India become a sovereign state in August
15, 1947. After got independence, in the first 45 years, Economic India began to separate into
two distinct segments, which are private and public. The private sector owned and operated
with small to medium size business. So private also play role in term of developing the
economic, however the India’s government only provided those private sector to operate with
a kind of small and medium business because they nervous those private sector can have
more power and lead to bad affect to their own nation, that’s why the government is
important in play role in protecting the big industries, and also government is the one who
took care everything such as consumer service, transportation (airline, railroads, and local
transportation), communication service, and social service (education and health care) with
the reasonable cost as well as the employment sector. India also followed the five-years-plan
from Soviet Union in order to improve their infrastructure, agricultural production, health
1 2010. A History of the U.S Economy . September 10. Accessed November 1, 2014.
http://www.randomhistory.com/us-economy-history.html
Page | 7
care, and education; however the process worked extremely slowed due to the India’s
democratic system.
During in 1990s, India’s economy began to face a crisis with growing inflation,
unemployment, poverty, and low foreign exchange reserve due to the collapse of Soviet
Union. The collapse of Soviet Union is really significant to the impact of India’s economic
because of India is a major trading partner with Soviet Union and a key supplier for low cost
oil. Since the collapse of Soviet Union, India had to buy oil from free market. The foreign
exchange reserve become fell to low in term of the Gurf War sent thousands Indian’s
workers, whose worker at Middle East, back home resulting in a huge dent in India’s foreign
reserve. Consequently, in 1991, the India government had to change closed-door economic
policies because government ran out.
After the economics of India faced a crisis and closed-economic policies, India decided to
reform their economy to become liberalization and privatization by Prime Minister
Narasimha Rao. By implemented the idea of Prime Minister, Manhoman Singh, who was the
finance minister during that time introduced several economic reform such as lower tariff
levels, reform exchange rate policy, liberalized industrial licensing policy and also relaxed
India’s FDI policy. These reforms began to open the door in order to attract the multination
corporation to invest in India. Many multinational corporations deserved many advantages
from India’s new economic policies and as the result the FDI in India increased in just three
years. In term of economic growth in India were based on 3 major factor such as increased
FDI, India’s expertise in information technology, and increase the domestic consumption.
Since the increased of FDI and expertise information technology, it produced a lot of job
employment and created the growing the middle class which demand of creating increased
the domestic consumption.2
III. Comparison of Economy
Being a developing country, India is not as economically prosperous as the United
State. In this case study, our group will observe factors of economic growth that allow the
2 Gosai, Dushyant. 2013. History of Economic Growth in India. April 24. Accessed November 1, 2014.
http://www.internationalpolicydigest.org/2013/04/24/history-of-economic-growth-in-india/
Page | 8
United States to be more developed and are being implemented by India in an effort to
achieve economic progress.
3.1. Saving and Investment
Economic growth basically also considered by the saving and investment within the
country. Some scholars believed that the growth in one country is considered by the saving
because when the saving is high, the people will purchase more in the future and also mean
the country's security is high. While, some scholars considered investment as the main factor
to accelerate the economic growth which is very primitive because the more investment,
more jobs available, then people have salary to buy goods and production, and the
productivity will be increased. Basically, India and United States have different level of
investment and saving, but how is it impact to overall economic system between the two
countries and how it contributes to economic growth. India once was the closed market
country where trades especially export and import were limited and importantly the private
enterprises were highly restricted. So, we will compare the saving and investment in both
countries.
The United States, one of the richest countries in the world, has been a forward-thinking
country that builds for tomorrow through saving and investment. There has been a fluctuation
between saving and investment in United States because this greed power country faced
many crises such as recession, great depression, and government deficit which mean the
public sector high expense while the private sector have more saving in year 2008 to 2011 but
suppose nation saving is the sum of both public and private saving. However government
spending particularly automatic stabilizer like means-tested benefits that can stabilize the
consumption of people hit hardest by recession. The Great recession in 2008 is causing by
when people has a very low personal saving and in addition to that borrowing or what we call
leveraging to buy a house, but it also come with risks. Life become very difficult in a value of
the asset you bought decline. So, they faced difficulty in repay it back3. As stated saving
contribute a lot to investment, national saving also allow us to invest in physical assets that
help everyone. In the example, where a saving family saves money and deposit in the local
bank, and the bank lends that money to business for purchase of a new machine and the
3 Cole, Alan. 2014. Losing the Future: The Decline of U.S saving and investment. Accessed November 6, 2014.
http://taxfoundation.org/article/losing-future-decline-us-saving-and-investment,
Page | 9
machine is what economic call investment. Investment is the process by which financial
savings are turned into real estate. The purchase of equipment makes the workers at the
business more productive, raising their wages, and helps the economy produce more goods
overall for consumers to use. However, the saving and investment in U.S has showed the
downfall since the 1969 until 2009. Usually, saving and investment move in similar pattern
overall but in U.S investment grow faster than saving apparently because U.S has an open
economy. Much of the investment in America is financed from abroad. America is very good
place to own investment, and foreign savers recognize this; the physical manifestation of this
economic trend is that foreign investors own more property in America than America own
abroad. For example, New York Skyline, the iconic 77 story tower on Lexington Avenue, the
Chrysler building is 90 percent owned by the Abu Dhabi investment Council4. The U.S NIIP
which stand for Net International Investment Position is about negative 4.6$ trillion, meaning
that foreigners own about 4.6$ trillion and foreign investor own about $26.5 trillion of the
stock of investment in the United States.
In the past few decade, India was the closed economy country compare to United
States of America, thus the economic performance was not as great as U.S because both
private and public sector were strictly manipulated by the Government and especially saving
and investment was not seen as good. In 1994, the first time that India permit Foreign
Institutional Investors (FIIs) to invest up to 24 percent of equity of Indian corporate, this limit
was later raised to 49 percent5. FII increased from $3.5 billion in 1995-96 to $7.6 billion in
2003-2004 and a record $10.3 billion in 2004-2005 and $10 billion in 2006-2007. Saving rate
in India has steadily increased over time, from an extremely low base of 9.0 percent in 1950-
51 to 37.7 percent in 2007-2008 as well as the investment rate; this is a significant positive
and robust relation between growth rates. Showing that India had a close capital account
before 1991 which restricted capital mobility through administrative manipulation and
outright prohibition, domestic saving and domestic investment in India were highly
correlated, also the divergence between saving and investment in persistent until the
liberalization was narrowed down after the 1991 and balance of payment crisis after the
economy shifted to flexible exchange rate regime in 1993. Economic growth in India was
4 Bagli, Charles V. 2008. Abu Dhabi Buys 90% Stake in Chrysler Building. July 10. Accessed November 6, 2014.
http://www.nytimes.com/2008/07/10/nyregion/10chrysler.html 5 Nayak, Satyendra S. 2008. Globalization and the India Economy. Milton Park: Taylor and Francis Group.
Page | 10
largely led by investment demand through growing investment both direct and portfolio
investment play a role, the rise in investment was largely financed domestically, from a low
21.6 in 1992 to 37.7 percent in 2008. This fuelled investment, raising the need for all type of
investment related goods. Domestic saving in India is divided in two parts- Public saving and
Private Saving and the private saving divided to two parts which are household saving and
corporate saving and the three sectors has a different growth rate base on their composition.
The most noticeable trend is the growing divergence between the public and private saving.
Public saving decline from its peak level of 4.9 percent of GDP in 1977 to 2.2 percent in
2002, where it increase back to 4.5 percent in 2008, during the same time both private and
household sector have steadily growth rate nearly 60 percent in early 1990s to a maximum of
94 percent in 2002, after which nearly 94 percent in 2008. The private sector grows from
below 10 percent to 23 percent in recent years. Similar composition changes have occurred in
investment sector. Until, late 1980s public investment rate was dominating and reaches its
peak 12 percent in 1987. Following the liberalization, the role of public sector gradually
decreased. Hence, the private sector investment has steadily increased. The share of public
sector investment in total investment was at around 50 percent in 1980s and has declined to
23 percent in 2008. On the other hand, the share of private corporate which was little more
than 20 percent in 1980s reaches to 40 percent in 2008. While household sector investment
rate also increased from low base of 3.2 percent in 1964 to 14.2 percent to 20056.
3.2. Education and Health Care
Economic growth in one country depends on 2 factors such as doing research and human
capital. When we are talking about the human capital, we might think about education and
healthcare of the people in one country. First let start with education, for this point our group
decide to choose 3 differences of measuring education input such as Public Expenditure on
Education, Expected year of schooling and Secondary School Enrollment (Vuthdara, Lecture
2014)7, in order to make a comparison between India and U.S. Education is very important
because education is the activity of transforming skill, knowledge, behavior or attitude
(Vuthdara, Comparative Economic System 2014)8. When there’s a change of these, it can
6 Ramesh Jangill, Causal relation between saving, Investment and Economic growth for India, http://www.rbi.org.in/scripts/bs_viewcontent.aspx?Id=2486, Nov 6th 2014. 7Vuthdara, Prof. Um. 2014. "Lecture." Measuring Education 15/09/2014.
8 Group, The Wourld Bank. 2014. The World Bank Group. Accessed November 07, 2014.
www.data.worldbank.org.
Page | 11
effect to productivity that influence on economic growth in one country. So let take a look to
countries, India and US in Public Expenditure on Education, Expected year of schooling
and Secondary School Enrollment. About public expenditure on education is the total public
expenditure (current capital) on education expressed as a percentage of the GDP9 in a given
year. It includes government spending on educational instituted (both public and private),
education administration and transfer or subsidies for private entities (students/households
and other private entities). And expected year of schooling refers to the average duration of
formal education in which a five-year-old child can expect to enroll over his or her lifetime.
For secondary school enrollment is percentage of the population of official secondary
education age.
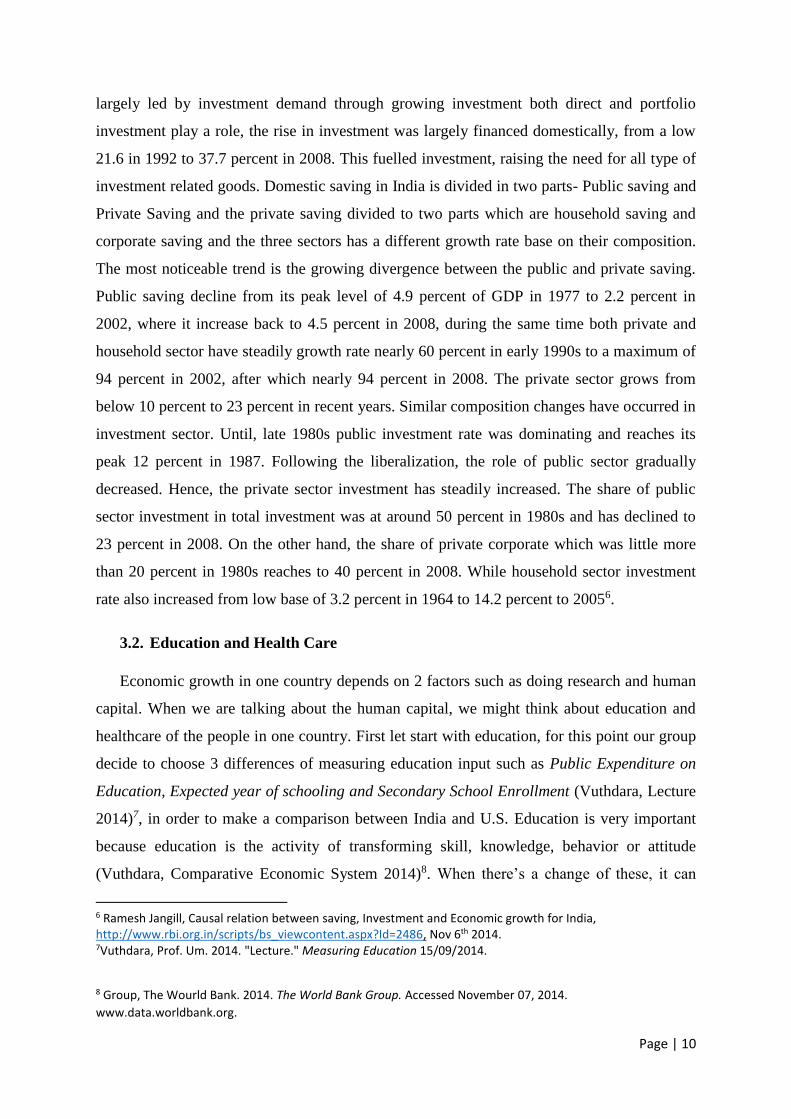
The table below shows the comparison of education between United States and India.
Year 2010
Country in Compare India US
Public Expenditure on Education 3.3 5.4
Expected Year of Schooling 5.1 12
Secondary School Enrollment 65 93
Source: Legal, The World Bank. The World Bank Group. 2014. www.data.worldbank.org (accessed
November 07, 2014)
On the other hand, according to University of Michigan, Even though education has
increased in India, literacy rates continue to act as an economic deterrent. Let compares
literacy rates for the United States and India. While both countries have high GDP, the
monetary value of GDP for the United States is considerably higher than that of India. In
India, 47% women literate and 70% of the males are literate. In the United States, equal
literacy rates exist for men and women, with 97% of both genders being literate. Lower GDP
values for India could be caused by the unequal literacy rates between males and females that
continue to persist in India, suggestive of the need to implement gender equality to achieve
economic growth.
9 GDP = Gross Domestic Product
Page | 12
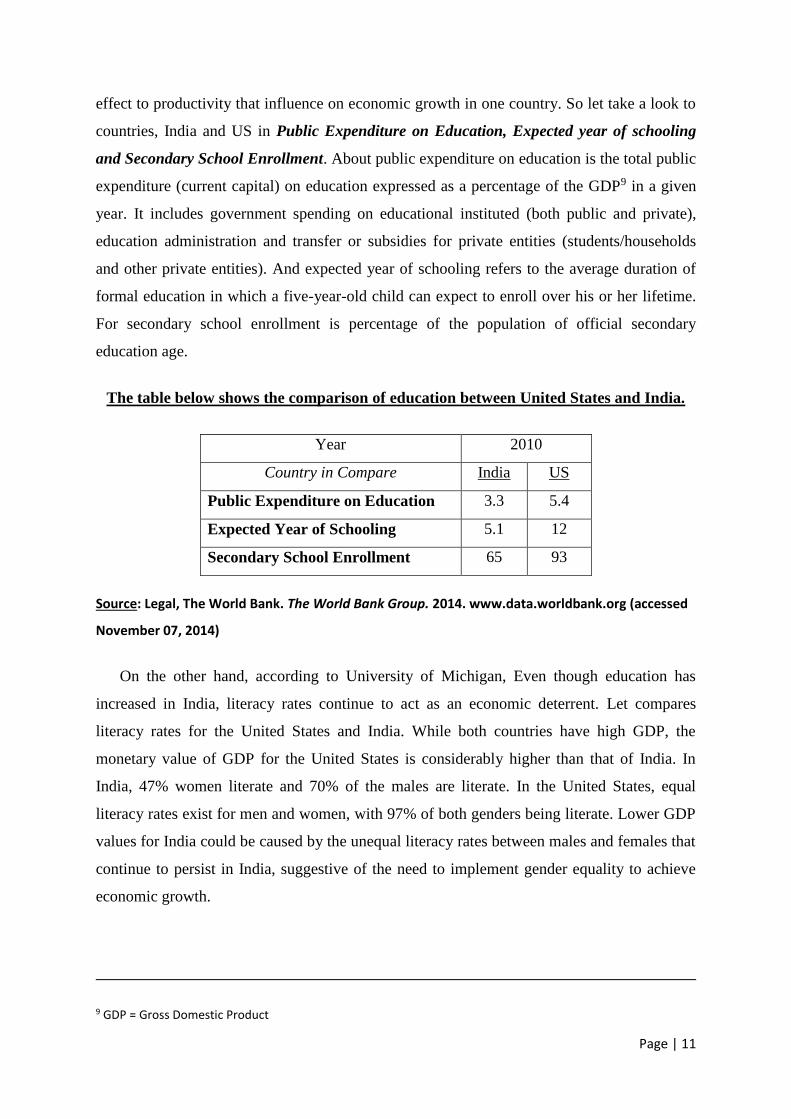
Furthermore, in human capital, not only education is the main factor for economic growth
but also health care system should be come through with education to increase human index.
So in order to make reader easier to understand the comparison of health care system between
India and US, please take a look at the table below:
2010
India Rank US Rank
People living with HIV 2.4 3rd 1.2 117th 39 % more than US
Life Expectancy 66.8 156th 78.37 47th 17% more than India
Physicians per 1000
people
0.6 19th 2.3 31st 4 times more than
India
Quality of healthcare
system
64.36 28th 69.03 23rd 7% more than India
Source: Group, The Wourld Bank. 2014. The World Bank Group. Accessed November 07, 2014.
www.data.worldbank.org
3.3. Export and Import
Besides saving and investment, health care and education, export and import are also the
crucial factor to determine the economic growth in each country. Export allows you to grow
your business by tapping into new oversea markets, expanding network contacts, and if done
properly, can significantly maximize your profitability (Government of Western Australia,
2014). Importing, on the other hand, can be an excellent strategy for expanding your business
by helping you reach new domestic markets, offer new products and reduce manufacturing
and component costs. In the following paragraph, we will compare the export and import
statistics between USA and India during 2011-2013.
According to the U.S. International Trade Administration released on 2012 and foreign
trade performance in India, India’s exports stood at Rs. 1465959 crores (~76 billions) in
2011-12 (28.9 %), while U.S. exports of goods and services increased by 1.4 percent in
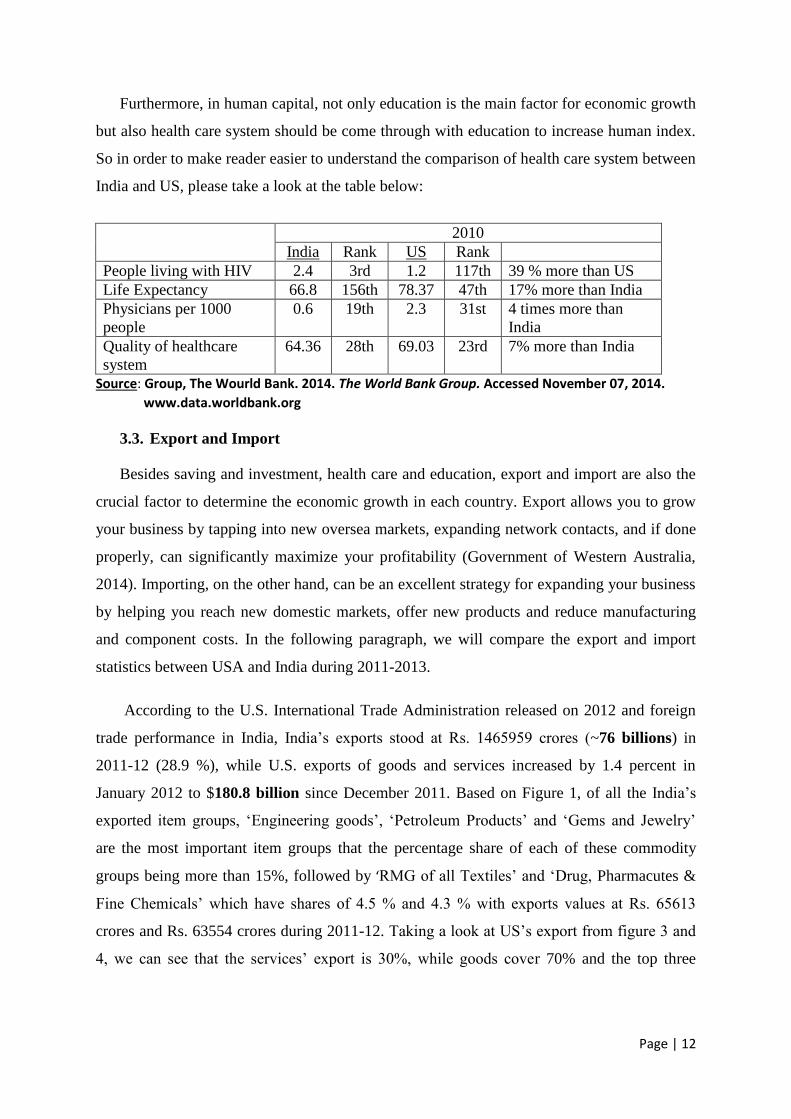
January 2012 to $180.8 billion since December 2011. Based on Figure 1, of all the India’s
exported item groups, ‘Engineering goods’, ‘Petroleum Products’ and ‘Gems and Jewelry’
are the most important item groups that the percentage share of each of these commodity
groups being more than 15%, followed by ‘RMG of all Textiles’ and ‘Drug, Pharmacutes &
Fine Chemicals’ which have shares of 4.5 % and 4.3 % with exports values at Rs. 65613
crores and Rs. 63554 crores during 2011-12. Taking a look at US’s export from figure 3 and
4, we can see that the services’ export is 30%, while goods cover 70% and the top three
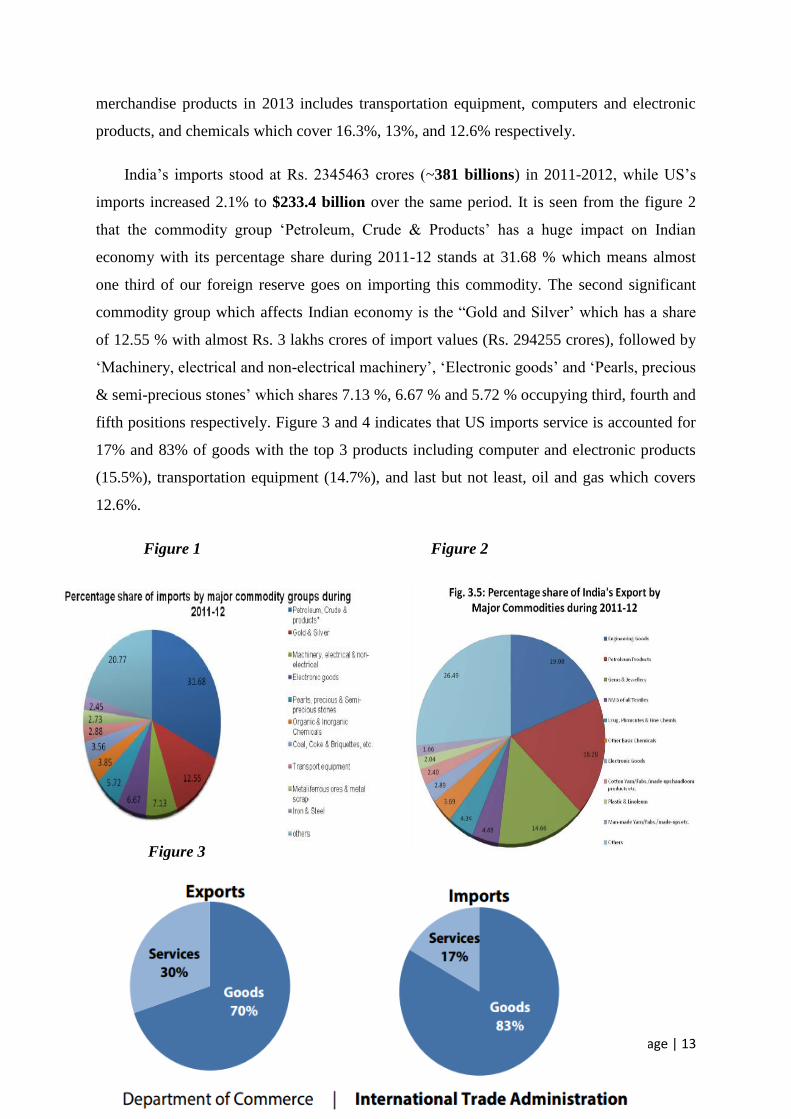
Page | 13
merchandise products in 2013 includes transportation equipment, computers and electronic
products, and chemicals which cover 16.3%, 13%, and 12.6% respectively.
India’s imports stood at Rs. 2345463 crores (~381 billions) in 2011-2012, while US’s
imports increased 2.1% to $233.4 billion over the same period. It is seen from the figure 2
that the commodity group ‘Petroleum, Crude & Products’ has a huge impact on Indian
economy with its percentage share during 2011-12 stands at 31.68 % which means almost
one third of our foreign reserve goes on importing this commodity. The second significant
commodity group which affects Indian economy is the “Gold and Silver’ which has a share
of 12.55 % with almost Rs. 3 lakhs crores of import values (Rs. 294255 crores), followed by
‘Machinery, electrical and non-electrical machinery’, ‘Electronic goods’ and ‘Pearls, precious
& semi-precious stones’ which shares 7.13 %, 6.67 % and 5.72 % occupying third, fourth and
fifth positions respectively. Figure 3 and 4 indicates that US imports service is accounted for
17% and 83% of goods with the top 3 products including computer and electronic products
(15.5%), transportation equipment (14.7%), and last but not least, oil and gas which covers
12.6%.
Figure 1 Figure 2
Figure 3

Page | 14
Figure 4
IV. Discussion and Finding
While education has increased in India, unequal literacy rate continue to exist and account
for the lower GDP of India as compared to the United States. Therefore, gender equality is a
factor that is proven to contribute to economic prosperity. (Michigan 2014)10. And according
to the above point of comparing the 3 main factors to measuring education between India and
U.S is that education in India is still poor that the way to access education is still limited
which is far from U.S that equal chance to access education and get high percentage of
joining school rather than India. After finding the data to compare the health care system of
India and US our group have a clear discussion that India is still poor at development of
economic because of the education is still low and also health care is still poor for Indian
citizen with contrast with US citizens. This is also one factor that can stuck economic growth
as well. Even technology improve but India cannot be like US.
USA's economy is more developed due to the fact it exports more than imports which is
totally different from India. Surprisingly, the most exported products of India and USA are
engineering goods and transportation and electronic equipment’s in which conclusion can be
10 Michigan, University of. 2014. The REgents of the University of Michigan. Accessed October 25, 2014.
www.sitemaker.umich.edu
Page | 15
drawn that both of them are expertise in technological field, and research and development.
Another interesting fact is that US's top export is transportation and electronic products;
nonetheless, those products are also in the top list of its import.
Saving and investment are also the factors that stimulate economic growth and both
factors have connection and casual affect. According to my research, U.S faced the downfall
both saving and investment according to its local saving which is very low and also the
government deficit and which reflects to fluctuate the economic pattern to down. Likewise,
the investment in U.S is persistently decreasing but still higher than saving because mostly
there are many foreign investors come to invest in this free economic country and now the
foreign investors is much higher than the local investor due to its economic system. However,
in India after reforming its economic system, they abolished restriction over the private and
household over resource ownership and allocation. India become steadily increased over time
especially the capacity of saving from household is much higher than before the establishing
the free market. The investment in India also seen as improvement especially when they
permit the Foreign Institutional Investors in 1994. India both saving and investment in
contrast to U.S became increasing. The public sector seems to have less influents over market
and so it reflect the good outcome for both private and household sector to gradually increase
their investment and saving over the market.
V. Overall Assessment and Study
Through my opinion, I think these two powerful countries are unlikely to be defeated
easily even if they both face different difficulty in improving market outcome. U.S has a
resilient economic country which mean it faced many challenging in the past but still can
survive over time even now U.S has a very low point in saving and investment due to the lack
of personal saving but the tax reforming might be necessary to help this economy system and
it will also help the local investment not to be invaded or conquer by the foreign investors.
However, India is still in another level of free market which mean India need to learn more in
in order to improve its market outcome by encourage household saving and investment and it
doesn’t meet that the public sector has no intervention on the market, they need also attract
foreign investors to increase job for local people thus they will have a good paid job and also
increased the personal saving. This might help them to determine putting their money in the
bank, then bank may loan the money to the local business and this is likely to subsidy the
Page | 16
infant industry, the result is that there will be more local investment in India rather than the
foreign investors.
India is developing into an open-market economy, yet traces of its past autarkic policies
remain. Economic liberalization measures, including industrial deregulation, privatization of
state-owned enterprises, and reduced controls on foreign trade and investment, began in the
early 1990s and have served to accelerate the country's growth, which averaged under 7% per
year since 1997. India's diverse economy encompasses traditional village farming, modern
agriculture, handicrafts, a wide range of modern industries, and a multitude of services.
Slightly more than half of the work force is in agriculture, but services are the major source
of economic growth, accounting for nearly two-thirds of India's output, with less than one-
third of its labor force. India has capitalized on its large educated English-speaking
population to become a major exporter of information technology services, business
outsourcing services, and software workers. In 2010, the Indian economy rebounded robustly
from the global financial crisis - in large part because of strong domestic demand - and
growth exceeded 8% year-on-year in real terms. However, India's economic growth began
slowing in 2011 because of a slowdown in government spending and a decline in investment,
caused by investor pessimism about the government's commitment to further economic
reforms and about the global situation. High international crude prices have exacerbated the
government's fuel subsidy expenditures, contributing to a higher fiscal deficit and a
worsening current account deficit. In late 2012, the Indian Government announced additional
reforms and deficit reduction measures to reverse India's slowdown, including allowing
higher levels of foreign participation in direct investment in the economy. The outlook for
India's medium-term growth is positive due to a young population and corresponding low
dependency ratio, healthy savings and investment rates, and increasing integration into the
global economy. India has many long-term challenges that it has yet to fully address,
including poverty, corruption, violence and discrimination against women and girls, an
inefficient power generation and distribution system, ineffective enforcement of intellectual
property rights, decades-long civil litigation dockets, inadequate transport and agricultural
infrastructure, limited non-agricultural employment opportunities, inadequate availability of
quality basic and higher education, and accommodating rural-to-urban migration.
The U.S has the largest and most technologically powerful economy in the world, with a
per capita GDP of $49,800. In this market-oriented economy, private individuals and
business firms make most of the decisions, and the federal and state governments buy needed
goods and services predominantly in the private marketplace. U.S business firms enjoy
Page | 17
greater flexibility than their counterparts in Western Europe and Japan in decisions to expand
capital plant, to lay off surplus workers, and to develop new products. At the same time, they
face higher barriers to enter their rivals' home markets than foreign firms face entering US
markets. U.S firms are at or near the forefront in technological advances, especially in
computers and in medical, aerospace, and military equipment; their advantage has narrowed
since the end of World War II. The onrush of technology largely explains the gradual
development of a "two-tier labor market" in which those at the bottom lack the education and
the professional or technical skills of those at the top and, more and more, fail to get
comparable pay raises, health insurance coverage, and other benefits. Since 1975, practically
all the gains in household income have gone to the top 20% of households. Since 1996,
dividends and capital gains have grown faster than wages or any other category of after-tax
income. Imported oil accounts for nearly 55% of U.S consumption. Crude oil prices doubled
between 2001 and 2006, the year home prices peaked; higher gasoline prices ate into
consumers' budgets and many individuals fell behind in their mortgage payments. Oil prices
climbed another 50% between 2006 and 2008, and bank foreclosures more than doubled in
the same period. Besides dampening the housing market, soaring oil prices caused a drop in
the value of the dollar and deterioration in the US merchandise trade deficit, which peaked at
$840 billion in 2008. The sub-prime mortgage crisis, falling home prices, investment bank
failures, tight credit, and the global economic downturn pushed the United States into a
recession by mid-2008. GDP contracted until the third quarter of 2009, making this the
deepest and longest downturn since the Great Depression. To help stabilize financial markets,
in October 2008 the U.S Congress established a $700 billion Troubled Asset Relief Program
(TARP). The government used some of these funds to purchase equity in U.S banks and
industrial corporations, much of which had been returned to the government by early 2011. In
January 2009 the US Congress passed and President Barack OBAMA signed a bill providing
an additional $787 billion fiscal stimulus to be used over 10 years - two-thirds on additional
spending and one-third on tax cuts - to create jobs and to help the economy recover. In 2010
and 2011, the federal budget deficit reached nearly 9% of GDP. In 2012 the federal
government reduced the growth of spending and the deficit shrank to 7.6% of GDP. Wars in
Iraq and Afghanistan required major shifts in national resources from civilian to military
purposes and contributed to the growth of the budget deficit and public debt. Through 2011,
the direct costs of the wars totaled nearly $900 billion, according to US government figures.
US revenues from taxes and other sources are lower, as a percentage of GDP, than those of
most other countries. In March 2010, President OBAMA signed into law the Patient
Page | 18
Protection and Affordable Care Act, a health insurance reform that was designed to extend
coverage to an additional 32 million American citizens by 2016, through private health
insurance for the general population and Medicaid for the impoverished. Total spending on
health care - public plus private - rose from 9.0% of GDP in 1980 to 17.9% in 2010. In July
2010, the president signed the DODD-FRANK Wall Street Reform and Consumer Protection
Act, a law designed to promote financial stability by protecting consumers from financial
abuses, ending taxpayer bailouts of financial firms, dealing with troubled banks that are "too
big to fail," and improving accountability and transparency in the financial system - in
particular, by requiring certain financial derivatives to be traded in markets that are subject to
government regulation and oversight. In December 2012, the Federal Reserve Board
announced plans to purchase $85 billion per month of mortgage-backed and Treasury
securities in an effort to hold down long-term interest rates, and to keep short term rates near
zero until unemployment drops to 6.5% from the December rate of 7.8%, or until inflation
rises above 2.5%. Long-term problems include stagnation of wages for lower-income
families, inadequate investment in deteriorating infrastructure, rapidly rising medical and
pension costs of an aging population, energy shortages, and sizable current account and
budget deficits - including significant budget shortages for state governments.
VI. Conclusion and Recommendation
The reason why we have to compare economics because of economic policy can make us
to see the differences between the countries. No economic system is pure because of the role
of state and another factor. Economic policy also can make us to see the differences between
the countries that is the reason why we have to compare economics. So according to the data
comparison in 3 main factors such as Saving and Investment, Education and Healthcare, and
Export and Import, our group meet a hard situation to discuss about this because the data
shows India is weaker than U.S in almost point. Then we can make an overall assessment that
between India and U.S, physical capital that refer to saving and investment of both countries
remain some struggling but U.S seem to be more prosper while India is trying to increasing
saving and investment. About Education and healthcare that refer to human capital, India still
face with many challenges about this factor, as healthcare system is low that leads to weak
education. As we know human capital is very vital for economic growth, U.S citizen can
access high quality of healthcare system and reach good education. That’s why U.S economic
growth more than India. And Foreign capital which refer to export and import, we can see
Page | 19
how the differences of both countries. Last but not least, our group hopes that this term paper
of comparison of economic system can help some reader who wants to clarify the differences
of India and U.S for some reasons. Finally, our group would like to say thank you to our
professor that give this good opportunity for us to research about this interesting topic and on
the behalf of economic student, we will try our best more to be good at deep explanation and
waiting for any comment, especially use this research to study more to improve economic in
our country.
Page | 20
References 2010. A History of the U.S Economy . September 10. Accessed November 1, 2014.
http://www.randomhistory.com/us-economy-history.html
Bagli, Charles V. 2008. Abu Dhabi Buys 90% Stake in Chrysler Building. July 10. Accessed
November 6, 2014. http://www.nytimes.com/2008/07/10/nyregion/10chrysler.html
Cole, Alan. 2014. Losing the Future: The Decline of U.S saving and investment. Accessed
November 6, 2014. http://taxfoundation.org/article/losing-future-decline-us-saving-and-
investment,
n.d. "Foreign Trade Performance of India." Annual Report, Directorate General of
Commercial Intelligence and Statistics, Ministry of Commerce and industry, Govt. of India.
Accessed November 6, 2014. http://www.dgciskol.nic.in/annualreport/book_3e.pdf
Gosai, Dushyant. 2013. History of Economic Growth in India. April 24. Accessed November 1,
2014. http://www.internationalpolicydigest.org/2013/04/24/history-of-economic-growth-
in-india/
Group, The Wourld Bank. 2014. The World Bank Group. Accessed November 07, 2014.
www.data.worldbank.org
Michigan, University of. 2014. The REgents of the University of Michigan. Accessed October
25, 2014. www.sitemaker.umich.edu
2012. NationalMaster. Accessed September 01, 2014. www.nationalmaster.com
Nayak, Satyendra S. 2008. Globalization and the India Economy. Milton Park: Taylor and
Francis Group
Sneha Shankar. 2014. "China set to over take US as world's largest economy while India pulls
ahead of Japan to become third largest economy: World Bank." 1. Accessed October 18,
2014. http://www.ibtimes.com/china-set-overtake-us-worlds-largest-economy-while-india-
pulls-ahead-japan-become-third-1578235
Stephanie Han & Natalie Soroka. 2014. "U.S. Trade Overview 2013." Trade and Economic
Analysis, Industry and Analysis, Department of Commerce, International Trade
Administration. Accessed November 6, 2014.
www.trade.gov/mas/ian/build/groups/public/@tg_ian/documents/webcontent/tg_ian_002
065.pdf
Vuthdara, Prof. Um, interview by Rany. 2014. Comparative Economic System (October 06).
Vuthdara, Prof. Um. 2014. "Lecture." Measuring Education 15/09/2014.