Comparing tropical forest tree size distributions with the predictions of metabolic ecology and...
14
LETTER Comparing tropical forest tree size distributions with the predictions of metabolic ecology and equilibrium models Helene C. Muller-Landau, 1 * Richard S. Condit, 2 Kyle E. Harms, 2,3 Christian O. Marks, 1 Sean C. Thomas, 4 Sarayudh Bunyavejchewin, 5 George Chuyong, 6 Leonardo Co, 7 Stuart Davies, 2 Robin Foster, 8 Savitri Gunatilleke, 9 Nimal Gunatilleke, 9 Terese Hart, 10 Stephen P. Hubbell, 2,11 Akira Itoh, 12 Abd Rahman Kassim, 13 David Kenfack, 14 James V. LaFrankie, 15 Daniel Lagunzad, 16 Hua Seng Lee, 17 Elizabeth Losos, 18 Jean- Remy Makana, 19 Tatsuhiro Ohkubo, 20 Cristian Samper, 21 Raman Sukumar, 22 I-Fang Sun, 23 Nur Supardi M. N., 24 Sylvester Tan, 25 Duncan Thomas, 26 Jill Thompson, 27 Renato Valencia, 28 Martha Isabel Vallejo, 29 Gorky Villa Mun ˜ oz, 28 Takuo Yamakura, 30 Jess K. Zimmerman, 27 Handanakere Shavaramaiah Dattaraja, 22 Shameema Esufali, 11 Pamela Hall, 31 Fangliang He, 32 Consuelo Hernandez, 28 Somboon Kiratiprayoon, 33 Hebbalalu S. Suresh, 22 Christopher Wills 34 and Peter Ashton 35 Abstract Tropical forests vary substantially in the densities of trees of different sizes and thus in above-ground biomass and carbon stores. However, these tree size distributions show fundamental similarities suggestive of underlying general principles. The theory of metabolic ecology predicts that tree abundances will scale as the )2 power of diameter. Demographic equilibrium theory explains tree abundances in terms of the scaling of growth and mortality. We use demographic equilibrium theory to derive analytic predictions for tree size distributions corresponding to different growth and mortality functions. We test both sets of predictions using data from 14 large-scale tropical forest plots encompassing censuses of 473 ha and > 2 million trees. The data are uniformly inconsistent with the predictions of metabolic ecology. In most forests, size distributions are much closer to the predictions of demographic equilibrium, and thus, intersite variation in size distributions is explained partly by intersite variation in growth and mortality. Keywords Demographic rates, forest structure, large-scale disturbance, metabolic theory of ecology, old-growth forests, tree diameter distributions. Ecology Letters (2006) 9: xxx–xxx 1 Department of Ecology, Evolution and Behavior, University of Minnesota, 1987 Upper Buford Circle, St Paul, MN 55108, USA 2 Smithsonian Tropical Research Institute, Unit 0948, APO AA 34002-0948, Miami, FL, USA 3 Department of Biological Sciences, Louisiana State University, 202 Life Sciences Building, Baton Rouge, LA 70803-1715, USA 4 Faculty of Forestry, University of Toronto, 33 Willcocks St, Toronto, ON, Canada 5 National Parks Wildlife and Plant Conservation Department, Research Office, 61 Paholyothin Road, Chatuchak, Bangkok 10900, Thailand 6 Department of Life Sciences, University of Buea, PO Box 63, Buea, Cameroon 7 Institute of Biology, College of Science, University of the Philippines, Herbarium, Diliman 1101, Quezon City, Philippines 8 The Field Museum, 1400 S. Lake Shore Drive, Chicago, IL 60605-2496, USA 9 Department of Botany, Faculty of Science, University of Pera- deniya, Peradeniya 20400, Sri Lanka 10 Wildlife Conservation Society, International Programs, 185th St and Southern Blvd, Bronx, NY 10460, USA Ecology Letters, (2006) 9: xxx–xxx doi: 10.1111/j.1461-0248.2006.00915.x ȑ 2006 Blackwell Publishing Ltd/CNRS
Transcript of Comparing tropical forest tree size distributions with the predictions of metabolic ecology and...
L E T T E RComparing tropical forest tree size distributions
with the predictions of metabolic ecology and
equilibrium models
Helene C. Muller-Landau,1*
Richard S. Condit,2 Kyle E.
Harms,2,3 Christian O. Marks,1
Sean C. Thomas,4 Sarayudh
Bunyavejchewin,5 George
Chuyong,6 Leonardo Co,7 Stuart
Davies,2 Robin Foster,8 Savitri
Gunatilleke,9 Nimal Gunatilleke,9
Terese Hart,10 Stephen P.
Hubbell,2,11 Akira Itoh,12 Abd
Rahman Kassim,13 David
Kenfack,14 James V. LaFrankie,15
Daniel Lagunzad,16 Hua Seng
Lee,17 Elizabeth Losos,18 Jean-
Remy Makana,19 Tatsuhiro
Ohkubo,20 Cristian Samper,21
Raman Sukumar,22 I-Fang Sun,23
Nur Supardi M. N.,24 Sylvester
Tan,25 Duncan Thomas,26 Jill
Thompson,27 Renato Valencia,28
Martha Isabel Vallejo,29 Gorky
Villa Munoz,28 Takuo
Yamakura,30 Jess K.
Zimmerman,27 Handanakere
Shavaramaiah Dattaraja,22
Shameema Esufali,11 Pamela
Hall,31 Fangliang He,32 Consuelo
Hernandez,28 Somboon
Kiratiprayoon,33 Hebbalalu S.
Suresh,22 Christopher Wills34 and
Peter Ashton35
Abstract
Tropical forests vary substantially in the densities of trees of different sizes and thus in
above-ground biomass and carbon stores. However, these tree size distributions show
fundamental similarities suggestive of underlying general principles. The theory of
metabolic ecology predicts that tree abundances will scale as the )2 power of diameter.
Demographic equilibrium theory explains tree abundances in terms of the scaling of
growth and mortality. We use demographic equilibrium theory to derive analytic
predictions for tree size distributions corresponding to different growth and mortality
functions. We test both sets of predictions using data from 14 large-scale tropical forest
plots encompassing censuses of 473 ha and > 2 million trees. The data are uniformly
inconsistent with the predictions of metabolic ecology. In most forests, size distributions
are much closer to the predictions of demographic equilibrium, and thus, intersite
variation in size distributions is explained partly by intersite variation in growth and
mortality.
Keywords
Demographic rates, forest structure, large-scale disturbance, metabolic theory of ecology,
old-growth forests, tree diameter distributions.
Ecology Letters (2006) 9: xxx–xxx
1Department of Ecology, Evolution and Behavior, University of
Minnesota, 1987 Upper Buford Circle, St Paul, MN 55108, USA2Smithsonian Tropical Research Institute, Unit 0948, APO AA
34002-0948, Miami, FL, USA3Department of Biological Sciences, Louisiana State University,
202 Life Sciences Building, Baton Rouge, LA 70803-1715, USA4Faculty of Forestry, University of Toronto, 33 Willcocks St,
Toronto, ON, Canada5National Parks Wildlife and Plant Conservation Department,
Research Office, 61 Paholyothin Road, Chatuchak, Bangkok
10900, Thailand
6Department of Life Sciences, University of Buea, PO Box 63,
Buea, Cameroon7Institute of Biology, College of Science, University of the
Philippines, Herbarium, Diliman 1101, Quezon City, Philippines8The Field Museum, 1400 S. Lake Shore Drive, Chicago, IL
60605-2496, USA9Department of Botany, Faculty of Science, University of Pera-
deniya, Peradeniya 20400, Sri Lanka10Wildlife Conservation Society, International Programs, 185th
St and Southern Blvd, Bronx, NY 10460, USA
Ecology Letters, (2006) 9: xxx–xxx doi: 10.1111/j.1461-0248.2006.00915.x
� 2006 Blackwell Publishing Ltd/CNRS
I N T R O D U C T I O N
Tropical forests vary widely in their structure and above-
ground biomass (Ashton & Hall 1992; Ter Steege et al.
2003), differences attributable mainly to wide variation in
the density of large trees (Chave et al. 2001). However, their
tree size distributions show fundamental similarities that
suggest general underlying principles (Coomes et al. 2003).
Given that tropical forests hold almost half of all above-
ground carbon stores in the biosphere (Dixon et al. 1994),
we cannot hope to understand the terrestrial carbon budget
without an understanding of tropical forest tree size
distributions. Recently, the theory of metabolic ecology
has generated specific predictions about the functional form
of this relationship (Enquist & Niklas 2001) and its variation
among sites (Niklas et al. 2003). Such a general theory could
potentially advance fundamental understanding of forest
structure and provide a basis for understanding current
changes and predicting future changes in forest structure
and associated carbon pools (Baker et al. 2004; Wright
2005).
The metabolic theory of ecology strives to explain
ecological structure by considering how the metabolic rates
of organisms vary with body size and environmental
conditions because of fundamental physical and chemical
constraints (Brown et al. 2004). The seminal paper by West
et al. (1997) derives the scaling of metabolic rates (gross
photosynthetic rates in plants) with size from consideration
of the limits on maximal rates of resource redistribution
through the organism via fractal branching networks. By
adding the assumptions that plants grow until they are
limited by resources and that resource use is proportional to
metabolic rate, Enquist et al. (1998) obtain a prediction for
the scaling of plant density across plant communities varying
in mean plant mass. This is essentially a self-thinning law,
albeit one that predicts an exponent of )4/3 rather than the
traditional )3/2 for the relationship between individual
plant biomass and the density of plants across plant stands.
11Department of Plant Biology, University of Georgia, Athens,
GA 30602, USA12Laboratory of Plant Ecology, Graduate School of Science,
Osaka City University, Osaka 558-8585, Japan13Forest Management and Ecology Program, Forestry and
Conservation Division, Forest Research Institute Malaysia,
Kepong 52109, Selangor, Malaysia14International Center for Tropical Ecology, University of
Missouri Saint Louis, 8001 Natural Bridge Ave., St Louis, MO
63121, USA15Center for Tropical Forest Science-Arnold Arboretum Asia
Program, Nanyang Technological University, 1 Nanyang Walk,
Singapore 637617, Singapore16Faculty of Forestry, University of the Philippines, Diliman,
Quezon City 1101, Philippines17Sarawak Forest Department, Jalan Stadium, Petra Jaya,
Kuching, Sarawak 93660, Malaysia18Organization for Tropical Studies, Duke University, Durham,
NC, USA19Wildlife Conservation Society – DR Congo Program, Chanic
Building, 2nd Floor, Ngaliema, PO Box 240, Kinshasa I,
Democratic Republic of Congo20Department of Forest Science, Utsunomiya University, 350
Minemachi, Utsunomiya 321-8505, Japan21National Museum of Natural History, Smithsonian Institution,
Washington, DC, USA22Center for Ecological Science, Indian Institute of Science,
Bangalore 560012, India23Center for Tropical Ecology and Biodiversity, Tunghai
University, Taichung 40704, Taiwan
24Forest Ecology Unit, Forestry and Conservation Division,
Forest Research Institute Malaysia, Kepong 52109 Selangor,
Malaysia25Forest Research Center, KM 10 Jalan Datuk Amar Kalong
Ningkan, 93250 Kuching, Sarawak, E., Malaysia26Department of Forest Science, Oregon State University, 529
NW 31st Street, Corvallis, OR 97330, USA27Institute for Tropical Ecosystem Studies, University of Puerto
Rico Rıo Piedras, Box 21910, San Juan, PR 00931-1910, USA28Herbario QCA. Dept. de Ciencias Biologicas, Pontificia
Universidad Catolica del Ecuador, Aptado. 17-01-2184, Quito,
Ecuador29Instituto Alexander von Humboldt, Ministerio del Medio
Ambiente, Calle 37 no. 8-40 Mezzanine, Bogota, Colombia30Department of Biology, Faculty of Science, Osaka City
University, Sugimoto, Sumiyoshi-ku, Osaka 558-8585, Japan31Department of Biological Sciences, Florida State University,
Tallahassee FL 32306-4370, USA32Department of Renewable Resources, University of Alberta,
Edmonton, AB, Canada T6G 2H133Department of Environmental Science, Faculty of Science and
Technology, Thammasat University (Rangsit), Patumtani,
Thailand34Division of Biological Sciences, University of California, San
Diego, La Jolla, CA 92093-0116, USA35Center for Tropical Forest Science-Arnold Arboretum Asia
Program, 22 Divinity Avenue, Cambridge, MA 02138, USA
*Correspondence: E-mail: [email protected]
2 H. C. Muller-Landau et al.
� 2006 Blackwell Publishing Ltd/CNRS

Enquist & Niklas (2001) state that this model also applies
within stands, and thus turn it into a prediction for plant size
distributions within old growth, and presumably equili-
brium, communities.
Alternatively, equilibrium plant size distributions can be
understood as the simple demographic consequence of size-
dependent variation in growth and mortality (Coomes et al.
2003; Kohyama et al. 2003). Because mortality removes trees
from size classes, increasing mortality in a given size class
reduces the number of trees in that size class. Because
growth moves trees from one size class to another and thus
is inversely related to residence time within a size class, an
increase in growth in a size class will also reduce the number
of trees in that size class and increase the number in the next
larger size class (Condit et al. 1998; Wright et al. 2003).
Mathematically, the general relationship between size and
age distributions, growth, and mortality is given by the von
Foerster equation (Von Foerster 1959; Sinko & Streifer
1967) which has long been an important tool in fisheries
management (e.g. Ebert et al. 1993; Smith et al. 1998). At
demographic equilibrium, size distributions are determined
completely by the functions relating average growth and
mortality to size (Kohyama et al. 2003). Thus, for example,
exponential size distributions are expected if absolute
growth rate and mortality rate are both size independent
(Coomes et al. 2003).
Tests of the predictions of the metabolic ecology and
demographic equilibrium models against whole-community
tree size distributions have had mixed results to date.
Enquist & Niklas (2001) found support for their metabolic
prediction of tree size distribution scaling in a data set from
tropical forests. However, their criteria for excluding data
bias their analyses, and a reanalysis of the same data set
without this bias showed consistent deviations from the
prediction at large tree sizes (Coomes et al. 2003). Coomes
et al. (2003) also analysed a large data set from New Zealand
temperate forests, again finding consistent deviations from
metabolic ecology predictions. In contrast, Coomes et al.
(2003) found support for the demographic equilibrium
model in both tropical and temperate forest data sets.
If forests are at demographic equilibrium, then the
equilibrium model makes it possible to precisely link
functions describing size-dependent growth and mortality
– including those proposed by the theory of metabolic
ecology – to functions describing tree size distributions.
Foresters regularly use quantitative descriptions of tree
diameter distributions as indicators of management impacts
and successional status (Goff & West 1975; Goodburn &
Lorimer 1999; Schwartz et al. 2005). Further, several studies
have previously simulated equilibrium diameter distributions
in mixed-aged forests on the basis of size-dependent growth
and mortality (e.g. Lorimer & Frelich 1984; Kohyama 1991).
However, although foresters have long used a variety of
statistical models to quantitatively describe tree diameter
distributions, including the negative exponential (DeLio-
court 1898; Meyer & Stevenson 1943; Leak 1964; Moser
1972) and the two-parameter Weibull (Bailey & Dell 1973),
these and other theoretical diameter distributions have
neither previously been derived directly from size-depen-
dent growth and mortality, nor have their parameters been
linked quantitatively to parameters describing growth and
mortality.
Here, we first concisely state the logic underlying the
metabolic ecology prediction for tree size distributions. We
then develop the alternative demographic equilibrium
model, analytically deriving the size distributions it predicts
for different combinations of growth and mortality
functions and thereby predicting exactly how the parameters
of these size distributions are related to parameters of the
growth and mortality functions. We test the metabolic
ecology prediction using data on tree size distributions in 14
large (16–52 ha) census plots in tropical forests around the
globe. We test the demographic equilibrium model in 10 of
those forests (those for which we have growth and mortality
data) by numerically integrating over the exact observed
changes in growth and mortality with size. Finally, we test
the utility of the analytical relationships we derive relating
growth, mortality and size distributions at demographic
equilibrium by fitting each forest’s size distribution using
each of the functional forms suggested for different
combinations of growth and mortality functions, and
evaluating how the best-fit parameters of the size distribu-
tions compare quantitatively with the values predicted given
the best-fit growth and mortality functions.
M E T A B O L I C E C O L O G Y T H E O R Y
West et al. (1997, 1999) derive predictions for the scaling of
vessel diameters, biomass and metabolic rates of organisms
that optimize resource distribution through branching
networks of vessels. For plants, their predictions can be
stated as follows:
M1 – Prediction: A plant’s trunk diameter, D scales with
its biomass, M as M3/8 (thus M � D8/3).
M2 – Prediction: A plant’s gross photosynthetic rate
scales with M3/4, and thus with D2 and with its total
leaf area and leaf mass, L.
To develop these ideas into predictions for the form of
plant size distributions within communities, Enquist &
Niklas (2001) make the following key assumption:
M3 – Assumption: The scaling of the density of plants
with plant mass within an old-growth (equilibrium)
plant community is the same as the scaling across plant
communities varying in mean plant mass.
Explaining tropical forest structure 3
� 2006 Blackwell Publishing Ltd/CNRS

They then make use of prior work by Enquist et al. (1998)
on plant density variation among communities:
M4 – Assumption: A plant’s resource use is proportional
to its gross photosynthetic rate.
M5 – Assumption: Plants grow until they are limited by
resources.
M6 – Prediction: A plant’s resource use scales with M3/4
(based on M2 and M4).
M7 – Prediction: Across plant communities of similar
total resource availability and varying in mean individ-
ual plant biomass, plant density, N scales as M)3/4
(based on M4, M5 and M6).
By combining this last result (M7) with the assumption
equating scaling within stands to scaling across stands (M3),
Enquist & Niklas (2001) derive the following prediction:
M8 – Prediction: In old-growth (equilibrium) plant com-
munities, the density of plants of biomass M scales with
M)3/4 and the density of plants of diameter D scales
with D)2 (based on M1, M3 and M7).
Here, we test how well tree diameter distributions in old-
growth forests are fit by a power function with exponent )2
(M8). We further evaluate how well these diameter
distributions are fit by power functions in general, and
whether the best-fit exponents are or are not significantly
different from )2.
D E M O G R A P H I C E Q U I L I B R I U M T H E O R Y
An alternative approach to understanding size distributions
of old-growth forests starts from the relationship of size
distributions with growth and mortality at demographic
equilibrium (Kohyama et al. 2003):
D1 – Assumption: In old-growth forests without major
long-term temporal variation, stands reach a demogra-
phic equilibrium at which mean growth as a function of
size, g(D), mortality as a function of size, m(D), and the
tree size probability distribution, p(D), are inter-related
as
pðDÞ ¼ 1
K gðDÞ exp �ZD
D0
mð~DÞgð~DÞ
d ~D
24
35; ð1Þ
where K is a normalization constant (equal to the total
number of individuals divided by the recruitment rate)
and D0 is the size of individuals upon recruitment.
This general relationship has previously been used to
numerically calculate what size distributions follow from
different growth and mortality functions (e.g. Coomes et al.
2003). Here, we show that this relationship also allows us to
analytically derive the tree size distributions that follow
from various combinations of growth and mortality scaling
functions. We thereby derive the following specific predic-
tions (see Appendix S1 for full derivations):
D2 – Prediction: If absolute diameter growth rates and
mortality rates are both constant with diameter and take
values r and a, respectively (i.e. g(D) ¼ dD/dt ¼ r and
m(D) ¼ a), the diameter distribution is a negative
exponential with rate parameter k ¼ a/r:
p Dð Þ ¼ 1
Ke
exp � a
rD
� �; ð2aÞ
p Dð Þ ¼ 1
Ke
exp �kDð Þ; ð2bÞ
where Ke is a normalization constant whose value de-
pends on k and on D0 (see Appendix S1).
D3 – Prediction: If growth is a power function of
diameter, following
gðDÞ ¼ dD
dt¼ rDc ð3Þ
and mortality is constant at a (m(D) ¼ a), the diameter
distribution will take the form of a Weibull distribution
with shape parameter l ¼ 1 ) c and scale parameter
m ¼ (r(1 ) c)/a)1/(1)c):
p Dð Þ ¼ 1
Kw
D�c exp�a
r 1 � cð ÞD1�c
� �; ð4aÞ
p Dð Þ ¼ 1
Kw0
D
b
� �l�1
exp � D
m
� �l� �; ð4bÞ
where Kw and Kw¢ are normalization constants.
D4 – Prediction: If growth and mortality are both power
functions of diameter, with growth following eqn 3
and mortality following
mðDÞ ¼ aDb ð5Þ
and if the scaling exponents are related such that c ) b ¼1 (i.e. mortality is proportional to relative growth rate),
the diameter distribution will be a power function with
exponent )h ¼ )c ) a/r ¼ )1 ) b ) a/r:
pðDÞ ¼ 1
Kp
D�c�a=r ; ð6aÞ
pðDÞ ¼ 1
Kp
D�1�b�a=r ; ð6bÞ
p Dð Þ ¼ 1
Kp
D�h; ð6cÞ
where Kp is a normalization constant.
4 H. C. Muller-Landau et al.
� 2006 Blackwell Publishing Ltd/CNRS

Note that metabolic ecology predictions for the scaling
exponents of growth (1/3) and mortality ()2/3) are such that
the condition c ) b ¼ 1 is met, and thus, a power function
size distribution is predicted – but the exponent will be equal
to )2 only if the ratio of the mortality and growth coefficients
is such that a/r ¼ 5/3, a condition not specified in previous
publications (Enquist et al. 1999; Brown et al. 2004). Note
further that when the diameter distribution is a power
function, the probability distribution of log (D) is a truncated
exponential distribution with rate parameter h ) 1.
D5 – Prediction: If growth and mortality are both power
functions of diameter (eqns 3 and 5) and c ) b „ 1,
the diameter distribution will take a form similar to a
Weibull distribution with quasi-shape parameter a ¼1 ) c, quasi-scale parameter b ¼ (r(1 ) c)/a)1/(1)c), and
a third new parameter c ¼ b:
p Dð Þ ¼ 1
Kq
D�c exp�a
r 1 � c þ bð ÞD1�cþb
� �; ð7aÞ
p Dð Þ ¼ 1
Kq
Da�1 exp � D
b
� �aþc� �; ð7bÞ
where Kq is a normalization constant.
Here, we first evaluate whether the assumption that size
distributions are in demographic equilibrium (D1) is war-
ranted by numerically integrating eqn 1 over exactly
interpolated observed growth and mortality functions and
comparing the predicted diameter distributions with those
observed. We then fit observed size distributions with
exponential, power function, Weibull, and quasi-Weibull
functions, examine which function produces the best fit, and
compare the fitted parameter values with those expected
based on growth and mortality parameters (D2–D5).
Because it has been shown that growth and mortality
functions change as trees reach the canopy at c. 18- to 20-cm
diameter (Coomes et al. 2003; Muller-Landau et al. in press),
size distributions were fit separately for all individuals
combined, for small individuals (< 20 cm in diameter) only,
and for large individuals (‡ 20 cm in diameter) only.
M E T H O D S
Data sets
Our study sites are 14 large plots (16–52 ha each) in old-
growth tropical forests around the world (see Table 1 and
Losos & Leigh 2004). All plots were censused one or more
times using the standard methods of the Center for Tropical
Forest Science (Condit 1998): all free-standing woody plants
with a stem diameter ‡ 1 cm (at 1.3 m above the ground)
were mapped, tagged, identified to species, and measured in
diameter (with a precision of 0.1 cm – we excluded early
censuses in which small stems were measured only to the
nearest 0.5 cm). We excluded data for individuals whose
diameters were recorded as 1.0 cm to avoid the influence of
inconsistencies in the definitions of this smallest size class.
Table 1 The 14 tropical forest dynamics plots used in this study; their sample sizes in area, censuses and trees (with tree number from the
most recent census), and their climate
Site
Plot
area (ha)
No.
censuses
No.
trees
Rainfall
(mm)
Dry season
(months)
Sinharaja Wilderness Area, Sri Lanka 25 2 190 328 5016 0
La Planada Nature Reserve, Colombia 25 2 99 802 4415 0
Luquillo Experimental Forest, Puerto Rico 16 1 64 291 3548 0
Palanan Wilderness Area, Philippines 16 1 63 891 3379 0
Yasuni National Park, Ecuador 25 2 139 566 3081 0
Lambir Hills National Park, Sarawak, Malaysia 52 2 347 236 2664 0
Pasoh Forest Reserve, Malaysia 50 3 291 954 1788 1
Korup National Park, Cameroon 50 1 314 747 5272 3
Khao Chong Wildlife Refuge, Thailand 24 1 96 110 2660 3
Barro Colorado Nature Monument, Panama 50 3 209 097 2551 3
Edoro study area, Ituri Forest, Congo 20* 2 149 045 1785 3
Lenda study area, Ituri Forest, Congo 20* 2 127 038 1674 4
Huai Kha Khaeng Wildlife Sanctuary, Thailand 50 2 70 597 1476 6
Mudumalai Wildlife Sanctuary, India 50 3 18 008 1250 4
Rainfall is the average annual total; dry season length is the number of calendar months with average rainfall < 100 mm. Climate data from
Losos & Leigh (2004), except for Yasuni (S. J. Wright, personal communication) and Khao Chong (S. J. Davies, unpublished data). Plots are
ordered by increasing dryness.
*The two Congo sites each consist of two 10-ha plots; all other sites are one contiguous rectangle or square.
Explaining tropical forest structure 5
� 2006 Blackwell Publishing Ltd/CNRS
(At some sites, any stem between 0.95 and 1.05 cm was
recorded as a 1.0-cm stem, while in others only stems
between 1.00 and 1.05 cm were thus recorded.) In total, we
analysed over 4.4-million size measurements on over 2.1-
million individuals in 473 ha.
Evaluating the two models
To compare the fits of the metabolic ecology (M8) and
demographic equilibrium (D1) predictions to the data, we
used likelihood, the preferred approach for comparing fits
to continuous probability distributions (Johnson et al.
1994). For both models, the predictions were exact, with
no fitted parameters. In both cases, we normalized the
predicted probability densities so that they summed to
exactly one over the total diameter range considered
(D0 ¼ 1.05 cm to Dmax ¼ 499.95 cm). In the case of the
theory of metabolic ecology, the prediction can be stated
analytically. In a size class i bounded below at Dimin and
above at Dimax, we should observe a proportion of the
total stems equal to
pi;Mpred ¼ 1=Di min � 1=Di max
1=D0 � 1=Dmax
: ð8Þ
For the demographic equilibrium theory, numerical meth-
ods are necessary. We calculated mean diameter, growth and
mortality within wider size classes and then linearly inter-
polated between these points to obtain complete functions,
g(D) and m(D) for growth and mortality (see Appendix S2
and Muller-Landau et al. in press). We then used eqn 1 and
numerical integration to obtain the predictions for the
number of individuals in each diameter class.
Because measurement precision is limited to 0.1 cm and
thus the data are essentially binned into classes of this width,
the likelihood of the complete data set given a predicted
probability distribution is essentially a multinomial distribu-
tion,Qi
pNi
i (Kulldorff 1961; Johnson et al. 1994). The total
log likelihood is
L ¼Xi
Ni log pið Þ: ð9Þ
We calculate this log likelihood for each model using the
finest size classes possible for our data set: classes evenly
0.1-cm wide from 1.05 to 499.95 cm.
Phenomenological fits and their relationships to growthand mortality
We fitted negative exponential (eqn 2b), Weibull (eqn
4b), power function (eqn 6c), and quasi-Weibull (eqn 7b)
probability distributions to the diameter distributions using
maximum likelihood methods (Kulldorff 1961); that is, we
searched for the parameters that maximized the log
likelihood, as given in eqn 9. We used Akaike’s
Information Criterion to compare the maximum likelihood
fits of the different functions (Burnham & Anderson
2002). For each census at each plot, we separately fit
distributions for all individuals (bins from 1.05 to
500.05 cm), small individuals only (measured at < 20 cm
in diameter, thus encompassing bins from 1.05 to
19.95 cm), and large individuals only (measured at
‡ 20 cm in diameter, thus encompassing bins from 19.95
to 500.05 cm), always using 0.1-cm bins (the limits of
measurement precision). We bootstrapped over 50 · 50-m
subplots to obtain confidence intervals on parameter
estimates. The fitted power-function parameters were
compared with the )2 value predicted under metabolic
ecology, specifically examining whether the confidence
intervals included this prediction.
We calculated predicted parameter values of each
phenomenological model of tree size distributions from
fitted parameters of growth and mortality (eqns 2a, 4a, 6a,
6b and 7a). The parameters of power functions relating
growth and mortality to diameter were obtained from
Muller-Landau et al. (in press); details of the fitting methods
are given in Appendix S2. We calculated mean growth and
mean mortality rates for each site for all individuals, small
individuals and large individuals. In each case, we calculated
weighted mean values, weighing each size class by its width
on a log-diameter scale (size classes were chosen to be
approximately equal on a log-diameter scale, while also
being bounded at round numbers to avoid the influences of
measurement biases). We used weighted mean values
because unweighted mean values are dominated by the
growth and mortality rates of the very abundant small
individuals, which are not typical of all size classes.
Confidence intervals on all growth and mortality parameters
were obtained by bootstrapping over 50 · 50-m subplots.
Confidence intervals on the size distribution parameters
calculated from the growth and mortality parameters were
obtained by bootstrapping over the growth and mortality
parameters that went into the calculation (using the
confidence intervals of the parameters and assuming errors
in the estimates are normally distributed).
To compare predicted and observed size distribution
parameters, we first assessed which predicted size distribution
model (exponential, power, Weibull or quasi-Weibull) had
the highest likelihood of the data across all sites combined. We
then used this best model and the most recent census for each
site to investigate the degree to which we could explain
intersite variation in size distributions in terms of growth
and mortality. To do this, we examined the correlations
among sites between the size distribution parameters predic-
ted from growth and mortality and the size distribution
parameters fitted directly to the tree size data.
6 H. C. Muller-Landau et al.
� 2006 Blackwell Publishing Ltd/CNRS
R E S U L T S
Evaluating the two models
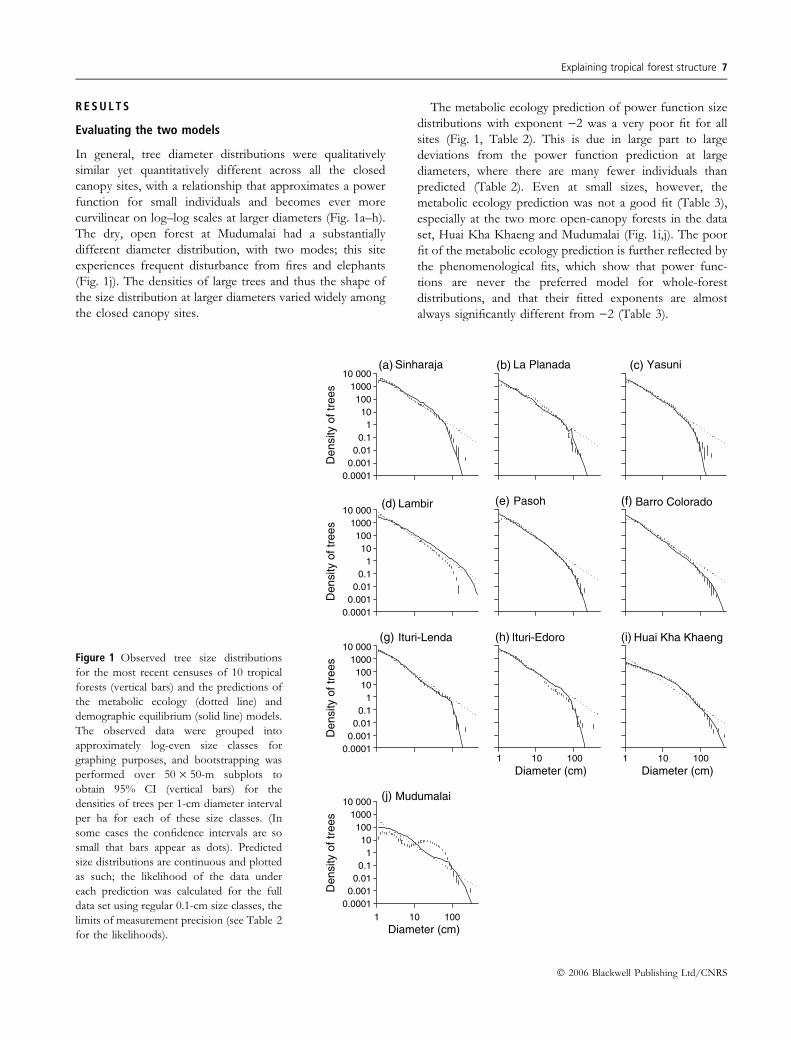
In general, tree diameter distributions were qualitatively
similar yet quantitatively different across all the closed
canopy sites, with a relationship that approximates a power
function for small individuals and becomes ever more
curvilinear on log–log scales at larger diameters (Fig. 1a–h).
The dry, open forest at Mudumalai had a substantially
different diameter distribution, with two modes; this site
experiences frequent disturbance from fires and elephants
(Fig. 1j). The densities of large trees and thus the shape of
the size distribution at larger diameters varied widely among
the closed canopy sites.
The metabolic ecology prediction of power function size
distributions with exponent )2 was a very poor fit for all
sites (Fig. 1, Table 2). This is due in large part to large
deviations from the power function prediction at large
diameters, where there are many fewer individuals than
predicted (Table 2). Even at small sizes, however, the
metabolic ecology prediction was not a good fit (Table 3),
especially at the two more open-canopy forests in the data
set, Huai Kha Khaeng and Mudumalai (Fig. 1i,j). The poor
fit of the metabolic ecology prediction is further reflected by
the phenomenological fits, which show that power func-
tions are never the preferred model for whole-forest
distributions, and that their fitted exponents are almost
always significantly different from )2 (Table 3).
Sinharaja La Planada Yasuni
Lambir Pasoh Barro Colorado
Ituri-Lenda Ituri-Edoro
Diameter (cm)
Huai Kha Khaeng
Diameter (cm)
Mudumalai
Diameter (cm)1
Den
sity
of t
rees
0.00010.001
0.010.1
110
1001000
10 000
Den
sity
of t
rees
0.00010.001
0.010.1
110
1001000
10 000
10010
1 10010 1 10010
Den
sity
of t
rees
0.00010.001
0.010.1
110
1001000
10 000
Den
sity
of t
rees
0.00010.001
0.010.1
110
1001000
10 000(a) (b) (c)
(d) (e) (f)
(g)
(j)
(h) (i)
Figure 1 Observed tree size distributions
for the most recent censuses of 10 tropical
forests (vertical bars) and the predictions of
the metabolic ecology (dotted line) and
demographic equilibrium (solid line) models.
The observed data were grouped into
approximately log-even size classes for
graphing purposes, and bootstrapping was
performed over 50 · 50-m subplots to
obtain 95% CI (vertical bars) for the
densities of trees per 1-cm diameter interval
per ha for each of these size classes. (In
some cases the confidence intervals are so
small that bars appear as dots). Predicted
size distributions are continuous and plotted
as such; the likelihood of the data under
each prediction was calculated for the full
data set using regular 0.1-cm size classes, the
limits of measurement precision (see Table 2
for the likelihoods).
Explaining tropical forest structure 7
� 2006 Blackwell Publishing Ltd/CNRS
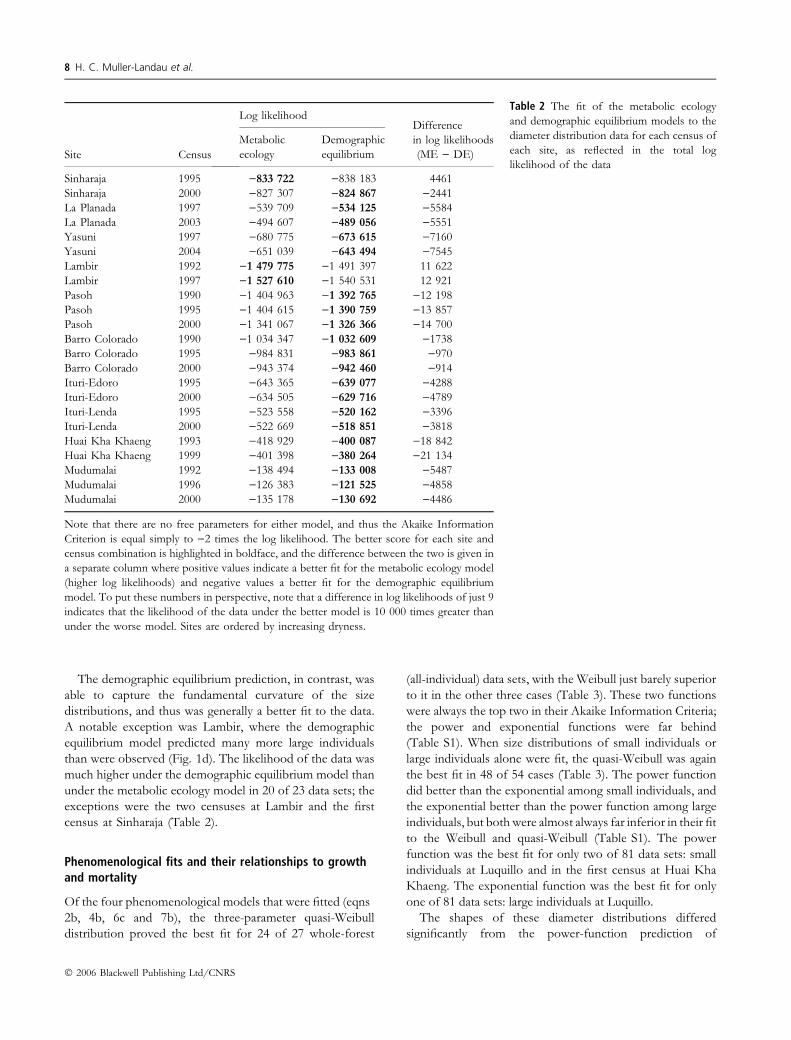
The demographic equilibrium prediction, in contrast, was
able to capture the fundamental curvature of the size
distributions, and thus was generally a better fit to the data.
A notable exception was Lambir, where the demographic
equilibrium model predicted many more large individuals
than were observed (Fig. 1d). The likelihood of the data was
much higher under the demographic equilibrium model than
under the metabolic ecology model in 20 of 23 data sets; the
exceptions were the two censuses at Lambir and the first
census at Sinharaja (Table 2).
Phenomenological fits and their relationships to growthand mortality
Of the four phenomenological models that were fitted (eqns
2b, 4b, 6c and 7b), the three-parameter quasi-Weibull
distribution proved the best fit for 24 of 27 whole-forest
(all-individual) data sets, with the Weibull just barely superior
to it in the other three cases (Table 3). These two functions
were always the top two in their Akaike Information Criteria;
the power and exponential functions were far behind
(Table S1). When size distributions of small individuals or
large individuals alone were fit, the quasi-Weibull was again
the best fit in 48 of 54 cases (Table 3). The power function
did better than the exponential among small individuals, and
the exponential better than the power function among large
individuals, but both were almost always far inferior in their fit
to the Weibull and quasi-Weibull (Table S1). The power
function was the best fit for only two of 81 data sets: small
individuals at Luquillo and in the first census at Huai Kha
Khaeng. The exponential function was the best fit for only
one of 81 data sets: large individuals at Luquillo.
The shapes of these diameter distributions differed
significantly from the power-function prediction of
Table 2 The fit of the metabolic ecology
and demographic equilibrium models to the
diameter distribution data for each census of
each site, as reflected in the total log
likelihood of the dataSite Census
Log likelihoodDifference
in log likelihoods
(ME ) DE)
Metabolic
ecology
Demographic
equilibrium
Sinharaja 1995 )833 722 )838 183 4461
Sinharaja 2000 )827 307 )824 867 )2441
La Planada 1997 )539 709 )534 125 )5584
La Planada 2003 )494 607 )489 056 )5551
Yasuni 1997 )680 775 )673 615 )7160
Yasuni 2004 )651 039 )643 494 )7545
Lambir 1992 )1 479 775 )1 491 397 11 622
Lambir 1997 )1 527 610 )1 540 531 12 921
Pasoh 1990 )1 404 963 )1 392 765 )12 198
Pasoh 1995 )1 404 615 )1 390 759 )13 857
Pasoh 2000 )1 341 067 )1 326 366 )14 700
Barro Colorado 1990 )1 034 347 )1 032 609 )1738
Barro Colorado 1995 )984 831 )983 861 )970
Barro Colorado 2000 )943 374 )942 460 )914
Ituri-Edoro 1995 )643 365 )639 077 )4288
Ituri-Edoro 2000 )634 505 )629 716 )4789
Ituri-Lenda 1995 )523 558 )520 162 )3396
Ituri-Lenda 2000 )522 669 )518 851 )3818
Huai Kha Khaeng 1993 )418 929 )400 087 )18 842
Huai Kha Khaeng 1999 )401 398 )380 264 )21 134
Mudumalai 1992 )138 494 )133 008 )5487
Mudumalai 1996 )126 383 )121 525 )4858
Mudumalai 2000 )135 178 )130 692 )4486
Note that there are no free parameters for either model, and thus the Akaike Information
Criterion is equal simply to )2 times the log likelihood. The better score for each site and
census combination is highlighted in boldface, and the difference between the two is given in
a separate column where positive values indicate a better fit for the metabolic ecology model
(higher log likelihoods) and negative values a better fit for the demographic equilibrium
model. To put these numbers in perspective, note that a difference in log likelihoods of just 9
indicates that the likelihood of the data under the better model is 10 000 times greater than
under the worse model. Sites are ordered by increasing dryness.
8 H. C. Muller-Landau et al.
� 2006 Blackwell Publishing Ltd/CNRS
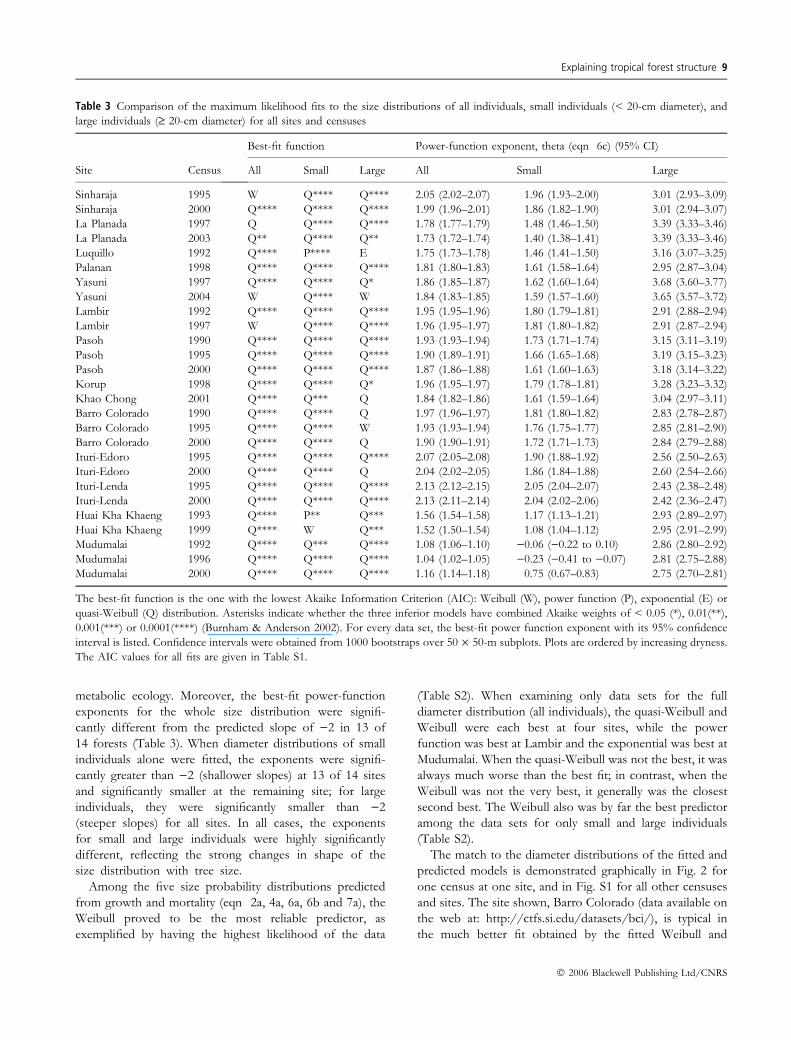
metabolic ecology. Moreover, the best-fit power-function
exponents for the whole size distribution were signifi-
cantly different from the predicted slope of )2 in 13 of
14 forests (Table 3). When diameter distributions of small
individuals alone were fitted, the exponents were signifi-
cantly greater than )2 (shallower slopes) at 13 of 14 sites
and significantly smaller at the remaining site; for large
individuals, they were significantly smaller than )2
(steeper slopes) for all sites. In all cases, the exponents
for small and large individuals were highly significantly
different, reflecting the strong changes in shape of the
size distribution with tree size.
Among the five size probability distributions predicted
from growth and mortality (eqn 2a, 4a, 6a, 6b and 7a), the
Weibull proved to be the most reliable predictor, as
exemplified by having the highest likelihood of the data
(Table S2). When examining only data sets for the full
diameter distribution (all individuals), the quasi-Weibull and
Weibull were each best at four sites, while the power
function was best at Lambir and the exponential was best at
Mudumalai. When the quasi-Weibull was not the best, it was
always much worse than the best fit; in contrast, when the
Weibull was not the very best, it generally was the closest
second best. The Weibull also was by far the best predictor
among the data sets for only small and large individuals
(Table S2).
The match to the diameter distributions of the fitted and
predicted models is demonstrated graphically in Fig. 2 for
one census at one site, and in Fig. S1 for all other censuses
and sites. The site shown, Barro Colorado (data available on
the web at: http://ctfs.si.edu/datasets/bci/), is typical in
the much better fit obtained by the fitted Weibull and
Table 3 Comparison of the maximum likelihood fits to the size distributions of all individuals, small individuals (< 20-cm diameter), and
large individuals (‡ 20-cm diameter) for all sites and censuses
Site Census
Best-fit function Power-function exponent, theta (eqn 6c) (95% CI)
All Small Large All Small Large
Sinharaja 1995 W Q**** Q**** 2.05 (2.02–2.07) 1.96 (1.93–2.00) 3.01 (2.93–3.09)
Sinharaja 2000 Q**** Q**** Q**** 1.99 (1.96–2.01) 1.86 (1.82–1.90) 3.01 (2.94–3.07)
La Planada 1997 Q Q**** Q**** 1.78 (1.77–1.79) 1.48 (1.46–1.50) 3.39 (3.33–3.46)
La Planada 2003 Q** Q**** Q** 1.73 (1.72–1.74) 1.40 (1.38–1.41) 3.39 (3.33–3.46)
Luquillo 1992 Q**** P**** E 1.75 (1.73–1.78) 1.46 (1.41–1.50) 3.16 (3.07–3.25)
Palanan 1998 Q**** Q**** Q**** 1.81 (1.80–1.83) 1.61 (1.58–1.64) 2.95 (2.87–3.04)
Yasuni 1997 Q**** Q**** Q* 1.86 (1.85–1.87) 1.62 (1.60–1.64) 3.68 (3.60–3.77)
Yasuni 2004 W Q**** W 1.84 (1.83–1.85) 1.59 (1.57–1.60) 3.65 (3.57–3.72)
Lambir 1992 Q**** Q**** Q**** 1.95 (1.95–1.96) 1.80 (1.79–1.81) 2.91 (2.88–2.94)
Lambir 1997 W Q**** Q**** 1.96 (1.95–1.97) 1.81 (1.80–1.82) 2.91 (2.87–2.94)
Pasoh 1990 Q**** Q**** Q**** 1.93 (1.93–1.94) 1.73 (1.71–1.74) 3.15 (3.11–3.19)
Pasoh 1995 Q**** Q**** Q**** 1.90 (1.89–1.91) 1.66 (1.65–1.68) 3.19 (3.15–3.23)
Pasoh 2000 Q**** Q**** Q**** 1.87 (1.86–1.88) 1.61 (1.60–1.63) 3.18 (3.14–3.22)
Korup 1998 Q**** Q**** Q* 1.96 (1.95–1.97) 1.79 (1.78–1.81) 3.28 (3.23–3.32)
Khao Chong 2001 Q**** Q*** Q 1.84 (1.82–1.86) 1.61 (1.59–1.64) 3.04 (2.97–3.11)
Barro Colorado 1990 Q**** Q**** Q 1.97 (1.96–1.97) 1.81 (1.80–1.82) 2.83 (2.78–2.87)
Barro Colorado 1995 Q**** Q**** W 1.93 (1.93–1.94) 1.76 (1.75–1.77) 2.85 (2.81–2.90)
Barro Colorado 2000 Q**** Q**** Q 1.90 (1.90–1.91) 1.72 (1.71–1.73) 2.84 (2.79–2.88)
Ituri-Edoro 1995 Q**** Q**** Q**** 2.07 (2.05–2.08) 1.90 (1.88–1.92) 2.56 (2.50–2.63)
Ituri-Edoro 2000 Q**** Q**** Q 2.04 (2.02–2.05) 1.86 (1.84–1.88) 2.60 (2.54–2.66)
Ituri-Lenda 1995 Q**** Q**** Q**** 2.13 (2.12–2.15) 2.05 (2.04–2.07) 2.43 (2.38–2.48)
Ituri-Lenda 2000 Q**** Q**** Q**** 2.13 (2.11–2.14) 2.04 (2.02–2.06) 2.42 (2.36–2.47)
Huai Kha Khaeng 1993 Q**** P** Q*** 1.56 (1.54–1.58) 1.17 (1.13–1.21) 2.93 (2.89–2.97)
Huai Kha Khaeng 1999 Q**** W Q*** 1.52 (1.50–1.54) 1.08 (1.04–1.12) 2.95 (2.91–2.99)
Mudumalai 1992 Q**** Q*** Q**** 1.08 (1.06–1.10) )0.06 ()0.22 to 0.10) 2.86 (2.80–2.92)
Mudumalai 1996 Q**** Q**** Q**** 1.04 (1.02–1.05) )0.23 ()0.41 to )0.07) 2.81 (2.75–2.88)
Mudumalai 2000 Q**** Q**** Q**** 1.16 (1.14–1.18) 0.75 (0.67–0.83) 2.75 (2.70–2.81)
The best-fit function is the one with the lowest Akaike Information Criterion (AIC): Weibull (W), power function (P), exponential (E) or
quasi-Weibull (Q) distribution. Asterisks indicate whether the three inferior models have combined Akaike weights of < 0.05 (*), 0.01(**),
0.001(***) or 0.0001(****) (Burnham & Anderson 2002). For every data set, the best-fit power function exponent with its 95% confidence
interval is listed. Confidence intervals were obtained from 1000 bootstraps over 50 · 50-m subplots. Plots are ordered by increasing dryness.
The AIC values for all fits are given in Table S1.
Explaining tropical forest structure 9
� 2006 Blackwell Publishing Ltd/CNRS
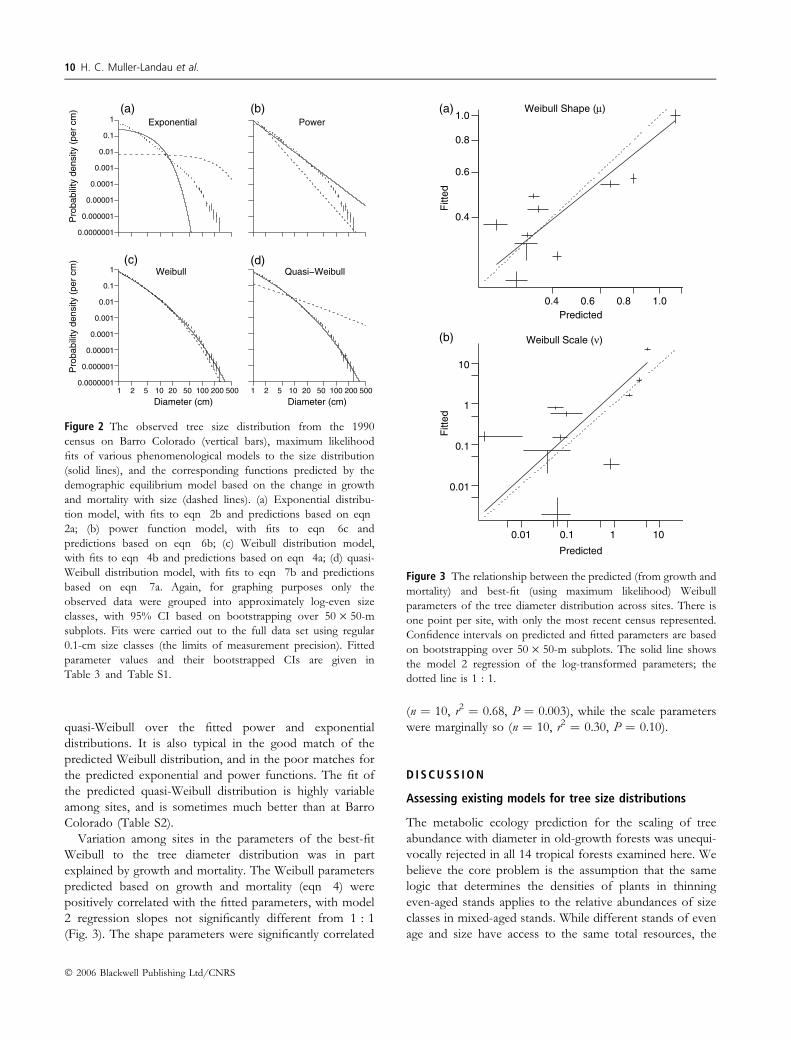
quasi-Weibull over the fitted power and exponential
distributions. It is also typical in the good match of the
predicted Weibull distribution, and in the poor matches for
the predicted exponential and power functions. The fit of
the predicted quasi-Weibull distribution is highly variable
among sites, and is sometimes much better than at Barro
Colorado (Table S2).
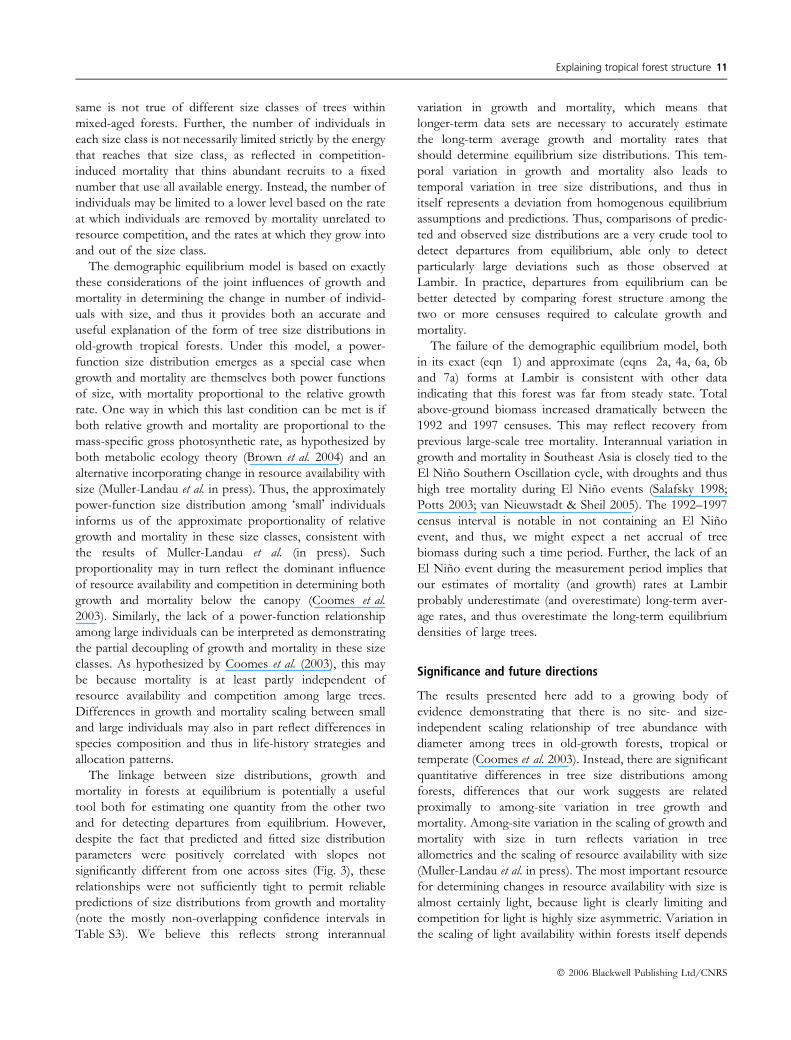
Variation among sites in the parameters of the best-fit
Weibull to the tree diameter distribution was in part
explained by growth and mortality. The Weibull parameters
predicted based on growth and mortality (eqn 4) were
positively correlated with the fitted parameters, with model
2 regression slopes not significantly different from 1 : 1
(Fig. 3). The shape parameters were significantly correlated
(n ¼ 10, r2 ¼ 0.68, P ¼ 0.003), while the scale parameters
were marginally so (n ¼ 10, r2 ¼ 0.30, P ¼ 0.10).
D I S C U S S I O N
Assessing existing models for tree size distributions
The metabolic ecology prediction for the scaling of tree
abundance with diameter in old-growth forests was unequi-
vocally rejected in all 14 tropical forests examined here. We
believe the core problem is the assumption that the same
logic that determines the densities of plants in thinning
even-aged stands applies to the relative abundances of size
classes in mixed-aged stands. While different stands of even
age and size have access to the same total resources, the
Pro
babi
lity
dens
ity (
per
cm)
Diameter (cm)
Exponential Power
Weibull Quasi−Weibull
0.0000001
0.000001
0.00001
0.0001
0.001
0.01
0.1
1
Pro
babi
lity
dens
ity (
per
cm)
0.0000001
0.000001
0.00001
0.0001
0.001
0.01
0.1
1
(a)
(c)
(b)
(d)
200 500100502010521
Diameter (cm)200 500100502010521
Figure 2 The observed tree size distribution from the 1990
census on Barro Colorado (vertical bars), maximum likelihood
fits of various phenomenological models to the size distribution
(solid lines), and the corresponding functions predicted by the
demographic equilibrium model based on the change in growth
and mortality with size (dashed lines). (a) Exponential distribu-
tion model, with fits to eqn 2b and predictions based on eqn
2a; (b) power function model, with fits to eqn 6c and
predictions based on eqn 6b; (c) Weibull distribution model,
with fits to eqn 4b and predictions based on eqn 4a; (d) quasi-
Weibull distribution model, with fits to eqn 7b and predictions
based on eqn 7a. Again, for graphing purposes only the
observed data were grouped into approximately log-even size
classes, with 95% CI based on bootstrapping over 50 · 50-m
subplots. Fits were carried out to the full data set using regular
0.1-cm size classes (the limits of measurement precision). Fitted
parameter values and their bootstrapped CIs are given in
Table 3 and Table S1.
0.4
0.4
0.6
0.8
1.0Weibull Shape (µ)
Predicted
Fitt
edF
itted
0.01
0.1
1
10
Weibull Scale (ν)
Predicted
1010.10.01
(a)
(b)
1.00.80.6
Figure 3 The relationship between the predicted (from growth and
mortality) and best-fit (using maximum likelihood) Weibull
parameters of the tree diameter distribution across sites. There is
one point per site, with only the most recent census represented.
Confidence intervals on predicted and fitted parameters are based
on bootstrapping over 50 · 50-m subplots. The solid line shows
the model 2 regression of the log-transformed parameters; the
dotted line is 1 : 1.
10 H. C. Muller-Landau et al.
� 2006 Blackwell Publishing Ltd/CNRS
same is not true of different size classes of trees within
mixed-aged forests. Further, the number of individuals in
each size class is not necessarily limited strictly by the energy
that reaches that size class, as reflected in competition-
induced mortality that thins abundant recruits to a fixed
number that use all available energy. Instead, the number of
individuals may be limited to a lower level based on the rate
at which individuals are removed by mortality unrelated to
resource competition, and the rates at which they grow into
and out of the size class.
The demographic equilibrium model is based on exactly
these considerations of the joint influences of growth and
mortality in determining the change in number of individ-
uals with size, and thus it provides both an accurate and
useful explanation of the form of tree size distributions in
old-growth tropical forests. Under this model, a power-
function size distribution emerges as a special case when
growth and mortality are themselves both power functions
of size, with mortality proportional to the relative growth
rate. One way in which this last condition can be met is if
both relative growth and mortality are proportional to the
mass-specific gross photosynthetic rate, as hypothesized by
both metabolic ecology theory (Brown et al. 2004) and an
alternative incorporating change in resource availability with
size (Muller-Landau et al. in press). Thus, the approximately
power-function size distribution among �small� individuals
informs us of the approximate proportionality of relative
growth and mortality in these size classes, consistent with
the results of Muller-Landau et al. (in press). Such
proportionality may in turn reflect the dominant influence
of resource availability and competition in determining both
growth and mortality below the canopy (Coomes et al.
2003). Similarly, the lack of a power-function relationship
among large individuals can be interpreted as demonstrating
the partial decoupling of growth and mortality in these size
classes. As hypothesized by Coomes et al. (2003), this may
be because mortality is at least partly independent of
resource availability and competition among large trees.
Differences in growth and mortality scaling between small
and large individuals may also in part reflect differences in
species composition and thus in life-history strategies and
allocation patterns.
The linkage between size distributions, growth and
mortality in forests at equilibrium is potentially a useful
tool both for estimating one quantity from the other two
and for detecting departures from equilibrium. However,
despite the fact that predicted and fitted size distribution
parameters were positively correlated with slopes not
significantly different from one across sites (Fig. 3), these
relationships were not sufficiently tight to permit reliable
predictions of size distributions from growth and mortality
(note the mostly non-overlapping confidence intervals in
Table S3). We believe this reflects strong interannual
variation in growth and mortality, which means that
longer-term data sets are necessary to accurately estimate
the long-term average growth and mortality rates that
should determine equilibrium size distributions. This tem-
poral variation in growth and mortality also leads to
temporal variation in tree size distributions, and thus in
itself represents a deviation from homogenous equilibrium
assumptions and predictions. Thus, comparisons of predic-
ted and observed size distributions are a very crude tool to
detect departures from equilibrium, able only to detect
particularly large deviations such as those observed at
Lambir. In practice, departures from equilibrium can be
better detected by comparing forest structure among the
two or more censuses required to calculate growth and
mortality.
The failure of the demographic equilibrium model, both
in its exact (eqn 1) and approximate (eqns 2a, 4a, 6a, 6b
and 7a) forms at Lambir is consistent with other data
indicating that this forest was far from steady state. Total
above-ground biomass increased dramatically between the
1992 and 1997 censuses. This may reflect recovery from
previous large-scale tree mortality. Interannual variation in
growth and mortality in Southeast Asia is closely tied to the
El Nino Southern Oscillation cycle, with droughts and thus
high tree mortality during El Nino events (Salafsky 1998;
Potts 2003; van Nieuwstadt & Sheil 2005). The 1992–1997
census interval is notable in not containing an El Nino
event, and thus, we might expect a net accrual of tree
biomass during such a time period. Further, the lack of an
El Nino event during the measurement period implies that
our estimates of mortality (and growth) rates at Lambir
probably underestimate (and overestimate) long-term aver-
age rates, and thus overestimate the long-term equilibrium
densities of large trees.
Significance and future directions
The results presented here add to a growing body of
evidence demonstrating that there is no site- and size-
independent scaling relationship of tree abundance with
diameter among trees in old-growth forests, tropical or
temperate (Coomes et al. 2003). Instead, there are significant
quantitative differences in tree size distributions among
forests, differences that our work suggests are related
proximally to among-site variation in tree growth and
mortality. Among-site variation in the scaling of growth and
mortality with size in turn reflects variation in tree
allometries and the scaling of resource availability with size
(Muller-Landau et al. in press). The most important resource
for determining changes in resource availability with size is
almost certainly light, because light is clearly limiting and
competition for light is highly size asymmetric. Variation in
the scaling of light availability within forests itself depends
Explaining tropical forest structure 11
� 2006 Blackwell Publishing Ltd/CNRS
on the tree size distribution and especially the abundances
of large trees (Nicotra et al. 1999; Montgomery & Chazdon
2001; Montgomery 2004). Thus, ultimately, variation in tree
size distributions and resource availability is interlinked and
feeds back upon itself, and a complete explanation requires
an understanding of these linkages.
Despite the observed variability, there is considerable
consistency in the scaling of size distributions within and
among closed canopy forests – indeed, more than would be
expected based on growth and mortality alone. This is
especially evident for subcanopy individuals and within sites,
where the growth and mortality patterns (Muller-Landau et
al. in press) are more variable among censuses than the size
distributions. This consistency indicates the presence of
negative feedbacks, such that a decrease in the abundance of
trees results in increased growth and decreased mortality
until the forest returns to its previous size distribution.
Models that explicitly incorporate resource dynamics can
capture these types of feedbacks (Pacala et al. 1996; Chave
1999), and such models provide the best avenue for
understanding the ultimate causes of the similarities and
differences among forests observed here.
Muller-Landau et al. (in press) hypothesize that the key
factor for understanding differences and similarities in
growth and mortality functions among forests is the relative
degree to which large individuals can monopolize resources
vs. the degree to which their abundance and resource
monopolization are limited by other factors such as lethal
disturbances (Coomes et al. 2003) or relatively more
symmetric resource competition (Stoll et al. 2002). We
propose that this same factor is critical for tree size
distributions as well. Among-site variation in size distribu-
tions is, by definition, greatest between what we refer to as
closed and open canopy forests. In open canopy forests, the
abundance of large trees is obviously far below its
theoretical maximum – in the two forests here because of
recurring fire and elephants (Sukumar et al. 2005). Even in
closed canopy forests, the densities of large trees are limited
by the mortality imposed by droughts, wind storms,
lightning and disease. In some cases, mortality rates of
large trees may be fairly similar across years, reflecting the
dominance of frequent small-scale events; in other cases,
strong interannual variation may reflect the importance of
rare and typically large-scale events (Asner et al. 2000;
Williamson et al. 2000). It will take much longer-term
records than we have to date to disentangle the relative
influences of different processes in determining large tree
mortality rates.
If we are correct, then attempts to understand geograph-
ical variation in the above-ground biomass of tropical
forests today and to predict future changes to associated
carbon stores should focus on the determinants of mortality
rates of large trees (Loehle 1988, 2000). The gaps made in
the canopy by the deaths of large trees due to disturbances
or droughts may quickly be filled by smaller trees, but the
gaps in the size class are not. Anthropogenic global change
may be increasing the frequency and severity of cyclones
and hurricanes (Webster et al. 2005), which can cause great
increases in tropical tree mortality (Zimmerman et al. 1994).
These changes may lead to permanently lower long-term
average abundances of large trees in many tropical forests,
and concomitant decreases in above-ground carbon stores.
A better, more mechanistic understanding of tropical forest
structure and dynamics will provide insight into both
geographical variation today and future forest change.
A C K N O W L E D G E M E N T S
We thank Joe Wright, Steve Pacala, Jerome Chave, Bert
Leigh, David Coomes, Robin Chazdon, and two anonymous
referees for comments on the manuscript, Deborah Clark
and Gary Mittelbach for useful suggestions, and Sandy
Weisberg of the University of Minnesota School of Statistics
for statistical advice. We gratefully acknowledge the
contributions of the many dedicated people and generous
funders that have made possible the forest dynamics plot
data sets upon which this research is based. We especially
thank the US National Science Foundation for funding the
workshop at which this study was initiated (DEB-9806828).
HCM thanks the University of Minnesota and the National
Center for Ecological Analysis and Synthesis, a centre
funded by NSF and the state of California, for support. This
material was developed while JKZ was serving at the
National Science Foundation. Any opinions, findings,
conclusions or recommendations expressed in this material
are those of the authors and do not necessarily reflect the
views of the National Science Foundation.
R E F E R E N C E S
Ashton, P.S. & Hall, P. (1992). Comparisons of structure among
mixed dipterocarp forests of north-western Borneo. J. Ecol., 80,
459–481.
Asner, G.P., Townsend, A.R. & Braswell, B.H. (2000). Satellite
observation of El Nino effects on Amazon forest phenology and
productivity. Geophys. Res. Lett., 27, 981–984.
Bailey, R.L. & Dell, T.R. (1973). Quantifying diameter distributions
with Weibull function. For. Sci., 19, 97–104.
Baker, T.R., Phillips, O.L., Malhi, Y., Almeida, S., Arroyo, L.,
Di Fiore, A. et al. (2004). Increasing biomass in Amazonian
forest plots. Philos. Trans. R. Soc. Lond. Ser. B, Biol. Sci., 359, 353–
365.
Brown, J.H., Gillooly, J.F., Allen, A.P., Savage, V.M. & West, G.B.
(2004). Toward a metabolic theory of ecology. Ecology, 85, 1771–
1789.
Burnham, K.P. & Anderson, D.R. (2002). Model Selection and
Inference: A Practical Information-theoretic Approach, 2nd edn.
Springer, New York, NY.
12 H. C. Muller-Landau et al.
� 2006 Blackwell Publishing Ltd/CNRS
Chave, J. (1999). Study of structural, successional and spatial pat-
terns in tropical rain forests using TROLL, a spatially explicit
forest model. Ecol. Modell., 124, 233–254.
Chave, J., Riera, B. & Dubois, M.A. (2001). Estimation of biomass
in a neotropical forest of French Guiana: spatial and temporal
variability. J. Trop. Ecol., 17, 79–96.
Condit, R. (1998). Tropical Forest Census Plots. Springer-Verlag,
Berlin and R. G. Landes Company, Georgetown, TX, USA.
Condit, R., Sukumar, R., Hubbell, S.P. & Foster, R.B. (1998).
Predicting population trends from size distributions: a direct test
in a tropical tree community. Am. Nat., 152, 495–509.
Coomes, D.A., Duncan, R.P., Allen, R.B. & Truscott, J. (2003).
Disturbances prevent stem size-density distributions in natural
forests from following scaling relationships. Ecol. Lett., 6, 980–
989.
DeLiocourt, F. (1898). De l’amenagement des sapinieres. Soc. For.
Franche-comte Belfort Bull., 6, 369–405.
Dixon, R.K., Brown, S., Houghton, R.A., Solomon, A.M., Trexler,
M.C. & Wisniewski, J. (1994). Carbon pools and flux of global
forest ecosystems. Science, 263, 185–190.
Ebert, T.A., Schroeter, S.C. & Dixon, J.D. (1993). Inferring
demographic-processes from size-frequency distributions – effect
of pulsed recruitment on simple-models. Fish. Bull., 91, 237–243.
Enquist, B.J. & Niklas, K.J. (2001). Invariant scaling relations
across plant communities. Nature, 410, 655–660.
Enquist, B.J., Brown, J.H. & West, G.B. (1998). Allometric scaling
of plant energetics and population density. Nature, 395, 163–165.
Enquist, B.J., West, G.B., Charnov, E.L. & Brown, J.H. (1999).
Allometric scaling of production and life-history variation in
vascular plants. Nature, 401, 907–911.
Goff, F.G. & West, D. (1975). Canopy-understory interaction
effects on forest population structure. For. Sci., 21, 98–107.
Goodburn, J.M. & Lorimer, C.G. (1999). Population structure in
old-growth and managed northern hardwoods: an examination
of the balanced diameter distribution concept. For. Ecol. Manage,
118, 11–29.
Johnson, N.L., Kotz, S. & Balakrishnan, N. (1994). Continuous
Univariate Distributions, 2nd edn. John Wiley & Sons, New York,
NY.
Kohyama, T. (1991). Simulating stationary size distribution of trees
in rain forests. Ann. Bot., 68, 173–180.
Kohyama, T., Suzuki, M., Partomihardjo, T., Yamada, T. & Kubo,
T. (2003). Tree species differentiation in growth, recruitment
and allometry in relation to maximum height in a Bornean mixed
dipterocarp forest. J. Ecol., 91, 797–806.
Kulldorff, G. (1961). Contributions to the Theory of Estimation from
Grouped and Partially Grouped Samples. Wiley, New York, NY.
Leak, W.B. (1964). An expression of diameter distribution for
unbalanced, uneven-aged stands and forests. For. Sci., 10, 39–50.
Loehle, C. (1988). Tree life history strategies: the role of defenses.
Can. J. For. Res., 18, 209–222.
Loehle, C. (2000). Strategy space and the disturbance spectrum: a
life-history model for tree species coexistence. Am. Nat., 156,
14–33.
Lorimer, C.G. & Frelich, L.E. (1984). A simulation of equilibrium
diameter distributions of sugar maple (Acer saccharum). Bull. Torrey
Bot. Club, 111, 193–199.
Losos, E.C. & Leigh, E.G. (2004). Forest Diversity and Dynamism:
Findings from a Network of Large-scale Tropical Forest Plots. University
of Chicago Press, Chicago, IL.
Meyer, H.A. & Stevenson, D.D. (1943). The structure and growth
of virgin beech-birch-hemlock forests in northern Pennsylvania.
J. Agric. Res., 67, 465–484.
Montgomery, R.A. (2004). Effects of understory foliage on pat-
terns of light attenuation near the forest floor. Biotropica, 36,
33–39.
Montgomery, R.A. & Chazdon, R.L. (2001). Forest structure,
canopy architecture, and light transmittance in tropical wet
forests. Ecology, 82, 2707–2718.
Moser, J.W. (1972). Dynamics of an uneven-aged forest stand. For.
Sci., 18, 184–191.
Muller-Landau, H.C., Condit, R.S., Chave, J., Thomas, S.C.,
Bohlman, S.A., Bunyavejchewin, S. et al. (2006). Testing meta-
bolic ecology theory for allometric scaling of tree size, growth,
and mortality in tropical forests. Ecol. Lett. doi: 10.1111/j.1461-
0248.2006.00905.x
Nicotra, A.B., Chazdon, R.L. & Iriarte, S.V.B. (1999). Spatial het-
erogeneity of light and woody seedling regeneration in tropical
wet forests. Ecology, 80, 1908–1926.
van Nieuwstadt, M.G.L. & Sheil, D. (2005). Drought, fire and tree
survival in a Borneo rain forest, East Kalimantan, Indonesia.
J. Ecol., 93, 191–201.
Niklas, K.J., Midgley, J.J. & Rand, R.H. (2003). Tree size frequency
distributions, plant density, age and community disturbance.
Ecol. Lett., 6, 405–411.
Pacala, S.W., Canham, C.D., Saponara, J., Silander, J.A.J., Kobe,
R.K. & Ribbens, E. (1996). Forest models defined by field
measurements: estimation, error analysis and dynamics. Ecol.
Monogr., 66, 1–43.
Potts, M.D. (2003). Drought in a Bornean everwet rain forest.
J. Ecol., 91, 467–474.
Salafsky, N. (1998). Drought in the rain forest, part II – an
update based on the 1994 ENSO event. Clim. Change, 39,
601–603.
Schwartz, J.W., Nagel, L.M. & Webster, C.R. (2005). Effects of
uneven-aged management on diameter distribution and species
composition of northern hardwoods in Upper Michigan. For.
Ecol. Manage, 211, 356–370.
Sinko, J.W. & Streifer, W. (1967). A new model for age-size
structure of a population. Ecology, 48, 910–918.
Smith, B.D., Botsford, L.W. & Wing, S.R. (1998). Estimation of
growth and mortality parameters from size frequency distributions
lacking age patterns: the red sea urchin (Strongylocentrotus fran-
ciscanus) as an example. Can. J. Fish. Aquat. Sci., 55, 1236–1247.
Stoll, P., Weiner, J., Muller-Landau, H., Muller, E. & Hara, T.
(2002). Size symmetry of competition alters biomass-density
relations. Proc. R. Soc. Biol. Sci. Ser. B, 269, 2191–2195.
Sukumar, R., Suresh, H.S., Dattaraja, H.S., Srinidhi, S. & Nath, C.
(2005). The dynamics of a tropical dry forest in India: climate,
fire, elephants and the evolution of life-history strategies. In:
Biotic Interactions in the Tropics: Their Role in the Maintenance of Species
Diversity (eds Burslem, D., Pinard, M. & Hartley, S.). Cambridge
University Press, Cambridge, pp. 510–529.
Ter Steege, H., Pitman, N., Sabatier, D., Castellanos, H., Van der
Hout, P., Daly, D.C. et al. (2003). A spatial model of tree alpha-
diversity and tree density for the Amazon. Biodivers. Conserv., 12,
2255–2277.
Von Foerster, H. (1959). Some remarks on changing populations.
In: The Kinetics of Cellular Proliferation (ed. Stohlman, F. Jr). Grune
and Stratton, New York, NY, pp. 382–407.
Explaining tropical forest structure 13
� 2006 Blackwell Publishing Ltd/CNRS

Webster, P.J., Holland, G.J., Curry, J.A. & Chang, H.-R. (2005).
Changes in tropical cyclone number, duration, and intensity in a
warming environment. Science, 309, 1844–1846.
West, G.B., Brown, J.H. & Enquist, B.J. (1997). A general model
for the origin of allometric scaling laws in biology. Science, 276,
122–126.
West, G.B., Brown, J.H. & Enquist, B.J. (1999). A general model
for the structure and allometry of plant vascular systems. Nature,
400, 664–667.
Williamson, G.B., Laurance, W.F., Oliveira, A.A., Delamonica, P.,
Gascon, C., Lovejoy, T.E. et al. (2000). Amazonian tree
mortality during the 1997 El Nino drought. Conserv. Biol., 14,
1538–1542.
Wright, S.J. (2005). Tropical forests in a changing environment.
Trends Ecol. Evol., 20, 553–562.
Wright, S.J., Muller-Landau, H.C., Condit, R. & Hubbell, S.P.
(2003). Shade tolerance, realized vital rates, and size distributions
of tropical trees. Ecology, 84, 3174–3185.
Zimmerman, J.K., Everham, E.M. III, Waide, R.B., Lodge, D.J.,
Taylor, C.M. & Brokaw, N.V.L. (1994). Responses of tree
species to hurricane winds in subtropical wet forest in Puerto
Rico: implications for tropical tree life histories. J. Ecol., 82, 911–
922.
S U P P L E M E N T A R Y M A T E R I A L
The following supplementary material is available online
from http://www.Blackwell-Synergy.com:
Appendix S1 Derivations of tree size distributions from
growth and mortality relationships.
Appendix S2 Details of the methods for fitting growth and
mortality.
Table S1 Akaike Information Criteria for the phenomeno-
logical fits to the tree size distributions.
Table S2 Log likelihoods of the observed size distributions
under the predictions based on growth and mortality
parameters.
Table S3 Parameters of the fitted and predicted size
distributions.
Figure S1 Observed, predicted and fitted tree size distribu-
tions for all sites.
Editor, Marcel Rejmanek
Manuscript received 19 December 2005
First decision made 27 January 2006
Manuscript accepted 6 February 2006
14 H. C. Muller-Landau et al.
� 2006 Blackwell Publishing Ltd/CNRS