Suboptimal wavelet denoising of coaveraged spectra employing statistics from individual scans
Upload
independentCategory
view
2download
0
Comparing Retinal Thickness MeasurementsUsing Automated Fast Macular ThicknessMap versus Six-Radial Line Scans withManual Measurements
Mehran Taban, MD, Sumit Sharma, BS, Dawn R. Williams, RN, Nadia Waheed, MD, Peter K. Kaiser, MD
Purpose: To compare automated retinal thickness values generated by the fast macular thickness maps(FMTM) and customized 6-radial line scans (RLS) versus manual retinal measurements on Stratus opticalcoherence tomography (OCT) (Carl Zeiss Meditec, Dublin, CA).
Design: Prospective, observational case series.Participants: Patients with subfoveal choroidal neovascularization (CNV) caused by age-related macular
degeneration (AMD), diabetic macular edema (DME), or branch/central retinal vein occlusion (RVO).Methods: Patients were prospectively imaged using the FMTM and customized RLS patterns on Stratus
OCT at the same sitting. Each scan was evaluated for errors in retinal segmentation (i.e., correct retinalboundaries [CRB]). Automated values were recorded while central retinal thickness measurements were deter-mined manually for both patterns. The presence or absence of epiretinal phenomenon, cystoid spaces, pigmentepithelial detachment, and subretinal fluid was also noted.
Main Outcome Measures: Errors in retinal segmentation at and outside the fovea (i.e., CRB) and percent-age of automated values within a clinically acceptable margin (�25 �m) of the manual central retinal thickness.
Results: A total of 147 eyes of 147 patients (95 eyes with exudative AMD, 41 eyes with DME, and 11 eyeswith macular edema caused by RVO) were included. For wet AMD, the total number of CRB at the fovea andoutside the fovea was 363 (63.7%) and 360 (63.2%), respectively, in FMTM and 428 (75.1%) and 426 (74.7%),respectively, in RLS (P�0.0001 for both). For DME and RVO, the total number of CRB at the fovea and outsidethe fovea was 274 (87.8%) and 256 (82.1%), respectively, in FMTM and 287 (92.0%) and 270 (86.5%),respectively, in RLS (P � 0.11, P � 0.15, respectively). Some 40% and 56% of automated foveal center pointthicknesses on FMTM and RLS, respectively, were within �25 �m of the manual central retinal thickness for AMD(P � 0.042), versus 94% and 81% for DME and RVO, respectively (P � 0.07).
Conclusions: For exudative AMD, the RLS protocol provides fewer segmentation errors than the FMTMprotocol, and its automated retinal thickness values (e.g., foveal center point, central subfield) correlate betterwith manual retinal thickness measurement than FMTM. In DME and RVO, however, both protocols providesimilar and low segmentation errors, and their automated results are close to manual measurements.
Financial Disclosure(s): Proprietary or commercial disclosure may be found after the references.
Ophthalmology 2009;116:964–970 © 2009 by the American Academy of Ophthalmology.With the increasing number of clinical trials evaluating newpharmacologic treatments for retinal diseases, a reliablemethod to assess and compare retinal status (e.g., retinalthickness) over time in these trials and in clinical practice isneeded. Fluorescein angiography, although valuable forevaluation of retinal diseases (especially for the detection ofvascular leakage), does not provide a quantitative assess-ment of retinal thickening.1 Optical coherence tomography(OCT) is a noninvasive, noncontact imaging modality thatprovides high-resolution, cross-sectional images of the eye.OCT has therefore emerged as a useful tool for quantita-tively measuring retinal thickness and is increasingly beingused in clinical trials and clinical practice, with the mainoutcome measure often being reported as “central retinal
thickness.”2–8 These measurements are made using the au-964 © 2009 by the American Academy of OphthalmologyPublished by Elsevier Inc.
tomated software built into the Stratus (Carl Zeiss Meditec,Dublin, CA) OCT machine (e.g., foveal center point andcentral subfield thickness). These automated measures relyon the software correctly identifying the inner and outerboundaries of the retina. However, automatic retinal bound-ary determination by the software may be incorrect; thus,central retinal thickness measurements used in clinical prac-tice and trials may be inaccurate. Because many physiciansand clinical trials rely on this measure, it is important todetermine its accuracy.
Two different OCT scan modes can be used to generatethe data for a macular thickness map. The fast macularthickness map (FMTM) protocol consists of 6 single-linescans in a radial formation with 125 A-scans on each line,
centered on the fovea. The radial line scan (RLS) protocolISSN 0161-6420/09/$–see front matterdoi:10.1016/j.ophtha.2008.12.033
Taban et al � Retinal Measurements Using Fast Macular Thickness Map
consists of 6 single-line scans in a radial formation centeredon the fovea, with 512 A-scans on each line, which thephotographer places sequentially and individually. TheFMTM results in faster overall acquisition time, in contrastwith the higher resolution of RLS. Studies comparing these2 protocols are limited in the literature. Menke and Feke9
evaluated the boundary error rate of FMTM compared withRLS in only 28 patients with wet age-related macular de-generation (AMD) and reported that FMTM performed bet-ter.9 However, they did not analyze retinal thickness mea-surement between these 2 modalities compared with astandard manual measurement. Another limitation of thisstudy was the exclusion of scans with “weak scan signal andpoor image quality” without providing details.9
Sadda et al10 reported that there is no difference betweenautomated values derived from RLS relative to manualmeasurements using custom software in 20 normal patients.However, they did not analyze subjects with retinal disease,such as AMD or diabetic macular edema (DME). Joeres etal11 compared intergrader reproducibility in eyes with AMDusing automated values from FMTM versus RLS. However,they used custom software to draw boundaries manually onthe OCT scans, and they also did not compare these valueswith standard measurements. In another study, the samegroup compared automated values from RLS protocol withtheir customized manual technique.12 However, no compar-ison was made with the FMTM protocol, which is thecommon protocol used in most clinical studies.
The aim of this report is to compare retinal thicknessvalues and placement of retinal boundaries using the auto-mated protocols of the Stratus OCT versus manual measure-ments in patients with neovascular AMD, DME, and veinocclusion using 2 scan protocols: the faster acquisitionFMTM (low resolution) and the slower, higher-resolutionRLS protocol. Although more advanced OCT technologiesare becoming available (i.e., spectral domain), the less-expensive Stratus OCT is still the predominant OCT ma-chine used in retina, both in practice and across clinicaltrials; therefore, this study is important with practicalimplications.
Materials and Methods
After Cleveland Clinic Institutional Review Board approval wasobtained, a prospective study of all patients who underwent OCTevaluation for AMD, DME, or macular edema caused by branch orcentral retinal vein occlusion (RVO) was performed. Patients wereincluded in the study if they had a diagnosis of subfoveal neovas-cular AMD, DME, or macular edema caused by branch/centralRVO and had an OCT scan on the Stratus OCT using both theFMTM and RLS protocols at the same sitting by a photographercertified to perform OCT scans in retinal clinical trials, and gavewritten informed consent. Patients were excluded if they had morethan 1 diagnosis.
Optical Coherence TomographyAcquisition/Scanning Protocol
All scans were obtained through a dilated pupil by experienced,
certified OCT photographers. Scans assessed by the photographersto be of unacceptable quality (e.g., not centered) were not saved oranalyzed. Scans were reacquired as needed to optimize scan qual-ity (e.g., clarity, signal strength) and minimize eye movementduring the scan. The OCT device used was the commerciallyavailable Stratus OCT using version 4.0 software (Carl ZeissMeditec).
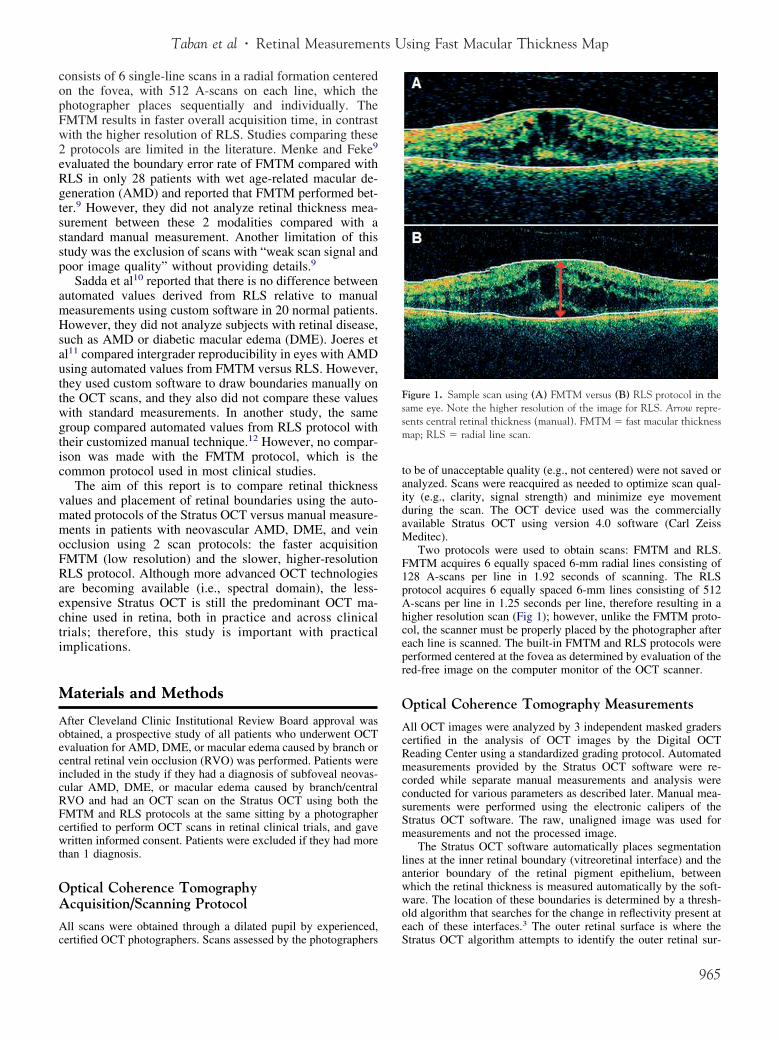
Two protocols were used to obtain scans: FMTM and RLS.FMTM acquires 6 equally spaced 6-mm radial lines consisting of128 A-scans per line in 1.92 seconds of scanning. The RLSprotocol acquires 6 equally spaced 6-mm lines consisting of 512A-scans per line in 1.25 seconds per line, therefore resulting in ahigher resolution scan (Fig 1); however, unlike the FMTM proto-col, the scanner must be properly placed by the photographer aftereach line is scanned. The built-in FMTM and RLS protocols wereperformed centered at the fovea as determined by evaluation of thered-free image on the computer monitor of the OCT scanner.
Optical Coherence Tomography Measurements
All OCT images were analyzed by 3 independent masked graderscertified in the analysis of OCT images by the Digital OCTReading Center using a standardized grading protocol. Automatedmeasurements provided by the Stratus OCT software were re-corded while separate manual measurements and analysis wereconducted for various parameters as described later. Manual mea-surements were performed using the electronic calipers of theStratus OCT software. The raw, unaligned image was used formeasurements and not the processed image.
The Stratus OCT software automatically places segmentationlines at the inner retinal boundary (vitreoretinal interface) and theanterior boundary of the retinal pigment epithelium, betweenwhich the retinal thickness is measured automatically by the soft-ware. The location of these boundaries is determined by a thresh-old algorithm that searches for the change in reflectivity present ateach of these interfaces.3 The outer retinal surface is where the
Figure 1. Sample scan using (A) FMTM versus (B) RLS protocol in thesame eye. Note the higher resolution of the image for RLS. Arrow repre-sents central retinal thickness (manual). FMTM � fast macular thicknessmap; RLS � radial line scan.
Stratus OCT algorithm attempts to identify the outer retinal sur-
965
Ophthalmology Volume 116, Number 5, May 2009
face; however, the resolution of the Stratus OCT is limited, espe-cially in the FMTM, such that the inner margin of the RPE andinner/outer segment barrier is seen as one structure. In this studythe outer retinal surface was identified as the first highly reflectivestructure, which is what the Stratus OCT algorithm also attemptsto identify.
To evaluate the success of the software at determining thecorrect retinal boundaries (CRB) on each of the 6 line scans fromeach pattern, graders evaluated the location of the inner and outerretinal boundary lines generated by the automated OCT algorithmand used by the machine for retinal thickness calculations. Eachboundary was graded as “correct” if they followed the inner orouter retinal boundary. The number of CRB (range 0–6) at thefovea and outside the fovea was recorded for each scan. Therefore,for each eye, 12 notations were noted for CRB (6 at the fovea, 6outside the fovea). For the purposes of grading scans, the fovealarea was defined as the 1-mm area surrounding the site of thefoveal depression or the central 1 mm of the scan if no fovealdepression was visible.
Definition and TerminologyTwo automated measurements using the “retinal thickness/volume(OU)” analysis algorithm of the Stratus OCT software were re-
Table 1. Retinal Thicknesses and Differences among the V
Measure No.
FMTMFoveal center point thickness 95Central subfield 95CRT 95Central subfield, CRT 95Foveal center point thickness, CRT 95Central subfield, Foveal center point thickness 95
Radial Line ScanFoveal center point thickness 95Central subfield 95CRT 95Central subfield, CRT 95Foveal center point thickness, CRT 95Central subfield, foveal center point thickness 95
CRT � central retinal thickness (manually measured); FMTM � fast maAll measurements are �m.
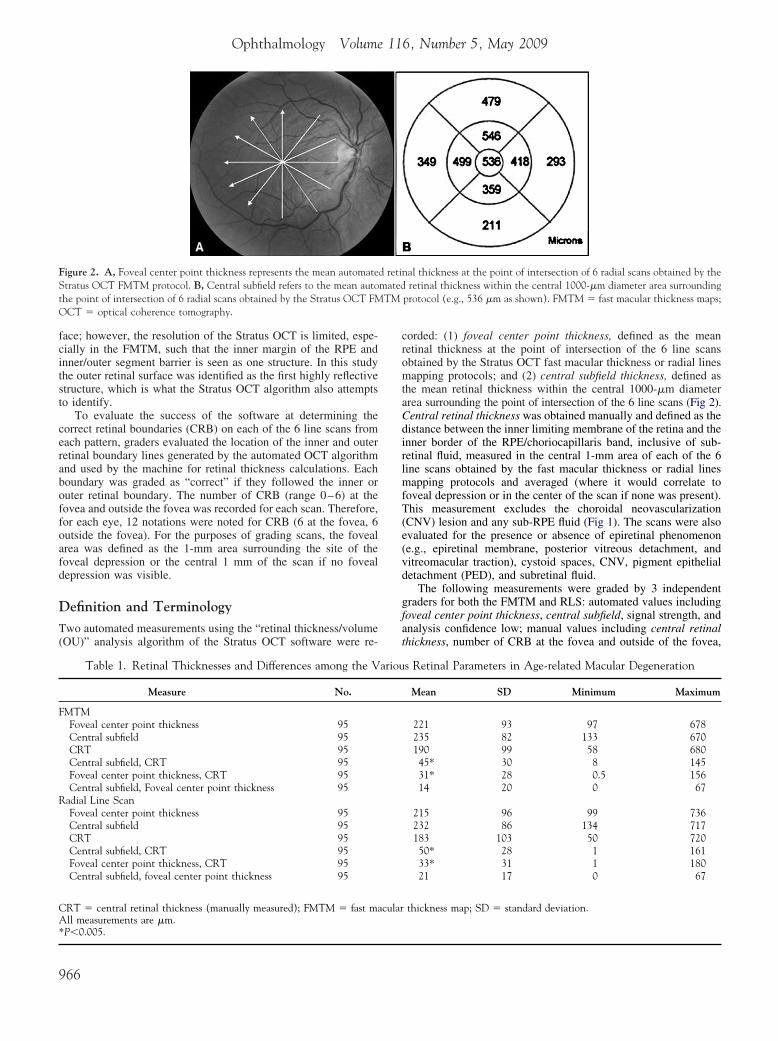
Figure 2. A, Foveal center point thickness represents the mean automateStratus OCT FMTM protocol. B, Central subfield refers to the mean autothe point of intersection of 6 radial scans obtained by the Stratus OCT FMOCT � optical coherence tomography.
*P�0.005.
966
corded: (1) foveal center point thickness, defined as the meanretinal thickness at the point of intersection of the 6 line scansobtained by the Stratus OCT fast macular thickness or radial linesmapping protocols; and (2) central subfield thickness, defined asthe mean retinal thickness within the central 1000-�m diameterarea surrounding the point of intersection of the 6 line scans (Fig 2).Central retinal thickness was obtained manually and defined as thedistance between the inner limiting membrane of the retina and theinner border of the RPE/choriocapillaris band, inclusive of sub-retinal fluid, measured in the central 1-mm area of each of the 6line scans obtained by the fast macular thickness or radial linesmapping protocols and averaged (where it would correlate tofoveal depression or in the center of the scan if none was present).This measurement excludes the choroidal neovascularization(CNV) lesion and any sub-RPE fluid (Fig 1). The scans were alsoevaluated for the presence or absence of epiretinal phenomenon(e.g., epiretinal membrane, posterior vitreous detachment, andvitreomacular traction), cystoid spaces, CNV, pigment epithelialdetachment (PED), and subretinal fluid.
The following measurements were graded by 3 independentgraders for both the FMTM and RLS: automated values includingfoveal center point thickness, central subfield, signal strength, andanalysis confidence low; manual values including central retinalthickness, number of CRB at the fovea and outside of the fovea,
s Retinal Parameters in Age-related Macular Degeneration
Mean SD Minimum Maximum
221 93 97 678235 82 133 670190 99 58 68045* 30 8 14531* 28 0.5 15614 20 0 67
215 96 99 736232 86 134 717183 103 50 72050* 28 1 16133* 31 1 18021 17 0 67
thickness map; SD � standard deviation.
nal thickness at the point of intersection of 6 radial scans obtained by theretinal thickness within the central 1000-�m diameter area surrounding
protocol (e.g., 536 �m as shown). FMTM � fast macular thickness maps;
ariou
cular
d retimatedTM
Taban et al � Retinal Measurements Using Fast Macular Thickness Map
and presence or absence of epiretinal membrane, cystoid spaces,CNV, PED, and subretinal fluid.
Statistical Analysis
Scatter plots of manual measurements of FMTM versus RLSprotocols with reference lines at 45 degrees and concordancecorrelations with 95% confidence intervals were computed tomeasure the agreement of manual measurements between the 2protocols. A concordance correlation takes into account both thelinear association between the 2 measures and the distance of eachpair of observations from the 45-degree line. A 45-degree linerepresents equivalence (slope of 1).
Bland-Altman plots, which plot the differences between mea-surements, show whether the difference between the 2 measures(measurement error) differs across the range of observed retinalthickness (which is estimated by average of the 2 measurementswith reference lines at 0). The percent of observations (eyes)within clinically acceptable differences of �25 �m (2 times thestandard error of the Stratus OCT scanner) was calculated as ameasurement of agreement. The mean of measurements of 6 scansfor each eye was used for these comparisons.
Chi-square and Fisher exact tests were used to determine sig-nificant differences between the FMTM and RLS mapping proto-col values, such as the number of CRB. The associations ofepiretinal phenomenon, cystoid spaces, CNV, PED, and subretinalfluid to the percentage of measurements within the clinicallyacceptable difference of �25 �m were also compared using chi-square tests.
Results
A total of 147 eyes (147 patients) were included in the study,including 95 eyes (95 patients) with subfoveal neovascular AMD,41 eyes (41 patients) with DME, and 11 eyes (11 patients) withmacular edema from branch or central RVO. For the purposes ofanalysis, all eyes with macular edema caused by diabetes or veinocclusions were considered as one entity (i.e., 52 eyes) becausethey exhibit similar findings on OCT. The mean, standard devia-tion, and range of the retinal thickness parameters and their dif-
Table 2. Retinal Thicknesses and Differences among the Vario
Measure No.
FMTMFoveal center point thickness 52Central subfield 52CRT 52Central subfield, CRT 52Foveal center point thickness, CRT 52Central subfield, foveal center point thickness 52
Radial Line ScanFoveal center point thickness 52Central subfield 52CRT 52Central subfield, CRT 52Foveal center point thickness, CRT 52Central subfield, foveal center point thickness 52
CRT � central retinal thickness (manually measured); FMTM � fast maAll measurements are �m.
ferences are presented in Tables 1 and 2.
The total numbers of CRB at and outside the fovea for eyeswith exudative AMD versus eyes with macular edema secondaryto diabetic retinopathy or branch/central vein occlusion (“macularedema”) are shown in Table 3. The difference between the FMTMand RLS protocols, either at or outside the fovea, was found to besignificant for exudative AMD (P�0.0001 for both), but not formacular edema (P � 0.11 at the fovea, P � 0.15 outside thefovea). There was no difference in the rate of error at the foveaversus outside the fovea within either group.
A total of 38 (40%) and 58 (61%) of wet AMD eyes had �4 of6 scans with CRB at the fovea for FMTM and RLS protocols,respectively (P � 0.006) (Table 4). A total of 44 (84.6%) and 45(86.5%) of macular edema eyes had �4 of 6 scans with CRB at thefovea for FMTM and RLS protocols, respectively (P � 1.0) (Table 4).
Bland-Altman plots comparing differences between the auto-mated foveal center point thickness and manual measurements inboth FMTM and RLS protocols are shown in Figure 3. Compar-ison of the number of eyes within the clinically acceptable cutoffof �25 �m with the FMTM and RLS protocols found this differ-ence to be significant for subjects with AMD, with 38 eyes(40.0%) on the FMTM protocol versus 53 eyes (55.8%) on theRLS protocol (P � 0.042), but not for subjects with macularedema, with 49 eyes (94.2%) on the FMTM protocol versus 42eyes (80.8%) on the RLS protocol (P � 0.07). There was astatistically nonsignificant greater number of scans in which the
etinal Parameters in Diabetic Macular Edema/Vein Occlusion
Mean SD Minimum Maximum
314 193 91 809329 173 147 757309 199 73 82920 32 4 745 13 0 41
15 26 1 70
306 181 111 758322 163 145 749304 188 79 80118 38 7 1072 27 0 109
16 25 1 52
thickness map; SD � standard deviation.
Table 3. Number of Correct Retinal Boundaries at the Foveaversus Outside the Fovea
Location
Fast Macular Thickness Radial Lines
% of ScansDME/VO†
% of ScansAMD*
% of ScansDME/VO†
% of ScansAMD*
Fovea 87.8 63.7 92.0 75.1Outside fovea 82.1 63.2 86.5 74.7
AMD � age-related macular degeneration; DME � diabetic macularedema; VO � vein occlusion.*AMD ¡ P�0.0001 for FMTM versus RLS protocols, either at the foveaor outside the fovea.†Diabetic/vascular occlusion ¡ P � 0.11 at the fovea and P � 0.15 outside
us R
cular
the fovea for FMTM versus RLS protocols.
967

aries;
Ophthalmology Volume 116, Number 5, May 2009
RLS protocol performed worse than the FMTM protocol in eyeswith macular edema, which is discussed later.
Scatter plots with corresponding concordance correlations and95% confidence intervals for the agreement between manual cen-tral retinal thickness measurements of FMTM versus RLS proto-cols for both AMD and macular edema eyes are depicted in Figure 4.They reveal that manual measurements correlate highly to eachother, whether performed on the FMTM protocol or the RLSprotocol for either pathology.
Signal strength distribution was similar between both OCTprotocols and disease types because they use the same OCTdevice. Signal strength had a mean of 6 (range, 3–9) and 5.7(range, 3–9) for FMTM and RLS, respectively, in AMD comparedwith a mean of 5.3 (range, 2–8) and 5 (range, 2–8) for FMTM andRLS, respectively, in macular edema.
The associations of epiretinal phenomenon, cystoid spaces,CNV, PED, and subretinal fluid to the percentage of measurements
Table 4. Distribution of Corre
No. of CRB
Fast Macular Thickness
No. of Eyes (%) DME/VO No. of Eyes (%
0 0 (0) 2 (2.11 0 (0) 11 (11.2 2 (3.8) 9 (9.53 2 (3.8) 17 (17.4 4 (7.7) 18 (18.5 16 (30.8) 17 (17.6 28 (53.8) 21 (22.
Total 52 (100) 95 (100
AMD � age-related macular degeneration; CRB � correct retinal bound
Figure 3. Bland-Altman plots for the differences between automated foveFMTM; (B) exudative AMD using RLS; (C) diabetes/vein occlusion using�25 �m (clinically acceptable boundaries). Inbox represents percentage of
macular degeneration; CRT � central retinal thickness; FMTM � fast macula968
within the clinically acceptable difference of �25 �m were foundto be insignificant (Table 5).
Discussion
With its noncontact, noninvasive, fast acquisition time andability to obtain detailed morphologic information, such asevaluating for the presence of subretinal fluid, CNV, CME,and PED, OCT has rapidly become an integral part of retinalpractice. Furthermore, the ability of OCT software to gen-erate retinal thickness maps and automated measurementshas led to its widespread use as a quantitative tool in clinicaltrials and practice. However, as reported in many studies,although accurate in healthy subjects and those with dia-betic retinopathy or uveitis,2,3,6–8 the use of the current
tinal Boundaries at the Fovea
Radial Lines
D No. of Eyes (%) DME/VO No. of Eyes (%) AMD
0 (0) 3 (3.2)0 (0) 6 (6.3)0 (0) 4 (4.2)3 (5.8) 6 (6.3)4 (7.7) 18 (18.9)8 (15.4) 24 (25.3)
37 (71.2) 34 (35.8)52 (100) 95 (100)
DME � diabetic macular edema; VO � vein occlusion.
ter point thickness relative to manual CRT in (A) exudative AMD usingM; and (D) diabetes/vein occlusion using RLS. The dashed lines representences lying within �25 mm of manual measurement. AMD � age-related
ct Re
) AM
)6))9)9)9)1))
al cenFMTdiffer
r thickness map; RLS � radial line scan.

RLS �
Taban et al � Retinal Measurements Using Fast Macular Thickness Map
OCT software (i.e., FMTM of Stratus) results in inaccuratesegmentation and analysis in patients with neovascularAMD.13,14 The current study further supports these previousstudies by demonstrating that the FMTM protocol results ininaccurate segmentation and automated retinal thicknessvalues in patients with exudative AMD, but accurate resultsin subjects with macular edema caused by diabetes or RVO(branch or central). However, this report also evaluated theutility of the customized 6-RLS pattern relative to FMTMand manual measurements to see whether the higher reso-lution scans would improve the accuracy of the Stratusautomated algorithms. Indeed, the RLS pattern had signif-icantly fewer segmentation (CRB) errors in patients withneovascular AMD than FMTM. Furthermore, a higher per-centage of its automated retinal thickness values werewithin the clinically acceptable margins (�25 �m) of man-ual retinal thickness using the RLS pattern than for FMTM(56% vs. 40%, P � 0.042).
In eyes with macular edema caused by diabetes or veinocclusion, both RLS and FMTM resulted in similar and lowsegmentation errors (Tables 3 and 4). Furthermore, a highpercentage of their automated retinal thickness values werewithin the clinically acceptable margins (�25 �m) of manualretinal thickness (FMTM � 94% vs. RLS � 81%, P � 0.07).There was a trend (P � 0.07) where fewer RLS scans hadautomated values within 25 �m of manual retinal thicknesscompared with the FMTM protocol in diabetic/vascular occlu-sion eyes. However, further analysis revealed that this was due
Figure 4. Scatter plots of manual CRT for FMTM versus RLS in subjereference line represents equivalence (slope � 1). AMD � age-related maDME � diabetic macular edema; FMTM � fast macular thickness map;
Table 5. Distribution of Pathologies
Pathology
AMD DME/Vein Occlusion
No. of Eyes (%) No. of Eyes (%)
CNV 83 (87.4) 0 (0)Cystoid spaces 52 (54.7) 39 (75)Subretinal fluid 19 (20) 5 (9.6)PED 28 (29.5) 0 (0)ERM 23 (24.2) 23 (44.2)
AMD � age-related macular degeneration; CNV � choroidal neovascu-larization; DME � diabetic macular edema; ERM � epiretinal membrane;
PED � pigment epithelial detachment.to incorrect outer retinal boundary line placement in certainRLS scans. As depicted in Figure 5, the automated segmenta-tion line in these scans was placed incorrectly at the photore-ceptor inner/outer segment as opposed to the anterior boundaryof the retinal pigment epithelium, where manual central retinalthickness is measured. This occurred only in certain cases,resulting in the RLS protocol performing slightly, but clinicallyand statistically nonsignificant, worse than the FMTM protocolin diabetic/vascular occlusion eyes.
In exudative AMD, determination of inner limiting mem-brane and RPE borders becomes difficult for the OCTsoftware, because the CNV may disrupt the architecture ofthe RPE.13 It is therefore expected that the quantitativeretinal thickness data generated by OCT automated software(foveal center point thickness, central subfield) may be lessreliable than in other retinal conditions, such as DME orvein occlusion. However, with its higher resolution, theRLS protocol does decrease segmentation errors in neovas-
ith (A) exudative AMD and (B) diabetes/vein occlusion. A 45-degreedegeneration; CC � concordance correlation; CI � confidence interval;
radial line scan; VO � vein occlusion.
Figure 5. Sample scan using the RLS protocol with an incorrect boundaryline. Photoreceptor inner/outer segment is represented by the arrow (A).Automated segmentation line is placed incorrectly on this point as op-posed to the anterior boundary of the retinal pigment epithelium, wheremanual central retinal thickness is measured from represented by the small
cts wcular
vertical line (B). RLS � radial line scan.
969
Ophthalmology Volume 116, Number 5, May 2009
cular AMD and thus results in a higher accuracy of itsautomated retinal thickness maps.
There are potential limitations to this study. AlthoughOCT imaging protocols were standardized and certifiedphotographers obtained all images, the effect of individualbias and experience among the photographers cannot becompletely controlled. It is also important to note that theRLS pattern requires precise placement of each line byexperienced photographers or technicians, which is not asimportant when obtaining the FMTM. Although typicalOCT errors, including image artifacts, operator error, anddecentration errors resulting from poor fixation, can bepotentially fixed by repeating scans,13 in cases of exudativeAMD, failure to accurately define retinal boundaries (e.g.,RPE delineation/segmentation) cannot be fixed by repeatingscans. Only manual measurement of retinal thickness pa-rameters is indicated in these cases for accurate quantitativeanalysis.
In summary, according to this report, the RLS protocol withits superior scan resolution (A-scan density), compared withFMTM, results in (1) improved segmentation accuracy and ahigher percentage of CRB, and (2) a higher proportion of itsautomated retinal thickness measurements falling within a clin-ically acceptable margin (�25 �m) of manual measurementsin patients with neovascular AMD. Until improvements aremade in the analysis software, manual measurements are stillsuperior to automated measurements when evaluating patientswith exudative AMD using the Stratus OCT; thus, cliniciansshould consider performing manual measurements using theOCT electronic calipers to determine treatment decisions andfollow treatment results in clinical trials. In patients with mac-ular edema caused by diabetes or vein occlusion, however,both the FMTM and RLS protocols provide similar and lowsegmentation errors, and their automated results are close tothose of manual measurements.
References
1. Shahidi M, Ogura Y, Blair NP, et al. Retinal thickness analysisfor quantitative assessment of diabetic macular edema. ArchOphthalmol 1991;109:1115–9.
2. Yang CS, Cheng CY, Lee FL, et al. Quantitative assessment of
The author(s) have made the following disclosure(s):
970
retinal thickness in diabetic patients with and withoutclinically significant macular edema using optical coherencetomography. Acta Ophthalmol Scand 2001;79:266–70.
3. Polito A, Del Borrello M, Isola M, et al. Repeatability andreproducibility of fast macular thickness mapping with Stratusoptical coherence tomography. Arch Ophthalmol 2005;123:1330–7.
4. Muscat S, Parks S, Kemp E, Keating D. Repeatability andreproducibility of macular thickness measurements with theHumphrey OCT system. Invest Ophthalmol Vis Sci 2002;43:490–5.
5. Paunescu LA, Schuman JS, Price LL, et al. Reproducibility ofnerve fiber thickness, macular thickness, and optic nerve headmeasurements using StratusOCT. Invest Ophthalmol Vis Sci2004;45:1716–24.
6. Baumann M, Gentile RC, Liebmann JM, Ritch R. Reproduc-ibility of retinal thickness measurements in normal eyes usingoptical coherence tomography. Ophthalmic Surg Lasers 1998;29:280–5.
7. Chan A, Duker JS, Ko TH, et al. Normal macular thicknessmeasurements in healthy eyes using Stratus optical coherencetomography. Arch Ophthalmol 2006;124:193–8.
8. Massin P, Vicaut E, Haouchine B, et al. Reproducibility ofretinal mapping using optical coherence tomography. ArchOphthalmol 2001;119:1135–42.
9. Menke MN, Feke GT. Assessment of the effects of morpho-logical changes related to age-related macular degeneration onoptical coherence tomography retinal thickness measure-ments. Ophthalmic Surg Lasers Imaging 2005;36:310–4.
10. Sadda SR, Joeres S, Wu Z, et al. Error correction and quan-titative subanalysis of optical coherence tomography data us-ing computer-assisted grading. Invest Ophthalmol Vis Sci2007;48:839–48.
11. Joeres S, Tsong JW, Updike PG, et al. Reproducibility ofquantitative optical coherence tomography subanalysis in neo-vascular age-related macular degeneration. Invest OphthalmolVis Sci 2007;48:4300–7.
12. Joeres S, Kaplowitz K, Brubaker JW, et al. Quantitative com-parison of optical coherence tomography after pegaptanib orbevacizumab in neovascular age-related macular degenera-tion. Ophthalmology 2008;115:347–54.
13. Ray R, Stinnett SS, Jaffe GJ. Evaluation of image artifactproduced by optical coherence tomography of retinal pathol-ogy. Am J Ophthalmol 2005;139:18–29.
14. Sadda SR, Wu Z, Walsh AC, et al. Errors in retinal thicknessmeasurements obtained by optical coherence tomography.
Ophthalmology 2006;113:285–93.Footnotes and Financial Disclosures
Originally received: August 28, 2008.Final revision: December 8, 2008.Accepted: December 9, 2008. Manuscript no. 2008-1035.
Cole Eye Institute, Cleveland Clinic, Cleveland, Ohio.
Presented at the Association for Research in Vision and Ophthalmology,April 28 to May 1, 2008, Fort Lauderdale, Florida.
Financial Disclosure(s):
None of the authors have any financial involvement or interests or equityfrom companies or devices investigated in this study. Peter Kaiser hasreceived honoraria when speaking by invitation from Carl Zeiss Meditecand Heidelberg Engineering and serves on the scientific advisory boardsfor both. Sumit Sharma has received travel support from Reichert, Inc.
Correspondence:Peter K. Kaiser, MD, Director, Digital OCT Reading Center, ClevelandClinic 9500 Euclid Ave., Cleveland, OH 44195. E-mail: pkkaiser@aol.
com.Copyright © 2022 FDOKUMEN