Effect of image quality on tissue thickness measurements obtained with spectral domain-optical...
18
Effect of image quality on tissue thickness measurements obtained with spectral domain- optical coherence tomography ◊ Madhusudhanan Balasubramanian, Christopher Bowd, Gianmarco Vizzeri, Robert N. Weinreb, and Linda M. Zangwill * Hamilton Glaucoma Center, Department of Ophthalmology, University of California, San Diego, La Jolla CA. 92093-0946 *Corresponding author: [email protected] Abstract: The purpose of this study was to investigate the effect of image quality on retinal nerve fiber layer (RNFL) and retinal thickness measurements obtained using three commercially available spectral domain-optical coherence tomographers (SD-OCT). Subjectively determined good, medium and poor quality images were obtained from four healthy and one glaucoma suspect eyes. RNFL and retinal thickness measurements were compared as a function of image quality. Results indicate that when image quality is within the range specified as acceptable by SD-OCT manufacturers, RNFL and retinal thickness measurements are comparable. © 2009 Optical Society of America OCIS Codes: (110.4500) Optical coherence tomography; (170.4580) Optical diagnostics for medicine ◊ Datasets associated with this article are available at http://hdl.handle.net/10376/1342 . References 1. T. C. Chen, B. Cense, M. C. Pierce, N. Nassif, B. H. Park, S. H. Yun, B. R. White, B. E. Bouma, G. J. Tearney, and J. F. de Boer, “Spectral domain optical coherence tomography: ultra-high speed, ultra-high resolution ophthalmic imaging,” Arch. Ophthalmol. 123, 1715–1720 (2005). 2. J. F. de Boer, B. Cense, B. H. Park, M. C. Pierce, G. J. Tearney, and B. E. Bouma, “Improved signal-to- noise ratio in spectral-domain compared with time-domain optical coherence tomography,” Opt. Lett. 28, 2067–2069 (2003). 3. J. G. Fujimoto, B. Bouma, G. J. Tearney, S. A. Boppart, C. Pitris, J. F. Southern, and M. E. Brezinski, “New technology for high-speed and high-resolution optical coherence tomography,” Ann. N. Y. Acad. Sci. 838, 95–107 (1998). 4. N. Nassif, B. Cense, B. H. Park, S. H. Yun, T. C. Chen, B. E. Bouma, G. J. Tearney, and J. F. de Boer, “In vivo human retinal imaging by ultrahigh-speed spectral domain optical coherence tomography,” Opt. Lett. 29, 480–482 (2004). 5. M. E. van Velthoven, D. J. Faber, F. D. Verbraak, T. G. van Leeuwen, and M. D. de Smet, “Recent developments in optical coherence tomography for imaging the retina,” Prog. Retin. Eye Res. 26, 57–77 (2007). 6. M. Wojtkowski, R. Leitgeb, A. Kowalczyk, T. Bajraszewski, and A. F. Fercher, “In vivo human retinal imaging by Fourier domain optical coherence tomography,” J. Biomed. Opt. 7, 457–463 (2002). 7. M. Wojtkowski, V. Srinivasan, J. G. Fujimoto, T. Ko, J. S. Schuman, A. Kowalczyk, and J. S. Duker, “Three-dimensional retinal imaging with high-speed ultrahigh-resolution optical coherence tomography,” Ophthalmology 112, 1734–1746 (2005). 8. A. O. Gonzalez-Garcia, G. Vizzeri, C. Bowd, F. A. Medeiros, L. M. Zangwill, and R. N. Weinreb, “Reproducibility of RTVue Retinal Nerve Fiber Layer Thickness and Optic Disc Measurements and Agreement with Stratus OCT Measurements,” Am. J. Ophthalmol. in press. 9. T. Mumcuoglu, G. Wollstein, M. Wojtkowski, L. Kagemann, H. Ishikawa, M. L. Gabriele, V. Srinivasan, J. G. Fujimoto, J. S. Duker, and J. S. Schuman, "Improved visualization of glaucomatous retinal damage using high-speed ultrahigh-resolution optical coherence tomography," Ophthalmology 115,. 782-789 e2 (2008). #102910 - $15.00 USD Received 17 Oct 2008; revised 17 Jan 2009; accepted 19 Feb 2009; published 2 Mar 2009 (C) 2009 OSA 2 March 2009 / Vol. 17, No. 5 / OPTICS EXPRESS 4019 Help Us Improve the Interactive Science Publishing (ISP) Tools -- Take the ISP Reader Survey
Transcript of Effect of image quality on tissue thickness measurements obtained with spectral domain-optical...
Effect of image quality on tissue thickness
measurements obtained with spectral domain-
optical coherence tomography◊
Madhusudhanan Balasubramanian, Christopher Bowd, Gianmarco Vizzeri, Robert N.
Weinreb, and Linda M. Zangwill*
Hamilton Glaucoma Center, Department of Ophthalmology, University of California, San Diego, La Jolla CA. 92093-0946
*Corresponding author: [email protected]
Abstract: The purpose of this study was to investigate the effect of image
quality on retinal nerve fiber layer (RNFL) and retinal thickness
measurements obtained using three commercially available spectral
domain-optical coherence tomographers (SD-OCT). Subjectively
determined good, medium and poor quality images were obtained from four
healthy and one glaucoma suspect eyes. RNFL and retinal thickness
measurements were compared as a function of image quality. Results
indicate that when image quality is within the range specified as acceptable
by SD-OCT manufacturers, RNFL and retinal thickness measurements are
comparable.
© 2009 Optical Society of America
OCIS Codes: (110.4500) Optical coherence tomography; (170.4580) Optical diagnostics for
medicine
◊Datasets associated with this article are available at http://hdl.handle.net/10376/1342.
References 1. T. C. Chen, B. Cense, M. C. Pierce, N. Nassif, B. H. Park, S. H. Yun, B. R. White, B. E. Bouma, G. J.
Tearney, and J. F. de Boer, “Spectral domain optical coherence tomography: ultra-high speed, ultra-high
resolution ophthalmic imaging,” Arch. Ophthalmol. 123, 1715–1720 (2005). 2. J. F. de Boer, B. Cense, B. H. Park, M. C. Pierce, G. J. Tearney, and B. E. Bouma, “Improved signal-to-
noise ratio in spectral-domain compared with time-domain optical coherence tomography,” Opt. Lett. 28,
2067–2069 (2003). 3. J. G. Fujimoto, B. Bouma, G. J. Tearney, S. A. Boppart, C. Pitris, J. F. Southern, and M. E. Brezinski, “New
technology for high-speed and high-resolution optical coherence tomography,” Ann. N. Y. Acad. Sci. 838,
95–107 (1998). 4. N. Nassif, B. Cense, B. H. Park, S. H. Yun, T. C. Chen, B. E. Bouma, G. J. Tearney, and J. F. de Boer, “In
vivo human retinal imaging by ultrahigh-speed spectral domain optical coherence tomography,” Opt. Lett.
29, 480–482 (2004). 5. M. E. van Velthoven, D. J. Faber, F. D. Verbraak, T. G. van Leeuwen, and M. D. de Smet, “Recent
developments in optical coherence tomography for imaging the retina,” Prog. Retin. Eye Res. 26, 57–77
(2007). 6. M. Wojtkowski, R. Leitgeb, A. Kowalczyk, T. Bajraszewski, and A. F. Fercher, “In vivo human retinal
imaging by Fourier domain optical coherence tomography,” J. Biomed. Opt. 7, 457–463 (2002).
7. M. Wojtkowski, V. Srinivasan, J. G. Fujimoto, T. Ko, J. S. Schuman, A. Kowalczyk, and J. S. Duker, “Three-dimensional retinal imaging with high-speed ultrahigh-resolution optical coherence tomography,”
Ophthalmology 112, 1734–1746 (2005).
8. A. O. Gonzalez-Garcia, G. Vizzeri, C. Bowd, F. A. Medeiros, L. M. Zangwill, and R. N. Weinreb, “Reproducibility of RTVue Retinal Nerve Fiber Layer Thickness and Optic Disc Measurements and
Agreement with Stratus OCT Measurements,” Am. J. Ophthalmol. in press.
9. T. Mumcuoglu, G. Wollstein, M. Wojtkowski, L. Kagemann, H. Ishikawa, M. L. Gabriele, V. Srinivasan, J. G. Fujimoto, J. S. Duker, and J. S. Schuman, "Improved visualization of glaucomatous retinal damage using
high-speed ultrahigh-resolution optical coherence tomography," Ophthalmology 115,. 782-789 e2 (2008).
#102910 - $15.00 USD Received 17 Oct 2008; revised 17 Jan 2009; accepted 19 Feb 2009; published 2 Mar 2009
(C) 2009 OSA 2 March 2009 / Vol. 17, No. 5 / OPTICS EXPRESS 4019
Help Us Improve the Interactive Science Publishing (ISP) Tools -- Take the ISP Reader Survey
10. V. J. Srinivasan, D. C. Adler, Y. Chen, I. Gorczynska, R. Huber, J. S. Duker, J. S. Schuman, and J. G.
Fujimoto, “Ultrahigh-speed optical coherence tomography for three-dimensional and en face imaging of the retina and optic nerve head,” Invest. Ophthalmol. Vis. Sci. 49, 5103–5110 (2008).
11. G. Vizzeri, R. N. Weinreb, A. O. Gonzalez-Garcia, C. Bowd, F. A. Medeiros, P. A. Sample, and L. M.
Zangwill, “Agreement between Spectral-Domain and Time-Domain OCT for measuring RNFL thickness,” Br. J. Ophthalmol. in press.
12. N. G. Strouthidis, E. T. White, V. M. Owen, T. A. Ho, C. J. Hammond, and D. F. Garway-Heath, “Factors
affecting the test-retest variability of Heidelberg retina tomograph and Heidelberg retina tomograph II measurements,” Br. J. Ophthalmol. 89, 1427–1432 (2005).
13. C. Bowd, F. A. Medeiros, R. N. Weinreb, and L. M. Zangwill, “The effect of atypical birefringence patterns
on glaucoma detection using scanning laser polarimetry with variable corneal compensation,” Invest. Ophthalmol. Vis. Sci. 48, 223–227 (2007).
14. F. A. Medeiros, C. Bowd, L. M. Zangwill, C. Patel, and R. N. Weinreb, “Detection of glaucoma using
scanning laser polarimetry with enhanced corneal compensation,” Invest. Ophthalmol. Vis. Sci. 48, 3146–3153 (2007).
15. Z. Wu, M. Vazeen, R. Varma, V. Chopra, A. C. Walsh, L. D. LaBree, and S. R. Sadda, “Factors associated
with variability in retinal nerve fiber layer thickness measurements obtained by optical coherence tomography,” Ophthalmology 114, 1505–1512 (2007).
16. D. M. Stein, G. Wollstein, H. Ishikawa, E. Hertzmark, R. J. Noecker, and J. S. Schuman, “Effect of corneal
drying on optical coherence tomography,” Ophthalmology 113, 985–991 (2006).
17. C. Y. Cheung, C. K. Leung, D. Lin, C. P. Pang, and D. S. Lam, Relationship between retinal nerve fiber
layer measurement and signal strength in optical coherence tomography. Ophthalmology 115, 1347-51,
1351 e1-2 (2008). 18. M. L. Gabriele, H. Ishikawa, G. Wollstein, R. A. Bilonick, K. A. Townsend, L. Kagemann, M. Wojtkowski,
V. J. Srinivasan, J. G. Fujimoto, J. S. Duker, and J. S. Schuman, “Optical coherence tomography scan circle
location and mean retinal nerve fiber layer measurement variability,” Invest. Ophthalmol. Vis. Sci. 49, 2315–2321 (2008).
19. G. Vizzeri, C. Bowd, F. A. Medeiros, R. N. Weinreb, and L. M. Zangwill, “Effect of improper scan alignment on retinal nerve fiber layer thickness measurements using Stratus optical coherence tomograph,”
J. Glaucoma 17, 341–349 (2008).
20. B. Liu, and M. E. Brezinski, “Theoretical and practical considerations on detection performance of time domain, Fourier domain, and swept source optical coherence tomography,” J. Biomed. Opt. 12, 044007
(2007).
1. Introduction
The recent development and commercialization of Spectral Domain Optical Coherence
Tomography (SD-OCT) has brought a significant improvement in our ability to visualize and
measure the retina in-vivo. With scanning speeds between 25,000–40,000 A-scans/second,
this technology, also known as Fourier-domain OCT, or high speed, high resolution OCT,
provides excellent depth resolution (up to 5 microns) and transverse resolution (up to 14
microns) [1-7]. Reproducible, three-dimensional representations of the human eye are now
possible using OCT during a routine undilated clinical examination [7-11]. RTVue Fourier Domain (FD)-OCT (Optovue Inc, Fremont, CA), Spectralis OCT
(Heidelberg Engineering, GmbH, Heidelberg, Germany), and Cirrus High Density (HD)-OCT
(Carl Zeiss Meditec, Dublin, CA) are three of several commercially available SD-OCT
instruments. Each instrument provides numerous options to acquire scans of different sizes
and densities. For example, the Cirrus SD-OCT “Optic Disc Cube” can consist of 200 A-
scans × 200 B-scans or 512 A-scans × 128 B-scans centered on the optic disc. The RTVue
NHM4 scan is a composite of 12 radial B-scans (452 A-scans each), and two types of circular
scans (3 concentric circular B-scans of diameter 2.5mm, 2.8mm, and 3.1mm respectively by
587 A-scans and 3 concentric circular B-scans of diameter 3.4mm, 3.7mm, and 4.0mm
respectively by 775 A-scans). The Spectralis “volume scan” has the flexibility of acquiring
between 12 and 96 B-scans and 256 A-scans (high-speed mode) or 512 A-scans (high-
resolution mode) per 10° field of view. In addition, an automatic retinal tracking (ART)
mode is available in Spectralis to ensure that all B-scans required to cover the imaging area of
interest are acquired coherently despite any eye movements. In ART mode, Spectralis
acquires 9 B-scans per retinal location (each B-scan per retinal location is referred to as a
frame) by default and can be manually adjusted from 2 to 100 frames. The type of scan
#102910 - $15.00 USD Received 17 Oct 2008; revised 17 Jan 2009; accepted 19 Feb 2009; published 2 Mar 2009
(C) 2009 OSA 2 March 2009 / Vol. 17, No. 5 / OPTICS EXPRESS 4020
preferred represents a compromise between the time required to obtain the scan, the field of
view included, and the density of the A- and B-scans. These scans generate large datasets that
are analyzed and interpreted using sophisticated algorithms. In addition, the clinician can
subjectively review the scans to identify specific pathologic features or conditions.
We know from other imaging instruments, such as confocal scanning laser
ophthalmoscopy [12], scanning laser polarimetry [13, 14] and time domain OCT [15], that
poor quality scans can provide inaccurate information about the status of the optic disc and
RNFL [16]. For example, it has been documented that time domain OCT signal strength is
positively associated with RNFL thickness measurements (i.e., poor quality scans with low
signal strength lead to underestimates of RNFL thickness) [17] . It can be assumed that
interpretation of the scans is most accurate when images are of good quality. Fortunately, the
SD-OCT instruments provide automated feedback to the operator about the quality of the
acquired scan.
The objective of this manuscript is to examine and provide examples of how the quality
of SD-OCT three-dimensional scans effects the qualitative and quantitative information
available to the clinician.
2. Methods
2.1 Study Participants
Four healthy individuals (average age = 35 years, range 30 to 43 years, with healthy
appearing optic discs on examination, standard automated perimetry within normal limits on
all global indices, IOP ≤ 22 mmHg with no history of elevation) and one glaucoma suspect
(49 years, untreated IOP > 24 mmHg and glaucomatous appearing optic discs on examination
and masked stereophotograph assessment OU) from the UCSD Diagnostic Innovations in
Glaucoma Study (DIGS) were included in this observational case series. Volumetric optic
disk scans (details below) were acquired using three commercially available SD-OCT
instruments: RTVue (Model RT100, software version 2.0.4.0), Spectralis (Model Spectralis
HRA+OCT, software version 3.2a), and Cirrus (Model 4000, software version 3.0.0.64). A
set of 4 volumetric scans were acquired from one randomly selected eye of each of the study
participants at 3 subjective-scan-quality (SSQ) levels and at +2 diopter defocus (to simulate
plausible user error in a busy clinic) using each of the SD-OCT instruments. The SSQ levels
used were: 1. best quality, 2. medium quality, and 3. low quality. Table 1 provides a brief
summary of the SD-OCT specifications. For Spectralis, all scans were acquired in the ART
mode with the number of frames reduced to 2 (instead of the default 9 frames in the ART
mode) to acquire all 4 scans in a reasonable time frame (i.e., the manufacturer imposed
maximum laser exposure per day per eye to ensure patient safety) from each study participant.
For each instrument, the SSQ levels were derived based on the range of the quality scores
assigned by the respective instrument (referred to as the Instrument Quality Score – IQS). For
RTVue, IQS varies from 0–100; therefore, scans with IQS 60 or above were considered best
quality, IQS between 40 and 60 were considered medium quality and IQS below 40 were
considered low quality. Spectralis uses a signal-to-noise (SNR in dB) estimate for IQS.
Scans with SNR 20 dB or above were considered best quality, SNR of approximately 15 dB
were considered medium quality and SNR of approximately 10 dB were considered low
quality. For Cirrus, IQS varies from 0–10; therefore, scans with IQS 8 or above were
considered best quality, IQS of approximately 6 were considered medium quality and IQS of
approximately 3 were considered low quality. A trained operator adjusted SSQ levels
manually to achieve desired scan quality by changing the amount of instrument defocus prior
to image acquisition.
#102910 - $15.00 USD Received 17 Oct 2008; revised 17 Jan 2009; accepted 19 Feb 2009; published 2 Mar 2009
(C) 2009 OSA 2 March 2009 / Vol. 17, No. 5 / OPTICS EXPRESS 4021
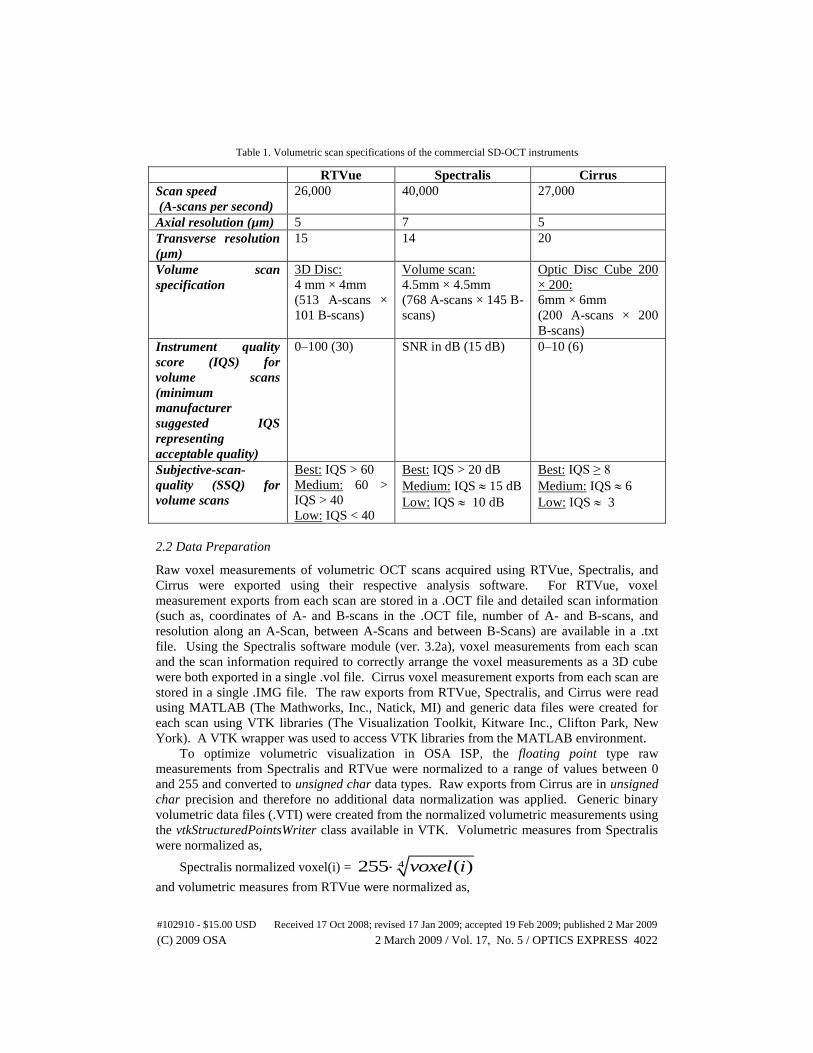
Table 1. Volumetric scan specifications of the commercial SD-OCT instruments
RTVue Spectralis Cirrus
Scan speed
(A-scans per second)
26,000 40,000 27,000
Axial resolution (µm) 5 7 5
Transverse resolution
(µm)
15 14 20
Volume scan
specification
3D Disc:
4 mm × 4mm
(513 A-scans ×
101 B-scans)
Volume scan:
4.5mm × 4.5mm
(768 A-scans × 145 B-
scans)
Optic Disc Cube 200
× 200:
6mm × 6mm
(200 A-scans × 200
B-scans)
Instrument quality
score (IQS) for
volume scans
(minimum
manufacturer
suggested IQS
representing
acceptable quality)
0–100 (30) SNR in dB (15 dB) 0–10 (6)
Subjective-scan-
quality (SSQ) for
volume scans
Best: IQS > 60
Medium: 60 >
IQS > 40
Low: IQS < 40
Best: IQS > 20 dB
Medium: IQS 15 dB
Low: IQS 10 dB
Best: IQS ≥ 8
Medium: IQS 6
Low: IQS 3
2.2 Data Preparation
Raw voxel measurements of volumetric OCT scans acquired using RTVue, Spectralis, and
Cirrus were exported using their respective analysis software. For RTVue, voxel
measurement exports from each scan are stored in a .OCT file and detailed scan information
(such as, coordinates of A- and B-scans in the .OCT file, number of A- and B-scans, and
resolution along an A-Scan, between A-Scans and between B-Scans) are available in a .txt
file. Using the Spectralis software module (ver. 3.2a), voxel measurements from each scan
and the scan information required to correctly arrange the voxel measurements as a 3D cube
were both exported in a single .vol file. Cirrus voxel measurement exports from each scan are
stored in a single .IMG file. The raw exports from RTVue, Spectralis, and Cirrus were read
using MATLAB (The Mathworks, Inc., Natick, MI) and generic data files were created for
each scan using VTK libraries (The Visualization Toolkit, Kitware Inc., Clifton Park, New
York). A VTK wrapper was used to access VTK libraries from the MATLAB environment.
To optimize volumetric visualization in OSA ISP, the floating point type raw
measurements from Spectralis and RTVue were normalized to a range of values between 0
and 255 and converted to unsigned char data types. Raw exports from Cirrus are in unsigned
char precision and therefore no additional data normalization was applied. Generic binary
volumetric data files (.VTI) were created from the normalized volumetric measurements using
the vtkStructuredPointsWriter class available in VTK. Volumetric measures from Spectralis
were normalized as,
Spectralis normalized voxel(i) = 4255 ( )voxel i
and volumetric measures from RTVue were normalized as,
#102910 - $15.00 USD Received 17 Oct 2008; revised 17 Jan 2009; accepted 19 Feb 2009; published 2 Mar 2009
(C) 2009 OSA 2 March 2009 / Vol. 17, No. 5 / OPTICS EXPRESS 4022
RTVue normalized voxel(i) =
( )255
max ( )
Voxel i
Voxel i
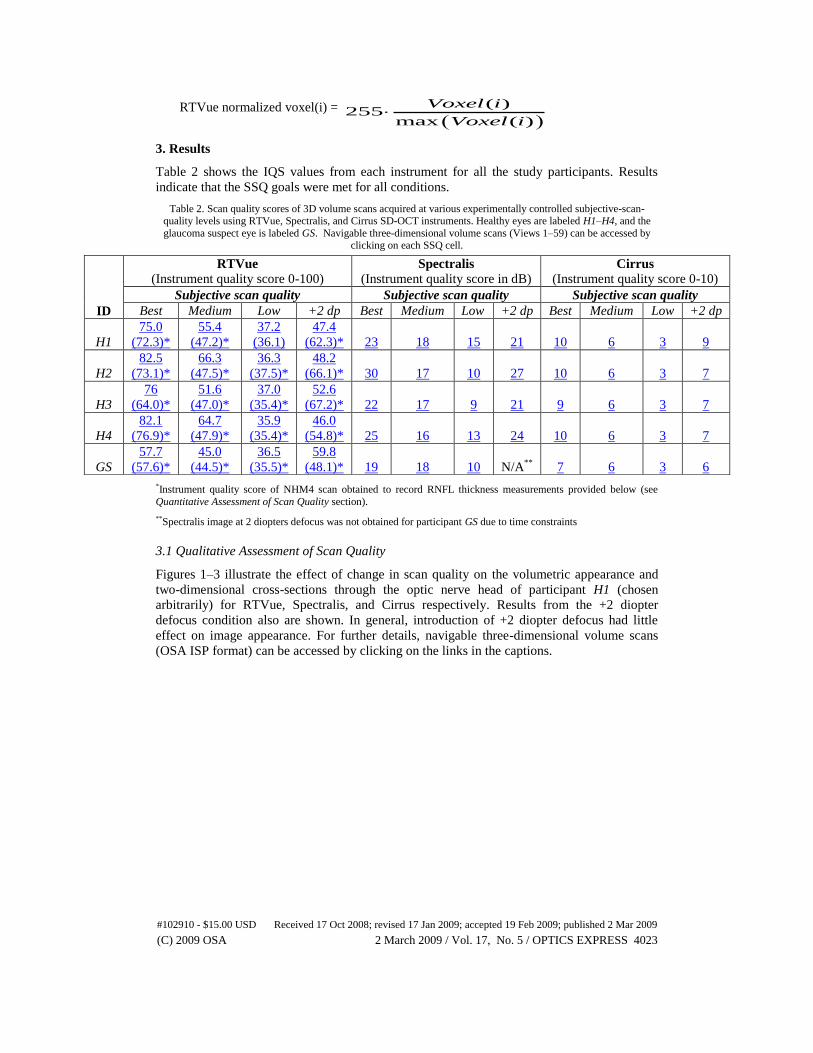
3. Results
Table 2 shows the IQS values from each instrument for all the study participants. Results
indicate that the SSQ goals were met for all conditions.
Table 2. Scan quality scores of 3D volume scans acquired at various experimentally controlled subjective-scan-quality levels using RTVue, Spectralis, and Cirrus SD-OCT instruments. Healthy eyes are labeled H1–H4, and the
glaucoma suspect eye is labeled GS. Navigable three-dimensional volume scans (Views 1–59) can be accessed by clicking on each SSQ cell.
*Instrument quality score of NHM4 scan obtained to record RNFL thickness measurements provided below (see
Quantitative Assessment of Scan Quality section).
**Spectralis image at 2 diopters defocus was not obtained for participant GS due to time constraints
3.1 Qualitative Assessment of Scan Quality
Figures 1–3 illustrate the effect of change in scan quality on the volumetric appearance and
two-dimensional cross-sections through the optic nerve head of participant H1 (chosen
arbitrarily) for RTVue, Spectralis, and Cirrus respectively. Results from the +2 diopter
defocus condition also are shown. In general, introduction of +2 diopter defocus had little
effect on image appearance. For further details, navigable three-dimensional volume scans
(OSA ISP format) can be accessed by clicking on the links in the captions.
ID
RTVue
(Instrument quality score 0-100) Spectralis
(Instrument quality score in dB) Cirrus
(Instrument quality score 0-10)
Subjective scan quality Subjective scan quality Subjective scan quality
Best Medium Low +2 dp Best Medium Low +2 dp Best Medium Low +2 dp
H1
75.0
(72.3)*
55.4
(47.2)*
37.2
(36.1)
47.4
(62.3)* 23 18 15 21 10 6 3 9
H2
82.5
(73.1)*
66.3
(47.5)*
36.3
(37.5)*
48.2
(66.1)* 30 17 10 27 10 6 3 7
H3
76
(64.0)*
51.6
(47.0)*
37.0
(35.4)*
52.6
(67.2)* 22 17 9 21 9 6 3 7
H4
82.1
(76.9)*
64.7
(47.9)*
35.9
(35.4)*
46.0
(54.8)* 25 16 13 24 10 6 3 7
GS
57.7
(57.6)*
45.0
(44.5)*
36.5
(35.5)*
59.8
(48.1)* 19 18 10 N/A**
7 6 3 6
#102910 - $15.00 USD Received 17 Oct 2008; revised 17 Jan 2009; accepted 19 Feb 2009; published 2 Mar 2009
(C) 2009 OSA 2 March 2009 / Vol. 17, No. 5 / OPTICS EXPRESS 4023
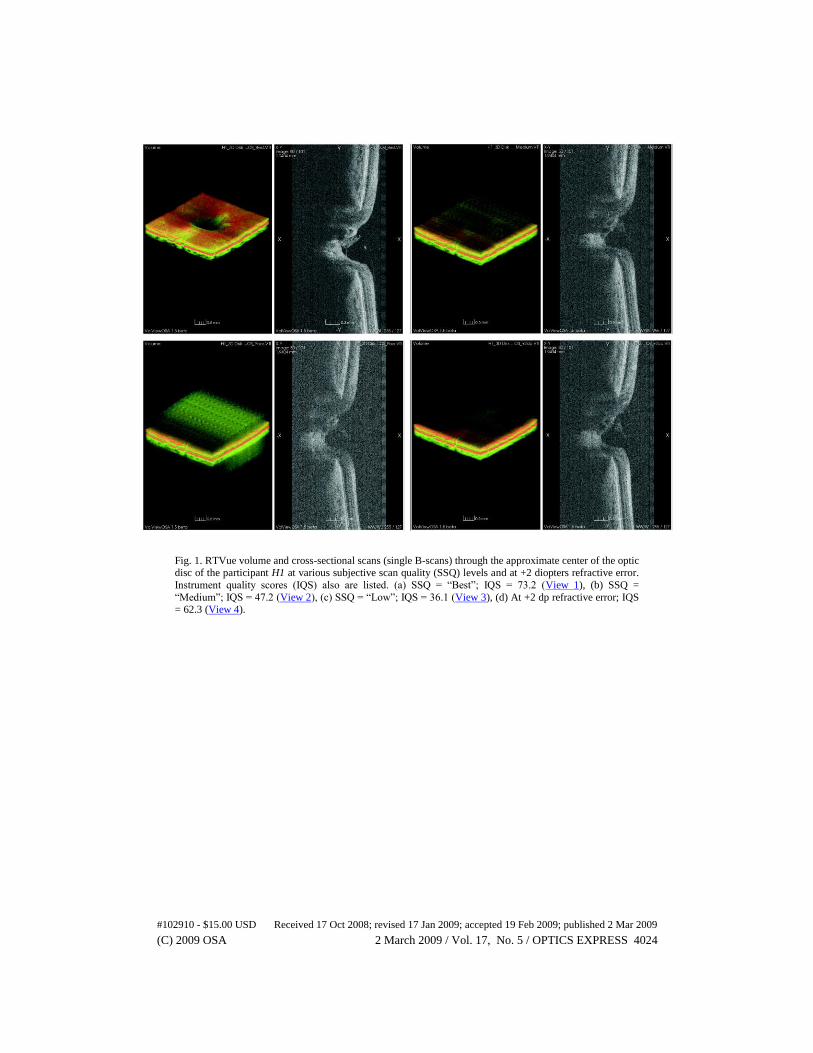
Fig. 1. RTVue volume and cross-sectional scans (single B-scans) through the approximate center of the optic
disc of the participant H1 at various subjective scan quality (SSQ) levels and at +2 diopters refractive error.
Instrument quality scores (IQS) also are listed. (a) SSQ = “Best”; IQS = 73.2 (View 1), (b) SSQ =
“Medium”; IQS = 47.2 (View 2), (c) SSQ = “Low”; IQS = 36.1 (View 3), (d) At +2 dp refractive error; IQS = 62.3 (View 4).
#102910 - $15.00 USD Received 17 Oct 2008; revised 17 Jan 2009; accepted 19 Feb 2009; published 2 Mar 2009
(C) 2009 OSA 2 March 2009 / Vol. 17, No. 5 / OPTICS EXPRESS 4024
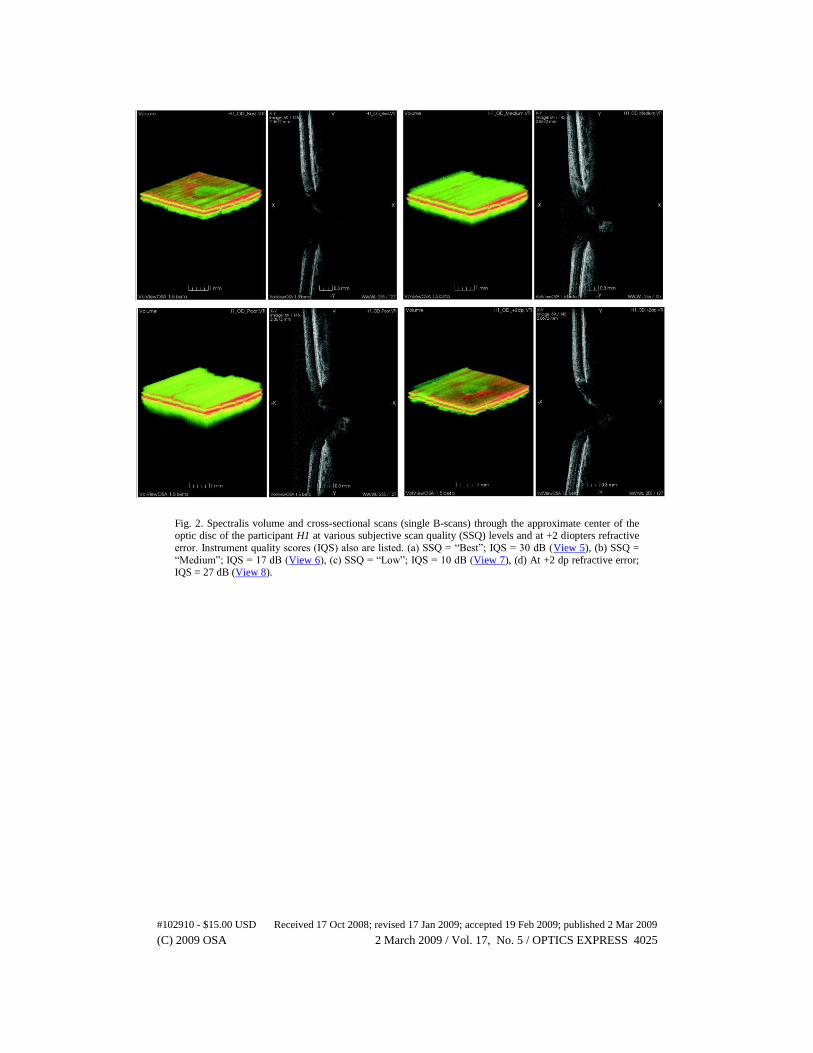
Fig. 2. Spectralis volume and cross-sectional scans (single B-scans) through the approximate center of the optic disc of the participant H1 at various subjective scan quality (SSQ) levels and at +2 diopters refractive
error. Instrument quality scores (IQS) also are listed. (a) SSQ = “Best”; IQS = 30 dB (View 5), (b) SSQ =
“Medium”; IQS = 17 dB (View 6), (c) SSQ = “Low”; IQS = 10 dB (View 7), (d) At +2 dp refractive error;
IQS = 27 dB (View 8).
#102910 - $15.00 USD Received 17 Oct 2008; revised 17 Jan 2009; accepted 19 Feb 2009; published 2 Mar 2009
(C) 2009 OSA 2 March 2009 / Vol. 17, No. 5 / OPTICS EXPRESS 4025
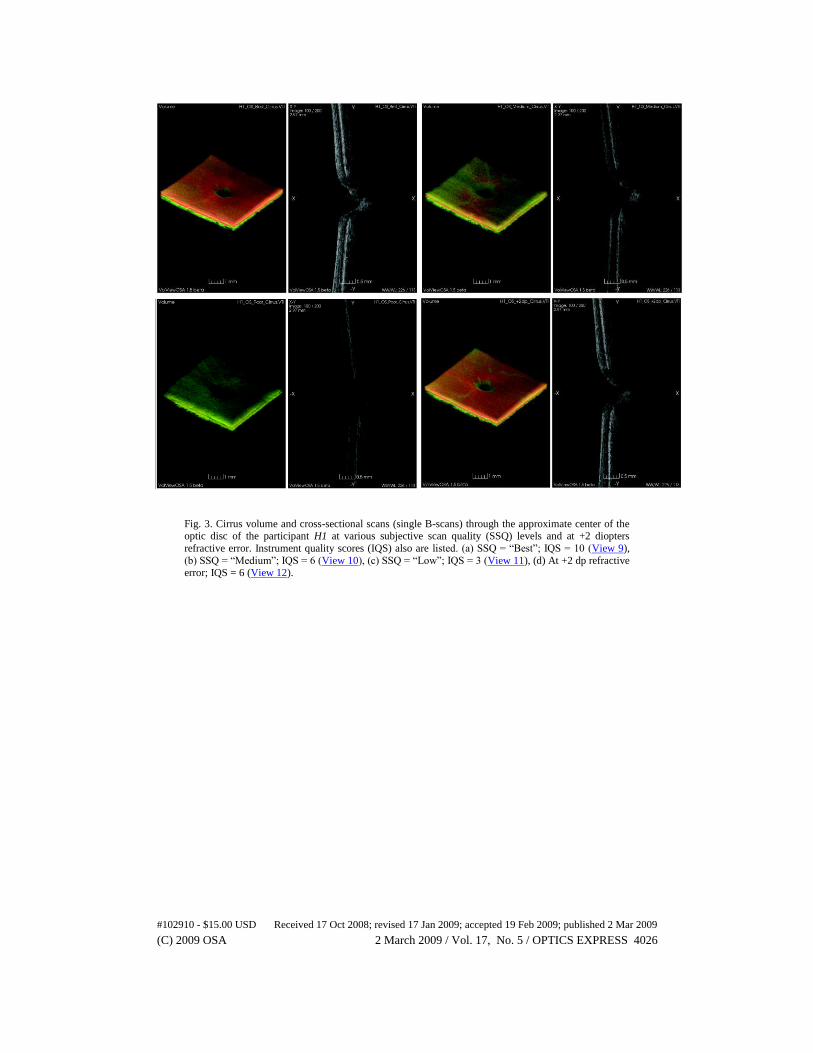
Fig. 3. Cirrus volume and cross-sectional scans (single B-scans) through the approximate center of the optic disc of the participant H1 at various subjective scan quality (SSQ) levels and at +2 diopters
refractive error. Instrument quality scores (IQS) also are listed. (a) SSQ = “Best”; IQS = 10 (View 9),
(b) SSQ = “Medium”; IQS = 6 (View 10), (c) SSQ = “Low”; IQS = 3 (View 11), (d) At +2 dp refractive
error; IQS = 6 (View 12).
#102910 - $15.00 USD Received 17 Oct 2008; revised 17 Jan 2009; accepted 19 Feb 2009; published 2 Mar 2009
(C) 2009 OSA 2 March 2009 / Vol. 17, No. 5 / OPTICS EXPRESS 4026
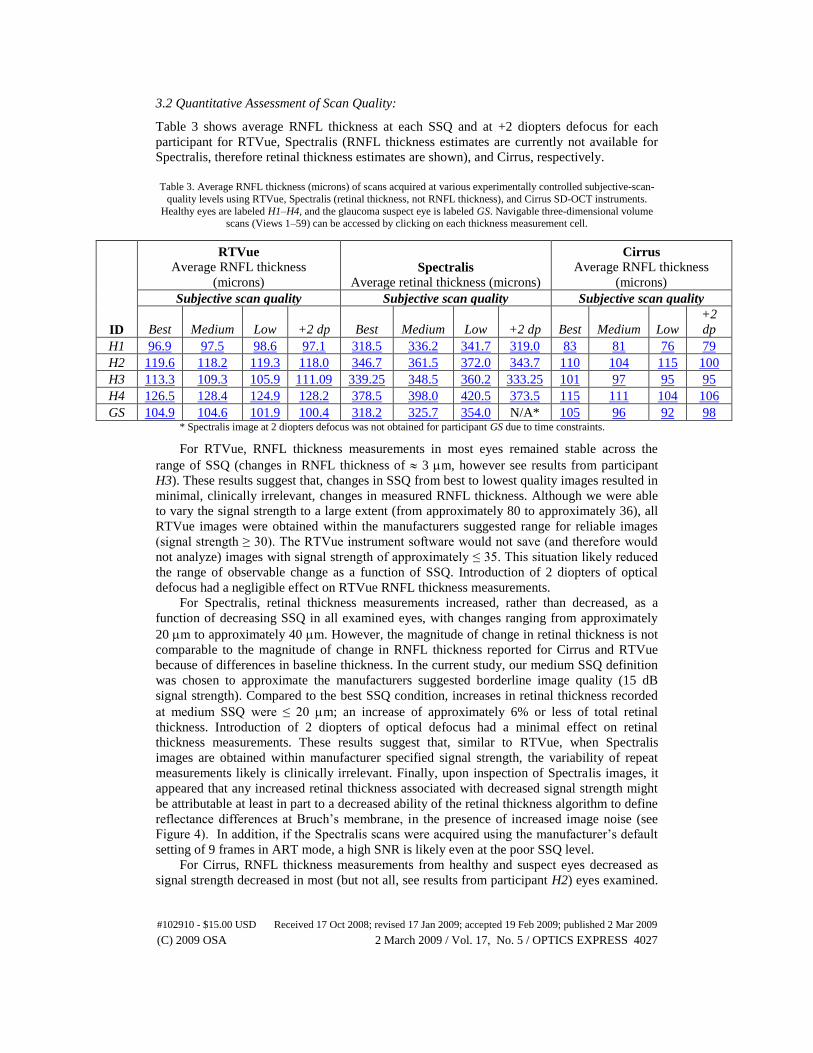
3.2 Quantitative Assessment of Scan Quality:
Table 3 shows average RNFL thickness at each SSQ and at +2 diopters defocus for each
participant for RTVue, Spectralis (RNFL thickness estimates are currently not available for
Spectralis, therefore retinal thickness estimates are shown), and Cirrus, respectively.
Table 3. Average RNFL thickness (microns) of scans acquired at various experimentally controlled subjective-scan-
quality levels using RTVue, Spectralis (retinal thickness, not RNFL thickness), and Cirrus SD-OCT instruments.
Healthy eyes are labeled H1–H4, and the glaucoma suspect eye is labeled GS. Navigable three-dimensional volume scans (Views 1–59) can be accessed by clicking on each thickness measurement cell.
ID
RTVue
Average RNFL thickness
(microns) Spectralis
Average retinal thickness (microns)
Cirrus
Average RNFL thickness
(microns)
Subjective scan quality Subjective scan quality Subjective scan quality
Best Medium Low +2 dp Best Medium Low +2 dp Best Medium Low
+2
dp
H1 96.9 97.5 98.6 97.1 318.5 336.2 341.7 319.0 83 81 76 79
H2 119.6 118.2 119.3 118.0 346.7 361.5 372.0 343.7 110 104 115 100
H3 113.3 109.3 105.9 111.09 339.25 348.5 360.2 333.25 101 97 95 95
H4 126.5 128.4 124.9 128.2 378.5 398.0 420.5 373.5 115 111 104 106
GS 104.9 104.6 101.9 100.4 318.2 325.7 354.0 N/A* 105 96 92 98 * Spectralis image at 2 diopters defocus was not obtained for participant GS due to time constraints.
For RTVue, RNFL thickness measurements in most eyes remained stable across the
range of SSQ (changes in RNFL thickness of 3 m, however see results from participant
H3). These results suggest that, changes in SSQ from best to lowest quality images resulted in
minimal, clinically irrelevant, changes in measured RNFL thickness. Although we were able
to vary the signal strength to a large extent (from approximately 80 to approximately 36), all
RTVue images were obtained within the manufacturers suggested range for reliable images
(signal strength ≥ 30). The RTVue instrument software would not save (and therefore would
not analyze) images with signal strength of approximately ≤ 35. This situation likely reduced
the range of observable change as a function of SSQ. Introduction of 2 diopters of optical
defocus had a negligible effect on RTVue RNFL thickness measurements.
For Spectralis, retinal thickness measurements increased, rather than decreased, as a
function of decreasing SSQ in all examined eyes, with changes ranging from approximately
20 m to approximately 40 m. However, the magnitude of change in retinal thickness is not
comparable to the magnitude of change in RNFL thickness reported for Cirrus and RTVue
because of differences in baseline thickness. In the current study, our medium SSQ definition
was chosen to approximate the manufacturers suggested borderline image quality (15 dB
signal strength). Compared to the best SSQ condition, increases in retinal thickness recorded
at medium SSQ were ≤ 20 m; an increase of approximately 6% or less of total retinal
thickness. Introduction of 2 diopters of optical defocus had a minimal effect on retinal
thickness measurements. These results suggest that, similar to RTVue, when Spectralis
images are obtained within manufacturer specified signal strength, the variability of repeat
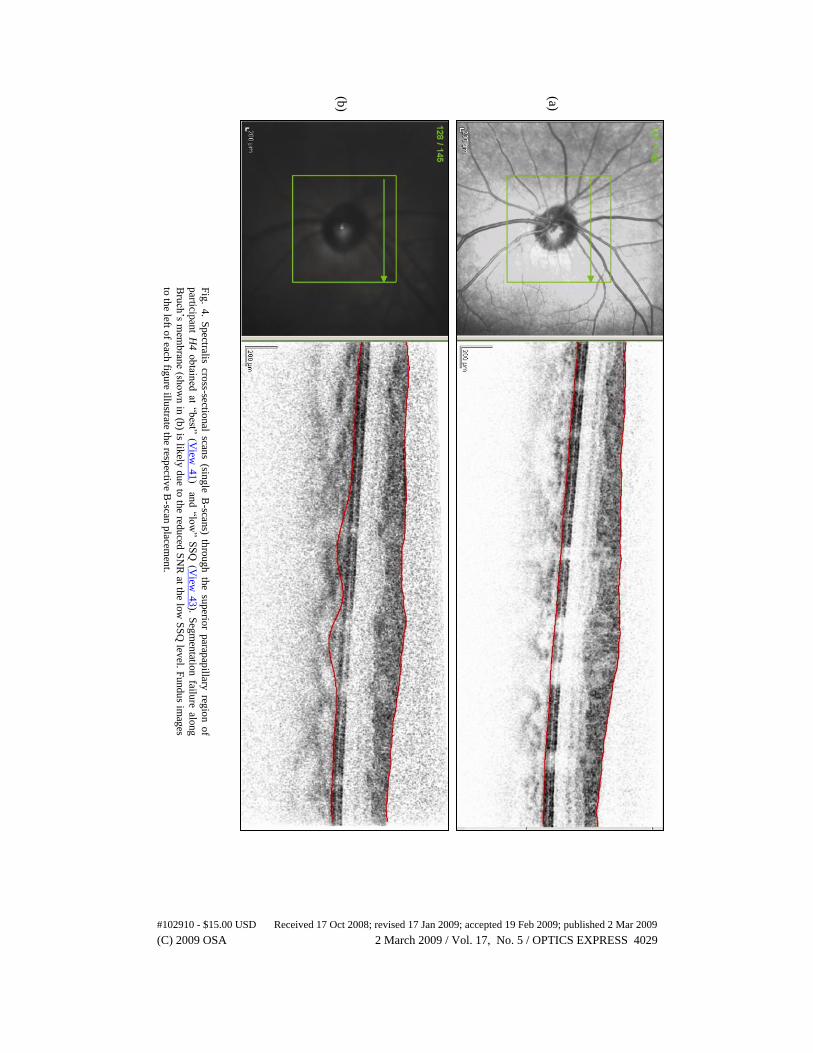
measurements likely is clinically irrelevant. Finally, upon inspection of Spectralis images, it
appeared that any increased retinal thickness associated with decreased signal strength might
be attributable at least in part to a decreased ability of the retinal thickness algorithm to define
reflectance differences at Bruch’s membrane, in the presence of increased image noise (see
Figure 4). In addition, if the Spectralis scans were acquired using the manufacturer’s default
setting of 9 frames in ART mode, a high SNR is likely even at the poor SSQ level.
For Cirrus, RNFL thickness measurements from healthy and suspect eyes decreased as
signal strength decreased in most (but not all, see results from participant H2) eyes examined.
#102910 - $15.00 USD Received 17 Oct 2008; revised 17 Jan 2009; accepted 19 Feb 2009; published 2 Mar 2009
(C) 2009 OSA 2 March 2009 / Vol. 17, No. 5 / OPTICS EXPRESS 4027
According to manufacturer protocol, images with signal strength ≥ 6 are considered
acceptable and we used this value to define our medium SSQ scans. Decreases in RNFL
thickness between subjectively defined best quality images (with signal strength ≥ 8) and
subjectively defined medium quality images (with signal strength 6) were ≤ 5 m in all
cases, suggesting that RNFL thickness measurement changes within the range of acceptable
quality images are probably not clinically relevant. When signal strength was decreased to
3, changes in RNFL thickness measurements ranged from –10 m to + 5 m. Introduction of
2 diopters of optical defocus decreased RNFL thickness measurements as much as 10 m.
Figures 5–9 show within-subject (i.e., one figure per study participant) temporal-
superior-nasal-inferior- temporal (i.e., “TSNIT”) plots for RNFL thickness at each SSQ level
and at +2 diopters defocus for RTVue, Spectralis (retinal thickness, not RNFL thickness), and
Cirrus. For all instruments, thickness values that compose the TSNIT plot were obtained
along a scan circle with diameter 3.45 mm centered on the optic disc. For RTVue, RNFL
thickness measurements were obtained using the NHM4 scan protocol (see [8] for description
of this protocol), not the volumetric scan described in the data preparation section above.
IQSs were somewhat different for volumetric and NHM4 images and are shown in Table 2.
TSNIT plots reinforce the mean RNFL and retinal thickness results reported above.
#102910 - $15.00 USD Received 17 Oct 2008; revised 17 Jan 2009; accepted 19 Feb 2009; published 2 Mar 2009
(C) 2009 OSA 2 March 2009 / Vol. 17, No. 5 / OPTICS EXPRESS 4028
(a)
(b)
Fig
. 4. S
pectralis cro
ss-sectional scan
s (single B
-scans) th
rough
the su
perio
r parap
apillary
regio
n o
f
particip
ant H
4 o
btain
ed at “b
est” (View
41
) and
“low
” SS
Q (V
iew 4
3). S
egm
entatio
n failu
re along
Bru
ch’s m
emb
rane (sh
ow
n in
(b) is lik
ely d
ue to
the red
uced
SN
R at th
e low
SS
Q lev
el. Fu
ndu
s imag
es
to th
e left of each
figu
re illustrate th
e respectiv
e B-scan
placem
ent.
#102910 - $15.00 USD Received 17 Oct 2008; revised 17 Jan 2009; accepted 19 Feb 2009; published 2 Mar 2009
(C) 2009 OSA 2 March 2009 / Vol. 17, No. 5 / OPTICS EXPRESS 4029
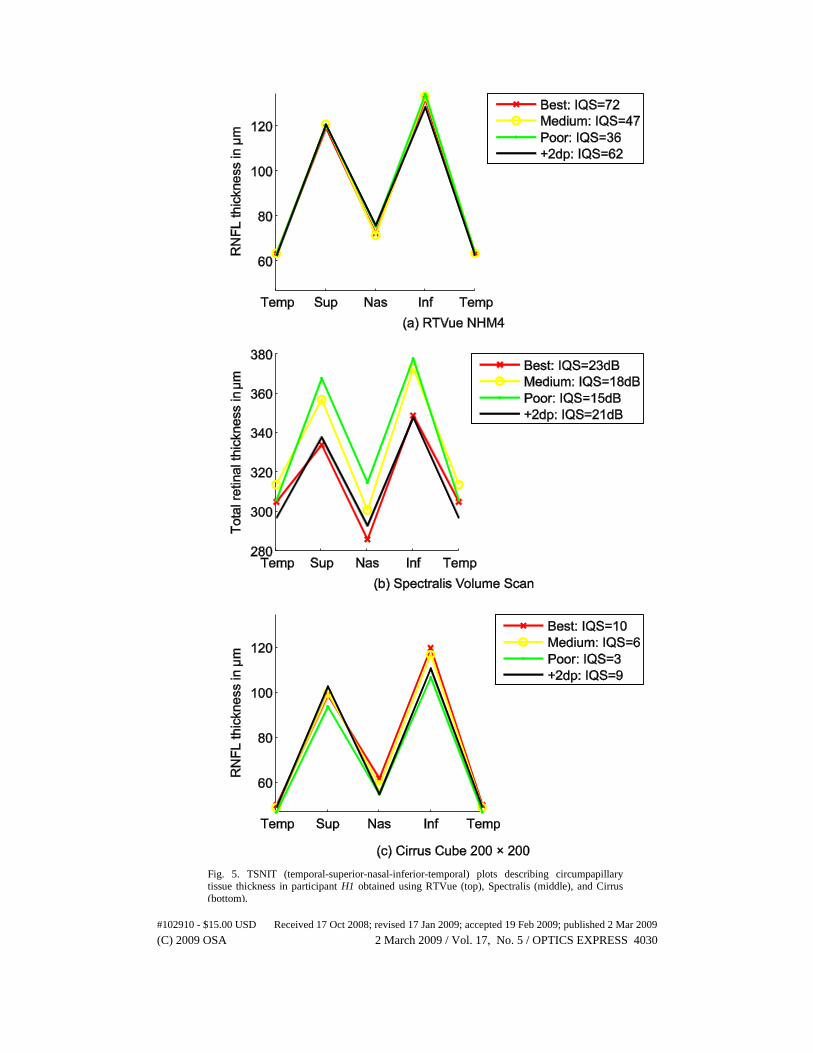
Fig. 5. TSNIT (temporal-superior-nasal-inferior-temporal) plots describing circumpapillary tissue thickness in participant H1 obtained using RTVue (top), Spectralis (middle), and Cirrus
(bottom).
#102910 - $15.00 USD Received 17 Oct 2008; revised 17 Jan 2009; accepted 19 Feb 2009; published 2 Mar 2009
(C) 2009 OSA 2 March 2009 / Vol. 17, No. 5 / OPTICS EXPRESS 4030
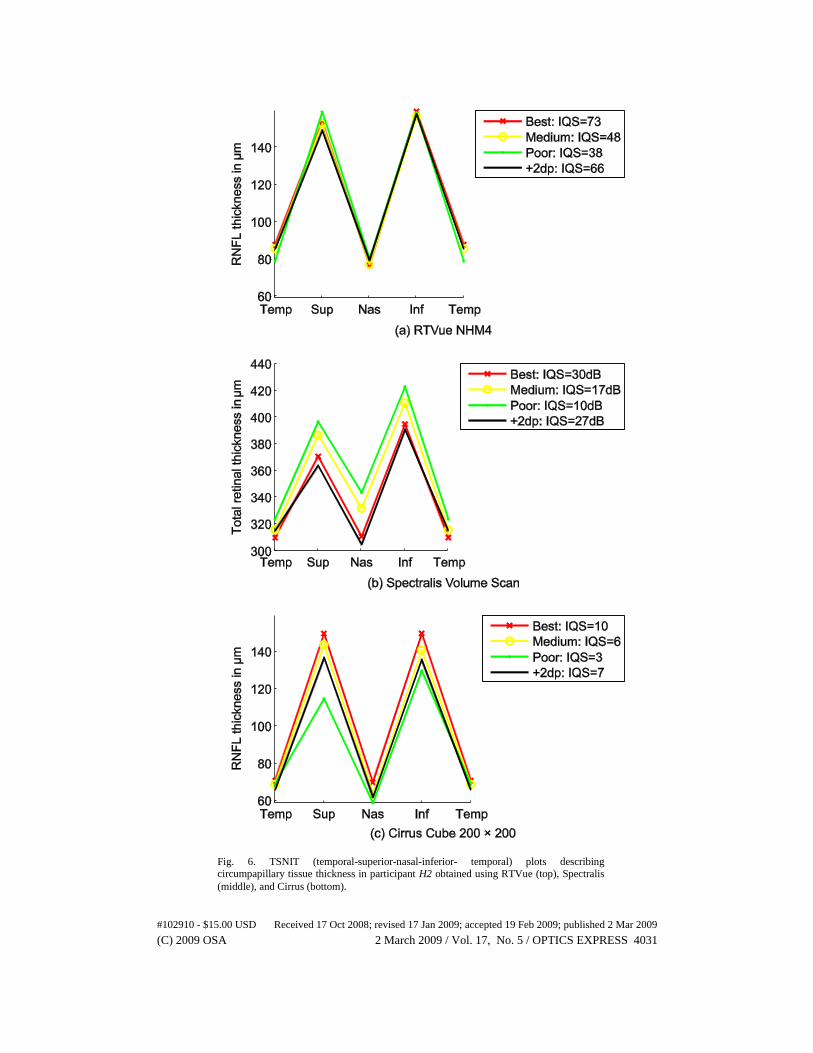
Fig. 6. TSNIT (temporal-superior-nasal-inferior- temporal) plots describing circumpapillary tissue thickness in participant H2 obtained using RTVue (top), Spectralis
(middle), and Cirrus (bottom).
#102910 - $15.00 USD Received 17 Oct 2008; revised 17 Jan 2009; accepted 19 Feb 2009; published 2 Mar 2009
(C) 2009 OSA 2 March 2009 / Vol. 17, No. 5 / OPTICS EXPRESS 4031
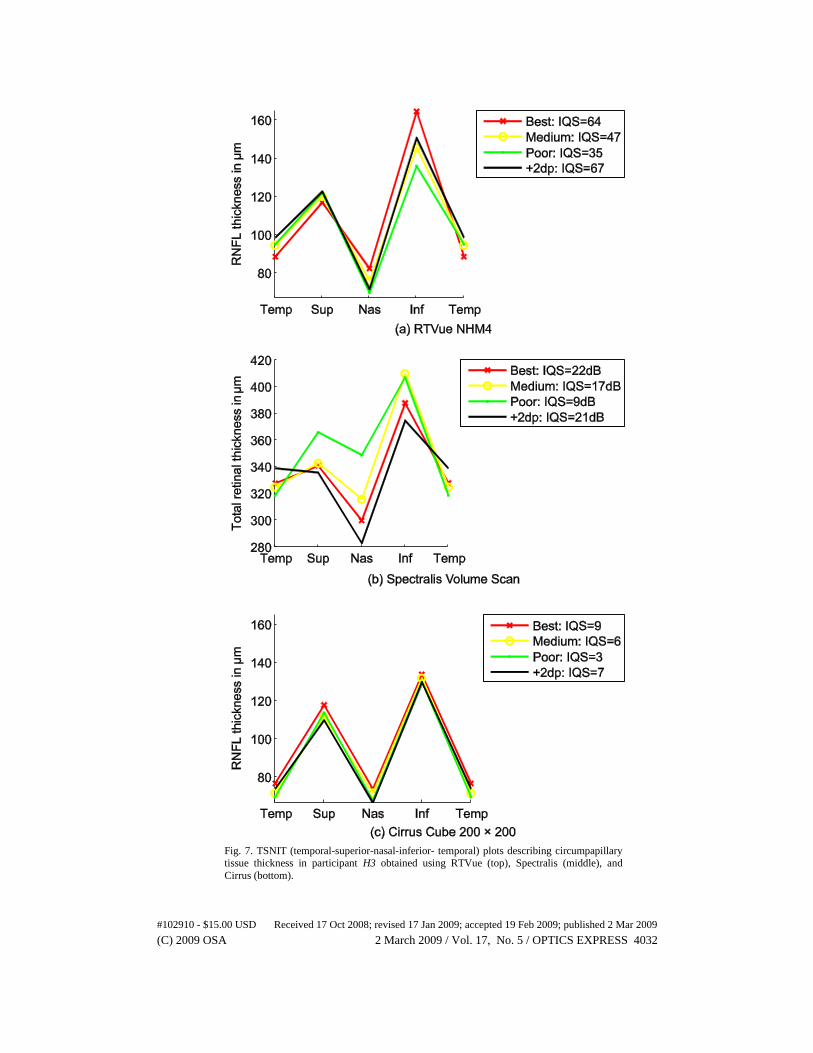
Fig. 7. TSNIT (temporal-superior-nasal-inferior- temporal) plots describing circumpapillary
tissue thickness in participant H3 obtained using RTVue (top), Spectralis (middle), and
Cirrus (bottom).
#102910 - $15.00 USD Received 17 Oct 2008; revised 17 Jan 2009; accepted 19 Feb 2009; published 2 Mar 2009
(C) 2009 OSA 2 March 2009 / Vol. 17, No. 5 / OPTICS EXPRESS 4032
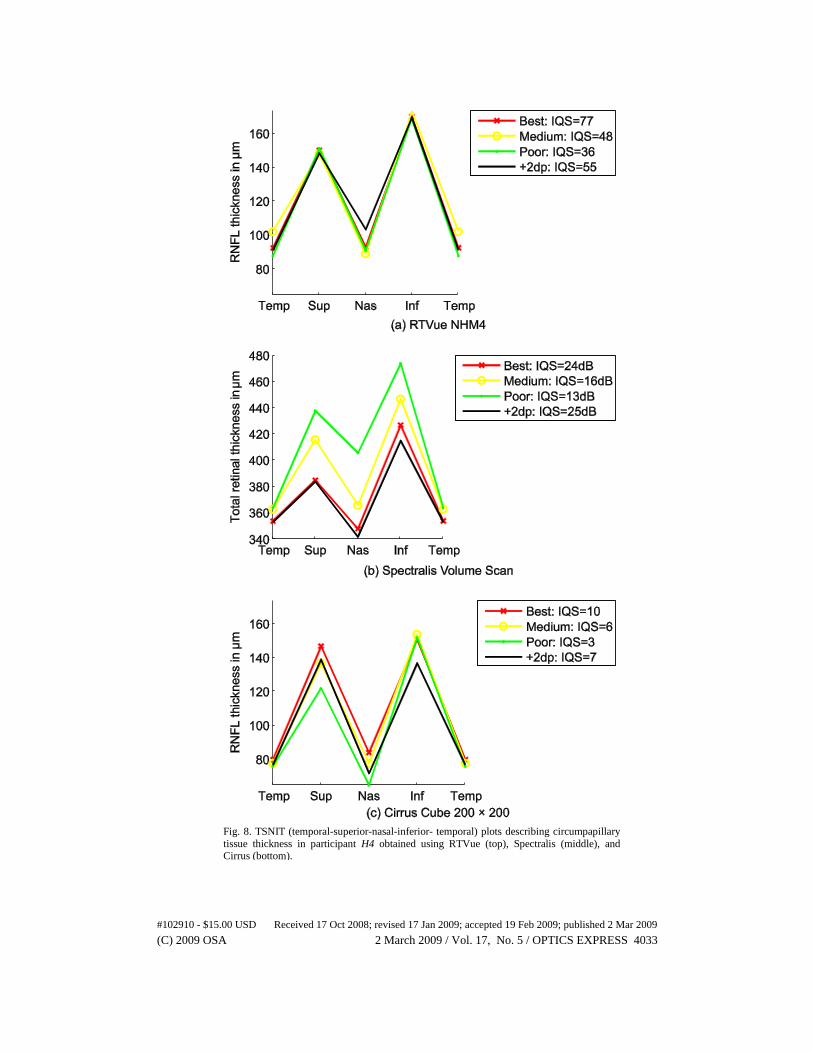
Fig. 8. TSNIT (temporal-superior-nasal-inferior- temporal) plots describing circumpapillary
tissue thickness in participant H4 obtained using RTVue (top), Spectralis (middle), and Cirrus (bottom).
#102910 - $15.00 USD Received 17 Oct 2008; revised 17 Jan 2009; accepted 19 Feb 2009; published 2 Mar 2009
(C) 2009 OSA 2 March 2009 / Vol. 17, No. 5 / OPTICS EXPRESS 4033
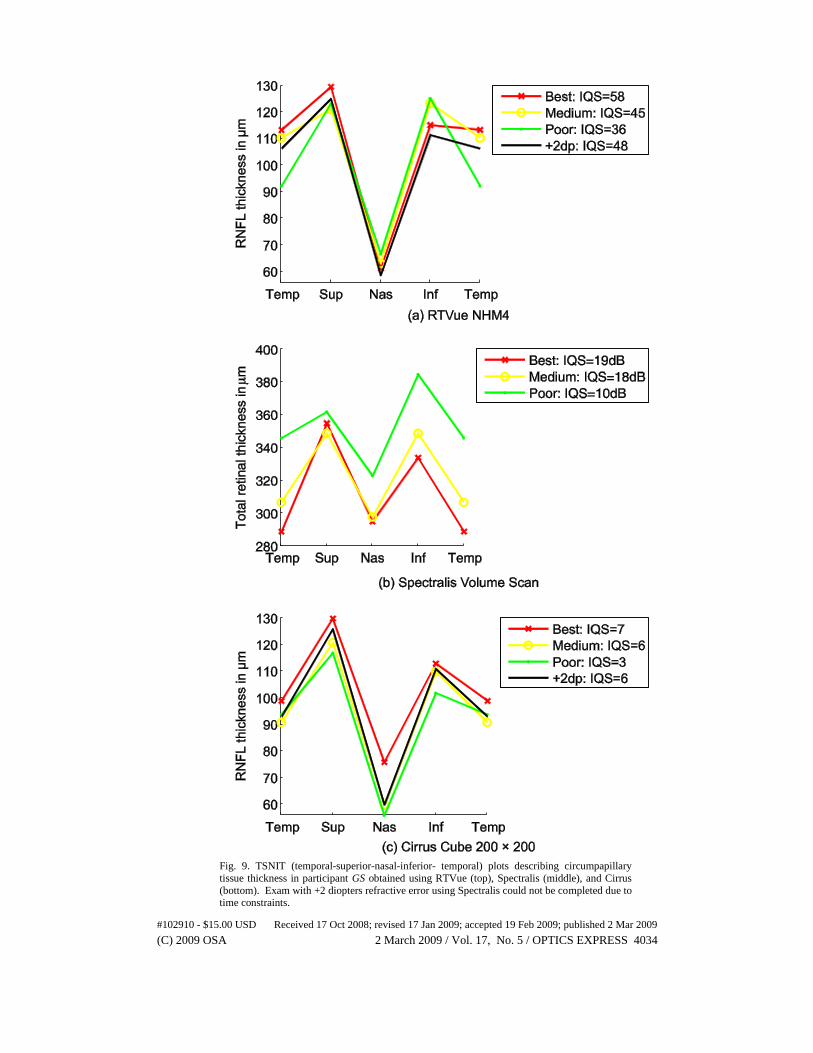
Fig. 9. TSNIT (temporal-superior-nasal-inferior- temporal) plots describing circumpapillary
tissue thickness in participant GS obtained using RTVue (top), Spectralis (middle), and Cirrus
(bottom). Exam with +2 diopters refractive error using Spectralis could not be completed due to time constraints.
#102910 - $15.00 USD Received 17 Oct 2008; revised 17 Jan 2009; accepted 19 Feb 2009; published 2 Mar 2009
(C) 2009 OSA 2 March 2009 / Vol. 17, No. 5 / OPTICS EXPRESS 4034
4. Discussion
It is important that the clinician understand the specific strengths and weaknesses of any
instrument so that the best quality information can be used for glaucoma management
decisions. Fortunately, the SD-OCT instruments provide real-time automated assessment of
the quality of an exam. This feedback to the operator during image acquisition improves the
likelihood that a good quality image will be available. With each instrument, deliberate effort
was required to obtain a poor quality image of all eyes examined. With the RTVue very poor
quality images could not be saved and with Spectralis acquiring poor quality images was
made difficult by the laser time-out safety feature described in the Methods section. It should
be noted that the range of the quality measures and the basis for the image quality assessment
are not necessarily comparable across instruments. Therefore, a “medium” or “low” quality
scan on one instrument may not be comparable to a “medium” or “low” quality scan on
another. For example, the lowest quality scan obtainable with the RTVue was within the
manufacturer’s suggested acceptable range. In contrast, the low quality scans acquired using
Cirrus and Spectralis were well outside the manufacturer’s suggestion for a good quality scan.
Moreover, for Spectralis scans, only 2 frames were acquired in the ART mode as opposed to
the default value of 9 frames. For these reasons, it is not appropriate to compare differences in
measurements across instruments.
During the initial study design, we attempted several approaches to systematically
acquire scans at known quality level from each of the instruments so that the relationship
between the retinal thickness estimates and the corresponding scan quality levels could be
quantitatively described. For example, we identified the best scan quality setting for each
study eye in a given instrument and attempted to incrementally and consistently degrade the
scan quality in all the 3 instruments by adding external defocus in steps of 2 diopters so that
scans could be acquired at 4 known defocus levels of 1) best possible quality for a given eye
from each of the instruments, 2) +2 diopters focus error, 3) +4 diopters focus error, and 4) +6
diopters focus error. However, acquiring scans with an external focus > +4 diopters was very
challenging and it was sometimes not possible to complete an exam due to built in features
designed to ensure that good quality scans are used (Spectralis and RTVUe) and that overall
scan time per eye does not exceed a specified safety limit (Spectralis). Specifically, the scans
acquired at higher defocus levels using Spectralis in the default ART mode did not meet the
minimum required scan quality recommended by the manufacturer and therefore the
instrument could not acquire scans at this setting; RTVue does not permit saving such poor
quality scans. In addition, because it became harder to fixate on the scanning target at higher
defocus levels and because ART mode in Spectralis requires at least 2 B-scans per retinal
location, it took longer to complete a scan and some study participants could not complete all
the scans due to the laser time-out safety feature. Therefore, we determined that defining scan
quality levels subjectively within each instrument was the most reliable method of acquiring
scans at various scan quality levels from all of the study participants, even though the quality
levels are not comparable across instruments.
It is important to emphasize that automated image quality assessment is not fool-proof
and can miss some types of poor quality images. Moreover, as software and hardware
improves, some issues that adversely affect the quality of the scan may no longer be relevant.
It is therefore essential that images be assessed subjectively for quality before they are utilized
for clinical decision-making.
In this small case series, the RNFL and retinal measurements of each eye were relatively
stable despite differences in the quality of the SD-OCT images, particularly among the “best”,
“medium” and “+2dp level” scans . These results suggest that the measurements are robust to
differences in image quality, at least in the small number of cases included. A larger sample
is needed to fully investigate this issue, and to provide estimates of the range of differences in
measurements that are likely to occur due to variability in scan quality.
#102910 - $15.00 USD Received 17 Oct 2008; revised 17 Jan 2009; accepted 19 Feb 2009; published 2 Mar 2009
(C) 2009 OSA 2 March 2009 / Vol. 17, No. 5 / OPTICS EXPRESS 4035
The TSNIT plots for all the participants at “best” and “+2dp” SSQ levels are very similar
indicating that small defocus errors that are plausible in a busy clinical setting do not
deteriorate the quality of the scans and do not introduce large measurements errors in the
parameter estimates.
There are several possible explanations for how quality of scans influences RNFL and
retinal measurements. One important issue likely is increased noise in lower quality images.
More noise increases the likelihood that segmentation algorithms used to calculate thickness
measurements will not accurately identify junctions of retinal layers. Increased noise also may
adversely affect algorithms used for centering and aligning images for location-specific
monitoring of change over time. In this study, RNFL thickness was estimated along a
~3.45mm diameter circle at temporal, superior, nasal and Inferior locations. RTVue and
Cirrus software version used in our current study (software version 2.0.4.0 and 3.0.0.64
respectively) uses a semi-automatic algorithm to identify the center of the optic disk to mark
the 3.45mm circular region while Spectralis requires the operator to identify the center of the
optic disk to place a 3.45mm circle. However, software is improving rapidly to include
features such as automatic delineation of the optic disc without operator
intervention. Therefore, other components of the SD-OCT such as the SD-OCT software
(especially the robustness of the segmentation algorithm to segment retinal layers) and the
level of operator intervention required to ensure the scan quality may also influence the
overall scan quality and repeatability of an exam. Previous studies on time-domain OCTs
indicate that the RNFL thickness estimates are influenced by the centering of the 3.45mm
circle [11, 18]. Inconsistent centering might contribute to the explanation of regional
thickness variations observed among scans obtained at different SSQs [19]. Consideration of
image noise levels may be particularly important for SD-OCT because it has been suggested
that SD (e.g., Fourier Domain) technology compensates less effectively for classical sources
of noise than time-domain OCT because of reliance on low-pass rather than band-pass
filtering, thus theoretically decreasing the effective SNR. (see [20] for a detailed description
of these issues).
In summary, this case series provides examples of 3D volume scans at various subjective
scan quality levels from the 3 commercially available SD-OCT instruments. These results
suggest that image acquisition protocols and analysis software are relatively robust even in
situations of suboptimal image quality.
Acknowledgments
The authors thank Ali Tafreshi, Hamilton Glaucoma Center, Department of Ophthalmology,
University of California San Diego for acquiring the scans for this case series study. This
research was supported in part by NIH EY 11008 (LMZ), and a financial support from
Heidelberg Engineering, GmbH, Heidelberg, Germany.
#102910 - $15.00 USD Received 17 Oct 2008; revised 17 Jan 2009; accepted 19 Feb 2009; published 2 Mar 2009
(C) 2009 OSA 2 March 2009 / Vol. 17, No. 5 / OPTICS EXPRESS 4036
Help Us Improve the Interactive Science Publishing (ISP) Tools -- Take the ISP Reader Survey