Assessment of the accuracy of dental enamel thickness measurements using microfocal X-ray computed...
13
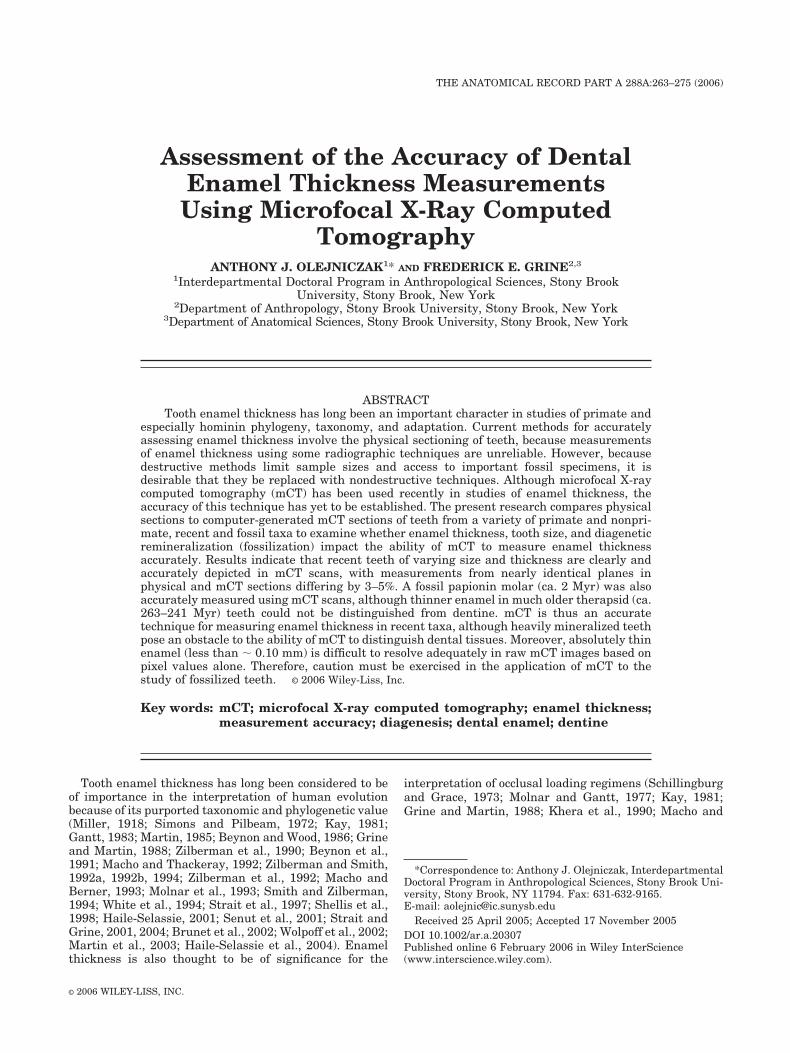
Assessment of the Accuracy of Dental Enamel Thickness Measurements Using Microfocal X-Ray Computed Tomography ANTHONY J. OLEJNICZAK 1 * AND FREDERICK E. GRINE 2,3 1 Interdepartmental Doctoral Program in Anthropological Sciences, Stony Brook University, Stony Brook, New York 2 Department of Anthropology, Stony Brook University, Stony Brook, New York 3 Department of Anatomical Sciences, Stony Brook University, Stony Brook, New York ABSTRACT Tooth enamel thickness has long been an important character in studies of primate and especially hominin phylogeny, taxonomy, and adaptation. Current methods for accurately assessing enamel thickness involve the physical sectioning of teeth, because measurements of enamel thickness using some radiographic techniques are unreliable. However, because destructive methods limit sample sizes and access to important fossil specimens, it is desirable that they be replaced with nondestructive techniques. Although microfocal X-ray computed tomography (mCT) has been used recently in studies of enamel thickness, the accuracy of this technique has yet to be established. The present research compares physical sections to computer-generated mCT sections of teeth from a variety of primate and nonpri- mate, recent and fossil taxa to examine whether enamel thickness, tooth size, and diagenetic remineralization (fossilization) impact the ability of mCT to measure enamel thickness accurately. Results indicate that recent teeth of varying size and thickness are clearly and accurately depicted in mCT scans, with measurements from nearly identical planes in physical and mCT sections differing by 3–5%. A fossil papionin molar (ca. 2 Myr) was also accurately measured using mCT scans, although thinner enamel in much older therapsid (ca. 263–241 Myr) teeth could not be distinguished from dentine. mCT is thus an accurate technique for measuring enamel thickness in recent taxa, although heavily mineralized teeth pose an obstacle to the ability of mCT to distinguish dental tissues. Moreover, absolutely thin enamel (less than 0.10 mm) is difficult to resolve adequately in raw mCT images based on pixel values alone. Therefore, caution must be exercised in the application of mCT to the study of fossilized teeth. © 2006 Wiley-Liss, Inc. Key words: mCT; microfocal X-ray computed tomography; enamel thickness; measurement accuracy; diagenesis; dental enamel; dentine Tooth enamel thickness has long been considered to be of importance in the interpretation of human evolution because of its purported taxonomic and phylogenetic value (Miller, 1918; Simons and Pilbeam, 1972; Kay, 1981; Gantt, 1983; Martin, 1985; Beynon and Wood, 1986; Grine and Martin, 1988; Zilberman et al., 1990; Beynon et al., 1991; Macho and Thackeray, 1992; Zilberman and Smith, 1992a, 1992b, 1994; Zilberman et al., 1992; Macho and Berner, 1993; Molnar et al., 1993; Smith and Zilberman, 1994; White et al., 1994; Strait et al., 1997; Shellis et al., 1998; Haile-Selassie, 2001; Senut et al., 2001; Strait and Grine, 2001, 2004; Brunet et al., 2002; Wolpoff et al., 2002; Martin et al., 2003; Haile-Selassie et al., 2004). Enamel thickness is also thought to be of significance for the interpretation of occlusal loading regimens (Schillingburg and Grace, 1973; Molnar and Gantt, 1977; Kay, 1981; Grine and Martin, 1988; Khera et al., 1990; Macho and *Correspondence to: Anthony J. Olejniczak, Interdepartmental Doctoral Program in Anthropological Sciences, Stony Brook Uni- versity, Stony Brook, NY 11794. Fax: 631-632-9165. E-mail: [email protected] Received 25 April 2005; Accepted 17 November 2005 DOI 10.1002/ar.a.20307 Published online 6 February 2006 in Wiley InterScience (www.interscience.wiley.com). THE ANATOMICAL RECORD PART A 288A:263–275 (2006) © 2006 WILEY-LISS, INC.
-
Upload
independent -
Category
Documents
-
view
3 -
download
0
Transcript of Assessment of the accuracy of dental enamel thickness measurements using microfocal X-ray computed...
Assessment of the Accuracy of DentalEnamel Thickness MeasurementsUsing Microfocal X-Ray Computed
TomographyANTHONY J. OLEJNICZAK1* AND FREDERICK E. GRINE2,3
1Interdepartmental Doctoral Program in Anthropological Sciences, Stony BrookUniversity, Stony Brook, New York
2Department of Anthropology, Stony Brook University, Stony Brook, New York3Department of Anatomical Sciences, Stony Brook University, Stony Brook, New York
ABSTRACTTooth enamel thickness has long been an important character in studies of primate and
especially hominin phylogeny, taxonomy, and adaptation. Current methods for accuratelyassessing enamel thickness involve the physical sectioning of teeth, because measurementsof enamel thickness using some radiographic techniques are unreliable. However, becausedestructive methods limit sample sizes and access to important fossil specimens, it isdesirable that they be replaced with nondestructive techniques. Although microfocal X-raycomputed tomography (mCT) has been used recently in studies of enamel thickness, theaccuracy of this technique has yet to be established. The present research compares physicalsections to computer-generated mCT sections of teeth from a variety of primate and nonpri-mate, recent and fossil taxa to examine whether enamel thickness, tooth size, and diageneticremineralization (fossilization) impact the ability of mCT to measure enamel thicknessaccurately. Results indicate that recent teeth of varying size and thickness are clearly andaccurately depicted in mCT scans, with measurements from nearly identical planes inphysical and mCT sections differing by 3–5%. A fossil papionin molar (ca. 2 Myr) was alsoaccurately measured using mCT scans, although thinner enamel in much older therapsid (ca.263–241 Myr) teeth could not be distinguished from dentine. mCT is thus an accuratetechnique for measuring enamel thickness in recent taxa, although heavily mineralized teethpose an obstacle to the ability of mCT to distinguish dental tissues. Moreover, absolutely thinenamel (less than � 0.10 mm) is difficult to resolve adequately in raw mCT images based onpixel values alone. Therefore, caution must be exercised in the application of mCT to thestudy of fossilized teeth. © 2006 Wiley-Liss, Inc.
Key words: mCT; microfocal X-ray computed tomography; enamel thickness;measurement accuracy; diagenesis; dental enamel; dentine
Tooth enamel thickness has long been considered to beof importance in the interpretation of human evolutionbecause of its purported taxonomic and phylogenetic value(Miller, 1918; Simons and Pilbeam, 1972; Kay, 1981;Gantt, 1983; Martin, 1985; Beynon and Wood, 1986; Grineand Martin, 1988; Zilberman et al., 1990; Beynon et al.,1991; Macho and Thackeray, 1992; Zilberman and Smith,1992a, 1992b, 1994; Zilberman et al., 1992; Macho andBerner, 1993; Molnar et al., 1993; Smith and Zilberman,1994; White et al., 1994; Strait et al., 1997; Shellis et al.,1998; Haile-Selassie, 2001; Senut et al., 2001; Strait andGrine, 2001, 2004; Brunet et al., 2002; Wolpoff et al., 2002;Martin et al., 2003; Haile-Selassie et al., 2004). Enamelthickness is also thought to be of significance for the
interpretation of occlusal loading regimens (Schillingburgand Grace, 1973; Molnar and Gantt, 1977; Kay, 1981;Grine and Martin, 1988; Khera et al., 1990; Macho and
*Correspondence to: Anthony J. Olejniczak, InterdepartmentalDoctoral Program in Anthropological Sciences, Stony Brook Uni-versity, Stony Brook, NY 11794. Fax: 631-632-9165.E-mail: [email protected]
Received 25 April 2005; Accepted 17 November 2005DOI 10.1002/ar.a.20307Published online 6 February 2006 in Wiley InterScience(www.interscience.wiley.com).
THE ANATOMICAL RECORD PART A 288A:263–275 (2006)
© 2006 WILEY-LISS, INC.

Berner, 1993; Dumont, 1995; Spears and Macho, 1998;Macho and Spears, 1999; Schwartz, 2000a, 2000b; Martinet al., 2003).
Physical cross-sections of molar teeth have been used tomeasure enamel thickness by a number of workers (e.g.,Molnar and Gantt, 1977; Martin, 1985; Beynon and Wood,1986; Grine and Martin, 1988; Macho and Berner, 1993;Dumont, 1995; Schwartz, 2000b; Grine, 2002, 2004, 2005;Grine et al., 2005). Physical sections provide an accurateportrayal of enamel thickness in a particular plane ofsection, but problems with specimen orientation (i.e., sec-tion obliquity) may render some of these data less thanideal. Moreover, because mechanical sectioning is destruc-tive, even when the cut is as narrow as 70 �m (Grine andMartin, 1988), it is difficult to obtain adequate samples forstatistical comparison, especially when the taxa underconsideration are rare, endangered, or extinct.
Alternative techniques have been developed and em-ployed in response to the problem of accurately recon-structing enamel cap volumes from physical sections, al-though some of these entail the destruction of the entireenamel cap (Kono-Takeuchi et al., 1997; Kono et al., 2002).Noninvasive methods such as ultrasonic imaging or acous-tic microscopy (Baum et al., 1963; Lees, 1968, 1971; Leesand Barber, 1968; Peck et al., 1989; Yang, 1991, 1996;Mezava et al., 1999; Maev et al., 2000, 2002) and radiog-raphy have been employed to quantify tooth enamel thick-ness. Although acoustic microscopy has been used in sev-eral clinical studies of enamel and dentine, the accuracy ofthe quantitative data obtained has yet to be established.Various radiographic techniques have been employed ex-tensively in the measurement of tooth enamel thickness toaddress clinical as well as evolutionary questions, includ-ing flat-plane radiography, computed tomography, and,most recently, microfocal X-ray computed tomography(mCT).
Lateral flat-plane radiographs have been used to mea-sure enamel thickness in living humans. Standard bite-wing radiographs of dental patients have been used tostudy the effect of sex-linked genes on tooth size (Alvesaloand Tammisalo, 1981; Alvesalo, 1985; Alvesalo et al.,1985, 1987), and they also have been used to assess theeffects of sex and ethnic background on tooth crown com-ponents (Stroud et al., 1994, 1998; Zilberman and Smith,1994; Harris and Hicks, 1998; Harris et al., 1999). Lateralflat-plane radiographs also have been used to measureenamel thickness in fossil hominin and hominoid speci-mens (Sperber, 1985, 1986; Nagatoshi, 1990; Zilberman etal., 1990; Zilberman and Smith, 1992b, 1992a; Molnar etal., 1993; Faerman et al., 1994; Smith and Zilberman,1994). These studies utilized the parallel-film technique,in which the film is oriented parallel to the major axis ofthe tooth, and the X-ray beam is directed perpendicular toan imaginary plane that bisects the vertical and mesiodis-tal axes of the tooth and the plane of the radiographicplate (Gron, 1960). Some studies have recorded linearmeasurements from lateral radiographs, while othershave measured the projected area of the enamel cap. Ithas been shown, however, that measurements of enamelthickness from standard lateral radiographs are unlikelyto reflect accurately the true thickness as defined by phys-ical sections through the crown (Grine et al., 2001). Thus,while this type of X-ray may provide a qualitative impres-sion of whether a tooth has relatively thin enamel (e.g.,human deciduous molars) or relatively thick enamel (e.g.,
human permanent molars), measurements derived fromstandard lateral radiographic images are unlikely to re-flect that thickness accurately.
Computed tomography (CT) has also been utilized toquantify enamel thickness in recent and fossil homininteeth (e.g., Zonneveld and Wind, 1985; Conroy, 1991; Con-roy and Vanier, 1991; Macho and Thackeray, 1992; Con-roy et al., 1995; Schwartz et al., 1998). With the exceptionof the study by Schwartz et al. (1998), however, theseanalyses have employed standard CT scans, a techniquethat has been demonstrated to be grossly inaccurate in themeasurement of enamel thickness (Grine, 1991). Stan-dard CT images generally exaggerate enamel thicknesscompared to values obtained from mechanical sections(Grine, 1991). There are several reasons for this, includingbeam hardening artifacts, partial volume effect, and theimprobability of obtaining a CT slice that traverses thetips of both dentine horns (Grine, 1991). Moreover, Spooret al. (1993) have shown that accurate linear measure-ments of enamel can be obtained with CT scans only if thehalf maximum height (HMH) values are calculated be-tween adjacent CT number levels at both the air-enameland enamel-dentine boundaries. Failure to image at theproper HMH CT values can result in measurement errorsin excess of 1.0 mm (Spoor et al., 1993). Even when thecorrect HMH CT adjustment is used, thin enamel cannotbe measured accurately (its thickness will be exaggerated)due to limited spatial resolution of the scanner (Spoor etal., 1993). These factors render suspect the results ofenamel thickness measurements reported in a number ofstudies that did not take them into account (e.g., Zonn-eveld and Wind, 1985; Conroy, 1991; Conroy and Vanier,1991; Macho and Thackeray, 1992; Conroy et al., 1995).
Technical advances in computer-assisted radiographictechniques have resulted in the application of microfocalX-ray computed tomography as a nondestructive tech-nique for the measurement of enamel thickness (Chaim-anee et al., 2003; Gantt et al., 2003; Kono, 2004; Olejnic-zak and Grine, 2005). The intricate structure of cancellousbone has been extensively studied using mCT (Kuhn et al.,1990; Bonse et al., 1994; Muller et al., 1996a,b; Ruegseg-ger et al., 1996; Muller and Ruegsegger, 1997; Kappel-man, 1998; Kinney et al., 1998; Fajardo and Muller, 2001;MacLatchy and Muller, 2002; Muller, 2002, 2003), andthis technology has even been applied successfully to thevisualization of the brain endocast and vestibular appa-ratus of Mesozoic pterosaurs (Witmer et al., 2003).
A number of studies have examined the repeatability ofmeasurements (and inter- and intraindividual errors inlocating landmarks) from mCT images of trabecular bone(e.g., Durand and Ruegsegger, 1991; Balto et al., 2000),tooth root canals (Peters et al., 2000), and tooth enamel(Avishai et al., 2004). To date, however, the only studiesthat have attempted to assess the accuracy of measure-ments derived from high-resolution X-ray computed to-mography have been conducted with reference to trabec-ular bone configuration (Kuhn et al., 1990; Muller et al.,1996a,b, 1998; Hildebrand et al., 1999; Fajardo et al.,2002), periapical and periradicular alveolar bone destruc-tion (Balto et al., 2000; von Stechow et al., 2003), thediameters of tooth root canals (Rhodes et al., 1999), andcortical bone porosity (Cooper et al., 2004). We are un-aware of any study that has addressed the issue of mea-surement accuracy in the mCT assessment of dental hardtissues.
264 OLEJNICZAK AND GRINE
Kuhn et al. (1990), Muller et al. (1996a,b, 1998), Hilde-brand et al. (1999), and Fajardo et al. (2002) observednegligible differences between measurements derivedfrom mCT images and those obtained using traditionalhistomorphometric or stereological techniques applied tohistological thin sections. Percentage differences betweenthe mCT and histological values reported by these studiesranged between lows of 0.88–1.17 (Muller et al., 1996a,b)and highs of 2.5–6.1 (Muller et al., 1996a,b), dependingupon the type of physical section examined. Balto et al.(2000) and von Stechow et al. (2003) also reported negli-gible differences between measurements obtained frommCT and histological sections of periapical and perira-dicular bone. Rhodes et al. (1999) similarly reported veryhigh correlations between the values recorded for the di-ameters of tooth root canals from mCT images and phys-ical sections. Cooper et al. (2004) compared measurementsobtained by mCT to those recorded from microradiographsof cortical bone, and while the two methods producedsimilarities, relatively poor results were obtained for mea-surements of pore density. Unfortunately, it is not possi-ble to ascertain the source of this discrepancy or its devi-ation from values derived from physical sections becausehistological preparations were not measured directly. Fa-jardo et al. (2002) concluded that mCT can accuratelyreconstruct the complex architecture of trabecular bone,although slight alterations in threshold values greatlyaffected the morphometric data.
The only mCT studies that have been directed explicitlyat the resolution of dental hard tissues (e.g., Avashai etal., 2004; McErlain et al., 2004) have not involved com-parisons of measurements derived from mCT and physicalsections. McErlain et al. (2004) examined a single toothfrom a 420-year-old Late Iron Age site in Cambodia andsimply commented that they were clearly able to differen-tiate visually the hard tissue components, which weredisplayed with “exceptional clarity.” The study by Avishaiet al. (2004) examined individual error rates in locatinglandmarks (and resultant measurements) in a series oftooth germs derived from archeological contexts.
Thus, although mCT is a potentially powerful tool bywhich to obtain information on enamel thickness in anondestructive manner, its efficacy for this purpose hasyet to be demonstrated. It is necessary to establish thevalidity of enamel thickness measurements obtained us-
ing mCT before these data are employed to answer ques-tions of clinical or evolutionary interest. The purpose ofthe present study was to establish the accuracy of high-resolution mCT for the measurement of enamel thicknessin teeth of differing size, enamel thickness, and degree ofmineralization. Toward this end, we compared measure-ments obtained from mCT scans that had not undergoneany image artifact corrections (as this may impact mea-surements) to those obtained from physical sections of thesame specimens. In the first instance, we measured mCTand histological sections using standard techniques (i.e.,measuring printed images using a digitizing tablet) inorder to make our results comparable to those of previ-ously published studies. As mCT studies become morecommon, direct measurement by means of computer soft-ware will also become commonplace. We therefore alsocompared our measurements obtained by digitization tothose taken directly on the three-dimensional models inorder to assess the comparability of these protocols.
MATERIALS AND METHODSStudy Sample Composition
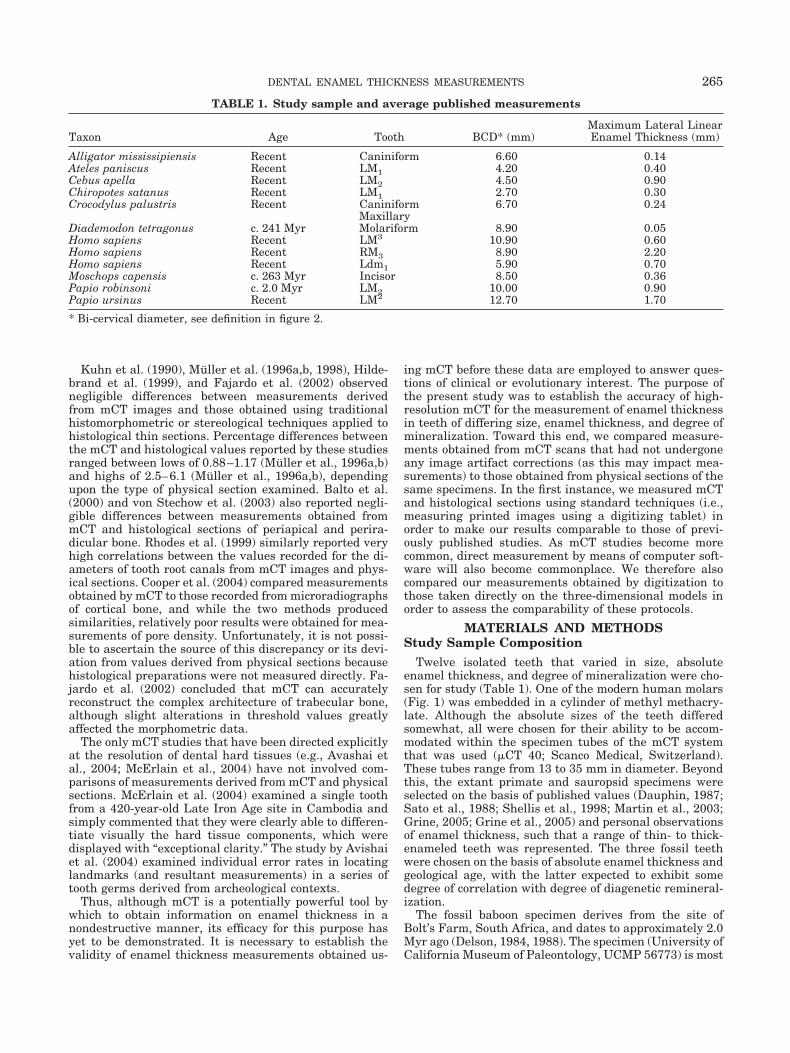
Twelve isolated teeth that varied in size, absoluteenamel thickness, and degree of mineralization were cho-sen for study (Table 1). One of the modern human molars(Fig. 1) was embedded in a cylinder of methyl methacry-late. Although the absolute sizes of the teeth differedsomewhat, all were chosen for their ability to be accom-modated within the specimen tubes of the mCT systemthat was used (�CT 40; Scanco Medical, Switzerland).These tubes range from 13 to 35 mm in diameter. Beyondthis, the extant primate and sauropsid specimens wereselected on the basis of published values (Dauphin, 1987;Sato et al., 1988; Shellis et al., 1998; Martin et al., 2003;Grine, 2005; Grine et al., 2005) and personal observationsof enamel thickness, such that a range of thin- to thick-enameled teeth was represented. The three fossil teethwere chosen on the basis of absolute enamel thickness andgeological age, with the latter expected to exhibit somedegree of correlation with degree of diagenetic remineral-ization.
The fossil baboon specimen derives from the site ofBolt’s Farm, South Africa, and dates to approximately 2.0Myr ago (Delson, 1984, 1988). The specimen (University ofCalifornia Museum of Paleontology, UCMP 56773) is most
TABLE 1. Study sample and average published measurements
Taxon Age Tooth BCD* (mm)Maximum Lateral LinearEnamel Thickness (mm)
Alligator mississipiensis Recent Caniniform 6.60 0.14Ateles paniscus Recent LM1 4.20 0.40Cebus apella Recent LM2 4.50 0.90Chiropotes satanus Recent LM1 2.70 0.30Crocodylus palustris Recent Caniniform 6.70 0.24
Diademodon tetragonus c. 241 MyrMaxillaryMolariform 8.90 0.05
Homo sapiens Recent LM3 10.90 0.60Homo sapiens Recent RM3 8.90 2.20Homo sapiens Recent Ldm1 5.90 0.70Moschops capensis c. 263 Myr Incisor 8.50 0.36Papio robinsoni c. 2.0 Myr LM2 10.00 0.90Papio ursinus Recent LM2 12.70 1.70
* Bi-cervical diameter, see definition in figure 2.
265DENTAL ENAMEL THICKNESS MEASUREMENTS

likely attributable to Papio robinsoni (E. Delson, personalcommunication). The two therapsid teeth are from thePermo-Triassic sediments of the Karoo Basin of SouthAfrica. The younger of the two specimens (National Mu-seum, Bloemfontein, specimen QR 1222) is a molariformtooth of the cynodont Diademodon tetragonus, the enamelof which is extremely thin (Grine et al., 1979). This fossildates to the Early-Middle Triassic boundary (Lucas,1995), or the Early Anisian, between some 237 and 245Myr (Hancox and Rubidge, 2001; De Kock et al., 2003;Rubidge, 2005). The older of the two therapsid specimens(South African Museum, Cape Town, specimen K 203) isan isolated tapinocephalid incisor. It derives from theAbrahamskraal Formation of the Beaufort Group anddates to the Middle Permian (Smith and Keyser, 1995), orCapitanian, between about 260 and 266 Myr (Hancox andRubidge, 2001; De Kock et al., 2003; Rubidge, 2005). Theincisor is compatible with assignment to either Struthio-cephalus whaitsi or Moschops capensis; because the latteris more common in these strata (Smith and Keyser, 1995),we assign the tooth to it.
Physical Cross-Section and mCT ImageAcquisition
In order to generate a three-dimensional model of eachtooth, every specimen was scanned in its entirety using afan-beam-type desktop mCT system (�CT 40; Scanco Med-ical). The diameter of the specimen tubes used, as well asthe voxel dimensions and number of slices produced, are
given in Table 2. All scans were output with 2,048 � 2,048pixels per slice and 8 bits per pixel; the resultant voxelswere isometric (having identical length, width, anddepth). Each scan used the same settings for voltage (50kV) and amperage (160 �A), and the acquisition time foreach slice was 4–7 sec, with a reconstruction time ofapproximately 24 sec per slice at an angular increment of0.36°. After the mCT scanning of each tooth was complete,the specimens were prepared for physical sectioning fol-lowing established methods (Grine, 2005). The tips of thetwo mesial cusps (protocone and paracone, or metaconidand protoconid) of the primate molars were marked with aspot of permanent ink. An equivalent procedure was em-ployed for the sauropsid and therapsid teeth, taking intoaccount the fact that because they differ morphologicallyfrom the primate molars, a homologous plane is not avail-able. In these instances, a series of anatomical landmarksand pseudolandmarks (e.g., cusp tips, cervical margins)was identified in order to define the location of the plane ofsection. The crown was then embedded in epoxy and sec-tioned with a 0.15 mm diamond-wafering blade (BuehlerIsomet). The blade was positioned immediately distal tothe ink marks to ensure that the mesial crown blockincluded both dentine horns. This block face was groundwith 400-grade paper and polished with a sequence ofdiamond pastes to 0.25 �m (Buehler Microcloth) to obtaina topography-free buccolingual (BL) section that traversedthe tips of both dentine horns (in the case of the primatemolars). The polished surface was lightly etched with 0.5%H3PO4 for 15 sec to remove any smeared enamel, ultra-sonicated in distilled H2O, mounted on a stub, and coatedwith silver for examination by scanning electron micros-copy (AMRAY 1810). These specimens were examined at25 kV in either secondary or, more commonly, back-scat-tered electron mode. Micrographs were recorded usingPolaroid type 55 P/N film at magnifications between 7.5�and 11.0�, depending on the size of the specimen; workingdistance was held under 27 mm to ensure accurate mag-nification. Enlargements of the micrographs were used formeasurement.
In order to compare measurements recorded from thephysical sections to those obtained by mCT, stacked imagesequences of each tooth derived from mCT scanning wereimported into the VoxBlast software program (Vaytek) tocreate three-dimensional reconstructions of the crown.The size of the mCT image file at the slice thicknessesused here (3.0–10.0 GB for each image stack in this study)imposes certain hardware limitations, so image stackswere stored at a resolution of 512 � 512 pixels [(the samepixel dimensions used by Kono (2004)] rather than the2,048 � 2,048 pixels generated by the mCT unit. We notedno visual loss of image quality after the adjustment. Be-cause the slice thickness of the scans was preserved, thepixel size was effectively four times the slice thickness. AllVoxBlast procedures described here were performed on acomputer equipped with a 2.8 GHz Hyper-Threading Pen-tium IV processor (Intel) and 2.0 GB of random accessmemory.
VoxBlast software allows user-defined planes of sectionto be created, and these can pass through the three-di-mensional reconstructions at any orientation. Using twoenamel cusp tips as landmarks (in the case of the primatemolars), a buccolingual section was made through eachtooth model, attempting to capture the same plane as waslocated in the physical sections. An iterative (slice-by-
Fig. 1. Scanning electron micrographs (left) and mCT images of thesame cross-section through three of the primate molars examined.Scale bar � 1 mm.
266 OLEJNICZAK AND GRINE
slice) technique was employed to refine the location of thisplane of section based on visual comparison of the SEMmicrographs to the mCT model. Anatomical landmarksunique to a particular plane (e.g., cracks in the enamel ordentine, distinct pulp chamber morphology, distinct den-tine topography) were identified in order to match themCT section to the physical section. After locating thedesired plane of section in the mCT model, the image ofthis plane was exported and printed at its resolutionbased on our postprocessing technique (512 � 512 pixels).Two images representing the same plane of section werethus available for comparison for each specimen: one gen-erated by physical sectioning and one generated by mCT(Fig. 1).
As mCT analysis of teeth becomes commonplace, themeasurement of dental tissues using software alone(rather than digitizing a printed image) is likely also tobecome widespread. Therefore, we compared measure-ments that were recorded using both techniques to seewhether they differ. Measuring the mCT sections and theSEM images of the histological sections using a digitizingtablet served to control potential sources of measurementerror by ensuring that identical techniques were used tomeasure both sets of images. Digitization also made themethod of analysis used here comparable to that of previ-ous studies. We then compared digitized measurementswith on-screen measurements in order to establishwhether the data derived from these two techniques areequivalent. Certain measurements that are based on an-atomical landmarks (e.g., the thickness of enamel betweenthe dentin horn tip and the enamel cusp tip) were recordedon the mCT images for three of the specimens using Vox-Blast software. These values were compared to measure-ments obtained by digitizing the printed images.
Measurements RecordedMeasurements describing the thickness of enamel rela-
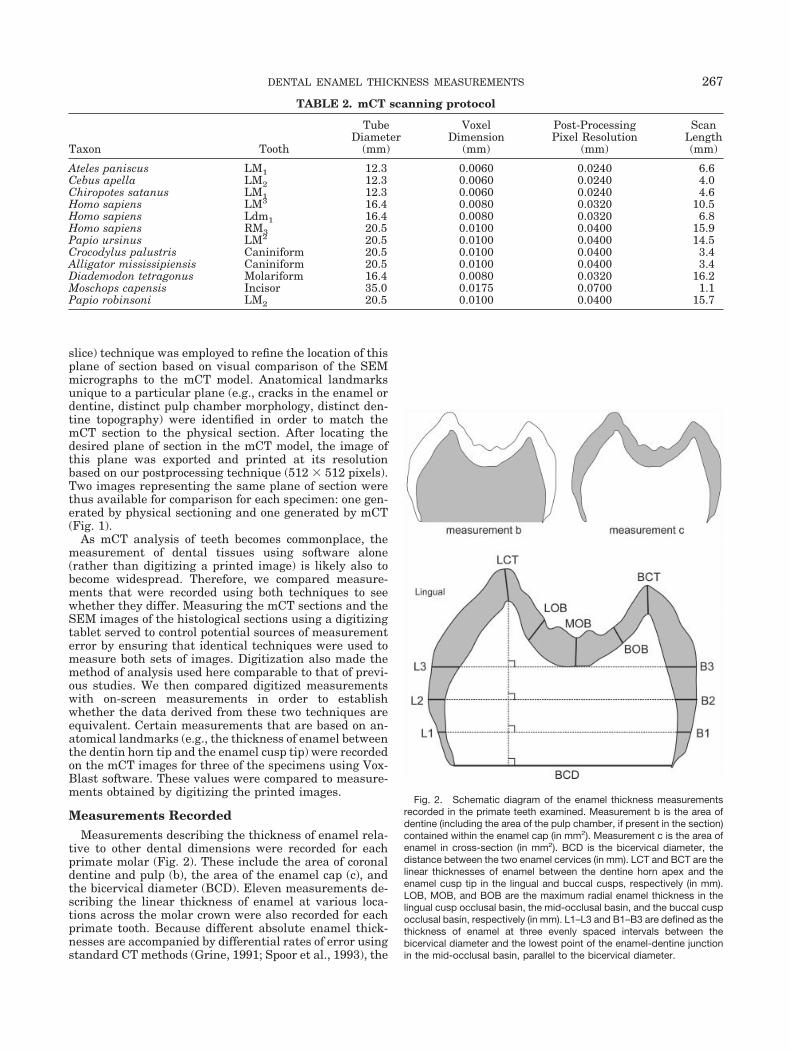
tive to other dental dimensions were recorded for eachprimate molar (Fig. 2). These include the area of coronaldentine and pulp (b), the area of the enamel cap (c), andthe bicervical diameter (BCD). Eleven measurements de-scribing the linear thickness of enamel at various loca-tions across the molar crown were also recorded for eachprimate tooth. Because different absolute enamel thick-nesses are accompanied by differential rates of error usingstandard CT methods (Grine, 1991; Spoor et al., 1993), the
Fig. 2. Schematic diagram of the enamel thickness measurementsrecorded in the primate teeth examined. Measurement b is the area ofdentine (including the area of the pulp chamber, if present in the section)contained within the enamel cap (in mm2). Measurement c is the area ofenamel in cross-section (in mm2). BCD is the bicervical diameter, thedistance between the two enamel cervices (in mm). LCT and BCT are thelinear thicknesses of enamel between the dentine horn apex and theenamel cusp tip in the lingual and buccal cusps, respectively (in mm).LOB, MOB, and BOB are the maximum radial enamel thickness in thelingual cusp occlusal basin, the mid-occlusal basin, and the buccal cuspocclusal basin, respectively (in mm). L1–L3 and B1–B3 are defined as thethickness of enamel at three evenly spaced intervals between thebicervical diameter and the lowest point of the enamel-dentine junctionin the mid-occlusal basin, parallel to the bicervical diameter.
TABLE 2. mCT scanning protocol
Taxon Tooth
TubeDiameter
(mm)
VoxelDimension
(mm)
Post-ProcessingPixel Resolution
(mm)
ScanLength(mm)
Ateles paniscus LM1 12.3 0.0060 0.0240 6.6Cebus apella LM2 12.3 0.0060 0.0240 4.0Chiropotes satanus LM1 12.3 0.0060 0.0240 4.6Homo sapiens LM3 16.4 0.0080 0.0320 10.5Homo sapiens Ldm1 16.4 0.0080 0.0320 6.8Homo sapiens RM3 20.5 0.0100 0.0400 15.9Papio ursinus LM2 20.5 0.0100 0.0400 14.5Crocodylus palustris Caniniform 20.5 0.0100 0.0400 3.4Alligator mississipiensis Caniniform 20.5 0.0100 0.0400 3.4Diademodon tetragonus Molariform 16.4 0.0080 0.0320 16.2Moschops capensis Incisor 35.0 0.0175 0.0700 1.1Papio robinsoni LM2 20.5 0.0100 0.0400 15.7
267DENTAL ENAMEL THICKNESS MEASUREMENTS
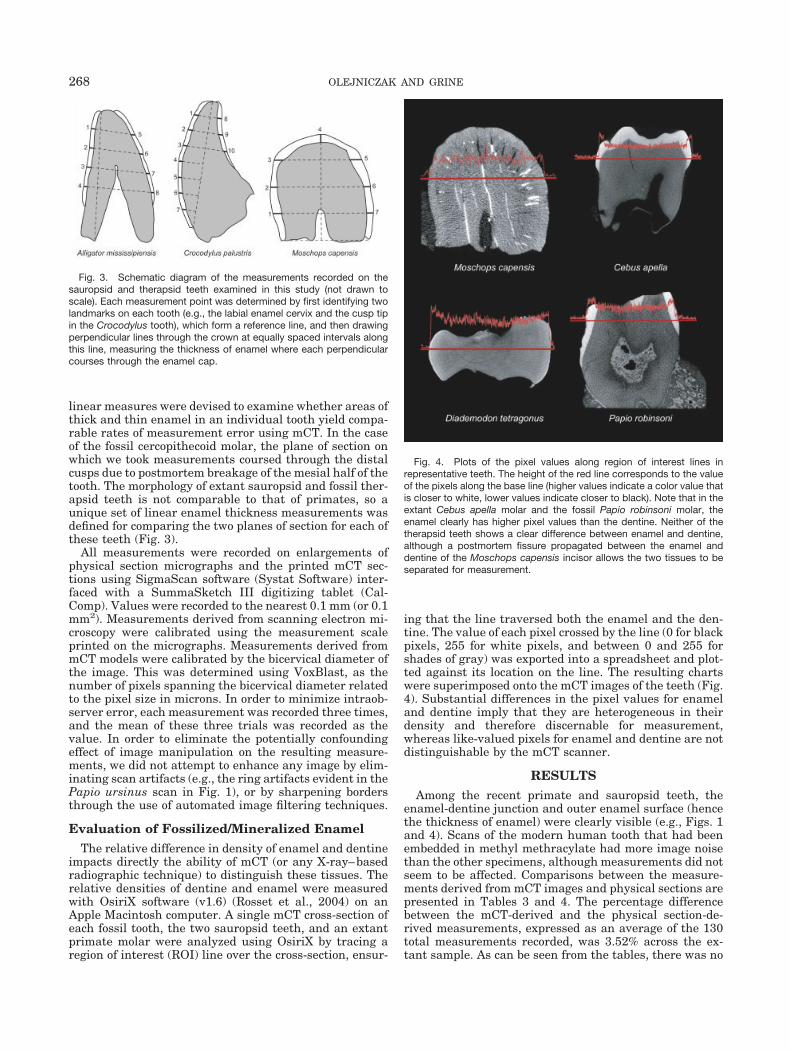
linear measures were devised to examine whether areas ofthick and thin enamel in an individual tooth yield compa-rable rates of measurement error using mCT. In the caseof the fossil cercopithecoid molar, the plane of section onwhich we took measurements coursed through the distalcusps due to postmortem breakage of the mesial half of thetooth. The morphology of extant sauropsid and fossil ther-apsid teeth is not comparable to that of primates, so aunique set of linear enamel thickness measurements wasdefined for comparing the two planes of section for each ofthese teeth (Fig. 3).
All measurements were recorded on enlargements ofphysical section micrographs and the printed mCT sec-tions using SigmaScan software (Systat Software) inter-faced with a SummaSketch III digitizing tablet (Cal-Comp). Values were recorded to the nearest 0.1 mm (or 0.1mm2). Measurements derived from scanning electron mi-croscopy were calibrated using the measurement scaleprinted on the micrographs. Measurements derived frommCT models were calibrated by the bicervical diameter ofthe image. This was determined using VoxBlast, as thenumber of pixels spanning the bicervical diameter relatedto the pixel size in microns. In order to minimize intraob-server error, each measurement was recorded three times,and the mean of these three trials was recorded as thevalue. In order to eliminate the potentially confoundingeffect of image manipulation on the resulting measure-ments, we did not attempt to enhance any image by elim-inating scan artifacts (e.g., the ring artifacts evident in thePapio ursinus scan in Fig. 1), or by sharpening bordersthrough the use of automated image filtering techniques.
Evaluation of Fossilized/Mineralized EnamelThe relative difference in density of enamel and dentine
impacts directly the ability of mCT (or any X-ray–basedradiographic technique) to distinguish these tissues. Therelative densities of dentine and enamel were measuredwith OsiriX software (v1.6) (Rosset et al., 2004) on anApple Macintosh computer. A single mCT cross-section ofeach fossil tooth, the two sauropsid teeth, and an extantprimate molar were analyzed using OsiriX by tracing aregion of interest (ROI) line over the cross-section, ensur-
ing that the line traversed both the enamel and the den-tine. The value of each pixel crossed by the line (0 for blackpixels, 255 for white pixels, and between 0 and 255 forshades of gray) was exported into a spreadsheet and plot-ted against its location on the line. The resulting chartswere superimposed onto the mCT images of the teeth (Fig.4). Substantial differences in the pixel values for enameland dentine imply that they are heterogeneous in theirdensity and therefore discernable for measurement,whereas like-valued pixels for enamel and dentine are notdistinguishable by the mCT scanner.
RESULTSAmong the recent primate and sauropsid teeth, the
enamel-dentine junction and outer enamel surface (hencethe thickness of enamel) were clearly visible (e.g., Figs. 1and 4). Scans of the modern human tooth that had beenembedded in methyl methracylate had more image noisethan the other specimens, although measurements did notseem to be affected. Comparisons between the measure-ments derived from mCT images and physical sections arepresented in Tables 3 and 4. The percentage differencebetween the mCT-derived and the physical section-de-rived measurements, expressed as an average of the 130total measurements recorded, was 3.52% across the ex-tant sample. As can be seen from the tables, there was no
Fig. 3. Schematic diagram of the measurements recorded on thesauropsid and therapsid teeth examined in this study (not drawn toscale). Each measurement point was determined by first identifying twolandmarks on each tooth (e.g., the labial enamel cervix and the cusp tipin the Crocodylus tooth), which form a reference line, and then drawingperpendicular lines through the crown at equally spaced intervals alongthis line, measuring the thickness of enamel where each perpendicularcourses through the enamel cap.
Fig. 4. Plots of the pixel values along region of interest lines inrepresentative teeth. The height of the red line corresponds to the valueof the pixels along the base line (higher values indicate a color value thatis closer to white, lower values indicate closer to black). Note that in theextant Cebus apella molar and the fossil Papio robinsoni molar, theenamel clearly has higher pixel values than the dentine. Neither of thetherapsid teeth shows a clear difference between enamel and dentine,although a postmortem fissure propagated between the enamel anddentine of the Moschops capensis incisor allows the two tissues to beseparated for measurement.
268 OLEJNICZAK AND GRINE
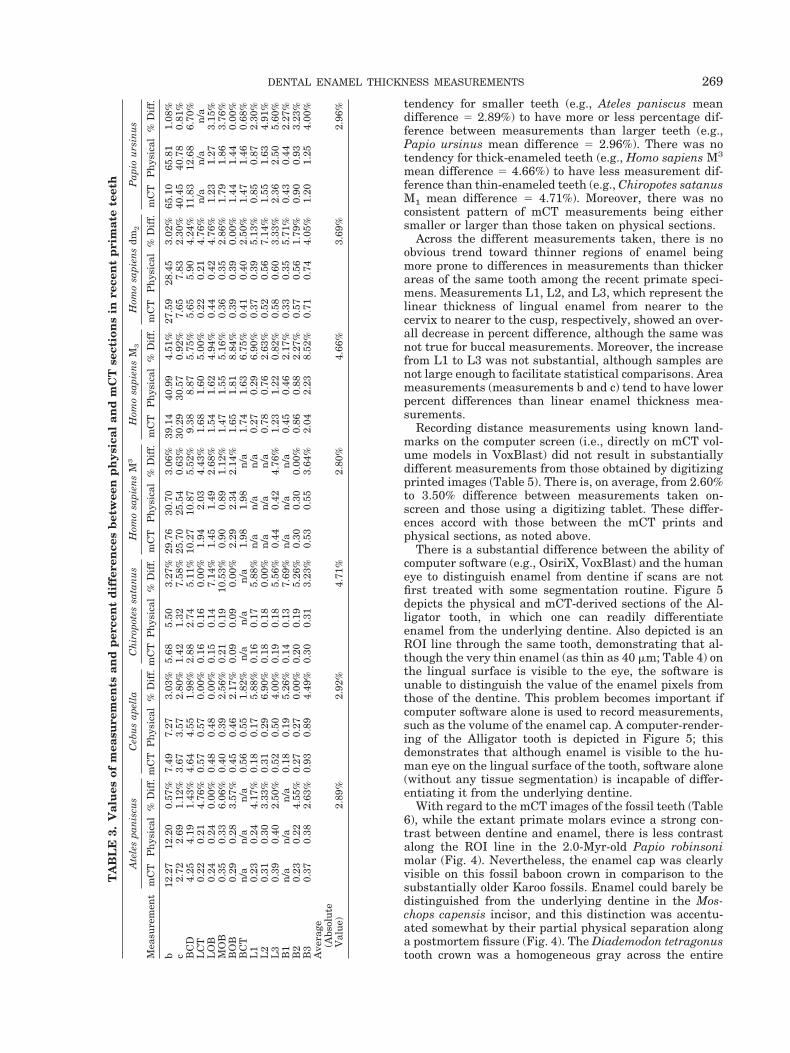
tendency for smaller teeth (e.g., Ateles paniscus meandifference � 2.89%) to have more or less percentage dif-ference between measurements than larger teeth (e.g.,Papio ursinus mean difference � 2.96%). There was notendency for thick-enameled teeth (e.g., Homo sapiens M3
mean difference � 4.66%) to have less measurement dif-ference than thin-enameled teeth (e.g., Chiropotes satanusM1 mean difference � 4.71%). Moreover, there was noconsistent pattern of mCT measurements being eithersmaller or larger than those taken on physical sections.
Across the different measurements taken, there is noobvious trend toward thinner regions of enamel beingmore prone to differences in measurements than thickerareas of the same tooth among the recent primate speci-mens. Measurements L1, L2, and L3, which represent thelinear thickness of lingual enamel from nearer to thecervix to nearer to the cusp, respectively, showed an over-all decrease in percent difference, although the same wasnot true for buccal measurements. Moreover, the increasefrom L1 to L3 was not substantial, although samples arenot large enough to facilitate statistical comparisons. Areameasurements (measurements b and c) tend to have lowerpercent differences than linear enamel thickness mea-surements.
Recording distance measurements using known land-marks on the computer screen (i.e., directly on mCT vol-ume models in VoxBlast) did not result in substantiallydifferent measurements from those obtained by digitizingprinted images (Table 5). There is, on average, from 2.60%to 3.50% difference between measurements taken on-screen and those using a digitizing tablet. These differ-ences accord with those between the mCT prints andphysical sections, as noted above.
There is a substantial difference between the ability ofcomputer software (e.g., OsiriX, VoxBlast) and the humaneye to distinguish enamel from dentine if scans are notfirst treated with some segmentation routine. Figure 5depicts the physical and mCT-derived sections of the Al-ligator tooth, in which one can readily differentiateenamel from the underlying dentine. Also depicted is anROI line through the same tooth, demonstrating that al-though the very thin enamel (as thin as 40 �m; Table 4) onthe lingual surface is visible to the eye, the software isunable to distinguish the value of the enamel pixels fromthose of the dentine. This problem becomes important ifcomputer software alone is used to record measurements,such as the volume of the enamel cap. A computer-render-ing of the Alligator tooth is depicted in Figure 5; thisdemonstrates that although enamel is visible to the hu-man eye on the lingual surface of the tooth, software alone(without any tissue segmentation) is incapable of differ-entiating it from the underlying dentine.
With regard to the mCT images of the fossil teeth (Table6), while the extant primate molars evince a strong con-trast between dentine and enamel, there is less contrastalong the ROI line in the 2.0-Myr-old Papio robinsonimolar (Fig. 4). Nevertheless, the enamel cap was clearlyvisible on this fossil baboon crown in comparison to thesubstantially older Karoo fossils. Enamel could barely bedistinguished from the underlying dentine in the Mos-chops capensis incisor, and this distinction was accentu-ated somewhat by their partial physical separation alonga postmortem fissure (Fig. 4). The Diademodon tetragonustooth crown was a homogeneous gray across the entire
TA
BL
E3.
Val
ues
ofm
easu
rem
ents
and
per
cen
td
iffe
ren
ces
bet
wee
np
hys
ical
and
mC
Tse
ctio
ns
inre
cen
tp
rim
ate
teet
h
Mea
sure
men
t
Ate
les
pan
iscu
sC
ebu
sap
ella
Ch
irop
otes
sata
nu
sH
omo
sapi
ens
M3
Hom
osa
pien
sM
3H
omo
sapi
ens
dm2
Pap
iou
rsin
us
mC
TP
hys
ical
%D
iff.
mC
TP
hys
ical
%D
iff.
mC
TP
hys
ical
%D
iff.
mC
TP
hys
ical
%D
iff.
mC
TP
hys
ical
%D
iff.
mC
TP
hys
ical
%D
iff.
mC
TP
hys
ical
%D
iff.
b12
.27
12.2
00.
57%
7.49
7.27
3.03
%5.
685.
503.
27%
29.7
630
.70
3.06
%39
.14
40.9
94.
51%
27.5
928
.45
3.02
%65
.10
65.8
11.
08%
c2.
722.
691.
12%
3.67
3.57
2.80
%1.
421.
327.
58%
25.7
025
.54
0.63
%30
.29
30.5
70.
92%
7.65
7.83
2.30
%40
.45
40.7
80.
81%
BC
D4.
254.
191.
43%
4.64
4.55
1.98
%2.
882.
745.
11%
10.2
710
.87
5.52
%9.
388.
875.
75%
5.65
5.90
4.24
%11
.83
12.6
86.
70%
LC
T0.
220.
214.
76%
0.57
0.57
0.00
%0.
160.
160.
00%
1.94
2.03
4.43
%1.
681.
605.
00%
0.22
0.21
4.76
%n
/an
/an
/aL
OB
0.24
0.24
0.00
%0.
480.
480.
00%
0.15
0.14
7.14
%1.
451.
492.
68%
1.54
1.62
4.94
%0.
440.
424.
76%
1.23
1.27
3.15
%M
OB
0.35
0.33
6.06
%0.
400.
392.
56%
0.21
0.19
10.5
3%0.
900.
891.
12%
1.47
1.55
5.16
%0.
360.
352.
86%
1.79
1.86
3.76
%B
OB
0.29
0.28
3.57
%0.
450.
462.
17%
0.09
0.09
0.00
%2.
292.
342.
14%
1.65
1.81
8.84
%0.
390.
390.
00%
1.44
1.44
0.00
%B
CT
n/a
n/a
n/a
0.56
0.55
1.82
%n
/an
/an
/a1.
981.
98n
/a1.
741.
636.
75%
0.41
0.40
2.50
%1.
471.
460.
68%
L1
0.23
0.24
4.17
%0.
180.
175.
88%
0.16
0.17
5.88
%n
/an
/an
/a0.
270.
296.
90%
0.37
0.39
5.13
%0.
850.
872.
30%
L2
0.31
0.30
3.33
%0.
310.
296.
90%
0.18
0.18
0.00
%n
/an
/an
/a0.
780.
762.
63%
0.52
0.56
7.14
%1.
551.
634.
91%
L3
0.39
0.40
2.50
%0.
520.
504.
00%
0.19
0.18
5.56
%0.
440.
424.
76%
1.23
1.22
0.82
%0.
580.
603.
33%
2.36
2.50
5.60
%B
1n
/an
/an
/a0.
180.
195.
26%
0.14
0.13
7.69
%n
/an
/an
/a0.
450.
462.
17%
0.33
0.35
5.71
%0.
430.
442.
27%
B2
0.23
0.22
4.55
%0.
270.
270.
00%
0.20
0.19
5.26
%0.
300.
300.
00%
0.86
0.88
2.27
%0.
570.
561.
79%
0.90
0.93
3.23
%B
30.
370.
382.
63%
0.93
0.89
4.49
%0.
300.
313.
23%
0.53
0.55
3.64
%2.
042.
238.
52%
0.71
0.74
4.05
%1.
201.
254.
00%
Ave
rage
(Abs
olu
teV
alu
e)2.
89%
2.92
%4.
71%
2.80
%4.
66%
3.69
%2.
96%
269DENTAL ENAMEL THICKNESS MEASUREMENTS

scan; in this case, mCT was incapable of clearly distin-guishing enamel from dentine (Fig. 4).
The 2.0-Myr-old Papio robinsoni molar demonstratesthat enamel and dentine can be differentiated by mCT ina fossil when the enamel is of moderate thickness (0.5–1.0mm). The relative inability of mCT to differentiate be-tween enamel and dentine in the Moschops tooth, and itstotal inability to do so in the Diademodon tooth, mayreflect the comparatively greater degree of fossilization(i.e., remineralization) of the enamel (and especially den-tine) in these Karoo specimens.
However, geochronological age does not account entirelyfor differences in the ability of mCT to visualize enamel.The Diademodon tooth is approximately 22 Myr youngerthan the Moschops incisor. Nevertheless, it is possible tovisualize the enamel cap of the Moschops specimen,whereas it is totally invisible to mCT in Diademodon. It ispossible that diagenetic alteration, which may be (to somedegree) independent of geological age, may have differen-tially affected the Moschops and Diademodon teeth suchthat the remineralized dentine and enamel are of a morehomogeneous structural composition in the former. In or-der to investigate this possibility, these two teeth weresubjected to energy-dispersive X-ray microanalysis to in-vestigate the composition of the dentine and enamel. Thephysical section faces of each specimen were examined ina LEO 1550 (LEO/Zeiss) SEM equipped with an EDAXSapphire Si(Li) detector and Phoenix analyzer (EDAX) at15 kV, zero tilt, a 4.1 takeoff, and a working distance of 8.0mm. The results of these analyses are depicted in Figure6. In the Moschops incisor, the dentine and enamel haveessentially identical proportions of calcium and phospho-rous (i.e., typical calcium phosphate), and they differ onlyin the amount of silicon present. In the Diademodon tooth,
while calcium and phosphorous predominate the mineralchemistry of the dentine, the enamel is wholly lacking inphosphorous (it also exhibits some manganese). Thus, thedentine and enamel are dissimilar to one another in chem-ical composition in both specimens, although diageneticalteration has not been the same in each. The introductionof silicon into the dentine compartment of the Moschopsincisor (presumably in the form of quartz) might be ex-pected to affect the mCT X-ray beam attenuation as muchas the diagenetic loss of phosphorous from the enamelcompartment of the Diademodon crown, which suggestsan increase in porosity.
This appears to suggest that neither geological age perse nor the differential diagenetic alteration of the chemi-cal composition of the enamel and dentine adequatelyexplains the differences in the ability of mCT to visualizethe enamel caps of the two therapsid teeth. Rather, thedifference between them in the detection of enamel viamCT seems to be related principally to its absolute thick-ness. Enamel in Moschops is approximately six timesthicker than in Diademodon (� 0.30 mm in Moschops vs.� 0.05 mm in Diademodon). However, the inability ofmCT to resolve the enamel cap in Moschops as clearly asin recent and substantially younger fossil teeth may berelated to the diagenetic alterations of the dentine in theformer.
DISCUSSIONThe percent differences (mean � 3.52%) reported here
between enamel thickness measurements derived frommCT scans and physical sections of recent teeth are sig-nificantly improved over standard CT procedures (7–34%)(Grine, 1991) and especially over lateral dental radio-graphs (15–115%) (Grine et al., 2001). The percent differ-
TABLE 4. Values of measurements and percent differences betweenphysical and mCT sections in the recent sauropsid teeth
Measurement
Alligator mississipiensis Crocodylus palustris
mCT Physical % Diff. mCT Physical % Diff.
1 0.15 0.14 7.14% 0.18 0.19 5.26%2 0.05 0.05 0.00% 0.24 0.24 0.00%3 0.11 0.12 8.33% 0.20 0.21 4.76%4 0.07 0.06 16.67% 0.18 0.17 5.88%5 0.15 0.16 6.25% 0.14 0.15 6.67%6 0.11 0.11 0.00% 0.17 0.16 6.25%7 0.09 0.09 0.00% 0.13 0.13 0.00%8 0.04 0.04 0.00% 0.15 0.17 11.76%9 0.17 0.16 6.25%
10 0.13 0.12 8.33%Average (Absolute Value) 4.80% 5.52%
TABLE 5. Comparison between measurements recorded on-screen using software and thoserecorded on printed images using a digitizing tablet
Measurement
Homo sapiens RM3 Papio ursinus LM2 Cebus apella LM2
On-Screen Digitizer % Diff. On-Screen Digitizer % Diff. On-Screen Digitizer % Diff.
LCT 1.68 1.62 3.70% n/a n/a n/a 0.57 0.54 5.56%BCT 1.74 1.68 3.57% 1.47 1.39 5.76% 0.56 0.58 3.45%MOB 1.47 1.43 2.80% 1.79 1.73 3.47% 0.40 0.42 4.76%BCD 9.38 9.41 0.32% 11.83 11.79 0.34% 4.64 4.65 0.22%Average
(Absolute Value) 2.60% 3.19% 3.50%
270 OLEJNICZAK AND GRINE

ences obtained here are comparable to those recorded instudies comparing mCT scans and physical sections oftrabecular bone (Muller et al., 1996a,b, 1998). This indi-cates that mCT is a valuable technique for the nondestruc-tive assessment of enamel thickness in extant primateteeth. Figure 1 demonstrates the similarity between mCTand physical sections measured in this study, where onlyslight differences in the shapes of these sections are ap-parent.
The percent difference for the measurements reportedhere apparently does not relate to the thickness of the
enamel or the size of a given specimen (Tables 3 and 4).We suggest that the differences are due to human error inthe process of measuring the photographs and printedimages of the sections, rather than any inherent differ-ences in the comparability of the two sections measuredfor each tooth or to any other factor having to do withspecimen size or thickness.
Although distances measured on the computer screenby way of drawing lines did not differ substantially fromthose taken by hand using a digitizing tablet (Table 5), themCT technology used here does appear to be limited in its
Fig. 5. Different visualizations of an Alligator tooth. Scale bar at left is5 mm and applies to images a–c (image d is not to scale). a: Physicalsection with enlargement (box) showing the lingual enamel. b: mCT-derived section through the same plane with enlargement (box) showingthat the lingual enamel can be differentiated from the underlying dentineby the human eye. c: An ROI line demonstrating that while the thickerenamel on the labial side of the tooth can be differentiated by segmen-
tation software as a peak in the intensity of the pixel values at the rightside of the line, the thin enamel on the lingual surface of the tooth cannotbe differentiated (note the absence of any intensity peak at left). d: A 3Dcomputer volume rendering of the tooth, demonstrating that the enamelon the lingual surface is not distinguished from the underlying dentine bysegmentation software.
271DENTAL ENAMEL THICKNESS MEASUREMENTS

ability to distinguish enamel from dentine when theenamel is very thin and/or when these two dental tissueshave undergone diagenetic alteration. Thus, the extantsauropsid teeth and the Ateles and Chiropotes molars ex-amined here demonstrate that mCT is capable of differ-entiating between enamel and dentine in recent speci-mens with thin enamel (as thin as 0.04 mm in theAlligator tooth). However, as is evident from the ROI lineacross the Alligator tooth (Fig. 5), whereas the pixel val-ues clearly differentiate the thicker enamel, the extremelythin lingual enamel (ca. 0.04 mm) is not clearly distin-guished from the adjacent dentine. Thus, it would appearthat absolutely thin enamel (less than � 0.10 mm) isdifficult to resolve adequately with mCT based on pixelvalues alone. Nevertheless, while it is not distinguishedfrom dentine based on pixel values, the thin lingualenamel of the Alligator tooth is visible to the human eye inthe mCT scans (e.g., Fig. 5). Since the comparably thinenamel of the Diademodon is not visible in terms of pixelvalues or to the human eye, this problem appears to beexacerbated by diagenetic processes involved in fossiliza-tion. It is possible that other mCT systems, such as indus-trial mCT (e.g., Bush et al., 2004) and synchrotron mCT(Tafforeau, 2004; Tafforeau et al., 2006), may be bettersuited to imaging thinly enameled fossils.
The poor visualization of enamel by mCT in the ca.250-Myr-old therapsids compared to the ca. 2.0-Myr-oldpapionin, and the somewhat lower contrast in pixels alongthe ROI in this specimen compared to recent teeth, sug-gest that diagenetic alteration, which may differ substan-tially with geochronological age, may have an impact onvisualization based on mCT scanning. On the other hand,the differences in detection by mCT of the enamel caps ofthe two therapsid specimens suggest that the absolutethickness of enamel (0.30 mm in Moschops vs. 0.05 mm inDiademodon) is a more problematic issue. Finally, theability of segmentation software to distinguish enameland dentine differs in some cases from the ability of thehuman eye to detect the same two tissues. The thinenamel of the Alligator tooth (e.g., Fig. 5) demonstratesthat while the human eye may detect and measure thinenamel on mCT scans, computer-automated tissue seg-mentation (based on pixel shade values) may fail to do so.
Fig. 6. Energy-dispersive X-ray microanalysis of enamel and dentine inthe fossil therapsid teeth. Note that the composition of the enamel anddentine in Moschops are virtually identical except in the higher concentra-tion of phosphorus in the former and the presence of silica in the latter. InDiademodon, the enamel and dentine differ in the presence of manganesein the former and the almost total absence of phosphorus in the latter.
TABLE 6. Values of measurements and percent differences betweenphysical and mCT sections in fossil teeth
Measurement
Moschops capensis Papio robinsoni
mCT Physical % Diff. mCT Physical % Diff.
1.00 0.32 0.33 3.03%2.00 0.33 0.34 2.94%3.00 0.26 0.27 3.70%4.00 0.27 0.28 3.57%5.00 0.32 0.33 3.03%6.00 0.33 0.36 8.33%7.00 0.32 0.33 3.03%BCD 10.13 10.01 1.20%L1 0.63 0.61 3.28%L2 0.59 0.63 6.35%L3 0.63 0.60 5.00%B1 0.42 0.40 5.00%B2 0.82 0.84 2.38%B3 0.92 0.91 1.10%Average (Absolute Value) 3.95% 3.47%
272 OLEJNICZAK AND GRINE

Thus, the measurement of enamel thickness based onmCT scans by means of computer software alone mayexacerbate the two problems of thin enamel and reminer-alization via diagenesis.
ACKNOWLEDGMENTSThe authors are grateful to R. Monk and J. Spence
(Department of Mammalogy, American Museum of Natu-ral History) for permission to mCT and section a molar ofCebus apella. Specimens were graciously loaned by R.Smith (South African Museum, Cape Town), J. Botha(National Museum, Bloemfontein), and P. Holroyd (Uni-versity of California Museum of Paleontology, Berkeley).Information pertaining to these specimens was providedby E. Delson, B. Rubidge, and M. Raath. S. Judex and S.Xu provided access to and assistance with mCT facilities.J. Sipla, A. Kaufman, T. Smith, and S. Frank providedadvice and assistance. We thank T. Radsbury for the dis-cussion and we are grateful to L. Betti-Nash for the mas-terful execution of the illustrations. This manuscript ben-efited greatly from the comments and suggestions of J.Laitman and two anonymous reviewers.
LITERATURE CITEDAlvesalo L, Tammisalo E. 1981. Enamel thickness in 45 X females
permanent teeth. Am J Hum Genet 33:464–469.Alvesalo L. 1985. Dental growth in 47 XYY males and in conditions
with other sex-chromosome anomolies. In: Sandberg AA, editor. TheY chromosome. New York: Alan R. Liss. p 277–300.
Alvesalo L, Tammisalo E, Hakola P. 1985. Enamel thickness in 47XYY males’ permanent teeth. Ann Hum Biol 12:421–427.
Alvesalo L, Tammisalo E, Therman E. 1987. 47 XYY females, sexchromosomes, and tooth crown structures. Hum Genet 7:345–348.
Avishai G, Muller R, Gabet Y, Bab I, Zilberman U, Smith P. 2004.New approach to quantifying developmental variation in the den-tition using serial microtomographic imaging. Microsc Res Tech65:263–269.
Balto K, Muller R, Carrington DC, Dobeck J, Stashenko P. 2000.Quantification of periapical bone destruction in mice by micro-computed tomography. J Dent Res 79:35–40.
Baum G, Greenwood I, Smirnow R. 1963. Observation of internalstructures of tooth by ultrasonography. Science 139:495–496.
Beynon AD, Wood BA. 1986. Variations in enamel thickness andstructure in East African hominids. Am J Phys Anthropol 70:177–193.
Beynon AD, Dean MC, Reid DJ. 1991. On thick and thin enamel inhominoids. Am J Phys Anthropol 86:295–309.
Bonse U, Busch F, Gunnewig O, Beckmann F, Pahl R, Delling G,Hahn M, Graeff W. 1994. 3D computed X-ray tomography of humancancellous bone at 8 �m spatial and 10�4 energy resolution. BoneMiner 25:25–38.
Brunet M, Guy F, Pilbeam D, Mackaye HT, Likius A, Ahounta D,Beauvilain A, Blondel C, Bocherens H, Boisserie JR, De Bonis L,Coppens Y, Dejax J, Denys C, Duringer P, Eisenmann VR, FanoneG, Fronty P, Geraads D, Lehmann T, Lihoreau F, Louchart A,Mahamat A, Merceron G, Mouchelin G, Otero O, Campomanes PP,De Leon MP, Rage JC, Sapanet M, Schuster M, Sudre J, Tassy P,Valentin X, Vignaud P, Viriot L, Zazzo A, Zollikofer C. 2002. A newhominid from the Upper Miocene of Chad, Central Africa. Nature418:145–151.
Bush EC, Simons EL, Allman JM. 2004. High-resolution computedtomography study of the cranium of a fossil anthropoid primate,Parapithecus grangeri: new insights into the evolutionary history ofprimate sensory systems. Anat Rec A 281A:1083–1087.
Chaimanee Y, Jolly D, Benammi M, Tafforeau P, Duzer D, Moussa I,Jaeger JJ. 2003. A Middle Miocene hominoid from Thailand andorangutan origins. Nature 422:61–65.
Conroy GC. 1991. Enamel thickness in South African australopithecines:noninvasive evaluation by computed tomography. Paleont Afr 28:53–59.
Conroy GC, Vanier MW. 1991. Noninvasive evaluation of enamelthickness and volume in South African australopithecines by com-puted tomography. Am J Phys Anthropol 12(Suppl):60.
Conroy GC, Lichtman JW, Martin LB. 1995. Some observations onenamel thickness and enamel prism packing in the Miocene homi-noid Otavipithecus namibiensis. Am J Phys Anthropol 98:595–600.
Cooper DML, Matyas JR, Katzenberg MA, Hallgrimsson B. 2004.Comparison of microcomputed tomographic and microradiographicmeasurements of cortical bone porosity. Calcif Tiss Int 74:437–447.
Dauphin Y. 1987. Some results on the dental enamel structure infossil and recent reptiles. CR Acad Sci II 305:1217–1219.
De Kock MO, Beukes NJ, Hancox PJ, Kirshvink JL, Rubidge BS,Ward PD. 2003. Permian-Triassic megnetostratigraphy in the Ka-roo Basin of South Africa. Geochem Cosmochim Acta 67:A77–A78.
Delson E. 1984. Cercopithecid biochronology of the African Plio-Pleistocene: correlation among eastern and southern hominid-bear-ing localities. Cour Forsch Inst Senckenberg 69:199–218.
Delson E. 1988. Chronology of South African australopith site units.In: Grine FE, editor. Evolutionary history of the “robust” Australo-pithecines. New York: Aldine de Gruyter. p 317–324.
Dumont ER. 1995. Enamel thickness and dietary adaptation amongextant primates and chiropterans. J Mammal 76:1127–1136.
Durand EP, Ruegsegger P. 1991. Cancellous bone structure: analysisof high-resolution CT images with run-length method. J CompAssist Tomogr 15:133–139.
Faerman M, Kharitonov VM, Batsevich V, Zilberman U, Smith P.1994. A Neanderthal infant from the Barakai Cave, western Cau-casus. J Hum Evol 27:405–415.
Fajardo RJ, Muller R. 2001. Three-dimensional analysis of non-hu-man primate trabecular architecture using micro-computed tomog-raphy. Am J Phys Anthropol 115:327–336.
Fajardo RJ, Ryan TM, Kappelman J. 2002. Assessing the accuracy ofhigh-resolution X-ray computed tomography of primate trabecularbone by comparison with histological sections. Am J Phys Anthropol118:1–10.
Gantt DG. 1983. The enamel of Neogene hominoids: structual andphyletic implications. In: Ciochon RL, Corruccini RS, editors. Newinterpretations of ape and human ancestry. New York: PlenumPress. p 249–298.
Gantt DG, Kappleman J, Ketcham RA, Alder ME, Deahl TH. 2003. 3Dapproach to interpret enamel thickness and volume. Am J PhysAnthropol 36(Suppl):99.
Grine FE, Vrba ES, Cruickshank ARI. 1979. Enamel prisms anddiphydonty: linked apomorphies of Mammalia. S Afr J Sci 75:114–120.
Grine FE, Martin L. 1988. Enamel thickness and development inAustralopithecus and Paranthropus. In: Grine FE, editor. Evolu-tionary history of the “robust” Australopithecines. New York: Al-dine de Gruyter. p 3–42.
Grine FE. 1991. Computed tomography and the measurement ofenamel thickness in extant hominoids: implications for its paleon-tological application. Palaeont Afr 28:61–69.
Grine FE, Stevens NJ, Jungers WL. 2001. An evaluation of dentalradiograph accuracy in the measurement of enamel thickness.Archs Oral Biol 46:1117–1125.
Grine FE. 2002. Scaling of tooth enamel thickness, and molar crownsize reduction in modern humans. S Afr J Sci 98:503–509.
Grine FE. 2004. Geographic variation in tooth enamel thickness doesnot support Neandertal involvement in the ancestry of modernEuropeans. S Afr J Sci 100:389–394.
Grine FE. 2005. Enamel thickness of deciduous and permanent mo-lars in modern Homo sapiens. Am J Phys Anthropol 126:14–31.
Grine FE, Spencer MA, Demes AB, Smith HF, Strait DS, ConstantDA. 2005. Molar enamel thickness in the Chacma baboon, Papioursinus. Am J Phys Anthropol 128:812–822.
Gron P. 1960. A geometrical evaluation of image size in dental radi-ography. J Dent Res 39:289–301.
Haile-Selassie Y. 2001. Late Miocene hominids from the MiddleAwash, Ethiopia. Nature 412:178–181.
273DENTAL ENAMEL THICKNESS MEASUREMENTS

Haile-Selassie Y, Suwa G, White TD. 2004. Late Miocene teeth fromMiddle Awash, Ethiopia, and early hominid dental evolution. Sci-ence 303:1503–1505.
Hancox PJ, Rubidge BS. 2001. Breakthroughs in the biodiversity,biogeography, biostratigraphy, and basin analysis of the Beaufortgroup. J Afr Earth Sci 33:563–577.
Harris EF, Hicks JD. 1998. Enamel thickness in maxillary humanincisors: a radiographic assessment. Archs Oral Biol 43:825–831.
Harris EF, Hicks JD, Barcroft BD. 1999. Absence of sexual dimor-phism in enamel thickness of human deciduous molars. In: MayhallJT, Heikkinen T, editors. Dental morphology. Oulu, Finland: OuluUniversity Press. p 338–349.
Hildebrand T, Laib A, Muller R, Dequekker J, Ruegsegger P. 1999.Direct three-dimensional morphometric analysis of human cancel-lous bone: microstructural data from spine, femur, iliac crest, andcalcaneus. J Bone Miner Res 14:1167–1174.
Kappelman J. 1998. Advances in three-dimensional data acquisitionand analysis. In: Rosenberger AL, Fleagle JG, McHenry HM,Strasser E, editors. Primate locomotion. New York: Plenum. p 205–222.
Kay RF. 1981. The nut-crackers: a new theory of the adaptations ofthe Ramapithecinae. Am J Phys Anthropol 55:141–151.
Khera SC, Carpenter CW, Vetter JD, Staley RN. 1990. Anatomy ofcusps of posterior teeth and their fracture potential. J ProsthetDent 64:139–147.
Kinney JH, Ryaby JT, Haupt DL, Lane NE. 1998. Three-dimensionalin vivo morphometry of trabecular bone in the OVX rat model ofosteoporosis. Technol Health Care 6:339–350.
Kono RT, Suwa G, Tanijiri T. 2002. A three-dimensional analysis ofenamel distribution patterns in human permanent first molars.Archs Oral Biol 47:867–875.
Kono R. 2004. Molar enamel thickness and distribution patterns inextant great apes and humans: new insights based on a 3-dimen-sional whole crown perspective. Anthropol Sci 112:121–146.
Kono-Takeuchi R, Suwa G, Kanazawa E, Tanijiri T. 1997. A newmethod of evaluating enamel thickness based on a three-dimen-sional measuring system. Anthropol Sci 105:217–229.
Kuhn JL, Goldstein SA, Feldkamp LA, Goulet RW, Jesion G. 1990.Evaluation of a microcomputed tomography system to study trabec-ular bone structure. J Orthoped Res 8:833–842.
Lees S. 1968. Specific acoustic impedence of enamel and dentine.Archs Oral Biol 13:1491–1500.
Lees S, Barber FE. 1968. Looking into teeth with ultrasound. Science161:477.
Lees S. 1971. Ultrasonics in hard dental tissues. Int Dent J 21:403–417.
Lucas SG. 1995. Towards dicynodont biochronology. Albertina 16:33–40.
Macho GA, Thackeray JF. 1992. Computed-tomography and enamelthickness of maxillary molars of Plio-Pleistocene hominids fromSterkfontein, Swartkrans, and Kromdraai (South-Africa): an ex-ploratory study. Am J Phys Anthropol 89:133–143.
Macho GA, Berner ME. 1993. Enamel thickness of human maxillarymolars reconsidered. Am J Phys Anthropol 92:189–200.
Macho GA, Spears IR. 1999. Effects of loading on the biochemicalbehavior of molars of Homo, Pan, and Pongo. Am J Phys Anthropol109:211–227.
MacLatchy L, Muller R. 2002. A comparison of the femoral head andneck trabecular architecture of Galago and Perodicticus using mi-cro-computed tomography (�CT). J Hum Evol 43:89–105.
Maev RG, Maximovskye YM, Denisova LA, Maeva EY, Denissov AA,Chrkova TD, Domyshev DA. 2000. Acoustic microscopy: a newmethod for investigation of dental tissues. Stomatology 79:14–19.
Maev RG, Denisova LA, Maeva EY, Denissov AA. 2002. New data onhistology and physico-mechanical properties of human tooth tissueobtained with acoustic microscopy. Ultrasound Med Biol 28:131–136.
Martin LB. 1985. Significance of enamel thickness in hominoid evo-lution. Nature 314:260–263.
Martin LB, Olejniczak AJ, Maas MC. 2003. Enamel thickness andmicrostructure in pitheciin primates, with comments on dietary
adaptations of the middle Miocene hominoid Kenyapithecus. J HumEvol 45:351–367.
McErlain DD, Chhem RK, Bohay RN, Holdsworth DW. 2004. Micro-computed tomography of a 500-year-old tooth: technical note. JAssoc Canad Radiol 55:242–245.
Mezava S, Kawato T, Yoshida K, Nozaki H, Saito T, Tomura K,Onozava M. 1999. Evaluation of human tooth structure with theultrasonic imaging technique. J Oral Sci 41:191–197.
Miller GS. 1918. The Piltdown jaw. Am J Phys Anthropol 1:25–52.Molnar S, Gantt DG. 1977. Functional implications of primate enamel
thickness. Am J Phys Anthropol 46:447–454.Molnar S, Hildebolt C, Molnar IM, Radovcic J, Gravier M. 1993.
Hominid enamel thickness: I, the Krapina Neandertals. Am J PhysAnthropol 92:131–138.
Muller R. 2002. The Zurich experience: one decade of three-dimen-sional high-resolution computed tomography. Topics Magnet Reso-nance Imag 13:307–322.
Muller R. 2003. Bone microarcitecture assessment: current and futuretrends. Osteoporos Int 14:89–99.
Muller R, Koller B, Hildebrand T, Laib A, Gionollini S, Ruegsegger P.1996a. Resolution dependency of microstructural properties of can-cellous bone based on three-dimensional �-tomography. TechnolHealth Care 4:113–119.
Muller R, Hahn M, Vogel M, Delling G, Ruegsegger P. 1996b. Mor-phometric analysis of noninvasively assessed bone biopsies: com-parison of high-resolution computed tomography and histologic sec-tions. Bone 18:215–220.
Muller R, Ruegsegger P. 1997. Micro-tomographic imaging for thenondestructive evaluation of trabecular bone architecture. In:Meunier A, editor. Bone research in biomechanics. Amsterdam: IOSPress. p 61–79.
Muller R, van Campenhout H, Van Damme B, Van der Perre G,Dequeker J, Hildebrand T, Ruegsegger P. 1998. Morphometricanalysis of human bone biopsies: a quantitative structural compar-ison of histological sections and micro-computed tomography. Bone23:59–66.
Nagatoshi K. 1990. Molar enamel thickness in European Miocene andextant Hominoidea. Int J Primatol 11:283–295.
Olejniczak AJ, Grine FE. 2005. High resolution measurement of Ne-andertal tooth enamel thickness by micro-focal computed tomogra-phy. S Afr J Sci 101:219–220.
Peck SD, Rowe JM, Briggs GAD. 1989. Studies on sound and cariousenamel with the quantitative acoustic microscope. J Dent Res 68:107–112.
Peters OA, Laib A, Ruegsegger P, Barbakow F. 2000. Three-dimen-sional analysis of root canal geometry by high-resolution computedtomography. J Dent Res 79:1405–1409.
Rhodes JS, Pitt-Ford TR, Lynch JA, Liepins PJ, Curtis RV. 1999.Micro-computed tomography: a new tool for experimental endodon-tology. Int Endodont J 32:165–170.
Rosset A, Spadola L, Ratib O. 2004. OsiriX: an open-source softwarefor navigating in multidimensional DICOM images. J Digital Imag17:205–216.
Rubidge BS. 2006. Re-uniting lost continents: fossil reptiles from theancient Karoo and their wanderlust. S Afr J Geol (in press).
Ruegsegger P, Koller B, Muller R. 1996. A microtomographic systemfor the non-destructive evaluation of bone architecture. Calcif Tis-sue Int 58:24–29.
Sato I, Shimada K, Handal JC, Lance V, Gasser RF. 1988. Morphologyof the American alligator (Alligator mississipiensis) tooth: I, thefine-structure and analysis of the enamel. Am Zool 28:A78.
Schillingburg HT, Grace CS. 1973. Thickness of enamel and dentine.J S Calif Dent Assoc 41:33–52.
Schwartz GT, Thackeray JF, Reid C, van Reenan JF. 1998. Enamelthickness and the topography of the enamel-dentine junction inSouth African Plio-Pleistocene hominids with special reference tothe Carabelli trait. J Hum Evol 35:523–542.
Schwartz GT. 2000a. Enamel thickness and the helicoidal wear planein modern human mandibular molars. Archs Oral Biol 45:401–409.
Schwartz GT. 2000b. Taxonomic and functional aspects of the pat-terning of enamel thickness distribution in extant large-bodiedhominoids. Am J Phys Anthropol 111:221–244.
274 OLEJNICZAK AND GRINE

Senut B, Pickford M, Gommery D, Mein P, Cheboi K, Coppens Y.2001. First hominid from the Miocene (Lukeino Formation, Kenya).CR Acad Sci Ser II A 332:137–144.
Shellis RP, Beynon AD, Reid DJ, Hiiemae KM. 1998. Variations inmolar enamel thickness among primates. J Hum Evol 35:507–522.
Simons EL, Pilbeam D. 1972. Hominiod paleoprimatology. In: TuttleR, editor. The functional and evolutionary biology of primates.Chicago: Aldine. p 36–62.
Smith P, Zilberman U. 1994. Thin enamel and other tooth componentsin Neanderthals and other hominids. Am J Phys Anthropol 95:85–87.
Smith RMH, Keyser AW. 1995. Biostratigraphy of the Tapinocepha-lus assemblage zone. In: Rubidge BS, editor. SACS biostratigraphicseries no 1. Pretoria: Council for Geoscience. p 8–17.
Spears IR, Macho GA. 1998. Biomechanical behaviour of modernhuman molars: implications for interpreting the fossil record. Am JPhys Anthropol 106:467–482.
Sperber GH. 1985. Comparative primate dental enamel thickness. In:Tobias PV, editor. Hominid evolution: past, present, and future.New York: Alan R. Liss. p 443–454.
Sperber GH. 1986. Palaeodontology: radiographic revelations of theAustralopithecinae. In: Singer R, Lundy JK, editors. Variation,culture, and evolution in African populations. Johannesburg, SouthAfrica: Witwatersrand University Press. p 195–207.
Spoor CF, Zonneveld FW, Macho GA. 1993. Linear measurements ofcortical bone and dental enamel by computed-tomography: applica-tions and problems. Am J Phys Anthropol 91:469–484.
Strait DS, Grine FE, Moniz MA. 1997. A reappraisal of early hominidphylogeny. J Hum Evol 32:17–82.
Strait DS, Grine FE. 2001. The systematics of Australopithecus garhi.Ludus Vitalis 9:109–135.
Strait DS, Grine FE. 2004. Inferring hominoid and early hominidphylogeny using craniodental characters: the role of fossil taxa. JHum Evol 47:399–452.
Stroud JL, Buschang PH, Goaz PW. 1994. Sexual dimorphism inmesiodistal dentine and enamel thickness. Dent-Max-Fac Radiol23:169–171.
Stroud JL, English J, Buschang PH. 1998. Enamel thickness of theposterior dentition: its implications for nonextraction treatment.Angle Orthod 68:141–146.
Tafforeau, P. 2004. Aspects phylogenetiques et fonctionnels de lamicrostructure de l’email dentaire et de la structure tridimension-nelle des molaires chez les primates fossils et actuels: apports de la
microtomographie e rayonnement X synchrotron. PhD thesis.Montpellier: Universite de Montpellier II.
Tafforeau P, Boistel R, Boller E, Bravin A, Brunet M, Chaimanee Y,Cloetens P, Feist M, Hoszowska J, Jaeger J-J, Kay RF, Lazzari V,Marivaux L, Nel A, Nemoz C, Thibault X, Vignaud P, Zabler S.2006. Applications of X-Ray synchotron microtomography for non-destructive studies of paleontological specimens. Appl Phys A (inpress).
von Stechow D, Balto K, Stashenko P, Muller R. 2003. Three-dimen-sional quantitation of periradicular bone destruction by micro-com-puted tomography. J Endodont 29:252–256.
White TD, Suwa G, Asfaw B. 1994. Australopithecus ramidus, a newspecies of early hominid from Aramis, Ethiopia. Nature 371:306–312.
Witmer LM, Chatterjee S, Franzosa J, Rowe T. 2003. Neuroanatomyof flying reptiles and implications for flight, posture, and behavior.Nature 425:950–953.
Wolpoff MH, Senut B, Pickford M, Hawks J. 2002. Sahelanthropus or“Sahelpithecus”? Nature 419:581–582.
Yang Z. 1991. Ultrasound surface imaging and the measurement oftooth enamel thickness. PhD dissertation. Manchester: Universityof Manchester.
Yang Z. 1996. Tooth enamel surface imaging measurement by ultra-sound imaging method. J Acoust Soc Am 100:2710.
Zilberman U, Smith P, Sperber GH. 1990. Components of australo-pithecine teeth, a radiographic study. J Hum Evol 5:515–529.
Zilberman U, Smith P. 1992a. A comparison of tooth structure inNeanderthals and early Homo sapiens sapiens: a radiographicstudy. J Anat 180:387–393.
Zilberman U, Smith P. 1992b. Evolutionary trends in hominid toothcomponents: a radiographic study. In: Smith P, Tchernov E, editors.Structure, function, and evolution of teeth. London: Freund. p 349–359.
Zilberman U, Skinner M, Smith P. 1992. Tooth components of man-dibular deciduous molars of Homo sapiens sapiens and Homo sapi-ens neanderthalensis: a radiographic study. Am J Phys Anthropol87:255–262.
Zilberman U, Smith P. 1994. Sex discrimination using tooth compo-nents measured from bite-wing radiographs. Am J Phys AnthropolS18:214.
Zonneveld FW, Wind J. 1985. High resolution computed tomographyof fossil hominid skulls: a new method and some results. In: TobiasPV, editor. Hominid evolution: past, present, and future. New York:Alan R. Liss. p 427–436.
275DENTAL ENAMEL THICKNESS MEASUREMENTS