Comparing land-use planning approaches in the coastal Mekong Delta of Vietnam
16
14 Comparing Land-use Planning Approaches in the Coastal Mekong Delta of Vietnam N.H. Trung, 1 L.Q. Tri, 2 M.E.F. van Mensvoort 3 and A.K. Bregt 4 1 College of Technology, Can Tho University, Can Tho City, Vietnam, e-mail: [email protected] 2 College of Agriculture, Can Tho University, Can Tho City, Vietnam 3 Laboratory of Soil Science and Geology, Wageningen University, Wageningen, The Netherlands 4 Center for Geo-Information, Wageningen University, Wageningen, The Netherlands. © CAB International 2006. Environment and Livelihoods in Tropical Coastal Zones (eds C.T. Hoanh, T.P. Tuong, J.W. Gowing and B. Hardy) 177 Abstract This chapter presents the application and comparison of three land-use planning (LUP) approaches in the coastal area of the Mekong Delta (MD), Vietnam. The land use of the studied area is diverse, quickly shifting and strongly contrasting. The contrast is not only in terms of resources but also in economic prof- itability and environmental sustainability. We wanted to use LUPapproaches representing various levels of complexity and computation intensity, from empirical and qualitative to mechanistic and quantitative. From the variety of methods available, we selected a participatory LUP (PLUP) methodology, the guide- lines for LUP by FAO enhanced with multi-criteria evaluation (FAO-MCE) and the land-use planning and analysis system (LUPAS) using interactive, multiple-goal linear programming. We used the same planning goal, worked in the same study area and the same period and produced three land-use plans. We compared the credibility, which is the technical and scientific appropriateness of the approach, and the stakeholder acceptability, which is the perception of the stakeholders of its practical value. The LUPAS map was best appreciated by stakeholders, but it also was the most expensive method. When comparing land-use plans of 2003 with actual land use of 2004, the PLUP map, which is disagreed with most strongly by the scientists, agrees best with the actual land use by the farmers. In the dynamic and contrasting land-use systems of the coastal MD, PLUP seems the most suitable approach for short-term advice, but for longer-term planning a combination of methods will probably work best. Introduction In the period 1975–1986, Vietnam had a cen- trally planned economy decreed by 5-year plans with production targets. In the south- ern part of the country, every province oper- ated a number of large-scale state communal farms. These farms produced industrial crops such as sugarcane or pineapples but also rice or, in the coastal zone, shrimp. Private farmers had to sell predetermined quantities of rice for fixed prices to the gov- ernment. Land use was planned by local and provincial authorities, guided by the Ministry of Planning and Investment (MPI) and supported by the National Institute for
Transcript of Comparing land-use planning approaches in the coastal Mekong Delta of Vietnam
14 Comparing Land-use PlanningApproaches in the Coastal Mekong Delta of
Vietnam
N.H. Trung,1 L.Q. Tri,2 M.E.F. van Mensvoort3 and A.K. Bregt41College of Technology, Can Tho University, Can Tho City, Vietnam, e-mail:
[email protected] of Agriculture, Can Tho University, Can Tho City, Vietnam
3Laboratory of Soil Science and Geology, Wageningen University, Wageningen, TheNetherlands
4Center for Geo-Information, Wageningen University, Wageningen, The Netherlands.
© CAB International 2006. Environment and Livelihoods in TropicalCoastal Zones (eds C.T. Hoanh, T.P. Tuong, J.W. Gowing and B. Hardy) 177
Abstract
This chapter presents the application and comparison of three land-use planning (LUP) approaches inthe coastal area of the Mekong Delta (MD), Vietnam. The land use of the studied area is diverse, quicklyshifting and strongly contrasting. The contrast is not only in terms of resources but also in economic prof-itability and environmental sustainability. We wanted to use LUP approaches representing various levelsof complexity and computation intensity, from empirical and qualitative to mechanistic and quantitative.From the variety of methods available, we selected a participatory LUP (PLUP) methodology, the guide-lines for LUP by FAO enhanced with multi-criteria evaluation (FAO-MCE) and the land-use planningand analysis system (LUPAS) using interactive, multiple-goal linear programming. We used the sameplanning goal, worked in the same study area and the same period and produced three land-use plans.We compared the credibility, which is the technical and scientific appropriateness of the approach, andthe stakeholder acceptability, which is the perception of the stakeholders of its practical value. TheLUPAS map was best appreciated by stakeholders, but it also was the most expensive method. Whencomparing land-use plans of 2003 with actual land use of 2004, the PLUP map, which is disagreed withmost strongly by the scientists, agrees best with the actual land use by the farmers. In the dynamic andcontrasting land-use systems of the coastal MD, PLUP seems the most suitable approach for short-termadvice, but for longer-term planning a combination of methods will probably work best.
Introduction
In the period 1975–1986, Vietnam had a cen-trally planned economy decreed by 5-yearplans with production targets. In the south-ern part of the country, every province oper-ated a number of large-scale state communalfarms. These farms produced industrial
crops such as sugarcane or pineapples butalso rice or, in the coastal zone, shrimp.Private farmers had to sell predeterminedquantities of rice for fixed prices to the gov-ernment. Land use was planned by local andprovincial authorities, guided by theMinistry of Planning and Investment (MPI)and supported by the National Institute for
Agricultural Planning and Projection(NIAPP).
In 1986, economic liberalization wasaccomplished through the Vietnamese doimoi (renovation) policy. State farms werereformed and became cooperatives, whereland-use decisions were left to the farmers.Private farmers negotiated long-term leasecontracts for land-use rights with the localauthorities and were free to decide aboutland use themselves. These changes had con-sequences for the role of NIAPP and MPI:from top-down centralized planning agen-cies they became advisers in land-use plan-ning.
The FAO Framework for Land Evaluationwas used most widely as a methodology forland-use advice. Mekong Delta-wide studiesand studies at the district level were carriedout. Some studies were a purely biophysicalassessment of crop growth possibilities, oth-ers were enhanced with economic data onthe evaluated land-use systems. The FAOmethod was also the basis for the NIAPPland-use planning study of Vinh Loi District(NIAPP, 1999). The strongly contrastingland-use types (extensive and intensiveshrimp, mangrove forestry, double or singlerice), with often unknown or hard-to-deter-mine requirements (saltwater versus freshwa-ter, tidal movement, growth conditions ofmangrove trees), made a reliable assessmentdifficult. The approach was rather top-down,with limited interdisciplinary interaction andweak communication among stakeholders.This resulted in conflicting interests betweenstakeholders (Hoanh, 1996). Other problemsalso surfaced, such as the environmentaleffects and unreliability of shrimp cultivationand the acceptance of proposed land uses bythe local people. Therefore, to ensure a moresustainable development, it is essential tointroduce a land-use planning approach thatcan overcome these problems and better sup-port the land-users and other stakeholders inthe coastal area of the Mekong Delta (MD).
A multitude of recent land-use analysisand planning methods is available, for exam-ple, the land-use planning (LUP) guidelinesby FAO (1993), the participatory land-useplanning (PLUP) methodology (Amler et al.,1999), the conversion of land use and its
effects (CLUE) of Veldkamp and Fresco(1996), the trade-off model (Stoorvogel, 2001)and the land-use planning and analysis sys-tem (LUPAS) described by Hoanh et al.(2000), van Ittersum et al. (2004) and Roetteret al. (2005). They vary in degree of complex-ity from empirical to mechanistic, and indegree of computation from qualitative toquantitative. We believe that the methodscan be grouped into: (i) participatory qualita-tive empirical methods using farmer andexpert knowledge such as PLUP; (ii) semi-quantitative and mechanistic methods suchas the FAO guidelines; and (iii) quantitativeand computational methods such as CLUE(based on regression) or LUPAS (based onmultiple-goal programming).
It is hard to choose a ‘most suited’method for the coastal MD. Each method isdeveloped for a certain purpose or coversonly a part of the land-use planningsequence set out by FAO (1993), but all meth-ods are developed to advise on land use.Instead of choosing one single method, wedecided to select three different approaches,apply them to the same study area and try torecognize the pros and cons of eachapproach. We used approaches with a differ-ent level of complexity and computationintensity, we compared the approaches incredibility (the technical and scientific appro-priateness) and acceptability (the perceptionof the stakeholders on their practical value)and we hoped to come to an objective judge-ment for application in the coastal MD.
The Study Area
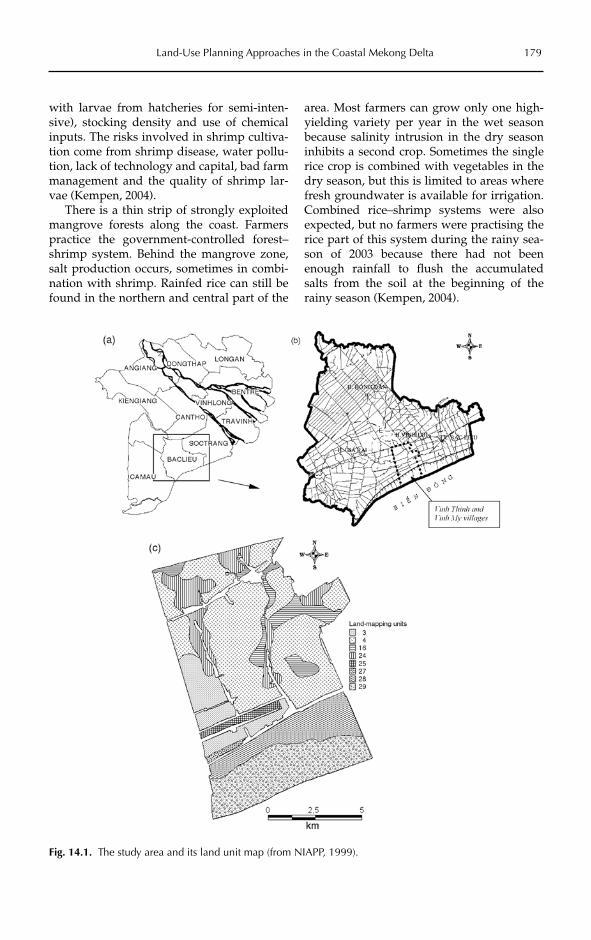
This study was carried out in an area ofapproximately 10,700 ha in two coastal vil-lages of the MD: Vinh My and Vinh Thinh(Fig. 14.1). The study area has contrastingdegrees of saltwater intrusion and land-usesystems. Most of the area is now (2005) usedfor shrimp cultivation. There are two cultiva-tion techniques in these villages: improvedextensive and semi-intensive, with a differ-ence in level of applied technology, feedingstrategy, recruitment system (natural recruit-ment for improved extensive or stocking
178 N.H. Trung et al.
with larvae from hatcheries for semi-inten-sive), stocking density and use of chemicalinputs. The risks involved in shrimp cultiva-tion come from shrimp disease, water pollu-tion, lack of technology and capital, bad farmmanagement and the quality of shrimp lar-vae (Kempen, 2004).
There is a thin strip of strongly exploitedmangrove forests along the coast. Farmerspractice the government-controlled forest–shrimp system. Behind the mangrove zone,salt production occurs, sometimes in combi-nation with shrimp. Rainfed rice can still befound in the northern and central part of the
area. Most farmers can grow only one high-yielding variety per year in the wet seasonbecause salinity intrusion in the dry seasoninhibits a second crop. Sometimes the singlerice crop is combined with vegetables in thedry season, but this is limited to areas wherefresh groundwater is available for irrigation.Combined rice–shrimp systems were alsoexpected, but no farmers were practising therice part of this system during the rainy sea-son of 2003 because there had not beenenough rainfall to flush the accumulatedsalts from the soil at the beginning of therainy season (Kempen, 2004).
Land-Use Planning Approaches in the Coastal Mekong Delta 179
Fig. 14.1. The study area and its land unit map (from NIAPP, 1999).

Four soil types are found (NIAPP, 1999).More than half of the area (5025 ha) has non-acid or weak-acid alluvial soils, which areslightly saline in the dry season. Severe acidsulphate soils (ASS), which are stronglysaline in the dry season, can be found alongthe coast (3134 ha). These soils extendapproximately 4 km land-inward. Theremaining two soil types, found furtherinland, are weakly ASS (685 ha) and severeASS (968 ha), both with moderate salinity inthe dry season. NIAPP did not clearly definethe degree of salinity (Kempen, 2004).
Methodology
The study has been carried out in four steps:(i) review and select LUP approaches for thestudy; (ii) apply the selected LUP approachesin the studied area; (iii) compare the credibil-ity and acceptability of the LUP approaches;and (iv) discuss a proper LUP approach forthe coastal areas of the MD.
We took the most widely used methodol-ogy (FAO-MCE) as a starting point. Wewanted methods of different levels of com-plexity and computation intensity, so we alsoused a participatory land-use planning(PLUP) method and the land-use planningand analysis system (LUPAS). Why these?The FAO-MCE uses a semi-quantitative andmechanistic approach. In the FAO guidelines(FAO, 1993) as applied in Vietnam (NIAPP,1999), the biophysical evaluation and socio-economic analysis are carried out in tensteps. The multi-criteria evaluation serves toinvestigate a number of choice-possibilitiesin the light of multiple criteria and conflict-ing objectives or development targets. Indoing so, it is possible to generate rankingsof alternatives according to their attractive-ness (Jansen and Rietveld, 1990).
PLUP has gained increasing recognitionas an important tool for reaching sustainableresource management by local communities(Amler et al., 1999). PLUP mobilizes localknowledge and resources for self-reliantdevelopment and thus reduces the cost togovernments for development assistance.People’s participation is also recognized asan essential element in strategies for sustain-
able agriculture since the rural environmentcan be protected only with the active collabo-ration of the local population (FAO, 1991;WB, 1996).
LUPAS is a computerized decision sup-port system for strategic planning based oninteractive multiple-goal linear program-ming (IMGLP) (De Wit et al., 1988). LUPASuses a set of tools for yield estimation, quan-tification of input–output relations and opti-mization of land use at the regional scaleunder alternative sets of multiple objectivesand constraints (van Ittersum et al., 2004;Roetter et al., 2005). LUPAS addresses thequestions ‘What would be possible?’ and‘What has to be changed?’ It can be appliedfor scenario analysis of complex problemssuch as conflicts in land use (Hoanh et al.,2000). The LUPAS methodology was devel-oped under the Systems Research Networkfor Eco-regional Land Use Planning inTropical Asia (SysNet) project (1996–2000).So, LUPAS meets our technological require-ments and has also been developed andapplied in Asia.
Application of the FAO-MCE Approach
Figure 14.2 presents what steps were per-formed in this study. There were eight landmapping units (LMU) in the study area (Fig.14.1) (NIAPP, 1999). For each LMU, eightland-use types (LUTs) were evaluated. Theresult of this biophysical land evaluation byNIAPP is shown in Table 14.1.
In the socio-economic and environmentalassessment (Fig. 14.2, step 3), secondary datafrom NIAPP (2001) and data gathered fromfarm households by a questionnaire areassessed in order to quantify socio-economicand environmental indicators of the land-usesystems (LUS). Each indicator is transformedby means of a standardization scheme into acriterion score. The following socio-eco-nomic indicators were taken into account:gross income, investment costs, variablecosts, total costs, benefit–cost ratio, labourdays, environmental impact and financialrisk. The environmental assessment wasdone qualitatively because of a lack of data.The impact of an LUT on the surrounding
180 N.H. Trung et al.

environment is estimated using six indica-tors, notably sedimentation, salinization,groundwater use, water pollution withorganic wastes and nutrients, the use of fer-tilizer and chemicals, and (irreversible) ter-rain adjustments. The terrain adjustmentsare taken into account only for semi-inten-sive shrimp, improved extensive shrimp andsalt. The terrain adjustments needed for thedevelopment of these LUTs are the mostsevere. The degree of environmental impactof each indicator is determined by the resultsof the farmer interviews, expert knowledgeand literature consultation.
The accessibility analysis (Fig. 14.2, step 4)was performed using the ‘AccessibilityAnalyst’ extension of the ArcView softwarepackage developed by the InternationalCenter for Tropical Agriculture (CIAT). It cal-culates the travel time (road or, in our case,boat) from any given geographical location tothe nearest local market where farmers cansell their products. Farmers can reach themarkets within 90 min from any location. Thisis thought to be enough to keep the productsfresh and makes accessibility no limiting fac-tor for socio-economic development.
Figure 14.2, step 5 – generation of land-usescenarios by applying MCE – requires thedecision-maker to formulate developmenttargets for which the LUTs are to be evalu-ated. This person decides what socio-eco-nomic and environmental indicators affectthe development targets and to what degree.Impact weights have to be assigned to theindicators for each development target.
A land-use scenario can be defined on thebasis of development targets with their pri-
ority weights (e.g. a 25% priority for eco-nomic development and a 75% priority forenvironmental conservation) and theweighted linear combination has to beapplied to the alternative LUTs. For eachLMU, the LUT that has the highest final eval-uation score for a given development targetcan be regarded as the most suited. The gen-eration of land-use scenarios based on socio-economic and environmental assessments isa trade-off between LUTs: the best is chosenfor a given set of priority weights. Table 14.2presents the priority weighting sets thatwere applied to the development targets. Inthis table, both the second and third scenar-ios put an accent on social security but thesecond emphasizes job creation (with a highimpact weight for the labour day indicator)while the third minimizes financial risk (highimpact weight for this indicator).
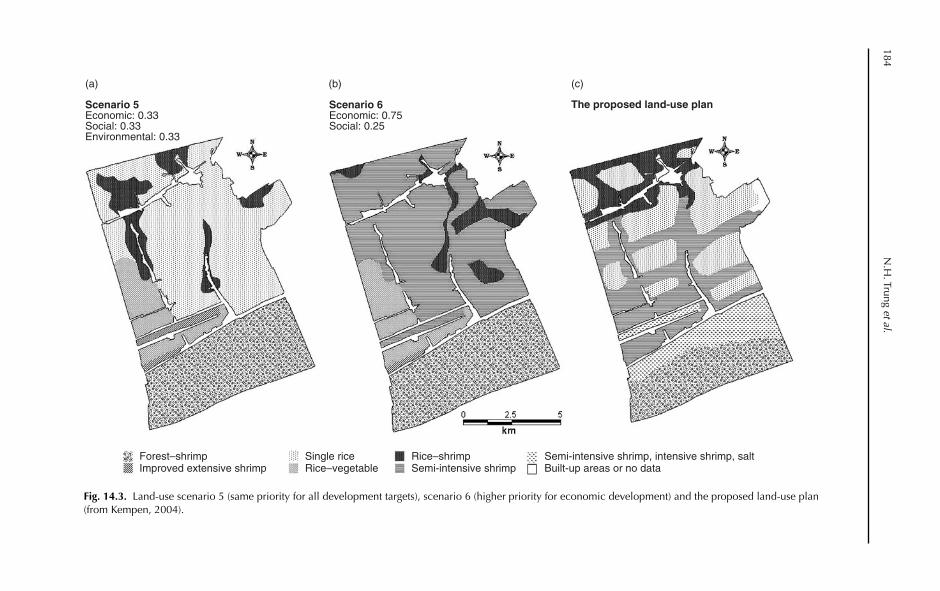
When a high priority is given to economicdevelopment, most of the LMUs are assignedto semi-intensive shrimp (Fig. 14.3, scenario6). However, the feasibility of this scenario interms of labour, capital and technology is notwell known. When social security has a highpriority, most land is assigned to rice–veg-etable or single rice. However, according tofarmers, the vegetable market is small in thestudy area. When environmental sustainabil-ity gets a high priority, most land is assignedto single rice. Because of the low income fromrice, farmers may not accept this scenario.When all targets have the same priority, sin-gle rice is the main LUT; forest–shrimp ismainly suitable near the coast, with rice–veg-etable and rice–shrimp in the highland areaand near canals (Fig. 14.3, scenario 5).
Land-Use Planning Approaches in the Coastal Mekong Delta 181
Table 14.1. Land suitability classification after biophysical land evaluation.
LMU S1 S1/S2 S2 S2/S3 S3 N
3 SR, DR, RV RS i-e S, s-I S SS, FS4 SR, DR, RV RS i-e S, s-I S SS, FS16, 24 i-e S RS, s-I S SR, DR, RV SS, FS25 RS, i-e S, s-I S SR, DR, RV, SS, FS27, 28 i-e S SS i-e S, FS SR, DR, RS29 FS SS i-e S, s-I S SR, DR, RS
S1, highly suited; S2, moderately suited; S3, marginally suited; N, unsuited; SR, single rice; DR, doublerice; RV, rice–vegetable; RS, rice–shrimp; i-e S, improved extensive shrimp; s-I S, semi-intensive shrimp;SS, salt–shrimp; FS, forest–shrimp.

The last step is evaluation and selection ofthe most suitable land-use plan. The evalua-tion must not only take place on the basis ofthe development targets but also take intoaccount the wishes and needs of theinvolved farmers and communities. The finaldecision must be a compromise between top-down and bottom-up approaches to satisfythe needs of both government and partici-pating stakeholders, communities andmunicipalities.
Figure 14.3 also presents a proposed LUPbased on land-use scenario analysis. Theproposed LUP gives priority to economicdevelopment while attempting to reduceenvironmental and financial risk. Shrimpfarms should be located close to a canal for
proper access to a saltwater source.Rice–shrimp is a safer alternative in thenorth of the study area, close to the Quan LoPhung Hiep salinity protection area. The rea-son is that polluted water from the watercontrol activities may make single-shrimpcultivation risky (Kempen, 2004).
Application of the PLUP Approach
A modified participatory rural appraisal(PRA) was used based on the toolboxdesigned by Ticheler et al. (2000) and onexperiences from an earlier study in thesame area by Feitsma et al. (2002). We tookcare to avoid their difficulties regarding com-
182 N.H. Trung et al.
1. Inventory and analysisof available data
2. Data acquisition
3. Socio-economicand environmental
assessments
4. Accessibilityanalysis
5. Generation of land-usescenarios by MCE of
alternative land-use system
6. Evaluation of LUscenarios and choosing themost suitable land-use plan
Land-use plan
Land-use scenarios
Accessibility mapCriterion scores forsocio-economic and
environmental indicators
Environmental, social andeconomic data for each
land use scenario
Present land use Data set complete and ofgood quality: yes or no?
Stakeholders’ priority(acceptability)
Fig. 14.2. Integrating the FAO approach with MCE (from Kempen, 2004).

munication, lack of secondary data, largeand scattered hamlets and limited time.Groups of about ten key informants (experi-enced farmers) were formed in each hamlet.The PLUP was repeated twice, in 2002 and2003. To have a thorough set of perspectives,agriculture farmers and aquaculture farmerswere grouped separately. In each group,farmers participated in reviewing the ham-let’s land-use history, described their landconditions and production systems,explained the reasons for land-use change,defined the socio-economic factors that affectthe change decisions, drew a sketch mapshowing the land use and land constraints oftheir hamlets and proposed the preferredfuture land use. Transect walks were alsoconducted to verify the farmers’ resourcemap. During the transect walk, farmers wereasked for information on the land and alsothe land-use types they practised. Weanalysed land-use change (actual use com-pared with use in the previous year), therealization of preferences (actual land usecompared with what farmers indicated astheir preferred land use during the previousyear), the preferred change (what theywould hope to do next year) and preferencesconflicting with those of neighbours.
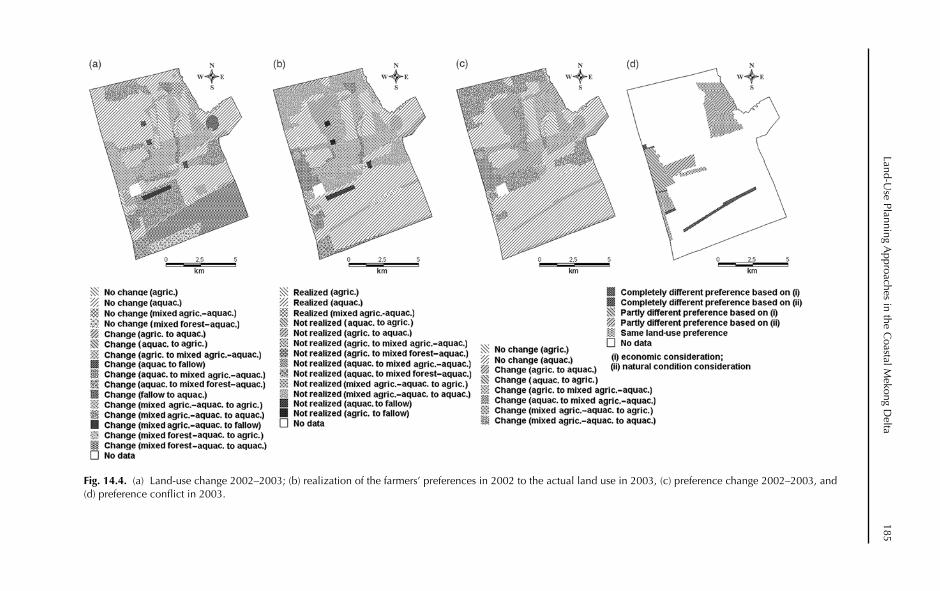
Results show that land use in the studiedarea is very dynamic. Within 1 year, morethan half of the studied area (58%) changeduse, mostly from agriculture to aquaculture(Fig. 14.4a). The land-use change in 2003 was
more than could be expected from the pref-erence expressed by both agriculture andaquaculture farmers in 2002. Half of the pref-erences were realized, mostly in aquaculture(Fig. 14.4b). In the areas where plans couldnot be realized, aquaculture or mixed agri-culture–aquaculture was practised instead ofthe preferred agriculture. In other locations,aquaculture was also practised instead of thepreferred combination of agriculture–aqua-culture.
The major change in farmers’ preferencewas the increased preference for aquacultureat the expense of agriculture (Fig. 14.4c).While in 2002 the farmers’ preference foragriculture covered 27% of the area, in 2003this was only 4%. The preference changefrom agriculture to aquaculture or to mixedagriculture–aquaculture was about 23.6% ofthe total area. The preference change frommixed agriculture–aquaculture to monoaquaculture covered 17.6% of the area. Themain reasons for those changes were thataquaculture has a higher profit than rice, andthat increasing saltwater intrusion due to theexpansion of aquaculture forces farmers toplan for aquaculture as other agriculturalpractices become virtually impossiblebecause of the lack of fresh water (Kempen,2004). Moreover, according to the adjustmentplan for the coastal areas of Bac Lieu, thegovernment was advised to invest in dredg-ing existing canals and excavating newcanals for aquaculture development (NIAPP,2001).
Conflicts in preference were analysed inseven hamlets with both agriculture andaquaculture groups. The 2003 preferencemaps of both groups were overlaid to delin-eate the areas of preference conflict. The dif-ference in preference was classified into fivelevels (Fig. 14.4d): (i) same land-use prefer-ence; (ii) partly different preference based onnatural conditions; (iii) partly different pref-erence based on economic considerations;(iv) completely different preference based onnatural conditions; and (v) completely differ-ent preference based on economic considera-tions. In most of the cases, the aquaculturegroups wanted to convert part of the agricul-tural land into shrimp land while the agri-culture groups wanted to continue
Land-Use Planning Approaches in the Coastal Mekong Delta 183
Table 14.2. Twelve scenarios with weight sets forthe development targets (FAO-MCE approach).
Scenario Economic Social Environmentaldevelopment security sustainability
1 1.0 0 02 0 1.0 03 0 1.0 04 0 0 1.05 0.33 0.33 0.336 0.75 0.25 07 0.25 0.75 08 0.25 0 0.759 0.75 0 0.25
10 0.60 0.20 0.2011 0.50 0.25 0.2512 0.25 0.50 0.25
184N
.H. Trung
et al.
(a) (b) (c)
Scenario 5Economic: 0.33Social: 0.33Environmental: 0.33
Scenario 6Economic: 0.75Social: 0.25
The proposed land-use plan
Forest–shrimpImproved extensive shrimp
Single riceRice–vegetable
Rice–shrimpSemi-intensive shrimp
Semi-intensive shrimp, intensive shrimp, saltBuilt-up areas or no data
Fig. 14.3. Land-use scenario 5 (same priority for all development targets), scenario 6 (higher priority for economic development) and the proposed land-use plan(from Kempen, 2004).
Land-Use Planning A
pproaches in the Coastal M
ekong Delta
185
Fig. 14.4. (a) Land-use change 2002–2003; (b) realization of the farmers’ preferences in 2002 to the actual land use in 2003, (c) preference change 2002–2003, and(d) preference conflict in 2003.

186 N.H. Trung et al.
cultivating their crops. The agriculturegroups either lacked capital and knowledgeof aquaculture or believed that rice and veg-etables were less risky and still profitable.
Application of the LUPAS Approach
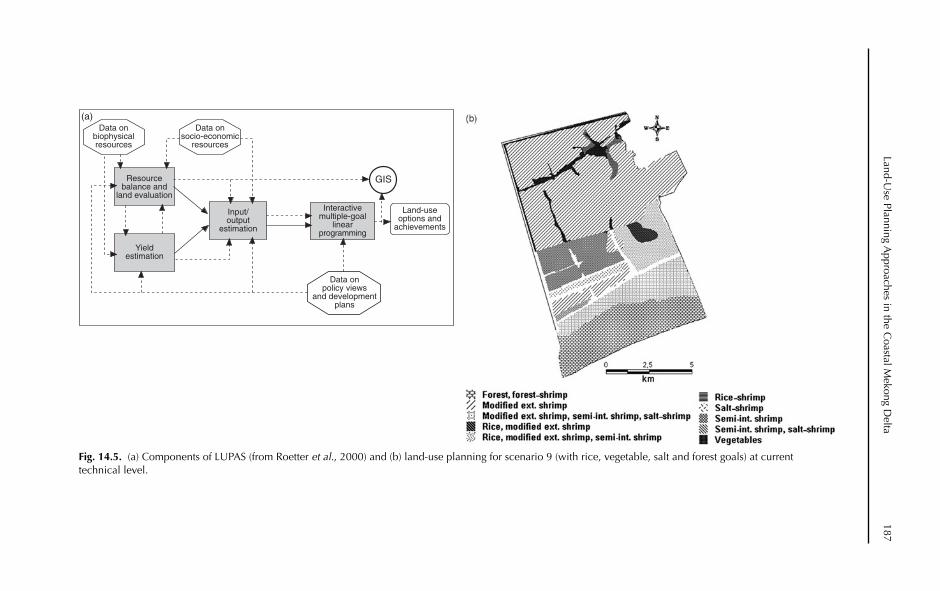
The structure of LUPAS is illustrated in Fig.14.5a and consists of a resource balance andland evaluation, a yield estimation, aninput–output estimation and an interactivemultiple-goal linear programming (IMGLP)part (van Ittersum et al., 2004).
Resource balance and land evaluation
Similar resource requirements create compe-tition between LUTs. It is critical to deter-mine the resource availability andsubsequently the potential or limits of pro-duction (Ismail et al., 2000). In LUPAS, thestudied area is divided into land units (LU),unique combinations of an agro-ecologicaland an administrative unit. The LU map isused for spatial display as well as for theIMGLP. In this study, the LMUs of NIAPP(1999, 2001) are overlain with the villageboundary map, resulting in 30 LUs.
Eleven promising LUTs considered in thisstudy were single rice, rice–vegetable, veg-etable, extensive shrimp, modified extensiveshrimp, semi-intensive shrimp, salt,salt–shrimp, forest–shrimp, rice–shrimp andmangrove forest.
Resource needs such as labour, capital,land and water were assessed. Available landfor production (10,700 ha) was determinedby excluding built-up and protected areas.Available labour was based on the total pop-ulation, 17,700 in Vinh My and 10,480 inVinh Thinh (NIAPP, 1999). Tri et al. (2002)claim that 60% of the population in the studyarea is between 18 and 60 years old. Weobserved many labourers under 17 and fromadjacent villages. Because data on capitalused are not available, they were estimatedfrom the current input cost for actual landuse plus available credit.
Yield and input–output estimation
The main tools and techniques used forinput–output and yield estimation are cropyield simulation or statistical models, expertjudgement and farm surveys (Hoanh et al.,2000). Input–output is described by totalinput cost, labour requirement and revenueof each promising LUT per LU. In this study,yield and input–output of LUTs are deter-mined at the current technical level and at animproved technical level. These levels arebased on recent average and recent maxi-mum values from a field survey or previousstudies.
Interactive, multiple-goal linear programming
Based on existing land-use planning (NIAPP,1999), annual development strategy docu-ments and actual land use, objectives andgoal restrictions are distinguished. They areto maximize the total regional income fromagriculture and aquaculture products, torealize the strategic rice, shrimp, salt andvegetable production quotas and to protectthe mangrove forest. Since our objective is tocompare LUPAS with PLUP and the FAO-MCE, the case study was narrowed to maxi-mizing the total income in two scenarios: (i)all farmers apply the actual technical level(this refers to the production techniques cur-rently practised by the majority of the farm-ers in the studied area); and (ii) all farmersapply an improved technical level that refersto a higher level of production, the ‘attain-able yield’ (Tawang et al., 2000), by advancedfarmers in the study area.
The study area had the following resourceconstraints and goal restrictions:
● The total area of all LUTs allocated in anLU must be less than or equal to the totalarea available of that LU;
● The total labour needed for all plannedproduction activities in a village must beless than or equal to the labour availablein that village;
● The total capital need for the allocatedLUTs in an LU must be less than or equalto the total available capital of that LU;
Land-Use Planning A
pproaches in the Coastal M
ekong Delta
187
Data onbiophysicalresources
Data onsocio-economic
resources
Resourcebalance and
land evaluation
Yieldestimation
Input/output
estimation
Interactivemultiple-goal
linearprogramming
GIS
Data onpolicy views
and developmentplans
Land-useoptions and
achievements
(a)
Fig. 14.5. (a) Components of LUPAS (from Roetter et al., 2000) and (b) land-use planning for scenario 9 (with rice, vegetable, salt and forest goals) at currenttechnical level.

● The total rice, shrimp, salt and vegetableproduction of the study area must begreater than or equal to the rice, shrimp,salt and vegetable production required/targeted by the local government; and
● The total mangrove forest areas allocatedin the study area must be greater than orequal to the mangrove forest area tar-geted by the local government.
A LUPAS model for the case study wasdeveloped using the GAMS software (GAMSDevelopment Corporation, <http://www.gams.com>). Table 14.3 shows the results ofthe nine feasible scenarios based on combina-tions of objectives with sets of constraintsand/or goal restrictions. The first scenario rep-resents the most favourable conditions, whenonly biophysical suitability of the land and theland area constraint apply. It generates thepotential biophysical production, which ishard to achieve. However, it can be used toevaluate the potential income from agricultureand aquaculture under the actual biophysicalconditions. The subsequent scenarios demon-strate what constraints and goal restrictionsaffect the overall goal most, so that the trade-offs between goals can be analysed and a morefeasible and sustainable land-use plan made.
In general, the results (Table 14.3) implythat:
● For maximizing the total income of thestudy area, the model assigns a high pro-portion of land area to shrimp LUTs. Thisis very risky in case a drop in shrimpyield is experienced;
● Twice the income can be achieved byimproving cultivation technology to theexisting maximum level;
● Capital and cultivation techniques are themain constraints. Labour problems can besolved by using machines, especially inland preparation and harvesting; and
● Goal restrictions (upper limit of produc-tion targets) slightly affect the totalincome but strongly influence land alloca-tion. Thus, by changing goal restrictions,the risk can be reduced, for example,reducing the shrimp production target.
Figure 14.5b presents the land-use plan-ning resulting from scenario 9 when targets
of rice, vegetable, salt and forest arearequirement were taken into account at thepresent technical level.
Comparing the Three LUP Approaches
We used acceptability (agreement of stake-holders with the results and requirements ofthe three methods) and credibility (predic-tion quality and uncertainty of the plans) ascriteria to compare the LUP approaches. Theacceptability and credibility criteria werederived from a framework presented by vander Molen (1999).
Acceptability
The agreement was prepared by asking 25stakeholders their opinion (agree, partlyagree, disagree) on the three LUP maps for2004 that had resulted from our approaches.They had no prior knowledge of whichmethod produced which map: results are inTable 14.4. The stakeholders are managers(provincial and district politicians), localexperts (staff of extension services) and sci-entists (university staff and researchers inLUP). LUPAS scores best, with 21/25 partlyagreeing and 4/25 fully agreeing with theLUPAS plan. Most answered partly becausethey feared insufficient provision of freshwater for rice and rice–shrimp. Few peoplefully agree with FAO-MCE and PLUP but farmore people disagree with these plans thanwith the LUPAS plan. The reasons for thisare expected insurmountable problems foradequate irrigation (both plans) and far tooscattered land allocation (PLUP). The threegroups judge LUPAS similarly (and mostfavourably) but local experts judge PLUPhigher than the managers and scientists. Ingeneral, the results suggest that the percep-tion of the local experts and local managersis somewhat closer to the farmers’ percep-tion than that of the scientists
In terms of resources required for imple-mentation of LUP methods, PLUP is muchcheaper (4640 VN dong/ha) than FAO-MCE(20,650) and LUPAS (24,000). PLUP takes themost time and person-months but it requires
188 N.H. Trung et al.

only simple software (statistics, GIS) foranalysis. FAO-MCE requires modelling andstatistics skills, whereas, for LUPAS, special-ized training and much more expert time foranalysis are needed.
Credibility
We compared the land-use plans made in2003 with the actual land use of 2004. PLUP
looks most like the actual use (75% of thesurface agrees) and next are LUPAS (62%)and FAO-MCE (33%). The areas planned foraquaculture agreed best (96%, 96% and 76%of the planned area actually had aquaculturethe next year). For agriculture (rice, vegeta-bles), FAO-MCE agreed best but this isbecause in this plan a much larger area wasreserved for these activities than in the othertwo plans. In all three plans, the areas thatdid not agree were largely mixed systems of
Land-Use Planning Approaches in the Coastal Mekong Delta 189
Table 14.3. Results of maximizing income at actual technical level (LUPAS approach).
Income Production (t) Environment Resource usedConstraints
(109 Rice Shrimp Salt Veg. Forest Land Capital Labourand targets
VND) (ha) (%) (109 (106
VND) days)
Land 1,944 351 22,611 4,296 15,115 1,096 100 1,241 1.85Land, labour 1,694 1,474 20,485 11,295 7,208 1,050 84 1,188 1.39Land, capital 1,111 351 9,123 4,296 15,115 1,096 87 186 1.41Land, labour, capital 974 738 8,025 30,390 15,115 1,096 83 178 1.29Land, labour, capital, 972 2,940 7,990 27,678 15,115 1,096 86 177 1.29
riceLand, labour, capital, 974 738 8,025 30,390 15,115 1,096 83 178 1.29
saltLand, labour, capital, 969 738 8,071 28,821 3,000 1,096 76 174 1.17
vegetableLand, labour, capital, 968 2,940 8,045 28,105 3,000 1,096 80 175 1.18
rice, vegetableLand, labour, capital, 930 2,940 7,845 16,000 3,000 1,360 81 181 1.10
rice, vegetable, salt, forest
VND, Vietnamese dong.
Table 14.4. Stakeholders’ opinions on land-use plans generated by LUPAS, FAO-MCE and PLUP.
Group Agreement Number of stakeholders
LUPAS FAO-MCE PLUP
Managers (9) Agree 2 3 0Partly agree 7 2 5Disagree 0 4 4
Local experts (9) Agree 1 1 3Partly agree 8 4 2Disagree 0 4 4
Scientists (7) Agree 1 0 0Partly agree 6 2 2Disagree 0 5 5
All (25) Agree 4 4 3Partly agree 21 8 9Disagree 0 13 13

190N
.H. Trung
et al.
Fig. 14.6. Realization of land-use plans for 2004 of (a) PLUP, (b) LUPAS and (c) FAO-MCE approaches.
rice–shrimp, vegetable–rice or forest–shrimp.In most cases, farmers preferred to go forone crop only, aquaculture, as this one is farmore profitable than the other planned activ-ities. So, most mixed systems turned into sin-gle aquaculture. Figure 14.6 shows where theplans were realized and where not. Areaswhere plans were not realized are along thecoast (the planned mixed forest–shrimp wasturned into shrimp only by the farmers) andin the central-northeastern part, whereplanned single rice and mixed rice–shrimpturned mostly into single aquaculture.
Discussion and Conclusions
The LUPAS map is the most accepted bymanagers, scientists and local experts. Whilescientists do not agree with either the FAO-MCE or the PLUP maps, the proportion oflocal experts and local managers that fully orpartly agree with PLUP is higher than withFAO-MCE.
When comparing land-use plans made in2003 with the actual land use in 2004, thePLUP map, which is disagreed with moststrongly by the scientists, is the most real-ized. The reason for this may be that thePLUP map, drawn by the farmers, is basedon actual land use and for the short term,whereas the other approaches aim at opti-mized resource use and the long term.
In PLUP, the attitude of the key farmersand the skill of the discussion facilitator dur-ing the PRA are the most important factors.In the FAO-MCE approach, it is crucial todetect the right key indicators for each disci-pline, qualify them and determine theirimportance. Land evaluation studies supplythe input for both LUPAS and FAO-MCEapproaches. However, their static descriptionof biophysical conditions seems unsuitablefor describing the rapid changes in thecoastal area as explained above. Accuratetransfer of the socio-economic characteristicsof the study area into the model and obtain-ing precise data on production systems arechallenges when applying both LUPAS andFAO-MCE in the coastal area of the MD.
The analysis shows that with dynamicand contrasting land uses, as in the coastalzone of the MD, PLUP seems the most suit-able approach since it is capable of acquiringup-to-date information on actual land condi-tions and of presenting the farmers’ land-usepreference. In PLUP, the places and causes ofland-use conflicts can be defined. This canhelp land-use planners in finding solutionsto achieve an acceptable land-use plan.However, for a sustainable land-use planover a longer term that can optimize the useof resources and balance different stakehold-ers’ priorities, these LUP approaches shouldbe integrated.
Land-Use Planning Approaches in the Coastal Mekong Delta 191
References
Amler, B., Betke, D., Eger, H., Ehrich, C., Hoesle, U., Kohler, A., Kösel, C., Lossau, A.V., Lutz, W., Müller,U., Schwedersky, T., Seidemann, S., Siebert, M., Trux, A. and Zimmermann, W. (1999) Land UsePlanning Methods, Strategies and Tools. GTZ, Berlin.
De Wit, C.T., Vankeulen, H., Seligman, N.G. and Spharim, I. (1988) Application of interactive multiple-goal programming techniques for analysis and planning of regional agricultural development.Agricultural Systems 26, 211–230.
FAO (1991) Plan of action for people’s participation in rural development. FAO Conference Sessions 26,Rome, p. 19.
FAO (1993) Guidelines for land-use planning. FAO Development Series 1, FAO, Rome, p. 96.Feitsma, M., Vincent, L. and Can, N.D. (2002) Understanding the challenges of PRA for farming systems
research: lessons from coastal Vietnam. In: Van Mensvoort, M.E.F. and Tri, L.Q. (eds) Selected Papersof the Workshop on Integrated Management of Coastal Resources in the Mekong Delta, Vietnam. C.T. de WitGraduate School for Production Ecology & Resource Conservation (PE & RC), Wageningen,Netherlands.
Hoanh, C.T. (1996) Development of a computerized aid to integrated land use planning (CAILUP) atregional level in irrigated areas: a case study for the Quan Lo Phung Hiep region in the MekongDelta, Vietnam. PhD thesis, Wageningen University, Wageningen, Netherlands.
Hoanh, C.T., Roetter, R.P., Aggarwal, P.K., Bakar, I.A., Tawang, A., Lansigan, F.P., Francisco, S., Lai, N.X.and Laborte, A.G. (2000) LUPAS: an operational system for land use scenario analysis. In: Roetter,R.P. et al. (eds) Systems Research for Optimizing Future Land Use in South and South-east Asia. SysNetResearch Paper Series No. 2, International Rice Research Institute, Los Baños, Philippines, pp. 39–53.
Ismail, A.B., Ahmad Shokri, O., Laborte, A.G., Aggarwal, P.K., Lansigan, F.P. and Lai, N.X. (2000)Methodologies for resource balancing and land evaluation as applied in the SysNet case studies. In:Roetter, R.P. et al. (eds) Systems Research for Optimizing Future Land Use in South and South-east Asia.SysNet Research Paper Series No. 2, International Rice Research Institute, Los Baños, Philippines,pp. 121–131.
Jansen, R. and Rietveld, P. (1990) Multicriteria analysis and GIS: an application to agricultural use in theNetherlands. In: Geographic Information System for Urban and Regional Planning. Kluwer Publishers,Dordrecht, Netherlands.
Kempen, B. (2004) Multi-criteria evaluation as a decision-making tool in land use planning on districtlevel: integrating biophysical land evaluation with socio-economic and environmental assessmentsin a decision support system for land use planning, with applications for the coastal zone of VinhLoi district, Mekong Delta, Vietnam. MSc thesis, Wageningen University and Research Center,Wageningen, Netherlands.
NIAPP (1999) Report on Land Evaluation for Agriculture, Forestry and Fishery in Bac Lieu Province [inVietnamese]. National Institute of Agriculture Planning and Projection, Vietnam.
NIAPP (2001) Adjustment Plan for Agriculture, Aquaculture, Salt and Forest Production in South of NationalRoad 1A, Bac Lieu Province [in Vietnamese]. Ho Chi Minh City, Vietnam.
Roetter, R.P., Keulen, H.V., Laborte, A.G., Hoanh, C.T. and Laar, H.H.V. (eds) (2000) Systems Research forOptimizing Future Land Use in South and South-east Asia. SysNet Research Paper Series No. 2,International Rice Research Institute, Los Baños, Philippines, 266 pp.
Roetter, R.P., Hoanh, C.T., Laborte, A.G., Van Keulen, H., Van Ittersum, M.K., Dreiser, C., Van Diepen,C.A., De Ridder, N. and Van Laar, H.H. (2005) Integration of systems network (SysNet) tools forregional land use scenario analysis in Asia. Environmental Modelling and Software 20, 291–307.
Stoorvogel, J.J. (2001) The Tradeoff Analysis Model Version 3.1: A Policy Decision Support System forAgriculture: User Guide. Wageningen University, Laboratory of Soil Science and Geology,Wageningen, Netherlands.
Tawang, A., Bakar, I.A., Kamaruddin, A.A., Yahya, T.M.T., Abdullah, M.Y., Jaafar, H.B., Othman, A.S.,Yusof, A., Ismail, Z., Hamzah, A.R., Jaafar, A.M., Aziz, Z.A., Ghani, M.Z.A., Majid, N.A. and Rashid,A.A. (2000) Developing and appying LUPAS in the Kedah-Perlis Region, Malaysia: methodologies,results and policy implications. In: Roetter, R.P. et al. (eds) Systems Research for Optimizing FutureLand Use in South and South-east Asia. SysNet Research Paper Series No. 2, International RiceResearch Institute, Los Baños, Philippines, pp. 71–89.
Ticheler, J., Defoer, T. and Kater, L. (2000) ResourceKit for participatory learning and action research.Detailed field tools for PLARUser’s guide for the ResourceKIT, CD-ROM Managing Soil Fertility inthe Tropics. KIT, Amsterdam, p. 1.
Tri, L.Q., Sanh, N.V., Ha, V.V., Loi, L.T. and Binh, N.S. (2002) Social-economic aspects of farming systemsin Vinh Loi, Thanh Phu, and Dam Doi districts, Mekong Delta, Vietnam. In: Van Mensvoort, M.E.F.and Tri, L.Q. (eds) Selected Papers of the Workshop on Integrated Management of Coastal Resources in theMekong Delta, Vietnam. C.T. de Wit Graduate School for Production Ecology & ResourceConservation (PE & RC), Wageningen, Netherlands, pp. 17–27.
van der Molen, D. (1999) The role of eutrophication models in water management. PhD thesis 2626,Wageningen University, Wageningen, Netherlands.
van Ittersum, M.K., Roetter, R.P., van Keulen, H., de Ridder, N., Hoanh, C.T., Laborte, A.G., Aggarwal,P.K., Ismail, A.B., and Tawang, A. (2004) A systems network (SysNet) approach for interactivelyevaluating strategic land use options at sub-national scale in South and South-east Asia. Land UsePolicy 21, 101–113.
Veldkamp, A., and Fresco, L.O. (1996) CLUE: a conceptual model to study the conversion of land use andits effects. Ecological Modelling 85, 253–270.
WB (1996) The World Bank Participation Sourcebook. Environmentally Sustainable DevelopmentPublications, World Bank, Washington, DC, 259 pp.
192 N.H. Trung et al.
All in-text references underlined in blue are linked to publications on ResearchGate, letting you access and read them immediately.