Comparing different strategies for variable selection in large dimensions
49
Outline Motivation Statistical Learning Feature Selection Experiments Extensions Comparing different strategies for variable selection in large dimensions B. Ghattas Institut de Mathématiques de Luminy, Marseille, France May 25, 2009, Gent, Belgium B. Ghattas Institut de Mathématiques de Luminy, Marseille, France Comparing different strategies for variable selection in large dimensions
Transcript of Comparing different strategies for variable selection in large dimensions

Outline Motivation Statistical Learning Feature Selection Experiments Extensions
Comparing different strategies for variable
selection in large dimensions
B. Ghattas
Institut de Mathématiques de Luminy, Marseille, France
May 25, 2009, Gent, Belgium
B. Ghattas Institut de Mathématiques de Luminy, Marseille, France
Comparing different strategies for variable selection in large dimensions

Outline Motivation Statistical Learning Feature Selection Experiments Extensions
Outline
Motivation.
Statistical Learning.
Feature Selection.
Experiments.
Extensions.
B. Ghattas Institut de Mathématiques de Luminy, Marseille, France
Comparing different strategies for variable selection in large dimensions

Outline Motivation Statistical Learning Feature Selection Experiments Extensions
Motivation
We would like to learn a model from data and discover the importantfeatures for learning.Examples:
Predict exportation of Uruguayan meat using informations aboutconcurrent countries and their interactions: exchange rate, production,annual import and/ export, ...Predict whether a flow within a router in a network is an email, asound, an image, a video ...Predict whether an individual will recidivate or not a heart attackknowing his past, his ECG analysis, his plasma analysis, ...
B. Ghattas Institut de Mathématiques de Luminy, Marseille, France
Comparing different strategies for variable selection in large dimensions

Outline Motivation Statistical Learning Feature Selection Experiments Extensions
Sparse data
A particular attention for situations where n << p, "Microarray data".
Which are the genes that give the best discrimination between thepresence and absence of a cancer ?
B. Ghattas Institut de Mathématiques de Luminy, Marseille, France
Comparing different strategies for variable selection in large dimensions

Outline Motivation Statistical Learning Feature Selection Experiments Extensions
A three steps approach
First order the variables.Next introduce them sequentiallay within the modelmonitoring its performance evolution.Localize the optimal number of variables to keep in the model.
0 100 200 300 400 500 600
05
1015
2025
30
Index
err.r
s
B. Ghattas Institut de Mathématiques de Luminy, Marseille, France
Comparing different strategies for variable selection in large dimensions
Outline Motivation Statistical Learning Feature Selection Experiments Extensions
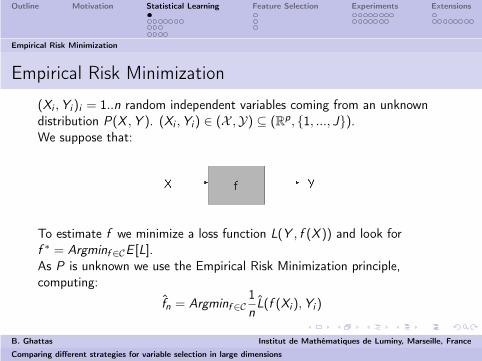
Empirical Risk Minimization
Empirical Risk Minimization
(Xi , Yi )i = 1..n random independent variables coming from an unknowndistribution P(X , Y ). (Xi , Yi ) ∈ (X ,Y) ⊆ (Rp, {1, ..., J}).We suppose that:
To estimate f we minimize a loss function L(Y , f (X )) and look forf ∗ = Argminf ∈CE [L].As P is unknown we use the Empirical Risk Minimization principle,computing:
fn = Argminf ∈C1nL(f (Xi ), Yi )
B. Ghattas Institut de Mathématiques de Luminy, Marseille, France
Comparing different strategies for variable selection in large dimensions
Outline Motivation Statistical Learning Feature Selection Experiments Extensions
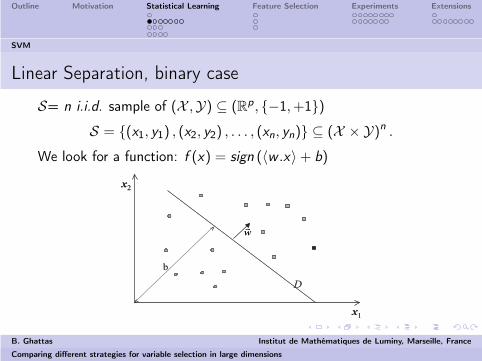
SVM
Linear Separation, binary case
S= n i.i.d. sample of (X ,Y) ⊆ (Rp, {−1, +1})
S = {(x1, y1) , (x2, y2) , . . . , (xn, yn)} ⊆ (X × Y)n .
We look for a function: f (x) = sign (〈w .x〉 + b)
B. Ghattas Institut de Mathématiques de Luminy, Marseille, France
Comparing different strategies for variable selection in large dimensions

Outline Motivation Statistical Learning Feature Selection Experiments Extensions
SVM
Margin optimization
The margin of an hyperplane is : γ = 1‖w‖ .
The optimal hyperplane is the one that achieves the maximum ofthe margin over all the separating hyperplanes.
B. Ghattas Institut de Mathématiques de Luminy, Marseille, France
Comparing different strategies for variable selection in large dimensions

Outline Motivation Statistical Learning Feature Selection Experiments Extensions
SVM
The Optimization problem
Find (w , b) ∈ Rp × R such that :
Minimizew ,b‖w‖2
2Under yi (〈w .xi 〉 + b) > 1∀i ∈ {1, . . . , n}
(1)
Solution :
w∗ =n∑
i=1
α∗i yixi =
∑
i∈sv
α∗i yixi .
and
b∗ = −maxyi=−1 (〈w∗.xi 〉) + minyi=+1 (〈w∗.xi 〉)
2.
where α∗ = (α∗1, . . . , α
∗n) are the Langrangian coefficients and
sv = {i ∈ {1, . . . , n} ; α∗i 6= 0}.
The decision function is :
f (x)n = sign
(∑
i∈sv
α∗i yi 〈xi .x〉 + b∗
)
B. Ghattas Institut de Mathématiques de Luminy, Marseille, France
Comparing different strategies for variable selection in large dimensions

Outline Motivation Statistical Learning Feature Selection Experiments Extensions
SVM
The Kernel Trick
Project the data in a high dimensional space where linearseparation is tractable, using a transformation Φ.
B. Ghattas Institut de Mathématiques de Luminy, Marseille, France
Comparing different strategies for variable selection in large dimensions
Outline Motivation Statistical Learning Feature Selection Experiments Extensions
SVM
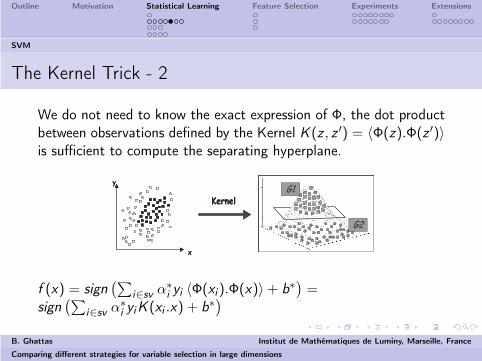
The Kernel Trick - 2
We do not need to know the exact expression of Φ, the dot productbetween observations defined by the Kernel K (z , z ′) = 〈Φ(z).Φ(z ′)〉is sufficient to compute the separating hyperplane.
f (x) = sign(∑
i∈sv α∗i yi 〈Φ(xi ).Φ(x)〉 + b∗
)=
sign(∑
i∈sv α∗i yiK (xi .x) + b∗
)
B. Ghattas Institut de Mathématiques de Luminy, Marseille, France
Comparing different strategies for variable selection in large dimensions
Outline Motivation Statistical Learning Feature Selection Experiments Extensions
SVM
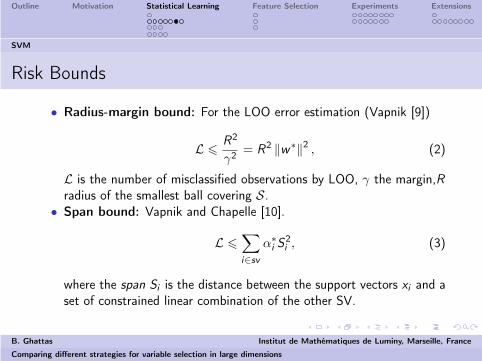
Risk Bounds
• Radius-margin bound: For the LOO error estimation (Vapnik [9])
L 6R2
γ2= R2 ‖w∗‖2 , (2)
L is the number of misclassified observations by LOO, γ the margin,Rradius of the smallest ball covering S.
• Span bound: Vapnik and Chapelle [10].
L 6∑
i∈sv
α∗i S
2i , (3)
where the span Si is the distance between the support vectors xi and aset of constrained linear combination of the other SV.
B. Ghattas Institut de Mathématiques de Luminy, Marseille, France
Comparing different strategies for variable selection in large dimensions
Outline Motivation Statistical Learning Feature Selection Experiments Extensions
SVM
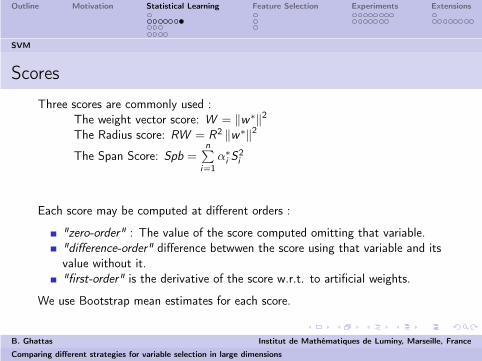
Scores
Three scores are commonly used :The weight vector score: W = ‖w∗‖2
The Radius score: RW = R2 ‖w∗‖2
The Span Score: Spb =n∑
i=1
α∗i S
2i
Each score may be computed at different orders :
"zero-order" : The value of the score computed omitting that variable."difference-order" difference betwwen the score using that variable and itsvalue without it."first-order" is the derivative of the score w.r.t. to artificial weights.
We use Bootstrap mean estimates for each score.
B. Ghattas Institut de Mathématiques de Luminy, Marseille, France
Comparing different strategies for variable selection in large dimensions

Outline Motivation Statistical Learning Feature Selection Experiments Extensions
Random Forests
Random Forests, (L. Breiman, 2001)
K bootstrap Samples, keeping the out of bag samples.Construct a Maximum tree over each one, using best split over veryfew variables randomly selected.Don’t prune.Aggregate trees using mean (regression) or majority vote(classification).
"Random Input" uses one variable at each split."Random Features" uses a linear combination of variables with randomlyselected coefficients.Weak trees + weak correlation between trees (between their predictions)→ Powerful learner.
B. Ghattas Institut de Mathématiques de Luminy, Marseille, France
Comparing different strategies for variable selection in large dimensions

Outline Motivation Statistical Learning Feature Selection Experiments Extensions
Random Forests
Variables importance
Based on OOB samples, and difference in the performance of a treewhen the values of one variable are randomly permuted.
Consider the prediction error τk of the kth tree of the forestover the OOB Sample.
Permute randomly the values of Xj in the OOB sample anduse the modified sample for prediction.
Measure the prediction error for the modified sample τ′
k(j)
The Importance measure for variable j is :
I (j) = 1K
∑Kk=1
τk−τ′
k(j)
τk
B. Ghattas Institut de Mathématiques de Luminy, Marseille, France
Comparing different strategies for variable selection in large dimensions

Outline Motivation Statistical Learning Feature Selection Experiments Extensions
Random Forests
Variables importance- Comments
Insensitive to the nature of the resampling used (bootstrapsamples with or without replacement).
Stable in presence of correlations between variables.
Invariant to normalization (using standard deviation of Zi (j)
Stable w.r.t. data perturbations. Bootstrapping VI isunnecessary.
B. Ghattas Institut de Mathématiques de Luminy, Marseille, France
Comparing different strategies for variable selection in large dimensions
Outline Motivation Statistical Learning Feature Selection Experiments Extensions
GLMpath
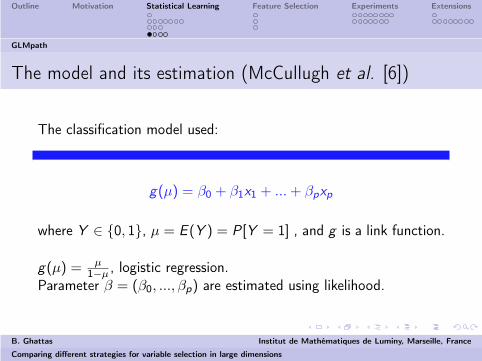
The model and its estimation (McCullugh et al. [6])
The classification model used:
g(µ) = β0 + β1x1 + ... + βpxp
where Y ∈ {0, 1}, µ = E (Y ) = P[Y = 1] , and g is a link function.
g(µ) = µ1−µ
, logistic regression.Parameter β = (β0, ..., βp) are estimated using likelihood.
B. Ghattas Institut de Mathématiques de Luminy, Marseille, France
Comparing different strategies for variable selection in large dimensions

Outline Motivation Statistical Learning Feature Selection Experiments Extensions
GLMpath
Regularization, Park et.al.(2006)
Penalize the likelihood with L1 constraint over the coefficients.
β(λ) = argminβ {−logL(x; β) + λ ‖β‖1}
where λ > 0 is a regularization parameter.The sequence β(λ), 0 < λ < ∞ is called the path.For λ = ∞ all the coefficients are equal to zero.Increasing λ sets more coefficients to zero.
B. Ghattas Institut de Mathématiques de Luminy, Marseille, France
Comparing different strategies for variable selection in large dimensions
Outline Motivation Statistical Learning Feature Selection Experiments Extensions
GLMpath
Estimation
At each step k of the algorithm, we have values for λk , βk .
1 Compute the necessary increment to reach λk+1
2 "predictor step": compute a linear approximation βk+, forβk+1
3 "corrector step": Use convex optimization to compute βk+1,with initial value βk+
4 Test if the set of active variables (having non zero coefficient),must change.
B. Ghattas Institut de Mathématiques de Luminy, Marseille, France
Comparing different strategies for variable selection in large dimensions
Outline Motivation Statistical Learning Feature Selection Experiments Extensions
GLMpath
Variables importance
Use B=500 bootstrap samples.
Compute the optimal GLM-penalized model, and keep it’scoefficients.
The importance of variable j is the absolute value of it’scoefficient’s bootstrap mean βB
j .
Variables whose coefficient bootstrap mean is zero won’t beused for comparisons.
B. Ghattas Institut de Mathématiques de Luminy, Marseille, France
Comparing different strategies for variable selection in large dimensions
Outline Motivation Statistical Learning Feature Selection Experiments Extensions
Stepwise selection
Stepwise selection
Stepwise, SFS, SBS, SFFS, ....
Advantage: Do not need a specific model, but a monotoniccriterion over a set of variables.
Drawbacks: computational complexity, depend on the order ofvariables in the data.
B. Ghattas Institut de Mathématiques de Luminy, Marseille, France
Comparing different strategies for variable selection in large dimensions

Outline Motivation Statistical Learning Feature Selection Experiments Extensions
SVM-RFE
SVM-RFE (Guyon et al. [4],Rakotomamonjy [8])
While there are still variablesLearn an SVM and sort variables using the score ||w ||2 bydifferences.Estimate its misclassification error.Eliminate half of the variables, the least important if there aremore then 100 kept.
For the last 100 variables, eliminate them recursively one byone.
B. Ghattas Institut de Mathématiques de Luminy, Marseille, France
Comparing different strategies for variable selection in large dimensions

Outline Motivation Statistical Learning Feature Selection Experiments Extensions
Our procedure
Our procedure
D = Learning sample. B = 200 Number of bootstrap samples.Compute the score(D, B) to get a hierarchy X (1), . . . ,X (p).For k = 1, . . . , p
For l = 1, . . . , 50Randomly split with stratification D = Al ∪ Tl
Al is the learning sample Tl the test sample.Mk
l = f(X (1), . . . ,X (k), Al
)
Erkl = Test
(Mk
l , Tl
)
Erk = 150
∑50l=1 Erk
l
kopt = Arg mink
{Erk}
.
B. Ghattas Institut de Mathématiques de Luminy, Marseille, France
Comparing different strategies for variable selection in large dimensions

Outline Motivation Statistical Learning Feature Selection Experiments Extensions
Toys data [11]
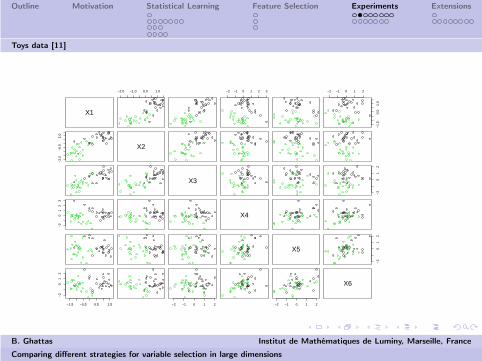
Toys
Two classes {−1, 1} having the same probability.
xi ∼ yN(i , 1), i = 1, 2, 3
xi ∼ yN(0, 1), i = 3, 4, 5
with probability 0.7,else
xi ∼ yN(0, 1), i = 1, 2, 3
xi ∼ yN(i − 3, 1), i = 3, 4, 5
xi ∼ N(0, 20), i = 7 . . . , p
These data are linearly separable with high probability, decreasingwith the sample size.
B. Ghattas Institut de Mathématiques de Luminy, Marseille, France
Comparing different strategies for variable selection in large dimensions
Outline Motivation Statistical Learning Feature Selection Experiments Extensions
Toys data [11]
X1
−2.0 −1.0 0.0 1.0 −2 −1 0 1 2 3 −2 −1 0 1 2
−1.
50.
01.
0
−2.
0−
0.5
1.0
X2
X3
−2
01
2
−2
01
23
X4
X5
−2
01
2
−1.5 −0.5 0.5 1.5
−2
01
2
−2 −1 0 1 2 −2 −1 0 1 2
X6
B. Ghattas Institut de Mathématiques de Luminy, Marseille, France
Comparing different strategies for variable selection in large dimensions
Outline Motivation Statistical Learning Feature Selection Experiments Extensions
Toys data [11]
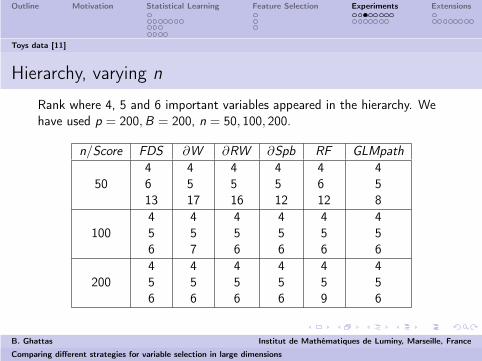
Hierarchy, varying n
Rank where 4, 5 and 6 important variables appeared in the hierarchy. Wehave used p = 200, B = 200, n = 50, 100, 200.
n/Score FDS ∂W ∂RW ∂Spb RF GLMpath
504613
4517
4516
4512
4612
458
100456
457
456
456
456
456
200456
456
456
456
459
456
B. Ghattas Institut de Mathématiques de Luminy, Marseille, France
Comparing different strategies for variable selection in large dimensions
Outline Motivation Statistical Learning Feature Selection Experiments Extensions
Toys data [11]
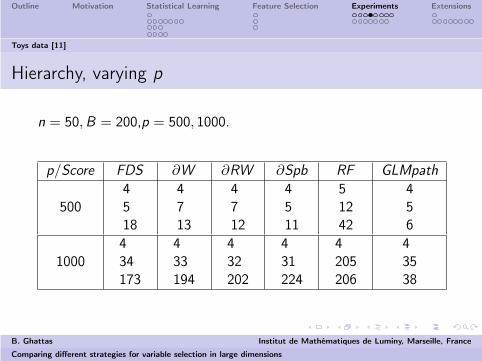
Hierarchy, varying p
n = 50, B = 200,p = 500, 1000.
p/Score FDS ∂W ∂RW ∂Spb RF GLMpath
5004518
4713
4712
4511
51242
456
1000434173
433194
432202
431224
4205206
43538
B. Ghattas Institut de Mathématiques de Luminy, Marseille, France
Comparing different strategies for variable selection in large dimensions
Outline Motivation Statistical Learning Feature Selection Experiments Extensions
Toys data [11]
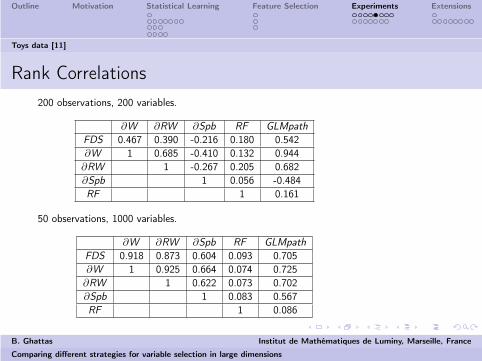
Rank Correlations
200 observations, 200 variables.
∂W ∂RW ∂Spb RF GLMpath
FDS 0.467 0.390 -0.216 0.180 0.542∂W 1 0.685 -0.410 0.132 0.944∂RW 1 -0.267 0.205 0.682∂Spb 1 0.056 -0.484RF 1 0.161
50 observations, 1000 variables.
∂W ∂RW ∂Spb RF GLMpath
FDS 0.918 0.873 0.604 0.093 0.705∂W 1 0.925 0.664 0.074 0.725∂RW 1 0.622 0.073 0.702∂Spb 1 0.083 0.567RF 1 0.086
B. Ghattas Institut de Mathématiques de Luminy, Marseille, France
Comparing different strategies for variable selection in large dimensions
Outline Motivation Statistical Learning Feature Selection Experiments Extensions
Toys data [11]
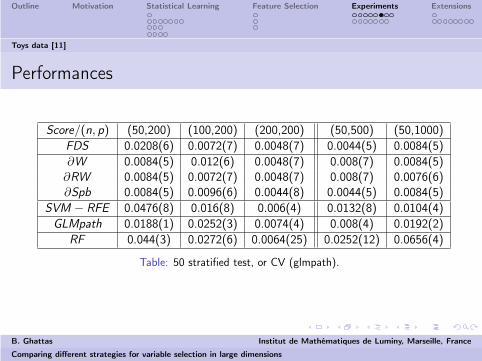
Performances
Score/(n, p) (50,200) (100,200) (200,200) (50,500) (50,1000)FDS 0.0208(6) 0.0072(7) 0.0048(7) 0.0044(5) 0.0084(5)∂W 0.0084(5) 0.012(6) 0.0048(7) 0.008(7) 0.0084(5)∂RW 0.0084(5) 0.0072(7) 0.0048(7) 0.008(7) 0.0076(6)∂Spb 0.0084(5) 0.0096(6) 0.0044(8) 0.0044(5) 0.0084(5)
SVM − RFE 0.0476(8) 0.016(8) 0.006(4) 0.0132(8) 0.0104(4)GLMpath 0.0188(1) 0.0252(3) 0.0074(4) 0.008(4) 0.0192(2)
RF 0.044(3) 0.0272(6) 0.0064(25) 0.0252(12) 0.0656(4)
Table: 50 stratified test, or CV (glmpath).
B. Ghattas Institut de Mathématiques de Luminy, Marseille, France
Comparing different strategies for variable selection in large dimensions

Outline Motivation Statistical Learning Feature Selection Experiments Extensions
Toys data [11]
sample size effects, 50 stratified test samples, p = 200.
100
102
0
0.2
0.4
Tau
x d’
erre
ur50 observations
FDS
100
102
0
0.2
0.4
50 observations
∂W∂RW∂Spb
100
102
0
0.2
0.4
50 observations
FA
100
102
0
0.2
0.4
Tau
x d’
erre
ur
100 observations
100
102
0
0.2
0.4
100 observations
100
102
0
0.2
0.4
100 observations
100
102
0
0.2
0.4
Tau
x d’
erre
ur
200 observations
100
102
0
0.2
0.4
200 observations
200 variables10
010
20
0.2
0.4
200 observations
B. Ghattas Institut de Mathématiques de Luminy, Marseille, France
Comparing different strategies for variable selection in large dimensions

Outline Motivation Statistical Learning Feature Selection Experiments Extensions
Toys data [11]
Number of variables effect. p = 500, 1000, n = 50.
100
102
0
0.1
0.2
0.3
0.4
0.5T
aux
d’er
reur
: 50
obs
erva
tions
500 variables
FDS
100
102
0
0.1
0.2
0.3
0.4
0.5500 variables
∂W∂RW∂Spb
100
102
0
0.1
0.2
0.3
0.4
0.5500 variables
FA
100
102
0
0.1
0.2
0.3
0.4
0.5
Tau
x d’
erre
ur :
50 o
bser
vatio
ns
1000 variables
100
102
0
0.1
0.2
0.3
0.4
0.51000 variables
100
102
0
0.1
0.2
0.3
0.4
0.51000 variables
B. Ghattas Institut de Mathématiques de Luminy, Marseille, France
Comparing different strategies for variable selection in large dimensions

Outline Motivation Statistical Learning Feature Selection Experiments Extensions
Microarray datasets
Data sets
Data p learning test n +1/-1
Colon 2000 62 – 22/40Lymphoma 4026 96 – 62/34Prostate 12600 102 – 52/50Leukemia 7129 38 34 27/11 - 20/14
B. Ghattas Institut de Mathématiques de Luminy, Marseille, France
Comparing different strategies for variable selection in large dimensions

Outline Motivation Statistical Learning Feature Selection Experiments Extensions
Microarray datasets
Hierarchies comparison
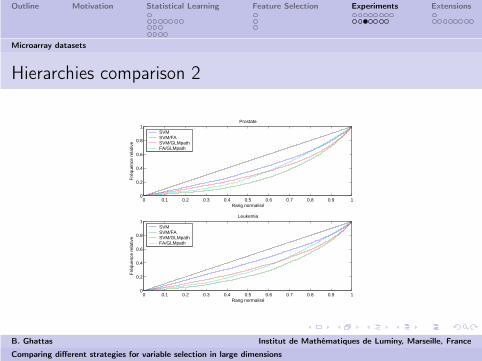
0-coefficients: Colon-999, Lymphoma-1376, Leukemia-1190, Prostate-2234.x-axis: Normalized rank.y-axis: Proportion of common variables for thecompared methods.
0 0.1 0.2 0.3 0.4 0.5 0.6 0.7 0.8 0.9 10
0.2
0.4
0.6
0.8
1
Fré
quen
ce r
elat
ive
Rang normalisé
Colon
SVMSVM/FASVM/GLMpathFA/GLMpath
0 0.1 0.2 0.3 0.4 0.5 0.6 0.7 0.8 0.9 10
0.2
0.4
0.6
0.8
1
Fré
quen
ce r
elat
ive
Rang normalisé
Lymphoma
SVMSVM/FASVM/GLMpathFA/GLMpath
B. Ghattas Institut de Mathématiques de Luminy, Marseille, France
Comparing different strategies for variable selection in large dimensions
Outline Motivation Statistical Learning Feature Selection Experiments Extensions
Microarray datasets
Hierarchies comparison 2
0 0.1 0.2 0.3 0.4 0.5 0.6 0.7 0.8 0.9 10
0.2
0.4
0.6
0.8
1F
réqu
ence
rel
ativ
e
Rang normalisé
Prostate
SVMSVM/FASVM/GLMpathFA/GLMpath
0 0.1 0.2 0.3 0.4 0.5 0.6 0.7 0.8 0.9 10
0.2
0.4
0.6
0.8
1
Fré
quen
ce r
elat
ive
Rang normalisé
Leukemia
SVMSVM/FASVM/GLMpathFA/GLMpath
B. Ghattas Institut de Mathématiques de Luminy, Marseille, France
Comparing different strategies for variable selection in large dimensions
Outline Motivation Statistical Learning Feature Selection Experiments Extensions
Microarray datasets
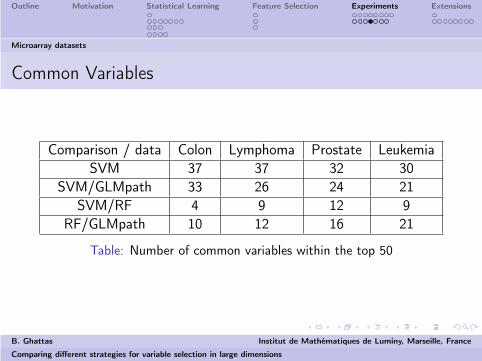
Common Variables
Comparison / data Colon Lymphoma Prostate LeukemiaSVM 37 37 32 30
SVM/GLMpath 33 26 24 21SVM/RF 4 9 12 9
RF/GLMpath 10 12 16 21
Table: Number of common variables within the top 50
B. Ghattas Institut de Mathématiques de Luminy, Marseille, France
Comparing different strategies for variable selection in large dimensions

Outline Motivation Statistical Learning Feature Selection Experiments Extensions
Microarray datasets
Results, real data sets
Score/Data Colon Lympoma Prostate Leukemia
FDS 0.1219(3) 0.0436(200) 0.0371(315) 0.0882(7)∂W 0.0009(31) 0(186) 0.0269(83) 0.1176(2)∂RW 0.0029(33) 0(60) 0.0269(902) 0.0882(22)∂Spb 0.0029(34) 0.0006(118) 0.0109(45) 0.1176(11)
SVM − RFE 0.0057(32) 0(64) 0(64) 0.0882(1)GLMpath 0.064(2) 0(3) 0(3) 0(1)
RF 0.0962(55) 0.0588(73) 0.0554(7) 0.0588(103)
Colon: 0.17, Lymphoma: 0.06, Prostate: 0.075, Leukemia:0.20588.
B. Ghattas Institut de Mathématiques de Luminy, Marseille, France
Comparing different strategies for variable selection in large dimensions
Outline Motivation Statistical Learning Feature Selection Experiments Extensions
Microarray datasets
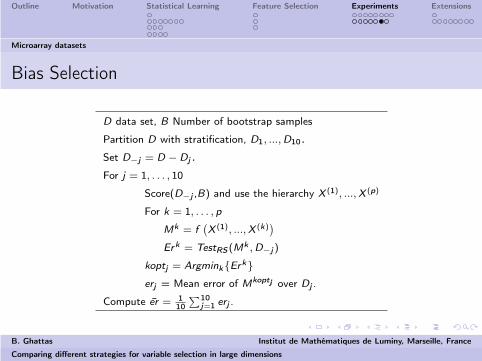
Bias Selection
D data set, B Number of bootstrap samples
Partition D with stratification, D1, ..., D10.Set D−j = D − Dj .For j = 1, . . . , 10
Score(D−j ,B) and use the hierarchy X (1), ..., X (p)
For k = 1, . . . , p
Mk = f(X (1), ..., X (k)
)
Erk = TestRS (Mk , D−j )
koptj = Argmink{Erk}
erj = Mean error of Mkoptj over Dj .
Compute er = 1
10
∑10
j=1erj .
B. Ghattas Institut de Mathématiques de Luminy, Marseille, France
Comparing different strategies for variable selection in large dimensions

Outline Motivation Statistical Learning Feature Selection Experiments Extensions
Microarray datasets
Results
Data Colon Lymphoma Prostate
FDS 0.1595(15.1) 0.1233(83.7) 0.0882(126.4)∂W 0.233 (35.1) 0.051 (86.5) 0.054 (756.6)∂RW 0.214 (43.3) 0.042 (71) 0.053 (573.3)∂Spb 0.197 (31.8) 0.073 (70.5) 0.052 (95.5)
SVM − RFE 0.1452(26.4) 0.0878(16.8) 0.0582(43.2)GLMpath 0.1809 (1.3) 0.0522 (2.8) 0.05909 (1.6)
RF 0.106 (49.8) 0.052 (65.9) 0.059 (81)
B. Ghattas Institut de Mathématiques de Luminy, Marseille, France
Comparing different strategies for variable selection in large dimensions

Outline Motivation Statistical Learning Feature Selection Experiments Extensions
Non linear Separation
Non linear Separation
100
101
102
0
0.1
0.2
0.3
0.4
0.5
0.6
0.7T
aux
d’er
reur
50 variables
100
101
102
0
0.1
0.2
0.3
0.4
0.5
0.6
0.7100 variables
100
101
102
103
0.1
0.2
0.3
0.4
0.5
0.6
Tau
x d’
erre
ur
200 variables
100
101
102
103
0.1
0.2
0.3
0.4
0.5
0.6300 variables
FDS∂W∂RW∂Spb
80 observations
B. Ghattas Institut de Mathématiques de Luminy, Marseille, France
Comparing different strategies for variable selection in large dimensions

Outline Motivation Statistical Learning Feature Selection Experiments Extensions
Multiclass separation
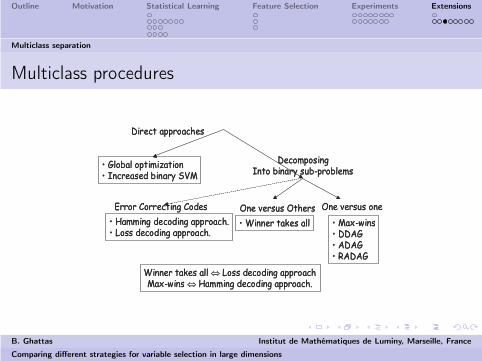
One versus others
Here Y ∈ 1, .., J. We construct J hyperplanes each learning thesimplified binary classification of one class against the other.
B. Ghattas Institut de Mathématiques de Luminy, Marseille, France
Comparing different strategies for variable selection in large dimensions
Outline Motivation Statistical Learning Feature Selection Experiments Extensions
Multiclass separation
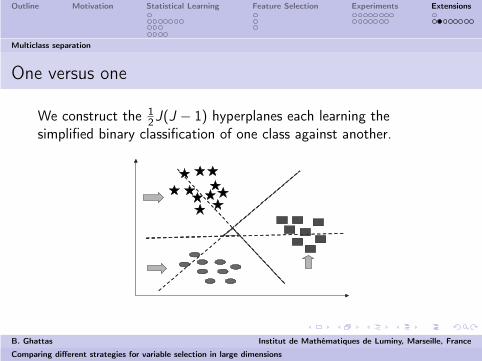
One versus one
We construct the 12J(J − 1) hyperplanes each learning the
simplified binary classification of one class against another.
B. Ghattas Institut de Mathématiques de Luminy, Marseille, France
Comparing different strategies for variable selection in large dimensions
Outline Motivation Statistical Learning Feature Selection Experiments Extensions
Multiclass separation
Multiclass procedures
B. Ghattas Institut de Mathématiques de Luminy, Marseille, France
Comparing different strategies for variable selection in large dimensions
Outline Motivation Statistical Learning Feature Selection Experiments Extensions
Multiclass separation
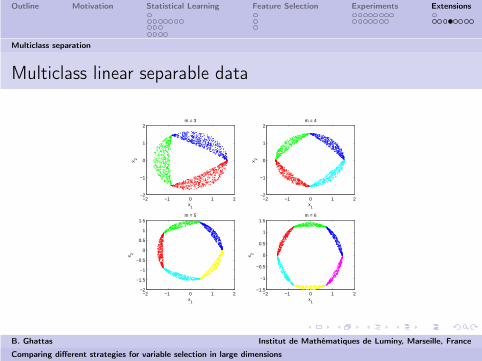
Multiclass linear separable data
−2 −1 0 1 2−2
−1
0
1
2
x1
x 2
m = 3
−2 −1 0 1 2−2
−1
0
1
2
x1
x 2
m = 4
−2 −1 0 1 2−2
−1.5
−1
−0.5
0
0.5
1
1.5
x1
x 2
m = 5
−2 −1 0 1 2−1.5
−1
−0.5
0
0.5
1
1.5
x1
x 2
m = 6
B. Ghattas Institut de Mathématiques de Luminy, Marseille, France
Comparing different strategies for variable selection in large dimensions
Outline Motivation Statistical Learning Feature Selection Experiments Extensions
Multiclass separation
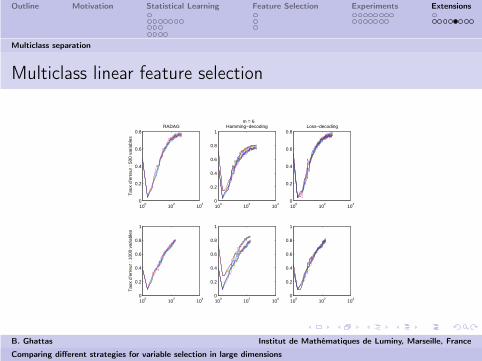
Multiclass linear feature selection
100
102
104
0
0.2
0.4
0.6
0.8T
aux
d’er
reur
: 50
0 va
riabl
esRADAG
100
102
104
0
0.2
0.4
0.6
0.8
1Hamming−decoding
100
102
104
0
0.2
0.4
0.6
0.8Loss−decoding
100
102
104
0
0.2
0.4
0.6
0.8
1
Tau
x d’
erre
ur :
1000
var
iabl
es
100
102
104
0
0.2
0.4
0.6
0.8
1
100
102
104
0
0.2
0.4
0.6
0.8
1
m = 6
B. Ghattas Institut de Mathématiques de Luminy, Marseille, France
Comparing different strategies for variable selection in large dimensions
Outline Motivation Statistical Learning Feature Selection Experiments Extensions
Multiclass separation
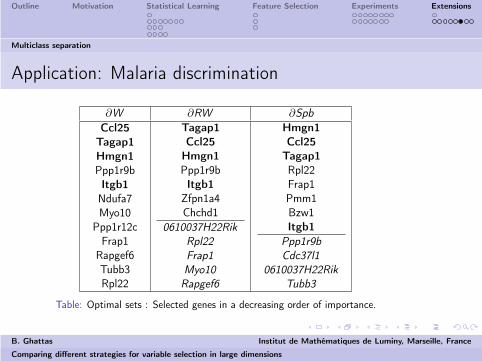
Application: Malaria discrimination
∂W ∂RW ∂Spb
Ccl25
Tagap1
Hmgn1
Ppp1r9bItgb1
Ndufa7Myo10
Ppp1r12cFrap1
Rapgef6Tubb3Rpl22
Tagap1
Ccl25
Hmgn1
Ppp1r9bItgb1
Zfpn1a4Chchd1
0610037H22RikRpl22Frap1Myo10Rapgef6
Hmgn1
Ccl25
Tagap1
Rpl22Frap1Pmm1Bzw1Itgb1
Ppp1r9bCdc37l1
0610037H22RikTubb3
Table: Optimal sets : Selected genes in a decreasing order of importance.
B. Ghattas Institut de Mathématiques de Luminy, Marseille, France
Comparing different strategies for variable selection in large dimensions

Outline Motivation Statistical Learning Feature Selection Experiments Extensions
Multiclass separation
Perspectives
Thank you for your attention.
B. Ghattas Institut de Mathématiques de Luminy, Marseille, France
Comparing different strategies for variable selection in large dimensions

Outline Motivation Statistical Learning Feature Selection Experiments Extensions
Multiclass separation
Bibliography
L. Breiman. Random forests. Machine Learning Journal, 45:5Ű32, 2001.
O. Chapelle, V. Vapnik, O. Bousquet, and S. Mukherjee. Choosing multipleparameters for support vector machines. Machine Learning, 46(1-3) : 131-159.
I. Guyon and A. Elisseff. An introduction to variable and feature selection.Journal of Machine Learning Research, 3 : 1157-1182, 2003.
I. Guyon, J. Weston, S. Barnhill, and V. Vapnik. Gene selection for cancerclassification using support vector machines. Machine Learning, 46(1-3) :389-422, 2002.
P. Langley. Selection of relevant features in machine learning. In AAAI FallSymposium on Relevance, pages 140-144, New Orleans, 1994.
P. McCullagh and J. Nelder. Generalized Linear Models. CHAPMAN &HALL/CRC, Boca Raton, 1989.
M. Y. Park and T. Hastie. L1 Regularization Path Algorithm for GeneralizedLinear Models. Technical report, Stanford University, February 2006.
A. Rakotomamonjy. Variable selection using SVM-based criteria. Journal ofMachine Learning Research, 3 : 1357-1370, 2003.
V. Vapnik. Statistical Learning Theory. John Wiley and Sons, New York, 1998.
V. Vapnik and O. Chapelle. Bounds on error expectation for support vectormachines. Neural Computation, 12 : 9, 2000.
J. Weston, A. Elisseff, B. Schoelkopf, and M. Tipping. Use of the zero normwith linear models and kernel methods. Journal of Machine Learning Research, 3: 1439-1461, 2003.
B. Ghattas Institut de Mathématiques de Luminy, Marseille, France
Comparing different strategies for variable selection in large dimensions