Comparative life cycle assessment between imported and ...
24
Journal Pre-proof Comparative life cycle assessment between imported and recovered fly ash for blended cement concrete in the UK Hisham Hafez, Rawaz Kurda, Wai Ming Cheung, Brabha Nagaratnam PII: S0959-6526(19)33592-9 DOI: https://doi.org/10.1016/j.jclepro.2019.118722 Reference: JCLP 118722 To appear in: Journal of Cleaner Production Received Date: 31 March 2019 Accepted Date: 03 October 2019 Please cite this article as: Hisham Hafez, Rawaz Kurda, Wai Ming Cheung, Brabha Nagaratnam, Comparative life cycle assessment between imported and recovered fly ash for blended cement concrete in the UK, (2019), Journal of Cleaner Production https://doi.org/10.1016/j.jclepro. 2019.118722 This is a PDF file of an article that has undergone enhancements after acceptance, such as the addition of a cover page and metadata, and formatting for readability, but it is not yet the definitive version of record. This version will undergo additional copyediting, typesetting and review before it is published in its final form, but we are providing this version to give early visibility of the article. Please note that, during the production process, errors may be discovered which could affect the content, and all legal disclaimers that apply to the journal pertain. © 2019 Published by Elsevier.
-
Upload
khangminh22 -
Category
Documents
-
view
2 -
download
0
Transcript of Comparative life cycle assessment between imported and ...
Journal Pre-proof
Comparative life cycle assessment between imported and recovered fly ash for blended cement concrete in the UK
Hisham Hafez, Rawaz Kurda, Wai Ming Cheung, Brabha Nagaratnam
PII: S0959-6526(19)33592-9DOI: https://doi.org/10.1016/j.jclepro.2019.118722Reference: JCLP 118722
To appear in: Journal of Cleaner Production
Received Date: 31 March 2019Accepted Date: 03 October 2019
Please cite this article as: Hisham Hafez, Rawaz Kurda, Wai Ming Cheung, Brabha Nagaratnam, Comparative life cycle assessment between imported and recovered fly ash for blended cement concrete in the UK, (2019), Journal of Cleaner Production https://doi.org/10.1016/j.jclepro.2019.118722
This is a PDF file of an article that has undergone enhancements after acceptance, such as the addition of a cover page and metadata, and formatting for readability, but it is not yet the definitive version of record. This version will undergo additional copyediting, typesetting and review before it is published in its final form, but we are providing this version to give early visibility of the article. Please note that, during the production process, errors may be discovered which could affect the content, and all legal disclaimers that apply to the journal pertain.
© 2019 Published by Elsevier.

1
Comparative life cycle assessment between imported and recovered fly ash for blended
cement concrete in the UK
Hisham Hafez1*, Rawaz Kurda2,3, Wai Ming Cheung1, Brabha Nagaratnam1
1Department of Mechanical and Construction Engineering. University of Northumbria. Newcastle upon Tyne, UK
2CERIS, Civil Engineering, Architecture and Georesources Department, Instituto Superior Técnico, Universidade de Lisboa, Av.
Rovisco Pais, 1049-001 Lisbon, Portugal
3Department of Civil Engineering, Technical Engineering College, Erbil Polytechnic University, Erbil, Kurdistan-Region, Iraq
*Corresponding author. Tel.: +44 7493280699
E-mail address: [email protected]
Keywords: Blended cement, supplementary cementitious materials, Life Cycle Assessment, Recovered
fly ash, Imported fly ash
AbstractA UK government report released in 2017 indicated that fly ash (FA) production locally is expected to
seize after 2021. This means that for the construction industry to meet its continuously increasing
demand for an Ordinary Portland Cement (OPC) replacement, FA would probably need to be either
imported or recovered from landfills through energy-intensive processes. Recent reports show that
companies in the UK have already started importing FA from several countries from which Germany
and China were chosen as case studies to exemplify the closest and furthest respectively. The
environmental impact associated with the FA transportation raises concerns about the environmental
sustainability of the final concrete product. Therefore, this study focuses on using a life cycle
assessment (LCA) tool to analyse the environmental impact of importing FA from Germany and China
and compare that to recovering landfilled FA in the UK. The study is the first of its kind to investigate
the environmental impact of any of the alternatives. Using a Cradle-to-Gate approach and a mix of
primary and secondary data, these alternatives were modelled and compared to conventional OPC
and currently available locally sources of FA. Results show that the environmental burden from
transporting FA from China to the UK will overcome the environmental benefits of it replacing OPC. It
is then concluded that the most promising alternative for cleaner production of blended cement
concrete is to recover the 50 million tonnes of landfilled FA from the UK using the Dry-processing
technique explained in the study. The second best alternative is to import FA from a country within
the Europe region to the UK.
Journal Pre-proof

2
1. IntroductionDespite being responsible for more than 5% of the global CO2 emissions in 2016, the production rate
of cement is expected to grow continuously at a rate of 10% annually to reach a historical maximum
of around 5000 Mt/Year by 2021 (Andrew, 2018). However, recent research has been directed to meet
the “2015 Paris climate conference” guidelines concerning reducing the clinker used in concrete to
decrease its environmental impact (Vinuales et al., 2017). Among several options, the most common
is partially replacing ordinary Portland cement (OPC) with supplementary cementitious materials of
pozzolanic nature such as fly ash (FA) (Rahla et al., 2019). FA is precipitated electrostatically as a by-
product from coal burning power plants (Meyer, 2009). China alone produced 700 million tonnes in
2014, making FA the fifth largest raw material available on Earth (Wang et al., 2017). The use of FA as
an addition to OPC has been around globally for the past 50 years as it is believed to enhance the 90
days compressive strength and durability of concrete (Assi et al., 2018; Thomas, 2007). Besides
increasing the durability and mechanical properties, the use of waste material instead of cement is
intended primarily to decrease the latter’s environmental impacts and avoid the burden from
landfilling such waste (Muller et al., 2014). A well-recognized comprehensive method of analysing such
environmental impact is Life cycle assessment (LCA) (Knoeri et al., 2013). Using LCA, it was argued that
replacing 35% of the OPC in a concrete mix could reduce the global warming potential (GWP) up to
30% (Tait and Cheung, 2016). The same conclusion was found when recycled aggregates were used
along with 30% OPC replacement with FA (Turk et al., 2015). The use of higher volume of FA (60% and
65% respectively) yielded even more reduction in GWP equivalent to almost 50% (Kurda et al., 2018;
Marinković et al., 2017).
In the UK, the use of FA is established in many sectors of the construction market. According to a
report by the UK Quality Ash Association (UKQAA), FA is added directly to clinker in cement factories,
added partially to OPC in precast concrete and concrete blocks as well as being used in soil stabilization
(UKQAA, 2015). In 2014, out of 4 million tonnes of FA produced, more than 2 million tonnes were
utilized in the concrete industry in the aforementioned applications (UKQAA, 2014). Several cement
manufacturers such as Hanson Heidelberg Cement Group produce ready blended cement packages
with 35% FA replacement to OPC (Tait and Cheung, 2016). Contractors have been encouraged to utilize
FA in construction due to the presence of different standards as EN 450 and BS 8500. However,
although the demand for FA appears to be increasing, the future concerning the availability of local
supply is not promising. The reason is that the UK government is opting to close down all coal operated
power plants after 2021 according to a governmental report published in 2017 (BEIS, 2017). Starting
2013, the production of coal has already been decreasing in the UK and will continue to decline till it
nullifies by 2021 as discussed (BEIS, 2013). Hence, the report proposes two solutions to make FA
Journal Pre-proof

3
available beyond the seizure of coal production namely, importing FA from abroad and restoring
landfilled FA.
Looking into the potential for importing FA, two private companies: Power Minerals Co. (Paoli, 2016)
and Ecocem Co. (Lambe, 2018) have already started importing FA from Europe (Germany, Italy, Spain,
and Portugal) and China respectively. However, this raises concerns on the environmental impact
associated with long transportation distances that might end up cancelling the benefits of the
imported FA (IFA) replacing OPC. Since FA carries negligible emissions as a product, most of the weight
of importing FA could be attributed to its transportation process (O’Brien et al., 2009). An LCA study
is needed then to calculate the critical transportation distance of FA beyond which substituting OPC
with FA would actually result in higher environmental impact (O’Brien et al., 2009). A similar study
concluded that transportation could attribute up to 30% of the environmental impact of the concrete
produced depending on the distances travelled by the different concrete constituents (Lopez Gayyare
et al., 2015). Nevertheless, increasing transportation distances beyond 20% reduces the
environmental benefits of replacing fresh aggregates with recycled ones (Uzzal Husain et al., 2016). A
similar research by Gursel et al. (2016) concluded that importing cement from further away China
rather than Malaysia, the GWP of concrete in Singapore increases by 11%.
The second alternative proposed by the report is to recover landfilled FA from the UK (BEIS, 2017).
Due to variations in the coal quality, only 40-50% of the FA residue could be recycled directly and the
rest is simply landfilled (McCarthy et al., 2013). A report by the department for Business, Energy and
Industrial Strategy (BEIS, 2017) argue that given suitable recovery technologies are utilized, the
current reserve of almost 50 million tonnes of stockpiled FA could be enough to meet decades of
demand for use in concrete in the UK. Several technologies were found in the literature attempting
the recovery of FA using lab based processes such as the “mechanical processing” technique
developed in the centre for Applied Energy Research at the University of Kentucky (Robl et al., 2006).
The process involves characterization of the landfilled FA followed by hydraulic classification (Robl et
al., 2006). Another technique is the “Triboelectrostatic beneficiation” in which FA particles are
pumped into a copper tube that causes an active charge that separates the FA particles and recovers
the fine particles suitable for use (Bultras et al., 2015). In addition, the “Dry-processing” technique
developed in the University of Dundee, which was reported to successfully recover 90% of random
samples of FA, was found to include some energy consumption data (McCarthy et al., 2018). Similar
to the importing alternative, further investigation of the associated environmental impacts of the
recovery techniques is needed. The energy needed and the resulting emissions from the recovery
process of the FA could end up causing negative environmental impacts that surpass that of OPC. This
would render the replacement process useless in terms of environmental sustainability.
Journal Pre-proof

4
It is now clear that starting 2022, concrete producers and users in the UK will be facing a challenge
sourcing FA. Although there appears to be alternatives, it is necessary to quantify and evaluate the
environmental impact of them and compare it to OPC and locally sourced FA. This study is the first of
its kind to look into such a critical matter. In order to reach a decision of whether FA is to be imported
as opposed to recovering the landfilled FA, an LCA will be carried out on each of the proposed
alternatives. The primary data from local UK news about the importing scenario were not used before
in any of the studied literature. Also, this is the first study to evaluate the environmental impact of a
FA recovery process.
2. MethodsA LCA consists of 4 main stages: (i) Scope and goal definition, (ii) Defining the inventory for the life
cycle processes, iii) characterising and measuring the life cycle impact (ISO, 2006) and iv) the
interpretation of results. First, the main decision in the scope stage is to decide on the system
boundaries and functional unit (Habert et al., 2011). A system boundary of a concrete product could
be “Cradle-to-Gate” which spans until the production of its different constituents or “Cradle-to-Grave”
which includes the “Use” and “End-of-Life” phases. Many LCA studies opt for a Cradle-to-Gate system
boundary due to the large uncertainties present in the remaining phases (Wu et al., 2014). A functional
unit is the basis for quantifying the inputs and outputs between alternatives. Hence, its selection
needs to be reflective of the nature of the LCA subjects (Panesar et al., 2017). Mass based functional
units are found to be the most common when comparing the process of producing binders such as:
Lime, FA and OPC (Panesar et al., 2017). The next LCA stage includes collecting the data of energy and
emissions associated with the aforementioned scope. The data needed for standard processes can
mostly be found in databases such as Ecoinvent, Swiss input/output and ELCD (Sagastume Gutierrez
et al., 2017). Another important parameter to decide at this stage is the allocation, which is basically
portioning the environmental burden of the original process to the product under study (Marinkovic
et al., 2017). According to the EU directive 2008, FA is considered a by-product not a waste and thus
ought to be allocated a percentage of the environmental burden of its original production process,
which is coal combustion (Anastasiou et al., 2015). The first scenario is “Mass allocation” where the
percentage allocation is based on the relative mass between the waste material as a by-product and
the mass of the total (the effective mass of electricity + the mass of FA). The second scenario is
“Economic allocation” in which the percentage allocated is based on the relative market value
between the final product, which is FA and electricity (Chen et al., 2010). LCA studies on Green
concrete tend to use economic allocation for FA since it is usually a lower number, which allows the
results to be positive relative to OPC, but the fluctuation of market prices brings in uncertainties to
Journal Pre-proof

5
the calculations (Marinkovic et al., 2017). The final stage of an LCA is to calculate the environmental
impact of the studied product. This is performed by adding up the individual impacts of all the
associated processes as per ISO 14040:2006 to calculate an environmental impact indicator; a number
that makes the output of the impact assessment study more understandable to the user (Goedkoop
et al., 2001). According to Menoufi (2011), there are two main types of indicators: Mid-point
indicators, which correlate the calculated impact to a specific change in the environment such as GWP
and End-point indicators which correlate the same increase to a further on damage in the cause-effect
change such as human health. The significance of this differentiation is that the same comparison
between products or processes could result in different scores if looked upon by a Mid-point or an
End-point indicator, due to the exaggeration of damage that happens to reach the latter (Maia de
Souza et al., 2016). Mid-point indicators are then known to be more accurate given that the user
knows which indicator best suits the description of the assessment, but End-point ones are easier to
interpret since it is just a single score (Sayyagh et al., 2010).
2.1 LCA scope definition
The first stage of the LCA study is to decide on the boundaries and the scope. As agreed, it is best
descriptive of this kind of comparison between binders to have a Cradle-to-Gate scope. The processes
examined are hence only those involved up until the production of the following products: ordinary
Portland cement (OPC), current locally sourced UK FA (LFA), IFA and recovered FA (RFA). The
functional unit is selected as 1 kg of mass. To reflect the fact that only 90% of the landfilled FA is
reported to be recyclable according to McCarthy et al. (2018), the functional united selected for RFA
is 1.11. The boundaries of the Cradle-to-Gate scope for all the materials modelled in the LCA are found
in Figures 1 and 2. Although the FA studied are intended for use as partial replacements to OPC in
concrete, it is out of scope to study the further processes concerned with concrete production, use,
and end-of-life. The reason behind this is that beyond the production processes included in this study,
all the FA types are assumed to be conforming to the specifications by BS EN 450-1 standard shown
below in Table 1, which ensures a fair comparison. The selected countries of origin for the IFA are
China and Germany. These exemplify the largest and smallest transportation distance out of all the
examined countries from the literature. IFA is hence sub-divided into IFA/C and IFA/G to indicate FA
imported from China and Germany, respectively. The selected transportation means is by sea freight
and the selected ports from UK, China and Germany were Newcastle, Hong Kong and Bremen,
respectively. The calculated freight distances, which are assumed to be only for a single trip
considering that other products are transported back on the same carrier, can be found in Table 2. It
is assumed that the transportation from the port to the concrete batch plant is the same as the
distance from the nearest OPC factory as well as the nearest coal-fired power station where LFA and
Journal Pre-proof

6
RFA are sourced. Hence, the energy and emissions related to the transportation of any of the products
to the concrete batch plant is considered as equal. Out of the three recovery techniques found in the
literature (Robl et al., 2006; Bultras et al., 2015; McCarthy et al., 2018), the Dry-processing technique
was the one selected for the scope of this study. The reason is that the process is well explained in a
way that allowed for the calculation of the energy and emissions that was input in the modelling
scenario.
Table 1: BS EN 450-1 requirements for FA to replace cement based on Carroll (2015)
Property LimitsActivity Index ≥ 75% @28 days, ≥ 85% @90 daysLoss On Ignition (LOI) Category A ≤ 5%, Category B ≤ 7%, Category C ≤ 9%Particle density ± 200 kg/m3
Fineness (45 µm) Category N ≤ 40%, Category S ≤ 12%Free Calcium Oxide ≤ 1.5%Reactive Calcium Oxide ≤ 10%Sulphate Content ≤ 3%Alkalis ≤ 5%Magnesium Oxide ≤ 4%Soluble Phosphate ≤ 100 mg/kgTotal Phosphate ≤ 5%Reactive SiO2 ≥ 25%
Table 2: The country of origin and transportation distances for the materials included in the study
Symbol Material Scope Origin Sea Freight (tkm)OPC Ordinary Portland Cement Production UK -LFA Local fly ash Production UK -RFA Recovered fly ash Dry-processing UK -IFA/C Imported fly ash from China Production, Transportation China 9.0IFA/G Imported fly ash from Germany Production, Transportation Germany 1.4
Figure 1: The boundary of the LCA study and OPC production process
Journal Pre-proof

7
Figure 2: The boundary of the production process of (a) IFA, and (b) locally sourced and RFA
2.2 Life Cycle Inventory Analysis
The data necessary for this LCA can be categorized into two groups: the first is related to calculating
the energy and emissions related to OPC as well as these related to the IFA including the production
process in the country of origin and the transportation to the UK. These were found as a secondary
data from the Ecoinvent data base using SimaPro 8. The second group, which include the primary data
that calculate the energy required for the Dry-processing recovery of landfilled FA and the calculations
necessary for the allocation scenario of FA, were developed using primary data.
In order to calculate the allocation scenario for FA; the difference in prices of FA relative to electricity
in both countries were surveyed. In China, the cost of electricity and FA was found to be 0.11 €/kWh
(CEIC, 2018) and 10 €/tonne (Alibaba, 2019; Wang et al., 2016) respectively, while the electricity price
in Germany was 0.29 €/kWh (Statista, 2018). Due to the absence of any commercially available data
Journal Pre-proof

8
around the price of FA in Germany, it was assumed to be the same as that in the UK, which is 50
€/tonne (Alberici et al., 2017). Assuming both countries use the same coal combustion techniques,
2689 kWh of electricity and 80 kg of FA can be produced from burning one tonne of coal (Seto et al.,
2017). Hence according to Equation 1 (Chen et al., 2010), the economic allocation for the IFA from
China and Germany is calculated to be 0.25% and 0.50%, respectively. Using the same assumption for
the LFA, since the price of the electricity in the UK was found to be 0.16 €/kWh (UKPower, 2019), the
economic allocation percentage was calculated to be 0.11%. The mass allocation was calculated as
9.3% using Equation 2 according to Seto et al. (2017). A summary of the allocation percentages for all
alternatives could be found in Table 3. It should be noted that the three economic allocation
percentages are fairly lower than the ones in the literature (4% in Seto et al., 2017 and 1% in Chen et
al., 2010). This could be attributed to discrepancies in the primary data used. Regarding the RFA, it
being already landfilled waste, no original burden is allocated to it.
Economic Allocation = (€. m)by ― product
(€. m)main product + (€. m)by ― product(1)
Mass Allocation = (m)by ― product
(m)main product + (m)by ― product(2)
Table 3: A summary of the allocation scenarios for all materials included in the study
Symbol Local Electricity Price (€/kWh)
Local FA Price (€/tonne)
FA generated/ Coal (Kg/t)
Electricity Generated/ Coal (kWh/t)
Mass Allocation (%)
Economic Allocation (%)
OPC No AllocationRFA No AllocationLFA 0.16 50 80 2689 9.3 0.11IFA/C 0.11 50 80 2689 9.3 0.25IFA/G 0.29 10 80 2689 9.3 0.50
2.3 Life Cycle Impact assessment
In this study, two indicators were chosen, the GWP in a 100 years time (GWP 100) calculated using a
Mid-point indicator by the Centre of Environmental Studies at Leiden University (CML 2000), and the
single score of Eco-indicator 99 (EI-99) which is an End-point indicator. The alternatives for importing
FA were modelled using SimaPro 8, then compared to locally sourced FA and OPC while accounting
for the allocation scenario. After that the impact of the RFA using Dry-processing was calculated and
compared to the rest. Finally, before judging on the best alternative, a sensitivity analysis was
performed to measure the impact of changing critical parameters such as transportation distances
and allocation percentages.
Journal Pre-proof

9
3. Calculations and discussions
3.1 The impact of the imported fly ash
3.1.1 Using mass allocation scenario
As shown in Figure 3, allocating 9.3% of the original process would mean that IFA products and even
locally FA products have a higher environmental impact than OPC. Judging by the EI-99 single point
indicator, IFA from Germany, IFA from China and LFA are around 4, 16 and 7 times higher than OPC,
respectively. The GWP indicator does not change the ranking, but decreases the relative scores to be
4, 6, 4 and 1 for IFA from Germany, IFA from China, LCA and OPC, respectively.
Figure 3: The impact of importing FA using EI-99 (L) and GWP (R) indicators with mass allocation
3.1.2 Using economic allocation scenario
On the other hand, using the economic allocation scenario, the impact assessment results change
significantly. Since the environmental burden from the original process is a much less than the mass
allocation scenario, all binders seem to have a lower environmental impact than OPC, which is the
starting point for considering them as an OPC replacement. However, results differ depending on the
indicator used. As shown in Figure 4, the relative scores for the GWP100 of IFA from Germany, IFA
from China, LFA are 30%, 88% and 5% compared to OPC, respectively. When using the EI-99 single
indicator, the rankings have changed. IFA from China has a higher impact with a relative score of 3.24
compared to OPC, but LFA and IFA from Germany remained less, scoring 8% and 52% respectively
compared to OPC.
Journal Pre-proof
10
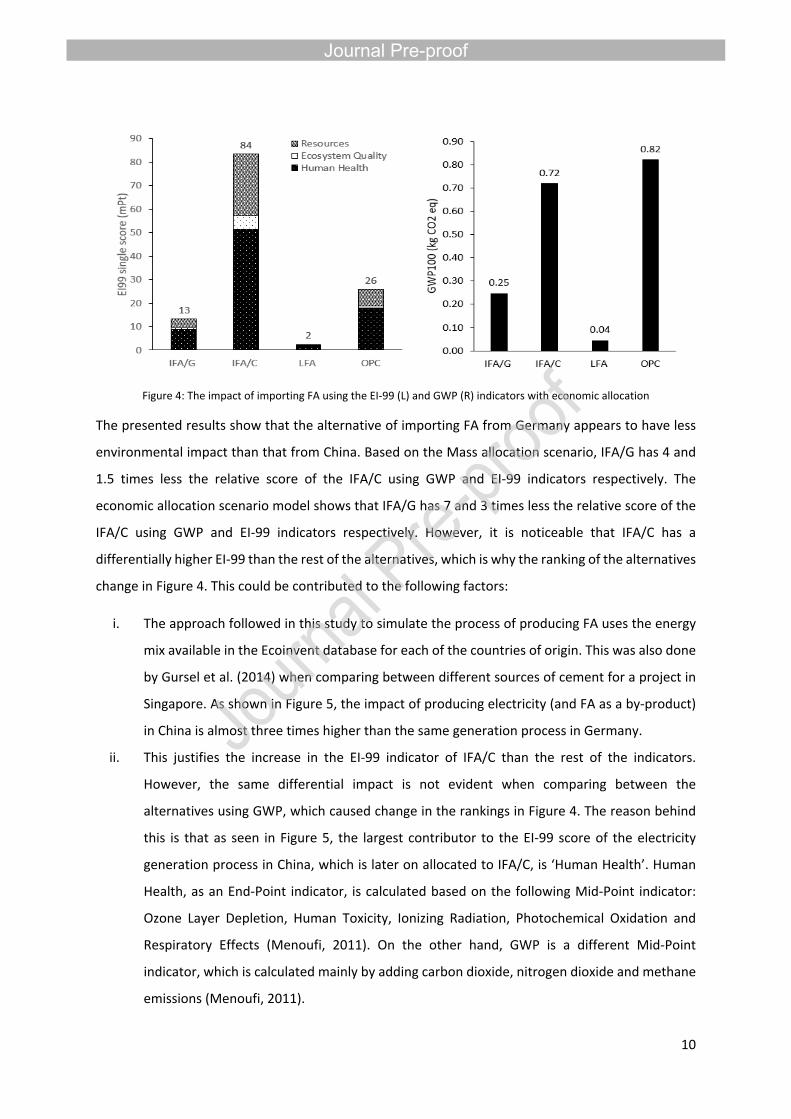
Figure 4: The impact of importing FA using the EI-99 (L) and GWP (R) indicators with economic allocation
The presented results show that the alternative of importing FA from Germany appears to have less
environmental impact than that from China. Based on the Mass allocation scenario, IFA/G has 4 and
1.5 times less the relative score of the IFA/C using GWP and EI-99 indicators respectively. The
economic allocation scenario model shows that IFA/G has 7 and 3 times less the relative score of the
IFA/C using GWP and EI-99 indicators respectively. However, it is noticeable that IFA/C has a
differentially higher EI-99 than the rest of the alternatives, which is why the ranking of the alternatives
change in Figure 4. This could be contributed to the following factors:
i. The approach followed in this study to simulate the process of producing FA uses the energy
mix available in the Ecoinvent database for each of the countries of origin. This was also done
by Gursel et al. (2014) when comparing between different sources of cement for a project in
Singapore. As shown in Figure 5, the impact of producing electricity (and FA as a by-product)
in China is almost three times higher than the same generation process in Germany.
ii. This justifies the increase in the EI-99 indicator of IFA/C than the rest of the indicators.
However, the same differential impact is not evident when comparing between the
alternatives using GWP, which caused change in the rankings in Figure 4. The reason behind
this is that as seen in Figure 5, the largest contributor to the EI-99 score of the electricity
generation process in China, which is later on allocated to IFA/C, is ‘Human Health’. Human
Health, as an End-Point indicator, is calculated based on the following Mid-Point indicator:
Ozone Layer Depletion, Human Toxicity, Ionizing Radiation, Photochemical Oxidation and
Respiratory Effects (Menoufi, 2011). On the other hand, GWP is a different Mid-Point
indicator, which is calculated mainly by adding carbon dioxide, nitrogen dioxide and methane
emissions (Menoufi, 2011).
Journal Pre-proof

11
27.3
6.9
1.2
0.4
1.2
1.5
Electricity, Coal, China Electricity, Coal, Germany0
5
10
15
20
25
30
35 Human Health
Ecosystem Quality
Resources
EI99
sing
le sc
ore
(mPt
)
Figure 5: Comparison of the Ecoinvent score for the original production process of FA between Germany and China
3.2 The impact of the recovered fly ash
For the RFA impact assessment, the chosen method was the Dry-processing proposed by McCarthy et
al. (2018), which entails that 90% of the FA landfilled are recyclable to conform to BS EN 450-1 through
a process of drying, sieving then mechanical grinding. According to Baker et al. (2015), the landfilled
FA has an average water content of 15-20% and the energy required to remove it by oven drying at
105°C is around 200 kWh/tonne. McCarthy et al. (2018) states that the mechanical grinding is carried
out using a “Fritsch Pulverisette” machine in 500 g batches with 20 minutes of operation each. The
machine operates at 110V and 0.5A as per its technical catalogue so the energy demand for the
grinding process is estimated at around 300 kWh/tonne. Using these energy inputs for the recovery
process, the environmental impact for the RFA was modelled using SimaPro 8 using GWP and EI-99 as
indicators. The results of the impact assessment per 1.11 kg of mass of RFA was only compared to 1
kg of OPC, LFA, IFA/C and IFA/G. An economic allocation scenario similar to that in the previous model
was selected for LFA, IFA/C and IFA/G, since it was established by the literature as the most realistic
scenario to compare to (Chen et al.. 2010; Habert et al., 2011; Seto et al., 2017).
As shown in Figure 6, recovering of FA using the ”Dry-processing” method yield a binder that has 50%
and 75% less environmental impact compared to OPC when using EI-99’s End-point and GWP as
indicators, respectively. Nevertheless, RFA has 7 and 6 times less impact that IFA/C using EI-99’s single
indicator and GWP respectively. Compared to IFA from Germany, RFA only has 10-15% reduction.
Finally, the impact of RFA was found to be higher than that of LFA which is believed to seize to be
available beyond 2021, which still makes RFA the best alternative considered in this study. The fact
Journal Pre-proof

12
that the locally available and imported FA alternatives were allocated only minimal percentages as per
the economic allocation scenario means that RFA would have even yielded higher environmental gains
had the other FA alternatives been allocated higher percentages as established in 4.1. This could be
contributed to the fact that RFA is not allocated any burden from its original production process since
it is considered as a waste. Also, the “Dry-processing” method is, as explained by McCarthy et al.
(2018), very basic and energy efficient. In addition, the fact that it is already landfilled means that
recycling FA has a positive environmental impact, especially for the Carcinogens, Ecotoxicity and of
course Land use.
Figure 6: EI-99 Single score indicator (L) and GWP (R) of RFA vs OPC
3.3 Sensitivity Analysis
Before generalizing the judgment on the preferred alternatives to LFA from the 3 proposed ones, the
sensitivity of the calculated impact to allocation scenarios, transportation distances, and recovery
processes was studied.
3.3.1 Sensitivity to Allocation Scenario
In order to assess the sensitivity of the calculated environmental impact of the two proposed
importing alternatives to locally available FA and OPC, the graph in Figure 7 was plotted between the
GWP100 indicator used and difference allocation percentages (0-15%) of all three alternatives.
Generally, the results in Figure 7 show that the environmental impact of IFA is very sensitive to the
selected allocation scenario with a common slope of almost 0.4 kg CO2 eq per 1% change in allocation.
Had the scope of this study included FA as a part of a concrete product, which means reducing its
Journal Pre-proof

13
contribution to the FA content in concrete (around 10%), the results would have been less sensitive
to change. The same conclusion was found in the literature (Gursel et al., 2014; Seto et al., 2017). As
shown in the results, the calculated environmental burden of FA was a 6 to 8 times less when an
economic allocation scenario was chosen compared to mass allocation. The critical allocation scenario
for the IFA to have less GWP100 than OPC was calculated to be 2.5%. The graph also shows that the
sensitivity of FA to allocation scenarios studies by Chen et al. (2010) is almost identical to the one
calculated for the FA imported from Germany in this study. Accordingly, researchers tend to rely more
on economic allocation, although dependant on electricity and FA prices, to encourage the use of
supplementary cementitious materials in the construction industry (Marinković et al., 2017). This
means that it is up to the user to determine the most indicative allocation scenario regarding the
intended purpose until a consensus is reached on the most accurate method for allocation
(Mohammadi et al., 2017).
0 2.5 5 7.5 10 12.5 150
2
4
6
8
10
12
14
Chen et al. (2010) IFA/C IFA/G OPC
Allocation Percentage (%)
GWP
(kg
CO2 e
q)
Figure 7: Sensitivity analysis of the allocation of different FA materials compared to OPC
It is also shown that importing FA from China has a higher environmental impact than locally available
FA regardless of the allocation scenario. This could be contributed to the large transportation distance
between China and the UK (calculated as 9 tkm) compared to that between Germany and the UK (1.4
tkm only). It is also established that the original process of FA generation as a by-product in electricity
power plants has a much higher impact in China compared to than in Germany. Given the
aforementioned assumptions, importing FA to the UK from anywhere with the same power generation
Journal Pre-proof

14
process and the transportation distance as Germany will reduce the environmental impact compared
to OPC. The condition is that the allocation scenario selected attributes ≤2.5%.
It is worth noting that environmental impact is not the only parameter to consider when comparing
alternatives in the construction industry. It is agreed from the literature that economic feasibility of
the solution might have even a bigger weight depending on the stakeholders (Garcia-Segura et al.,
2013; Ignacio Navarro et al., 2018; Tucker et al., 2018). The primary data used in this study indicate
that the price of FA imported from China (10 €/tonne) is five times less that its selling price in Europe
(Alberici et al., 2017; Wang et al., 2016). This means that from the perspective of concrete
manufacturers and suppliers it would be more attractive to import FA from China regardless of the
negative differential environmental impacts established in this study. It is hereby worthy to
recommend that the UK government, which is driven as discussed to cut down the environmental
impact from building materials, enforce higher taxation on the FA imported from China or similar
countries with the same electricity mix and transportation distance.
3.3.2 Sensitivity to Transportation Distances
As agreed in the literature, transportation processes represent almost 25% of the environmental
impact of the IFA products (Lopez Gayyare et al., 2015). Several transportation distances by sea freight
were simulated to measure the sensitivity of the different IFA products and the corresponding
environmental indicators. An economic allocation scenario was selected for the IFA as it was shown
to provide comparable results to OPC. Using the EI-99 single indicator, the threshold of the
transportation distance travelled by sea towards which the IFA would still have less environmental
impact compared to OPC was found to be around 3.57 tkm (Figure 8). This covers almost the whole of
Europe and parts of North Africa as seen in the Google image in Figure 9. This value is significantly
lower than the 54 tkm found in the literature (O’Brien et al., 2009) but the difference in primary data
used could be the variance source and the fact that the cited study used a no allocation scenario. The
underlying assumption remains that the coal combustion process at the country exporting FA has the
same environmental burden as that in Germany. An important factor to consider is that the same
environmental laws and regulations to be adopted by the UK are expected to happen all over Europe
(Vinabules et al.,2017). This means that, several other European countries will be inclined to shift away
from generating electricity from coal which again compromises the potential of the availability of FA
in these countries.
Journal Pre-proof

15
0 1 2 3 4 50
5
10
15
20
25
30
35
40
IFA economic allocation OPC
Transportation distance (tkm)
EI99
sing
le sc
ore
(mPt
)
Figure 8: Sensitivity of importing FA to the UK to the transportation distances
Figure 9: A Google maps image showing the radius of 3.57 tkm that can be covered by IFA to the UK
Journal Pre-proof

16
3.3.3 Sensitivity to Recovery Process
Since recovering landfilled FA was found to be the best alternative in terms of environmental impacts,
its sensitivity to the amount of energy and emissions involved in the recover process was investigated.
The “Dry-processing” technique of recovery as explained by McCarthy et al. (2018) and modelled in
this study consisted of two steps: heating for five hours to get rid of the excess water which was
estimated to consume around 200 kWh/tonne and mechanical grinding which was estimated to
consume around 300 kWh/tonne. The latter was changed to a range between 400-1200 kWh/tonne
to accommodate for more industrial solutions. It shows that increasing it four times and up to 1160
kWh per tonne would still yield an improvement in the impact of RFA compared to OPC as shown in
Figure 10. Although the “Dry-processing” recovery process is still only successful at the laboratory
scale, it seems that the results are very promising since it carries no allocation scenario due to the fact
that it was already scrapped. Nevertheless, minimal environmental impact are expected to be added
to RFA due to transportation. According to Carroll (2015), landfilled FA where the recovery plants are
to be located are very close geographically to the same locations of coal-fired electrical power plants
that are expected to be shut down in the UK after 2020.
0.2 0.4 0.6 0.8 1 1.2 1.4 1.60
0.1
0.2
0.3
0.4
0.5
0.6
0.7
0.8
0.9
RFA OPC
Processing Power kWh/t
GWP1
00 (k
g eC
O2 e
q)
Figure 10: Sensitivity of RFA to the different energy demands of processing methods of recovery using GWP 100
Journal Pre-proof

17
4. ConclusionThe work presented in this paper is to investigate a critical problem facing the concrete industry in the
UK to find alternatives to locally sources FA. Generally, the following could be concluded from the
paper given the aforementioned scope and limitations:
- Imported FA from Germany has less environmental impact than that from China. The latter
appeared to have around 4 and 1.5 times the relative score of the using GWP100 (Mid-point)
and EI-99 (End-point) indicators, respectively.
- It is worth noting that given the Chinese electricity power generation process from Ecoinvent,
imported FA from China will have higher environmental impact than OPC regardless of the
allocation scenario. This is worth noting since this is the most appealing alternative
economically given the surveyed market prices in this study.
- Recovering the 50 million tonnes of landfilled FA using the Dry-processing technique could be
the alternative with the least environmental impact compared to importing it. It would also
be enough for almost 30 years of FA demand.
- FA products, in general, seem to possess high sensitivity to allocation scenarios. An increase
of 1% allocation leads to an increase of the global warming potential within the specified
scope up to 0.5 kg CO2 eq.
- Given the assumptions in this study, importing FA from anywhere with the same power
generation process and the same transportation distance as Germany will have a less
environmental impact than OPC as long as the allocation scenario attributes less than 15%
from the original process to FA.
- The selling price of FA in China is a lot lower than that in Europe. Hence, as long as the negative
environmental impacts associated with it as established in this study still prevail, the UK
government should increase the taxes to discourage suppliers from importing FA from China.
- Shipping transportation processes could contribute to up to 25% of the FA environmental
burden. However, assuming a 0.5% allocation, importing FA from Europe or North Africa could
still have less environmental impact than locally sourced OPC given that the main production
process and market prices are similar to that in Germany.
- The Dry-processing recovery technique is not very sensitive to the increase in energy demand
for the recovery process. The process could even have up to 4 times the assumed energy and
still would have less kg CO2 eq than OPC.
Journal Pre-proof

18
AcknowledgmentsThe authors acknowledge no conflict of interest. This research did not receive any specific grant from
funding agencies in the public, commercial, or not-for-profit sectors.
References Alberici, S., De Beer, J., Van Der Hoorn, I., Staats, M. 2017. Fly ash and blast furnace slag for cement
manufacturing. In: DEPARTMENT FOR BUSINESS, E. A. I. S. (ed.). Ecofys.Alibaba.com, fly ash for concrete class c class f - buy fly ash exporter, fly ash exporter supplier, fly
ash manufacturer product on alibaba.com [Online]. Available at:https://www.alibaba.com/product-detail/Fly-Ash-for-Concrete-Class [Accessed March 5,2019].
Anastasiou, E. K., Liapis, A. & Papayianni, I. 2015. Comparative life cycle assessment of concrete road pavements using industrial by-products as alternative materials. Resources, Conservation & Recycling, 101, 1-8. https://doi.org/10.1016/j.resconrec.2015.05.009
Andrew, R. M. 2018. Global CO2 emissions from cement production. Earth System Science Data, 10, 195-217. https://doi.org/10.5194/essd-10-195-2018
Assi, L., Carter, K., Deaver, E., Anay, R. & Ziehl, P. 2018. Sustainable concrete: Building a greener future. Journal of Cleaner Production, 198, 1641-1651. https://doi.org/10.1016/j.jclepro.2018.07.123
Baker L., G. A., And Gasiorowski S. Triboelectrostatic beneficiation of land filled fly ash. 2015 World of Coal Ash, 2015 Needham MA USA. ST Equipment and Technologies LLC.
Baltrus, J. P., Diehl, J. R., Soong, Y. & Sands, W. 2002. Triboelectrostatic separation of fly ash and charge reversal. Fuel, 81, 757-762. https://doi.org/10.1016/S0016-2361(01)00196-X
Carroll R. Coal Combustion Products in the United Kingdom and the Potential of Stockpiled Fly Ash. World of Coal Ash, 2015 Nashville, TN, USA. United Kingdom Quality Ash Association.
CEIC, China | Electricity Price | CEIC. Global Economic Data, Indicators, Charts & Forecasts [Online].Available at: https://www.ceicdata.com/en/china/electricity-price [Accessed March 5,2019].
Chen, C., Habert, G., Bouzidi, Y., Jullien, A. & Ventura, A. 2010. LCA allocation procedure used as an incitative method for waste recycling: An application to mineral additions in concrete. Resources, Conservation & Recycling, 54, 1231-1240. https://doi.org/10.1016/j.resconrec.2010.04.001
García-Segura, T., Yepes, V. & Alcalá, J. 2014. Life cycle greenhouse gas emissions of blended cement concrete including carbonation and durability. International journal of life cycle assessment, 19, 3-12. https://doi.org/10.1007/s11367-013-0614-0
Gursel, A. P. 2014. Life-Cycle Assessment of Concrete: Decision-Support Tool and Case Study Application.
Gursel, A. P. & Ostertag, C. P. 2016. Impact of Singapore's importers on life-cycle assessment of concrete. Journal of Cleaner Production, 118, 140-150. https://doi.org/10.1016/j.jclepro.2016.01.051
Habert, G., D’espinose De Lacaillerie, J. B. & Roussel, N. 2011. An environmental evaluation of geopolymer based concrete production: reviewing current research trends. Journal of Cleaner Production, 19, 1229-1238. https://doi.org/10.1016/j.jclepro.2011.03.012
Hossain, M. U., Poon, C. S., Lo, I. M. C. & Cheng, J. C. P. 2016. Comparative environmental evaluation of aggregate production from recycled waste materials and virgin sources by LCA. Resources, Conservation & Recycling, 109, 67-77. https://doi.org/10.1016/j.resconrec.2016.02.009
Ignacio, J. N., Víctor, Y. & José, V. M. 2018. Life Cycle Cost Assessment of Preventive Strategies Applied to Prestressed Concrete Bridges Exposed to Chlorides. Sustainability, 10, 845. https://doi.org/10.3390/su10030845
Journal Pre-proof

19
Knoeri, C., Sanyé-Mengual, E. & Althaus, H.-J. 2013. Comparative LCA of recycled and conventional concrete for structural applications. The International Journal of Life Cycle Assessment, 18, 909-918. https://doi.org/10.1007/s11367-012-0544-2
Kurda, R., Silvestre, J. D. & De Brito, J. 2018. Life cycle assessment of concrete made with high volume of recycled concrete aggregates and fly ash. Resources, Conservation & Recycling, 139, 407-417. https://doi.org/10.1016/j.resconrec.2018.07.004
Lambe, L. 2018. Ecocem Launch First UK Import Terminal [Online]. EcoCem. Available: https://www.ecocem.ie/ecocem-launch-first-uk-import-terminal/ [Accessed 20 December 2018].
López Gayarre, F., González Pérez, J., López-Colina Pérez, C., Serrano López, M. & López Martínez, A. 2016. Life cycle assessment for concrete kerbs manufactured with recycled aggregates. Journal of Cleaner Production, 113, 41-53. https://doi.org/10.1016/j.jclepro.2015.11.093
Maia De Souza, D., Lafontaine, M., Charron-Doucet, F., Chappert, B., Kicak, K., Duarte, F. & Lima, L. 2016. Comparative life cycle assessment of ceramic brick, concrete brick and cast-in-place reinforced concrete exterior walls. Journal of Cleaner Production, 137, 70-82. https://doi.org/10.1016/j.jclepro.2016.07.069
Marinković, S., Dragaš, J., Ignjatović, I. & Tošić, N. 2017. Environmental assessment of green concretes for structural use. Journal of Cleaner Production, 154, 633-649. https://doi.org/10.1016/j.jclepro.2017.04.015
Mccarthy, M. J., Jones, M. R., Zheng, L., Robl, T. L. & Groppo, J. G. 2013. Characterising long-term wet-stored fly ash following carbon and particle size separation. Fuel, 111, 430-441. https://doi.org/10.1016/j.fuel.2013.02.048
Mccarthy, M. J., Zheng, L., Dhir, R. K. & Tella, G. 2018. Dry-processing of long-term wet-stored fly ash for use as an addition in concrete. Cement and Concrete Composites, 92, 205-215. https://doi.org/10.1016/j.cemconcomp.2017.10.004
Menoufi, K. a. I. 2011. Life cycle analysis and life cycle impact assessment methodologies: a state of the art. In: Universitat De Lleida. Escola Politècnica, S., CASTELL, A. & CABEZA, L. F. (eds.).
Meyer, C. 2009. The greening of the concrete industry. Cement and Concrete Composites, 31, 601-605. https://doi.org/10.1016/j.cemconcomp.2008.12.010
Mohammadi, J. & South, W. 2017. Life cycle assessment (LCA) of benchmark concrete products in Australia. The International Journal of Life Cycle Assessment, 22, 1588-1608. https://doi.org/10.1007/s11367-017-1266-2
Müller, H. S., Haist, M. & Vogel, M. 2014. Assessment of the sustainability potential of concrete and concrete structures considering their environmental impact, performance and lifetime. Construction and Building Materials, 67, 321-337. https://doi.org/10.1016/j.conbuildmat.2014.01.039
O’brien, K., Ménaché, J. & O’moore, L. 2009. Impact of fly ash content and fly ash transportation distance on embodied greenhouse gas emissions and water consumption in concrete. The International Journal of Life Cycle Assessment, 14, 621-629. https://doi.org/10.1007/s11367-009-0105-5
Panesar, D., Seto, K. & Churchill, C. 2017. Impact of the selection of functional unit on the life cycle assessment of green concrete. The International Journal of Life Cycle Assessment, 22, 1969-1986. https://doi.org/10.1007/s11367-017-1284-0
Paoli, G. D. 2016. Crunching carbon | The dash for ash [Online]. New Civil Engineer. Available: https://www.newcivilengineer.com/crunching-carbon-the-dash-for-ash/10015486.article [Accessed 20 December 2018].
Rahla, K. M., Mateus, R. & Bragança, L. 2019. Comparative sustainability assessment of binary blended concretes using Supplementary Cementitious Materials (SCMs) and Ordinary Portland Cement (OPC). Journal of Cleaner Production, 220, 445-459. https://doi.org/10.1016/j.jclepro.2019.02.010
Journal Pre-proof

20
Robl, T. L., Groppo, J. G. & Rathbone, R. 2006. Pilot Demonstration of Technology for the Production of High Value Materials from the Ultra-Fine (PM 2.5) Fraction of Coal Combustion Ash. In: USDOE (ed.). University of Kentucky. https://doi:10.2172/949201.
Sagastume Gutiérrez, A., Cabello Eras, J. J., Gaviria, C. A., Van Caneghem, J. & Vandecasteele, C. 2017. Improved selection of the functional unit in environmental impact assessment of cement. Journal of Cleaner Production, 168, 463-473. https://doi.org/10.1016/j.jclepro.2017.09.007
Sayagh, S., Ventura, A., Hoang, T., François, D. & Jullien, A. 2010. Sensitivity of the LCA allocation procedure for BFS recycled into pavement structures. Resources, Conservation & Recycling, 54, 348-358. https://doi.org/10.1016/j.resconrec.2009.08.011
Seto, K. E., Churchill, C. J. & Panesar, D. K. 2017. Influence of fly ash allocation approaches on the life cycle assessment of cement-based materials. Journal of Cleaner Production, 157, 65-75. https://doi.org/10.1016/j.jclepro.2017.04.093
Statista, Germany: Electricity prices for households 2010-2018 | Statistic [Online]. Available at:https://www.statista.com/statistics/418078/electricity-prices-for-households-in-germany/ [Accessed March 5, 2019].
Tait, M. W. & Cheung, W. M. 2016. A comparative cradle-to-gate life cycle assessment of three concrete mix designs. https://doi.org/10.1007/s11367-016-1045-5
Teh, S. H., Wiedmann, T., Castel, A. & De Burgh, J. 2017. Hybrid life cycle assessment of greenhouse gas emissions from cement, concrete and geopolymer concrete in Australia. Journal of Cleaner Production, 152, 312-320. https://doi.org/10.1016/j.jclepro.2017.03.122
Thomas, M. 2007. Optimizing the use of fly ash in concrete. Portland Cement Association, Skokie, IL (United States).
Tucker, E. L., Ferraro, C. C., Laux, S. J. & Townsend, T. G. 2018. Economic and life cycle assessment of recycling municipal glass as a pozzolan in portland cement concrete production. Resources, Conservation & Recycling, 129, 240-247. https://doi.org/10.1016/j.resconrec.2017.10.025
Viñuales, J. E., Depledge, J., Reiner, D. M. & Lees, E. 2017. Climate policy after the Paris 2015 climate conference. Climate Policy, 17, 1-8. https://doi.org/10.1080/14693062.2016.1242060
Wang, S., Zhang, Y., Gu, Y., Wang, J., Liu, Z., Cao, Y., Romero, C. E. & Pan, W. P. 2016. Using modified fly ash for mercury emissions control for coal-fired power plant applications in China. Fuel, 181, 1230-1237. https://doi.org/10.1016/j.fuel.2016.02.043
Wu, P., Xia, B. & Zhao, X. 2014. The importance of use and end-of-life phases to the life cycle greenhouse gas (GHG) emissions of concrete – A review. Renewable and Sustainable Energy Reviews, 37, 360-369. https://doi.org/10.1016/j.rser.2014.04.070
UKPower, Gas & Electricity Tariff Prices per kWh. Why leaving the light on could be damaging your health [Online]. Available at: https://www.ukpower.co.uk/home_energy/tariffs-per-unit kwh [Accessed March 5, 2019].
Journal Pre-proof

21
List of Figures:
Figure 1: The boundary of the LCA study and OPC production process .....................................................................................6Figure 2: The boundary of the production process of (a) IFA, and (b) locally sourced and RFA.................................................7Figure 3: The impact of importing FA using EI-99 (L) and GWP (R) indicators with mass allocation..........................................9Figure 4: The impact of importing FA using the EI-99 (L) and GWP (R) indicators with economic allocation ..........................10Figure 5: Comparison of the Ecoinvent score for the original production process of FA between Germany and China .........11Figure 6: EI-99 Single score indicator (L) and GWP (R) of RFA vs OPC ......................................................................................12Figure 7: Sensitivity analysis of the allocation of different FA materials compared to OPC.....................................................13Figure 8: Sensitivity of importing FA to the UK to the transportation distances......................................................................15Figure 9: A Google maps image showing the radius of 3.57 tkm that can be covered by IFA to the UK..................................15Figure 10: Sensitivity of RFA to the different energy demands of processing methods of recovery using GWP 100 ..............16
List of tables:
Table 1: BS EN 450-1 requirements for FA to replace cement based on Carroll (2015).............................................................6Table 2: The country of origin and transportation distances for the materials included in the study .......................................6Table 3: A summary of the allocation scenarios for all materials included in the study ............................................................8
Journal Pre-proof

Declaration of interests
☒ The authors declare that they have no known competing financial interests or personal relationships that could have appeared to influence the work reported in this paper.
☐The authors declare the following financial interests/personal relationships which may be considered as potential competing interests:
Journal Pre-proof

1
Comparative life cycle assessment between imported and recovered fly ash for blended
cement concrete in the UK
Hisham Hafez1*, Rawaz Kurda2,3, Wai Ming Cheung1, Brabha Nagaratnam1
1Department of Mechanical and Construction Engineering. University of Northumbria. Newcastle upon Tyne, UK
2CERIS, Civil Engineering, Architecture and Georesources Department, Instituto Superior Técnico, Universidade de Lisboa, Av.
Rovisco Pais, 1049-001 Lisbon, Portugal
3Department of Civil Engineering, Technical Engineering College, Erbil Polytechnic University, Erbil, Kurdistan-Region, Iraq
*Corresponding author. Tel.: +44 7493280699
E-mail address: [email protected]
Keywords: Blended cement, supplementary cementitious materials, Life Cycle Assessment, Recovered
fly ash, Imported fly ash
Highlights Life Cycle Assessment tool to analyse the environmental impact of importing and recovering fly
ash from different countries; Environmental impact of importing fly ash from Germany and China, and recovering landfilled
fly ash in the United Kingdom; Optimum solution for importing and recovering landfilling fly ash.
Journal Pre-proof