Comparative Life Cycle Assessment (LCA) of passenger seats and their impact on different vehicle...
21
Int. J. Vehicle Design, Vol. 53, Nos. 1/2, 2010 89 Copyright © 2010 Inderscience Enterprises Ltd. Comparative Life Cycle Assessment (LCA) of passenger seats and their impact on different vehicle models Aleksandar Subic*, Francesco Schiavone, Martin Leary and Jack Manning School of Aerospace, Mechanical and Manufacturing Engineering, RMIT University, Melbourne, Victoria 3803, Australia E-mail: [email protected] E-mail: [email protected] E-mail: [email protected] *Corresponding author Abstract: The main purpose of Life Cycle Assessment (LCA) to date has been to evaluate life cycle impacts of different design solutions and materials for a car, its sub-systems and components. Considerable number of publications are available on LCA of automotive components. This research aims to extend the LCA approach by evaluating and comparing the effects of mass reduction of passenger seats for different vehicle models in order to provide strategic support for decision making in the development process and to validate the environmental benefits of design alternatives under investigation. For this purpose, the paper presents a comprehensive LCA of passenger seats with detailed consideration of alternative scenarios for the use phase for different vehicle models. Keywords: LCA; life cycle assessment; use phase; mass reduction; passenger seat; vehicle design. Reference to this paper should be made as follows: Subic, A., Schiavone, F., Leary, M. and Manning, J. (2010) ‘Comparative Life Cycle Assessment (LCA) of passenger seats and their impact on different vehicle models’, Int. J. Vehicle Design, Vol. 53, Nos. 1/2, pp.89–109. Biographical notes: Aleksandar Subic is the Head of School of Aerospace, Mechanical and Manufacturing Engineering at RMIT University in Melbourne, Australia. He is also at present Director of SAE-A and Education Director of AutoCRC. He has over 20 years of active involvement in design research with particular focus in recent years on sustainable design and green car technologies. He has published over 200 international peer reviewed journal articles, book chapters and books, and conference papers and has undertaken a wide range of high impact research projects in collaboration with industry. He is the Chair of the International Conference series on Sustainable Automotive Technologies and Editor-in-Chief of the International Journal of Sustainable Design. Francesco Schiavone is a Senior Research Fellow at RMIT University in Melbourne, Australia. He has completed his PhD at University of Florence, Italy in collaboration with Rieter focusing on sustainable design strategies
Transcript of Comparative Life Cycle Assessment (LCA) of passenger seats and their impact on different vehicle...
Int. J. Vehicle Design, Vol. 53, Nos. 1/2, 2010 89
Copyright © 2010 Inderscience Enterprises Ltd.
Comparative Life Cycle Assessment (LCA) of passenger seats and their impact on different vehicle models
Aleksandar Subic*, Francesco Schiavone, Martin Leary and Jack Manning School of Aerospace, Mechanical and Manufacturing Engineering, RMIT University, Melbourne, Victoria 3803, Australia E-mail: [email protected] E-mail: [email protected] E-mail: [email protected] *Corresponding author
Abstract: The main purpose of Life Cycle Assessment (LCA) to date has been to evaluate life cycle impacts of different design solutions and materials for a car, its sub-systems and components. Considerable number of publications are available on LCA of automotive components. This research aims to extend the LCA approach by evaluating and comparing the effects of mass reduction of passenger seats for different vehicle models in order to provide strategic support for decision making in the development process and to validate the environmental benefits of design alternatives under investigation. For this purpose, the paper presents a comprehensive LCA of passenger seats with detailed consideration of alternative scenarios for the use phase for different vehicle models.
Keywords: LCA; life cycle assessment; use phase; mass reduction; passenger seat; vehicle design.
Reference to this paper should be made as follows: Subic, A., Schiavone, F., Leary, M. and Manning, J. (2010) ‘Comparative Life Cycle Assessment (LCA) of passenger seats and their impact on different vehicle models’, Int. J. Vehicle Design, Vol. 53, Nos. 1/2, pp.89–109.
Biographical notes: Aleksandar Subic is the Head of School of Aerospace, Mechanical and Manufacturing Engineering at RMIT University in Melbourne, Australia. He is also at present Director of SAE-A and Education Director of AutoCRC. He has over 20 years of active involvement in design research with particular focus in recent years on sustainable design and green car technologies. He has published over 200 international peer reviewed journal articles, book chapters and books, and conference papers and has undertaken a wide range of high impact research projects in collaboration with industry. He is the Chair of the International Conference series on Sustainable Automotive Technologies and Editor-in-Chief of the International Journal of Sustainable Design.
Francesco Schiavone is a Senior Research Fellow at RMIT University in Melbourne, Australia. He has completed his PhD at University of Florence, Italy in collaboration with Rieter focusing on sustainable design strategies

90 A. Subic et al.
and practices. He is actively involved in Life Cycle Assessment (LCA) research and application within the automotive industry sector and has published a number of journal articles and conference papers in this field. His research work has led to a number of innovations in automotive technologies resulting in patent submissions.
Martin Leary is a Senior Lecturer in Mechanical and Automotive Design at RMIT University in Melbourne, Australia. He has completed his PhD at the University of Melbourne focusing on lightweight automotive materials and structures. He is actively involved with the automotive industry in research leading to alternative lightweight automotive actuators and structures and has published over 20 international peer reviewed papers in this field and has co-authored a book on Sustainable Automotive Technologies.
Jack Manning is an Honours graduate in Mechanical Engineering at RMIT University in Melbourne, Australia. He has conducted a comprehensive Life Cycle Assessment of vehicle passenger seats within his Honours research project in collaboration with the car seat manufacturer. This work has enabled him to establish a benchmark of environmental indicators for this particular automotive technology.
1 Introduction
The Life Cycle Assessment (LCA) method has been used by the automotive industry sector over the years to evaluate life cycle implications of different design solutions for a particular car model, its sub-systems and components. Although a considerable amount of published research is available on LCA of automotive components (including standard guidelines and legislations) (Ridge, 1997; Finkbeiner et al., 2001; Ribeiro and Ferreira, 2007), it is still not fully understood how different design solutions may affect different vehicle platforms in terms of their respective environmental impacts. This type of deeper, more general understanding is required if particular life cycle design strategies are to be articulated and implemented effectively in different vehicle models.
Determining and reducing the environmental impact of vehicles is of paramount importance in sustainable vehicle design. This requires a comprehensive, quantitative, life-cycle approach. Encompassing more than ‘well-to-wheels’, the analysis needs to include the:
• extraction of all raw materials required for production
• fuel production
• infrastructure requirements
• component manufacture
• vehicle use
• end-of-life phases of the vehicle.
A general simplified life cycle of a passenger vehicle is shown in Figure 1 based on Hendrickson et al. (2006)

Comparative Life Cycle Assessment (LCA) 91
Figure 1 Simplified life cycle analysis of a passenger vehicle (see online version for colours)
Almost 80% of the environmental impact of passenger vehicles is attributed to the vehicle use (operation) phase of the life cycle. This is due, primarily, to fuel consumption and relates directly to the weight of the vehicle, with the load being transported included. Therefore, much of the effort towards the reduction of the environmental impact of vehicles is typically focused on the reduction of fuel consumption (by tinkering with aerodynamic properties, rolling resistance/friction, weight), use of renewable materials, reduction of weight, hazardous substance restriction and recycling.
Life Cycle Assessment (LCA) addresses the environmental aspects and potential environmental impacts (e.g., use of resources and environmental consequences of releases) throughout the vehicle’s life cycle from ‘cradle-to-grave’. There are four main phases in an LCA study, as follows:
• goal and scope definition phase
• inventory analysis phase
• impact assessment phase
• interpretation phase.
Interpretation of LCA results may lead to particular design improvement strategies, strategic planning of new vehicle development, policy making, marketing and others.
This research aims to extend the LCA approach by using this method to evaluate and compare the effects of weight reduction associated with passenger seat design on different vehicle platforms in order to provide strategic support for decision making in the development process and to validate the environmental benefits of the design

92 A. Subic et al.
alternatives under investigation. The LCA is used here to investigate the life cycle of a car seat currently implemented in a wide range of vehicle platforms in the Australian market. Of particular interest in this paper are the effects of the car seat design on the environmental performance of different vehicle platforms, especially in terms of the vehicle use phase. For this purpose, firstly, the LCA of a reference car seat will be presented followed by detailed analysis of alternative scenarios for modelling of the vehicle use phase.
2 Reference product system: car seat
2.1 Goal and scope definition
The goal of the research is to identify viable strategies and options for improving the environmental performance of car seats, by:
• assessing the current design throughout the complete life cycle
• evaluating the corresponding environmental impacts
• identifying the key environmental design parameters
• verifying which phase and component is contributing the most.
The intended audience is represented by the product engineers and designers involved in seat design in the company, as well as the researchers involved in the LCA activities. The scope needs to address the following specific questions:
• What are the quantifiable environmental impacts of a car seat over its life cycle?
• What are the relative environmental contributions of each life cycle phase?
• What are the relative environmental contributions of the seat sub-assemblies?
• What sensitivities do environmental impact categories have towards variance in weight and towards material selection and end-of-life scenarios?
• What design directions could lead to an improved environmental performance of an automotive seat?
The reference product system represented in this study is a base automotive front seat assembly including the seat track assembly with manual fore-aft adjustment mechanism, the cushion frame assembly and the seat back assembly. No alternative seat assembly will be analysed, whereby a comparison of different scenarios for the use phase will, instead, be performed.
The functional unit is defined as follows: a basic automotive seat with full track, cushion and back assemblies, manual fore/aft adjustment, manual inclination adjustment and lumbar adjustment. This vehicle seat will have a nominal use life of 200,000 km. The reference seat can be easily fitted (given some minimal changes in design) into two selected Australian vehicles. The relevant information about these models is given in Table 1. The vehicle chosen for the reference scenario is Vehicle A.
Comparative Life Cycle Assessment (LCA) 93
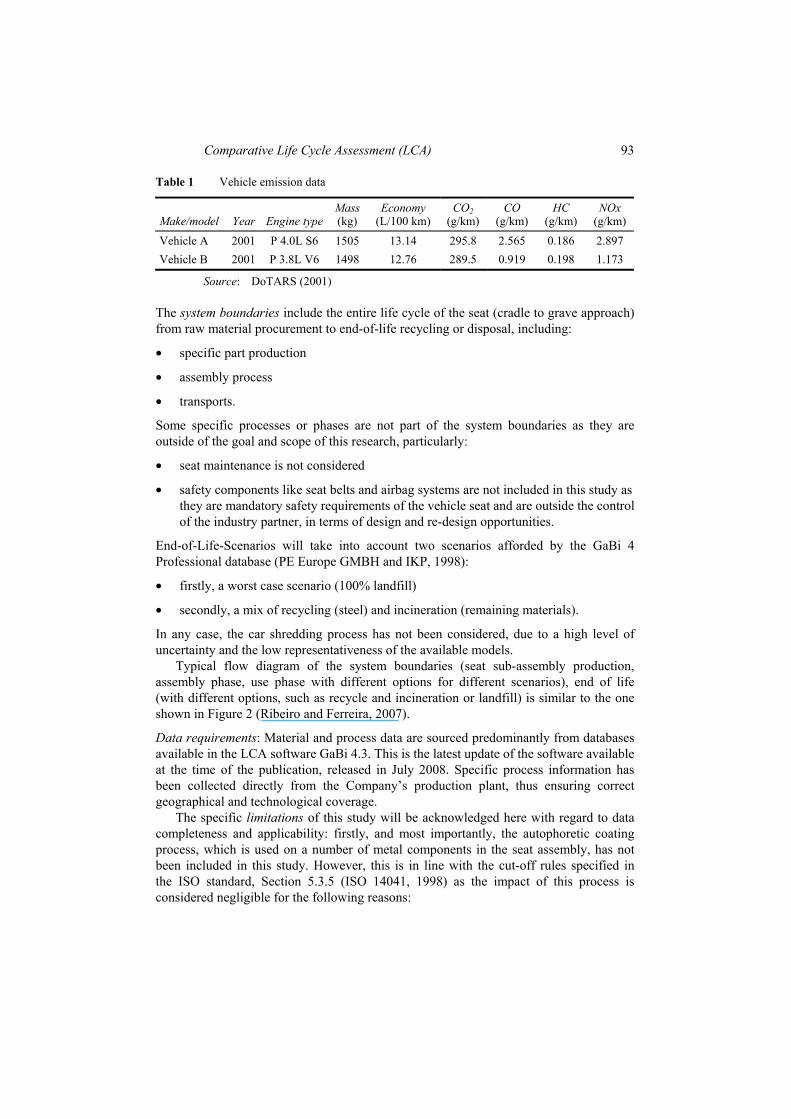
Table 1 Vehicle emission data
Make/model Year Engine type Mass (kg)
Economy (L/100 km)
CO2 (g/km)
CO (g/km)
HC (g/km)
NOx (g/km)
Vehicle A 2001 P 4.0L S6 1505 13.14 295.8 2.565 0.186 2.897 Vehicle B 2001 P 3.8L V6 1498 12.76 289.5 0.919 0.198 1.173
Source: DoTARS (2001)
The system boundaries include the entire life cycle of the seat (cradle to grave approach) from raw material procurement to end-of-life recycling or disposal, including:
• specific part production
• assembly process
• transports.
Some specific processes or phases are not part of the system boundaries as they are outside of the goal and scope of this research, particularly:
• seat maintenance is not considered
• safety components like seat belts and airbag systems are not included in this study as they are mandatory safety requirements of the vehicle seat and are outside the control of the industry partner, in terms of design and re-design opportunities.
End-of-Life-Scenarios will take into account two scenarios afforded by the GaBi 4 Professional database (PE Europe GMBH and IKP, 1998):
• firstly, a worst case scenario (100% landfill)
• secondly, a mix of recycling (steel) and incineration (remaining materials).
In any case, the car shredding process has not been considered, due to a high level of uncertainty and the low representativeness of the available models.
Typical flow diagram of the system boundaries (seat sub-assembly production, assembly phase, use phase with different options for different scenarios), end of life (with different options, such as recycle and incineration or landfill) is similar to the one shown in Figure 2 (Ribeiro and Ferreira, 2007).
Data requirements: Material and process data are sourced predominantly from databases available in the LCA software GaBi 4.3. This is the latest update of the software available at the time of the publication, released in July 2008. Specific process information has been collected directly from the Company’s production plant, thus ensuring correct geographical and technological coverage.
The specific limitations of this study will be acknowledged here with regard to data completeness and applicability: firstly, and most importantly, the autophoretic coating process, which is used on a number of metal components in the seat assembly, has not been included in this study. However, this is in line with the cut-off rules specified in the ISO standard, Section 5.3.5 (ISO 14041, 1998) as the impact of this process is considered negligible for the following reasons:

94 A. Subic et al.
• the material input is minimal
• is 100% free of Volatile Organic Compounds (VOC) and meets all European Clean Air Legislation
• contains no heavy metal anticorrosive pigments, and does not require heavy metal based pre-treatments, therefore the complete process does not contain chrome, strontium, zinc manganese or nickel at all
• is not based on electrical shielding (as a typical coating process is), this means that low energy is required.
Most of the data relating to materials and processes that have not been obtained directly from the company plant are sourced from the GaBi 4 Professional database: the information provided by the datasets is mostly related to European sources and is not necessarily entirely representative of the Australian scenario. Nevertheless, particular attention has been paid in order to guarantee the same level of technology and high representativeness of the model. Moreover, all process units using electric power are connected to the dataset of the Australian power grid mix, thus strengthening the geographical coverage of the model itself.
Figure 2 System boundaries of the main processes within the reference scenario

Comparative Life Cycle Assessment (LCA) 95
A bottom-up approach has been used to perform the LCA in this research: a detailed model of every sub-assembly and component has been created, following cut-off rules and assumptions in line with the ISO standards. A summary of the inventory for the manufacturing phase is given in Table 2.
The automotive industry is generally in agreement over the environmental impact category selection, which is reflected in the consistency of result presentation in several papers (Schmidt, 2004; Schmidt and Taylor, 2006). Typically, this choice is driven by the emissions related to the vehicle manufacturing and use phase; however, other factors, including hard and chemical waste, also play important roles. The impact categories considered include (Centre of Environmental Science (CML), 1992): Global Warming Potential (GWP) with units kg CO2 equiv, Photochemical Ozone Creation Potential (POCP) with units kg ethene equiv, Acidification Potential (AP) with units kg SO2 equiv, Eutrophication Potential (EP) with units kg phosphate equiv and Abiotic Resource Depletion Potential (ADP) with units kg Sb equiv. In accordance with ISO14042 (ISO 14042, 2000) for documents intended for public use, no weighting has been applied to the results presented in this paper.
Table 2 Data sources for the manufacturing phase
Process unit Main source of data
Steel production GaBi 4 professional and extension databases Steel processing Futuris automotive interiors All plastic production: ABS, polypropylene, nylon, POM and polyurethane foam
GaBi Plastics Europe database
Plastics injection moulding processes Futuris + local tier 1 suppliers Cooling water usage Futuris + local tier 1 suppliers Energy consumption for seat assembly Futuris + local tier 1 suppliers Transport between suppliers and Futuris + Transport to car manufacturer
Futuris + local tier 1 and tier 2 suppliers
Metal surface treatments GaBi 4 professional and extension databases Electric power for all process units GaBi 4 – Australian power grid mix MIG welding Futuris + local tier 1 suppliers + GaBi 4
2.2 LCA results for a reference scenario
Relevant results of LCA for the selected reference scenario are illustrated in Figures 3–10.
The breakdown of phase contribution in most impact categories is dominated by the use phase, registering values between 75% and 90% of total life cycle impact. The manufacturing phase registered values between 10% and 20% of the total. End of life scenario effects accounted for less than 1% of total impact in most landfill categories, and less than 2% of total when a recycle/incineration approach was applied. Exceptions for the end-of-life scenarios were EP in the land fill scenario where ELV was almost 10% of the total life cycle value, and GWP in the recycle/incineration scenario where ELV secured just under 6% of the total life cycle.

96 A. Subic et al.
Figure 3 Reference model, complete life cycle, landfill option for end of life (see online version for colours)
Figure 4 Reference model, complete life cycle, recycle and incineration option for end of life (see online version for colours)
Figure 5 Reference model, contribution of different sub-assemblies, landfill option for end of life (see online version for colours)
Comparative Life Cycle Assessment (LCA) 97
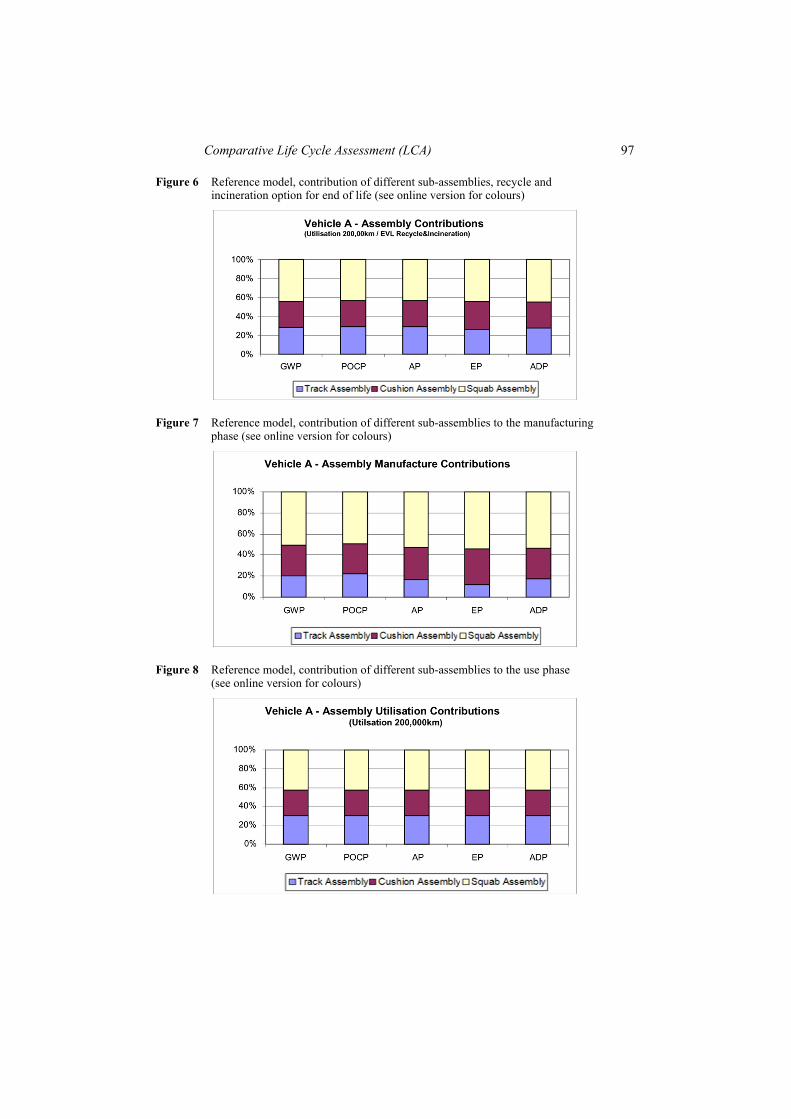
Figure 6 Reference model, contribution of different sub-assemblies, recycle and incineration option for end of life (see online version for colours)
Figure 7 Reference model, contribution of different sub-assemblies to the manufacturing phase (see online version for colours)
Figure 8 Reference model, contribution of different sub-assemblies to the use phase (see online version for colours)

98 A. Subic et al.
Figure 9 Reference model, contribution of different sub-assemblies to the end of life phase – landfill (see online version for colours)
Figure 10 Reference model, contribution of different sub-assemblies to the end of life phase – recycle and incineration (see online version for colours)
When looking at the sub-assembly contributions for the same base model (for both landfill and recycle/incineration ELV scenarios (Figures 5 and 6), overall life cycle contributions in a majority of categories were divided fairly closely with weight contribution (track assembly a little under 30%, cushion assembly about 30% and seat back assembly a little over 40%). This trend is continued into the use phase, where the impact of each sub-assembly correlates directly to its mass (Figure 8). The manufacturing and end-of-life (landfill scenario) phases see deviations away from this trend (Figures 7 and 9). In both of these phases, reductions in the impact of the seat track assembly are registered in the bulk of impact categories and this is compensated for by proportional additions to seat cushion and seat back assembly impacts. The end-of-life (recycle/incineration) phase gives a higher relative reading for the seat track assembly, especially in the ADP impact category, just under 40% of the total (Figure 10).
Comparative Life Cycle Assessment (LCA) 99
3 Modelling the vehicle use phase
3.1 Theoretical background
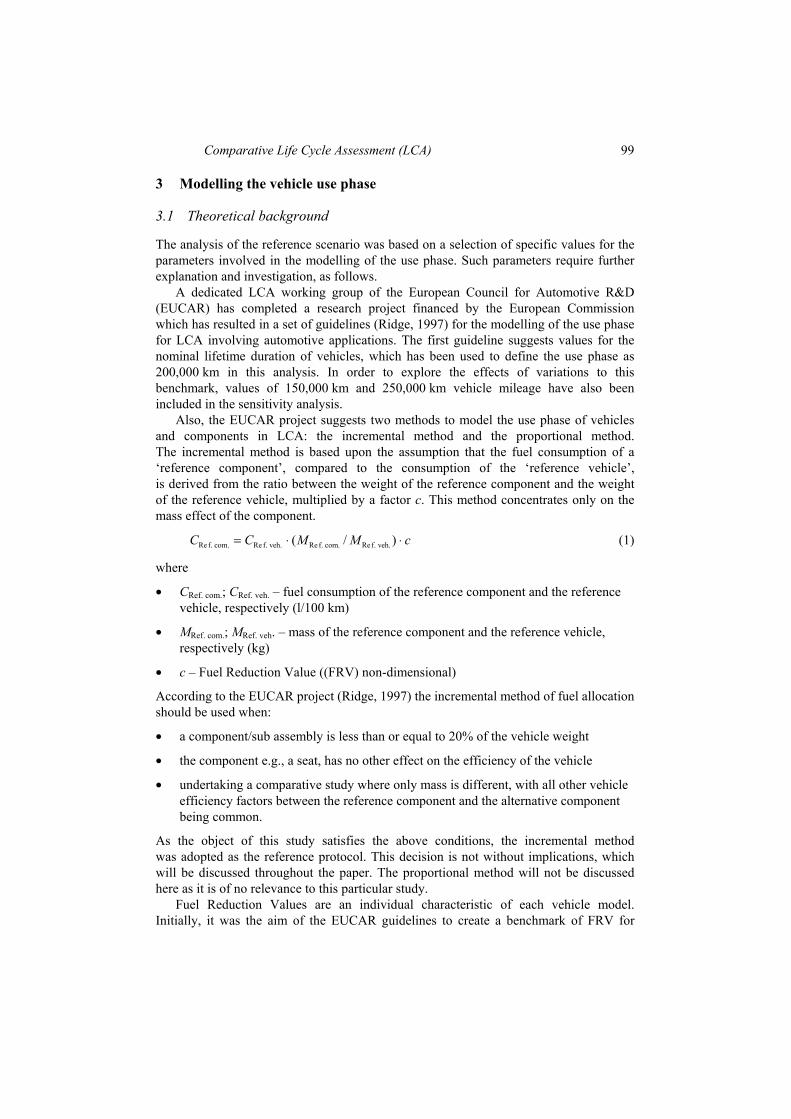
The analysis of the reference scenario was based on a selection of specific values for the parameters involved in the modelling of the use phase. Such parameters require further explanation and investigation, as follows.
A dedicated LCA working group of the European Council for Automotive R&D (EUCAR) has completed a research project financed by the European Commission which has resulted in a set of guidelines (Ridge, 1997) for the modelling of the use phase for LCA involving automotive applications. The first guideline suggests values for the nominal lifetime duration of vehicles, which has been used to define the use phase as 200,000 km in this analysis. In order to explore the effects of variations to this benchmark, values of 150,000 km and 250,000 km vehicle mileage have also been included in the sensitivity analysis.
Also, the EUCAR project suggests two methods to model the use phase of vehicles and components in LCA: the incremental method and the proportional method. The incremental method is based upon the assumption that the fuel consumption of a ‘reference component’, compared to the consumption of the ‘reference vehicle’, is derived from the ratio between the weight of the reference component and the weight of the reference vehicle, multiplied by a factor c. This method concentrates only on the mass effect of the component.
Re f. com. Re f. veh. Re f. com. Re f. veh.( / )C C M M c= ⋅ ⋅ (1)
where
• CRef. com.; CRef. veh. – fuel consumption of the reference component and the reference vehicle, respectively (l/100 km)
• MRef. com.; MRef. veh. – mass of the reference component and the reference vehicle, respectively (kg)
• c – Fuel Reduction Value ((FRV) non-dimensional)
According to the EUCAR project (Ridge, 1997) the incremental method of fuel allocation should be used when:
• a component/sub assembly is less than or equal to 20% of the vehicle weight
• the component e.g., a seat, has no other effect on the efficiency of the vehicle
• undertaking a comparative study where only mass is different, with all other vehicle efficiency factors between the reference component and the alternative component being common.
As the object of this study satisfies the above conditions, the incremental method was adopted as the reference protocol. This decision is not without implications, which will be discussed throughout the paper. The proportional method will not be discussed here as it is of no relevance to this particular study.
Fuel Reduction Values are an individual characteristic of each vehicle model. Initially, it was the aim of the EUCAR guidelines to create a benchmark of FRV for

100 A. Subic et al.
small, medium and large cars. However, the data gathered from the nine major industry participants could provide no such conclusions. This result was somewhat solidified by a later BMW study, concluding that:
“Neither between gasoline nor diesel powered vehicles could be established any dependency of reduction of fuel consumption on the absolute weight of the considered vehicle, its power or the specific power-to-weight ratio.” (Eberle and Franze, 1998)
Weight reduction has two positive effects on the vehicle: firstly, a reduction in fuel consumption; secondly, a subsequent improvement in performance. Another parameter often considered in fuel reduction studies is a modified transmission ratio. Lengthening of this ratio has a positive effect on fuel consumption, yet it negatively affects performance. A combination of these two, reduction in weight balanced with lengthening of transmission ratio, in specific amounts, can result in performance characteristics similar to the original. This combination creates a two-fold fuel reduction effect. Table 3 shows the calculated FRV’s across a BMW vehicle range against weight, with and without lengthening of the transmission ratio.
Table 3 BMW vehicle range – FRV
Fuel Consumption Reduction Coefficient FRC (setting off cold) [(ltr/(100 kg ⋅ 100 km)]
Without modification ira With modification ira
Model
Vehicle weight
(kg) Power (kW)
Specific power-to-weight
ratio (kg/kW) NEDC Econom. Sport. NEDC Econom. Sport.
316i 1335 75 17.8 0.134 0.145 0.166 0.343 0.361 0.457
318i 1335 85 15.7 0.139 0 144 0.178 0.377 0.400 0.467
320i 1400 110 12.7 0.124 0.131 0.206 0.426 0.412 0.556
323i 1410 125 11.3 0.133 0.139 0.200 0.394 0.407 0.500
328i 1420 142 10.0 0.116 0.135 0.219 0.440 0.392 0.553
520i 1510 110 13.7 0.126 0.123 0.203 0.379 0.360 0.513
523i 1520 125 12.2 0.119 0.113 0.186 0.363 0.370 0.502
528i 1560 142 11.0 0.134 0.141 0.235 0.409 0.346 0.510
535i 1660 173 9.7 0.073 0.102 0.179 0.384 0.383 0.488
540i 1705 210 3.1 0.049 0.084 0.162 0.481 0.441 0.579
728i 1810 142 12.7 0.135 0.119 0.196 0.383 0.349 0.470
735i 1865 173 13.8 0.107 0.117 0.194 0.375 0.369 0.446
T40i 1920 210 9.1 0.061 0.093 0.194 0.447 0.403 0.552
318 tds 1360 66 20.0 0.118 0.139 V < Vmax 0.330 0.388 V < Vmax
525 tds 1560 105 15.0 0.120 0.120 0.180 0.301 0.316 0.457
725 tds 1845 105 17.0 0.138 0.132 0.165 0.290 0.301 0.428
Source: Eberle and Franze (1998)
When only vehicle weight was considered, the data included in the EUCAR study indicated a range of FRV values from 0.02 to 0.5. With such a result spread it is hardly a surprise that conclusions saw fit to comment on the ‘quality and spread’ representing an

Comparative Life Cycle Assessment (LCA) 101
inadequate refinement of the control group. The EUCAR partners recommended a FRV of 0.6 as representative for most automotive LCA studies, with no reference to the method to used. As in this case the incremental method is used, a value of 0.30 was selected, be close to the average value.
3.2 Australian fleet scenario and selection of use phase parameters
As no simple correlation between FRV and overall vehicle mass has been established (Eberle and Franze, 1998), such a correlation for Australian and US vehicles has been investigated, in order to get an idea of the order of magnitude of the difference between FRV available from the literature (mostly provided by European car manufacturers) and the average vehicle currently on the roads in Australia and USA, which are considerably different from the European scenario.
The relationship has been quantified based on publicly available United States Environmental Protection Agency (US-EPA) fuel efficiency data. The strategies applied to fuel consumption of Australian vehicles (Standards Australia, 1986) are derived from the US-EPA protocols; the US-EPA fuel efficiency data was modified to represent the mean fuel consumption of Australian vehicles by the application of an empirical correction factor (Department of Primary Industries and Energy, 1996). The analysis defined a correlation of 0.7 between fuel consumption and overall vehicle mass (Figure 11). This is in line with the value of 0.6 recommended by the EUCAR study.
Figure 11 Average fuel consumption vs. vehicle mass for US vehicles available in 2001
Source: Leary (2006)
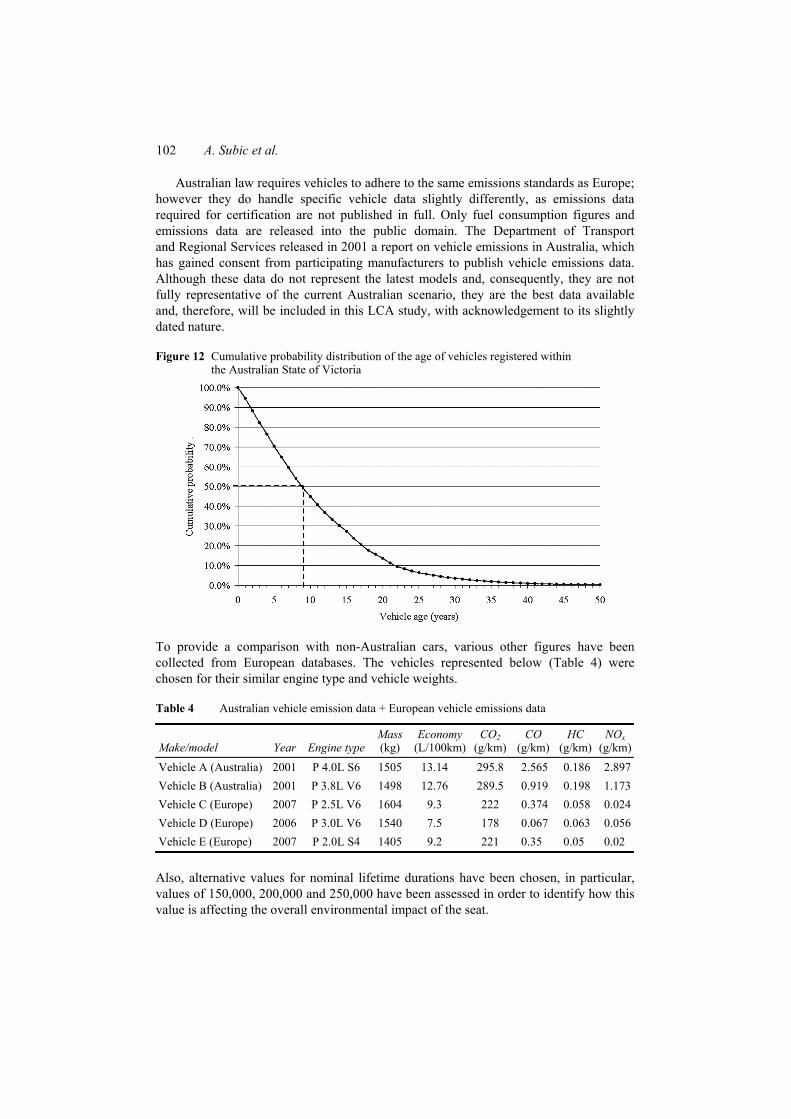
To better understand the Australian scenario, an extensive literature review has been performed on Australian vehicle service-life, providing no robust outcome. To overcome this impediment, vehicle registration data were obtained to provide a cumulative probability distribution of the age of vehicles registered in the Australian State of Victoria (Figure 12). The associated vehicle age for a cumulative probability of 50% is 8.8 years.
102 A. Subic et al.
Australian law requires vehicles to adhere to the same emissions standards as Europe; however they do handle specific vehicle data slightly differently, as emissions data required for certification are not published in full. Only fuel consumption figures and emissions data are released into the public domain. The Department of Transport and Regional Services released in 2001 a report on vehicle emissions in Australia, which has gained consent from participating manufacturers to publish vehicle emissions data. Although these data do not represent the latest models and, consequently, they are not fully representative of the current Australian scenario, they are the best data available and, therefore, will be included in this LCA study, with acknowledgement to its slightly dated nature.
Figure 12 Cumulative probability distribution of the age of vehicles registered within the Australian State of Victoria
To provide a comparison with non-Australian cars, various other figures have been collected from European databases. The vehicles represented below (Table 4) were chosen for their similar engine type and vehicle weights.
Table 4 Australian vehicle emission data + European vehicle emissions data
Make/model Year Engine typeMass (kg)
Economy (L/100km)
CO2 (g/km)
CO (g/km)
HC (g/km)
NOx (g/km)
Vehicle A (Australia) 2001 P 4.0L S6 1505 13.14 295.8 2.565 0.186 2.897 Vehicle B (Australia) 2001 P 3.8L V6 1498 12.76 289.5 0.919 0.198 1.173 Vehicle C (Europe) 2007 P 2.5L V6 1604 9.3 222 0.374 0.058 0.024 Vehicle D (Europe) 2006 P 3.0L V6 1540 7.5 178 0.067 0.063 0.056 Vehicle E (Europe) 2007 P 2.0L S4 1405 9.2 221 0.35 0.05 0.02
Also, alternative values for nominal lifetime durations have been chosen, in particular, values of 150,000, 200,000 and 250,000 have been assessed in order to identify how this value is affecting the overall environmental impact of the seat.
Comparative Life Cycle Assessment (LCA) 103
3.3 Summary of results for different scenarios across complete life cycle
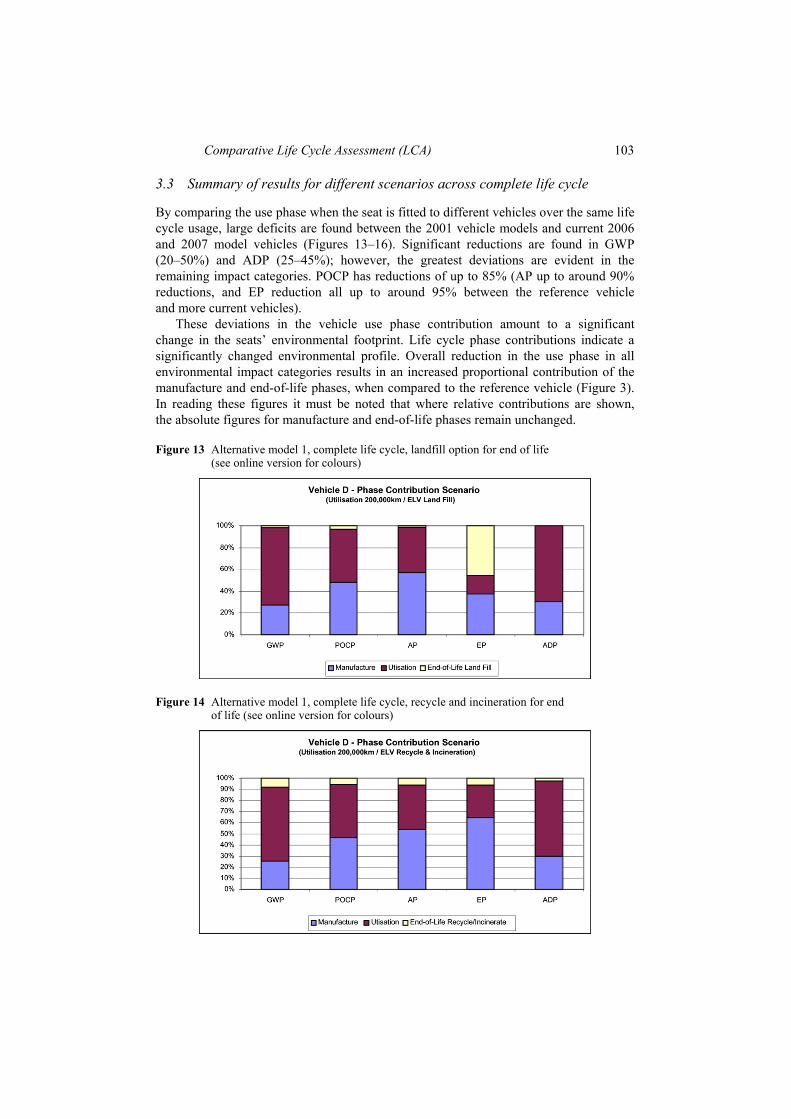
By comparing the use phase when the seat is fitted to different vehicles over the same life cycle usage, large deficits are found between the 2001 vehicle models and current 2006 and 2007 model vehicles (Figures 13–16). Significant reductions are found in GWP (20–50%) and ADP (25–45%); however, the greatest deviations are evident in the remaining impact categories. POCP has reductions of up to 85% (AP up to around 90% reductions, and EP reduction all up to around 95% between the reference vehicle and more current vehicles).
These deviations in the vehicle use phase contribution amount to a significant change in the seats’ environmental footprint. Life cycle phase contributions indicate a significantly changed environmental profile. Overall reduction in the use phase in all environmental impact categories results in an increased proportional contribution of the manufacture and end-of-life phases, when compared to the reference vehicle (Figure 3). In reading these figures it must be noted that where relative contributions are shown, the absolute figures for manufacture and end-of-life phases remain unchanged.
Figure 13 Alternative model 1, complete life cycle, landfill option for end of life (see online version for colours)
Figure 14 Alternative model 1, complete life cycle, recycle and incineration for end of life (see online version for colours)
104 A. Subic et al.
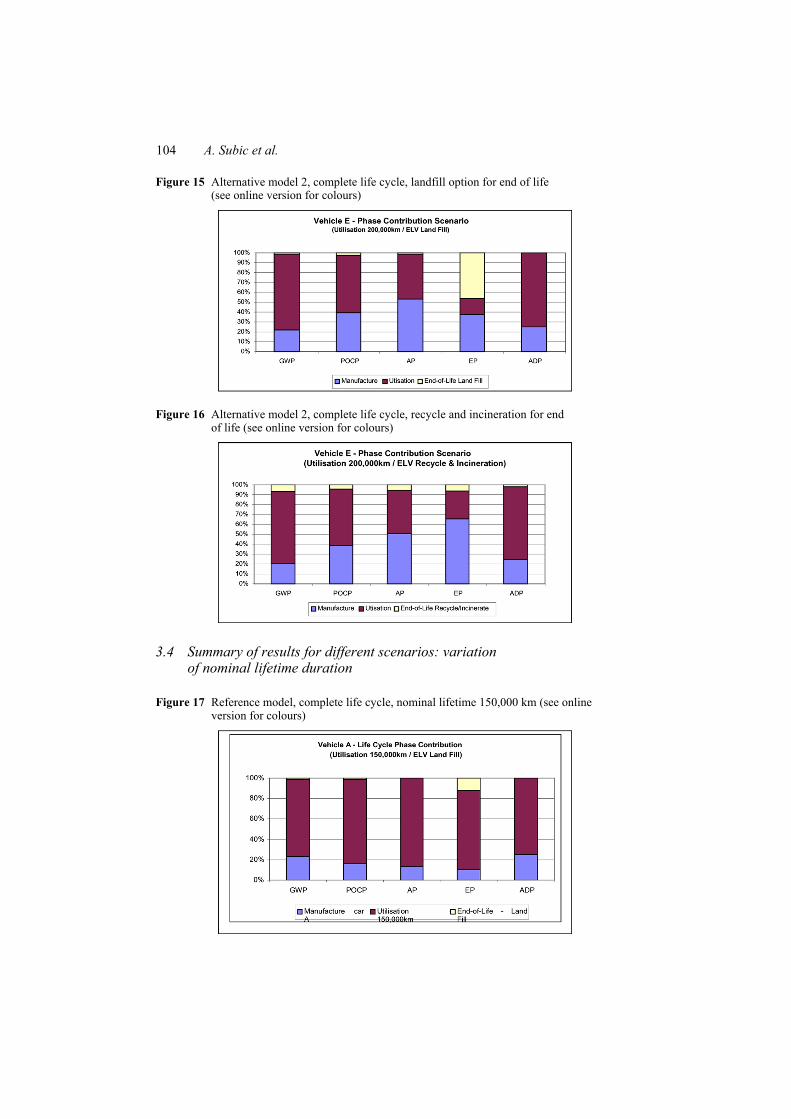
Figure 15 Alternative model 2, complete life cycle, landfill option for end of life (see online version for colours)
Figure 16 Alternative model 2, complete life cycle, recycle and incineration for end of life (see online version for colours)
3.4 Summary of results for different scenarios: variation of nominal lifetime duration
Figure 17 Reference model, complete life cycle, nominal lifetime 150,000 km (see online version for colours)

Comparative Life Cycle Assessment (LCA) 105
Figure 18 Reference model, complete life cycle, nominal lifetime 250,000 km (see online version for colours)
Figure 19 Alternative model 1, complete life cycle, nominal lifetime 150,000 km (see online version for colours)
Figure 20 Alternative model 1, complete life cycle, nominal lifetime 250,000 km (see online version for colours)

106 A. Subic et al.
4 Discussion of results
The reference scenario (Figure 3) indicates that the impact of the vehicle use phase is highly dominant. This suggests that reducing the weight should be a priority, even if subsequent energy intensive materials, manufacturing and recycling processes are involved. Typical examples of this include substitution of steel with aluminium or magnesium or composites options in structural components of the seat. Here, one must recall that the initial base scenario uses data for a 2001 model of Vehicle A (a vehicle that this base seat has in the past been fitted to). However, looking at the variance between use phase impacts when the seat is ‘coupled’ with different vehicles the above case becomes less clear. In fact, equation (1) (see Section 3.1) shows that the incremental method for allocating the fuel consumption and subsequent emissions of a component are proportional to the vehicle fuel consumption, to the component mass, and the FRV. As in each case of the FRV, the component (seat) mass, and the nominal lifetime duration (200,000 km) remain constant, there are three variables affecting the variation in impact between each vehicle: vehicle mass, vehicle fuel consumption, and vehicle emission values. The following effects should be noted here:
1 If all other variables are held constant, the emissions allocated to the seat will decay following a hyperbolic trend as vehicle mass increases:
1Seat_Allocated_Consumption ;Vehicle_Mass
µ
2 A better vehicle fuel economy will result in linear decrease in the allocated seat impact.
These two changes in parameter values will both influence the impact in the same way. The third variable to be added to this equation is the emission statistics specific to each of the vehicles considered in the analysis. These vehicles were chosen for their relative closeness in mass to the Vehicle A and Vehicle B, and because they belong to the same class of vehicles. The mass of all vehicles deviate no more than 7% from total base vehicle mass. The fuel consumption figures, instead, are between 30% and 44% lower than the initial base scenario. It is the emission figures, however, that differ most markedly between 2001 model vehicles and the current models under investigation. For example carbon monoxide emissions for Vehicle D are around 38 times smaller, that is, 2.6% of those put out by Vehicle A (Table 1). In any given vehicle scenario and impact category it is a combination of all three factors that result in different outcomes.
In the case of GWP the combined effects of weight and fuel consumption alone correlate very closely with the respective vehicle GWP figures. This is not unexpected as there is a direct stoichiometric link between the fuel consumption allocated to the seat and associated CO2 emissions, which are a dominating factor in the GWP in this study. Likewise, ADP, which in the vehicle use phase model is solely produced by fuel acquisition, is directly proportional to the allocated portion of vehicle fuel consumption.
Differences between the 2001 model and current vehicles in impact categories POCP, AP and EP are clearly influenced by the reduced emissions of the newer vehicles. These improvements in vehicle emission levels reduce the overall impact of the car seat by reducing the impact of the use phase in all impact categories included in this study (Figures 13–16).

Comparative Life Cycle Assessment (LCA) 107
All together, these figures certainly shift the single sided emphasis slightly away from the vehicle use phase. There is a noticeable shift in figures on GWP and ADP life cycle phase proportional impacts. Despite the most marked differences induced by the above mentioned reduced emission levels, the current vehicle scenarios showed a completely different picture with regard to impact categories POCP, AP and EP. In fact, the EP impact category is dominated by manufacture and end-of-life phases rather than the use phase. Even where case scenarios deviate away from the selected 200,000 km nominal lifetime duration (Figures 17–20) the introduction of new vehicle scenarios results in no drastic breakaway from the LCIA profile found in Figures 13 and 14.
These findings suggest that with the improved emissions performance of new vehicles there is no clear environmental reduction by adopting a higher content of lightweight materials, if manufacture and end-of-life phases are negatively effected. These detrimental effects will be non-trivial in the overall environmental footprint of the product. Consequently, only by considering an alternative material design over its full life cycle can the environmental benefits be proven (Gibson, 2000; Caceres, 2007), and particular attention should be paid to the impact of manufacturing processes and end-of-life options as well (US Department of Energy, 2004).
Moving away from the effects of mass on the vehicle use phase, the highest contribution to the impact of the manufacturing phase is provided by the seat back and the seat cushion, overall impact categories, whereby the seat track system shows a generally lower contribution. This is due to the noticeable difference in material composition between the track assembly and the remainder of the seat. The track assembly is made up almost entirely of steel parts, while the rest of the seat comprises a good portion of plastics and foams such as polyurethane (PU), acrylonitrile-butadiene-styrene (ABS), polyoxymehtylene (POM), and polypropelene (PP). These plastics show a greater contribution to many impact categories on a per weight basis. For example, steel components in the cushion assembly account for around 67% of its mass. However, in the GWP impact category, these same components account for 40% of the sub-assembly contribution. Whereas the PU foam alone accounts for 25% of the sub-assembly, the mass contributes 50% of its GWP total. The same trend is found across all other indicator categories investigated. Thus, plastics, on a mass-relative basis, make a larger contribution to the manufacture phase (Finkbeiner et al., 2001). This conclusion is significant as the system shows that there are significant levels of contributions from plastics in each impact category (Mark, 2004). Furthermore, the contribution of plastics inputs becomes even more relevant with the increased proportional contribution of manufacture and end-of-life phases, in the newer vehicle scenarios.
5 Conclusion
The paper presented a comprehensive LCA study of the vehicle seat, which was used to evaluate the effect of weight reduction on the life cycle phases of different vehicle models. The LCA results obtained in this research indicate that better fuel economy of newer vehicles has reduced the impact of the vehicle use phase relative to the environmental impact of other life cycle phases. The significant improvement in emissions performance has resulted in further use phase impact reductions, especially in the following impact categories: POCP, AP, and ADP. These improvements have dramatically changed the relative impacts of manufacture, use and end of life phases.

108 A. Subic et al.
As a result of this there can be no clear cut verdict on environmental impacts of weight reduction by simply increasing lightweight material content to replace the current steel components until a complete Life Cycle Assessment of the alternative materials is analysed in detail, with a particular focus on material production phase. As shown in the paper, newer vehicle scenarios are increasingly dominated by both manufacture and end-of-life phases. Furthermore, the results obtained in this research indicate that the role of plastics both in manufacture and, also, end-of-life plays a dominant role in contributing to around 70% of the EP readings in the respective phases. Bearing in mind the contribution of plastics in both manufacture and end-of-life scenarios, the application of such materials in seat design should not be assumed as necessarily being the best case scenario from an environmental standpoint. Possible alternatives lie in renewable plastics or current plastic compounds especially designed for recycling processes. Selection and treatment of such materials will become an increasingly important factor in vehicle life cycle design in the future as the environmental impact weighting shifts from the use phase to the manufacturing and end-of-life phase.
References Caceres, C. (2007) ‘Economical and environmental factors in light alloys automotive applications’,
Metallurgical and Material Transactions, Vol. 38A, No. 7, July, pp.1649–1662. Centre of Environmental Science (CML) (1992) Environmental Life Cycle Assessment of Products,
Guide and Backgrounds, Leiden University Institute of Environmental Sciences, Leiden, The Netherlands.
Department of Primary Industries and Energy (1996) Fuel Consumption Project, Department of Primary Industries and Energy, p.115.
DoTARS (2001) Department of Transport and Regional Services, Federal Government of Australia, Comparative Vehicle Emissions Study, Canberra, Australia.
Eberle, R. and Franze, H.A. (1998) Modelling the Use Phase of Passenger Cars in LCI, SAE Technical Paper – 982179.
Finkbeiner, M., Rulhand, K., Cetiner, H. and Stark, B. (2001) Life Cycle Engineering and Design for Environment of the Mercedes-Benz C-Class, SAE Technical Paper – ESC-26.
Gibson, T. (2000) Life Cycle Assessment of Advanced Materials for Automotive Applications, SAE Technical Paper – 2000-01-1486.
Hendrickson, C.T., Lave, L.B. and Matthews, H.S. (2006) Environmental Life Cycle Assessment of Goods and Services, Resources for the Future, Washington, pp.66, 67.
ISO 14041 (1998) Environmental Management – Life Cycle Assessment – Goal and Scope Definition and Inventory Analysis.
ISO 14042 (2000) Environmental Management – Life Cycle Assessment – Life Cycle Impact Assessment.
Leary, M. (2006) Mass Reduction of Fatigue-Limited, Safety-Critical (FLSC), Ferrous Metal Automotive Components by Forged Light Alloy Substitution, Melbourne University, Melbourne, Australia.
Mark, F. (2004) End-of-life Vehicles Recovery and Recycling Polyurethane Seat Cushion Recycling Options Analysis, SAE Technical Paper Series 2004-01-0249.
PE Europe GMBH and IKP (1998) GaBi – Software and Database for Life Cycle Engineering, Stuttgart.
Ribeiro, C. and Ferreira, J.V. (2007) ‘Life cycle assessment of a multi-material car component’, International Journal of Life Cycle Assessment, Vol. 12, No. 5, pp.336–345.
Ridge, L. (1997) EUCAR – Automotive LCA Guidelines – Phase 2, SAE Technical Paper – 982185.

Comparative Life Cycle Assessment (LCA) 109
Schmidt, W. and Taylor, A. (2006) ‘Ford of Europe’s product sustainability index’, 13th CIRP International Conference on Life Cycle Engineering, Leuven, pp.5–10.
Schmidt, W.P. (2004) ‘Life cycle assessment of lightweight and end-of-life scenarios for generic compact class passenger vehicle’, International Journal of Life Cycle Assessment, Vol. 9, No. 6, pp.405–416.
Standards Australia (1986) Methods of Test for Fuel Consumption of Motor Vehicles Designed to Comply with Australian Design Rules 37 and 40, Standards Australia, Sydney.
US Department of Energy (2004) Progress Report Automotive Lightweight Materials, Report of the US Department Energy, pp.157–164.