Comparative Health Analysis of the National Bank, Joint ...
13
Journal of International Studies Vol. 13, 33-45 (2017) Comparative Health Analysis of the National Bank, Joint Venture Banks and Foreign Banks in Indonesia Dudi Rudianto Bakrie University Jakarta, Indonesia [email protected] Abstract The Risk-Based Bank Rating approach (RBBR) is used to determine the health of banks in Indonesia, both for national banks, joint venture banks and foreign banks. This approach uses five (5) proxies, i.e. Non Performing Loan (NPL), Loan to Deposit Ratio (LDR), Return on Assets (ROA), Net Interesr Margin (NIM), and the Capital Adequacy Ratio (CAR). The overall result of the 5 (five) variables studied show that national banks are healthier than the other two types of banks, namely venture banks and foreign banks, because the national bank has a value beyond the provisions of Bank Indonesia. The partial variable LDR consistently varies significantly between national banks, joint venture banks and foreign banks. The LDR of joint venture banks and foreign banks is higher than the national bank. These conditions indicate that the bargaining position of joint venture banks and foreign banks in serving the needs of public borrowing is much higher than the national bank, which results in increasing the ability of both types of banks in generating profit. Simultaneously throughout the study variables was significantly different among the national banks, joint venture banks and foreign banks.. Keywords: Health bank, RBBR approach, national banks, joint venture banks and foreign banks. Introduction Foreign capital in Indonesia has been spread evenly across all sectors of the economy, including the banking sector. Of the 30 largest banks in Indonesia, 11 are controlled by foreign owners as joint venture banks and foreign banks. In addition, some of the private national banks, are dominated by foreign investors (Bank Indonesia, 2014). Knowingly or not, the Indonesian banking sector in the last two decades has shifted significantly. This certainly can threaten the existence of Indonesian banks and the economy in the future. This condition needs to be a serious concern for the government, and Bank Indonesia is very important and plays a crucial role in the national economy. After the monetary crisis in 1997, it was recorded that more than 20 national private banks passed into the hands of foreign banks or foreign investors. As a consequence of acquisitions DOI: https://doi.org/10.32890/jis2017.13.3
-
Upload
khangminh22 -
Category
Documents
-
view
1 -
download
0
Transcript of Comparative Health Analysis of the National Bank, Joint ...

Journal of International Studies Vol. 13, 33-45 (2017)
Comparative Health Analysis of the National Bank, Joint Venture Banks and Foreign Banks in Indonesia
Dudi RudiantoBakrie University Jakarta, Indonesia
Abstract
The Risk-Based Bank Rating approach (RBBR) is used to determine the health of banks in Indonesia, both for national banks, joint venture banks and foreign banks. This approach uses five (5) proxies, i.e. Non Performing Loan (NPL), Loan to Deposit Ratio (LDR), Return on Assets (ROA), Net Interesr Margin (NIM), and the Capital Adequacy Ratio (CAR). The overall result of the 5 (five) variables studied show that national banks are healthier than the other two types of banks, namely venture banks and foreign banks, because the national bank has a value beyond the provisions of Bank Indonesia. The partial variable LDR consistently varies significantly between national banks, joint venture banks and foreign banks. The LDR of joint venture banks and foreign banks is higher than the national bank. These conditions indicate that the bargaining position of joint venture banks and foreign banks in serving the needs of public borrowing is much higher than the national bank, which results in increasing the ability of both types of banks in generating profit. Simultaneously throughout the study variables was significantly different among the national banks, joint venture banks and foreign banks..
Keywords: Health bank, RBBR approach, national banks, joint venture banks and foreign banks.
Introduction
Foreign capital in Indonesia has been spread evenly across all sectors of the economy, including the banking sector. Of the 30 largest banks in Indonesia, 11 are controlled by foreign owners as joint venture banks and foreign banks. In addition, some of the private national banks, are dominated by foreign investors (Bank Indonesia, 2014). Knowingly or not, the Indonesian banking sector in the last two decades has shifted significantly. This certainly can threaten the existence of Indonesian banks and the economy in the future. This condition needs to be a serious concern for the government, and Bank Indonesia is very important and plays a crucial role in the national economy.
After the monetary crisis in 1997, it was recorded that more than 20 national private banks passed into the hands of foreign banks or foreign investors. As a consequence of acquisitions
DOI: https://doi.org/10.32890/jis2017.13.3
Dudi Rudianto
34
by foreign banks of the national banks, the control of national assets by government banks and the national private sector shrank. In contrast, the share control of national assets by foreign banks continued to rise sharply and increasingly dominated the market. In terms of banking assets, foreign banks and joint venture banks mastered more than 36.5% of the banking market in Indonesia in 2015 (www.beritasatu.com). The entry of foreign banks made banking competitive, stringent and complex in Indonesia. It is very evident that a lot of funds have been invested by foreign banks in Indonesia, both to operate and to acquire local banks. It is similar to Singapore and Malaysia who have stakes in Bank Danamon, OCBC NISP, CIMB Niaga and BII Maybank. In addition, foreign banks such as ANZ (Australia), Standard Chartered Bank, HSBC and Barclays (England), Rabobank (Netherlands), Texas Pacific and Mercy Corp. (United States), ICBC (China), State Bank of India (India), Tokyo Mitsubishi (Japan) and IFC (South Korea) are some of the foreign banks with the largest stock holdings in several national banks.
The overall number of foreign banks in Indonesia is 10, with total assets of Rp. 450 trillion. The 10 foreign banks operating in Indonesia, have 197 offices that have been channeling funds to communities amounting to Rp. 244 trillion and have collected public funds amounting to Rp. 174 trillion. In addition, foreign banks also operate in the country through 12 banks with total assets of Rp. 282 trillion and 283 offices have disbursed Rp. 195 trillion and raised public funds amounting to Rp. 149 trillion. This certainly could be a threat to the national banks, because of the 119 banks operating in Indonesia, as many as 97 banks are still national banks, but there are 21 national private commercial banks owned by foreign banks. In fact there are several national banks which are now foreign-controlled up to 99%, though still using national names. It can be interpreted that from the national bank’s total assets amounting to Rp. 4,251 trillion, fund distribution to the public of Rp. 2,789 trillion and Rp. 3337 trillion of funds that have been collected from the community through 15 538 offices operating in Indonesia, 22% of national banks have been acquired by foreign parties indirectly. Basically, policies and arrangements by Bank Indonesia to foreign banks and joint venture banks are equal or the same (Reciprocal). The entire regulations, including prudential regulations are applied uniformly to all banks operating in Indonesia; national banks, joint venture banks and foreign banks.
The Bank has a very important role in the Indonesian economy. The banking sector has a market share of ± 80% of the overall financial system in Indonesia. Given the magnitude of the role and the dominant role of banks in financing the economy in Indonesia, the policy-makers need to do the monitoring and evaluation of high performance for the existence and health of banks operating in Indonesia. In order to improve the effectiveness of the health ratings of banks to cope with changes in business complexity and risk profile come from the central office of the bank and its subsidiaries should the necessary improvements to the health ratings of banks using a risk-based approach (Risk-based Bank Ratings / RBBR). Aspects considered in determining the health of banks using the approach of these risks include Risk, Good Corporate Governance, Earnings and Capital, commonly called RGEC, in accordance with the regulations of Bank Indonesia Number 13/1 / PBI / 2011 dated

Comparative Health Analysis of National Bank, Joint Venture Banks and Foreign Banks in Indonesia
35
January 5, 2011 and SE No. 13/24 / DPNP dated October 25, 2011 concerning the Rating System for Commercial Banks.
Literature Review
Law Decree No. 10 of 1998 on banks mentions that the types of banks under ownership consists of: (a) state-owned banks, namely the type of bank certificate of incorporation or capital owned by the government, so that the profits are also owned by the government. Examples of such government-owned banks are Bank Mandiri, Bank Negara Indonesia (BNI), Bank Rakyat Indonesia (BRI) and the State Savings Bank (BTN). There is also a bank owned by the local government (local government), located in the areas of level I and level II. Examples of such local government banks are Bank DKI, Bank BJB and Bank Jatim; (b) privately owned banks nationwide, are banks which are wholly or largely owned by national private sectors. The founding deed show private ownership, as well as the distribution of profits to private parties. Examples of national privately owned banks include Bank Central Asia, Bank Mega, Bank Bukopin, Bank Mayapada, and others; (c) bank proprietary blend, the type of banks owned by foreign and national private sectors. However, the proportion of majority shares is owned by Indonesian citizens. Examples of joint venture banks include Bank Sumitomo Mitsui Indonesia, Mizuho Bank, Bank ANZ Indonesia, DBS and OCBC Indonesia; and (d) foreign-owned banks, are branches of banks who outside the country, either privately owned by foreigners or foreign governments. Examples of foreign banks include HSBC (Hongkong and Shanghai Banking Corporation), Citibank (USA), RBS (Scotland), and Deutsche Bank (Germany).
The health assessment is the assessment of the bank’s ability to carry out normal banking operations and the bank’s ability to meet its obligations. The health assessment of banks is very important to maintain the trust of the community; so healthy banks are expected to serve the public well. Bank Indonesia Regulation No. 13/1 / PBI / 2011 and SE No. 13/24 / DPNP dated October 25, 2011, concerning the Rating System for Commercial Banks states that bank carry out the health assessment using the Risk (Risk-based Bank Rating / RBBR) approach. Under the regulation, the factors include the bank’s health ratings: (a) Risk profile, consisting of credit risk, market risk, liquidity risk, operational risk, legal risk, strategic risk, compliance risk and reputation risk; (b) Good Corporate Governance; (c) Earning, and (d) Capital.
Based on Marwanto Marsuki research (2012), there is no significant difference in financial performance between government banks and national private banks as measured by CAR (capital adequacy ratio), RORA (return on risk assets), NPM (net profit margin), ROA (return on assets) and OR (operating ratio), but there are significant differences between the financial performance of state banks and national private banks as measured by the LDR (loan to deposit ratio) and CMR (call money ratio). According Christania Graciella Angel (2014), bank mixture is superior to the performance of foreign banks, and foreign banks are superior

Dudi Rudianto
36
to the performance of the national bank. The significant difference between the performance of the national banks and foreign banks are located in the CAR and NIM (net interest margin), while significant differences between national banks and joint venture banks lie in the NPL ratio (non-performing loans), and the significant differences between the foreign banks and joint venture banks lie in ROA. Meanwhile, according to Arie Firmansyah Saragih (2011), there is no significant difference between the performance of Islamic banks and conventional banks. However, during the study period 2008-2010 the overall Islamic banking performance (CAR, ROA, ROE, and LDR) was better compared with conventional banking (Mohamad Hanapi Mohamad, 2016), Using the Ownership Locational Internalization (OLI) Model, this paper examined the formation of multinational firms from ASEAN countries. We found positive similarities in the advancement of the firm’s specific ownership advantages such as skills, management know-how, R&D and technological capabilities. Unlike the firms from developed countries, the firms from developing countries adopted local elements in their products and services. According to Ahmad Bashawir Abdul Ghani (2009) many Malaysian companies with business activities in the Asia Pacific region have strategic alliances with local companies. An exploratory overview of their strategic orientation and performance reveals that they are mostly local-market oriented, and their success is closely associated with three factors; working relationships with partners, difficulties in partnering agreements, and difficulties arising from environment and cultural differences.
Methodology
This was an explanatory research. Statistical techniques were used in this analysis. The variables used in this research were quantitative factors to determine the financial soundness of banks using the Bank’s Risk-based approach Rating (RBBR), which includes:
1. Risk profile as measured by:
a. Credit risk is proxied by the ratio of non-performing loans (NPL). The NPL ratio shows the bank’s ability to manage non-performing loans granted by banks. NPL reflects the credit risk, the smaller the NPL lesser the credit risk borne by the bank. NPL is obtained by the formula:
b. Liquidity risk is proxied by the Loan to Deposit Ratio (LDR). LDR measures the bank’s ability to meet the repayment of deposits that have matured to its depositors, and can meet the credit application submitted without a delay. LDR is obtained by the formula:
6
METHODOLOGY
This was an explanatory research. Statistical techniques were used in this analysis.
The variables used in this research were quantitative factors to determine the
financial soundness of banks using the Bank's Risk-based approach Rating
(RBBR), which includes:
1. Risk profile as measured by:
a. Credit risk is proxied by the ratio of non-performing loans (NPL). The NPL
ratio shows the bank's ability to manage non-performing loans granted by banks.
NPL reflects the credit risk, the smaller the NPL lesser the credit risk borne by the
bank. NPL is obtained by the formula:
NPL = Non Performing LoansTotal Credit 𝑥𝑥100%
b. Liquidity risk is proxied by the Loan to Deposit Ratio (LDR). LDR measures
the bank's ability to meet the repayment of deposits that have matured to its
depositors, and can meet the credit application submitted without a delay. LDR is
obtained by the formula:
LDR = Total CreditTotal Deposits 𝑥𝑥100%
2. Profitability is proxied by:
a. Retun On Assets (ROA). ROA is used to measure a company's ability to
generate profits with the total assets of the bank. The higher the ROA, the greater
the ability of the bank to achieve profit level. ROA is obtained by the formula:
ROA = Earning Before TaxesTotal Assets 𝑥𝑥100%
b. Net Interest Margin (NIM). NIM is used to measure the ability of the bank's
management in managing its productive assets to generate net interest income.

Comparative Health Analysis of National Bank, Joint Venture Banks and Foreign Banks in Indonesia
37
2. Profitability is proxied by:
a. Retun On Assets (ROA). ROA is used to measure a company’s ability to generate profits with the total assets of the bank. The higher the ROA, the greater the ability of the bank to achieve profit level. ROA is obtained by the formula:
b. Net Interest Margin (NIM). NIM is used to measure the ability of the bank’s management in managing its productive assets to generate net interest income. Net interest income is derived from interest income less interest expense. NIM is obtained by the formula:
3. Capital is proxied by the Capital Adequacy Ratio (CAR), which is a measure that indicates the ability of a bank to anticipate the need for the availability of own funds for business growth, and assumes the risk of loss incurred in the running. CAR is obtained by the formula:
The data used in this research was secondary data obtained from Bank Indonesia, www.bi.go.id of 2010-2014 and from the Indonesian Stock Exchange (BEI) through reports of the Indonesian Capital Market Directory (ICMD) for the period 2011-2014. Data used in this study was collected:
1. By studying the documentary, by way of collection of data relating to the NPL, LDR, ROA, NIM and CAR at national banks, joint venture banks and foreign banks.
2. Through literature, that is by studying and deepening the literature related to this research.
The population used in this study is listed banks in Indonesia from 2010 to 2014. Sampling was done by the purposive sampling method to determine sampling with certain
6
METHODOLOGY
This was an explanatory research. Statistical techniques were used in this analysis.
The variables used in this research were quantitative factors to determine the
financial soundness of banks using the Bank's Risk-based approach Rating
(RBBR), which includes:
1. Risk profile as measured by:
a. Credit risk is proxied by the ratio of non-performing loans (NPL). The NPL
ratio shows the bank's ability to manage non-performing loans granted by banks.
NPL reflects the credit risk, the smaller the NPL lesser the credit risk borne by the
bank. NPL is obtained by the formula:
NPL = Non Performing LoansTotal Credit 𝑥𝑥100%
b. Liquidity risk is proxied by the Loan to Deposit Ratio (LDR). LDR measures
the bank's ability to meet the repayment of deposits that have matured to its
depositors, and can meet the credit application submitted without a delay. LDR is
obtained by the formula:
LDR = Total CreditTotal Deposits 𝑥𝑥100%
2. Profitability is proxied by:
a. Retun On Assets (ROA). ROA is used to measure a company's ability to
generate profits with the total assets of the bank. The higher the ROA, the greater
the ability of the bank to achieve profit level. ROA is obtained by the formula:
ROA = Earning Before TaxesTotal Assets 𝑥𝑥100%
b. Net Interest Margin (NIM). NIM is used to measure the ability of the bank's
management in managing its productive assets to generate net interest income.
7
Net interest income is derived from interest income less interest expense. NIM is
obtained by the formula:
𝑁𝑁𝑁𝑁𝑁𝑁 = Net Interest IncomeEarning Assets 𝑥𝑥100%
3. Capital is proxied by the Capital Adequacy Ratio (CAR), which is a measure
that indicates the ability of a bank to anticipate the need for the availability of own
funds for business growth, and assumes the risk of loss incurred in the running.
CAR is obtained by the formula:
CAR = Total CapitalTotal Risk Assets 𝑥𝑥100%
The data used in this research was secondary data obtained from Bank Indonesia,
www.bi.go.id of 2010-2014 and from the Indonesian Stock Exchange (BEI)
through reports of the Indonesian Capital Market Directory (ICMD) for the period
2011-2014. Data used in this study was collected:
1. By studying the documentary, by way of collection of data relating to the
NPL, LDR, ROA, NIM and CAR at national banks, joint venture banks and
foreign banks.
2. Through literature, that is by studying and deepening the literature related to
this research.
The population used in this study is listed banks in Indonesia from 2010 to 2014.
Sampling was done by the purposive sampling method to determine sampling
with certain considerations (Saifuddin Azwar, 2004) with the aim to obtain a
representative sample. The criteria for the samples were:
1. Conventional commercial banks were registered with Bank Indonesia for 5
consecutive years and participated, from 2010 to 2014.
2. The conventional commercial banks published annual financial statements for
the period December 31, 2010 - December 31, 2014.
Dudi Rudianto
38
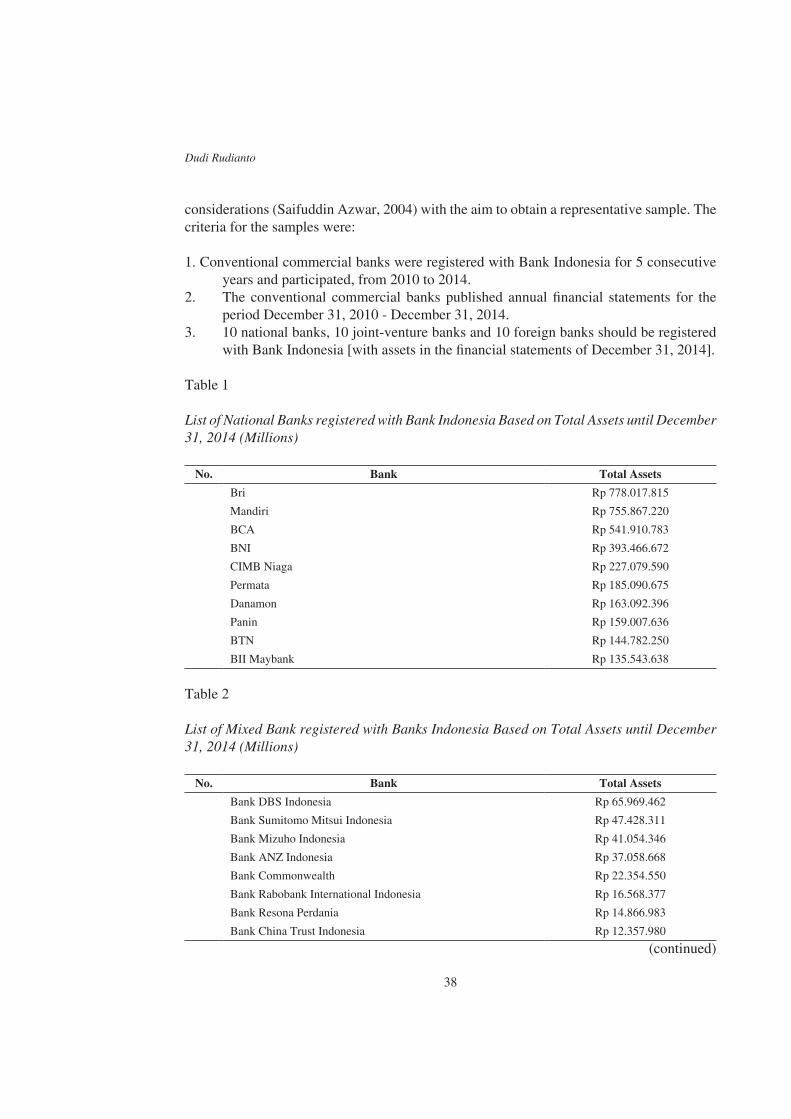
considerations (Saifuddin Azwar, 2004) with the aim to obtain a representative sample. The criteria for the samples were:
1. Conventional commercial banks were registered with Bank Indonesia for 5 consecutive years and participated, from 2010 to 2014.
2. The conventional commercial banks published annual financial statements for the period December 31, 2010 - December 31, 2014.
3. 10 national banks, 10 joint-venture banks and 10 foreign banks should be registered with Bank Indonesia [with assets in the financial statements of December 31, 2014].
Table 1 List of National Banks registered with Bank Indonesia Based on Total Assets until December 31, 2014 (Millions)
No. Bank Total Assets
Bri Rp 778.017.815
Mandiri Rp 755.867.220
BCA Rp 541.910.783
BNI Rp 393.466.672
CIMB Niaga Rp 227.079.590
Permata Rp 185.090.675
Danamon Rp 163.092.396
Panin Rp 159.007.636
BTN Rp 144.782.250
BII Maybank Rp 135.543.638
Table 2
List of Mixed Bank registered with Banks Indonesia Based on Total Assets until December 31, 2014 (Millions)
No. Bank Total Assets
Bank DBS Indonesia Rp 65.969.462
Bank Sumitomo Mitsui Indonesia Rp 47.428.311
Bank Mizuho Indonesia Rp 41.054.346
Bank ANZ Indonesia Rp 37.058.668
Bank Commonwealth Rp 22.354.550
Bank Rabobank International Indonesia Rp 16.568.377
Bank Resona Perdania Rp 14.866.983
Bank China Trust Indonesia Rp 12.357.980
(continued)
Comparative Health Analysis of National Bank, Joint Venture Banks and Foreign Banks in Indonesia
39
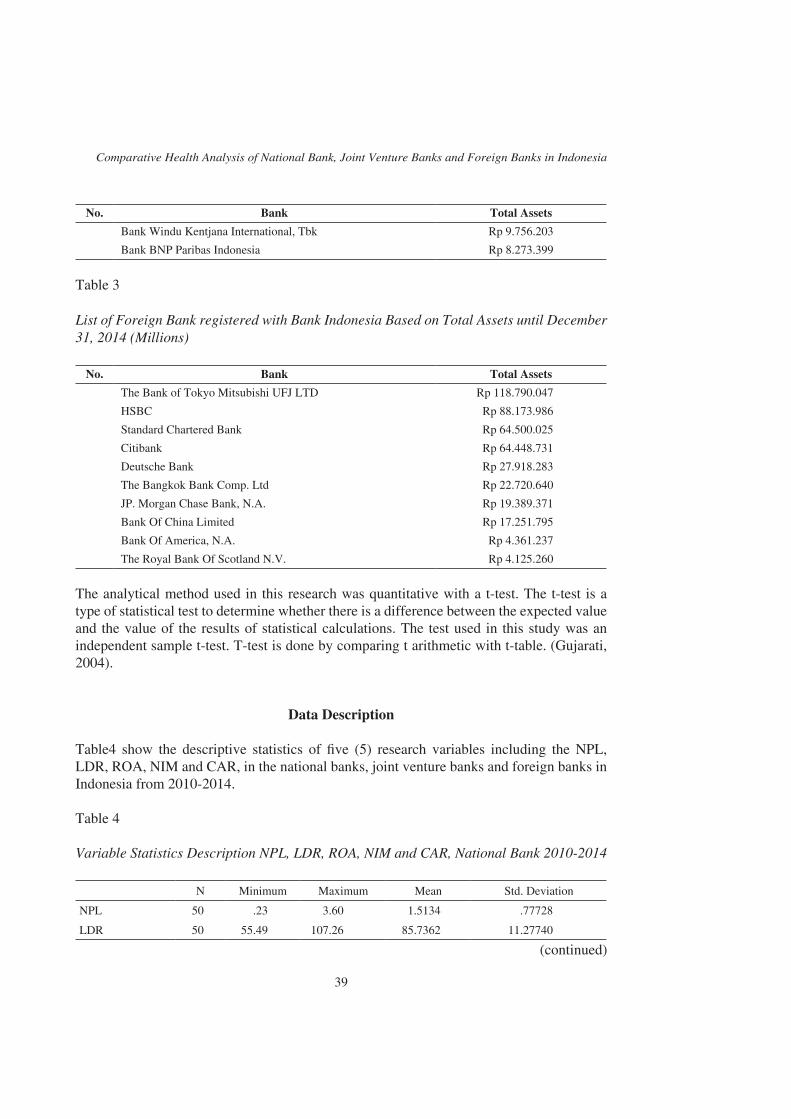
No. Bank Total Assets
Bank Windu Kentjana International, Tbk Rp 9.756.203
Bank BNP Paribas Indonesia Rp 8.273.399
Table 3
List of Foreign Bank registered with Bank Indonesia Based on Total Assets until December 31, 2014 (Millions)
No. Bank Total Assets
The Bank of Tokyo Mitsubishi UFJ LTD Rp 118.790.047
HSBC Rp 88.173.986
Standard Chartered Bank Rp 64.500.025
Citibank Rp 64.448.731
Deutsche Bank Rp 27.918.283
The Bangkok Bank Comp. Ltd Rp 22.720.640
JP. Morgan Chase Bank, N.A. Rp 19.389.371
Bank Of China Limited Rp 17.251.795
Bank Of America, N.A. Rp 4.361.237
The Royal Bank Of Scotland N.V. Rp 4.125.260
The analytical method used in this research was quantitative with a t-test. The t-test is a type of statistical test to determine whether there is a difference between the expected value and the value of the results of statistical calculations. The test used in this study was an independent sample t-test. T-test is done by comparing t arithmetic with t-table. (Gujarati, 2004).
Data Description
Table4 show the descriptive statistics of five (5) research variables including the NPL, LDR, ROA, NIM and CAR, in the national banks, joint venture banks and foreign banks in Indonesia from 2010-2014.
Table 4
Variable Statistics Description NPL, LDR, ROA, NIM and CAR, National Bank 2010-2014
N Minimum Maximum Mean Std. Deviation
NPL 50 .23 3.60 1.5134 .77728
LDR 50 55.49 107.26 85.7362 11.27740
(continued)

Dudi Rudianto
40
N Minimum Maximum Mean Std. Deviation
ROA 50 .48 4.56 2.4084 .97274
NIM 50 1.80 8.96 5.5050 1.65657
CAR 50 12.03 18.45 15.3462 1.68214
Valid N (listwise) 50
Source. Data processed in 2016.
Table 5
Description Variable Statistics NPL, LDR, ROA, NIM and CAR, Joint Venture Banks 2010-2014
N Minimum Maximum Mean Std. Deviation
NPL 50 .04 1.08 .5544 .29736
LDR 50 60.02 140.69 106.3596 18.46863
ROA 50 .15 5.20 2.0894 1.23807
NIM 50 1.19 5.24 3.3114 1.19382
CAR 50 11.58 27.92 17.5808 3.52003
Valid N (listwise) 50
Source. Data processed in 2016.
Table 6
Description of Variables Statistics NPL, LDR, ROA, NIM and CAR, Foreign Banks 2010-2014
N Minimum Maximum Mean Std. Deviation
NPL 50 .13 2.81 1.3050 .67144
LDR 50 95.08 296.60 167.6790 39.50980
ROA 50 .18 5.41 2.5548 1.35768
NIM 50 .01 6.94 2.9734 1.53995
CAR 50 16.97 31.62 22.9272 3.58935
Valid N (listwise) 50
Source. Data processed in 2016.
Table 4 lists all the five (5) research variables; the NPL, LDR, ROA, NIM and CAR. It shows the entire national bank health indicators have value beyond the provisions of Bank Indonesia (4 criteria are very healthy and one criterion is healthy enough). Table 5 for joint venture banks, shows that three criteria are very healthy (NPL, ROA and CAR), 1
Comparative Health Analysis of National Bank, Joint Venture Banks and Foreign Banks in Indonesia
41
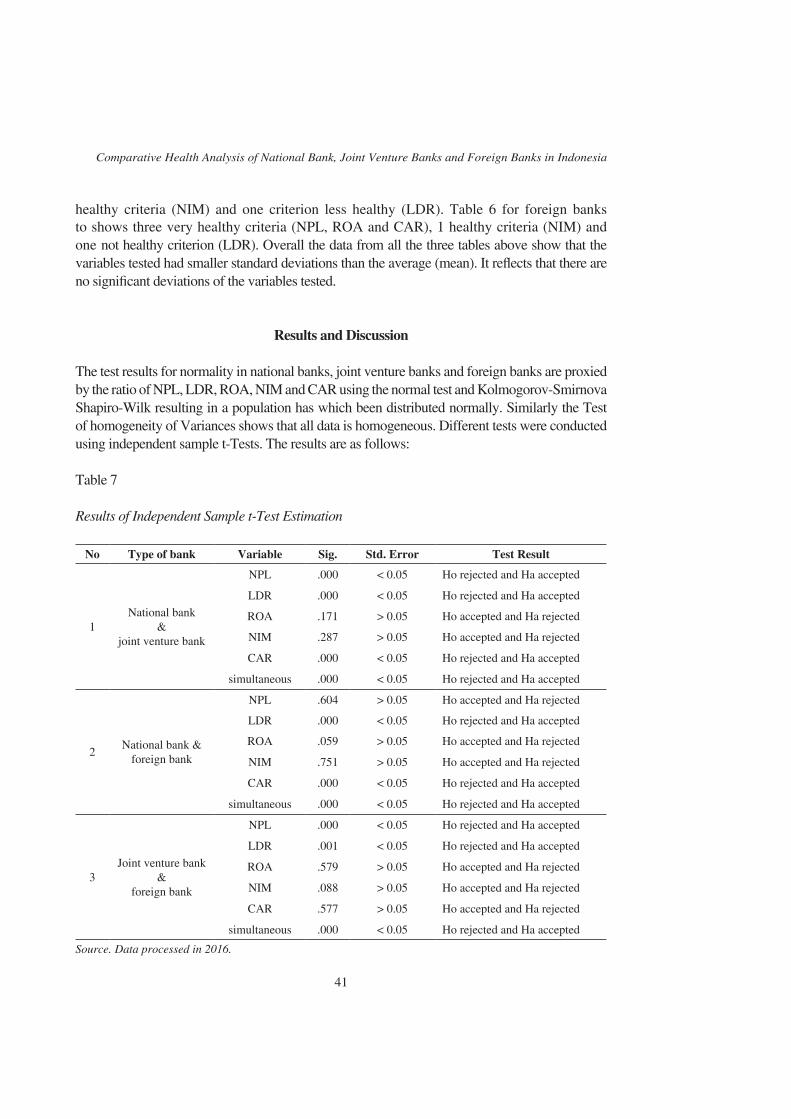
healthy criteria (NIM) and one criterion less healthy (LDR). Table 6 for foreign banks to shows three very healthy criteria (NPL, ROA and CAR), 1 healthy criteria (NIM) and one not healthy criterion (LDR). Overall the data from all the three tables above show that the variables tested had smaller standard deviations than the average (mean). It reflects that there are no significant deviations of the variables tested.
Results and Discussion
The test results for normality in national banks, joint venture banks and foreign banks are proxied by the ratio of NPL, LDR, ROA, NIM and CAR using the normal test and Kolmogorov-Smirnova Shapiro-Wilk resulting in a population has which been distributed normally. Similarly the Test of homogeneity of Variances shows that all data is homogeneous. Different tests were conducted using independent sample t-Tests. The results are as follows:
Table 7
Results of Independent Sample t-Test Estimation
No Type of bank Variable Sig. Std. Error Test Result
1National bank
& joint venture bank
NPL .000 < 0.05 Ho rejected and Ha accepted
LDR .000 < 0.05 Ho rejected and Ha accepted
ROA .171 > 0.05 Ho accepted and Ha rejected
NIM .287 > 0.05 Ho accepted and Ha rejected
CAR .000 < 0.05 Ho rejected and Ha accepted
simultaneous .000 < 0.05 Ho rejected and Ha accepted
2National bank &
foreign bank
NPL .604 > 0.05 Ho accepted and Ha rejected
LDR .000 < 0.05 Ho rejected and Ha accepted
ROA .059 > 0.05 Ho accepted and Ha rejected
NIM .751 > 0.05 Ho accepted and Ha rejected
CAR .000 < 0.05 Ho rejected and Ha accepted
simultaneous .000 < 0.05 Ho rejected and Ha accepted
3Joint venture bank
& foreign bank
NPL .000 < 0.05 Ho rejected and Ha accepted
LDR .001 < 0.05 Ho rejected and Ha accepted
ROA .579 > 0.05 Ho accepted and Ha rejected
NIM .088 > 0.05 Ho accepted and Ha rejected
CAR .577 > 0.05 Ho accepted and Ha rejected
simultaneous .000 < 0.05 Ho rejected and Ha accepted
Source. Data processed in 2016.

Dudi Rudianto
42
Table 7 shown that partial LDR (loan to deposit ratio) consistently varies significantly between national banks, joint venture banks and foreign banks. While other variables differ only NPL and CAR were compared between the two banks. Simultaneously all variables are significantly different among the national banks, joint venture banks and foreign banks.
LDR is a proxy of liquidity risk, which is intended to measure the ability of banks to allocate credit using public funds from the deposit. The higher the LDR the more aggressive banks are in lending (credit) to the people who contributed to greater risk in the fulfillment of liquidity. The data showed that the average LDR of national banks amounted to 85.74% and entered the category of healthy enough, the average LDR venture banks amounted to 106.36% and entered the category of unwell, while the average LDR foreign banks amounted to 167.68% and entered the unhealthy category. The LDR level difference is significant in national banks compared with venture banks and foreign banks, indicating very aggressive venture banks and foreign banks in extending credit to the public than national banks. But apparently this condition is followed by the ability of both types of banks in managing credit quality with their ability to generate a very healthy NPL value, which is better than the national bank’s. These results will lead to the bargaining position of joint venture banks and foreign banks in serving the lending needs of the society which will increasingly outpace its competitors, namely the national bank, resulting in increasing the ability of the two banks in generating profit. On the other hand the capital level of the three types of bank has a capital adequacy ratio (CAR) which is strong, above the minimum requirement, i.e. 15%.
Conclusion
Based on the research and discussion above, several conclusions can be made.
Overall out of the 5 (five) research variables, namely the NPL, LDR, ROA, NIM and CAR show that national banks are healthier than the other two types of banks, namely joint venture banks and foreign banks. It shows the national bank health indicators have value above the provisions of Bank Indonesia.
Partially variable LDR (loan to deposit ratio) has consistently been shown to vary significantly between national banks, joint venture banks and foreign banks, with LDR of joint venture banks and foreign banks being higher than the national bank. These results indicate that the bargaining position of joint venture banks and foreign banks in serving the needs of public borrowing is much higher than the national bank, resulting in increasing the ability of both types of banks to generate profit. While other variables differ only NPL and CAR were compared between the two banks. Simultaneously all the research variables including the NPL, LDR, ROA, NIM and CAR were significantly different among the national banks, joint venture banks and foreign banks.

Comparative Health Analysis of National Bank, Joint Venture Banks and Foreign Banks in Indonesia
43
Suggestions
Suggestions and recommendations relating to the results of this study are:
1. For the regulator.Bank Indonesia as the Indonesian authority, should to make a rule that limits the space for operating joint venture banks and foreign banks, especially in serving loan facilities to the people of Indonesia. With very high lending by both types of banks and delinquency rates being very low, it is feared they will dominate the structure of banking in Indonesia.
2. For the national banks.The national banks are required to continue being aggressive in lending to the public in a variety of industry sectors with a high level of supervision, so that the level of health can be maintained well.
3. For the joint venture & foreign banks.Joint venture banks and foreign banks should increase lending, especially to sectors that have not worked or have not been optimized by national banks such as the infrastructure/construction, agriculture, maritime, trade financing, and the mineral and energy sections so as to provide added value to the economy of Indonesia.
4. For future researchers.The result is expected to be a reference for other studies on similar research so as to increase knowledge in the study of the phenomena that occur in the national banking system and can be further developed on the model of a much more comprehensive study.
References
Agustin, Hamdi, Rohani, & M. Taufil, Kamarun, Nisham. (2013). Financial performance and ownership structure: A comparison study between community development banks, government banks and private banks in Indonesia. International Journal of Academic Research in Business and Social Sciences, 3(12).
Ahmad Bashawir Abdul Ghani. (2009). International cooperation and network influences in Asia Pacific: The case of Malaysia. Journal of International Studies, 5, 58-72.
Ali, K. et al. (2011). Bank-specific and macroeconomic indicators of profitability - Empirical evidence from the commercial banks of Pakistan. International Journal of Business and Social Science, 2(6), 235-242.
Ali, Z. et al. (2012). Parameters of conventional and Islamic Bank’s profitability in Pakistan: Evaluation of internal factor. Research Journal of Finance and Accounting, 3(3). Doi: https://doi.org/10.1016/j.bir.2016.03.002
Dudi Rudianto
44
Angel, C.G. (2014). Analisis perbandingan kinerja pada bank nasional, bank campuran dan bank asing yang terdaftar di bursa efek Indonesia. Tesis. Universitas Sam Ratulangi. Manado.
Azwar Saifuddin. (2004). Metode penelitian. Pustaka Pelajar, Yogyakarta.Bank Indonesia. Laporan Keuangan Publikasi Bank. Laporan Keuangan Publikasi Bank
2010-2014. Retrieved from www.bi.go.idBastian Indra. (2006). Akuntansi perbankan. Salemba Empat, Jakarta.Boussaada, Rim, & Karmani, Majdi. (2015). Ownership concentration and bank
performance: Evidence from MENA Banks. International Journal of Business and Management, 10 (3), 189-202.
Esther, L.A., Matthew, N.G. (2012). A financial performance comparison of foreign vs local banks in Ghana. International Journal of Business and Social Science, 3 (21).
Fahmi Irham. (2011). Analisis kinerja keuangan. Alfabeta, Bandung.Gitosudarmo Indriyo, & Basri. (2002). Manajemen keuangan. BPFE, Yogyakarta.Gorener, Rifat, & Choi, Sungho. (2013). Competition in the banking system: Evidence
from Turkey using the Panzar–Rosse Model. Journal of Accounting and Finance, 13(2), 108-125.
Kadira, G. et al. (2015). Determinants and effect of commercial bank profitability in Zimbabwe (2009-2013). European Journal of Business and Management, 7(30), 78-83.
Kamaludin & Indriani, Rini. (2012). Manajemen keuangan : Konsep dasar dan penerapannnya. CV.Mandar Maju, Jakarta.
Kuncoro, M., & Suhardjono. (2002). Manajemen perbankan : Teori dan Aplikasi. BPFE, Yogyakarta.
Kusuma. astu, Sri Yani. (2008). Derajat persaingan industri perbankan Indonesia : Setelah krisis ekonomi. Jurnal Ekonomi dan Bisnis Indonesia, 23(1), 299-317.
Mohamad Hanapi Mohamad. (2016). The internationalization of firms: Some lessons from ASEAN firms. Journal of International Studies, 12, 31-51.
Munawir. (2010). Analisa laporan keuangan. Liberty, Yogyakarta.Nurgiyantoro, Burhan, Gunawan, Marzuki. (2015). Statistik terapan : Untuk penelitian
ilmu sosial. Gadjah Mada University Press, Yogyakarta.Park. K.H. (2013). Bank mergers and competition in Japan. International Journal of
Banking and Finance, 9(2), 61-70.Pemerintah Republik Indonesia. (1998). Undang-undang Republik Indonesia No.10 tahun
1998 tentang Perubahan Undang-undang No 7 tahun 1992. Jakarta.Perarturan Bank Indonesia Nomor 13/1/PBI/2011. (5 Januari 2011). Perihal Penilaian
Tingkat Kesehatan Bank Umum.Bank Indonesia, Jakarta.Prasetyo, Indra. (2008). Analisis kinerja keuangan bank syariah dan bank konvensional.
Jurnal Aplikasi Manajemen, 6(2), 164-174.Putri, I. Dewa., & Damayanti, I. Gst. (2013). Analisis perbedaan tingkat kesehatan bank
berdasarkan RGEC pada perusahaan perbankan besar dan kecil. E-Jurnal Akuntansi, 5(2) : Universtas Udayana.
Comparative Health Analysis of National Bank, Joint Venture Banks and Foreign Banks in Indonesia
45
Putri, Y.F., Fadah, Isti., & Endhiarto, Tatok., (2015). Analisis perbandingan kinerja keuangan bank konvensional dan bank syariah. JEAM, Vol. XIV.
Saeed, M.S, (2014). Bank-related, industry-related and macroeconomic factors affecting bank profitability: A case of the United Kingdom. Research Journal of Finance and Accounting, 5(2), 42-50.
Sarwoko, Endi. (2009). Analisis kinerja bank swasta nasional devisa dan non devisa di Indonesia. Jurnal Ekonomi Modernisasi, 5(2), 92-105.
Statistik Ekonomi Indonesia. Beberapa Edisi, Bank Indonesia. Laporan Statistik Indonesia 2010-2014. Retrieved from http://www.bi.go.id
Surat Edaran Bank Indonesia Nomor 13/ 24 /DPNP. (25 Oktober 2011). Perihal Penilaian Tingkat Kesehatan Bank Umum. Bank Indonesia, Jakarta.
Surat Edaran Bank Indonesia Nomor 3/30/DPNP. (14 Desember 2001). Perihal Pedoman Perhitungan Rasio Keuangan. Bank Indonesia. Jakarta.
Suyatno, Thomas. (2007). Kelembagaan perbankan edisi ketiga. Jakarta: PT. Gramedia Pustaka Utama.
Swai, J.P., & Mbogela., C.S. (2014). Do ownership structures affect banks performance? An empirical inquiry into Tanzanian bank industry. ACRN Journal of Finance and Risk Perspectives, 3 (2), 47-66.
Uddin, S. M. S., & Suzuki, Y. (2011). Financial reform, ownership and performance in banking industry: The case of Bangladesh. International Journal of Business and Management, 6 (7),28-39.
Usman, Rachmadi. (2001). Aspek - aspek hukum perbankan di Indonesia. PT Gramedia Pustaka Utama, Jakarta.
Wild, Subramanyam, Halsey. (2005). Analisis Laporan Keuangan. Salemba Empat, Jakarta.______.Artikel Economic dan Buiness. Retrived from http:// http://www.bloomberg.com/asia______.Artikel Economic dan Buiness. Retrived from http://www.worldbank.com ______.Artikel Koran Berita Satu. Retrived from http://www.beritasatu.com ______.Artikel Koran Detik. Retrived from http://www.detikfinance.com ______.Artikel Koran Kompas. Retrived from http://www.kompas.com ______.Artikel Koran Kontan. Retrived from http://www.kontan.co.id ______.Artikel Koran Suara Merdeka. Retrived from http://www.suaramerdeka.com ______.Artikel Koran Viva News. Retrived from http://www.viva.co.id