Comparative genetics in sugarcane enables structured map enhancement and validation of marker-trait...
15
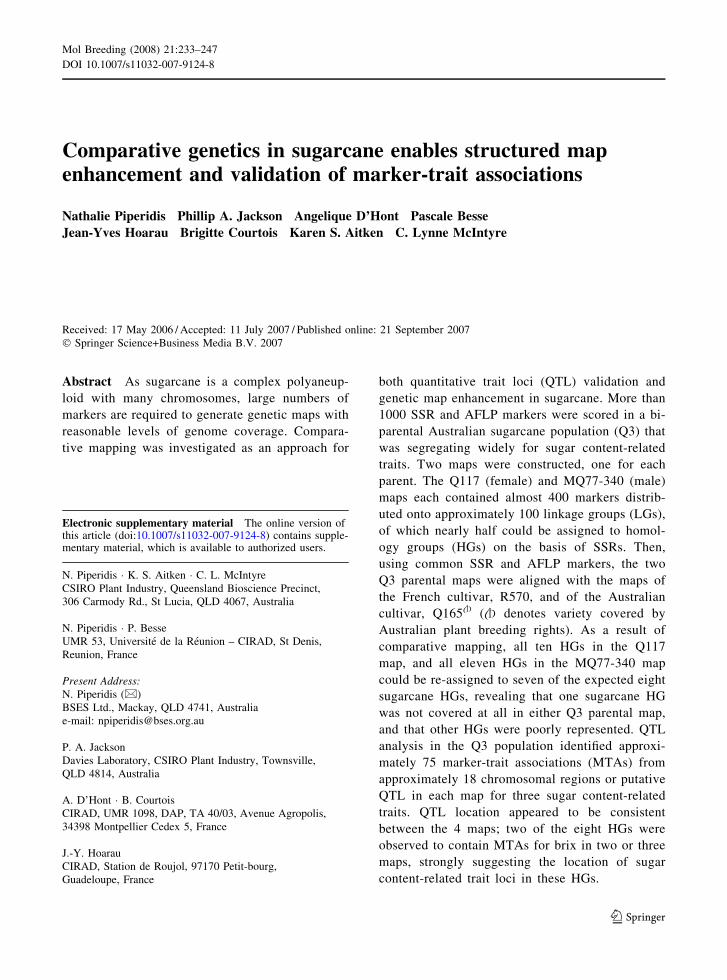
Comparative genetics in sugarcane enables structured map enhancement and validation of marker-trait associations Nathalie Piperidis Phillip A. Jackson Angelique D’Hont Pascale Besse Jean-Yves Hoarau Brigitte Courtois Karen S. Aitken C. Lynne McIntyre Received: 17 May 2006 / Accepted: 11 July 2007 / Published online: 21 September 2007 Ó Springer Science+Business Media B.V. 2007 Abstract As sugarcane is a complex polyaneup- loid with many chromosomes, large numbers of markers are required to generate genetic maps with reasonable levels of genome coverage. Compara- tive mapping was investigated as an approach for both quantitative trait loci (QTL) validation and genetic map enhancement in sugarcane. More than 1000 SSR and AFLP markers were scored in a bi- parental Australian sugarcane population (Q3) that was segregating widely for sugar content-related traits. Two maps were constructed, one for each parent. The Q117 (female) and MQ77-340 (male) maps each contained almost 400 markers distrib- uted onto approximately 100 linkage groups (LGs), of which nearly half could be assigned to homol- ogy groups (HGs) on the basis of SSRs. Then, using common SSR and AFLP markers, the two Q3 parental maps were aligned with the maps of the French cultivar, R570, and of the Australian cultivar, Q165 A (A denotes variety covered by Australian plant breeding rights). As a result of comparative mapping, all ten HGs in the Q117 map, and all eleven HGs in the MQ77-340 map could be re-assigned to seven of the expected eight sugarcane HGs, revealing that one sugarcane HG was not covered at all in either Q3 parental map, and that other HGs were poorly represented. QTL analysis in the Q3 population identified approxi- mately 75 marker-trait associations (MTAs) from approximately 18 chromosomal regions or putative QTL in each map for three sugar content-related traits. QTL location appeared to be consistent between the 4 maps; two of the eight HGs were observed to contain MTAs for brix in two or three maps, strongly suggesting the location of sugar content-related trait loci in these HGs. Electronic supplementary material The online version of this article (doi:10.1007/s11032-007-9124-8) contains supple- mentary material, which is available to authorized users. N. Piperidis Á K. S. Aitken Á C. L. McIntyre CSIRO Plant Industry, Queensland Bioscience Precinct, 306 Carmody Rd., St Lucia, QLD 4067, Australia N. Piperidis Á P. Besse UMR 53, Universite ´ de la Re ´union – CIRAD, St Denis, Reunion, France Present Address: N. Piperidis (&) BSES Ltd., Mackay, QLD 4741, Australia e-mail: [email protected] P. A. Jackson Davies Laboratory, CSIRO Plant Industry, Townsville, QLD 4814, Australia A. D’Hont Á B. Courtois CIRAD, UMR 1098, DAP, TA 40/03, Avenue Agropolis, 34398 Montpellier Cedex 5, France J.-Y. Hoarau CIRAD, Station de Roujol, 97170 Petit-bourg, Guadeloupe, France 123 Mol Breeding (2008) 21:233–247 DOI 10.1007/s11032-007-9124-8
-
Upload
univ-reunion -
Category
Documents
-
view
1 -
download
0
Transcript of Comparative genetics in sugarcane enables structured map enhancement and validation of marker-trait...
Comparative genetics in sugarcane enables structured mapenhancement and validation of marker-trait associations
Nathalie Piperidis Æ Phillip A. Jackson Æ Angelique D’Hont Æ Pascale Besse ÆJean-Yves Hoarau Æ Brigitte Courtois Æ Karen S. Aitken Æ C. Lynne McIntyre
Received: 17 May 2006 / Accepted: 11 July 2007 / Published online: 21 September 2007
� Springer Science+Business Media B.V. 2007
Abstract As sugarcane is a complex polyaneup-
loid with many chromosomes, large numbers of
markers are required to generate genetic maps with
reasonable levels of genome coverage. Compara-
tive mapping was investigated as an approach for
both quantitative trait loci (QTL) validation and
genetic map enhancement in sugarcane. More than
1000 SSR and AFLP markers were scored in a bi-
parental Australian sugarcane population (Q3) that
was segregating widely for sugar content-related
traits. Two maps were constructed, one for each
parent. The Q117 (female) and MQ77-340 (male)
maps each contained almost 400 markers distrib-
uted onto approximately 100 linkage groups (LGs),
of which nearly half could be assigned to homol-
ogy groups (HGs) on the basis of SSRs. Then,
using common SSR and AFLP markers, the two
Q3 parental maps were aligned with the maps of
the French cultivar, R570, and of the Australian
cultivar, Q165A (A denotes variety covered by
Australian plant breeding rights). As a result of
comparative mapping, all ten HGs in the Q117
map, and all eleven HGs in the MQ77-340 map
could be re-assigned to seven of the expected eight
sugarcane HGs, revealing that one sugarcane HG
was not covered at all in either Q3 parental map,
and that other HGs were poorly represented. QTL
analysis in the Q3 population identified approxi-
mately 75 marker-trait associations (MTAs) from
approximately 18 chromosomal regions or putative
QTL in each map for three sugar content-related
traits. QTL location appeared to be consistent
between the 4 maps; two of the eight HGs were
observed to contain MTAs for brix in two or three
maps, strongly suggesting the location of sugar
content-related trait loci in these HGs.
Electronic supplementary material The online version ofthis article (doi:10.1007/s11032-007-9124-8) contains supple-mentary material, which is available to authorized users.
N. Piperidis � K. S. Aitken � C. L. McIntyre
CSIRO Plant Industry, Queensland Bioscience Precinct,
306 Carmody Rd., St Lucia, QLD 4067, Australia
N. Piperidis � P. Besse
UMR 53, Universite de la Reunion – CIRAD, St Denis,
Reunion, France
Present Address:N. Piperidis (&)
BSES Ltd., Mackay, QLD 4741, Australia
e-mail: [email protected]
P. A. Jackson
Davies Laboratory, CSIRO Plant Industry, Townsville,
QLD 4814, Australia
A. D’Hont � B. Courtois
CIRAD, UMR 1098, DAP, TA 40/03, Avenue Agropolis,
34398 Montpellier Cedex 5, France
J.-Y. Hoarau
CIRAD, Station de Roujol, 97170 Petit-bourg,
Guadeloupe, France
123
Mol Breeding (2008) 21:233–247
DOI 10.1007/s11032-007-9124-8
Keywords Saccharum spp. � Comparative
mapping � QTL � Sugar � Sucrose � SSR and AFLP
Introduction
Modern sugarcane cultivars have a complex poly-
ploid, aneuploid genome constitution derived from
introgression between S. officinarum (2n = 80), the
major sucrose contributor, and S. spontaneum
(2n = 40–128), a wild species. Chromosome numbers
in sugarcane cultivars range between 100 and 130
with an estimated 80–85% derived from S. officina-
rum, 10–15% derived from S. spontaneum and 5–
15% recombinant chromosomes between the two
species (Piperidis and D’Hont 2001). The basic
chromosome numbers in the two ancestral species
are also different, with x = 10 in S. officinarum and
x = 8 in S. spontaneum (D’Hont et al. 1998).
Molecular markers have been used to develop
genetic maps in crops to improve our understanding
of genome structure, to localise genes of agronomic
importance, and to identify quantitative trait loci
(QTL) associated with such agronomic traits in order
to facilitate marker-assisted selection. This approach
is also being investigated in sugarcane with major
targets being sugar content-related traits and disease
resistance. However, the high level of polyploidy
combined with the irregular and high numbers of
chromosomes in cultivars make sugarcane one of the
most difficult crops for genome mapping. A further
frustration arises from the observation that only a
subset of polymorphic markers can be used for
mapping in sugarcane. As there are an estimated 8–14
copies of homologous/homoeologous chromosomes
in sugarcane, conventional population sizes of
approximately 300 progeny allow only simplex
(markers present in single dose in one parent only)
or duplex (two copies or double dose) markers to be
mapped (Wu et al. 1992). The inheritance of poly-
morphic markers present in triplex or higher dosage
cannot be accurately determined and therefore such
markers cannot be used for map construction. Sim-
plex markers have been generated with a wide range
of marker types, such as Restriction Fragment Length
Polymorphism (RFLPs) (Grivet et al. 1996; Ming
et al. 2001), Randomly Amplified Polymorphic DNA
(RAPDs) (Da Silva et al. 1993, 1995; Mudge et al.
1996), Radio-labelled Amplified Fragments (RAFs)
(Jordan et al. 2004; Aitken et al. 2005), Amplified
Fragment Length Polymorphisms (AFLPs) (Hoarau
et al. 2002; Rossi et al. 2003; Aitken et al. 2005;
Reffay et al. 2005), Simple Sequence Repeats (SSRs)
(Rossi et al. 2003; Aitken et al. 2005; McIntyre et al.
2005; Reffay et al. 2005) and, more recently, Single
Nucleotide Polymorphisms (SNPs) (McIntyre et al.
2006).
The AFLP technique is widely used in sugarcane
mapping as it provides a large number of markers per
primer pair and large numbers of markers are
essential in sugarcane to provide adequate genome
coverage of the 100–130 chromosomes. SSRs are
also frequently used in sugarcane mapping. Like
RFLPs, they detect alleles at homo(eo)logous loci on
all chromosomes within a homology group. Single
dose RFLP or SSR markers that are mapped in
sugarcane can be used to assign the large number of
linkage groups to the expected eight homology
groups (HGs) (x = 8 in S. spontaneum, D’Hont et al.
1996).
In sugarcane, the largest maps contain predomi-
nantly SSR and AFLP markers. The map of French
cultivar R570 developed by Hoarau et al. (2001) and
amended by Rossi et al. (2003) contains 1169
markers distributed onto 128 LGs that could be
assigned to 7 of the expected 8 HGs. The map of
Australian cultivar Q165A (Aitken et al. 2005) con-
tains 968 markers distributed onto 136 LGs that
could be assigned to 8 HGs. On the basis of common
SSR markers, 6 HGs can be tentatively aligned
between the two maps.
Despite the large number of markers mapped in
R570 and Q165A, both maps are estimated to cover
less than 50% of the sugarcane genome. This is due to
the low number of markers mapped relative to the
large number of chromosomes in sugarcane and
raises the problem of genome coverage efficiency in
sugarcane. Deployment of a similar number of
markers for mapping in species such as sorghum
(Menz et al. 2002) or wheat (Chalmers et al. 2001)
provide excellent genome coverage, due to the
smaller number of chromosomes and genome size.
Synteny has been demonstrated between members
of the Poaceae family, allowing alignment of the
genetic maps of rice, sorghum, sugarcane, wheat, and
maize (Moore et al. 1995; Devos and Gale 1997).
Using RFLPs, several groups have demonstrated the
high level of synteny between sugarcane and other
234 Mol Breeding (2008) 21:233–247
123
diploid members of the Andropogonae tribe of the
Poaceae family such as sorghum and maize (Hulbert
et al. 1990; Grivet et al. 1994; Dufour et al. 1996;
Guimaraes et al. 1997; Ming et al. 2001, 2002;
McIntyre et al. 2005). Ming et al. (2002) constructed
a consensus genetic map in Saccharum from their 4
fragmentary sugarcane maps using a sorghum map as
a template. While each map only covered approxi-
mately 39.5–46% of the Saccharum genome, the
consensus map was estimated to cover 70% of the
genome. Asnaghi et al. (2000) used the synteny
between sorghum and sugarcane to identify new
markers for fine mapping of a major sugarcane rust
resistance gene.
The purpose of our study was to investigate the
feasibility and usefulness of comparative mapping in
sugarcane by (i) comparing the map coverage of
parents of an Australian cross, Q3, with maps of the
French cultivar R570 (Hoarau et al. 2001; Rossi et al.
2003), and the Australian cultivar, Q165A, (Aitken
et al. 2005), using common SSR and AFLP marker,
and (ii) validating QTLs associated with sugar
content from the three populations through the
identification of common QTLs.
Material and methods
Plant material
Phenotypic and genotypic data for the Q3 population
Mapping analyses were conducted in the Q3 population,
which consists of 232 I1 progeny (I1 progeny result
from a cross between two non-inbred, heterozygous at
many loci, parents) resulting from a bi-parental cross
between Q117 as the female parent and MQ77-340 as
the male parent. Q117 is an Australian cultivar bred by
BSES Ltd. MQ77-340 is an elite sugarcane parental line
developed by CSR Ltd. The mapping population was
planted in July 1998 at Ayr in the North Queensland of
Australia and replanted in July 2001. Both fields are
located at approximately 147.4�E, 19.5�S. The trial
design in both experiments was a randomised complete
block design with 4 replicates.
Genotypic information was collected as described
in Reffay et al. (2005). DNA was extracted from
freeze-dried material following the CTAB-method
described by Hoisington (1992). Amplified fragment
length polymorphism (AFLP) was conducted accord-
ing to Vos et al. (1995) with some modifications
already described in Reffay et al. (2005) while the
SSR analysis were conducted according to Rossi
et al. (2003).
The SSR markers were identified by mSSCIR (for
markers, Saccharum spp. and CIRAD) followed by
the microsatellite number and a band number, while
the polymorphic AFLP markers were identified by six
letters representing the EcoRI and the MseI primers
followed by a number or a capital letter in order to
identify the band.
Due to the high level of polyploidy, only markers
likely to be simplex (or single dose) were scored;
higher dosage markers were ignored. In the absence
of segregation distortion, single dose markers are
expected to segregate 1:1 if present in one parent and
absent in the other, or 3:1 if present in both parents
(bi-parental simplex). A chi-squared test was per-
formed at p = 5% in order to exclude duplex or
multiplex markers. Bi-parental simplex markers were
given an ‘x’ as a prefix to the marker name.
Linkage analysis of the simplex markers was
conducted using MAPMAKER 3.0 (Lander et al.
1987). The Q117 and MQ77-340 maps were con-
structed separately using the 1:1 markers first. The
3:1 markers were then analysed with the same
program after being integrated into the 1:1 marker
matrix. Two point analyses were performed at a LOD
score threshold of 5 and a recombination fraction of
0.35. Linked markers formed LG and the markers
were ordered by multipoint analysis. Distances in cM
were determined with Haldane’s mapping function.
The LG of the Q117 and MQ77-340 maps were
assigned to HG on the basis of at least one common
SSR marker and/or two AFLP markers in common, as
determined by band size on polyacrylamide gels. The
present paper introduces the Q117 map (Supplemen-
tary Figure 1) of the Q3 population; the male map
(MQ77-340) was published in Reffay et al. (2005).
All gel analyses of SSR and AFLP markers
included a lane of R570 to enable co-migrating
markers to be identified between the Q3 and R570
populations. Markers generated by these common
primer pairs were used to compare the MQ77-340
and Q117 maps with the much larger map of R570
and to re-assign Q3 HGs so that they were consistent
with R570 HG nomenclature (the R570 HGs origi-
nally annotated in Hoarau et al. (2001) are indicated
Mol Breeding (2008) 21:233–247 235
123

by roman numerals inside square brackets). The
nomenclature of final Q3 HG followed the HG
nomenclature used in R570 (Hoarau et al. 2001;
Rossi et al. 2003) because the map of R570 was
published first. For SSR markers, a Q117 or MQ77-
340 HG was assigned the same R570 HG number
when SSR alleles were present on at least one LG in
the HG. For AFLP markers, the assignment was
based on either two co-migrating AFLP markers in
MQ77-340 or Q117 that were also present in R570 or
on the basis of one co-migrating AFLP marker only if
the HG was already assigned because it contained a
common SSR marker.
Phenotypic information was collected for three sugar
content-related traits, Brix (a measure of the soluble
solids in sugarcane juice), Pol (the polarisation index of
the primary juice which accounts for the optically active
component and is therefore essentially a measure of
sucrose) and CCS (commercial cane sugar), as
described in Reffay et al. (2005), from both early
(2000, 9 month old plant cane, and 2001, 12 month
ratoon plant cane) and late (2002, 9 month old plant
cane) harvested material. All three are estimates of
sucrose content and are routinely used as selection aids
in Australian sugarcane breeding programs.
Phenotypic and genotypic data for the R570
population
The two Q3 population parental maps were compared
to the map obtained for the ‘R570’ population devel-
oped and analysed by Hoarau et al. (2001) and Rossi
et al. (2003), using the criteria defined above. The
R570 map was constructed from approximately 1200
AFLP, SSR and RFLP markers scored on a selfed
population from R570. Phenotypic information (Brix)
was collected as described in Hoarau et al. (2002).
MTA analysis of the Q3 and R570 populations
In this paper, the term MTA is used rather than QTL.
This is because the sparseness of the two Q3 parental
maps makes it difficult to determine whether linked
markers that are associated with a trait are detecting
the same or different QTL. The term ‘‘chromosomal’’
region is used to describe a cluster of two or more
loosely linked markers and may equate to a QTL.
A single factor analysis was conducted using Map
Manager QTXb16 (Meer et al. 2002) to determine
associations between markers and traits of the 232
progeny of the Q3 and 112 progeny from the R570
population. Interval mapping was conducted using
QTL-Cartographer version 2.0 but gave very similar
results to those obtained by single factor analysis.
Thus only the single factor analysis results are
presented. All MTAs were reported at P \ 0.01 in
the Q3 and R570 populations to enable a broader
comparison of MTA locations between the popula-
tions. At this low stringency, some of the MTAs are
likely to be false but, given the complexity of the
sugarcane genome which enables only a subset of
marker alleles, the simplex alleles, to be mapped,
weakly associated MTAs may be homo(eo)logous to
more stringently associated loci that are not tagged by
simplex marker alleles.
Mapping and QTL analysis in Q165A
The two Q3 population parental maps and QTL data
were compared to the map and QTL data obtained for
the cultivar Q165A (Aitken et al. 2005) to identify
SSRs mapped in all three maps and SSRs detecting
MTAs in the three maps. Q117, the female parent of
the Q3 population is also a parent of Q165A. The
Q165A map was constructed from approximately
1000 SSR, AFLP and RAF markers scored on an I1
population developed from a cross between IJ76-514
and Q165A (Aitken et al. 2005). Brix, Pol and CCS
were measured on the I1 population and QTL
analysis undertaken, as described in Aitken et al.
(2006). In this paper (Aitken et al. 2006), markers
were reported when associated with a trait at
P \ 0.005 in at least one year, or at P \ 0.01 with
two year data.
Results
Map construction in the Q3 population
A map was constructed for each parent in the Q3
population after genotyping the 232 progeny with a
set of 28 AFLP primer pairs and 33 SSR primer pairs,
as previously reported in Reffay et al. (2005). The
MQ77-340 map contains 400 markers, comprising
342 simplex (1:1) markers and 58 bi-parental simplex
236 Mol Breeding (2008) 21:233–247
123
(3:1) markers distributed onto 101 linkage groups
(LGs) (Reffay et al. 2005). Fifty-two of the LGs were
assigned to 13 HGs initially on the basis of shared
SSR loci and then into 11 HGs after comparison with
the female Q117 map (Table 1, Supplementary
Figure 1). The length of the LGs in the MQ77-340
map varied from 1.4 to 159 cM with a total map
length of 3582 cM.
The female map (Q117) contains 376 markers,
comprising 334 simplex and 42 bi-parental simplex
markers, distributed onto 93 LGs (Supplementary
Figure 1). Thirty-eight of the LGs were assigned on
the basis of shared SSR loci into 12 HGs initially, and
into 10 HGs after comparison with the male MQ77-
340 map (Table 1, Reffay et al. 2005). LGs were
assigned to HGs on the basis of single shared loci.
The length of the Q117 LGs varied from 1.8 to
115 cM and the cumulative length of this map is
3167 cM (Supplementary Figure 1).
Comparison of the maps of R570, Q117 and
MQ77-340 using common SSR and AFLP
markers
The genetic map of R570 contains a total of 1169
markers (887 AFLP, 148 RGA and 134 SSR markers)
(Rossi et al. 2003) distributed onto 128 LGs for a
combined length of 5850 cM. The 887 AFLP and 134
SSR markers mapped in R570 were generated using 37
AFLP primer pairs and 55 SSR primer pairs (Hoarau
et al. 2001; Rossi et al. 2003). Sixty-six of the 128 LGs
have been assigned to 7 HGs on the basis of at least two
RFLP (RGA) or SSR markers in common, while 62
LGs remain unassigned (Rossi et al. 2003).
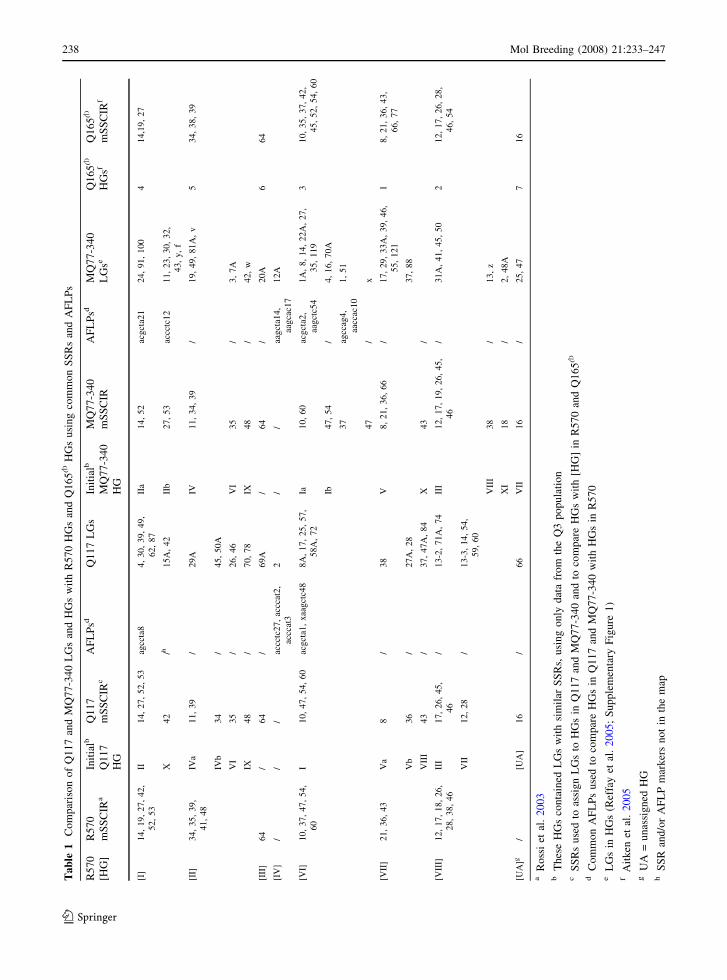
Thirty-one SSR and 18 AFLP primer pairs were
used to genotype progeny in both the Q3 and R570
populations. Using SSRs, HG II of Q3, which
contains mSSCIR14, 27, 52 and 53 was re-named
HG [I], while HGs IV, VI and IX of Q3 were
combined into one HG and re-named HG [II] on the
basis of mSSCIR 34, 35, 39 and 48 which are present
in R570 HG [II]. HG V and X of MQ77-340 and HG
V and VIII of Q117 were also combined in each map
and renamed HG [VII] (Table 1).
The 18 common AFLP primer pairs generated
many markers but only 40 were single dose AFLP
bands of identical size between R570, MQ77-340
and/or Q117. Of the 40 putatively common AFLP
markers, 14 (five were common between R570 and
Q117, eight between R570 and MQ77-340 and one
was common between R570 and a bi-parental sim-
plex marker) could be used to confirm the assignment
of a LG to an HG (Table 1), using the rules of
assignment defined above. Five putatively common
AFLP markers mapped to LGs already assigned to an
HG on the basis of an SSR marker, but the HG
assignment of the AFLP and SSR markers differed
between the Q3 and R570 maps (data not shown); the
remaining 21 putatively common AFLP markers
could not be assigned to any HGs as they were
located on unassigned LGs (data not shown).
The use of common SSR and AFLP markers also
enabled several previously unassigned LGs from both
MQ77-340 and Q117 maps to be assigned to HGs
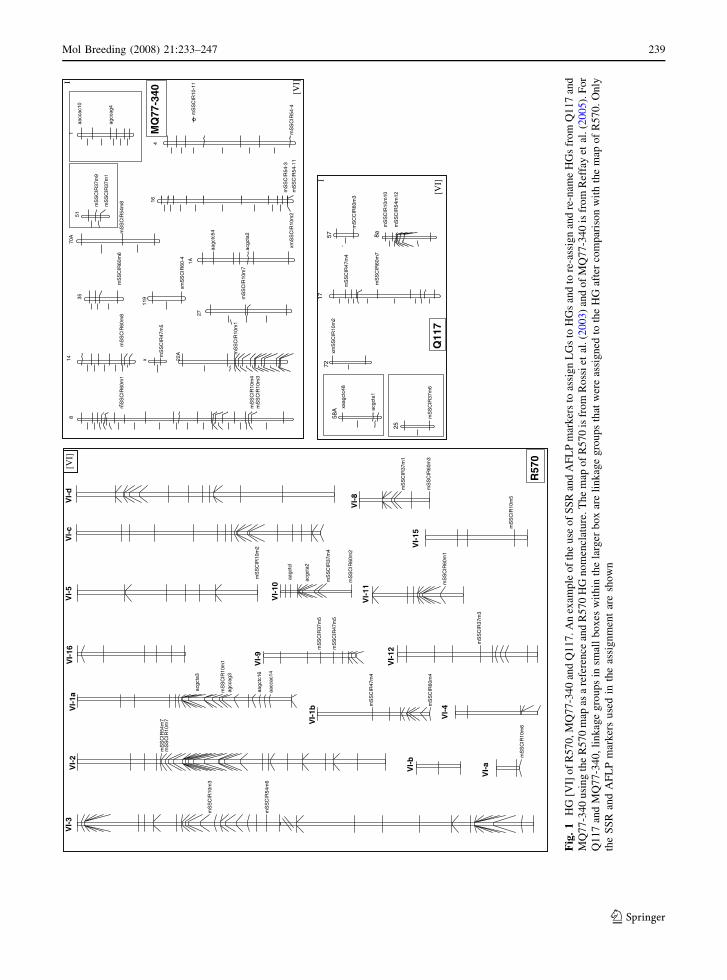
(Table 1). An example of the re-assigning and re-
naming of MQ77-340 and Q117 LGs and HGs after
comparison with the larger map of R570 is shown in
Fig. 1.
Only one SSR mapped to different HGs in the two
populations, mSSCIR 19 (Table 1). LG 50 which
contains mSSCIR19 and mSSCIR46 was assigned to
former HG III in the MQ77-340 map. This MQ77-
340 HG equates to HG [VIII] of R570, because both
HG contain SSRs mSSCIR26 and mSSCIR46. How-
ever, mSSCIR 19 was mapped to HG [I] of R570 as it
was linked to mSSCIR 14, mSSCIR 27, mSSCIR 42,
mSSCIR52, and mSSCIR 53 in this population.
After comparison with the R570 map using common
SSR and AFLP markers, a total of 90 LGs (46%) out of
194 (52 of the 101 and 38 of the 93 LGs of MQ77-340
and Q117, respectively), have now been assigned to
HGs (Table 1). Ten of the 11 MQ77-340 HGs and all
10 Q117 HGs have been assigned to 7 HGs and
re-named to be consistent with the HG nomenclature
used in R570 (Table 1). MQ77-340 HG VII could not
be assigned with any R570 HG as this MQ77-340 HG
contains mSSCIR16 and no common AFLP markers,
and mSSCIR16 has not been mapped in R570.
Comparison of the maps of Q165A, Q117 and
MQ77-340 using SSR markers
After initially comparing the Q117 and MQ77-340
maps with the map of R570, a further comparison
was undertaken with the recently published Q165A
map. The genetic map of Q165A contains a total of
Mol Breeding (2008) 21:233–247 237
123
Ta
ble
1C
om
par
iso
no
fQ
11
7an
dM
Q7
7-3
40
LG
san
dH
Gs
wit
hR
57
0H
Gs
and
Q1
65A
HG
su
sin
gco
mm
on
SS
Rs
and
AF
LP
s
R5
70
[HG
]
R5
70
mS
SC
IRa
Init
ialb
Q1
17
HG
Q1
17
mS
SC
IRc
AF
LP
sdQ
11
7L
Gs
Init
ialb
MQ
77
-34
0
HG
MQ
77
-34
0
mS
SC
IR
AF
LP
sdM
Q7
7-3
40
LG
seQ
16
5A
HG
sfQ
16
5A
mS
SC
IRf
[I]
14,
19,
27,
42,
52,
53
II14,
27,
52,
53
agcc
ta8
4,
30,
39,
49,
62,
87
IIa
14,
52
acgct
a21
24,
91,
100
414,1
9,
27
X42
/h15A
,42
IIb
27,
53
accc
tc12
11,
23,
30,
32,
43,
y,
f
[II]
34,
35,
39,
41,
48
IVa
11,
39
/29A
IV11,
34,
39
/19,
49,
81A
,v
534,
38,
39
IVb
34
/45,
50A
VI
35
/26,
46
VI
35
/3,
7A
IX48
/70,
78
IX48
/42,
w
[III
]64
/64
/69A
/64
/20A
664
[IV
]/
//
accc
tc27,
accc
at2,
accc
at3
2/
/aa
gct
a14,
aagca
c17
12A
[VI]
10,
37,
47,
54,
60
I10,
47,
54,
60
acgct
a1,
xaa
gct
c48
8A
,17,
25,
57,
58A
,72
Ia10,
60
acgct
a2,
aagct
c54
1A
,8,
14,
22A
,27,
35,
119
310,
35,
37,
42,
45,
52,
54,
60
Ib47,
54
/4,
16,
70A
37
agcc
ag4,
aacc
ac10
1,
51
47
/x
[VII
]21,
36,
43
Va
8/
38
V8,
21,
36,
66
/17,
29,
33A
,39,
46,
55,
121
18,
21,
36,
43,
66,
77
Vb
36
/27A
,28
37,
88
VII
I43
/37,
47A
,84
X43
/
[VII
I]12,
17,
18,
26,
28,
38,
46
III
17,
26,
45,
46
/13-2
,71A
,74
III
12,
17,
19,
26,
45,
46
/31A
,41,
45,
50
212,
17,
26,
28,
46,
54
VII
12,
28
/13-3
,14,
54,
59,
60
VII
I38
/13,
z
XI
18
/2,
48A
[UA
]g/
[UA
]16
/66
VII
16
/25,
47
716
aR
oss
iet
al.
20
03
bT
hes
eH
Gs
con
tain
edL
Gs
wit
hsi
mil
arS
SR
s,u
sin
go
nly
dat
afr
om
the
Q3
po
pu
lati
on
cS
SR
su
sed
toas
sig
nL
Gs
toH
Gs
inQ
11
7an
dM
Q7
7-3
40
and
toco
mp
are
HG
sw
ith
[HG
]in
R5
70
and
Q1
65A
dC
om
mo
nA
FL
Ps
use
dto
com
par
eH
Gs
inQ
11
7an
dM
Q7
7-3
40
wit
hH
Gs
inR
57
0e
LG
sin
HG
s(R
effa
yet
al.
20
05
;S
up
ple
men
tary
Fig
ure
1)
fA
itk
enet
al.
20
05
gU
A=
un
assi
gn
edH
Gh
SS
Ran
d/o
rA
FL
Pm
ark
ers
no
tin
the
map
238 Mol Breeding (2008) 21:233–247
123
01cacc aa
1atcgca
4ctcgaax8
2a tcgca
Ictcgaa
61ctcgaa
]IV[
d-IV
c-IV
61- IV
a- IV
6m01
RIC
SS
m
4- IV
V2-I
m45R I
CS
Sm
7 7m01
RIC
SS
m
Va1-I
m01R I
CS
Sm
1
01-IV
2m06
R IC
SS
m
m73RI
CS
Sm
4
5m01
RIC
SS
m
51-IV
9-IV
5m73
RIC
SS
m
5m74
RIC
SS
m
V8-I
1m7 3
R IC
SS
m
3m06
RIC
SS
m
21 -IV
3m7 3
RIC
SS
m
2m01
R IC
SS
m
5-IV
3 -IV
3m01
R IC
SS
m
6m45
RIC
SS
m
1m06
RIC
SS
m11-IV
Vb1-I
4m74
RIC
SS
m
4m06
RIC
SS
m
b- IV
m06RI
CS
Sm
8
4 1
m06RI
CS
Sm
1
m01RI
CS
Sm
4m01
RIC
SS
m3
8
]IV[
I
m73RI
CS
Sm
9 1m73
RIC
SS
m
15
m0 6RI
CS
Sm
6
53
m01RI
CS
Sm
7
72
m45RI
CS
Sm
8
A07
-45RI
CS
Sm
3 1-45RI
CS
Sm
1
61
-45RI
CS
Sm
4
4
x
A22
gaccga4
1
45ctcg aa
2atcgca
2m01
RIC
SS
mx
A1
-06RI
CS
Smx
4
9 11
m74RI
CS
Sm
5 1m01
RIC
SS
m
3m06
RIC
CS
m
75
m73RI
CS
Sm
6
52
2m01
RIC
SS
mx27
4m74
R IC
SS
m
m06R I
CS
Sm
7
71
1m 01
RIC
SS
m0 1
m45RI
CS
Sm
2
a8
A85
3atcgca
3gaccga
41caccaa
075R
43-77Q
M0
711Q
I ]IV[
11-0 1RI
CS
Sm
Fig
.1
HG
[VI]
of
R5
70
,M
Q7
7-3
40
and
Q1
17
.A
nex
amp
leo
fth
eu
seo
fS
SR
and
AF
LP
mar
ker
sto
assi
gn
LG
sto
HG
san
dto
re-a
ssig
nan
dre
-nam
eH
Gs
fro
mQ
11
7an
d
MQ
77
-34
0u
sin
gth
eR
57
0m
apas
are
fere
nce
and
R5
70
HG
no
men
clat
ure
.T
he
map
of
R5
70
isfr
om
Ro
ssi
etal
.(2
00
3)
and
of
MQ
77
-34
0is
fro
mR
effa
yet
al.(2
00
5).
Fo
r
Q1
17
and
MQ
77
-34
0,
lin
kag
eg
rou
ps
insm
all
bo
xes
wit
hin
the
larg
erb
ox
are
lin
kag
eg
rou
ps
that
wer
eas
sig
ned
toth
eH
Gaf
ter
com
par
iso
nw
ith
the
map
of
R57
0.
On
ly
the
SS
Ran
dA
FL
Pm
ark
ers
use
din
the
assi
gn
men
tar
esh
ow
n
Mol Breeding (2008) 21:233–247 239
123
967 markers generated from 40 AFLP primer pairs
and 72 SSR primer pairs. These markers are distrib-
uted onto 116 LGs, and 96 of the 116 LGs have been
assigned to 8 HGs (Aitken et al. 2005).
Thirty-three SSRs primer pairs were used to
generate markers in the R570 and Q165A maps.
Using the assignment of linked SSRs to HGs in the
two maps, six of the HGs can be tentatively identified
as the same HG (Table 1). Of the 33 SSRs, five have
been mapped to LGs which are assigned to different
HGs (Table 1). To confirm the assignment of the Q3
population parental maps, the Q117 and MQ77-340
maps were also compared with the map of Q165A.
Twenty-nine SSR primers pairs were used to geno-
type both the Q165A and Q3 populations. Of these 29
SSRs, all but three were also mapped in R570. This
comparison confirmed the assignment of Q3 LGs to
HGs and enabled assignment of the previously
unassignment MQ77-340 HG to Q165A HG 7.
After comparing the Q3 maps with the maps of
R570 and Q165A, a total of 90 out of 194 LGs have
now been allocated to seven of the eight HGs of
sugarcane. The eighth HG of Q165A contains only
one single-locus SSR that has not been mapped in
either the R570 or Q3 populations.
MTA analysis of the Q3 population
Marker-trait associations (MTA) were investigated
for the three sugar content-related traits for both the
early harvest (1999 and 2000) and late harvest (2002)
data. Tables 2 and 3, and Supplementary Tables 1
and 2, summarise the MTA detected for simplex
markers derived from Q117 and MQ77-340, respec-
tively, including the direction and the size of the
marker effect. Table 4 and Supplementary Table 3
summarise MTAs for the bi-parental simplex markers.
MTAs with both positive and negative effects on the
traits were observed (Tables 2–4). Individual marker
effects were small and explained from 3 to 7% of the
phenotypic variation (Supplementary Tables 1–3).
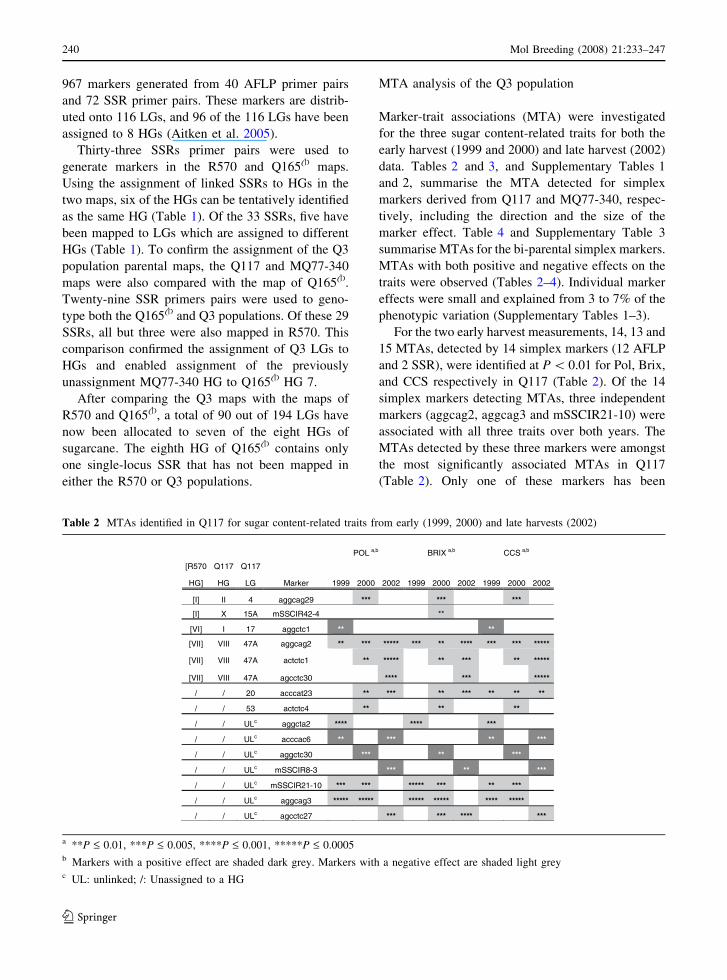
For the two early harvest measurements, 14, 13 and
15 MTAs, detected by 14 simplex markers (12 AFLP
and 2 SSR), were identified at P \ 0.01 for Pol, Brix,
and CCS respectively in Q117 (Table 2). Of the 14
simplex markers detecting MTAs, three independent
markers (aggcag2, aggcag3 and mSSCIR21-10) were
associated with all three traits over both years. The
MTAs detected by these three markers were amongst
the most significantly associated MTAs in Q117
(Table 2). Only one of these markers has been
Table 2 MTAs identified in Q117 for sugar content-related traits from early (1999, 2000) and late harvests (2002)
POL a,b BRIX a,b CCS a,b
[R570 Q117 Q117
HG] HG LG Marker 1999 2000 2002 1999 2000 2002 1999 2000 2002
[I] II 4 aggcag29 *** *** ***
[I] X 15A mSSCIR42-4 **
[VI] I 17 aggctc1 ** **
[VII] VIII 47A aggcag2 ** *** ***** *** ** **** *** *** *****
[VII] VIII 47A actctc1 ** ***** ** *** ** *****
[VII] VIII 47A agcctc30 **** *** *****
/ / 20 acccat23 ** *** ** *** ** ** **
/ / 53 actctc4 ** ** **
/ / ULc aggcta2 **** **** ***
/ / ULc acccac6 ** *** ** ***
/ / ULc aggctc30 *** ** ***
/ / ULc mSSCIR8-3 *** ** ***
/ / ULc mSSCIR21-10 *** *** ***** *** ** ***
/ / ULc aggcag3 ***** ***** ***** ***** **** *****
/ / ULc agcctc27 *** *** **** ***
a **P £ 0.01, ***P £ 0.005, ****P £ 0.001, *****P £ 0.0005b Markers with a positive effect are shaded dark grey. Markers with a negative effect are shaded light greyc UL: unlinked; /: Unassigned to a HG
240 Mol Breeding (2008) 21:233–247
123
assigned to a HG (HG [VII]); the remainder map to an
unassigned linkage group or are unlinked markers.
Three additional markers were associated only in
2000 for all three traits, while one marker was
associated only in 1999.
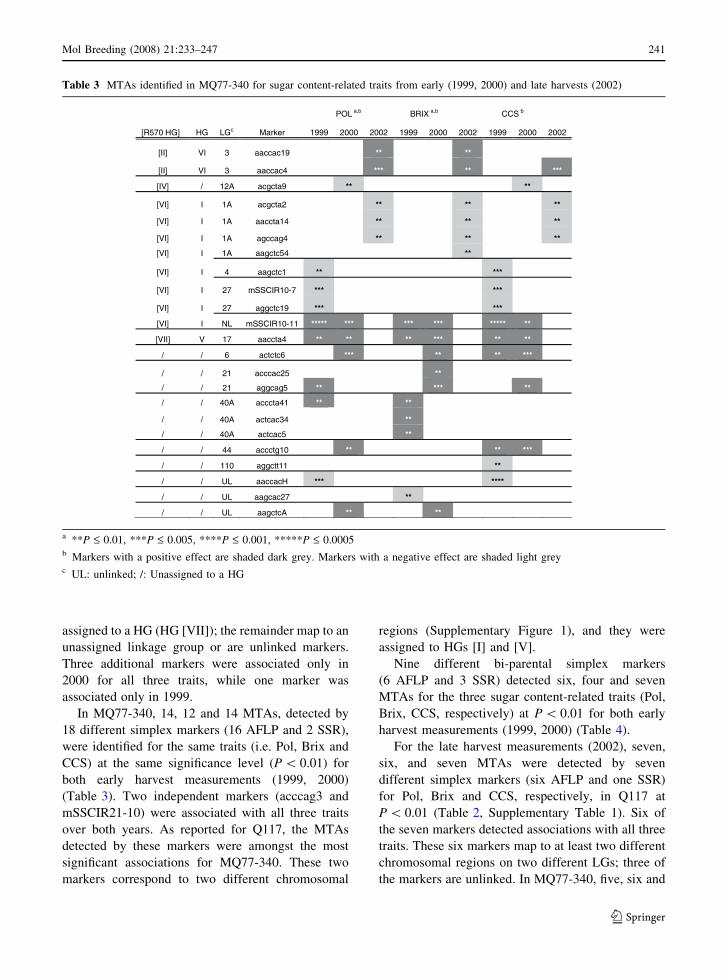
In MQ77-340, 14, 12 and 14 MTAs, detected by
18 different simplex markers (16 AFLP and 2 SSR),
were identified for the same traits (i.e. Pol, Brix and
CCS) at the same significance level (P \ 0.01) for
both early harvest measurements (1999, 2000)
(Table 3). Two independent markers (acccag3 and
mSSCIR21-10) were associated with all three traits
over both years. As reported for Q117, the MTAs
detected by these markers were amongst the most
significant associations for MQ77-340. These two
markers correspond to two different chromosomal
regions (Supplementary Figure 1), and they were
assigned to HGs [I] and [V].
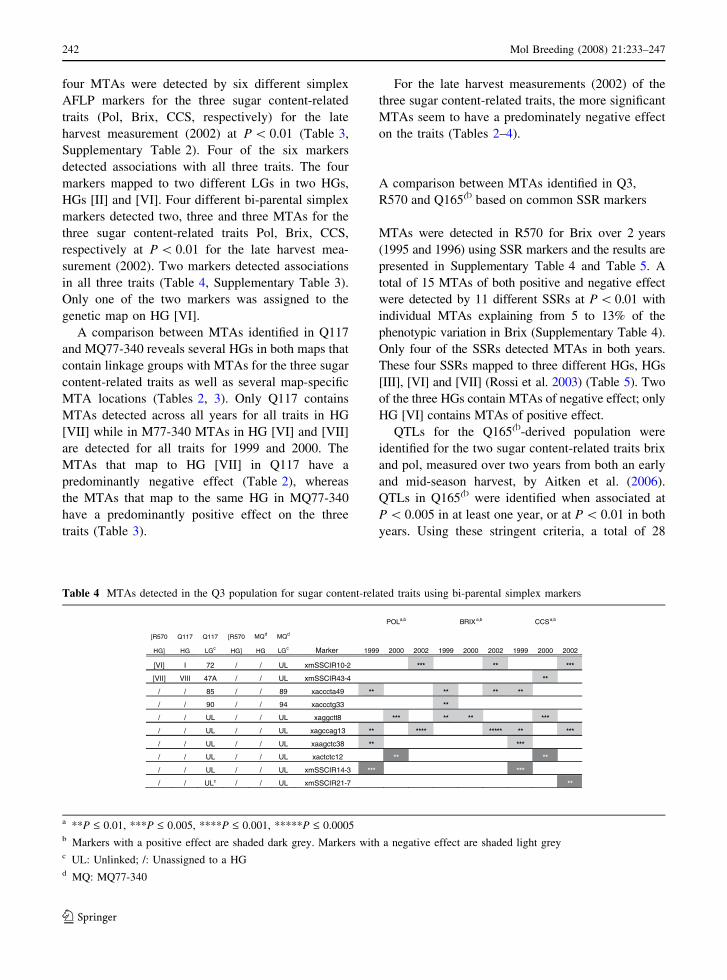
Nine different bi-parental simplex markers
(6 AFLP and 3 SSR) detected six, four and seven
MTAs for the three sugar content-related traits (Pol,
Brix, CCS, respectively) at P \ 0.01 for both early
harvest measurements (1999, 2000) (Table 4).
For the late harvest measurements (2002), seven,
six, and seven MTAs were detected by seven
different simplex markers (six AFLP and one SSR)
for Pol, Brix and CCS, respectively, in Q117 at
P \ 0.01 (Table 2, Supplementary Table 1). Six of
the seven markers detected associations with all three
traits. These six markers map to at least two different
chromosomal regions on two different LGs; three of
the markers are unlinked. In MQ77-340, five, six and
Table 3 MTAs identified in MQ77-340 for sugar content-related traits from early (1999, 2000) and late harvests (2002)
POL a,b a,b bBRIX CCS
[R570 HG] HG LGc Marker 1999 2000 2002 1999 2000 2002 1999 2000 2002
[II] VI 3 aaccac19 ** **
[II] VI 3 aaccac4 *** ** ***
[IV] / 12A acgcta9 ** **
[VI] I 1A acgcta2 ** ** **
[VI] I 1A aaccta14 ** ** **
[VI] I 1A agccag4 ** ** **
[VI] I 1A aagctc54 **
[VI] I 4 aagctc1 ** ***
[VI] I 27 mSSCIR10-7 *** ***
[VI] I 27 aggctc19 *** ***
[VI] I NL mSSCIR10-11 ***** *** *** *** ***** **
[VII] V 17 aaccta4 ** ** ** *** ** **
/ / 6 actctc6 *** ** ** ***
/ / 21 acccac25 **
/ / 21 aggcag5 ** *** **
/ / 40A acccta41 ** **
/ / 40A actcac34 **
/ / 40A actcac5 **
/ / 44 accctg10 ** ** ***
/ / 110 aggctt11 **
/ / UL aaccacH *** ****
/ / UL aagcac27 **
/ / UL aagctcA ** **
a **P £ 0.01, ***P £ 0.005, ****P £ 0.001, *****P £ 0.0005b Markers with a positive effect are shaded dark grey. Markers with a negative effect are shaded light greyc UL: unlinked; /: Unassigned to a HG
Mol Breeding (2008) 21:233–247 241
123
four MTAs were detected by six different simplex
AFLP markers for the three sugar content-related
traits (Pol, Brix, CCS, respectively) for the late
harvest measurement (2002) at P \ 0.01 (Table 3,
Supplementary Table 2). Four of the six markers
detected associations with all three traits. The four
markers mapped to two different LGs in two HGs,
HGs [II] and [VI]. Four different bi-parental simplex
markers detected two, three and three MTAs for the
three sugar content-related traits Pol, Brix, CCS,
respectively at P \ 0.01 for the late harvest mea-
surement (2002). Two markers detected associations
in all three traits (Table 4, Supplementary Table 3).
Only one of the two markers was assigned to the
genetic map on HG [VI].
A comparison between MTAs identified in Q117
and MQ77-340 reveals several HGs in both maps that
contain linkage groups with MTAs for the three sugar
content-related traits as well as several map-specific
MTA locations (Tables 2, 3). Only Q117 contains
MTAs detected across all years for all traits in HG
[VII] while in M77-340 MTAs in HG [VI] and [VII]
are detected for all traits for 1999 and 2000. The
MTAs that map to HG [VII] in Q117 have a
predominantly negative effect (Table 2), whereas
the MTAs that map to the same HG in MQ77-340
have a predominantly positive effect on the three
traits (Table 3).
For the late harvest measurements (2002) of the
three sugar content-related traits, the more significant
MTAs seem to have a predominately negative effect
on the traits (Tables 2–4).
A comparison between MTAs identified in Q3,
R570 and Q165A based on common SSR markers
MTAs were detected in R570 for Brix over 2 years
(1995 and 1996) using SSR markers and the results are
presented in Supplementary Table 4 and Table 5. A
total of 15 MTAs of both positive and negative effect
were detected by 11 different SSRs at P \ 0.01 with
individual MTAs explaining from 5 to 13% of the
phenotypic variation in Brix (Supplementary Table 4).
Only four of the SSRs detected MTAs in both years.
These four SSRs mapped to three different HGs, HGs
[III], [VI] and [VII] (Rossi et al. 2003) (Table 5). Two
of the three HGs contain MTAs of negative effect; only
HG [VI] contains MTAs of positive effect.
QTLs for the Q165A-derived population were
identified for the two sugar content-related traits brix
and pol, measured over two years from both an early
and mid-season harvest, by Aitken et al. (2006).
QTLs in Q165A were identified when associated at
P \ 0.005 in at least one year, or at P \ 0.01 in both
years. Using these stringent criteria, a total of 28
Table 4 MTAs detected in the Q3 population for sugar content-related traits using bi-parental simplex markers
POLa,b BRIXa,b CCSa,b
[R570 Q117 Q117 [R570 MQd MQd
HG] HG LGc HG] HG LGc Marker 1999 2000 2002 1999 2000 2002 1999 2000 2002
[VI] I 72 / / UL xmSSCIR10-2 *** ** ***
[VII] VIII 47A / / UL xmSSCIR43-4 **
/ / 85 / / 89 xacccta49 ** ** ** **
/ / 90 / / 94 xaccctg33 **
/ / UL / / UL xaggctt8 *** ** ** ***
/ / UL / / UL xagccag13 ** **** ***** ** ***
/ / UL / / UL xaagctc38 ** ***
/ / UL / / UL xactctc12 ** **
/ / UL / / UL xmSSCIR14-3 *** ***
/ / ULc / / UL xmSSCIR21-7 **
a **P £ 0.01, ***P £ 0.005, ****P £ 0.001, *****P £ 0.0005b Markers with a positive effect are shaded dark grey. Markers with a negative effect are shaded light greyc UL: Unlinked; /: Unassigned to a HGd MQ: MQ77-340
242 Mol Breeding (2008) 21:233–247
123
QTLs were detected overall of which 23 were
detected from early harvest data and 21 from mid-
season harvest data. For the early harvest data, 11
QTLs, mapping to five different HGs, were detected
in both years data, while eight QTLs, mapping to four
different HGs, were detected in both years from mid-
season harvest data (Aitken et al. 2006). Each MTA
explained between 3 and 9 % of the phenotypic
variation. Ten of the 28 QTLs were detected by nine
SSRs of which four had also been mapped in R570
and/or Q3 (mSSCIR SSRs). These four SSRs mapped
to the equivalent of R570 HGs [II], [III] and [VII].
Three of the four SSRs detected QTLs in the early-
season or in the mid-season harvest data from Q165A,
and two of the four detected QTLs in both data sets.
The remaining 6 SSRs, while not mapped in either
Q3 or R570, mapped to HGs that could be aligned
R570 HGs [I] and [VIII] (data not shown).
MTAs were compared between the four maps
using both common SSR primers and AFLP markers.
None of the AFLP markers common to R570 and the
Q3 population were associated with any of the traits
analysed (data not shown). No attempt was made to
compare the AFLP markers between Q3 and Q165A.
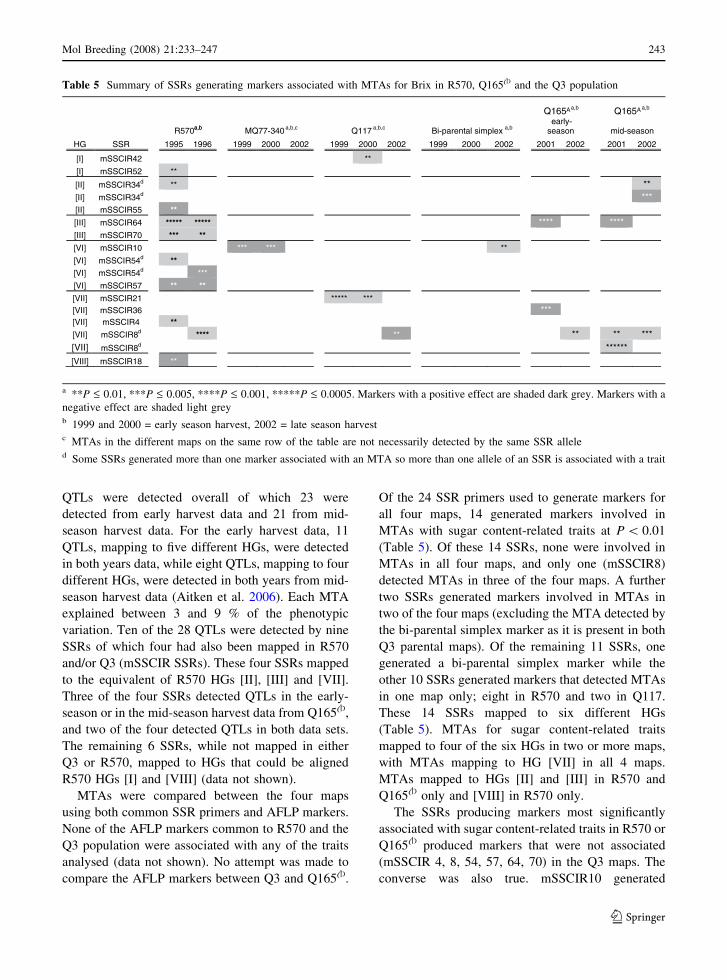
Of the 24 SSR primers used to generate markers for
all four maps, 14 generated markers involved in
MTAs with sugar content-related traits at P \ 0.01
(Table 5). Of these 14 SSRs, none were involved in
MTAs in all four maps, and only one (mSSCIR8)
detected MTAs in three of the four maps. A further
two SSRs generated markers involved in MTAs in
two of the four maps (excluding the MTA detected by
the bi-parental simplex marker as it is present in both
Q3 parental maps). Of the remaining 11 SSRs, one
generated a bi-parental simplex marker while the
other 10 SSRs generated markers that detected MTAs
in one map only; eight in R570 and two in Q117.
These 14 SSRs mapped to six different HGs
(Table 5). MTAs for sugar content-related traits
mapped to four of the six HGs in two or more maps,
with MTAs mapping to HG [VII] in all 4 maps.
MTAs mapped to HGs [II] and [III] in R570 and
Q165A only and [VIII] in R570 only.
The SSRs producing markers most significantly
associated with sugar content-related traits in R570 or
Q165A produced markers that were not associated
(mSSCIR 4, 8, 54, 57, 64, 70) in the Q3 maps. The
converse was also true. mSSCIR10 generated
Table 5 Summary of SSRs generating markers associated with MTAs for Brix in R570, Q165A and the Q3 population
Q165A Q165A
R570a,b MQ77-340a,b a,b,c a,b,c a,b
a,b a,b
Q117 Bi-parental simplex early-season mid-season
HG SSR 1995 1996 1999 2000 2002 1999 2000 2002 1999 2000 2002 2001 2002 2001 2002
[I] mSSCIR42 **
[I] mSSCIR52 **
[II] mSSCIR34d ** **[II] mSSCIR34d ***[II] mSSCIR55 **
[III] mSSCIR64 ***** ***** **** ****[III] mSSCIR70 *** **
[VI] mSSCIR10 *** *** **
[VI] mSSCIR54d **
[VI] mSSCIR54d ***
[VI] mSSCIR57 ** **
[VII] mSSCIR21 ***** ***[VII] mSSCIR36 ***[VII] mSSCIR4 **
[VII] mSSCIR8d **** ** ** ** ***[VII] mSSCIR8d ******
[VIII] mSSCIR18 **
a **P £ 0.01, ***P £ 0.005, ****P £ 0.001, *****P £ 0.0005. Markers with a positive effect are shaded dark grey. Markers with a
negative effect are shaded light greyb 1999 and 2000 = early season harvest, 2002 = late season harvestc MTAs in the different maps on the same row of the table are not necessarily detected by the same SSR alleled Some SSRs generated more than one marker associated with an MTA so more than one allele of an SSR is associated with a trait
Mol Breeding (2008) 21:233–247 243
123
markers that were associated at low P values in
MQ77-340, but not associated in R570, Q165A or
Q117. Similarly, mSSCIR21 markers were associated
at low P values in Q117 but not associated in R570,
Q165A or MQ77-340 (Table 5).
Discussion
The Q3 maps and their alignment with R570 and
Q165A
High levels of genome coverage in a polyploid such
as sugarcane are difficult to obtain. With approxi-
mately 1000–1200 markers, the R570 and Q165A
maps are estimated to cover less than one-half of the
genome (Aitken et al. 2005); in the Q3 maps, with
approximately 400 markers on each parent map, only
20% of the genome is estimated to be covered.
Several comparative mapping studies have been
undertaken in sugarcane to assist in genome coverage
or in order to obtain a better understanding of the
constitution and alignment of chromosomes between
different species within a family. D’Hont et al.
(1994) undertook the first comparison between sug-
arcane and a relative, maize. Since then, sugarcane
maps have been compared to a variety of other
species, including sorghum, maize and rice (Grivet
et al. 1994; Dufour et al. 1996; Glaszmann et al.
1997; Guimaraes et al. 1997; Ming et al. 1998).
However, no study has yet reported using a compar-
ative mapping approach between sugarcane cultivar
maps of agronomical interest to increase genome
coverage and to validate QTLs.
The major benefit of the comparison of the Q3
maps with the maps of R570 and Q165A was the
assignment and re-naming of all of the Q3 HGs using
the two larger maps as reference. This assignment of
HGs, using the HG nomenclature of R570, provided
structure to the two fragmentary Q3 parental maps,
and indicated that two HGs ([IV] and [V]) were
apparently not covered at all (HG [IV] is assigned
only on the basis of common AFLP markers). Some
of the unassigned LGs in the two maps may originate
from these two HGs but until more SSR/RFLP/AFLP
markers are mapped in the Q3 population, these HGs
are effectively untagged. It should be noted, however,
that the two HGs not represented in the Q3 maps are
two of the smallest HGs in the R570 and Q165A
maps (Rossi et al. 2003; Aitken et al. 2005) and
hence alignment with these two HGs will always be
difficult. It is possible that these two HGs contain a
low frequency of simplex markers.
Most of the HG assignments were based on single
common SSR primers and hence HG assignments are
only tentative. It would have been more rigorous to
base the HG assignments on two or more SSR
primers; two or more common SSR primers would
also have enabled LGs to be aligned and oriented
correctly. However, the relatively small number of
common SSR primers and the large number of
sugarcane LGs prevented such a rigorous assignment.
All common SSR primers were used to assign and
align LGs and HGs in Q3 with R570 and the only
discrepancy observed was mSSCIR19 which mapped
to different HGs in R570 and MQ77-340. Interest-
ingly, it mapped to the corresponding R570 HG in
Q165A, suggesting that either it is mis-assigned in
MQ77-340 or that there is a chromosomal rearrange-
ment in MQ77-340 compared to R570 and Q165A. A
simple explanation for this could be that some SSR
are present as duplicated loci and that different loci
have been mapped in MQ77-340 compared with
R570 and Q165A. Several sugarcane SSRs have been
observed to map to multiple HGs already, including
mSSCIR 40 which maps to both HG [III] and [VI] in
R570 (unmapped in Q165A), mSSCIR 42 which
maps to HGs [I] and [III](and HG 3 in Q165A =
R570 HG [VI]) and mSMC292MS which maps to
every HG but HG8 in Q165A (Rossi et al. 2003;
Aitken et al. 2005). An alternative hypothesis could be
that there are minor structural rearrangements between
the sugarcane clones. Approximately 10–15% of the
sugarcane genome consists of recombinant chromo-
somes between S. officinarum and S. spontaneum
(Piperidis and D’Hont 2001). Little is known about the
chromosomes involved in these recombination events
and it is possible that they involve chromosomes from
different HGs (Aitken et al. 2005).
To increase the number of markers available for
map alignment, we also used AFLP markers to
compare the Q3 maps with the map of R570. AFLP
markers have been used to align genetic maps in
other species including maize. Vuylsteke et al. (1999)
analysed the distribution of AFLP markers in two
maize genetic maps and found numerous AFLP
markers that mapped at the same position on the two
maps.
244 Mol Breeding (2008) 21:233–247
123
A total of 40 simplex AFLP markers were
identical in size between R570 and Q117 and/or
MQ77-340. Fourteen (35%) of them were used for
HG assignment and mapped to a LG allocated to the
same HG in the two populations. Five other AFLP
markers mapped to LGs assigned to other HGs. It is
possible that these AFLP markers were DNA frag-
ments of the same size that came from different parts
of the genome in R570 and Q117/MQ77-340. Alter-
natively, as indicated above for SSRs, they could
indicate a minor structural rearrangement between
R570 and Q117/MQ77-340. Sequencing of these
AFLP markers could help to determine whether the
markers of identical size are the same marker or not.
So while the number of AFLP markers used to align
the R570 and Q117/MQ77-340 sugarcane maps is
limited, this approach appears useful and comple-
mentary to SSR primer-based alignment.
Identification and validation of new MTAs via
comparative mapping
Numerous MTAs were detected for the three sugar
content-related traits in the Q3 population. Each
MTA explained between 3% and 8% of the pheno-
typic variation and were comparable in size to MTAs
identified by Hoarau et al. (2002) and Aitken et al.
(2006) but were inferior in magnitude to MTAs
obtained by Ming et al. (2002) (up to 15%). This
difference may be due to the different genetic
structures of the selected populations. Ming et al.
(2002) analysed sugar content-related MTAs in two
F1 populations derived from crosses between two
wild Saccharum hybrids and two S. spontaneum
clones. These populations, due to their origin, are
likely to exhibit more extensive variation for sugar
content-related traits. The Q165A, R570 and Q3
populations involve elite sugarcane material which
are likely to have been enriched for superior alleles
controlling high sugar content during cycles of
breeding and selection, resulting in a reduced allele
contrast within loci underlying the target trait. The
difference between the phenotypic variations
explained by the MTAs could also be the result of
different statistical thresholds used in the analysis.
The identification of common QTLs in more than
one population is an important validation exercise
and has been used in many species for many different
traits. In our study, none of the SSR primers
generated markers involved in MTAs in all four
maps, and only one detected MTAs in 3 of the 4
maps. While MTAs were detected in the Q3 and
R570 populations at a similar P value, a higher
stringency was used in Q165A (Aitken et al. 2006);
this would have resulted in fewer common SSRs
detecting MTAs between Q165A and the other 3
maps. Q117 is a parent of Q165A (P.A. Jackson, pers.
comm.), and would be expected to contribute
approximately half of its chromosomes to Q165A;
the LG and HG of the Q117 map aligned equally well
with both R570 and Q165A. Only one of the common
SSRs (mSSCIR 8 on HG [VII]) detected MTAs in
both Q117 and its progeny Q165A. Nevertheless the
most significant sugar-content QTL in Q117 was
associated with mSSCIR28 in the same HG[VII] and
this HG also contains a major QTL in Q165A in a
similar region (Aitken et al. 2005). Other major
sugar-content QTL in Q165A have presumably been
inherited from the second parent of Q165A.
The association between markers generated by
three of the SSRs (mSSCIR8, 34 and 64) and sugar
content-related traits in two or three maps and the
localisation of MTAs to 3 HGs ([II], [III], [VII]) in
two or more maps validate the association between
these markers and traits and provide additional
evidence for the role of these chromosomal regions
on expression of these traits. These results support
previous results that suggest that the factors involved
in sugar production are distributed throughout the
sugarcane genome and this provides essential infor-
mation for implementation of future marker-assisted
selection projects.
Also of interest from an industry perspective was the
observed association between markers generated by
one SSR and mid-to late season harvest data in both the
Q3 population and in Q165A (Aitken et al. 2006). The
validation of that MTA in the two populations suggests
that different QTLs may be involved in the production
of sucrose early and late in the season, which may
allow some varieties to be harvested with high sucrose
content earlier or later in the season as previously
suggested by Aitken et al. (2006).
Of the SSRs mapped in all four maps, those that
were associated with sugar content-related traits in
the R570 map were also associated at high signifi-
cance levels in the Q165A map but were usually not
associated at all in the Q3 population. Similarly, the
Mol Breeding (2008) 21:233–247 245
123
most significantly associated SSRs in the Q3 popu-
lation were not associated with these traits in either
the R570 or the Q165A maps. There are several
possible explanations for these observations. Firstly,
a more stringent threshold was used to detect MTAs
in the Q165A map and hence SSRs involved in MTAs
in the other three maps may not have been reported as
associated in the Q165A map if the P value was
below the cut-off. Secondly, not all alleles of an SSR
will have been incorporated into these maps as only
simplex alleles can be mapped. A SSR allele may be
a simplex marker in one parental line and mapped,
but multi-dose in another population parental line and
not mapped. The weak association or absence of an
association between SSR alleles and the traits may
mean that different chromosomes, carrying different
SSR alleles and sugar content-related trait genes,
within a homology group have been tagged in each
map. Alternatively, the SSR markers may be tagging
the same chromosomes, but the alleles at these sugar
content-related trait genes may have different effects
on the amount of each sugar content-related trait in
the different sugarcane varieties. The SSR primers
that detected strong associations in one population
but not in the other two populations suggest that
further work should target these HGs and chromo-
somal regions for markers associated with these sugar
content-related traits. These SSR primers could also
be examined for the presence of multi-dose, and
hence unmapped, markers and their potential associ-
ation with sugar content-related traits evaluated.
These results have demonstrated the value of, and
also the difficulty associated with, comparative
mapping in sugarcane. After comparison with the
larger R570 and Q165A maps, all Q3 HGs and
several unassigned LGs in the smaller Q3 population
parental maps could be tentatively assigned to HGs.
This assignment confirmed the sparse genome cov-
erage of the Q3 population parental maps. It also
identified which sugarcane HGs were poorly covered
or not covered in these maps and hence which HGs
should be targeted, and which SSRs selected, to assist
in expanding genome coverage or to find markers
associated with traits of interest on those HGs. The
association between SSRs and sugar content-related
traits in more than one population and the observed
localisation of MTAs to the same HGs in more than
one population have also assisted in validating these
MTAs and confirming the role of these chromosomal
regions in the expression of these sugar content-
related traits.
Acknowledgements We are grateful for the PhD scholarship
to NP provided by Le Conseil Regional de la Reunion in La
Reunion, for travel support to NP, PB and CLM provided by
the Embassy of France in Australia, and to the Sugar Research
and Development Corporation, Australia, for funding this
research.
References
Aitken K, Jackson PA, McIntyre CL (2005) A combination of
AFLP and SSR markers provides extensive map coverage
and identification of homo(eo)logous linkage groups in a
sugarcane cultivar. Theor Appl Genet 110:789–801
Aitken K, Jackson PA, McIntyre CL (2006) QTL identified for
sugar related traits (Saccharum spp.) cultivar x S. offici-narum population. Theor Appl Genet 112:1306–1317
Asnaghi C, Paulet F, Kaye C, Grivet L, Deu M, Glaszmann J-
C, D’Hont A (2000) Application of synteny across Poa-
ceae to determine the map location of rust resistance gene
in sugarcane. Theor Appl Genet 101:962–969
Chalmers KJ, Campbell AW, Kretschmer J, Karakousis A,
Henschke PH, Pierens S, Harker N, Pallotta M, Cornish
GB, Shariflou MR, Rampling LR, McLauchlan A, Dag-
gard G, Sharp PJ, Holton TA, Sutherland MW, Appels R,
Langridge P (2001) Construction of three linkage maps in
bread wheat, Triticum aestivum. Aust J Agric Res
52:1089–1120
Da Silva JAG, Sorrells ME, Burnquist W, Tanksley SD (1993)
RFLP linkage map and genome analysis of Saccharumspontaneum. Genome 36:782–791
Da Silva JAG, Honeycutt JR, Burnquist W, Al-Janabi SM,
Sorrells ME, Tanksley SD, Sobral BWS (1995) Saccha-rum spontaneum L. ‘SES 208’ genetic map containing
RFLP and PCR based markers. Mol Breed 1:165–179
D’Hont A, Grivet L, Feldmann P, Rao S, Berding N, Glasz-
mann JC (1996) Characterisation of the double genome
structure of modern sugarcane cultivars (Saccharum spp.)
by molecular cytogentics. Mol Gen Genet 250:405–413
D’Hont A, Ison D, Alix K, Roux C, Glaszmann JC (1998)
Determination of basic chromosome number in the genus
Saccharum by physical mapping of ribosomal RNA
genes. Genome 41:221–225
D’Hont A, Lu YH, Gonzales de Leon D, Grivet L, Feldmann P,
Lanaud C, Glaszmann JC (1994) A molecular approach to
unravelling the genetics of sugarcane, a complex poly-
ploid of the Andropogoneae. Genome 37:222–230
Devos K, Gale MD (1997) Comparative genetics in the grasses.
Plant Mol Biol 35:3–15
Dufour P, Grivet L, D’Hont A, Deu M, Trouche G, Glaszmann
J-C, Hamon P (1996) Comparative genetic mapping
between duplicated segments on maize chromosomes 3
and 8 homoeologous regions in sorghum and sugarcane.
Theor Appl Genet 92:1024–1030
Glaszmann J-C, Dufour P, Grivet L, D’Hont A, Deu M, Paulet
F, Hamon P (1997) Comparative genome analysis
between several tropical grasses. Euphytica 96:13–21
246 Mol Breeding (2008) 21:233–247
123

Grivet L, D’Hont A, Dufour P, Hamon P, Roques D, Glasz-
mann J-C (1994) Comparative genome mapping of
sugarcane with other species within the Andropogoneae
Tribe. Heredity 73:500–508
Grivet L, D’Hont A, Roques D, Feldmann P, Lanaud C,
Glaszmann J-C (1996) RFLP mapping in a cultivated
sugarcane (Saccharum spp.): genome organisation in a
highly polyploid and aneuploid interspecific hybrid.
Genetics 142:987–1000
Guimaraes CT, Sills GR, Sobral BW (1997) Comparative
mapping of Andropogoneae: Saccharum L. (sugarcane)
and its relation to sorghum and maize. Proc Natl Acad Sci
USA 94:14261–14266
Hoarau J-Y, Offmann B, D’Hont A, Risterucci A-M, Roques
D, Glaszmann J-C, Grivet L (2001) Genetic dissection of
a modern sugarcane cultivar (Saccharum spp.). I. Genome
mapping with AFLP markers. Theor Appl Genet 103:
84–97
Hoarau J-Y, Grivet L, Offmann B, Raboin L-M, Diorflar J-P,
Payet J, Hellmann M, D’Hont A, Glaszmann J-C (2002)
Genetic dissection of a modern cultivar (Saccharum spp.).
II. Detection of QTLs for yield components. Theor Appl
Genet 105:1027–1037
Hosington DA (1992) Laboratory protocols. CIMMYT
Applied Molecular Genetics Laboratory, Mexico, D.f.
CIMMYT
Hulbert SH, Richter TE, Axtell JD, Bennetzen JL (1990)
Genetic mapping and characterization of sorghum and
related crops by means of maize DNA probes. Proc Natl
Acad Sci USA 87:4251–4255
Jordan DR, Casu RE, Besse P, Carroll BC, Berding N, McIn-
tyre CL (2004) Markers associated with stalk number and
suckering in sugarcane co-locate with tillering and rhi-
zomatousness QTLs in sorghum. Genome 47:988–983
Lander ES, Gree P, Abrahamson J, Daly MJ, Lincoln SE,
Newburg L (1987) Mapmaker: an interactive computer
package for constructing primary genetic linkage maps of
experimental and natural populations. Genomics 1:
174–181
McIntyre CL, Whan VA, Croft BC, Magarey R, Smith GR
(2005) Identification and validation of molecular markers
associated with Pachymetra root rot and brown rust
resistance in sugarcane using map- and association-based
approaches. Mol Breed 16:151–161
McIntyre CL, Jackson M, Cordeiro G, Amouyal O, Hermann S,
Aitken KS, Eliott F, Henry RJ, Casu RE, Bonnett GD
(2006) The identification and characterisation of alleles of
sucrose phosphate synthase gene family III in sugarcane.
Mol Breed 18:39–50
Meer JM, Manly KF, Cudmore RH (2002) Software for genetic
mapping of Mendelian markers and quantitative traits
loci. Roswell Cancer Park Institute
Menz MA, Klein RR, Mullet JE, Obert JA, Unruh NC, Klein
PE (2002) A high-density genetic map of Sorghum bicolor
(L.) Moench based on 2926 AFLP(R), RFLP and SSR
markers. Plant Mol Biol 48(5/6):483–499
Ming R, Liu S-C, Lin Y-R, Da Silva J, Wilson W, Braga D,
Van Deynze A, Wenslaff TF, Wu KK, Moore PH,
Burnquist W, Sorrells ME, Irvine JE, Paterson AH (1998)
Detailed alignment of Saccharum and Sorghum chromo-
somes: comparative organization of closely related
diploid and polyploid genomes. Genetics 150:1663–1682
Ming R, Sin-Chien L, Moore PH, Irvine JE, Paterson AH
(2001) QTL analysis in a complex autopolyploid: genetic
control of sugar content in sugarcane. Genome Res
11:2075–2084
Ming R, Wang Y-W, Draye X, Moore PH, Irvine JE, Paterson
AH (2002) Molecular dissection of complex traits in au-
topolyploids: mapping QTLs affecting sugar yield and
related traits in sugarcane. Theor Appl Genet 105:332–345
Mudge J, Andersen WR, Kehrer RL, Fairbanks DJ (1996) A
RAPD genetic map of Saccharum officinarum. Crop Sci
36:1362–1363
Moore G, Devos KM, Wang Z (1995) Grasses, line up and
form a circle. Curr Biol 5(7):737–739
Piperidis G, D’Hont A (2001) Chromosome composition
analysis of various Saccharum interspecific hybrids by
genomic in situ hybridisation (GISH). Int Soc Sugar Cane
Technol Congress 11:565
Reffay N, Jackson PA, Aitken KA, D’Hont A, Besse P,
McIntyre CL (2005) Characterisation of genome regions
incorporated from an important wild relative into Aus-
tralian sugarcane. Mol Breed 15:367–381
Rossi M, Araujo P, Paulet F, Garsmeur O, Dias V, Hui C, Van
Sluys MA, D’Hont A (2003) Genome distribution and
characterization of EST derived sugarcane resistance gene
analogs. Mol Gen Genome 269:406–419
Tao Y, Henzell RG, Jordan DR, Butler DG, Kelly AM,
McIntyre CL (2000) Identification of genomic regions
associated with staygreen in sorghum by testing RILs in
multiple environments. Theor Appl Genet 100:1225–1232
Tuinstra MR, Grote EM, Goldsbrough PB, Ejeta G (1997)
Genetic analysis of post flowering drought tolerance and
components of grain development in Sorghum bicolor (L.)
Moench. Mol Breed 3:439–448
Vos P, Hogers R, Bleeker M, Reijans M, Van de Lee T, Frijters
A, Pot J, Peleman J, Kuiper M, Zabeau M (1995) AFLP: a
new technique for DNA fingerprinting. Nucleic Acids Res
23:4407–4414
Vuylsteke M, Mank R, Antonise R, Bastiaans E, Senio ML,
Stuber CW, Melchinger AE, Lubberstedt T, Xia XC, Stam
P, Zabeau M, Kuiper M (1999) Two high-density AFLP1
analysis of distribution of AFLP markers. Theor Appl
Genet 99:921–935
Wu KK, Burnquist W, Sorrells ME, Tew TL, Moore PH,
Tanksley SD (1992) The detection and estimation of
linkage in polyploıds using single-dose restriction frag-
ments. Theor Appl Genet 83:294–300
Mol Breeding (2008) 21:233–247 247
123