Comparative analysis of the interaction between habitat and growth form in diatoms
10
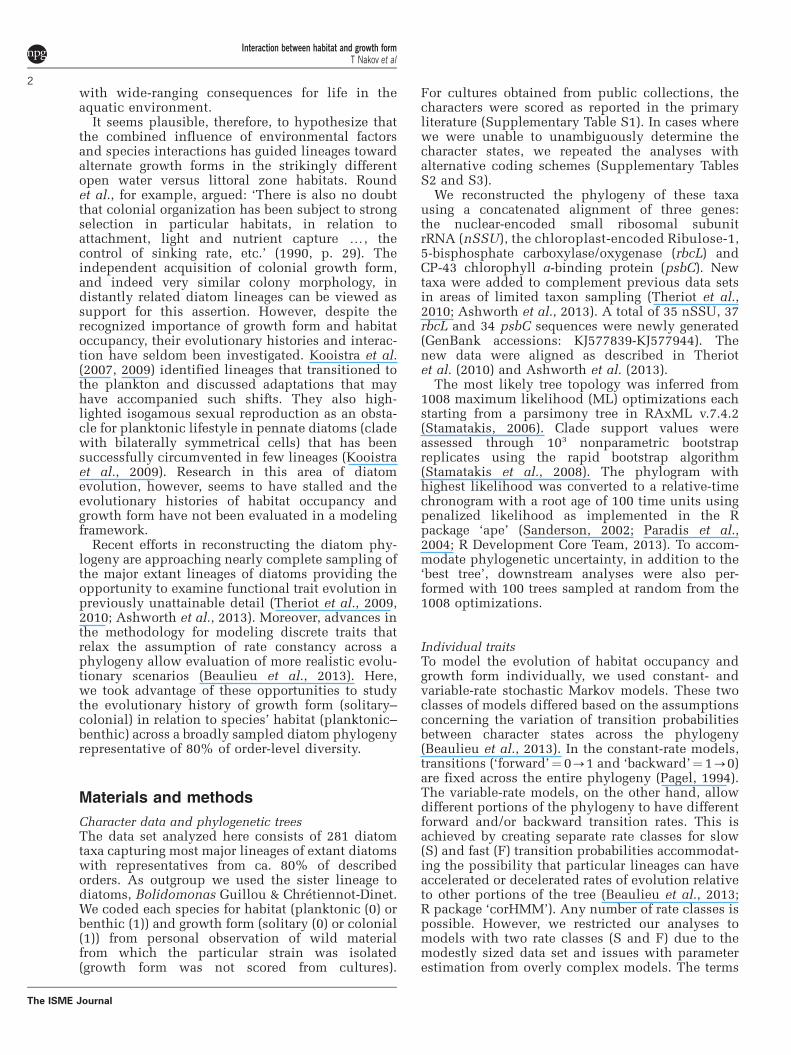
ORIGINAL ARTICLE Comparative analysis of the interaction between habitat and growth form in diatoms Teofil Nakov 1,3 , Matt Ashworth 2,3 and Edward C Theriot 1,2 1 Plant Biology Graduate Program, University of Texas at Austin, Austin, TX, USA and 2 Section of Integrative Biology, University of Texas at Austin, Austin, TX, USA We characterized the evolutionary history of growth form (solitary–colonial) and its interaction with species’ habitat (planktonic–benthic) across a multi-gene phylogeny encompassing a broad sample of the order-level diversity of diatoms. We treated these characters broadly, modeling the evolution of aggregation of cells into a colony irrespective of the way aggregation is achieved, and relating the growth form to a broad concept of niche location: in the plankton or benthos. The results showed that habitat shifts are rare implying conservatism in niche location at the level of large clades. On the other hand, the evolutionary history of growth form is more dynamic with evolutionary rates that vary across the tree. Analyses of a possible interaction revealed that shifts in growth form are independent of habitat and that traversing between habitats does not hinge upon species’ growth form. Our findings help to fill a gap in the understanding of diatom niche and growth form macroevolution and contribute toward a platform for the comparative study of the mechanisms underlying diatom species and functional diversity. The ISME Journal advance online publication, 1 July 2014; doi:10.1038/ismej.2014.108 Introduction Diatoms are an exceptionally diverse lineage of predominantly photoautotrophic heterokonts (Mann and Vanormelingen, 2013) responsible for substan- tial portions of the global primary production and atmospheric carbon removal (Nelson et al., 1995; Hopkinson et al., 2011). They have colonized the plankton and benthos, are frequently dominant in communities of lotic and lentic systems, and span the salinity barrier with substantial species diversity in each of these habitat types (Spaulding and Kociolek, 2000; Alverson et al., 2007; Vyverman et al., 2007). Their diversification across environ- ments is a result of a combination of genetic, physiological and morphological factors (Falkowski et al., 2004; Armbrust, 2009) shaped over an evolutionary history since the Mesozoic (Brown and Sorhannus, 2010). One remarkable feature of diatoms is their extraordinary diversity in growth form. They range from simple spheroid unicells to complex three- dimensional colonies comprised of hundreds of cells and reaching macroscopic sizes. The mechan- isms of colony construction are varied as well. Diatoms form colonies through modified features of the silica cell wall, chitin threads and an array of extracellular mucilaginous secretions in the form of pads, stalks, tubes or sheets (Round et al., 1990). This diversity in growth form has a functional role. The combination of growth form (for example, solitary or colonial) and habitat occupancy (for example, planktonic or benthic) approximates, albeit roughly, a diatom’s ecological niche. Small- celled species that grow attached to a substrate via a mucilaginous pad, for instance, are early coloni- zers of benthic mats and are adapted for resistance to scouring from water currents (Hoagland et al., 1982; Hoagland, 1983; McCormick and Stevenson, 1991; Johnson et al., 1997). Long filamentous or branched colonies, on the other hand, tend to establish later in the succession, when the mat is crowded and cells improve access to nutrients and light by rising above the boundary layer (Hoagland et al., 1982; Hoagland, 1983; McCormick and Stevenson, 1991). Growth form is similarly con- sequential in the plankton because species’ sinking rate and vertical position in the water column are affected by colony morphology and symmetry (Padisa ´k et al., 2003; Reynolds, 2006). Thus, the amount of light and nutrients available to a cell living in a stratified environment is at least partially influenced by the ability to form colonies and their properties. Combining these considera- tions with the benefit of increased organism size as a strategy for defense against predation (Yokota and Sterner, 2010), colony formation emerges as a trait Correspondence: T Nakov, Plant Biology Graduate Program, University of Texas at Austin, 1 University Station A6700 (Biolabs 214), Austin, TX 78712, USA. E-mail: [email protected] 3 These authors contributed equally to this work. Received 17 March 2014; revised 16 May 2014; accepted 29 May 2014 The ISME Journal (2014), 1–10 & 2014 International Society for Microbial Ecology All rights reserved 1751-7362/14 www.nature.com/ismej
Transcript of Comparative analysis of the interaction between habitat and growth form in diatoms
ORIGINAL ARTICLE
Comparative analysis of the interaction betweenhabitat and growth form in diatoms
Teofil Nakov1,3, Matt Ashworth2,3 and Edward C Theriot1,2
1Plant Biology Graduate Program, University of Texas at Austin, Austin, TX, USA and 2Section of IntegrativeBiology, University of Texas at Austin, Austin, TX, USA
We characterized the evolutionary history of growth form (solitary–colonial) and its interaction withspecies’ habitat (planktonic–benthic) across a multi-gene phylogeny encompassing a broad sampleof the order-level diversity of diatoms. We treated these characters broadly, modeling the evolutionof aggregation of cells into a colony irrespective of the way aggregation is achieved, and relating thegrowth form to a broad concept of niche location: in the plankton or benthos. The results showedthat habitat shifts are rare implying conservatism in niche location at the level of large clades. On theother hand, the evolutionary history of growth form is more dynamic with evolutionary rates thatvary across the tree. Analyses of a possible interaction revealed that shifts in growth form areindependent of habitat and that traversing between habitats does not hinge upon species’ growthform. Our findings help to fill a gap in the understanding of diatom niche and growth formmacroevolution and contribute toward a platform for the comparative study of the mechanismsunderlying diatom species and functional diversity.The ISME Journal advance online publication, 1 July 2014; doi:10.1038/ismej.2014.108
Introduction
Diatoms are an exceptionally diverse lineage ofpredominantly photoautotrophic heterokonts (Mannand Vanormelingen, 2013) responsible for substan-tial portions of the global primary production andatmospheric carbon removal (Nelson et al., 1995;Hopkinson et al., 2011). They have colonized theplankton and benthos, are frequently dominant incommunities of lotic and lentic systems, and spanthe salinity barrier with substantial species diversityin each of these habitat types (Spaulding andKociolek, 2000; Alverson et al., 2007; Vyvermanet al., 2007). Their diversification across environ-ments is a result of a combination of genetic,physiological and morphological factors (Falkowskiet al., 2004; Armbrust, 2009) shaped over anevolutionary history since the Mesozoic (Brownand Sorhannus, 2010).
One remarkable feature of diatoms is theirextraordinary diversity in growth form. They rangefrom simple spheroid unicells to complex three-dimensional colonies comprised of hundreds ofcells and reaching macroscopic sizes. The mechan-isms of colony construction are varied as well.
Diatoms form colonies through modified features ofthe silica cell wall, chitin threads and an array ofextracellular mucilaginous secretions in the form ofpads, stalks, tubes or sheets (Round et al., 1990).This diversity in growth form has a functional role.The combination of growth form (for example,solitary or colonial) and habitat occupancy (forexample, planktonic or benthic) approximates,albeit roughly, a diatom’s ecological niche. Small-celled species that grow attached to a substrate viaa mucilaginous pad, for instance, are early coloni-zers of benthic mats and are adapted for resistanceto scouring from water currents (Hoagland et al.,1982; Hoagland, 1983; McCormick and Stevenson,1991; Johnson et al., 1997). Long filamentous orbranched colonies, on the other hand, tend toestablish later in the succession, when the mat iscrowded and cells improve access to nutrients andlight by rising above the boundary layer (Hoaglandet al., 1982; Hoagland, 1983; McCormick andStevenson, 1991). Growth form is similarly con-sequential in the plankton because species’ sinkingrate and vertical position in the water column areaffected by colony morphology and symmetry(Padisak et al., 2003; Reynolds, 2006). Thus, theamount of light and nutrients available to a cellliving in a stratified environment is at leastpartially influenced by the ability to form coloniesand their properties. Combining these considera-tions with the benefit of increased organism size asa strategy for defense against predation (Yokota andSterner, 2010), colony formation emerges as a trait
Correspondence: T Nakov, Plant Biology Graduate Program,University of Texas at Austin, 1 University Station A6700 (Biolabs214), Austin, TX 78712, USA.E-mail: [email protected] authors contributed equally to this work.Received 17 March 2014; revised 16 May 2014; accepted 29 May2014
The ISME Journal (2014), 1–10& 2014 International Society for Microbial Ecology All rights reserved 1751-7362/14
www.nature.com/ismej
with wide-ranging consequences for life in theaquatic environment.
It seems plausible, therefore, to hypothesize thatthe combined influence of environmental factorsand species interactions has guided lineages towardalternate growth forms in the strikingly differentopen water versus littoral zone habitats. Roundet al., for example, argued: ‘There is also no doubtthat colonial organization has been subject to strongselection in particular habitats, in relation toattachment, light and nutrient capture y, thecontrol of sinking rate, etc.’ (1990, p. 29). Theindependent acquisition of colonial growth form,and indeed very similar colony morphology, indistantly related diatom lineages can be viewed assupport for this assertion. However, despite therecognized importance of growth form and habitatoccupancy, their evolutionary histories and interac-tion have seldom been investigated. Kooistra et al.(2007, 2009) identified lineages that transitioned tothe plankton and discussed adaptations that mayhave accompanied such shifts. They also high-lighted isogamous sexual reproduction as an obsta-cle for planktonic lifestyle in pennate diatoms (cladewith bilaterally symmetrical cells) that has beensuccessfully circumvented in few lineages (Kooistraet al., 2009). Research in this area of diatomevolution, however, seems to have stalled and theevolutionary histories of habitat occupancy andgrowth form have not been evaluated in a modelingframework.
Recent efforts in reconstructing the diatom phy-logeny are approaching nearly complete sampling ofthe major extant lineages of diatoms providing theopportunity to examine functional trait evolution inpreviously unattainable detail (Theriot et al., 2009,2010; Ashworth et al., 2013). Moreover, advances inthe methodology for modeling discrete traits thatrelax the assumption of rate constancy across aphylogeny allow evaluation of more realistic evolu-tionary scenarios (Beaulieu et al., 2013). Here,we took advantage of these opportunities to studythe evolutionary history of growth form (solitary–colonial) in relation to species’ habitat (planktonic–benthic) across a broadly sampled diatom phylogenyrepresentative of 80% of order-level diversity.
Materials and methods
Character data and phylogenetic treesThe data set analyzed here consists of 281 diatomtaxa capturing most major lineages of extant diatomswith representatives from ca. 80% of describedorders. As outgroup we used the sister lineage todiatoms, Bolidomonas Guillou & Chretiennot-Dinet.We coded each species for habitat (planktonic (0) orbenthic (1)) and growth form (solitary (0) or colonial(1)) from personal observation of wild materialfrom which the particular strain was isolated(growth form was not scored from cultures).
For cultures obtained from public collections, thecharacters were scored as reported in the primaryliterature (Supplementary Table S1). In cases wherewe were unable to unambiguously determine thecharacter states, we repeated the analyses withalternative coding schemes (Supplementary TablesS2 and S3).
We reconstructed the phylogeny of these taxausing a concatenated alignment of three genes:the nuclear-encoded small ribosomal subunitrRNA (nSSU), the chloroplast-encoded Ribulose-1,5-bisphosphate carboxylase/oxygenase (rbcL) andCP-43 chlorophyll a-binding protein (psbC). Newtaxa were added to complement previous data setsin areas of limited taxon sampling (Theriot et al.,2010; Ashworth et al., 2013). A total of 35 nSSU, 37rbcL and 34 psbC sequences were newly generated(GenBank accessions: KJ577839-KJ577944). Thenew data were aligned as described in Theriotet al. (2010) and Ashworth et al. (2013).
The most likely tree topology was inferred from1008 maximum likelihood (ML) optimizations eachstarting from a parsimony tree in RAxML v.7.4.2(Stamatakis, 2006). Clade support values wereassessed through 103 nonparametric bootstrapreplicates using the rapid bootstrap algorithm(Stamatakis et al., 2008). The phylogram withhighest likelihood was converted to a relative-timechronogram with a root age of 100 time units usingpenalized likelihood as implemented in the Rpackage ‘ape’ (Sanderson, 2002; Paradis et al.,2004; R Development Core Team, 2013). To accom-modate phylogenetic uncertainty, in addition to the‘best tree’, downstream analyses were also per-formed with 100 trees sampled at random from the1008 optimizations.
Individual traitsTo model the evolution of habitat occupancy andgrowth form individually, we used constant- andvariable-rate stochastic Markov models. These twoclasses of models differed based on the assumptionsconcerning the variation of transition probabilitiesbetween character states across the phylogeny(Beaulieu et al., 2013). In the constant-rate models,transitions (‘forward’¼ 0-1 and ‘backward’¼ 1-0)are fixed across the entire phylogeny (Pagel, 1994).The variable-rate models, on the other hand, allowdifferent portions of the phylogeny to have differentforward and/or backward transition rates. This isachieved by creating separate rate classes for slow(S) and fast (F) transition probabilities accommodat-ing the possibility that particular lineages can haveaccelerated or decelerated rates of evolution relativeto other portions of the tree (Beaulieu et al., 2013;R package ‘corHMM’). Any number of rate classes ispossible. However, we restricted our analyses tomodels with two rate classes (S and F) due to themodestly sized data set and issues with parameterestimation from overly complex models. The terms
Interaction between habitat and growth formT Nakov et al
2
The ISME Journal
‘forward’ and ‘backward’ are used for convenienceand do not imply transitions between ancestral andderived states.
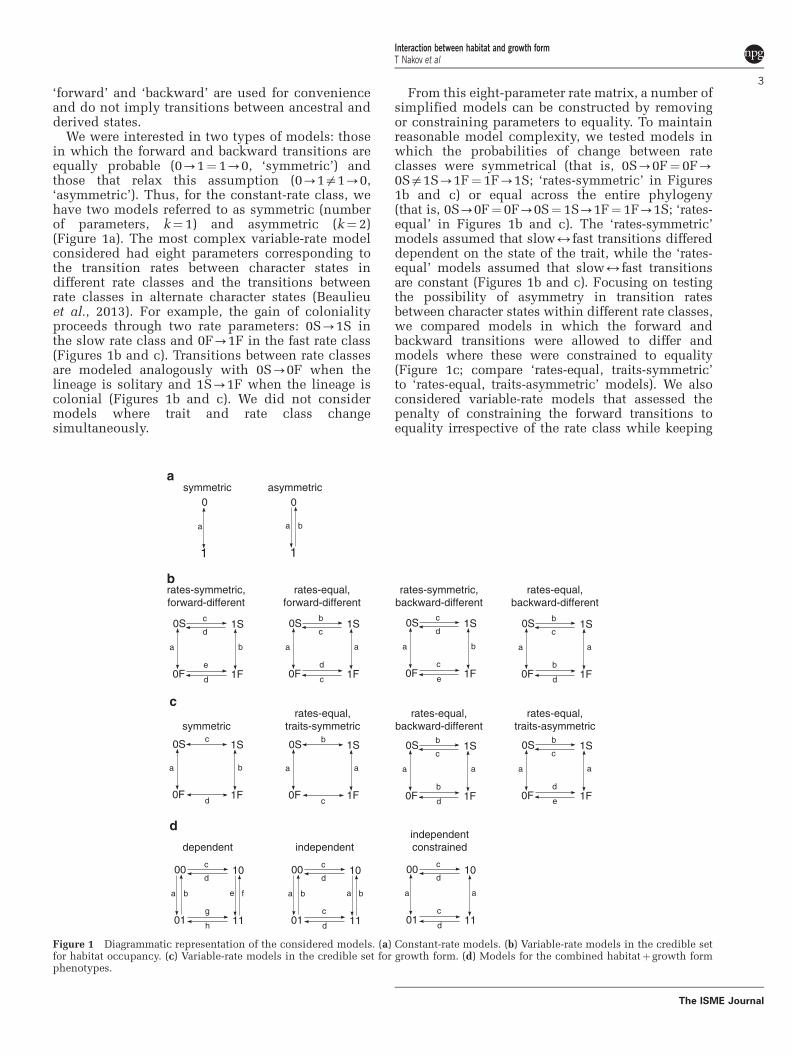
We were interested in two types of models: thosein which the forward and backward transitions areequally probable (0-1¼ 1-0, ‘symmetric’) andthose that relax this assumption (0-1a1-0,‘asymmetric’). Thus, for the constant-rate class, wehave two models referred to as symmetric (numberof parameters, k¼ 1) and asymmetric (k¼ 2)(Figure 1a). The most complex variable-rate modelconsidered had eight parameters corresponding tothe transition rates between character states indifferent rate classes and the transitions betweenrate classes in alternate character states (Beaulieuet al., 2013). For example, the gain of colonialityproceeds through two rate parameters: 0S-1S inthe slow rate class and 0F-1F in the fast rate class(Figures 1b and c). Transitions between rate classesare modeled analogously with 0S-0F when thelineage is solitary and 1S-1F when the lineage iscolonial (Figures 1b and c). We did not considermodels where trait and rate class changesimultaneously.
From this eight-parameter rate matrix, a number ofsimplified models can be constructed by removingor constraining parameters to equality. To maintainreasonable model complexity, we tested models inwhich the probabilities of change between rateclasses were symmetrical (that is, 0S-0F¼ 0F-0Sa1S-1F¼ 1F-1S; ‘rates-symmetric’ in Figures1b and c) or equal across the entire phylogeny(that is, 0S-0F¼ 0F-0S¼ 1S-1F¼ 1F-1S; ‘rates-equal’ in Figures 1b and c). The ‘rates-symmetric’models assumed that slow2fast transitions differeddependent on the state of the trait, while the ‘rates-equal’ models assumed that slow2fast transitionsare constant (Figures 1b and c). Focusing on testingthe possibility of asymmetry in transition ratesbetween character states within different rate classes,we compared models in which the forward andbackward transitions were allowed to differ andmodels where these were constrained to equality(Figure 1c; compare ‘rates-equal, traits-symmetric’to ‘rates-equal, traits-asymmetric’ models). We alsoconsidered variable-rate models that assessed thepenalty of constraining the forward transitions toequality irrespective of the rate class while keeping
symmetrica
b
c
d
0
a
1
asymmetric0
a b
1
0S
a
c
d
b
e
d0F 1F
1S
rates-symmetric,forward-different
rates-equal,forward-different
0S
a
b
c
a
d
c0F 1F
1S
rates-symmetric,backward-different
0S
a
c
d
b
c
e0F 1F
1S
rates-equal,backward-different
0S
a
b
c
a
b
d0F 1F
1S
symmetric
0S
a
c
b
d0F 1F
1S 0S
a
b
a
c0F 1F
1S
rates-equal,traits-symmetric
rates-equal,backward-different
0S
a
b
c
a
b
d0F 1F
1S
rates-equal,traits-asymmetric
0S
a
b
c
a
d
e0F 1F
1S
dependent independentindependentconstrained
00
a b
c
d
e f
g
h01 11
10 00
a b
c
d
a b
c
d01 11
10 00
a
c
d
a
c
d01 11
10
Figure 1 Diagrammatic representation of the considered models. (a) Constant-rate models. (b) Variable-rate models in the credible setfor habitat occupancy. (c) Variable-rate models in the credible set for growth form. (d) Models for the combined habitatþ growth formphenotypes.
Interaction between habitat and growth formT Nakov et al
3
The ISME Journal
the backward transitions different (that is, 0S-1S¼ 0F-1F and 1S-0Sa1F-0F; ‘rates-symmetric(equal), backward-different’), and the reverse, con-straining backward transitions to equality whilekeeping forward transitions different (that is, 0S-1Sa0F-1F and 1S-0S¼ 1F-0F; ‘rates-symmetric(equal), forward-different’). These models were, ineffect, testing the possibility that one type oftransition in the trait (either the forward or backward)is constant across the phylogeny while the othervaries. A total of 12 models constructed with theabove reasoning were tested on the best phylogeny. Asubset of four variable-rate models that fit the traitdata best as well as the two constant-rate modelswere thereafter fitted to the sample of 100 ML trees.The set of six models are diagramed in Figures 1a andb for habitat occupancy and Figure 1a and c forgrowth form.
Combined phenotypesIt is possible that growth form and habitat interact—colony formation might, for example, be favored inbenthic species. The combination of two binarycharacters yields four combined phenotypes:planktonicþ solitary (00), planktonicþ colonial(01), benthicþ solitary (10) and benthicþ colonial(11). If growth form evolution depends on habitat,then the transition rate 00-01 is expected to bedifferent than the transition rate 10-11 (Pagel, 1994;Pagel and Meade, 2006). The analogous situation forhabitat is also of interest. Are transitions to theplankton dependent on growth form (00-10a01-11)?To test for the interaction, we fit two models: anindependent model where the transitions 0-1 or1-0 in one character were independent of the stateof the other character (k¼ 4; Figure 1d) and adependent model where the probability of 0-1 or1-0 in one character differed based on the state ofthe other character (k¼ 8; Figure 1d). Preliminaryanalyses showed that a symmetric constant-ratemodel was favored for the evolution of habitatoccupancy when viewed separately of growth form.Knowing this, we tested an independent modelwhere planktonic-benthic¼ benthic-planktonic,but solitary-colonialacolonial-solitary (Figure 1d).All two-trait modes were constant-rate because thecurrent methodological framework is not extendedto allow ‘hidden rates’ in two-trait models (Beaulieuet al., 2013). As before, analyses were performed onthe 100 phylogenies.
The analyses were performed in the R packages‘corHMM’ and ‘ape’ (Paradis et al., 2004; Beaulieuet al., 2013) and character state transitions werecalculated in Mesquite (Maddison and Maddison,2011). Model selection was performed using theAkaike Information Criterion corrected for samplesize (AICc). Importance of parameters was calcu-lated as the sum of the average Akaike weights of allcredible models that include a particular parameter(Burnham and Anderson, 2002).
Results
Trees and trait distributionThe phylogeny recovered all major groups identifiedin recent all-diatom trees (Theriot et al., 2009, 2011)and is consistent with the current understanding ofhigh-level relationships (Figure 2a, SupplementaryFigure S1). For habitat occupancy, the ratio benthic:-planktonic was about 2:1, and for growth form,solitary:colonial was about 1:1. In the grade ofclades of non-pennate diatoms, phenotypes alter-nate fairly often and there appears to be no bias withrespect to habitat or growth form (Figure 2a).Pennate diatoms were predominantly benthic(Figure 2a, Supplementary Figure S1 node 2) andamong them the clade of actively motile raphidpennates was dominated by solitary forms(Figure 2a, Supplementary Figure S1 node 1).
HabitatFive models, all within four DAICc units from thebest and with a cumulative relative likelihood oi
(Akaike weight)¼ 0.97, were within the credible setfor the evolutionary history of habitat occupancy.The symmetric, constant-rate model performedbest (Table 1; Figure 1a), followed closely by theasymmetric constant-rate model (mean DAICc¼ 0.82;Table 1; Figure 1a). Given the cumulative weight ofconstant-rate models, variable-rate models cannot beruled out as plausible for the evolution of habitat(Table 1). From the pool of tested variable-ratemodels, only those with symmetric or equal transi-tions between rate classes (slow2fast) wereincluded in the credible set (Table 1; Figures 1aand b). The penalty of reducing shifts between rateclasses to one parameter was negligible (Table 1;‘rates-equal’ in Figure 1b). These results are con-sistent with a scenario where transitions betweenthe fast and slow rate class happen at similar ratesacross the entire phylogeny. Models where forwardtransitions (planktonic-benthic) were allowed tovary, whereas backward (benthic-planktonic) werekept equal, had a combined average oi¼ 0.38(Table 1; ‘forward-different’ in Figure 1b). The latterwere better than models where backward, instead offorward transitions, were allowed to vary (Table 1;‘backward-different’ in Figure 1b).
A parameter for a backward transition (benthos-plankton) constant across the phylogeny, but differ-ent from the forward transition, was most importantgiven the credible set of models (Table 2). There waslittle support for slow versus fast rate of backwardtransitions (Table 2). Parameters for slow versus fastforward transitions had weight, but their importancewas not substantially higher than a constant forwardrate parameter (Table 2).
Parsimony, maximum likelihood and stochasticcharacter mapping on the best tree, the latter twoconducted with the parameter estimates fromthe constant-rate symmetric model, agreed that a
Interaction between habitat and growth formT Nakov et al
4
The ISME Journal
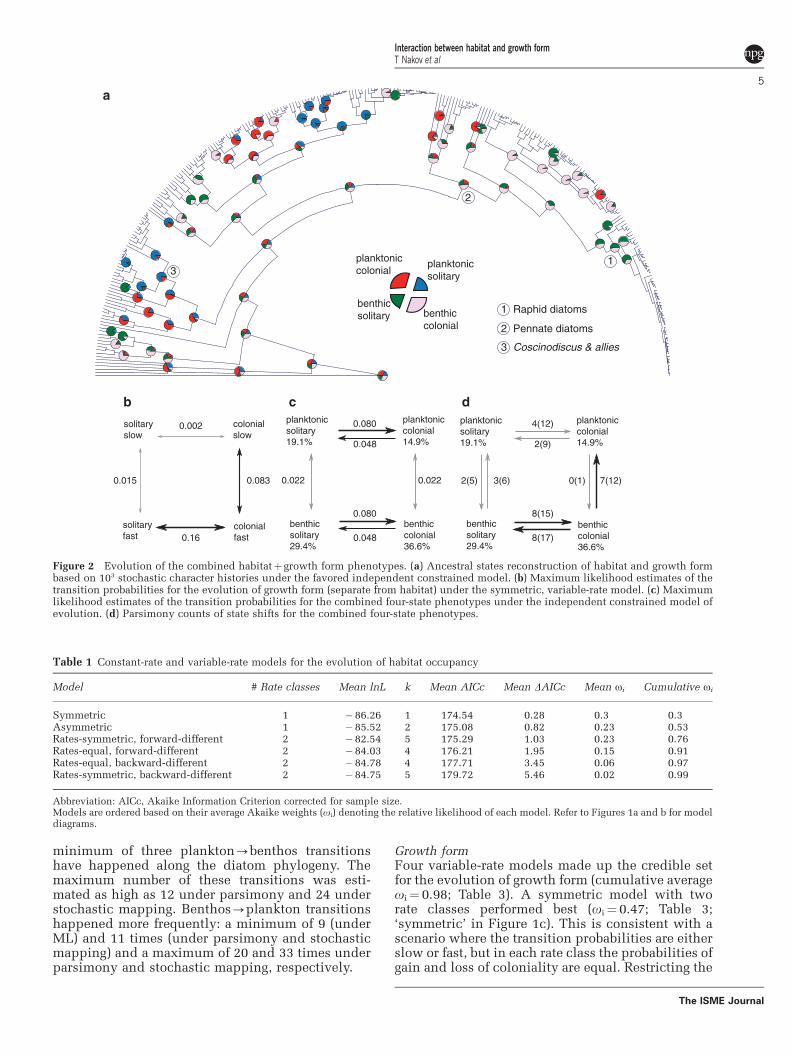
minimum of three plankton-benthos transitionshave happened along the diatom phylogeny. Themaximum number of these transitions was esti-mated as high as 12 under parsimony and 24 understochastic mapping. Benthos-plankton transitionshappened more frequently: a minimum of 9 (underML) and 11 times (under parsimony and stochasticmapping) and a maximum of 20 and 33 times underparsimony and stochastic mapping, respectively.
Growth formFour variable-rate models made up the credible setfor the evolution of growth form (cumulative averageoi¼ 0.98; Table 3). A symmetric model with tworate classes performed best (oi¼ 0.47; Table 3;‘symmetric’ in Figure 1c). This is consistent with ascenario where the transition probabilities are eitherslow or fast, but in each rate class the probabilities ofgain and loss of coloniality are equal. Restricting the
Table 1 Constant-rate and variable-rate models for the evolution of habitat occupancy
Model # Rate classes Mean lnL k Mean AICc Mean DAICc Mean oi Cumulative oi
Symmetric 1 �86.26 1 174.54 0.28 0.3 0.3Asymmetric 1 �85.52 2 175.08 0.82 0.23 0.53Rates-symmetric, forward-different 2 �82.54 5 175.29 1.03 0.23 0.76Rates-equal, forward-different 2 �84.03 4 176.21 1.95 0.15 0.91Rates-equal, backward-different 2 �84.78 4 177.71 3.45 0.06 0.97Rates-symmetric, backward-different 2 �84.75 5 179.72 5.46 0.02 0.99
Abbreviation: AICc, Akaike Information Criterion corrected for sample size.Models are ordered based on their average Akaike weights (oi) denoting the relative likelihood of each model. Refer to Figures 1a and b for modeldiagrams.
planktonicsolitary19.1%
benthicsolitary29.4%
benthiccolonial36.6%
planktoniccolonial14.9%
0.048
0.080
0.022
0.048
0.080
0.022
b
8(17)
7(12)
8(15)
2(5) 0(1)
2(9)
3(6)
4(12)planktonicsolitary19.1%
benthicsolitary29.4%
benthiccolonial36.6%
planktoniccolonial14.9%
c d
solitaryslow
solitaryfast
colonialfast
colonialslow
0.015 0.083
0.16
0.002
1
2
3planktonicsolitary
benthicsolitary benthic
colonial
planktoniccolonial
a
1
2
3
Raphid diatoms
Pennate diatoms
Coscinodiscus & allies
Figure 2 Evolution of the combined habitatþ growth form phenotypes. (a) Ancestral states reconstruction of habitat and growth formbased on 103 stochastic character histories under the favored independent constrained model. (b) Maximum likelihood estimates of thetransition probabilities for the evolution of growth form (separate from habitat) under the symmetric, variable-rate model. (c) Maximumlikelihood estimates of the transition probabilities for the combined four-state phenotypes under the independent constrained model ofevolution. (d) Parsimony counts of state shifts for the combined four-state phenotypes.
Interaction between habitat and growth formT Nakov et al
5
The ISME Journal
transitions between rate classes to one parameterdid not incur a substantial cost in likelihood(average DAICc¼ 0.96; Table 3; ‘rates-equal, traits-symmetric’ in Figure 1c). Relaxing the latter modelto allow for asymmetric transition rates betweengrowth forms or constraining forward transitions toequality irrespective of rate class did not offer asubstantially better fit (Table 3; ‘rates-equal, back-ward-different’ and ‘rates-equal, traits-asymmetric’in Figure 1c). In contrast to the results for habitatoccupancy, constant-rate models performed poorly(average oip0.01; Table 3).
Parameters for slow and fast, but symmetric, ratesof solitary2colonial transitions were of greatestimportance for modeling the evolution of growthform (Table 2). Asymmetric transitions in eitherdirection were less important (Table 2). Amongthese types of parameters, separate rate classes (slowversus fast) for loss of coloniality were more relevant(Table 2). Of the parameters implying asymmetry,but rate constancy across the tree, only the forwardsolitary-colonial transition received some weight(Table 2). Based on the DAICc criterion, only the‘symmetric’ and ‘rates-equal, traits-symmetric’ mod-els fell within the credible set (DAICcp4; Table 3)trivializing any parameters not included in thesemodels (Tables 2 and 3). Parameter estimates
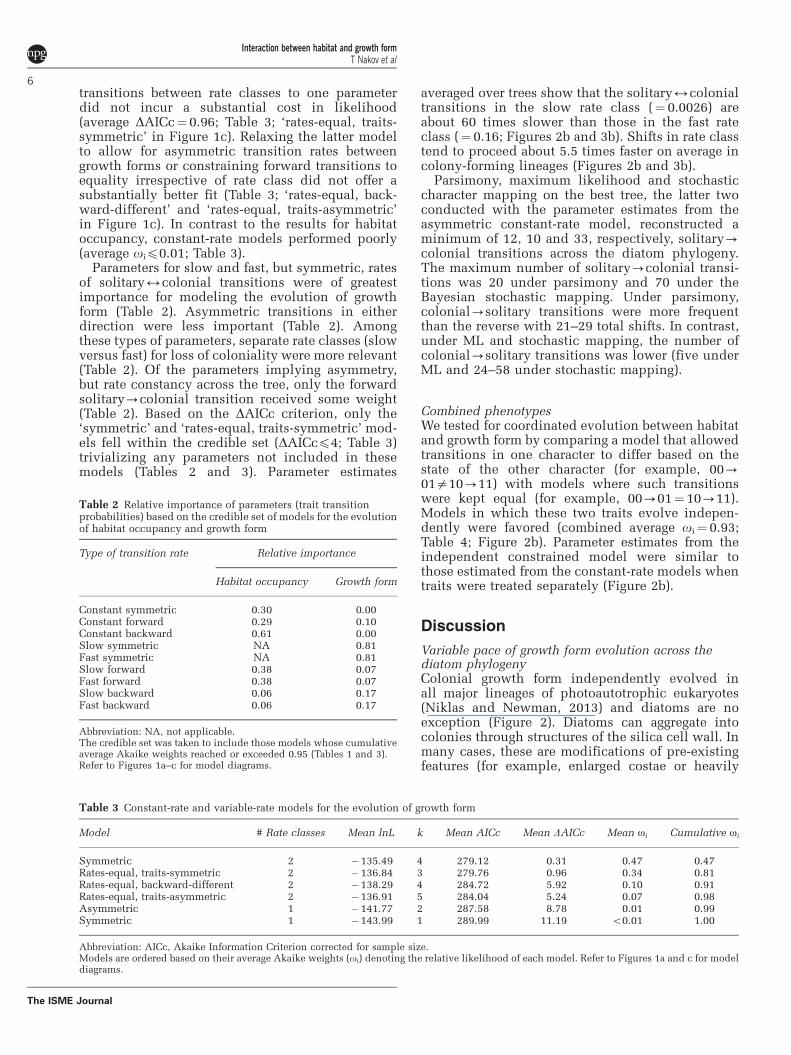
averaged over trees show that the solitary2colonialtransitions in the slow rate class (¼ 0.0026) areabout 60 times slower than those in the fast rateclass (¼ 0.16; Figures 2b and 3b). Shifts in rate classtend to proceed about 5.5 times faster on average incolony-forming lineages (Figures 2b and 3b).
Parsimony, maximum likelihood and stochasticcharacter mapping on the best tree, the latter twoconducted with the parameter estimates from theasymmetric constant-rate model, reconstructed aminimum of 12, 10 and 33, respectively, solitary-colonial transitions across the diatom phylogeny.The maximum number of solitary-colonial transi-tions was 20 under parsimony and 70 under theBayesian stochastic mapping. Under parsimony,colonial-solitary transitions were more frequentthan the reverse with 21–29 total shifts. In contrast,under ML and stochastic mapping, the number ofcolonial-solitary transitions was lower (five underML and 24–58 under stochastic mapping).
Combined phenotypesWe tested for coordinated evolution between habitatand growth form by comparing a model that allowedtransitions in one character to differ based on thestate of the other character (for example, 00-01a10-11) with models where such transitionswere kept equal (for example, 00-01¼ 10-11).Models in which these two traits evolve indepen-dently were favored (combined average oi¼ 0.93;Table 4; Figure 2b). Parameter estimates from theindependent constrained model were similar tothose estimated from the constant-rate models whentraits were treated separately (Figure 2b).
Discussion
Variable pace of growth form evolution across thediatom phylogenyColonial growth form independently evolved inall major lineages of photoautotrophic eukaryotes(Niklas and Newman, 2013) and diatoms are noexception (Figure 2). Diatoms can aggregate intocolonies through structures of the silica cell wall. Inmany cases, these are modifications of pre-existingfeatures (for example, enlarged costae or heavily
Table 2 Relative importance of parameters (trait transitionprobabilities) based on the credible set of models for the evolutionof habitat occupancy and growth form
Type of transition rate Relative importance
Habitat occupancy Growth form
Constant symmetric 0.30 0.00Constant forward 0.29 0.10Constant backward 0.61 0.00Slow symmetric NA 0.81Fast symmetric NA 0.81Slow forward 0.38 0.07Fast forward 0.38 0.07Slow backward 0.06 0.17Fast backward 0.06 0.17
Abbreviation: NA, not applicable.The credible set was taken to include those models whose cumulativeaverage Akaike weights reached or exceeded 0.95 (Tables 1 and 3).Refer to Figures 1a–c for model diagrams.
Table 3 Constant-rate and variable-rate models for the evolution of growth form
Model # Rate classes Mean lnL k Mean AICc Mean DAICc Mean oi Cumulative oi
Symmetric 2 � 135.49 4 279.12 0.31 0.47 0.47Rates-equal, traits-symmetric 2 � 136.84 3 279.76 0.96 0.34 0.81Rates-equal, backward-different 2 � 138.29 4 284.72 5.92 0.10 0.91Rates-equal, traits-asymmetric 2 � 136.91 5 284.04 5.24 0.07 0.98Asymmetric 1 � 141.77 2 287.58 8.78 0.01 0.99Symmetric 1 � 143.99 1 289.99 11.19 o0.01 1.00
Abbreviation: AICc, Akaike Information Criterion corrected for sample size.Models are ordered based on their average Akaike weights (oi) denoting the relative likelihood of each model. Refer to Figures 1a and c for modeldiagrams.
Interaction between habitat and growth formT Nakov et al
6
The ISME Journal

modified marginal strutted processes refashioned toserve in valve-to-valve interlocking) or rarely struc-tures that seem specifically acquired for cell-to-cellattachment (for example, the periplekton ofSyndetocystis Ralfs ex Greville). The other majormechanism is through extracellular mucilageproduction in form of pads, stalks, sheets or tubes.In many cases, solitary species already possess theability to produce mucilage, commonly used forthe attachment to benthic substrata or ‘coccooning’:
surrounding itself in a sheath of mucilage. Colonyformation therefore might be a relatively simpleprocess that requires the failure of cells to separatefollowing mitosis and remain attached throughelements of the cell wall or pre-existing mucilageformations. Perhaps due to this relative simplicityand the benefits of colonial lifestyle, colony forma-tion has repeatedly evolved across the diatom tree.Estimates from different methods vary, but thereseems to have been at least 10 and perhaps as muchas a couple of dozen acquisitions of the colony-forming state (Figure 2). The solitary growth formpredominates in the large, planktonic species ofCoscinodiscus Ehrenberg (and allies) and the lineageof raphid pennate diatoms that have the ability ofactive movement (Figure 2a). Otherwise, gains ofcoloniality are dispersed across the phylogenyencompassing both planktonic and benthic speciesacross an array of cell bauplanes (Figure 2a).
Under constant-rate models, there is support forasymmetry in the relative rates of transition betweenthe solitary and colonial growth form: gains ofcoloniality are on average faster than losses(Figure 3a). This result can be interpreted as atendency for the acquisition of the generally bene-ficial colonial state. When we considered thepossibility of rate heterogeneity, however, therewas no longer support for asymmetric transitionprobabilities (Table 3; Figures 2b and 3). Instead, theresults argue for symmetric transitions between thestates of growth form, but in separate rate classes.Thus, diatoms can be roughly divided into lineagesin which the evolution of growth form can beconsidered stagnant and lineages in which this traitis labile, with frequent (60 times more probable)traversals between growth forms (Figures 2b and 3).Clades evolving in the slow or fast ‘regime’ are notrestricted to a particular portion of the topology, butdispersed across the tree (Supplementary Figure S1).Apart from the coscinodiscoid lineage and theraphid pennates (Figure 2a, Supplementary Figure S1),which are estimated as exclusively slow- andfast-rate class, respectively, rate classes across thephylogeny alternate at the family or even genus level(Supplementary Figure S1). Asymmetric transition
Cou
nt
solitary to colonialcolonial to solitary
Cou
nt
rate in fast classrate in slow class
Cou
nt
0
10
20
30
40a
b
c
0
20
40
60
80
100
0
20
40
60
80rate when colonialrate when solitary
Transition rate
0.00 0.05 0.10 0.15 0.20 0.25 0.30
0.00 0.05 0.10 0.15 0.20 0.25 0.30
0.00 0.05 0.10 0.15 0.20 0.25 0.30
Figure 3 Transition probabilities for shifts between solitary andcolonial growth form estimated from 100 phylogenies. (a) Underthe asymmetric constant-rate model, the solitary-colonialtransition is much faster than the reverse. (b) Transitionprobabilities for shifts between growth forms in the slow andfast rate class of the favored symmetric variable-rate model.(c) Transition probabilities for shifting between rate classes whenlineages are solitary and colonial.
Table 4 Two-trait models for the evolution of the combinedhabitatþ growth form phenotypes
Two-traitmodel
MeanlnL
k MeanAICc
MeanDAICc
Meanoi
Cumulativeoi
Independentconstrained
�227.33 3 460.75 0.04 0.53 0.53
Independent �226.58 4 461.31 0.6 0.4 0.93Dependent �224.09 8 464.7 3.99 0.07 1
Abbreviation: AICc, Akaike Information Criterion corrected forsample size.Models are ordered based on their average Akaike weights (oi)denoting the relative likelihood of each model. Refer to Figure 1d formodel diagrams.
Interaction between habitat and growth formT Nakov et al
7
The ISME Journal
probabilities within particular clades are certainlypossible and a closer look at lineages where stateshifts are most common might identify tendenciesspecific to particular groups.
Traversals between habitats are rare, but asymmetric inlineages with colonial growth formFor a photosynthetic unicell, the plankton andbenthos are diametrically different environments.Differences in physico-chemical properties of thesurrounding water, the availability of nutrients andlight and the types of available microhabitats requiredifferent sets of morphological and physiologicaladaptations (Stevenson, 1997; Reynolds, 2006). Tran-sitions between benthic and planktonic habitatstherefore are accompanied by physiological andmorphological adjustments streamlining the cellsfor existence in the respective habitat. A comparisonof morphology of sister lineages differing in habitatoccupancy revealed that benthos-plankton transi-tions tend to be accompanied by one or more of thefollowing trait shifts: (i) increased morphologicalcomplexity of the cell, (ii) increase in cell size and(iii) transition to colonial growth form. These traitshifts might be related to adaptations for planktoniclifestyle (Kooistra et al., 2007, 2009). Increasedmorphological complexity of the cell, achievedthrough the acquisition of various projections,spines and keels, might represent a mechanism-improved buoyancy. Departure from spherical cellshape increases form resistance—the difference insinking velocity between a particle and a spherewith identical density and volume—and thereforedecreases sinking velocity allowing cells to staysuspended longer (Padisak et al., 2003). The mor-phology of a colony can have an effect on sinkingvelocity as well. Tubular, spiral or stellate arrange-ments that maintain colony symmetry exhibitreduced sinking relative to asymmetrical arrange-ments (Padisak et al., 2003; Reynolds, 2006). Increasein cell size, a strategy that accompanied transitionsto the plankton in some marine lineages(for example, the benthic Odontella longicruris(Greville) Hoban versus the larger planktonicO. longicruris var. hyalina (Schroder) Hoban), mightbe related to adaptation for higher capacity ofnutrient storage given transition to the planktonicenvironment (Litchman et al., 2009). The repeatedappearance of these phenotypes coincident with thetransition to planktonic habitats is suggestive ofadaptations to life as a suspended particle. It isunlikely, however, that these traits are selectedsolely by the requirements of the planktonic envir-onment. Large cell size, for example, is a strategy fordefense against predators (Thingstad et al., 2005;Verdy et al., 2009; Yokota and Sterner, 2010) andappears to be favored in marine environments ingeneral (Litchman et al., 2009; Nakov et al., 2014).
Estimates of the number of habitat traversalson the phylogeny offers several insights. First,
transitions to planktonic lifestyle from a benthichabitat occurred more frequently than the opposite.This result is consistent regardless of the method ofinference (parsimony or model based). Second, themajority of transitions to the plankton happened inlineages that had already attained a colonial growthform (Figure 2c). Third, planktonic, colony-forminglineages rarely or never transition to benthic habitats(Figure 2c). Taken together, these observationsindicate that lineages with solitary growth formtraverse the habitat boundaries rarely, but in bothdirections. On the other hand, in the colonial state,transitions between habitats become highly asym-metric (under parsimony: 7–12 benthic-plankonicversus 0–1 planktonic-benthic). Planktonic colo-nial lineages can be viewed as somewhat of a ‘dead-end’ with respect to habitat traversals. For thesespecies, transition to the benthos would be a two-step process involving, first, loss of colonial growthhabit and, second, transition to the benthos(Figure 2c). Overall, the benthic colonial state seemsmost dynamic, as changes in either trait are morefrequent compared with transitions to and fromother states (Figure 2c).
Estimating character state shifts is sensitive totaxon sampling. In this data set, benthic speciesoutnumber planktonic by factor of two, and amongthe colony formers this factor increases to 2.4. Thebias in favor of benthic species could be proble-matic, but only if it incorrectly depicts the ratio ofspecies richness observed in nature. Estimates ofspecies numbers in diatoms are uncertain (Guiry2012; Mann and Vanormelingen, 2013), but it isgenerally accepted that the benthos is more diversethan the plankton, especially in freshwater lakes(Mackay et al., 2010). While we cannot ascertainthat the ratio of colonialþ benthic:colonialþplanktonic species in our data set is a very accurateapproximation of the diversity in nature, anypotential bias in these data is likely in favorof the less numerous planktonic species as opposedto benthic taxa. Future studies will undoubtedlyrefine the findings reported here, but it is unlikelythat these inferences are a result of a grossmisrepresentation of the ratio of benthic:planktonicdiversity.
Concluding remarksWe used a broadly sampled diatom phylogeny andflexible modeling framework to investigate theinteraction between habitat occupancy, that is,where a species’ niche is, and growth form, that is,what is the species growth habit. We found thatswitches of habitat are rare and niche location,plankton or benthos, is conserved at the level oflarge clades. Transitions between growth forms arefaster, but lineage specific, such that evolution isessentially stagnant in some clades, and dynamic inothers. There is little interaction between thesetraits—switching niche location does not depend
Interaction between habitat and growth formT Nakov et al
8
The ISME Journal
on growth form and alternating between growthforms is not conditioned on habitat.
The approach taken here is somewhat simplisticin that the variety of microhabitats inhabited bydiatoms and the diverse set of colony morphologiesand aggregation mechanisms were reduced to binarycharacters. We were interested in capturing patternsat a very general level, that is, is cell aggregation in acolony, of any type, favored in planktonic versusbenthic species? Thus, how colonies were con-structed or whether the species were neritic oroceanic were not essential considerations for thepresent study. Fine-grained coding of microhabitatsand colony features in lineages with a diversity ofphenotypes allow posing specific questions that canrefine the inferences made here. For example, whattrajectories lead to and from the seemingly dead-endplanktonic colonial state? Are mucilage- versussilica-derived cell-to-cell attachment mechanismsattained at similar rates? Has the acquisition ofactive motility slowed down the rate of growth formevolution? Understanding the evolution of theseniche-related phenotypes would likely requiremulti-trait approaches that incorporate species cellsize, morphology and physiological characteristicsas well as investigation of the interplay between traitevolution and rates of species diversification.
Conflict of Interest
The authors declare no conflict of interest.
Acknowledgements
This work was partially funded by NSF EF 0629410 andBlumberg Fellowship to ECT. Computations wereperformed at the Texas Advanced Computing Center(http://www.tacc.utexas.edu).
References
Alverson AJ, Jansen RK, Theriot EC. (2007). Bridging therubicon: phylogenetic analysis reveals repeated colo-nizations of marine and fresh waters by thalassiosiroiddiatoms. Mol Phylogenet Evol 45: 193–210.
Armbrust EV. (2009). The life of diatoms in the world’soceans. Nature 459: 185–192.
Ashworth MP, Nakov T, Theriot EC. (2013).Revisiting Ross and Sims (1971): toward a molecularphylogeny of the Biddulphiaceae and Eupodiscaceae(Bacillariophyceae). J Phycol 49: 1207–1222.
Beaulieu JM, O’Meara BC, Donoghue MJ. (2013).Identifying hidden rate changes in the evolution of abinary morphological character: the evolution ofplant habit in campanulid angiosperms. Syst Biol 62:725–737.
Brown JW, Sorhannus U. (2010). A molecular genetictimescale for the diversification of autotrophic stra-menopiles (Ochrophyta): substantive underestimationof putative fossil ages. PLoS One 5: e12759.
Burnham KP, Anderson DR. (2002). Model Selectionand Multimodel Inference: A Practical Information-Theoretic Approach, 2nd edn. Springer: New York, USA.
Falkowski PG, Katz ME, Knoll AH, Quigg A, Raven JA,Schofield O et al. (2004). The evolution of moderneukaryotic phytoplankton. Science 305: 354–360.
Guiry MD. (2012). How many species of algae are there?J Phycol 48: 1057–1063.
Hoagland KD. (1983). Short-term standing crop anddiversity of periphytic diatoms in a eutrophicreservoir1. J Phycol 19: 30–38.
Hoagland KD, Roemer SC, Rosowski JR. (1982).Colonization and Community structure of twoperiphyton assemblages, with emphasis on the dia-toms (Bacillariophyceae). Am J Bot 69: 188–213.
Hopkinson BM, Dupont CL, Allen AE, Morel FMM. (2011).Efficiency of the CO2-concentrating mechanism ofdiatoms. Proc Natl Acad Sci USA 108: 3830–3837.
Johnson RE, Tuchman NC, Peterson CG. (1997). Changesin the vertical microdistribution of diatoms within adeveloping periphyton mat. J North Am Benthol Soc16: 503–519.
Kooistra WHCF, Forlani G, De Stefano M. (2009).Adaptations of araphid pennate diatoms to a planktonicexistence. Mar Ecol 30: 1–15.
Kooistra WHCF, Gersonde RK, Medlin LG, Mann D.(2007). The origin and evolution of the diatoms: Theiradaptation to a planktonic existence. In Evolution ofPrimary Producers in the Sea. Falkowski PG, Knoll AH(eds). Academic Press: Burlington, pp 207–249.
Litchman E, Klausmeier CA, Yoshiyama K. (2009).Contrasting size evolution in marine and freshwaterdiatoms. Proc Natl Acad Sci 106: 2665–2670.
Mackay AW, Edlund MB, Khursevich G. (2010). Diatomsin ancient lakes. In The Diatoms: Applications forthe Environmental and Earth Sciences. Smol JP,Stoermer EF (eds). Cambridge University Press:Cambridge, pp 209–228.
Maddison WP, Maddison DR. (2011). Mesquite: amodular system for evolutionary analysis. http://mesquiteproject.org.
Mann DG, Vanormelingen P. (2013). An inordinate fond-ness? the number, distributions, and origins of diatomspecies. J Eukaryot Microbiol 60: 414–420.
McCormick PV, Stevenson RJ. (1991). Mechanismsof benthic algal succession in lotic environments.Ecology 72: 1835–1848.
Nakov T, Theriot EC, Alverson AJ. (2014). Using phylo-geny to model the evolution of cell size in marine andfreshwater diatoms. Limnol Oceanogr 59: 79–86.
Nelson DM, Treguer P, Brzezinski MA, Leynaert A,Queguiner B. (1995). Production and dissolution ofbiogenic silica in the ocean: revised global estimates,comparison with regional data and relationship tobiogenic sedimentation. Glob Biogeochem Cycles 9:359–372.
Niklas KJ, Newman SA. (2013). The origins of multi-cellular organisms. Evol Dev 15: 41–52.
Padisak J, Soroczki-Pinter E, Rezner Z. (2003). Sinkingproperties of some phytoplankton shapes and therelation of form resistance to morphological diversityof plankton—an experimental study. Hydrobiologia500: 243–257.
Pagel M. (1994). Detecting correlated evolution onphylogenies: a general method for the comparativeanalysis of discrete characters. Proc R Soc B Biol Sci255: 37–45.
Interaction between habitat and growth formT Nakov et al
9
The ISME Journal
Pagel M, Meade A. (2006). Bayesian analysis of correlatedevolution of discrete characters by reversible-jumpMarkov chain Monte Carlo. Am Nat 167: 808–825.
Paradis E, Claude J, Strimmer K. (2004). APE: analysesof phylogenetics and evolution in R language.Bioinformatics 20: 289–290.
R Development Core Team (2013). R: a Language andEnvironment for Statistical Computing. R Foundationfor Statistical Computing: Vienna, Austria, URL http://www.R-project.org/.
Reynolds CS. (2006). The Ecology of Phytoplankton.Cambridge University Press: Cambridge.
Round FE, Crawford RM, Mann DG. (1990). Diatoms:Biology and Morphology of the Genera. CambridgeUniversity Press: Cambridge.
Sanderson MJ. (2002). Estimating absolute rates ofmolecular evolution and divergence times: a pena-lized likelihood approach. Mol Biol Evol 19: 101–109.
Spaulding SA, Kociolek JP. (2000). Freshwater diatombiogeography. Nova Hedwig 71: 223–242.
Stamatakis A. (2006). RAxML-VI-HPC: maximum like-lihood-based phylogenetic analyses with thousands oftaxa and mixed models. Bioinformatics 22: 2688–2690.
Stamatakis A, Hoover P, Rougemont J. (2008). A rapidbootstrap algorithm for the RAxML Web servers. SystBiol 57: 758–771.
Stevenson RJ. (1997). An introduction to algal ecology infreshwater benthic habitats. In algal Ecology: Fresh-water Benthic Ecosystems. Stevenson RJ, Bothwell ML,
Lowe R (eds). Aquatic ecology series, Academic Press:San Diego.
Theriot EC, Ashworth M, Ruck E, Nakov T, Jansen RK.(2010). A preliminary multigene phylogeny of thediatoms (Bacillariophyta): challenges for futureresearch. Plant Ecol Evol 143: 278–296.
Theriot EC, Cannone JJ, Gutell RR, Alverson AJ. (2009).The limits of nuclear-encoded SSU rDNA for resolvingthe diatom phylogeny. Eur J Phycol 44: 277–290.
Theriot EC, Ruck E, Ashworth M, Nakov T, Jansen RK.(2011). Status of the pursuit of the diatom phylogeny:are traditional views and new molecular paradigmsreally that different? Diatom World 119–142.
Thingstad TF, Øvreas L, Egge JK, Løvdal T, Heldal M.(2005). Use of non-limiting substrates to increase size;a generic strategy to simultaneously optimize uptakeand minimize predation in pelagic osmotrophs? EcolLett 8: 675–682.
Verdy A, Follows M, Flierl G. (2009). Optimal phyto-plankton cell size in an allometric model. Mar EcolProg Ser 379: 1–12.
Vyverman W, Verleyen E, Sabbe K, Vanhoutte K,Sterken M, Hodgson DA et al. (2007). Historicalprocesses constrain patterns in global diatomdiversity. Ecology 88: 1924–1931.
Yokota K, Sterner RW. (2010). Trade-offs limiting theevolution of coloniality: ecological displacement ratesused to measure small costs. Proc R Soc B Biol Sci 278:458–463.
Supplementary Information accompanies this paper on The ISME Journal website (http://www.nature.com/ismej)
Interaction between habitat and growth formT Nakov et al
10
The ISME Journal