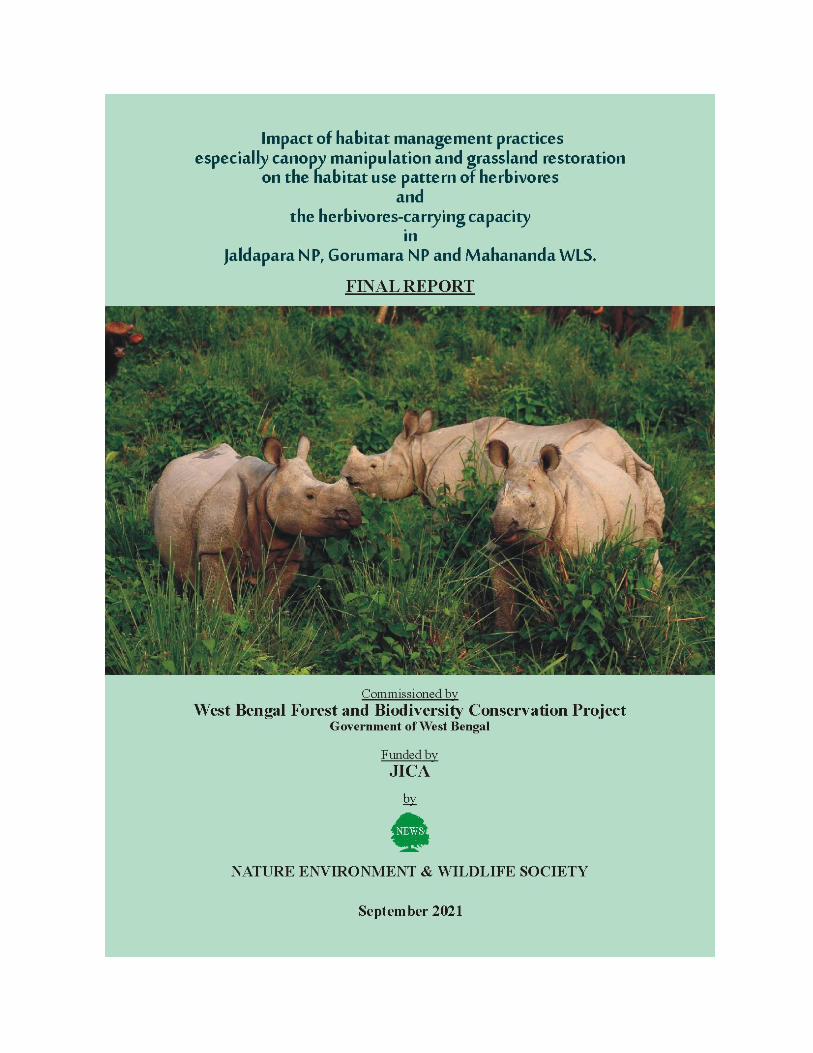
Impact of habitat management practices
224
-
Upload
khangminh22 -
Category
Documents
-
view
4 -
download
0
Transcript of Impact of habitat management practices
ACKNOWLEDGEMENTS
We are grateful to the West Bengal Forest and Biodiversity Conservation Project (WBFBCP) and JICA for funding this project and especially for the support given by Mr. Debal Ray, Chief Project Director, Mr. Bhatta,Project Director, Monitoring and Evaluation, toDr. S. Faizi, Biodiversity Specialist, PMC, West Bengal Forest and Biodiversity Conservation Projectfor his valuable suggestions and midterm corrections, and Mr. GoutamChatterjee for his endless support. We place on record our gratitude to Mr. Ravi KantSinha, HOFF, West Bengal and Mr. V. K Yadav, PCCF Wildlife, West Bengal, for their constant guidance and support to carry this project forward to its logical conclusion throughout the project period.
We also thank Mr. Rajendra Jhakar, CCF, Wildlife, North Bengal; Mr. UjjalGhosh, Former CCF,Wildlife, North Bengal and presently APCCF & CCF, Special Development Project;Mr.Kumar Vimal, then DFO, Jaldapara National Park; Ms. NishaGoswami, then DFO, Gorumara NP; Mr. Jiju Jasper, DFO, Mahananda Wildlife Sanctuary;Mr. Bimal Debnath, then AWLW, Jaldapara National Park and Mahananda WLS; Mr.ManishKumar Jadav, thenAWLW, Jaldapara NP; Mr. Debdarshan Roy, AWLW, Jaldapara NP; Ms. Rhea Ganguli, ADFO, Gorumara NP; Mr. Jayanta Mondal, Former AWLW, Mahananda WLS and presently ADFO, Baikunthapur Forest Division; Ms. Nima Lamu Sherpa, AWLW, Mahananda WLS; for providing us the necessary permission, logistic support, documents related to the project and all theforest staffs for their assistance at all times.
We thank Mr. Mukesh Sarkar, Ranger, Jaldapara West Range, Mr. Sibash Sarkar, Ranger, Jaldapara North Range, Mr.SwapanMajhi, Ranger, Jaldapara East Range, Beat officers of East and West Range and Siltorsa Beat and other officials our deep sense of gratitudewho rendered us all thehelp as andwhen needed.
We place our gratitude toMr. AyanChakraborty, Ranger, Gorumara South Range; Mr. Sarad Mani Chetri, Ranger, GorumaraNorth Range. Ms. SmritiRai, Beat Officer, Dhupjhora Beat; Mr. Bhupati Singh, Beat officer, Budhram Beat; Mr. JibonBiswakarma, Beat Officer, Gorumara Beat; Mr. Kinu Sarkar, Beat Officer, Khunia Beat and Mr. Roshan Roy Beat Officer, Murti Beatfor their help in the field.
We thank Mr. Tapas Kundu, Ranger, Mahananda West Range;Mr. Mriganka Maity, Ranger, Sukna Range; Mr. Kaji Chetri, Ranger, Mahananda South Range and Mr. Nawin Mani Pradhan,Mahananda North Range for their help in the field and also with the accommodation.
We arealso thankful to Mr. Chiranjit Pal, NWC Beat; Mr. Gour Chandra Chanda, Former-Beat Officer, Bendaki Beat; Mr. RajibPodder, Beat Officer, Jaldapara Headquarter Beat Jaldapara National Park.
We thank Mr. Dolan Sarkarfor helping uswith thenecessarymaps and management plans and toMr. Anukul Chandra Roy, Mr.DebjyotiDutta, andMr. Nirmal Das forassistingus throughout the field work.
And last, but not the least we are thankful to all the Forest Guards, Bono Sramiks and Mahuts of all the PAs for helping us throughout the field surveys.
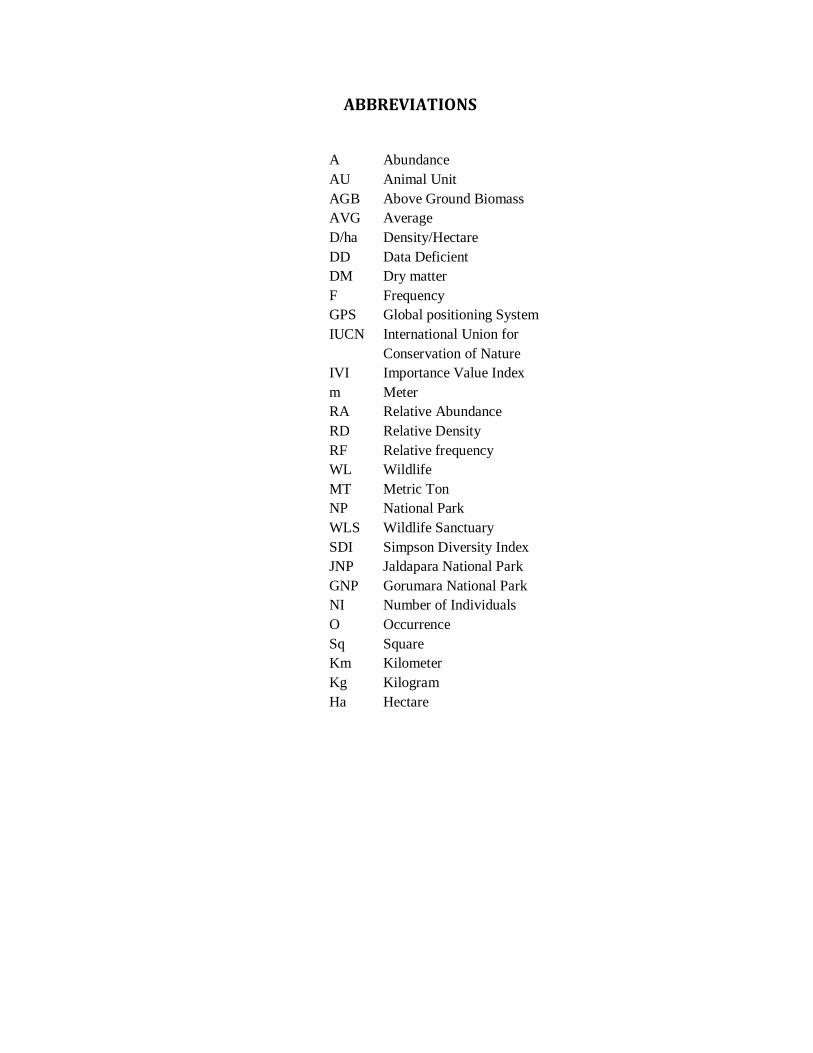
ABBREVIATIONS
A Abundance
AU Animal Unit
AGB Above Ground Biomass
AVG Average
D/ha Density/Hectare
DD Data Deficient
DM Dry matter
F Frequency
GPS Global positioning System
IUCN International Union for
Conservation of Nature
IVI Importance Value Index
m Meter
RA Relative Abundance
RD Relative Density
RF Relative frequency
WL Wildlife
MT Metric Ton
NP National Park
WLS Wildlife Sanctuary
SDI Simpson Diversity Index
JNP Jaldapara National Park
GNP Gorumara National Park
NI Number of Individuals
O Occurrence
Sq Square
Km Kilometer
Kg Kilogram
Ha Hectare
4 | N E W S
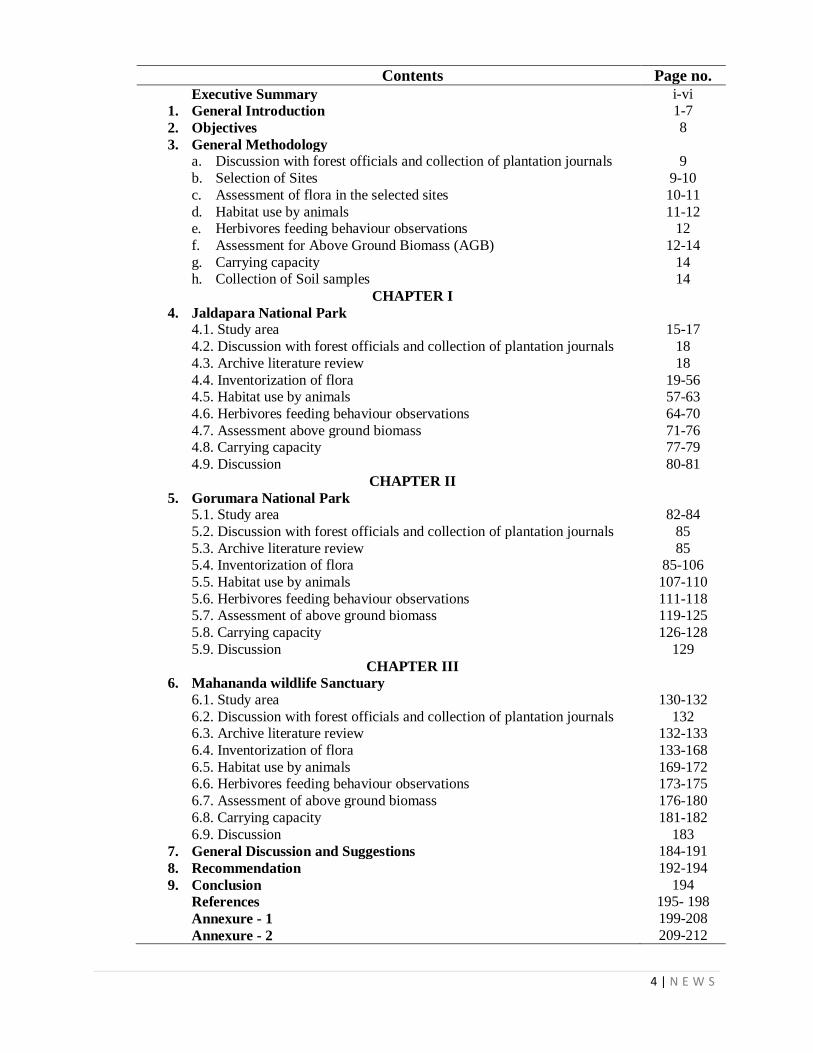
Contents Page no.
Executive Summary i-vi
1. General Introduction 1-7
2. Objectives 8
3. General Methodology a. Discussion with forest officials and collection of plantation journals 9
b. Selection of Sites 9-10
c. Assessment of flora in the selected sites 10-11
d. Habitat use by animals 11-12 e. Herbivores feeding behaviour observations 12
f. Assessment for Above Ground Biomass (AGB) 12-14
g. Carrying capacity 14 h. Collection of Soil samples 14
CHAPTER I
4. Jaldapara National Park 4.1. Study area 15-17
4.2. Discussion with forest officials and collection of plantation journals 18
4.3. Archive literature review 18
4.4. Inventorization of flora 19-56 4.5. Habitat use by animals 57-63
4.6. Herbivores feeding behaviour observations 64-70
4.7. Assessment above ground biomass 71-76 4.8. Carrying capacity 77-79
4.9. Discussion 80-81
CHAPTER II
5. Gorumara National Park 5.1. Study area 82-84
5.2. Discussion with forest officials and collection of plantation journals 85
5.3. Archive literature review 85 5.4. Inventorization of flora 85-106
5.5. Habitat use by animals 107-110
5.6. Herbivores feeding behaviour observations 111-118 5.7. Assessment of above ground biomass 119-125
5.8. Carrying capacity 126-128
5.9. Discussion 129
CHAPTER III
6. Mahananda wildlife Sanctuary
6.1. Study area 130-132
6.2. Discussion with forest officials and collection of plantation journals 132 6.3. Archive literature review 132-133
6.4. Inventorization of flora 133-168
6.5. Habitat use by animals 169-172 6.6. Herbivores feeding behaviour observations 173-175
6.7. Assessment of above ground biomass 176-180
6.8. Carrying capacity 181-182
6.9. Discussion 183
7. General Discussion and Suggestions 184-191
8. Recommendation 192-194
9. Conclusion 194
References 195- 198
Annexure - 1 199-208
Annexure - 2 209-212
5 | N E W S
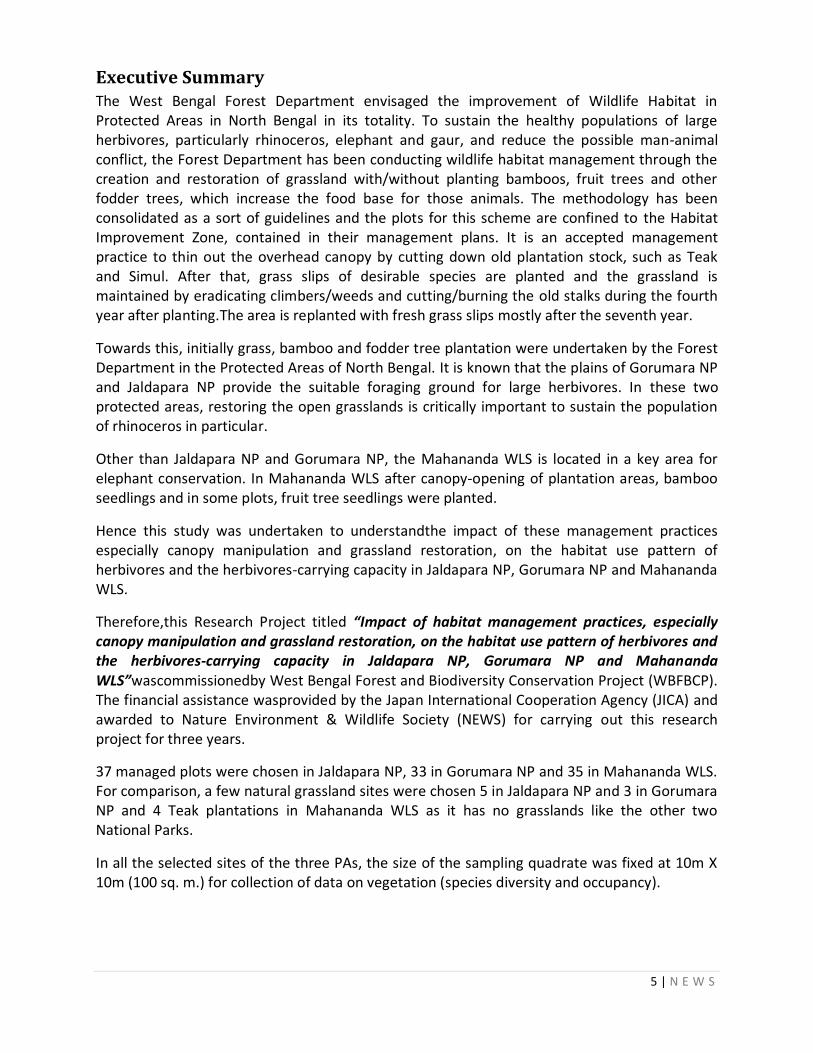
Executive Summary The West Bengal Forest Department envisaged the improvement of Wildlife Habitat in Protected Areas in North Bengal in its totality. To sustain the healthy populations of large herbivores, particularly rhinoceros, elephant and gaur, and reduce the possible man-animal conflict, the Forest Department has been conducting wildlife habitat management through the creation and restoration of grassland with/without planting bamboos, fruit trees and other fodder trees, which increase the food base for those animals. The methodology has been consolidated as a sort of guidelines and the plots for this scheme are confined to the Habitat Improvement Zone, contained in their management plans. It is an accepted management practice to thin out the overhead canopy by cutting down old plantation stock, such as Teak and Simul. After that, grass slips of desirable species are planted and the grassland is maintained by eradicating climbers/weeds and cutting/burning the old stalks during the fourth year after planting.The area is replanted with fresh grass slips mostly after the seventh year.
Towards this, initially grass, bamboo and fodder tree plantation were undertaken by the Forest Department in the Protected Areas of North Bengal. It is known that the plains of Gorumara NP and Jaldapara NP provide the suitable foraging ground for large herbivores. In these two protected areas, restoring the open grasslands is critically important to sustain the population of rhinoceros in particular.
Other than Jaldapara NP and Gorumara NP, the Mahananda WLS is located in a key area for elephant conservation. In Mahananda WLS after canopy-opening of plantation areas, bamboo seedlings and in some plots, fruit tree seedlings were planted.
Hence this study was undertaken to understandthe impact of these management practices especially canopy manipulation and grassland restoration, on the habitat use pattern of herbivores and the herbivores-carrying capacity in Jaldapara NP, Gorumara NP and Mahananda WLS.
Therefore,this Research Project titled “Impact of habitat management practices, especially canopy manipulation and grassland restoration, on the habitat use pattern of herbivores and the herbivores-carrying capacity in Jaldapara NP, Gorumara NP and Mahananda WLS”wascommissionedby West Bengal Forest and Biodiversity Conservation Project (WBFBCP). The financial assistance wasprovided by the Japan International Cooperation Agency (JICA) and awarded to Nature Environment & Wildlife Society (NEWS) for carrying out this research project for three years.
37 managed plots were chosen in Jaldapara NP, 33 in Gorumara NP and 35 in Mahananda WLS. For comparison, a few natural grassland sites were chosen 5 in Jaldapara NP and 3 in Gorumara NP and 4 Teak plantations in Mahananda WLS as it has no grasslands like the other two National Parks.
In all the selected sites of the three PAs, the size of the sampling quadrate was fixed at 10m X 10m (100 sq. m.) for collection of data on vegetation (species diversity and occupancy).
6 | N E W S
Special emphasis was given to record the presence/absence of the planted species and all weeds, to understand the correlation between their intrusion and growth of grass, fodder and sedge species.
For convenience all the plant species found in the quadrates they were grouped into 4 categories: • Planted grass & fodder species (planted by Forest Department) • Naturally occurring grass, fodder & sedge species (those not planted) • Weed species • Other species (excluding all the above species) The documentation of plants from the different sites was tabulated and their Abundance, Frequency & Relative Frequency, Density & Relative Density were also calculated (Baxter, 2014). The Importance Value Index (IVI) was analyzed (Sukla & Chandel, 1980).
Habitat utilization of major herbivores like Rhino, Gaur, and Elephant were mapped with the animal sighting records from therespective forest departments. The datawere represented and categorized in five major classes.
Feeding and foraging behaviour of herbivores (Rhino, Gaur, Elephant, Sambar and Spotted Deer and other deer species) was recorded by direct opportunistic observation in Jaldapara NP, Gorumara NP and Mahananda WLS. The plant species consumed werecollected immediately from the field and later identified.
For Assessment for Above Ground Biomass (AGB), 3 nested subplots of 1m X 1m were randomly chosen, within the same quadrate in which the taxonomical studies for vegetation were carried out. The wet weight of all these plants was weighed in the field itself and tabulated plot wise and each species expressed as Kg/m-2.These plants which were collected from each plot were then placed in an open paper or cloth bag and brought back to Kolkata and sun dried. Once totally dried, each sample was weighed with a gram scale and the recorded dry weights were averaged (Voelkel et al., 2018).
After determining annual forage production/ha (plant biomass), using Voelkel's estimation method, the total annual forage produced in the management area was calculated. This was used for determining the carrying capacity of the animals.
Jaldapara National Park
From the present study in the 33 management plots, it was seen that the Planted Fodder species by the Forest Department revealed a low occupancy percentage in all the Ranges varying from an average of 6% to 11% in pre-monsoon and 8% to 12% in post monsoon These few occurrences of the Planted species may either be due to non-survival at the sapling stage or its immediate consumption by herbivores as soon as the fences were removed.
70% of the total sightings of the Hispid hare (both direct and indirect) was in the habitat managed plots of West and East Range of Jaldapara.
7 | N E W S
It was seen that the most utilised habitat zone for both the Rhino and Gaur was in the Sissamara and Malangi beats of the East Range. Both these large ungulate species showed a positive correlation between their sightings and the percentage of grassland area.
Poaceae family (Grass species) was the dominant family in terms of the fodders fed by both the Rhino and Gaur.
The maximum estimated Biomass (24,000 kg/ha) comprised of the Planted Fodder Species planted by the Forest Department in the management plots. The least Biomass (3,500 kg/ha) occurred among the Naturally occurring Fodder Species, which were not planted, in the management plots. In between was the Biomass (18,500 kg/ha) of the Fodder Species that occurred naturally in the Natural Grasslands (untouched/unmanaged).
The total Biomass (35,29,251 kg/year) as Available Fodder Species in management plots is approximately only 1/3rdof the Available Biomass of Fodder Species in Natural Grasslands (untouched/unmanaged).
On calculation of the carrying capacity, it was seen that if only the total grassland area (without trees) of Jaldapara NP can support 111 Rhinos, 248 Gaurs and 54 Elephants on the basis of dry season biomass available. 15% of this which is 17 Rhinos, 37 Gaurs and 8 Elephants was calculated to found in the managed plots when only the planted species biomass is considered. However, if the managed plots are taken into consideration as a whole, both the planted species as well as the natural occurring grass species then the carrying capacity is 27% amounting to 30 Rhinos, 68 Gaurs and 15 Elephants.
Gorumara National Park
It was noted that an increase in the percentage of Natural grass (Saccharum sponteneum, Imperata cylindrica, Oplismenus burmannii&Axonopus compressus) decreased the intrusion of Weeds (Lantana camara, Mikania micrantha, Leea asiatica, Chromolaena odorata, Clerodendrum infortunatum) and vice versa. On a total evaluation of vegetation in Gorumara NP the cover percentage for planted species is around 32.96%.
It was also seen that occupancy percentage of Weed species in North Range is higher than the South Range. Weed species occupied about 32% of area in North Range recording the highest among the four categories of plants.
Most utilized habitat zone for both the Rhino and Gaur was Budhram with Ramsai Ext followed by Gorumara Beat of the South Range which has most of the natural grasslands. Both the species showed a positive correlation between sightings and the percentage of grassland area.
A total of 22 species of plants was recorded as consumed by herbivores like Rhino, Gaur, Sambar, Elephant, Barking deer and Spotted deer. Poaceae family (Grass species) was the dominating family in terms of the fodders for all the herbivores like Rhino, Gaur, Elephant and all deer species.
The maximum estimated Biomass (19,000 kg/ha) comprised of the Fodder Species that occurred in the Natural Grasslands (untouched/unmanaged). The least Biomass (4,500 kg/ha)
8 | N E W S
occurred among the Naturally occurring Fodder Species, which were not planted, in the management plots. In between was the Biomass (13,100 kg/ha) of the Planted Fodder Species in management plots.
The total grassland area of Gorumara NP can support 38 Rhinos, 86 Gaurs and 19 Elephants on the basis of dry season biomass available. 18% of this which is 7 Rhinos, 17 Gaurs and 4 Elephants was calculated to found in the managed plots when only the planted species biomass was considered. However, if the managed plots are taken into consideration as a whole, both the planted species as well as the natural occurring grass species, then the carrying capacity is 23% amounting to 9 Rhinos, 21 Gaurs and 5 Elephants.
Mahananda Wildlife Sanctuary
Grass and bamboo fodder species diversity in canopy opened plots of Mahananda WLS was calculated to be 3% of the total plants recorded,while fruit fodder diversity is minimal in the sample plots. In comparison to the canopy opened plots, the teak plantation plots showed less grass fodder species as it recorded only 35%, while total grass and bamboo fodder density in whole of Mahananda was 57%.
Among the weeds Chromolaena odorata, Mikania micrantha, and Clerodendrum infortunatum were denser than others. The weed species density was calculated to be almost 10% in Teak plantation and 5% in the canopy opened plots.
Of the two major herbivores in Mahananda only Gaur shows a positive correlation between sightings and the percentage of grassland area.
A total of 7 plant species was recorded as consumed by the herbivores like the Elephant, Gaur, Barking deer and Spotted deer.
The maximumestimated mean Biomass (800kg/ha)comprised of the Planted Fodder Species planted by the Forest Department in the management plots. The least Biomass (540 kg/ha) occurred among the Naturally occurring Fodder Species, which were not planted, in the management plots. This trend was seen also in the total Biomass of the Fodder Speciesas well as in Consumable Biomass of Fodder Species. The biomass of the planted species of grass fodder in the managed plots of Mahananda WLS was seen not to support any animal by its own, but with the naturally growing grass fodder species present in the managed plots it is seen to support 1 elephant and 2 gaurs on the basis of biomass in the dry season as per our findings.
Suggestions and recommendations
Grassland (Fodder species)
Cover and abundance were estimated for grasses, shrubs, herbs, and sedges. Data collection in grasslands was carried out in the pre- and post-monsoon season i.e. December, 2018 and October, 2019.
9 | N E W S
Our findings clearly indicate that Dhadda is not a good species to be planted in the management plots. This has also been reflected in the latest Management Plan of Jaldapara NP where they have suggested only 50% of Dhadda be considered for plantation. We would like to go a little further in that our suggestion would be to plant only 10% of Dhadda and over the next couple of years after a rapid analysis to remove the species from the plantation list. There is enough Dhadda available in the open unmanaged grasslands to be sustainable by itself. Moreover, over the years as per the plantation journals it is seen that the older plantations are left and mostly not tendered and in addition occupying space where other fodder can be planted or can grow on their own as is seen in the present study.
In addition,Digitaria sp. and other Bamboo sp. may be added in the list of species to be planted in Mahananda as both grass and bamboo fodder species accounted for nearly 60% of the fodder species in the canopy opened plots. Along with all these species only 10% of Dhadda may be considered for planting.
The fodder species suggested may be planted based on the grazing capacity of herbivores, in addition legumes which should be mixed together and sown as a mixed crop with a species mix ratio of 45%:20%:20%:15%.
Invasive Weeds
In the present study among the weed species recorded, Mikania micrantha, Chromolaena odorata and Ageratum conyzoides were the dominant and recorded only 20% as maximum. It is suggested that weeding of these species should be done just before the opening of the fences. While uprooting one has to very specific about the weed species and the timing of its flowering and fruiting season.
Animal Sightings
During the study period, 70% of the total sightings of the Hispid hare (both direct and indirect) in JNP was documented from the managed plots of West and East Range. In those places where the Hispid hare was sighted,it was seen to choose tall, coarse and old Dhadda plantation beds for its nesting ground. In these areas to prevent natural succession Dhadda may be considered for planting, helping in maintaining the habitat of the Hispid hare.
Opportunistic Feeding Behaviour
It is seen from the feeding behavior that these herbivores feed on a variety of fodder species of plants. However, Dhadda and Chepti seem to form nearly 50% of their diet. It is suggested that there is a need to increase the naturally growing grass species as suggested by planting them in the management plots.
Fodder Biomass
It is seen that the estimated Biomass comprising of the Planted Fodder Species planted by the Forest Department in the management plotsand theestimated Biomass of the Fodder Species that occurred naturally in the Natural Grasslands (untouched/unmanaged) were the maximum. In fact when the Available Biomass of Fodder Species was taken into consideration it is seen
10 | N E W S
that the Biomass in the Management Plots is approximately 1/3rd of the Biomass of Natural Grasslands (untouched/unmanaged).
This indicates that if this 1/3rd of Managed plots has helped in the steady growth of these large herbivores, it is suggested that 10 to 20% more management plots may be undertaken for plantation with the species identified above under Grasslandas a general prescription. In fact this is true of Mahananda where the Biomass of Natural Grass species growing within the management plots seem to sustain the carrying capacity of the animals, because even though Dhadda was present the planted species did not have enough Biomass to sustain even one animal.
We recommend that in future for all Forage Biomass Estimations especially from management plots should be undertaken at least a couple of days before the fence are removed. Also Biomass estimations should be reflecting at least two seasons if not the ideal four seasons. This will go a long way in the calculation of the Carrying Capacity of not only the grassland ecosystem but also of the animals that depend on this ecosystem. In addition to regenerate more grassland areas it is recommended that canopy opening may be undertaken in old teak plantations and in monoculture plantations in the 3 Protected Areas.
Grazing
The timing of the removal of the fence from the management plots is very crucial both for the plants as well as for the grazers. We recommend a deferred and rotational grazing for long term sustenance of plant species and the animal species.
Carrying Capacity
The Carrying Capacity of the grasslands are adequate for the present species of animals. It is at a stage when the Carrying capacity of the Herbivores will overshoot beyond its sustenance. It is recommendedto have 10% extra management plots in each Range. In addition it is useful to procurethe adjacent tea gardens or at least portions of it that border the Protective Areas for future growth of the large ungulates.
The study revealed that the impact of managing the grasslands in these Protective Areas have shown in the turnover of the large herbivores which have had a logarithmic growth since the initiation of such management practices.In effect the study revealed that the past management intervention of grassland development and canopy opening has helped enhance the ecosystem and wildlife in all the 3 PAs of North Bengal. From our study we have suggested a few alterations for the betterment of the management practices and introduce regular monitoring and correction through adaptive management.
11 | N E W S
1. General Introduction: This Research Project titled “Impact of habitat management practices, especially canopy manipulation and grassland restoration, on the habitat use pattern of herbivores and the herbivores-carrying capacity in Jaldapara NP, Gorumara NP and Mahananda WLS” was commissioned by West Bengal Forest and Biodiversity Conservation Project (WBFBCP). The financial assistance was provided by the Japan International Cooperation Agency (JICA) through them to Nature Environment & Wildlife Society (NEWS) for carrying out this research project for three years.
The West Bengal Forest Department envisaged the improvement of Wildlife Habitat in Protected Areas in North Bengal in its totality. To sustain the healthy populations of large herbivores, particularly rhinoceros, elephant and gaur, in the protected areas in the North Bengal and reduce the possible man-animal conflict, the Forest Department has been conducting wildlife habitat management through the creation and restoration of grassland with/without planting bamboos, fruit trees and other fodder trees, which increase the food basis for those animals. The methodology has been consolidated as a sort of guidelines and the plots for this scheme are confined to Habitat Improvement Zone in the protected areas, contained in their management plans. It is an accepted management practice to thin out the overhead canopy by cutting down old plantation stock, such as Teak and Simul, and by girdling (i.e. cutting up to phloem layer). After that, grass slips of desirable species are planted and the grassland is maintained by eradicating climbers/weeds and cutting/burning the old stalks in the fourth year after planting. In the seventh year, the old grasses are uprooted and the area is replanted with fresh grass slips.
Towards this initially grass and fodder tree plantation was undertaken by the West Bengal Forest Department in the Protected Areas located in the Plains of North Bengal. It is known that the plains of Gorumara NP and Jaldapara NP provide the suitable foraging ground for large herbivores. In these two protected areas, restoring the open grasslands is critically important to sustain the population of rhinoceros in particular. However, many such areas have been getting shrunk due to the natural succession with the rapid growth of colonising tree species. At the same time, the numbers of the threatened species have been increasing due to the success of conservation effort by the Forest Department for the past decade. Thus, the shortage of open grasslands has become more serious management issue for recent years. The grass species so far planted by the Forest Department are: Dhadda (Saccharum narenga), Chepti (Themeda arundinacea), Malsa (Saccharum longisetosum), Madhua (Saccharum arundinaceum), Ekra (Saccharum longisetosum var. hookeri), Nal (Arundo donax), Khagra (Pharagmites karka), Bhutta ghash (Coix lachryma-jobi), Banspati (Setaria sp.), Purundi (Alpinia nigra), etc. The tree species planted are: Sissoo (Dalbergia sissoo), Chapalish (Artocarpus chaplasha), Kumbhi (Careya arborea), Chalta (Dillenia indica), Jogdumur (Ficus hispida), etc. In addition, old grassland of over seven years old was revitalized by similar operation.
Other than Jaldapara NP and Gorumara NP, the Mahananda WLS is located in a key area for elephant conservation. Herds of elephant stay in the foothills longer than other areas along migration routes before crossing to Nepal and after coming back to West Bengal. During the stay, they raid paddy fields or maize farms, damaging crops and house properties seriously. After canopy-opening of plantation areas, bamboo seedlings and in some plots, fruit tree
12 | N E W S
seedlings will be planted by the Forest Department. The bamboo species used will all be indigenous species: Bhalu bans (Dendrocalamus sikkimensis), Choya bans (Dendrocalamus hamiltonii), Mala bans (Bambusa nutans), Kalaimakla (Bambusa vulgaris) and Mulibans (Melocana baccifera).
Towards achieving these goals, the respective Forest Department undertook management interventions of planting grass fodder during the past 30 years in open grasslands/areas after canopy opening as plantation sites. This led to an increase not only in the Rhino populations but also in other herbivores like the Elephant, Gaur, Sambar, Chital, Barking deer, Wild boar and Hog deer.
Hence this study was undertaken to understand the impact of these management practices especially canopy manipulation and grassland restoration, on the habitat use pattern of herbivores and the herbivores-carrying capacity in Jaldapara NP, Gorumara NP and Mahananda WLS.
However, due to the Covid-19 pandemic which led to a total shutdown of India including the State of West Bengal from March 2020 till August 2020 with the Protected Areas opening up only after September/October 2020 the project was brought down to a study period of only six months as all the field work had to be completed on or before the 31st of March, 2021. Therefore, many of objectives were not fully complied with, like for example the seasonal studies carried out in Jaldapara NP could not be undertaken in either Gorumara NP or in Mahananda WLS. The opportunistic foraging studies which had been kept for the last year of the project could not be carried out to our satisfaction. Only representative AGB (Above Ground Biomass) was collected for analysis as time was the biggest constraint.
The management plots undertaken in this study in the three Protected areas were chosen by the respective Forest Officials for the detailed study of vegetation and for AGB collections.
Protected Areas represent glimpses of awe-inspiring creativity of evolutionary processes, albeit somewhat edited by the human footprint on wilderness. These sacred lands are the only ones capable of providing us a kinship with wondrous wild creatures and plants, our fellow travelers on this planet. We need to ensure their persistence for posterity. Over the past three decades Protected Area Management in India has come to be driven by Scientific Wildlife Management plans, slowly at first, later as a mandatory process. Such conservation efforts cannot be sustained without long-term vision, direction and quality, based on Integration of modern scientific precepts.
Protected areas of West Bengal cover 4% of the state having 4692 sq.km. of forests under Protected Area (PA) network which is 39.50% of the State’s recorded forest area. There are 6 national parks and 16 wildlife sanctuaries in West Bengal.
The geographical positioning of West Bengal is distinctive as it is the only state within the Indian region, which extends from the Himalayas in the North to the Bay of Bengal in the south, and has many perennial rivers flowing through the state. Therefore, it enjoys an alpine as well as a sub-tropical climate.
13 | N E W S
Located in the eastern part of India, the State of West Bengal, occupies a geographical area of 88,752 sq km, (2.70% area of the country). The State lies between 21°29'N to 27°13'N latitude and 85°50'E to 89°52' E longitude. It shares the international borders with Bangladesh in the east, Nepal in the northwest and Bhutan in the northeast. With the rest of India, the State is bordered by Sikkim in the north, Assam in the east, Bihar and Jharkhand in the west and Odisha and the Bay of Bengal in the south. The North Himalayan and the south Alluvial Gangetic Plains are the two natural divisions of the State.
The state has a recorded forest land of 16,902 sq km, of which 3,018.52 sq km under Very Dense Forest (VDF), 4,160.26 sq km under Moderately Dense Forest (MDF) and 9,722.73 sq km under Open Forest (OF), thus constituting 19.04% of the geographical area of the state (FSI, 2019). The forests of West Bengal are classified into seven categories viz., Tropical Semi-Evergreen Forest, Tropical Moist Deciduous Forest, Tropical Dry Deciduous Forest, Littoral and Swampy Forest, Sub-Tropical Hill Forest, Eastern Himalayan Wet Temperate Forest and Alpine Forest.
The protected areas like National Parks, Wildlife Sanctuaries and Reserve Forests have attracted worldwide attention to study vegetation, floral diversity and other wildlife for their conservation, sustainable use and also for proper management of bio-resources. The three protected areas undertaken for the present study have a rich ecological habitat for the wild variety of animal and plants species. The natural vegetation of the areas is mainly contributed by forests of tall trees, grassland and wetland vegetation. The wood land provides food and shelter to a variety of animals and the grassland is the heaven for a variety of herbivores. One of most profound statements ever made was that Protected Area management plans, etc. would provide valuable lessons in launching the landscape approach in the country (Faizi, 2013).
The habitat of any organism is its immediate, physical and biological surroundings which supplies all the elements an animal needs for its survival. A healthy and sustainable wild habitat includes food, cover, water, and space as its basic elements. However, each animal varies in its requirement of these elements. Wildlife populations in forested habitats are dynamic because the forest is always changing. Habitat management is commonly used to maintain and enhance the biological interest of many areas of semi-natural habitat, where natural processes no longer create suitable conditions for desired species. Habitat restoration and creation is increasingly being used to increase the extent of ecologically important habitats in order to mitigate the impacts of overall human development. The modification of past management techniques and the introduction of new ones can provide additional benefits (Malcolm Ausden, 2007).
Habitat management is the key to supporting pre-historic wild animals like the rhino. Individuals or groups of wild animals never use the entire habitat homogenously, but utilize selective zones of the habitat (Hazarika, 2007). Each species requires a particular habitat, food, shelter and other survival needs, to the extent that species are said to be a product of their habitat (Smith, 1974). This habitat selection could be determined by the availability of food resources, mate distribution as well as safety from predators (Fjellstad and Steinheim, 1996). There are species-specific variations of habitat use patterns owing to distinct food choices of individual species, which may or may not be available in each habitat patch and home range area (Bell, 1971). The differences in food choice led to variations in habitat utilization patterns
14 | N E W S
among different species; widely applicable among herbivorous animals. The seasonal variation of food availability, such as burning of grasslands and annual floods, affects the variation of habitat utilization pattern of herbivorous animals.
Management Planning is an ongoing process. Adaptive management is the key element. Good planning requires continuous monitoring and evaluation to test the effectiveness of the plan. Lessons learnt act as the feedback to review the appropriateness of management actions and policies and then used to either a) make adjustments to the original plan to keep it on the right track; or b) use the lessons to develop the next version of the plan.
If one has to understand the impact of grassland management some of the following aspects need to be looked into to get a truly holistic picture for future guideline.
Forage/Grasslands
Grasslands in the wider sense are among the largest ecosystems in the world; their area is estimated at 52.5 million sq km, or 40.5 percent of the terrestrial area excluding Greenland and Antarctica (World Resources Institute, 2000, based on IGBP data). In its narrow sense, “grassland” may be defined as ground covered by vegetation dominated by grasses, with little or no tree cover; UNESCO defines grassland as “land covered with herbaceous plants with less than 10 percent tree and shrub cover” and wooded grassland as 10-40 percent tree and shrub cover (White, 1983).
Globally, grasses are represented by 10,550 species belonging to 715 genera (Pathak, 2013) whereas, in India 1,200 species belonging to 268 genera are documented (Karthikeyan et al. 1989; Moulik, 1997). About 430 grass species are endemic to India, among them Indian peninsular region shows 55% endemism (Jain 1986). For a proper management of grasslands, it is necessary to know something about the Indian grasslands, its area of occurrence, production potential and management methods. Dabadghao and Shankaranarayan (1973) have grasslands classified into five types:
1. Schima - Dichanthium grasslands are spread over the Central Indian plateau, Chota Nagpur plateau and Aravallis. The elevation ranges between 300 and 1200 m.
2. Dichanthium - Cenchrus - Lasiurus grasslands cover northern parts of Gujarat, Rajasthan, Aravalli ranges, southwestern Uttar Pradesh, Delhi and Punjab. The elevation ranges between 150 and 300 m.
3. Phragmites - Saccharum - Imperata grasslands are in the Gangetic plains, the Brahamputra Valley and the plains of Punjab. The elevation ranges between 300 and 500 m.
4. Themeda - Arundinella grasslands are found in the States of Manipur, Assam, West Bengal, Uttar Pradesh, Himachal Pradesh and Jammu and Kashmir. The elevation ranges between 350 and 1200 m.
5. Temperate - Alpine grasslands are found above 2 100 m and include the temperate and cold arid areas of Jammu and Kashmir, Himachal Pradesh, Uttar Pradesh, West Bengal and the northeastern states.
15 | N E W S
These grasslands are major reserves of biodiversity, providing important wildlife habitat. Grasslands have a basic role in feeding herbivores and ruminants and provide important ecosystem services, including erosion control, water management and water purification. Grasslands are very diverse in terms of management, yield and biodiversity value. Determining the status of grassland community structure and long-term ecological studies on various grasslands will be fundamental in systematic planning and development of scientific grassland management regime (Rawat & Adhikari 2015).
The main objective in the management of grassland is to secure the maximum production of herbivores without any detrimental effect to the productivity of grass land. It is therefore essential to see that the grassland under consideration is kept at its peak level of productivity as long as possible. Depending on the respective management regime, these areas provide a wide range of ecosystem services that include carbon sequestration, water filtering, the provision of species-rich habitats or the provision of fodder (Zhao et al. 2020; Blair et al. 2014; Sala and Paruelo 1997).
Foraging/Grazing/Browsing
Grazing management plays a large role in the quality and extent of wildlife habitat. Practices like grazing to too long, stocking too heavily, and applying too much grazing pressure especially in a single pasture system all negatively impact the natural variability of grasslands upon which wildlife populations depend. Over grazing deteriorates the grasslands. Just like human beings, grazing animals, too, have their likes and dislikes and certain grasses are preferred while certain others are avoided. On account of the relative grazing habit, desirable species tend to get depleted in grasslands much faster than other species that are not so palatable. Bison herds never stayed in one place for long, allowing grazed areas to recover. Their hooves churned the soil leaving bare areas for annual forbs and grasses to take hold, and animals like deer, dove, quail, and many others were attracted to these areas.
Since a smaller number of well-fed animals are always better than a large number of half-starved ones, the number of animals is the first principle of all grazing systems. In fixing the number of animals, the carrying capacity of the grassland should be taken into consideration. This is defined as the number of animals that can graze in a unit area without over grazing or under grazing in an average season. The greatest single factor which causes determination of grasslands is over-grazing on account of selective grazing habit of animals; desirable species tend to get depleted much faster than the less palatable species. To avoid this risk, grazing must be stopped at some stage or other i.e., in grassland terminology the grazing has to be deferred since it will seldom possible to stop grazing over entire area, when no other alternative areas are available. The practical method is to defer grazing in a part of the grassland and to allow grazing in the other part in a 'rotational' system.
Forage Biomass
Biomass is defined as the total amount of living vegetation in e.g., a habitat or a sample (Chapin et al., 2002) and is a measure of vegetative growth. Because all living things contain water
16 | N E W S
(fresh mass) and the percentage of water can vary widely from species to species, biomass is calculated as a dry mass. Dry mass is the mass of life that is left after all the water is removed, much like squeezing out a sponge. Total biomass is found by summing the dry mass of all individuals in a given land area and then reported by naming the area of concern, e.g. biomass per plot, ecosystem, biome, classroom. To be able to compare biomass in different locations, biomass is standardized as per unit of area. Typical units of biomass are grams per meters squared (g/m2), although it is also expressed as kg/m2, lb/ft2.The first requirement when developing a grazing management plan is setting a proper stocking rate that considers annual vegetation production (kg/m2). A proper stocking rate matches animal demand with the annual forage production, and consists of three factors: the number of animals grazing, the area being grazed, and the amount of time a given area is grazed. Biomass of grassland vegetation refers to above-ground herbaceous flora, commonly referred to as ‘dry matter (DM) yield.’
Plant biomass measurement is a fundamental procedure for grassland management and grassland field studies. The precision of herbaceous biomass estimation depends not only on the sample number (Iwasaki 1976), but also on the spatial heterogeneity of the biomass (Iwasaki 1976) and sampling procedures (Cobby et al. 1985). Research workers and managers of grassland vegetation are interested in this to determine the amount of available forage for animals or to measure the effects of management on the vegetation. Traditional biomass measurements are considered the most reliable method for determining aboveground biomass (AGB) (Desalew et al., 2010). However, they are extremely labor demanding and time consuming; including cutting of biomass in field, followed by drying and weighing of biomass in laboratories.
Forage can be divided into botanical species, into groups of species (grasses, legumes, weeds or other species), or into standing green and dead material and litter. The quantity of vegetation present at any one given time can be used to calculate changes, such as herbage growth, utilization by grazing animals, or deterioration. Although the basic techniques of measuring the amount of vegetation present can be used for each of these purposes, the procedures and intensity of sampling will differ depending on the objectives of the measurements.
Vegetation also varies in quality according to their stage of growth and maturity. Plants are most nutritious during the early growing stages. Once mature the nutritive value of plants declines – especially for herbaceous plants (Desalew et al., 2010). At the same time the plants´ content of fibre, lignin and cellulose increase. These substances serve as protection from high temperatures and evapotranspiration. But they also reduce their nutritional content and digestibility, making them more indigestible to animals (Powell et al., 1996). Therefore, the early growing stages are important for the animals.
Carrying Capacity
The number of animals a piece of land can support on a long-term basis without causing damage to the range resource is the carrying capacity (or grazing capacity) of the land. Thus, carrying capacity is set by mother nature, through soil and climate characteristics; stocking rate is set by humans, through wildlife management. Large herbivore carrying capacity, that is, the maximum biomass of large herbivorous mammals that an ecosystem is able to sustain for the long term, is a key factor in ecosystems trophic dynamics.
17 | N E W S
In a mammalian community, the biomass of secondary consumers (carnivores) depends on the biomass of their prey, namely, the herbivores, and this biomass, in turn, depends on primary production (McNaughton et al., 1989; Oesterheld et al., 1992), which, in turn, is determined by climate (mainly temperature and rain fall) and soil fertility (Rosenzweigh, 1968; Fritz and Duncan, 1994). Generally speaking, the total ungulate biomass is closer to estimated carrying capacity in open than in closed forest because of the different distribution of primary production, which results in different food availability for the large mammal herbivores.
The dynamics of a plant-herbivore system can be represented by three components (Caughley, 1979): 1) the functional response of the herbivore, which describes plant biomass intake by herbivores as a function of standing plant biomass, 2) the numerical response of the herbivore, which describes the rate of increase of herbivores as a function of standing plant biomass, and 3) the plant growth response, which describes the rate of increase of plant biomass as a function of plant density.
This present study has a direct application to the conservation of wildlife implicitly and will also serve as a primary input for planning management interventions for sustaining the phyto-diversity of the diverse grass/forest cover present in the area of study.
In this report we document a comprehensive inventory of all grass and tree species wherever present, both quantitatively and qualitatively with relevant statistical analysis in random quadrates from the selected management plots along with some natural plots in each of the three Protected areas. Also, Above Ground Biomass (AGB) estimations were undertaken in randomized nested subplots in the same plots from where the vegetation data was recorded. All these plots were chosen by the West Bengal Forest Department.
Data collected from the Forest Department on animal sightings in the three Protected areas have also been computed and analyzed. Along with this the foraging behavior of animals was documented by direct opportunistic observation of herbivores (Rhino, Gaur and Deer species) feeding pattern with the help of vehicles and departmental elephants. In addition, in Jaldapara NP, the habitat use by hispid hare was carried out by signs (pellets) and direct opportunistic observation.
All these have been explained though relevant statistical analysis with Tables and Pie diagrams. Based on the findings, relevant calculations have been made to enumerate the AGB and relate it to the Carrying Capacity of these Protected areas.
The final findings have been explained separately with particular reference to the impact of management for each of the Protected area along with recommendations for future management in these individual areas. A general conclusion and suggested recommendations as whole are also given to understand these areas holistically, to enable its inclusion in future adaptive management plans of these Protected areas of the West Bengal Forest Department.
2. Objectives:
I. To finalise the methodology and selection of study sites in consultation with the client.
18 | N E W S
II. To assess the impact of habitat management practices with emphasis on canopy
manipulation and grassland management in Jaldapara NP, Gorumara NP, and Mahananda WL Sanctuary on the habitat use pattern of herbivores (especially all Deer species, Rhino, Elephant, Gaur and Hispid hare) and the Bengal Florican.
III. To assess the Herbivore-carrying capacity of these PAs. IV. To identify the major weeds in the PAs, assess the occupancy percentage, evaluate the
current practices for weed elimination and suggest measures for strengthening effective weed management.
V. To develop habitat management plans for the three Protected Areas in relation to the herbivores, especially in regard to canopy manipulation and grassland management.
VI. To incorporate the comments and suggestions of the Wildlife Wing and other field officers received through PMU office.
19 | N E W S
1. General Methodology
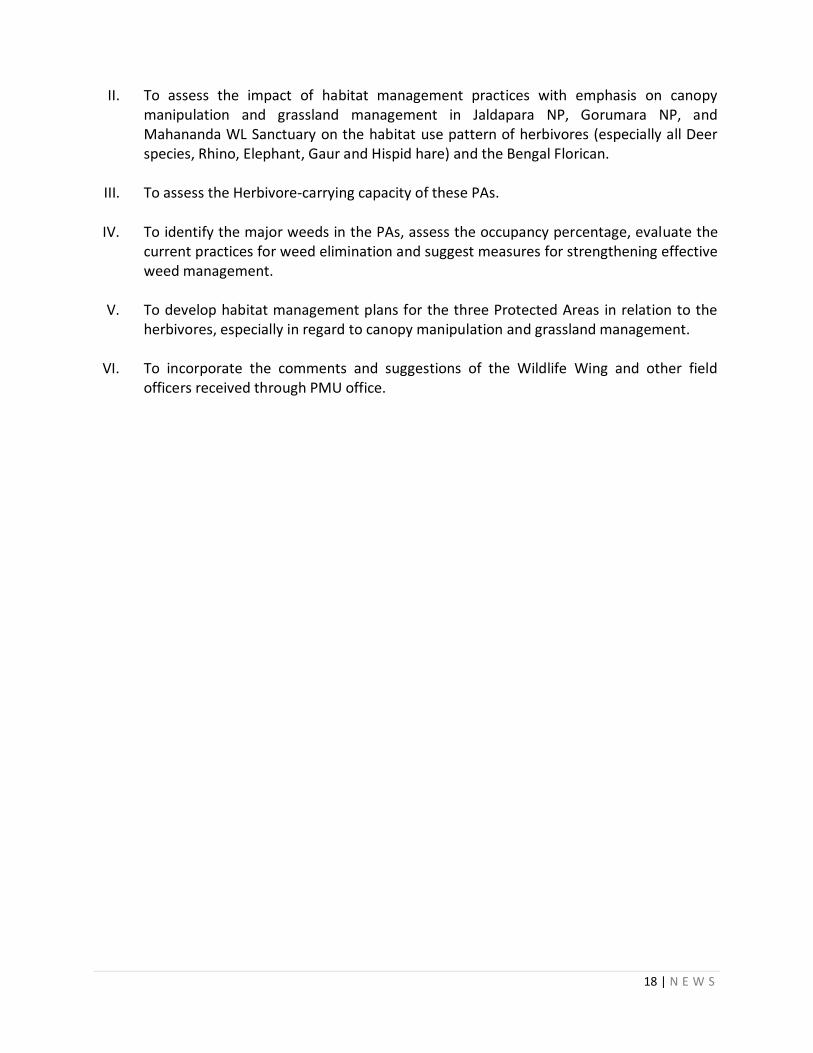
a) Discussion with forest officials and collection of plantation journals: Discussions were carried out with the respective forest officials in all the three PAs.
Both old and new Plantation journals that were made available were collected from respective ranges of Jaldapara NP, Gorumara NP and Mahananda WLS. In addition, archival documents like previous Management Plan, Rhino Census Report (2013, 2015, and 2019), old and new cut back and burning records and Annual Report (2015-16) of Jaldapara NP were also collected. All these documents were photo copied for reference.
Figure 1: Discussion with the Forest Officials
b) Selection of sites:
I. For collection, identification & documentation of plants Sites were selected by going through all the available archive journals/reports/ documents including repeated plantation sites and after discussion with the relevant Forest Officials. A ground survey was also conducted before the actual sites were selected, to understand different ecosystem, habitats and river pathways. The survey also examined the relationship between light availability and canopy type viz. open pasture, planted canopy, and secondary forest on understory grass biomass. The plots were so chosen that they were located in the different habitats like low land, high land etc, and near adjoining water bodies and salt licks. All these sites were chosen with the approval of the Forest Department.
II. For assessing vegetation in managed and natural sites
These sites were randomly selected with the help of the Respective Forest Departments, so that they are representative of all the beats and ranges in three Protected Areas. Based on these, 37 managed plots were chosen in Jaldapara NP, 33 in Gorumara NP and 35 in Mahananda WLS. Simultaneously for comparison, 5 sites of natural grassland in Jaldapara NP, 3 Sites in Gorumara NP and 4 Teak plantation in Mahananda WLS as it has no grasslands like the other two National Parks.
20 | N E W S
III. For assessing Above Ground Biomass (AGB) Sites for the biomass assessment were selected randomly from the same sites where the taxonomical studies were carried out for the JNP, GNP and Mahananda. 10 sites from JNP, 16 sites from GNP and 10 sites from Mahananda were chosen for grass collection. The sites were so chosen that at least one plot from each beat was represented. Two natural plots were also randomly selected at Jaldapara North and East Ranges. Similarly, two natural plots were randomly selected in Gorumara South Range.
c) Assessment of flora in the selected sites: In all the selected sites of the three PAs, the size of the sampling quadrate was fixed at 10m X 10m (100 sq. m.) for collection of the data on vegetation (Species diversity and occupancy).
Special emphasis was given to record the presence/absence of the planted species and all weeds, to understand the correlation between their intrusion and growth of grass, fodder and sedge species. In Mahananda WLS vegetation occupancy method could not be done as most of the plots were under canopy openings and along with the grass fodder species tree species were also there.
I. Calculation methods for Vegetation occupancy: For occupancy percentage calculation in this study, both Saccharum narenga and Themeda arundinacea were selected as standard species and given the score as 1 as these were the large planted grass species. A mature plant species generally occupied more or less same land area in different quadrates. As an example, one individual of either Saccharum narenga or Themeda arundinacea usually take up a land area of 9 sq ft, where 50 individuals of Ageratum conyzoides also occur in the same area. So, the score for Ageratum conyzoides is calculated as 1/50 i.e. 0.02.
Such a scoring of all plant species found at Jaldapara and Gorumara were done first and then multiplied with the individual plant number which was encountered in each quadrate during survey. Occupancy percentage was calculated for all species (planted, natural grass and weeds) within the 100 sq. m. area. Summation of all species occupied is always 100. (Elzinga et. al., 1998)
For convenience all the plant species found in the quadrates were grouped into 4 categories:
Planted grass & fodder species (planted by Forest Department)
Naturally occurring grass, fodder & sedge species (those not planted)
Weed species
Other species (excluding all the above species)
II. Statistical evaluation of the data:
The documentation of plants from the site was tabulated and their Abundance, Frequency & Relative Frequency, Density & Relative Density were also calculated (Baxter, 2014) Range wise and also total PA wise. The Importance value Index (IVI) was analysed by summing up the
21 | N E W S
values of Relative Density, Relative Frequency and Relative Abundance (Sukla & Chandel, 1980). The adopted formulas are as follows –
1.
Where, i = total number of individuals of a species and n = number of quadrates in which the species has occurred.
2.
3.
Where, n = number of quadrates in which the species has occurred and N = Total number of quadrates studied.
4.
5.
Where, F = frequency of a species and f = total plant frequency.
6.
Where, x = total number of a species and c = area studied.
7.
Where, D = density of a species and d = total plant density.
8.
Where, RA=Relative Abundance, RF= Relative Frequency and RD= Relative density The species diversity was calculated by Simpson Diversity Index.
9.
Where, ni = number of individuals of a species and N = Total number of individuals of all
species.
d) Habitat use by animals:
I. Hispid hare: Habitat utilization of Hispid hare was analyzed by using photographs of the Hispid hare, and by collection of pellets in the sites identified by the Forest Department and by direct sightings. All the sites were tagged by GPS and micro habitat was noted during the study.
22 | N E W S
II. Other Herbivores:
Habitat utilization: Habitat utilisation of major herbivores like Rhino, Gaur, and Elephant were mapped with the animal sighting records from the forest departments. The data were represented beat wise (in case of Mahananda it is range wise) and categorised in five major classes:
1. Most Preferable, 2. High Preferable, 3. Moderately Preferable, 4. Least Preferable and 5. Not Preferable
e) Herbivores feeding behaviour observations: Feeding and foraging behaviour of herbivores (Rhino, Gaur, Elephant, Sambar and Spotted Deer and other deer species) was recorded by direct opportunistic observation in Jaldapara NP, Gorumara NP and Mahananda WLS. In Jaldapara the observations were made with the help of vehicle as well as on elephant back. In Gorumara and Mahananda observation were made mainly from the observation camps and watch towers. The plant species consumed were collected immediately from the field and later identified. Photographic evidence was also recorded and later used for identification of the preferable fodders. High zooming camera and binoculars were also used during observation. All observation points were tagged with GPS. Observing Sambar and other Deer species was difficult as they are very shy animals and run away when approached.
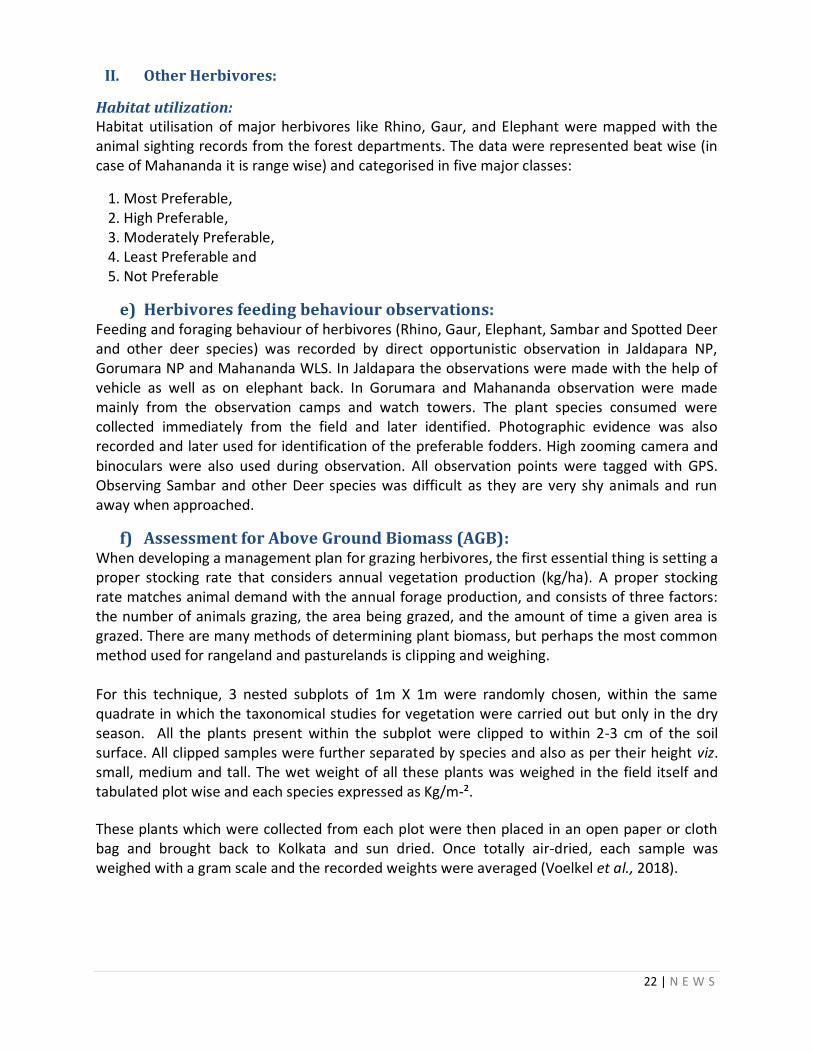
f) Assessment for Above Ground Biomass (AGB): When developing a management plan for grazing herbivores, the first essential thing is setting a proper stocking rate that considers annual vegetation production (kg/ha). A proper stocking rate matches animal demand with the annual forage production, and consists of three factors: the number of animals grazing, the area being grazed, and the amount of time a given area is grazed. There are many methods of determining plant biomass, but perhaps the most common method used for rangeland and pasturelands is clipping and weighing. For this technique, 3 nested subplots of 1m X 1m were randomly chosen, within the same quadrate in which the taxonomical studies for vegetation were carried out but only in the dry season. All the plants present within the subplot were clipped to within 2-3 cm of the soil surface. All clipped samples were further separated by species and also as per their height viz. small, medium and tall. The wet weight of all these plants was weighed in the field itself and tabulated plot wise and each species expressed as Kg/m-².
These plants which were collected from each plot were then placed in an open paper or cloth bag and brought back to Kolkata and sun dried. Once totally air-dried, each sample was weighed with a gram scale and the recorded weights were averaged (Voelkel et al., 2018).
23 | N E W S
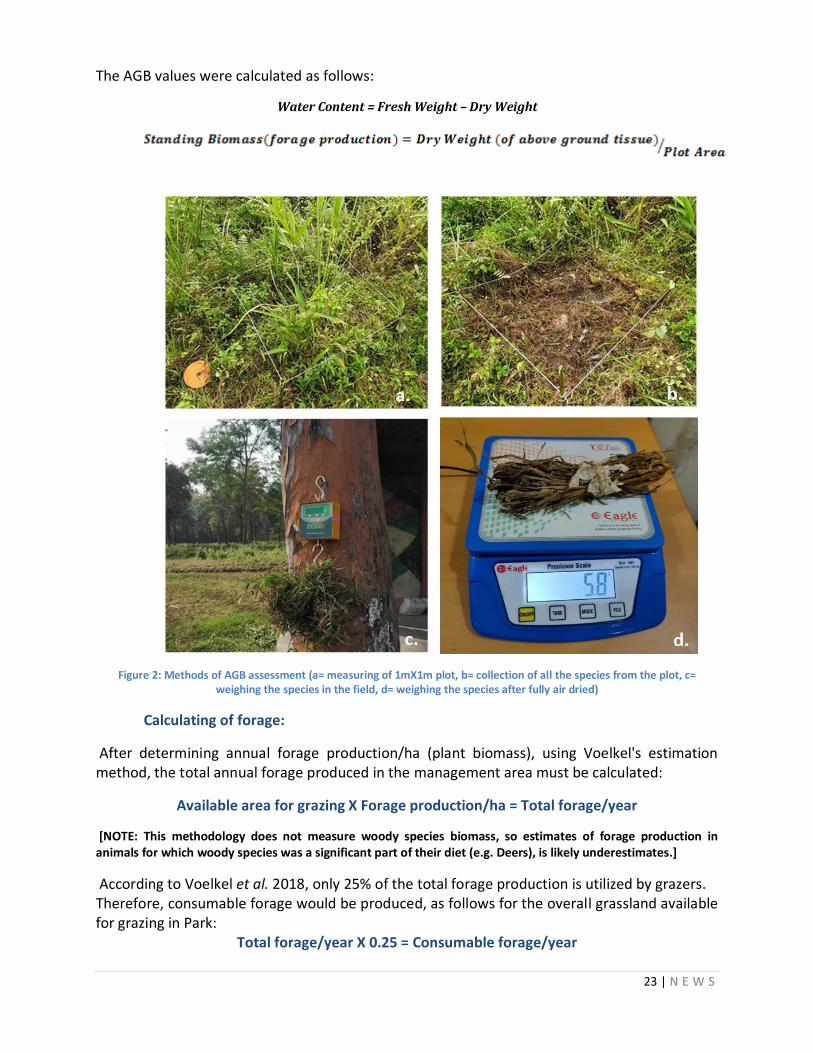
The AGB values were calculated as follows:
Water Content = Fresh Weight – Dry Weight
Figure 2: Methods of AGB assessment (a= measuring of 1mX1m plot, b= collection of all the species from the plot, c= weighing the species in the field, d= weighing the species after fully air dried)
Calculating of forage:
After determining annual forage production/ha (plant biomass), using Voelkel's estimation method, the total annual forage produced in the management area must be calculated:
Available area for grazing X Forage production/ha = Total forage/year
[NOTE: This methodology does not measure woody species biomass, so estimates of forage production in animals for which woody species was a significant part of their diet (e.g. Deers), is likely underestimates.]
According to Voelkel et al. 2018, only 25% of the total forage production is utilized by grazers. Therefore, consumable forage would be produced, as follows for the overall grassland available for grazing in Park:
Total forage/year X 0.25 = Consumable forage/year
24 | N E W S
There are also areas in forest land that cattle do not graze such as heavy brush, weeds, roads, fire lines, other non fodder species etc. To reduce the risk of overgrazing, these areas were removed from the calculation. The available forage would be determined as follows:
Consumable forage X % Grazeable areas = Available forage kg /year
g) Carrying capacity: Ecological carrying capacity (K) is usually defined as the maximum number of animals a defined area can support in relation to available resources (McCullough, 2001), where K is primarily limited by forage.
As Rhino is the keystone species here the calculation of carrying capacity is based on the Rhino suitable grassland area in Jaldapara and Gorumara NP. Besides Rhino and Gaur, Elephant is also considered for this calculation as they preferred the same habitat in Jaldapara and Gorumara NP (Anon., 2018; Anon., 2007a) as all the animals preferred grass species as primary fodders in this region (Peden et. al., 1974; Banerjee, 1993; Ghosh and Das, 2007; Roy, 2010; Lahkar et. al., 2018). But in Mahananda the Elephant is the main species. And as elephants also prefer grassland for foraging so therefore the carrying capacity will be calculated again on the basis of vegetation of the grassland plantation on the canopy opening areas available in Mahananda WLS.
In this study a straight forward approach was taken to determine the Carrying Capacity (K). To find out the number of animals one Protected Area can support over a period of time one need to divide the total forage biomass available in the particular area by the total amount of forage consumed by the targeted animal during the grazing period (Workman & MacPherson, 1973). Here the unit of the Carrying Capacity (K) will be AU/ year). Carrying Capacity of the Protected Areas was measured by using following formula.
h) Collection of Soil samples: a. 35 soil samples have been collected from 11 beats (both flooded & non flooded zone of
JNP during Pre monsoon & Post Monsoon season. b. All the soil samples were studied and analysis was done of all the soil samples on pH,
Electrical conductivity, percentage of organic content and Nitrogen, Phosphorus, Potassium content (kg/ha).
[NOTE: The Soil study which was recommended to be undertaken in the present study was subsequently dropped as per PMU letter no. 558/WBFBCP/17-1/19 dtd.03.03.2020. Since then, no more soil analysis was carried out in this project.]
25 | N E W S
CHAPTER I
4. Jaldapara National Park:
4.1. Study Area:
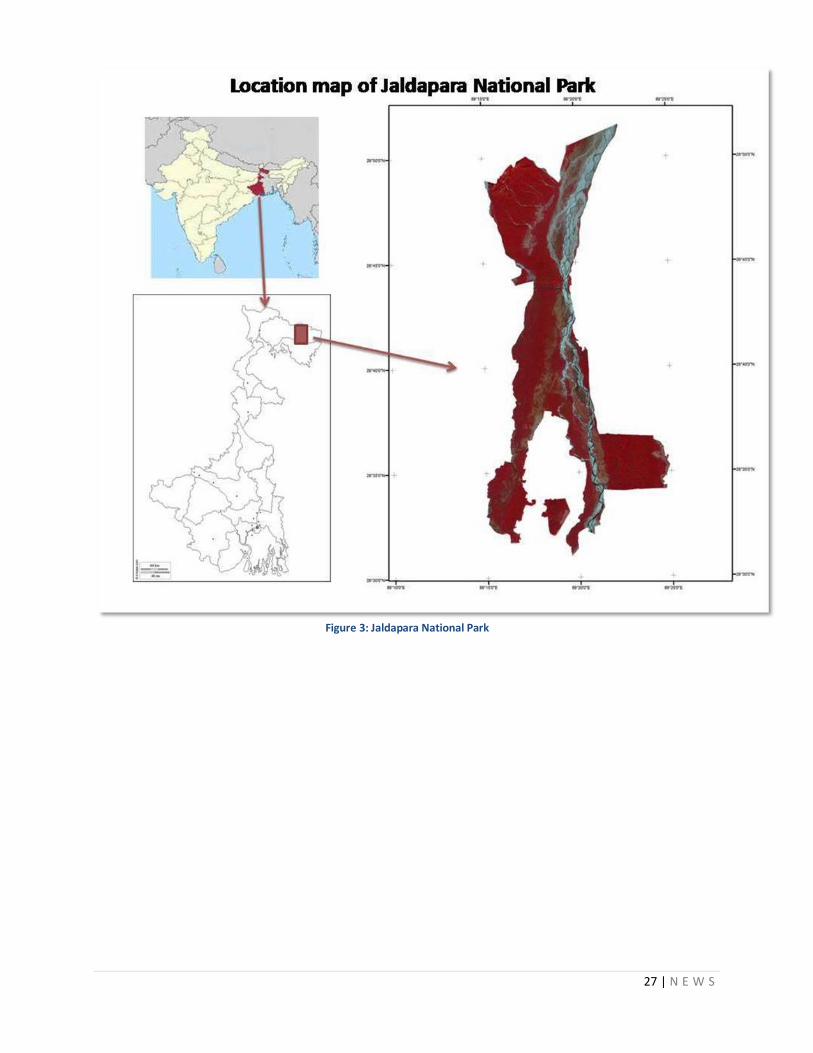
One of the three Protected Areas undertaken for the present study is in the Jaldapara National Park. This National Park lying in the civil district of Alipurduar in North Bengal between the latitudes 25°58’’and 27°45’’N and longitudes 89°08’’ and 89°55’’E, comprises of 216.51 km2 area. Jaldapara National Park is the second largest home after the Kaziranga National Park in Assam, India for the Great Indian One-Horned Rhinoceros (Rhinoceros unicornis L.) and is one of the prestigious National Parks of West Bengal. Initially it was a Wildlife Sanctuary, and in May, 2012 this was upgraded and designated as a National Park. The Park is located in the flood plains of the River Torsa and other small rivers, like Malangi, Buritorsa, Hollong, Sissamara, Kalijhora, Sanjoy, Sukti, Bhaluka etc. The area of the Park is 216.51 sq.km comprising of 12 blocks, 45 compartments, 29 beats and 4 Camps under eight Territorial Ranges, one Eco-Tourism and one Elephant Squad Range (Anon. 2007, 2019). The average day temperature varies from 10°C to 21°C from November to February, between 27°C to 37°C during May to September and between 24°C to 27°C during the rest of the year and is adequately humid throughout the year, ranging from 80 to 100%. The soil types are alluvial, with coarse gravel and sandy clay to loam. Annual rainfall exceeds 2000 mm and natural flooding from annual monsoons varies in frequency and magnitude. The Great Indian One-Horned Rhinoceros is the key-stone species of the Park. The other associated herbivore species are Elephants, Gaur, different species of Deer (Sambar, Hog Deer, Barking Deer, and Spotted Deer), Hispid hare, Indian hare, Wild Boar. It also boasts of the presence of a large number of Avian species (246) and the Leopard and Lesser cats among the carnivores. It has been reported that Jaldapara NP has 33 species of carnivores & herbivores, 29 species of reptiles, 8 species of turtles, 54 species of fishes and a host of other micro fauna (Anon. 2007b, 2019). The whole area is rich with biodiversity and has a mixture of natural and manmade forests with a great collection of rare and medicinal plants. Jaldapara NP is reported to contain a total of 585 identified plant species belonging to 111 families, 429 genera, including 91 grass species, 19 orchid species and 47 endangered plant species (29 genera) which are of conservation importance (Anon. 2007b, 2019). The vegetation types present here as per the classification of Champion and Seth (1968) are (1) Evergreen Forests (Northern tropical evergreen forest); (2) Semi-Evergreen Forests (Eastern sub-montane semi-evergreen forest); (3) Hill Forests (East Himalayan subtropical wet hill forest); (4)

26 | N E W S
Wet Mixed Deciduous Forest (Sub-Himalayan secondary wet mixed forest); (5) Dry Mixed Forests (East Himalayan moist mixed deciduous forest); (6) Sal Forests (Eastern Bhabar and Terai sal); (7) Riverine Forests (Northern dry deciduous forest); (8) Savanna (Moist sal savanna and low alluvium savannah woodland); and (9) Grassland (Eastern alluvial grassland). The riverine grass lands and savannah wood land occupy 45 percent of the total plant cover of the National Park, offering the best type of grazing ground for the herbivores of the park. This type of vegetation is found in JP-1, 2, 3, 4 & 5, Hasimara-1, 2, 3, 4, Malangi- 1, 2, 3, Torsa-1, 2, 3, Chilapata-1, 2, 3b, Jaigaon-1, 2, Dalsingpara-1, 2, 3, 4 and Titi-1, 2, 3 & 4 compartments confined in East, West, North, Jaigaon, Nilpara and Lankapara Range. However, herbivores are not found in Jaigaon-1, 2 & Dalsingpara-1, 2, 3, 4 Compartment of Jaigaon and Nilpara Range. In Titi block of Lankapara Range, only the deer, wild boar, gaur and elephant are distributed sparsely. Distribution of animals is highly concentrated in old National Park area i.e. East, West and North Range mostly (Anon. 2007b). The vegetation found in Savanna woodland areas are Sal along with Kumbhi, Amloki, Sidha, Tanki associated with grasses in moist savanna Sal land and Simul, with Sirish, Khair, Pitali etc associated with grasses in the low alluvium savannah woodland and dominated by species like Saccharum spp, Arundo donax, Phragmites karka, lmperata cylindrica and Themeda arundinacea in eastern alluvial grasslands along with the bed of river Torsa and its tributaries in the Park. The grasses are very tall, dense, sometimes 4-5m high and are the principal dwelling places for one horned Rhinoceros. Rhinoceros mostly occur with high concentration in East, West, North and part of Chilapata Ranges. New fodder plantations are highly grazed by Rhinoceros. Rhinoceros never found in Titi, Jaigaon and Dalsingpara block of Nilpara, Jaigaon and Lankapara Range, beyond National High Way 31A (Anon. 2007b, 2019). As a keystone species of the Park, the Rhino along with the other herbivores occur mainly in the East, West and North Ranges of the Park; these habitats were undertaken for (Grassland) improvement by the Forest Department. The present study was therefore confined to the main habitat improvement zone of the Park i.e. East, West and North Ranges to identify the impact of Grassland Management in these areas.
27 | N E W S
Figure 3: Jaldapara National Park
28 | N E W S
4.2. Discussion with forest officials and collection of plantation journals
Results:
Detailed discussions were carried out with the following officers of Jaldapara viz. Mr. Ujjal Ghosh, Former CCF, Wildlife, North Bengal; Mr. Kumar Vimal, DFO, Jaldapara NP; Mr. Bimal Debnath, Former AWLW; Mr. Debdarshan Roy, AWLW; Mr. Mukesh Sarkar, Ranger, Jaldapara West Range; Mr. Sibash Sarkar, Ranger, Jaldapara North Range; Mr. Swapan Majhi, Ranger Jaldapara East Range; Beat officers of East, West and North Ranges.
4.3. Archive literature review
Results:
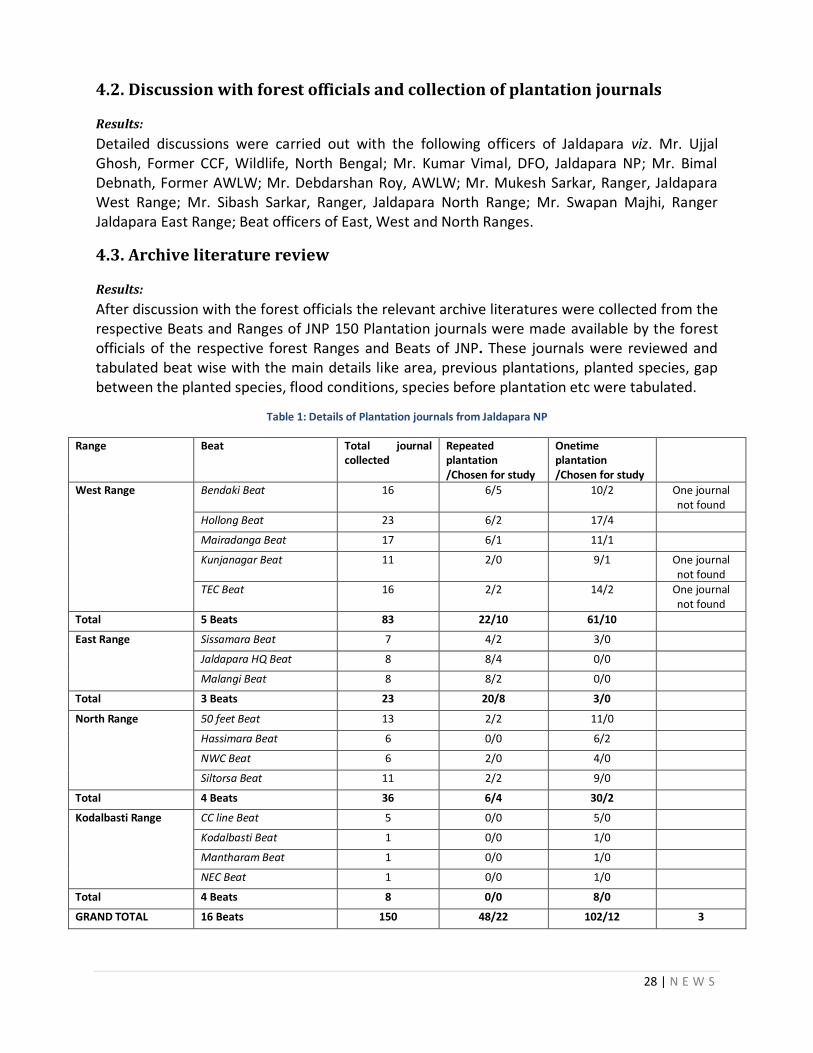
After discussion with the forest officials the relevant archive literatures were collected from the respective Beats and Ranges of JNP 150 Plantation journals were made available by the forest officials of the respective forest Ranges and Beats of JNP. These journals were reviewed and tabulated beat wise with the main details like area, previous plantations, planted species, gap between the planted species, flood conditions, species before plantation etc were tabulated.
Table 1: Details of Plantation journals from Jaldapara NP
Range Beat Total journal collected
Repeated plantation /Chosen for study
Onetime plantation /Chosen for study
West Range Bendaki Beat 16 6/5 10/2 One journal not found
Hollong Beat 23 6/2 17/4
Mairadanga Beat 17 6/1 11/1
Kunjanagar Beat 11 2/0 9/1 One journal not found
TEC Beat 16 2/2 14/2 One journal not found
Total 5 Beats 83 22/10 61/10
East Range Sissamara Beat 7 4/2 3/0
Jaldapara HQ Beat 8 8/4 0/0
Malangi Beat 8 8/2 0/0
Total 3 Beats 23 20/8 3/0
North Range 50 feet Beat 13 2/2 11/0
Hassimara Beat 6 0/0 6/2
NWC Beat 6 2/0 4/0
Siltorsa Beat 11 2/2 9/0
Total 4 Beats 36 6/4 30/2
Kodalbasti Range CC line Beat 5 0/0 5/0
Kodalbasti Beat 1 0/0 1/0
Mantharam Beat 1 0/0 1/0
NEC Beat 1 0/0 1/0
Total 4 Beats 8 0/0 8/0
GRAND TOTAL 16 Beats 150 48/22 102/12 3
29 | N E W S
4.4. Inventorization of Flora
Results:
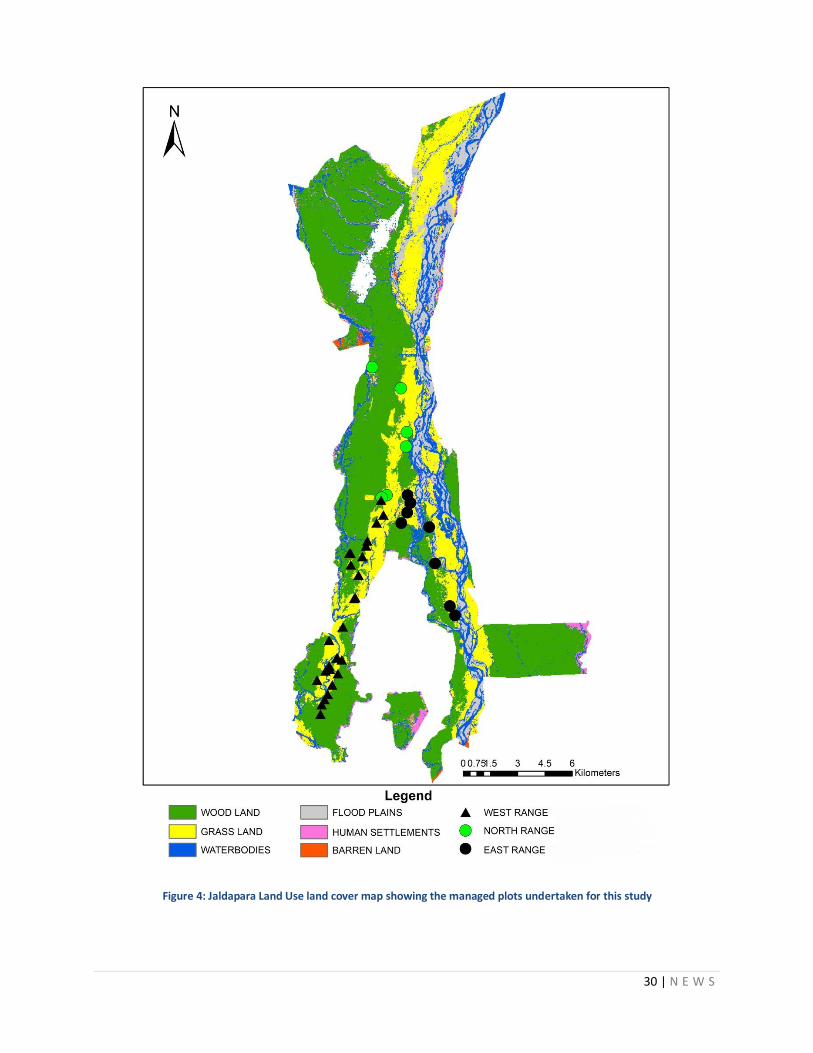
A total of 37 managed plots were identified by the Forest Department and selected for the study in 11 beats of 3 Ranges i.e. Jaldapara West Range, East Range and North Range of Jaldapara NP. Of these 23 were repeated plantations and 14 were one-time plantations 41 quadrates [10 m X 10 m (100 sq. m.)] were randomly chosen in these 37 plots, for detailed documentation of all vegetation occupancy in two seasons viz. pre monsoon (December to April) and post monsoon (September to November). In addition, 5 natural grassland plots (unmanaged) were randomly chosen for a similar qualitative and quantitative documentation of all vegetation in these plots in Jaldapara NP.
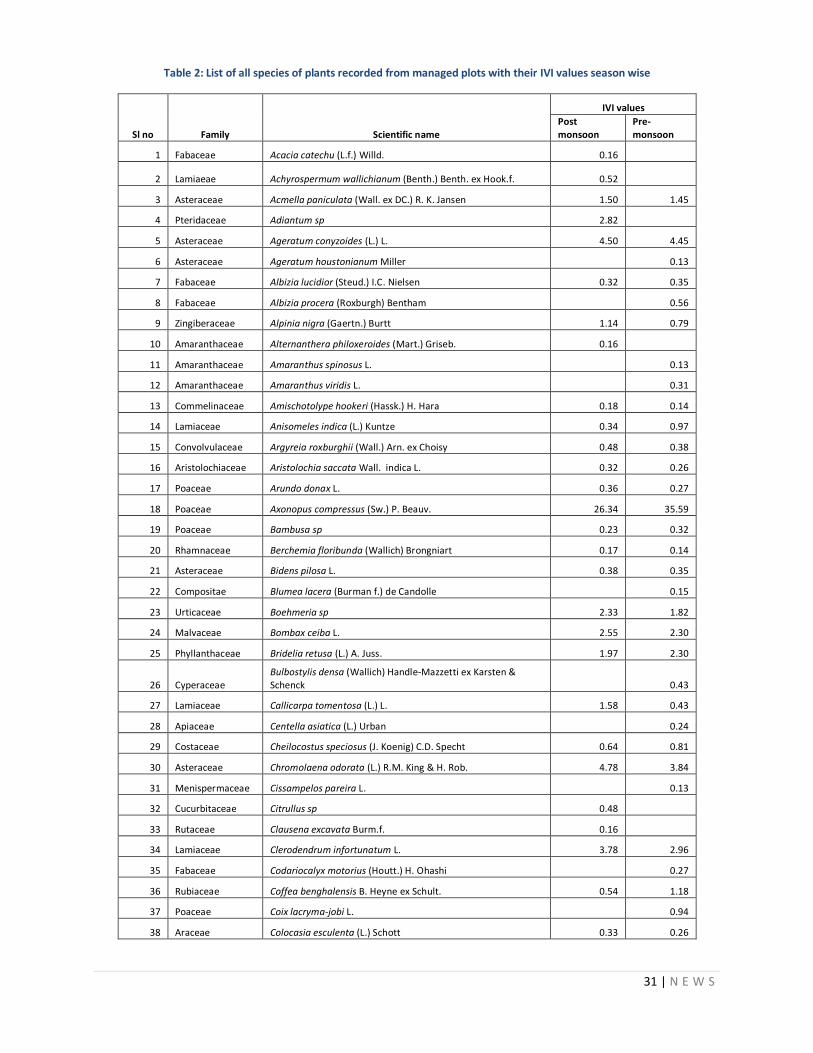
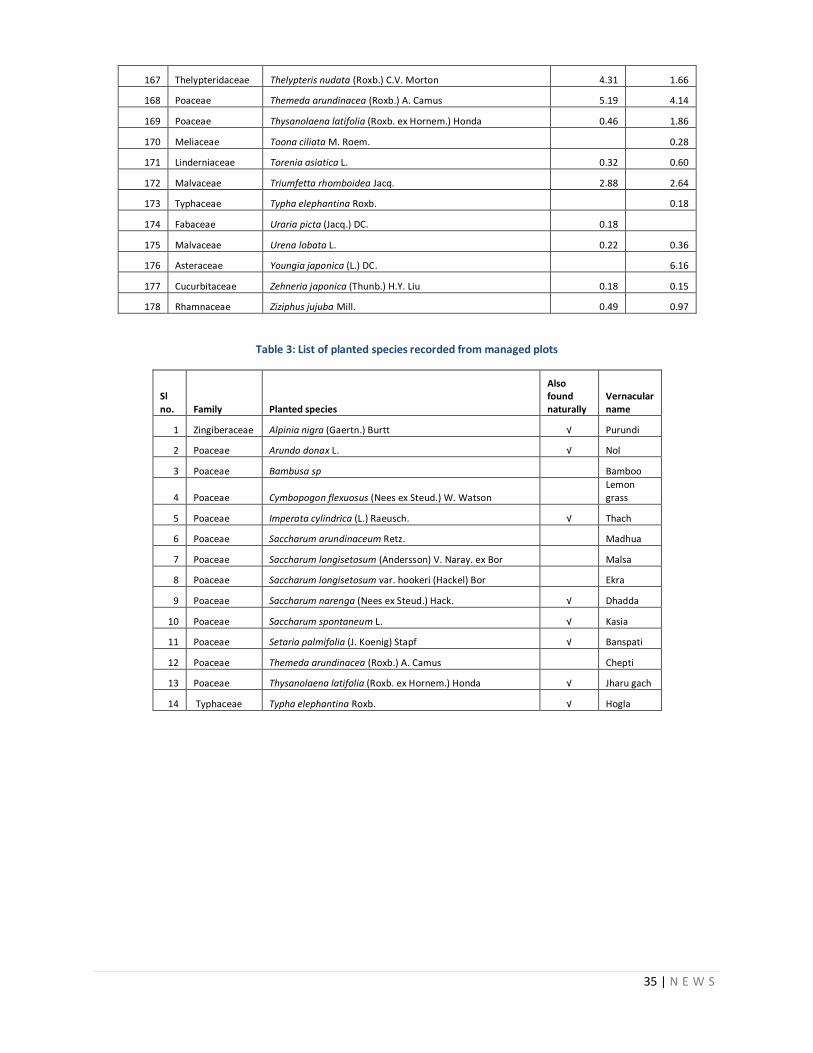
A total of 178 plant species were identified and recorded, documented and tabulated. Of these, 14 were the Planted species by the Forest Department, while 17 species belonged to Natural grass, fodder & sedge and 29 were Weed species. The remaining 121 species were Other species including ferns. Fern species have not been considered as weeds as they play an important role in maintaining the swampy habitat.
Analyzed data shows that Imperata cylindrica has highest IVI= 44.64 (in Pre-monsoon) and IVI=61.56 (in Post monsoon) followed by Axonopus compressus (IVI= 26.34 in Pre-monsoon and IVI= 35.59 in Post monsoon) among all the species found in the managed plots of Jaldapara National Park.
30 | N E W S
Figure 4: Jaldapara Land Use land cover map showing the managed plots undertaken for this study
31 | N E W S
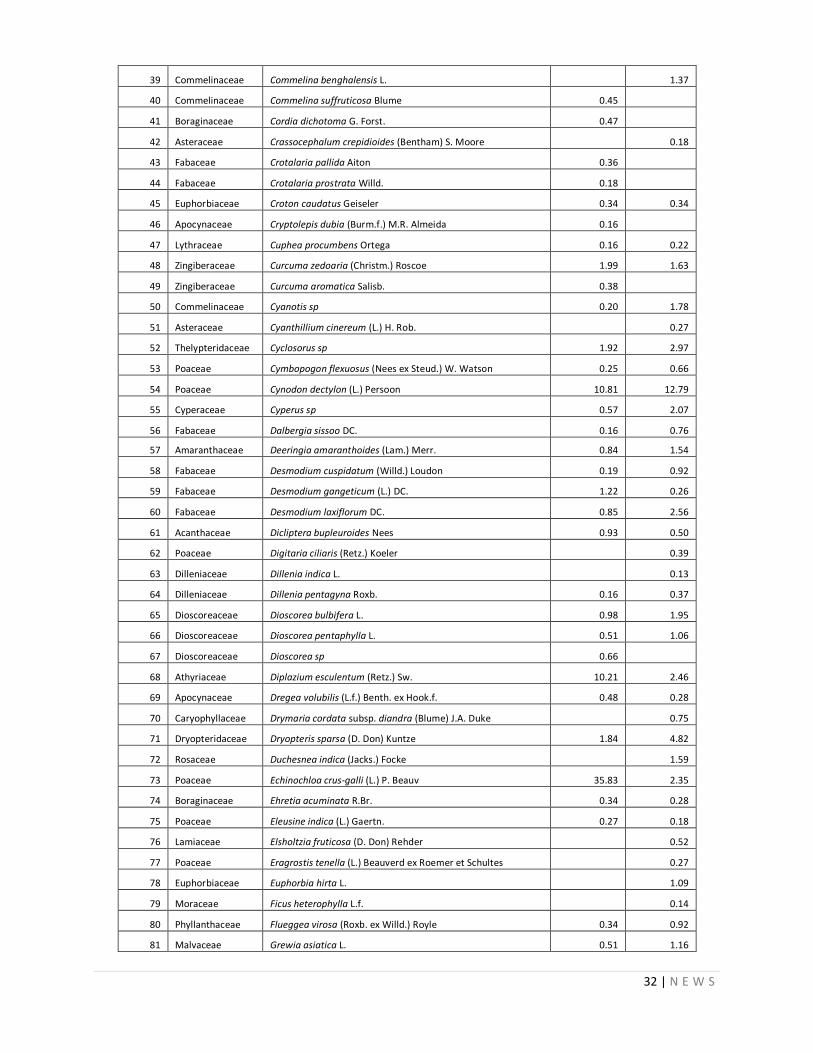
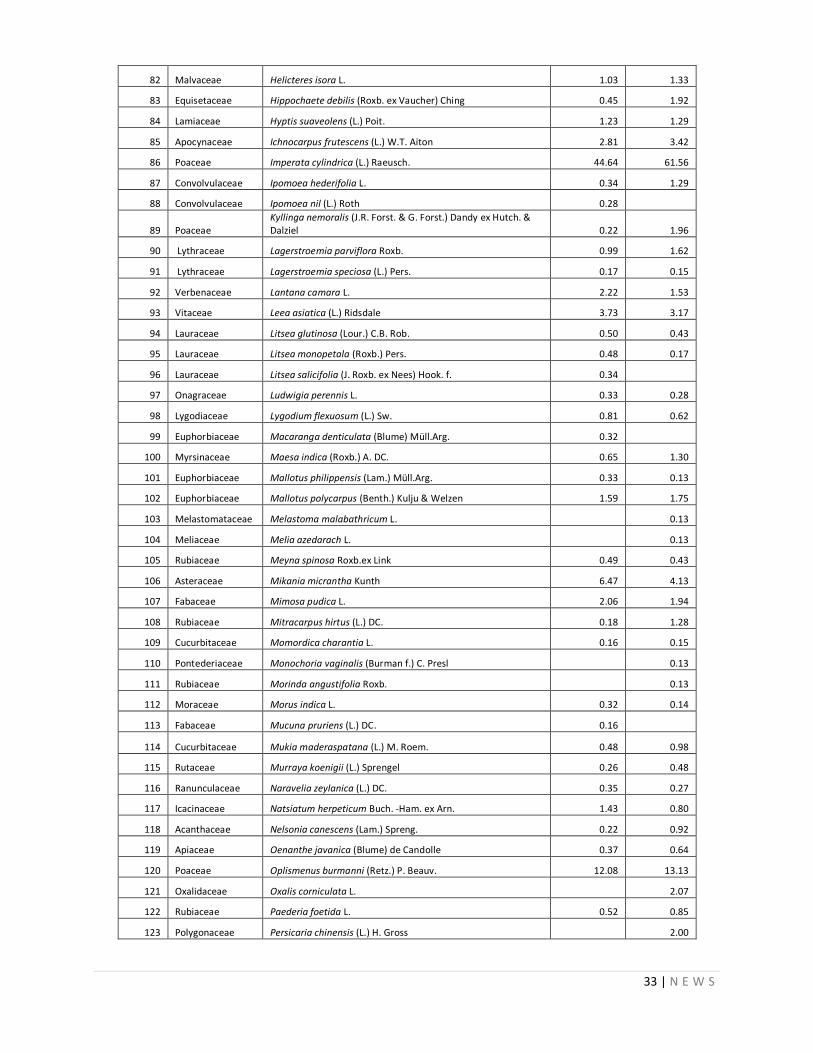
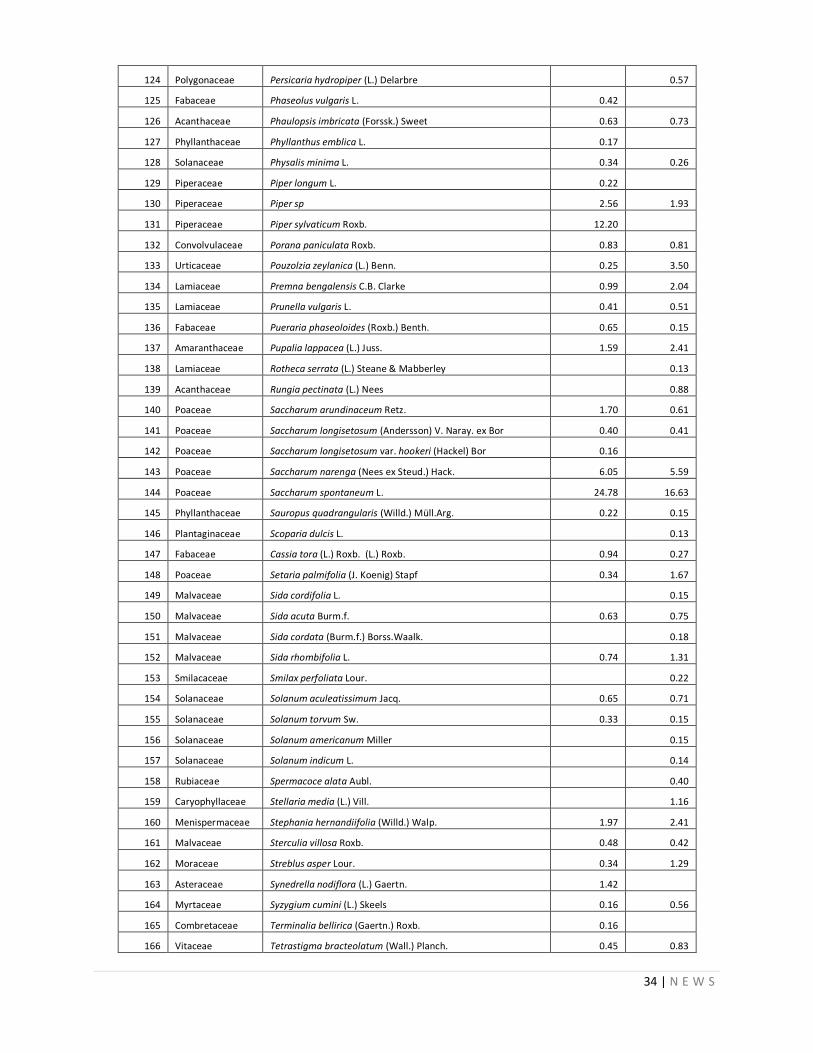
Table 2: List of all species of plants recorded from managed plots with their IVI values season wise
Sl no Family Scientific name
IVI values
Post monsoon
Pre-monsoon
1 Fabaceae Acacia catechu (L.f.) Willd. 0.16
2 Lamiaeae Achyrospermum wallichianum (Benth.) Benth. ex Hook.f. 0.52
3 Asteraceae Acmella paniculata (Wall. ex DC.) R. K. Jansen 1.50 1.45
4 Pteridaceae Adiantum sp 2.82
5 Asteraceae Ageratum conyzoides (L.) L. 4.50 4.45
6 Asteraceae Ageratum houstonianum Miller 0.13
7 Fabaceae Albizia lucidior (Steud.) I.C. Nielsen 0.32 0.35
8 Fabaceae Albizia procera (Roxburgh) Bentham 0.56
9 Zingiberaceae Alpinia nigra (Gaertn.) Burtt 1.14 0.79
10 Amaranthaceae Alternanthera philoxeroides (Mart.) Griseb. 0.16
11 Amaranthaceae Amaranthus spinosus L. 0.13
12 Amaranthaceae Amaranthus viridis L. 0.31
13 Commelinaceae Amischotolype hookeri (Hassk.) H. Hara 0.18 0.14
14 Lamiaceae Anisomeles indica (L.) Kuntze 0.34 0.97
15 Convolvulaceae Argyreia roxburghii (Wall.) Arn. ex Choisy 0.48 0.38
16 Aristolochiaceae Aristolochia saccata Wall. indica L. 0.32 0.26
17 Poaceae Arundo donax L. 0.36 0.27
18 Poaceae Axonopus compressus (Sw.) P. Beauv. 26.34 35.59
19 Poaceae Bambusa sp 0.23 0.32
20 Rhamnaceae Berchemia floribunda (Wallich) Brongniart 0.17 0.14
21 Asteraceae Bidens pilosa L. 0.38 0.35
22 Compositae Blumea lacera (Burman f.) de Candolle 0.15
23 Urticaceae Boehmeria sp 2.33 1.82
24 Malvaceae Bombax ceiba L. 2.55 2.30
25 Phyllanthaceae Bridelia retusa (L.) A. Juss. 1.97 2.30
26 Cyperaceae Bulbostylis densa (Wallich) Handle-Mazzetti ex Karsten & Schenck 0.43
27 Lamiaceae Callicarpa tomentosa (L.) L. 1.58 0.43
28 Apiaceae Centella asiatica (L.) Urban 0.24
29 Costaceae Cheilocostus speciosus (J. Koenig) C.D. Specht 0.64 0.81
30 Asteraceae Chromolaena odorata (L.) R.M. King & H. Rob. 4.78 3.84
31 Menispermaceae Cissampelos pareira L. 0.13
32 Cucurbitaceae Citrullus sp 0.48
33 Rutaceae Clausena excavata Burm.f. 0.16
34 Lamiaceae Clerodendrum infortunatum L. 3.78 2.96
35 Fabaceae Codariocalyx motorius (Houtt.) H. Ohashi 0.27
36 Rubiaceae Coffea benghalensis B. Heyne ex Schult. 0.54 1.18
37 Poaceae Coix lacryma-jobi L. 0.94
38 Araceae Colocasia esculenta (L.) Schott 0.33 0.26
32 | N E W S
39 Commelinaceae Commelina benghalensis L. 1.37
40 Commelinaceae Commelina suffruticosa Blume 0.45
41 Boraginaceae Cordia dichotoma G. Forst. 0.47
42 Asteraceae Crassocephalum crepidioides (Bentham) S. Moore 0.18
43 Fabaceae Crotalaria pallida Aiton 0.36
44 Fabaceae Crotalaria prostrata Willd. 0.18
45 Euphorbiaceae Croton caudatus Geiseler 0.34 0.34
46 Apocynaceae Cryptolepis dubia (Burm.f.) M.R. Almeida 0.16
47 Lythraceae Cuphea procumbens Ortega 0.16 0.22
48 Zingiberaceae Curcuma zedoaria (Christm.) Roscoe 1.99 1.63
49 Zingiberaceae Curcuma aromatica Salisb. 0.38
50 Commelinaceae Cyanotis sp 0.20 1.78
51 Asteraceae Cyanthillium cinereum (L.) H. Rob. 0.27
52 Thelypteridaceae Cyclosorus sp 1.92 2.97
53 Poaceae Cymbopogon flexuosus (Nees ex Steud.) W. Watson 0.25 0.66
54 Poaceae Cynodon dectylon (L.) Persoon 10.81 12.79
55 Cyperaceae Cyperus sp 0.57 2.07
56 Fabaceae Dalbergia sissoo DC. 0.16 0.76
57 Amaranthaceae Deeringia amaranthoides (Lam.) Merr. 0.84 1.54
58 Fabaceae Desmodium cuspidatum (Willd.) Loudon 0.19 0.92
59 Fabaceae Desmodium gangeticum (L.) DC. 1.22 0.26
60 Fabaceae Desmodium laxiflorum DC. 0.85 2.56
61 Acanthaceae Dicliptera bupleuroides Nees 0.93 0.50
62 Poaceae Digitaria ciliaris (Retz.) Koeler 0.39
63 Dilleniaceae Dillenia indica L. 0.13
64 Dilleniaceae Dillenia pentagyna Roxb. 0.16 0.37
65 Dioscoreaceae Dioscorea bulbifera L. 0.98 1.95
66 Dioscoreaceae Dioscorea pentaphylla L. 0.51 1.06
67 Dioscoreaceae Dioscorea sp 0.66
68 Athyriaceae Diplazium esculentum (Retz.) Sw. 10.21 2.46
69 Apocynaceae Dregea volubilis (L.f.) Benth. ex Hook.f. 0.48 0.28
70 Caryophyllaceae Drymaria cordata subsp. diandra (Blume) J.A. Duke 0.75
71 Dryopteridaceae Dryopteris sparsa (D. Don) Kuntze 1.84 4.82
72 Rosaceae Duchesnea indica (Jacks.) Focke 1.59
73 Poaceae Echinochloa crus-galli (L.) P. Beauv 35.83 2.35
74 Boraginaceae Ehretia acuminata R.Br. 0.34 0.28
75 Poaceae Eleusine indica (L.) Gaertn. 0.27 0.18
76 Lamiaceae Elsholtzia fruticosa (D. Don) Rehder 0.52
77 Poaceae Eragrostis tenella (L.) Beauverd ex Roemer et Schultes 0.27
78 Euphorbiaceae Euphorbia hirta L. 1.09
79 Moraceae Ficus heterophylla L.f. 0.14
80 Phyllanthaceae Flueggea virosa (Roxb. ex Willd.) Royle 0.34 0.92
81 Malvaceae Grewia asiatica L. 0.51 1.16
33 | N E W S
82 Malvaceae Helicteres isora L. 1.03 1.33
83 Equisetaceae Hippochaete debilis (Roxb. ex Vaucher) Ching 0.45 1.92
84 Lamiaceae Hyptis suaveolens (L.) Poit. 1.23 1.29
85 Apocynaceae Ichnocarpus frutescens (L.) W.T. Aiton 2.81 3.42
86 Poaceae Imperata cylindrica (L.) Raeusch. 44.64 61.56
87 Convolvulaceae Ipomoea hederifolia L. 0.34 1.29
88 Convolvulaceae Ipomoea nil (L.) Roth 0.28
89 Poaceae Kyllinga nemoralis (J.R. Forst. & G. Forst.) Dandy ex Hutch. & Dalziel 0.22 1.96
90 Lythraceae Lagerstroemia parviflora Roxb. 0.99 1.62
91 Lythraceae Lagerstroemia speciosa (L.) Pers. 0.17 0.15
92 Verbenaceae Lantana camara L. 2.22 1.53
93 Vitaceae Leea asiatica (L.) Ridsdale 3.73 3.17
94 Lauraceae Litsea glutinosa (Lour.) C.B. Rob. 0.50 0.43
95 Lauraceae Litsea monopetala (Roxb.) Pers. 0.48 0.17
96 Lauraceae Litsea salicifolia (J. Roxb. ex Nees) Hook. f. 0.34
97 Onagraceae Ludwigia perennis L. 0.33 0.28
98 Lygodiaceae Lygodium flexuosum (L.) Sw. 0.81 0.62
99 Euphorbiaceae Macaranga denticulata (Blume) Müll.Arg. 0.32
100 Myrsinaceae Maesa indica (Roxb.) A. DC. 0.65 1.30
101 Euphorbiaceae Mallotus philippensis (Lam.) Müll.Arg. 0.33 0.13
102 Euphorbiaceae Mallotus polycarpus (Benth.) Kulju & Welzen 1.59 1.75
103 Melastomataceae Melastoma malabathricum L. 0.13
104 Meliaceae Melia azedarach L. 0.13
105 Rubiaceae Meyna spinosa Roxb.ex Link 0.49 0.43
106 Asteraceae Mikania micrantha Kunth 6.47 4.13
107 Fabaceae Mimosa pudica L. 2.06 1.94
108 Rubiaceae Mitracarpus hirtus (L.) DC. 0.18 1.28
109 Cucurbitaceae Momordica charantia L. 0.16 0.15
110 Pontederiaceae Monochoria vaginalis (Burman f.) C. Presl 0.13
111 Rubiaceae Morinda angustifolia Roxb. 0.13
112 Moraceae Morus indica L. 0.32 0.14
113 Fabaceae Mucuna pruriens (L.) DC. 0.16
114 Cucurbitaceae Mukia maderaspatana (L.) M. Roem. 0.48 0.98
115 Rutaceae Murraya koenigii (L.) Sprengel 0.26 0.48
116 Ranunculaceae Naravelia zeylanica (L.) DC. 0.35 0.27
117 Icacinaceae Natsiatum herpeticum Buch. -Ham. ex Arn. 1.43 0.80
118 Acanthaceae Nelsonia canescens (Lam.) Spreng. 0.22 0.92
119 Apiaceae Oenanthe javanica (Blume) de Candolle 0.37 0.64
120 Poaceae Oplismenus burmanni (Retz.) P. Beauv. 12.08 13.13
121 Oxalidaceae Oxalis corniculata L. 2.07
122 Rubiaceae Paederia foetida L. 0.52 0.85
123 Polygonaceae Persicaria chinensis (L.) H. Gross 2.00
34 | N E W S
124 Polygonaceae Persicaria hydropiper (L.) Delarbre 0.57
125 Fabaceae Phaseolus vulgaris L. 0.42
126 Acanthaceae Phaulopsis imbricata (Forssk.) Sweet 0.63 0.73
127 Phyllanthaceae Phyllanthus emblica L. 0.17
128 Solanaceae Physalis minima L. 0.34 0.26
129 Piperaceae Piper longum L. 0.22
130 Piperaceae Piper sp 2.56 1.93
131 Piperaceae Piper sylvaticum Roxb. 12.20
132 Convolvulaceae Porana paniculata Roxb. 0.83 0.81
133 Urticaceae Pouzolzia zeylanica (L.) Benn. 0.25 3.50
134 Lamiaceae Premna bengalensis C.B. Clarke 0.99 2.04
135 Lamiaceae Prunella vulgaris L. 0.41 0.51
136 Fabaceae Pueraria phaseoloides (Roxb.) Benth. 0.65 0.15
137 Amaranthaceae Pupalia lappacea (L.) Juss. 1.59 2.41
138 Lamiaceae Rotheca serrata (L.) Steane & Mabberley 0.13
139 Acanthaceae Rungia pectinata (L.) Nees 0.88
140 Poaceae Saccharum arundinaceum Retz. 1.70 0.61
141 Poaceae Saccharum longisetosum (Andersson) V. Naray. ex Bor 0.40 0.41
142 Poaceae Saccharum longisetosum var. hookeri (Hackel) Bor 0.16
143 Poaceae Saccharum narenga (Nees ex Steud.) Hack. 6.05 5.59
144 Poaceae Saccharum spontaneum L. 24.78 16.63
145 Phyllanthaceae Sauropus quadrangularis (Willd.) Müll.Arg. 0.22 0.15
146 Plantaginaceae Scoparia dulcis L. 0.13
147 Fabaceae Cassia tora (L.) Roxb. (L.) Roxb. 0.94 0.27
148 Poaceae Setaria palmifolia (J. Koenig) Stapf 0.34 1.67
149 Malvaceae Sida cordifolia L. 0.15
150 Malvaceae Sida acuta Burm.f. 0.63 0.75
151 Malvaceae Sida cordata (Burm.f.) Borss.Waalk. 0.18
152 Malvaceae Sida rhombifolia L. 0.74 1.31
153 Smilacaceae Smilax perfoliata Lour. 0.22
154 Solanaceae Solanum aculeatissimum Jacq. 0.65 0.71
155 Solanaceae Solanum torvum Sw. 0.33 0.15
156 Solanaceae Solanum americanum Miller 0.15
157 Solanaceae Solanum indicum L. 0.14
158 Rubiaceae Spermacoce alata Aubl. 0.40
159 Caryophyllaceae Stellaria media (L.) Vill. 1.16
160 Menispermaceae Stephania hernandiifolia (Willd.) Walp. 1.97 2.41
161 Malvaceae Sterculia villosa Roxb. 0.48 0.42
162 Moraceae Streblus asper Lour. 0.34 1.29
163 Asteraceae Synedrella nodiflora (L.) Gaertn. 1.42
164 Myrtaceae Syzygium cumini (L.) Skeels 0.16 0.56
165 Combretaceae Terminalia bellirica (Gaertn.) Roxb. 0.16
166 Vitaceae Tetrastigma bracteolatum (Wall.) Planch. 0.45 0.83
35 | N E W S
167 Thelypteridaceae Thelypteris nudata (Roxb.) C.V. Morton 4.31 1.66
168 Poaceae Themeda arundinacea (Roxb.) A. Camus 5.19 4.14
169 Poaceae Thysanolaena latifolia (Roxb. ex Hornem.) Honda 0.46 1.86
170 Meliaceae Toona ciliata M. Roem. 0.28
171 Linderniaceae Torenia asiatica L. 0.32 0.60
172 Malvaceae Triumfetta rhomboidea Jacq. 2.88 2.64
173 Typhaceae Typha elephantina Roxb. 0.18
174 Fabaceae Uraria picta (Jacq.) DC. 0.18
175 Malvaceae Urena lobata L. 0.22 0.36
176 Asteraceae Youngia japonica (L.) DC. 6.16
177 Cucurbitaceae Zehneria japonica (Thunb.) H.Y. Liu 0.18 0.15
178 Rhamnaceae Ziziphus jujuba Mill. 0.49 0.97
Table 3: List of planted species recorded from managed plots
Sl no. Family Planted species
Also found naturally
Vernacular name
1 Zingiberaceae Alpinia nigra (Gaertn.) Burtt √ Purundi
2 Poaceae Arundo donax L. √ Nol
3 Poaceae Bambusa sp Bamboo
4 Poaceae Cymbopogon flexuosus (Nees ex Steud.) W. Watson Lemon grass
5 Poaceae Imperata cylindrica (L.) Raeusch. √ Thach
6 Poaceae Saccharum arundinaceum Retz. Madhua
7 Poaceae Saccharum longisetosum (Andersson) V. Naray. ex Bor Malsa
8 Poaceae Saccharum longisetosum var. hookeri (Hackel) Bor Ekra
9 Poaceae Saccharum narenga (Nees ex Steud.) Hack. √ Dhadda
10 Poaceae Saccharum spontaneum L. √ Kasia
11 Poaceae Setaria palmifolia (J. Koenig) Stapf √ Banspati
12 Poaceae Themeda arundinacea (Roxb.) A. Camus Chepti
13 Poaceae Thysanolaena latifolia (Roxb. ex Hornem.) Honda √ Jharu gach
14 Typhaceae Typha elephantina Roxb. √ Hogla
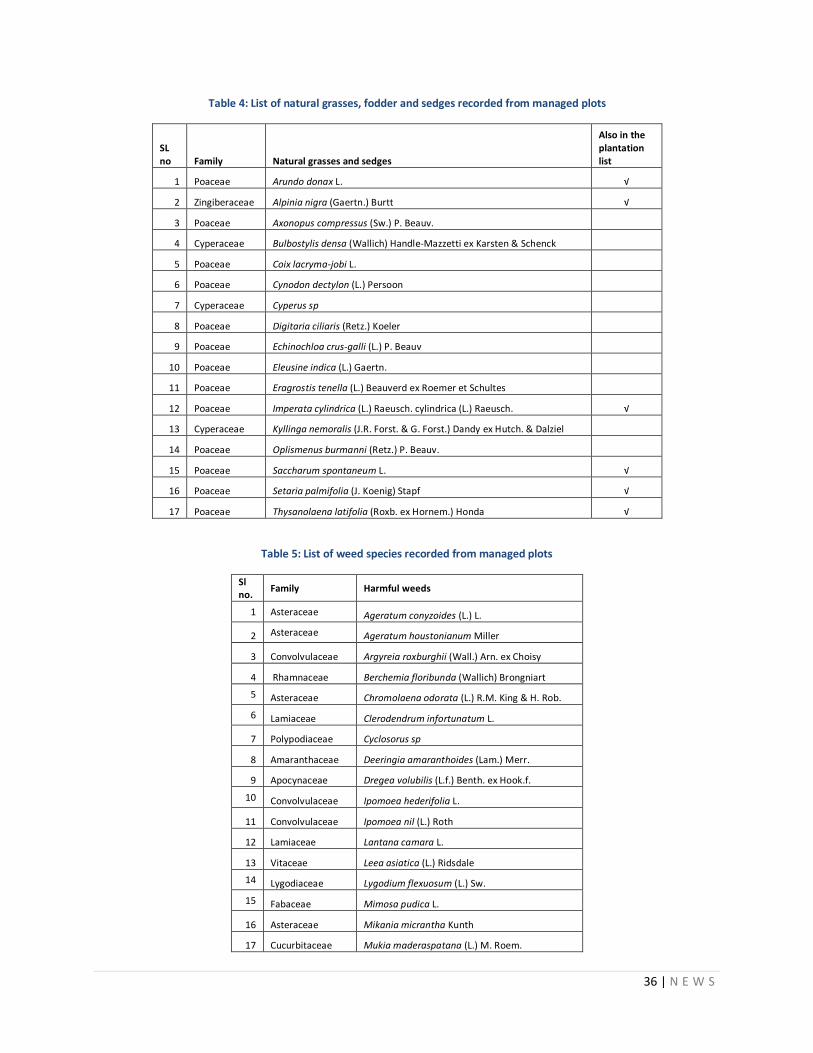
36 | N E W S
Table 4: List of natural grasses, fodder and sedges recorded from managed plots
SL no Family Natural grasses and sedges
Also in the plantation list
1 Poaceae Arundo donax L. √
2 Zingiberaceae Alpinia nigra (Gaertn.) Burtt √
3 Poaceae Axonopus compressus (Sw.) P. Beauv.
4 Cyperaceae Bulbostylis densa (Wallich) Handle-Mazzetti ex Karsten & Schenck
5 Poaceae Coix lacryma-jobi L.
6 Poaceae Cynodon dectylon (L.) Persoon
7 Cyperaceae Cyperus sp
8 Poaceae Digitaria ciliaris (Retz.) Koeler
9 Poaceae Echinochloa crus-galli (L.) P. Beauv
10 Poaceae Eleusine indica (L.) Gaertn.
11 Poaceae Eragrostis tenella (L.) Beauverd ex Roemer et Schultes
12 Poaceae Imperata cylindrica (L.) Raeusch. cylindrica (L.) Raeusch. √
13 Cyperaceae Kyllinga nemoralis (J.R. Forst. & G. Forst.) Dandy ex Hutch. & Dalziel
14 Poaceae Oplismenus burmanni (Retz.) P. Beauv.
15 Poaceae Saccharum spontaneum L. √
16 Poaceae Setaria palmifolia (J. Koenig) Stapf √
17 Poaceae Thysanolaena latifolia (Roxb. ex Hornem.) Honda √
Table 5: List of weed species recorded from managed plots
Sl no.
Family Harmful weeds
1 Asteraceae Ageratum conyzoides (L.) L.
2 Asteraceae Ageratum houstonianum Miller
3 Convolvulaceae Argyreia roxburghii (Wall.) Arn. ex Choisy
4 Rhamnaceae Berchemia floribunda (Wallich) Brongniart
5 Asteraceae Chromolaena odorata (L.) R.M. King & H. Rob.
6 Lamiaceae Clerodendrum infortunatum L.
7 Polypodiaceae Cyclosorus sp
8 Amaranthaceae Deeringia amaranthoides (Lam.) Merr.
9 Apocynaceae Dregea volubilis (L.f.) Benth. ex Hook.f.
10 Convolvulaceae Ipomoea hederifolia L.
11 Convolvulaceae Ipomoea nil (L.) Roth
12 Lamiaceae Lantana camara L.
13 Vitaceae Leea asiatica (L.) Ridsdale
14 Lygodiaceae Lygodium flexuosum (L.) Sw.
15 Fabaceae Mimosa pudica L.
16 Asteraceae Mikania micrantha Kunth
17 Cucurbitaceae Mukia maderaspatana (L.) M. Roem.
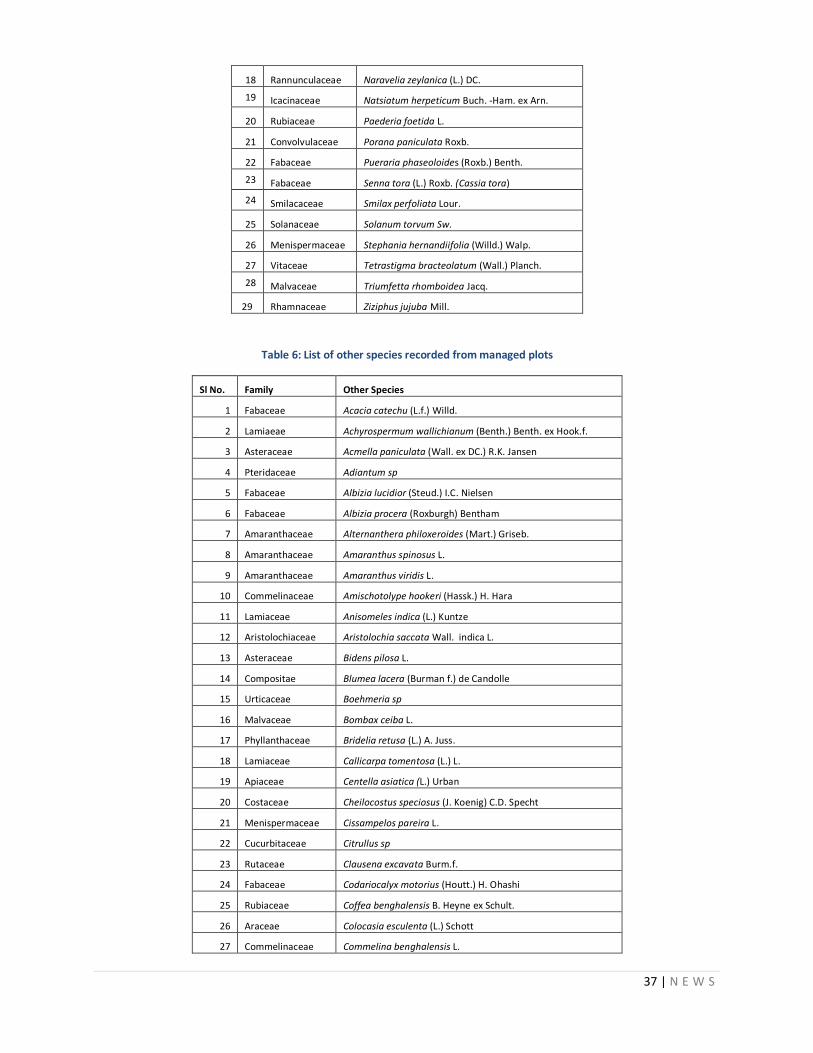
37 | N E W S
18 Rannunculaceae Naravelia zeylanica (L.) DC.
19 Icacinaceae Natsiatum herpeticum Buch. -Ham. ex Arn.
20 Rubiaceae Paederia foetida L.
21 Convolvulaceae Porana paniculata Roxb.
22 Fabaceae Pueraria phaseoloides (Roxb.) Benth.
23 Fabaceae Senna tora (L.) Roxb. (Cassia tora)
24 Smilacaceae Smilax perfoliata Lour.
25 Solanaceae Solanum torvum Sw.
26 Menispermaceae Stephania hernandiifolia (Willd.) Walp.
27 Vitaceae Tetrastigma bracteolatum (Wall.) Planch.
28 Malvaceae Triumfetta rhomboidea Jacq.
29 Rhamnaceae Ziziphus jujuba Mill.
Table 6: List of other species recorded from managed plots
Sl No. Family Other Species
1 Fabaceae Acacia catechu (L.f.) Willd.
2 Lamiaeae Achyrospermum wallichianum (Benth.) Benth. ex Hook.f.
3 Asteraceae Acmella paniculata (Wall. ex DC.) R.K. Jansen
4 Pteridaceae Adiantum sp
5 Fabaceae Albizia lucidior (Steud.) I.C. Nielsen
6 Fabaceae Albizia procera (Roxburgh) Bentham
7 Amaranthaceae Alternanthera philoxeroides (Mart.) Griseb.
8 Amaranthaceae Amaranthus spinosus L.
9 Amaranthaceae Amaranthus viridis L.
10 Commelinaceae Amischotolype hookeri (Hassk.) H. Hara
11 Lamiaceae Anisomeles indica (L.) Kuntze
12 Aristolochiaceae Aristolochia saccata Wall. indica L.
13 Asteraceae Bidens pilosa L.
14 Compositae Blumea lacera (Burman f.) de Candolle
15 Urticaceae Boehmeria sp
16 Malvaceae Bombax ceiba L.
17 Phyllanthaceae Bridelia retusa (L.) A. Juss.
18 Lamiaceae Callicarpa tomentosa (L.) L.
19 Apiaceae Centella asiatica (L.) Urban
20 Costaceae Cheilocostus speciosus (J. Koenig) C.D. Specht
21 Menispermaceae Cissampelos pareira L.
22 Cucurbitaceae Citrullus sp
23 Rutaceae Clausena excavata Burm.f.
24 Fabaceae Codariocalyx motorius (Houtt.) H. Ohashi
25 Rubiaceae Coffea benghalensis B. Heyne ex Schult.
26 Araceae Colocasia esculenta (L.) Schott
27 Commelinaceae Commelina benghalensis L.
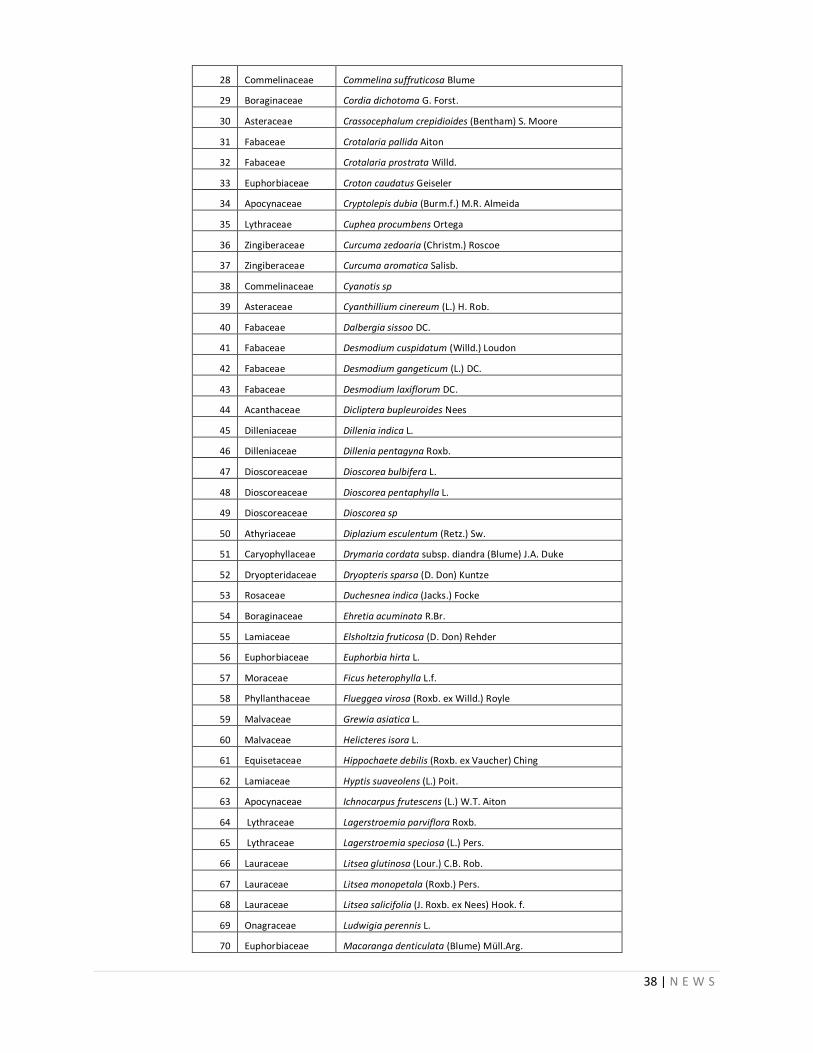
38 | N E W S
28 Commelinaceae Commelina suffruticosa Blume
29 Boraginaceae Cordia dichotoma G. Forst.
30 Asteraceae Crassocephalum crepidioides (Bentham) S. Moore
31 Fabaceae Crotalaria pallida Aiton
32 Fabaceae Crotalaria prostrata Willd.
33 Euphorbiaceae Croton caudatus Geiseler
34 Apocynaceae Cryptolepis dubia (Burm.f.) M.R. Almeida
35 Lythraceae Cuphea procumbens Ortega
36 Zingiberaceae Curcuma zedoaria (Christm.) Roscoe
37 Zingiberaceae Curcuma aromatica Salisb.
38 Commelinaceae Cyanotis sp
39 Asteraceae Cyanthillium cinereum (L.) H. Rob.
40 Fabaceae Dalbergia sissoo DC.
41 Fabaceae Desmodium cuspidatum (Willd.) Loudon
42 Fabaceae Desmodium gangeticum (L.) DC.
43 Fabaceae Desmodium laxiflorum DC.
44 Acanthaceae Dicliptera bupleuroides Nees
45 Dilleniaceae Dillenia indica L.
46 Dilleniaceae Dillenia pentagyna Roxb.
47 Dioscoreaceae Dioscorea bulbifera L.
48 Dioscoreaceae Dioscorea pentaphylla L.
49 Dioscoreaceae Dioscorea sp
50 Athyriaceae Diplazium esculentum (Retz.) Sw.
51 Caryophyllaceae Drymaria cordata subsp. diandra (Blume) J.A. Duke
52 Dryopteridaceae Dryopteris sparsa (D. Don) Kuntze
53 Rosaceae Duchesnea indica (Jacks.) Focke
54 Boraginaceae Ehretia acuminata R.Br.
55 Lamiaceae Elsholtzia fruticosa (D. Don) Rehder
56 Euphorbiaceae Euphorbia hirta L.
57 Moraceae Ficus heterophylla L.f.
58 Phyllanthaceae Flueggea virosa (Roxb. ex Willd.) Royle
59 Malvaceae Grewia asiatica L.
60 Malvaceae Helicteres isora L.
61 Equisetaceae Hippochaete debilis (Roxb. ex Vaucher) Ching
62 Lamiaceae Hyptis suaveolens (L.) Poit.
63 Apocynaceae Ichnocarpus frutescens (L.) W.T. Aiton
64 Lythraceae Lagerstroemia parviflora Roxb.
65 Lythraceae Lagerstroemia speciosa (L.) Pers.
66 Lauraceae Litsea glutinosa (Lour.) C.B. Rob.
67 Lauraceae Litsea monopetala (Roxb.) Pers.
68 Lauraceae Litsea salicifolia (J. Roxb. ex Nees) Hook. f.
69 Onagraceae Ludwigia perennis L.
70 Euphorbiaceae Macaranga denticulata (Blume) Müll.Arg.
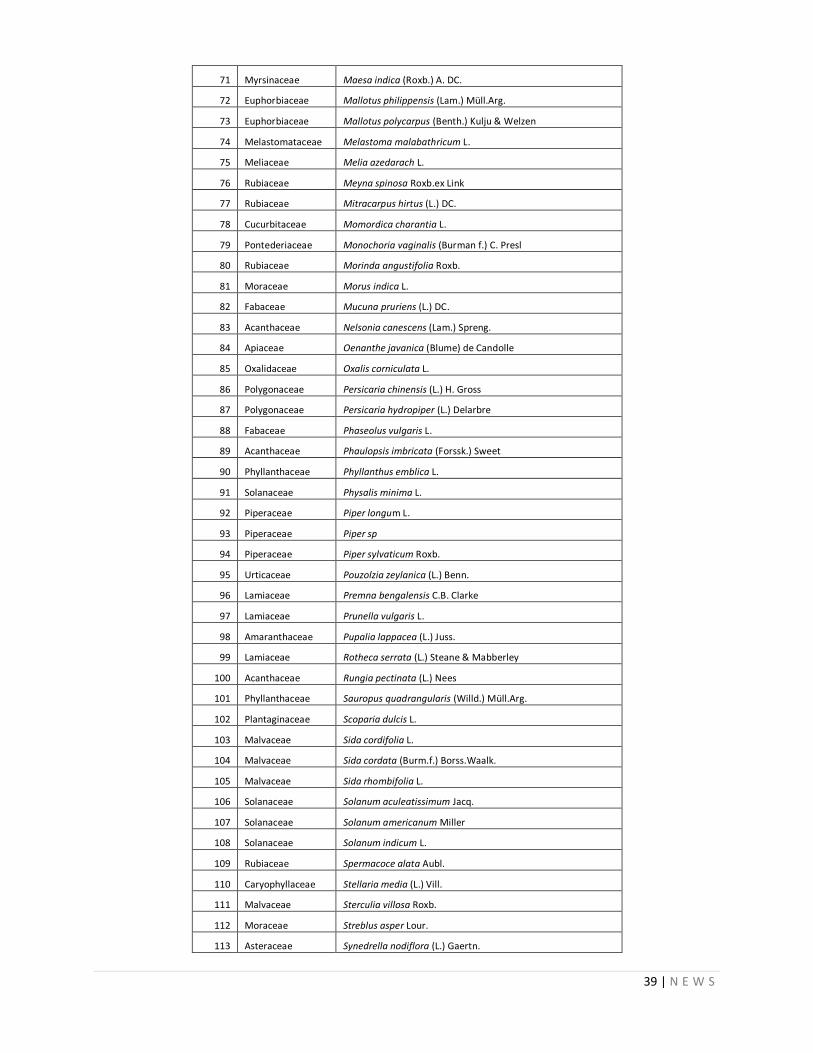
39 | N E W S
71 Myrsinaceae Maesa indica (Roxb.) A. DC.
72 Euphorbiaceae Mallotus philippensis (Lam.) Müll.Arg.
73 Euphorbiaceae Mallotus polycarpus (Benth.) Kulju & Welzen
74 Melastomataceae Melastoma malabathricum L.
75 Meliaceae Melia azedarach L.
76 Rubiaceae Meyna spinosa Roxb.ex Link
77 Rubiaceae Mitracarpus hirtus (L.) DC.
78 Cucurbitaceae Momordica charantia L.
79 Pontederiaceae Monochoria vaginalis (Burman f.) C. Presl
80 Rubiaceae Morinda angustifolia Roxb.
81 Moraceae Morus indica L.
82 Fabaceae Mucuna pruriens (L.) DC.
83 Acanthaceae Nelsonia canescens (Lam.) Spreng.
84 Apiaceae Oenanthe javanica (Blume) de Candolle
85 Oxalidaceae Oxalis corniculata L.
86 Polygonaceae Persicaria chinensis (L.) H. Gross
87 Polygonaceae Persicaria hydropiper (L.) Delarbre
88 Fabaceae Phaseolus vulgaris L.
89 Acanthaceae Phaulopsis imbricata (Forssk.) Sweet
90 Phyllanthaceae Phyllanthus emblica L.
91 Solanaceae Physalis minima L.
92 Piperaceae Piper longum L.
93 Piperaceae Piper sp
94 Piperaceae Piper sylvaticum Roxb.
95 Urticaceae Pouzolzia zeylanica (L.) Benn.
96 Lamiaceae Premna bengalensis C.B. Clarke
97 Lamiaceae Prunella vulgaris L.
98 Amaranthaceae Pupalia lappacea (L.) Juss.
99 Lamiaceae Rotheca serrata (L.) Steane & Mabberley
100 Acanthaceae Rungia pectinata (L.) Nees
101 Phyllanthaceae Sauropus quadrangularis (Willd.) Müll.Arg.
102 Plantaginaceae Scoparia dulcis L.
103 Malvaceae Sida cordifolia L.
104 Malvaceae Sida cordata (Burm.f.) Borss.Waalk.
105 Malvaceae Sida rhombifolia L.
106 Solanaceae Solanum aculeatissimum Jacq.
107 Solanaceae Solanum americanum Miller
108 Solanaceae Solanum indicum L.
109 Rubiaceae Spermacoce alata Aubl.
110 Caryophyllaceae Stellaria media (L.) Vill.
111 Malvaceae Sterculia villosa Roxb.
112 Moraceae Streblus asper Lour.
113 Asteraceae Synedrella nodiflora (L.) Gaertn.
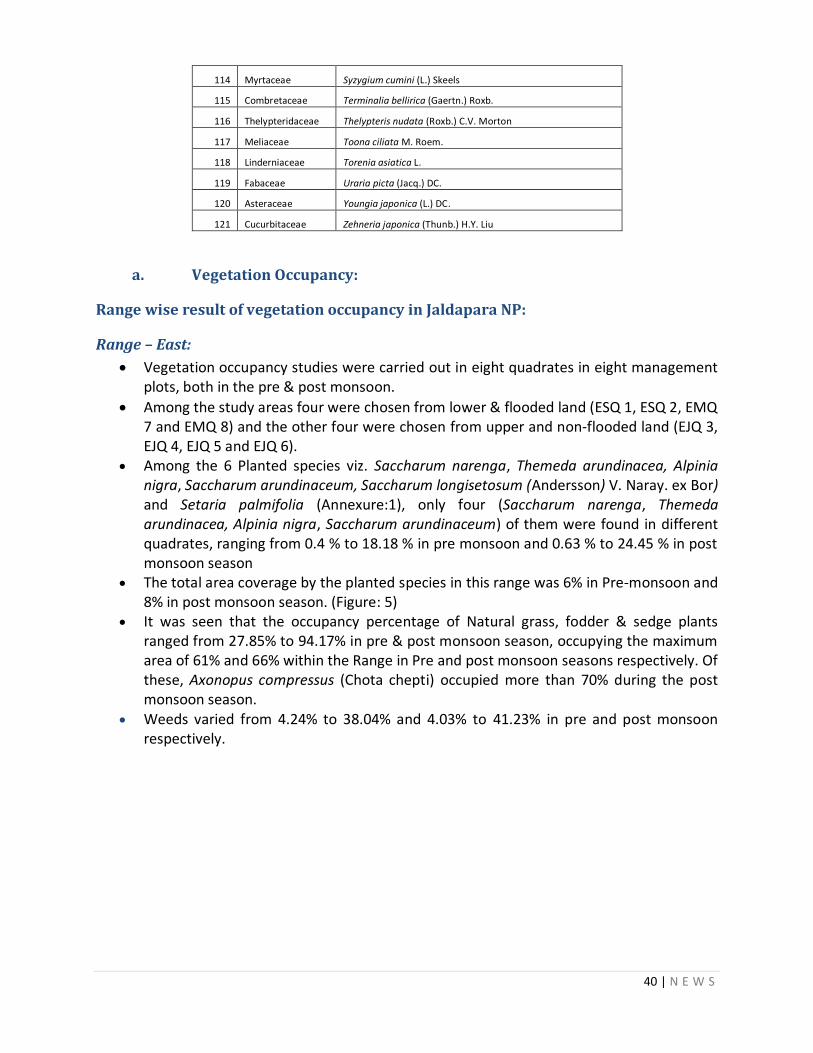
40 | N E W S
114 Myrtaceae Syzygium cumini (L.) Skeels
115 Combretaceae Terminalia bellirica (Gaertn.) Roxb.
116 Thelypteridaceae Thelypteris nudata (Roxb.) C.V. Morton
117 Meliaceae Toona ciliata M. Roem.
118 Linderniaceae Torenia asiatica L.
119 Fabaceae Uraria picta (Jacq.) DC.
120 Asteraceae Youngia japonica (L.) DC.
121 Cucurbitaceae Zehneria japonica (Thunb.) H.Y. Liu
a. Vegetation Occupancy:
Range wise result of vegetation occupancy in Jaldapara NP:
Range – East:
Vegetation occupancy studies were carried out in eight quadrates in eight management plots, both in the pre & post monsoon.
Among the study areas four were chosen from lower & flooded land (ESQ 1, ESQ 2, EMQ 7 and EMQ 8) and the other four were chosen from upper and non-flooded land (EJQ 3, EJQ 4, EJQ 5 and EJQ 6).
Among the 6 Planted species viz. Saccharum narenga, Themeda arundinacea, Alpinia nigra, Saccharum arundinaceum, Saccharum longisetosum (Andersson) V. Naray. ex Bor) and Setaria palmifolia (Annexure:1), only four (Saccharum narenga, Themeda arundinacea, Alpinia nigra, Saccharum arundinaceum) of them were found in different quadrates, ranging from 0.4 % to 18.18 % in pre monsoon and 0.63 % to 24.45 % in post monsoon season
The total area coverage by the planted species in this range was 6% in Pre-monsoon and 8% in post monsoon season. (Figure: 5)
It was seen that the occupancy percentage of Natural grass, fodder & sedge plants ranged from 27.85% to 94.17% in pre & post monsoon season, occupying the maximum area of 61% and 66% within the Range in Pre and post monsoon seasons respectively. Of these, Axonopus compressus (Chota chepti) occupied more than 70% during the post monsoon season.
Weeds varied from 4.24% to 38.04% and 4.03% to 41.23% in pre and post monsoon respectively.
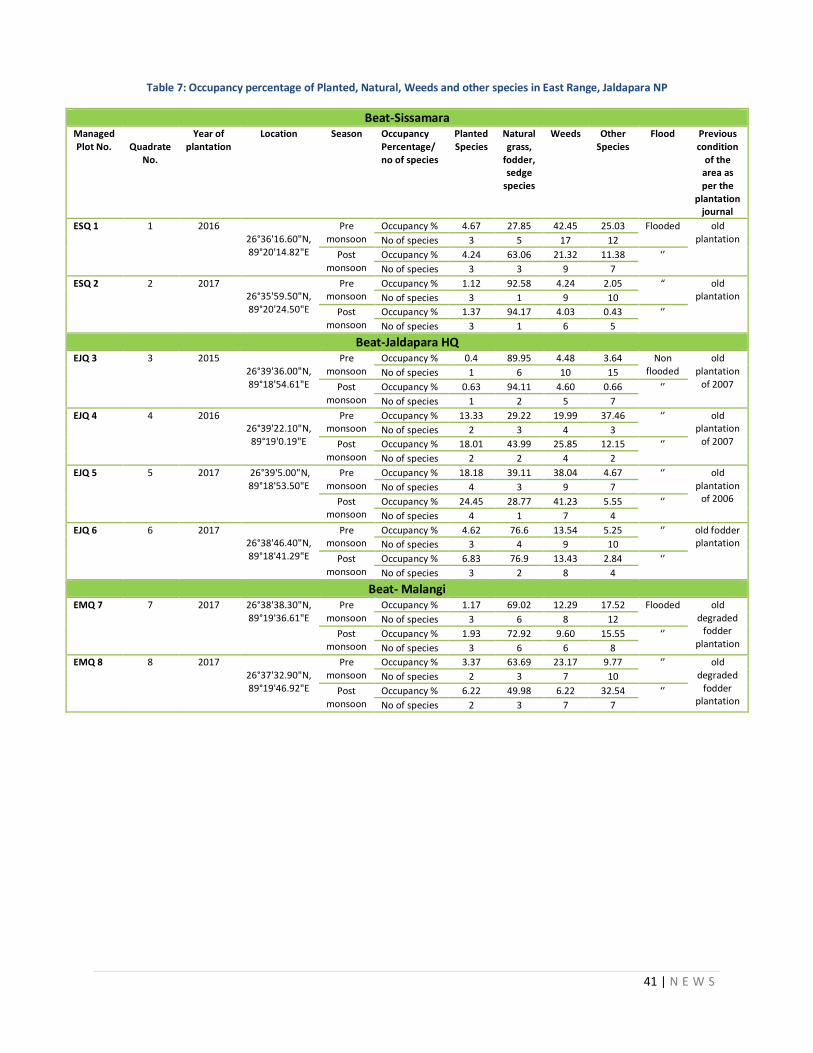
41 | N E W S
Table 7: Occupancy percentage of Planted, Natural, Weeds and other species in East Range, Jaldapara NP
Beat-Sissamara Managed Plot No.
Quadrate
No.
Year of plantation
Location Season Occupancy Percentage/ no of species
Planted Species
Natural grass,
fodder, sedge
species
Weeds Other Species
Flood Previous condition
of the area as per the
plantation journal
ESQ 1 1 2016 26°36'16.60"N, 89°20'14.82"E
Pre monsoon
Occupancy % 4.67 27.85 42.45 25.03 Flooded old plantation No of species 3 5 17 12
Post monsoon
Occupancy % 4.24 63.06 21.32 11.38 ‘’
No of species 3 3 9 7
ESQ 2 2 2017 26°35'59.50"N, 89°20'24.50"E
Pre monsoon
Occupancy % 1.12 92.58 4.24 2.05 “ old plantation No of species 3 1 9 10
Post monsoon
Occupancy % 1.37 94.17 4.03 0.43 ‘’
No of species 3 1 6 5
Beat-Jaldapara HQ EJQ 3 3 2015
26°39'36.00"N, 89°18'54.61"E
Pre monsoon
Occupancy % 0.4 89.95 4.48 3.64 Non flooded
old plantation
of 2007 No of species 1 6 10 15
Post monsoon
Occupancy % 0.63 94.11 4.60 0.66 ‘’
No of species 1 2 5 7
EJQ 4 4 2016 26°39'22.10"N,
89°19'0.19"E
Pre monsoon
Occupancy % 13.33 29.22 19.99 37.46 ‘’ old plantation
of 2007 No of species 2 3 4 3
Post monsoon
Occupancy % 18.01 43.99 25.85 12.15 ‘’
No of species 2 2 4 2
EJQ 5 5 2017 26°39'5.00"N, 89°18'53.50"E
Pre monsoon
Occupancy % 18.18 39.11 38.04 4.67 ‘’ old plantation
of 2006 No of species 4 3 9 7
Post monsoon
Occupancy % 24.45 28.77 41.23 5.55 ‘’
No of species 4 1 7 4
EJQ 6 6 2017 26°38'46.40"N, 89°18'41.29"E
Pre monsoon
Occupancy % 4.62 76.6 13.54 5.25 ‘’ old fodder plantation No of species 3 4 9 10
Post monsoon
Occupancy % 6.83 76.9 13.43 2.84 ‘’
No of species 3 2 8 4
Beat- Malangi EMQ 7 7 2017 26°38'38.30"N,
89°19'36.61"E Pre
monsoon Occupancy % 1.17 69.02 12.29 17.52 Flooded old
degraded fodder
plantation
No of species 3 6 8 12
Post monsoon
Occupancy % 1.93 72.92 9.60 15.55 ‘’
No of species 3 6 6 8
EMQ 8 8 2017 26°37'32.90"N, 89°19'46.92"E
Pre monsoon
Occupancy % 3.37 63.69 23.17 9.77 ‘’ old degraded
fodder plantation
No of species 2 3 7 10
Post monsoon
Occupancy % 6.22 49.98 6.22 32.54 ‘’
No of species 2 3 7 7
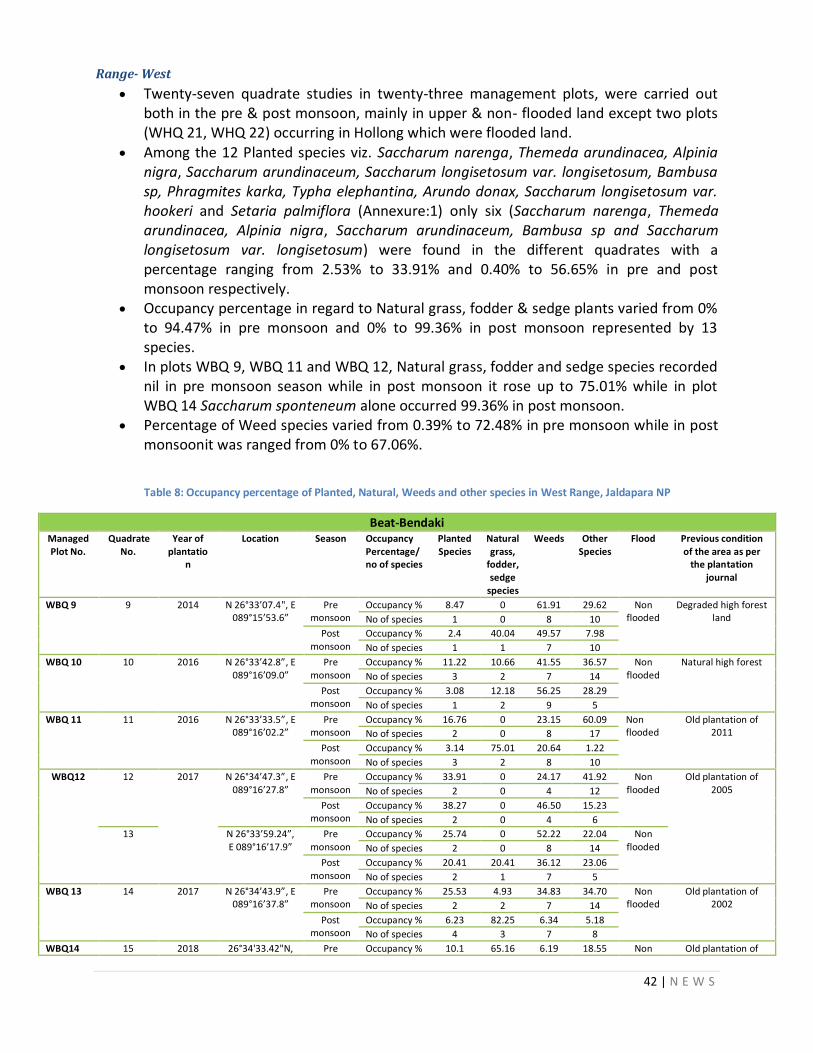
42 | N E W S
Range- West
Twenty-seven quadrate studies in twenty-three management plots, were carried out both in the pre & post monsoon, mainly in upper & non- flooded land except two plots (WHQ 21, WHQ 22) occurring in Hollong which were flooded land.
Among the 12 Planted species viz. Saccharum narenga, Themeda arundinacea, Alpinia nigra, Saccharum arundinaceum, Saccharum longisetosum var. longisetosum, Bambusa sp, Phragmites karka, Typha elephantina, Arundo donax, Saccharum longisetosum var. hookeri and Setaria palmiflora (Annexure:1) only six (Saccharum narenga, Themeda arundinacea, Alpinia nigra, Saccharum arundinaceum, Bambusa sp and Saccharum longisetosum var. longisetosum) were found in the different quadrates with a percentage ranging from 2.53% to 33.91% and 0.40% to 56.65% in pre and post monsoon respectively.
Occupancy percentage in regard to Natural grass, fodder & sedge plants varied from 0% to 94.47% in pre monsoon and 0% to 99.36% in post monsoon represented by 13 species.
In plots WBQ 9, WBQ 11 and WBQ 12, Natural grass, fodder and sedge species recorded nil in pre monsoon season while in post monsoon it rose up to 75.01% while in plot WBQ 14 Saccharum sponteneum alone occurred 99.36% in post monsoon.
Percentage of Weed species varied from 0.39% to 72.48% in pre monsoon while in post monsoonit was ranged from 0% to 67.06%.
Table 8: Occupancy percentage of Planted, Natural, Weeds and other species in West Range, Jaldapara NP
Beat-Bendaki Managed Plot No.
Quadrate No.
Year of plantatio
n
Location Season Occupancy Percentage/ no of species
Planted Species
Natural grass,
fodder, sedge
species
Weeds Other Species
Flood Previous condition of the area as per
the plantation journal
WBQ 9 9 2014 N 26°33’07.4", E 089°15’53.6”
Pre monsoon
Occupancy % 8.47 0 61.91 29.62 Non flooded
Degraded high forest land No of species 1 0 8 10
Post monsoon
Occupancy % 2.4 40.04 49.57 7.98
No of species 1 1 7 10
WBQ 10 10 2016 N 26°33’42.8”, E 089°16’09.0”
Pre monsoon
Occupancy % 11.22 10.66 41.55 36.57 Non flooded
Natural high forest
No of species 3 2 7 14
Post monsoon
Occupancy % 3.08 12.18 56.25 28.29
No of species 1 2 9 5
WBQ 11 11 2016 N 26°33’33.5”, E 089°16’02.2”
Pre monsoon
Occupancy % 16.76 0 23.15 60.09 Non flooded
Old plantation of 2011 No of species 2 0 8 17
Post monsoon
Occupancy % 3.14 75.01 20.64 1.22
No of species 3 2 8 10
WBQ12 12 2017 N 26°34’47.3”, E 089°16’27.8”
Pre monsoon
Occupancy % 33.91 0 24.17 41.92 Non flooded
Old plantation of 2005 No of species 2 0 4 12
Post monsoon
Occupancy % 38.27 0 46.50 15.23
No of species 2 0 4 6
13 N 26°33’59.24”, E 089°16’17.9”
Pre monsoon
Occupancy % 25.74 0 52.22 22.04 Non flooded No of species 2 0 8 14
Post monsoon
Occupancy % 20.41 20.41 36.12 23.06
No of species 2 1 7 5
WBQ 13 14 2017 N 26°34’43.9”, E 089°16’37.8”
Pre monsoon
Occupancy % 25.53 4.93 34.83 34.70 Non flooded
Old plantation of 2002 No of species 2 2 7 14
Post monsoon
Occupancy % 6.23 82.25 6.34 5.18
No of species 4 3 7 8
WBQ14 15 2018 26°34'33.42"N, Pre Occupancy % 10.1 65.16 6.19 18.55 Non Old plantation of
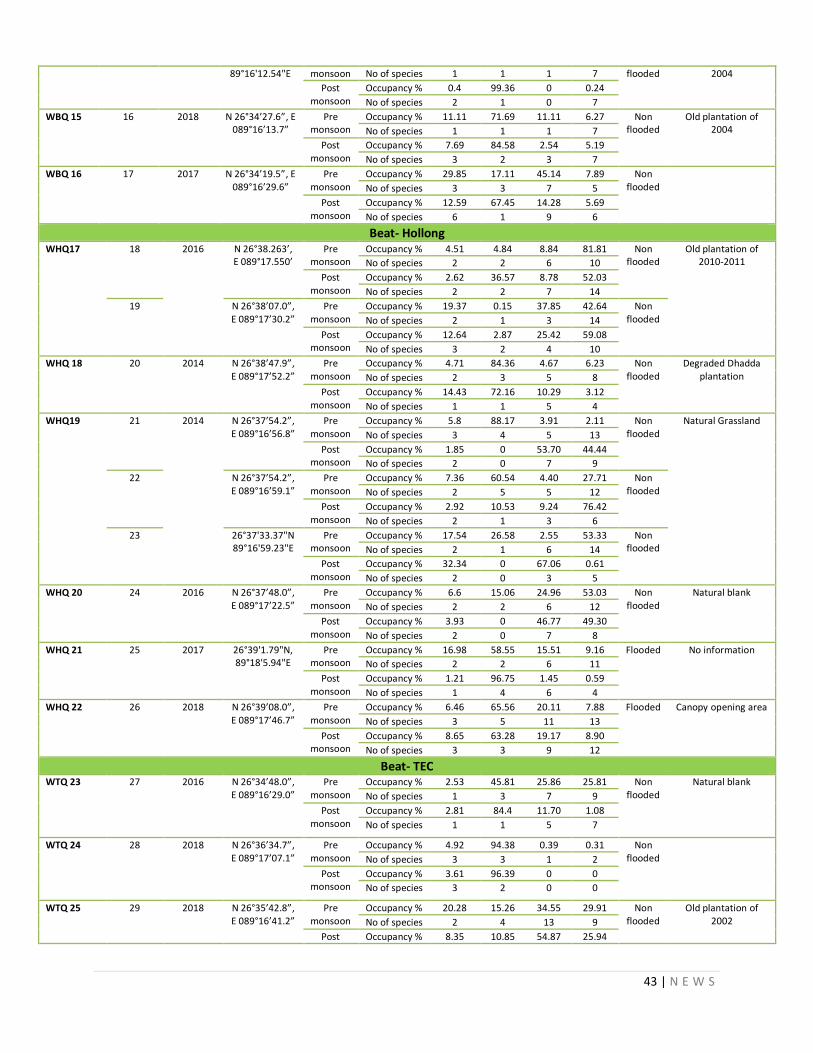
43 | N E W S
89°16'12.54"E monsoon No of species 1 1 1 7 flooded 2004
Post monsoon
Occupancy % 0.4 99.36 0 0.24
No of species 2 1 0 7
WBQ 15 16 2018 N 26°34’27.6”, E 089°16’13.7”
Pre monsoon
Occupancy % 11.11 71.69 11.11 6.27 Non flooded
Old plantation of 2004 No of species 1 1 1 7
Post monsoon
Occupancy % 7.69 84.58 2.54 5.19
No of species 3 2 3 7
WBQ 16 17 2017 N 26°34’19.5”, E 089°16’29.6”
Pre monsoon
Occupancy % 29.85 17.11 45.14 7.89 Non flooded
No of species 3 3 7 5
Post monsoon
Occupancy % 12.59 67.45 14.28 5.69
No of species 6 1 9 6
Beat- Hollong WHQ17 18 2016 N 26°38.263’,
E 089°17.550’ Pre
monsoon Occupancy % 4.51 4.84 8.84 81.81 Non
flooded Old plantation of
2010-2011 No of species 2 2 6 10
Post monsoon
Occupancy % 2.62 36.57 8.78 52.03
No of species 2 2 7 14
19 N 26°38’07.0”, E 089°17’30.2”
Pre monsoon
Occupancy % 19.37 0.15 37.85 42.64 Non flooded No of species 2 1 3 14
Post monsoon
Occupancy % 12.64 2.87 25.42 59.08
No of species 3 2 4 10
WHQ 18 20 2014 N 26°38’47.9”, E 089°17’52.2”
Pre monsoon
Occupancy % 4.71 84.36 4.67 6.23 Non flooded
Degraded Dhadda plantation No of species 2 3 5 8
Post monsoon
Occupancy % 14.43 72.16 10.29 3.12
No of species 1 1 5 4
WHQ19 21 2014 N 26°37’54.2”, E 089°16’56.8”
Pre monsoon
Occupancy % 5.8 88.17 3.91 2.11 Non flooded
Natural Grassland
No of species 3 4 5 13
Post monsoon
Occupancy % 1.85 0 53.70 44.44
No of species 2 0 7 9
22 N 26°37’54.2”, E 089°16’59.1”
Pre monsoon
Occupancy % 7.36 60.54 4.40 27.71 Non flooded No of species 2 5 5 12
Post monsoon
Occupancy % 2.92 10.53 9.24 76.42
No of species 2 1 3 6
23 26°37'33.37"N89°16'59.23"E
Pre monsoon
Occupancy % 17.54 26.58 2.55 53.33 Non flooded No of species 2 1 6 14
Post monsoon
Occupancy % 32.34 0 67.06 0.61
No of species 2 0 3 5
WHQ 20 24 2016 N 26°37’48.0”, E 089°17’22.5”
Pre monsoon
Occupancy % 6.6 15.06 24.96 53.03 Non flooded
Natural blank
No of species 2 2 6 12
Post monsoon
Occupancy % 3.93 0 46.77 49.30
No of species 2 0 7 8
WHQ 21 25 2017 26°39'1.79"N, 89°18'5.94"E
Pre monsoon
Occupancy % 16.98 58.55 15.51 9.16 Flooded No information
No of species 2 2 6 11
Post monsoon
Occupancy % 1.21 96.75 1.45 0.59
No of species 1 4 6 4
WHQ 22 26 2018 N 26°39’08.0”, E 089°17’46.7”
Pre monsoon
Occupancy % 6.46 65.56 20.11 7.88 Flooded Canopy opening area
No of species 3 5 11 13
Post monsoon
Occupancy % 8.65 63.28 19.17 8.90
No of species 3 3 9 12
Beat- TEC WTQ 23 27 2016 N 26°34’48.0”,
E 089°16’29.0”
Pre monsoon
Occupancy % 2.53 45.81 25.86 25.81 Non flooded
Natural blank
No of species 1 3 7 9
Post monsoon
Occupancy % 2.81 84.4 11.70 1.08
No of species 1 1 5 7
WTQ 24 28 2018 N 26°36’34.7”, E 089°17’07.1”
Pre monsoon
Occupancy % 4.92 94.38 0.39 0.31 Non flooded
No of species 3 3 1 2
Post monsoon
Occupancy % 3.61 96.39 0 0
No of species 3 2 0 0
WTQ 25 29 2018 N 26°35’42.8”, E 089°16’41.2”
Pre monsoon
Occupancy % 20.28 15.26 34.55 29.91 Non flooded
Old plantation of 2002 No of species 2 4 13 9
Post Occupancy % 8.35 10.85 54.87 25.94
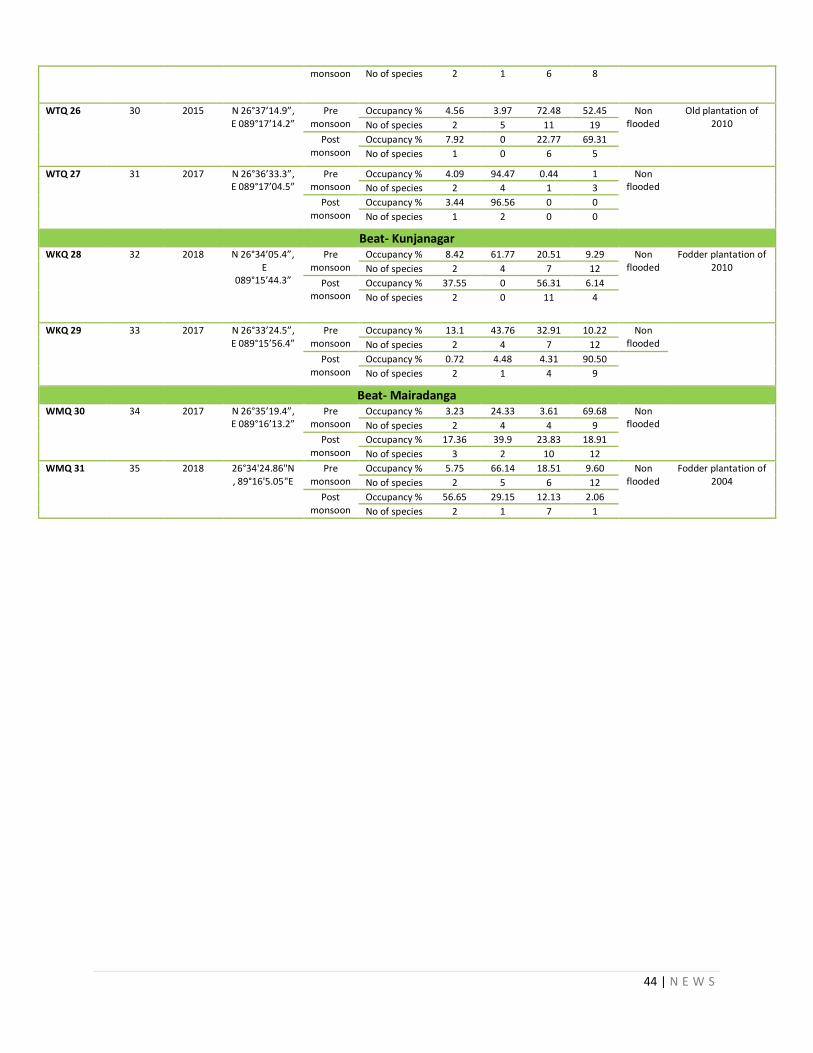
44 | N E W S
monsoon No of species 2 1 6 8
WTQ 26 30 2015 N 26°37’14.9”, E 089°17’14.2”
Pre monsoon
Occupancy % 4.56 3.97 72.48 52.45 Non flooded
Old plantation of 2010 No of species 2 5 11 19
Post monsoon
Occupancy % 7.92 0 22.77 69.31
No of species 1 0 6 5
WTQ 27 31 2017 N 26°36’33.3”, E 089°17’04.5”
Pre monsoon
Occupancy % 4.09 94.47 0.44 1 Non flooded
No of species 2 4 1 3
Post monsoon
Occupancy % 3.44 96.56 0 0
No of species 1 2 0 0
Beat- Kunjanagar WKQ 28 32 2018 N 26°34’05.4”,
E 089°15’44.3”
Pre monsoon
Occupancy % 8.42 61.77 20.51 9.29 Non flooded
Fodder plantation of 2010 No of species 2 4 7 12
Post monsoon
Occupancy % 37.55 0 56.31 6.14
No of species 2 0 11 4
WKQ 29 33 2017 N 26°33’24.5”, E 089°15’56.4”
Pre monsoon
Occupancy % 13.1 43.76 32.91 10.22 Non flooded
No of species 2 4 7 12
Post monsoon
Occupancy % 0.72 4.48 4.31 90.50
No of species 2 1 4 9
Beat- Mairadanga WMQ 30 34 2017 N 26°35’19.4”,
E 089°16’13.2” Pre
monsoon Occupancy % 3.23 24.33 3.61 69.68 Non
flooded
No of species 2 4 4 9
Post monsoon
Occupancy % 17.36 39.9 23.83 18.91
No of species 3 2 10 12
WMQ 31 35 2018 26°34'24.86"N, 89°16'5.05"E
Pre monsoon
Occupancy % 5.75 66.14 18.51 9.60 Non flooded
Fodder plantation of 2004 No of species 2 5 6 12
Post monsoon
Occupancy % 56.65 29.15 12.13 2.06
No of species 2 1 7 1
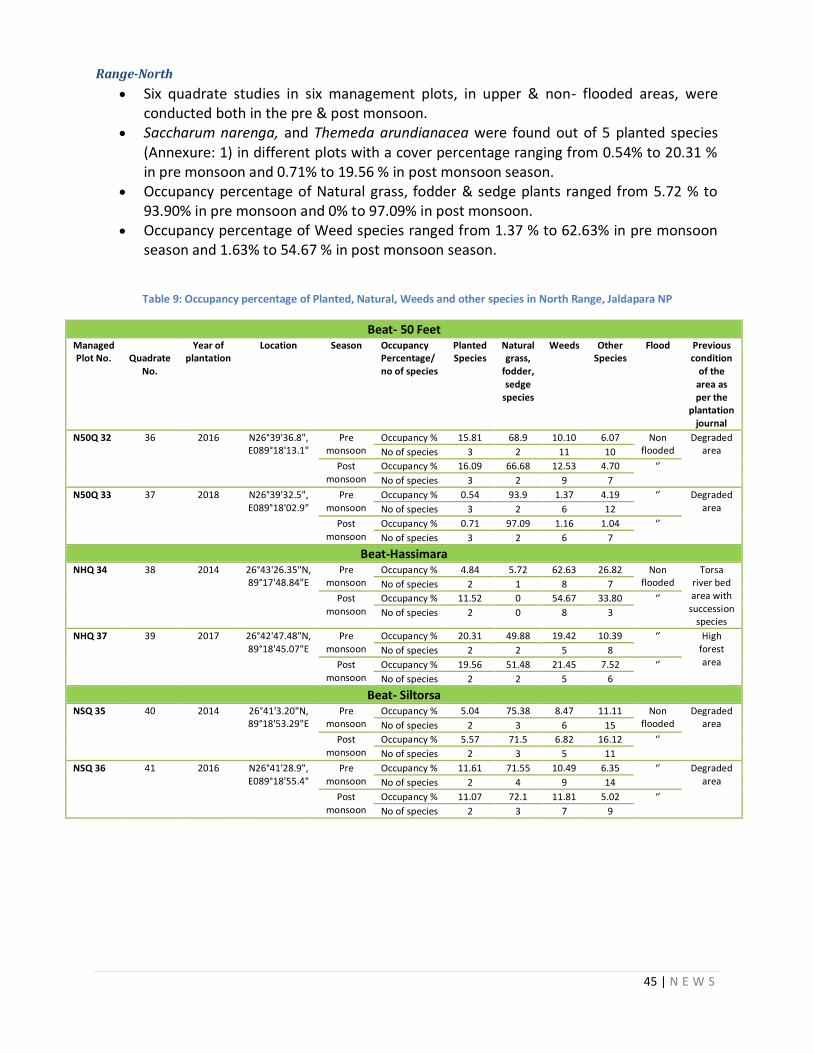
45 | N E W S
Range-North
Six quadrate studies in six management plots, in upper & non- flooded areas, were conducted both in the pre & post monsoon.
Saccharum narenga, and Themeda arundianacea were found out of 5 planted species (Annexure: 1) in different plots with a cover percentage ranging from 0.54% to 20.31 % in pre monsoon and 0.71% to 19.56 % in post monsoon season.
Occupancy percentage of Natural grass, fodder & sedge plants ranged from 5.72 % to 93.90% in pre monsoon and 0% to 97.09% in post monsoon.
Occupancy percentage of Weed species ranged from 1.37 % to 62.63% in pre monsoon season and 1.63% to 54.67 % in post monsoon season.
Table 9: Occupancy percentage of Planted, Natural, Weeds and other species in North Range, Jaldapara NP
Beat- 50 Feet Managed Plot No.
Quadrate
No.
Year of plantation
Location Season Occupancy Percentage/ no of species
Planted Species
Natural grass,
fodder, sedge
species
Weeds Other Species
Flood Previous condition
of the area as per the
plantation journal
N50Q 32 36 2016 N26°39'36.8", E089°18'13.1"
Pre monsoon
Occupancy % 15.81 68.9 10.10 6.07 Non flooded
Degraded area No of species 3 2 11 10
Post monsoon
Occupancy % 16.09 66.68 12.53 4.70 ‘’
No of species 3 2 9 7
N50Q 33 37 2018 N26°39'32.5", E089°18'02.9"
Pre monsoon
Occupancy % 0.54 93.9 1.37 4.19 ‘’ Degraded area No of species 3 2 6 12
Post monsoon
Occupancy % 0.71 97.09 1.16 1.04 ‘’
No of species 3 2 6 7
Beat-Hassimara NHQ 34 38 2014 26°43'26.35"N,
89°17'48.84"E Pre
monsoon Occupancy % 4.84 5.72 62.63 26.82 Non
flooded Torsa
river bed area with
succession species
No of species 2 1 8 7
Post monsoon
Occupancy % 11.52 0 54.67 33.80 ‘’
No of species 2 0 8 3
NHQ 37 39 2017 26°42'47.48"N, 89°18'45.07"E
Pre monsoon
Occupancy % 20.31 49.88 19.42 10.39 ‘’ High forest area
No of species 2 2 5 8
Post monsoon
Occupancy % 19.56 51.48 21.45 7.52 ‘’
No of species 2 2 5 6
Beat- Siltorsa NSQ 35 40 2014 26°41'3.20"N,
89°18'53.29"E Pre
monsoon Occupancy % 5.04 75.38 8.47 11.11 Non
flooded Degraded
area No of species 2 3 6 15
Post monsoon
Occupancy % 5.57 71.5 6.82 16.12 ‘’
No of species 2 3 5 11
NSQ 36 41 2016 N26°41'28.9", E089°18'55.4"
Pre monsoon
Occupancy % 11.61 71.55 10.49 6.35 ‘’ Degraded area No of species 2 4 9 14
Post monsoon
Occupancy % 11.07 72.1 11.81 5.02 ‘’
No of species 2 3 7 9
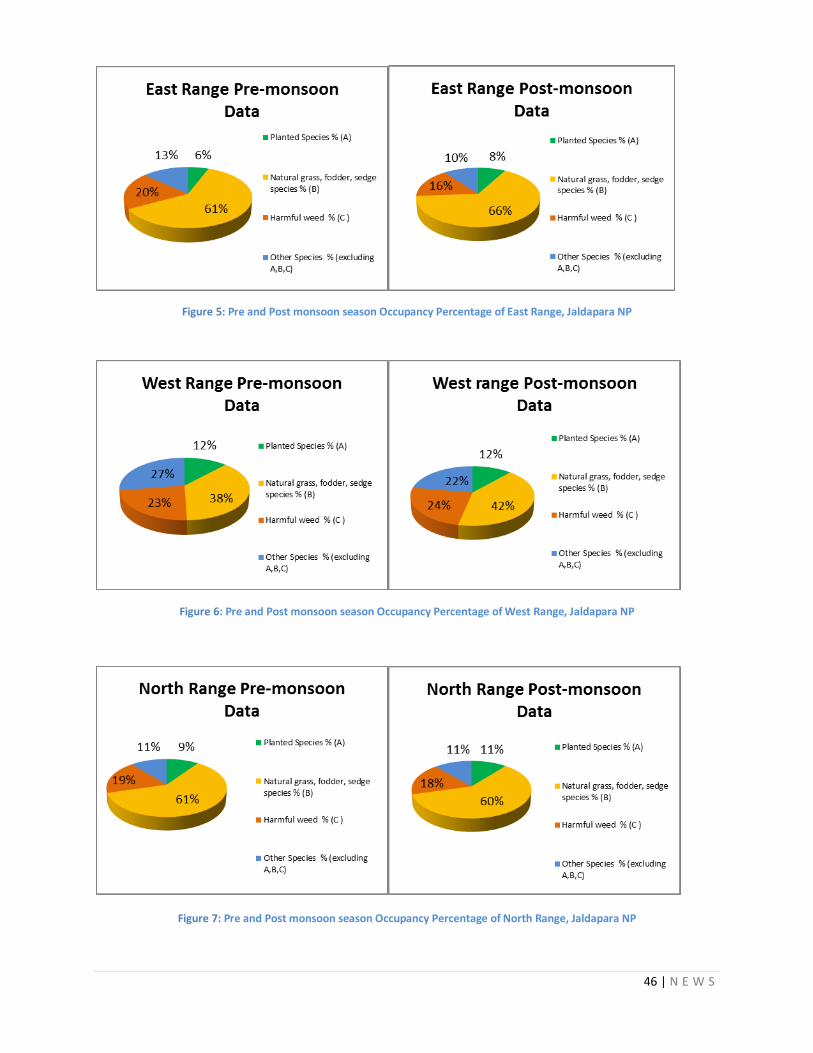
46 | N E W S
Figure 5: Pre and Post monsoon season Occupancy Percentage of East Range, Jaldapara NP
Figure 6: Pre and Post monsoon season Occupancy Percentage of West Range, Jaldapara NP
Figure 7: Pre and Post monsoon season Occupancy Percentage of North Range, Jaldapara NP
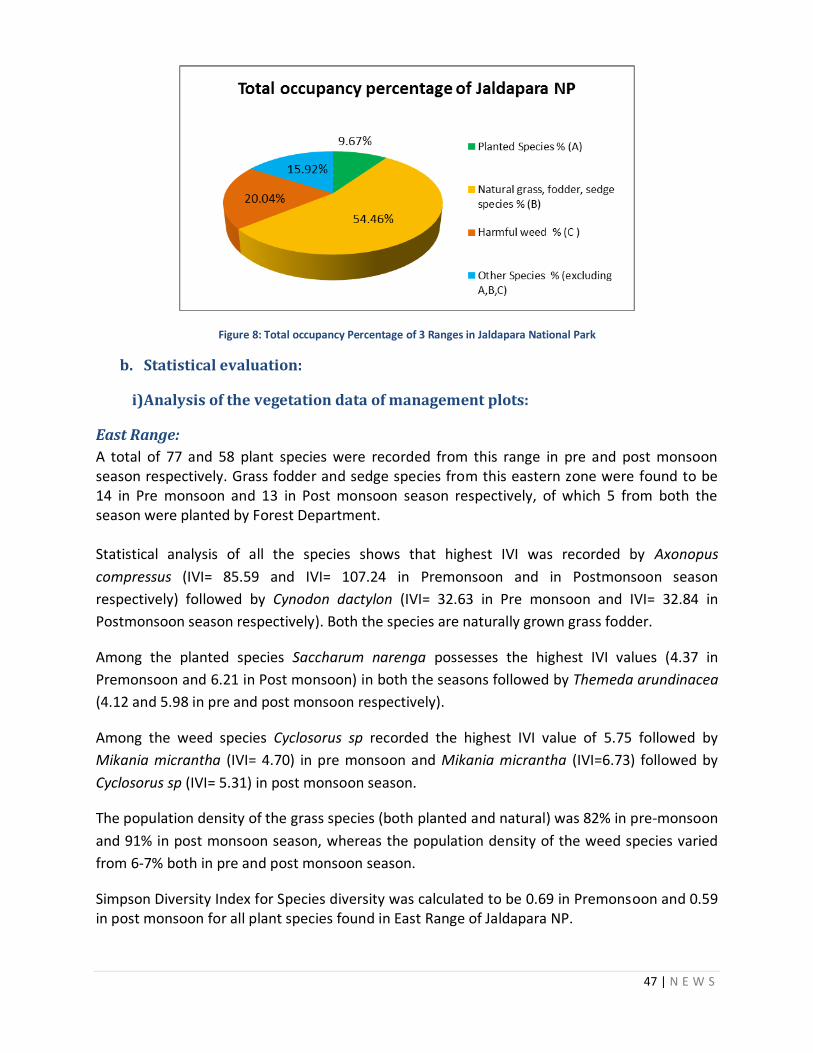
47 | N E W S
Figure 8: Total occupancy Percentage of 3 Ranges in Jaldapara National Park
b. Statistical evaluation:
i) Analysis of the vegetation data of management plots:
East Range:
A total of 77 and 58 plant species were recorded from this range in pre and post monsoon season respectively. Grass fodder and sedge species from this eastern zone were found to be 14 in Pre monsoon and 13 in Post monsoon season respectively, of which 5 from both the season were planted by Forest Department. Statistical analysis of all the species shows that highest IVI was recorded by Axonopus
compressus (IVI= 85.59 and IVI= 107.24 in Premonsoon and in Postmonsoon season
respectively) followed by Cynodon dactylon (IVI= 32.63 in Pre monsoon and IVI= 32.84 in
Postmonsoon season respectively). Both the species are naturally grown grass fodder.
Among the planted species Saccharum narenga possesses the highest IVI values (4.37 in
Premonsoon and 6.21 in Post monsoon) in both the seasons followed by Themeda arundinacea
(4.12 and 5.98 in pre and post monsoon respectively).
Among the weed species Cyclosorus sp recorded the highest IVI value of 5.75 followed by
Mikania micrantha (IVI= 4.70) in pre monsoon and Mikania micrantha (IVI=6.73) followed by
Cyclosorus sp (IVI= 5.31) in post monsoon season.
The population density of the grass species (both planted and natural) was 82% in pre-monsoon
and 91% in post monsoon season, whereas the population density of the weed species varied
from 6-7% both in pre and post monsoon season.
Simpson Diversity Index for Species diversity was calculated to be 0.69 in Premonsoon and 0.59 in post monsoon for all plant species found in East Range of Jaldapara NP.
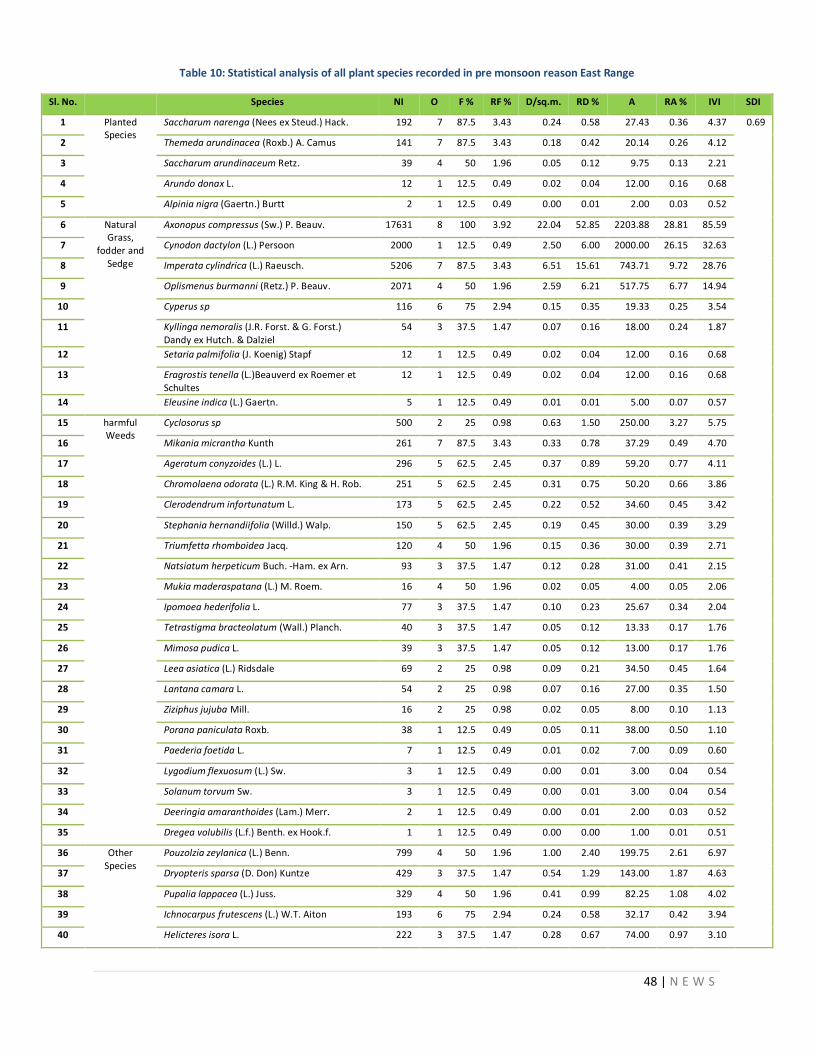
48 | N E W S
Table 10: Statistical analysis of all plant species recorded in pre monsoon reason East Range
Sl. No. Species NI O F % RF % D/sq.m. RD % A RA % IVI SDI
1 Planted Species
Saccharum narenga (Nees ex Steud.) Hack. 192 7 87.5 3.43 0.24 0.58 27.43 0.36 4.37 0.69
2 Themeda arundinacea (Roxb.) A. Camus 141 7 87.5 3.43 0.18 0.42 20.14 0.26 4.12
3 Saccharum arundinaceum Retz. 39 4 50 1.96 0.05 0.12 9.75 0.13 2.21
4 Arundo donax L. 12 1 12.5 0.49 0.02 0.04 12.00 0.16 0.68
5 Alpinia nigra (Gaertn.) Burtt 2 1 12.5 0.49 0.00 0.01 2.00 0.03 0.52
6 Natural Grass,
fodder and Sedge
Axonopus compressus (Sw.) P. Beauv. 17631 8 100 3.92 22.04 52.85 2203.88 28.81 85.59
7 Cynodon dactylon (L.) Persoon 2000 1 12.5 0.49 2.50 6.00 2000.00 26.15 32.63
8 Imperata cylindrica (L.) Raeusch. 5206 7 87.5 3.43 6.51 15.61 743.71 9.72 28.76
9 Oplismenus burmanni (Retz.) P. Beauv. 2071 4 50 1.96 2.59 6.21 517.75 6.77 14.94
10 Cyperus sp 116 6 75 2.94 0.15 0.35 19.33 0.25 3.54
11 Kyllinga nemoralis (J.R. Forst. & G. Forst.) Dandy ex Hutch. & Dalziel
54 3 37.5 1.47 0.07 0.16 18.00 0.24 1.87
12 Setaria palmifolia (J. Koenig) Stapf 12 1 12.5 0.49 0.02 0.04 12.00 0.16 0.68
13 Eragrostis tenella (L.)Beauverd ex Roemer et Schultes
12 1 12.5 0.49 0.02 0.04 12.00 0.16 0.68
14 Eleusine indica (L.) Gaertn. 5 1 12.5 0.49 0.01 0.01 5.00 0.07 0.57
15 harmful Weeds
Cyclosorus sp 500 2 25 0.98 0.63 1.50 250.00 3.27 5.75
16 Mikania micrantha Kunth 261 7 87.5 3.43 0.33 0.78 37.29 0.49 4.70
17 Ageratum conyzoides (L.) L. 296 5 62.5 2.45 0.37 0.89 59.20 0.77 4.11
18 Chromolaena odorata (L.) R.M. King & H. Rob. 251 5 62.5 2.45 0.31 0.75 50.20 0.66 3.86
19 Clerodendrum infortunatum L. 173 5 62.5 2.45 0.22 0.52 34.60 0.45 3.42
20 Stephania hernandiifolia (Willd.) Walp. 150 5 62.5 2.45 0.19 0.45 30.00 0.39 3.29
21 Triumfetta rhomboidea Jacq. 120 4 50 1.96 0.15 0.36 30.00 0.39 2.71
22 Natsiatum herpeticum Buch. -Ham. ex Arn. 93 3 37.5 1.47 0.12 0.28 31.00 0.41 2.15
23 Mukia maderaspatana (L.) M. Roem. 16 4 50 1.96 0.02 0.05 4.00 0.05 2.06
24 Ipomoea hederifolia L. 77 3 37.5 1.47 0.10 0.23 25.67 0.34 2.04
25 Tetrastigma bracteolatum (Wall.) Planch. 40 3 37.5 1.47 0.05 0.12 13.33 0.17 1.76
26 Mimosa pudica L. 39 3 37.5 1.47 0.05 0.12 13.00 0.17 1.76
27 Leea asiatica (L.) Ridsdale 69 2 25 0.98 0.09 0.21 34.50 0.45 1.64
28 Lantana camara L. 54 2 25 0.98 0.07 0.16 27.00 0.35 1.50
29 Ziziphus jujuba Mill. 16 2 25 0.98 0.02 0.05 8.00 0.10 1.13
30 Porana paniculata Roxb. 38 1 12.5 0.49 0.05 0.11 38.00 0.50 1.10
31 Paederia foetida L. 7 1 12.5 0.49 0.01 0.02 7.00 0.09 0.60
32 Lygodium flexuosum (L.) Sw. 3 1 12.5 0.49 0.00 0.01 3.00 0.04 0.54
33 Solanum torvum Sw. 3 1 12.5 0.49 0.00 0.01 3.00 0.04 0.54
34 Deeringia amaranthoides (Lam.) Merr. 2 1 12.5 0.49 0.00 0.01 2.00 0.03 0.52
35 Dregea volubilis (L.f.) Benth. ex Hook.f. 1 1 12.5 0.49 0.00 0.00 1.00 0.01 0.51
36 Other Species
Pouzolzia zeylanica (L.) Benn. 799 4 50 1.96 1.00 2.40 199.75 2.61 6.97
37 Dryopteris sparsa (D. Don) Kuntze 429 3 37.5 1.47 0.54 1.29 143.00 1.87 4.63
38 Pupalia lappacea (L.) Juss. 329 4 50 1.96 0.41 0.99 82.25 1.08 4.02
39 Ichnocarpus frutescens (L.) W.T. Aiton 193 6 75 2.94 0.24 0.58 32.17 0.42 3.94
40 Helicteres isora L. 222 3 37.5 1.47 0.28 0.67 74.00 0.97 3.10
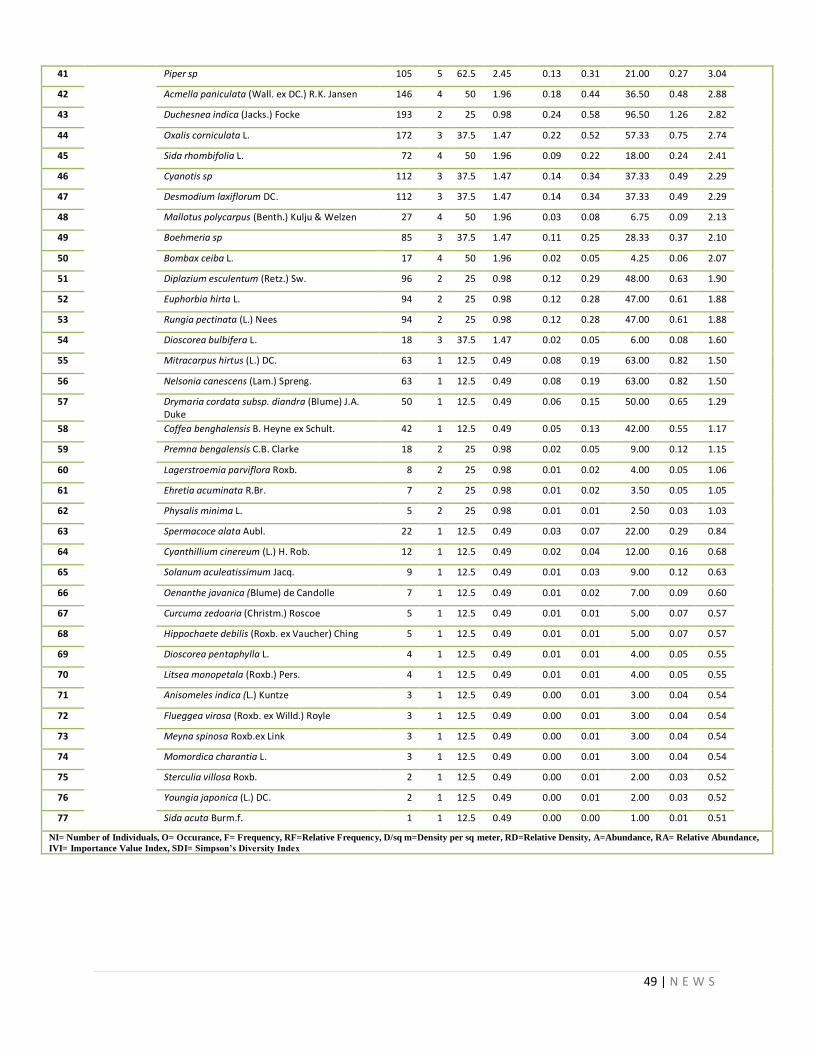
49 | N E W S
41 Piper sp 105 5 62.5 2.45 0.13 0.31 21.00 0.27 3.04
42 Acmella paniculata (Wall. ex DC.) R.K. Jansen 146 4 50 1.96 0.18 0.44 36.50 0.48 2.88
43 Duchesnea indica (Jacks.) Focke 193 2 25 0.98 0.24 0.58 96.50 1.26 2.82
44 Oxalis corniculata L. 172 3 37.5 1.47 0.22 0.52 57.33 0.75 2.74
45 Sida rhombifolia L. 72 4 50 1.96 0.09 0.22 18.00 0.24 2.41
46 Cyanotis sp 112 3 37.5 1.47 0.14 0.34 37.33 0.49 2.29
47 Desmodium laxiflorum DC. 112 3 37.5 1.47 0.14 0.34 37.33 0.49 2.29
48 Mallotus polycarpus (Benth.) Kulju & Welzen 27 4 50 1.96 0.03 0.08 6.75 0.09 2.13
49 Boehmeria sp 85 3 37.5 1.47 0.11 0.25 28.33 0.37 2.10
50 Bombax ceiba L. 17 4 50 1.96 0.02 0.05 4.25 0.06 2.07
51 Diplazium esculentum (Retz.) Sw. 96 2 25 0.98 0.12 0.29 48.00 0.63 1.90
52 Euphorbia hirta L. 94 2 25 0.98 0.12 0.28 47.00 0.61 1.88
53 Rungia pectinata (L.) Nees 94 2 25 0.98 0.12 0.28 47.00 0.61 1.88
54 Dioscorea bulbifera L. 18 3 37.5 1.47 0.02 0.05 6.00 0.08 1.60
55 Mitracarpus hirtus (L.) DC. 63 1 12.5 0.49 0.08 0.19 63.00 0.82 1.50
56 Nelsonia canescens (Lam.) Spreng. 63 1 12.5 0.49 0.08 0.19 63.00 0.82 1.50
57 Drymaria cordata subsp. diandra (Blume) J.A. Duke
50 1 12.5 0.49 0.06 0.15 50.00 0.65 1.29
58 Coffea benghalensis B. Heyne ex Schult. 42 1 12.5 0.49 0.05 0.13 42.00 0.55 1.17
59 Premna bengalensis C.B. Clarke 18 2 25 0.98 0.02 0.05 9.00 0.12 1.15
60 Lagerstroemia parviflora Roxb. 8 2 25 0.98 0.01 0.02 4.00 0.05 1.06
61 Ehretia acuminata R.Br. 7 2 25 0.98 0.01 0.02 3.50 0.05 1.05
62 Physalis minima L. 5 2 25 0.98 0.01 0.01 2.50 0.03 1.03
63 Spermacoce alata Aubl. 22 1 12.5 0.49 0.03 0.07 22.00 0.29 0.84
64 Cyanthillium cinereum (L.) H. Rob. 12 1 12.5 0.49 0.02 0.04 12.00 0.16 0.68
65 Solanum aculeatissimum Jacq. 9 1 12.5 0.49 0.01 0.03 9.00 0.12 0.63
66 Oenanthe javanica (Blume) de Candolle 7 1 12.5 0.49 0.01 0.02 7.00 0.09 0.60
67 Curcuma zedoaria (Christm.) Roscoe 5 1 12.5 0.49 0.01 0.01 5.00 0.07 0.57
68 Hippochaete debilis (Roxb. ex Vaucher) Ching 5 1 12.5 0.49 0.01 0.01 5.00 0.07 0.57
69 Dioscorea pentaphylla L. 4 1 12.5 0.49 0.01 0.01 4.00 0.05 0.55
70 Litsea monopetala (Roxb.) Pers. 4 1 12.5 0.49 0.01 0.01 4.00 0.05 0.55
71 Anisomeles indica (L.) Kuntze 3 1 12.5 0.49 0.00 0.01 3.00 0.04 0.54
72 Flueggea virosa (Roxb. ex Willd.) Royle 3 1 12.5 0.49 0.00 0.01 3.00 0.04 0.54
73 Meyna spinosa Roxb.ex Link 3 1 12.5 0.49 0.00 0.01 3.00 0.04 0.54
74 Momordica charantia L. 3 1 12.5 0.49 0.00 0.01 3.00 0.04 0.54
75 Sterculia villosa Roxb. 2 1 12.5 0.49 0.00 0.01 2.00 0.03 0.52
76 Youngia japonica (L.) DC. 2 1 12.5 0.49 0.00 0.01 2.00 0.03 0.52
77 Sida acuta Burm.f. 1 1 12.5 0.49 0.00 0.00 1.00 0.01 0.51
NI= Number of Individuals, O= Occurance, F= Frequency, RF=Relative Frequency, D/sq m=Density per sq meter, RD=Relative Density, A=Abundance, RA= Relative Abundance,
IVI= Importance Value Index, SDI= Simpson’s Diversity Index
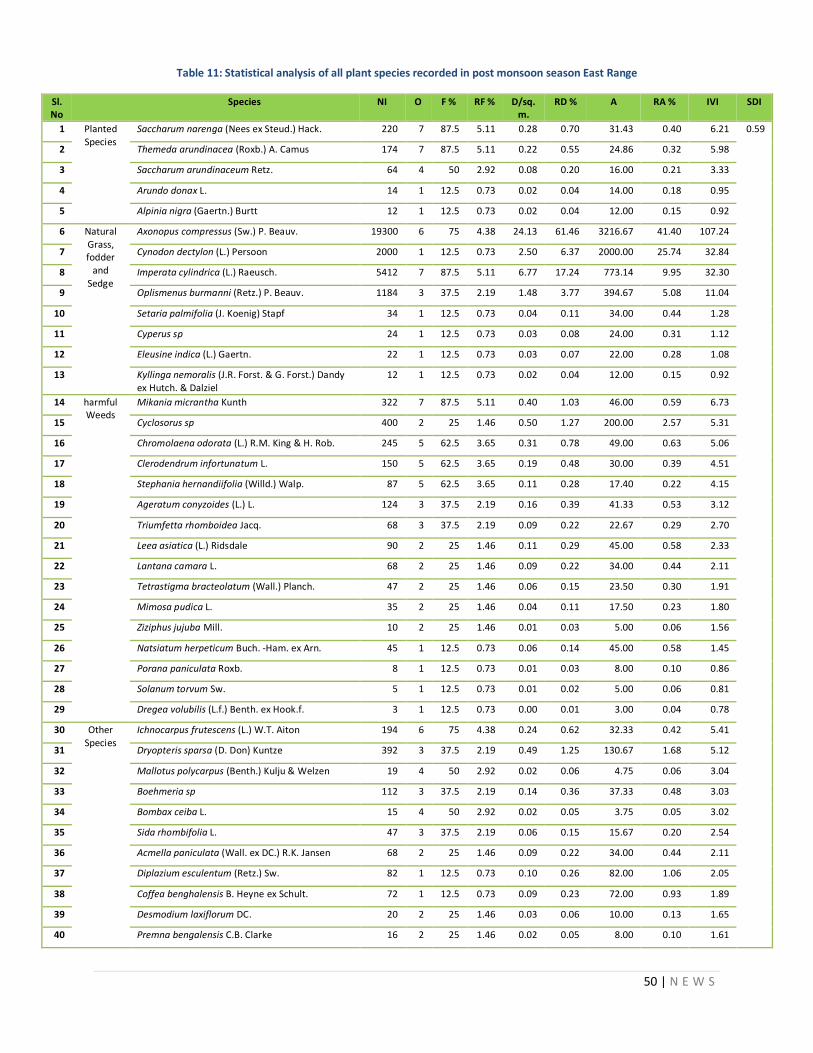
50 | N E W S
Table 11: Statistical analysis of all plant species recorded in post monsoon season East Range
Sl. No
Species NI O F % RF % D/sq.m.
RD % A RA % IVI SDI
1 Planted Species
Saccharum narenga (Nees ex Steud.) Hack. 220 7 87.5 5.11 0.28 0.70 31.43 0.40 6.21 0.59
2 Themeda arundinacea (Roxb.) A. Camus 174 7 87.5 5.11 0.22 0.55 24.86 0.32 5.98
3 Saccharum arundinaceum Retz. 64 4 50 2.92 0.08 0.20 16.00 0.21 3.33
4 Arundo donax L. 14 1 12.5 0.73 0.02 0.04 14.00 0.18 0.95
5 Alpinia nigra (Gaertn.) Burtt 12 1 12.5 0.73 0.02 0.04 12.00 0.15 0.92
6 Natural Grass, fodder
and Sedge
Axonopus compressus (Sw.) P. Beauv. 19300 6 75 4.38 24.13 61.46 3216.67 41.40 107.24
7 Cynodon dectylon (L.) Persoon 2000 1 12.5 0.73 2.50 6.37 2000.00 25.74 32.84
8 Imperata cylindrica (L.) Raeusch. 5412 7 87.5 5.11 6.77 17.24 773.14 9.95 32.30
9 Oplismenus burmanni (Retz.) P. Beauv. 1184 3 37.5 2.19 1.48 3.77 394.67 5.08 11.04
10 Setaria palmifolia (J. Koenig) Stapf 34 1 12.5 0.73 0.04 0.11 34.00 0.44 1.28
11 Cyperus sp 24 1 12.5 0.73 0.03 0.08 24.00 0.31 1.12
12 Eleusine indica (L.) Gaertn. 22 1 12.5 0.73 0.03 0.07 22.00 0.28 1.08
13 Kyllinga nemoralis (J.R. Forst. & G. Forst.) Dandy ex Hutch. & Dalziel
12 1 12.5 0.73 0.02 0.04 12.00 0.15 0.92
14 harmful Weeds
Mikania micrantha Kunth 322 7 87.5 5.11 0.40 1.03 46.00 0.59 6.73
15 Cyclosorus sp 400 2 25 1.46 0.50 1.27 200.00 2.57 5.31
16 Chromolaena odorata (L.) R.M. King & H. Rob. 245 5 62.5 3.65 0.31 0.78 49.00 0.63 5.06
17 Clerodendrum infortunatum L. 150 5 62.5 3.65 0.19 0.48 30.00 0.39 4.51
18 Stephania hernandiifolia (Willd.) Walp. 87 5 62.5 3.65 0.11 0.28 17.40 0.22 4.15
19 Ageratum conyzoides (L.) L. 124 3 37.5 2.19 0.16 0.39 41.33 0.53 3.12
20 Triumfetta rhomboidea Jacq. 68 3 37.5 2.19 0.09 0.22 22.67 0.29 2.70
21 Leea asiatica (L.) Ridsdale 90 2 25 1.46 0.11 0.29 45.00 0.58 2.33
22 Lantana camara L. 68 2 25 1.46 0.09 0.22 34.00 0.44 2.11
23 Tetrastigma bracteolatum (Wall.) Planch. 47 2 25 1.46 0.06 0.15 23.50 0.30 1.91
24 Mimosa pudica L. 35 2 25 1.46 0.04 0.11 17.50 0.23 1.80
25 Ziziphus jujuba Mill. 10 2 25 1.46 0.01 0.03 5.00 0.06 1.56
26 Natsiatum herpeticum Buch. -Ham. ex Arn. 45 1 12.5 0.73 0.06 0.14 45.00 0.58 1.45
27 Porana paniculata Roxb. 8 1 12.5 0.73 0.01 0.03 8.00 0.10 0.86
28 Solanum torvum Sw. 5 1 12.5 0.73 0.01 0.02 5.00 0.06 0.81
29 Dregea volubilis (L.f.) Benth. ex Hook.f. 3 1 12.5 0.73 0.00 0.01 3.00 0.04 0.78
30 Other Species
Ichnocarpus frutescens (L.) W.T. Aiton 194 6 75 4.38 0.24 0.62 32.33 0.42 5.41
31 Dryopteris sparsa (D. Don) Kuntze 392 3 37.5 2.19 0.49 1.25 130.67 1.68 5.12
32 Mallotus polycarpus (Benth.) Kulju & Welzen 19 4 50 2.92 0.02 0.06 4.75 0.06 3.04
33 Boehmeria sp 112 3 37.5 2.19 0.14 0.36 37.33 0.48 3.03
34 Bombax ceiba L. 15 4 50 2.92 0.02 0.05 3.75 0.05 3.02
35 Sida rhombifolia L. 47 3 37.5 2.19 0.06 0.15 15.67 0.20 2.54
36 Acmella paniculata (Wall. ex DC.) R.K. Jansen 68 2 25 1.46 0.09 0.22 34.00 0.44 2.11
37 Diplazium esculentum (Retz.) Sw. 82 1 12.5 0.73 0.10 0.26 82.00 1.06 2.05
38 Coffea benghalensis B. Heyne ex Schult. 72 1 12.5 0.73 0.09 0.23 72.00 0.93 1.89
39 Desmodium laxiflorum DC. 20 2 25 1.46 0.03 0.06 10.00 0.13 1.65
40 Premna bengalensis C.B. Clarke 16 2 25 1.46 0.02 0.05 8.00 0.10 1.61
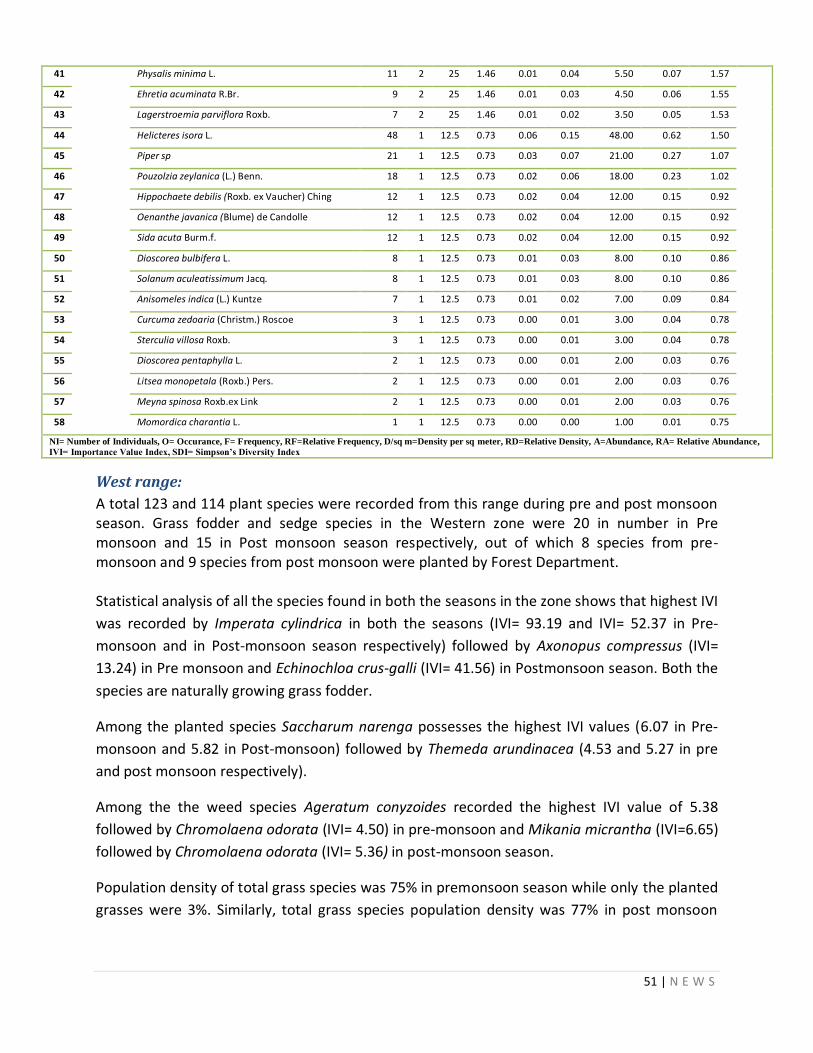
51 | N E W S
41 Physalis minima L. 11 2 25 1.46 0.01 0.04 5.50 0.07 1.57
42 Ehretia acuminata R.Br. 9 2 25 1.46 0.01 0.03 4.50 0.06 1.55
43 Lagerstroemia parviflora Roxb. 7 2 25 1.46 0.01 0.02 3.50 0.05 1.53
44 Helicteres isora L. 48 1 12.5 0.73 0.06 0.15 48.00 0.62 1.50
45 Piper sp 21 1 12.5 0.73 0.03 0.07 21.00 0.27 1.07
46 Pouzolzia zeylanica (L.) Benn. 18 1 12.5 0.73 0.02 0.06 18.00 0.23 1.02
47 Hippochaete debilis (Roxb. ex Vaucher) Ching 12 1 12.5 0.73 0.02 0.04 12.00 0.15 0.92
48 Oenanthe javanica (Blume) de Candolle 12 1 12.5 0.73 0.02 0.04 12.00 0.15 0.92
49 Sida acuta Burm.f. 12 1 12.5 0.73 0.02 0.04 12.00 0.15 0.92
50 Dioscorea bulbifera L. 8 1 12.5 0.73 0.01 0.03 8.00 0.10 0.86
51 Solanum aculeatissimum Jacq. 8 1 12.5 0.73 0.01 0.03 8.00 0.10 0.86
52 Anisomeles indica (L.) Kuntze 7 1 12.5 0.73 0.01 0.02 7.00 0.09 0.84
53 Curcuma zedoaria (Christm.) Roscoe 3 1 12.5 0.73 0.00 0.01 3.00 0.04 0.78
54 Sterculia villosa Roxb. 3 1 12.5 0.73 0.00 0.01 3.00 0.04 0.78
55 Dioscorea pentaphylla L. 2 1 12.5 0.73 0.00 0.01 2.00 0.03 0.76
56 Litsea monopetala (Roxb.) Pers. 2 1 12.5 0.73 0.00 0.01 2.00 0.03 0.76
57 Meyna spinosa Roxb.ex Link 2 1 12.5 0.73 0.00 0.01 2.00 0.03 0.76
58 Momordica charantia L. 1 1 12.5 0.73 0.00 0.00 1.00 0.01 0.75
NI= Number of Individuals, O= Occurance, F= Frequency, RF=Relative Frequency, D/sq m=Density per sq meter, RD=Relative Density, A=Abundance, RA= Relative Abundance,
IVI= Importance Value Index, SDI= Simpson’s Diversity Index
West range:
A total 123 and 114 plant species were recorded from this range during pre and post monsoon season. Grass fodder and sedge species in the Western zone were 20 in number in Pre monsoon and 15 in Post monsoon season respectively, out of which 8 species from pre-monsoon and 9 species from post monsoon were planted by Forest Department. Statistical analysis of all the species found in both the seasons in the zone shows that highest IVI
was recorded by Imperata cylindrica in both the seasons (IVI= 93.19 and IVI= 52.37 in Pre-
monsoon and in Post-monsoon season respectively) followed by Axonopus compressus (IVI=
13.24) in Pre monsoon and Echinochloa crus-galli (IVI= 41.56) in Postmonsoon season. Both the
species are naturally growing grass fodder.
Among the planted species Saccharum narenga possesses the highest IVI values (6.07 in Pre-
monsoon and 5.82 in Post-monsoon) followed by Themeda arundinacea (4.53 and 5.27 in pre
and post monsoon respectively).
Among the the weed species Ageratum conyzoides recorded the highest IVI value of 5.38
followed by Chromolaena odorata (IVI= 4.50) in pre-monsoon and Mikania micrantha (IVI=6.65)
followed by Chromolaena odorata (IVI= 5.36) in post-monsoon season.
Population density of total grass species was 75% in premonsoon season while only the planted
grasses were 3%. Similarly, total grass species population density was 77% in post monsoon

52 | N E W S
season but only the planted species was 2%. Population density of weeds was 8% and 7% in pre
monsoon and post monsoon period respectively.
Simpson Diversity Index for Species diversity was calculated to be 0.71 in pre-monsoon and 0.83 in post monsoon for all plant species found in West Range of Jaldapara NP.
Table 12: Statistical analysis of all plant species recorded in pre monsoon season West Range
Sl. No.
Species NI O F % RF % D/sq.m.
RD % A RA % IVI SDI
1 Planted Species
Saccharum narenga (Nees ex Steud.) Hack. 760 22 95.65 4.14 0.33 1.48 34.55 0.45 6.07 0.71
2 Themeda arundinacea (Roxb.) A. Camus 551 16 69.57 3.01 0.24 1.07 34.44 0.45 4.53
3 Alpinia nigra (Gaertn.) Burtt 89 2 8.70 0.38 0.04 0.17 44.50 0.58 1.13
4 Cymbopogon flexuosus (Nees ex Steud.) W. Watson
65 3 13.04 0.56 0.03 0.13 21.67 0.28 0.98
5 Saccharum longisetosum (Andersson) V. Naray. ex Bor
14 3 13.04 0.56 0.01 0.03 4.67 0.06 0.65
6 Bambusa sp 16 1 4.35 0.19 0.01 0.03 16.00 0.21 0.43
7 Typha elephantina Roxb. 5 1 4.35 0.19 0.00 0.01 5.00 0.07 0.26
8 Natural Grass, fodder
and Sedge
Imperata cylindrica (L.) Raeusch. 26833 9 39.13 1.69 11.67 52.34 2981.44 39.15 93.19
9 Axonopus compressus (Sw.) P. Beauv. 3607 12 52.17 2.26 1.57 7.04 300.58 3.95 13.24
10 Oplismenus burmanni (Retz.) P. Beauv. 2577 12 52.17 2.26 1.12 5.03 214.75 2.82 10.10
11 Saccharum spontaneum L. 1833 7 30.43 1.32 0.80 3.58 261.86 3.44 8.33
12 Cynodon dectylon (L.) Persoon 530 2 8.70 0.38 0.23 1.03 265.00 3.48 4.89
13 Echinochloa crus-galli (L.) P. Beauv 407 3 13.04 0.56 0.18 0.79 135.67 1.78 3.14
14 Thysanolaena latifolia (Roxb. ex Hornem.) Honda
306 2 8.70 0.38 0.13 0.60 153.00 2.01 2.98
15 Kyllinga nemoralis (J.R. Forst. & G. Forst.) Dandy ex Hutch. & Dalziel
350 6 26.09 1.13 0.15 0.68 58.33 0.77 2.58
16 Setaria palmifolia (J. Koenig) Stapf 312 6 26.09 1.13 0.14 0.61 52.00 0.68 2.42
17 Cyperus sp 162 6 26.09 1.13 0.07 0.32 27.00 0.35 1.80
18 Coix lacryma-jobi L. 65 1 4.35 0.19 0.03 0.13 65.00 0.85 1.17
19 Bulbostylis densa (Wallich) Handle-Mazzetti ex Karsten & Schenck
25 1 4.35 0.19 0.01 0.05 25.00 0.33 0.57
20 Digitaria ciliaris (Retz.) Koeler 4 1 4.35 0.19 0.00 0.01 4.00 0.05 0.25
21 harmful Weeds
Ageratum conyzoides (L.) L. 1081 9 39.13 1.69 0.47 2.11 120.11 1.58 5.38
22 Chromolaena odorata (L.) R.M. King & H. Rob. 538 16 69.57 3.01 0.23 1.05 33.63 0.44 4.50
23 Leea asiatica (L.) Ridsdale 413 15 65.22 2.82 0.18 0.81 27.53 0.36 3.99
24 Mikania micrantha Kunth 447 14 60.87 2.63 0.19 0.87 31.93 0.42 3.92
25 Clerodendrum infortunatum L. 328 11 47.83 2.07 0.14 0.64 29.82 0.39 3.10
26 Triumfetta rhomboidea Jacq. 109 11 47.83 2.07 0.05 0.21 9.91 0.13 2.41
27 Stephania hernandiifolia (Willd.) Walp. 255 6 26.09 1.13 0.11 0.50 42.50 0.56 2.18
28 Mimosa pudica L. 118 9 39.13 1.69 0.05 0.23 13.11 0.17 2.09
29 Deeringia amaranthoides (Lam.) Merr. 68 9 39.13 1.69 0.03 0.13 7.56 0.10 1.92
30 Ipomoea hederifolia L. 104 4 17.39 0.75 0.05 0.20 26.00 0.34 1.30
31 Ziziphus jujuba Mill. 47 5 21.74 0.94 0.02 0.09 9.40 0.12 1.15
32 Lantana camara L. 54 4 17.39 0.75 0.02 0.11 13.50 0.18 1.03
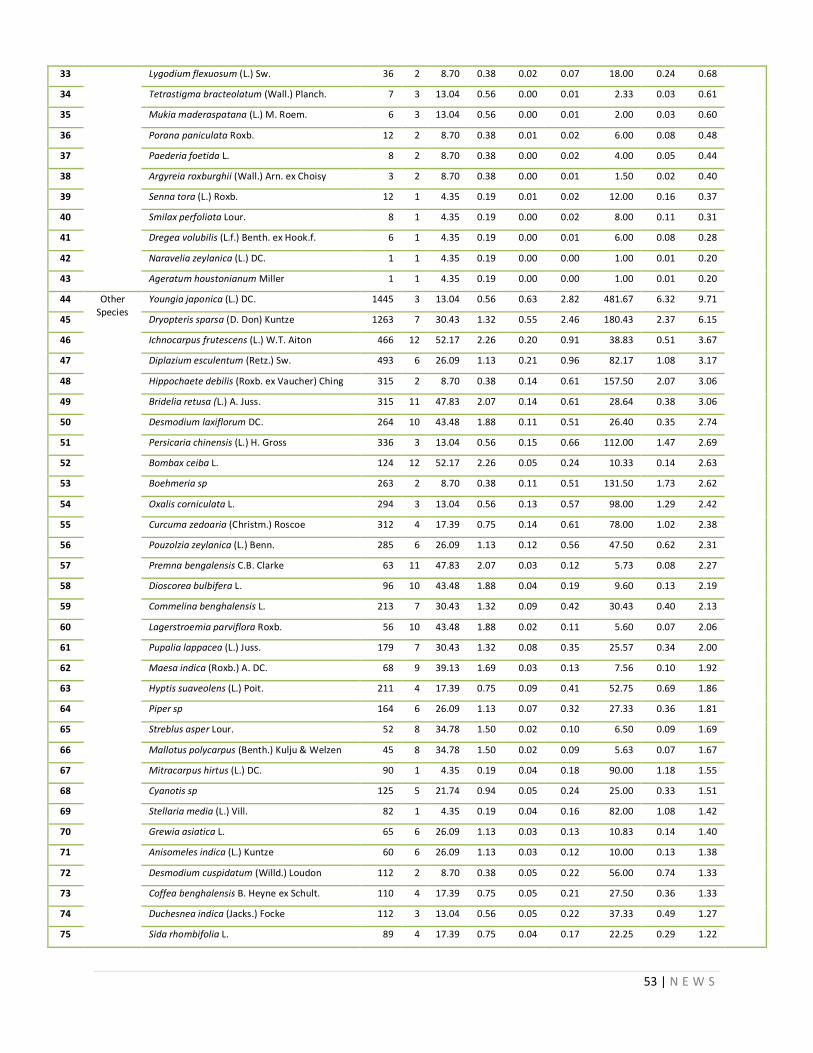
53 | N E W S
33 Lygodium flexuosum (L.) Sw. 36 2 8.70 0.38 0.02 0.07 18.00 0.24 0.68
34 Tetrastigma bracteolatum (Wall.) Planch. 7 3 13.04 0.56 0.00 0.01 2.33 0.03 0.61
35 Mukia maderaspatana (L.) M. Roem. 6 3 13.04 0.56 0.00 0.01 2.00 0.03 0.60
36 Porana paniculata Roxb. 12 2 8.70 0.38 0.01 0.02 6.00 0.08 0.48
37 Paederia foetida L. 8 2 8.70 0.38 0.00 0.02 4.00 0.05 0.44
38 Argyreia roxburghii (Wall.) Arn. ex Choisy 3 2 8.70 0.38 0.00 0.01 1.50 0.02 0.40
39 Senna tora (L.) Roxb. 12 1 4.35 0.19 0.01 0.02 12.00 0.16 0.37
40 Smilax perfoliata Lour. 8 1 4.35 0.19 0.00 0.02 8.00 0.11 0.31
41 Dregea volubilis (L.f.) Benth. ex Hook.f. 6 1 4.35 0.19 0.00 0.01 6.00 0.08 0.28
42 Naravelia zeylanica (L.) DC. 1 1 4.35 0.19 0.00 0.00 1.00 0.01 0.20
43 Ageratum houstonianum Miller 1 1 4.35 0.19 0.00 0.00 1.00 0.01 0.20
44 Other Species
Youngia japonica (L.) DC. 1445 3 13.04 0.56 0.63 2.82 481.67 6.32 9.71
45 Dryopteris sparsa (D. Don) Kuntze 1263 7 30.43 1.32 0.55 2.46 180.43 2.37 6.15
46 Ichnocarpus frutescens (L.) W.T. Aiton 466 12 52.17 2.26 0.20 0.91 38.83 0.51 3.67
47 Diplazium esculentum (Retz.) Sw. 493 6 26.09 1.13 0.21 0.96 82.17 1.08 3.17
48 Hippochaete debilis (Roxb. ex Vaucher) Ching 315 2 8.70 0.38 0.14 0.61 157.50 2.07 3.06
49 Bridelia retusa (L.) A. Juss. 315 11 47.83 2.07 0.14 0.61 28.64 0.38 3.06
50 Desmodium laxiflorum DC. 264 10 43.48 1.88 0.11 0.51 26.40 0.35 2.74
51 Persicaria chinensis (L.) H. Gross 336 3 13.04 0.56 0.15 0.66 112.00 1.47 2.69
52 Bombax ceiba L. 124 12 52.17 2.26 0.05 0.24 10.33 0.14 2.63
53 Boehmeria sp 263 2 8.70 0.38 0.11 0.51 131.50 1.73 2.62
54 Oxalis corniculata L. 294 3 13.04 0.56 0.13 0.57 98.00 1.29 2.42
55 Curcuma zedoaria (Christm.) Roscoe 312 4 17.39 0.75 0.14 0.61 78.00 1.02 2.38
56 Pouzolzia zeylanica (L.) Benn. 285 6 26.09 1.13 0.12 0.56 47.50 0.62 2.31
57 Premna bengalensis C.B. Clarke 63 11 47.83 2.07 0.03 0.12 5.73 0.08 2.27
58 Dioscorea bulbifera L. 96 10 43.48 1.88 0.04 0.19 9.60 0.13 2.19
59 Commelina benghalensis L. 213 7 30.43 1.32 0.09 0.42 30.43 0.40 2.13
60 Lagerstroemia parviflora Roxb. 56 10 43.48 1.88 0.02 0.11 5.60 0.07 2.06
61 Pupalia lappacea (L.) Juss. 179 7 30.43 1.32 0.08 0.35 25.57 0.34 2.00
62 Maesa indica (Roxb.) A. DC. 68 9 39.13 1.69 0.03 0.13 7.56 0.10 1.92
63 Hyptis suaveolens (L.) Poit. 211 4 17.39 0.75 0.09 0.41 52.75 0.69 1.86
64 Piper sp 164 6 26.09 1.13 0.07 0.32 27.33 0.36 1.81
65 Streblus asper Lour. 52 8 34.78 1.50 0.02 0.10 6.50 0.09 1.69
66 Mallotus polycarpus (Benth.) Kulju & Welzen 45 8 34.78 1.50 0.02 0.09 5.63 0.07 1.67
67 Mitracarpus hirtus (L.) DC. 90 1 4.35 0.19 0.04 0.18 90.00 1.18 1.55
68 Cyanotis sp 125 5 21.74 0.94 0.05 0.24 25.00 0.33 1.51
69 Stellaria media (L.) Vill. 82 1 4.35 0.19 0.04 0.16 82.00 1.08 1.42
70 Grewia asiatica L. 65 6 26.09 1.13 0.03 0.13 10.83 0.14 1.40
71 Anisomeles indica (L.) Kuntze 60 6 26.09 1.13 0.03 0.12 10.00 0.13 1.38
72 Desmodium cuspidatum (Willd.) Loudon 112 2 8.70 0.38 0.05 0.22 56.00 0.74 1.33
73 Coffea benghalensis B. Heyne ex Schult. 110 4 17.39 0.75 0.05 0.21 27.50 0.36 1.33
74 Duchesnea indica (Jacks.) Focke 112 3 13.04 0.56 0.05 0.22 37.33 0.49 1.27
75 Sida rhombifolia L. 89 4 17.39 0.75 0.04 0.17 22.25 0.29 1.22
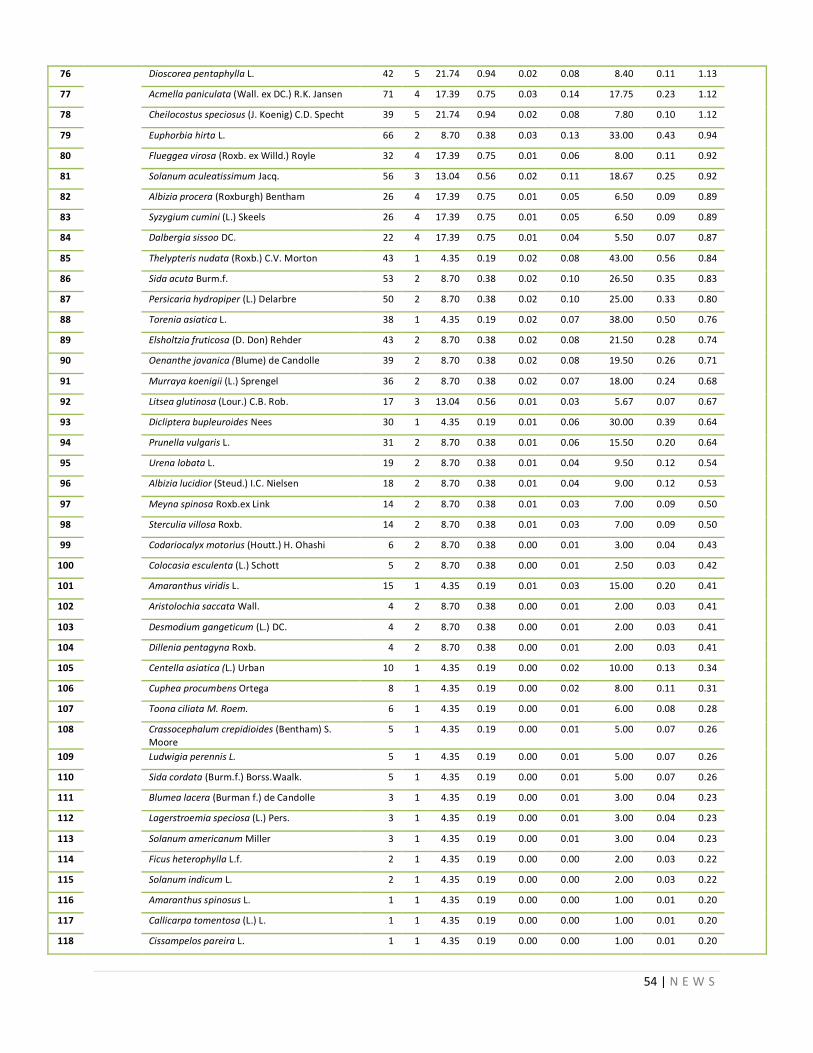
54 | N E W S
76 Dioscorea pentaphylla L. 42 5 21.74 0.94 0.02 0.08 8.40 0.11 1.13
77 Acmella paniculata (Wall. ex DC.) R.K. Jansen 71 4 17.39 0.75 0.03 0.14 17.75 0.23 1.12
78 Cheilocostus speciosus (J. Koenig) C.D. Specht 39 5 21.74 0.94 0.02 0.08 7.80 0.10 1.12
79 Euphorbia hirta L. 66 2 8.70 0.38 0.03 0.13 33.00 0.43 0.94
80 Flueggea virosa (Roxb. ex Willd.) Royle 32 4 17.39 0.75 0.01 0.06 8.00 0.11 0.92
81 Solanum aculeatissimum Jacq. 56 3 13.04 0.56 0.02 0.11 18.67 0.25 0.92
82 Albizia procera (Roxburgh) Bentham 26 4 17.39 0.75 0.01 0.05 6.50 0.09 0.89
83 Syzygium cumini (L.) Skeels 26 4 17.39 0.75 0.01 0.05 6.50 0.09 0.89
84 Dalbergia sissoo DC. 22 4 17.39 0.75 0.01 0.04 5.50 0.07 0.87
85 Thelypteris nudata (Roxb.) C.V. Morton 43 1 4.35 0.19 0.02 0.08 43.00 0.56 0.84
86 Sida acuta Burm.f. 53 2 8.70 0.38 0.02 0.10 26.50 0.35 0.83
87 Persicaria hydropiper (L.) Delarbre 50 2 8.70 0.38 0.02 0.10 25.00 0.33 0.80
88 Torenia asiatica L. 38 1 4.35 0.19 0.02 0.07 38.00 0.50 0.76
89 Elsholtzia fruticosa (D. Don) Rehder 43 2 8.70 0.38 0.02 0.08 21.50 0.28 0.74
90 Oenanthe javanica (Blume) de Candolle 39 2 8.70 0.38 0.02 0.08 19.50 0.26 0.71
91 Murraya koenigii (L.) Sprengel 36 2 8.70 0.38 0.02 0.07 18.00 0.24 0.68
92 Litsea glutinosa (Lour.) C.B. Rob. 17 3 13.04 0.56 0.01 0.03 5.67 0.07 0.67
93 Dicliptera bupleuroides Nees 30 1 4.35 0.19 0.01 0.06 30.00 0.39 0.64
94 Prunella vulgaris L. 31 2 8.70 0.38 0.01 0.06 15.50 0.20 0.64
95 Urena lobata L. 19 2 8.70 0.38 0.01 0.04 9.50 0.12 0.54
96 Albizia lucidior (Steud.) I.C. Nielsen 18 2 8.70 0.38 0.01 0.04 9.00 0.12 0.53
97 Meyna spinosa Roxb.ex Link 14 2 8.70 0.38 0.01 0.03 7.00 0.09 0.50
98 Sterculia villosa Roxb. 14 2 8.70 0.38 0.01 0.03 7.00 0.09 0.50
99 Codariocalyx motorius (Houtt.) H. Ohashi 6 2 8.70 0.38 0.00 0.01 3.00 0.04 0.43
100 Colocasia esculenta (L.) Schott 5 2 8.70 0.38 0.00 0.01 2.50 0.03 0.42
101 Amaranthus viridis L. 15 1 4.35 0.19 0.01 0.03 15.00 0.20 0.41
102 Aristolochia saccata Wall. 4 2 8.70 0.38 0.00 0.01 2.00 0.03 0.41
103 Desmodium gangeticum (L.) DC. 4 2 8.70 0.38 0.00 0.01 2.00 0.03 0.41
104 Dillenia pentagyna Roxb. 4 2 8.70 0.38 0.00 0.01 2.00 0.03 0.41
105 Centella asiatica (L.) Urban 10 1 4.35 0.19 0.00 0.02 10.00 0.13 0.34
106 Cuphea procumbens Ortega 8 1 4.35 0.19 0.00 0.02 8.00 0.11 0.31
107 Toona ciliata M. Roem. 6 1 4.35 0.19 0.00 0.01 6.00 0.08 0.28
108 Crassocephalum crepidioides (Bentham) S. Moore
5 1 4.35 0.19 0.00 0.01 5.00 0.07 0.26
109 Ludwigia perennis L. 5 1 4.35 0.19 0.00 0.01 5.00 0.07 0.26
110 Sida cordata (Burm.f.) Borss.Waalk. 5 1 4.35 0.19 0.00 0.01 5.00 0.07 0.26
111 Blumea lacera (Burman f.) de Candolle 3 1 4.35 0.19 0.00 0.01 3.00 0.04 0.23
112 Lagerstroemia speciosa (L.) Pers. 3 1 4.35 0.19 0.00 0.01 3.00 0.04 0.23
113 Solanum americanum Miller 3 1 4.35 0.19 0.00 0.01 3.00 0.04 0.23
114 Ficus heterophylla L.f. 2 1 4.35 0.19 0.00 0.00 2.00 0.03 0.22
115 Solanum indicum L. 2 1 4.35 0.19 0.00 0.00 2.00 0.03 0.22
116 Amaranthus spinosus L. 1 1 4.35 0.19 0.00 0.00 1.00 0.01 0.20
117 Callicarpa tomentosa (L.) L. 1 1 4.35 0.19 0.00 0.00 1.00 0.01 0.20
118 Cissampelos pareira L. 1 1 4.35 0.19 0.00 0.00 1.00 0.01 0.20
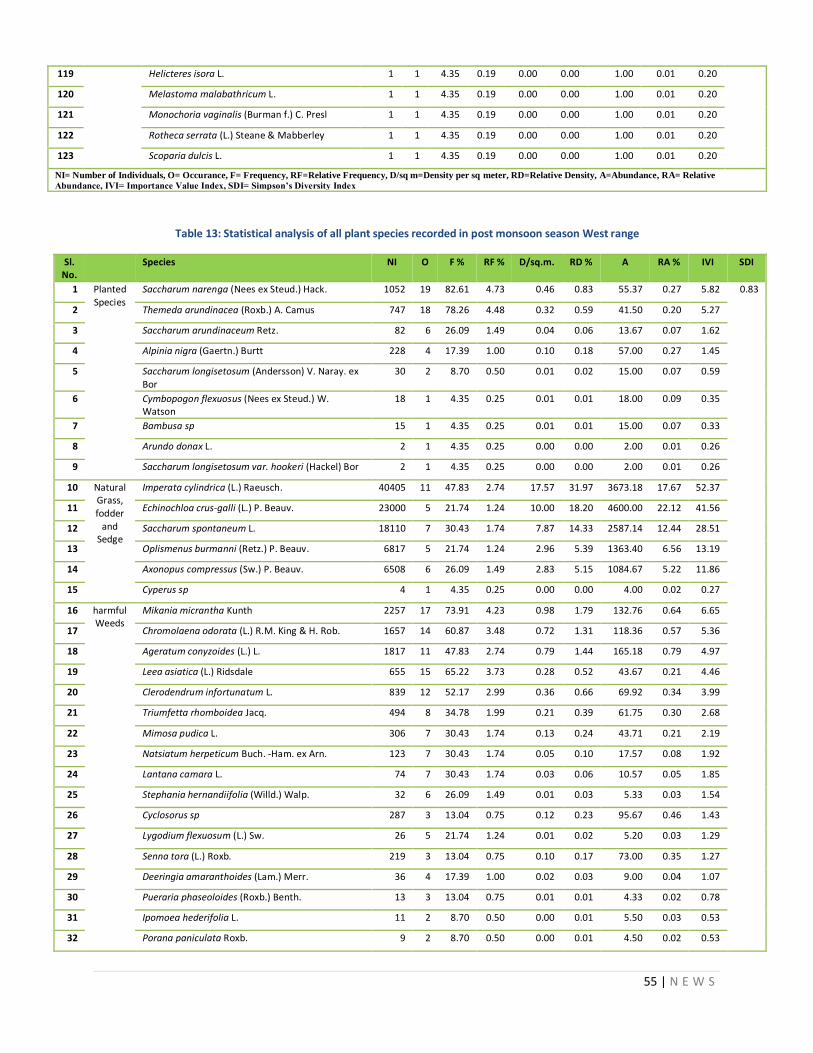
55 | N E W S
119 Helicteres isora L. 1 1 4.35 0.19 0.00 0.00 1.00 0.01 0.20
120 Melastoma malabathricum L. 1 1 4.35 0.19 0.00 0.00 1.00 0.01 0.20
121 Monochoria vaginalis (Burman f.) C. Presl 1 1 4.35 0.19 0.00 0.00 1.00 0.01 0.20
122 Rotheca serrata (L.) Steane & Mabberley 1 1 4.35 0.19 0.00 0.00 1.00 0.01 0.20
123 Scoparia dulcis L. 1 1 4.35 0.19 0.00 0.00 1.00 0.01 0.20
NI= Number of Individuals, O= Occurance, F= Frequency, RF=Relative Frequency, D/sq m=Density per sq meter, RD=Relative Density, A=Abundance, RA= Relative
Abundance, IVI= Importance Value Index, SDI= Simpson’s Diversity Index
Table 13: Statistical analysis of all plant species recorded in post monsoon season West range
Sl. No.
Species NI O F % RF % D/sq.m. RD % A RA % IVI SDI
1 Planted Species
Saccharum narenga (Nees ex Steud.) Hack. 1052 19 82.61 4.73 0.46 0.83 55.37 0.27 5.82 0.83
2 Themeda arundinacea (Roxb.) A. Camus 747 18 78.26 4.48 0.32 0.59 41.50 0.20 5.27
3 Saccharum arundinaceum Retz. 82 6 26.09 1.49 0.04 0.06 13.67 0.07 1.62
4 Alpinia nigra (Gaertn.) Burtt 228 4 17.39 1.00 0.10 0.18 57.00 0.27 1.45
5 Saccharum longisetosum (Andersson) V. Naray. ex Bor
30 2 8.70 0.50 0.01 0.02 15.00 0.07 0.59
6 Cymbopogon flexuosus (Nees ex Steud.) W. Watson
18 1 4.35 0.25 0.01 0.01 18.00 0.09 0.35
7 Bambusa sp 15 1 4.35 0.25 0.01 0.01 15.00 0.07 0.33
8 Arundo donax L. 2 1 4.35 0.25 0.00 0.00 2.00 0.01 0.26
9 Saccharum longisetosum var. hookeri (Hackel) Bor 2 1 4.35 0.25 0.00 0.00 2.00 0.01 0.26
10 Natural Grass, fodder
and Sedge
Imperata cylindrica (L.) Raeusch. 40405 11 47.83 2.74 17.57 31.97 3673.18 17.67 52.37
11 Echinochloa crus-galli (L.) P. Beauv. 23000 5 21.74 1.24 10.00 18.20 4600.00 22.12 41.56
12 Saccharum spontaneum L. 18110 7 30.43 1.74 7.87 14.33 2587.14 12.44 28.51
13 Oplismenus burmanni (Retz.) P. Beauv. 6817 5 21.74 1.24 2.96 5.39 1363.40 6.56 13.19
14 Axonopus compressus (Sw.) P. Beauv. 6508 6 26.09 1.49 2.83 5.15 1084.67 5.22 11.86
15 Cyperus sp 4 1 4.35 0.25 0.00 0.00 4.00 0.02 0.27
16 harmful Weeds
Mikania micrantha Kunth 2257 17 73.91 4.23 0.98 1.79 132.76 0.64 6.65
17 Chromolaena odorata (L.) R.M. King & H. Rob. 1657 14 60.87 3.48 0.72 1.31 118.36 0.57 5.36
18 Ageratum conyzoides (L.) L. 1817 11 47.83 2.74 0.79 1.44 165.18 0.79 4.97
19 Leea asiatica (L.) Ridsdale 655 15 65.22 3.73 0.28 0.52 43.67 0.21 4.46
20 Clerodendrum infortunatum L. 839 12 52.17 2.99 0.36 0.66 69.92 0.34 3.99
21 Triumfetta rhomboidea Jacq. 494 8 34.78 1.99 0.21 0.39 61.75 0.30 2.68
22 Mimosa pudica L. 306 7 30.43 1.74 0.13 0.24 43.71 0.21 2.19
23 Natsiatum herpeticum Buch. -Ham. ex Arn. 123 7 30.43 1.74 0.05 0.10 17.57 0.08 1.92
24 Lantana camara L. 74 7 30.43 1.74 0.03 0.06 10.57 0.05 1.85
25 Stephania hernandiifolia (Willd.) Walp. 32 6 26.09 1.49 0.01 0.03 5.33 0.03 1.54
26 Cyclosorus sp 287 3 13.04 0.75 0.12 0.23 95.67 0.46 1.43
27 Lygodium flexuosum (L.) Sw. 26 5 21.74 1.24 0.01 0.02 5.20 0.03 1.29
28 Senna tora (L.) Roxb. 219 3 13.04 0.75 0.10 0.17 73.00 0.35 1.27
29 Deeringia amaranthoides (Lam.) Merr. 36 4 17.39 1.00 0.02 0.03 9.00 0.04 1.07
30 Pueraria phaseoloides (Roxb.) Benth. 13 3 13.04 0.75 0.01 0.01 4.33 0.02 0.78
31 Ipomoea hederifolia L. 11 2 8.70 0.50 0.00 0.01 5.50 0.03 0.53
32 Porana paniculata Roxb. 9 2 8.70 0.50 0.00 0.01 4.50 0.02 0.53
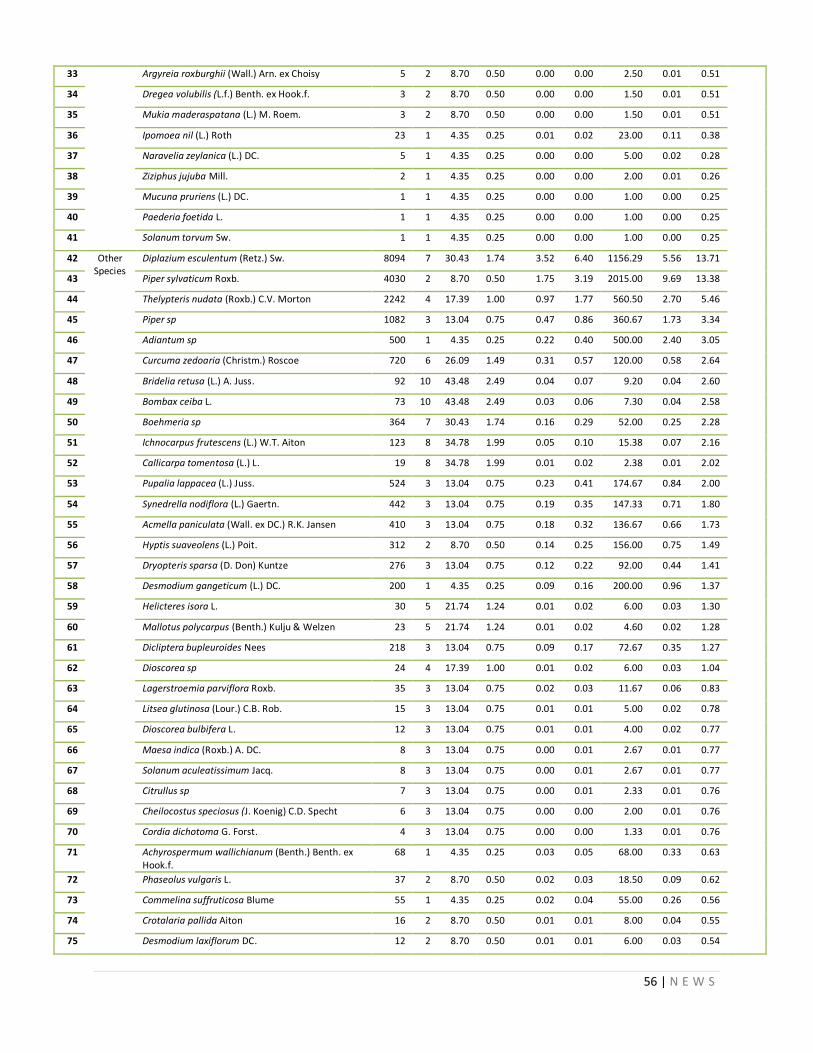
56 | N E W S
33 Argyreia roxburghii (Wall.) Arn. ex Choisy 5 2 8.70 0.50 0.00 0.00 2.50 0.01 0.51
34 Dregea volubilis (L.f.) Benth. ex Hook.f. 3 2 8.70 0.50 0.00 0.00 1.50 0.01 0.51
35 Mukia maderaspatana (L.) M. Roem. 3 2 8.70 0.50 0.00 0.00 1.50 0.01 0.51
36 Ipomoea nil (L.) Roth 23 1 4.35 0.25 0.01 0.02 23.00 0.11 0.38
37 Naravelia zeylanica (L.) DC. 5 1 4.35 0.25 0.00 0.00 5.00 0.02 0.28
38 Ziziphus jujuba Mill. 2 1 4.35 0.25 0.00 0.00 2.00 0.01 0.26
39 Mucuna pruriens (L.) DC. 1 1 4.35 0.25 0.00 0.00 1.00 0.00 0.25
40 Paederia foetida L. 1 1 4.35 0.25 0.00 0.00 1.00 0.00 0.25
41 Solanum torvum Sw. 1 1 4.35 0.25 0.00 0.00 1.00 0.00 0.25
42 Other Species
Diplazium esculentum (Retz.) Sw. 8094 7 30.43 1.74 3.52 6.40 1156.29 5.56 13.71
43 Piper sylvaticum Roxb. 4030 2 8.70 0.50 1.75 3.19 2015.00 9.69 13.38
44 Thelypteris nudata (Roxb.) C.V. Morton 2242 4 17.39 1.00 0.97 1.77 560.50 2.70 5.46
45 Piper sp 1082 3 13.04 0.75 0.47 0.86 360.67 1.73 3.34
46 Adiantum sp 500 1 4.35 0.25 0.22 0.40 500.00 2.40 3.05
47 Curcuma zedoaria (Christm.) Roscoe 720 6 26.09 1.49 0.31 0.57 120.00 0.58 2.64
48 Bridelia retusa (L.) A. Juss. 92 10 43.48 2.49 0.04 0.07 9.20 0.04 2.60
49 Bombax ceiba L. 73 10 43.48 2.49 0.03 0.06 7.30 0.04 2.58
50 Boehmeria sp 364 7 30.43 1.74 0.16 0.29 52.00 0.25 2.28
51 Ichnocarpus frutescens (L.) W.T. Aiton 123 8 34.78 1.99 0.05 0.10 15.38 0.07 2.16
52 Callicarpa tomentosa (L.) L. 19 8 34.78 1.99 0.01 0.02 2.38 0.01 2.02
53 Pupalia lappacea (L.) Juss. 524 3 13.04 0.75 0.23 0.41 174.67 0.84 2.00
54 Synedrella nodiflora (L.) Gaertn. 442 3 13.04 0.75 0.19 0.35 147.33 0.71 1.80
55 Acmella paniculata (Wall. ex DC.) R.K. Jansen 410 3 13.04 0.75 0.18 0.32 136.67 0.66 1.73
56 Hyptis suaveolens (L.) Poit. 312 2 8.70 0.50 0.14 0.25 156.00 0.75 1.49
57 Dryopteris sparsa (D. Don) Kuntze 276 3 13.04 0.75 0.12 0.22 92.00 0.44 1.41
58 Desmodium gangeticum (L.) DC. 200 1 4.35 0.25 0.09 0.16 200.00 0.96 1.37
59 Helicteres isora L. 30 5 21.74 1.24 0.01 0.02 6.00 0.03 1.30
60 Mallotus polycarpus (Benth.) Kulju & Welzen 23 5 21.74 1.24 0.01 0.02 4.60 0.02 1.28
61 Dicliptera bupleuroides Nees 218 3 13.04 0.75 0.09 0.17 72.67 0.35 1.27
62 Dioscorea sp 24 4 17.39 1.00 0.01 0.02 6.00 0.03 1.04
63 Lagerstroemia parviflora Roxb. 35 3 13.04 0.75 0.02 0.03 11.67 0.06 0.83
64 Litsea glutinosa (Lour.) C.B. Rob. 15 3 13.04 0.75 0.01 0.01 5.00 0.02 0.78
65 Dioscorea bulbifera L. 12 3 13.04 0.75 0.01 0.01 4.00 0.02 0.77
66 Maesa indica (Roxb.) A. DC. 8 3 13.04 0.75 0.00 0.01 2.67 0.01 0.77
67 Solanum aculeatissimum Jacq. 8 3 13.04 0.75 0.00 0.01 2.67 0.01 0.77
68 Citrullus sp 7 3 13.04 0.75 0.00 0.01 2.33 0.01 0.76
69 Cheilocostus speciosus (J. Koenig) C.D. Specht 6 3 13.04 0.75 0.00 0.00 2.00 0.01 0.76
70 Cordia dichotoma G. Forst. 4 3 13.04 0.75 0.00 0.00 1.33 0.01 0.76
71 Achyrospermum wallichianum (Benth.) Benth. ex Hook.f.
68 1 4.35 0.25 0.03 0.05 68.00 0.33 0.63
72 Phaseolus vulgaris L. 37 2 8.70 0.50 0.02 0.03 18.50 0.09 0.62
73 Commelina suffruticosa Blume 55 1 4.35 0.25 0.02 0.04 55.00 0.26 0.56
74 Crotalaria pallida Aiton 16 2 8.70 0.50 0.01 0.01 8.00 0.04 0.55
75 Desmodium laxiflorum DC. 12 2 8.70 0.50 0.01 0.01 6.00 0.03 0.54
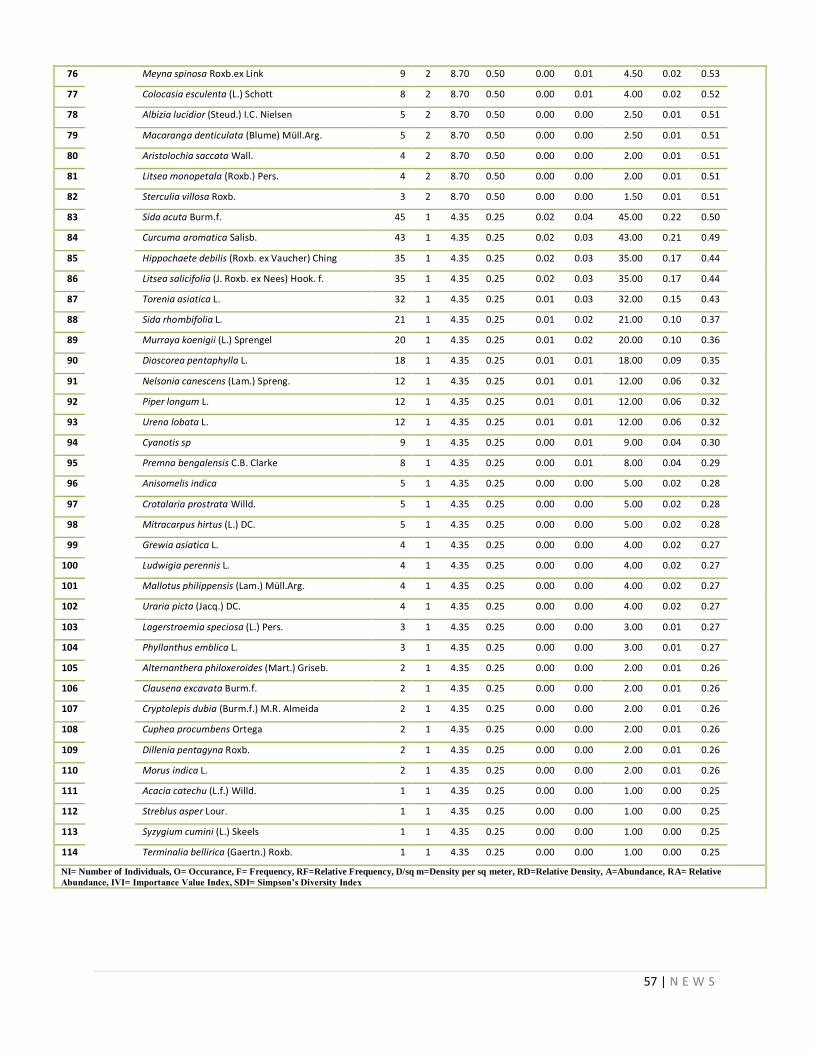
57 | N E W S
76 Meyna spinosa Roxb.ex Link 9 2 8.70 0.50 0.00 0.01 4.50 0.02 0.53
77 Colocasia esculenta (L.) Schott 8 2 8.70 0.50 0.00 0.01 4.00 0.02 0.52
78 Albizia lucidior (Steud.) I.C. Nielsen 5 2 8.70 0.50 0.00 0.00 2.50 0.01 0.51
79 Macaranga denticulata (Blume) Müll.Arg. 5 2 8.70 0.50 0.00 0.00 2.50 0.01 0.51
80 Aristolochia saccata Wall. 4 2 8.70 0.50 0.00 0.00 2.00 0.01 0.51
81 Litsea monopetala (Roxb.) Pers. 4 2 8.70 0.50 0.00 0.00 2.00 0.01 0.51
82 Sterculia villosa Roxb. 3 2 8.70 0.50 0.00 0.00 1.50 0.01 0.51
83 Sida acuta Burm.f. 45 1 4.35 0.25 0.02 0.04 45.00 0.22 0.50
84 Curcuma aromatica Salisb. 43 1 4.35 0.25 0.02 0.03 43.00 0.21 0.49
85 Hippochaete debilis (Roxb. ex Vaucher) Ching 35 1 4.35 0.25 0.02 0.03 35.00 0.17 0.44
86 Litsea salicifolia (J. Roxb. ex Nees) Hook. f. 35 1 4.35 0.25 0.02 0.03 35.00 0.17 0.44
87 Torenia asiatica L. 32 1 4.35 0.25 0.01 0.03 32.00 0.15 0.43
88 Sida rhombifolia L. 21 1 4.35 0.25 0.01 0.02 21.00 0.10 0.37
89 Murraya koenigii (L.) Sprengel 20 1 4.35 0.25 0.01 0.02 20.00 0.10 0.36
90 Dioscorea pentaphylla L. 18 1 4.35 0.25 0.01 0.01 18.00 0.09 0.35
91 Nelsonia canescens (Lam.) Spreng. 12 1 4.35 0.25 0.01 0.01 12.00 0.06 0.32
92 Piper longum L. 12 1 4.35 0.25 0.01 0.01 12.00 0.06 0.32
93 Urena lobata L. 12 1 4.35 0.25 0.01 0.01 12.00 0.06 0.32
94 Cyanotis sp 9 1 4.35 0.25 0.00 0.01 9.00 0.04 0.30
95 Premna bengalensis C.B. Clarke 8 1 4.35 0.25 0.00 0.01 8.00 0.04 0.29
96 Anisomelis indica 5 1 4.35 0.25 0.00 0.00 5.00 0.02 0.28
97 Crotalaria prostrata Willd. 5 1 4.35 0.25 0.00 0.00 5.00 0.02 0.28
98 Mitracarpus hirtus (L.) DC. 5 1 4.35 0.25 0.00 0.00 5.00 0.02 0.28
99 Grewia asiatica L. 4 1 4.35 0.25 0.00 0.00 4.00 0.02 0.27
100 Ludwigia perennis L. 4 1 4.35 0.25 0.00 0.00 4.00 0.02 0.27
101 Mallotus philippensis (Lam.) Müll.Arg. 4 1 4.35 0.25 0.00 0.00 4.00 0.02 0.27
102 Uraria picta (Jacq.) DC. 4 1 4.35 0.25 0.00 0.00 4.00 0.02 0.27
103 Lagerstroemia speciosa (L.) Pers. 3 1 4.35 0.25 0.00 0.00 3.00 0.01 0.27
104 Phyllanthus emblica L. 3 1 4.35 0.25 0.00 0.00 3.00 0.01 0.27
105 Alternanthera philoxeroides (Mart.) Griseb. 2 1 4.35 0.25 0.00 0.00 2.00 0.01 0.26
106 Clausena excavata Burm.f. 2 1 4.35 0.25 0.00 0.00 2.00 0.01 0.26
107 Cryptolepis dubia (Burm.f.) M.R. Almeida 2 1 4.35 0.25 0.00 0.00 2.00 0.01 0.26
108 Cuphea procumbens Ortega 2 1 4.35 0.25 0.00 0.00 2.00 0.01 0.26
109 Dillenia pentagyna Roxb. 2 1 4.35 0.25 0.00 0.00 2.00 0.01 0.26
110 Morus indica L. 2 1 4.35 0.25 0.00 0.00 2.00 0.01 0.26
111 Acacia catechu (L.f.) Willd. 1 1 4.35 0.25 0.00 0.00 1.00 0.00 0.25
112 Streblus asper Lour. 1 1 4.35 0.25 0.00 0.00 1.00 0.00 0.25
113 Syzygium cumini (L.) Skeels 1 1 4.35 0.25 0.00 0.00 1.00 0.00 0.25
114 Terminalia bellirica (Gaertn.) Roxb. 1 1 4.35 0.25 0.00 0.00 1.00 0.00 0.25
NI= Number of Individuals, O= Occurance, F= Frequency, RF=Relative Frequency, D/sq m=Density per sq meter, RD=Relative Density, A=Abundance, RA= Relative
Abundance, IVI= Importance Value Index, SDI= Simpson’s Diversity Index
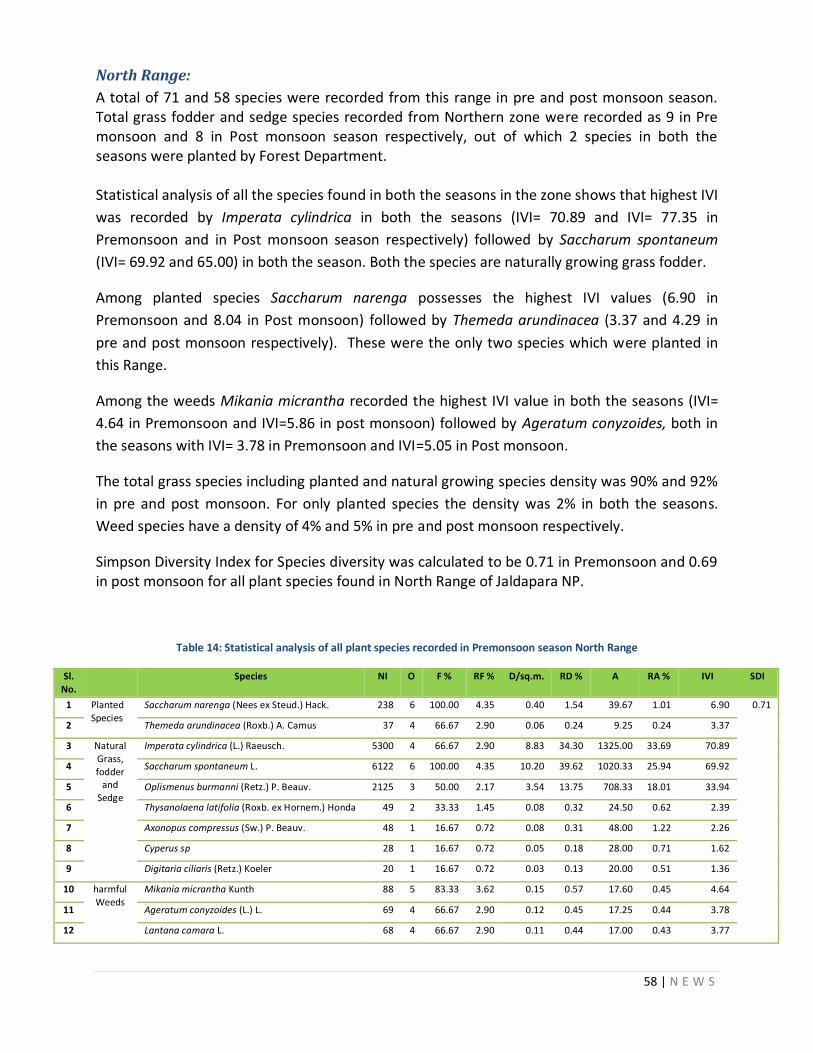
58 | N E W S
North Range:
A total of 71 and 58 species were recorded from this range in pre and post monsoon season. Total grass fodder and sedge species recorded from Northern zone were recorded as 9 in Pre monsoon and 8 in Post monsoon season respectively, out of which 2 species in both the seasons were planted by Forest Department. Statistical analysis of all the species found in both the seasons in the zone shows that highest IVI
was recorded by Imperata cylindrica in both the seasons (IVI= 70.89 and IVI= 77.35 in
Premonsoon and in Post monsoon season respectively) followed by Saccharum spontaneum
(IVI= 69.92 and 65.00) in both the season. Both the species are naturally growing grass fodder.
Among planted species Saccharum narenga possesses the highest IVI values (6.90 in
Premonsoon and 8.04 in Post monsoon) followed by Themeda arundinacea (3.37 and 4.29 in
pre and post monsoon respectively). These were the only two species which were planted in
this Range.
Among the weeds Mikania micrantha recorded the highest IVI value in both the seasons (IVI=
4.64 in Premonsoon and IVI=5.86 in post monsoon) followed by Ageratum conyzoides, both in
the seasons with IVI= 3.78 in Premonsoon and IVI=5.05 in Post monsoon.
The total grass species including planted and natural growing species density was 90% and 92%
in pre and post monsoon. For only planted species the density was 2% in both the seasons.
Weed species have a density of 4% and 5% in pre and post monsoon respectively.
Simpson Diversity Index for Species diversity was calculated to be 0.71 in Premonsoon and 0.69 in post monsoon for all plant species found in North Range of Jaldapara NP.
Table 14: Statistical analysis of all plant species recorded in Premonsoon season North Range
Sl. No.
Species NI O F % RF % D/sq.m. RD % A RA % IVI SDI
1 Planted Species
Saccharum narenga (Nees ex Steud.) Hack. 238 6 100.00 4.35 0.40 1.54 39.67 1.01 6.90 0.71
2 Themeda arundinacea (Roxb.) A. Camus 37 4 66.67 2.90 0.06 0.24 9.25 0.24 3.37
3 Natural Grass, fodder
and Sedge
Imperata cylindrica (L.) Raeusch. 5300 4 66.67 2.90 8.83 34.30 1325.00 33.69 70.89
4 Saccharum spontaneum L. 6122 6 100.00 4.35 10.20 39.62 1020.33 25.94 69.92
5 Oplismenus burmanni (Retz.) P. Beauv. 2125 3 50.00 2.17 3.54 13.75 708.33 18.01 33.94
6 Thysanolaena latifolia (Roxb. ex Hornem.) Honda 49 2 33.33 1.45 0.08 0.32 24.50 0.62 2.39
7 Axonopus compressus (Sw.) P. Beauv. 48 1 16.67 0.72 0.08 0.31 48.00 1.22 2.26
8 Cyperus sp 28 1 16.67 0.72 0.05 0.18 28.00 0.71 1.62
9 Digitaria ciliaris (Retz.) Koeler 20 1 16.67 0.72 0.03 0.13 20.00 0.51 1.36
10 harmful Weeds
Mikania micrantha Kunth 88 5 83.33 3.62 0.15 0.57 17.60 0.45 4.64
11 Ageratum conyzoides (L.) L. 69 4 66.67 2.90 0.12 0.45 17.25 0.44 3.78
12 Lantana camara L. 68 4 66.67 2.90 0.11 0.44 17.00 0.43 3.77
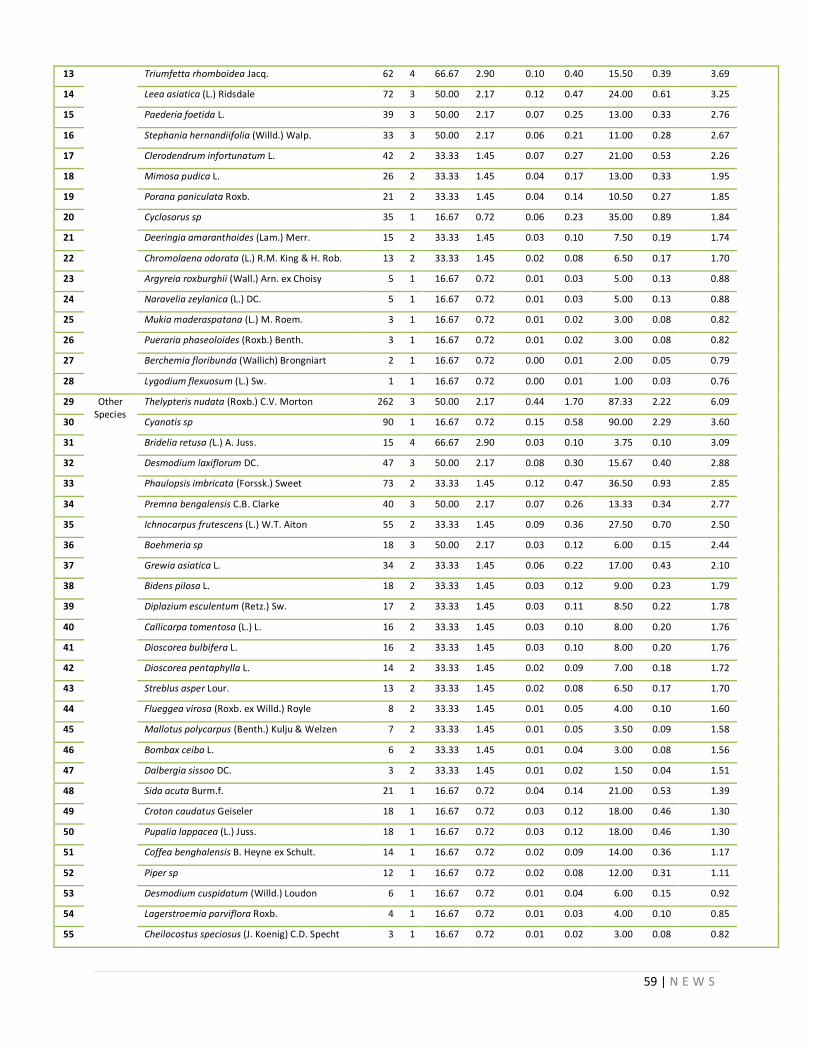
59 | N E W S
13 Triumfetta rhomboidea Jacq. 62 4 66.67 2.90 0.10 0.40 15.50 0.39 3.69
14 Leea asiatica (L.) Ridsdale 72 3 50.00 2.17 0.12 0.47 24.00 0.61 3.25
15 Paederia foetida L. 39 3 50.00 2.17 0.07 0.25 13.00 0.33 2.76
16 Stephania hernandiifolia (Willd.) Walp. 33 3 50.00 2.17 0.06 0.21 11.00 0.28 2.67
17 Clerodendrum infortunatum L. 42 2 33.33 1.45 0.07 0.27 21.00 0.53 2.26
18 Mimosa pudica L. 26 2 33.33 1.45 0.04 0.17 13.00 0.33 1.95
19 Porana paniculata Roxb. 21 2 33.33 1.45 0.04 0.14 10.50 0.27 1.85
20 Cyclosorus sp 35 1 16.67 0.72 0.06 0.23 35.00 0.89 1.84
21 Deeringia amaranthoides (Lam.) Merr. 15 2 33.33 1.45 0.03 0.10 7.50 0.19 1.74
22 Chromolaena odorata (L.) R.M. King & H. Rob. 13 2 33.33 1.45 0.02 0.08 6.50 0.17 1.70
23 Argyreia roxburghii (Wall.) Arn. ex Choisy 5 1 16.67 0.72 0.01 0.03 5.00 0.13 0.88
24 Naravelia zeylanica (L.) DC. 5 1 16.67 0.72 0.01 0.03 5.00 0.13 0.88
25 Mukia maderaspatana (L.) M. Roem. 3 1 16.67 0.72 0.01 0.02 3.00 0.08 0.82
26 Pueraria phaseoloides (Roxb.) Benth. 3 1 16.67 0.72 0.01 0.02 3.00 0.08 0.82
27 Berchemia floribunda (Wallich) Brongniart 2 1 16.67 0.72 0.00 0.01 2.00 0.05 0.79
28 Lygodium flexuosum (L.) Sw. 1 1 16.67 0.72 0.00 0.01 1.00 0.03 0.76
29 Other Species
Thelypteris nudata (Roxb.) C.V. Morton 262 3 50.00 2.17 0.44 1.70 87.33 2.22 6.09
30 Cyanotis sp 90 1 16.67 0.72 0.15 0.58 90.00 2.29 3.60
31 Bridelia retusa (L.) A. Juss. 15 4 66.67 2.90 0.03 0.10 3.75 0.10 3.09
32 Desmodium laxiflorum DC. 47 3 50.00 2.17 0.08 0.30 15.67 0.40 2.88
33 Phaulopsis imbricata (Forssk.) Sweet 73 2 33.33 1.45 0.12 0.47 36.50 0.93 2.85
34 Premna bengalensis C.B. Clarke 40 3 50.00 2.17 0.07 0.26 13.33 0.34 2.77
35 Ichnocarpus frutescens (L.) W.T. Aiton 55 2 33.33 1.45 0.09 0.36 27.50 0.70 2.50
36 Boehmeria sp 18 3 50.00 2.17 0.03 0.12 6.00 0.15 2.44
37 Grewia asiatica L. 34 2 33.33 1.45 0.06 0.22 17.00 0.43 2.10
38 Bidens pilosa L. 18 2 33.33 1.45 0.03 0.12 9.00 0.23 1.79
39 Diplazium esculentum (Retz.) Sw. 17 2 33.33 1.45 0.03 0.11 8.50 0.22 1.78
40 Callicarpa tomentosa (L.) L. 16 2 33.33 1.45 0.03 0.10 8.00 0.20 1.76
41 Dioscorea bulbifera L. 16 2 33.33 1.45 0.03 0.10 8.00 0.20 1.76
42 Dioscorea pentaphylla L. 14 2 33.33 1.45 0.02 0.09 7.00 0.18 1.72
43 Streblus asper Lour. 13 2 33.33 1.45 0.02 0.08 6.50 0.17 1.70
44 Flueggea virosa (Roxb. ex Willd.) Royle 8 2 33.33 1.45 0.01 0.05 4.00 0.10 1.60
45 Mallotus polycarpus (Benth.) Kulju & Welzen 7 2 33.33 1.45 0.01 0.05 3.50 0.09 1.58
46 Bombax ceiba L. 6 2 33.33 1.45 0.01 0.04 3.00 0.08 1.56
47 Dalbergia sissoo DC. 3 2 33.33 1.45 0.01 0.02 1.50 0.04 1.51
48 Sida acuta Burm.f. 21 1 16.67 0.72 0.04 0.14 21.00 0.53 1.39
49 Croton caudatus Geiseler 18 1 16.67 0.72 0.03 0.12 18.00 0.46 1.30
50 Pupalia lappacea (L.) Juss. 18 1 16.67 0.72 0.03 0.12 18.00 0.46 1.30
51 Coffea benghalensis B. Heyne ex Schult. 14 1 16.67 0.72 0.02 0.09 14.00 0.36 1.17
52 Piper sp 12 1 16.67 0.72 0.02 0.08 12.00 0.31 1.11
53 Desmodium cuspidatum (Willd.) Loudon 6 1 16.67 0.72 0.01 0.04 6.00 0.15 0.92
54 Lagerstroemia parviflora Roxb. 4 1 16.67 0.72 0.01 0.03 4.00 0.10 0.85
55 Cheilocostus speciosus (J. Koenig) C.D. Specht 3 1 16.67 0.72 0.01 0.02 3.00 0.08 0.82
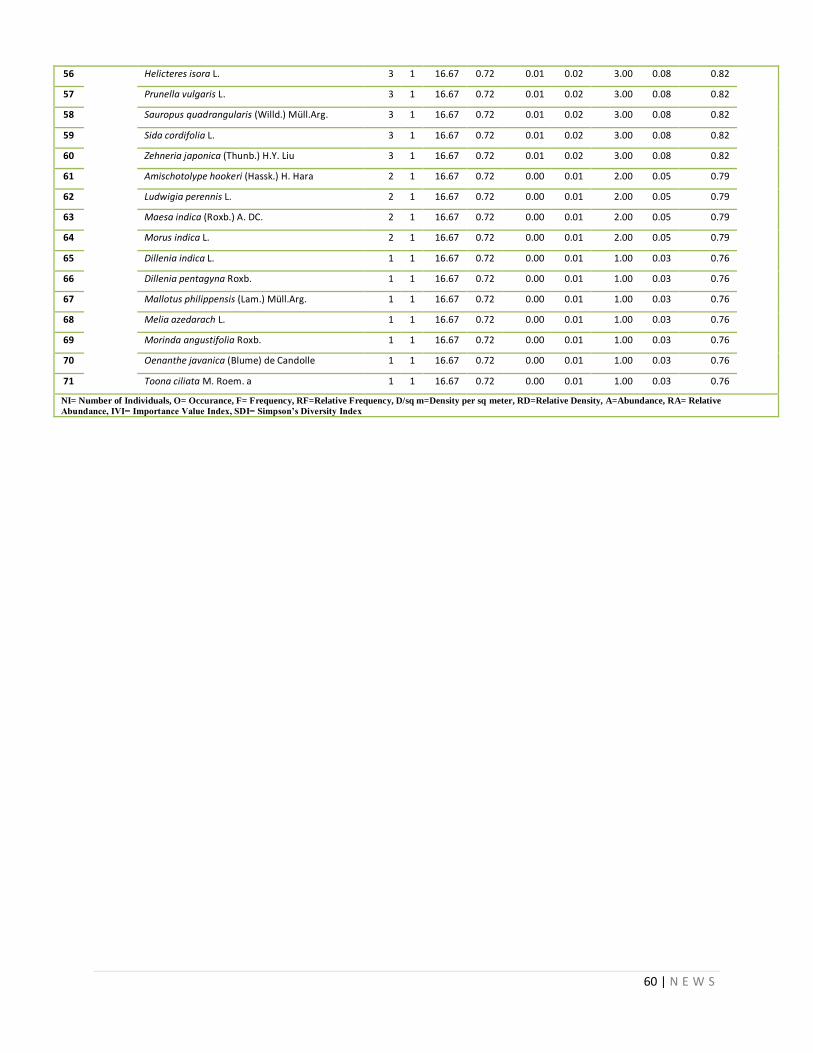
60 | N E W S
56 Helicteres isora L. 3 1 16.67 0.72 0.01 0.02 3.00 0.08 0.82
57 Prunella vulgaris L. 3 1 16.67 0.72 0.01 0.02 3.00 0.08 0.82
58 Sauropus quadrangularis (Willd.) Müll.Arg. 3 1 16.67 0.72 0.01 0.02 3.00 0.08 0.82
59 Sida cordifolia L. 3 1 16.67 0.72 0.01 0.02 3.00 0.08 0.82
60 Zehneria japonica (Thunb.) H.Y. Liu 3 1 16.67 0.72 0.01 0.02 3.00 0.08 0.82
61 Amischotolype hookeri (Hassk.) H. Hara 2 1 16.67 0.72 0.00 0.01 2.00 0.05 0.79
62 Ludwigia perennis L. 2 1 16.67 0.72 0.00 0.01 2.00 0.05 0.79
63 Maesa indica (Roxb.) A. DC. 2 1 16.67 0.72 0.00 0.01 2.00 0.05 0.79
64 Morus indica L. 2 1 16.67 0.72 0.00 0.01 2.00 0.05 0.79
65 Dillenia indica L. 1 1 16.67 0.72 0.00 0.01 1.00 0.03 0.76
66 Dillenia pentagyna Roxb. 1 1 16.67 0.72 0.00 0.01 1.00 0.03 0.76
67 Mallotus philippensis (Lam.) Müll.Arg. 1 1 16.67 0.72 0.00 0.01 1.00 0.03 0.76
68 Melia azedarach L. 1 1 16.67 0.72 0.00 0.01 1.00 0.03 0.76
69 Morinda angustifolia Roxb. 1 1 16.67 0.72 0.00 0.01 1.00 0.03 0.76
70 Oenanthe javanica (Blume) de Candolle 1 1 16.67 0.72 0.00 0.01 1.00 0.03 0.76
71 Toona ciliata M. Roem. a 1 1 16.67 0.72 0.00 0.01 1.00 0.03 0.76
NI= Number of Individuals, O= Occurance, F= Frequency, RF=Relative Frequency, D/sq m=Density per sq meter, RD=Relative Density, A=Abundance, RA= Relative
Abundance, IVI= Importance Value Index, SDI= Simpson’s Diversity Index
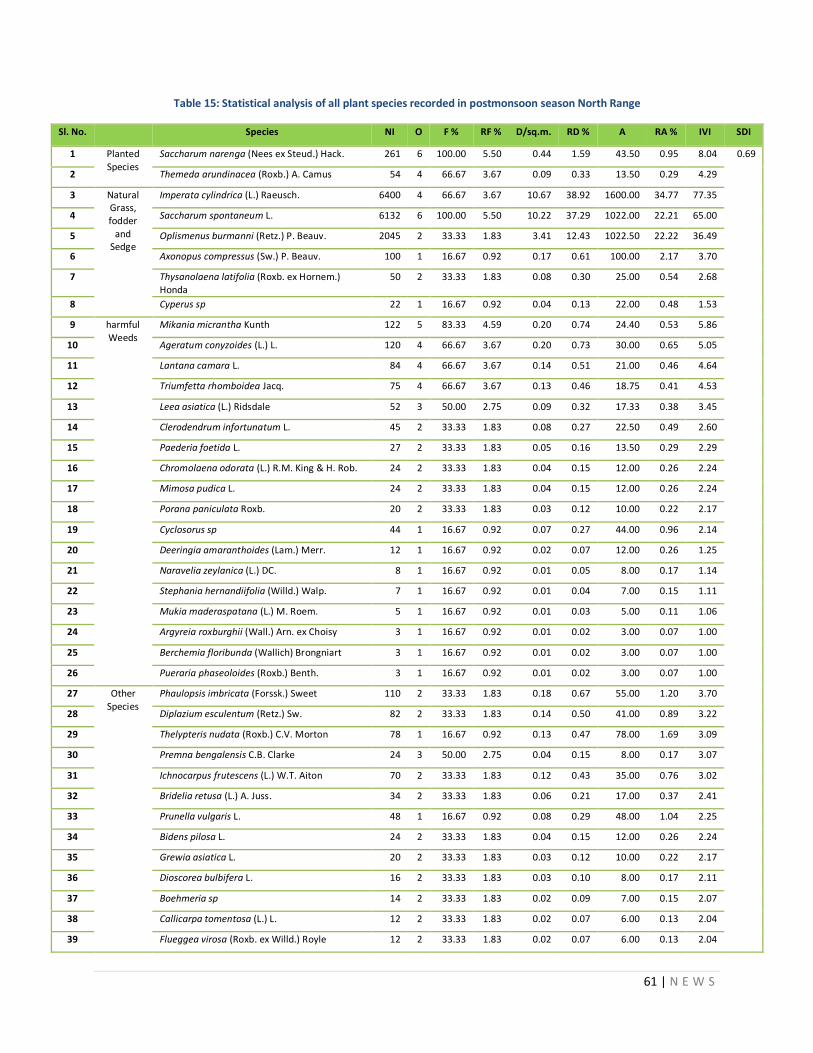
61 | N E W S
Table 15: Statistical analysis of all plant species recorded in postmonsoon season North Range
Sl. No. Species NI O F % RF % D/sq.m. RD % A RA % IVI SDI
1 Planted Species
Saccharum narenga (Nees ex Steud.) Hack. 261 6 100.00 5.50 0.44 1.59 43.50 0.95 8.04 0.69
2 Themeda arundinacea (Roxb.) A. Camus 54 4 66.67 3.67 0.09 0.33 13.50 0.29 4.29
3 Natural Grass, fodder
and Sedge
Imperata cylindrica (L.) Raeusch. 6400 4 66.67 3.67 10.67 38.92 1600.00 34.77 77.35
4 Saccharum spontaneum L. 6132 6 100.00 5.50 10.22 37.29 1022.00 22.21 65.00
5 Oplismenus burmanni (Retz.) P. Beauv. 2045 2 33.33 1.83 3.41 12.43 1022.50 22.22 36.49
6 Axonopus compressus (Sw.) P. Beauv. 100 1 16.67 0.92 0.17 0.61 100.00 2.17 3.70
7 Thysanolaena latifolia (Roxb. ex Hornem.) Honda
50 2 33.33 1.83 0.08 0.30 25.00 0.54 2.68
8 Cyperus sp 22 1 16.67 0.92 0.04 0.13 22.00 0.48 1.53
9 harmful Weeds
Mikania micrantha Kunth 122 5 83.33 4.59 0.20 0.74 24.40 0.53 5.86
10 Ageratum conyzoides (L.) L. 120 4 66.67 3.67 0.20 0.73 30.00 0.65 5.05
11 Lantana camara L. 84 4 66.67 3.67 0.14 0.51 21.00 0.46 4.64
12 Triumfetta rhomboidea Jacq. 75 4 66.67 3.67 0.13 0.46 18.75 0.41 4.53
13 Leea asiatica (L.) Ridsdale 52 3 50.00 2.75 0.09 0.32 17.33 0.38 3.45
14 Clerodendrum infortunatum L. 45 2 33.33 1.83 0.08 0.27 22.50 0.49 2.60
15 Paederia foetida L. 27 2 33.33 1.83 0.05 0.16 13.50 0.29 2.29
16 Chromolaena odorata (L.) R.M. King & H. Rob. 24 2 33.33 1.83 0.04 0.15 12.00 0.26 2.24
17 Mimosa pudica L. 24 2 33.33 1.83 0.04 0.15 12.00 0.26 2.24
18 Porana paniculata Roxb. 20 2 33.33 1.83 0.03 0.12 10.00 0.22 2.17
19 Cyclosorus sp 44 1 16.67 0.92 0.07 0.27 44.00 0.96 2.14
20 Deeringia amaranthoides (Lam.) Merr. 12 1 16.67 0.92 0.02 0.07 12.00 0.26 1.25
21 Naravelia zeylanica (L.) DC. 8 1 16.67 0.92 0.01 0.05 8.00 0.17 1.14
22 Stephania hernandiifolia (Willd.) Walp. 7 1 16.67 0.92 0.01 0.04 7.00 0.15 1.11
23 Mukia maderaspatana (L.) M. Roem. 5 1 16.67 0.92 0.01 0.03 5.00 0.11 1.06
24 Argyreia roxburghii (Wall.) Arn. ex Choisy 3 1 16.67 0.92 0.01 0.02 3.00 0.07 1.00
25 Berchemia floribunda (Wallich) Brongniart 3 1 16.67 0.92 0.01 0.02 3.00 0.07 1.00
26 Pueraria phaseoloides (Roxb.) Benth. 3 1 16.67 0.92 0.01 0.02 3.00 0.07 1.00
27 Other Species
Phaulopsis imbricata (Forssk.) Sweet 110 2 33.33 1.83 0.18 0.67 55.00 1.20 3.70
28 Diplazium esculentum (Retz.) Sw. 82 2 33.33 1.83 0.14 0.50 41.00 0.89 3.22
29 Thelypteris nudata (Roxb.) C.V. Morton 78 1 16.67 0.92 0.13 0.47 78.00 1.69 3.09
30 Premna bengalensis C.B. Clarke 24 3 50.00 2.75 0.04 0.15 8.00 0.17 3.07
31 Ichnocarpus frutescens (L.) W.T. Aiton 70 2 33.33 1.83 0.12 0.43 35.00 0.76 3.02
32 Bridelia retusa (L.) A. Juss. 34 2 33.33 1.83 0.06 0.21 17.00 0.37 2.41
33 Prunella vulgaris L. 48 1 16.67 0.92 0.08 0.29 48.00 1.04 2.25
34 Bidens pilosa L. 24 2 33.33 1.83 0.04 0.15 12.00 0.26 2.24
35 Grewia asiatica L. 20 2 33.33 1.83 0.03 0.12 10.00 0.22 2.17
36 Dioscorea bulbifera L. 16 2 33.33 1.83 0.03 0.10 8.00 0.17 2.11
37 Boehmeria sp 14 2 33.33 1.83 0.02 0.09 7.00 0.15 2.07
38 Callicarpa tomentosa (L.) L. 12 2 33.33 1.83 0.02 0.07 6.00 0.13 2.04
39 Flueggea virosa (Roxb. ex Willd.) Royle 12 2 33.33 1.83 0.02 0.07 6.00 0.13 2.04
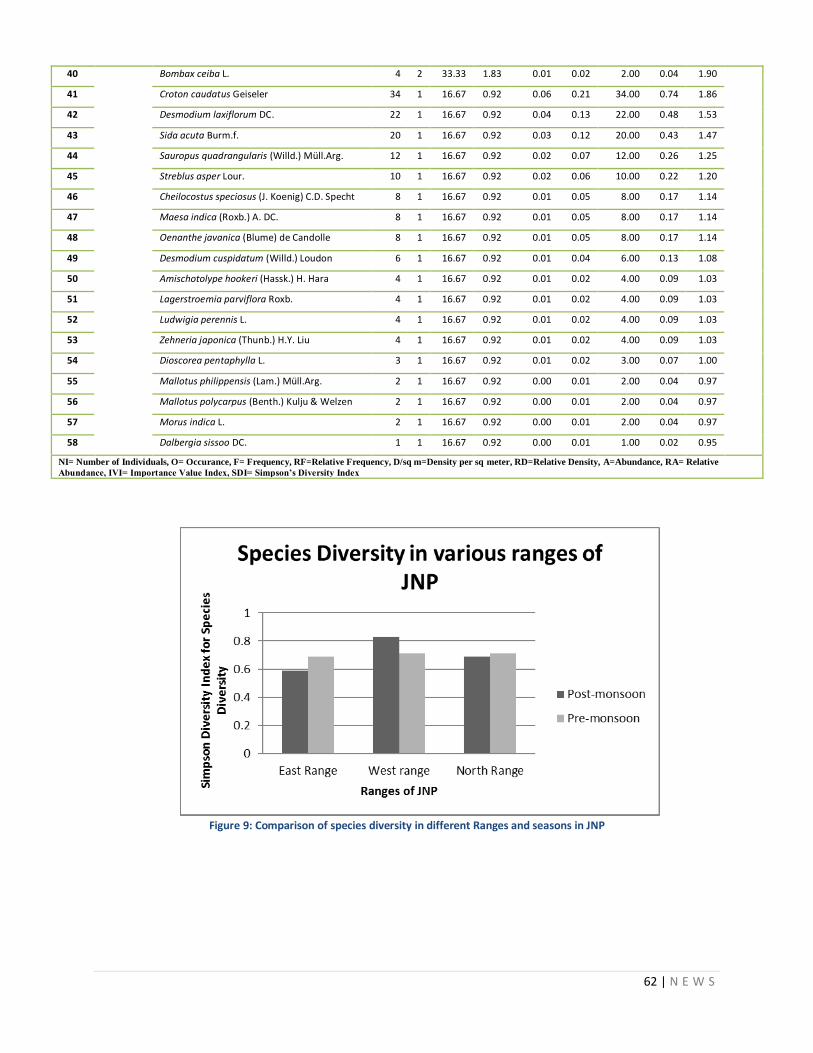
62 | N E W S
40 Bombax ceiba L. 4 2 33.33 1.83 0.01 0.02 2.00 0.04 1.90
41 Croton caudatus Geiseler 34 1 16.67 0.92 0.06 0.21 34.00 0.74 1.86
42 Desmodium laxiflorum DC. 22 1 16.67 0.92 0.04 0.13 22.00 0.48 1.53
43 Sida acuta Burm.f. 20 1 16.67 0.92 0.03 0.12 20.00 0.43 1.47
44 Sauropus quadrangularis (Willd.) Müll.Arg. 12 1 16.67 0.92 0.02 0.07 12.00 0.26 1.25
45 Streblus asper Lour. 10 1 16.67 0.92 0.02 0.06 10.00 0.22 1.20
46 Cheilocostus speciosus (J. Koenig) C.D. Specht 8 1 16.67 0.92 0.01 0.05 8.00 0.17 1.14
47 Maesa indica (Roxb.) A. DC. 8 1 16.67 0.92 0.01 0.05 8.00 0.17 1.14
48 Oenanthe javanica (Blume) de Candolle 8 1 16.67 0.92 0.01 0.05 8.00 0.17 1.14
49 Desmodium cuspidatum (Willd.) Loudon 6 1 16.67 0.92 0.01 0.04 6.00 0.13 1.08
50 Amischotolype hookeri (Hassk.) H. Hara 4 1 16.67 0.92 0.01 0.02 4.00 0.09 1.03
51 Lagerstroemia parviflora Roxb. 4 1 16.67 0.92 0.01 0.02 4.00 0.09 1.03
52 Ludwigia perennis L. 4 1 16.67 0.92 0.01 0.02 4.00 0.09 1.03
53 Zehneria japonica (Thunb.) H.Y. Liu 4 1 16.67 0.92 0.01 0.02 4.00 0.09 1.03
54 Dioscorea pentaphylla L. 3 1 16.67 0.92 0.01 0.02 3.00 0.07 1.00
55 Mallotus philippensis (Lam.) Müll.Arg. 2 1 16.67 0.92 0.00 0.01 2.00 0.04 0.97
56 Mallotus polycarpus (Benth.) Kulju & Welzen 2 1 16.67 0.92 0.00 0.01 2.00 0.04 0.97
57 Morus indica L. 2 1 16.67 0.92 0.00 0.01 2.00 0.04 0.97
58 Dalbergia sissoo DC. 1 1 16.67 0.92 0.00 0.01 1.00 0.02 0.95
NI= Number of Individuals, O= Occurance, F= Frequency, RF=Relative Frequency, D/sq m=Density per sq meter, RD=Relative Density, A=Abundance, RA= Relative
Abundance, IVI= Importance Value Index, SDI= Simpson’s Diversity Index
Figure 9: Comparison of species diversity in different Ranges and seasons in JNP
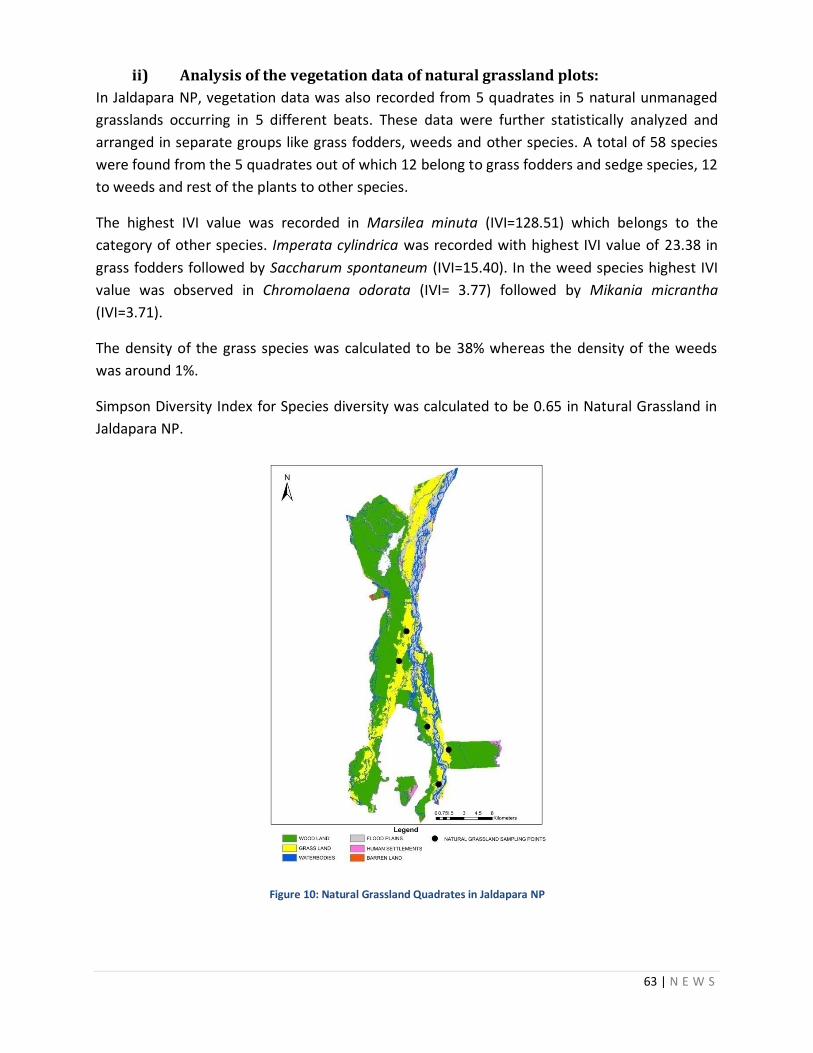
63 | N E W S
ii) Analysis of the vegetation data of natural grassland plots:
In Jaldapara NP, vegetation data was also recorded from 5 quadrates in 5 natural unmanaged
grasslands occurring in 5 different beats. These data were further statistically analyzed and
arranged in separate groups like grass fodders, weeds and other species. A total of 58 species
were found from the 5 quadrates out of which 12 belong to grass fodders and sedge species, 12
to weeds and rest of the plants to other species.
The highest IVI value was recorded in Marsilea minuta (IVI=128.51) which belongs to the
category of other species. Imperata cylindrica was recorded with highest IVI value of 23.38 in
grass fodders followed by Saccharum spontaneum (IVI=15.40). In the weed species highest IVI
value was observed in Chromolaena odorata (IVI= 3.77) followed by Mikania micrantha
(IVI=3.71).
The density of the grass species was calculated to be 38% whereas the density of the weeds
was around 1%.
Simpson Diversity Index for Species diversity was calculated to be 0.65 in Natural Grassland in
Jaldapara NP.
Figure 10: Natural Grassland Quadrates in Jaldapara NP
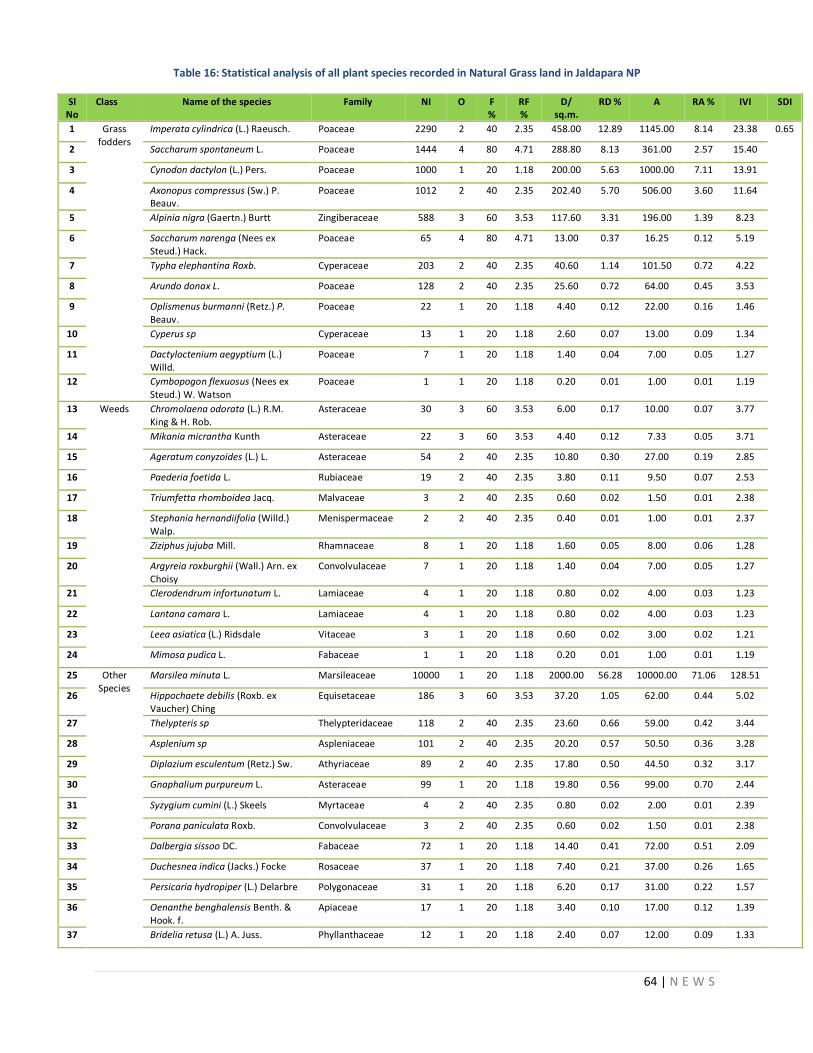
64 | N E W S
Table 16: Statistical analysis of all plant species recorded in Natural Grass land in Jaldapara NP
Sl No
Class Name of the species Family NI O F %
RF %
D/ sq.m.
RD % A RA % IVI SDI
1 Grass fodders
Imperata cylindrica (L.) Raeusch. Poaceae 2290 2 40 2.35 458.00 12.89 1145.00 8.14 23.38 0.65
2 Saccharum spontaneum L. Poaceae 1444 4 80 4.71 288.80 8.13 361.00 2.57 15.40
3 Cynodon dactylon (L.) Pers. Poaceae 1000 1 20 1.18 200.00 5.63 1000.00 7.11 13.91
4 Axonopus compressus (Sw.) P. Beauv.
Poaceae 1012 2 40 2.35 202.40 5.70 506.00 3.60 11.64
5 Alpinia nigra (Gaertn.) Burtt Zingiberaceae 588 3 60 3.53 117.60 3.31 196.00 1.39 8.23
6 Saccharum narenga (Nees ex Steud.) Hack.
Poaceae 65 4 80 4.71 13.00 0.37 16.25 0.12 5.19
7 Typha elephantina Roxb. Cyperaceae 203 2 40 2.35 40.60 1.14 101.50 0.72 4.22
8 Arundo donax L. Poaceae 128 2 40 2.35 25.60 0.72 64.00 0.45 3.53
9 Oplismenus burmanni (Retz.) P. Beauv.
Poaceae 22 1 20 1.18 4.40 0.12 22.00 0.16 1.46
10 Cyperus sp Cyperaceae 13 1 20 1.18 2.60 0.07 13.00 0.09 1.34
11 Dactyloctenium aegyptium (L.) Willd.
Poaceae 7 1 20 1.18 1.40 0.04 7.00 0.05 1.27
12 Cymbopogon flexuosus (Nees ex Steud.) W. Watson
Poaceae 1 1 20 1.18 0.20 0.01 1.00 0.01 1.19
13 Weeds Chromolaena odorata (L.) R.M. King & H. Rob.
Asteraceae 30 3 60 3.53 6.00 0.17 10.00 0.07 3.77
14 Mikania micrantha Kunth Asteraceae 22 3 60 3.53 4.40 0.12 7.33 0.05 3.71
15 Ageratum conyzoides (L.) L. Asteraceae 54 2 40 2.35 10.80 0.30 27.00 0.19 2.85
16 Paederia foetida L. Rubiaceae 19 2 40 2.35 3.80 0.11 9.50 0.07 2.53
17 Triumfetta rhomboidea Jacq. Malvaceae 3 2 40 2.35 0.60 0.02 1.50 0.01 2.38
18 Stephania hernandiifolia (Willd.) Walp.
Menispermaceae 2 2 40 2.35 0.40 0.01 1.00 0.01 2.37
19 Ziziphus jujuba Mill. Rhamnaceae 8 1 20 1.18 1.60 0.05 8.00 0.06 1.28
20 Argyreia roxburghii (Wall.) Arn. ex Choisy
Convolvulaceae 7 1 20 1.18 1.40 0.04 7.00 0.05 1.27
21 Clerodendrum infortunatum L. Lamiaceae 4 1 20 1.18 0.80 0.02 4.00 0.03 1.23
22 Lantana camara L. Lamiaceae 4 1 20 1.18 0.80 0.02 4.00 0.03 1.23
23 Leea asiatica (L.) Ridsdale Vitaceae 3 1 20 1.18 0.60 0.02 3.00 0.02 1.21
24 Mimosa pudica L. Fabaceae 1 1 20 1.18 0.20 0.01 1.00 0.01 1.19
25 Other Species
Marsilea minuta L. Marsileaceae 10000 1 20 1.18 2000.00 56.28 10000.00 71.06 128.51
26 Hippochaete debilis (Roxb. ex Vaucher) Ching
Equisetaceae 186 3 60 3.53 37.20 1.05 62.00 0.44 5.02
27 Thelypteris sp Thelypteridaceae 118 2 40 2.35 23.60 0.66 59.00 0.42 3.44
28 Asplenium sp Aspleniaceae 101 2 40 2.35 20.20 0.57 50.50 0.36 3.28
29 Diplazium esculentum (Retz.) Sw. Athyriaceae 89 2 40 2.35 17.80 0.50 44.50 0.32 3.17
30 Gnaphalium purpureum L. Asteraceae 99 1 20 1.18 19.80 0.56 99.00 0.70 2.44
31 Syzygium cumini (L.) Skeels Myrtaceae 4 2 40 2.35 0.80 0.02 2.00 0.01 2.39
32 Porana paniculata Roxb. Convolvulaceae 3 2 40 2.35 0.60 0.02 1.50 0.01 2.38
33 Dalbergia sissoo DC. Fabaceae 72 1 20 1.18 14.40 0.41 72.00 0.51 2.09
34 Duchesnea indica (Jacks.) Focke Rosaceae 37 1 20 1.18 7.40 0.21 37.00 0.26 1.65
35 Persicaria hydropiper (L.) Delarbre Polygonaceae 31 1 20 1.18 6.20 0.17 31.00 0.22 1.57
36 Oenanthe benghalensis Benth. & Hook. f.
Apiaceae 17 1 20 1.18 3.40 0.10 17.00 0.12 1.39
37 Bridelia retusa (L.) A. Juss. Phyllanthaceae 12 1 20 1.18 2.40 0.07 12.00 0.09 1.33
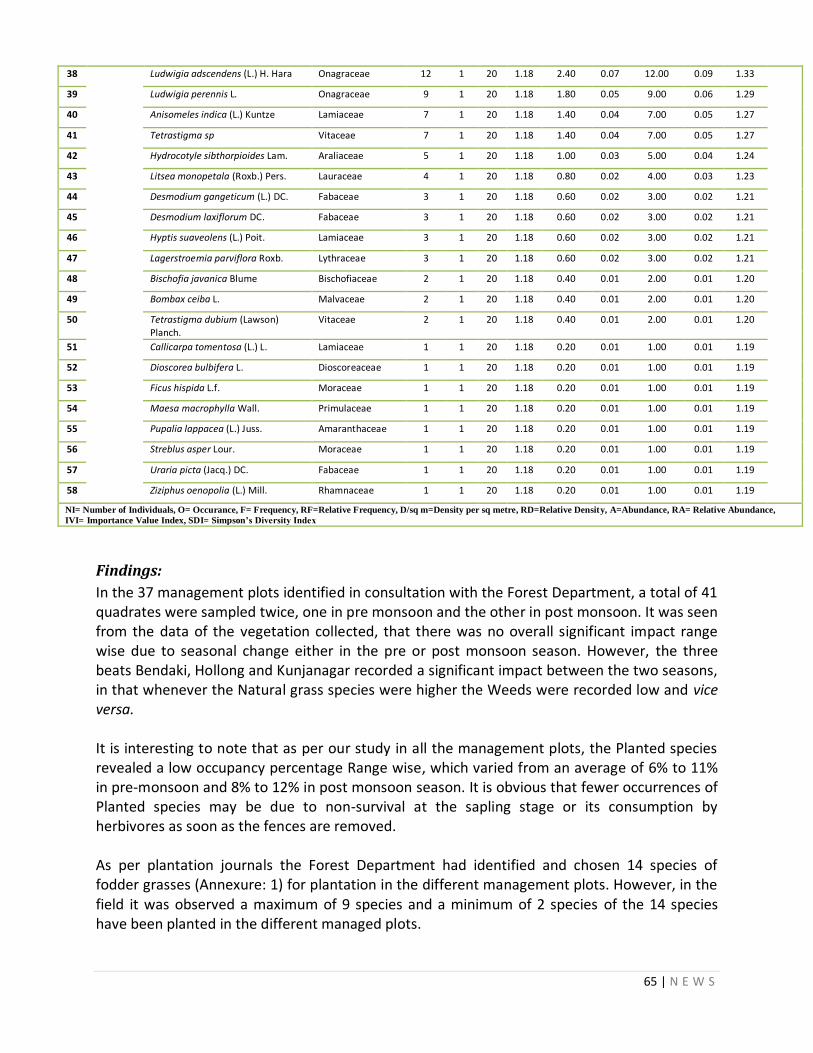
65 | N E W S
38 Ludwigia adscendens (L.) H. Hara Onagraceae 12 1 20 1.18 2.40 0.07 12.00 0.09 1.33
39 Ludwigia perennis L. Onagraceae 9 1 20 1.18 1.80 0.05 9.00 0.06 1.29
40 Anisomeles indica (L.) Kuntze Lamiaceae 7 1 20 1.18 1.40 0.04 7.00 0.05 1.27
41 Tetrastigma sp Vitaceae 7 1 20 1.18 1.40 0.04 7.00 0.05 1.27
42 Hydrocotyle sibthorpioides Lam. Araliaceae 5 1 20 1.18 1.00 0.03 5.00 0.04 1.24
43 Litsea monopetala (Roxb.) Pers. Lauraceae 4 1 20 1.18 0.80 0.02 4.00 0.03 1.23
44 Desmodium gangeticum (L.) DC. Fabaceae 3 1 20 1.18 0.60 0.02 3.00 0.02 1.21
45 Desmodium laxiflorum DC. Fabaceae 3 1 20 1.18 0.60 0.02 3.00 0.02 1.21
46 Hyptis suaveolens (L.) Poit. Lamiaceae 3 1 20 1.18 0.60 0.02 3.00 0.02 1.21
47 Lagerstroemia parviflora Roxb. Lythraceae 3 1 20 1.18 0.60 0.02 3.00 0.02 1.21
48 Bischofia javanica Blume Bischofiaceae 2 1 20 1.18 0.40 0.01 2.00 0.01 1.20
49 Bombax ceiba L. Malvaceae 2 1 20 1.18 0.40 0.01 2.00 0.01 1.20
50 Tetrastigma dubium (Lawson) Planch.
Vitaceae 2 1 20 1.18 0.40 0.01 2.00 0.01 1.20
51 Callicarpa tomentosa (L.) L. Lamiaceae 1 1 20 1.18 0.20 0.01 1.00 0.01 1.19
52 Dioscorea bulbifera L. Dioscoreaceae 1 1 20 1.18 0.20 0.01 1.00 0.01 1.19
53 Ficus hispida L.f. Moraceae 1 1 20 1.18 0.20 0.01 1.00 0.01 1.19
54 Maesa macrophylla Wall. Primulaceae 1 1 20 1.18 0.20 0.01 1.00 0.01 1.19
55 Pupalia lappacea (L.) Juss. Amaranthaceae 1 1 20 1.18 0.20 0.01 1.00 0.01 1.19
56 Streblus asper Lour. Moraceae 1 1 20 1.18 0.20 0.01 1.00 0.01 1.19
57 Uraria picta (Jacq.) DC. Fabaceae 1 1 20 1.18 0.20 0.01 1.00 0.01 1.19
58 Ziziphus oenopolia (L.) Mill. Rhamnaceae 1 1 20 1.18 0.20 0.01 1.00 0.01 1.19
NI= Number of Individuals, O= Occurance, F= Frequency, RF=Relative Frequency, D/sq m=Density per sq metre, RD=Relative Density, A=Abundance, RA= Relative Abundance,
IVI= Importance Value Index, SDI= Simpson’s Diversity Index
Findings:
In the 37 management plots identified in consultation with the Forest Department, a total of 41 quadrates were sampled twice, one in pre monsoon and the other in post monsoon. It was seen from the data of the vegetation collected, that there was no overall significant impact range wise due to seasonal change either in the pre or post monsoon season. However, the three beats Bendaki, Hollong and Kunjanagar recorded a significant impact between the two seasons, in that whenever the Natural grass species were higher the Weeds were recorded low and vice versa. It is interesting to note that as per our study in all the management plots, the Planted species revealed a low occupancy percentage Range wise, which varied from an average of 6% to 11% in pre-monsoon and 8% to 12% in post monsoon season. It is obvious that fewer occurrences of Planted species may be due to non-survival at the sapling stage or its consumption by herbivores as soon as the fences are removed. As per plantation journals the Forest Department had identified and chosen 14 species of fodder grasses (Annexure: 1) for plantation in the different management plots. However, in the field it was observed a maximum of 9 species and a minimum of 2 species of the 14 species have been planted in the different managed plots.
66 | N E W S
It was observed that in almost all the managed plots where Dhadda and Chepti were planted they were found to be also present in our present collections. However, Purundi, Malsa and Madhua which were planted in 22 to 29 managed plots as per plantation journals, but their occurrence was found only in 4 to 9 plots respectively in our study. In the quadrates where 4-6 species were planted as per the record, only 50% of them were found in actual field during this study. However, wherever only 2-3 species were planted all of them were also found in our collections. This phenomenon was seen both in pre and post monsoon seasons. On a comparison between Weeds and Planted species it was seen that there was very little impact/conflict on Planted species by Weeds. However, this trend was not observed in Mairadanga beat where higher the Planted species lower the occurrence of Weeds and vice versa. It was seen that occupancy percentage of Weed species in non-flooded areas was more in comparison to flooded areas. On a total evaluation of the managed plots in Jaldapara NP the cover percentage for planted species is 9.67%; natural grass, fodder & sedge species – 54.46%; harmful weeds – 20.04% and other species occupies 15.92% of the area. (Figure: 8) Natural Grass species shows high IVI values in both the seasons in all the Ranges. Among natural grasses Imperata cylindrica, Axonopus compressus and Saccharum sponteneum were the naturally occurring grass species with high IVI in most cases. Among the weed species, Mikania micrantha, Chromolaena odorata and Ageratum conyzoides were denser than the other weed species. Species diversity was highest in West range in post monsoon season with SDI= 0.83 while East range shows the lowest diversity. It is seen that in natutal grassland the effects of weeds are minimum as the population density of the weeds in natural grassland quadrates were only 1% where as in the managed grassland the density varied from 4% to 8%. Interestingly it was also seen that the population density of grass species in natural grassland was less (only 38%) than the managed plots in various ranges (75% to 92%).
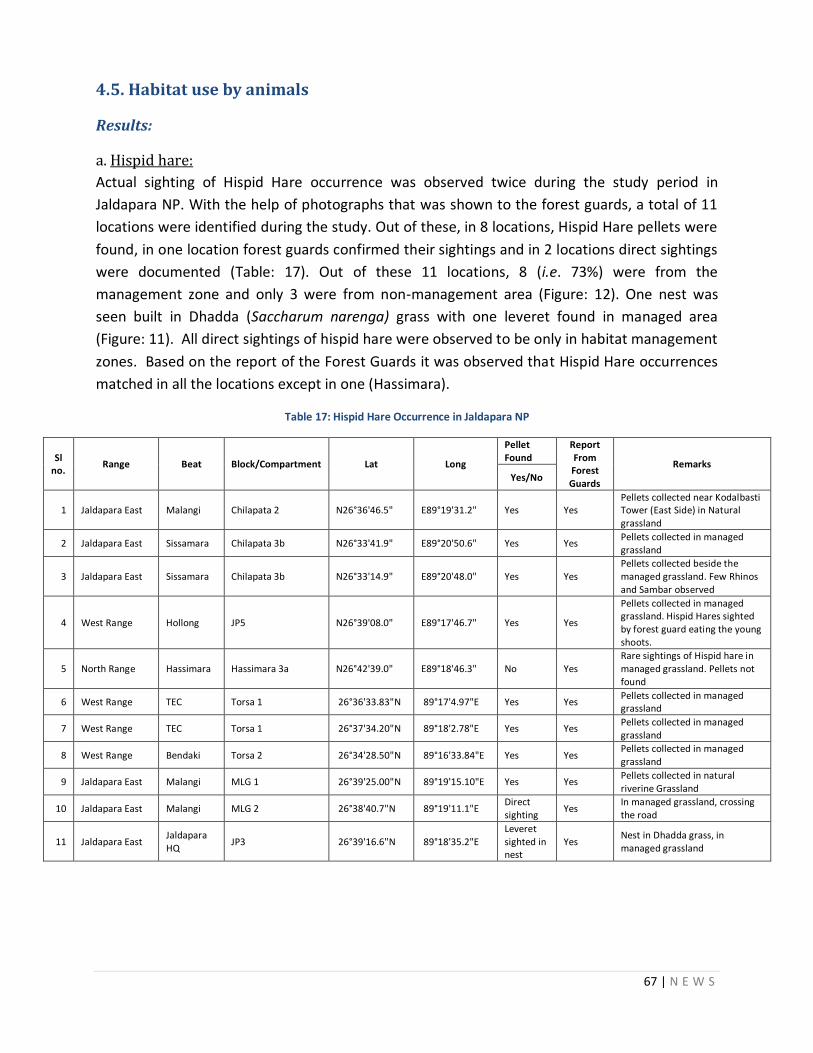
67 | N E W S
4.5. Habitat use by animals
Results:
a. Hispid hare:
Actual sighting of Hispid Hare occurrence was observed twice during the study period in
Jaldapara NP. With the help of photographs that was shown to the forest guards, a total of 11
locations were identified during the study. Out of these, in 8 locations, Hispid Hare pellets were
found, in one location forest guards confirmed their sightings and in 2 locations direct sightings
were documented (Table: 17). Out of these 11 locations, 8 (i.e. 73%) were from the
management zone and only 3 were from non-management area (Figure: 12). One nest was
seen built in Dhadda (Saccharum narenga) grass with one leveret found in managed area
(Figure: 11). All direct sightings of hispid hare were observed to be only in habitat management
zones. Based on the report of the Forest Guards it was observed that Hispid Hare occurrences
matched in all the locations except in one (Hassimara).
Table 17: Hispid Hare Occurrence in Jaldapara NP
Sl no.
Range Beat Block/Compartment Lat Long
Pellet Found
Report From Forest Guards
Remarks
Yes/No
1 Jaldapara East Malangi Chilapata 2 N26°36'46.5" E89°19'31.2" Yes Yes Pellets collected near Kodalbasti Tower (East Side) in Natural grassland
2 Jaldapara East Sissamara Chilapata 3b N26°33'41.9" E89°20'50.6" Yes Yes Pellets collected in managed grassland
3 Jaldapara East Sissamara Chilapata 3b N26°33'14.9" E89°20'48.0" Yes Yes Pellets collected beside the managed grassland. Few Rhinos and Sambar observed
4 West Range Hollong JP5 N26°39'08.0" E89°17'46.7" Yes Yes
Pellets collected in managed grassland. Hispid Hares sighted by forest guard eating the young shoots.
5 North Range Hassimara Hassimara 3a N26°42'39.0" E89°18'46.3" No Yes Rare sightings of Hispid hare in managed grassland. Pellets not found
6 West Range TEC Torsa 1 26°36'33.83"N 89°17'4.97"E Yes Yes Pellets collected in managed grassland
7 West Range TEC Torsa 1 26°37'34.20"N 89°18'2.78"E Yes Yes Pellets collected in managed grassland
8 West Range Bendaki Torsa 2 26°34'28.50"N 89°16'33.84"E Yes Yes Pellets collected in managed grassland
9 Jaldapara East Malangi MLG 1 26°39'25.00"N 89°19'15.10"E Yes Yes Pellets collected in natural riverine Grassland
10 Jaldapara East Malangi MLG 2 26°38'40.7"N 89°19'11.1"E Direct sighting
Yes In managed grassland, crossing the road
11 Jaldapara East Jaldapara HQ
JP3 26°39'16.6"N 89°18'35.2"E Leveret sighted in nest
Yes Nest in Dhadda grass, in managed grassland
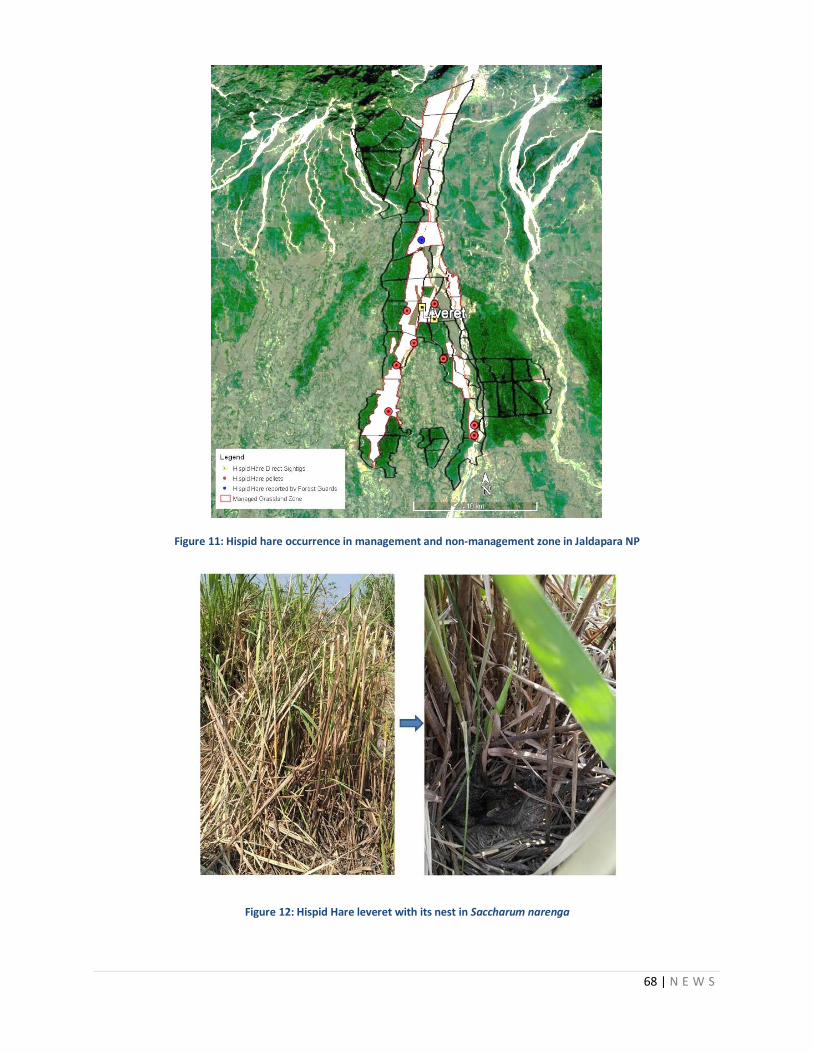
68 | N E W S
Figure 11: Hispid hare occurrence in management and non-management zone in Jaldapara NP
Figure 12: Hispid Hare leveret with its nest in Saccharum narenga
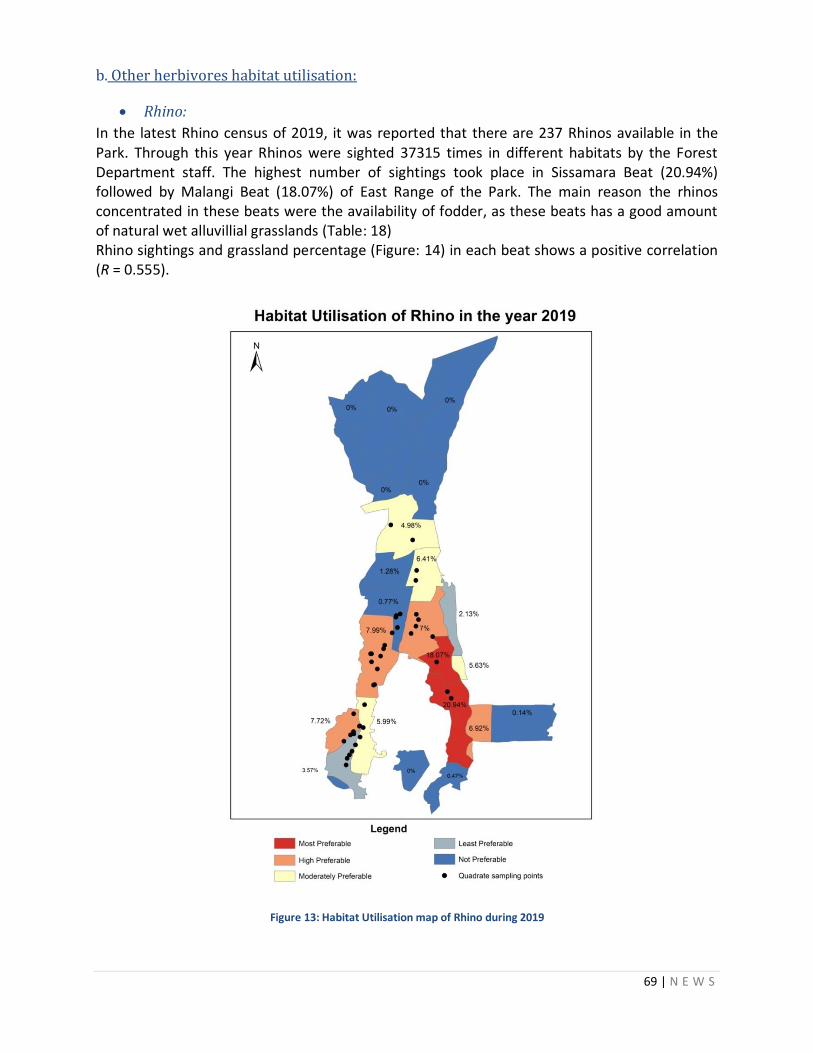
69 | N E W S
b. Other herbivores habitat utilisation:
Rhino:
In the latest Rhino census of 2019, it was reported that there are 237 Rhinos available in the Park. Through this year Rhinos were sighted 37315 times in different habitats by the Forest Department staff. The highest number of sightings took place in Sissamara Beat (20.94%) followed by Malangi Beat (18.07%) of East Range of the Park. The main reason the rhinos concentrated in these beats were the availability of fodder, as these beats has a good amount of natural wet alluvillial grasslands (Table: 18) Rhino sightings and grassland percentage (Figure: 14) in each beat shows a positive correlation (R = 0.555).
Figure 13: Habitat Utilisation map of Rhino during 2019
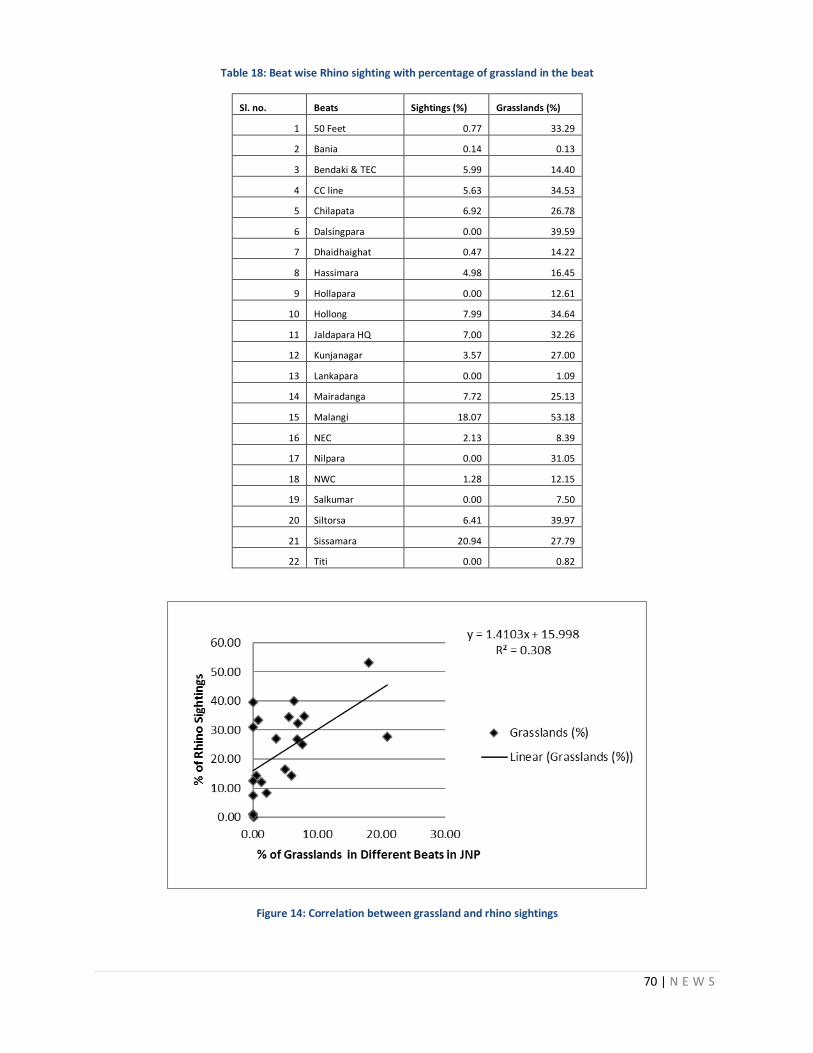
70 | N E W S
Table 18: Beat wise Rhino sighting with percentage of grassland in the beat
Sl. no. Beats Sightings (%) Grasslands (%)
1 50 Feet 0.77 33.29
2 Bania 0.14 0.13
3 Bendaki & TEC 5.99 14.40
4 CC line 5.63 34.53
5 Chilapata 6.92 26.78
6 Dalsingpara 0.00 39.59
7 Dhaidhaighat 0.47 14.22
8 Hassimara 4.98 16.45
9 Hollapara 0.00 12.61
10 Hollong 7.99 34.64
11 Jaldapara HQ 7.00 32.26
12 Kunjanagar 3.57 27.00
13 Lankapara 0.00 1.09
14 Mairadanga 7.72 25.13
15 Malangi 18.07 53.18
16 NEC 2.13 8.39
17 Nilpara 0.00 31.05
18 NWC 1.28 12.15
19 Salkumar 0.00 7.50
20 Siltorsa 6.41 39.97
21 Sissamara 20.94 27.79
22 Titi 0.00 0.82
Figure 14: Correlation between grassland and rhino sightings
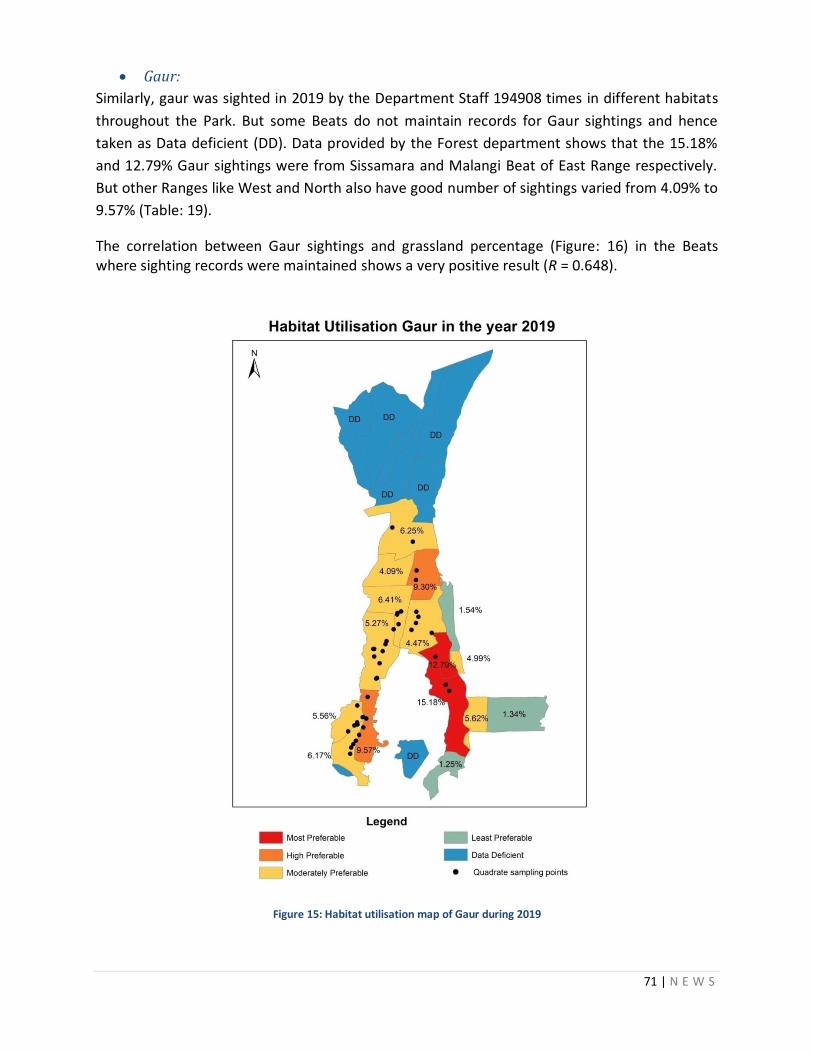
71 | N E W S
Gaur:
Similarly, gaur was sighted in 2019 by the Department Staff 194908 times in different habitats
throughout the Park. But some Beats do not maintain records for Gaur sightings and hence
taken as Data deficient (DD). Data provided by the Forest department shows that the 15.18%
and 12.79% Gaur sightings were from Sissamara and Malangi Beat of East Range respectively.
But other Ranges like West and North also have good number of sightings varied from 4.09% to
9.57% (Table: 19).
The correlation between Gaur sightings and grassland percentage (Figure: 16) in the Beats where sighting records were maintained shows a very positive result (R = 0.648).
Figure 15: Habitat utilisation map of Gaur during 2019
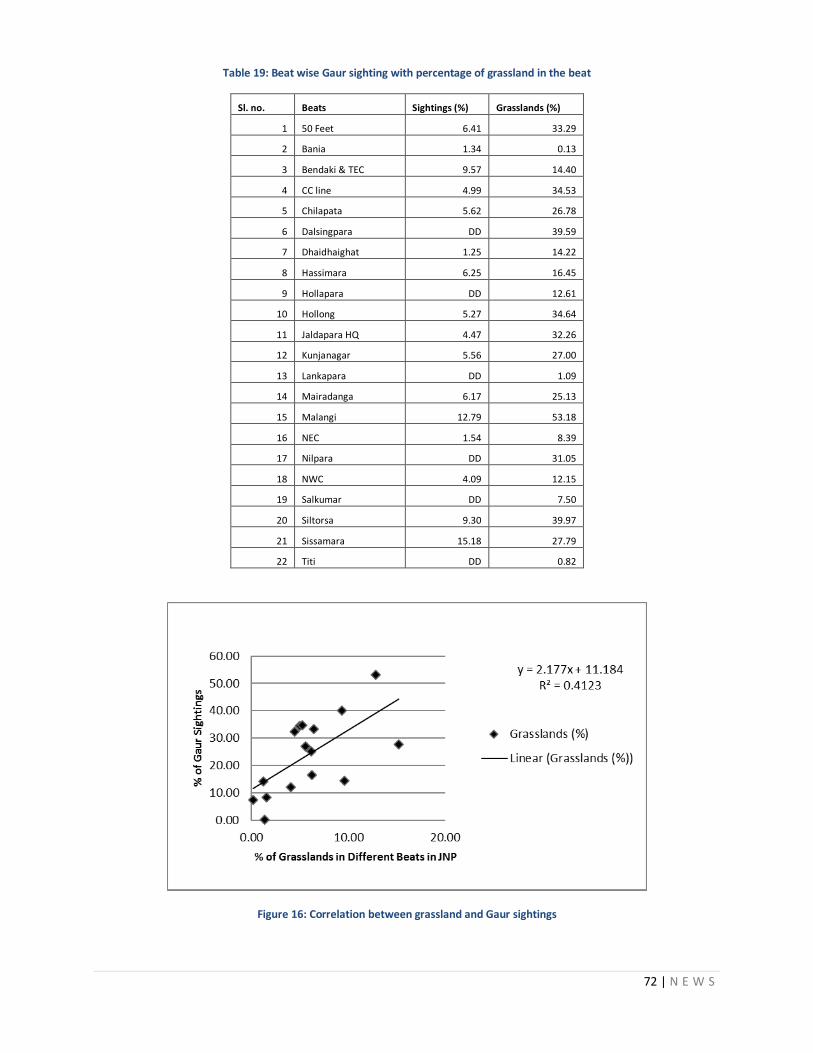
72 | N E W S
Table 19: Beat wise Gaur sighting with percentage of grassland in the beat
Sl. no. Beats Sightings (%) Grasslands (%)
1 50 Feet 6.41 33.29
2 Bania 1.34 0.13
3 Bendaki & TEC 9.57 14.40
4 CC line 4.99 34.53
5 Chilapata 5.62 26.78
6 Dalsingpara DD 39.59
7 Dhaidhaighat 1.25 14.22
8 Hassimara 6.25 16.45
9 Hollapara DD 12.61
10 Hollong 5.27 34.64
11 Jaldapara HQ 4.47 32.26
12 Kunjanagar 5.56 27.00
13 Lankapara DD 1.09
14 Mairadanga 6.17 25.13
15 Malangi 12.79 53.18
16 NEC 1.54 8.39
17 Nilpara DD 31.05
18 NWC 4.09 12.15
19 Salkumar DD 7.50
20 Siltorsa 9.30 39.97
21 Sissamara 15.18 27.79
22 Titi DD 0.82
Figure 16: Correlation between grassland and Gaur sightings
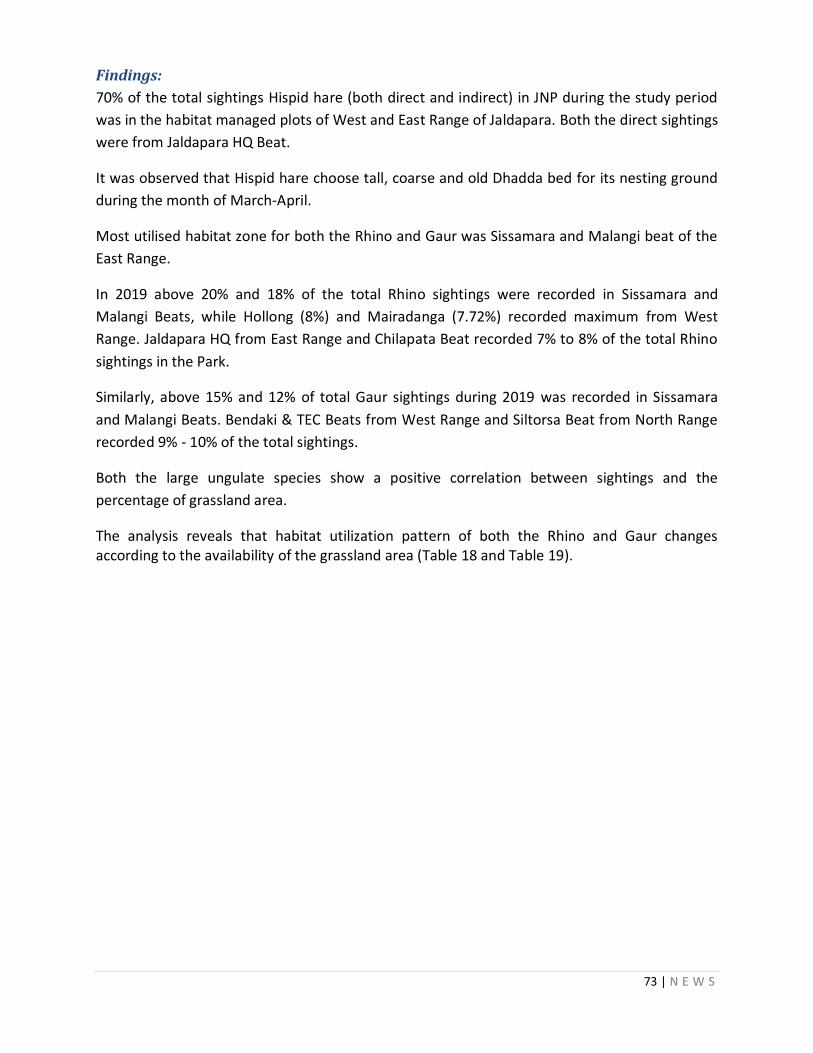
73 | N E W S
Findings:
70% of the total sightings Hispid hare (both direct and indirect) in JNP during the study period
was in the habitat managed plots of West and East Range of Jaldapara. Both the direct sightings
were from Jaldapara HQ Beat.
It was observed that Hispid hare choose tall, coarse and old Dhadda bed for its nesting ground
during the month of March-April.
Most utilised habitat zone for both the Rhino and Gaur was Sissamara and Malangi beat of the
East Range.
In 2019 above 20% and 18% of the total Rhino sightings were recorded in Sissamara and
Malangi Beats, while Hollong (8%) and Mairadanga (7.72%) recorded maximum from West
Range. Jaldapara HQ from East Range and Chilapata Beat recorded 7% to 8% of the total Rhino
sightings in the Park.
Similarly, above 15% and 12% of total Gaur sightings during 2019 was recorded in Sissamara
and Malangi Beats. Bendaki & TEC Beats from West Range and Siltorsa Beat from North Range
recorded 9% - 10% of the total sightings.
Both the large ungulate species show a positive correlation between sightings and the
percentage of grassland area.
The analysis reveals that habitat utilization pattern of both the Rhino and Gaur changes according to the availability of the grassland area (Table 18 and Table 19).
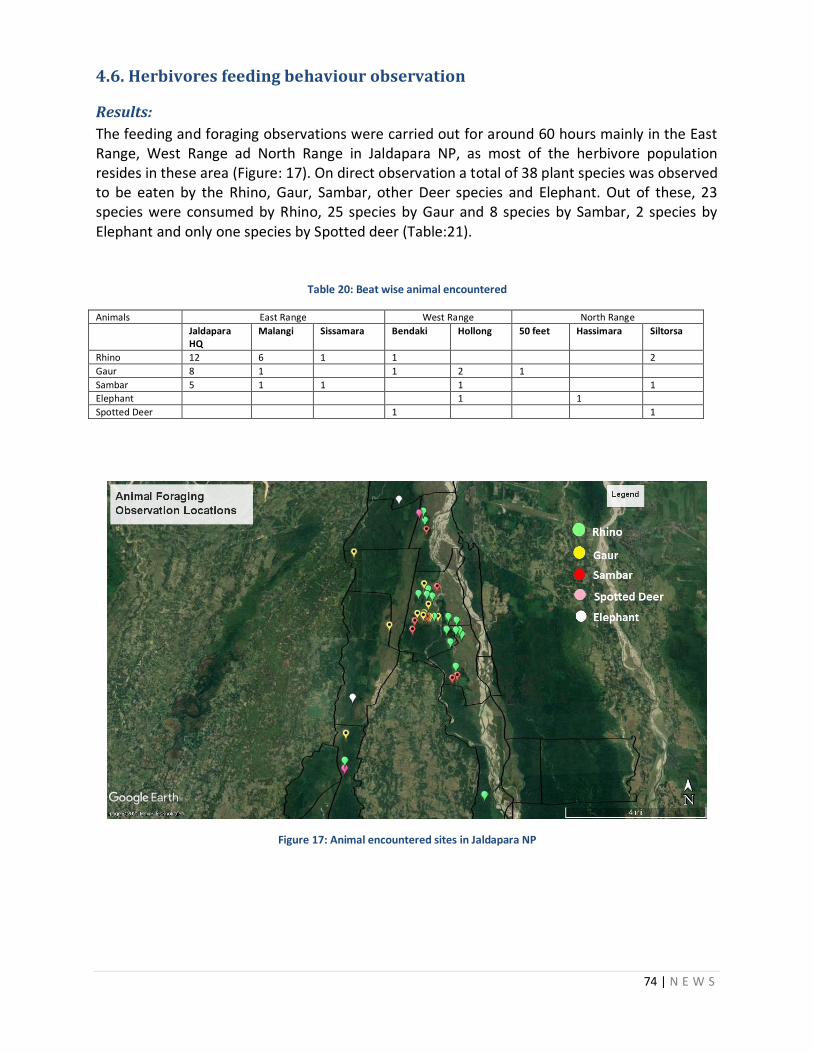
74 | N E W S
4.6. Herbivores feeding behaviour observation
Results:
The feeding and foraging observations were carried out for around 60 hours mainly in the East Range, West Range ad North Range in Jaldapara NP, as most of the herbivore population resides in these area (Figure: 17). On direct observation a total of 38 plant species was observed to be eaten by the Rhino, Gaur, Sambar, other Deer species and Elephant. Out of these, 23 species were consumed by Rhino, 25 species by Gaur and 8 species by Sambar, 2 species by Elephant and only one species by Spotted deer (Table:21).
Table 20: Beat wise animal encountered
Animals East Range West Range North Range
Jaldapara HQ
Malangi Sissamara Bendaki Hollong 50 feet Hassimara Siltorsa
Rhino 12 6 1 1 2
Gaur 8 1 1 2 1
Sambar 5 1 1 1 1
Elephant 1 1
Spotted Deer 1 1
Figure 17: Animal encountered sites in Jaldapara NP
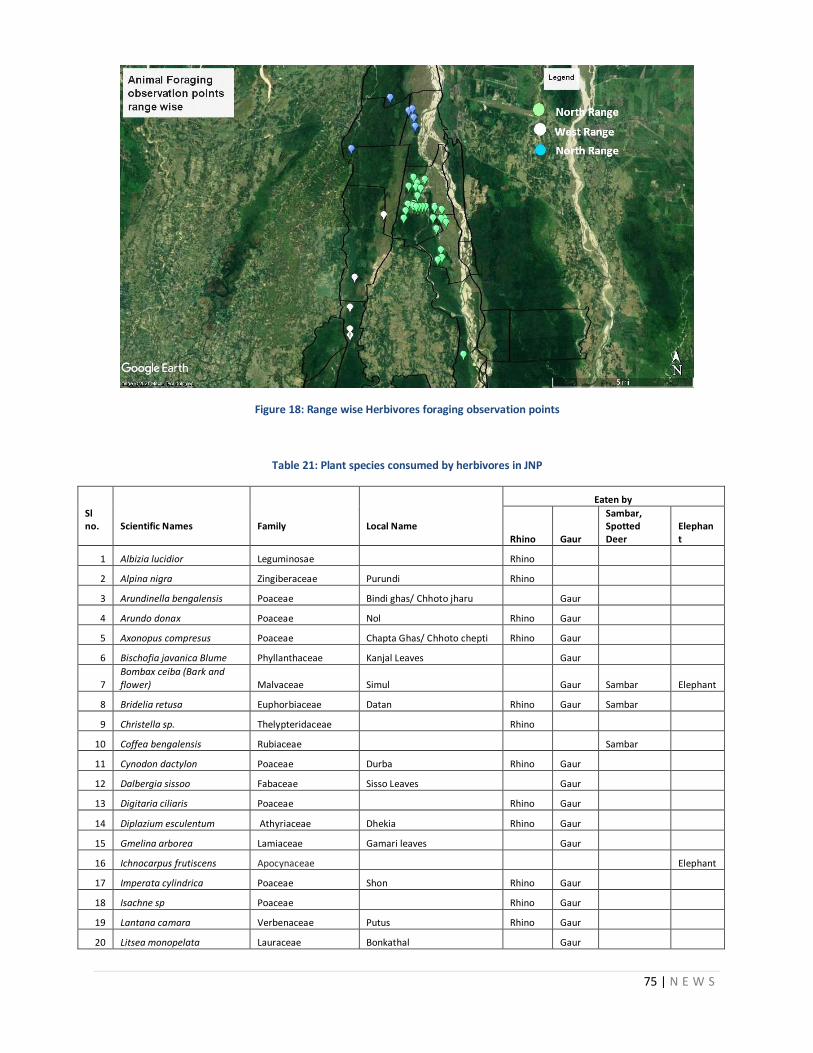
75 | N E W S
Figure 18: Range wise Herbivores foraging observation points
Table 21: Plant species consumed by herbivores in JNP
Sl no.
Scientific Names
Family
Local Name
Eaten by
Rhino Gaur
Sambar, Spotted Deer
Elephant
1 Albizia lucidior Leguminosae Rhino
2 Alpina nigra Zingiberaceae Purundi Rhino
3 Arundinella bengalensis Poaceae Bindi ghas/ Chhoto jharu Gaur
4 Arundo donax Poaceae Nol Rhino Gaur
5 Axonopus compresus Poaceae Chapta Ghas/ Chhoto chepti Rhino Gaur
6 Bischofia javanica Blume Phyllanthaceae Kanjal Leaves Gaur
7 Bombax ceiba (Bark and flower) Malvaceae Simul Gaur Sambar Elephant
8 Bridelia retusa Euphorbiaceae Datan Rhino Gaur Sambar
9 Christella sp. Thelypteridaceae Rhino
10 Coffea bengalensis Rubiaceae Sambar
11 Cynodon dactylon Poaceae Durba Rhino Gaur
12 Dalbergia sissoo Fabaceae Sisso Leaves Gaur
13 Digitaria ciliaris Poaceae Rhino Gaur
14 Diplazium esculentum Athyriaceae Dhekia Rhino Gaur
15 Gmelina arborea Lamiaceae Gamari leaves Gaur
16 Ichnocarpus frutiscens Apocynaceae Elephant
17 Imperata cylindrica Poaceae Shon Rhino Gaur
18 Isachne sp Poaceae Rhino Gaur
19 Lantana camara Verbenaceae Putus Rhino Gaur
20 Litsea monopelata Lauraceae Bonkathal Gaur
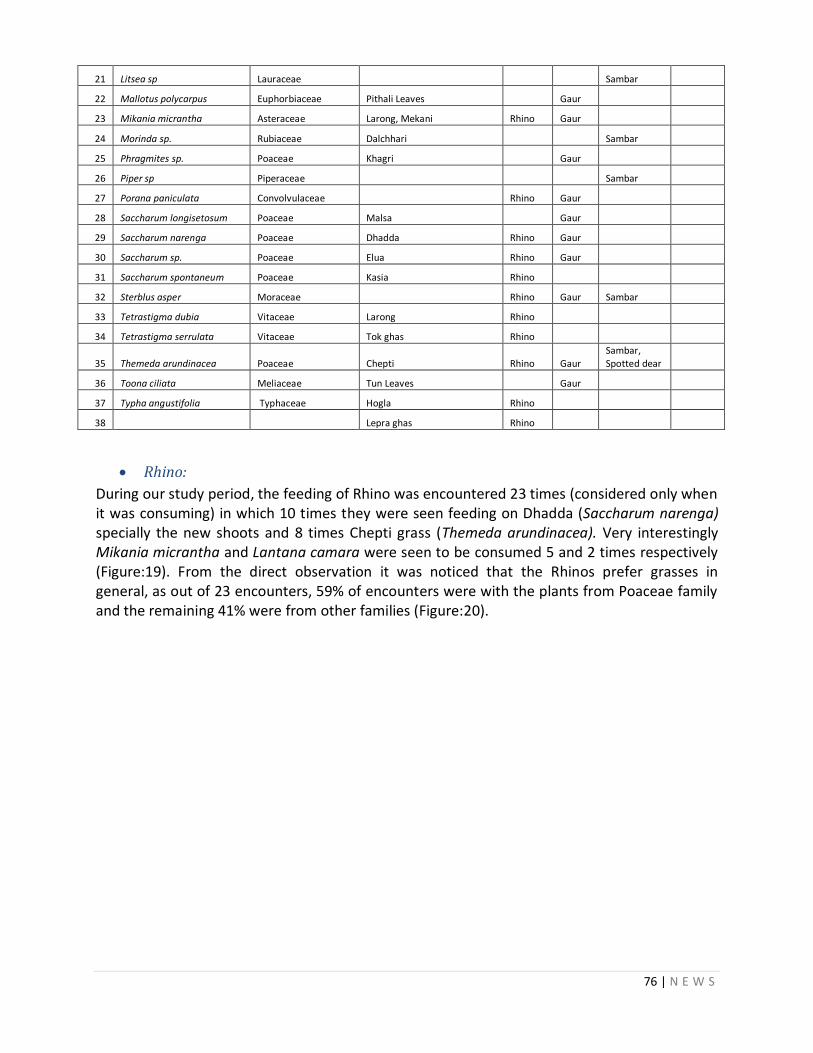
76 | N E W S
21 Litsea sp Lauraceae Sambar
22 Mallotus polycarpus Euphorbiaceae Pithali Leaves Gaur
23 Mikania micrantha Asteraceae Larong, Mekani Rhino Gaur
24 Morinda sp. Rubiaceae Dalchhari Sambar
25 Phragmites sp. Poaceae Khagri Gaur
26 Piper sp Piperaceae Sambar
27 Porana paniculata Convolvulaceae Rhino Gaur
28 Saccharum longisetosum Poaceae Malsa Gaur
29 Saccharum narenga Poaceae Dhadda Rhino Gaur
30 Saccharum sp. Poaceae Elua Rhino Gaur
31 Saccharum spontaneum Poaceae Kasia Rhino
32 Sterblus asper Moraceae Rhino Gaur Sambar
33 Tetrastigma dubia Vitaceae Larong Rhino
34 Tetrastigma serrulata Vitaceae Tok ghas Rhino
35 Themeda arundinacea Poaceae Chepti Rhino Gaur Sambar, Spotted dear
36 Toona ciliata Meliaceae Tun Leaves Gaur
37 Typha angustifolia Typhaceae Hogla Rhino
38 Lepra ghas Rhino
Rhino:
During our study period, the feeding of Rhino was encountered 23 times (considered only when it was consuming) in which 10 times they were seen feeding on Dhadda (Saccharum narenga) specially the new shoots and 8 times Chepti grass (Themeda arundinacea). Very interestingly Mikania micrantha and Lantana camara were seen to be consumed 5 and 2 times respectively (Figure:19). From the direct observation it was noticed that the Rhinos prefer grasses in general, as out of 23 encounters, 59% of encounters were with the plants from Poaceae family and the remaining 41% were from other families (Figure:20).
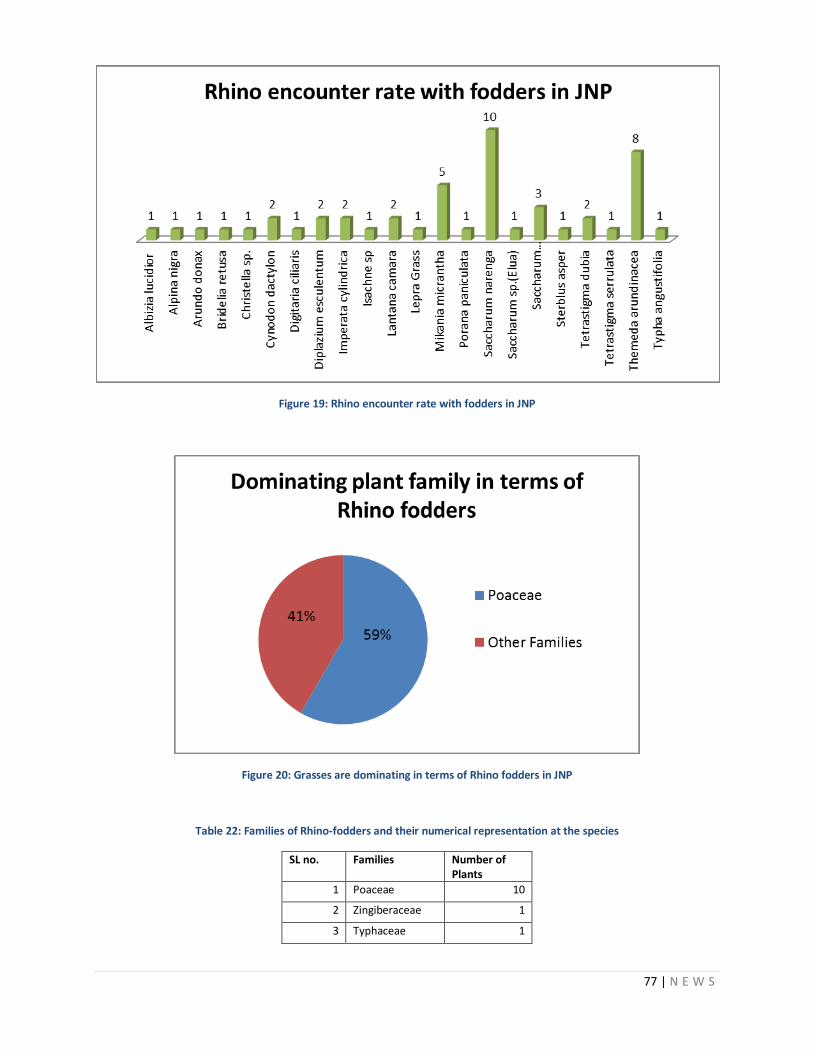
77 | N E W S
Figure 19: Rhino encounter rate with fodders in JNP
Figure 20: Grasses are dominating in terms of Rhino fodders in JNP
Table 22: Families of Rhino-fodders and their numerical representation at the species
SL no. Families Number of Plants
1 Poaceae 10
2 Zingiberaceae 1
3 Typhaceae 1
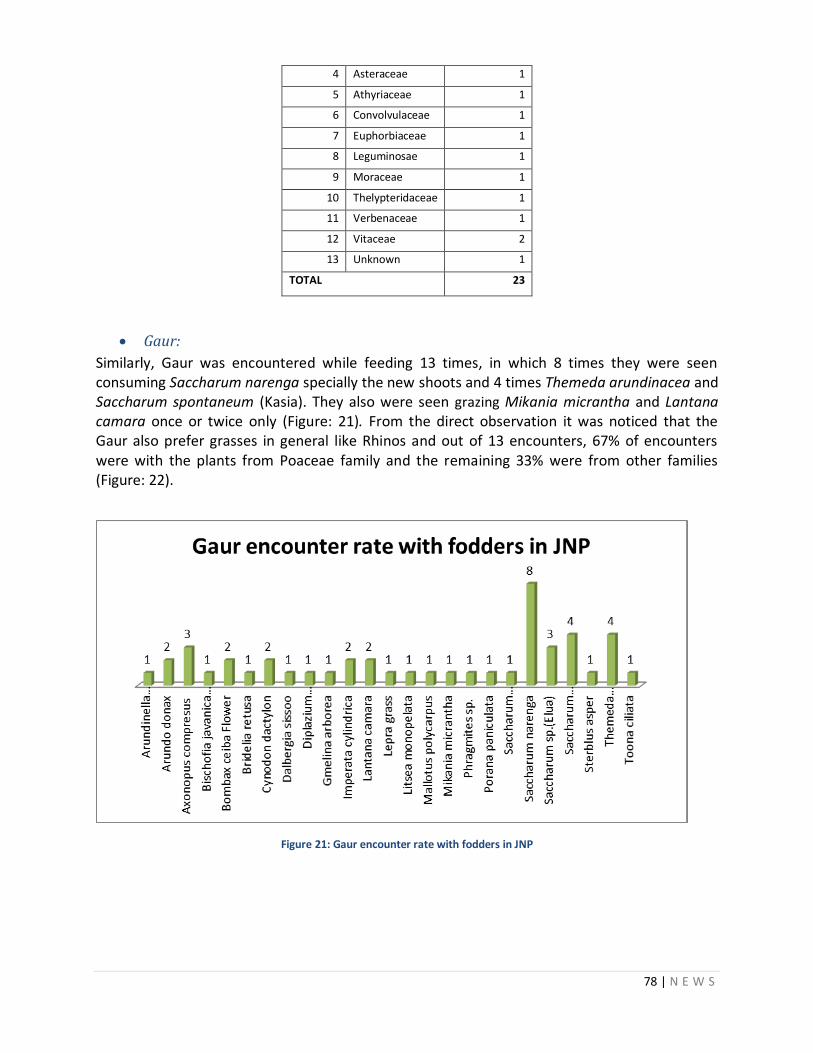
78 | N E W S
4 Asteraceae 1
5 Athyriaceae 1
6 Convolvulaceae 1
7 Euphorbiaceae 1
8 Leguminosae 1
9 Moraceae 1
10 Thelypteridaceae 1
11 Verbenaceae 1
12 Vitaceae 2
13 Unknown 1
TOTAL 23
Gaur:
Similarly, Gaur was encountered while feeding 13 times, in which 8 times they were seen consuming Saccharum narenga specially the new shoots and 4 times Themeda arundinacea and Saccharum spontaneum (Kasia). They also were seen grazing Mikania micrantha and Lantana camara once or twice only (Figure: 21). From the direct observation it was noticed that the Gaur also prefer grasses in general like Rhinos and out of 13 encounters, 67% of encounters were with the plants from Poaceae family and the remaining 33% were from other families (Figure: 22).
Figure 21: Gaur encounter rate with fodders in JNP
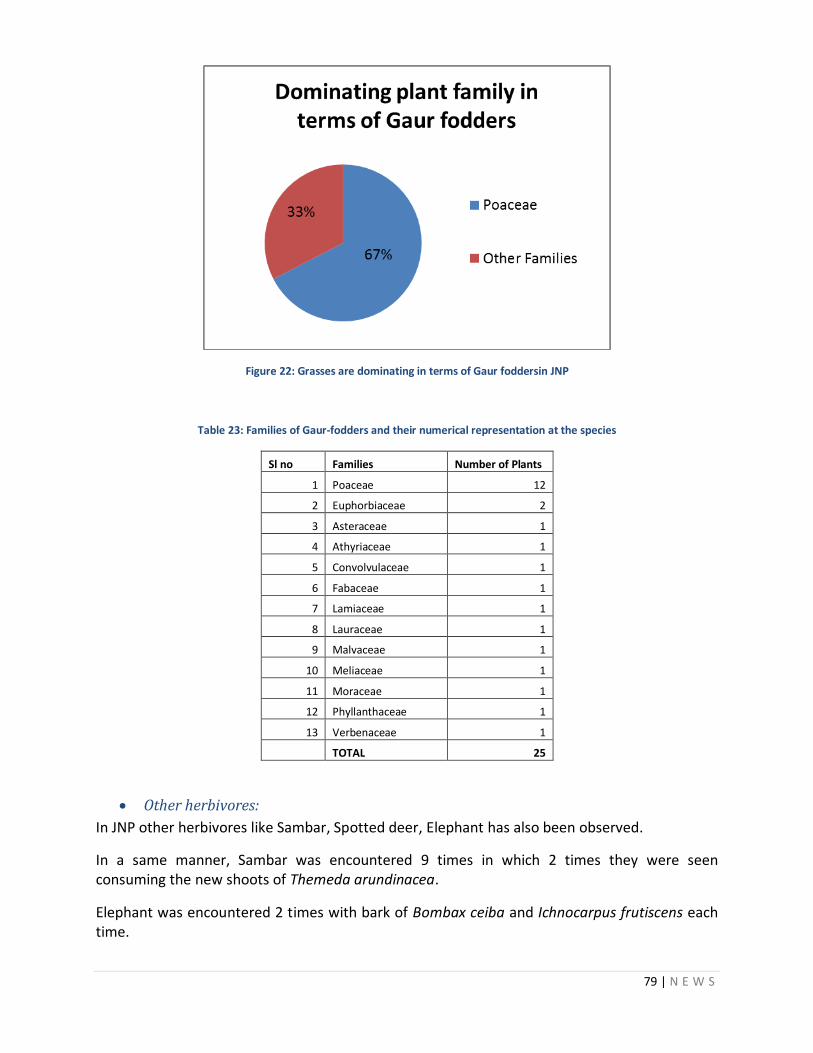
79 | N E W S
Figure 22: Grasses are dominating in terms of Gaur foddersin JNP
Table 23: Families of Gaur-fodders and their numerical representation at the species
Sl no Families Number of Plants
1 Poaceae 12
2 Euphorbiaceae 2
3 Asteraceae 1
4 Athyriaceae 1
5 Convolvulaceae 1
6 Fabaceae 1
7 Lamiaceae 1
8 Lauraceae 1
9 Malvaceae 1
10 Meliaceae 1
11 Moraceae 1
12 Phyllanthaceae 1
13 Verbenaceae 1
TOTAL 25
Other herbivores:
In JNP other herbivores like Sambar, Spotted deer, Elephant has also been observed.
In a same manner, Sambar was encountered 9 times in which 2 times they were seen consuming the new shoots of Themeda arundinacea.
Elephant was encountered 2 times with bark of Bombax ceiba and Ichnocarpus frutiscens each time.
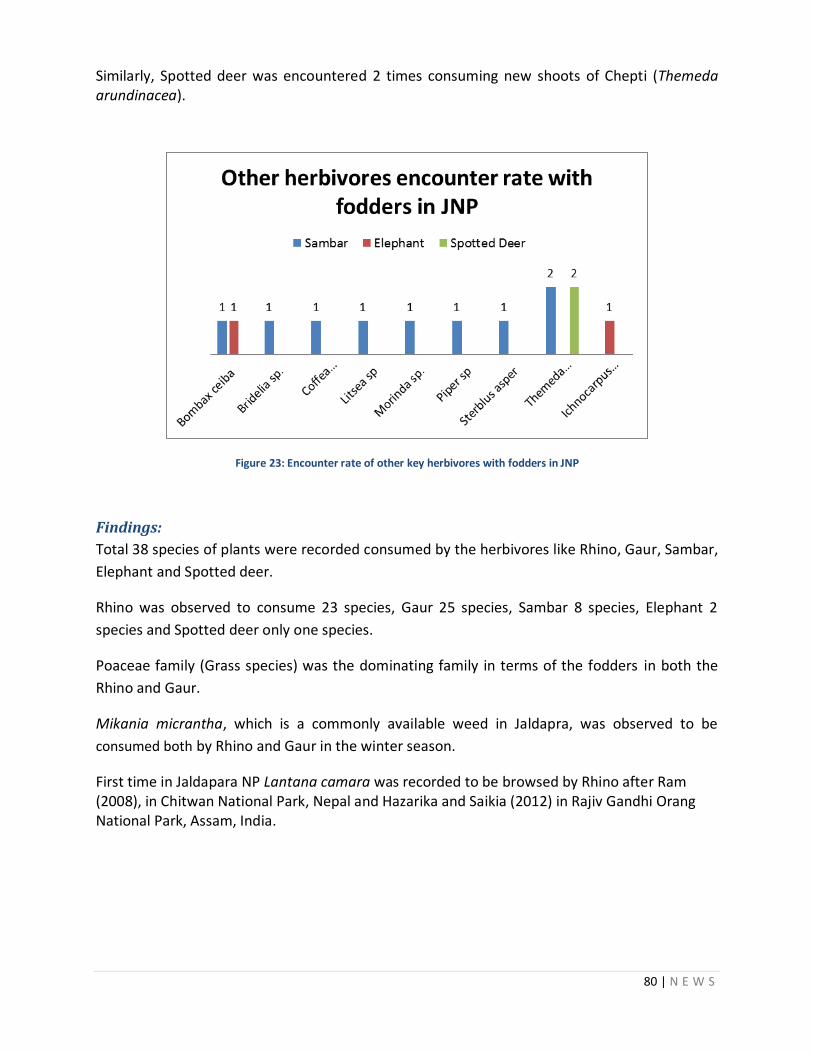
80 | N E W S
Similarly, Spotted deer was encountered 2 times consuming new shoots of Chepti (Themeda arundinacea).
Figure 23: Encounter rate of other key herbivores with fodders in JNP
Findings:
Total 38 species of plants were recorded consumed by the herbivores like Rhino, Gaur, Sambar,
Elephant and Spotted deer.
Rhino was observed to consume 23 species, Gaur 25 species, Sambar 8 species, Elephant 2
species and Spotted deer only one species.
Poaceae family (Grass species) was the dominating family in terms of the fodders in both the
Rhino and Gaur.
Mikania micrantha, which is a commonly available weed in Jaldapra, was observed to be
consumed both by Rhino and Gaur in the winter season.
First time in Jaldapara NP Lantana camara was recorded to be browsed by Rhino after Ram (2008), in Chitwan National Park, Nepal and Hazarika and Saikia (2012) in Rajiv Gandhi Orang National Park, Assam, India.
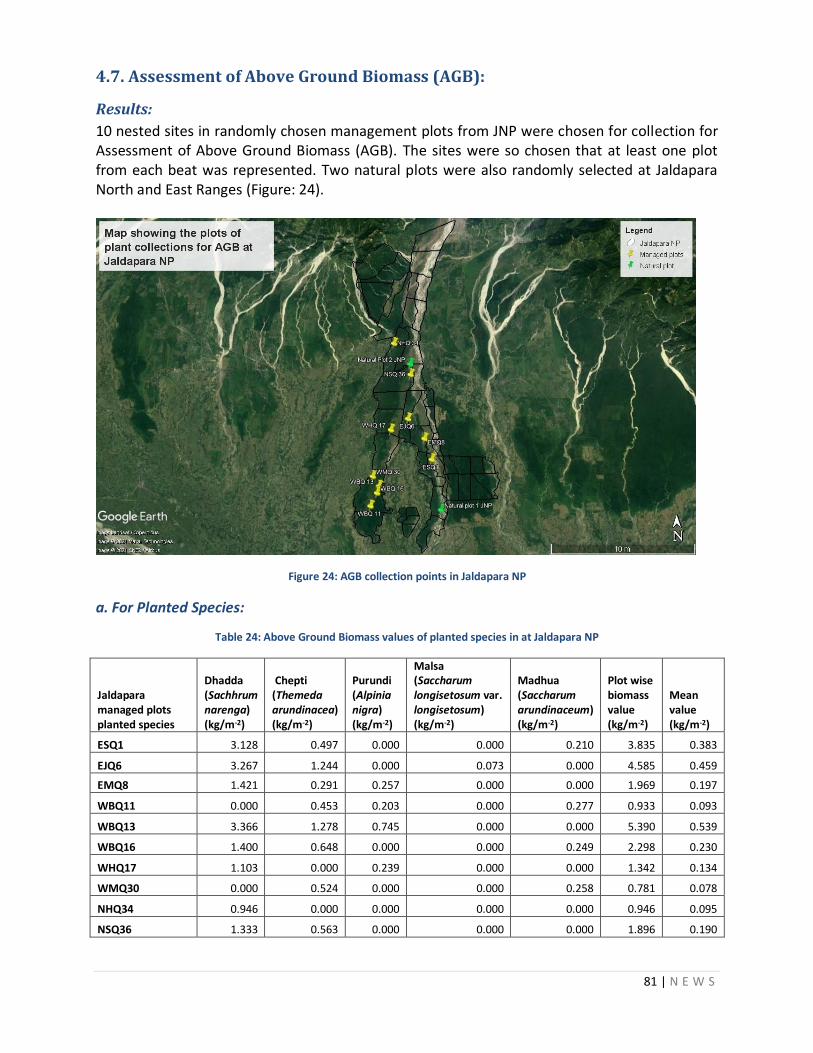
81 | N E W S
4.7. Assessment of Above Ground Biomass (AGB):
Results:
10 nested sites in randomly chosen management plots from JNP were chosen for collection for Assessment of Above Ground Biomass (AGB). The sites were so chosen that at least one plot from each beat was represented. Two natural plots were also randomly selected at Jaldapara North and East Ranges (Figure: 24).
Figure 24: AGB collection points in Jaldapara NP
a. For Planted Species:
Table 24: Above Ground Biomass values of planted species in at Jaldapara NP
Jaldapara managed plots planted species
Dhadda (Sachhrum narenga) (kg/m-2)
Chepti (Themeda arundinacea) (kg/m-2)
Purundi (Alpinia nigra) (kg/m-2)
Malsa (Saccharum longisetosum var. longisetosum) (kg/m-2)
Madhua (Saccharum arundinaceum) (kg/m-2)
Plot wise biomass value (kg/m-2)
Mean value (kg/m-2)
ESQ1 3.128 0.497 0.000 0.000 0.210 3.835 0.383
EJQ6 3.267 1.244 0.000 0.073 0.000 4.585 0.459
EMQ8 1.421 0.291 0.257 0.000 0.000 1.969 0.197
WBQ11 0.000 0.453 0.203 0.000 0.277 0.933 0.093
WBQ13 3.366 1.278 0.745 0.000 0.000 5.390 0.539
WBQ16 1.400 0.648 0.000 0.000 0.249 2.298 0.230
WHQ17 1.103 0.000 0.239 0.000 0.000 1.342 0.134
WMQ30 0.000 0.524 0.000 0.000 0.258 0.781 0.078
NHQ34 0.946 0.000 0.000 0.000 0.000 0.946 0.095
NSQ36 1.333 0.563 0.000 0.000 0.000 1.896 0.190

82 | N E W S
Species wise Biomass value 15.966 5.499 1.444 0.073 0.994 23.975
Mean Value 1.597 0.550 0.144 0.007 0.099 2.3975
Estimated Biomass for planted species = 2.3975 kg/m-2 or 23975 kg/ha ≈ 24000kg/ha
Calculating of forage:
After determining annual forage production/ha (plant biomass) of planted species, using Voelkel's estimation method, the total annual forage produced by planted species in the management area must be calculated by following formula:
Available area for grazing X Forage production/ha = Total forage/year
The total grassland management area in Jaldapara is 3366 ha (Anon, 2018; in heading no. 6.2.2.5 Grass land management, under subheading Category of grass land, page no 119-120).
So, Total forage in the management plot for the planted species for the year would be:
3366 X 24000 kg/ha = 80784000 kg/year
According to Voelkel et al. 2018, only 25% of the total forage production is utilized by grazers. Therefore, consumable forage would be produced, as follows for the managed grassland available for grazing in Park:
Total forage/year X 0.25 = Consumable forage/year
80784000 X 0.25= 20196000 kg/ year
There are also areas in forest land that herbivores do not graze, such as heavy brush, weeds, other non-fodder species etc. To reduce the risk of overgrazing, these areas were removed from the calculation. In this case, from our vegetation occupancy percentage value it was estimated that planted species occupy only 9.24% in premonsoon season and 10.10% in postmosoon season for managed area. Therefore, the average value of the above-mentioned seasons we have taken consideration for this calculation which is 9.67% (Figure: 8) only for planted species in Jaldapara NP.
Therefore, the available forage would be determined as follows:
Consumable forage X % Grazeable areas = Available forage kg /year
20196000 kg/ year X 0.09= 1938816 Kg/year
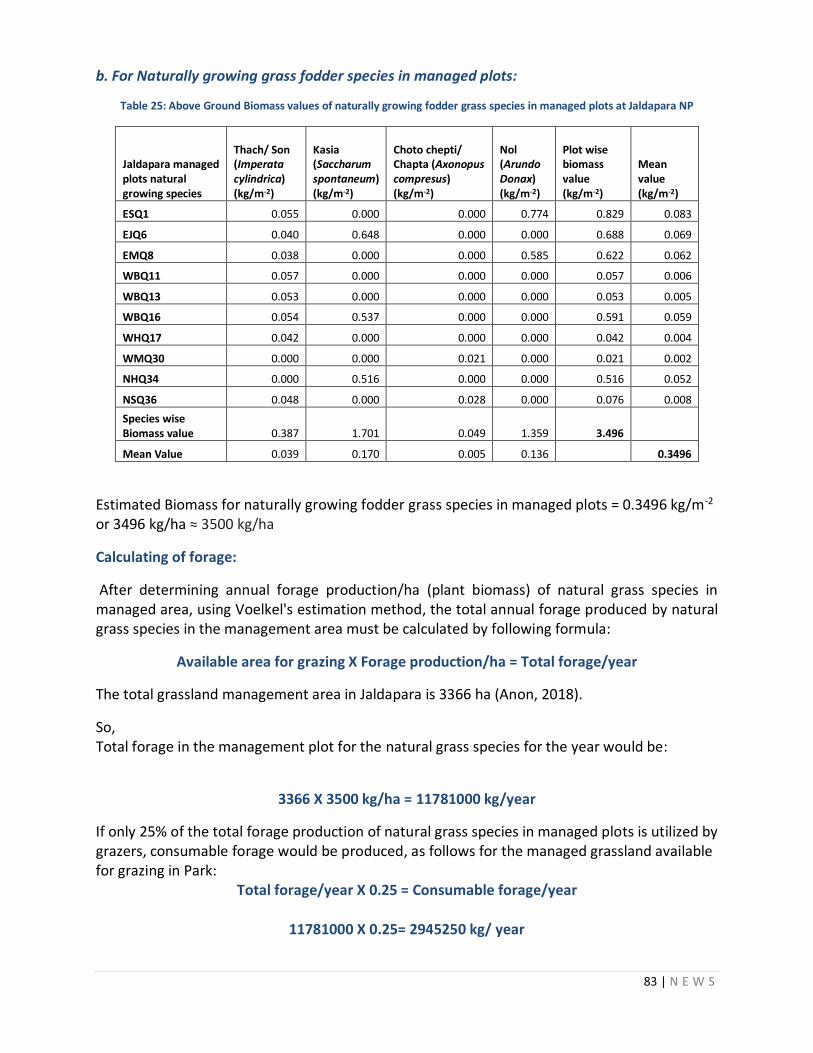
83 | N E W S
b. For Naturally growing grass fodder species in managed plots:
Table 25: Above Ground Biomass values of naturally growing fodder grass species in managed plots at Jaldapara NP
Jaldapara managed plots natural growing species
Thach/ Son (Imperata cylindrica) (kg/m-2)
Kasia (Saccharum spontaneum) (kg/m-2)
Choto chepti/ Chapta (Axonopus compresus) (kg/m-2)
Nol (Arundo Donax) (kg/m-2)
Plot wise biomass value (kg/m-2)
Mean value (kg/m-2)
ESQ1 0.055 0.000 0.000 0.774 0.829 0.083
EJQ6 0.040 0.648 0.000 0.000 0.688 0.069
EMQ8 0.038 0.000 0.000 0.585 0.622 0.062
WBQ11 0.057 0.000 0.000 0.000 0.057 0.006
WBQ13 0.053 0.000 0.000 0.000 0.053 0.005
WBQ16 0.054 0.537 0.000 0.000 0.591 0.059
WHQ17 0.042 0.000 0.000 0.000 0.042 0.004
WMQ30 0.000 0.000 0.021 0.000 0.021 0.002
NHQ34 0.000 0.516 0.000 0.000 0.516 0.052
NSQ36 0.048 0.000 0.028 0.000 0.076 0.008
Species wise Biomass value 0.387 1.701 0.049 1.359 3.496
Mean Value 0.039 0.170 0.005 0.136 0.3496
Estimated Biomass for naturally growing fodder grass species in managed plots = 0.3496 kg/m-2
or 3496 kg/ha ≈ 3500 kg/ha
Calculating of forage:
After determining annual forage production/ha (plant biomass) of natural grass species in managed area, using Voelkel's estimation method, the total annual forage produced by natural grass species in the management area must be calculated by following formula:
Available area for grazing X Forage production/ha = Total forage/year
The total grassland management area in Jaldapara is 3366 ha (Anon, 2018).
So, Total forage in the management plot for the natural grass species for the year would be:
3366 X 3500 kg/ha = 11781000 kg/year
If only 25% of the total forage production of natural grass species in managed plots is utilized by grazers, consumable forage would be produced, as follows for the managed grassland available for grazing in Park:
Total forage/year X 0.25 = Consumable forage/year
11781000 X 0.25= 2945250 kg/ year
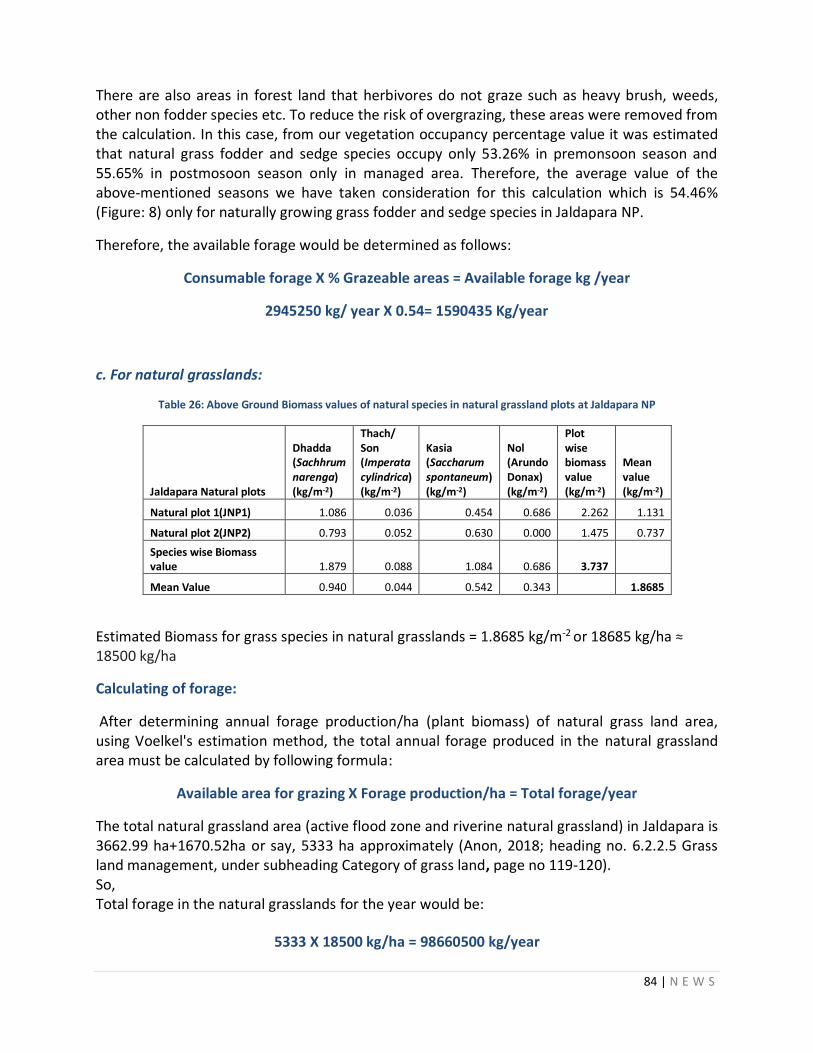
84 | N E W S
There are also areas in forest land that herbivores do not graze such as heavy brush, weeds, other non fodder species etc. To reduce the risk of overgrazing, these areas were removed from the calculation. In this case, from our vegetation occupancy percentage value it was estimated that natural grass fodder and sedge species occupy only 53.26% in premonsoon season and 55.65% in postmosoon season only in managed area. Therefore, the average value of the above-mentioned seasons we have taken consideration for this calculation which is 54.46% (Figure: 8) only for naturally growing grass fodder and sedge species in Jaldapara NP.
Therefore, the available forage would be determined as follows:
Consumable forage X % Grazeable areas = Available forage kg /year
2945250 kg/ year X 0.54= 1590435 Kg/year
c. For natural grasslands:
Table 26: Above Ground Biomass values of natural species in natural grassland plots at Jaldapara NP
Jaldapara Natural plots
Dhadda (Sachhrum narenga) (kg/m-2)
Thach/ Son (Imperata cylindrica) (kg/m-2)
Kasia (Saccharum spontaneum) (kg/m-2)
Nol (Arundo Donax) (kg/m-2)
Plot wise biomass value (kg/m-2)
Mean value (kg/m-2)
Natural plot 1(JNP1) 1.086 0.036 0.454 0.686 2.262 1.131
Natural plot 2(JNP2) 0.793 0.052 0.630 0.000 1.475 0.737
Species wise Biomass value 1.879 0.088 1.084 0.686 3.737
Mean Value 0.940 0.044 0.542 0.343 1.8685
Estimated Biomass for grass species in natural grasslands = 1.8685 kg/m-2 or 18685 kg/ha ≈ 18500 kg/ha
Calculating of forage:
After determining annual forage production/ha (plant biomass) of natural grass land area, using Voelkel's estimation method, the total annual forage produced in the natural grassland area must be calculated by following formula:
Available area for grazing X Forage production/ha = Total forage/year
The total natural grassland area (active flood zone and riverine natural grassland) in Jaldapara is 3662.99 ha+1670.52ha or say, 5333 ha approximately (Anon, 2018; heading no. 6.2.2.5 Grass land management, under subheading Category of grass land, page no 119-120). So, Total forage in the natural grasslands for the year would be:
5333 X 18500 kg/ha = 98660500 kg/year
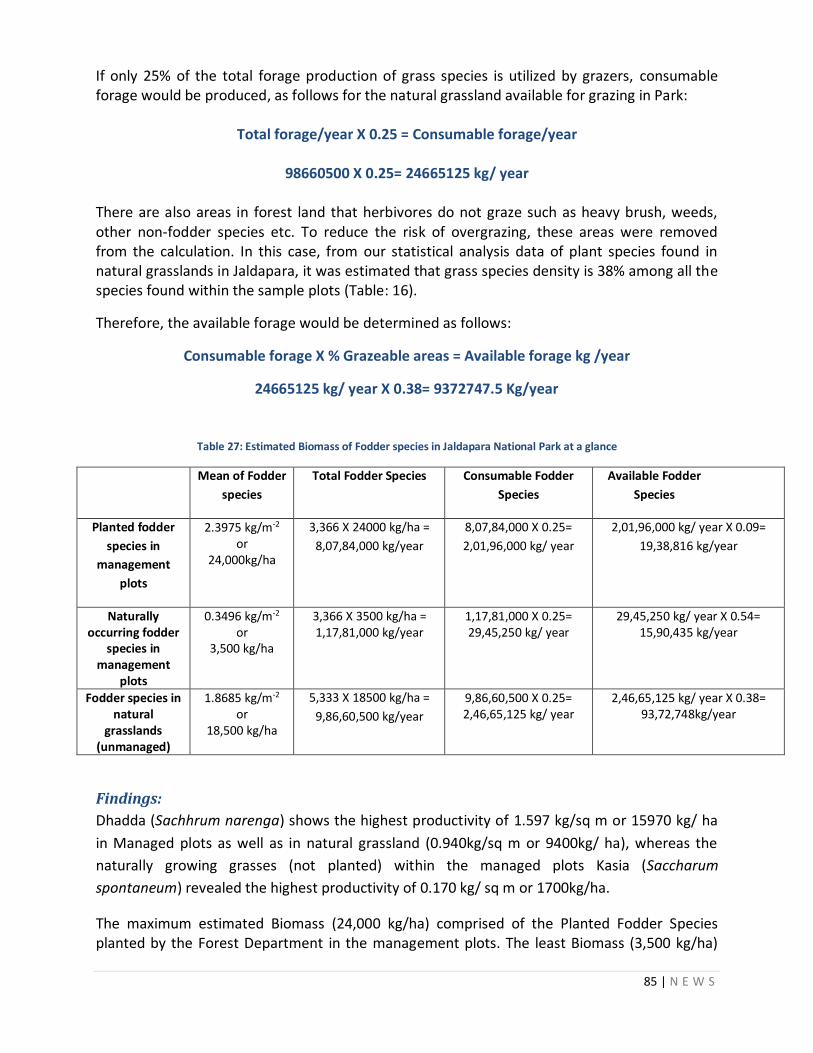
85 | N E W S
If only 25% of the total forage production of grass species is utilized by grazers, consumable forage would be produced, as follows for the natural grassland available for grazing in Park:
Total forage/year X 0.25 = Consumable forage/year
98660500 X 0.25= 24665125 kg/ year
There are also areas in forest land that herbivores do not graze such as heavy brush, weeds, other non-fodder species etc. To reduce the risk of overgrazing, these areas were removed from the calculation. In this case, from our statistical analysis data of plant species found in natural grasslands in Jaldapara, it was estimated that grass species density is 38% among all the species found within the sample plots (Table: 16).
Therefore, the available forage would be determined as follows:
Consumable forage X % Grazeable areas = Available forage kg /year
24665125 kg/ year X 0.38= 9372747.5 Kg/year
Table 27: Estimated Biomass of Fodder species in Jaldapara National Park at a glance
Mean of Fodder
species
Total Fodder Species Consumable Fodder
Species
Available Fodder
Species
Planted fodder
species in
management
plots
2.3975 kg/m-2 or
24,000kg/ha
3,366 X 24000 kg/ha =
8,07,84,000 kg/year
8,07,84,000 X 0.25=
2,01,96,000 kg/ year
2,01,96,000 kg/ year X 0.09=
19,38,816 kg/year
Naturally occurring fodder
species in management
plots
0.3496 kg/m-2 or
3,500 kg/ha
3,366 X 3500 kg/ha = 1,17,81,000 kg/year
1,17,81,000 X 0.25= 29,45,250 kg/ year
29,45,250 kg/ year X 0.54= 15,90,435 kg/year
Fodder species in natural
grasslands (unmanaged)
1.8685 kg/m-2 or
18,500 kg/ha
5,333 X 18500 kg/ha =
9,86,60,500 kg/year
9,86,60,500 X 0.25= 2,46,65,125 kg/ year
2,46,65,125 kg/ year X 0.38= 93,72,748kg/year
Findings:
Dhadda (Sachhrum narenga) shows the highest productivity of 1.597 kg/sq m or 15970 kg/ ha
in Managed plots as well as in natural grassland (0.940kg/sq m or 9400kg/ ha), whereas the
naturally growing grasses (not planted) within the managed plots Kasia (Saccharum
spontaneum) revealed the highest productivity of 0.170 kg/ sq m or 1700kg/ha.
The maximum estimated Biomass (24,000 kg/ha) comprised of the Planted Fodder Species planted by the Forest Department in the management plots. The least Biomass (3,500 kg/ha)
86 | N E W S
occurred among the Naturally occurring Fodder Species, which were not planted, growing simultaneously along with planted species in the management plots. In between was the Biomass (18,500 kg/ha) of the Fodder Species that occurred naturally in the Natural Grasslands (untouched/unmanaged). However, when the Biomass of the total Fodder Species was calculated as per the available area to each of them, revealed that the Biomass of the Fodder Species in Natural Grasslands (unmanaged) was the highest (9,86,60,500 kg/year), while the next highest Biomass (8,07,84,000 kg/year) was seen to be in Planted Fodder Species in management plots and the least Biomass (1,17,81,000 kg/year) in the Naturally occurring Fodder Species in management plots. Interestingly, if the total Biomass of Fodder Species (both Planted and Naturally occurring) in the management plots were taken together, it is seen that the Biomass is more or less the same Biomass (9,25,65,000 kg/year) as in the Natural Grasslands. This trend was seen to be the same when the Biomass of Consumable Fodder Species were tabulated, as only 25% was estimated to be utilized in each case, and irrespective of wherever they occurred. Finally when the percentage of the Fodder Species as recorded in the quantitative and qualitative sampling results in each case were tabulated with the Biomass of the Consumable Fodder Species to obtain the Biomass of the Available Fodder Species it was seen that the highest Biomass of 93,72,748 kg/year occurred in Fodder Species in Natural Grasslands (untouched/unmanaged), followed by the Biomass (19,38,816 kg/year) of Planted Fodder Species in management plots and least by the Biomass (15,90,435 kg/year) of Naturally occurring Fodder Species in management plots. In fact, if both the Available Biomass of the Planted Fodder Species and the Naturally occurring Fodder Species in management plots were added together, the total Biomass (35,29,251 kg/year) Available as Fodder Species in management plots is approximately only 1/3rd of the Available Biomass of Fodder Species in Natural Grasslands (untouched/unmanaged).

87 | N E W S
4.8. Carrying Capacity
As Rhino is the keystone species here the calculation of carrying capacity is based on the Rhino suitable grassland area. Besides Rhino and Gaur, Elephant is also considered for this calculation as they preferred the same habitat in Jaldapara NP (Anon., 2018) as both the animals preferred grass species as primary fodders in this region (Peden et. al., 1974; Banerjee, 1993; Ghosh and Das, 2007; Roy, 2010; Lahkar et. al., 2018).
An adult rhino eats between 60–80 kg a day fresh weight and spends most of its time browsing or grazing (Dinerstein, 2003). In addition, the food primarily consists of Saccharum species and other grass species. According to Coombs & Vlitos (1978) estimation, the standing biomass of sugarcane is 100 MT/ha fresh weight or 35 MT/ha dry weight, which gives a fresh/dry ratio of 100/35. So, if one rhino eats approximately 21–28 kg/day of dry weight, assuming the mid value of this range, 24.5 kg/day, the annual food requirement of one Rhino is 24.5 kg/day x 365 day/year = 8.9 Tons/year≈9 tons/year or 9000 Kg/year. Likewise for Asian Elephant it is assuming that they consume about 1.5–2.5% of its body weight of dry fodder (Sukumar, 2003) every day. Therefore, the middle value was taken consideration for this study. For the other ruminant herbivores, the consume rate is around 2% of their body weight (Murray, 1995). On the basis of their body weight the approximate DM intake value/ year are following (Table: 28).
Table 28: Body weight and Dry matter intake value
Sl. No Common Name Scientific Name Average Body Weight
(Kg.)
DM intake per day (Kg)
Total DM requirement/year
(Kg)
1 One Horned Rhino Rhinoceros unicornis 1600© 24.5 8900 ≈ 9000
2 Indian bison or Gaur Bos gaurus 600+ 12 4380 ≈4000
3 Asian Elephant Elephas maximus 2500* 50 18250
Total DM requirement for Rhino, Gaur and Elephant 31250
(+Mathur; 1991, *Roy 2010, ©Macdonald 2001)
Multiple grazing species has been considered in this case, so, to determine the total animal forage requirement, all the considered animals’ annual requirement has been added up and applied to the main formula of carrying capacity (Table: 28).
Therefore, only for available forage in planted species in Jaldapara,
88 | N E W S
Carrying Capacity (K) or AU = 1938816/ (9000+4000+18250) = 1938816*/ 31250 = 62.04 AU ≈ 62 AU/year *The Available forage only calculated for planted species
62 AU/Year means, the planted species of Managed area can hold a total of 62 animals (Rhino+ gaur+ elephant) per year if the forage availably, per day consumption rate for individual animals and the other environmental conditions are constant. The intake capacities of the herbivores are different as per their body weight and one gaur cannot consume the same amount as Rhino or elephant. Therefore, as per their consumption rate (Table: 28) it can be assumed that one rhino can consume fodders same as 2.3 numbers of gaur and half of an elephant. Hence, using this logic, the planted species of grass fodder managed plot in Jaldapara NP can support 17 Rhinos, 37 Gaurs and 8 elephants at a time. [Note: The biomass study was done in the dry season of the year 2020 and could not be collected data in the
wet seasons as the nationwide lockdown was imposed for Covid 19 Pandemic and the situation gets better only
after the wet season. So, the carrying capacity is calculated here only basis for the dry season biomass
availability]
For, only for forage available for natural grass species in managed plot in Jaldapara NP Carrying Capacity (K) or AU = 1590435/ (9000+4000+18250) = 1590435*/31250 = 50.89 AU ≈ 51 AU/year *The Available forage only calculated for naturally occurring grass species within managed plots
In the same manner, the carrying capacity of the natural occurring species in managed plot of Jaldapara is 14 Rhinos, 31 Gaurs and 7 elephants at a time. For, only for forage available in natural grass lands of in Jaldapara NP Carrying Capacity (K) or AU = 9372747.5/ (9000+4000+18250) = 9372747.5*/31250 = 299.93 AU ≈ 300 AU/year *The Available forage only calculated for grass fodder species within natural grassland
The natural grasslands of Jaldapara can support 80 Rhinos, 180 Gaurs and 40 elephants at a
time.
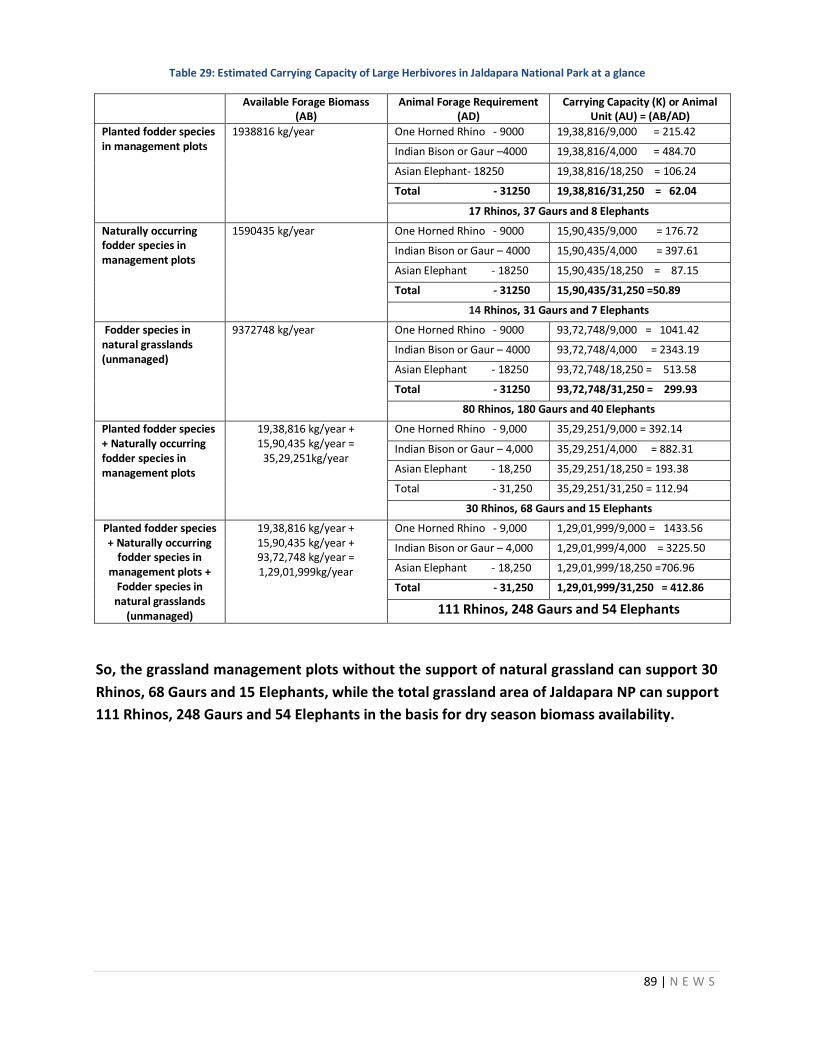
89 | N E W S
Table 29: Estimated Carrying Capacity of Large Herbivores in Jaldapara National Park at a glance
Available Forage Biomass (AB)
Animal Forage Requirement (AD)
Carrying Capacity (K) or Animal Unit (AU) = (AB/AD)
Planted fodder species in management plots
1938816 kg/year One Horned Rhino - 9000 19,38,816/9,000 = 215.42
Indian Bison or Gaur –4000 19,38,816/4,000 = 484.70
Asian Elephant- 18250 19,38,816/18,250 = 106.24
Total - 31250 19,38,816/31,250 = 62.04
17 Rhinos, 37 Gaurs and 8 Elephants
Naturally occurring fodder species in management plots
1590435 kg/year One Horned Rhino - 9000 15,90,435/9,000 = 176.72
Indian Bison or Gaur – 4000 15,90,435/4,000 = 397.61
Asian Elephant - 18250 15,90,435/18,250 = 87.15
Total - 31250 15,90,435/31,250 =50.89
14 Rhinos, 31 Gaurs and 7 Elephants
Fodder species in natural grasslands (unmanaged)
9372748 kg/year One Horned Rhino - 9000 93,72,748/9,000 = 1041.42
Indian Bison or Gaur – 4000 93,72,748/4,000 = 2343.19
Asian Elephant - 18250 93,72,748/18,250 = 513.58
Total - 31250 93,72,748/31,250 = 299.93
80 Rhinos, 180 Gaurs and 40 Elephants
Planted fodder species + Naturally occurring fodder species in management plots
19,38,816 kg/year + 15,90,435 kg/year =
35,29,251kg/year
One Horned Rhino - 9,000 35,29,251/9,000 = 392.14
Indian Bison or Gaur – 4,000 35,29,251/4,000 = 882.31
Asian Elephant - 18,250 35,29,251/18,250 = 193.38
Total - 31,250 35,29,251/31,250 = 112.94
30 Rhinos, 68 Gaurs and 15 Elephants
Planted fodder species + Naturally occurring
fodder species in management plots +
Fodder species in natural grasslands
(unmanaged)
19,38,816 kg/year + 15,90,435 kg/year + 93,72,748 kg/year = 1,29,01,999kg/year
One Horned Rhino - 9,000 1,29,01,999/9,000 = 1433.56
Indian Bison or Gaur – 4,000 1,29,01,999/4,000 = 3225.50
Asian Elephant - 18,250 1,29,01,999/18,250 =706.96
Total - 31,250 1,29,01,999/31,250 = 412.86
111 Rhinos, 248 Gaurs and 54 Elephants
So, the grassland management plots without the support of natural grassland can support 30
Rhinos, 68 Gaurs and 15 Elephants, while the total grassland area of Jaldapara NP can support
111 Rhinos, 248 Gaurs and 54 Elephants in the basis for dry season biomass availability.
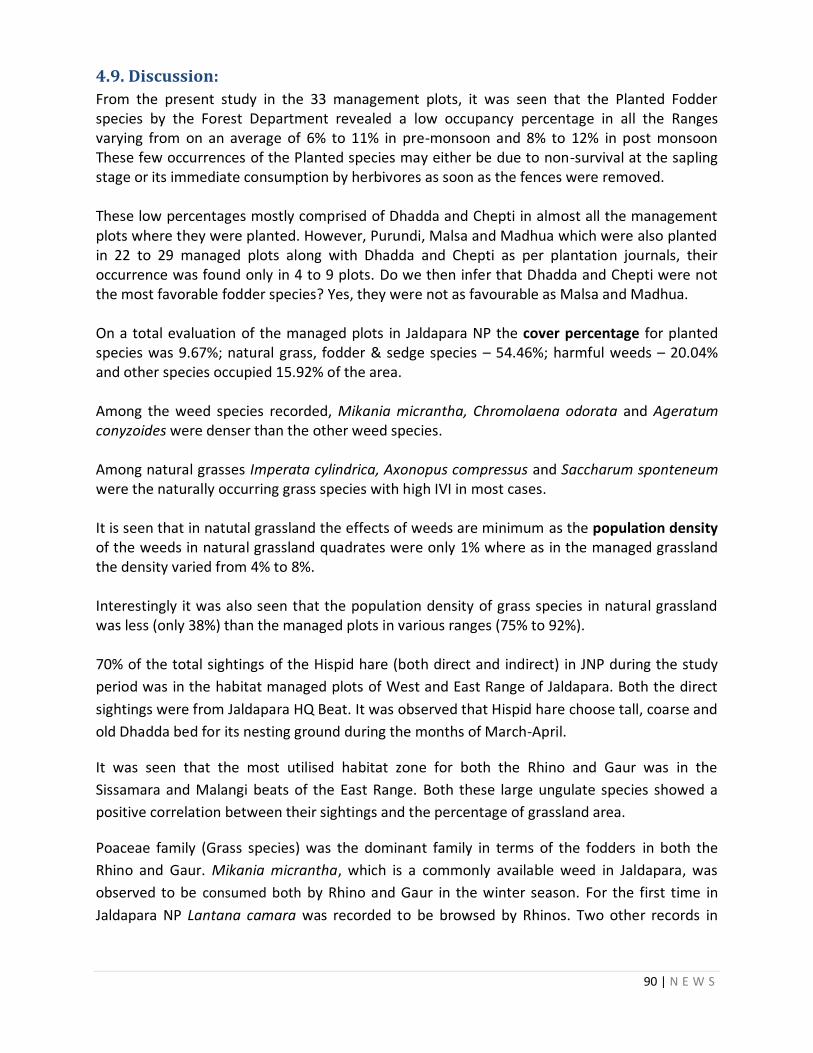
90 | N E W S
4.9. Discussion:
From the present study in the 33 management plots, it was seen that the Planted Fodder species by the Forest Department revealed a low occupancy percentage in all the Ranges varying from on an average of 6% to 11% in pre-monsoon and 8% to 12% in post monsoon These few occurrences of the Planted species may either be due to non-survival at the sapling stage or its immediate consumption by herbivores as soon as the fences were removed. These low percentages mostly comprised of Dhadda and Chepti in almost all the management plots where they were planted. However, Purundi, Malsa and Madhua which were also planted in 22 to 29 managed plots along with Dhadda and Chepti as per plantation journals, their occurrence was found only in 4 to 9 plots. Do we then infer that Dhadda and Chepti were not the most favorable fodder species? Yes, they were not as favourable as Malsa and Madhua. On a total evaluation of the managed plots in Jaldapara NP the cover percentage for planted species was 9.67%; natural grass, fodder & sedge species – 54.46%; harmful weeds – 20.04% and other species occupied 15.92% of the area. Among the weed species recorded, Mikania micrantha, Chromolaena odorata and Ageratum conyzoides were denser than the other weed species. Among natural grasses Imperata cylindrica, Axonopus compressus and Saccharum sponteneum were the naturally occurring grass species with high IVI in most cases. It is seen that in natutal grassland the effects of weeds are minimum as the population density of the weeds in natural grassland quadrates were only 1% where as in the managed grassland the density varied from 4% to 8%. Interestingly it was also seen that the population density of grass species in natural grassland was less (only 38%) than the managed plots in various ranges (75% to 92%). 70% of the total sightings of the Hispid hare (both direct and indirect) in JNP during the study
period was in the habitat managed plots of West and East Range of Jaldapara. Both the direct
sightings were from Jaldapara HQ Beat. It was observed that Hispid hare choose tall, coarse and
old Dhadda bed for its nesting ground during the months of March-April.
It was seen that the most utilised habitat zone for both the Rhino and Gaur was in the
Sissamara and Malangi beats of the East Range. Both these large ungulate species showed a
positive correlation between their sightings and the percentage of grassland area.
Poaceae family (Grass species) was the dominant family in terms of the fodders in both the
Rhino and Gaur. Mikania micrantha, which is a commonly available weed in Jaldapara, was
observed to be consumed both by Rhino and Gaur in the winter season. For the first time in
Jaldapara NP Lantana camara was recorded to be browsed by Rhinos. Two other records in
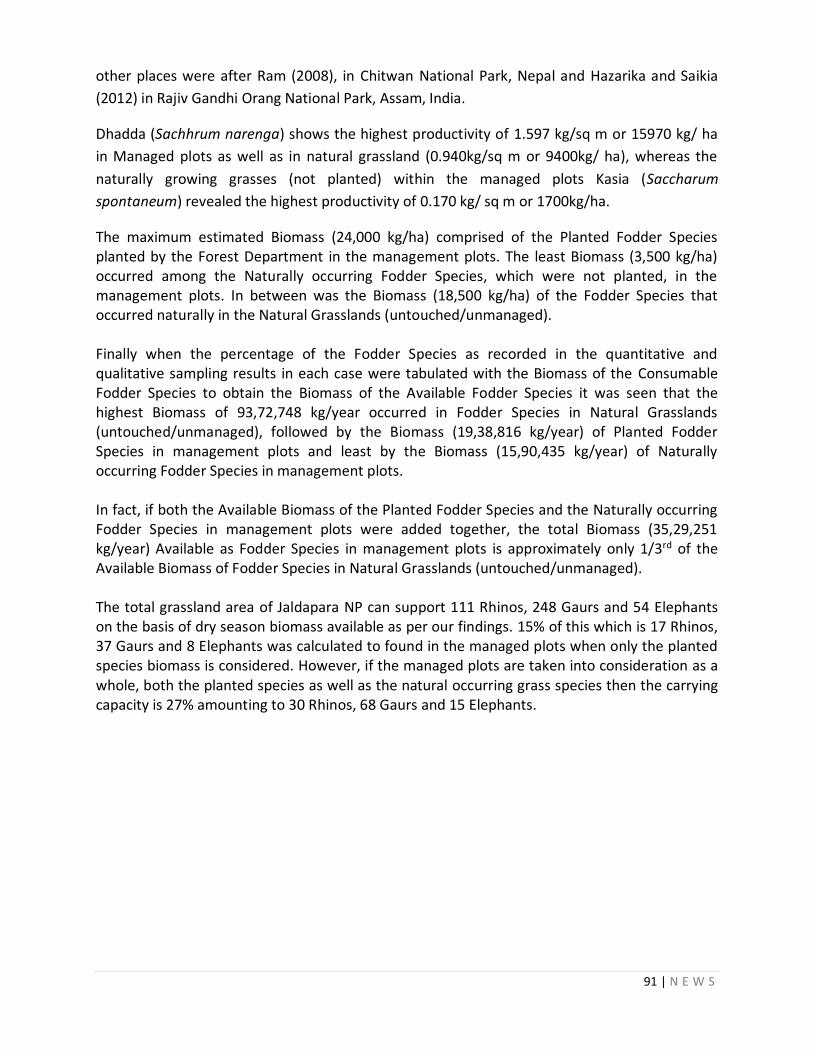
91 | N E W S
other places were after Ram (2008), in Chitwan National Park, Nepal and Hazarika and Saikia
(2012) in Rajiv Gandhi Orang National Park, Assam, India.
Dhadda (Sachhrum narenga) shows the highest productivity of 1.597 kg/sq m or 15970 kg/ ha
in Managed plots as well as in natural grassland (0.940kg/sq m or 9400kg/ ha), whereas the
naturally growing grasses (not planted) within the managed plots Kasia (Saccharum
spontaneum) revealed the highest productivity of 0.170 kg/ sq m or 1700kg/ha.
The maximum estimated Biomass (24,000 kg/ha) comprised of the Planted Fodder Species planted by the Forest Department in the management plots. The least Biomass (3,500 kg/ha) occurred among the Naturally occurring Fodder Species, which were not planted, in the management plots. In between was the Biomass (18,500 kg/ha) of the Fodder Species that occurred naturally in the Natural Grasslands (untouched/unmanaged). Finally when the percentage of the Fodder Species as recorded in the quantitative and qualitative sampling results in each case were tabulated with the Biomass of the Consumable Fodder Species to obtain the Biomass of the Available Fodder Species it was seen that the highest Biomass of 93,72,748 kg/year occurred in Fodder Species in Natural Grasslands (untouched/unmanaged), followed by the Biomass (19,38,816 kg/year) of Planted Fodder Species in management plots and least by the Biomass (15,90,435 kg/year) of Naturally occurring Fodder Species in management plots. In fact, if both the Available Biomass of the Planted Fodder Species and the Naturally occurring Fodder Species in management plots were added together, the total Biomass (35,29,251 kg/year) Available as Fodder Species in management plots is approximately only 1/3rd of the Available Biomass of Fodder Species in Natural Grasslands (untouched/unmanaged). The total grassland area of Jaldapara NP can support 111 Rhinos, 248 Gaurs and 54 Elephants on the basis of dry season biomass available as per our findings. 15% of this which is 17 Rhinos, 37 Gaurs and 8 Elephants was calculated to found in the managed plots when only the planted species biomass is considered. However, if the managed plots are taken into consideration as a whole, both the planted species as well as the natural occurring grass species then the carrying capacity is 27% amounting to 30 Rhinos, 68 Gaurs and 15 Elephants.
92 | N E W S
CHAPTER II
5. Gorumara National Park:
5.1. Study Area:
Since 1895, the present Gorumara National Park was a reserve forest, with an area of 7 sq. km. In 1949 this was extended to an area of 8.61 sq. km. when it was declared as the Gorumara Game Sanctuary. Nearly 27 years later a notification dated 24th June, 1976 was issued under the Wildlife (Protection) Act 1972, declaring it as Gorumara Wildlife Sanctuary. Finally in 1994, nearly two decades later the Wildlife Sanctuary was upgraded to a National Park, with a major extension comprising a total area of over 90 sq km (Mukherjee et al., 2019). The Gorumara National Park today is situated between latitude 26°47'12.5"N to 26°43'25.6"N and longitude 88°52'4.2"E to 88°47'7.3"E in Jalpaiguri district of North Bengal, India. The Park currently has two territorial ranges, four squad ranges, six beats and 7 camps.
The terrain of Gorumara National Park is differentiated into a distinct plateau and a plain area. The soil profile of the area is of alluvial and bhabar formations.
Three main rivers flow within Gorumara NP viz. the Murti, Indong and Garati. These rivers merge with each other and finally meet the Jaldhaka River that forms the boundary of the National Park in the eastern side. Water bodies like Hatidoba, Shealdoba, Gairadoba, Bandiabil, Chukchukie are the other perennial sources of water for the National Park. There are also rivulets and streams passing through the Park which are seasonal in nature, like the Bamni jhora, Saraswati jhora, Mukaddam nala, Neora jhora, Amba khola and Chang khola, carrying water only during rainy season and remaining dry the rest of the year.
Maximum recorded temperature is 37°C (in summer) and a minimum of 4°C (in winter). South-west monsoon is the main source of rainfall. Maximum precipitation occurs from mid-June to September, with a peak in July and August. The average annual rainfall is about 382 cm.
Gorumara National Park is famous for one of the last small pockets in Eastern India harbouring natural population of Great Indian one horned Rhinoceros, along with other mega herbivores. The National Park has immense significance in view of it being situated in the middle of the elephant migratory route between the rivers Tista and Torsa in North Bengal.
The Tondu, Selka, Gorumara, Barohati, Medla, Dhupjhora, Jaldhaka, Panjhora and Indong Blocks of Gorumara NP serve as a major habitat for elephant population and with development of fodder cover and water resources, the elephant depredation problem can be substantially reduced. The same is true for the ever-increasing population of gaurs in the area. However, in spite of having a good habitat for large carnivores, with plenty of food, water and cover, not having tigers which it once had, and though still to-day it is quite rich in leopard population the predator–prey relationship is not ideal.
As the Park is situated in the foothills of Eastern Himalayas, the areas boast a rich biological diversity. This Protected Area is famous for one of the few habitats in Eastern India that
93 | N E W S
harbours natural population of Greater One-horned Rhinoceros (Rhinoceros unicornis), along with other mega-herbivores like Asian Elephant (Elephas maximus), Gaur (Bos gaurus) and other Deer species along with carnivores like Leopard, lesser cats etc. Gorumara National Park has 48 species of mammals (carnivores and herbivores), approximately 195 species of birds, 22 species of reptiles including 7 species of turtles, 40 species of fishes and other macro and micro fauna (Anon, 2007a).
Gorumara National Park has 326 recorded plant species till now (trees 158, herbs - 35, shrubs - 77, grasses - 32, climbers - 15 and orchids - 9) (Anon, 2007a). The entire forest cover of Gorumara National Park comes under the North Indian Moist Tropical Forest (Champion & Seth, 1968) and can be classified into four distinct types 1. North Dry Deciduous Seral Sal-Khair-Sissoo Association, 2. Sal forests - Eastern Bhabar Sal and Eastern Terai Sal, 3. Wet Mixed forests – Sub-Himalayan Secondary Wet Mixed Forests and 4. Savannah Forests & Lower Alluvial Savannah - Sal Savannah (Anon, 2007a). There are three distinct types of savannah forests as per the classification of Champion and Seth, 1968 in this region - a) Moist Sal Savannah (3c/DS1)-Characterized by the presence of scattered Sal along with Kumbhi, Amlaki, Sidha, Tanki etc. The predominant grasses are Sacchanum sp., Arundo donax, Phragmites karka, Imperata cylindrica and Themeda arundinacea. b) Low alluvium savannah woodland (3/1S1) -This is characterized by Bombax - Albizia association. This type is met in the riverine flats that tend to be flooded during the rainy season but dry out during rest of the year. Trees include Simul, Siris and other important species like Khair, Kainjal and Pitali appear here. Grasses are very dense, sometimes 4-5 mt. high and consist of Saccharum procerum, S. spontaneum, Phragmities karka, Arundo donax, Themeda arundinacea, Imperata spp. etc. c) Eastern alluvial grassland (4D/252) -This is found in patches inside the National Park where the tract is deeply flooded during monsoon and becomes completely dry in summer months and soil becomes hard. The alteration of moisture conditions seems to inhibit any tree growth and has resulted in the pure grassland on the banks of the river Jaldhaka, Murti. The grasses are very tall and are the principal dwelling place for one horned rhinoceros. The grass species found here are Saccharum spontaneum, S. Procerum, Erianthus arundinacea, Phragmities karka, Arundo donax, Malsa and Setaria species. This area provides the main fodder base for the herbivores. Natural Savannah is present mostly in Jaldhaka-1b, Dhupjhora-1a, 1b, 1c blocks mainly of Gorumara NP. A limiting factor for conservation of Rhinoceros in Gorumara National Park is the serious limitation of suitable grassland habitat for the species (Anon, 2007a). This severe restriction of grazing area automatically limits the scope of population growth and sustainability of a larger population of these large herbivores. Moreover, succession of tree species is another most important factor for change in the grassland composition. In the natural process, depending on the climatic conditions fertile soil and underground moisture regime, the grasslands are colonized by tree species like Khair,
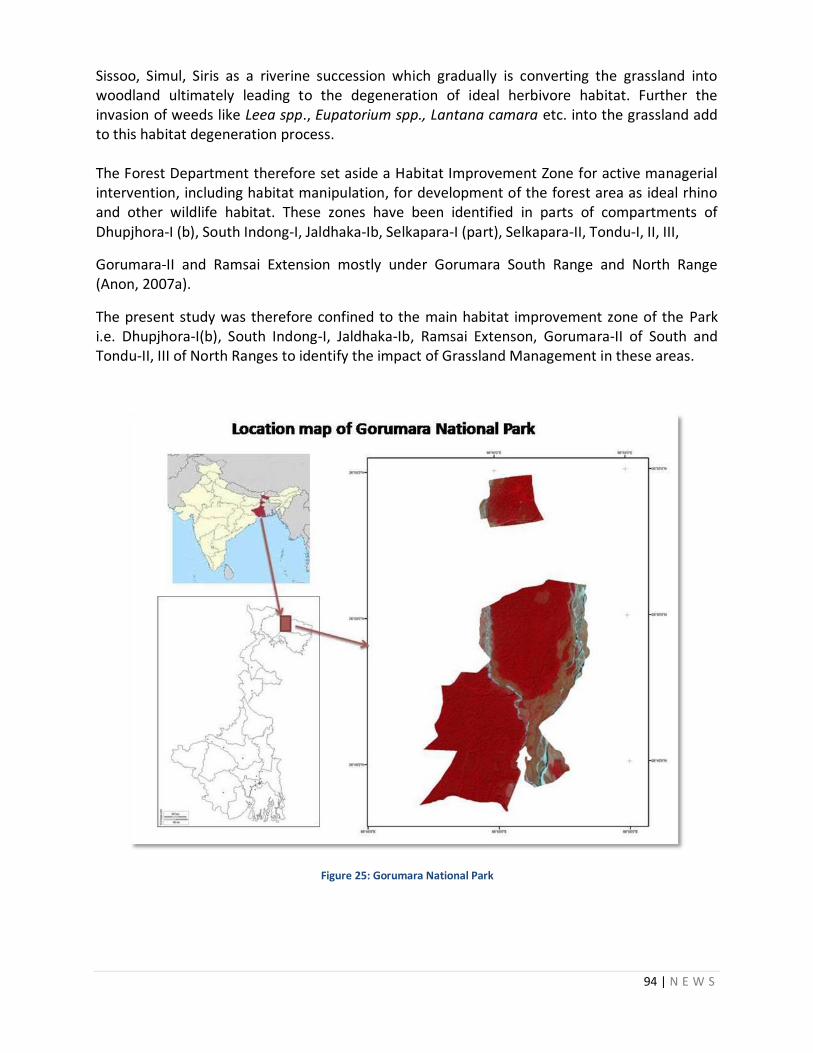
94 | N E W S
Sissoo, Simul, Siris as a riverine succession which gradually is converting the grassland into woodland ultimately leading to the degeneration of ideal herbivore habitat. Further the invasion of weeds like Leea spp., Eupatorium spp., Lantana camara etc. into the grassland add to this habitat degeneration process. The Forest Department therefore set aside a Habitat Improvement Zone for active managerial intervention, including habitat manipulation, for development of the forest area as ideal rhino and other wildlife habitat. These zones have been identified in parts of compartments of Dhupjhora-I (b), South Indong-I, Jaldhaka-Ib, Selkapara-I (part), Selkapara-II, Tondu-I, II, III,
Gorumara-II and Ramsai Extension mostly under Gorumara South Range and North Range (Anon, 2007a).
The present study was therefore confined to the main habitat improvement zone of the Park i.e. Dhupjhora-I(b), South Indong-I, Jaldhaka-Ib, Ramsai Extenson, Gorumara-II of South and Tondu-II, III of North Ranges to identify the impact of Grassland Management in these areas.
Figure 25: Gorumara National Park
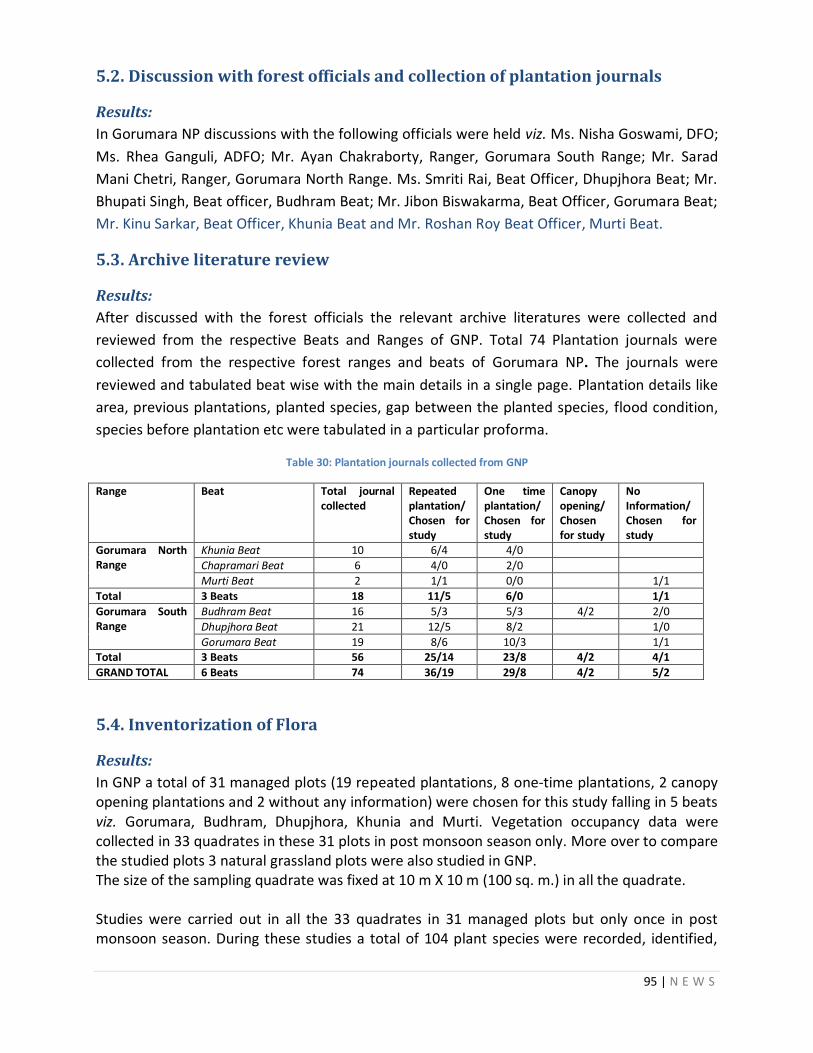
95 | N E W S
5.2. Discussion with forest officials and collection of plantation journals
Results:
In Gorumara NP discussions with the following officials were held viz. Ms. Nisha Goswami, DFO;
Ms. Rhea Ganguli, ADFO; Mr. Ayan Chakraborty, Ranger, Gorumara South Range; Mr. Sarad
Mani Chetri, Ranger, Gorumara North Range. Ms. Smriti Rai, Beat Officer, Dhupjhora Beat; Mr.
Bhupati Singh, Beat officer, Budhram Beat; Mr. Jibon Biswakarma, Beat Officer, Gorumara Beat;
Mr. Kinu Sarkar, Beat Officer, Khunia Beat and Mr. Roshan Roy Beat Officer, Murti Beat.
5.3. Archive literature review
Results:
After discussed with the forest officials the relevant archive literatures were collected and
reviewed from the respective Beats and Ranges of GNP. Total 74 Plantation journals were
collected from the respective forest ranges and beats of Gorumara NP. The journals were
reviewed and tabulated beat wise with the main details in a single page. Plantation details like
area, previous plantations, planted species, gap between the planted species, flood condition,
species before plantation etc were tabulated in a particular proforma.
Table 30: Plantation journals collected from GNP
Range Beat Total journal collected
Repeated plantation/ Chosen for study
One time plantation/ Chosen for study
Canopy opening/ Chosen for study
No Information/ Chosen for study
Gorumara North Range
Khunia Beat 10 6/4 4/0
Chapramari Beat 6 4/0 2/0
Murti Beat 2 1/1 0/0 1/1
Total 3 Beats 18 11/5 6/0 1/1
Gorumara South Range
Budhram Beat 16 5/3 5/3 4/2 2/0
Dhupjhora Beat 21 12/5 8/2 1/0
Gorumara Beat 19 8/6 10/3 1/1 Total 3 Beats 56 25/14 23/8 4/2 4/1
GRAND TOTAL 6 Beats 74 36/19 29/8 4/2 5/2
5.4. Inventorization of Flora
Results:
In GNP a total of 31 managed plots (19 repeated plantations, 8 one-time plantations, 2 canopy opening plantations and 2 without any information) were chosen for this study falling in 5 beats viz. Gorumara, Budhram, Dhupjhora, Khunia and Murti. Vegetation occupancy data were collected in 33 quadrates in these 31 plots in post monsoon season only. More over to compare the studied plots 3 natural grassland plots were also studied in GNP. The size of the sampling quadrate was fixed at 10 m X 10 m (100 sq. m.) in all the quadrate. Studies were carried out in all the 33 quadrates in 31 managed plots but only once in post monsoon season. During these studies a total of 104 plant species were recorded, identified,
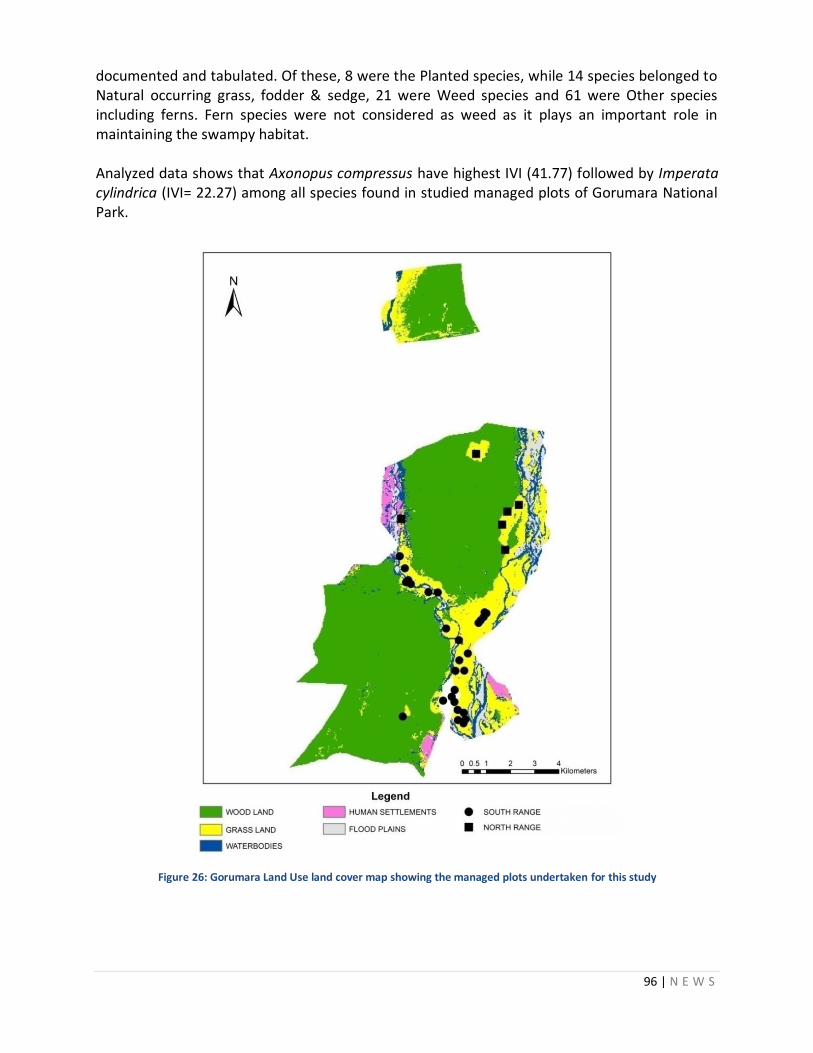
96 | N E W S
documented and tabulated. Of these, 8 were the Planted species, while 14 species belonged to Natural occurring grass, fodder & sedge, 21 were Weed species and 61 were Other species including ferns. Fern species were not considered as weed as it plays an important role in maintaining the swampy habitat. Analyzed data shows that Axonopus compressus have highest IVI (41.77) followed by Imperata cylindrica (IVI= 22.27) among all species found in studied managed plots of Gorumara National Park.
Figure 26: Gorumara Land Use land cover map showing the managed plots undertaken for this study
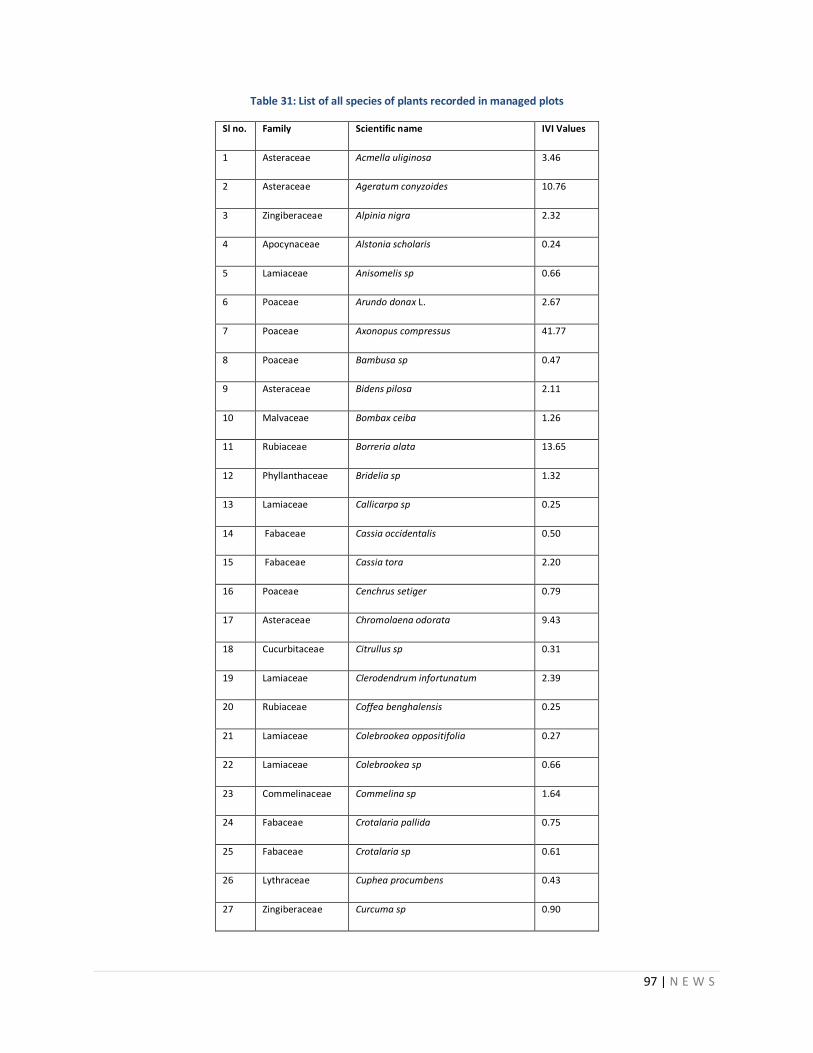
97 | N E W S
Table 31: List of all species of plants recorded in managed plots
Sl no. Family Scientific name IVI Values
1 Asteraceae Acmella uliginosa 3.46
2 Asteraceae Ageratum conyzoides 10.76
3 Zingiberaceae Alpinia nigra 2.32
4 Apocynaceae Alstonia scholaris 0.24
5 Lamiaceae Anisomelis sp 0.66
6 Poaceae Arundo donax L. 2.67
7 Poaceae Axonopus compressus 41.77
8 Poaceae Bambusa sp 0.47
9 Asteraceae Bidens pilosa 2.11
10 Malvaceae Bombax ceiba 1.26
11 Rubiaceae Borreria alata 13.65
12 Phyllanthaceae Bridelia sp 1.32
13 Lamiaceae Callicarpa sp 0.25
14 Fabaceae Cassia occidentalis 0.50
15 Fabaceae Cassia tora 2.20
16 Poaceae Cenchrus setiger 0.79
17 Asteraceae Chromolaena odorata 9.43
18 Cucurbitaceae Citrullus sp 0.31
19 Lamiaceae Clerodendrum infortunatum 2.39
20 Rubiaceae Coffea benghalensis 0.25
21 Lamiaceae Colebrookea oppositifolia 0.27
22 Lamiaceae Colebrookea sp 0.66
23 Commelinaceae Commelina sp 1.64
24 Fabaceae Crotalaria pallida 0.75
25 Fabaceae Crotalaria sp 0.61
26 Lythraceae Cuphea procumbens 0.43
27 Zingiberaceae Curcuma sp 0.90

98 | N E W S
28 Commelinaceae Cyanotis sp 0.43
29 Cyperaceae Cyperus sp 4.89
30 Fabaceae Desmodium sp 1.75
31 Dilleniaceae Dillenia pentagyna 0.24
32 Dioscoreaceae Dioscorea sp 0.53
33 Athyriaceae Diplazium esculentum 5.15
34 Dryopteridaceae Dryopteris sp 1.70
35 Poaceae Echynocloa crassgali 12.53
36 Poaceae Eragrostis amabilis 7.61
37 Fabaceae Flemingia strobilifera 1.63
38 Boraginaceae Heliotropium indicum 0.24
39 Lamiaceae Hyptis capitata 0.40
40 Lamiaceae Hyptis suaveolens 4.73
41 Apocynaceae Ichnocarpus frutiscens 0.43
42 Poaceae Imperata cylindrica 22.27
43 Convolvulaceae Ipoemia sp 0.62
44 Convolvulaceae Ipomoea nil 1.00
45 Poaceae Ishachne sp 8.64
46 Cyperaceae Kylinga nemoralis 9.14
47 Lythraceae Lagerstroemia hirsuta 0.25
48 Lythraceae Lagerstroemia speciosa 1.07
49 Verbenaceae Lantana camara 1.36
50 Vitaceae Leea asiatica 0.58
51 Acanthaceae Lepidagathis incurva 0.43
52 Verbenaceae Lippia javanica 1.24
53 Lauraceae Litsea glutinosa 0.61
54 Lauraceae Litsea monopetala 0.29
55 Onagraceae Ludwigia sp 2.34
56 Lygodiaceae Lygodium flexuosum 0.32
57 Melastomataceae Melastoma malabathricum 0.59
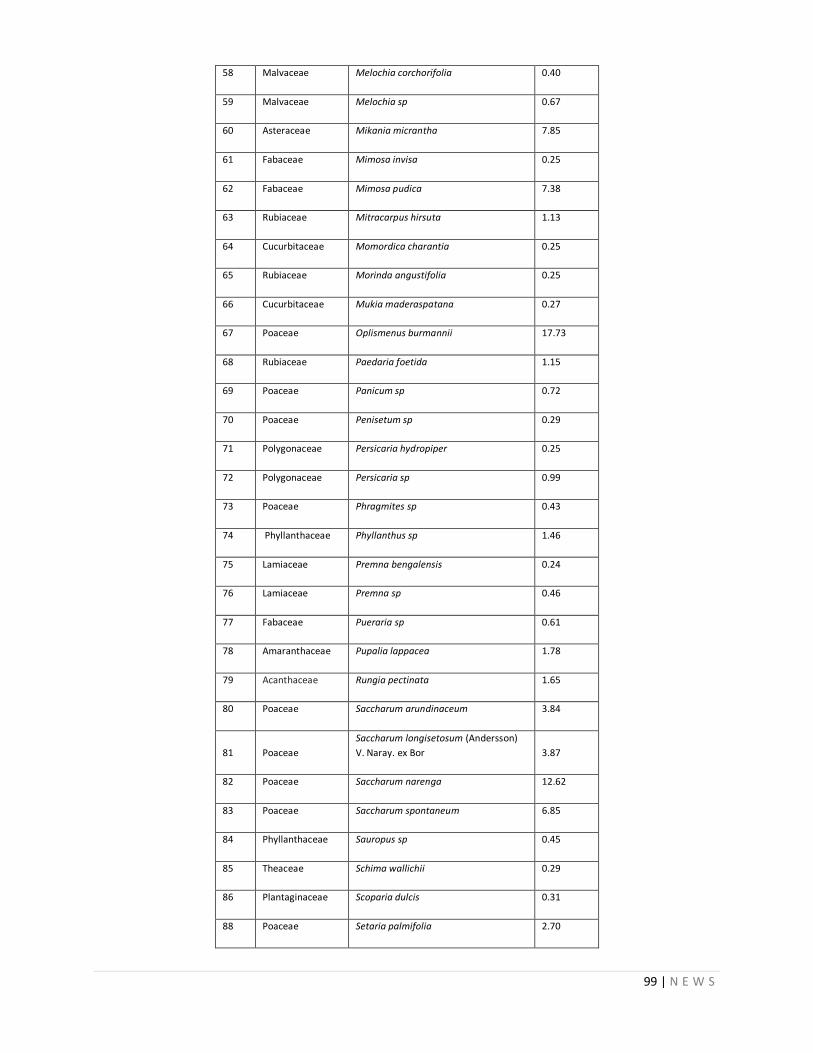
99 | N E W S
58 Malvaceae Melochia corchorifolia 0.40
59 Malvaceae Melochia sp 0.67
60 Asteraceae Mikania micrantha 7.85
61 Fabaceae Mimosa invisa 0.25
62 Fabaceae Mimosa pudica 7.38
63 Rubiaceae Mitracarpus hirsuta 1.13
64 Cucurbitaceae Momordica charantia 0.25
65 Rubiaceae Morinda angustifolia 0.25
66 Cucurbitaceae Mukia maderaspatana 0.27
67 Poaceae Oplismenus burmannii 17.73
68 Rubiaceae Paedaria foetida 1.15
69 Poaceae Panicum sp 0.72
70 Poaceae Penisetum sp 0.29
71 Polygonaceae Persicaria hydropiper 0.25
72 Polygonaceae Persicaria sp 0.99
73 Poaceae Phragmites sp 0.43
74 Phyllanthaceae Phyllanthus sp 1.46
75 Lamiaceae Premna bengalensis 0.24
76 Lamiaceae Premna sp 0.46
77 Fabaceae Pueraria sp 0.61
78 Amaranthaceae Pupalia lappacea 1.78
79 Acanthaceae Rungia pectinata 1.65
80 Poaceae Saccharum arundinaceum 3.84
81 Poaceae
Saccharum longisetosum (Andersson)
V. Naray. ex Bor 3.87
82 Poaceae Saccharum narenga 12.62
83 Poaceae Saccharum spontaneum 6.85
84 Phyllanthaceae Sauropus sp 0.45
85 Theaceae Schima wallichii 0.29
86 Plantaginaceae Scoparia dulcis 0.31
88 Poaceae Setaria palmifolia 2.70

100 | N E W S
89 Dipterocarpaceae Shorea robusta 0.27
90 Malvaceae Sida acuta 4.94
91 Malvaceae Sida rhomboidea 0.43
92 Solanaceae Solanum torvum 0.95
93 Rubiaceae Spermacoce alata 2.49
94 Verbenaceae Stachytarpheta indica 1.03
95 Menispermaceae Stephania hernandifolia 1.90
96 Moraceae Streblus asper 0.27
97 Combretaceae Terminalia myriocarpa 0.24
98 Poaceae Themeda arundinacea 8.42
99 Poaceae Thysanolena maxima 0.61
100 Commelinaceae Tradiscantia sp 0.31
101 Malvaceae Triumfetta rhomboidea 2.31
102 Malvaceae Urena lobata 1.89
103 Zingiberaceae Zingiber zerumbet 1.24
104 Rhamnaceae Ziziphus sp 0.50
Table 32: List of planted species recorded in managed plots
Sl no Family Planted species
Vernacular
name
1 Zingiberaceae Alpinia nigra Purundi
2 Poaceae Arundo donax L. Nol
3 Poaceae Bambusa sp Bansh
4 Poaceae Cenchrus setiger Dhabon
5 Poaceae Saccharum arundinaceum Retzius Madhua
6 Poaceae Saccharum longisetosum (Andersson) V. Naray. ex Bor Malsa
7 Poaceae Saccharum narenga (Nees ex Steud.) Hack. Dhadda
8 Poaceae Themeda arundinacea (Roxburgh) Ridley Chepti
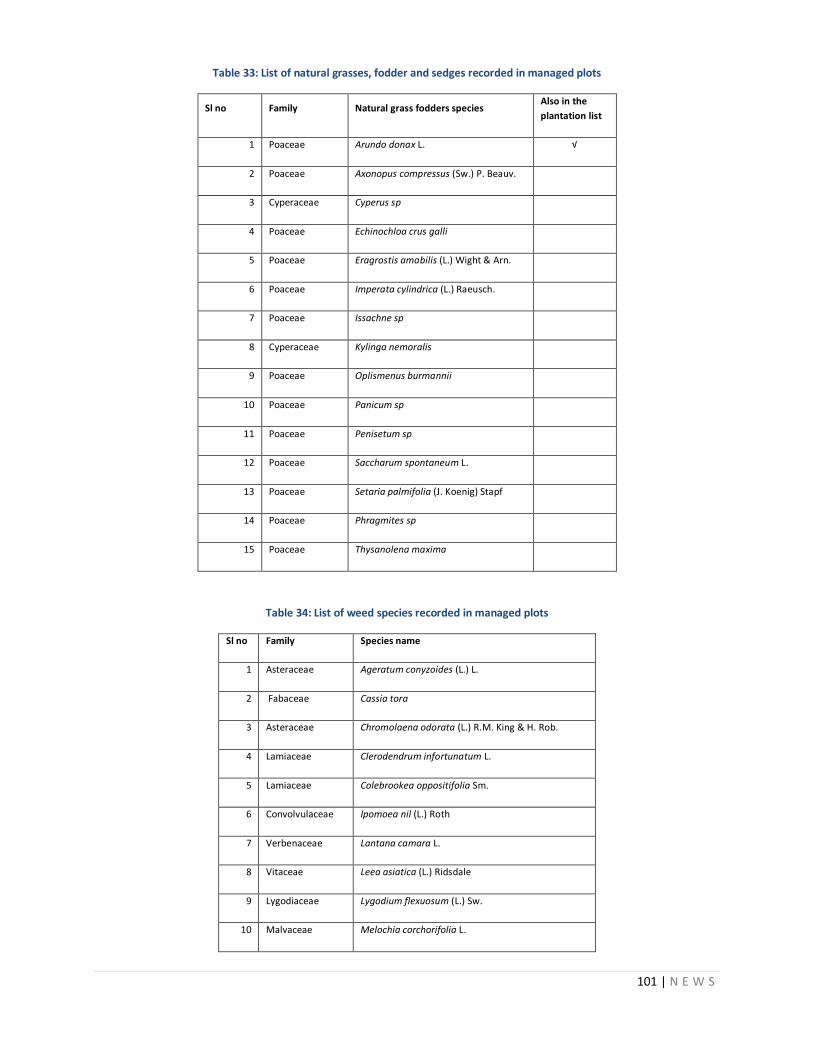
101 | N E W S
Table 33: List of natural grasses, fodder and sedges recorded in managed plots
Sl no Family Natural grass fodders species Also in the
plantation list
1 Poaceae Arundo donax L. √
2 Poaceae Axonopus compressus (Sw.) P. Beauv.
3 Cyperaceae Cyperus sp
4 Poaceae Echinochloa crus galli
5 Poaceae Eragrostis amabilis (L.) Wight & Arn.
6 Poaceae Imperata cylindrica (L.) Raeusch.
7 Poaceae Issachne sp
8 Cyperaceae Kylinga nemoralis
9 Poaceae Oplismenus burmannii
10 Poaceae Panicum sp
11 Poaceae Penisetum sp
12 Poaceae Saccharum spontaneum L.
13 Poaceae Setaria palmifolia (J. Koenig) Stapf
14 Poaceae Phragmites sp
15 Poaceae Thysanolena maxima
Table 34: List of weed species recorded in managed plots
Sl no Family Species name
1 Asteraceae Ageratum conyzoides (L.) L.
2 Fabaceae Cassia tora
3 Asteraceae Chromolaena odorata (L.) R.M. King & H. Rob.
4 Lamiaceae Clerodendrum infortunatum L.
5 Lamiaceae Colebrookea oppositifolia Sm.
6 Convolvulaceae Ipomoea nil (L.) Roth
7 Verbenaceae Lantana camara L.
8 Vitaceae Leea asiatica (L.) Ridsdale
9 Lygodiaceae Lygodium flexuosum (L.) Sw.
10 Malvaceae Melochia corchorifolia L.
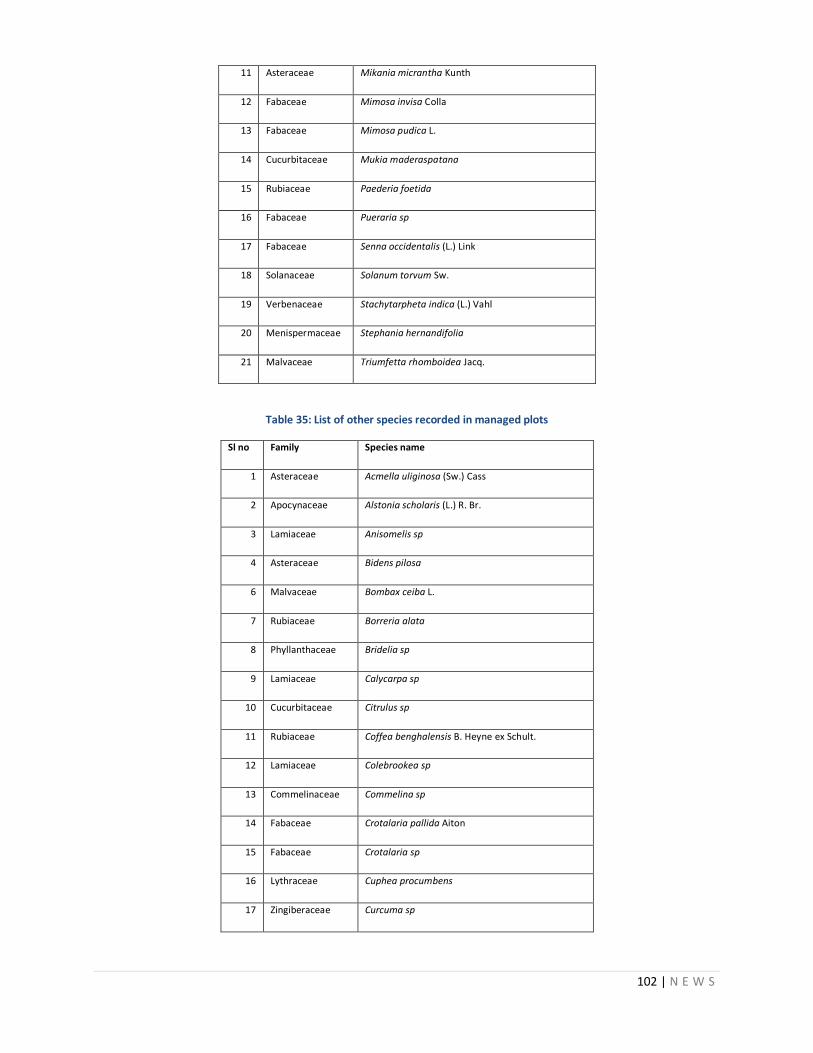
102 | N E W S
11 Asteraceae Mikania micrantha Kunth
12 Fabaceae Mimosa invisa Colla
13 Fabaceae Mimosa pudica L.
14 Cucurbitaceae Mukia maderaspatana
15 Rubiaceae Paederia foetida
16 Fabaceae Pueraria sp
17 Fabaceae Senna occidentalis (L.) Link
18 Solanaceae Solanum torvum Sw.
19 Verbenaceae Stachytarpheta indica (L.) Vahl
20 Menispermaceae Stephania hernandifolia
21 Malvaceae Triumfetta rhomboidea Jacq.
Table 35: List of other species recorded in managed plots
Sl no Family Species name
1 Asteraceae Acmella uliginosa (Sw.) Cass
2 Apocynaceae Alstonia scholaris (L.) R. Br.
3 Lamiaceae Anisomelis sp
4 Asteraceae Bidens pilosa
6 Malvaceae Bombax ceiba L.
7 Rubiaceae Borreria alata
8 Phyllanthaceae Bridelia sp
9 Lamiaceae Calycarpa sp
10 Cucurbitaceae Citrulus sp
11 Rubiaceae Coffea benghalensis B. Heyne ex Schult.
12 Lamiaceae Colebrookea sp
13 Commelinaceae Commelina sp
14 Fabaceae Crotalaria pallida Aiton
15 Fabaceae Crotalaria sp
16 Lythraceae Cuphea procumbens
17 Zingiberaceae Curcuma sp
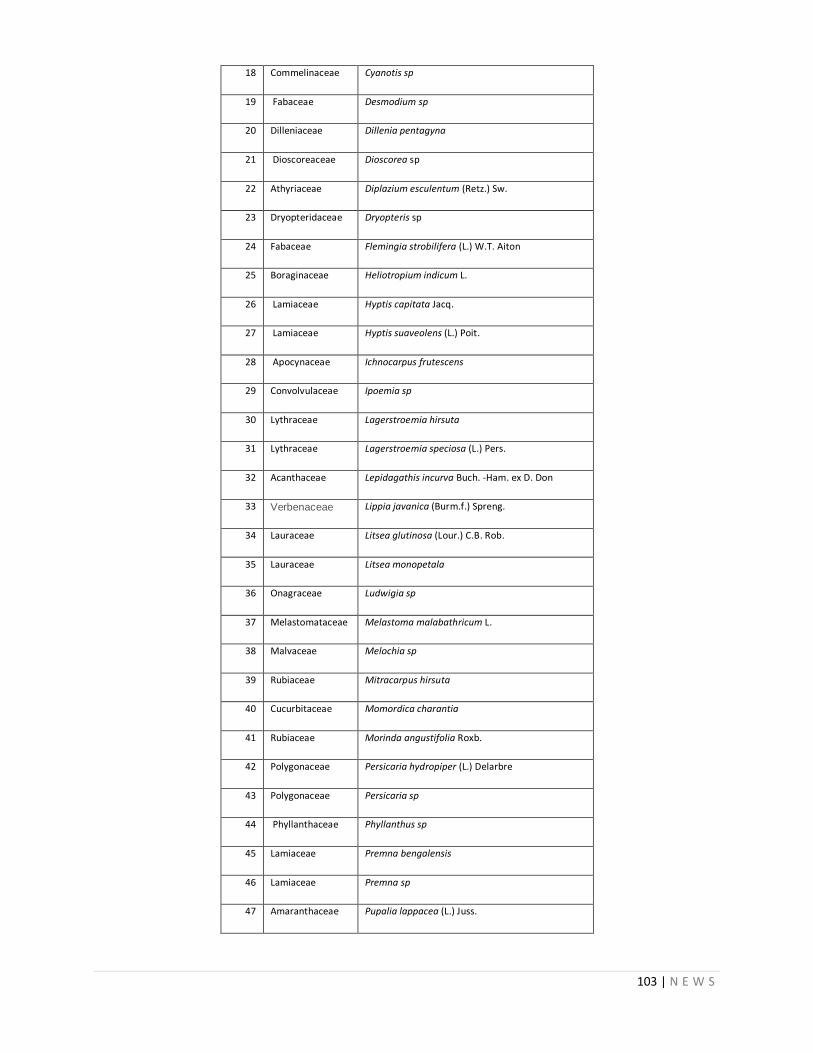
103 | N E W S
18 Commelinaceae Cyanotis sp
19 Fabaceae Desmodium sp
20 Dilleniaceae Dillenia pentagyna
21 Dioscoreaceae Dioscorea sp
22 Athyriaceae Diplazium esculentum (Retz.) Sw.
23 Dryopteridaceae Dryopteris sp
24 Fabaceae Flemingia strobilifera (L.) W.T. Aiton
25 Boraginaceae Heliotropium indicum L.
26 Lamiaceae Hyptis capitata Jacq.
27 Lamiaceae Hyptis suaveolens (L.) Poit.
28 Apocynaceae Ichnocarpus frutescens
29 Convolvulaceae Ipoemia sp
30 Lythraceae Lagerstroemia hirsuta
31 Lythraceae Lagerstroemia speciosa (L.) Pers.
32 Acanthaceae Lepidagathis incurva Buch. -Ham. ex D. Don
33 Verbenaceae Lippia javanica (Burm.f.) Spreng.
34 Lauraceae Litsea glutinosa (Lour.) C.B. Rob.
35 Lauraceae Litsea monopetala
36 Onagraceae Ludwigia sp
37 Melastomataceae Melastoma malabathricum L.
38 Malvaceae Melochia sp
39 Rubiaceae Mitracarpus hirsuta
40 Cucurbitaceae Momordica charantia
41 Rubiaceae Morinda angustifolia Roxb.
42 Polygonaceae Persicaria hydropiper (L.) Delarbre
43 Polygonaceae Persicaria sp
44 Phyllanthaceae Phyllanthus sp
45 Lamiaceae Premna bengalensis
46 Lamiaceae Premna sp
47 Amaranthaceae Pupalia lappacea (L.) Juss.
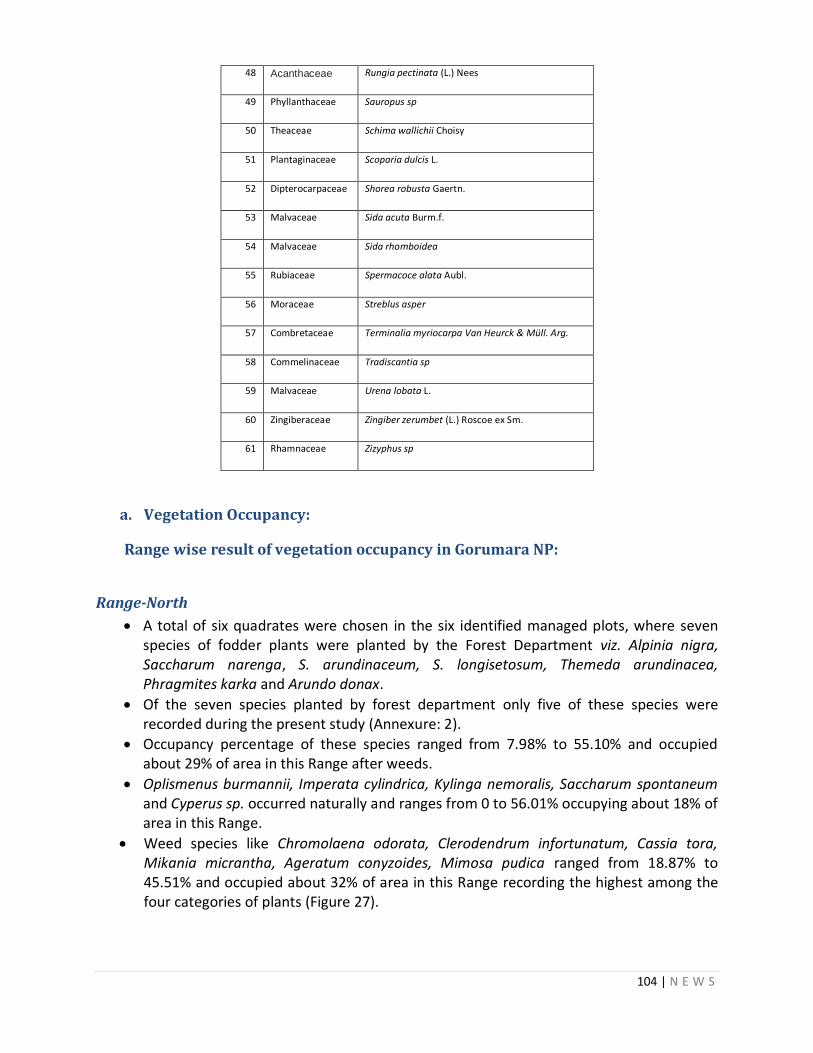
104 | N E W S
48 Acanthaceae Rungia pectinata (L.) Nees
49 Phyllanthaceae Sauropus sp
50 Theaceae Schima wallichii Choisy
51 Plantaginaceae Scoparia dulcis L.
52 Dipterocarpaceae Shorea robusta Gaertn.
53 Malvaceae Sida acuta Burm.f.
54 Malvaceae Sida rhomboidea
55 Rubiaceae Spermacoce alata Aubl.
56 Moraceae Streblus asper
57 Combretaceae Terminalia myriocarpa Van Heurck & Müll. Arg.
58 Commelinaceae Tradiscantia sp
59 Malvaceae Urena lobata L.
60 Zingiberaceae Zingiber zerumbet (L.) Roscoe ex Sm.
61 Rhamnaceae Zizyphus sp
a. Vegetation Occupancy:
Range wise result of vegetation occupancy in Gorumara NP:
Range-North
A total of six quadrates were chosen in the six identified managed plots, where seven species of fodder plants were planted by the Forest Department viz. Alpinia nigra, Saccharum narenga, S. arundinaceum, S. longisetosum, Themeda arundinacea, Phragmites karka and Arundo donax.
Of the seven species planted by forest department only five of these species were recorded during the present study (Annexure: 2).
Occupancy percentage of these species ranged from 7.98% to 55.10% and occupied about 29% of area in this Range after weeds.
Oplismenus burmannii, Imperata cylindrica, Kylinga nemoralis, Saccharum spontaneum and Cyperus sp. occurred naturally and ranges from 0 to 56.01% occupying about 18% of area in this Range.
Weed species like Chromolaena odorata, Clerodendrum infortunatum, Cassia tora, Mikania micrantha, Ageratum conyzoides, Mimosa pudica ranged from 18.87% to 45.51% and occupied about 32% of area in this Range recording the highest among the four categories of plants (Figure 27).
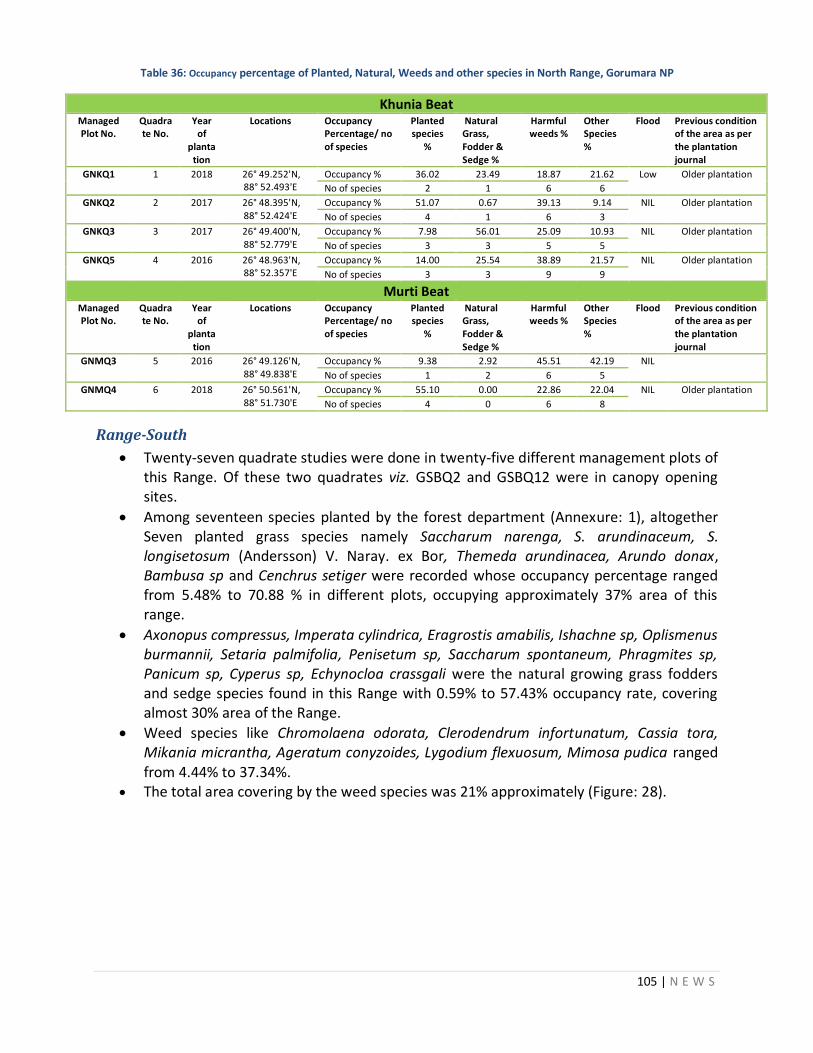
105 | N E W S
Table 36: Occupancy percentage of Planted, Natural, Weeds and other species in North Range, Gorumara NP
Khunia Beat Managed Plot No.
Quadrate No.
Year of
plantation
Locations Occupancy Percentage/ no of species
Planted species
%
Natural Grass, Fodder & Sedge %
Harmful weeds %
Other Species %
Flood Previous condition of the area as per the plantation journal
GNKQ1 1 2018 26° 49.252'N, 88° 52.493'E
Occupancy % 36.02 23.49 18.87 21.62 Low Older plantation
No of species 2 1 6 6
GNKQ2 2 2017 26° 48.395'N, 88° 52.424'E
Occupancy % 51.07 0.67 39.13 9.14 NIL Older plantation
No of species 4 1 6 3
GNKQ3 3 2017 26° 49.400'N, 88° 52.779'E
Occupancy % 7.98 56.01 25.09 10.93 NIL Older plantation
No of species 3 3 5 5
GNKQ5 4 2016 26° 48.963'N, 88° 52.357'E
Occupancy % 14.00 25.54 38.89 21.57 NIL Older plantation
No of species 3 3 9 9
Murti Beat Managed Plot No.
Quadrate No.
Year of
plantation
Locations Occupancy Percentage/ no of species
Planted species
%
Natural Grass, Fodder & Sedge %
Harmful weeds %
Other Species %
Flood Previous condition of the area as per the plantation journal
GNMQ3 5 2016 26° 49.126'N, 88° 49.838'E
Occupancy % 9.38 2.92 45.51 42.19 NIL
No of species 1 2 6 5
GNMQ4 6 2018 26° 50.561'N, 88° 51.730'E
Occupancy % 55.10 0.00 22.86 22.04 NIL Older plantation
No of species 4 0 6 8
Range-South
Twenty-seven quadrate studies were done in twenty-five different management plots of this Range. Of these two quadrates viz. GSBQ2 and GSBQ12 were in canopy opening sites.
Among seventeen species planted by the forest department (Annexure: 1), altogether Seven planted grass species namely Saccharum narenga, S. arundinaceum, S. longisetosum (Andersson) V. Naray. ex Bor, Themeda arundinacea, Arundo donax, Bambusa sp and Cenchrus setiger were recorded whose occupancy percentage ranged from 5.48% to 70.88 % in different plots, occupying approximately 37% area of this range.
Axonopus compressus, Imperata cylindrica, Eragrostis amabilis, Ishachne sp, Oplismenus burmannii, Setaria palmifolia, Penisetum sp, Saccharum spontaneum, Phragmites sp, Panicum sp, Cyperus sp, Echynocloa crassgali were the natural growing grass fodders and sedge species found in this Range with 0.59% to 57.43% occupancy rate, covering almost 30% area of the Range.
Weed species like Chromolaena odorata, Clerodendrum infortunatum, Cassia tora, Mikania micrantha, Ageratum conyzoides, Lygodium flexuosum, Mimosa pudica ranged from 4.44% to 37.34%.
The total area covering by the weed species was 21% approximately (Figure: 28).
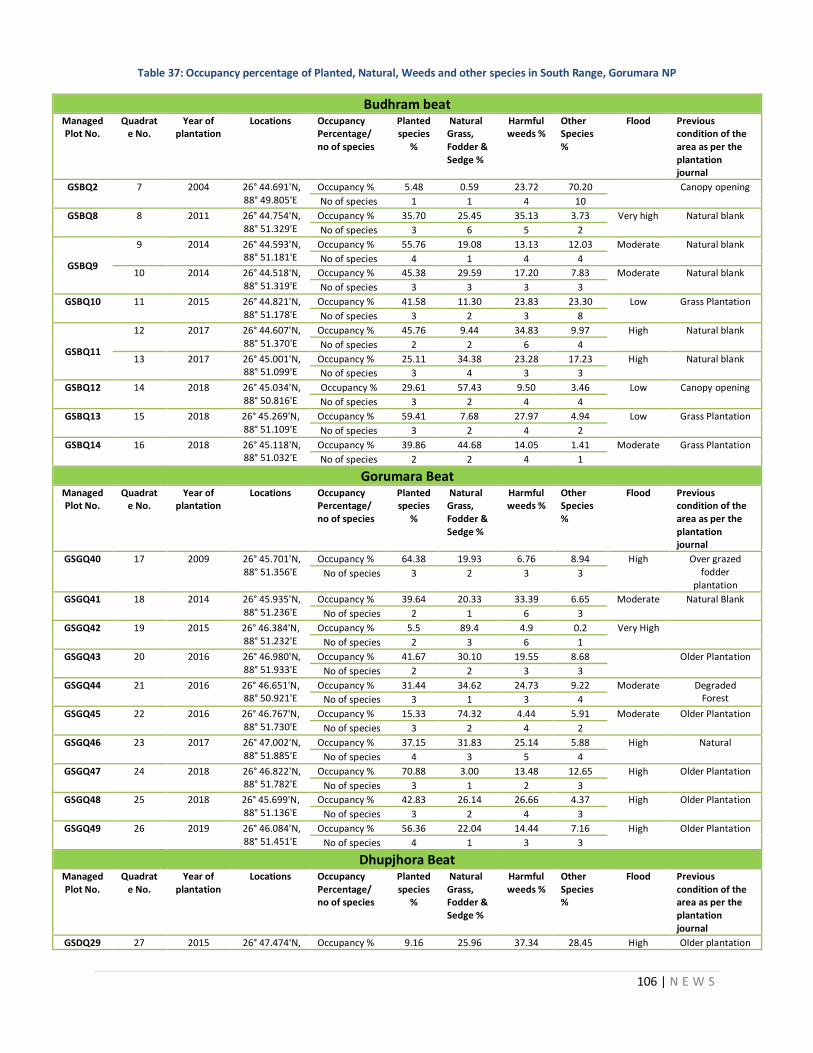
106 | N E W S
Table 37: Occupancy percentage of Planted, Natural, Weeds and other species in South Range, Gorumara NP
Budhram beat Managed Plot No.
Quadrate No.
Year of plantation
Locations Occupancy Percentage/ no of species
Planted species
%
Natural Grass, Fodder & Sedge %
Harmful weeds %
Other Species %
Flood Previous condition of the area as per the plantation journal
GSBQ2 7 2004 26° 44.691'N, 88° 49.805'E
Occupancy % 5.48 0.59 23.72 70.20 Canopy opening
No of species 1 1 4 10
GSBQ8 8 2011 26° 44.754'N, 88° 51.329'E
Occupancy % 35.70 25.45 35.13 3.73 Very high Natural blank
No of species 3 6 5 2
GSBQ9
9 2014 26° 44.593'N, 88° 51.181'E
Occupancy % 55.76 19.08 13.13 12.03 Moderate Natural blank
No of species 4 1 4 4
10 2014 26° 44.518'N, 88° 51.319'E
Occupancy % 45.38 29.59 17.20 7.83 Moderate Natural blank
No of species 3 3 3 3
GSBQ10 11 2015 26° 44.821'N, 88° 51.178'E
Occupancy % 41.58 11.30 23.83 23.30 Low Grass Plantation
No of species 3 2 3 8
GSBQ11
12 2017 26° 44.607'N, 88° 51.370'E
Occupancy % 45.76 9.44 34.83 9.97 High Natural blank
No of species 2 2 6 4
13 2017 26° 45.001'N, 88° 51.099'E
Occupancy % 25.11 34.38 23.28 17.23 High Natural blank
No of species 3 4 3 3
GSBQ12 14 2018 26° 45.034'N, 88° 50.816'E
Occupancy % 29.61 57.43 9.50 3.46 Low Canopy opening
No of species 3 2 4 4
GSBQ13 15 2018 26° 45.269'N, 88° 51.109'E
Occupancy % 59.41 7.68 27.97 4.94 Low Grass Plantation
No of species 3 2 4 2
GSBQ14 16 2018 26° 45.118'N, 88° 51.032'E
Occupancy % 39.86 44.68 14.05 1.41 Moderate Grass Plantation
No of species 2 2 4 1
Gorumara Beat Managed Plot No.
Quadrate No.
Year of plantation
Locations Occupancy Percentage/ no of species
Planted species
%
Natural Grass, Fodder & Sedge %
Harmful weeds %
Other Species %
Flood Previous condition of the area as per the plantation journal
GSGQ40 17 2009 26° 45.701'N, 88° 51.356'E
Occupancy % 64.38 19.93 6.76 8.94 High Over grazed fodder
plantation No of species 3 2 3 3
GSGQ41 18 2014 26° 45.935'N, 88° 51.236'E
Occupancy % 39.64 20.33 33.39 6.65 Moderate Natural Blank
No of species 2 1 6 3
GSGQ42 19 2015 26° 46.384'N, 88° 51.232'E
Occupancy % 5.5 89.4 4.9 0.2 Very High
No of species 2 3 6 1
GSGQ43 20 2016 26° 46.980'N, 88° 51.933'E
Occupancy % 41.67 30.10 19.55 8.68 Older Plantation
No of species 2 2 3 3
GSGQ44 21 2016 26° 46.651'N, 88° 50.921'E
Occupancy % 31.44 34.62 24.73 9.22 Moderate Degraded Forest No of species 3 1 3 4
GSGQ45 22 2016 26° 46.767'N, 88° 51.730'E
Occupancy % 15.33 74.32 4.44 5.91 Moderate Older Plantation
No of species 3 2 4 2
GSGQ46 23 2017 26° 47.002'N, 88° 51.885'E
Occupancy % 37.15 31.83 25.14 5.88 High Natural
No of species 4 3 5 4
GSGQ47 24 2018 26° 46.822'N, 88° 51.782'E
Occupancy % 70.88 3.00 13.48 12.65 High Older Plantation
No of species 3 1 2 3
GSGQ48 25 2018 26° 45.699'N, 88° 51.136'E
Occupancy % 42.83 26.14 26.66 4.37 High Older Plantation
No of species 3 2 4 3
GSGQ49 26 2019 26° 46.084'N, 88° 51.451'E
Occupancy % 56.36 22.04 14.44 7.16 High Older Plantation
No of species 4 1 3 3
Dhupjhora Beat Managed Plot No.
Quadrate No.
Year of plantation
Locations Occupancy Percentage/ no of species
Planted species
%
Natural Grass, Fodder & Sedge %
Harmful weeds %
Other Species %
Flood Previous condition of the area as per the plantation journal
GSDQ29 27 2015 26° 47.474'N, Occupancy % 9.16 25.96 37.34 28.45 High Older plantation
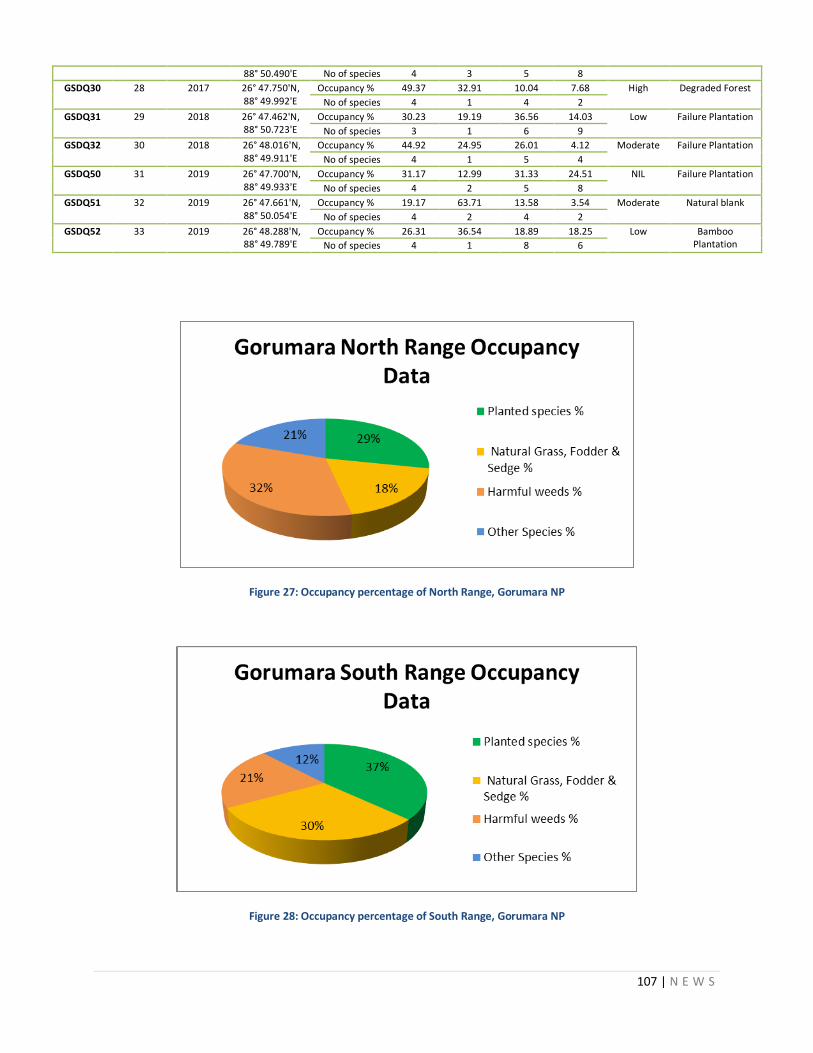
107 | N E W S
88° 50.490'E No of species 4 3 5 8
GSDQ30 28 2017 26° 47.750'N, 88° 49.992'E
Occupancy % 49.37 32.91 10.04 7.68 High Degraded Forest
No of species 4 1 4 2
GSDQ31 29 2018 26° 47.462'N, 88° 50.723'E
Occupancy % 30.23 19.19 36.56 14.03 Low Failure Plantation
No of species 3 1 6 9
GSDQ32 30 2018 26° 48.016'N, 88° 49.911'E
Occupancy % 44.92 24.95 26.01 4.12 Moderate Failure Plantation
No of species 4 1 5 4
GSDQ50 31 2019 26° 47.700'N, 88° 49.933'E
Occupancy % 31.17 12.99 31.33 24.51 NIL Failure Plantation
No of species 4 2 5 8
GSDQ51 32 2019 26° 47.661'N, 88° 50.054'E
Occupancy % 19.17 63.71 13.58 3.54 Moderate Natural blank
No of species 4 2 4 2
GSDQ52 33 2019 26° 48.288'N, 88° 49.789'E
Occupancy % 26.31 36.54 18.89 18.25 Low Bamboo Plantation No of species 4 1 8 6
Figure 27: Occupancy percentage of North Range, Gorumara NP
Figure 28: Occupancy percentage of South Range, Gorumara NP
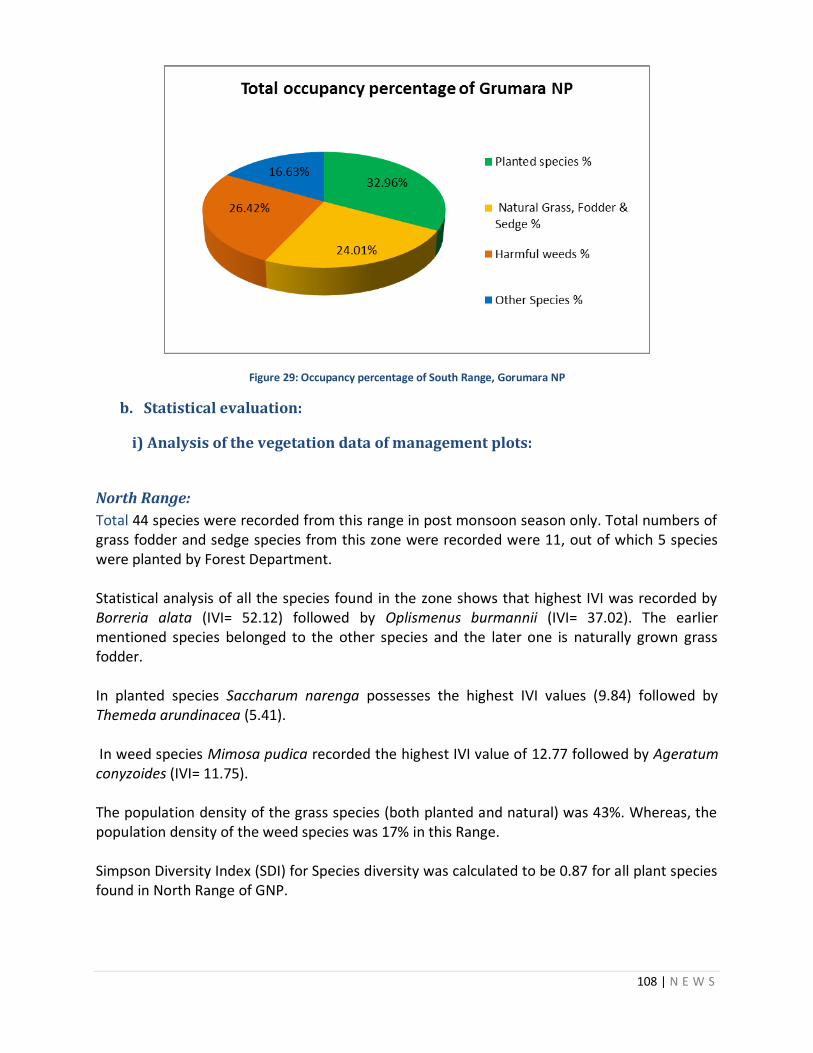
108 | N E W S
Figure 29: Occupancy percentage of South Range, Gorumara NP
b. Statistical evaluation:
i) Analysis of the vegetation data of management plots:
North Range:
Total 44 species were recorded from this range in post monsoon season only. Total numbers of grass fodder and sedge species from this zone were recorded were 11, out of which 5 species were planted by Forest Department. Statistical analysis of all the species found in the zone shows that highest IVI was recorded by Borreria alata (IVI= 52.12) followed by Oplismenus burmannii (IVI= 37.02). The earlier mentioned species belonged to the other species and the later one is naturally grown grass fodder. In planted species Saccharum narenga possesses the highest IVI values (9.84) followed by Themeda arundinacea (5.41). In weed species Mimosa pudica recorded the highest IVI value of 12.77 followed by Ageratum conyzoides (IVI= 11.75). The population density of the grass species (both planted and natural) was 43%. Whereas, the population density of the weed species was 17% in this Range. Simpson Diversity Index (SDI) for Species diversity was calculated to be 0.87 for all plant species found in North Range of GNP.
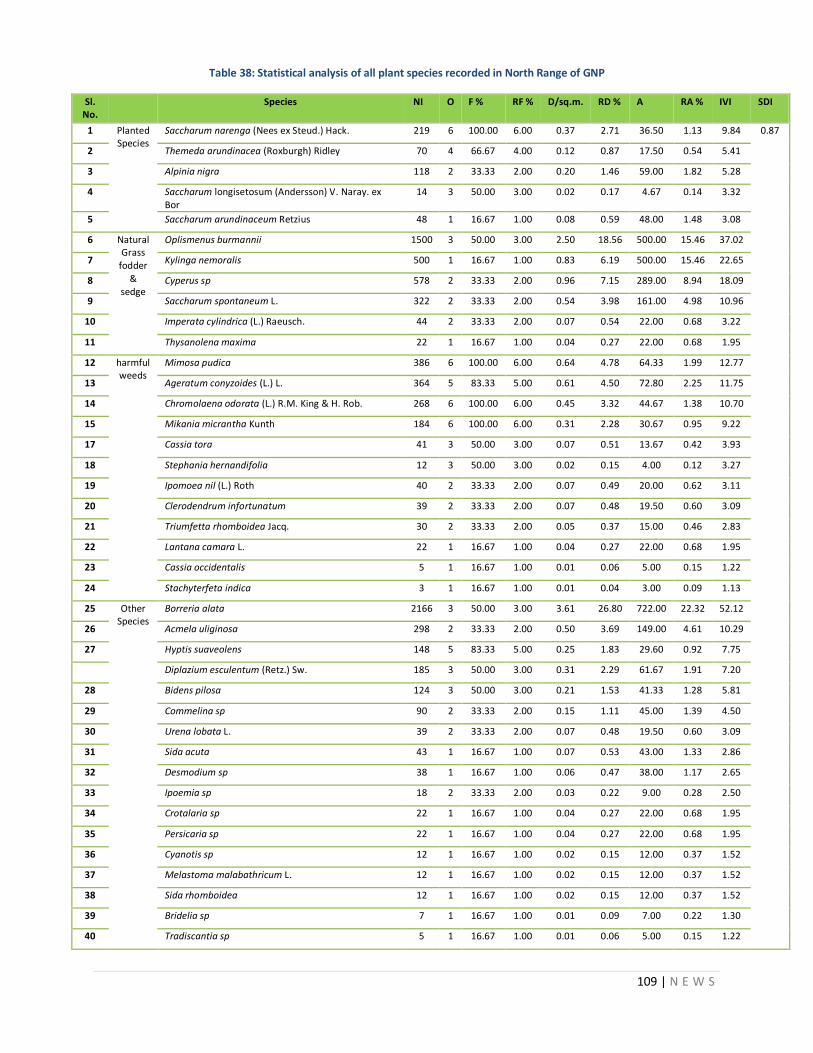
109 | N E W S
Table 38: Statistical analysis of all plant species recorded in North Range of GNP
Sl. No.
Species NI O F % RF % D/sq.m. RD % A RA % IVI SDI
1 Planted Species
Saccharum narenga (Nees ex Steud.) Hack. 219 6 100.00 6.00 0.37 2.71 36.50 1.13 9.84 0.87
2 Themeda arundinacea (Roxburgh) Ridley 70 4 66.67 4.00 0.12 0.87 17.50 0.54 5.41
3 Alpinia nigra 118 2 33.33 2.00 0.20 1.46 59.00 1.82 5.28
4 Saccharum longisetosum (Andersson) V. Naray. ex Bor
14 3 50.00 3.00 0.02 0.17 4.67 0.14 3.32
5 Saccharum arundinaceum Retzius 48 1 16.67 1.00 0.08 0.59 48.00 1.48 3.08
6 Natural Grass
fodder &
sedge
Oplismenus burmannii 1500 3 50.00 3.00 2.50 18.56 500.00 15.46 37.02
7 Kylinga nemoralis 500 1 16.67 1.00 0.83 6.19 500.00 15.46 22.65
8 Cyperus sp 578 2 33.33 2.00 0.96 7.15 289.00 8.94 18.09
9 Saccharum spontaneum L. 322 2 33.33 2.00 0.54 3.98 161.00 4.98 10.96
10 Imperata cylindrica (L.) Raeusch. 44 2 33.33 2.00 0.07 0.54 22.00 0.68 3.22
11 Thysanolena maxima 22 1 16.67 1.00 0.04 0.27 22.00 0.68 1.95
12 harmful weeds
Mimosa pudica 386 6 100.00 6.00 0.64 4.78 64.33 1.99 12.77
13 Ageratum conyzoides (L.) L. 364 5 83.33 5.00 0.61 4.50 72.80 2.25 11.75
14 Chromolaena odorata (L.) R.M. King & H. Rob. 268 6 100.00 6.00 0.45 3.32 44.67 1.38 10.70
15 Mikania micrantha Kunth 184 6 100.00 6.00 0.31 2.28 30.67 0.95 9.22
17 Cassia tora 41 3 50.00 3.00 0.07 0.51 13.67 0.42 3.93
18 Stephania hernandifolia 12 3 50.00 3.00 0.02 0.15 4.00 0.12 3.27
19 Ipomoea nil (L.) Roth 40 2 33.33 2.00 0.07 0.49 20.00 0.62 3.11
20 Clerodendrum infortunatum 39 2 33.33 2.00 0.07 0.48 19.50 0.60 3.09
21 Triumfetta rhomboidea Jacq. 30 2 33.33 2.00 0.05 0.37 15.00 0.46 2.83
22 Lantana camara L. 22 1 16.67 1.00 0.04 0.27 22.00 0.68 1.95
23 Cassia occidentalis 5 1 16.67 1.00 0.01 0.06 5.00 0.15 1.22
24 Stachyterfeta indica 3 1 16.67 1.00 0.01 0.04 3.00 0.09 1.13
25 Other Species
Borreria alata 2166 3 50.00 3.00 3.61 26.80 722.00 22.32 52.12
26 Acmela uliginosa 298 2 33.33 2.00 0.50 3.69 149.00 4.61 10.29
27 Hyptis suaveolens 148 5 83.33 5.00 0.25 1.83 29.60 0.92 7.75
Diplazium esculentum (Retz.) Sw. 185 3 50.00 3.00 0.31 2.29 61.67 1.91 7.20
28 Bidens pilosa 124 3 50.00 3.00 0.21 1.53 41.33 1.28 5.81
29 Commelina sp 90 2 33.33 2.00 0.15 1.11 45.00 1.39 4.50
30 Urena lobata L. 39 2 33.33 2.00 0.07 0.48 19.50 0.60 3.09
31 Sida acuta 43 1 16.67 1.00 0.07 0.53 43.00 1.33 2.86
32 Desmodium sp 38 1 16.67 1.00 0.06 0.47 38.00 1.17 2.65
33 Ipoemia sp 18 2 33.33 2.00 0.03 0.22 9.00 0.28 2.50
34 Crotalaria sp 22 1 16.67 1.00 0.04 0.27 22.00 0.68 1.95
35 Persicaria sp 22 1 16.67 1.00 0.04 0.27 22.00 0.68 1.95
36 Cyanotis sp 12 1 16.67 1.00 0.02 0.15 12.00 0.37 1.52
37 Melastoma malabathricum L. 12 1 16.67 1.00 0.02 0.15 12.00 0.37 1.52
38 Sida rhomboidea 12 1 16.67 1.00 0.02 0.15 12.00 0.37 1.52
39 Bridelia sp 7 1 16.67 1.00 0.01 0.09 7.00 0.22 1.30
40 Tradiscantia sp 5 1 16.67 1.00 0.01 0.06 5.00 0.15 1.22
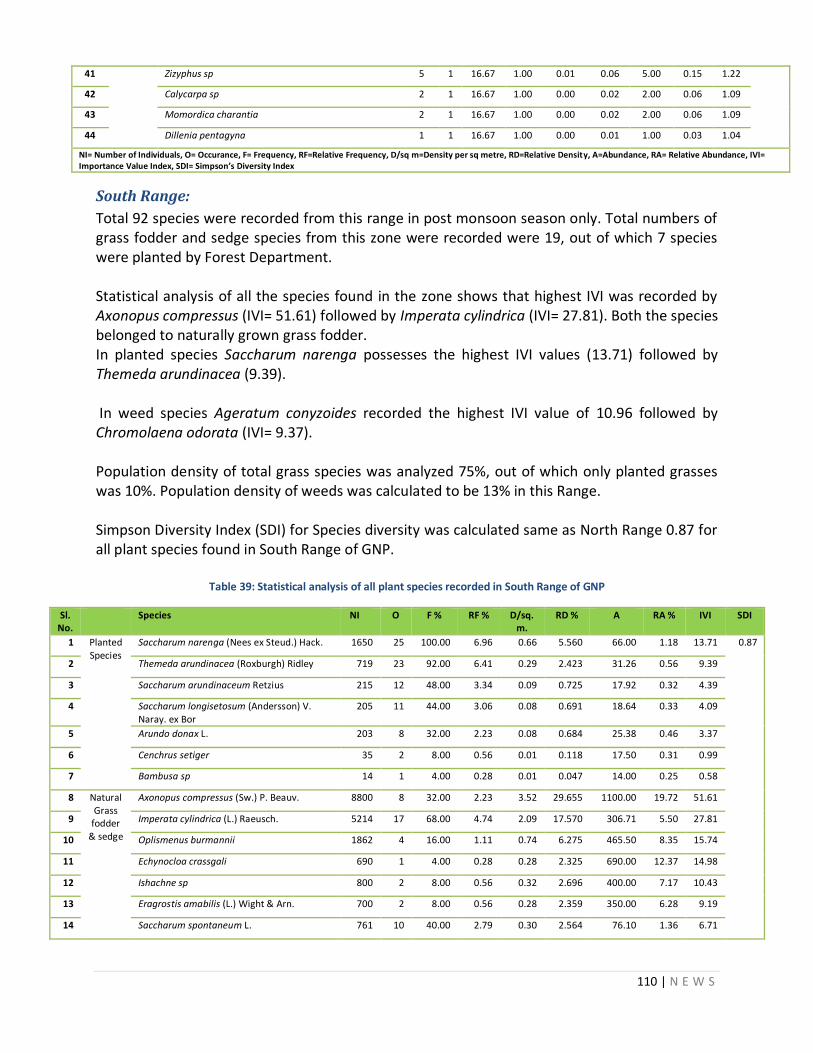
110 | N E W S
41 Zizyphus sp 5 1 16.67 1.00 0.01 0.06 5.00 0.15 1.22
42 Calycarpa sp 2 1 16.67 1.00 0.00 0.02 2.00 0.06 1.09
43 Momordica charantia 2 1 16.67 1.00 0.00 0.02 2.00 0.06 1.09
44 Dillenia pentagyna 1 1 16.67 1.00 0.00 0.01 1.00 0.03 1.04
NI= Number of Individuals, O= Occurance, F= Frequency, RF=Relative Frequency, D/sq m=Density per sq metre, RD=Relative Density, A=Abundance, RA= Relative Abundance, IVI= Importance Value Index, SDI= Simpson’s Diversity Index
South Range:
Total 92 species were recorded from this range in post monsoon season only. Total numbers of grass fodder and sedge species from this zone were recorded were 19, out of which 7 species were planted by Forest Department. Statistical analysis of all the species found in the zone shows that highest IVI was recorded by Axonopus compressus (IVI= 51.61) followed by Imperata cylindrica (IVI= 27.81). Both the species belonged to naturally grown grass fodder. In planted species Saccharum narenga possesses the highest IVI values (13.71) followed by Themeda arundinacea (9.39). In weed species Ageratum conyzoides recorded the highest IVI value of 10.96 followed by Chromolaena odorata (IVI= 9.37). Population density of total grass species was analyzed 75%, out of which only planted grasses was 10%. Population density of weeds was calculated to be 13% in this Range. Simpson Diversity Index (SDI) for Species diversity was calculated same as North Range 0.87 for all plant species found in South Range of GNP.
Table 39: Statistical analysis of all plant species recorded in South Range of GNP
Sl. No.
Species NI O F % RF % D/sq.m.
RD % A RA % IVI SDI
1 Planted Species
Saccharum narenga (Nees ex Steud.) Hack. 1650 25 100.00 6.96 0.66 5.560 66.00 1.18 13.71 0.87
2 Themeda arundinacea (Roxburgh) Ridley 719 23 92.00 6.41 0.29 2.423 31.26 0.56 9.39
3 Saccharum arundinaceum Retzius 215 12 48.00 3.34 0.09 0.725 17.92 0.32 4.39
4 Saccharum longisetosum (Andersson) V. Naray. ex Bor
205 11 44.00 3.06 0.08 0.691 18.64 0.33 4.09
5 Arundo donax L. 203 8 32.00 2.23 0.08 0.684 25.38 0.46 3.37
6 Cenchrus setiger 35 2 8.00 0.56 0.01 0.118 17.50 0.31 0.99
7 Bambusa sp 14 1 4.00 0.28 0.01 0.047 14.00 0.25 0.58
8 Natural Grass
fodder & sedge
Axonopus compressus (Sw.) P. Beauv. 8800 8 32.00 2.23 3.52 29.655 1100.00 19.72 51.61
9 Imperata cylindrica (L.) Raeusch. 5214 17 68.00 4.74 2.09 17.570 306.71 5.50 27.81
10 Oplismenus burmannii 1862 4 16.00 1.11 0.74 6.275 465.50 8.35 15.74
11 Echynocloa crassgali 690 1 4.00 0.28 0.28 2.325 690.00 12.37 14.98
12 Ishachne sp 800 2 8.00 0.56 0.32 2.696 400.00 7.17 10.43
13 Eragrostis amabilis (L.) Wight & Arn. 700 2 8.00 0.56 0.28 2.359 350.00 6.28 9.19
14 Saccharum spontaneum L. 761 10 40.00 2.79 0.30 2.564 76.10 1.36 6.71
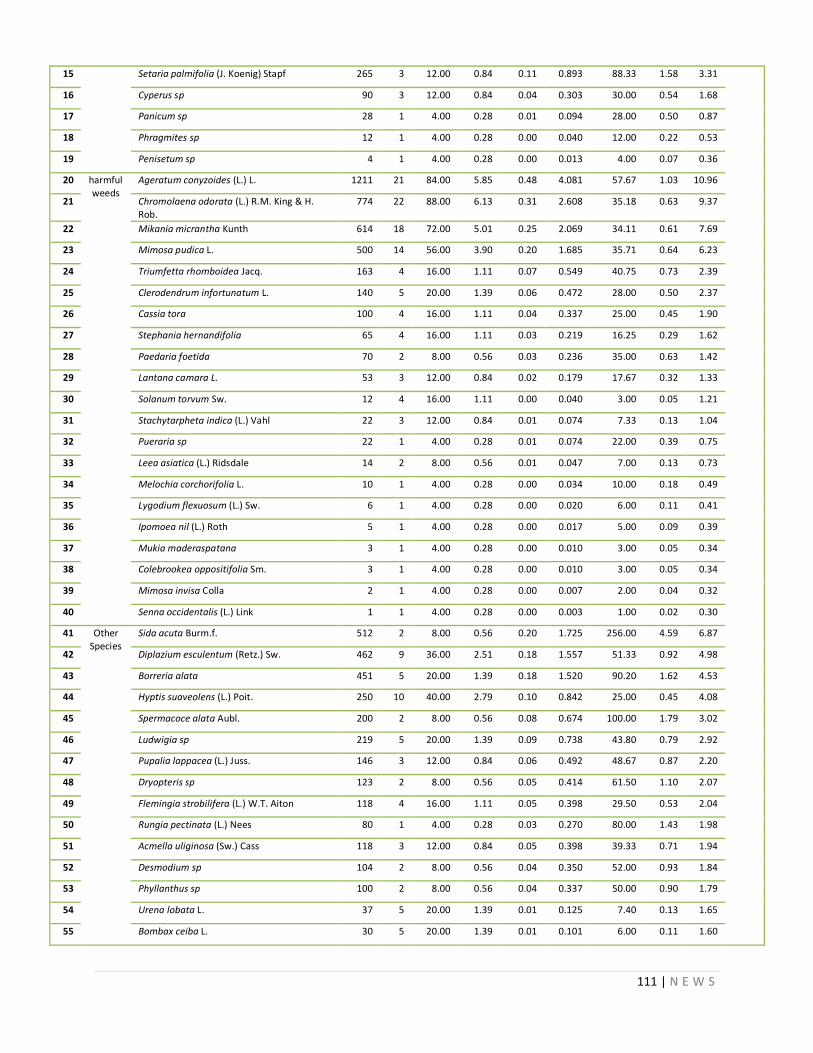
111 | N E W S
15 Setaria palmifolia (J. Koenig) Stapf 265 3 12.00 0.84 0.11 0.893 88.33 1.58 3.31
16 Cyperus sp 90 3 12.00 0.84 0.04 0.303 30.00 0.54 1.68
17 Panicum sp 28 1 4.00 0.28 0.01 0.094 28.00 0.50 0.87
18 Phragmites sp 12 1 4.00 0.28 0.00 0.040 12.00 0.22 0.53
19 Penisetum sp 4 1 4.00 0.28 0.00 0.013 4.00 0.07 0.36
20 harmful weeds
Ageratum conyzoides (L.) L. 1211 21 84.00 5.85 0.48 4.081 57.67 1.03 10.96
21 Chromolaena odorata (L.) R.M. King & H. Rob.
774 22 88.00 6.13 0.31 2.608 35.18 0.63 9.37
22 Mikania micrantha Kunth 614 18 72.00 5.01 0.25 2.069 34.11 0.61 7.69
23 Mimosa pudica L. 500 14 56.00 3.90 0.20 1.685 35.71 0.64 6.23
24 Triumfetta rhomboidea Jacq. 163 4 16.00 1.11 0.07 0.549 40.75 0.73 2.39
25 Clerodendrum infortunatum L. 140 5 20.00 1.39 0.06 0.472 28.00 0.50 2.37
26 Cassia tora 100 4 16.00 1.11 0.04 0.337 25.00 0.45 1.90
27 Stephania hernandifolia 65 4 16.00 1.11 0.03 0.219 16.25 0.29 1.62
28 Paedaria foetida 70 2 8.00 0.56 0.03 0.236 35.00 0.63 1.42
29 Lantana camara L. 53 3 12.00 0.84 0.02 0.179 17.67 0.32 1.33
30 Solanum torvum Sw. 12 4 16.00 1.11 0.00 0.040 3.00 0.05 1.21
31 Stachytarpheta indica (L.) Vahl 22 3 12.00 0.84 0.01 0.074 7.33 0.13 1.04
32 Pueraria sp 22 1 4.00 0.28 0.01 0.074 22.00 0.39 0.75
33 Leea asiatica (L.) Ridsdale 14 2 8.00 0.56 0.01 0.047 7.00 0.13 0.73
34 Melochia corchorifolia L. 10 1 4.00 0.28 0.00 0.034 10.00 0.18 0.49
35 Lygodium flexuosum (L.) Sw. 6 1 4.00 0.28 0.00 0.020 6.00 0.11 0.41
36 Ipomoea nil (L.) Roth 5 1 4.00 0.28 0.00 0.017 5.00 0.09 0.39
37 Mukia maderaspatana 3 1 4.00 0.28 0.00 0.010 3.00 0.05 0.34
38 Colebrookea oppositifolia Sm. 3 1 4.00 0.28 0.00 0.010 3.00 0.05 0.34
39 Mimosa invisa Colla 2 1 4.00 0.28 0.00 0.007 2.00 0.04 0.32
40 Senna occidentalis (L.) Link 1 1 4.00 0.28 0.00 0.003 1.00 0.02 0.30
41 Other Species
Sida acuta Burm.f. 512 2 8.00 0.56 0.20 1.725 256.00 4.59 6.87
42 Diplazium esculentum (Retz.) Sw. 462 9 36.00 2.51 0.18 1.557 51.33 0.92 4.98
43 Borreria alata 451 5 20.00 1.39 0.18 1.520 90.20 1.62 4.53
44 Hyptis suaveolens (L.) Poit. 250 10 40.00 2.79 0.10 0.842 25.00 0.45 4.08
45 Spermacoce alata Aubl. 200 2 8.00 0.56 0.08 0.674 100.00 1.79 3.02
46 Ludwigia sp 219 5 20.00 1.39 0.09 0.738 43.80 0.79 2.92
47 Pupalia lappacea (L.) Juss. 146 3 12.00 0.84 0.06 0.492 48.67 0.87 2.20
48 Dryopteris sp 123 2 8.00 0.56 0.05 0.414 61.50 1.10 2.07
49 Flemingia strobilifera (L.) W.T. Aiton 118 4 16.00 1.11 0.05 0.398 29.50 0.53 2.04
50 Rungia pectinata (L.) Nees 80 1 4.00 0.28 0.03 0.270 80.00 1.43 1.98
51 Acmella uliginosa (Sw.) Cass 118 3 12.00 0.84 0.05 0.398 39.33 0.71 1.94
52 Desmodium sp 104 2 8.00 0.56 0.04 0.350 52.00 0.93 1.84
53 Phyllanthus sp 100 2 8.00 0.56 0.04 0.337 50.00 0.90 1.79
54 Urena lobata L. 37 5 20.00 1.39 0.01 0.125 7.40 0.13 1.65
55 Bombax ceiba L. 30 5 20.00 1.39 0.01 0.101 6.00 0.11 1.60
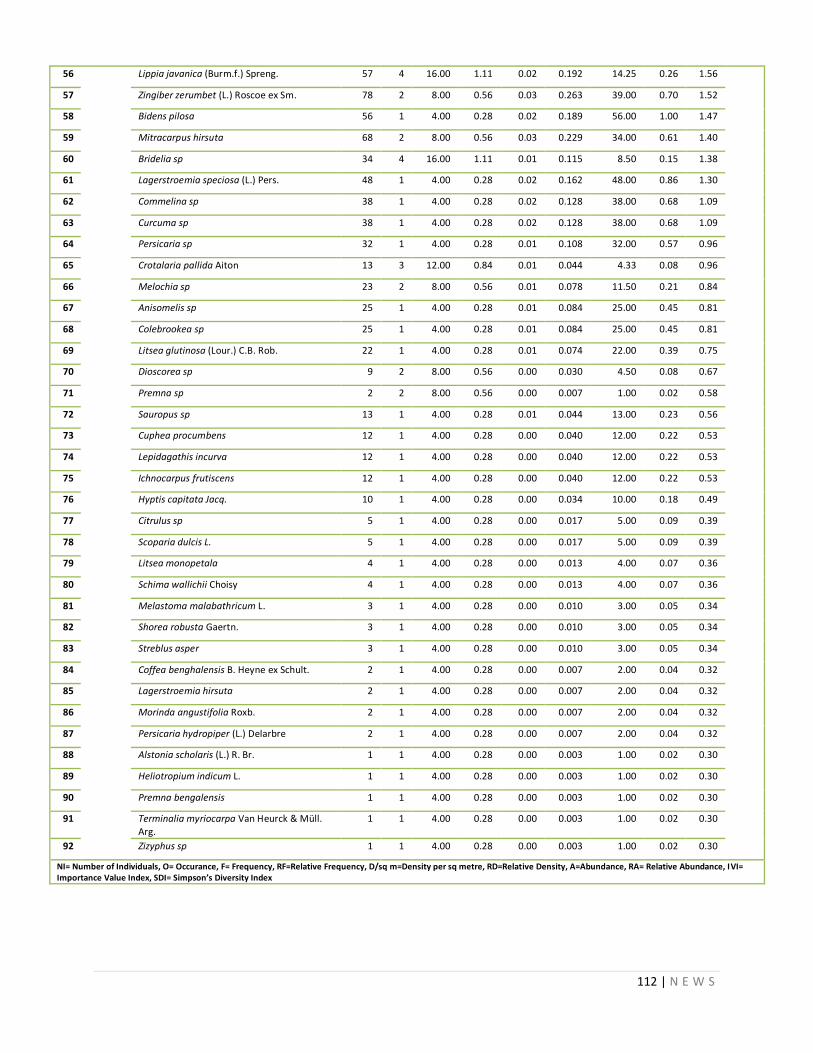
112 | N E W S
56 Lippia javanica (Burm.f.) Spreng. 57 4 16.00 1.11 0.02 0.192 14.25 0.26 1.56
57 Zingiber zerumbet (L.) Roscoe ex Sm. 78 2 8.00 0.56 0.03 0.263 39.00 0.70 1.52
58 Bidens pilosa 56 1 4.00 0.28 0.02 0.189 56.00 1.00 1.47
59 Mitracarpus hirsuta 68 2 8.00 0.56 0.03 0.229 34.00 0.61 1.40
60 Bridelia sp 34 4 16.00 1.11 0.01 0.115 8.50 0.15 1.38
61 Lagerstroemia speciosa (L.) Pers. 48 1 4.00 0.28 0.02 0.162 48.00 0.86 1.30
62 Commelina sp 38 1 4.00 0.28 0.02 0.128 38.00 0.68 1.09
63 Curcuma sp 38 1 4.00 0.28 0.02 0.128 38.00 0.68 1.09
64 Persicaria sp 32 1 4.00 0.28 0.01 0.108 32.00 0.57 0.96
65 Crotalaria pallida Aiton 13 3 12.00 0.84 0.01 0.044 4.33 0.08 0.96
66 Melochia sp 23 2 8.00 0.56 0.01 0.078 11.50 0.21 0.84
67 Anisomelis sp 25 1 4.00 0.28 0.01 0.084 25.00 0.45 0.81
68 Colebrookea sp 25 1 4.00 0.28 0.01 0.084 25.00 0.45 0.81
69 Litsea glutinosa (Lour.) C.B. Rob. 22 1 4.00 0.28 0.01 0.074 22.00 0.39 0.75
70 Dioscorea sp 9 2 8.00 0.56 0.00 0.030 4.50 0.08 0.67
71 Premna sp 2 2 8.00 0.56 0.00 0.007 1.00 0.02 0.58
72 Sauropus sp 13 1 4.00 0.28 0.01 0.044 13.00 0.23 0.56
73 Cuphea procumbens 12 1 4.00 0.28 0.00 0.040 12.00 0.22 0.53
74 Lepidagathis incurva 12 1 4.00 0.28 0.00 0.040 12.00 0.22 0.53
75 Ichnocarpus frutiscens 12 1 4.00 0.28 0.00 0.040 12.00 0.22 0.53
76 Hyptis capitata Jacq. 10 1 4.00 0.28 0.00 0.034 10.00 0.18 0.49
77 Citrulus sp 5 1 4.00 0.28 0.00 0.017 5.00 0.09 0.39
78 Scoparia dulcis L. 5 1 4.00 0.28 0.00 0.017 5.00 0.09 0.39
79 Litsea monopetala 4 1 4.00 0.28 0.00 0.013 4.00 0.07 0.36
80 Schima wallichii Choisy 4 1 4.00 0.28 0.00 0.013 4.00 0.07 0.36
81 Melastoma malabathricum L. 3 1 4.00 0.28 0.00 0.010 3.00 0.05 0.34
82 Shorea robusta Gaertn. 3 1 4.00 0.28 0.00 0.010 3.00 0.05 0.34
83 Streblus asper 3 1 4.00 0.28 0.00 0.010 3.00 0.05 0.34
84 Coffea benghalensis B. Heyne ex Schult. 2 1 4.00 0.28 0.00 0.007 2.00 0.04 0.32
85 Lagerstroemia hirsuta 2 1 4.00 0.28 0.00 0.007 2.00 0.04 0.32
86 Morinda angustifolia Roxb. 2 1 4.00 0.28 0.00 0.007 2.00 0.04 0.32
87 Persicaria hydropiper (L.) Delarbre 2 1 4.00 0.28 0.00 0.007 2.00 0.04 0.32
88 Alstonia scholaris (L.) R. Br. 1 1 4.00 0.28 0.00 0.003 1.00 0.02 0.30
89 Heliotropium indicum L. 1 1 4.00 0.28 0.00 0.003 1.00 0.02 0.30
90 Premna bengalensis 1 1 4.00 0.28 0.00 0.003 1.00 0.02 0.30
91 Terminalia myriocarpa Van Heurck & Müll. Arg.
1 1 4.00 0.28 0.00 0.003 1.00 0.02 0.30
92 Zizyphus sp 1 1 4.00 0.28 0.00 0.003 1.00 0.02 0.30
NI= Number of Individuals, O= Occurance, F= Frequency, RF=Relative Frequency, D/sq m=Density per sq metre, RD=Relative Density, A=Abundance, RA= Relative Abundance, IVI= Importance Value Index, SDI= Simpson’s Diversity Index
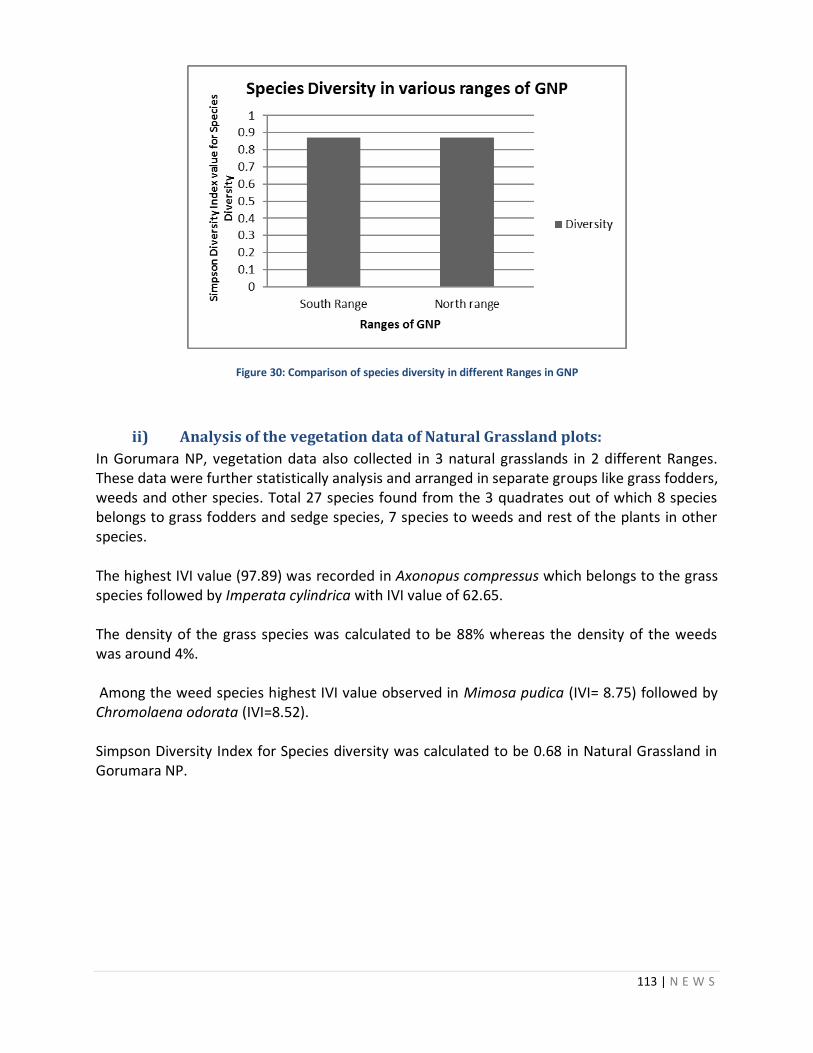
113 | N E W S
Figure 30: Comparison of species diversity in different Ranges in GNP
ii) Analysis of the vegetation data of Natural Grassland plots:
In Gorumara NP, vegetation data also collected in 3 natural grasslands in 2 different Ranges. These data were further statistically analysis and arranged in separate groups like grass fodders, weeds and other species. Total 27 species found from the 3 quadrates out of which 8 species belongs to grass fodders and sedge species, 7 species to weeds and rest of the plants in other species. The highest IVI value (97.89) was recorded in Axonopus compressus which belongs to the grass species followed by Imperata cylindrica with IVI value of 62.65. The density of the grass species was calculated to be 88% whereas the density of the weeds was around 4%. Among the weed species highest IVI value observed in Mimosa pudica (IVI= 8.75) followed by Chromolaena odorata (IVI=8.52). Simpson Diversity Index for Species diversity was calculated to be 0.68 in Natural Grassland in Gorumara NP.
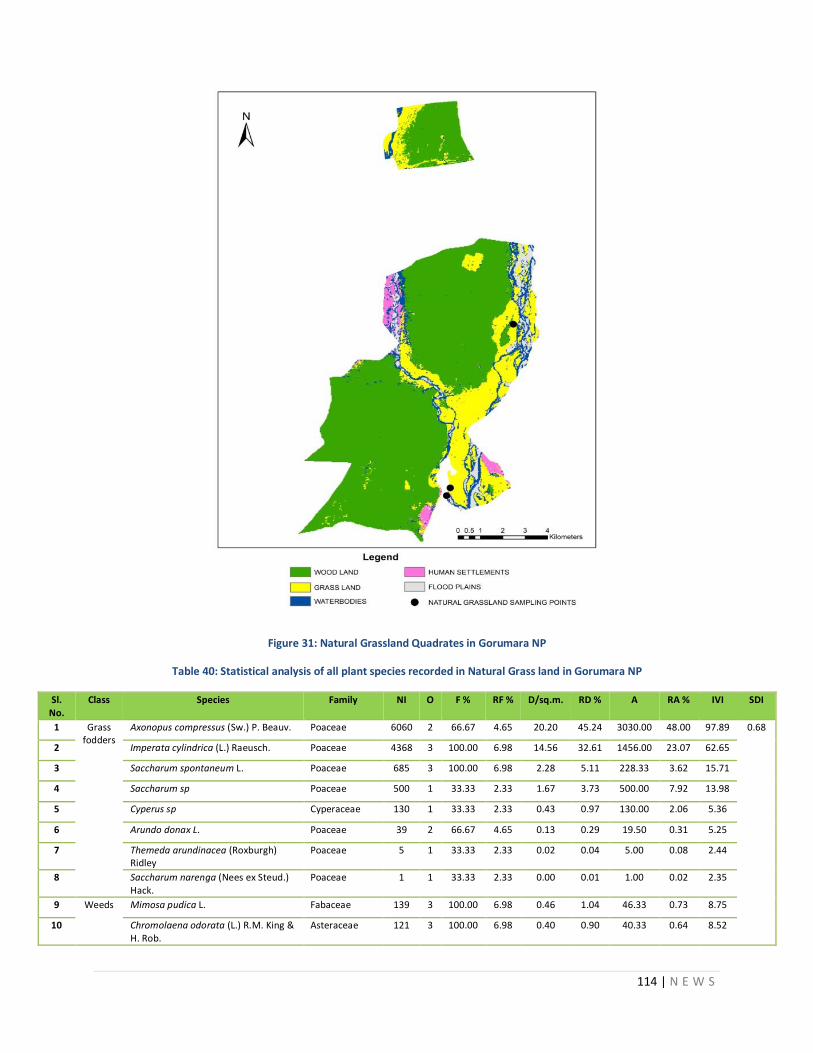
114 | N E W S
Figure 31: Natural Grassland Quadrates in Gorumara NP
Table 40: Statistical analysis of all plant species recorded in Natural Grass land in Gorumara NP
Sl. No.
Class Species Family NI O F % RF % D/sq.m. RD % A RA % IVI SDI
1 Grass fodders
Axonopus compressus (Sw.) P. Beauv. Poaceae 6060 2 66.67 4.65 20.20 45.24 3030.00 48.00 97.89 0.68
2 Imperata cylindrica (L.) Raeusch. Poaceae 4368 3 100.00 6.98 14.56 32.61 1456.00 23.07 62.65
3 Saccharum spontaneum L. Poaceae 685 3 100.00 6.98 2.28 5.11 228.33 3.62 15.71
4 Saccharum sp Poaceae 500 1 33.33 2.33 1.67 3.73 500.00 7.92 13.98
5 Cyperus sp Cyperaceae 130 1 33.33 2.33 0.43 0.97 130.00 2.06 5.36
6 Arundo donax L. Poaceae 39 2 66.67 4.65 0.13 0.29 19.50 0.31 5.25
7 Themeda arundinacea (Roxburgh) Ridley
Poaceae 5 1 33.33 2.33 0.02 0.04 5.00 0.08 2.44
8 Saccharum narenga (Nees ex Steud.) Hack.
Poaceae 1 1 33.33 2.33 0.00 0.01 1.00 0.02 2.35
9 Weeds Mimosa pudica L. Fabaceae 139 3 100.00 6.98 0.46 1.04 46.33 0.73 8.75
10 Chromolaena odorata (L.) R.M. King & H. Rob.
Asteraceae 121 3 100.00 6.98 0.40 0.90 40.33 0.64 8.52
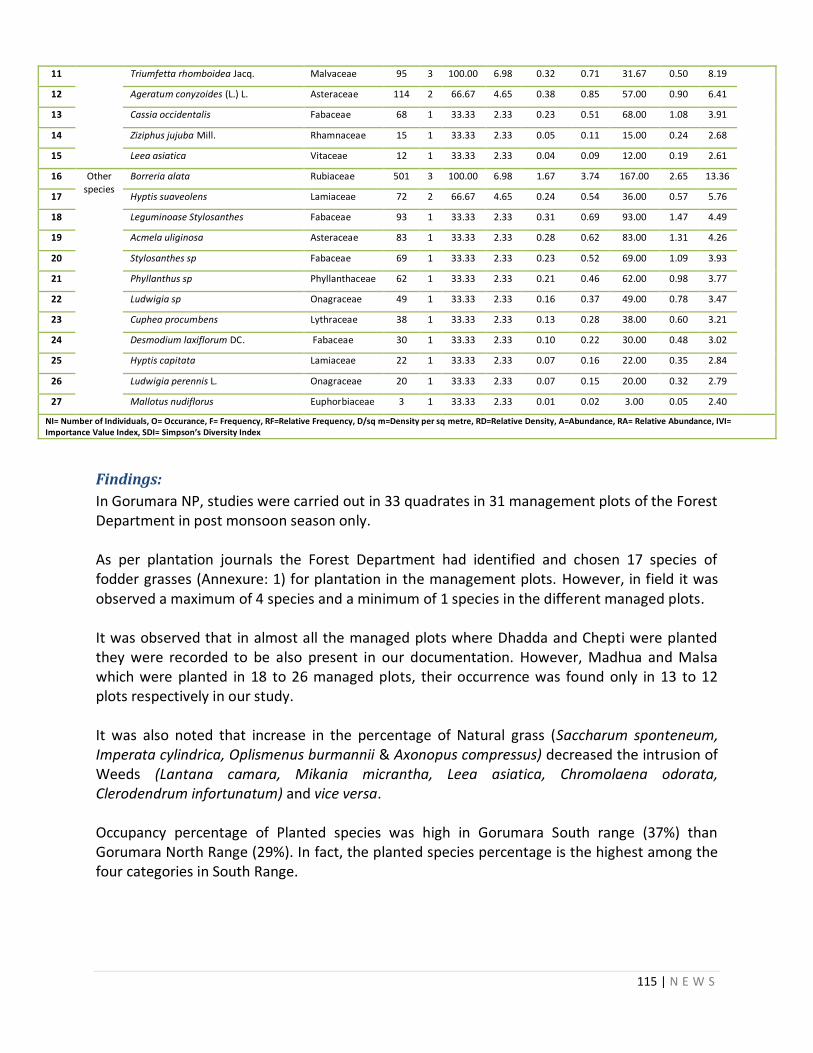
115 | N E W S
11 Triumfetta rhomboidea Jacq. Malvaceae 95 3 100.00 6.98 0.32 0.71 31.67 0.50 8.19
12 Ageratum conyzoides (L.) L. Asteraceae 114 2 66.67 4.65 0.38 0.85 57.00 0.90 6.41
13 Cassia occidentalis Fabaceae 68 1 33.33 2.33 0.23 0.51 68.00 1.08 3.91
14 Ziziphus jujuba Mill. Rhamnaceae 15 1 33.33 2.33 0.05 0.11 15.00 0.24 2.68
15 Leea asiatica Vitaceae 12 1 33.33 2.33 0.04 0.09 12.00 0.19 2.61
16 Other species
Borreria alata Rubiaceae 501 3 100.00 6.98 1.67 3.74 167.00 2.65 13.36
17 Hyptis suaveolens Lamiaceae 72 2 66.67 4.65 0.24 0.54 36.00 0.57 5.76
18 Leguminoase Stylosanthes Fabaceae 93 1 33.33 2.33 0.31 0.69 93.00 1.47 4.49
19 Acmela uliginosa Asteraceae 83 1 33.33 2.33 0.28 0.62 83.00 1.31 4.26
20 Stylosanthes sp Fabaceae 69 1 33.33 2.33 0.23 0.52 69.00 1.09 3.93
21 Phyllanthus sp Phyllanthaceae 62 1 33.33 2.33 0.21 0.46 62.00 0.98 3.77
22 Ludwigia sp Onagraceae 49 1 33.33 2.33 0.16 0.37 49.00 0.78 3.47
23 Cuphea procumbens Lythraceae 38 1 33.33 2.33 0.13 0.28 38.00 0.60 3.21
24 Desmodium laxiflorum DC. Fabaceae 30 1 33.33 2.33 0.10 0.22 30.00 0.48 3.02
25 Hyptis capitata Lamiaceae 22 1 33.33 2.33 0.07 0.16 22.00 0.35 2.84
26 Ludwigia perennis L. Onagraceae 20 1 33.33 2.33 0.07 0.15 20.00 0.32 2.79
27 Mallotus nudiflorus Euphorbiaceae 3 1 33.33 2.33 0.01 0.02 3.00 0.05 2.40
NI= Number of Individuals, O= Occurance, F= Frequency, RF=Relative Frequency, D/sq m=Density per sq metre, RD=Relative Density, A=Abundance, RA= Relative Abundance, IVI= Importance Value Index, SDI= Simpson’s Diversity Index
Findings:
In Gorumara NP, studies were carried out in 33 quadrates in 31 management plots of the Forest Department in post monsoon season only. As per plantation journals the Forest Department had identified and chosen 17 species of fodder grasses (Annexure: 1) for plantation in the management plots. However, in field it was observed a maximum of 4 species and a minimum of 1 species in the different managed plots. It was observed that in almost all the managed plots where Dhadda and Chepti were planted they were recorded to be also present in our documentation. However, Madhua and Malsa which were planted in 18 to 26 managed plots, their occurrence was found only in 13 to 12 plots respectively in our study. It was also noted that increase in the percentage of Natural grass (Saccharum sponteneum, Imperata cylindrica, Oplismenus burmannii & Axonopus compressus) decreased the intrusion of Weeds (Lantana camara, Mikania micrantha, Leea asiatica, Chromolaena odorata, Clerodendrum infortunatum) and vice versa. Occupancy percentage of Planted species was high in Gorumara South range (37%) than Gorumara North Range (29%). In fact, the planted species percentage is the highest among the four categories in South Range.
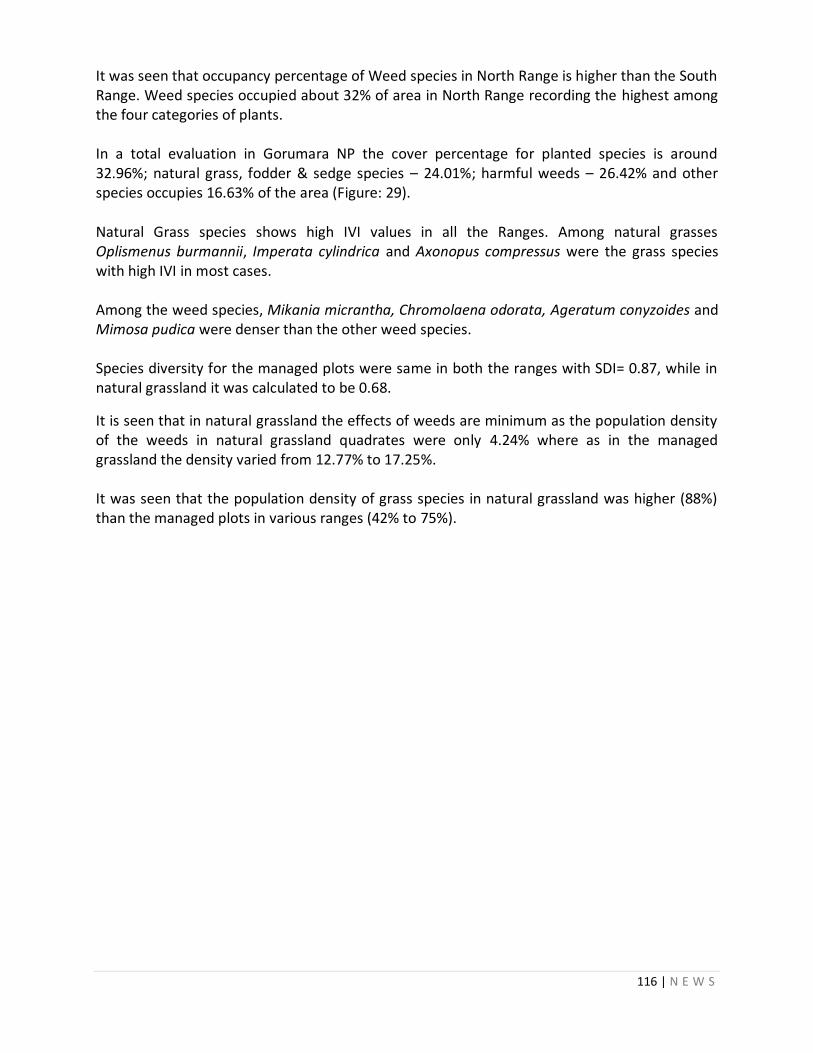
116 | N E W S
It was seen that occupancy percentage of Weed species in North Range is higher than the South Range. Weed species occupied about 32% of area in North Range recording the highest among the four categories of plants. In a total evaluation in Gorumara NP the cover percentage for planted species is around 32.96%; natural grass, fodder & sedge species – 24.01%; harmful weeds – 26.42% and other species occupies 16.63% of the area (Figure: 29). Natural Grass species shows high IVI values in all the Ranges. Among natural grasses Oplismenus burmannii, Imperata cylindrica and Axonopus compressus were the grass species with high IVI in most cases. Among the weed species, Mikania micrantha, Chromolaena odorata, Ageratum conyzoides and Mimosa pudica were denser than the other weed species. Species diversity for the managed plots were same in both the ranges with SDI= 0.87, while in natural grassland it was calculated to be 0.68.
It is seen that in natural grassland the effects of weeds are minimum as the population density of the weeds in natural grassland quadrates were only 4.24% where as in the managed grassland the density varied from 12.77% to 17.25%. It was seen that the population density of grass species in natural grassland was higher (88%) than the managed plots in various ranges (42% to 75%).
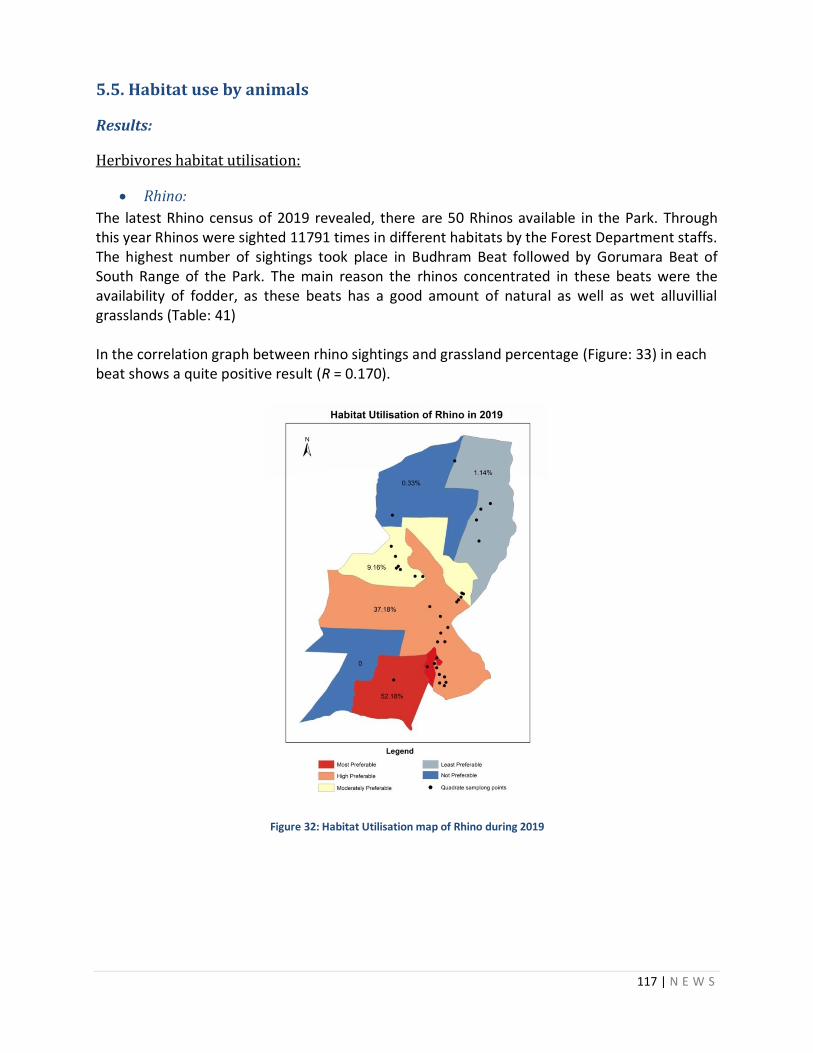
117 | N E W S
5.5. Habitat use by animals
Results:
Herbivores habitat utilisation:
Rhino:
The latest Rhino census of 2019 revealed, there are 50 Rhinos available in the Park. Through this year Rhinos were sighted 11791 times in different habitats by the Forest Department staffs. The highest number of sightings took place in Budhram Beat followed by Gorumara Beat of South Range of the Park. The main reason the rhinos concentrated in these beats were the availability of fodder, as these beats has a good amount of natural as well as wet alluvillial grasslands (Table: 41) In the correlation graph between rhino sightings and grassland percentage (Figure: 33) in each beat shows a quite positive result (R = 0.170).
Figure 32: Habitat Utilisation map of Rhino during 2019
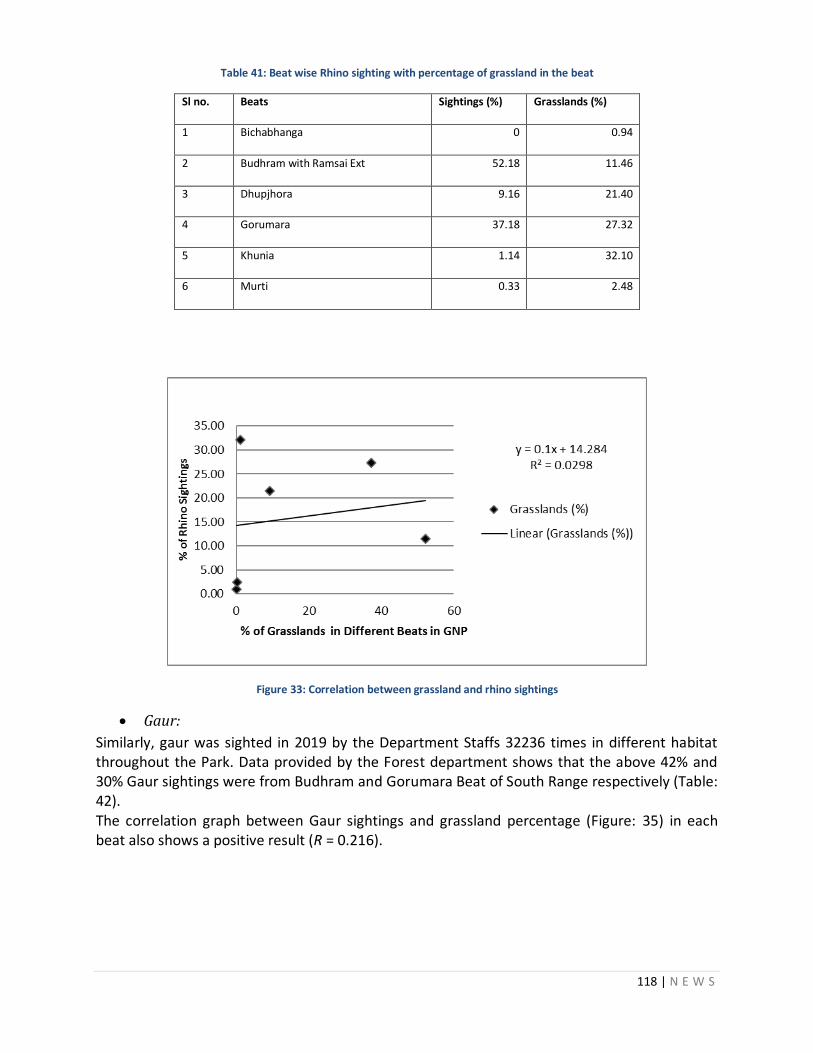
118 | N E W S
Table 41: Beat wise Rhino sighting with percentage of grassland in the beat
Sl no. Beats Sightings (%) Grasslands (%)
1 Bichabhanga 0 0.94
2 Budhram with Ramsai Ext 52.18 11.46
3 Dhupjhora 9.16 21.40
4 Gorumara 37.18 27.32
5 Khunia 1.14 32.10
6 Murti 0.33 2.48
Figure 33: Correlation between grassland and rhino sightings
Gaur:
Similarly, gaur was sighted in 2019 by the Department Staffs 32236 times in different habitat throughout the Park. Data provided by the Forest department shows that the above 42% and 30% Gaur sightings were from Budhram and Gorumara Beat of South Range respectively (Table: 42). The correlation graph between Gaur sightings and grassland percentage (Figure: 35) in each beat also shows a positive result (R = 0.216).
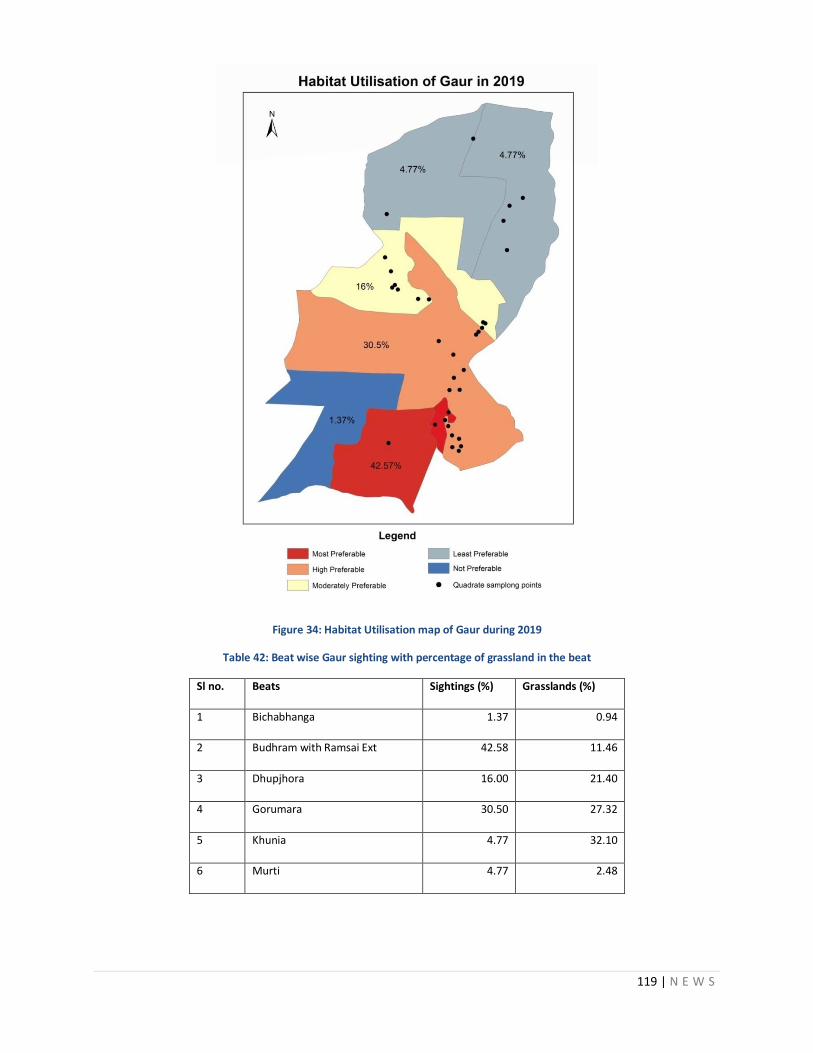
119 | N E W S
Figure 34: Habitat Utilisation map of Gaur during 2019
Table 42: Beat wise Gaur sighting with percentage of grassland in the beat
Sl no. Beats Sightings (%) Grasslands (%)
1 Bichabhanga 1.37 0.94
2 Budhram with Ramsai Ext 42.58 11.46
3 Dhupjhora 16.00 21.40
4 Gorumara 30.50 27.32
5 Khunia 4.77 32.10
6 Murti 4.77 2.48
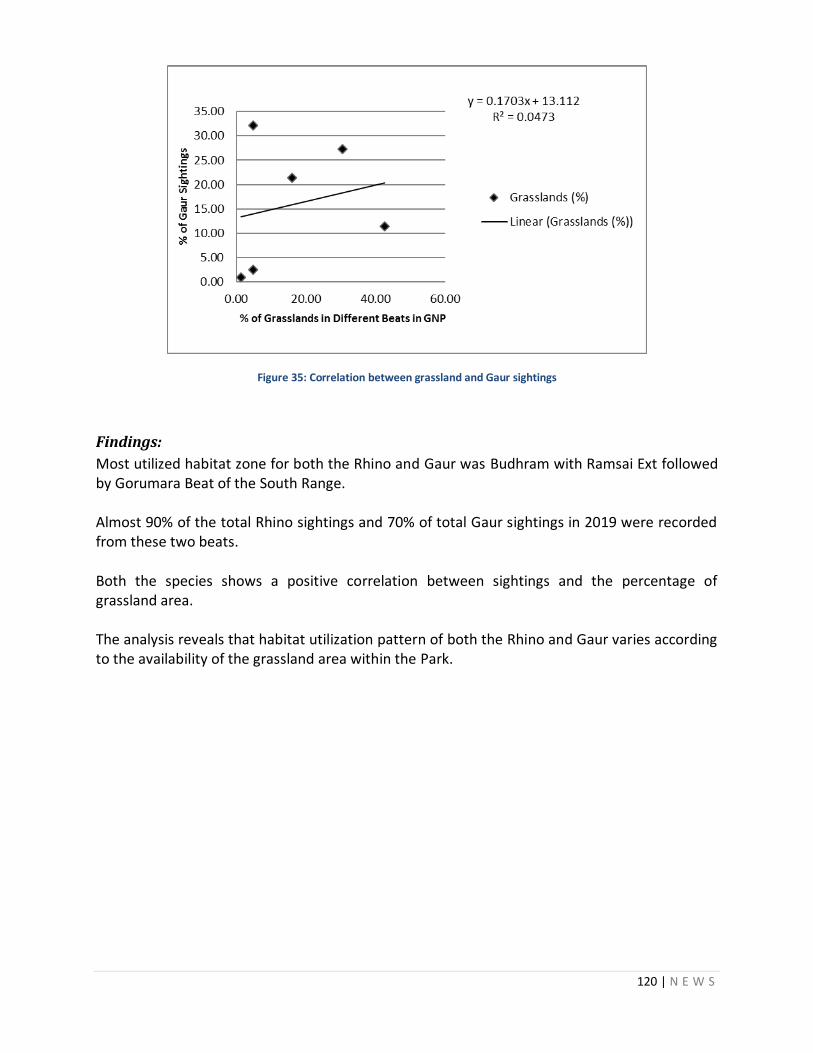
120 | N E W S
Figure 35: Correlation between grassland and Gaur sightings
Findings:
Most utilized habitat zone for both the Rhino and Gaur was Budhram with Ramsai Ext followed by Gorumara Beat of the South Range. Almost 90% of the total Rhino sightings and 70% of total Gaur sightings in 2019 were recorded from these two beats. Both the species shows a positive correlation between sightings and the percentage of grassland area. The analysis reveals that habitat utilization pattern of both the Rhino and Gaur varies according to the availability of the grassland area within the Park.
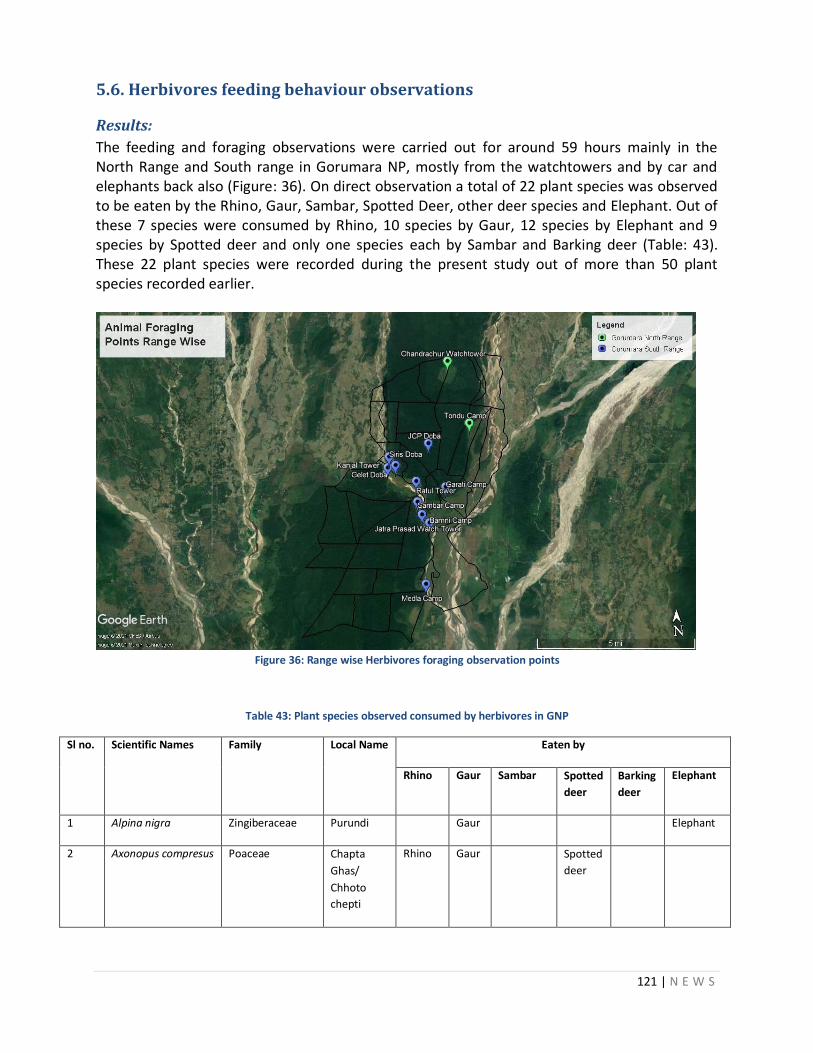
121 | N E W S
5.6. Herbivores feeding behaviour observations
Results:
The feeding and foraging observations were carried out for around 59 hours mainly in the North Range and South range in Gorumara NP, mostly from the watchtowers and by car and elephants back also (Figure: 36). On direct observation a total of 22 plant species was observed to be eaten by the Rhino, Gaur, Sambar, Spotted Deer, other deer species and Elephant. Out of these 7 species were consumed by Rhino, 10 species by Gaur, 12 species by Elephant and 9 species by Spotted deer and only one species each by Sambar and Barking deer (Table: 43). These 22 plant species were recorded during the present study out of more than 50 plant species recorded earlier.
Figure 36: Range wise Herbivores foraging observation points
Table 43: Plant species observed consumed by herbivores in GNP
Sl no. Scientific Names Family Local Name Eaten by
Rhino Gaur Sambar Spotted
deer
Barking
deer
Elephant
1 Alpina nigra Zingiberaceae Purundi Gaur Elephant
2 Axonopus compresus Poaceae Chapta
Ghas/
Chhoto
chepti
Rhino Gaur Spotted
deer
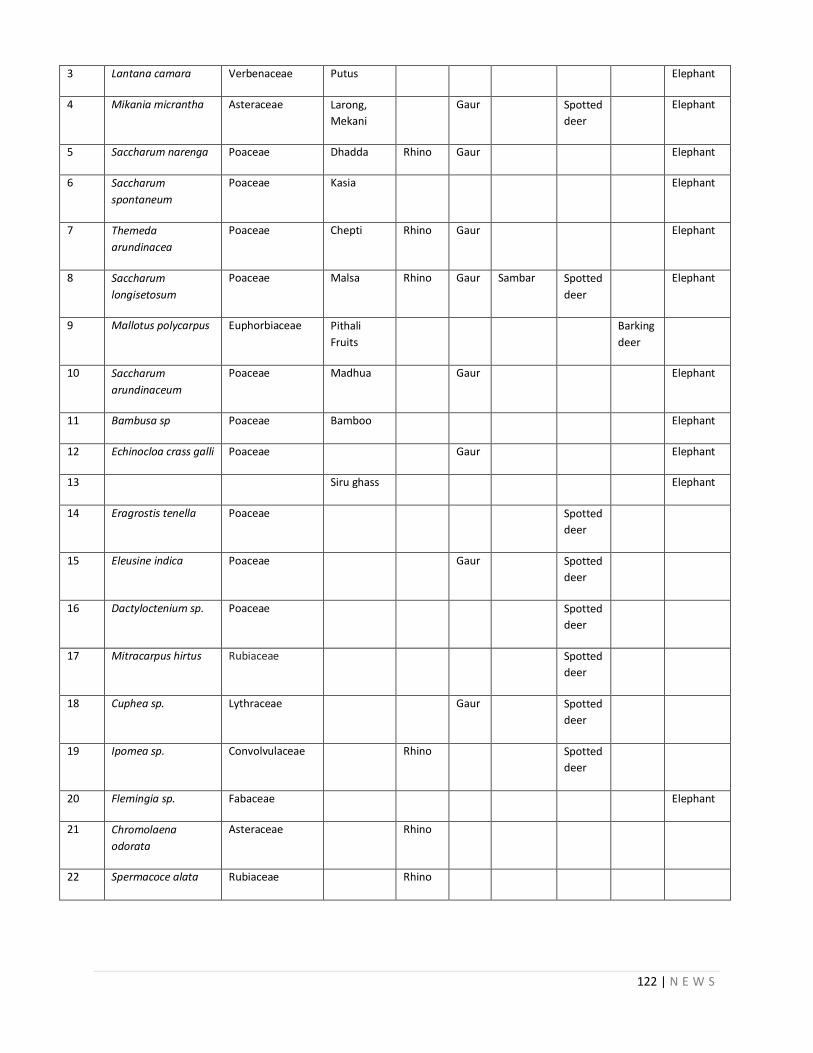
122 | N E W S
3 Lantana camara Verbenaceae Putus Elephant
4 Mikania micrantha Asteraceae Larong,
Mekani
Gaur Spotted
deer
Elephant
5 Saccharum narenga Poaceae Dhadda Rhino Gaur Elephant
6 Saccharum
spontaneum
Poaceae Kasia Elephant
7 Themeda
arundinacea
Poaceae Chepti Rhino Gaur Elephant
8 Saccharum
longisetosum
Poaceae Malsa Rhino Gaur Sambar Spotted
deer
Elephant
9 Mallotus polycarpus Euphorbiaceae Pithali
Fruits
Barking
deer
10 Saccharum
arundinaceum
Poaceae Madhua Gaur Elephant
11 Bambusa sp Poaceae Bamboo Elephant
12 Echinocloa crass galli Poaceae Gaur Elephant
13 Siru ghass Elephant
14 Eragrostis tenella Poaceae Spotted
deer
15 Eleusine indica Poaceae Gaur Spotted
deer
16 Dactyloctenium sp. Poaceae Spotted
deer
17 Mitracarpus hirtus Rubiaceae Spotted
deer
18 Cuphea sp. Lythraceae Gaur Spotted
deer
19 Ipomea sp. Convolvulaceae Rhino Spotted
deer
20 Flemingia sp. Fabaceae Elephant
21 Chromolaena
odorata
Asteraceae Rhino
22 Spermacoce alata Rubiaceae Rhino
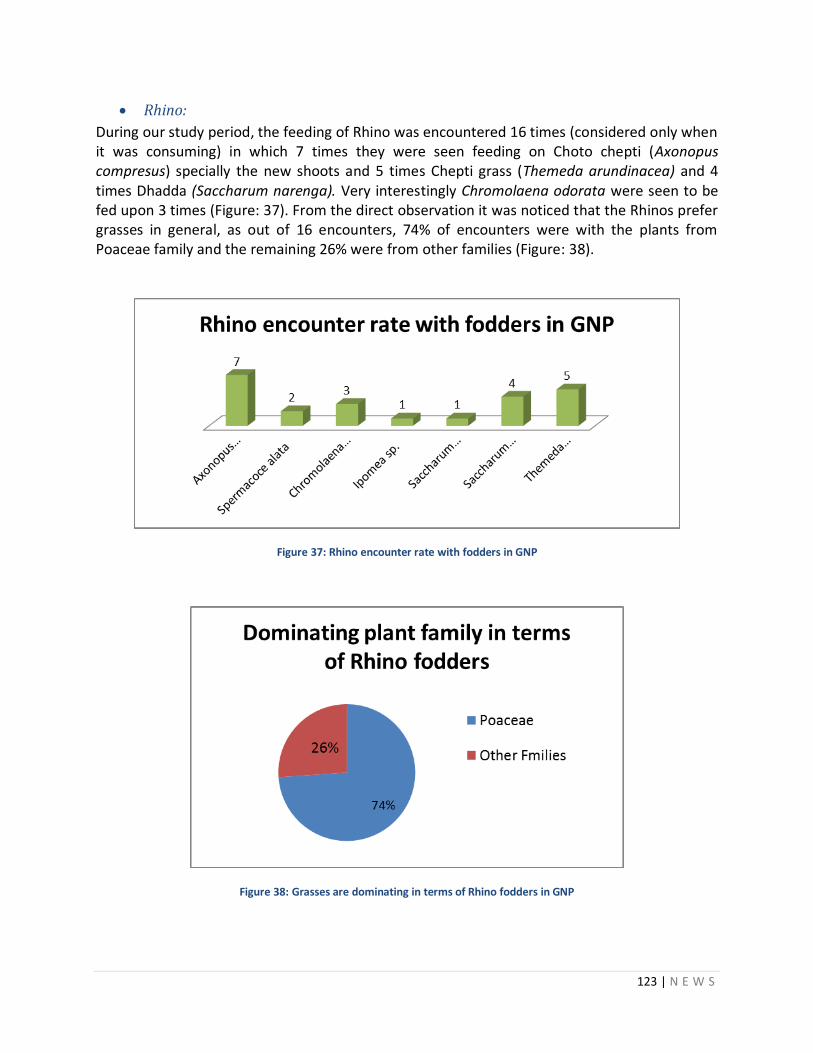
123 | N E W S
Rhino:
During our study period, the feeding of Rhino was encountered 16 times (considered only when it was consuming) in which 7 times they were seen feeding on Choto chepti (Axonopus compresus) specially the new shoots and 5 times Chepti grass (Themeda arundinacea) and 4 times Dhadda (Saccharum narenga). Very interestingly Chromolaena odorata were seen to be fed upon 3 times (Figure: 37). From the direct observation it was noticed that the Rhinos prefer grasses in general, as out of 16 encounters, 74% of encounters were with the plants from Poaceae family and the remaining 26% were from other families (Figure: 38).
Figure 37: Rhino encounter rate with fodders in GNP
Figure 38: Grasses are dominating in terms of Rhino fodders in GNP
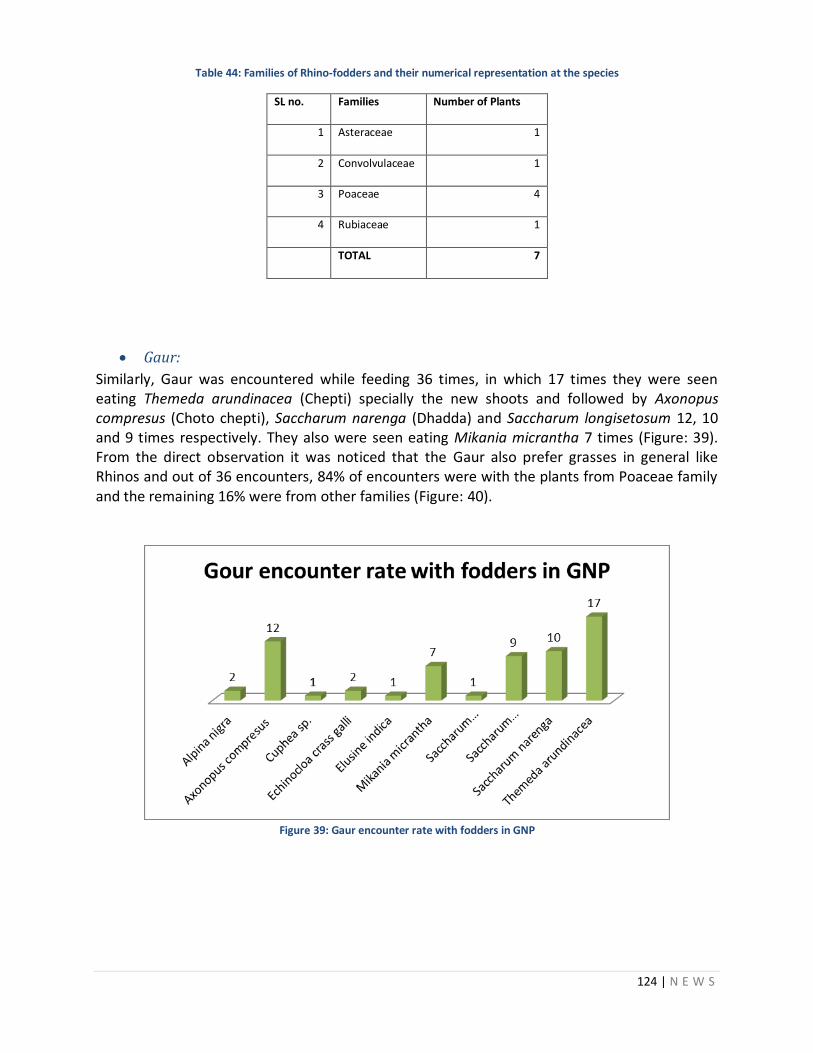
124 | N E W S
Table 44: Families of Rhino-fodders and their numerical representation at the species
SL no. Families Number of Plants
1 Asteraceae 1
2 Convolvulaceae 1
3 Poaceae 4
4 Rubiaceae 1
TOTAL 7
Gaur:
Similarly, Gaur was encountered while feeding 36 times, in which 17 times they were seen eating Themeda arundinacea (Chepti) specially the new shoots and followed by Axonopus compresus (Choto chepti), Saccharum narenga (Dhadda) and Saccharum longisetosum 12, 10 and 9 times respectively. They also were seen eating Mikania micrantha 7 times (Figure: 39). From the direct observation it was noticed that the Gaur also prefer grasses in general like Rhinos and out of 36 encounters, 84% of encounters were with the plants from Poaceae family and the remaining 16% were from other families (Figure: 40).
Figure 39: Gaur encounter rate with fodders in GNP
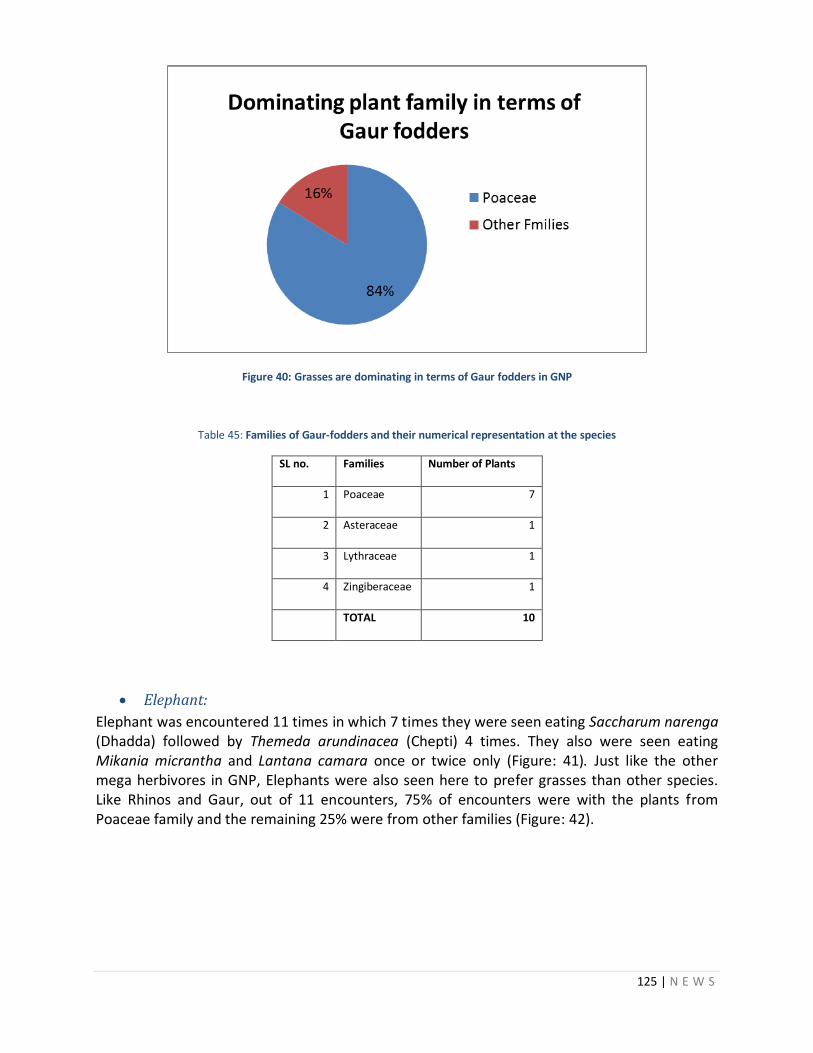
125 | N E W S
Figure 40: Grasses are dominating in terms of Gaur fodders in GNP
Table 45: Families of Gaur-fodders and their numerical representation at the species
SL no. Families Number of Plants
1 Poaceae 7
2 Asteraceae 1
3 Lythraceae 1
4 Zingiberaceae 1
TOTAL 10
Elephant:
Elephant was encountered 11 times in which 7 times they were seen eating Saccharum narenga (Dhadda) followed by Themeda arundinacea (Chepti) 4 times. They also were seen eating Mikania micrantha and Lantana camara once or twice only (Figure: 41). Just like the other mega herbivores in GNP, Elephants were also seen here to prefer grasses than other species. Like Rhinos and Gaur, out of 11 encounters, 75% of encounters were with the plants from Poaceae family and the remaining 25% were from other families (Figure: 42).
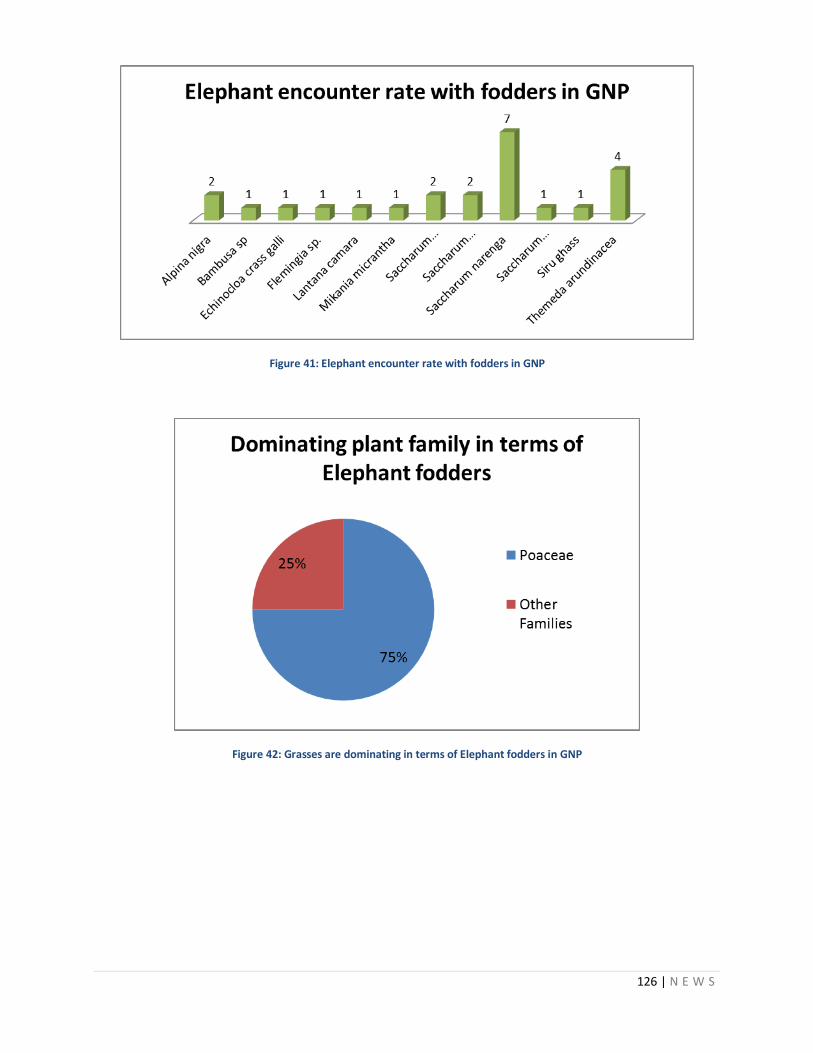
126 | N E W S
Figure 41: Elephant encounter rate with fodders in GNP
Figure 42: Grasses are dominating in terms of Elephant fodders in GNP
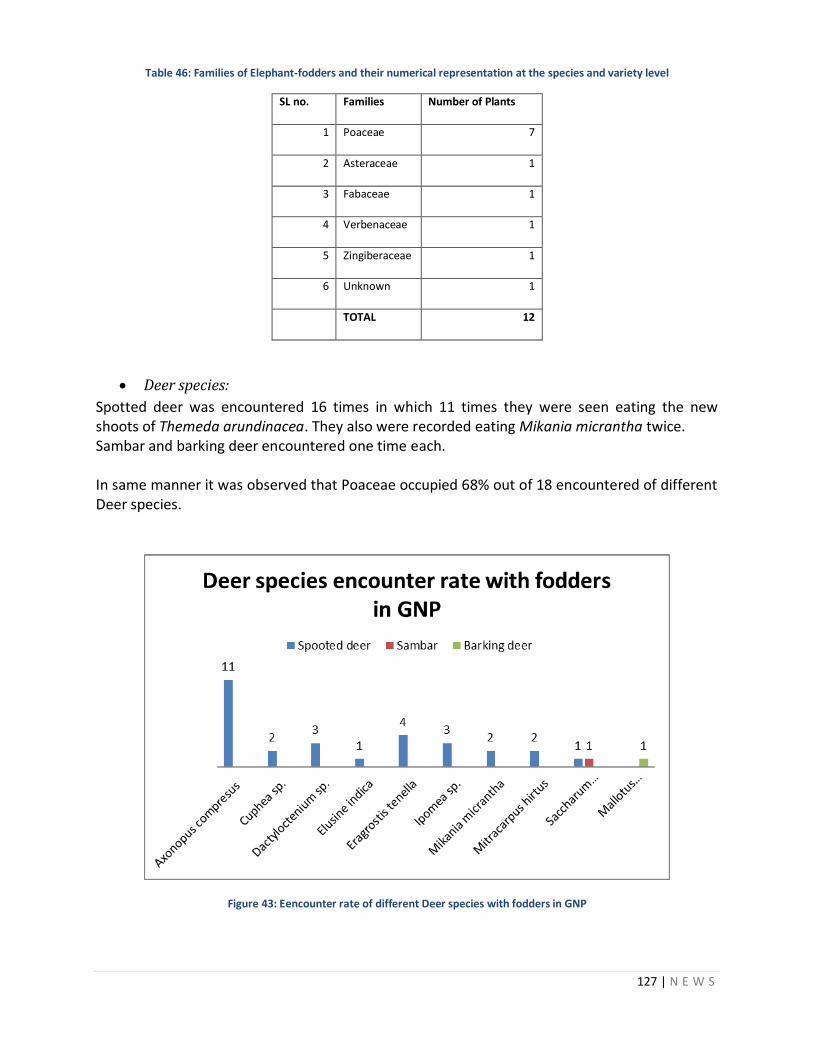
127 | N E W S
Table 46: Families of Elephant-fodders and their numerical representation at the species and variety level
SL no. Families Number of Plants
1 Poaceae 7
2 Asteraceae 1
3 Fabaceae 1
4 Verbenaceae 1
5 Zingiberaceae 1
6 Unknown 1
TOTAL 12
Deer species:
Spotted deer was encountered 16 times in which 11 times they were seen eating the new shoots of Themeda arundinacea. They also were recorded eating Mikania micrantha twice. Sambar and barking deer encountered one time each. In same manner it was observed that Poaceae occupied 68% out of 18 encountered of different Deer species.
Figure 43: Eencounter rate of different Deer species with fodders in GNP
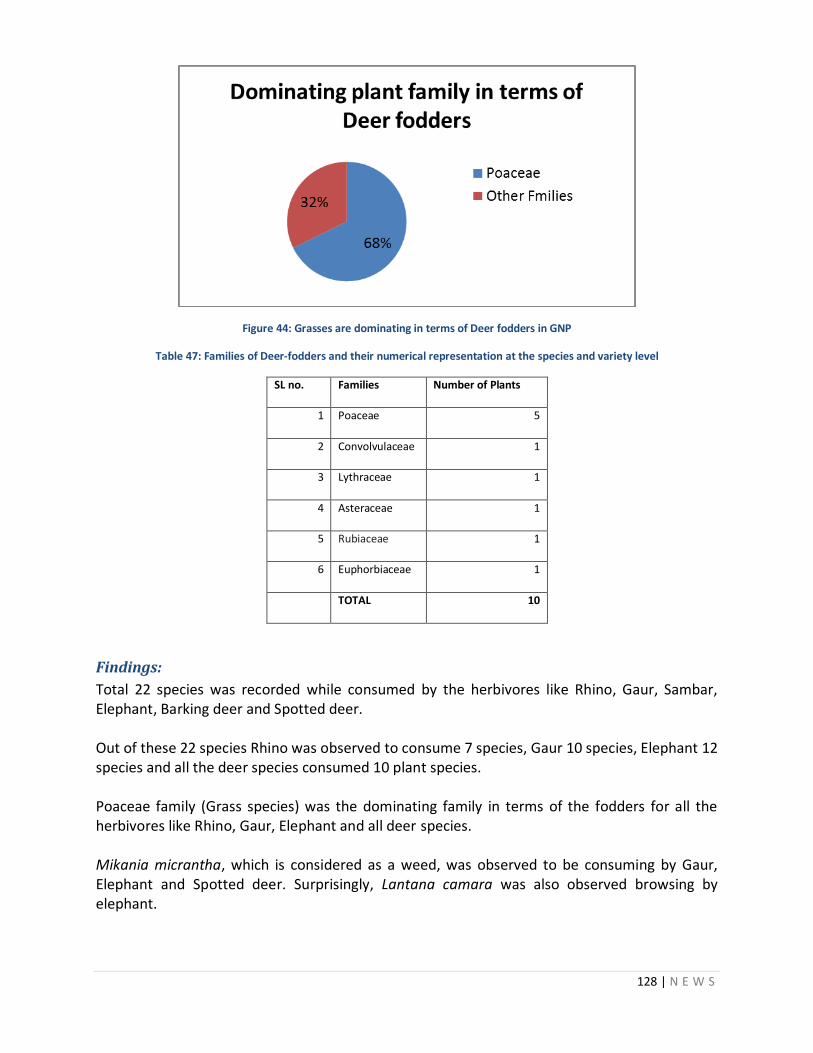
128 | N E W S
Figure 44: Grasses are dominating in terms of Deer fodders in GNP
Table 47: Families of Deer-fodders and their numerical representation at the species and variety level
SL no. Families Number of Plants
1 Poaceae 5
2 Convolvulaceae 1
3 Lythraceae 1
4 Asteraceae 1
5 Rubiaceae 1
6 Euphorbiaceae 1
TOTAL 10
Findings:
Total 22 species was recorded while consumed by the herbivores like Rhino, Gaur, Sambar, Elephant, Barking deer and Spotted deer. Out of these 22 species Rhino was observed to consume 7 species, Gaur 10 species, Elephant 12 species and all the deer species consumed 10 plant species. Poaceae family (Grass species) was the dominating family in terms of the fodders for all the herbivores like Rhino, Gaur, Elephant and all deer species. Mikania micrantha, which is considered as a weed, was observed to be consuming by Gaur, Elephant and Spotted deer. Surprisingly, Lantana camara was also observed browsing by elephant.
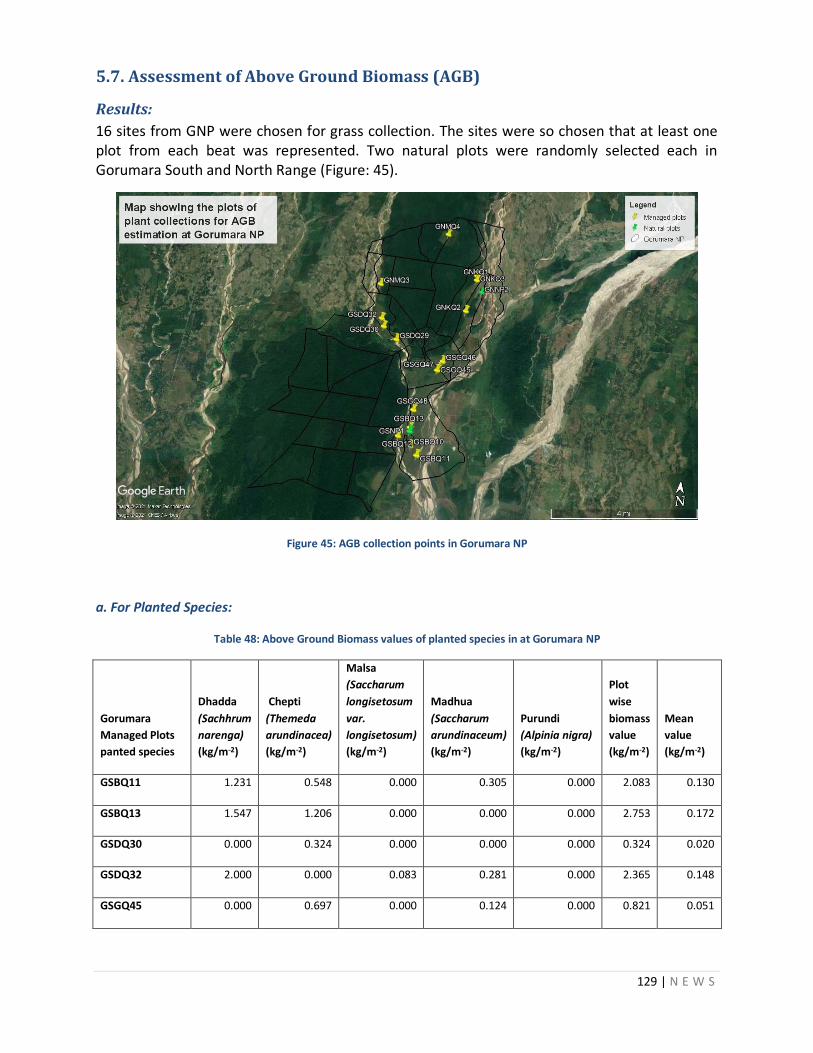
129 | N E W S
5.7. Assessment of Above Ground Biomass (AGB)
Results:
16 sites from GNP were chosen for grass collection. The sites were so chosen that at least one plot from each beat was represented. Two natural plots were randomly selected each in Gorumara South and North Range (Figure: 45).
Figure 45: AGB collection points in Gorumara NP
a. For Planted Species:
Table 48: Above Ground Biomass values of planted species in at Gorumara NP
Gorumara
Managed Plots
panted species
Dhadda
(Sachhrum
narenga)
(kg/m-2)
Chepti
(Themeda
arundinacea)
(kg/m-2)
Malsa
(Saccharum
longisetosum
var.
longisetosum)
(kg/m-2)
Madhua
(Saccharum
arundinaceum)
(kg/m-2)
Purundi
(Alpinia nigra)
(kg/m-2)
Plot
wise
biomass
value
(kg/m-2)
Mean
value
(kg/m-2)
GSBQ11 1.231 0.548 0.000 0.305 0.000 2.083 0.130
GSBQ13 1.547 1.206 0.000 0.000 0.000 2.753 0.172
GSDQ30 0.000 0.324 0.000 0.000 0.000 0.324 0.020
GSDQ32 2.000 0.000 0.083 0.281 0.000 2.365 0.148
GSGQ45 0.000 0.697 0.000 0.124 0.000 0.821 0.051
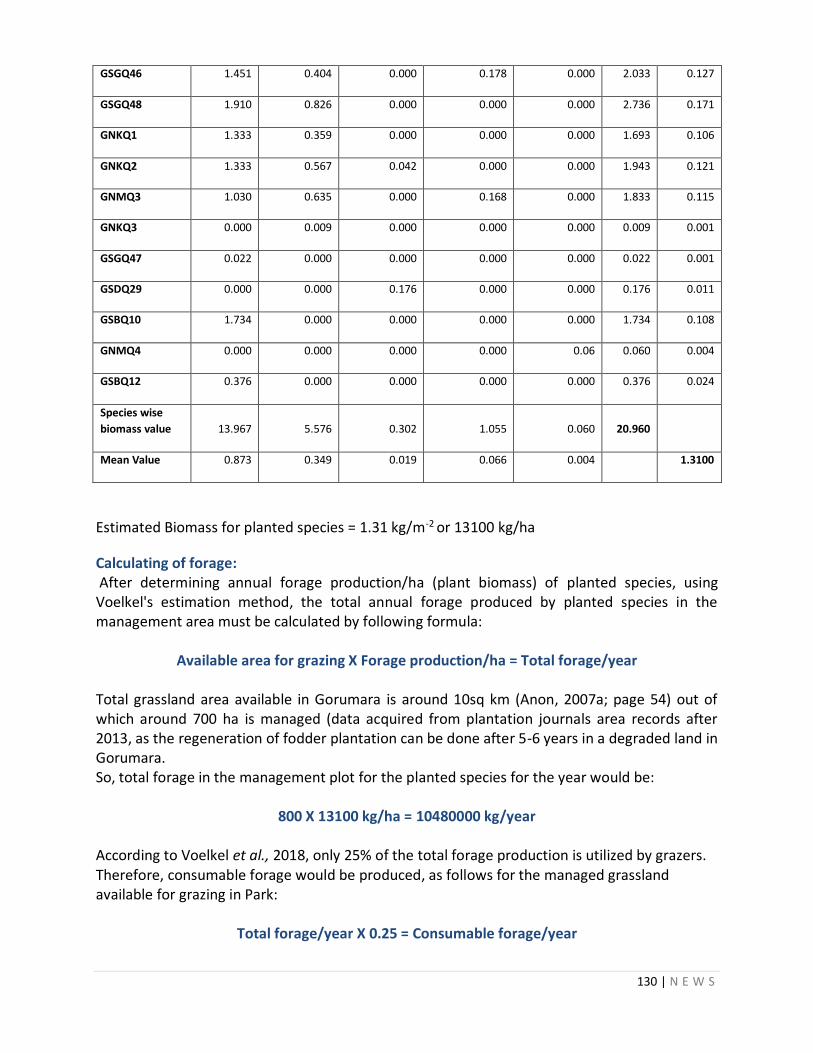
130 | N E W S
GSGQ46 1.451 0.404 0.000 0.178 0.000 2.033 0.127
GSGQ48 1.910 0.826 0.000 0.000 0.000 2.736 0.171
GNKQ1 1.333 0.359 0.000 0.000 0.000 1.693 0.106
GNKQ2 1.333 0.567 0.042 0.000 0.000 1.943 0.121
GNMQ3 1.030 0.635 0.000 0.168 0.000 1.833 0.115
GNKQ3 0.000 0.009 0.000 0.000 0.000 0.009 0.001
GSGQ47 0.022 0.000 0.000 0.000 0.000 0.022 0.001
GSDQ29 0.000 0.000 0.176 0.000 0.000 0.176 0.011
GSBQ10 1.734 0.000 0.000 0.000 0.000 1.734 0.108
GNMQ4 0.000 0.000 0.000 0.000 0.06 0.060 0.004
GSBQ12 0.376 0.000 0.000 0.000 0.000 0.376 0.024
Species wise
biomass value 13.967 5.576 0.302 1.055 0.060 20.960
Mean Value 0.873 0.349 0.019 0.066 0.004 1.3100
Estimated Biomass for planted species = 1.31 kg/m-2 or 13100 kg/ha
Calculating of forage: After determining annual forage production/ha (plant biomass) of planted species, using Voelkel's estimation method, the total annual forage produced by planted species in the management area must be calculated by following formula:
Available area for grazing X Forage production/ha = Total forage/year
Total grassland area available in Gorumara is around 10sq km (Anon, 2007a; page 54) out of which around 700 ha is managed (data acquired from plantation journals area records after 2013, as the regeneration of fodder plantation can be done after 5-6 years in a degraded land in Gorumara. So, total forage in the management plot for the planted species for the year would be:
800 X 13100 kg/ha = 10480000 kg/year
According to Voelkel et al., 2018, only 25% of the total forage production is utilized by grazers. Therefore, consumable forage would be produced, as follows for the managed grassland available for grazing in Park:
Total forage/year X 0.25 = Consumable forage/year
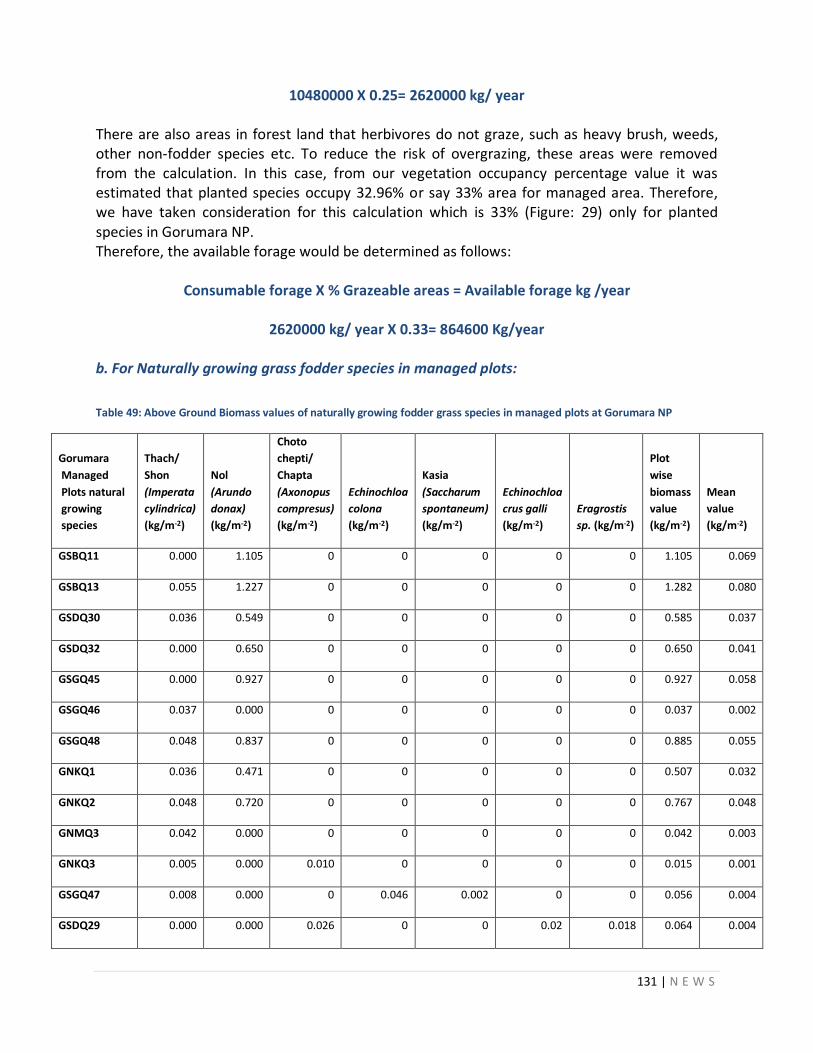
131 | N E W S
10480000 X 0.25= 2620000 kg/ year
There are also areas in forest land that herbivores do not graze, such as heavy brush, weeds, other non-fodder species etc. To reduce the risk of overgrazing, these areas were removed from the calculation. In this case, from our vegetation occupancy percentage value it was estimated that planted species occupy 32.96% or say 33% area for managed area. Therefore, we have taken consideration for this calculation which is 33% (Figure: 29) only for planted species in Gorumara NP. Therefore, the available forage would be determined as follows:
Consumable forage X % Grazeable areas = Available forage kg /year
2620000 kg/ year X 0.33= 864600 Kg/year
b. For Naturally growing grass fodder species in managed plots:
Table 49: Above Ground Biomass values of naturally growing fodder grass species in managed plots at Gorumara NP
Gorumara
Managed
Plots natural
growing
species
Thach/
Shon
(Imperata
cylindrica)
(kg/m-2)
Nol
(Arundo
donax)
(kg/m-2)
Choto
chepti/
Chapta
(Axonopus
compresus)
(kg/m-2)
Echinochloa
colona
(kg/m-2)
Kasia
(Saccharum
spontaneum)
(kg/m-2)
Echinochloa
crus galli
(kg/m-2)
Eragrostis
sp. (kg/m-2)
Plot
wise
biomass
value
(kg/m-2)
Mean
value
(kg/m-2)
GSBQ11 0.000 1.105 0 0 0 0 0 1.105 0.069
GSBQ13 0.055 1.227 0 0 0 0 0 1.282 0.080
GSDQ30 0.036 0.549 0 0 0 0 0 0.585 0.037
GSDQ32 0.000 0.650 0 0 0 0 0 0.650 0.041
GSGQ45 0.000 0.927 0 0 0 0 0 0.927 0.058
GSGQ46 0.037 0.000 0 0 0 0 0 0.037 0.002
GSGQ48 0.048 0.837 0 0 0 0 0 0.885 0.055
GNKQ1 0.036 0.471 0 0 0 0 0 0.507 0.032
GNKQ2 0.048 0.720 0 0 0 0 0 0.767 0.048
GNMQ3 0.042 0.000 0 0 0 0 0 0.042 0.003
GNKQ3 0.005 0.000 0.010 0 0 0 0 0.015 0.001
GSGQ47 0.008 0.000 0 0.046 0.002 0 0 0.056 0.004
GSDQ29 0.000 0.000 0.026 0 0 0.02 0.018 0.064 0.004
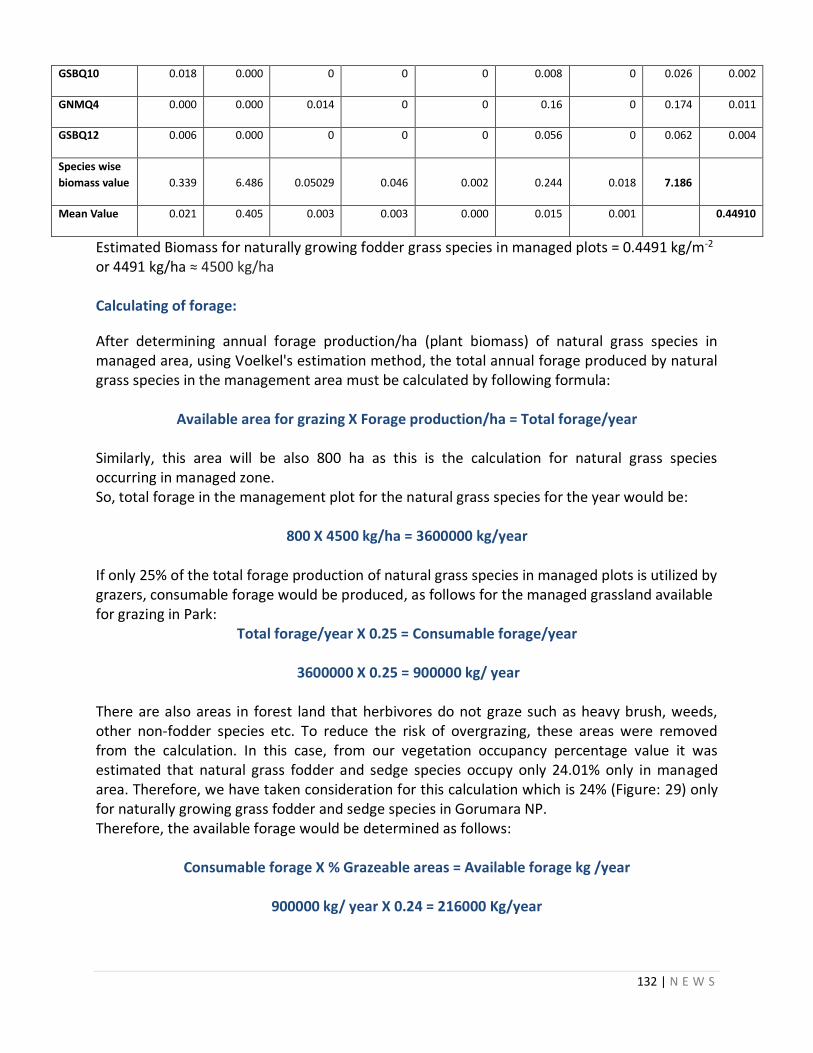
132 | N E W S
GSBQ10 0.018 0.000 0 0 0 0.008 0 0.026 0.002
GNMQ4 0.000 0.000 0.014 0 0 0.16 0 0.174 0.011
GSBQ12 0.006 0.000 0 0 0 0.056 0 0.062 0.004
Species wise
biomass value 0.339 6.486 0.05029 0.046 0.002 0.244 0.018 7.186
Mean Value 0.021 0.405 0.003 0.003 0.000 0.015 0.001 0.44910
Estimated Biomass for naturally growing fodder grass species in managed plots = 0.4491 kg/m-2
or 4491 kg/ha ≈ 4500 kg/ha Calculating of forage:
After determining annual forage production/ha (plant biomass) of natural grass species in managed area, using Voelkel's estimation method, the total annual forage produced by natural grass species in the management area must be calculated by following formula:
Available area for grazing X Forage production/ha = Total forage/year
Similarly, this area will be also 800 ha as this is the calculation for natural grass species occurring in managed zone. So, total forage in the management plot for the natural grass species for the year would be:
800 X 4500 kg/ha = 3600000 kg/year
If only 25% of the total forage production of natural grass species in managed plots is utilized by grazers, consumable forage would be produced, as follows for the managed grassland available for grazing in Park:
Total forage/year X 0.25 = Consumable forage/year
3600000 X 0.25 = 900000 kg/ year
There are also areas in forest land that herbivores do not graze such as heavy brush, weeds, other non-fodder species etc. To reduce the risk of overgrazing, these areas were removed from the calculation. In this case, from our vegetation occupancy percentage value it was estimated that natural grass fodder and sedge species occupy only 24.01% only in managed area. Therefore, we have taken consideration for this calculation which is 24% (Figure: 29) only for naturally growing grass fodder and sedge species in Gorumara NP. Therefore, the available forage would be determined as follows:
Consumable forage X % Grazeable areas = Available forage kg /year
900000 kg/ year X 0.24 = 216000 Kg/year
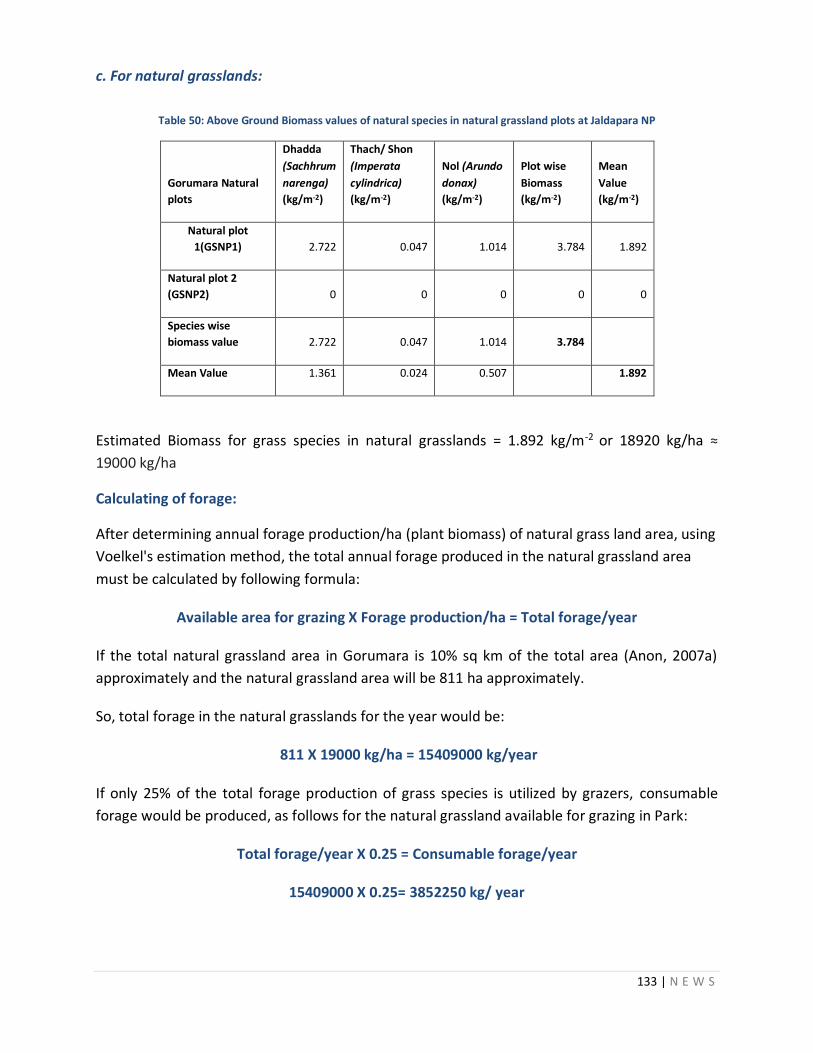
133 | N E W S
c. For natural grasslands:
Table 50: Above Ground Biomass values of natural species in natural grassland plots at Jaldapara NP
Gorumara Natural
plots
Dhadda
(Sachhrum
narenga)
(kg/m-2)
Thach/ Shon
(Imperata
cylindrica)
(kg/m-2)
Nol (Arundo
donax)
(kg/m-2)
Plot wise
Biomass
(kg/m-2)
Mean
Value
(kg/m-2)
Natural plot
1(GSNP1) 2.722 0.047 1.014 3.784 1.892
Natural plot 2
(GSNP2) 0 0 0 0 0
Species wise
biomass value 2.722 0.047 1.014 3.784
Mean Value 1.361 0.024 0.507 1.892
Estimated Biomass for grass species in natural grasslands = 1.892 kg/m-2 or 18920 kg/ha ≈
19000 kg/ha
Calculating of forage:
After determining annual forage production/ha (plant biomass) of natural grass land area, using
Voelkel's estimation method, the total annual forage produced in the natural grassland area
must be calculated by following formula:
Available area for grazing X Forage production/ha = Total forage/year
If the total natural grassland area in Gorumara is 10% sq km of the total area (Anon, 2007a)
approximately and the natural grassland area will be 811 ha approximately.
So, total forage in the natural grasslands for the year would be:
811 X 19000 kg/ha = 15409000 kg/year
If only 25% of the total forage production of grass species is utilized by grazers, consumable
forage would be produced, as follows for the natural grassland available for grazing in Park:
Total forage/year X 0.25 = Consumable forage/year
15409000 X 0.25= 3852250 kg/ year
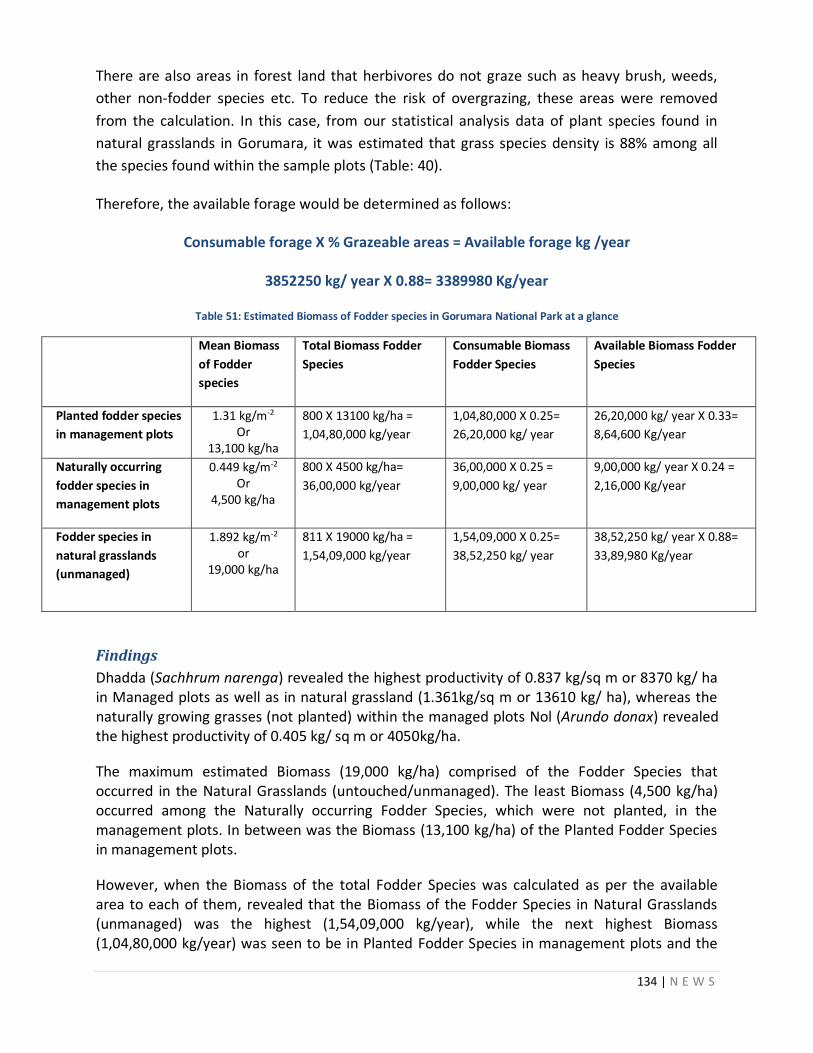
134 | N E W S
There are also areas in forest land that herbivores do not graze such as heavy brush, weeds,
other non-fodder species etc. To reduce the risk of overgrazing, these areas were removed
from the calculation. In this case, from our statistical analysis data of plant species found in
natural grasslands in Gorumara, it was estimated that grass species density is 88% among all
the species found within the sample plots (Table: 40).
Therefore, the available forage would be determined as follows:
Consumable forage X % Grazeable areas = Available forage kg /year
3852250 kg/ year X 0.88= 3389980 Kg/year
Table 51: Estimated Biomass of Fodder species in Gorumara National Park at a glance
Mean Biomass
of Fodder
species
Total Biomass Fodder
Species
Consumable Biomass
Fodder Species
Available Biomass Fodder
Species
Planted fodder species
in management plots
1.31 kg/m-2 Or
13,100 kg/ha
800 X 13100 kg/ha =
1,04,80,000 kg/year
1,04,80,000 X 0.25=
26,20,000 kg/ year
26,20,000 kg/ year X 0.33=
8,64,600 Kg/year
Naturally occurring
fodder species in
management plots
0.449 kg/m-2 Or
4,500 kg/ha
800 X 4500 kg/ha=
36,00,000 kg/year
36,00,000 X 0.25 =
9,00,000 kg/ year
9,00,000 kg/ year X 0.24 =
2,16,000 Kg/year
Fodder species in
natural grasslands
(unmanaged)
1.892 kg/m-2 or
19,000 kg/ha
811 X 19000 kg/ha =
1,54,09,000 kg/year
1,54,09,000 X 0.25=
38,52,250 kg/ year
38,52,250 kg/ year X 0.88=
33,89,980 Kg/year
Findings
Dhadda (Sachhrum narenga) revealed the highest productivity of 0.837 kg/sq m or 8370 kg/ ha in Managed plots as well as in natural grassland (1.361kg/sq m or 13610 kg/ ha), whereas the naturally growing grasses (not planted) within the managed plots Nol (Arundo donax) revealed the highest productivity of 0.405 kg/ sq m or 4050kg/ha.
The maximum estimated Biomass (19,000 kg/ha) comprised of the Fodder Species that occurred in the Natural Grasslands (untouched/unmanaged). The least Biomass (4,500 kg/ha) occurred among the Naturally occurring Fodder Species, which were not planted, in the management plots. In between was the Biomass (13,100 kg/ha) of the Planted Fodder Species in management plots.
However, when the Biomass of the total Fodder Species was calculated as per the available area to each of them, revealed that the Biomass of the Fodder Species in Natural Grasslands (unmanaged) was the highest (1,54,09,000 kg/year), while the next highest Biomass (1,04,80,000 kg/year) was seen to be in Planted Fodder Species in management plots and the
135 | N E W S
least Biomass (36,00,000 kg/year) in the Naturally occurring Fodder Species in management plots.
Interestingly, if the total Biomass of Fodder Species (both Planted and Naturally occurring) in the management plots were taken together, it is seen that the Biomass is more or less the same Biomass (1,40,80,000 kg/year) as in the Natural Grasslands.
This trend was seen to be the same when the Biomass of Consumable Fodder Species were tabulated, as only 25% was estimated to be utilized in each case, and irrespective of wherever they occurred.
Finally when the percentage of the Fodder Species as recorded in the quantitative and qualitative sampling results in each case were tabulated with the Biomass of the Consumable Fodder Species to obtain the Biomass of the Available Fodder Species it was seen that the highest Biomass of 33,89,980 kg/year occurred in Fodder Species in Natural Grasslands (untouched/unmanaged), followed by the Biomass (8,64,600 kg/year) of Planted Fodder Species in management plots and least by the Biomass (2,16,000 kg/year) of Naturally occurring Fodder Species in management plots.
In fact, if both the Available Biomass of the Planted Fodder Species and the Naturally occurring Fodder Species in management plots were added together, the total Biomass (10,80,600 kg/year) Available as Fodder Species in management plots is approximately only 1/3rd of the Available Biomass (33,89,980 kg/year) of Fodder Species in Natural Grasslands (untouched/unmanaged).
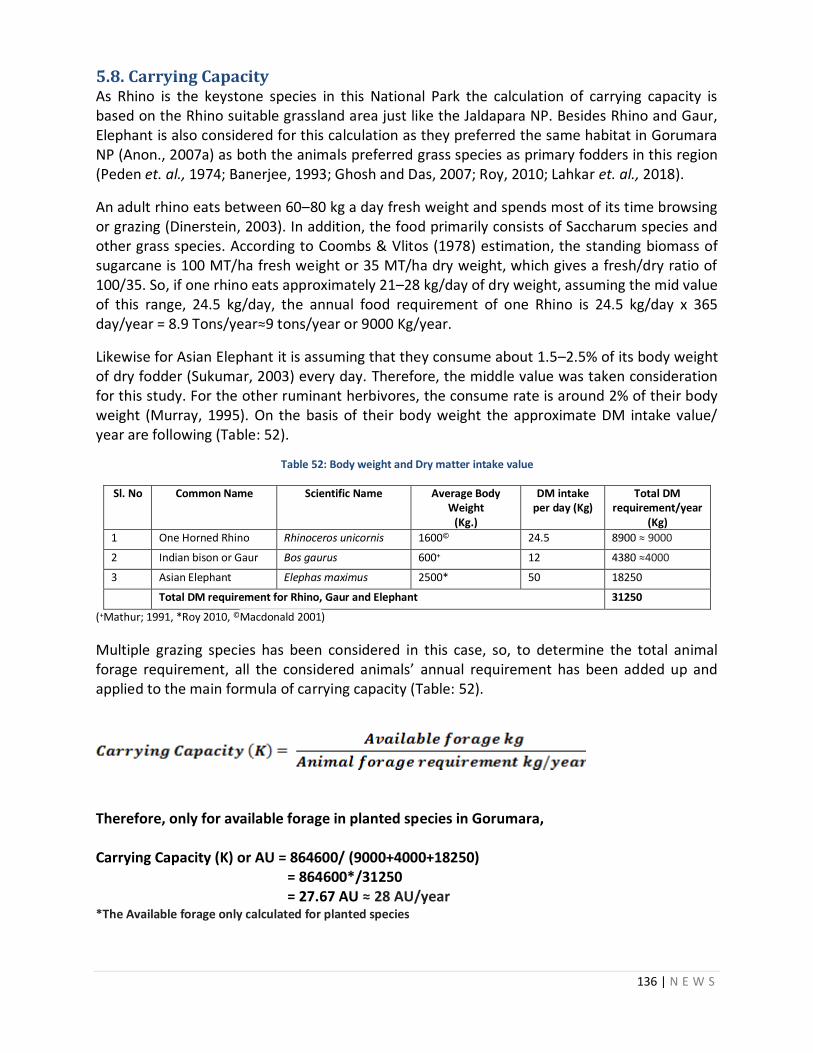
136 | N E W S
5.8. Carrying Capacity As Rhino is the keystone species in this National Park the calculation of carrying capacity is based on the Rhino suitable grassland area just like the Jaldapara NP. Besides Rhino and Gaur, Elephant is also considered for this calculation as they preferred the same habitat in Gorumara NP (Anon., 2007a) as both the animals preferred grass species as primary fodders in this region (Peden et. al., 1974; Banerjee, 1993; Ghosh and Das, 2007; Roy, 2010; Lahkar et. al., 2018).
An adult rhino eats between 60–80 kg a day fresh weight and spends most of its time browsing or grazing (Dinerstein, 2003). In addition, the food primarily consists of Saccharum species and other grass species. According to Coombs & Vlitos (1978) estimation, the standing biomass of sugarcane is 100 MT/ha fresh weight or 35 MT/ha dry weight, which gives a fresh/dry ratio of 100/35. So, if one rhino eats approximately 21–28 kg/day of dry weight, assuming the mid value of this range, 24.5 kg/day, the annual food requirement of one Rhino is 24.5 kg/day x 365 day/year = 8.9 Tons/year≈9 tons/year or 9000 Kg/year.
Likewise for Asian Elephant it is assuming that they consume about 1.5–2.5% of its body weight of dry fodder (Sukumar, 2003) every day. Therefore, the middle value was taken consideration for this study. For the other ruminant herbivores, the consume rate is around 2% of their body weight (Murray, 1995). On the basis of their body weight the approximate DM intake value/ year are following (Table: 52).
Table 52: Body weight and Dry matter intake value
Sl. No Common Name Scientific Name Average Body Weight
(Kg.)
DM intake per day (Kg)
Total DM requirement/year
(Kg)
1 One Horned Rhino Rhinoceros unicornis 1600© 24.5 8900 ≈ 9000
2 Indian bison or Gaur Bos gaurus 600+ 12 4380 ≈4000
3 Asian Elephant Elephas maximus 2500* 50 18250
Total DM requirement for Rhino, Gaur and Elephant 31250
(+Mathur; 1991, *Roy 2010, ©Macdonald 2001)
Multiple grazing species has been considered in this case, so, to determine the total animal forage requirement, all the considered animals’ annual requirement has been added up and applied to the main formula of carrying capacity (Table: 52).
Therefore, only for available forage in planted species in Gorumara, Carrying Capacity (K) or AU = 864600/ (9000+4000+18250) = 864600*/31250 = 27.67 AU ≈ 28 AU/year *The Available forage only calculated for planted species
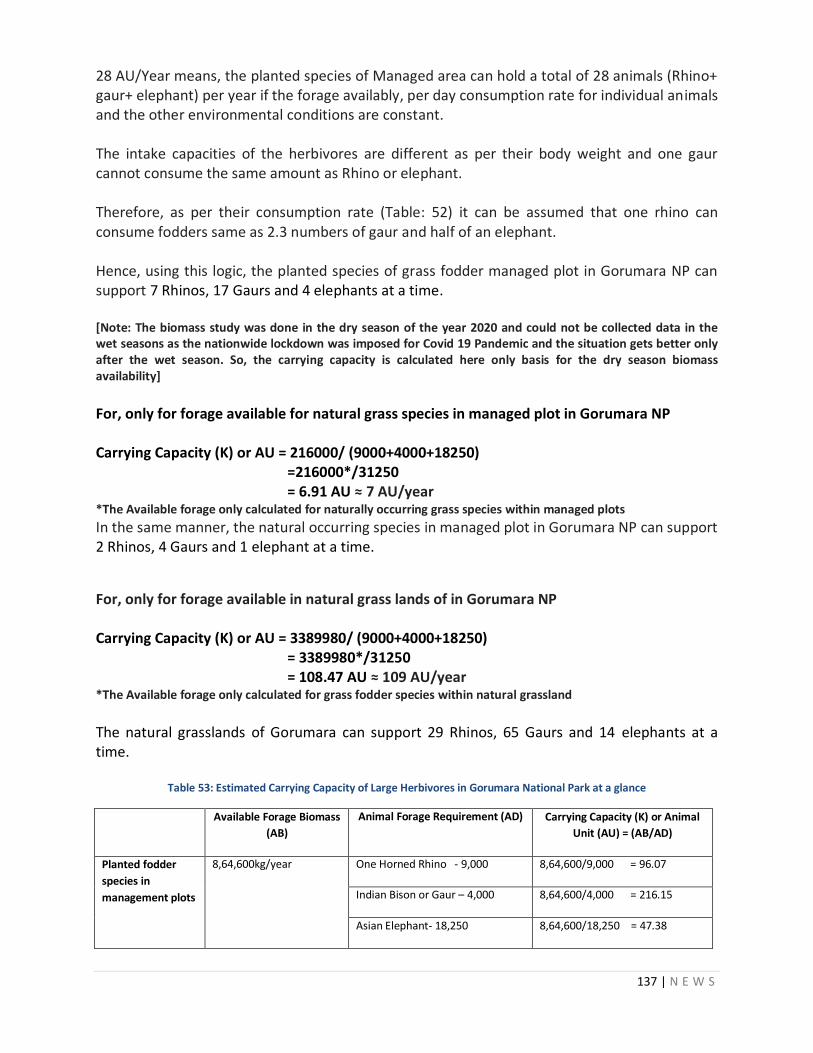
137 | N E W S
28 AU/Year means, the planted species of Managed area can hold a total of 28 animals (Rhino+ gaur+ elephant) per year if the forage availably, per day consumption rate for individual animals and the other environmental conditions are constant. The intake capacities of the herbivores are different as per their body weight and one gaur cannot consume the same amount as Rhino or elephant. Therefore, as per their consumption rate (Table: 52) it can be assumed that one rhino can consume fodders same as 2.3 numbers of gaur and half of an elephant. Hence, using this logic, the planted species of grass fodder managed plot in Gorumara NP can support 7 Rhinos, 17 Gaurs and 4 elephants at a time. [Note: The biomass study was done in the dry season of the year 2020 and could not be collected data in the wet seasons as the nationwide lockdown was imposed for Covid 19 Pandemic and the situation gets better only after the wet season. So, the carrying capacity is calculated here only basis for the dry season biomass availability]
For, only for forage available for natural grass species in managed plot in Gorumara NP Carrying Capacity (K) or AU = 216000/ (9000+4000+18250) =216000*/31250 = 6.91 AU ≈ 7 AU/year *The Available forage only calculated for naturally occurring grass species within managed plots
In the same manner, the natural occurring species in managed plot in Gorumara NP can support 2 Rhinos, 4 Gaurs and 1 elephant at a time.
For, only for forage available in natural grass lands of in Gorumara NP Carrying Capacity (K) or AU = 3389980/ (9000+4000+18250) = 3389980*/31250 = 108.47 AU ≈ 109 AU/year *The Available forage only calculated for grass fodder species within natural grassland
The natural grasslands of Gorumara can support 29 Rhinos, 65 Gaurs and 14 elephants at a time.
Table 53: Estimated Carrying Capacity of Large Herbivores in Gorumara National Park at a glance
Available Forage Biomass
(AB)
Animal Forage Requirement (AD) Carrying Capacity (K) or Animal
Unit (AU) = (AB/AD)
Planted fodder
species in
management plots
8,64,600kg/year One Horned Rhino - 9,000 8,64,600/9,000 = 96.07
Indian Bison or Gaur – 4,000 8,64,600/4,000 = 216.15
Asian Elephant- 18,250 8,64,600/18,250 = 47.38
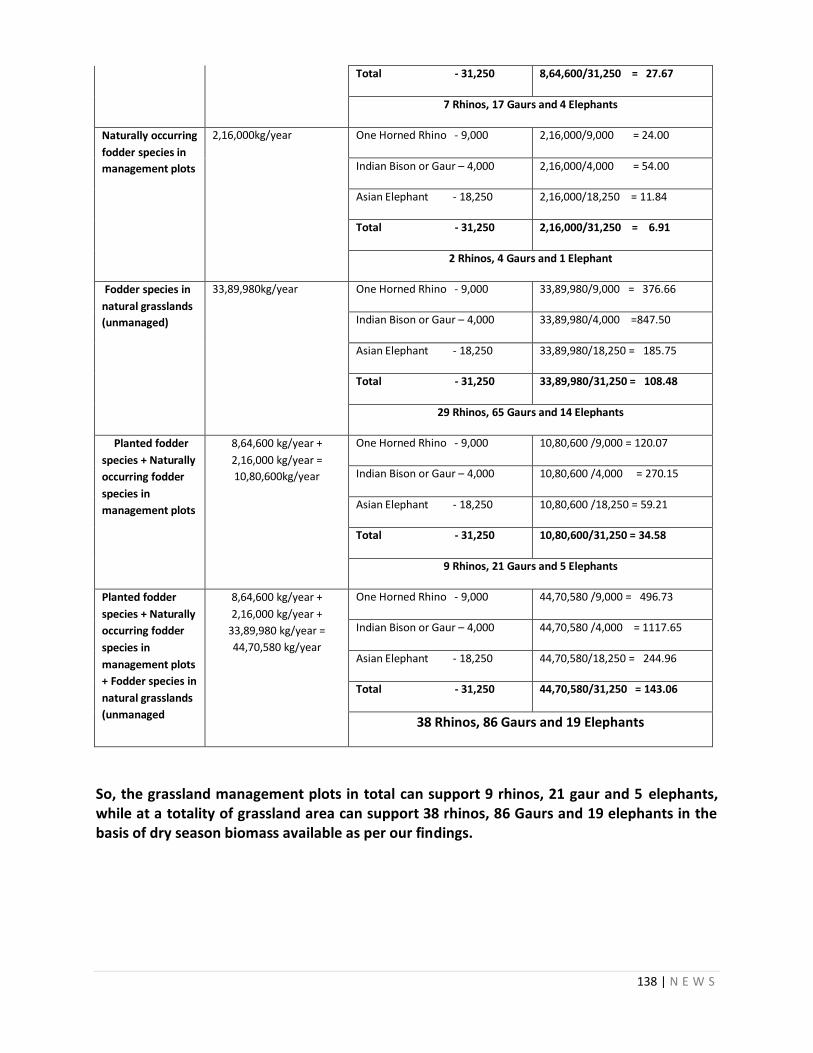
138 | N E W S
Total - 31,250 8,64,600/31,250 = 27.67
7 Rhinos, 17 Gaurs and 4 Elephants
Naturally occurring
fodder species in
management plots
2,16,000kg/year One Horned Rhino - 9,000 2,16,000/9,000 = 24.00
Indian Bison or Gaur – 4,000 2,16,000/4,000 = 54.00
Asian Elephant - 18,250 2,16,000/18,250 = 11.84
Total - 31,250 2,16,000/31,250 = 6.91
2 Rhinos, 4 Gaurs and 1 Elephant
Fodder species in
natural grasslands
(unmanaged)
33,89,980kg/year One Horned Rhino - 9,000 33,89,980/9,000 = 376.66
Indian Bison or Gaur – 4,000 33,89,980/4,000 =847.50
Asian Elephant - 18,250 33,89,980/18,250 = 185.75
Total - 31,250 33,89,980/31,250 = 108.48
29 Rhinos, 65 Gaurs and 14 Elephants
Planted fodder
species + Naturally
occurring fodder
species in
management plots
8,64,600 kg/year +
2,16,000 kg/year =
10,80,600kg/year
One Horned Rhino - 9,000 10,80,600 /9,000 = 120.07
Indian Bison or Gaur – 4,000 10,80,600 /4,000 = 270.15
Asian Elephant - 18,250 10,80,600 /18,250 = 59.21
Total - 31,250 10,80,600/31,250 = 34.58
9 Rhinos, 21 Gaurs and 5 Elephants
Planted fodder
species + Naturally
occurring fodder
species in
management plots
+ Fodder species in
natural grasslands
(unmanaged
8,64,600 kg/year +
2,16,000 kg/year +
33,89,980 kg/year =
44,70,580 kg/year
One Horned Rhino - 9,000 44,70,580 /9,000 = 496.73
Indian Bison or Gaur – 4,000 44,70,580 /4,000 = 1117.65
Asian Elephant - 18,250 44,70,580/18,250 = 244.96
Total - 31,250 44,70,580/31,250 = 143.06
38 Rhinos, 86 Gaurs and 19 Elephants
So, the grassland management plots in total can support 9 rhinos, 21 gaur and 5 elephants, while at a totality of grassland area can support 38 rhinos, 86 Gaurs and 19 elephants in the basis of dry season biomass available as per our findings.
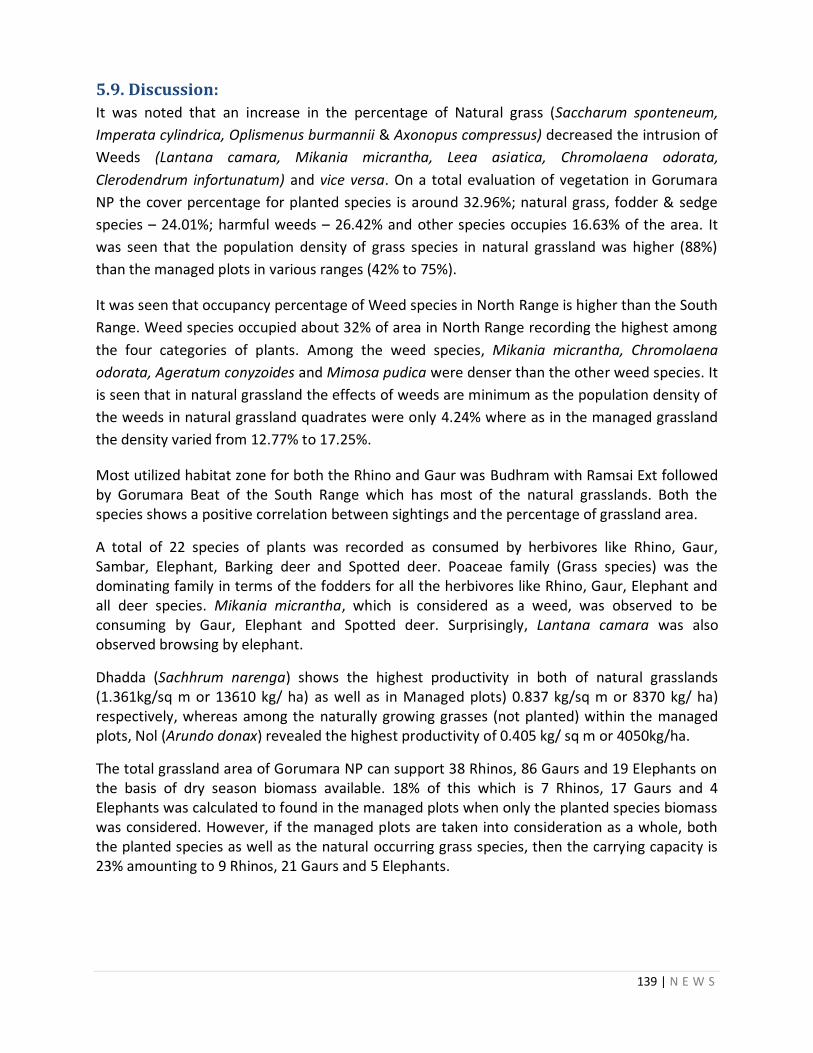
139 | N E W S
5.9. Discussion:
It was noted that an increase in the percentage of Natural grass (Saccharum sponteneum,
Imperata cylindrica, Oplismenus burmannii & Axonopus compressus) decreased the intrusion of
Weeds (Lantana camara, Mikania micrantha, Leea asiatica, Chromolaena odorata,
Clerodendrum infortunatum) and vice versa. On a total evaluation of vegetation in Gorumara
NP the cover percentage for planted species is around 32.96%; natural grass, fodder & sedge
species – 24.01%; harmful weeds – 26.42% and other species occupies 16.63% of the area. It
was seen that the population density of grass species in natural grassland was higher (88%)
than the managed plots in various ranges (42% to 75%).
It was seen that occupancy percentage of Weed species in North Range is higher than the South
Range. Weed species occupied about 32% of area in North Range recording the highest among
the four categories of plants. Among the weed species, Mikania micrantha, Chromolaena
odorata, Ageratum conyzoides and Mimosa pudica were denser than the other weed species. It
is seen that in natural grassland the effects of weeds are minimum as the population density of
the weeds in natural grassland quadrates were only 4.24% where as in the managed grassland
the density varied from 12.77% to 17.25%.
Most utilized habitat zone for both the Rhino and Gaur was Budhram with Ramsai Ext followed by Gorumara Beat of the South Range which has most of the natural grasslands. Both the species shows a positive correlation between sightings and the percentage of grassland area.
A total of 22 species of plants was recorded as consumed by herbivores like Rhino, Gaur, Sambar, Elephant, Barking deer and Spotted deer. Poaceae family (Grass species) was the dominating family in terms of the fodders for all the herbivores like Rhino, Gaur, Elephant and all deer species. Mikania micrantha, which is considered as a weed, was observed to be consuming by Gaur, Elephant and Spotted deer. Surprisingly, Lantana camara was also observed browsing by elephant.
Dhadda (Sachhrum narenga) shows the highest productivity in both of natural grasslands (1.361kg/sq m or 13610 kg/ ha) as well as in Managed plots) 0.837 kg/sq m or 8370 kg/ ha) respectively, whereas among the naturally growing grasses (not planted) within the managed plots, Nol (Arundo donax) revealed the highest productivity of 0.405 kg/ sq m or 4050kg/ha.
The total grassland area of Gorumara NP can support 38 Rhinos, 86 Gaurs and 19 Elephants on the basis of dry season biomass available. 18% of this which is 7 Rhinos, 17 Gaurs and 4 Elephants was calculated to found in the managed plots when only the planted species biomass was considered. However, if the managed plots are taken into consideration as a whole, both the planted species as well as the natural occurring grass species, then the carrying capacity is 23% amounting to 9 Rhinos, 21 Gaurs and 5 Elephants.
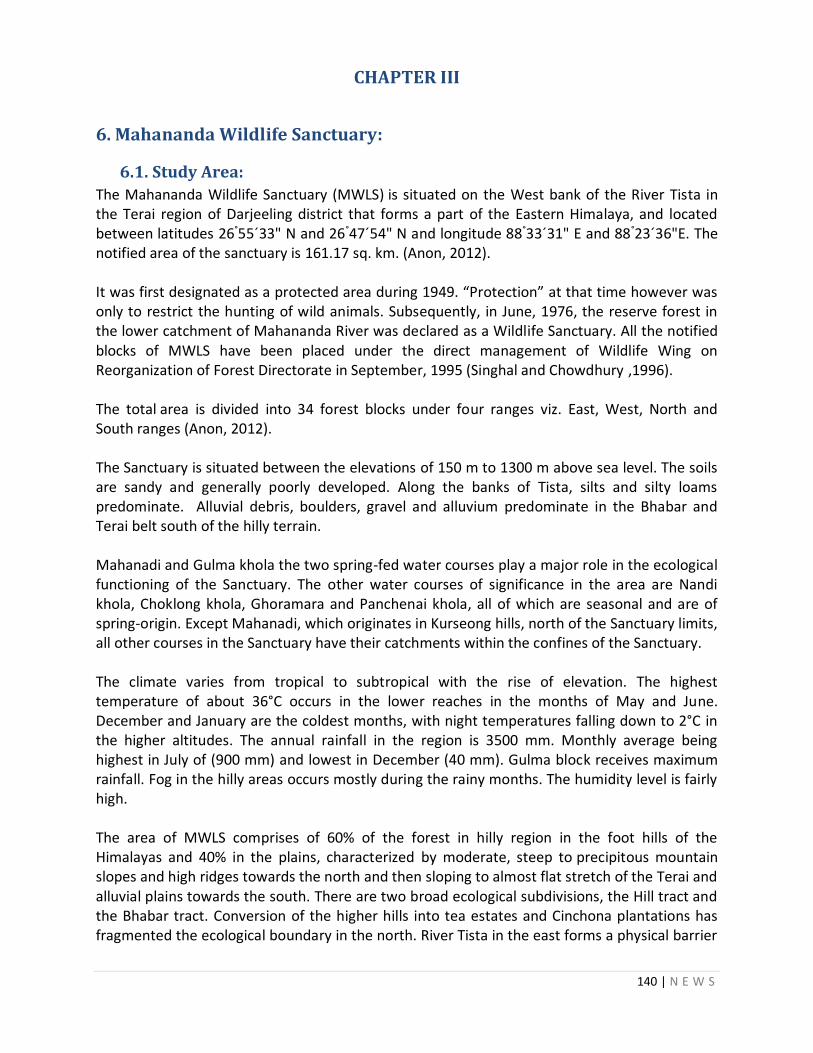
140 | N E W S
CHAPTER III
6. Mahananda Wildlife Sanctuary:
6.1. Study Area:
The Mahananda Wildlife Sanctuary (MWLS) is situated on the West bank of the River Tista in the Terai region of Darjeeling district that forms a part of the Eastern Himalaya, and located between latitudes 26°55´33" N and 26°47´54" N and longitude 88°33´31" E and 88°23´36"E. The notified area of the sanctuary is 161.17 sq. km. (Anon, 2012). It was first designated as a protected area during 1949. “Protection” at that time however was only to restrict the hunting of wild animals. Subsequently, in June, 1976, the reserve forest in the lower catchment of Mahananda River was declared as a Wildlife Sanctuary. All the notified blocks of MWLS have been placed under the direct management of Wildlife Wing on Reorganization of Forest Directorate in September, 1995 (Singhal and Chowdhury ,1996). The total area is divided into 34 forest blocks under four ranges viz. East, West, North and South ranges (Anon, 2012). The Sanctuary is situated between the elevations of 150 m to 1300 m above sea level. The soils are sandy and generally poorly developed. Along the banks of Tista, silts and silty loams predominate. Alluvial debris, boulders, gravel and alluvium predominate in the Bhabar and Terai belt south of the hilly terrain. Mahanadi and Gulma khola the two spring-fed water courses play a major role in the ecological functioning of the Sanctuary. The other water courses of significance in the area are Nandi khola, Choklong khola, Ghoramara and Panchenai khola, all of which are seasonal and are of spring-origin. Except Mahanadi, which originates in Kurseong hills, north of the Sanctuary limits, all other courses in the Sanctuary have their catchments within the confines of the Sanctuary. The climate varies from tropical to subtropical with the rise of elevation. The highest temperature of about 36°C occurs in the lower reaches in the months of May and June. December and January are the coldest months, with night temperatures falling down to 2°C in the higher altitudes. The annual rainfall in the region is 3500 mm. Monthly average being highest in July of (900 mm) and lowest in December (40 mm). Gulma block receives maximum rainfall. Fog in the hilly areas occurs mostly during the rainy months. The humidity level is fairly high. The area of MWLS comprises of 60% of the forest in hilly region in the foot hills of the Himalayas and 40% in the plains, characterized by moderate, steep to precipitous mountain slopes and high ridges towards the north and then sloping to almost flat stretch of the Terai and alluvial plains towards the south. There are two broad ecological subdivisions, the Hill tract and the Bhabar tract. Conversion of the higher hills into tea estates and Cinchona plantations has fragmented the ecological boundary in the north. River Tista in the east forms a physical barrier
141 | N E W S
against movement of terrestrial wild lives of the Bhabar tract which is gently sloping and covered with sal forests. The river and khola belts act as valuable biotope for wildlife (Singhal and Chowdhury, 1996). The forests can be classified into 10 distinct types namely 1. Khair-Sisoo Forest, 2. Eastern Bhabar Sal, 3. Eastern Terai Sal, 4. Dry mixed forest, 5. Wet mixed forest, 6. Lower Hill Sal Forest, 7. Lower Hill Dry mixed forest, 8. Lower Hill Wet mixed forest, 9. Middle Hill Forest and 10. Pure Sal forest. Monoculture of teak are common in the plains zone of Mahananda Wildlife Sanctuary and are distributed over the following blocks, namely- Jogijhora, Punding, Upper Champasari, Gulma, Lower Ghoramara, North Sevoke, East Sevoke, Singimari, Silivita West Sevoke, and Laltong block. A total 113 tree species, 78 herbs and shrubs, and 10 climbers have been recorded so far from this sanctuary (Anon, 2012). Due to the diversity of elevation and vegetation, the range of species found in the Sanctuary is rich and varied. Considering the extent of the tract, however, the number of individuals in each of the species is very limited. Mahananda Wildlife Sanctuary is an extremely important habitat of the wild elephants (Elephas maximas indicus) which is the key-stone species of the sanctuary. Earlier, the elephants did not stay in the Sanctuary permanently but used to pass through. However, during the last decade or so, elephants are staying within the Sanctuary for periods ranging up to several months. The reason may be the effect of canopy opening of teak plantation and planting up such areas with fodder & bamboo/ fruit trees. The other associated species of the sanctuary are gaur, different species of deer, wild boar and a large number of birds, reptiles, amphibians and insects. From the available records it is seen that this Wildlife Sanctuary has 71 species of mammals, 253 species of birds, 29 species of butterflies, 6 amphibian species, 11 reptile species including 2 species of turtles (Singhal and Chowdhury, 1996; Anon, 2012). The presence of large, relatively undisturbed semi-evergreen or moist deciduous forest tracts where there is abundance of forage in terms of coarse grass, bamboos, shrubs and trees found in central and eastern portions of the Sanctuary comprising of Gulma valley, Choklong, Silibhita and lower Ghoramara are the preferred habitats of the Gaur or Indian Bison (Bos gaurus gaurus), as they are primarily grazers, and their diet is largely composed of grasses (Peden et.al. 1974; Lahkar et. al. 2018). Similarly, elephants are known to exploit a large variety of species, yet the dominance of grasses in their diet was documented (Roy, 2010). As the elephants and the Gaurs are increasing day by day in this WLS, the need for the forage ground is also increasing. Moreover, Mahananda WLS does not have as much natural grassland area like Jaldapara NP and Gorumara NP. In view of this the Forest Department has developed suitable habitats for management in the blocks of Koklong, Kyananuka, Adalpur, Chamta, Sukna, Punding, Panchnai, Hatisar, Mohurgong, Jogijhora, Lower Champasari, Gulma, Singhimari, Lower Ghoramara,
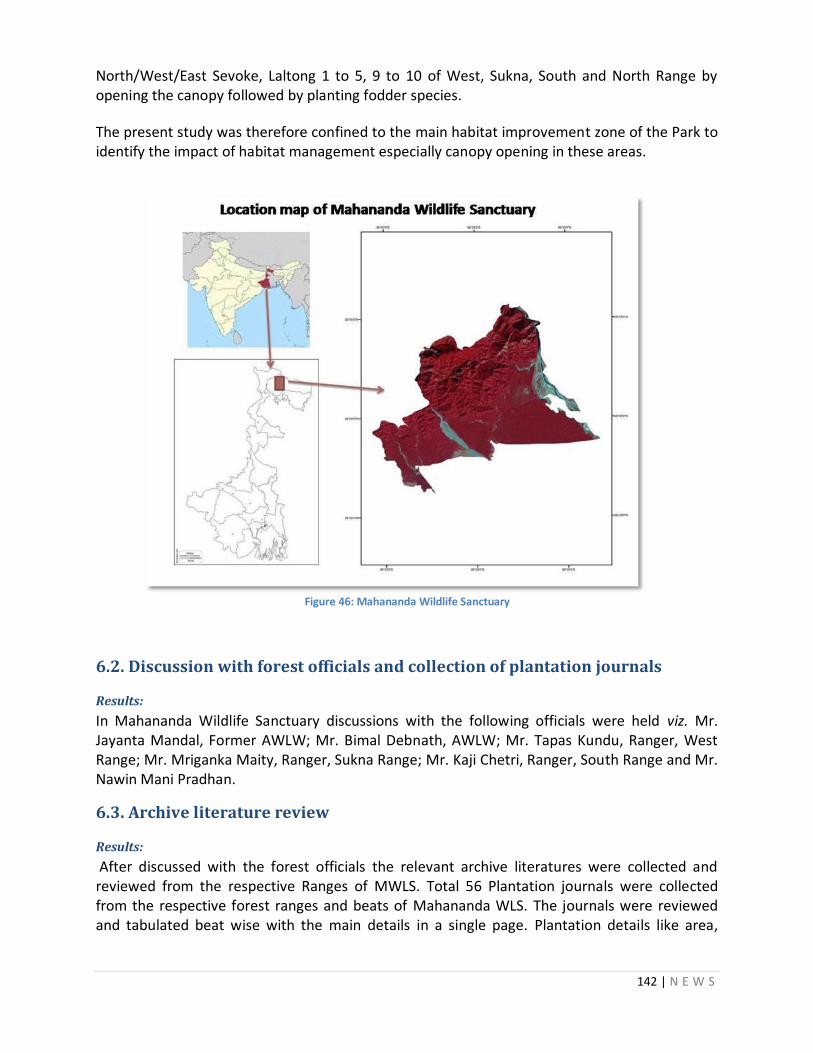
142 | N E W S
North/West/East Sevoke, Laltong 1 to 5, 9 to 10 of West, Sukna, South and North Range by opening the canopy followed by planting fodder species.
The present study was therefore confined to the main habitat improvement zone of the Park to identify the impact of habitat management especially canopy opening in these areas.
Figure 46: Mahananda Wildlife Sanctuary
6.2. Discussion with forest officials and collection of plantation journals
Results:
In Mahananda Wildlife Sanctuary discussions with the following officials were held viz. Mr. Jayanta Mandal, Former AWLW; Mr. Bimal Debnath, AWLW; Mr. Tapas Kundu, Ranger, West Range; Mr. Mriganka Maity, Ranger, Sukna Range; Mr. Kaji Chetri, Ranger, South Range and Mr. Nawin Mani Pradhan.
6.3. Archive literature review
Results:
After discussed with the forest officials the relevant archive literatures were collected and reviewed from the respective Ranges of MWLS. Total 56 Plantation journals were collected from the respective forest ranges and beats of Mahananda WLS. The journals were reviewed and tabulated beat wise with the main details in a single page. Plantation details like area,

143 | N E W S
previous plantations, planted species, gap between the planted species, flood condition, species before plantation etc were tabulated in a particular proforma.
Table 54: Plantation journals collected from MWLS
Range Beat Total journal collected
Repeated plantation /Chosen for study
Onetime plantation /Chosen for study
Canopy opening/ Chosen for study
No Information/ Chosen for study
West Range Gulma Beat 7 1/1 3/2 3/3
Punding Beat 6 4/1 2/2
Sukna Beat 3 1/0 2/2
Total 3 Beats 16 1/1 4/2 9/6 2/2
Sukna Range Chamta Beat 3 1/0 2/1
Mahanadi Beat 8 3/1 5/4
Koklong Beat 2 2/1 Total 3 Beats 13 2/1 4/1 2/1 5/4
North Range Sevoke Beat 8 4/2 4/3
Latpanchor Beat 6 5/2 1/1
Kalijhora Beat 3 3/3
Total 3 Beats 17 9/4 4/3 4/4
South Range Toribari Beat 5 2/1 1/0 2/2
7th mile beat 5 2/1 3/2
Total 2 Beats 10 2/1 1/0 4/3 3/2 GRAND TOTAL 11 Beats 56 5/3 18/7 19/13 14/12
6.4. Inventorization of Flora
Results:
In Mahananda a total of 35 managed plots (13 canopy opening plantation, 7 one-time plantations, 3 repeated plantations and 12 without any information were chosen for this study falling in 11 beats viz. Gulma, Punding, Sukna, Chamta, Mahanadi, Koklong, Sevoke, Latpanchor, Kalijhora, Toribari and 7th mile beat. Vegetation data were collected in 38 quadrates [10 m X 10 m (100 sq. m.)] in these 35 plots in pre monsoon season only. More over to compare the studied plots 4 Teak plantation plots were randomly chosen for a similar qualitative and quantitative documentation of all vegetation in these plots in MWLS.
During these studies a total of 191 plant species were recorded, identified, documented and tabulated. Of these, 14 were the Planted species, while 13 species belonged to Natural occurring grass, fodder & sedge, 18 were Weed species and 146 were Other species. In these 191 species some of the species have both the mature and juvenile forms. So, while analysis the data the mature form and the juvenile form of the species calculated separately. Analyzed data shows that Eragrostis spp has highest IVI (31.00) followed by Drymaria cordata (IVI= 30.12) within all species found in Mahananda WLS (Table: 55).
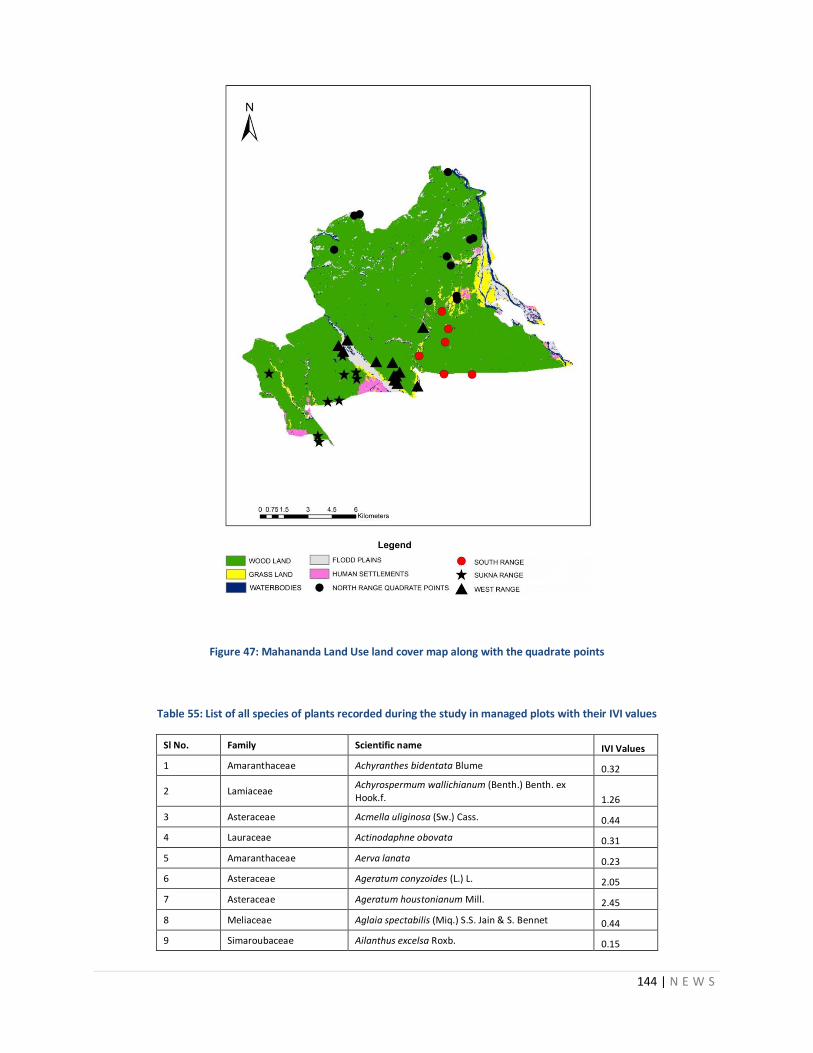
144 | N E W S
Figure 47: Mahananda Land Use land cover map along with the quadrate points
Table 55: List of all species of plants recorded during the study in managed plots with their IVI values
Sl No. Family Scientific name IVI Values
1 Amaranthaceae Achyranthes bidentata Blume 0.32
2 Lamiaceae Achyrospermum wallichianum (Benth.) Benth. ex Hook.f. 1.26
3 Asteraceae Acmella uliginosa (Sw.) Cass. 0.44
4 Lauraceae Actinodaphne obovata 0.31
5 Amaranthaceae Aerva lanata 0.23
6 Asteraceae Ageratum conyzoides (L.) L. 2.05
7 Asteraceae Ageratum houstonianum Mill. 2.45
8 Meliaceae Aglaia spectabilis (Miq.) S.S. Jain & S. Bennet 0.44
9 Simaroubaceae Ailanthus excelsa Roxb. 0.15
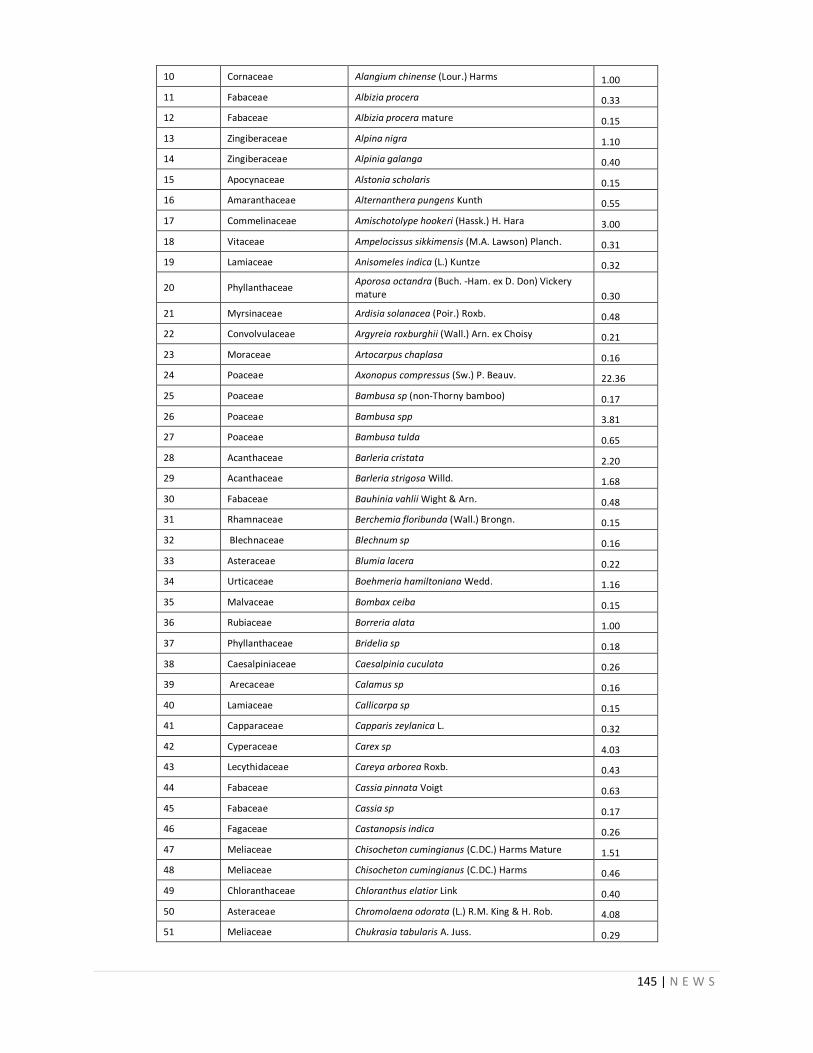
145 | N E W S
10 Cornaceae Alangium chinense (Lour.) Harms 1.00
11 Fabaceae Albizia procera 0.33
12 Fabaceae Albizia procera mature 0.15
13 Zingiberaceae Alpina nigra 1.10
14 Zingiberaceae Alpinia galanga 0.40
15 Apocynaceae Alstonia scholaris 0.15
16 Amaranthaceae Alternanthera pungens Kunth 0.55
17 Commelinaceae Amischotolype hookeri (Hassk.) H. Hara 3.00
18 Vitaceae Ampelocissus sikkimensis (M.A. Lawson) Planch. 0.31
19 Lamiaceae Anisomeles indica (L.) Kuntze 0.32
20 Phyllanthaceae Aporosa octandra (Buch. -Ham. ex D. Don) Vickery mature 0.30
21 Myrsinaceae Ardisia solanacea (Poir.) Roxb. 0.48
22 Convolvulaceae Argyreia roxburghii (Wall.) Arn. ex Choisy 0.21
23 Moraceae Artocarpus chaplasa 0.16
24 Poaceae Axonopus compressus (Sw.) P. Beauv. 22.36
25 Poaceae Bambusa sp (non-Thorny bamboo) 0.17
26 Poaceae Bambusa spp 3.81
27 Poaceae Bambusa tulda 0.65
28 Acanthaceae Barleria cristata 2.20
29 Acanthaceae Barleria strigosa Willd. 1.68
30 Fabaceae Bauhinia vahlii Wight & Arn. 0.48
31 Rhamnaceae Berchemia floribunda (Wall.) Brongn. 0.15
32 Blechnaceae Blechnum sp 0.16
33 Asteraceae Blumia lacera 0.22
34 Urticaceae Boehmeria hamiltoniana Wedd. 1.16
35 Malvaceae Bombax ceiba 0.15
36 Rubiaceae Borreria alata 1.00
37 Phyllanthaceae Bridelia sp 0.18
38 Caesalpiniaceae Caesalpinia cuculata 0.26
39 Arecaceae Calamus sp 0.16
40 Lamiaceae Callicarpa sp 0.15
41 Capparaceae Capparis zeylanica L. 0.32
42 Cyperaceae Carex sp 4.03
43 Lecythidaceae Careya arborea Roxb. 0.43
44 Fabaceae Cassia pinnata Voigt 0.63
45 Fabaceae Cassia sp 0.17
46 Fagaceae Castanopsis indica 0.26
47 Meliaceae Chisocheton cumingianus (C.DC.) Harms Mature 1.51
48 Meliaceae Chisocheton cumingianus (C.DC.) Harms 0.46
49 Chloranthaceae Chloranthus elatior Link 0.40
50 Asteraceae Chromolaena odorata (L.) R.M. King & H. Rob. 4.08
51 Meliaceae Chukrasia tabularis A. Juss. 0.29
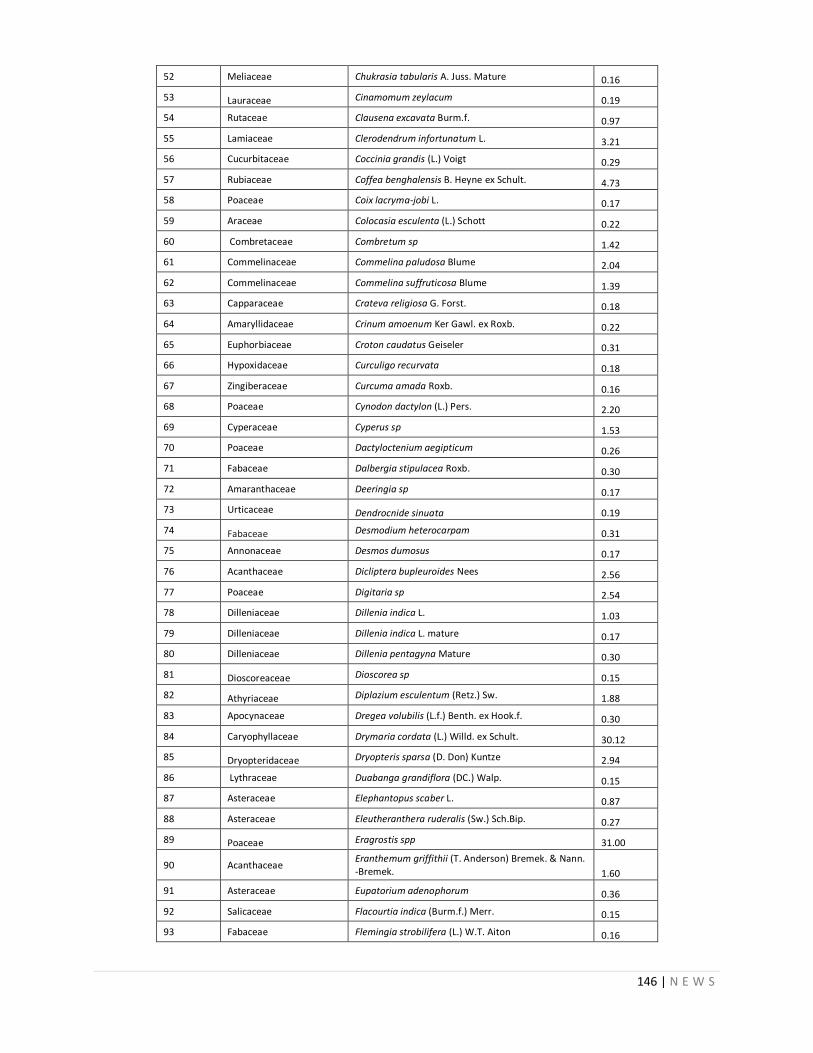
146 | N E W S
52 Meliaceae Chukrasia tabularis A. Juss. Mature 0.16
53 Lauraceae Cinamomum zeylacum 0.19
54 Rutaceae Clausena excavata Burm.f. 0.97
55 Lamiaceae Clerodendrum infortunatum L. 3.21
56 Cucurbitaceae Coccinia grandis (L.) Voigt 0.29
57 Rubiaceae Coffea benghalensis B. Heyne ex Schult. 4.73
58 Poaceae Coix lacryma-jobi L. 0.17
59 Araceae Colocasia esculenta (L.) Schott 0.22
60 Combretaceae Combretum sp 1.42
61 Commelinaceae Commelina paludosa Blume 2.04
62 Commelinaceae Commelina suffruticosa Blume 1.39
63 Capparaceae Crateva religiosa G. Forst. 0.18
64 Amaryllidaceae Crinum amoenum Ker Gawl. ex Roxb. 0.22
65 Euphorbiaceae Croton caudatus Geiseler 0.31
66 Hypoxidaceae Curculigo recurvata 0.18
67 Zingiberaceae Curcuma amada Roxb. 0.16
68 Poaceae Cynodon dactylon (L.) Pers. 2.20
69 Cyperaceae Cyperus sp 1.53
70 Poaceae Dactyloctenium aegipticum 0.26
71 Fabaceae Dalbergia stipulacea Roxb. 0.30
72 Amaranthaceae Deeringia sp 0.17
73 Urticaceae Dendrocnide sinuata 0.19
74 Fabaceae Desmodium heterocarpam 0.31
75 Annonaceae Desmos dumosus 0.17
76 Acanthaceae Dicliptera bupleuroides Nees 2.56
77 Poaceae Digitaria sp 2.54
78 Dilleniaceae Dillenia indica L. 1.03
79 Dilleniaceae Dillenia indica L. mature 0.17
80 Dilleniaceae Dillenia pentagyna Mature 0.30
81 Dioscoreaceae Dioscorea sp 0.15
82 Athyriaceae Diplazium esculentum (Retz.) Sw. 1.88
83 Apocynaceae Dregea volubilis (L.f.) Benth. ex Hook.f. 0.30
84 Caryophyllaceae Drymaria cordata (L.) Willd. ex Schult. 30.12
85 Dryopteridaceae Dryopteris sparsa (D. Don) Kuntze 2.94
86 Lythraceae Duabanga grandiflora (DC.) Walp. 0.15
87 Asteraceae Elephantopus scaber L. 0.87
88 Asteraceae Eleutheranthera ruderalis (Sw.) Sch.Bip. 0.27
89 Poaceae Eragrostis spp 31.00
90 Acanthaceae Eranthemum griffithii (T. Anderson) Bremek. & Nann. -Bremek. 1.60
91 Asteraceae Eupatorium adenophorum 0.36
92 Salicaceae Flacourtia indica (Burm.f.) Merr. 0.15
93 Fabaceae Flemingia strobilifera (L.) W.T. Aiton 0.16
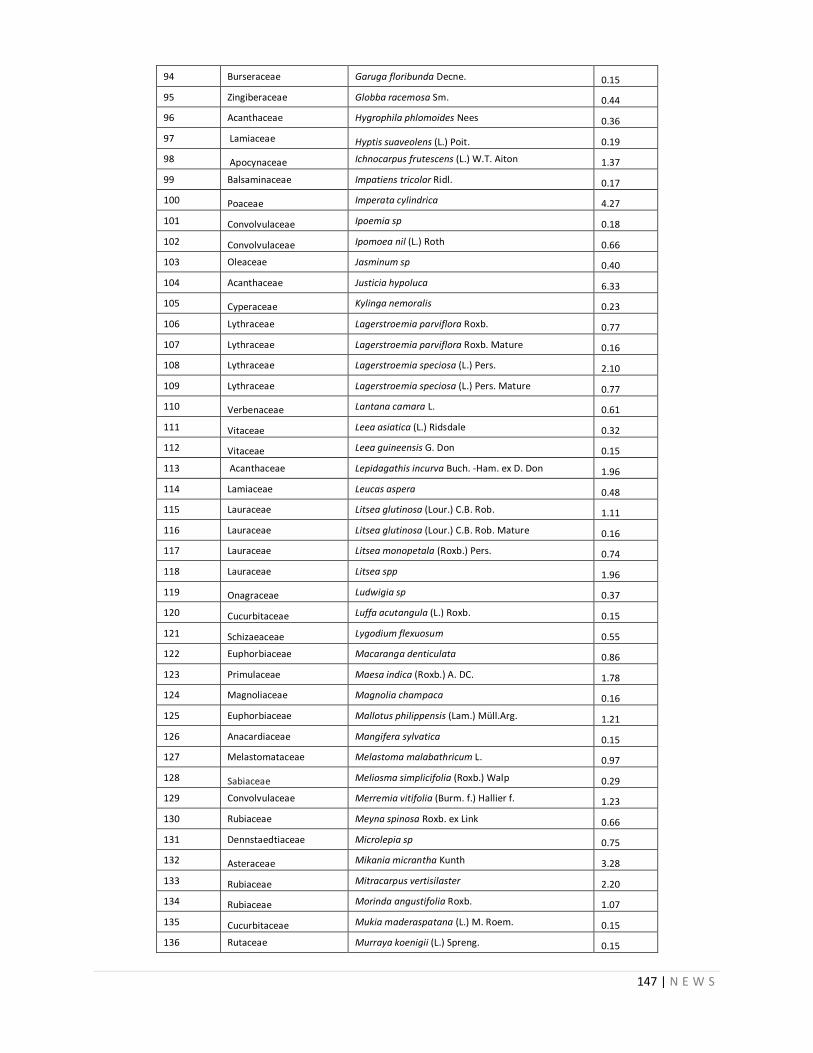
147 | N E W S
94 Burseraceae Garuga floribunda Decne. 0.15
95 Zingiberaceae Globba racemosa Sm. 0.44
96 Acanthaceae Hygrophila phlomoides Nees 0.36
97 Lamiaceae Hyptis suaveolens (L.) Poit. 0.19
98 Apocynaceae Ichnocarpus frutescens (L.) W.T. Aiton 1.37
99 Balsaminaceae Impatiens tricolor Ridl. 0.17
100 Poaceae Imperata cylindrica 4.27
101 Convolvulaceae Ipoemia sp 0.18
102 Convolvulaceae Ipomoea nil (L.) Roth 0.66
103 Oleaceae Jasminum sp 0.40
104 Acanthaceae Justicia hypoluca 6.33
105 Cyperaceae Kylinga nemoralis 0.23
106 Lythraceae Lagerstroemia parviflora Roxb. 0.77
107 Lythraceae Lagerstroemia parviflora Roxb. Mature 0.16
108 Lythraceae Lagerstroemia speciosa (L.) Pers. 2.10
109 Lythraceae Lagerstroemia speciosa (L.) Pers. Mature 0.77
110 Verbenaceae Lantana camara L. 0.61
111 Vitaceae Leea asiatica (L.) Ridsdale 0.32
112 Vitaceae Leea guineensis G. Don 0.15
113 Acanthaceae Lepidagathis incurva Buch. -Ham. ex D. Don 1.96
114 Lamiaceae Leucas aspera 0.48
115 Lauraceae Litsea glutinosa (Lour.) C.B. Rob. 1.11
116 Lauraceae Litsea glutinosa (Lour.) C.B. Rob. Mature 0.16
117 Lauraceae Litsea monopetala (Roxb.) Pers. 0.74
118 Lauraceae Litsea spp 1.96
119 Onagraceae Ludwigia sp 0.37
120 Cucurbitaceae Luffa acutangula (L.) Roxb. 0.15
121 Schizaeaceae Lygodium flexuosum 0.55
122 Euphorbiaceae Macaranga denticulata 0.86
123 Primulaceae Maesa indica (Roxb.) A. DC. 1.78
124 Magnoliaceae Magnolia champaca 0.16
125 Euphorbiaceae Mallotus philippensis (Lam.) Müll.Arg. 1.21
126 Anacardiaceae Mangifera sylvatica 0.15
127 Melastomataceae Melastoma malabathricum L. 0.97
128 Sabiaceae Meliosma simplicifolia (Roxb.) Walp 0.29
129 Convolvulaceae Merremia vitifolia (Burm. f.) Hallier f. 1.23
130 Rubiaceae Meyna spinosa Roxb. ex Link 0.66
131 Dennstaedtiaceae Microlepia sp 0.75
132 Asteraceae Mikania micrantha Kunth 3.28
133 Rubiaceae Mitracarpus vertisilaster 2.20
134 Rubiaceae Morinda angustifolia Roxb. 1.07
135 Cucurbitaceae Mukia maderaspatana (L.) M. Roem. 0.15
136 Rutaceae Murraya koenigii (L.) Spreng. 0.15
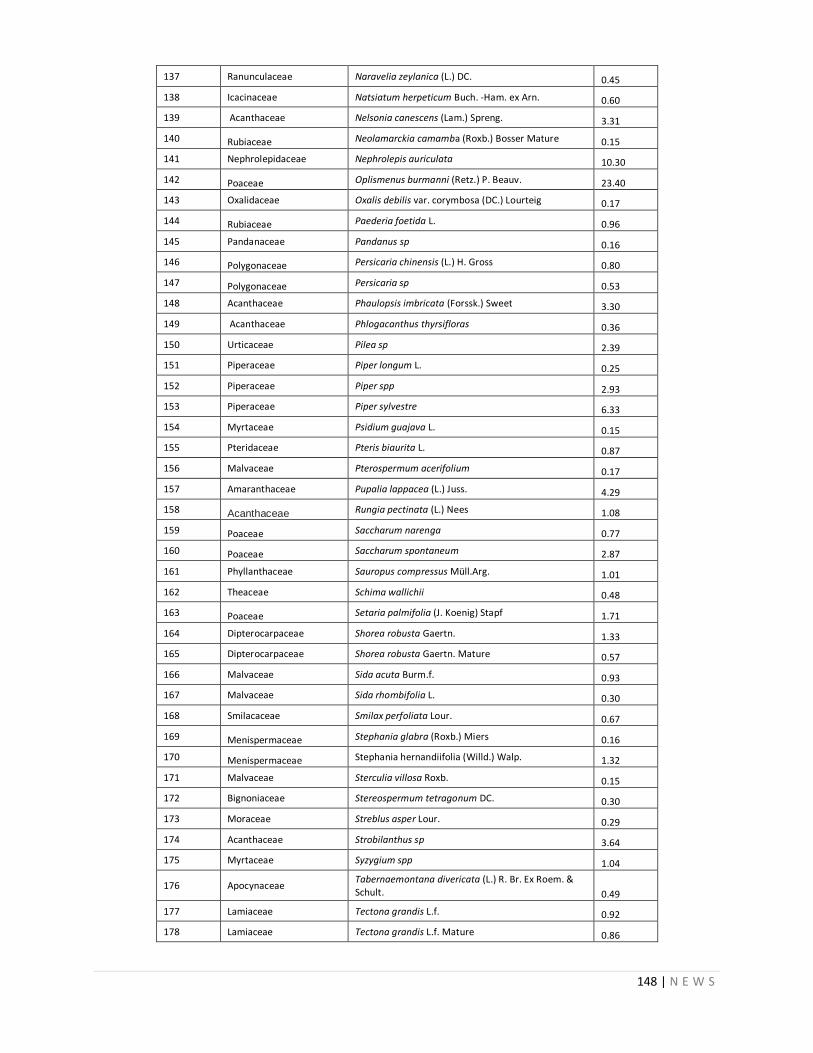
148 | N E W S
137 Ranunculaceae Naravelia zeylanica (L.) DC. 0.45
138 Icacinaceae Natsiatum herpeticum Buch. -Ham. ex Arn. 0.60
139 Acanthaceae Nelsonia canescens (Lam.) Spreng. 3.31
140 Rubiaceae Neolamarckia camamba (Roxb.) Bosser Mature 0.15
141 Nephrolepidaceae Nephrolepis auriculata 10.30
142 Poaceae Oplismenus burmanni (Retz.) P. Beauv. 23.40
143 Oxalidaceae Oxalis debilis var. corymbosa (DC.) Lourteig 0.17
144 Rubiaceae Paederia foetida L. 0.96
145 Pandanaceae Pandanus sp 0.16
146 Polygonaceae Persicaria chinensis (L.) H. Gross 0.80
147 Polygonaceae Persicaria sp 0.53
148 Acanthaceae Phaulopsis imbricata (Forssk.) Sweet 3.30
149 Acanthaceae Phlogacanthus thyrsifloras 0.36
150 Urticaceae Pilea sp 2.39
151 Piperaceae Piper longum L. 0.25
152 Piperaceae Piper spp 2.93
153 Piperaceae Piper sylvestre 6.33
154 Myrtaceae Psidium guajava L. 0.15
155 Pteridaceae Pteris biaurita L. 0.87
156 Malvaceae Pterospermum acerifolium 0.17
157 Amaranthaceae Pupalia lappacea (L.) Juss. 4.29
158 Acanthaceae Rungia pectinata (L.) Nees 1.08
159 Poaceae Saccharum narenga 0.77
160 Poaceae Saccharum spontaneum 2.87
161 Phyllanthaceae Sauropus compressus Müll.Arg. 1.01
162 Theaceae Schima wallichii 0.48
163 Poaceae Setaria palmifolia (J. Koenig) Stapf 1.71
164 Dipterocarpaceae Shorea robusta Gaertn. 1.33
165 Dipterocarpaceae Shorea robusta Gaertn. Mature 0.57
166 Malvaceae Sida acuta Burm.f. 0.93
167 Malvaceae Sida rhombifolia L. 0.30
168 Smilacaceae Smilax perfoliata Lour. 0.67
169 Menispermaceae Stephania glabra (Roxb.) Miers 0.16
170 Menispermaceae Stephania hernandiifolia (Willd.) Walp. 1.32
171 Malvaceae Sterculia villosa Roxb. 0.15
172 Bignoniaceae Stereospermum tetragonum DC. 0.30
173 Moraceae Streblus asper Lour. 0.29
174 Acanthaceae Strobilanthus sp 3.64
175 Myrtaceae Syzygium spp 1.04
176 Apocynaceae Tabernaemontana divericata (L.) R. Br. Ex Roem. & Schult. 0.49
177 Lamiaceae Tectona grandis L.f. 0.92
178 Lamiaceae Tectona grandis L.f. Mature 0.86
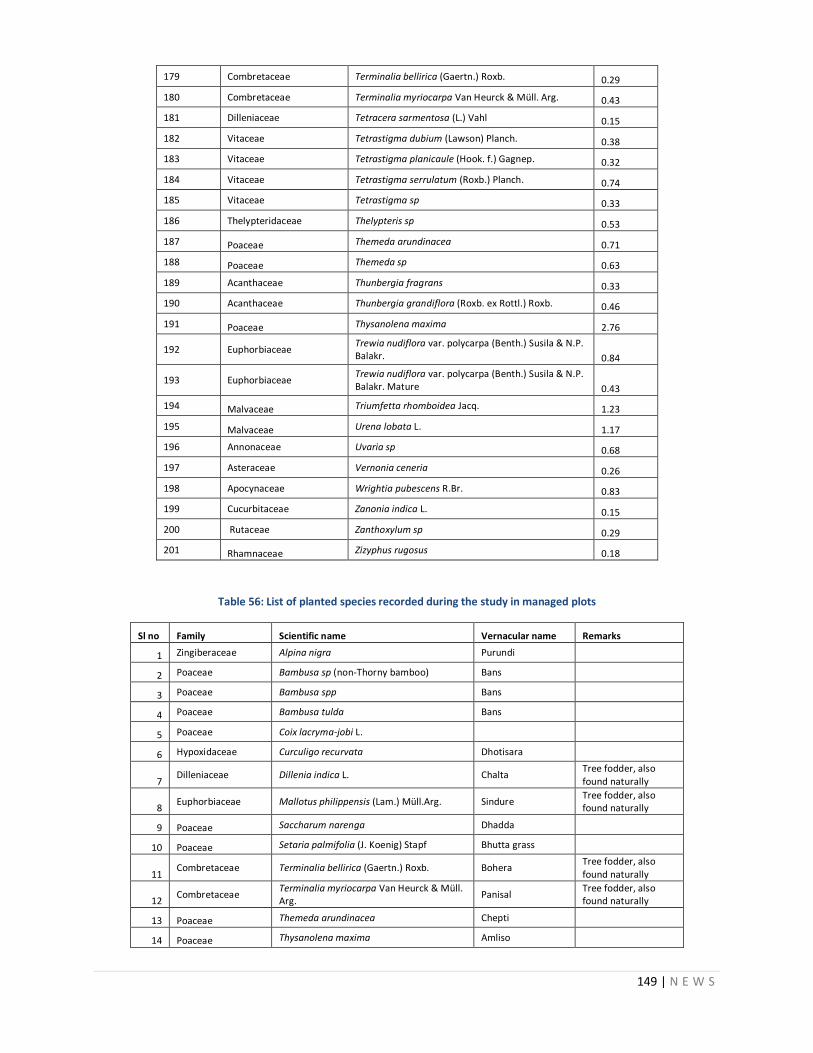
149 | N E W S
179 Combretaceae Terminalia bellirica (Gaertn.) Roxb. 0.29
180 Combretaceae Terminalia myriocarpa Van Heurck & Müll. Arg. 0.43
181 Dilleniaceae Tetracera sarmentosa (L.) Vahl 0.15
182 Vitaceae Tetrastigma dubium (Lawson) Planch. 0.38
183 Vitaceae Tetrastigma planicaule (Hook. f.) Gagnep. 0.32
184 Vitaceae Tetrastigma serrulatum (Roxb.) Planch. 0.74
185 Vitaceae Tetrastigma sp 0.33
186 Thelypteridaceae Thelypteris sp 0.53
187 Poaceae Themeda arundinacea 0.71
188 Poaceae Themeda sp 0.63
189 Acanthaceae Thunbergia fragrans 0.33
190 Acanthaceae Thunbergia grandiflora (Roxb. ex Rottl.) Roxb. 0.46
191 Poaceae Thysanolena maxima 2.76
192 Euphorbiaceae Trewia nudiflora var. polycarpa (Benth.) Susila & N.P. Balakr. 0.84
193 Euphorbiaceae Trewia nudiflora var. polycarpa (Benth.) Susila & N.P. Balakr. Mature 0.43
194 Malvaceae Triumfetta rhomboidea Jacq. 1.23
195 Malvaceae Urena lobata L. 1.17
196 Annonaceae Uvaria sp 0.68
197 Asteraceae Vernonia ceneria 0.26
198 Apocynaceae Wrightia pubescens R.Br. 0.83
199 Cucurbitaceae Zanonia indica L. 0.15
200 Rutaceae Zanthoxylum sp 0.29
201 Rhamnaceae Zizyphus rugosus 0.18
Table 56: List of planted species recorded during the study in managed plots
Sl no Family Scientific name Vernacular name Remarks
1 Zingiberaceae Alpina nigra Purundi
2 Poaceae Bambusa sp (non-Thorny bamboo) Bans
3 Poaceae Bambusa spp Bans
4 Poaceae Bambusa tulda Bans
5 Poaceae Coix lacryma-jobi L.
6 Hypoxidaceae Curculigo recurvata Dhotisara
7 Dilleniaceae Dillenia indica L. Chalta
Tree fodder, also found naturally
8 Euphorbiaceae Mallotus philippensis (Lam.) Müll.Arg. Sindure
Tree fodder, also found naturally
9 Poaceae Saccharum narenga Dhadda
10 Poaceae Setaria palmifolia (J. Koenig) Stapf Bhutta grass
11 Combretaceae Terminalia bellirica (Gaertn.) Roxb. Bohera
Tree fodder, also found naturally
12 Combretaceae
Terminalia myriocarpa Van Heurck & Müll. Arg.
Panisal Tree fodder, also found naturally
13 Poaceae Themeda arundinacea Chepti
14 Poaceae Thysanolena maxima Amliso
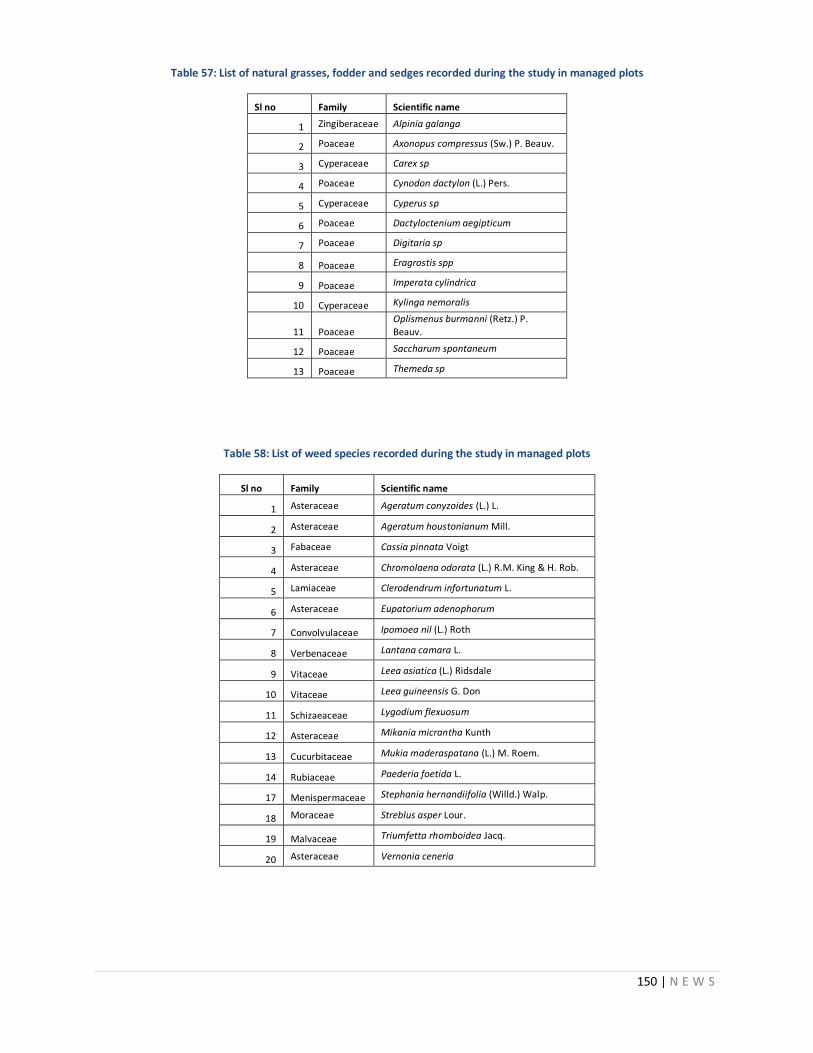
150 | N E W S
Table 57: List of natural grasses, fodder and sedges recorded during the study in managed plots
Sl no Family Scientific name
1 Zingiberaceae Alpinia galanga
2 Poaceae Axonopus compressus (Sw.) P. Beauv.
3 Cyperaceae Carex sp
4 Poaceae Cynodon dactylon (L.) Pers.
5 Cyperaceae Cyperus sp
6 Poaceae Dactyloctenium aegipticum
7 Poaceae Digitaria sp
8 Poaceae Eragrostis spp
9 Poaceae Imperata cylindrica
10 Cyperaceae Kylinga nemoralis
11 Poaceae Oplismenus burmanni (Retz.) P. Beauv.
12 Poaceae Saccharum spontaneum
13 Poaceae Themeda sp
Table 58: List of weed species recorded during the study in managed plots
Sl no Family Scientific name
1 Asteraceae Ageratum conyzoides (L.) L.
2 Asteraceae Ageratum houstonianum Mill.
3 Fabaceae Cassia pinnata Voigt
4 Asteraceae Chromolaena odorata (L.) R.M. King & H. Rob.
5 Lamiaceae Clerodendrum infortunatum L.
6 Asteraceae Eupatorium adenophorum
7 Convolvulaceae Ipomoea nil (L.) Roth
8 Verbenaceae Lantana camara L.
9 Vitaceae Leea asiatica (L.) Ridsdale
10 Vitaceae Leea guineensis G. Don
11 Schizaeaceae Lygodium flexuosum
12 Asteraceae Mikania micrantha Kunth
13 Cucurbitaceae Mukia maderaspatana (L.) M. Roem.
14 Rubiaceae Paederia foetida L.
17 Menispermaceae Stephania hernandiifolia (Willd.) Walp.
18 Moraceae Streblus asper Lour.
19 Malvaceae Triumfetta rhomboidea Jacq.
20 Asteraceae Vernonia ceneria

151 | N E W S
Table 59: List of other species recorded in managed plots
Sl no. Family Species name
1 Amaranthaceae Achyranthes bidentata Blume
2 Lamiaceae
Achyrospermum wallichianum (Benth.) Benth. ex Hook.f.
3 Asteraceae Acmella uliginosa (Sw.) Cass.
4 Lauraceae Actinodaphne obovata
5 Amaranthaceae Aerva lanata
6 Meliaceae Aglaia spectabilis (Miq.) S.S. Jain & S. Bennet
7 Simaroubaceae Ailanthus excelsa Roxb.
8 Cornaceae Alangium chinense (Lour.) Harms
9 Fabaceae Albizia procera
10 Fabaceae Albizia procera mature
11 Apocynaceae Alstonia scholaris
12 Amaranthaceae Alternanthera pungens Kunth
13 Commelinaceae Amischotolype hookeri (Hassk.) H. Hara
14 Vitaceae Ampelocissus sikkimensis (M.A. Lawson) Planch.
15 Lamiaceae Anisomeles indica (L.) Kuntze
16 Phyllanthaceae
Aporosa octandra (Buch. -Ham. ex D. Don) Vickery mature
17 Myrsinaceae Ardisia solanacea (Poir.) Roxb.
18 Convolvulaceae Argyreia roxburghii (Wall.) Arn. ex Choisy
19 Moraceae Artocarpus chaplasa
20 Acanthaceae Barleria cristata
21 Acanthaceae Barleria strigosa Willd.
22 Fabaceae Bauhinia vahlii Wight & Arn.
23 Rhamnaceae Berchemia floribunda (Wall.) Brongn.
24 Blechnaceae Blechnum sp
25 Asteraceae Blumia lacera
26 Urticaceae Boehmeria hamiltoniana Wedd.
27 Malvaceae Bombax ceiba
28 Rubiaceae Borreria alata
29 Phyllanthaceae Bridelia sp
30 Caesalpiniaceae Caesalpinia cuculata
31 Arecaceae Calamus sp
32 Lamiaceae Callicarpa sp
33 Capparaceae Capparis zeylanica L.
34 Lecythidaceae Careya arborea Roxb.
35 Fabaceae Cassia sp
36 Fagaceae Castanopsis indica
37 Meliaceae Chisocheton cumingianus (C.DC.) Harms
38 Meliaceae Chisocheton cumingianus (C.DC.) Harms Mature
39 Chloranthaceae Chloranthus elatior Link
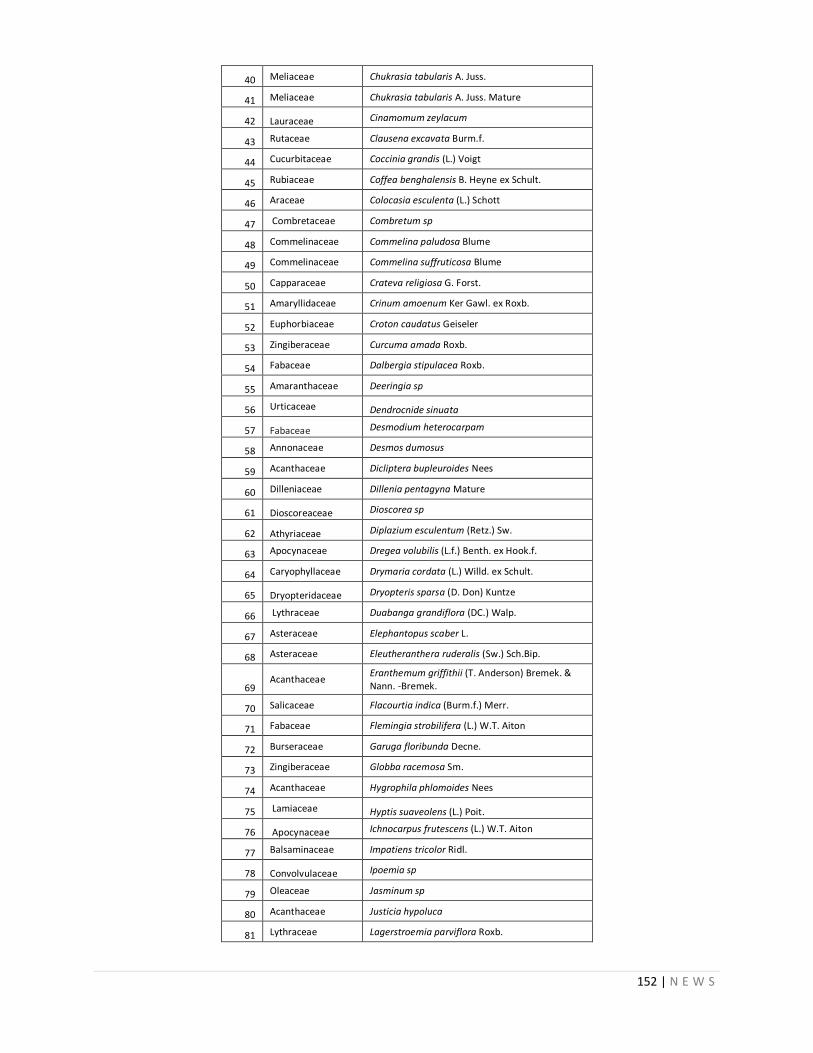
152 | N E W S
40 Meliaceae Chukrasia tabularis A. Juss.
41 Meliaceae Chukrasia tabularis A. Juss. Mature
42 Lauraceae Cinamomum zeylacum
43 Rutaceae Clausena excavata Burm.f.
44 Cucurbitaceae Coccinia grandis (L.) Voigt
45 Rubiaceae Coffea benghalensis B. Heyne ex Schult.
46 Araceae Colocasia esculenta (L.) Schott
47 Combretaceae Combretum sp
48 Commelinaceae Commelina paludosa Blume
49 Commelinaceae Commelina suffruticosa Blume
50 Capparaceae Crateva religiosa G. Forst.
51 Amaryllidaceae Crinum amoenum Ker Gawl. ex Roxb.
52 Euphorbiaceae Croton caudatus Geiseler
53 Zingiberaceae Curcuma amada Roxb.
54 Fabaceae Dalbergia stipulacea Roxb.
55 Amaranthaceae Deeringia sp
56 Urticaceae Dendrocnide sinuata
57 Fabaceae Desmodium heterocarpam
58 Annonaceae Desmos dumosus
59 Acanthaceae Dicliptera bupleuroides Nees
60 Dilleniaceae Dillenia pentagyna Mature
61 Dioscoreaceae Dioscorea sp
62 Athyriaceae Diplazium esculentum (Retz.) Sw.
63 Apocynaceae Dregea volubilis (L.f.) Benth. ex Hook.f.
64 Caryophyllaceae Drymaria cordata (L.) Willd. ex Schult.
65 Dryopteridaceae Dryopteris sparsa (D. Don) Kuntze
66 Lythraceae Duabanga grandiflora (DC.) Walp.
67 Asteraceae Elephantopus scaber L.
68 Asteraceae Eleutheranthera ruderalis (Sw.) Sch.Bip.
69 Acanthaceae
Eranthemum griffithii (T. Anderson) Bremek. & Nann. -Bremek.
70 Salicaceae Flacourtia indica (Burm.f.) Merr.
71 Fabaceae Flemingia strobilifera (L.) W.T. Aiton
72 Burseraceae Garuga floribunda Decne.
73 Zingiberaceae Globba racemosa Sm.
74 Acanthaceae Hygrophila phlomoides Nees
75 Lamiaceae Hyptis suaveolens (L.) Poit.
76 Apocynaceae Ichnocarpus frutescens (L.) W.T. Aiton
77 Balsaminaceae Impatiens tricolor Ridl.
78 Convolvulaceae Ipoemia sp
79 Oleaceae Jasminum sp
80 Acanthaceae Justicia hypoluca
81 Lythraceae Lagerstroemia parviflora Roxb.
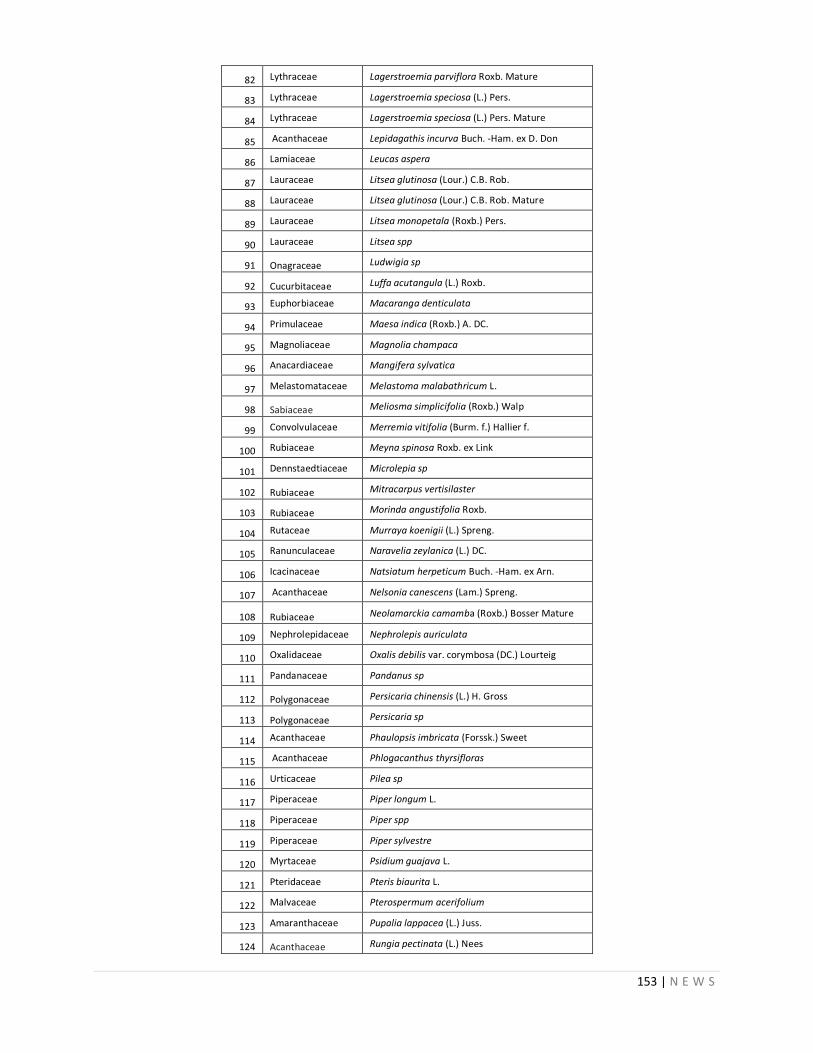
153 | N E W S
82 Lythraceae Lagerstroemia parviflora Roxb. Mature
83 Lythraceae Lagerstroemia speciosa (L.) Pers.
84 Lythraceae Lagerstroemia speciosa (L.) Pers. Mature
85 Acanthaceae Lepidagathis incurva Buch. -Ham. ex D. Don
86 Lamiaceae Leucas aspera
87 Lauraceae Litsea glutinosa (Lour.) C.B. Rob.
88 Lauraceae Litsea glutinosa (Lour.) C.B. Rob. Mature
89 Lauraceae Litsea monopetala (Roxb.) Pers.
90 Lauraceae Litsea spp
91 Onagraceae Ludwigia sp
92 Cucurbitaceae Luffa acutangula (L.) Roxb.
93 Euphorbiaceae Macaranga denticulata
94 Primulaceae Maesa indica (Roxb.) A. DC.
95 Magnoliaceae Magnolia champaca
96 Anacardiaceae Mangifera sylvatica
97 Melastomataceae Melastoma malabathricum L.
98 Sabiaceae Meliosma simplicifolia (Roxb.) Walp
99 Convolvulaceae Merremia vitifolia (Burm. f.) Hallier f.
100 Rubiaceae Meyna spinosa Roxb. ex Link
101 Dennstaedtiaceae Microlepia sp
102 Rubiaceae Mitracarpus vertisilaster
103 Rubiaceae Morinda angustifolia Roxb.
104 Rutaceae Murraya koenigii (L.) Spreng.
105 Ranunculaceae Naravelia zeylanica (L.) DC.
106 Icacinaceae Natsiatum herpeticum Buch. -Ham. ex Arn.
107 Acanthaceae Nelsonia canescens (Lam.) Spreng.
108 Rubiaceae Neolamarckia camamba (Roxb.) Bosser Mature
109 Nephrolepidaceae Nephrolepis auriculata
110 Oxalidaceae Oxalis debilis var. corymbosa (DC.) Lourteig
111 Pandanaceae Pandanus sp
112 Polygonaceae Persicaria chinensis (L.) H. Gross
113 Polygonaceae Persicaria sp
114 Acanthaceae Phaulopsis imbricata (Forssk.) Sweet
115 Acanthaceae Phlogacanthus thyrsifloras
116 Urticaceae Pilea sp
117 Piperaceae Piper longum L.
118 Piperaceae Piper spp
119 Piperaceae Piper sylvestre
120 Myrtaceae Psidium guajava L.
121 Pteridaceae Pteris biaurita L.
122 Malvaceae Pterospermum acerifolium
123 Amaranthaceae Pupalia lappacea (L.) Juss.
124 Acanthaceae Rungia pectinata (L.) Nees
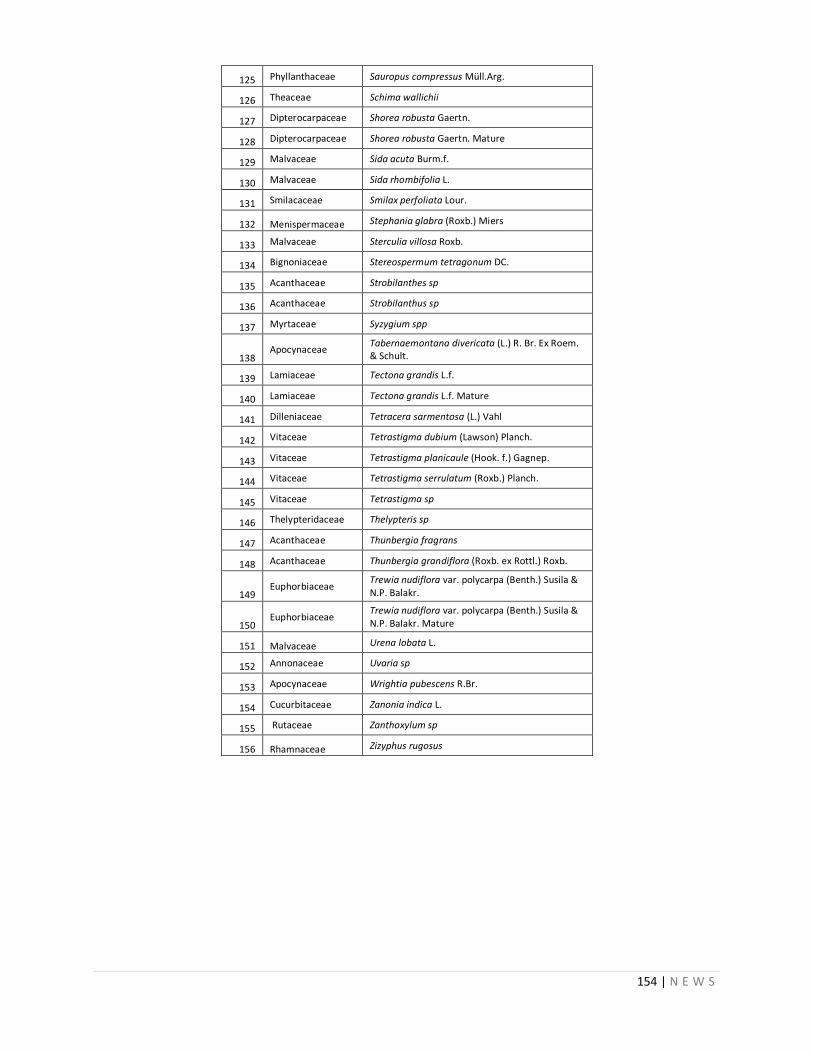
154 | N E W S
125 Phyllanthaceae Sauropus compressus Müll.Arg.
126 Theaceae Schima wallichii
127 Dipterocarpaceae Shorea robusta Gaertn.
128 Dipterocarpaceae Shorea robusta Gaertn. Mature
129 Malvaceae Sida acuta Burm.f.
130 Malvaceae Sida rhombifolia L.
131 Smilacaceae Smilax perfoliata Lour.
132 Menispermaceae Stephania glabra (Roxb.) Miers
133 Malvaceae Sterculia villosa Roxb.
134 Bignoniaceae Stereospermum tetragonum DC.
135 Acanthaceae Strobilanthes sp
136 Acanthaceae Strobilanthus sp
137 Myrtaceae Syzygium spp
138 Apocynaceae
Tabernaemontana divericata (L.) R. Br. Ex Roem. & Schult.
139 Lamiaceae Tectona grandis L.f.
140 Lamiaceae Tectona grandis L.f. Mature
141 Dilleniaceae Tetracera sarmentosa (L.) Vahl
142 Vitaceae Tetrastigma dubium (Lawson) Planch.
143 Vitaceae Tetrastigma planicaule (Hook. f.) Gagnep.
144 Vitaceae Tetrastigma serrulatum (Roxb.) Planch.
145 Vitaceae Tetrastigma sp
146 Thelypteridaceae Thelypteris sp
147 Acanthaceae Thunbergia fragrans
148 Acanthaceae Thunbergia grandiflora (Roxb. ex Rottl.) Roxb.
149 Euphorbiaceae
Trewia nudiflora var. polycarpa (Benth.) Susila & N.P. Balakr.
150 Euphorbiaceae
Trewia nudiflora var. polycarpa (Benth.) Susila & N.P. Balakr. Mature
151 Malvaceae Urena lobata L.
152 Annonaceae Uvaria sp
153 Apocynaceae Wrightia pubescens R.Br.
154 Cucurbitaceae Zanonia indica L.
155 Rutaceae Zanthoxylum sp
156 Rhamnaceae Zizyphus rugosus
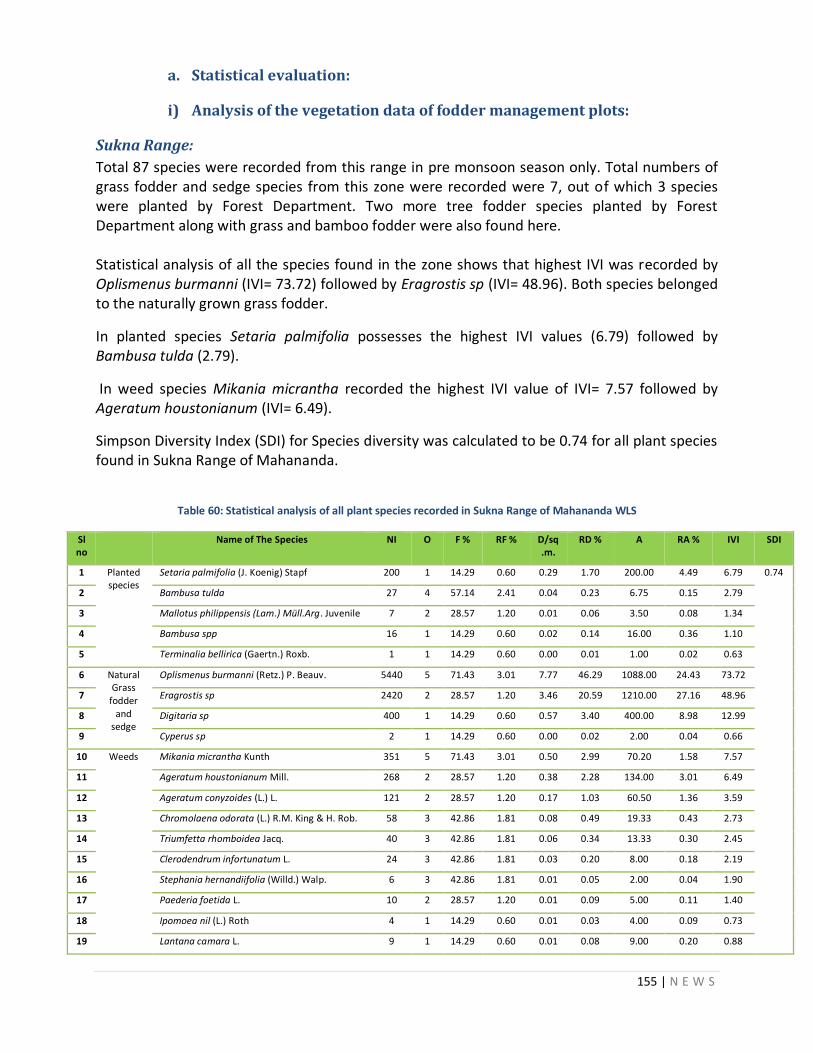
155 | N E W S
a. Statistical evaluation:
i) Analysis of the vegetation data of fodder management plots:
Sukna Range:
Total 87 species were recorded from this range in pre monsoon season only. Total numbers of grass fodder and sedge species from this zone were recorded were 7, out of which 3 species were planted by Forest Department. Two more tree fodder species planted by Forest Department along with grass and bamboo fodder were also found here. Statistical analysis of all the species found in the zone shows that highest IVI was recorded by Oplismenus burmanni (IVI= 73.72) followed by Eragrostis sp (IVI= 48.96). Both species belonged to the naturally grown grass fodder.
In planted species Setaria palmifolia possesses the highest IVI values (6.79) followed by Bambusa tulda (2.79).
In weed species Mikania micrantha recorded the highest IVI value of IVI= 7.57 followed by Ageratum houstonianum (IVI= 6.49).
Simpson Diversity Index (SDI) for Species diversity was calculated to be 0.74 for all plant species found in Sukna Range of Mahananda.
Table 60: Statistical analysis of all plant species recorded in Sukna Range of Mahananda WLS
Sl no
Name of The Species NI O F % RF % D/sq.m.
RD % A RA % IVI SDI
1 Planted species
Setaria palmifolia (J. Koenig) Stapf 200 1 14.29 0.60 0.29 1.70 200.00 4.49 6.79 0.74
2 Bambusa tulda 27 4 57.14 2.41 0.04 0.23 6.75 0.15 2.79
3 Mallotus philippensis (Lam.) Müll.Arg. Juvenile 7 2 28.57 1.20 0.01 0.06 3.50 0.08 1.34
4 Bambusa spp 16 1 14.29 0.60 0.02 0.14 16.00 0.36 1.10
5 Terminalia bellirica (Gaertn.) Roxb. 1 1 14.29 0.60 0.00 0.01 1.00 0.02 0.63
6 Natural Grass
fodder and
sedge
Oplismenus burmanni (Retz.) P. Beauv. 5440 5 71.43 3.01 7.77 46.29 1088.00 24.43 73.72
7 Eragrostis sp 2420 2 28.57 1.20 3.46 20.59 1210.00 27.16 48.96
8 Digitaria sp 400 1 14.29 0.60 0.57 3.40 400.00 8.98 12.99
9 Cyperus sp 2 1 14.29 0.60 0.00 0.02 2.00 0.04 0.66
10 Weeds Mikania micrantha Kunth 351 5 71.43 3.01 0.50 2.99 70.20 1.58 7.57
11 Ageratum houstonianum Mill. 268 2 28.57 1.20 0.38 2.28 134.00 3.01 6.49
12 Ageratum conyzoides (L.) L. 121 2 28.57 1.20 0.17 1.03 60.50 1.36 3.59
13 Chromolaena odorata (L.) R.M. King & H. Rob. 58 3 42.86 1.81 0.08 0.49 19.33 0.43 2.73
14 Triumfetta rhomboidea Jacq. 40 3 42.86 1.81 0.06 0.34 13.33 0.30 2.45
15 Clerodendrum infortunatum L. 24 3 42.86 1.81 0.03 0.20 8.00 0.18 2.19
16 Stephania hernandiifolia (Willd.) Walp. 6 3 42.86 1.81 0.01 0.05 2.00 0.04 1.90
17 Paederia foetida L. 10 2 28.57 1.20 0.01 0.09 5.00 0.11 1.40
18 Ipomoea nil (L.) Roth 4 1 14.29 0.60 0.01 0.03 4.00 0.09 0.73
19 Lantana camara L. 9 1 14.29 0.60 0.01 0.08 9.00 0.20 0.88
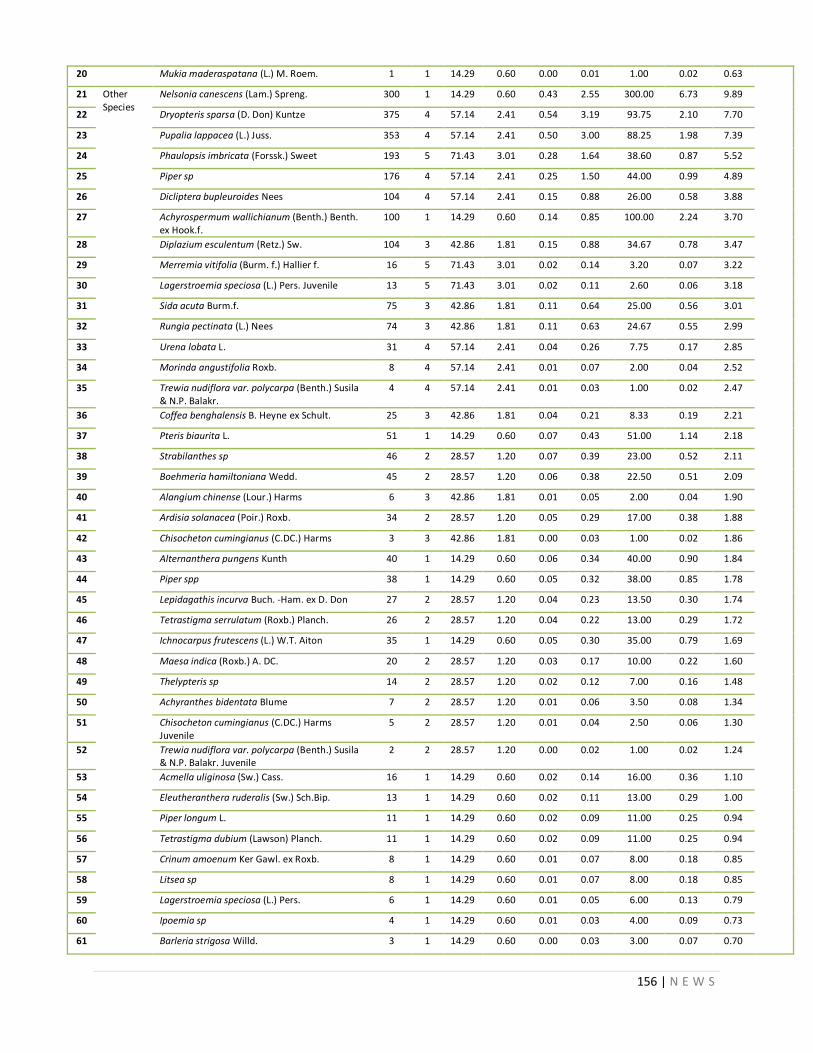
156 | N E W S
20 Mukia maderaspatana (L.) M. Roem. 1 1 14.29 0.60 0.00 0.01 1.00 0.02 0.63
21 Other Species
Nelsonia canescens (Lam.) Spreng. 300 1 14.29 0.60 0.43 2.55 300.00 6.73 9.89
22 Dryopteris sparsa (D. Don) Kuntze 375 4 57.14 2.41 0.54 3.19 93.75 2.10 7.70
23 Pupalia lappacea (L.) Juss. 353 4 57.14 2.41 0.50 3.00 88.25 1.98 7.39
24 Phaulopsis imbricata (Forssk.) Sweet 193 5 71.43 3.01 0.28 1.64 38.60 0.87 5.52
25 Piper sp 176 4 57.14 2.41 0.25 1.50 44.00 0.99 4.89
26 Dicliptera bupleuroides Nees 104 4 57.14 2.41 0.15 0.88 26.00 0.58 3.88
27 Achyrospermum wallichianum (Benth.) Benth. ex Hook.f.
100 1 14.29 0.60 0.14 0.85 100.00 2.24 3.70
28 Diplazium esculentum (Retz.) Sw. 104 3 42.86 1.81 0.15 0.88 34.67 0.78 3.47
29 Merremia vitifolia (Burm. f.) Hallier f. 16 5 71.43 3.01 0.02 0.14 3.20 0.07 3.22
30 Lagerstroemia speciosa (L.) Pers. Juvenile 13 5 71.43 3.01 0.02 0.11 2.60 0.06 3.18
31 Sida acuta Burm.f. 75 3 42.86 1.81 0.11 0.64 25.00 0.56 3.01
32 Rungia pectinata (L.) Nees 74 3 42.86 1.81 0.11 0.63 24.67 0.55 2.99
33 Urena lobata L. 31 4 57.14 2.41 0.04 0.26 7.75 0.17 2.85
34 Morinda angustifolia Roxb. 8 4 57.14 2.41 0.01 0.07 2.00 0.04 2.52
35 Trewia nudiflora var. polycarpa (Benth.) Susila & N.P. Balakr.
4 4 57.14 2.41 0.01 0.03 1.00 0.02 2.47
36 Coffea benghalensis B. Heyne ex Schult. 25 3 42.86 1.81 0.04 0.21 8.33 0.19 2.21
37 Pteris biaurita L. 51 1 14.29 0.60 0.07 0.43 51.00 1.14 2.18
38 Strabilanthes sp 46 2 28.57 1.20 0.07 0.39 23.00 0.52 2.11
39 Boehmeria hamiltoniana Wedd. 45 2 28.57 1.20 0.06 0.38 22.50 0.51 2.09
40 Alangium chinense (Lour.) Harms 6 3 42.86 1.81 0.01 0.05 2.00 0.04 1.90
41 Ardisia solanacea (Poir.) Roxb. 34 2 28.57 1.20 0.05 0.29 17.00 0.38 1.88
42 Chisocheton cumingianus (C.DC.) Harms 3 3 42.86 1.81 0.00 0.03 1.00 0.02 1.86
43 Alternanthera pungens Kunth 40 1 14.29 0.60 0.06 0.34 40.00 0.90 1.84
44 Piper spp 38 1 14.29 0.60 0.05 0.32 38.00 0.85 1.78
45 Lepidagathis incurva Buch. -Ham. ex D. Don 27 2 28.57 1.20 0.04 0.23 13.50 0.30 1.74
46 Tetrastigma serrulatum (Roxb.) Planch. 26 2 28.57 1.20 0.04 0.22 13.00 0.29 1.72
47 Ichnocarpus frutescens (L.) W.T. Aiton 35 1 14.29 0.60 0.05 0.30 35.00 0.79 1.69
48 Maesa indica (Roxb.) A. DC. 20 2 28.57 1.20 0.03 0.17 10.00 0.22 1.60
49 Thelypteris sp 14 2 28.57 1.20 0.02 0.12 7.00 0.16 1.48
50 Achyranthes bidentata Blume 7 2 28.57 1.20 0.01 0.06 3.50 0.08 1.34
51 Chisocheton cumingianus (C.DC.) Harms Juvenile
5 2 28.57 1.20 0.01 0.04 2.50 0.06 1.30
52 Trewia nudiflora var. polycarpa (Benth.) Susila & N.P. Balakr. Juvenile
2 2 28.57 1.20 0.00 0.02 1.00 0.02 1.24
53 Acmella uliginosa (Sw.) Cass. 16 1 14.29 0.60 0.02 0.14 16.00 0.36 1.10
54 Eleutheranthera ruderalis (Sw.) Sch.Bip. 13 1 14.29 0.60 0.02 0.11 13.00 0.29 1.00
55 Piper longum L. 11 1 14.29 0.60 0.02 0.09 11.00 0.25 0.94
56 Tetrastigma dubium (Lawson) Planch. 11 1 14.29 0.60 0.02 0.09 11.00 0.25 0.94
57 Crinum amoenum Ker Gawl. ex Roxb. 8 1 14.29 0.60 0.01 0.07 8.00 0.18 0.85
58 Litsea sp 8 1 14.29 0.60 0.01 0.07 8.00 0.18 0.85
59 Lagerstroemia speciosa (L.) Pers. 6 1 14.29 0.60 0.01 0.05 6.00 0.13 0.79
60 Ipoemia sp 4 1 14.29 0.60 0.01 0.03 4.00 0.09 0.73
61 Barleria strigosa Willd. 3 1 14.29 0.60 0.00 0.03 3.00 0.07 0.70

157 | N E W S
62 Commelina suffruticosa Blume 3 1 14.29 0.60 0.00 0.03 3.00 0.07 0.70
63 Impatiens tricolor Ridl. 3 1 14.29 0.60 0.00 0.03 3.00 0.07 0.70
64 Litsea monopetala (Roxb.) Pers. 3 1 14.29 0.60 0.00 0.03 3.00 0.07 0.70
65 Meyna spinosa Roxb. ex Link 3 1 14.29 0.60 0.00 0.03 3.00 0.07 0.70
66 Natsiatum herpeticum Buch. -Ham. ex Arn. 3 1 14.29 0.60 0.00 0.03 3.00 0.07 0.70
67 Oxalis debilis var. corymbosa (DC.) Lourteig 3 1 14.29 0.60 0.00 0.03 3.00 0.07 0.70
68 Clausena excavata Burm.f. 2 1 14.29 0.60 0.00 0.02 2.00 0.04 0.66
69 Combretum sp 2 1 14.29 0.60 0.00 0.02 2.00 0.04 0.66
70 Flemingia strobilifera (L.) W.T. Aiton 2 1 14.29 0.60 0.00 0.02 2.00 0.04 0.66
71 Aglaia spectabilis (Miq.) S.S. Jain & S. Bennet 1 1 14.29 0.60 0.00 0.01 1.00 0.02 0.63
72 Ailanthus excelsa Roxb. 1 1 14.29 0.60 0.00 0.01 1.00 0.02 0.63
73 Careya arborea Roxb. 1 1 14.29 0.60 0.00 0.01 1.00 0.02 0.63
74 Chukrasia tabularis A. Juss. 1 1 14.29 0.60 0.00 0.01 1.00 0.02 0.63
75 Coccinia grandis (L.) Voigt 1 1 14.29 0.60 0.00 0.01 1.00 0.02 0.63
76 Dregea volubilis (L.f.) Benth. ex Hook.f. 1 1 14.29 0.60 0.00 0.01 1.00 0.02 0.63
77 Duabanga grandiflora (DC.) Walp. 1 1 14.29 0.60 0.00 0.01 1.00 0.02 0.63
78 Flacourtia indica (Burm.f.) Merr. 1 1 14.29 0.60 0.00 0.01 1.00 0.02 0.63
79 Garuga floribunda Decne. 1 1 14.29 0.60 0.00 0.01 1.00 0.02 0.63
80 Lagerstroemia parviflora Roxb. 1 1 14.29 0.60 0.00 0.01 1.00 0.02 0.63
81 Lagerstroemia parviflora Roxb. Juvenile 1 1 14.29 0.60 0.00 0.01 1.00 0.02 0.63
82 Litsea glutinosa (Lour.) C.B. Rob. 1 1 14.29 0.60 0.00 0.01 1.00 0.02 0.63
83 Luffa acutangula (L.) Roxb. 1 1 14.29 0.60 0.00 0.01 1.00 0.02 0.63
84 Murraya koenigii (L.) Spreng. 1 1 14.29 0.60 0.00 0.01 1.00 0.02 0.63
85 Psidium guajava L. 1 1 14.29 0.60 0.00 0.01 1.00 0.02 0.63
86 Sterculia villosa Roxb. 1 1 14.29 0.60 0.00 0.01 1.00 0.02 0.63
87 Tetracera sarmentosa (L.) Vahl 1 1 14.29 0.60 0.00 0.01 1.00 0.02 0.63
NI= Number of Individuals, O= Occurance, F= Frequency, RF=Relative Frequency, D/sq m=Density per sq metre, RD=Relative Density, A=Abundance, RA= Relative Abundance,
IVI= Importance Value Index, SDI= Simpson’s Diversity Index
West Range:
Total 99 species were recorded from this range in pre monsoon season only. Total numbers of grass fodder and sedge species from this zone were recorded were 12, out of which 6 species were planted by Forest Department. Four more tree fodder species planted by Forest Department along with grass and bamboo fodder were also found here. Statistical analysis of all the species found in the zone shows that highest IVI was recorded by Axonopus compressus (IVI= 115.53) followed by Oplismenus burmanni (IVI= 14.34). Both species belonged to the naturally grown grass fodder.
In planted species Bambusa spp possesses the highest IVI values (4.08) followed by Setaria palmifolia (2.90).
In weed species Clerodendrum infortunatum recorded the highest IVI value of 5.51 followed by Chromolaena odorata (IVI= 3.87).
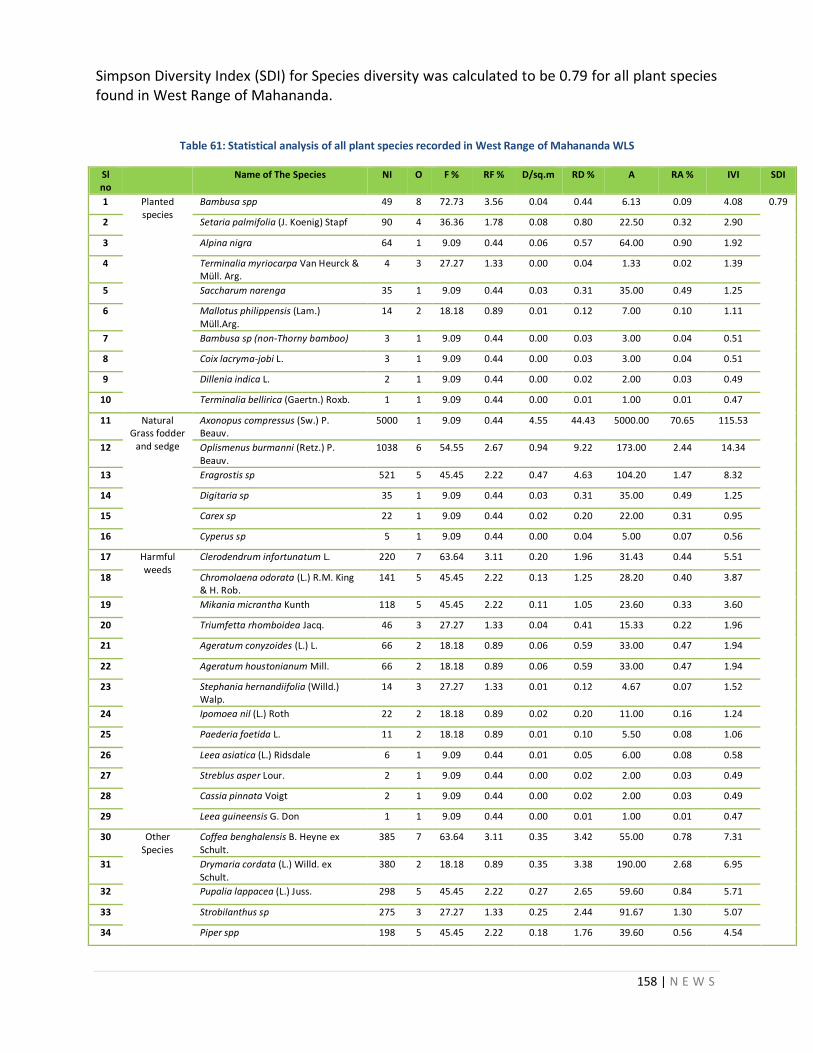
158 | N E W S
Simpson Diversity Index (SDI) for Species diversity was calculated to be 0.79 for all plant species found in West Range of Mahananda.
Table 61: Statistical analysis of all plant species recorded in West Range of Mahananda WLS
Sl no
Name of The Species NI O F % RF % D/sq.m RD % A RA % IVI SDI
1 Planted species
Bambusa spp 49 8 72.73 3.56 0.04 0.44 6.13 0.09 4.08 0.79
2 Setaria palmifolia (J. Koenig) Stapf 90 4 36.36 1.78 0.08 0.80 22.50 0.32 2.90
3 Alpina nigra 64 1 9.09 0.44 0.06 0.57 64.00 0.90 1.92
4 Terminalia myriocarpa Van Heurck & Müll. Arg.
4 3 27.27 1.33 0.00 0.04 1.33 0.02 1.39
5 Saccharum narenga 35 1 9.09 0.44 0.03 0.31 35.00 0.49 1.25
6 Mallotus philippensis (Lam.) Müll.Arg.
14 2 18.18 0.89 0.01 0.12 7.00 0.10 1.11
7 Bambusa sp (non-Thorny bamboo) 3 1 9.09 0.44 0.00 0.03 3.00 0.04 0.51
8 Coix lacryma-jobi L. 3 1 9.09 0.44 0.00 0.03 3.00 0.04 0.51
9 Dillenia indica L. 2 1 9.09 0.44 0.00 0.02 2.00 0.03 0.49
10 Terminalia bellirica (Gaertn.) Roxb. 1 1 9.09 0.44 0.00 0.01 1.00 0.01 0.47
11 Natural Grass fodder
and sedge
Axonopus compressus (Sw.) P. Beauv.
5000 1 9.09 0.44 4.55 44.43 5000.00 70.65 115.53
12 Oplismenus burmanni (Retz.) P. Beauv.
1038 6 54.55 2.67 0.94 9.22 173.00 2.44 14.34
13 Eragrostis sp 521 5 45.45 2.22 0.47 4.63 104.20 1.47 8.32
14 Digitaria sp 35 1 9.09 0.44 0.03 0.31 35.00 0.49 1.25
15 Carex sp 22 1 9.09 0.44 0.02 0.20 22.00 0.31 0.95
16 Cyperus sp 5 1 9.09 0.44 0.00 0.04 5.00 0.07 0.56
17 Harmful weeds
Clerodendrum infortunatum L. 220 7 63.64 3.11 0.20 1.96 31.43 0.44 5.51
18 Chromolaena odorata (L.) R.M. King & H. Rob.
141 5 45.45 2.22 0.13 1.25 28.20 0.40 3.87
19 Mikania micrantha Kunth 118 5 45.45 2.22 0.11 1.05 23.60 0.33 3.60
20 Triumfetta rhomboidea Jacq. 46 3 27.27 1.33 0.04 0.41 15.33 0.22 1.96
21 Ageratum conyzoides (L.) L. 66 2 18.18 0.89 0.06 0.59 33.00 0.47 1.94
22 Ageratum houstonianum Mill. 66 2 18.18 0.89 0.06 0.59 33.00 0.47 1.94
23 Stephania hernandiifolia (Willd.) Walp.
14 3 27.27 1.33 0.01 0.12 4.67 0.07 1.52
24 Ipomoea nil (L.) Roth 22 2 18.18 0.89 0.02 0.20 11.00 0.16 1.24
25 Paederia foetida L. 11 2 18.18 0.89 0.01 0.10 5.50 0.08 1.06
26 Leea asiatica (L.) Ridsdale 6 1 9.09 0.44 0.01 0.05 6.00 0.08 0.58
27 Streblus asper Lour. 2 1 9.09 0.44 0.00 0.02 2.00 0.03 0.49
28 Cassia pinnata Voigt 2 1 9.09 0.44 0.00 0.02 2.00 0.03 0.49
29 Leea guineensis G. Don 1 1 9.09 0.44 0.00 0.01 1.00 0.01 0.47
30 Other Species
Coffea benghalensis B. Heyne ex Schult.
385 7 63.64 3.11 0.35 3.42 55.00 0.78 7.31
31 Drymaria cordata (L.) Willd. ex Schult.
380 2 18.18 0.89 0.35 3.38 190.00 2.68 6.95
32 Pupalia lappacea (L.) Juss. 298 5 45.45 2.22 0.27 2.65 59.60 0.84 5.71
33 Strobilanthus sp 275 3 27.27 1.33 0.25 2.44 91.67 1.30 5.07
34 Piper spp 198 5 45.45 2.22 0.18 1.76 39.60 0.56 4.54
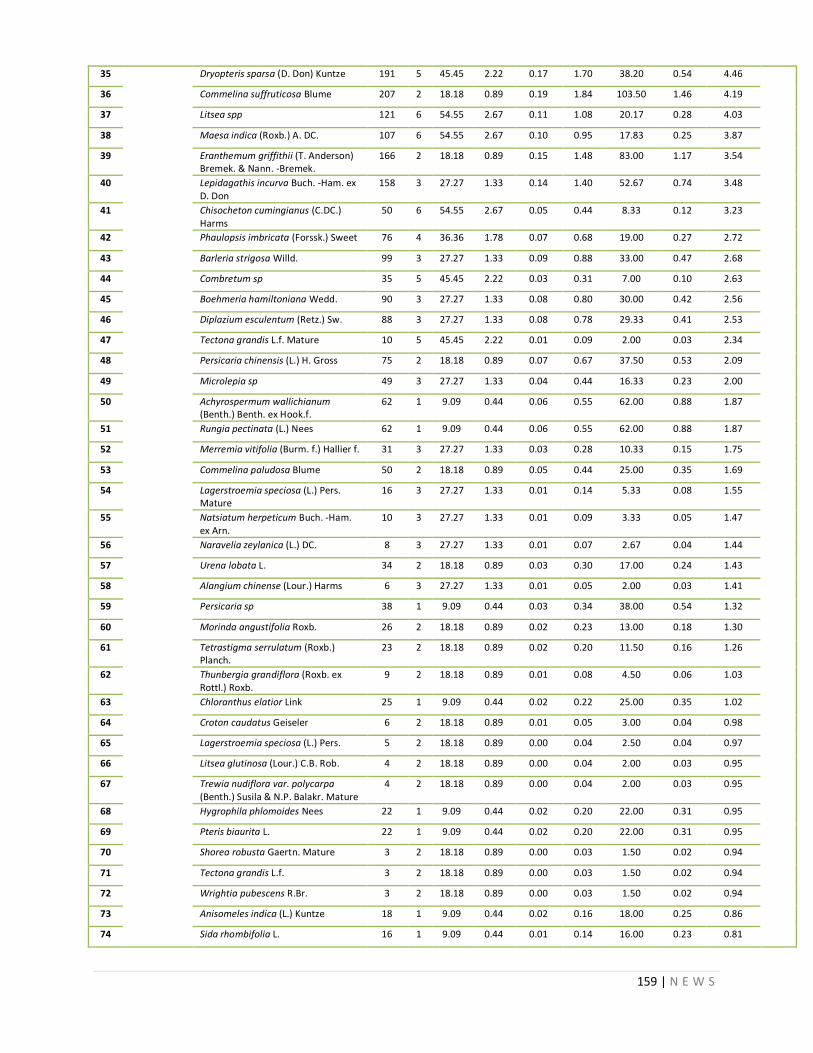
159 | N E W S
35 Dryopteris sparsa (D. Don) Kuntze 191 5 45.45 2.22 0.17 1.70 38.20 0.54 4.46
36 Commelina suffruticosa Blume 207 2 18.18 0.89 0.19 1.84 103.50 1.46 4.19
37 Litsea spp 121 6 54.55 2.67 0.11 1.08 20.17 0.28 4.03
38 Maesa indica (Roxb.) A. DC. 107 6 54.55 2.67 0.10 0.95 17.83 0.25 3.87
39 Eranthemum griffithii (T. Anderson) Bremek. & Nann. -Bremek.
166 2 18.18 0.89 0.15 1.48 83.00 1.17 3.54
40 Lepidagathis incurva Buch. -Ham. ex D. Don
158 3 27.27 1.33 0.14 1.40 52.67 0.74 3.48
41 Chisocheton cumingianus (C.DC.) Harms
50 6 54.55 2.67 0.05 0.44 8.33 0.12 3.23
42 Phaulopsis imbricata (Forssk.) Sweet 76 4 36.36 1.78 0.07 0.68 19.00 0.27 2.72
43 Barleria strigosa Willd. 99 3 27.27 1.33 0.09 0.88 33.00 0.47 2.68
44 Combretum sp 35 5 45.45 2.22 0.03 0.31 7.00 0.10 2.63
45 Boehmeria hamiltoniana Wedd. 90 3 27.27 1.33 0.08 0.80 30.00 0.42 2.56
46 Diplazium esculentum (Retz.) Sw. 88 3 27.27 1.33 0.08 0.78 29.33 0.41 2.53
47 Tectona grandis L.f. Mature 10 5 45.45 2.22 0.01 0.09 2.00 0.03 2.34
48 Persicaria chinensis (L.) H. Gross 75 2 18.18 0.89 0.07 0.67 37.50 0.53 2.09
49 Microlepia sp 49 3 27.27 1.33 0.04 0.44 16.33 0.23 2.00
50 Achyrospermum wallichianum (Benth.) Benth. ex Hook.f.
62 1 9.09 0.44 0.06 0.55 62.00 0.88 1.87
51 Rungia pectinata (L.) Nees 62 1 9.09 0.44 0.06 0.55 62.00 0.88 1.87
52 Merremia vitifolia (Burm. f.) Hallier f. 31 3 27.27 1.33 0.03 0.28 10.33 0.15 1.75
53 Commelina paludosa Blume 50 2 18.18 0.89 0.05 0.44 25.00 0.35 1.69
54 Lagerstroemia speciosa (L.) Pers. Mature
16 3 27.27 1.33 0.01 0.14 5.33 0.08 1.55
55 Natsiatum herpeticum Buch. -Ham. ex Arn.
10 3 27.27 1.33 0.01 0.09 3.33 0.05 1.47
56 Naravelia zeylanica (L.) DC. 8 3 27.27 1.33 0.01 0.07 2.67 0.04 1.44
57 Urena lobata L. 34 2 18.18 0.89 0.03 0.30 17.00 0.24 1.43
58 Alangium chinense (Lour.) Harms 6 3 27.27 1.33 0.01 0.05 2.00 0.03 1.41
59 Persicaria sp 38 1 9.09 0.44 0.03 0.34 38.00 0.54 1.32
60 Morinda angustifolia Roxb. 26 2 18.18 0.89 0.02 0.23 13.00 0.18 1.30
61 Tetrastigma serrulatum (Roxb.) Planch.
23 2 18.18 0.89 0.02 0.20 11.50 0.16 1.26
62 Thunbergia grandiflora (Roxb. ex Rottl.) Roxb.
9 2 18.18 0.89 0.01 0.08 4.50 0.06 1.03
63 Chloranthus elatior Link 25 1 9.09 0.44 0.02 0.22 25.00 0.35 1.02
64 Croton caudatus Geiseler 6 2 18.18 0.89 0.01 0.05 3.00 0.04 0.98
65 Lagerstroemia speciosa (L.) Pers. 5 2 18.18 0.89 0.00 0.04 2.50 0.04 0.97
66 Litsea glutinosa (Lour.) C.B. Rob. 4 2 18.18 0.89 0.00 0.04 2.00 0.03 0.95
67 Trewia nudiflora var. polycarpa (Benth.) Susila & N.P. Balakr. Mature
4 2 18.18 0.89 0.00 0.04 2.00 0.03 0.95
68 Hygrophila phlomoides Nees 22 1 9.09 0.44 0.02 0.20 22.00 0.31 0.95
69 Pteris biaurita L. 22 1 9.09 0.44 0.02 0.20 22.00 0.31 0.95
70 Shorea robusta Gaertn. Mature 3 2 18.18 0.89 0.00 0.03 1.50 0.02 0.94
71 Tectona grandis L.f. 3 2 18.18 0.89 0.00 0.03 1.50 0.02 0.94
72 Wrightia pubescens R.Br. 3 2 18.18 0.89 0.00 0.03 1.50 0.02 0.94
73 Anisomeles indica (L.) Kuntze 18 1 9.09 0.44 0.02 0.16 18.00 0.25 0.86
74 Sida rhombifolia L. 16 1 9.09 0.44 0.01 0.14 16.00 0.23 0.81
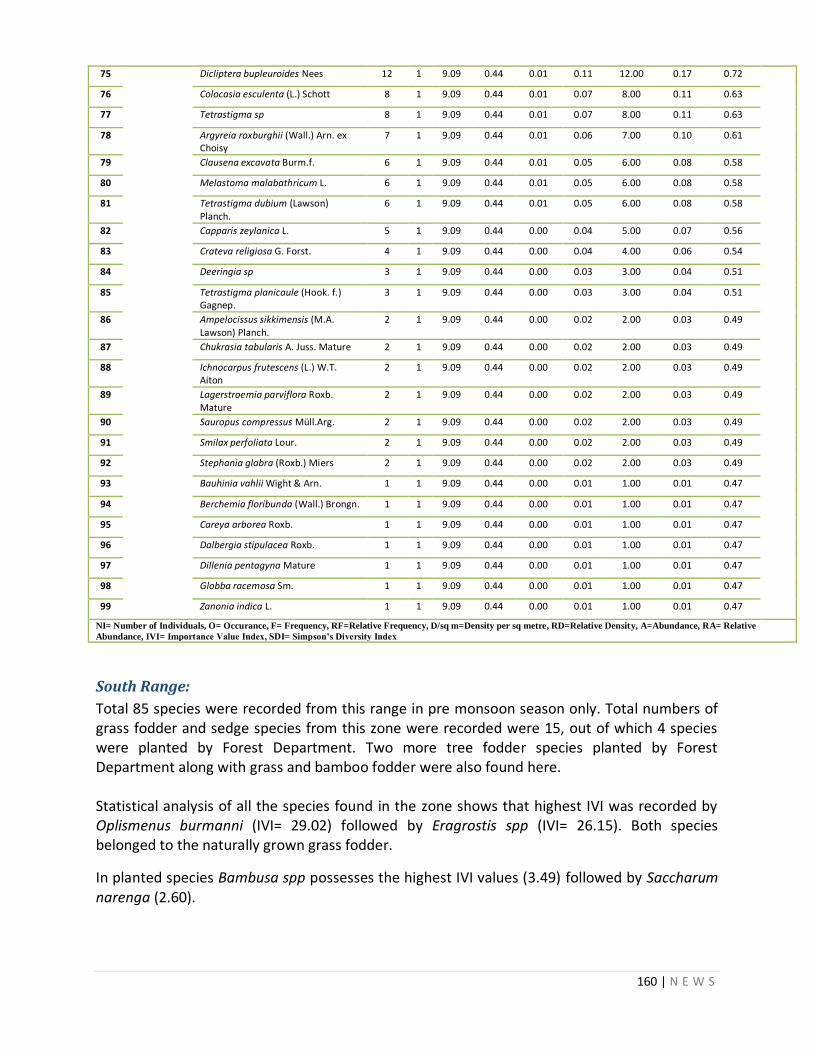
160 | N E W S
75 Dicliptera bupleuroides Nees 12 1 9.09 0.44 0.01 0.11 12.00 0.17 0.72
76 Colocasia esculenta (L.) Schott 8 1 9.09 0.44 0.01 0.07 8.00 0.11 0.63
77 Tetrastigma sp 8 1 9.09 0.44 0.01 0.07 8.00 0.11 0.63
78 Argyreia roxburghii (Wall.) Arn. ex Choisy
7 1 9.09 0.44 0.01 0.06 7.00 0.10 0.61
79 Clausena excavata Burm.f. 6 1 9.09 0.44 0.01 0.05 6.00 0.08 0.58
80 Melastoma malabathricum L. 6 1 9.09 0.44 0.01 0.05 6.00 0.08 0.58
81 Tetrastigma dubium (Lawson) Planch.
6 1 9.09 0.44 0.01 0.05 6.00 0.08 0.58
82 Capparis zeylanica L. 5 1 9.09 0.44 0.00 0.04 5.00 0.07 0.56
83 Crateva religiosa G. Forst. 4 1 9.09 0.44 0.00 0.04 4.00 0.06 0.54
84 Deeringia sp 3 1 9.09 0.44 0.00 0.03 3.00 0.04 0.51
85 Tetrastigma planicaule (Hook. f.) Gagnep.
3 1 9.09 0.44 0.00 0.03 3.00 0.04 0.51
86 Ampelocissus sikkimensis (M.A. Lawson) Planch.
2 1 9.09 0.44 0.00 0.02 2.00 0.03 0.49
87 Chukrasia tabularis A. Juss. Mature 2 1 9.09 0.44 0.00 0.02 2.00 0.03 0.49
88 Ichnocarpus frutescens (L.) W.T. Aiton
2 1 9.09 0.44 0.00 0.02 2.00 0.03 0.49
89 Lagerstroemia parviflora Roxb. Mature
2 1 9.09 0.44 0.00 0.02 2.00 0.03 0.49
90 Sauropus compressus Müll.Arg. 2 1 9.09 0.44 0.00 0.02 2.00 0.03 0.49
91 Smilax perfoliata Lour. 2 1 9.09 0.44 0.00 0.02 2.00 0.03 0.49
92 Stephania glabra (Roxb.) Miers 2 1 9.09 0.44 0.00 0.02 2.00 0.03 0.49
93 Bauhinia vahlii Wight & Arn. 1 1 9.09 0.44 0.00 0.01 1.00 0.01 0.47
94 Berchemia floribunda (Wall.) Brongn. 1 1 9.09 0.44 0.00 0.01 1.00 0.01 0.47
95 Careya arborea Roxb. 1 1 9.09 0.44 0.00 0.01 1.00 0.01 0.47
96 Dalbergia stipulacea Roxb. 1 1 9.09 0.44 0.00 0.01 1.00 0.01 0.47
97 Dillenia pentagyna Mature 1 1 9.09 0.44 0.00 0.01 1.00 0.01 0.47
98 Globba racemosa Sm. 1 1 9.09 0.44 0.00 0.01 1.00 0.01 0.47
99 Zanonia indica L. 1 1 9.09 0.44 0.00 0.01 1.00 0.01 0.47
NI= Number of Individuals, O= Occurance, F= Frequency, RF=Relative Frequency, D/sq m=Density per sq metre, RD=Relative Density, A=Abundance, RA= Relative
Abundance, IVI= Importance Value Index, SDI= Simpson’s Diversity Index
South Range:
Total 85 species were recorded from this range in pre monsoon season only. Total numbers of grass fodder and sedge species from this zone were recorded were 15, out of which 4 species were planted by Forest Department. Two more tree fodder species planted by Forest Department along with grass and bamboo fodder were also found here. Statistical analysis of all the species found in the zone shows that highest IVI was recorded by Oplismenus burmanni (IVI= 29.02) followed by Eragrostis spp (IVI= 26.15). Both species belonged to the naturally grown grass fodder.
In planted species Bambusa spp possesses the highest IVI values (3.49) followed by Saccharum narenga (2.60).
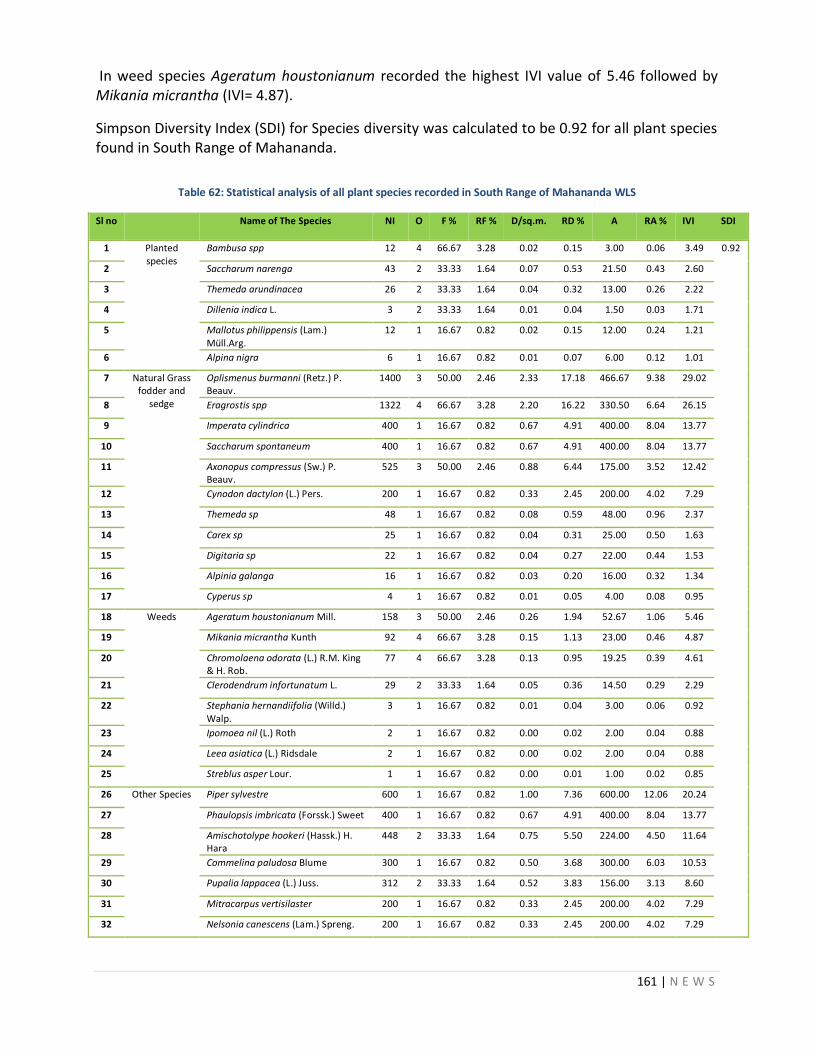
161 | N E W S
In weed species Ageratum houstonianum recorded the highest IVI value of 5.46 followed by Mikania micrantha (IVI= 4.87).
Simpson Diversity Index (SDI) for Species diversity was calculated to be 0.92 for all plant species found in South Range of Mahananda.
Table 62: Statistical analysis of all plant species recorded in South Range of Mahananda WLS
Sl no
Name of The Species NI O F % RF % D/sq.m. RD % A RA % IVI
SDI
1 Planted species
Bambusa spp 12 4 66.67 3.28 0.02 0.15 3.00 0.06 3.49 0.92
2 Saccharum narenga 43 2 33.33 1.64 0.07 0.53 21.50 0.43 2.60
3 Themeda arundinacea 26 2 33.33 1.64 0.04 0.32 13.00 0.26 2.22
4 Dillenia indica L. 3 2 33.33 1.64 0.01 0.04 1.50 0.03 1.71
5 Mallotus philippensis (Lam.) Müll.Arg.
12 1 16.67 0.82 0.02 0.15 12.00 0.24 1.21
6 Alpina nigra 6 1 16.67 0.82 0.01 0.07 6.00 0.12 1.01
7 Natural Grass fodder and
sedge
Oplismenus burmanni (Retz.) P. Beauv.
1400 3 50.00 2.46 2.33 17.18 466.67 9.38 29.02
8 Eragrostis spp 1322 4 66.67 3.28 2.20 16.22 330.50 6.64 26.15
9 Imperata cylindrica 400 1 16.67 0.82 0.67 4.91 400.00 8.04 13.77
10 Saccharum spontaneum 400 1 16.67 0.82 0.67 4.91 400.00 8.04 13.77
11 Axonopus compressus (Sw.) P. Beauv.
525 3 50.00 2.46 0.88 6.44 175.00 3.52 12.42
12 Cynodon dactylon (L.) Pers. 200 1 16.67 0.82 0.33 2.45 200.00 4.02 7.29
13 Themeda sp 48 1 16.67 0.82 0.08 0.59 48.00 0.96 2.37
14 Carex sp 25 1 16.67 0.82 0.04 0.31 25.00 0.50 1.63
15 Digitaria sp 22 1 16.67 0.82 0.04 0.27 22.00 0.44 1.53
16 Alpinia galanga 16 1 16.67 0.82 0.03 0.20 16.00 0.32 1.34
17 Cyperus sp 4 1 16.67 0.82 0.01 0.05 4.00 0.08 0.95
18 Weeds Ageratum houstonianum Mill. 158 3 50.00 2.46 0.26 1.94 52.67 1.06 5.46
19 Mikania micrantha Kunth 92 4 66.67 3.28 0.15 1.13 23.00 0.46 4.87
20 Chromolaena odorata (L.) R.M. King & H. Rob.
77 4 66.67 3.28 0.13 0.95 19.25 0.39 4.61
21 Clerodendrum infortunatum L. 29 2 33.33 1.64 0.05 0.36 14.50 0.29 2.29
22 Stephania hernandiifolia (Willd.) Walp.
3 1 16.67 0.82 0.01 0.04 3.00 0.06 0.92
23 Ipomoea nil (L.) Roth 2 1 16.67 0.82 0.00 0.02 2.00 0.04 0.88
24 Leea asiatica (L.) Ridsdale 2 1 16.67 0.82 0.00 0.02 2.00 0.04 0.88
25 Streblus asper Lour. 1 1 16.67 0.82 0.00 0.01 1.00 0.02 0.85
26 Other Species Piper sylvestre 600 1 16.67 0.82 1.00 7.36 600.00 12.06 20.24
27 Phaulopsis imbricata (Forssk.) Sweet 400 1 16.67 0.82 0.67 4.91 400.00 8.04 13.77
28 Amischotolype hookeri (Hassk.) H. Hara
448 2 33.33 1.64 0.75 5.50 224.00 4.50 11.64
29 Commelina paludosa Blume 300 1 16.67 0.82 0.50 3.68 300.00 6.03 10.53
30 Pupalia lappacea (L.) Juss. 312 2 33.33 1.64 0.52 3.83 156.00 3.13 8.60
31 Mitracarpus vertisilaster 200 1 16.67 0.82 0.33 2.45 200.00 4.02 7.29
32 Nelsonia canescens (Lam.) Spreng. 200 1 16.67 0.82 0.33 2.45 200.00 4.02 7.29
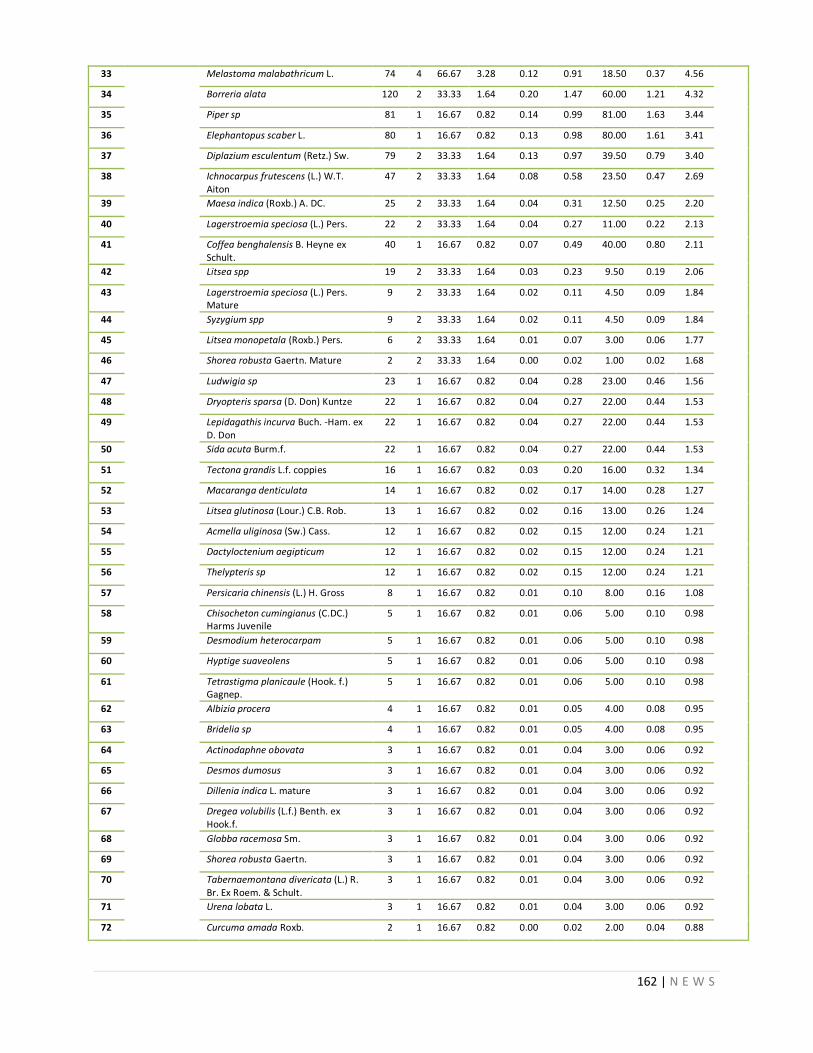
162 | N E W S
33 Melastoma malabathricum L. 74 4 66.67 3.28 0.12 0.91 18.50 0.37 4.56
34 Borreria alata 120 2 33.33 1.64 0.20 1.47 60.00 1.21 4.32
35 Piper sp 81 1 16.67 0.82 0.14 0.99 81.00 1.63 3.44
36 Elephantopus scaber L. 80 1 16.67 0.82 0.13 0.98 80.00 1.61 3.41
37 Diplazium esculentum (Retz.) Sw. 79 2 33.33 1.64 0.13 0.97 39.50 0.79 3.40
38 Ichnocarpus frutescens (L.) W.T. Aiton
47 2 33.33 1.64 0.08 0.58 23.50 0.47 2.69
39 Maesa indica (Roxb.) A. DC. 25 2 33.33 1.64 0.04 0.31 12.50 0.25 2.20
40 Lagerstroemia speciosa (L.) Pers. 22 2 33.33 1.64 0.04 0.27 11.00 0.22 2.13
41 Coffea benghalensis B. Heyne ex Schult.
40 1 16.67 0.82 0.07 0.49 40.00 0.80 2.11
42 Litsea spp 19 2 33.33 1.64 0.03 0.23 9.50 0.19 2.06
43 Lagerstroemia speciosa (L.) Pers. Mature
9 2 33.33 1.64 0.02 0.11 4.50 0.09 1.84
44 Syzygium spp 9 2 33.33 1.64 0.02 0.11 4.50 0.09 1.84
45 Litsea monopetala (Roxb.) Pers. 6 2 33.33 1.64 0.01 0.07 3.00 0.06 1.77
46 Shorea robusta Gaertn. Mature 2 2 33.33 1.64 0.00 0.02 1.00 0.02 1.68
47 Ludwigia sp 23 1 16.67 0.82 0.04 0.28 23.00 0.46 1.56
48 Dryopteris sparsa (D. Don) Kuntze 22 1 16.67 0.82 0.04 0.27 22.00 0.44 1.53
49 Lepidagathis incurva Buch. -Ham. ex D. Don
22 1 16.67 0.82 0.04 0.27 22.00 0.44 1.53
50 Sida acuta Burm.f. 22 1 16.67 0.82 0.04 0.27 22.00 0.44 1.53
51 Tectona grandis L.f. coppies 16 1 16.67 0.82 0.03 0.20 16.00 0.32 1.34
52 Macaranga denticulata 14 1 16.67 0.82 0.02 0.17 14.00 0.28 1.27
53 Litsea glutinosa (Lour.) C.B. Rob. 13 1 16.67 0.82 0.02 0.16 13.00 0.26 1.24
54 Acmella uliginosa (Sw.) Cass. 12 1 16.67 0.82 0.02 0.15 12.00 0.24 1.21
55 Dactyloctenium aegipticum 12 1 16.67 0.82 0.02 0.15 12.00 0.24 1.21
56 Thelypteris sp 12 1 16.67 0.82 0.02 0.15 12.00 0.24 1.21
57 Persicaria chinensis (L.) H. Gross 8 1 16.67 0.82 0.01 0.10 8.00 0.16 1.08
58 Chisocheton cumingianus (C.DC.) Harms Juvenile
5 1 16.67 0.82 0.01 0.06 5.00 0.10 0.98
59 Desmodium heterocarpam 5 1 16.67 0.82 0.01 0.06 5.00 0.10 0.98
60 Hyptige suaveolens 5 1 16.67 0.82 0.01 0.06 5.00 0.10 0.98
61 Tetrastigma planicaule (Hook. f.) Gagnep.
5 1 16.67 0.82 0.01 0.06 5.00 0.10 0.98
62 Albizia procera 4 1 16.67 0.82 0.01 0.05 4.00 0.08 0.95
63 Bridelia sp 4 1 16.67 0.82 0.01 0.05 4.00 0.08 0.95
64 Actinodaphne obovata 3 1 16.67 0.82 0.01 0.04 3.00 0.06 0.92
65 Desmos dumosus 3 1 16.67 0.82 0.01 0.04 3.00 0.06 0.92
66 Dillenia indica L. mature 3 1 16.67 0.82 0.01 0.04 3.00 0.06 0.92
67 Dregea volubilis (L.f.) Benth. ex Hook.f.
3 1 16.67 0.82 0.01 0.04 3.00 0.06 0.92
68 Globba racemosa Sm. 3 1 16.67 0.82 0.01 0.04 3.00 0.06 0.92
69 Shorea robusta Gaertn. 3 1 16.67 0.82 0.01 0.04 3.00 0.06 0.92
70 Tabernaemontana divericata (L.) R. Br. Ex Roem. & Schult.
3 1 16.67 0.82 0.01 0.04 3.00 0.06 0.92
71 Urena lobata L. 3 1 16.67 0.82 0.01 0.04 3.00 0.06 0.92
72 Curcuma amada Roxb. 2 1 16.67 0.82 0.00 0.02 2.00 0.04 0.88
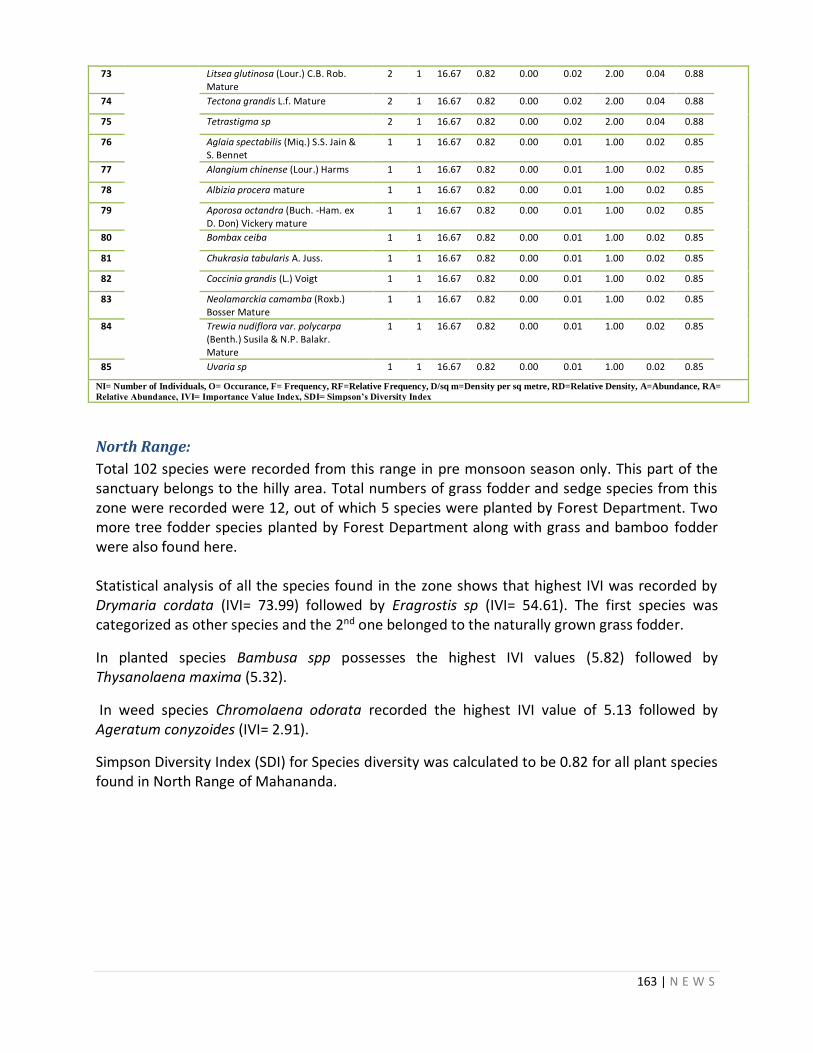
163 | N E W S
73 Litsea glutinosa (Lour.) C.B. Rob. Mature
2 1 16.67 0.82 0.00 0.02 2.00 0.04 0.88
74 Tectona grandis L.f. Mature 2 1 16.67 0.82 0.00 0.02 2.00 0.04 0.88
75 Tetrastigma sp 2 1 16.67 0.82 0.00 0.02 2.00 0.04 0.88
76 Aglaia spectabilis (Miq.) S.S. Jain & S. Bennet
1 1 16.67 0.82 0.00 0.01 1.00 0.02 0.85
77 Alangium chinense (Lour.) Harms 1 1 16.67 0.82 0.00 0.01 1.00 0.02 0.85
78 Albizia procera mature 1 1 16.67 0.82 0.00 0.01 1.00 0.02 0.85
79 Aporosa octandra (Buch. -Ham. ex D. Don) Vickery mature
1 1 16.67 0.82 0.00 0.01 1.00 0.02 0.85
80 Bombax ceiba 1 1 16.67 0.82 0.00 0.01 1.00 0.02 0.85
81 Chukrasia tabularis A. Juss. 1 1 16.67 0.82 0.00 0.01 1.00 0.02 0.85
82 Coccinia grandis (L.) Voigt 1 1 16.67 0.82 0.00 0.01 1.00 0.02 0.85
83 Neolamarckia camamba (Roxb.) Bosser Mature
1 1 16.67 0.82 0.00 0.01 1.00 0.02 0.85
84 Trewia nudiflora var. polycarpa (Benth.) Susila & N.P. Balakr. Mature
1 1 16.67 0.82 0.00 0.01 1.00 0.02 0.85
85 Uvaria sp 1 1 16.67 0.82 0.00 0.01 1.00 0.02 0.85
NI= Number of Individuals, O= Occurance, F= Frequency, RF=Relative Frequency, D/sq m=Density per sq metre, RD=Relative Density, A=Abundance, RA=
Relative Abundance, IVI= Importance Value Index, SDI= Simpson’s Diversity Index
North Range:
Total 102 species were recorded from this range in pre monsoon season only. This part of the sanctuary belongs to the hilly area. Total numbers of grass fodder and sedge species from this zone were recorded were 12, out of which 5 species were planted by Forest Department. Two more tree fodder species planted by Forest Department along with grass and bamboo fodder were also found here. Statistical analysis of all the species found in the zone shows that highest IVI was recorded by Drymaria cordata (IVI= 73.99) followed by Eragrostis sp (IVI= 54.61). The first species was categorized as other species and the 2nd one belonged to the naturally grown grass fodder.
In planted species Bambusa spp possesses the highest IVI values (5.82) followed by Thysanolaena maxima (5.32).
In weed species Chromolaena odorata recorded the highest IVI value of 5.13 followed by Ageratum conyzoides (IVI= 2.91).
Simpson Diversity Index (SDI) for Species diversity was calculated to be 0.82 for all plant species found in North Range of Mahananda.
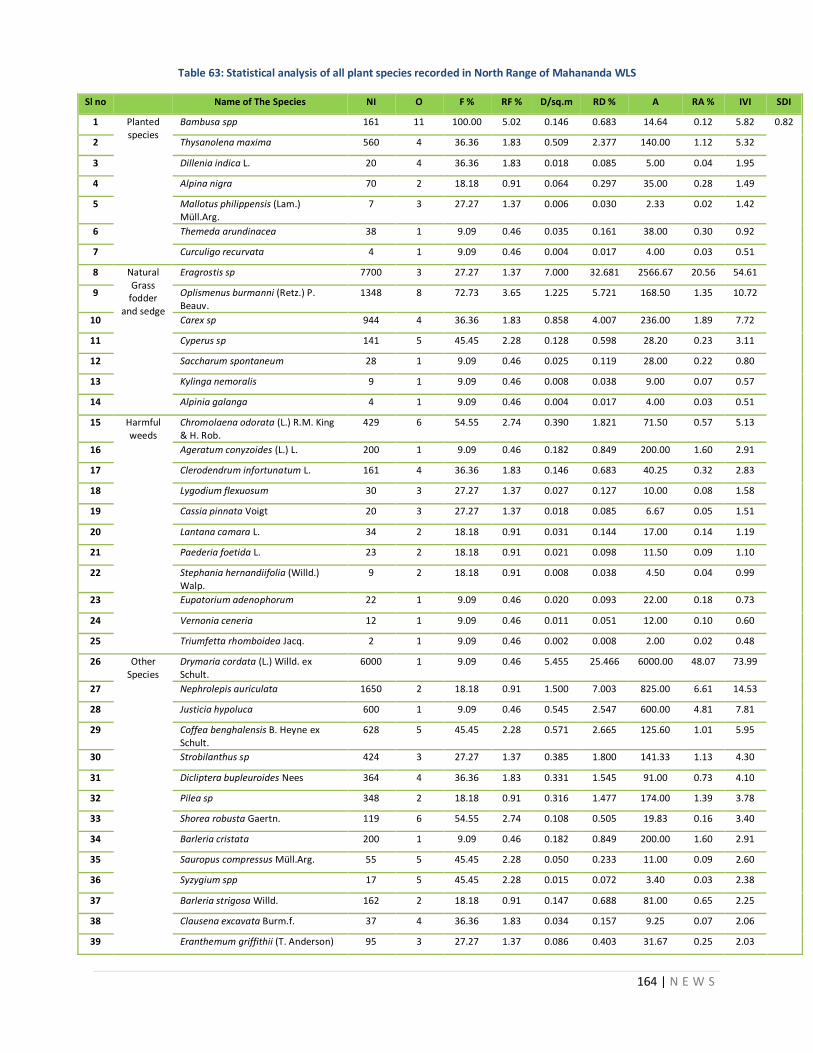
164 | N E W S
Table 63: Statistical analysis of all plant species recorded in North Range of Mahananda WLS
Sl no Name of The Species NI O F % RF % D/sq.m RD % A RA % IVI SDI
1 Planted species
Bambusa spp 161 11 100.00 5.02 0.146 0.683 14.64 0.12 5.82 0.82
2 Thysanolena maxima 560 4 36.36 1.83 0.509 2.377 140.00 1.12 5.32
3 Dillenia indica L. 20 4 36.36 1.83 0.018 0.085 5.00 0.04 1.95
4 Alpina nigra 70 2 18.18 0.91 0.064 0.297 35.00 0.28 1.49
5 Mallotus philippensis (Lam.) Müll.Arg.
7 3 27.27 1.37 0.006 0.030 2.33 0.02 1.42
6 Themeda arundinacea 38 1 9.09 0.46 0.035 0.161 38.00 0.30 0.92
7 Curculigo recurvata 4 1 9.09 0.46 0.004 0.017 4.00 0.03 0.51
8 Natural Grass
fodder and sedge
Eragrostis sp 7700 3 27.27 1.37 7.000 32.681 2566.67 20.56 54.61
9 Oplismenus burmanni (Retz.) P. Beauv.
1348 8 72.73 3.65 1.225 5.721 168.50 1.35 10.72
10 Carex sp 944 4 36.36 1.83 0.858 4.007 236.00 1.89 7.72
11 Cyperus sp 141 5 45.45 2.28 0.128 0.598 28.20 0.23 3.11
12 Saccharum spontaneum 28 1 9.09 0.46 0.025 0.119 28.00 0.22 0.80
13 Kylinga nemoralis 9 1 9.09 0.46 0.008 0.038 9.00 0.07 0.57
14 Alpinia galanga 4 1 9.09 0.46 0.004 0.017 4.00 0.03 0.51
15 Harmful weeds
Chromolaena odorata (L.) R.M. King & H. Rob.
429 6 54.55 2.74 0.390 1.821 71.50 0.57 5.13
16 Ageratum conyzoides (L.) L. 200 1 9.09 0.46 0.182 0.849 200.00 1.60 2.91
17 Clerodendrum infortunatum L. 161 4 36.36 1.83 0.146 0.683 40.25 0.32 2.83
18 Lygodium flexuosum 30 3 27.27 1.37 0.027 0.127 10.00 0.08 1.58
19 Cassia pinnata Voigt 20 3 27.27 1.37 0.018 0.085 6.67 0.05 1.51
20 Lantana camara L. 34 2 18.18 0.91 0.031 0.144 17.00 0.14 1.19
21 Paederia foetida L. 23 2 18.18 0.91 0.021 0.098 11.50 0.09 1.10
22 Stephania hernandiifolia (Willd.) Walp.
9 2 18.18 0.91 0.008 0.038 4.50 0.04 0.99
23 Eupatorium adenophorum 22 1 9.09 0.46 0.020 0.093 22.00 0.18 0.73
24 Vernonia ceneria 12 1 9.09 0.46 0.011 0.051 12.00 0.10 0.60
25 Triumfetta rhomboidea Jacq. 2 1 9.09 0.46 0.002 0.008 2.00 0.02 0.48
26 Other Species
Drymaria cordata (L.) Willd. ex Schult.
6000 1 9.09 0.46 5.455 25.466 6000.00 48.07 73.99
27 Nephrolepis auriculata 1650 2 18.18 0.91 1.500 7.003 825.00 6.61 14.53
28 Justicia hypoluca 600 1 9.09 0.46 0.545 2.547 600.00 4.81 7.81
29 Coffea benghalensis B. Heyne ex Schult.
628 5 45.45 2.28 0.571 2.665 125.60 1.01 5.95
30 Strobilanthus sp 424 3 27.27 1.37 0.385 1.800 141.33 1.13 4.30
31 Dicliptera bupleuroides Nees 364 4 36.36 1.83 0.331 1.545 91.00 0.73 4.10
32 Pilea sp 348 2 18.18 0.91 0.316 1.477 174.00 1.39 3.78
33 Shorea robusta Gaertn. 119 6 54.55 2.74 0.108 0.505 19.83 0.16 3.40
34 Barleria cristata 200 1 9.09 0.46 0.182 0.849 200.00 1.60 2.91
35 Sauropus compressus Müll.Arg. 55 5 45.45 2.28 0.050 0.233 11.00 0.09 2.60
36 Syzygium spp 17 5 45.45 2.28 0.015 0.072 3.40 0.03 2.38
37 Barleria strigosa Willd. 162 2 18.18 0.91 0.147 0.688 81.00 0.65 2.25
38 Clausena excavata Burm.f. 37 4 36.36 1.83 0.034 0.157 9.25 0.07 2.06
39 Eranthemum griffithii (T. Anderson) 95 3 27.27 1.37 0.086 0.403 31.67 0.25 2.03
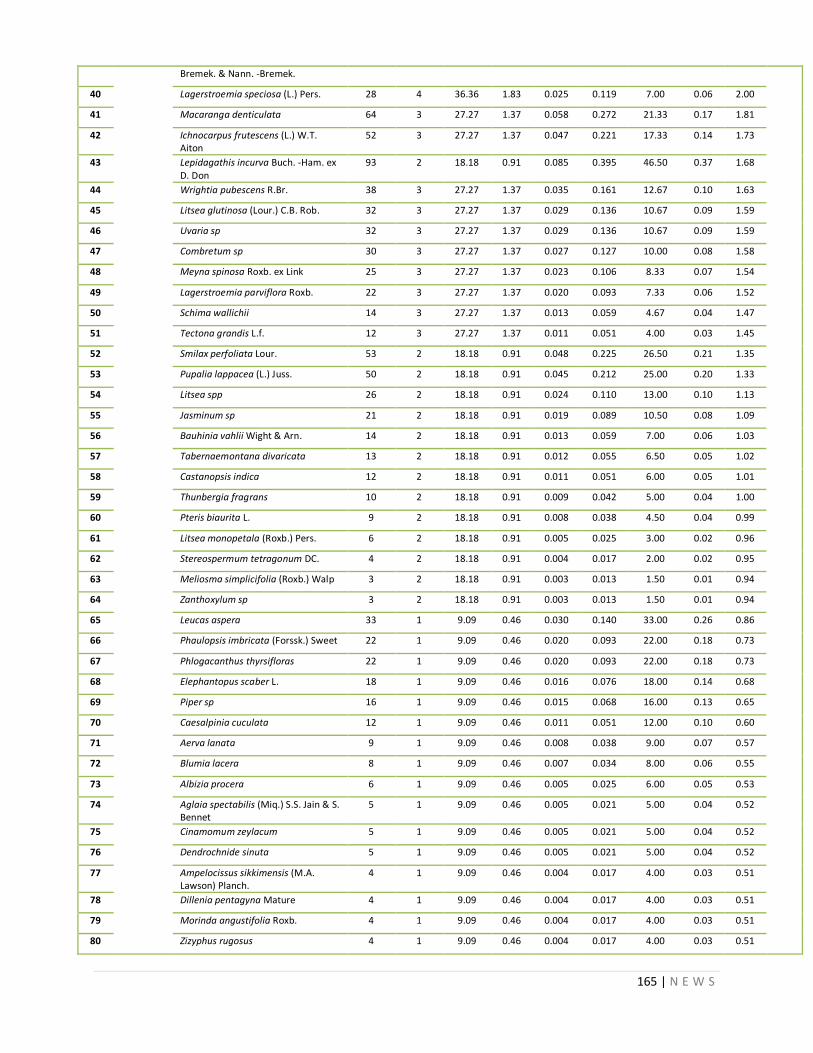
165 | N E W S
Bremek. & Nann. -Bremek.
40 Lagerstroemia speciosa (L.) Pers. 28 4 36.36 1.83 0.025 0.119 7.00 0.06 2.00
41 Macaranga denticulata 64 3 27.27 1.37 0.058 0.272 21.33 0.17 1.81
42 Ichnocarpus frutescens (L.) W.T. Aiton
52 3 27.27 1.37 0.047 0.221 17.33 0.14 1.73
43 Lepidagathis incurva Buch. -Ham. ex D. Don
93 2 18.18 0.91 0.085 0.395 46.50 0.37 1.68
44 Wrightia pubescens R.Br. 38 3 27.27 1.37 0.035 0.161 12.67 0.10 1.63
45 Litsea glutinosa (Lour.) C.B. Rob. 32 3 27.27 1.37 0.029 0.136 10.67 0.09 1.59
46 Uvaria sp 32 3 27.27 1.37 0.029 0.136 10.67 0.09 1.59
47 Combretum sp 30 3 27.27 1.37 0.027 0.127 10.00 0.08 1.58
48 Meyna spinosa Roxb. ex Link 25 3 27.27 1.37 0.023 0.106 8.33 0.07 1.54
49 Lagerstroemia parviflora Roxb. 22 3 27.27 1.37 0.020 0.093 7.33 0.06 1.52
50 Schima wallichii 14 3 27.27 1.37 0.013 0.059 4.67 0.04 1.47
51 Tectona grandis L.f. 12 3 27.27 1.37 0.011 0.051 4.00 0.03 1.45
52 Smilax perfoliata Lour. 53 2 18.18 0.91 0.048 0.225 26.50 0.21 1.35
53 Pupalia lappacea (L.) Juss. 50 2 18.18 0.91 0.045 0.212 25.00 0.20 1.33
54 Litsea spp 26 2 18.18 0.91 0.024 0.110 13.00 0.10 1.13
55 Jasminum sp 21 2 18.18 0.91 0.019 0.089 10.50 0.08 1.09
56 Bauhinia vahlii Wight & Arn. 14 2 18.18 0.91 0.013 0.059 7.00 0.06 1.03
57 Tabernaemontana divaricata 13 2 18.18 0.91 0.012 0.055 6.50 0.05 1.02
58 Castanopsis indica 12 2 18.18 0.91 0.011 0.051 6.00 0.05 1.01
59 Thunbergia fragrans 10 2 18.18 0.91 0.009 0.042 5.00 0.04 1.00
60 Pteris biaurita L. 9 2 18.18 0.91 0.008 0.038 4.50 0.04 0.99
61 Litsea monopetala (Roxb.) Pers. 6 2 18.18 0.91 0.005 0.025 3.00 0.02 0.96
62 Stereospermum tetragonum DC. 4 2 18.18 0.91 0.004 0.017 2.00 0.02 0.95
63 Meliosma simplicifolia (Roxb.) Walp 3 2 18.18 0.91 0.003 0.013 1.50 0.01 0.94
64 Zanthoxylum sp 3 2 18.18 0.91 0.003 0.013 1.50 0.01 0.94
65 Leucas aspera 33 1 9.09 0.46 0.030 0.140 33.00 0.26 0.86
66 Phaulopsis imbricata (Forssk.) Sweet 22 1 9.09 0.46 0.020 0.093 22.00 0.18 0.73
67 Phlogacanthus thyrsifloras 22 1 9.09 0.46 0.020 0.093 22.00 0.18 0.73
68 Elephantopus scaber L. 18 1 9.09 0.46 0.016 0.076 18.00 0.14 0.68
69 Piper sp 16 1 9.09 0.46 0.015 0.068 16.00 0.13 0.65
70 Caesalpinia cuculata 12 1 9.09 0.46 0.011 0.051 12.00 0.10 0.60
71 Aerva lanata 9 1 9.09 0.46 0.008 0.038 9.00 0.07 0.57
72 Blumia lacera 8 1 9.09 0.46 0.007 0.034 8.00 0.06 0.55
73 Albizia procera 6 1 9.09 0.46 0.005 0.025 6.00 0.05 0.53
74 Aglaia spectabilis (Miq.) S.S. Jain & S. Bennet
5 1 9.09 0.46 0.005 0.021 5.00 0.04 0.52
75 Cinamomum zeylacum 5 1 9.09 0.46 0.005 0.021 5.00 0.04 0.52
76 Dendrochnide sinuta 5 1 9.09 0.46 0.005 0.021 5.00 0.04 0.52
77 Ampelocissus sikkimensis (M.A. Lawson) Planch.
4 1 9.09 0.46 0.004 0.017 4.00 0.03 0.51
78 Dillenia pentagyna Mature 4 1 9.09 0.46 0.004 0.017 4.00 0.03 0.51
79 Morinda angustifolia Roxb. 4 1 9.09 0.46 0.004 0.017 4.00 0.03 0.51
80 Zizyphus rugosus 4 1 9.09 0.46 0.004 0.017 4.00 0.03 0.51
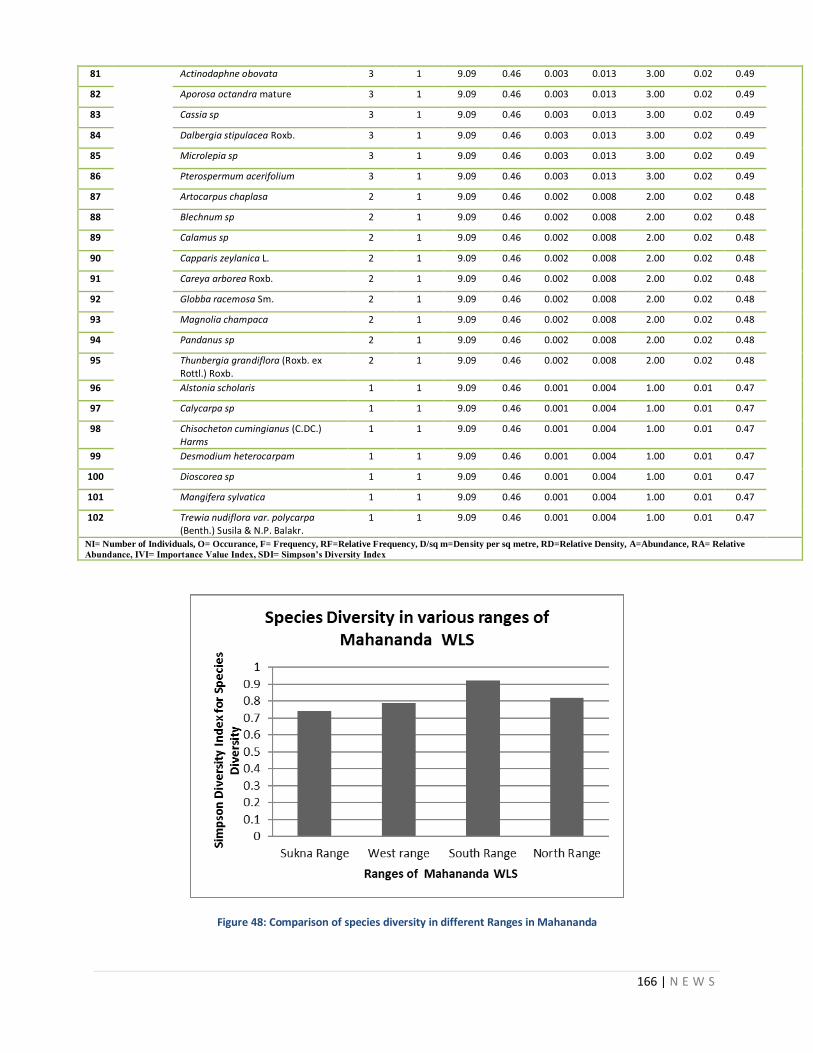
166 | N E W S
81 Actinodaphne obovata 3 1 9.09 0.46 0.003 0.013 3.00 0.02 0.49
82 Aporosa octandra mature 3 1 9.09 0.46 0.003 0.013 3.00 0.02 0.49
83 Cassia sp 3 1 9.09 0.46 0.003 0.013 3.00 0.02 0.49
84 Dalbergia stipulacea Roxb. 3 1 9.09 0.46 0.003 0.013 3.00 0.02 0.49
85 Microlepia sp 3 1 9.09 0.46 0.003 0.013 3.00 0.02 0.49
86 Pterospermum acerifolium 3 1 9.09 0.46 0.003 0.013 3.00 0.02 0.49
87 Artocarpus chaplasa 2 1 9.09 0.46 0.002 0.008 2.00 0.02 0.48
88 Blechnum sp 2 1 9.09 0.46 0.002 0.008 2.00 0.02 0.48
89 Calamus sp 2 1 9.09 0.46 0.002 0.008 2.00 0.02 0.48
90 Capparis zeylanica L. 2 1 9.09 0.46 0.002 0.008 2.00 0.02 0.48
91 Careya arborea Roxb. 2 1 9.09 0.46 0.002 0.008 2.00 0.02 0.48
92 Globba racemosa Sm. 2 1 9.09 0.46 0.002 0.008 2.00 0.02 0.48
93 Magnolia champaca 2 1 9.09 0.46 0.002 0.008 2.00 0.02 0.48
94 Pandanus sp 2 1 9.09 0.46 0.002 0.008 2.00 0.02 0.48
95 Thunbergia grandiflora (Roxb. ex Rottl.) Roxb.
2 1 9.09 0.46 0.002 0.008 2.00 0.02 0.48
96 Alstonia scholaris 1 1 9.09 0.46 0.001 0.004 1.00 0.01 0.47
97 Calycarpa sp 1 1 9.09 0.46 0.001 0.004 1.00 0.01 0.47
98 Chisocheton cumingianus (C.DC.) Harms
1 1 9.09 0.46 0.001 0.004 1.00 0.01 0.47
99 Desmodium heterocarpam 1 1 9.09 0.46 0.001 0.004 1.00 0.01 0.47
100 Dioscorea sp 1 1 9.09 0.46 0.001 0.004 1.00 0.01 0.47
101 Mangifera sylvatica 1 1 9.09 0.46 0.001 0.004 1.00 0.01 0.47
102 Trewia nudiflora var. polycarpa (Benth.) Susila & N.P. Balakr.
1 1 9.09 0.46 0.001 0.004 1.00 0.01 0.47
NI= Number of Individuals, O= Occurance, F= Frequency, RF=Relative Frequency, D/sq m=Density per sq metre, RD=Relative Density, A=Abundance, RA= Relative
Abundance, IVI= Importance Value Index, SDI= Simpson’s Diversity Index
Figure 48: Comparison of species diversity in different Ranges in Mahananda
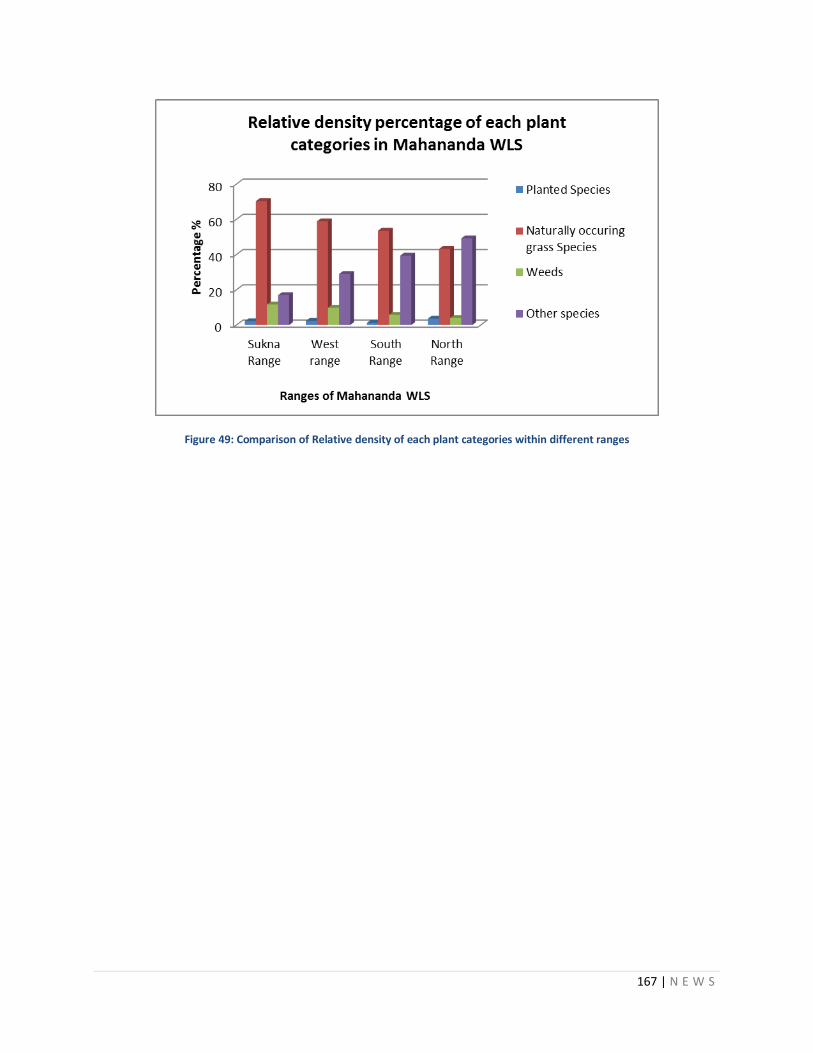
167 | N E W S
Figure 49: Comparison of Relative density of each plant categories within different ranges

168 | N E W S
Table 64: Statistical analysis of all plant species recorded in whole Mahananda WLS
Sl No. Class Name of The Species NI O F % RF % D/sq.m. RD % A RA % IVI SDI
1 Planted Grass fodders, bamboo and tree fodder species
Bambusa spp 238 24 68.57 3.29 0.068 0.43 9.92 0.08 3.81 0.9
2 Thysanolena maxima 560 4 11.43 0.55 0.160 1.02 140.00 1.19 2.76
3 Setaria palmifolia 290 5 14.29 0.68 0.083 0.53 58.00 0.49 1.71
4 Mallotus philippensis 40 8 22.86 1.10 0.011 0.07 5.00 0.04 1.21
5 Alpina nigra 140 4 11.43 0.55 0.040 0.26 35.00 0.30 1.10
6 Dillenia indica 25 7 20.00 0.96 0.007 0.05 3.57 0.03 1.03
7 Saccharum narenga 78 3 8.57 0.41 0.022 0.14 26.00 0.22 0.77
8 Themeda arundinacea 64 3 8.57 0.41 0.018 0.12 21.33 0.18 0.71
9 Bambusa tulda 27 4 11.43 0.55 0.008 0.05 6.75 0.06 0.65
10 Terminalia myriocarpa 4 3 8.57 0.41 0.001 0.01 1.33 0.01 0.43
11 Terminalia bellirica 2 2 5.71 0.27 0.001 0.00 1.00 0.01 0.29
12 Curculigo recurvata 4 1 2.86 0.14 0.001 0.01 4.00 0.03 0.18
13 Bambusa sp (non-Thorney bamboo) 3 1 2.86 0.14 0.001 0.01 3.00 0.03 0.17
14 Coix lacryma-jobi 3 1 2.86 0.14 0.001 0.01 3.00 0.03 0.17
15 Natural Grass, fodder and Sedge
Eragrostis spp 11963 14 40.00 1.92 3.418 21.82 854.50 7.26 31.00
16 Oplismenus burmanni 9226 22 62.86 3.01 2.636 16.82 419.36 3.56 23.40
17 Axonopus compressus 5525 4 11.43 0.55 1.579 10.08 1381.25 11.74 22.36
18 Imperata cylindrica 400 1 2.86 0.14 0.114 0.73 400.00 3.40 4.27
19 Carex sp 991 6 17.14 0.82 0.283 1.81 165.17 1.40 4.03
20 Saccharum spontaneum 428 2 5.71 0.27 0.122 0.78 214.00 1.82 2.87
21 Digitaria sp 457 3 8.57 0.41 0.131 0.83 152.33 1.29 2.54
22 Cynodon dactylon 200 1 2.86 0.14 0.057 0.36 200.00 1.70 2.20
23 Cyperus sp 152 8 22.86 1.10 0.043 0.28 19.00 0.16 1.53
24 Themeda sp 48 1 2.86 0.14 0.014 0.09 48.00 0.41 0.63
25 Alpinia galanga 20 2 5.71 0.27 0.006 0.04 10.00 0.09 0.40
26 Dactyloctenium aegipticum 12 1 2.86 0.14 0.003 0.02 12.00 0.10 0.26
27 Kylinga nemoralis 9 1 2.86 0.14 0.003 0.02 9.00 0.08 0.23
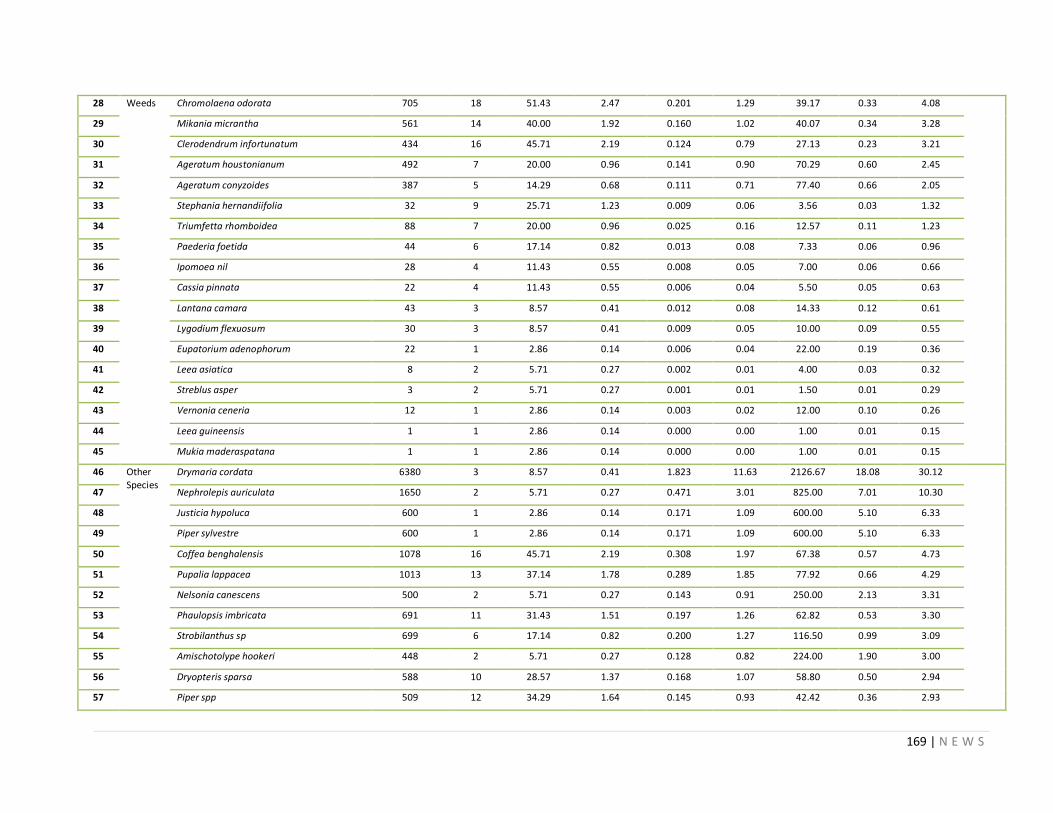
169 | N E W S
28 Weeds Chromolaena odorata 705 18 51.43 2.47 0.201 1.29 39.17 0.33 4.08
29 Mikania micrantha 561 14 40.00 1.92 0.160 1.02 40.07 0.34 3.28
30 Clerodendrum infortunatum 434 16 45.71 2.19 0.124 0.79 27.13 0.23 3.21
31 Ageratum houstonianum 492 7 20.00 0.96 0.141 0.90 70.29 0.60 2.45
32 Ageratum conyzoides 387 5 14.29 0.68 0.111 0.71 77.40 0.66 2.05
33 Stephania hernandiifolia 32 9 25.71 1.23 0.009 0.06 3.56 0.03 1.32
34 Triumfetta rhomboidea 88 7 20.00 0.96 0.025 0.16 12.57 0.11 1.23
35 Paederia foetida 44 6 17.14 0.82 0.013 0.08 7.33 0.06 0.96
36 Ipomoea nil 28 4 11.43 0.55 0.008 0.05 7.00 0.06 0.66
37 Cassia pinnata 22 4 11.43 0.55 0.006 0.04 5.50 0.05 0.63
38 Lantana camara 43 3 8.57 0.41 0.012 0.08 14.33 0.12 0.61
39 Lygodium flexuosum 30 3 8.57 0.41 0.009 0.05 10.00 0.09 0.55
40 Eupatorium adenophorum 22 1 2.86 0.14 0.006 0.04 22.00 0.19 0.36
41 Leea asiatica 8 2 5.71 0.27 0.002 0.01 4.00 0.03 0.32
42 Streblus asper 3 2 5.71 0.27 0.001 0.01 1.50 0.01 0.29
43 Vernonia ceneria 12 1 2.86 0.14 0.003 0.02 12.00 0.10 0.26
44 Leea guineensis 1 1 2.86 0.14 0.000 0.00 1.00 0.01 0.15
45 Mukia maderaspatana 1 1 2.86 0.14 0.000 0.00 1.00 0.01 0.15
46 Other Species
Drymaria cordata 6380 3 8.57 0.41 1.823 11.63 2126.67 18.08 30.12
47 Nephrolepis auriculata 1650 2 5.71 0.27 0.471 3.01 825.00 7.01 10.30
48 Justicia hypoluca 600 1 2.86 0.14 0.171 1.09 600.00 5.10 6.33
49 Piper sylvestre 600 1 2.86 0.14 0.171 1.09 600.00 5.10 6.33
50 Coffea benghalensis 1078 16 45.71 2.19 0.308 1.97 67.38 0.57 4.73
51 Pupalia lappacea 1013 13 37.14 1.78 0.289 1.85 77.92 0.66 4.29
52 Nelsonia canescens 500 2 5.71 0.27 0.143 0.91 250.00 2.13 3.31
53 Phaulopsis imbricata 691 11 31.43 1.51 0.197 1.26 62.82 0.53 3.30
54 Strobilanthus sp 699 6 17.14 0.82 0.200 1.27 116.50 0.99 3.09
55 Amischotolype hookeri 448 2 5.71 0.27 0.128 0.82 224.00 1.90 3.00
56 Dryopteris sparsa 588 10 28.57 1.37 0.168 1.07 58.80 0.50 2.94
57 Piper spp 509 12 34.29 1.64 0.145 0.93 42.42 0.36 2.93
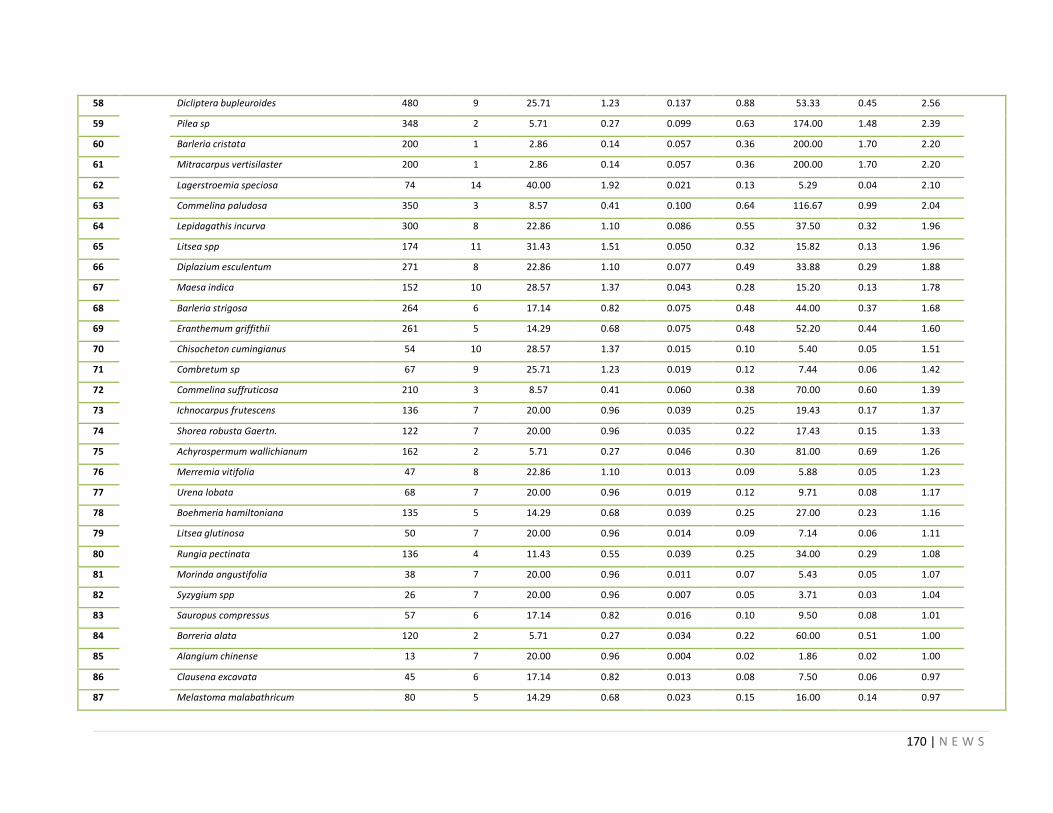
170 | N E W S
58 Dicliptera bupleuroides 480 9 25.71 1.23 0.137 0.88 53.33 0.45 2.56
59 Pilea sp 348 2 5.71 0.27 0.099 0.63 174.00 1.48 2.39
60 Barleria cristata 200 1 2.86 0.14 0.057 0.36 200.00 1.70 2.20
61 Mitracarpus vertisilaster 200 1 2.86 0.14 0.057 0.36 200.00 1.70 2.20
62 Lagerstroemia speciosa 74 14 40.00 1.92 0.021 0.13 5.29 0.04 2.10
63 Commelina paludosa 350 3 8.57 0.41 0.100 0.64 116.67 0.99 2.04
64 Lepidagathis incurva 300 8 22.86 1.10 0.086 0.55 37.50 0.32 1.96
65 Litsea spp 174 11 31.43 1.51 0.050 0.32 15.82 0.13 1.96
66 Diplazium esculentum 271 8 22.86 1.10 0.077 0.49 33.88 0.29 1.88
67 Maesa indica 152 10 28.57 1.37 0.043 0.28 15.20 0.13 1.78
68 Barleria strigosa 264 6 17.14 0.82 0.075 0.48 44.00 0.37 1.68
69 Eranthemum griffithii 261 5 14.29 0.68 0.075 0.48 52.20 0.44 1.60
70 Chisocheton cumingianus 54 10 28.57 1.37 0.015 0.10 5.40 0.05 1.51
71 Combretum sp 67 9 25.71 1.23 0.019 0.12 7.44 0.06 1.42
72 Commelina suffruticosa 210 3 8.57 0.41 0.060 0.38 70.00 0.60 1.39
73 Ichnocarpus frutescens 136 7 20.00 0.96 0.039 0.25 19.43 0.17 1.37
74 Shorea robusta Gaertn. 122 7 20.00 0.96 0.035 0.22 17.43 0.15 1.33
75 Achyrospermum wallichianum 162 2 5.71 0.27 0.046 0.30 81.00 0.69 1.26
76 Merremia vitifolia 47 8 22.86 1.10 0.013 0.09 5.88 0.05 1.23
77 Urena lobata 68 7 20.00 0.96 0.019 0.12 9.71 0.08 1.17
78 Boehmeria hamiltoniana 135 5 14.29 0.68 0.039 0.25 27.00 0.23 1.16
79 Litsea glutinosa 50 7 20.00 0.96 0.014 0.09 7.14 0.06 1.11
80 Rungia pectinata 136 4 11.43 0.55 0.039 0.25 34.00 0.29 1.08
81 Morinda angustifolia 38 7 20.00 0.96 0.011 0.07 5.43 0.05 1.07
82 Syzygium spp 26 7 20.00 0.96 0.007 0.05 3.71 0.03 1.04
83 Sauropus compressus 57 6 17.14 0.82 0.016 0.10 9.50 0.08 1.01
84 Borreria alata 120 2 5.71 0.27 0.034 0.22 60.00 0.51 1.00
85 Alangium chinense 13 7 20.00 0.96 0.004 0.02 1.86 0.02 1.00
86 Clausena excavata 45 6 17.14 0.82 0.013 0.08 7.50 0.06 0.97
87 Melastoma malabathricum 80 5 14.29 0.68 0.023 0.15 16.00 0.14 0.97
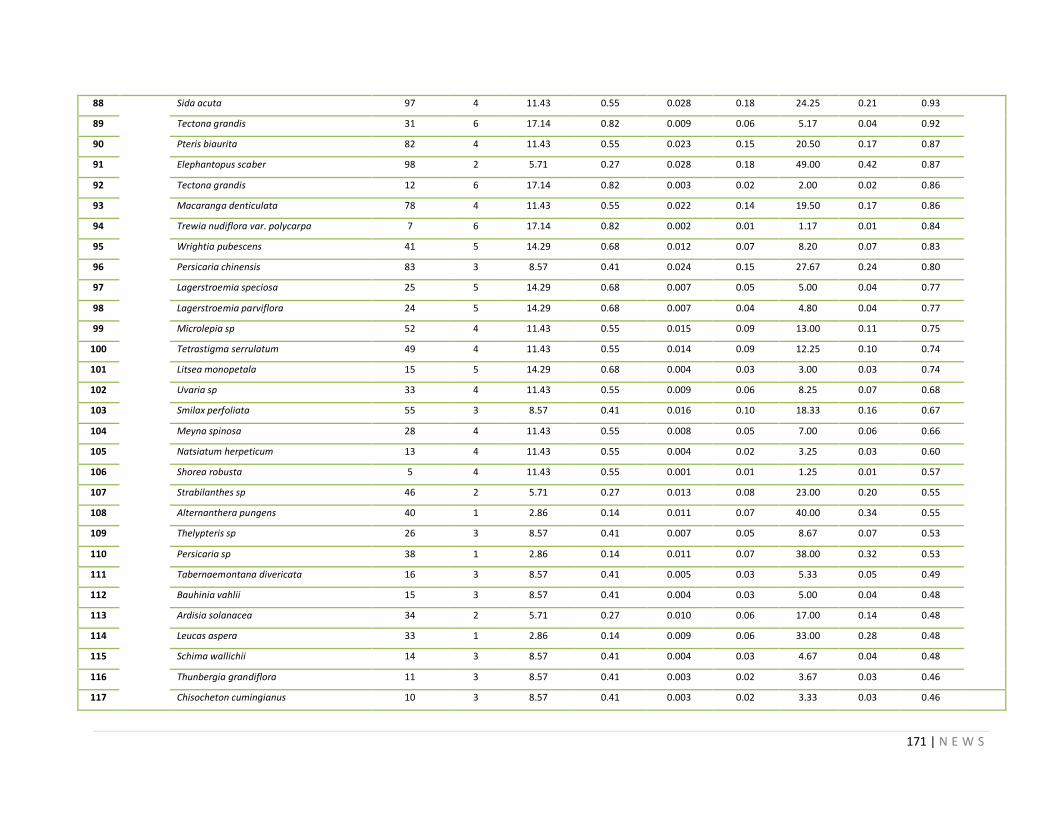
171 | N E W S
88 Sida acuta 97 4 11.43 0.55 0.028 0.18 24.25 0.21 0.93
89 Tectona grandis 31 6 17.14 0.82 0.009 0.06 5.17 0.04 0.92
90 Pteris biaurita 82 4 11.43 0.55 0.023 0.15 20.50 0.17 0.87
91 Elephantopus scaber 98 2 5.71 0.27 0.028 0.18 49.00 0.42 0.87
92 Tectona grandis 12 6 17.14 0.82 0.003 0.02 2.00 0.02 0.86
93 Macaranga denticulata 78 4 11.43 0.55 0.022 0.14 19.50 0.17 0.86
94 Trewia nudiflora var. polycarpa 7 6 17.14 0.82 0.002 0.01 1.17 0.01 0.84
95 Wrightia pubescens 41 5 14.29 0.68 0.012 0.07 8.20 0.07 0.83
96 Persicaria chinensis 83 3 8.57 0.41 0.024 0.15 27.67 0.24 0.80
97 Lagerstroemia speciosa 25 5 14.29 0.68 0.007 0.05 5.00 0.04 0.77
98 Lagerstroemia parviflora 24 5 14.29 0.68 0.007 0.04 4.80 0.04 0.77
99 Microlepia sp 52 4 11.43 0.55 0.015 0.09 13.00 0.11 0.75
100 Tetrastigma serrulatum 49 4 11.43 0.55 0.014 0.09 12.25 0.10 0.74
101 Litsea monopetala 15 5 14.29 0.68 0.004 0.03 3.00 0.03 0.74
102 Uvaria sp 33 4 11.43 0.55 0.009 0.06 8.25 0.07 0.68
103 Smilax perfoliata 55 3 8.57 0.41 0.016 0.10 18.33 0.16 0.67
104 Meyna spinosa 28 4 11.43 0.55 0.008 0.05 7.00 0.06 0.66
105 Natsiatum herpeticum 13 4 11.43 0.55 0.004 0.02 3.25 0.03 0.60
106 Shorea robusta 5 4 11.43 0.55 0.001 0.01 1.25 0.01 0.57
107 Strabilanthes sp 46 2 5.71 0.27 0.013 0.08 23.00 0.20 0.55
108 Alternanthera pungens 40 1 2.86 0.14 0.011 0.07 40.00 0.34 0.55
109 Thelypteris sp 26 3 8.57 0.41 0.007 0.05 8.67 0.07 0.53
110 Persicaria sp 38 1 2.86 0.14 0.011 0.07 38.00 0.32 0.53
111 Tabernaemontana divericata 16 3 8.57 0.41 0.005 0.03 5.33 0.05 0.49
112 Bauhinia vahlii 15 3 8.57 0.41 0.004 0.03 5.00 0.04 0.48
113 Ardisia solanacea 34 2 5.71 0.27 0.010 0.06 17.00 0.14 0.48
114 Leucas aspera 33 1 2.86 0.14 0.009 0.06 33.00 0.28 0.48
115 Schima wallichii 14 3 8.57 0.41 0.004 0.03 4.67 0.04 0.48
116 Thunbergia grandiflora 11 3 8.57 0.41 0.003 0.02 3.67 0.03 0.46
117 Chisocheton cumingianus 10 3 8.57 0.41 0.003 0.02 3.33 0.03 0.46
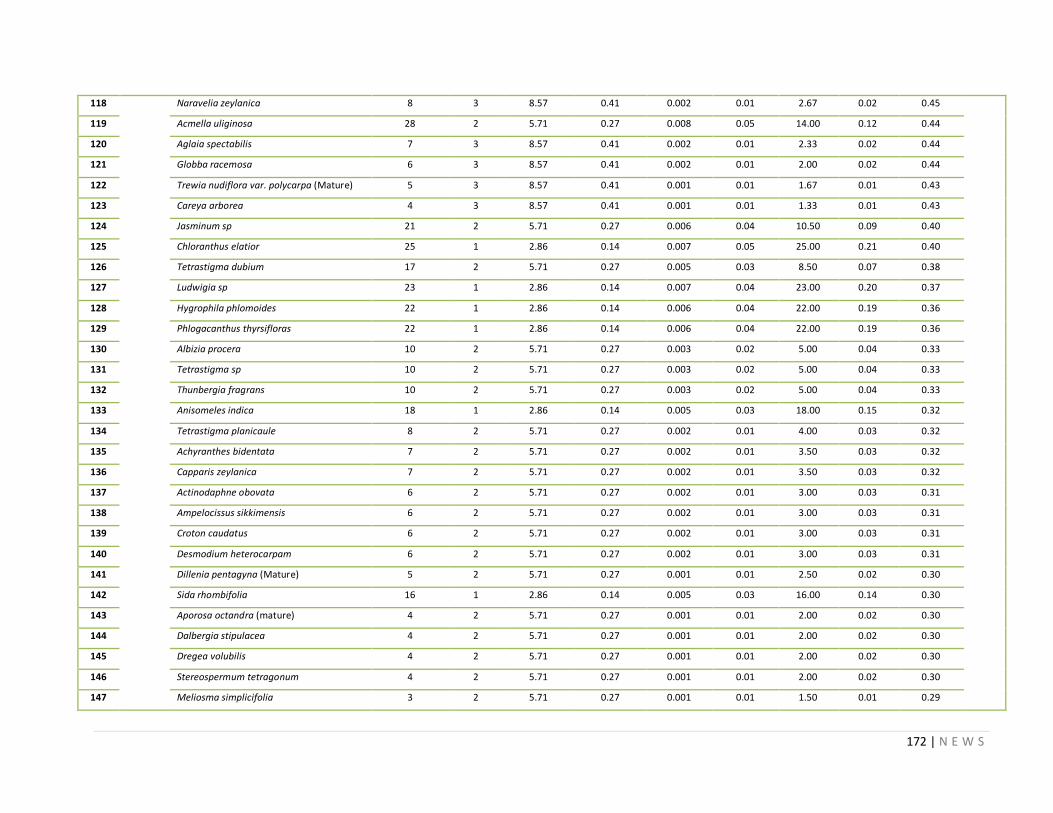
172 | N E W S
118 Naravelia zeylanica 8 3 8.57 0.41 0.002 0.01 2.67 0.02 0.45
119 Acmella uliginosa 28 2 5.71 0.27 0.008 0.05 14.00 0.12 0.44
120 Aglaia spectabilis 7 3 8.57 0.41 0.002 0.01 2.33 0.02 0.44
121 Globba racemosa 6 3 8.57 0.41 0.002 0.01 2.00 0.02 0.44
122 Trewia nudiflora var. polycarpa (Mature) 5 3 8.57 0.41 0.001 0.01 1.67 0.01 0.43
123 Careya arborea 4 3 8.57 0.41 0.001 0.01 1.33 0.01 0.43
124 Jasminum sp 21 2 5.71 0.27 0.006 0.04 10.50 0.09 0.40
125 Chloranthus elatior 25 1 2.86 0.14 0.007 0.05 25.00 0.21 0.40
126 Tetrastigma dubium 17 2 5.71 0.27 0.005 0.03 8.50 0.07 0.38
127 Ludwigia sp 23 1 2.86 0.14 0.007 0.04 23.00 0.20 0.37
128 Hygrophila phlomoides 22 1 2.86 0.14 0.006 0.04 22.00 0.19 0.36
129 Phlogacanthus thyrsifloras 22 1 2.86 0.14 0.006 0.04 22.00 0.19 0.36
130 Albizia procera 10 2 5.71 0.27 0.003 0.02 5.00 0.04 0.33
131 Tetrastigma sp 10 2 5.71 0.27 0.003 0.02 5.00 0.04 0.33
132 Thunbergia fragrans 10 2 5.71 0.27 0.003 0.02 5.00 0.04 0.33
133 Anisomeles indica 18 1 2.86 0.14 0.005 0.03 18.00 0.15 0.32
134 Tetrastigma planicaule 8 2 5.71 0.27 0.002 0.01 4.00 0.03 0.32
135 Achyranthes bidentata 7 2 5.71 0.27 0.002 0.01 3.50 0.03 0.32
136 Capparis zeylanica 7 2 5.71 0.27 0.002 0.01 3.50 0.03 0.32
137 Actinodaphne obovata 6 2 5.71 0.27 0.002 0.01 3.00 0.03 0.31
138 Ampelocissus sikkimensis 6 2 5.71 0.27 0.002 0.01 3.00 0.03 0.31
139 Croton caudatus 6 2 5.71 0.27 0.002 0.01 3.00 0.03 0.31
140 Desmodium heterocarpam 6 2 5.71 0.27 0.002 0.01 3.00 0.03 0.31
141 Dillenia pentagyna (Mature) 5 2 5.71 0.27 0.001 0.01 2.50 0.02 0.30
142 Sida rhombifolia 16 1 2.86 0.14 0.005 0.03 16.00 0.14 0.30
143 Aporosa octandra (mature) 4 2 5.71 0.27 0.001 0.01 2.00 0.02 0.30
144 Dalbergia stipulacea 4 2 5.71 0.27 0.001 0.01 2.00 0.02 0.30
145 Dregea volubilis 4 2 5.71 0.27 0.001 0.01 2.00 0.02 0.30
146 Stereospermum tetragonum 4 2 5.71 0.27 0.001 0.01 2.00 0.02 0.30
147 Meliosma simplicifolia 3 2 5.71 0.27 0.001 0.01 1.50 0.01 0.29
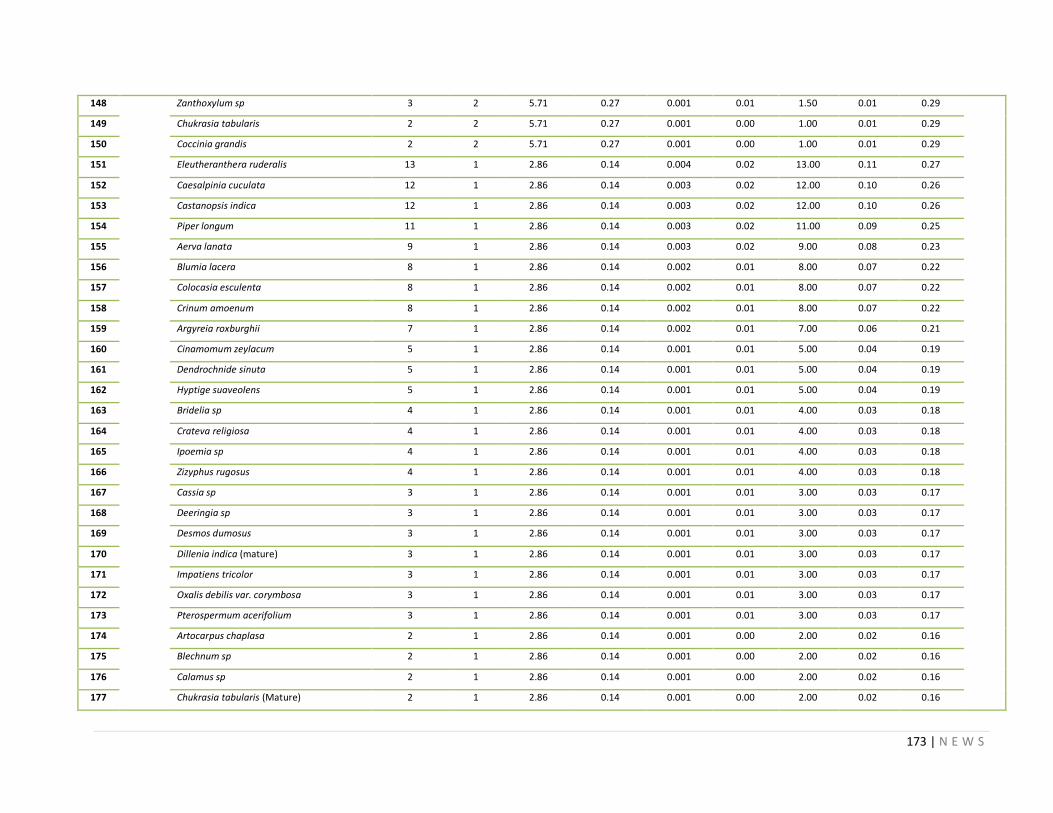
173 | N E W S
148 Zanthoxylum sp 3 2 5.71 0.27 0.001 0.01 1.50 0.01 0.29
149 Chukrasia tabularis 2 2 5.71 0.27 0.001 0.00 1.00 0.01 0.29
150 Coccinia grandis 2 2 5.71 0.27 0.001 0.00 1.00 0.01 0.29
151 Eleutheranthera ruderalis 13 1 2.86 0.14 0.004 0.02 13.00 0.11 0.27
152 Caesalpinia cuculata 12 1 2.86 0.14 0.003 0.02 12.00 0.10 0.26
153 Castanopsis indica 12 1 2.86 0.14 0.003 0.02 12.00 0.10 0.26
154 Piper longum 11 1 2.86 0.14 0.003 0.02 11.00 0.09 0.25
155 Aerva lanata 9 1 2.86 0.14 0.003 0.02 9.00 0.08 0.23
156 Blumia lacera 8 1 2.86 0.14 0.002 0.01 8.00 0.07 0.22
157 Colocasia esculenta 8 1 2.86 0.14 0.002 0.01 8.00 0.07 0.22
158 Crinum amoenum 8 1 2.86 0.14 0.002 0.01 8.00 0.07 0.22
159 Argyreia roxburghii 7 1 2.86 0.14 0.002 0.01 7.00 0.06 0.21
160 Cinamomum zeylacum 5 1 2.86 0.14 0.001 0.01 5.00 0.04 0.19
161 Dendrochnide sinuta 5 1 2.86 0.14 0.001 0.01 5.00 0.04 0.19
162 Hyptige suaveolens 5 1 2.86 0.14 0.001 0.01 5.00 0.04 0.19
163 Bridelia sp 4 1 2.86 0.14 0.001 0.01 4.00 0.03 0.18
164 Crateva religiosa 4 1 2.86 0.14 0.001 0.01 4.00 0.03 0.18
165 Ipoemia sp 4 1 2.86 0.14 0.001 0.01 4.00 0.03 0.18
166 Zizyphus rugosus 4 1 2.86 0.14 0.001 0.01 4.00 0.03 0.18
167 Cassia sp 3 1 2.86 0.14 0.001 0.01 3.00 0.03 0.17
168 Deeringia sp 3 1 2.86 0.14 0.001 0.01 3.00 0.03 0.17
169 Desmos dumosus 3 1 2.86 0.14 0.001 0.01 3.00 0.03 0.17
170 Dillenia indica (mature) 3 1 2.86 0.14 0.001 0.01 3.00 0.03 0.17
171 Impatiens tricolor 3 1 2.86 0.14 0.001 0.01 3.00 0.03 0.17
172 Oxalis debilis var. corymbosa 3 1 2.86 0.14 0.001 0.01 3.00 0.03 0.17
173 Pterospermum acerifolium 3 1 2.86 0.14 0.001 0.01 3.00 0.03 0.17
174 Artocarpus chaplasa 2 1 2.86 0.14 0.001 0.00 2.00 0.02 0.16
175 Blechnum sp 2 1 2.86 0.14 0.001 0.00 2.00 0.02 0.16
176 Calamus sp 2 1 2.86 0.14 0.001 0.00 2.00 0.02 0.16
177 Chukrasia tabularis (Mature) 2 1 2.86 0.14 0.001 0.00 2.00 0.02 0.16
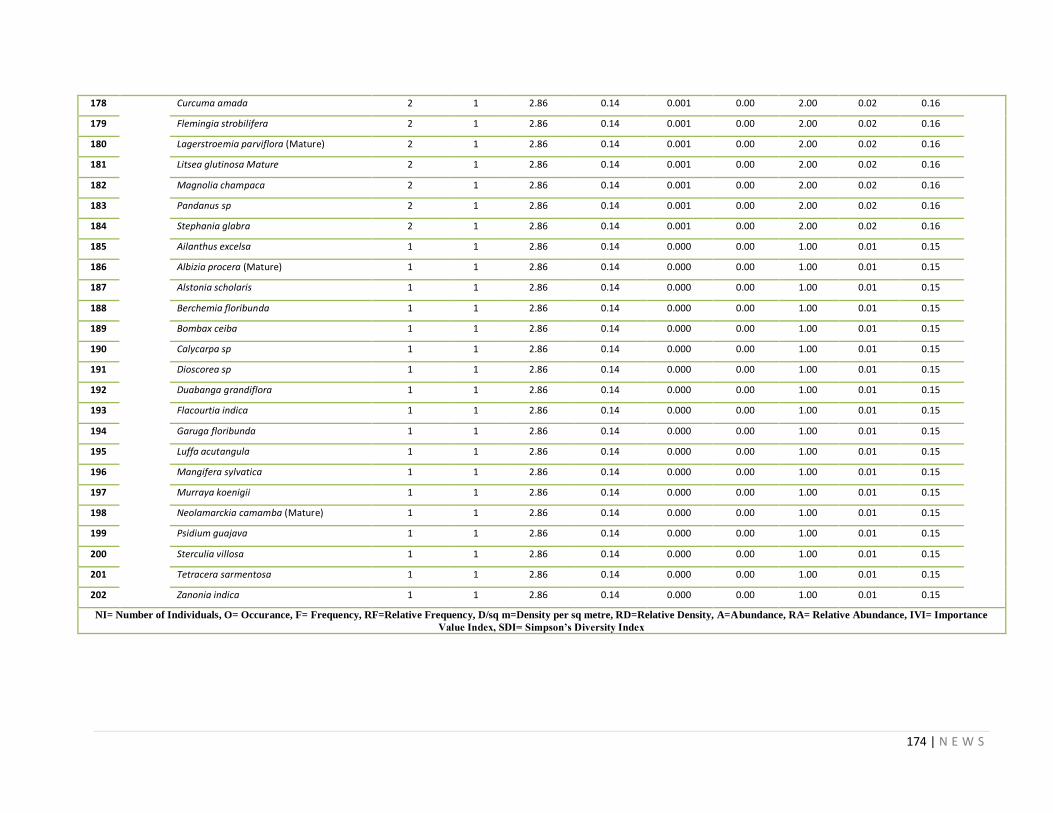
174 | N E W S
178 Curcuma amada 2 1 2.86 0.14 0.001 0.00 2.00 0.02 0.16
179 Flemingia strobilifera 2 1 2.86 0.14 0.001 0.00 2.00 0.02 0.16
180 Lagerstroemia parviflora (Mature) 2 1 2.86 0.14 0.001 0.00 2.00 0.02 0.16
181 Litsea glutinosa Mature 2 1 2.86 0.14 0.001 0.00 2.00 0.02 0.16
182 Magnolia champaca 2 1 2.86 0.14 0.001 0.00 2.00 0.02 0.16
183 Pandanus sp 2 1 2.86 0.14 0.001 0.00 2.00 0.02 0.16
184 Stephania glabra 2 1 2.86 0.14 0.001 0.00 2.00 0.02 0.16
185 Ailanthus excelsa 1 1 2.86 0.14 0.000 0.00 1.00 0.01 0.15
186 Albizia procera (Mature) 1 1 2.86 0.14 0.000 0.00 1.00 0.01 0.15
187 Alstonia scholaris 1 1 2.86 0.14 0.000 0.00 1.00 0.01 0.15
188 Berchemia floribunda 1 1 2.86 0.14 0.000 0.00 1.00 0.01 0.15
189 Bombax ceiba 1 1 2.86 0.14 0.000 0.00 1.00 0.01 0.15
190 Calycarpa sp 1 1 2.86 0.14 0.000 0.00 1.00 0.01 0.15
191 Dioscorea sp 1 1 2.86 0.14 0.000 0.00 1.00 0.01 0.15
192 Duabanga grandiflora 1 1 2.86 0.14 0.000 0.00 1.00 0.01 0.15
193 Flacourtia indica 1 1 2.86 0.14 0.000 0.00 1.00 0.01 0.15
194 Garuga floribunda 1 1 2.86 0.14 0.000 0.00 1.00 0.01 0.15
195 Luffa acutangula 1 1 2.86 0.14 0.000 0.00 1.00 0.01 0.15
196 Mangifera sylvatica 1 1 2.86 0.14 0.000 0.00 1.00 0.01 0.15
197 Murraya koenigii 1 1 2.86 0.14 0.000 0.00 1.00 0.01 0.15
198 Neolamarckia camamba (Mature) 1 1 2.86 0.14 0.000 0.00 1.00 0.01 0.15
199 Psidium guajava 1 1 2.86 0.14 0.000 0.00 1.00 0.01 0.15
200 Sterculia villosa 1 1 2.86 0.14 0.000 0.00 1.00 0.01 0.15
201 Tetracera sarmentosa 1 1 2.86 0.14 0.000 0.00 1.00 0.01 0.15
202 Zanonia indica 1 1 2.86 0.14 0.000 0.00 1.00 0.01 0.15
NI= Number of Individuals, O= Occurance, F= Frequency, RF=Relative Frequency, D/sq m=Density per sq metre, RD=Relative Density, A=Abundance, RA= Relative Abundance, IVI= Importance
Value Index, SDI= Simpson’s Diversity Index
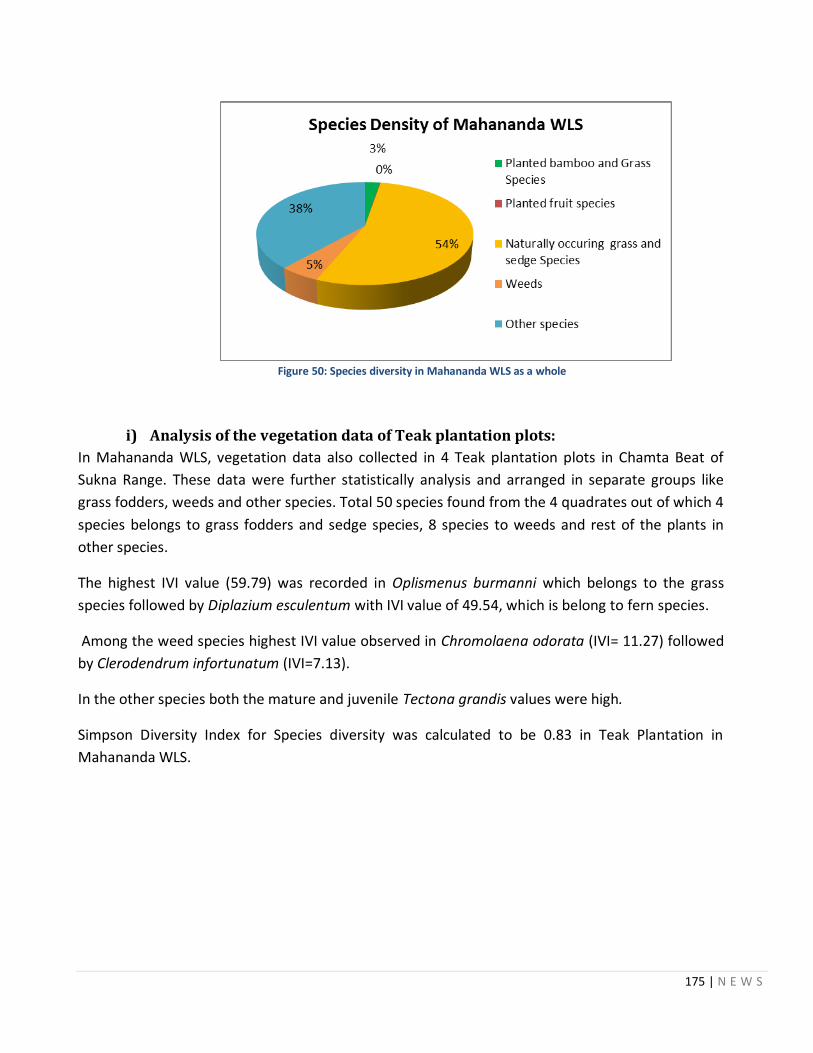
175 | N E W S
Figure 50: Species diversity in Mahananda WLS as a whole
i) Analysis of the vegetation data of Teak plantation plots:
In Mahananda WLS, vegetation data also collected in 4 Teak plantation plots in Chamta Beat of
Sukna Range. These data were further statistically analysis and arranged in separate groups like
grass fodders, weeds and other species. Total 50 species found from the 4 quadrates out of which 4
species belongs to grass fodders and sedge species, 8 species to weeds and rest of the plants in
other species.
The highest IVI value (59.79) was recorded in Oplismenus burmanni which belongs to the grass
species followed by Diplazium esculentum with IVI value of 49.54, which is belong to fern species.
Among the weed species highest IVI value observed in Chromolaena odorata (IVI= 11.27) followed
by Clerodendrum infortunatum (IVI=7.13).
In the other species both the mature and juvenile Tectona grandis values were high.
Simpson Diversity Index for Species diversity was calculated to be 0.83 in Teak Plantation in
Mahananda WLS.
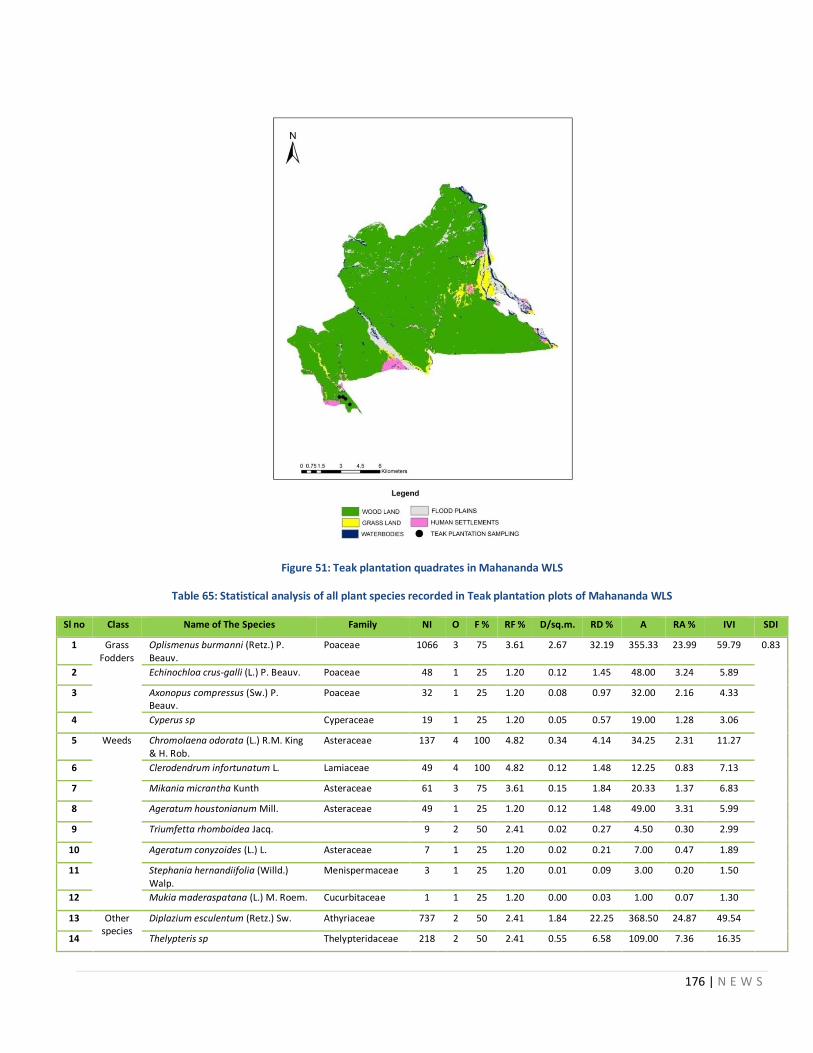
176 | N E W S
Figure 51: Teak plantation quadrates in Mahananda WLS
Table 65: Statistical analysis of all plant species recorded in Teak plantation plots of Mahananda WLS
Sl no Class Name of The Species Family NI O F % RF % D/sq.m. RD % A RA % IVI SDI
1 Grass Fodders
Oplismenus burmanni (Retz.) P. Beauv.
Poaceae 1066 3 75 3.61 2.67 32.19 355.33 23.99 59.79 0.83
2 Echinochloa crus-galli (L.) P. Beauv. Poaceae 48 1 25 1.20 0.12 1.45 48.00 3.24 5.89
3 Axonopus compressus (Sw.) P. Beauv.
Poaceae 32 1 25 1.20 0.08 0.97 32.00 2.16 4.33
4 Cyperus sp Cyperaceae 19 1 25 1.20 0.05 0.57 19.00 1.28 3.06
5 Weeds Chromolaena odorata (L.) R.M. King & H. Rob.
Asteraceae 137 4 100 4.82 0.34 4.14 34.25 2.31 11.27
6 Clerodendrum infortunatum L. Lamiaceae 49 4 100 4.82 0.12 1.48 12.25 0.83 7.13
7 Mikania micrantha Kunth Asteraceae 61 3 75 3.61 0.15 1.84 20.33 1.37 6.83
8 Ageratum houstonianum Mill. Asteraceae 49 1 25 1.20 0.12 1.48 49.00 3.31 5.99
9 Triumfetta rhomboidea Jacq. 9 2 50 2.41 0.02 0.27 4.50 0.30 2.99
10 Ageratum conyzoides (L.) L. Asteraceae 7 1 25 1.20 0.02 0.21 7.00 0.47 1.89
11 Stephania hernandiifolia (Willd.) Walp.
Menispermaceae 3 1 25 1.20 0.01 0.09 3.00 0.20 1.50
12 Mukia maderaspatana (L.) M. Roem. Cucurbitaceae 1 1 25 1.20 0.00 0.03 1.00 0.07 1.30
13 Other species
Diplazium esculentum (Retz.) Sw. Athyriaceae 737 2 50 2.41 1.84 22.25 368.50 24.87 49.54
14 Thelypteris sp Thelypteridaceae 218 2 50 2.41 0.55 6.58 109.00 7.36 16.35
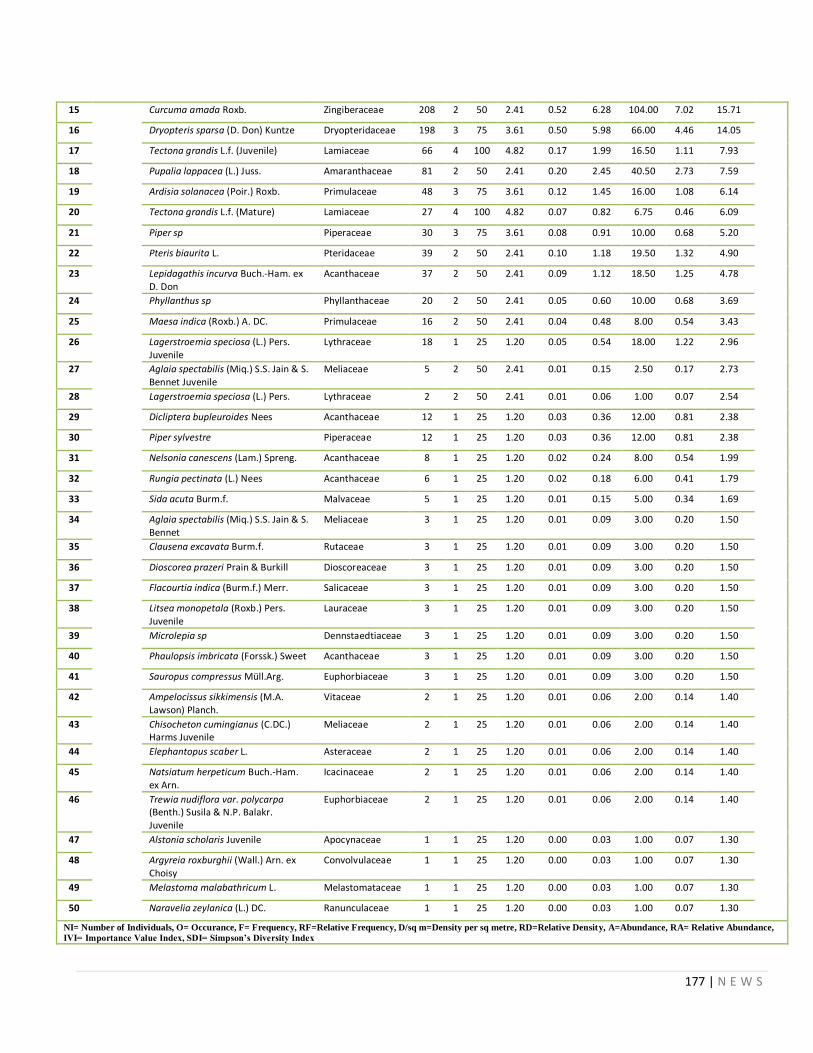
177 | N E W S
15 Curcuma amada Roxb. Zingiberaceae 208 2 50 2.41 0.52 6.28 104.00 7.02 15.71
16 Dryopteris sparsa (D. Don) Kuntze Dryopteridaceae 198 3 75 3.61 0.50 5.98 66.00 4.46 14.05
17 Tectona grandis L.f. (Juvenile) Lamiaceae 66 4 100 4.82 0.17 1.99 16.50 1.11 7.93
18 Pupalia lappacea (L.) Juss. Amaranthaceae 81 2 50 2.41 0.20 2.45 40.50 2.73 7.59
19 Ardisia solanacea (Poir.) Roxb. Primulaceae 48 3 75 3.61 0.12 1.45 16.00 1.08 6.14
20 Tectona grandis L.f. (Mature) Lamiaceae 27 4 100 4.82 0.07 0.82 6.75 0.46 6.09
21 Piper sp Piperaceae 30 3 75 3.61 0.08 0.91 10.00 0.68 5.20
22 Pteris biaurita L. Pteridaceae 39 2 50 2.41 0.10 1.18 19.50 1.32 4.90
23 Lepidagathis incurva Buch.-Ham. ex D. Don
Acanthaceae 37 2 50 2.41 0.09 1.12 18.50 1.25 4.78
24 Phyllanthus sp Phyllanthaceae 20 2 50 2.41 0.05 0.60 10.00 0.68 3.69
25 Maesa indica (Roxb.) A. DC. Primulaceae 16 2 50 2.41 0.04 0.48 8.00 0.54 3.43
26 Lagerstroemia speciosa (L.) Pers. Juvenile
Lythraceae 18 1 25 1.20 0.05 0.54 18.00 1.22 2.96
27 Aglaia spectabilis (Miq.) S.S. Jain & S. Bennet Juvenile
Meliaceae 5 2 50 2.41 0.01 0.15 2.50 0.17 2.73
28 Lagerstroemia speciosa (L.) Pers. Lythraceae 2 2 50 2.41 0.01 0.06 1.00 0.07 2.54
29 Dicliptera bupleuroides Nees Acanthaceae 12 1 25 1.20 0.03 0.36 12.00 0.81 2.38
30 Piper sylvestre Piperaceae 12 1 25 1.20 0.03 0.36 12.00 0.81 2.38
31 Nelsonia canescens (Lam.) Spreng. Acanthaceae 8 1 25 1.20 0.02 0.24 8.00 0.54 1.99
32 Rungia pectinata (L.) Nees Acanthaceae 6 1 25 1.20 0.02 0.18 6.00 0.41 1.79
33 Sida acuta Burm.f. Malvaceae 5 1 25 1.20 0.01 0.15 5.00 0.34 1.69
34 Aglaia spectabilis (Miq.) S.S. Jain & S. Bennet
Meliaceae 3 1 25 1.20 0.01 0.09 3.00 0.20 1.50
35 Clausena excavata Burm.f. Rutaceae 3 1 25 1.20 0.01 0.09 3.00 0.20 1.50
36 Dioscorea prazeri Prain & Burkill Dioscoreaceae 3 1 25 1.20 0.01 0.09 3.00 0.20 1.50
37 Flacourtia indica (Burm.f.) Merr. Salicaceae 3 1 25 1.20 0.01 0.09 3.00 0.20 1.50
38 Litsea monopetala (Roxb.) Pers. Juvenile
Lauraceae 3 1 25 1.20 0.01 0.09 3.00 0.20 1.50
39 Microlepia sp Dennstaedtiaceae 3 1 25 1.20 0.01 0.09 3.00 0.20 1.50
40 Phaulopsis imbricata (Forssk.) Sweet Acanthaceae 3 1 25 1.20 0.01 0.09 3.00 0.20 1.50
41 Sauropus compressus Müll.Arg. Euphorbiaceae 3 1 25 1.20 0.01 0.09 3.00 0.20 1.50
42 Ampelocissus sikkimensis (M.A. Lawson) Planch.
Vitaceae 2 1 25 1.20 0.01 0.06 2.00 0.14 1.40
43 Chisocheton cumingianus (C.DC.) Harms Juvenile
Meliaceae 2 1 25 1.20 0.01 0.06 2.00 0.14 1.40
44 Elephantopus scaber L. Asteraceae 2 1 25 1.20 0.01 0.06 2.00 0.14 1.40
45 Natsiatum herpeticum Buch.-Ham. ex Arn.
Icacinaceae 2 1 25 1.20 0.01 0.06 2.00 0.14 1.40
46 Trewia nudiflora var. polycarpa (Benth.) Susila & N.P. Balakr. Juvenile
Euphorbiaceae 2 1 25 1.20 0.01 0.06 2.00 0.14 1.40
47 Alstonia scholaris Juvenile Apocynaceae 1 1 25 1.20 0.00 0.03 1.00 0.07 1.30
48 Argyreia roxburghii (Wall.) Arn. ex Choisy
Convolvulaceae 1 1 25 1.20 0.00 0.03 1.00 0.07 1.30
49 Melastoma malabathricum L. Melastomataceae 1 1 25 1.20 0.00 0.03 1.00 0.07 1.30
50 Naravelia zeylanica (L.) DC. Ranunculaceae 1 1 25 1.20 0.00 0.03 1.00 0.07 1.30
NI= Number of Individuals, O= Occurance, F= Frequency, RF=Relative Frequency, D/sq m=Density per sq metre, RD=Relative Density, A=Abundance, RA= Relative Abundance,
IVI= Importance Value Index, SDI= Simpson’s Diversity Index
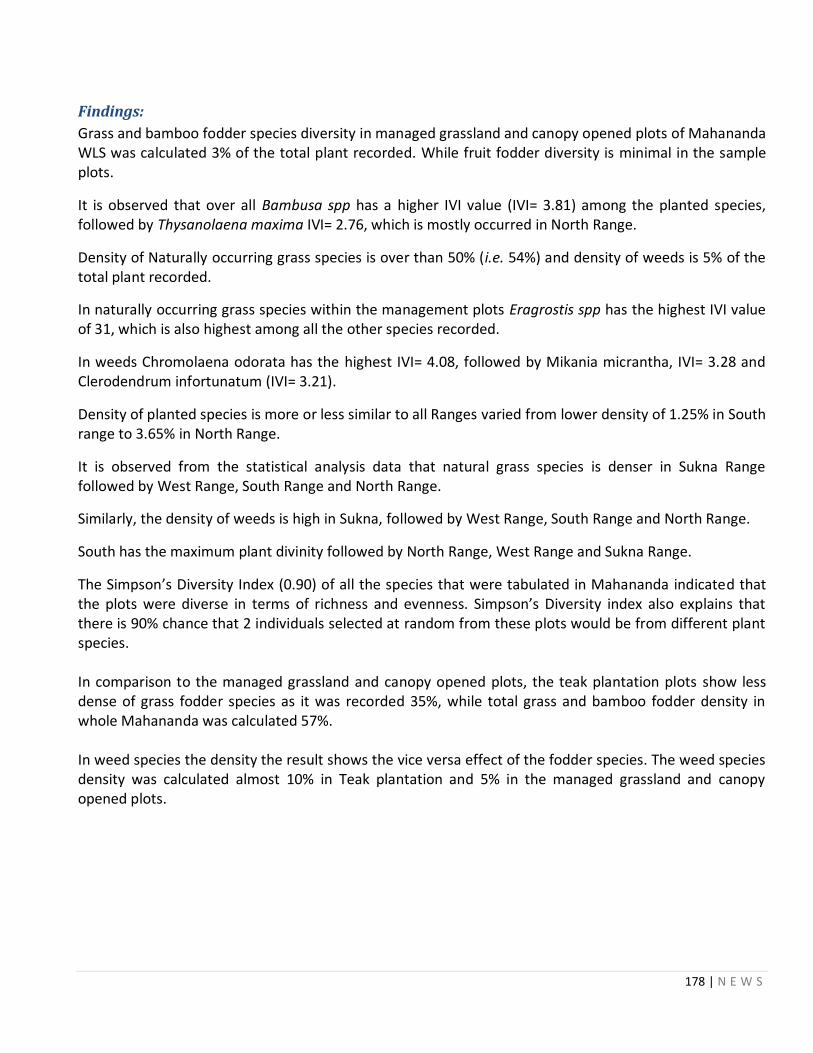
178 | N E W S
Findings:
Grass and bamboo fodder species diversity in managed grassland and canopy opened plots of Mahananda WLS was calculated 3% of the total plant recorded. While fruit fodder diversity is minimal in the sample plots.
It is observed that over all Bambusa spp has a higher IVI value (IVI= 3.81) among the planted species, followed by Thysanolaena maxima IVI= 2.76, which is mostly occurred in North Range.
Density of Naturally occurring grass species is over than 50% (i.e. 54%) and density of weeds is 5% of the total plant recorded.
In naturally occurring grass species within the management plots Eragrostis spp has the highest IVI value of 31, which is also highest among all the other species recorded.
In weeds Chromolaena odorata has the highest IVI= 4.08, followed by Mikania micrantha, IVI= 3.28 and Clerodendrum infortunatum (IVI= 3.21).
Density of planted species is more or less similar to all Ranges varied from lower density of 1.25% in South range to 3.65% in North Range.
It is observed from the statistical analysis data that natural grass species is denser in Sukna Range followed by West Range, South Range and North Range.
Similarly, the density of weeds is high in Sukna, followed by West Range, South Range and North Range.
South has the maximum plant divinity followed by North Range, West Range and Sukna Range.
The Simpson’s Diversity Index (0.90) of all the species that were tabulated in Mahananda indicated that the plots were diverse in terms of richness and evenness. Simpson’s Diversity index also explains that there is 90% chance that 2 individuals selected at random from these plots would be from different plant species. In comparison to the managed grassland and canopy opened plots, the teak plantation plots show less dense of grass fodder species as it was recorded 35%, while total grass and bamboo fodder density in whole Mahananda was calculated 57%. In weed species the density the result shows the vice versa effect of the fodder species. The weed species density was calculated almost 10% in Teak plantation and 5% in the managed grassland and canopy opened plots.
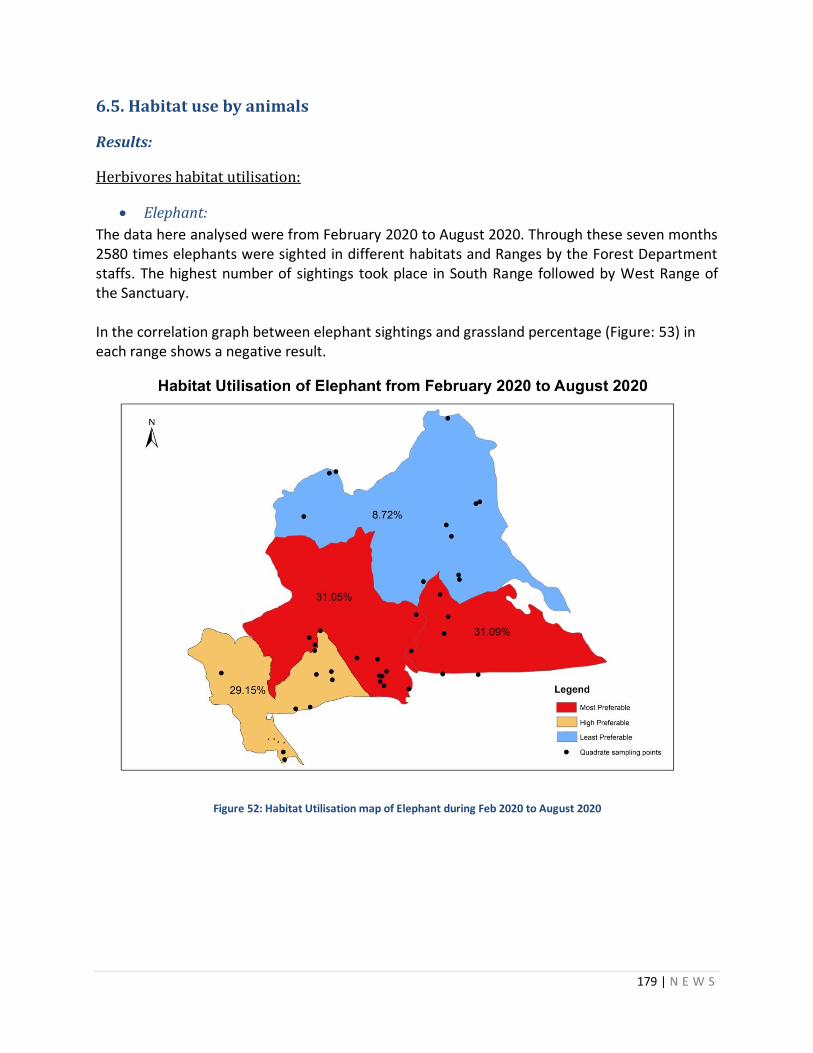
179 | N E W S
6.5. Habitat use by animals
Results:
Herbivores habitat utilisation:
Elephant:
The data here analysed were from February 2020 to August 2020. Through these seven months 2580 times elephants were sighted in different habitats and Ranges by the Forest Department staffs. The highest number of sightings took place in South Range followed by West Range of the Sanctuary. In the correlation graph between elephant sightings and grassland percentage (Figure: 53) in each range shows a negative result.
Figure 52: Habitat Utilisation map of Elephant during Feb 2020 to August 2020
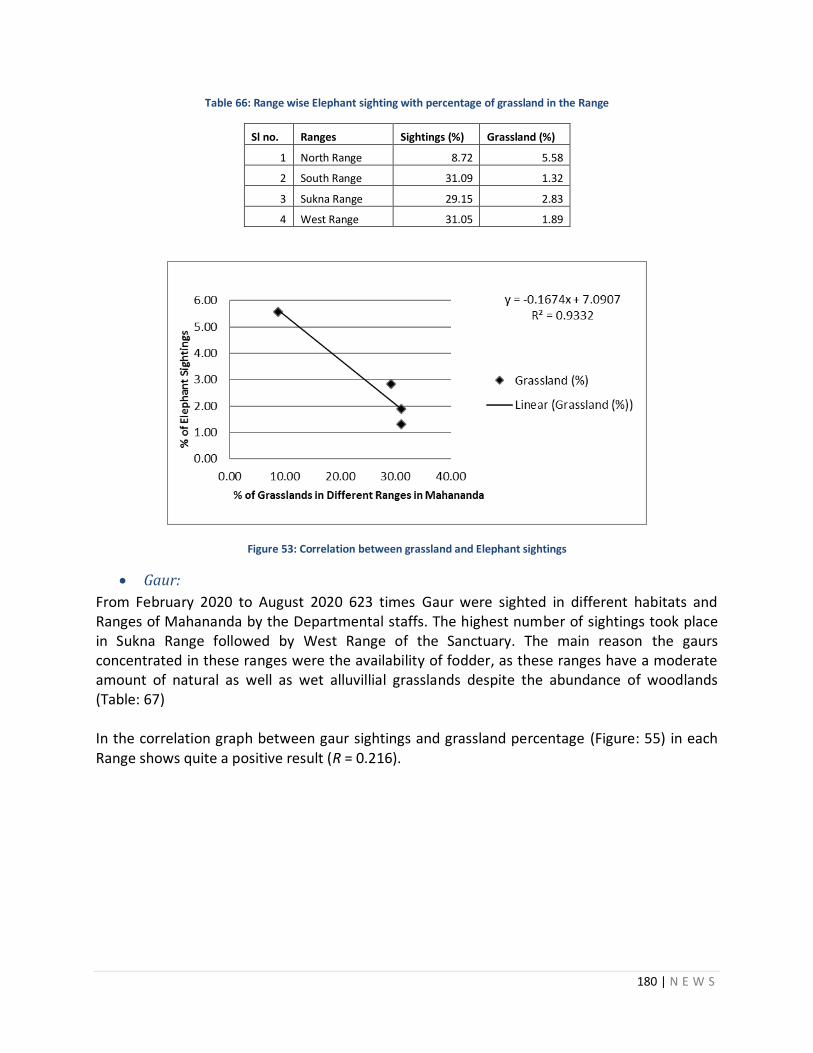
180 | N E W S
Table 66: Range wise Elephant sighting with percentage of grassland in the Range
Sl no. Ranges Sightings (%) Grassland (%)
1 North Range 8.72 5.58
2 South Range 31.09 1.32
3 Sukna Range 29.15 2.83
4 West Range 31.05 1.89
Figure 53: Correlation between grassland and Elephant sightings
Gaur:
From February 2020 to August 2020 623 times Gaur were sighted in different habitats and Ranges of Mahananda by the Departmental staffs. The highest number of sightings took place in Sukna Range followed by West Range of the Sanctuary. The main reason the gaurs concentrated in these ranges were the availability of fodder, as these ranges have a moderate amount of natural as well as wet alluvillial grasslands despite the abundance of woodlands (Table: 67) In the correlation graph between gaur sightings and grassland percentage (Figure: 55) in each Range shows quite a positive result (R = 0.216).
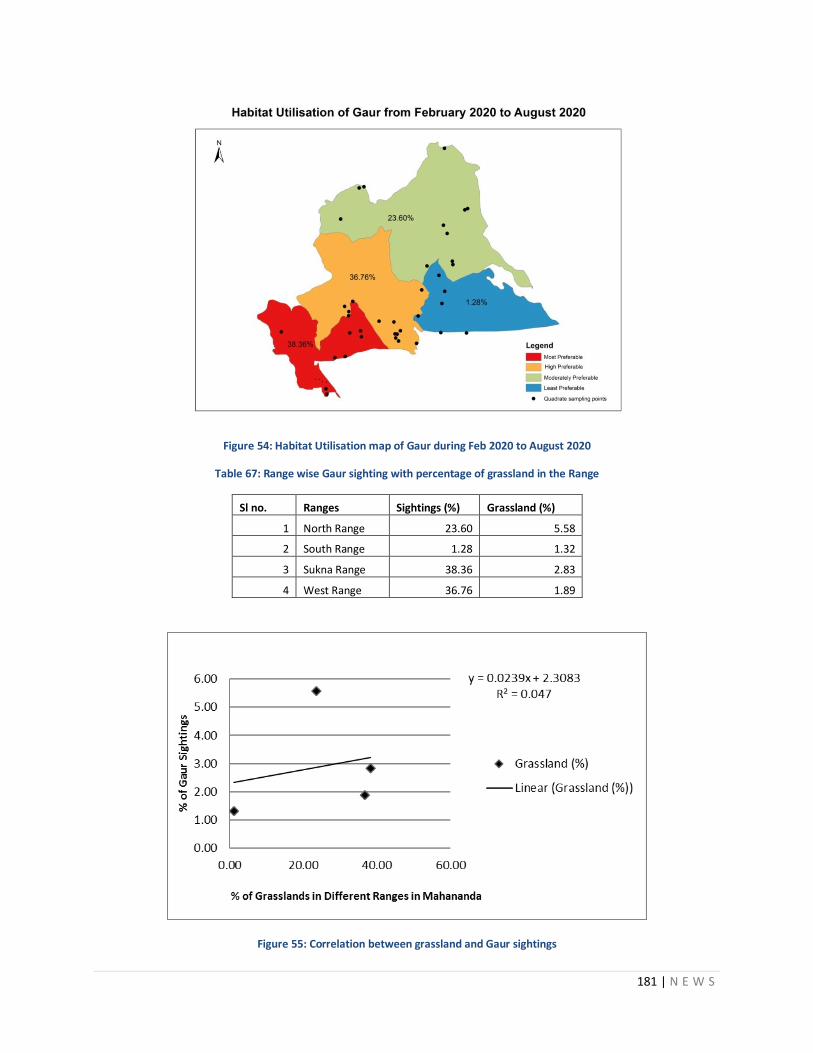
181 | N E W S
Figure 54: Habitat Utilisation map of Gaur during Feb 2020 to August 2020
Table 67: Range wise Gaur sighting with percentage of grassland in the Range
Sl no. Ranges Sightings (%) Grassland (%)
1 North Range 23.60 5.58
2 South Range 1.28 1.32
3 Sukna Range 38.36 2.83
4 West Range 36.76 1.89
Figure 55: Correlation between grassland and Gaur sightings
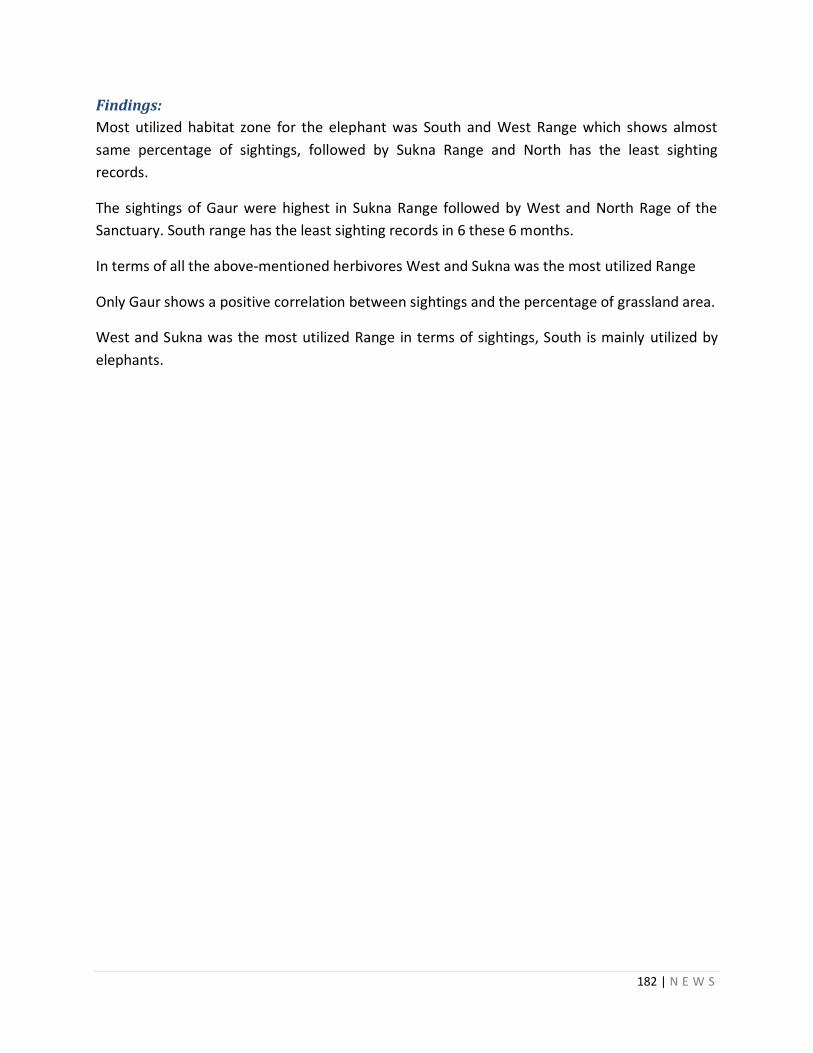
182 | N E W S
Findings:
Most utilized habitat zone for the elephant was South and West Range which shows almost
same percentage of sightings, followed by Sukna Range and North has the least sighting
records.
The sightings of Gaur were highest in Sukna Range followed by West and North Rage of the
Sanctuary. South range has the least sighting records in 6 these 6 months.
In terms of all the above-mentioned herbivores West and Sukna was the most utilized Range
Only Gaur shows a positive correlation between sightings and the percentage of grassland area.
West and Sukna was the most utilized Range in terms of sightings, South is mainly utilized by
elephants.
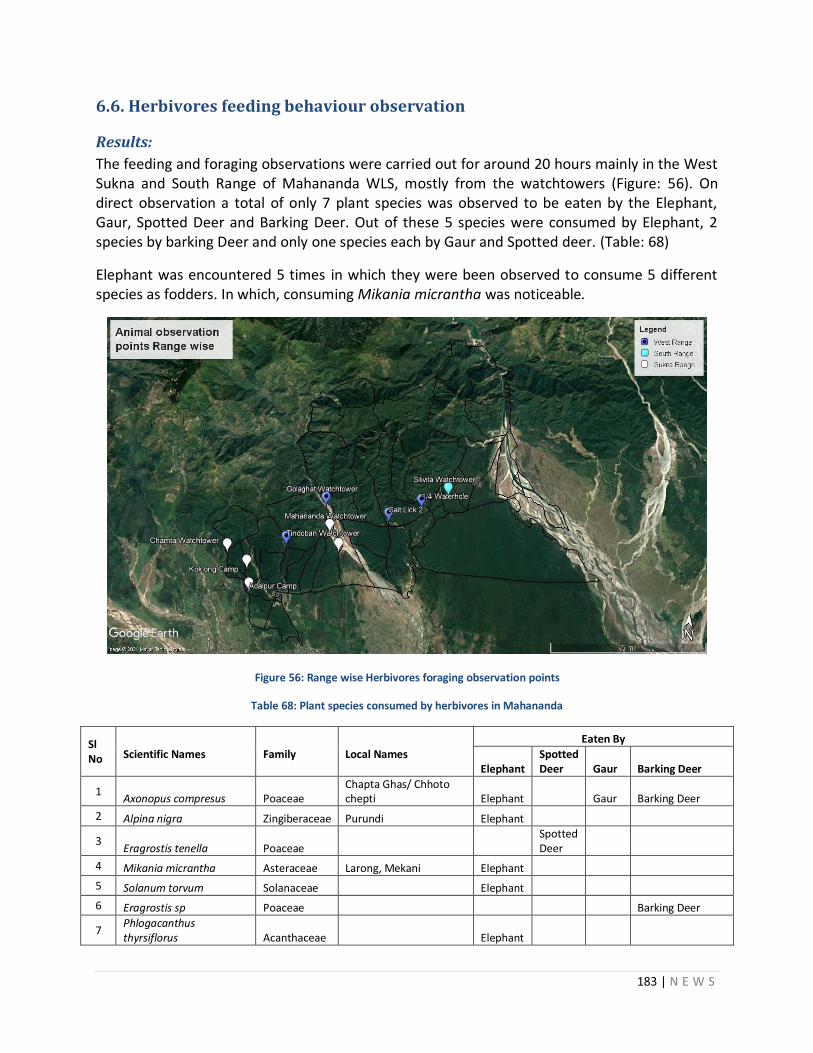
183 | N E W S
6.6. Herbivores feeding behaviour observation
Results:
The feeding and foraging observations were carried out for around 20 hours mainly in the West Sukna and South Range of Mahananda WLS, mostly from the watchtowers (Figure: 56). On direct observation a total of only 7 plant species was observed to be eaten by the Elephant, Gaur, Spotted Deer and Barking Deer. Out of these 5 species were consumed by Elephant, 2 species by barking Deer and only one species each by Gaur and Spotted deer. (Table: 68)
Elephant was encountered 5 times in which they were been observed to consume 5 different species as fodders. In which, consuming Mikania micrantha was noticeable.
Figure 56: Range wise Herbivores foraging observation points
Table 68: Plant species consumed by herbivores in Mahananda
Sl No Scientific Names
Family
Local Names
Eaten By
Elephant Spotted Deer Gaur Barking Deer
1 Axonopus compresus Poaceae
Chapta Ghas/ Chhoto chepti Elephant Gaur Barking Deer
2 Alpina nigra Zingiberaceae Purundi Elephant
3 Eragrostis tenella Poaceae
Spotted Deer
4 Mikania micrantha Asteraceae Larong, Mekani Elephant
5 Solanum torvum Solanaceae Elephant
6 Eragrostis sp Poaceae Barking Deer
7 Phlogacanthus thyrsiflorus Acanthaceae Elephant
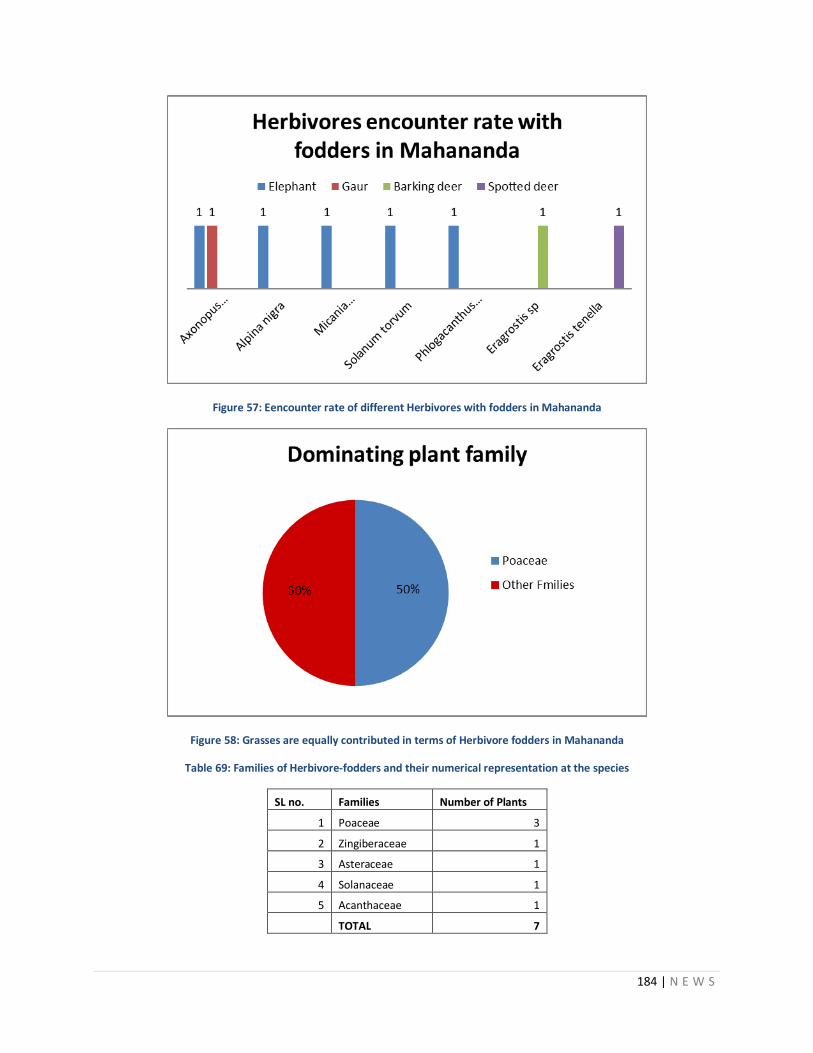
184 | N E W S
Figure 57: Eencounter rate of different Herbivores with fodders in Mahananda
Figure 58: Grasses are equally contributed in terms of Herbivore fodders in Mahananda
Table 69: Families of Herbivore-fodders and their numerical representation at the species
SL no. Families Number of Plants
1 Poaceae 3
2 Zingiberaceae 1
3 Asteraceae 1
4 Solanaceae 1
5 Acanthaceae 1
TOTAL 7
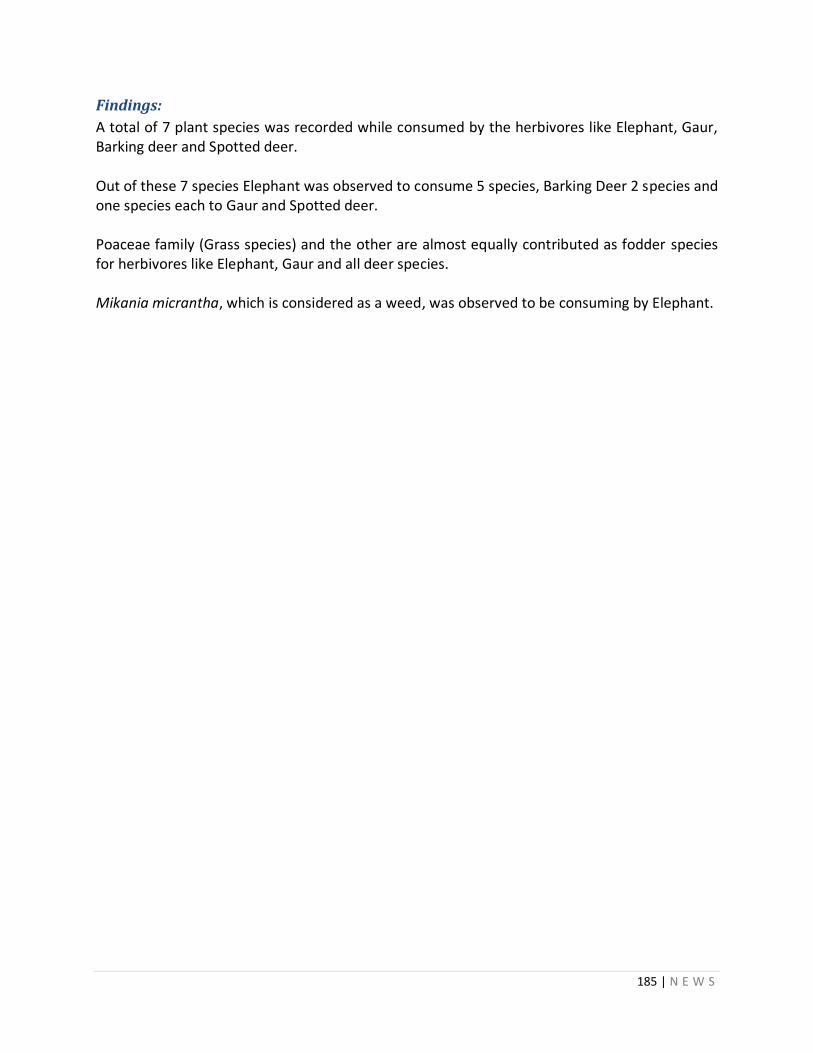
185 | N E W S
Findings:
A total of 7 plant species was recorded while consumed by the herbivores like Elephant, Gaur, Barking deer and Spotted deer. Out of these 7 species Elephant was observed to consume 5 species, Barking Deer 2 species and one species each to Gaur and Spotted deer. Poaceae family (Grass species) and the other are almost equally contributed as fodder species for herbivores like Elephant, Gaur and all deer species. Mikania micrantha, which is considered as a weed, was observed to be consuming by Elephant.
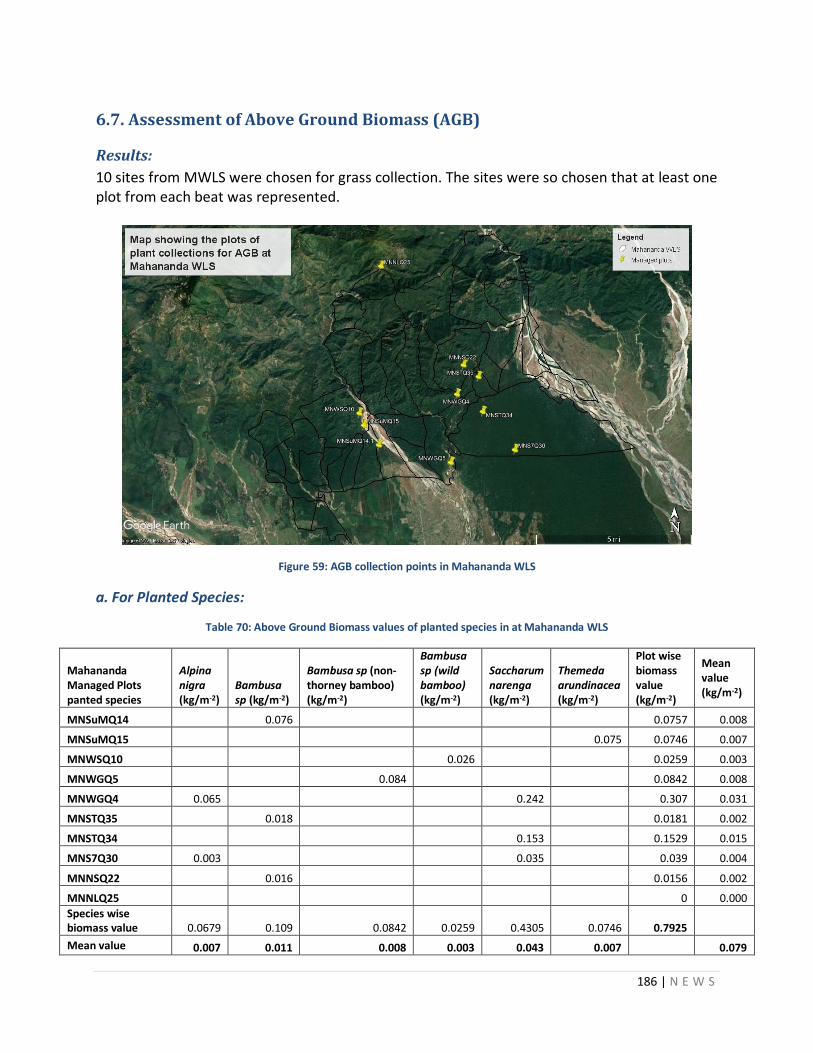
186 | N E W S
6.7. Assessment of Above Ground Biomass (AGB)
Results:
10 sites from MWLS were chosen for grass collection. The sites were so chosen that at least one plot from each beat was represented.
Figure 59: AGB collection points in Mahananda WLS
a. For Planted Species:
Table 70: Above Ground Biomass values of planted species in at Mahananda WLS
Mahananda Managed Plots panted species
Alpina nigra (kg/m-2)
Bambusa sp (kg/m-2)
Bambusa sp (non-thorney bamboo) (kg/m-2)
Bambusa sp (wild bamboo) (kg/m-2)
Saccharum narenga (kg/m-2)
Themeda arundinacea (kg/m-2)
Plot wise biomass value (kg/m-2)
Mean value (kg/m-2)
MNSuMQ14 0.076 0.0757 0.008
MNSuMQ15 0.075 0.0746 0.007
MNWSQ10 0.026 0.0259 0.003
MNWGQ5 0.084 0.0842 0.008
MNWGQ4 0.065 0.242 0.307 0.031
MNSTQ35 0.018 0.0181 0.002
MNSTQ34 0.153 0.1529 0.015
MNS7Q30 0.003 0.035 0.039 0.004
MNNSQ22 0.016 0.0156 0.002
MNNLQ25 0 0.000
Species wise biomass value 0.0679 0.109 0.0842 0.0259 0.4305 0.0746 0.7925
Mean value 0.007 0.011 0.008 0.003 0.043 0.007 0.079
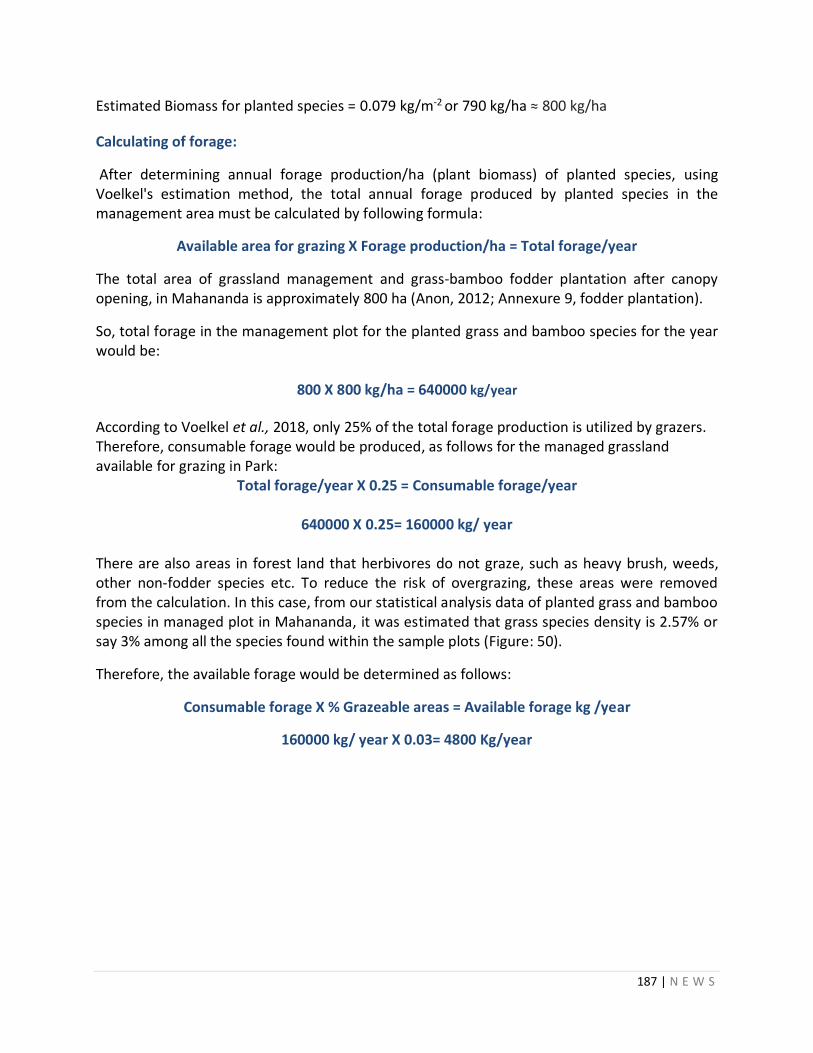
187 | N E W S
Estimated Biomass for planted species = 0.079 kg/m-2 or 790 kg/ha ≈ 800 kg/ha
Calculating of forage:
After determining annual forage production/ha (plant biomass) of planted species, using Voelkel's estimation method, the total annual forage produced by planted species in the management area must be calculated by following formula:
Available area for grazing X Forage production/ha = Total forage/year
The total area of grassland management and grass-bamboo fodder plantation after canopy opening, in Mahananda is approximately 800 ha (Anon, 2012; Annexure 9, fodder plantation).
So, total forage in the management plot for the planted grass and bamboo species for the year would be:
800 X 800 kg/ha = 640000 kg/year
According to Voelkel et al., 2018, only 25% of the total forage production is utilized by grazers. Therefore, consumable forage would be produced, as follows for the managed grassland available for grazing in Park:
Total forage/year X 0.25 = Consumable forage/year
640000 X 0.25= 160000 kg/ year
There are also areas in forest land that herbivores do not graze, such as heavy brush, weeds, other non-fodder species etc. To reduce the risk of overgrazing, these areas were removed from the calculation. In this case, from our statistical analysis data of planted grass and bamboo species in managed plot in Mahananda, it was estimated that grass species density is 2.57% or say 3% among all the species found within the sample plots (Figure: 50).
Therefore, the available forage would be determined as follows:
Consumable forage X % Grazeable areas = Available forage kg /year
160000 kg/ year X 0.03= 4800 Kg/year
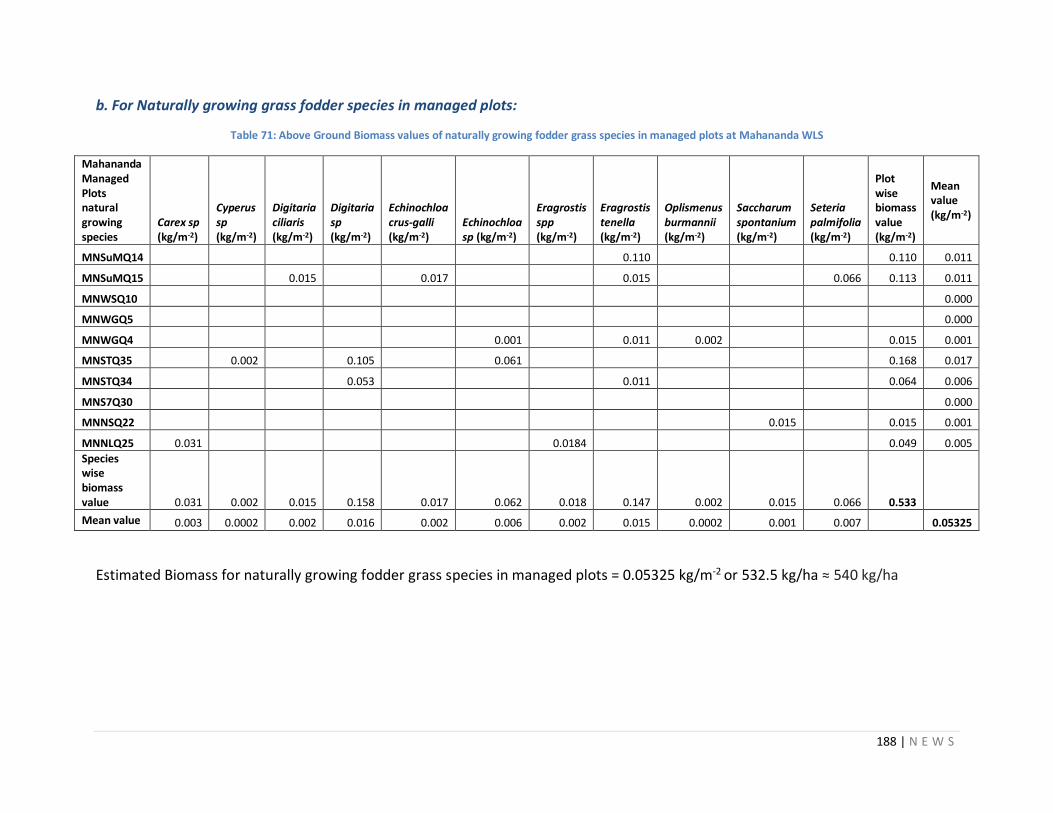
188 | N E W S
b. For Naturally growing grass fodder species in managed plots:
Table 71: Above Ground Biomass values of naturally growing fodder grass species in managed plots at Mahananda WLS
Mahananda Managed Plots natural growing species
Carex sp (kg/m-2)
Cyperus sp (kg/m-2)
Digitaria ciliaris (kg/m-2)
Digitaria sp (kg/m-2)
Echinochloa crus-galli (kg/m-2)
Echinochloa sp (kg/m-2)
Eragrostis spp (kg/m-2)
Eragrostis tenella (kg/m-2)
Oplismenus burmannii (kg/m-2)
Saccharum spontanium (kg/m-2)
Seteria palmifolia (kg/m-2)
Plot wise biomass value (kg/m-2)
Mean value (kg/m-2)
MNSuMQ14 0.110 0.110 0.011
MNSuMQ15 0.015 0.017 0.015 0.066 0.113 0.011
MNWSQ10 0.000
MNWGQ5 0.000
MNWGQ4 0.001 0.011 0.002 0.015 0.001
MNSTQ35 0.002 0.105 0.061 0.168 0.017
MNSTQ34 0.053 0.011 0.064 0.006
MNS7Q30 0.000
MNNSQ22 0.015 0.015 0.001
MNNLQ25 0.031 0.0184 0.049 0.005
Species wise biomass value 0.031 0.002 0.015 0.158 0.017 0.062 0.018 0.147 0.002 0.015 0.066 0.533
Mean value 0.003 0.0002 0.002 0.016 0.002 0.006 0.002 0.015 0.0002 0.001 0.007 0.05325
Estimated Biomass for naturally growing fodder grass species in managed plots = 0.05325 kg/m-2 or 532.5 kg/ha ≈ 540 kg/ha
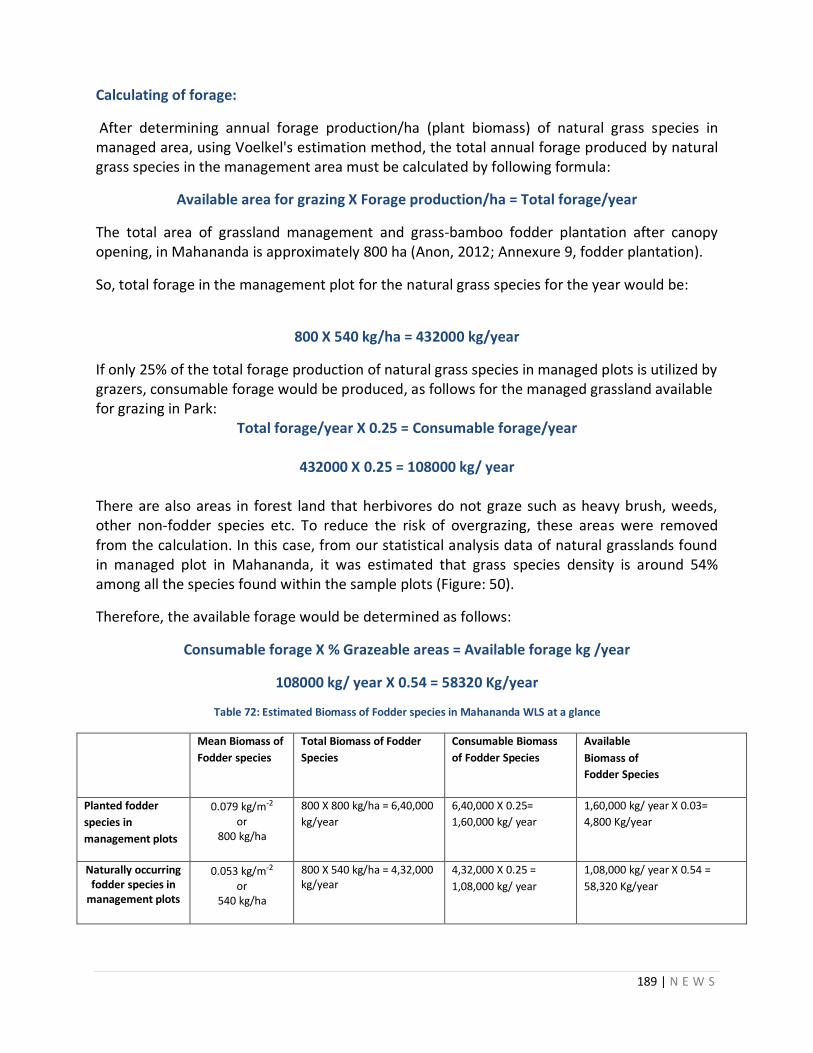
189 | N E W S
Calculating of forage:
After determining annual forage production/ha (plant biomass) of natural grass species in managed area, using Voelkel's estimation method, the total annual forage produced by natural grass species in the management area must be calculated by following formula:
Available area for grazing X Forage production/ha = Total forage/year
The total area of grassland management and grass-bamboo fodder plantation after canopy opening, in Mahananda is approximately 800 ha (Anon, 2012; Annexure 9, fodder plantation).
So, total forage in the management plot for the natural grass species for the year would be:
800 X 540 kg/ha = 432000 kg/year
If only 25% of the total forage production of natural grass species in managed plots is utilized by grazers, consumable forage would be produced, as follows for the managed grassland available for grazing in Park:
Total forage/year X 0.25 = Consumable forage/year
432000 X 0.25 = 108000 kg/ year
There are also areas in forest land that herbivores do not graze such as heavy brush, weeds, other non-fodder species etc. To reduce the risk of overgrazing, these areas were removed from the calculation. In this case, from our statistical analysis data of natural grasslands found in managed plot in Mahananda, it was estimated that grass species density is around 54% among all the species found within the sample plots (Figure: 50).
Therefore, the available forage would be determined as follows:
Consumable forage X % Grazeable areas = Available forage kg /year
108000 kg/ year X 0.54 = 58320 Kg/year
Table 72: Estimated Biomass of Fodder species in Mahananda WLS at a glance
Mean Biomass of
Fodder species
Total Biomass of Fodder
Species
Consumable Biomass
of Fodder Species
Available
Biomass of
Fodder Species
Planted fodder
species in
management plots
0.079 kg/m-2 or
800 kg/ha
800 X 800 kg/ha = 6,40,000
kg/year
6,40,000 X 0.25=
1,60,000 kg/ year
1,60,000 kg/ year X 0.03=
4,800 Kg/year
Naturally occurring fodder species in
management plots
0.053 kg/m-2 or
540 kg/ha
800 X 540 kg/ha = 4,32,000 kg/year
4,32,000 X 0.25 =
1,08,000 kg/ year
1,08,000 kg/ year X 0.54 =
58,320 Kg/year
190 | N E W S
Findings:
Dhadda (Sachhrum narenga) shows the highest productivity of 0.043 kg/sq m or 430 kg/ ha in Managed plots. While, among the naturally growing grass fodder species in managed plot Digitaria sp. shows the highest productivity (0.016 kg/sq m or 160 kg/ ha).
The maximum estimated mean Biomass (800kg/ha) comprised of the Planted Fodder Species planted by the Forest Department in the management plots. The least Biomass (540 kg/ha) occurred among the Naturally occurring Fodder Species, which were not planted, in the management plots. This trend was seen also in the total Biomass of the Fodder Species as well as in Consumable Biomass of Fodder Species. However, when the percentage of the Fodder Species as recorded in the quantitative and qualitative sampling results in each case were tabulated with the Biomass of the Consumable Fodder Species to obtain the Available Biomass, it was seen that the highest Biomass of 58,320 kg/year occurred in the Naturally occurring Fodder Species, which were not planted, in the management plots, followed by the Biomass (4,800 kg/year) of Planted Fodder Species in management plots. In fact, the Available Biomass of the Naturally occurring Fodder Species, which were not planted, in the management plots was nearly 10 times that of the Planted Fodder Species planted by the Forest Department in the management plots.
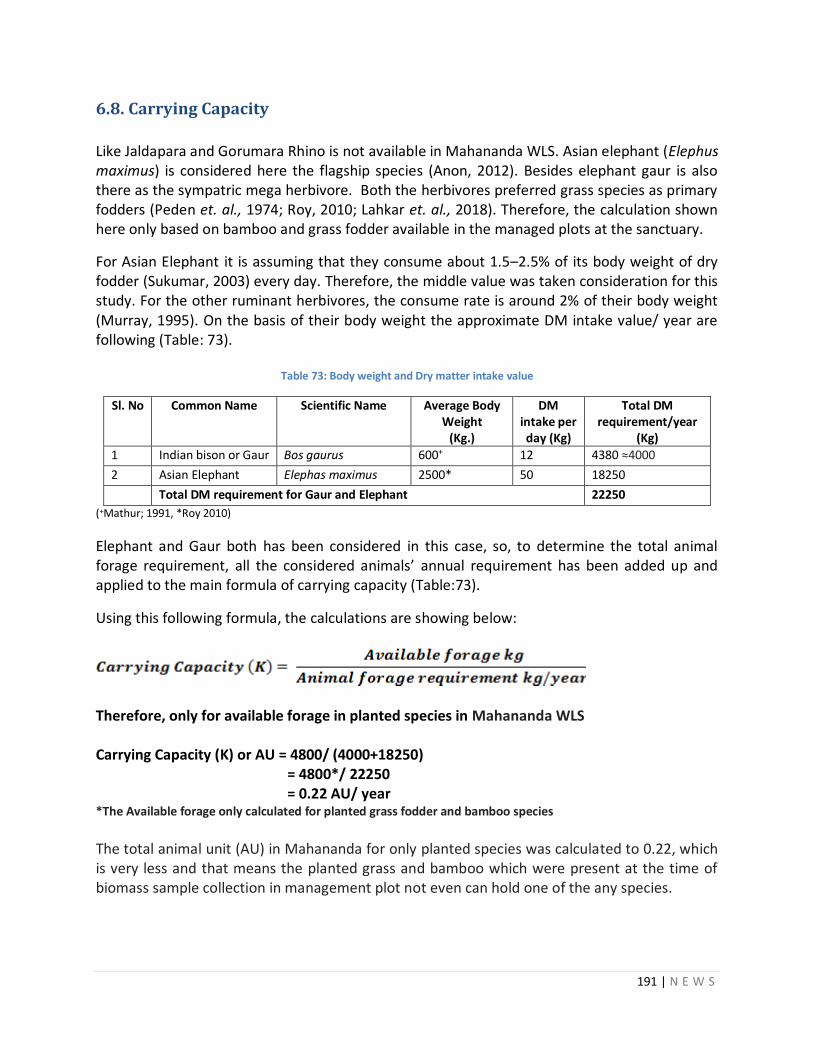
191 | N E W S
6.8. Carrying Capacity
Like Jaldapara and Gorumara Rhino is not available in Mahananda WLS. Asian elephant (Elephus maximus) is considered here the flagship species (Anon, 2012). Besides elephant gaur is also there as the sympatric mega herbivore. Both the herbivores preferred grass species as primary fodders (Peden et. al., 1974; Roy, 2010; Lahkar et. al., 2018). Therefore, the calculation shown here only based on bamboo and grass fodder available in the managed plots at the sanctuary.
For Asian Elephant it is assuming that they consume about 1.5–2.5% of its body weight of dry fodder (Sukumar, 2003) every day. Therefore, the middle value was taken consideration for this study. For the other ruminant herbivores, the consume rate is around 2% of their body weight (Murray, 1995). On the basis of their body weight the approximate DM intake value/ year are following (Table: 73).
Table 73: Body weight and Dry matter intake value
Sl. No Common Name Scientific Name Average Body Weight
(Kg.)
DM intake per day (Kg)
Total DM requirement/year
(Kg)
1 Indian bison or Gaur Bos gaurus 600+ 12 4380 ≈4000
2 Asian Elephant Elephas maximus 2500* 50 18250
Total DM requirement for Gaur and Elephant 22250
(+Mathur; 1991, *Roy 2010)
Elephant and Gaur both has been considered in this case, so, to determine the total animal forage requirement, all the considered animals’ annual requirement has been added up and applied to the main formula of carrying capacity (Table:73).
Using this following formula, the calculations are showing below:
Therefore, only for available forage in planted species in Mahananda WLS Carrying Capacity (K) or AU = 4800/ (4000+18250) = 4800*/ 22250 = 0.22 AU/ year *The Available forage only calculated for planted grass fodder and bamboo species
The total animal unit (AU) in Mahananda for only planted species was calculated to 0.22, which is very less and that means the planted grass and bamboo which were present at the time of biomass sample collection in management plot not even can hold one of the any species.
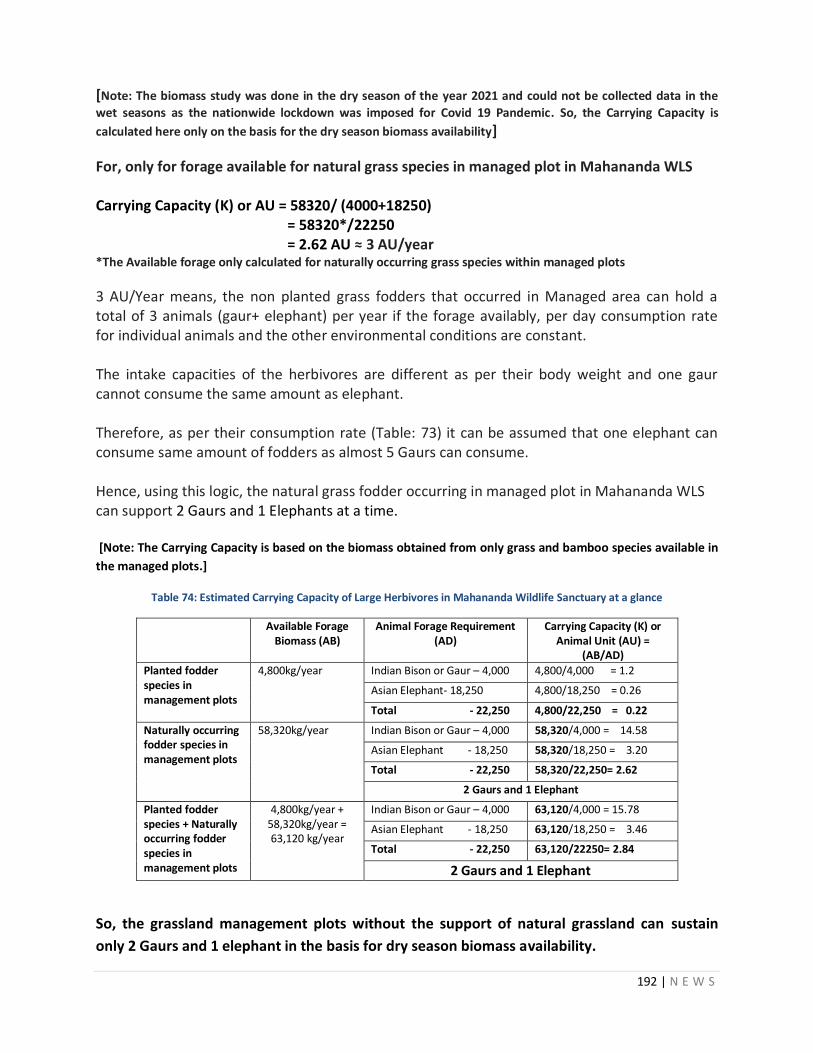
192 | N E W S
[Note: The biomass study was done in the dry season of the year 2021 and could not be collected data in the
wet seasons as the nationwide lockdown was imposed for Covid 19 Pandemic. So, the Carrying Capacity is
calculated here only on the basis for the dry season biomass availability]
For, only for forage available for natural grass species in managed plot in Mahananda WLS Carrying Capacity (K) or AU = 58320/ (4000+18250) = 58320*/22250 = 2.62 AU ≈ 3 AU/year *The Available forage only calculated for naturally occurring grass species within managed plots
3 AU/Year means, the non planted grass fodders that occurred in Managed area can hold a total of 3 animals (gaur+ elephant) per year if the forage availably, per day consumption rate for individual animals and the other environmental conditions are constant. The intake capacities of the herbivores are different as per their body weight and one gaur cannot consume the same amount as elephant. Therefore, as per their consumption rate (Table: 73) it can be assumed that one elephant can consume same amount of fodders as almost 5 Gaurs can consume. Hence, using this logic, the natural grass fodder occurring in managed plot in Mahananda WLS can support 2 Gaurs and 1 Elephants at a time. [Note: The Carrying Capacity is based on the biomass obtained from only grass and bamboo species available in
the managed plots.]
Table 74: Estimated Carrying Capacity of Large Herbivores in Mahananda Wildlife Sanctuary at a glance
Available Forage Biomass (AB)
Animal Forage Requirement (AD)
Carrying Capacity (K) or Animal Unit (AU) =
(AB/AD)
Planted fodder species in management plots
4,800kg/year Indian Bison or Gaur – 4,000 4,800/4,000 = 1.2
Asian Elephant- 18,250 4,800/18,250 = 0.26
Total - 22,250 4,800/22,250 = 0.22
Naturally occurring fodder species in management plots
58,320kg/year Indian Bison or Gaur – 4,000 58,320/4,000 = 14.58
Asian Elephant - 18,250 58,320/18,250 = 3.20
Total - 22,250 58,320/22,250= 2.62
2 Gaurs and 1 Elephant
Planted fodder species + Naturally occurring fodder species in management plots
4,800kg/year + 58,320kg/year = 63,120 kg/year
Indian Bison or Gaur – 4,000 63,120/4,000 = 15.78
Asian Elephant - 18,250 63,120/18,250 = 3.46
Total - 22,250 63,120/22250= 2.84
2 Gaurs and 1 Elephant
So, the grassland management plots without the support of natural grassland can sustain
only 2 Gaurs and 1 elephant in the basis for dry season biomass availability.
193 | N E W S
6.9. Discussion:
Grass and bamboo fodder species diversity in canopy opened plots of Mahananda WLS was calculated to be 3% of the total plants recorded. While fruit fodder diversity is minimal in the sample plots. In comparison to the canopy opened plots, the teak plantation plots show less dense of grass fodder species as it recorded only 35%, while total grass and bamboo fodder density in whole of Mahananda was calculated to be 57%.
Among the weeds Chromolaena odorata, Mikania micrantha, and Clerodendrum infortunatum were denser than others. The weed species density was calculated to be almost 10% in Teak plantation and 5% in the canopy opened plots, where it was seen that the density of these vice versa of the fodder species.
Of the two major herbivores in Mahananda only Gaur shows a positive correlation between
sightings and the percentage of grassland area.
A total of 7 plant species was recorded as consumed by the herbivores like the Elephant, Gaur, Barking deer and Spotted deer. Unlike Jaldapara and Gorumara direct observation of animals feeding was very difficult in Mahananda, because it does not have any open area. So, the findings may not be accurate in the terms of the percentage of the consumed plant species.
Among the planted species Dhadda (Sachhrum narenga) shows the highest productivity of 0.043 kg/sq m or 430 kg/ ha in Managed plots, while natural growing grass fodder species Digitaria sp. shows the highest productivity (0.016 kg/sq m or 160 kg/ ha).
The biomass of the planted species of grass fodder in the managed plots of Mahananda WLS
was seen not to support any animal by its own, but with the naturally growing grass fodder
species present in the managed plots it is seen to support 1 elephant and 2 gaurs on the basis
of biomass in the dry season as per our findings.
194 | N E W S
7. General Discussion and Suggestions The research findings presented in this report was conducted with the degree of skill and care consistent with customarily accepted good practices and procedures, which were applicable at the time and place of this study.
Conclusions and recommendations require the balance of diverse scientific, regulatory, economic, and other criteria. The suggestions presented are based on an assessment of conditions existing on the dates of the field reconnaissance and on readily available Forest Department data (records, reports and staff interviews) from all the three Protected Areas (JNP, GNP and MWLS), and may undergo revision as additional data are obtained and conducted over a period of time covering all the seasons.
Adaptive Management
Usually, Wildlife Management suffers from a lack of strong theoretical under-pinning. However, even where there is a good understanding of ecological processes, there are differences between sites and environmental fluctuations over time that makes predictions difficult, if not impossible. Under these conditions, a blueprint approach cannot work and adaptive management is the only option. Adaptive Management is a learning-based management approach that is used to reduce scientific uncertainty.
The advantages of the Adaptive Management approach are that 1) It enables timely intervention when a situation is fast-changing, 2) results of monitoring will provide an understanding of the system and 3) an Adaptive approach homes in on the objective with very little chance of a hit-or-miss situation.
Furthermore, we know that conditions change over time in any context -something we experience in the governance of any living being. Just as there is no universal prescription for good governance, one should not presume to impose such conditions on managers of renewable natural resources. Ecologists, conservation biologists and wildlife managers now recognize the need to manage multiple species simultaneously, or even entire communities, rather than just individual species. The appropriate scale of management is often large, requiring the spatial subdivision of management units. In addition, more researchers have acknowledged the importance of Adaptive approaches to management, and the application of multiple working hypotheses in the resolution of management uncertainty.
A common objective that motivates the management of wildlife resources is the optimal utilization by one or more animal populations, and this means of deriving an optimal" management strategy, based on the best current information. The study system need not be subjected to management mistakes incurred while reinforcement learning takes place; this is clearly advantageous for natural resource applications.
Grassland (Fodder species)
Historically, traditional grassland management promoted homogeneity-based approaches, simplifying ecosystem structure, and uniform disturbances across the landscape (Fuhlendorf
195 | N E W S
and Engle, 2001, 2004). Restoration of habitat heterogeneity continues to be a major challenge and critical need for wildlife conservation in grasslands (Johnson and others, 2011; Fuhlendorf and others, 2017). A heterogeneity-based approach to grassland management has not been well studied.
This is all the more true for grassland conservation, where a variety of grassland conditions will be required; that is, no single grassland habitat type or alternative management approach will be adequate to conserve the entire suite of grassland herbivores in a particular area (McCracken, 2005; Ribic and others, 2009).
Cover and abundance were estimated for grasses, shrubs, herbs, and sedges. Data collection in grasslands was carried out in the pre- and post-monsoon season i.e. December, 2018 and October, 2019.
Data was collected from 37 management plots and from five natural grassland (unmanaged) plots in Jaldapara and from 31 management plots and three natural grassland (unmanaged) plots in Gorumara NP. In Mahananda no open grasslands were there as other NPs, so the Forest Department resorted to canopy openings. For our present study Canopy opened plots were chosen and since open grasslands were not available no comparison could be made on the findings from such Canopy opened areas with areas outside these.
Our findings clearly indicate that Dhadda is not a good species to be planted in the management plots. This has also been reflected in the latest Management Plan of Jaldapara NP where they have suggested only 50% of Dhadda be considered for plantation. We would like to go a little further in that our suggestion would be to plant only 10% of Dhadda and over the next couple of years after a rapid analysis to remove the species from the plantation list. There is enough Dhadda available in the open unmanaged grasslands to be sustainable by itself. Moreover, over the years as per the plantation journals it is seen that the older plantations are left and mostly not tender and in addition occupying space where other fodder can be planted or can grow on their own as is seen in the present study. Dhadda grows vigorously and naturally, suppressing the growth of other species (Ghosh and Das, 2007).
Our suggestion for new plantations and for replanting in earlier management plots would be to take into consideration the following species that are already listed for plantation by the Forest Department like Chepti (Themeda arundinacea), Purundi (Alpinia nigra), Malsa (Saccharum longisetosum var. longisetosum) and Madhua (Saccharum arundinaceum), the last two being among the most preferred fodder of the large ungulates which can be planted @ 50%. In addition, as per our present findings species that are growing naturally in the management plots which are also fodder species [Thach/Son (Imperata cylindrica), Kasia (Saccharum spontaneum), Choto chepti/Chapta (Axonopus compresus) and Nol (Arundo donax)] be considered for planting along with those earlier planted and see the effect over the next two years. In addition, Digitaria sp. and other Bamboo sp. may be added in the list of species to be planted in Mahananda as both grass and bamboo fodder species accounted for nearly 60% of the fodder species in the canopy opened plots. Along with all these species only 10% of Dhadda may be considered for planting. Monitoring the effects regularly would help in putting forward a prescription based on the lessons learnt.
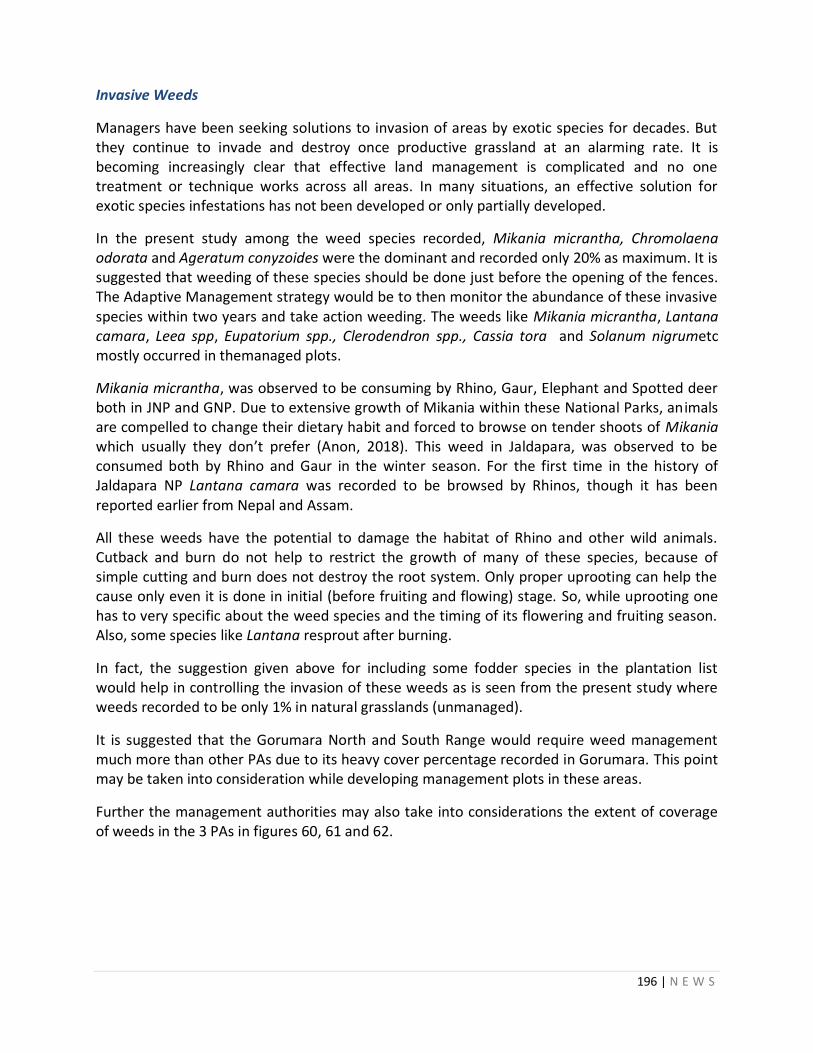
196 | N E W S
Invasive Weeds
Managers have been seeking solutions to invasion of areas by exotic species for decades. But they continue to invade and destroy once productive grassland at an alarming rate. It is becoming increasingly clear that effective land management is complicated and no one treatment or technique works across all areas. In many situations, an effective solution for exotic species infestations has not been developed or only partially developed.
In the present study among the weed species recorded, Mikania micrantha, Chromolaena odorata and Ageratum conyzoides were the dominant and recorded only 20% as maximum. It is suggested that weeding of these species should be done just before the opening of the fences. The Adaptive Management strategy would be to then monitor the abundance of these invasive species within two years and take action weeding. The weeds like Mikania micrantha, Lantana camara, Leea spp, Eupatorium spp., Clerodendron spp., Cassia tora and Solanum nigrumetc mostly occurred in themanaged plots.
Mikania micrantha, was observed to be consuming by Rhino, Gaur, Elephant and Spotted deer both in JNP and GNP. Due to extensive growth of Mikania within these National Parks, animals are compelled to change their dietary habit and forced to browse on tender shoots of Mikania which usually they don’t prefer (Anon, 2018). This weed in Jaldapara, was observed to be consumed both by Rhino and Gaur in the winter season. For the first time in the history of Jaldapara NP Lantana camara was recorded to be browsed by Rhinos, though it has been reported earlier from Nepal and Assam.
All these weeds have the potential to damage the habitat of Rhino and other wild animals. Cutback and burn do not help to restrict the growth of many of these species, because of simple cutting and burn does not destroy the root system. Only proper uprooting can help the cause only even it is done in initial (before fruiting and flowing) stage. So, while uprooting one has to very specific about the weed species and the timing of its flowering and fruiting season. Also, some species like Lantana resprout after burning.
In fact, the suggestion given above for including some fodder species in the plantation list would help in controlling the invasion of these weeds as is seen from the present study where weeds recorded to be only 1% in natural grasslands (unmanaged).
It is suggested that the Gorumara North and South Range would require weed management much more than other PAs due to its heavy cover percentage recorded in Gorumara. This point may be taken into consideration while developing management plots in these areas.
Further the management authorities may also take into considerations the extent of coverage of weeds in the 3 PAs in figures 60, 61 and 62.
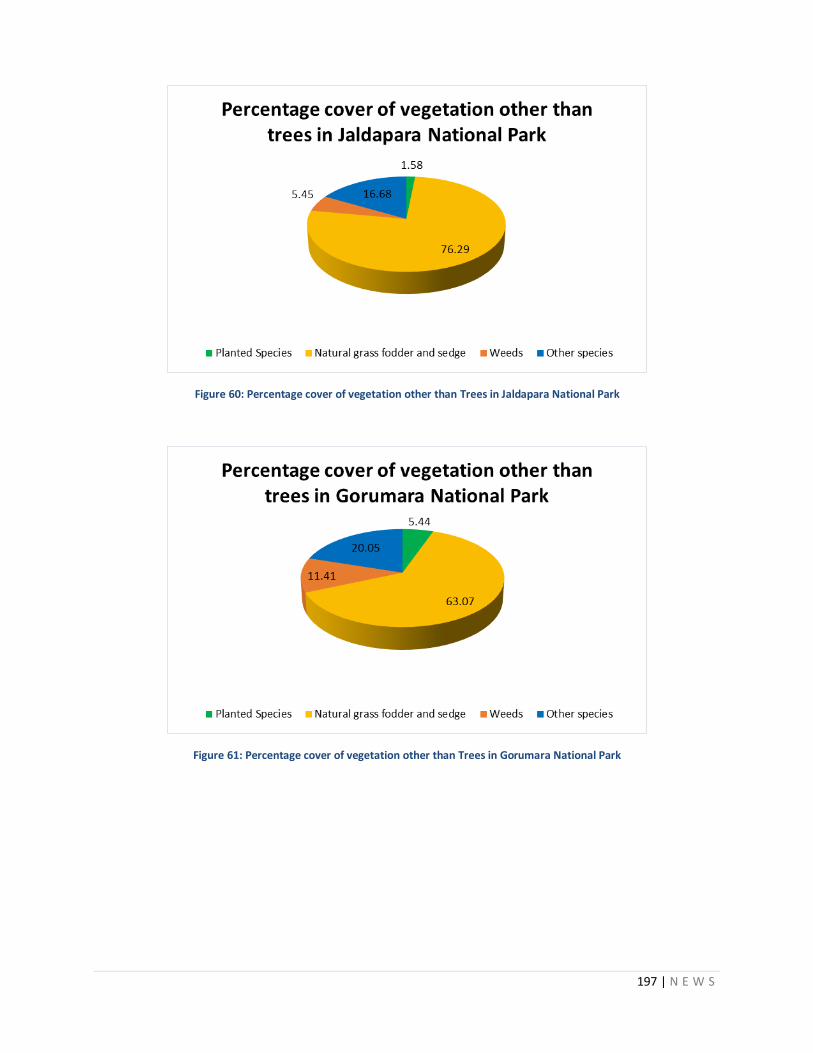
197 | N E W S
Figure 60: Percentage cover of vegetation other than Trees in Jaldapara National Park
Figure 61: Percentage cover of vegetation other than Trees in Gorumara National Park

198 | N E W S
Figure 62: Percentage cover of vegetation other than Trees in Mahananda WLS
Animal Sightings
Except for the direct and indirect sightings of Hispid hare by the present investigators, all data on animal sightings have been collected from the records maintained by the Forest Department.
During the study period, 70% of the total sightings of the Hispid hare (both direct and indirect) in JNP was documented from the managed plots of West and East Range. Both the direct sightings were from Jaldapara HQ Beat. In these places the Hispid hare was seen to choose tall, coarse and old Dhadda plantation beds for its nesting ground during the months of March-April.
As mentioned earlier that Dhadda when planted, cannot be removed either manually or by fire due to the huge stump that goes well into the soil when left untouched for seven years which is the usual time for replantation in the management plots. A few of these managed plots where Dhadda had been earlier planted may set aside in Jaldapara HQ Beat and a few more in continuity with this for the recovery of the Hispid hare. In these areas to prevent natural succession Dhadda may be considered for planting, helping in maintaining the habitat of the Hispid hare.
The data on Animal Sightings maintained by the Forest department revealed that the most utilized habitat zone for both the Rhino and Gaur was in the Sissamara and Malangi beats of the East Range of Jaldapara NP.
From our findings it was seen that the occupancy percentage of Natural grass, fodder & sedge plants in the management plots ranged from 27.85% to 94.17% in pre & post monsoon season, occupying the maximum area of 61% and 66% within the Range in Pre and post monsoon seasons respectively. Of these, Axonopus compressus (Chota chepti) occupied more than 70% during the post monsoon season. This further substantiates our suggestion to plant such naturally occurring species in the management plots.
199 | N E W S
Similarly, Budhram with Ramsai Ext followed by Gorumara Beat of the South Range which has most of the natural grasslands in Gorumara NP was the most utilized habitat zone for both the Rhino and Gaur.
Both these large ungulate species Rhino and Gaur showed a positive correlation between their sightings and the percentage of grassland area in both Jaldapara and in Gorumara.
Opportunistic Feeding Behaviour
In Jaldapara Rhino was seen to graze on 22 species of plants. Of these Dhadda was eaten 10 times and Chepti, 8 times while on the other grass species together 14 times and they browsed on the weeds like Mikania and Lantana 7 times. Gaur was seen to graze on Dhadda and Chepti together at about 12 times while on the other grass species together 19 times and browsed on the weeds like Mikania only once. Elephants were observed only once eating Bombax ceiba as also Spotted deer on Themeda arundinacea once. The Sambar was observed to feeding on 9 species of plants. In Gorumara Rhino was seen to graze on 7 species of plants of which Dhadda was fed upon 4 times and Chepti 5 times, while they fed on other grass species together 11 times and browsed on the weeds like Chromolaena odorata 3 times.
Gaur was seen to graze on Dhadda and Chepti together at about 27 times, while on the other grass species together also 27 times and browsed on the weeds like Mikania micrantha 7 times.
Elephants were seen to graze on Dhadda and Chepti together 11 times, while on the other grass species together 10 times and browsed on the weeds like Mikania micrantha and Lantana camara 2 times.
Spotted deer was seen to graze mostly on natural grass species, 17 times.
It is seen from the feeding behavior that these herbivores feed on a variety of fodder species of plants. However, Dhadda and Chepti seem to form nearly 50% of their diet.
Unlike Jaldapara and Gorumara direct observation was very difficult in Mahananda, because there are no open areas within it for sighting. So, the findings are shown here may not be accurate in the terms of the percentage of consumed species of plants.
Once again it is seen that there is a need to increase the naturally growing grass species by planting them in the management plots.
Fodder Biomass
A goal of any forest resource monitoring program must be to address change in biomass as well as its state. A more comprehensive and reliable approach for estimating biomass change is to combine new field studies with analysis of earlier work. At least two measurements on permanent management plots are needed to estimate biomass change. These measurements should preferably be a minimum of 3-5 years apart, particularly in forests vulnerable to change. The established management plots must be re measured regularly and be integrated into a
200 | N E W S
framework of continuous forest monitoring. This approach will provide the most accurate and precise estimates of total biomass and biomass density change for Adaptive Management.
Though the above is the best way to monitor and understand Fodder Biomass, the present study was only for three years. Though the study contract was done in Feb 2017, the study started after a short delay in getting the permit, and then it took a while for the study to be on course in pursuing the actual objective of the research project. Unfortunately, due to the Covid-19 Pandemic lockdown, left us with only one season and very little field studies for precise documentation. However, using the best time and resource at our disposal that we had, it is seen that the estimated Biomass comprising of the Planted Fodder Species planted by the Forest Department in the management plots and the estimated Biomass of the Fodder Species that occurred naturally in the Natural Grasslands (untouched/unmanaged) were the maximum. In fact, when the Available Biomass of Fodder Species was taken into consideration it is seen that the Biomass in the Management Plots is approximately 1/3rd of the Biomass of Natural Grasslands (untouched/unmanaged).
This indicates that if this 1/3rd of Managed plots has helped in the steady growth of these large herbivores, it is suggested that 10 to 20% more management plots may be undertaken for plantation with the species identified above under Grassland as a general prescription, with regular monitoring and use of Adaptive Management protocols. In fact, this is true of Mahananda where the Biomass of Natural Grass species growing within the management plots seem to sustain the carrying capacity of the animals, because even though Dhadda was present the planted species did not have enough Biomass to sustain even one animal.
If time was not the constraint the Biomass estimations could have been carried season wise to get a realistic picture of the availability of Fodder which would help in arriving at a reasonable estimation of the carrying capacity of these large herbivores in these Protected Areas.
Carrying Capacity
Based on the Fodder species Biomass it was estimated that in totality Jaldapara NP can sustain 111 Rhinos, 248 Gaurs and 55 Elephants. However, if only the total Fodder Biomass in management plots are considered then it is 30 Rhinos, 68 Gaurs and 15 Elephants. However interestingly if the Biomass of the planted species and the biomass of the naturally growing species within the management plots are taken into consideration separately then we see that the Biomass of the planted species alone sustains 17 Rhinos, 37 Gaurs and 8 Elephants while 14 Rhinos, 31 Gaurs and 7 Elephants are estimated when only the naturally occurring grass species within the management plots are considered.
Based on the Fodder species Biomass it was estimated that in totality Gorumara NP can sustain 38 Rhinos, 86 Gaurs and 19 Elephants. However, if only the total Fodder Biomass in management plots are considered then it is 9 Rhinos, 21 Gaurs and 5 Elephants. However interestingly if the Biomass of the planted species and the biomass of the naturally growing species within the management plots are taken into consideration separately then we see that the Biomass of the planted species alone sustains 7 Rhinos, 17 Gaurs and 4 Elephants while 2 Rhinos, 4 Gaurs and 1 Elephant are estimated when only the naturally occurring grass species
201 | N E W S
within the management plots are considered. Once again it is seen that the impact of the Biomass of naturally occurring fodder grass species in the management plots nearly enhances the sustainability of these herbivores by 1/4th.
This is true of Mahananda also, where the planted fodder species does not sustain even one animal on its own Biomass, while the Biomass of the naturally occurring species within the management area sustains at least 2 Gaurs and 1 Elephant.
Once again it is seen that the impact of the Biomass of naturally occurring fodder grass species in the management plots nearly enhances the sustainability of these herbivores twice over. The recommendation of adding the naturally occurring grass fodder species in the plantation list stands here too.
All calculations for carrying capacity were based only on grass vegetation and large stem plants were not included in the estimation of biomass, even though it is known that large herbivores feed also outside such grasslands.
202 | N E W S
8. Recommendations
Adaptive Management in the three Protected Areas – Jaldapara National Park, Gorumara National
Park and Mahananda Wildlife Sanctuary.
Fodder Species
It is recommended that in addition to the list of fodder species that has been used for planting in the management plots so far by the respective Forest Department, the following fodder species may be added as their impact on the biomass is substantial. From the present study the species that can be added to the list of plantation fodder species in Jaldapara NP and Gorumara NP are Thach/Son (Imperata cylindrica), Kasia (Saccharum spontaneum), Choto chepti/Chapta (Axonopus compresus) and Nol (Arundo donax) be considered for planting along with those earlier planted. In addition, Digitaria sp. and other Bamboo sp. may be added in the list of species to be planted in Mahananda. However, Dhadda though featuring in the list of fodder species should not be more than 10% planted in any management plot.
In addition, seeds of fodder grasses and legumes should be mixed together and sown as a mixed crop. The inclusion of legumes is advantageous in many ways. They are rich in protein and they raise protein content of the feed. They enrich soil by fixing atmospheric nitrogen and consequently the grasses that are associated with legumes make a better growth than the grasses which are grown alone. The indigenous legumes selected should be rich in foliage growth which in turn has rich protein and minerals. Further addition of such species in the management plots would prevent the growth of weeds to a large extent. It is recommended that the following indigenous species of legumes, some of which were also recorded in our study and others commonly available throughout the North Bengal such as Abrus precatorious, Abrus pulchellus, Crotalaria prostrata, Desmodium gangeticum, Flemingia strobilifera, Tephrosia candida, Mucuna pruriens, Vigna vexillata may be consider for use in managed plots.
These fodder species may be planted based on the grazing capacity of herbivores as follows: 1) Primarily grazers (90 - 100%) feeding on medium to tall grass of moderate quality (bulk grazers); 2) Primarily grazers (90 - 100%) feeding on short grass of high quality (concentrate grazers); 3) Mixed feeders (11 - 89%) feeding on grass; and 4) Primarily browsers (90 - 100%) feeding on the woody component. Along with a species mix ratio of 45%:20%:20%:15% for classes 1 to 4 respectively.
Grazing
The object of scientific grassland management is to maintain the grassland in the highest state of herbage production and at the same time is to satisfy the forage requirements of the grazing animals as well as to maintain the fertility of the soil unimpaired.
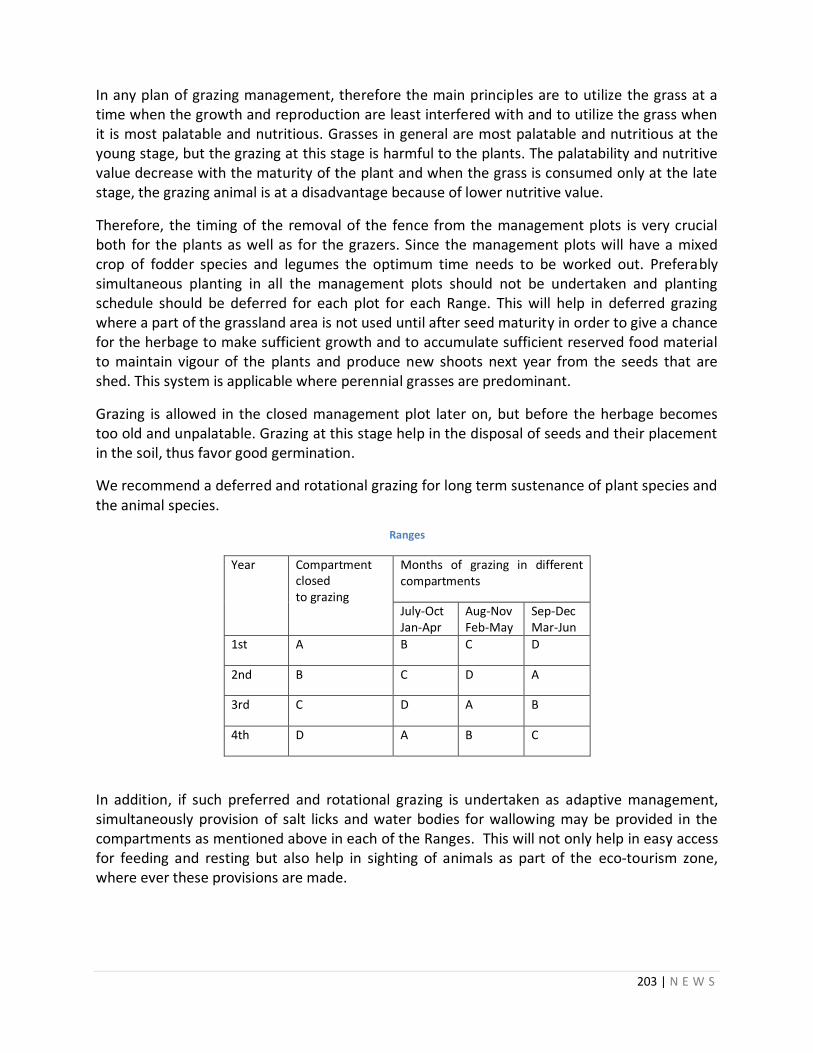
203 | N E W S
In any plan of grazing management, therefore the main principles are to utilize the grass at a time when the growth and reproduction are least interfered with and to utilize the grass when it is most palatable and nutritious. Grasses in general are most palatable and nutritious at the young stage, but the grazing at this stage is harmful to the plants. The palatability and nutritive value decrease with the maturity of the plant and when the grass is consumed only at the late stage, the grazing animal is at a disadvantage because of lower nutritive value.
Therefore, the timing of the removal of the fence from the management plots is very crucial both for the plants as well as for the grazers. Since the management plots will have a mixed crop of fodder species and legumes the optimum time needs to be worked out. Preferably simultaneous planting in all the management plots should not be undertaken and planting schedule should be deferred for each plot for each Range. This will help in deferred grazing where a part of the grassland area is not used until after seed maturity in order to give a chance for the herbage to make sufficient growth and to accumulate sufficient reserved food material to maintain vigour of the plants and produce new shoots next year from the seeds that are shed. This system is applicable where perennial grasses are predominant.
Grazing is allowed in the closed management plot later on, but before the herbage becomes too old and unpalatable. Grazing at this stage help in the disposal of seeds and their placement in the soil, thus favor good germination.
We recommend a deferred and rotational grazing for long term sustenance of plant species and the animal species.
Ranges
Year Compartment closed to grazing
Months of grazing in different compartments
July-Oct Jan-Apr
Aug-Nov Feb-May
Sep-Dec Mar-Jun
1st A B C D
2nd B C D A
3rd C D A B
4th D A B C
In addition, if such preferred and rotational grazing is undertaken as adaptive management, simultaneously provision of salt licks and water bodies for wallowing may be provided in the compartments as mentioned above in each of the Ranges. This will not only help in easy access for feeding and resting but also help in sighting of animals as part of the eco-tourism zone, where ever these provisions are made.
204 | N E W S
Forage Biomass
Due to the inadvertent situation this time the Forage Biomass could not be done as best as we wanted it to be.
We recommend that in future for all Forage Biomass Estimations especially from management plots should be undertaken at least a couple of days before the fence are removed. Also, Biomass estimations should be reflecting at least two seasons if not the ideal four seasons. Moreover, all collections for Biomass estimation should be preferably done along with the quantitative and qualitative sampling of the Fodder species for getting a near to perfect realistic data. This will go a long way in the calculation of the Carrying Capacity of not only the grassland ecosystem but also of the animals that depend on this ecosystem. In addition to regenerate more grassland areas it is recommended that canopy opening may be undertaken in old teak plantations and in monoculture plantations in the 3 protected areas.
Carrying Capacity
The Carrying Capacity of the grasslands are adequate for the present species of animals. It is at a stage when the Carrying capacity of the Herbivores will overshoot beyond its sustenance. We recommend of having 10% extra management plots in each Range. In addition, it is useful to procure the tea gardens or at least portions of it that border the Protective Areas for future growth of the large ungulates. They are in their last home in West Bengal.
9. Conclusion The study revealed that the impact of managing the grasslands in these Protective Areas have shown in the turnover of the large herbivores which have had a logarithmic growth since the initiation of such management practices. In effect the study revealed that the past management intervention of grassland development and canopy opening has helped enhance the ecosystem and wildlife in all the 3 PAs of North Bengal. From our study we have suggested a few alterations for the betterment of the management practices and introduce regular monitoring and correction through adaptive management.
205 | N E W S
REFERENCES
Anonymous (2007a). Management plan of Gorumara National Park West Bengal. Wildlife Circle, Department of Forests, Govt. of West Bengal
Anonymous (2007b). Management plan of Jaldapara National Park West Bengal. Wildlife Circle, Department of Forests, Govt. of West Bengal
Anonymous (2012). Management plan of Mahananda Wildlife Sanctuary West Bengal. Wildlife Circle, Department of Forests, Govt. of West Bengal
Anonymous (2018). Draft Management plan of Jaldapara National Park West Bengal. Wildlife Circle, Department of Forests, Govt. of West Bengal
Banerjee, L.K. (1993). Plant resources of Jaldapara Rhino Sanctuary. Botanical Survey of India, Calcutta.
Baxter, J. (2014). Common Abundance & Diversity Measures in Vegetation Analysis, Methods in EEC. BIO 221B. Dept. of Biological Science.
Blair J, Nippert J, Briggs J (2014) Grassland ecology. In: Monson RK(ed) Ecology and the environment. Springer, New York, pp 389–423. https://doi.org/10.1007/978-1-4614-7501-9_14
Caughley, G. (1979). What is this thing called carrying capacity? Pp. 2-8. In: Boyse, M.S. and L.D. Hayden-Wing (eds.). North American Elk: Ecology, Behaviour, and Management. La-ramie: University of Wyoming
Champion, G.H. and S.K. Seth. (1968). A revised survey of the forest types of India. Govt. of India, New Delhi.
Chapin, F.S., Matson, P.A., Moonet, H.A. (2002). Principles of Terrestrial Ecosystem Ecology, New York, NY, Springer Science Business Media, Inc. Pp. 97-114, 384. ISBN: 0-387-95443-0.
Cobby, J. M., Ridout, M. S., Bassett, P. J., and Large, R. V. (1985). An investigation into the use of ranked set sampling on grass and grass-clover swards. Grass and Forage Science, 40(3), 257–263.
Coombs, J. & Vlitos, A. J. (1978). An assessment of the potential for biological solar energy utilization using carbohydrates produced by higher plant photosynthesis as chemical feedstock. Vol. 2. Proceedings of International Solar Energy Society Congress, New Delhi, India, Pergamon Press, New York.
Dabadghao, P.M. and Shankarnarayan, K.A. (1973). The Grass Cover of India, Indian Council of Agricultural Research, New Delhi. 713 pp.
Desalew, T., Tegegne, A., Nigatu, L., &Teka, W. (2010). Rangeland Condition and Feed Resources in Metema District, North Gondar Zone, Amhara Region, Ethiopia (Vol. 25).ILRI (aka ILCA and ILRAD).
Dinerstein, E. (2003). The Return of the Unicornis - The Natural History and Conservation of the Greater One-horned Rhinoceros. Biology and Resource Management Series. World Wildlife Fund, Washington D.C., 320pp.
Elzinga, C. L., Salzer, D. W. and Willoughby, J. W. (1998). Measuring and Monitoring Plant Populations. U.S. Department of the Interior Bureau of Land Management, Denver.
Faizi, S. (2013). India’s Biodiversity: A Study of the Management Regime. Ph.D. Thesis. 195 Bharathidasan University.
Fjellstad and Steinheim, 1996 Fjellstad, J.I. and Steinheim, G. (1996). ‘Diet and habitat use of greater Indian one-horned rhinoceros (Rhinoceros unicornis) and Asian elephants (Elephas maximus) during dry season in Babai Valley, Royal Bardia National Park, Nepal.’ MSc thesis, Agricultural University of Norway.
206 | N E W S
Fritz H, Duncan P. (194). On the carrying capacity for large ungulates of African savanna ecosystems. Proc Biol Sci. 1994 Apr 22; 256(1345):77-82. doi: 10.1098/rspb.1994.0052. PMID: 8008761
Fuhlendorf, S.D., and Engle, D.M., (2001). Restoring heterogeneity on rangelands—Ecosystem management based on evolutionary grazing patterns: BioScience, v. 51, no. 8, p. 625–632. [Also available at https://doi. org/10.1641/0006-3568(2001)051[0625:RHOREM]2.0 .CO;2.]
Fuhlendorf, S.D., and Engle, D.M., (2004) Application of the fire–grazing interaction to restore a shifting mosaic on tallgrass prairie: Journal of Applied Ecology, v. 41, no. 4, p. 604–614. [Also available at https://dx.doi.org/10.1111/j.0021-8901.2004.00937.x.]
Fuhlendorf, S.D., Fynn, F.W.S., McGranahan, D.A., and Twidwell, D., (2017) Heterogeneity as the basis for rangeland management, in Briske, D.D., ed., Rangeland systems—Processes, management and challenges: New York, N.Y., Springer Nature, p. 169–196. [Also available at https://doi.org/10.1007/978-3-319-46709-2_5. ]
Fuhlendorf, S.D., Harell, W.C., Engle, D.M., Hamilton, R.G., Davis, C.A., and Leslie, D.M., Jr., (2006). Should heterogeneity be the basis for conservation? Grassland bird response to fire and grazing: Ecological Applications, v. 16, no. 5, p. 1706–1716. [Also available at https://dx.doi. org/10.1890/1051-0761(2006)016%5B1706:SHBTBF%5D 2.0.CO;2.]
Ghosh C. and Das AP (2007) Rhino-fodders in Jaldapara Wildlife Sanctuary in Duars of West Bengal, India. Our Nature 5: 14-20. DOI: 10.3126/on.v5i1.792
Hazarika B.C. and Saikia P.K (2012). Food Habit and Feeding Patterns of Great Indian One –Horned Rhinoceros (Rhinoceros unicornis) in the Rajiv Gandhi Orang National Park, Assam, India.
Hazarika, B.C. (2007). Studies on the eco-behavioural aspect of greater Indian one-horned rhinoceros (Rhinoceros unicornis) in Orang National Park. PhD dissertation, Department of Zoology, Gauhati University.
Iwasaki, M. (1976). Influence of size and shape of quadrate upon distribution pattern of grass weight and number of samples necessary for estimation of grass weight on grassland. Bulletin of the National Grassland Research Institute (Japan). (Mar 1976). (no.8) p. 11-26.
Johnson, R.J., Jedlicka, J.A., Quinn, J.E., and Brandle, J.R., (2011) Global perspectives on birds in agricultural landscapes, in Campbell, W.B., and LópezOrtíz, S., eds., Integrating agriculture, conservation and ecotourism—Examples from the field: New York, N.Y., Springer, p. 55–140. [Also available at https://doi.org/10.1007/978-94-007-1309-3_3.]
Karthikeyan, S. K., Jain, S. K., Nayar, M. P. & Sanjappa, M. (1989). Florae IndicaeEnumneratio: Monocotyledonae, Flora of India, Series 4. Botanical Survey of India, Calcutta
Lahkar, B. P., Saha, A., Sinha, A., Saha, R., Das, A., Barman, P. (2018). Ecology of Gaur (Bos gaurus) in North Bengal including population dynamics, distribution, habitat use pattern, protected area wise carrying capacity estimation and human gaur conflict. Annual report 2nd year. Submitted to WBFBCP. West Bengal. India.
Macdonald, D. (2001). The New Encyclopedia of Mammals. Oxford: Oxford University Press. ISBN 0198508239.
Malcolm Ausden, (2007). Habitat management for conservation. A handbook of techniques. Oxford University Press, Oxford, 2007, 411 pp, Paperback, £29.95, ISBN 978-0-19-856873-8
Mathur, V. B. (1991). The Ecological Interaction between Habitat Composition, Habitat Quality and Abundance of Some Wild Ungulates in India. D. Phil., Thesis, University of Oxford.
McCracken, J.D., (2005) Where the bobolinks roam—The plight of North America’s grassland birds: Biodiversity (Nepean), v. 6, no. 3, p. 20–29. [Also available at https://dx.doi.org/10.1080/14888386.2005.9712771 .]
207 | N E W S
McCullough DR, Barret RH, Eds. Wildlife Populations. Elsivir Science Publishers: London, UK 2001.
McNaughton, S., Oesterheld, M., Frank, D. et al. (1989) Ecosystem-level patterns of primary productivity and herbivory in terrestrial habitats. Nature 341, 142–144.
Moulik, S. (1997). The Grasses and Bamboos of India. Jodhpur: Scientific Publishers, 1997. Print.
Mukherjee T, Sharma LK, Thakur M, Saha GK, Chandra K (2019) Changing landscape configuration demands ecological planning: Retrospect and prospect for mega herbivores of North Bengal. PLoS ONE 14(12): e0225398. https://doi.org/10.1371/journal.pone.0225398
Murray, M. G. (1995). Specific nutrient requirements and migration of wildebeest. – In: Sinclair, A. R. E. and Arcese, P. (eds), Serengeti 2: dynamics, management, and conservation of an ecosystem: based on papers at a workshop held in December 1991 at the Serengeti Res. Inst., Tanzania. Univ. of Chicago Press, pp. 231–256.
Oesterheld, M., Sala, O. & McNaughton, S. (1992). Effect of animal husbandry on herbivore-carrying capacity at a regional scale. Nature 356, 234–236 (1992).
Peden DG, Van Dyne GM, Rice RW, Hansen RM. (1974). The trophic ecology of Bison on short grass plains.
Powell, J.M., Fernhdez-Rivera, S., Heirnauxh, P., Turner, M.D. (1996). Nutrient Cycling in Integrated Rangeland/Cropland Systems of the Sahel. Agricultural Systems 52: 143-170.
Prater, H. S. (1980). The Book of Indian Animals. Bombay Natural History Society, Mumbai.
Ram, A. K. (2008). Impact of Mikania Micrantha on Rhinoceros Habitat in Chitwan National Park, Chitwan Nepal. Pokhara: Tribhuvan University, Institute of Forestry.
Rawat, G. S., and B. S. Adhikari. (2015)."Ecology and management of grassland habitats in India. "ENVIS Bulletin, Wildlife & Protected Area No. 17.
Ribic, C.A., Guzy, M.J., and Sample, D.W. (2009). Grassland bird use of remnant prairie and Conservation Reserve Program fields in an agricultural landscape in Wisconsin: American Midland Naturalist, v. 161, no. 1, p. 110–122. [Also available at https://dx.doi.org/10.1674/0003-0031-161.1.110.]
Rosenzweig, M.L. (1968) Net Primary Productivity of Terrestrial Communities: Prediction from Climatological Data. The American Naturalist, 102, 67-74.
Roy, M. (2010). Habitat use and foraging ecology of the Asian Elephant (Elephas maximus) in Buxa Tiger Reserve and adjoining areas of northern West Bengal. Ph.D. thesis, Vidyasagar University, West Bengal, India.
Sala, O.E. and Paruelo, J.M. (1997). Ecosystem services in grasslands. In: Daily GC (ed) Nature’s services: societal dependence on natural ecosystems. Island Press, Washington, DC, pp 237–251
Singhal, N. and Chowdhury, B.R. (1996). Report on Survey of Flora and Fauna of Mahananda Wildlife Sanctuary. Forest Dept., Govt. of West Bengal and NEWS, Kolkata. DOI: 10.13140/RG.2.2.21844.94086
Smith, R.L. (1974). Ecology and field biology. Harper and Row, New York.
Sukla, S. R. & Chandel, S. P. (1980). Plant Ecology. 4th Edition (pp. 197). New Delhi.
Sukumar R (2003) The Living Elephants: Evolutionary Ecology, Behavior and Conservation. Oxford University Press, New York.
208 | N E W S
Voelkel, B. 2011. Modification of Robel’s range pole for estimating plant biomass by private landowners and wildlife students. Professional Paper. Wildlife and Fisheries Department, Texas A&M University. College Station, TX, USA.15 pages.
Voelkel, B., Marshall, M., Lund, A., Gobeli, A. and Lopez, R. (2018). A Simple Method for Estimating Plant Biomass Used in Grazing Management. Published by Texas A&M Natural Resources Institute, Texas. USA.
White, F. (1983) The Vegetation of Africa, a Descriptive Memoir to Accompany the UNESCO/AETFAT/UNSO Vegetation Map of Africa (3 Plates, Northwestern Africa, Northeastern Africa, and Southern Africa, 1:5,000,000. UNESCO, Paris.
Workman, J. P. and MacPherson, D.W. (1973). Calculating yearlong carrying capacity: An algebraic approach. J. Range Manage., 26: 274-277
Zhao Y, Liu Z, Wu J (2020) Grassland ecosystem services: a systematic review of research advances and future directions. Landscape Ecology 35:793–814. https://doi.org/10.1007/s10980-020-00980
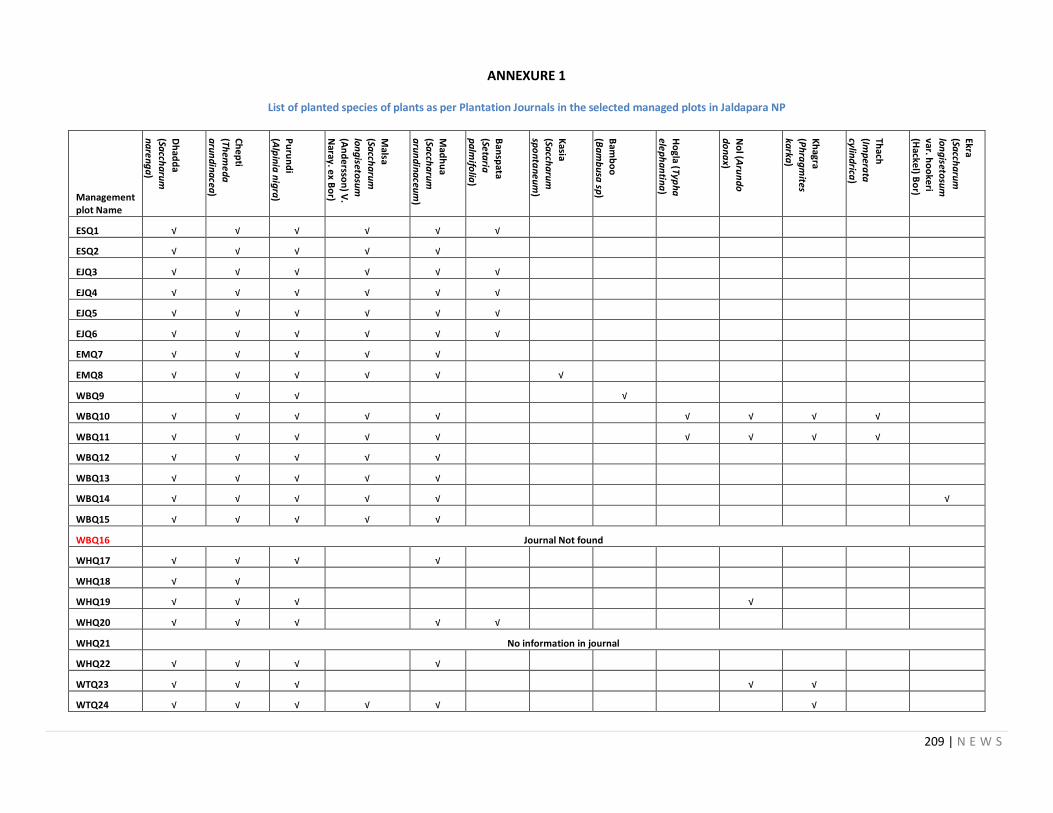
209 | N E W S
ANNEXURE 1
List of planted species of plants as per Plantation Journals in the selected managed plots in Jaldapara NP
Management plot Name
Dh
add
a
(Sacch
aru
m
na
ren
ga
)
Ch
ep
ti (Th
eme
da
aru
nd
ina
cea)
Pu
run
di
(Alp
inia
nig
ra)
Malsa
(Sacch
aru
m
lon
giseto
sum
(An
de
rsson
) V.
Naray. e
x Bo
r)
Mad
hu
a
(Sacch
aru
m
aru
nd
ina
ceum
)
Ban
spata
(Seta
ria
pa
lmifo
lia)
Kasia
(Sacch
aru
m
spo
nta
ne
um
)
Bam
bo
o
(Ba
mb
usa
sp)
Ho
gla (Typh
a
elep
ha
ntin
a)
No
l (Aru
nd
o
do
na
x)
Kh
agra
(Ph
rag
mites
karka
)
Thach
(Imp
erata
cylind
rica)
Ekra (Sa
ccha
rum
lon
giseto
sum
var. ho
oke
ri (H
ackel) B
or)
ESQ1 √ √ √ √ √ √
ESQ2 √ √ √ √ √
EJQ3 √ √ √ √ √ √
EJQ4 √ √ √ √ √ √
EJQ5 √ √ √ √ √ √
EJQ6 √ √ √ √ √ √
EMQ7 √ √ √ √ √
EMQ8 √ √ √ √ √ √
WBQ9 √ √ √
WBQ10 √ √ √ √ √ √ √ √ √
WBQ11 √ √ √ √ √ √ √ √ √
WBQ12 √ √ √ √ √
WBQ13 √ √ √ √ √
WBQ14 √ √ √ √ √ √
WBQ15 √ √ √ √ √
WBQ16 Journal Not found
WHQ17 √ √ √ √
WHQ18 √ √
WHQ19 √ √ √ √
WHQ20 √ √ √ √ √
WHQ21 No information in journal
WHQ22 √ √ √ √
WTQ23 √ √ √ √ √
WTQ24 √ √ √ √ √ √
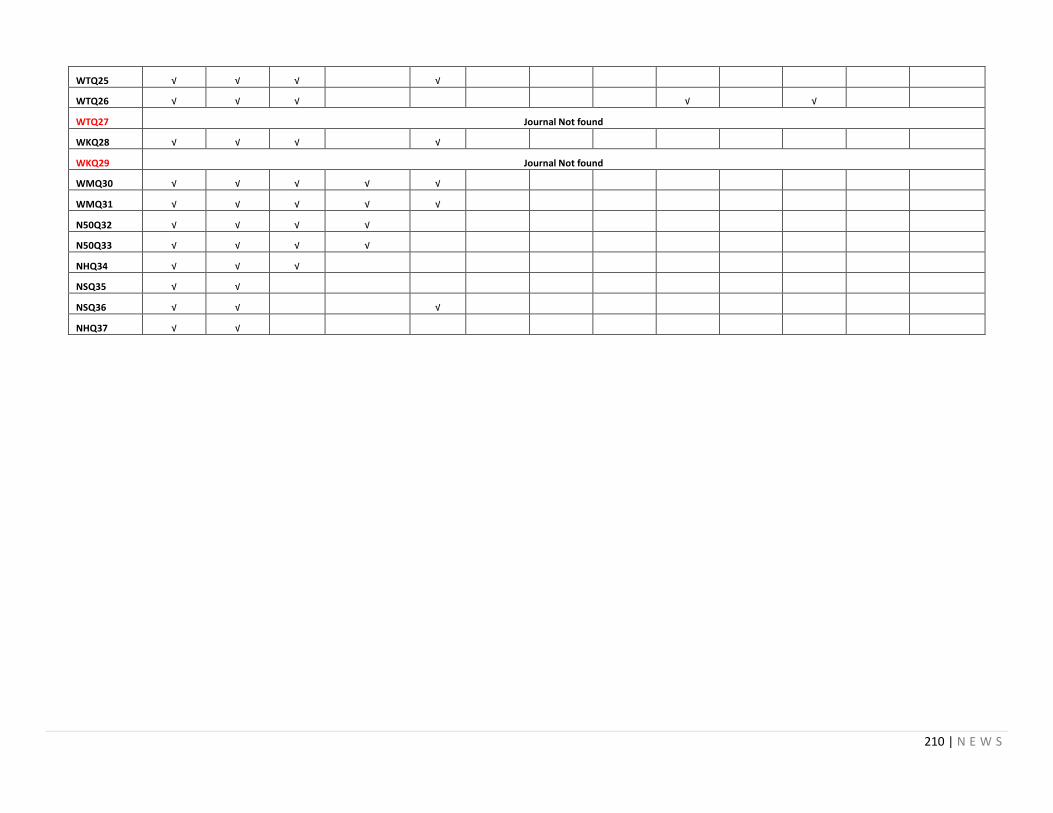
210 | N E W S
WTQ25 √ √ √ √
WTQ26 √ √ √ √ √
WTQ27 Journal Not found
WKQ28 √ √ √ √
WKQ29 Journal Not found
WMQ30 √ √ √ √ √
WMQ31 √ √ √ √ √
N50Q32 √ √ √ √
N50Q33 √ √ √ √
NHQ34 √ √ √
NSQ35 √ √
NSQ36 √ √ √
NHQ37 √ √
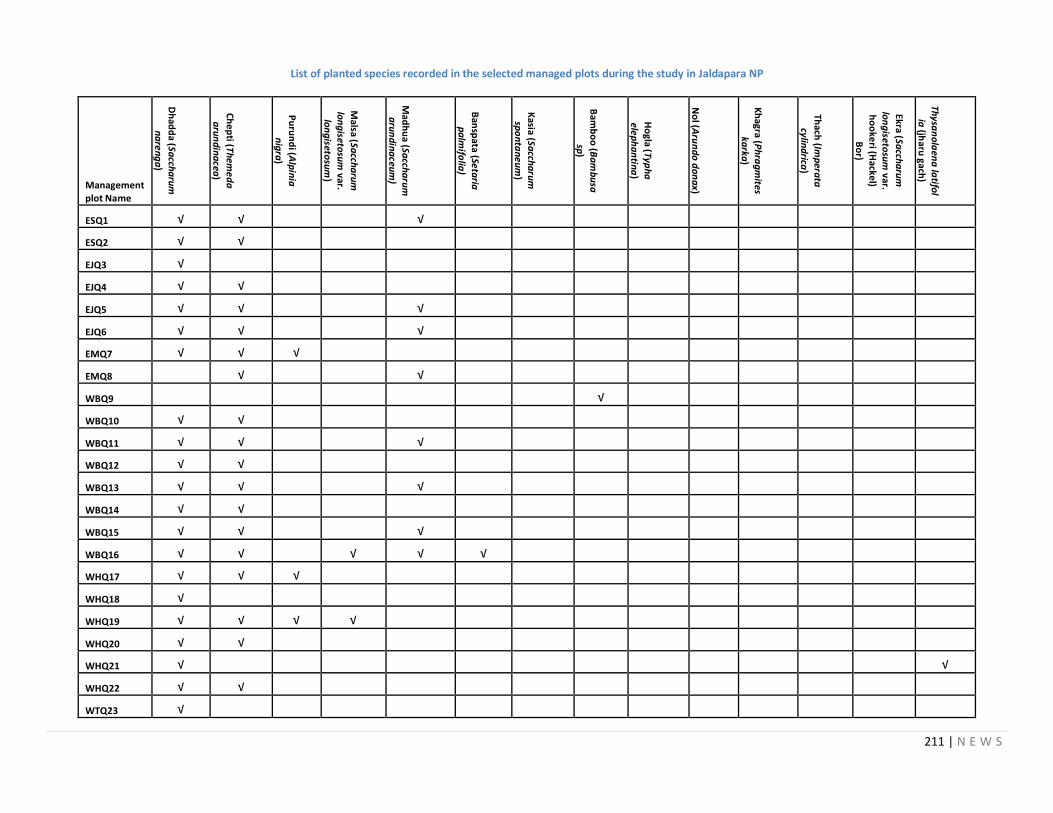
211 | N E W S
List of planted species recorded in the selected managed plots during the study in Jaldapara NP
Management plot Name
Dh
add
a (Sacch
aru
m
na
ren
ga
)
Ch
ep
ti (Th
eme
da
aru
nd
ina
cea)
Pu
run
di (A
lpin
ia
nig
ra)
Malsa (Sa
ccha
rum
lon
giseto
sum
var. lo
ng
isetosu
m)
Mad
hu
a (Sacch
aru
m
aru
nd
ina
ceum
)
Ban
spata (Se
taria
pa
lmifo
lia)
Kasia (Sa
ccha
rum
sp
on
tan
eu
m)
Bam
bo
o (B
am
bu
sa
sp)
Ho
gla (Typh
a
elep
ha
ntin
a)
No
l (Aru
nd
o d
on
ax)
Kh
agra (Ph
rag
mites
karka
)
Thach
(Imp
erata
cylind
rica)
Ekra (Sacch
aru
m
lon
giseto
sum
var. h
oo
keri (H
ackel)
Bo
r)
Thysa
no
laen
a la
tifol
ia (jh
aru gach
)
ESQ1 √ √ √
ESQ2 √ √
EJQ3 √
EJQ4 √ √
EJQ5 √ √ √
EJQ6 √ √ √
EMQ7 √ √ √
EMQ8 √ √
WBQ9 √
WBQ10 √ √
WBQ11 √ √ √
WBQ12 √ √
WBQ13 √ √ √
WBQ14 √ √
WBQ15 √ √ √
WBQ16 √ √ √ √ √
WHQ17 √ √ √
WHQ18 √
WHQ19 √ √ √ √
WHQ20 √ √
WHQ21 √ √
WHQ22 √ √
WTQ23 √
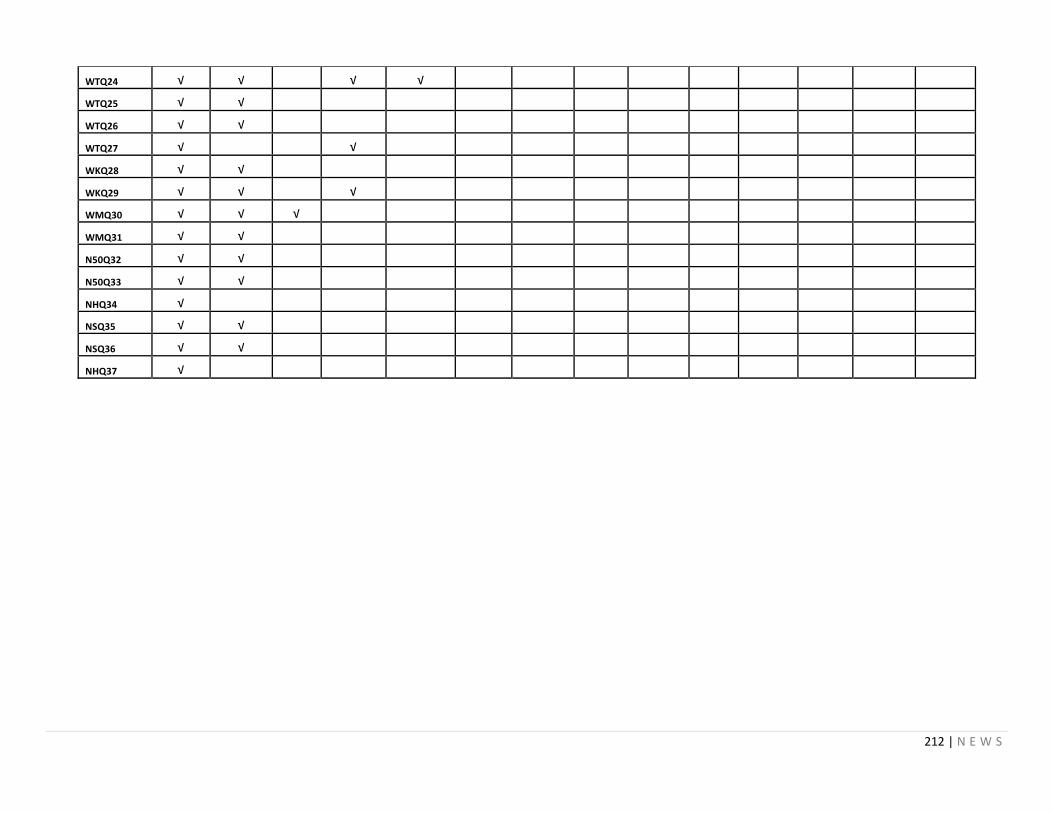
212 | N E W S
WTQ24 √ √ √ √
WTQ25 √ √
WTQ26 √ √
WTQ27 √ √
WKQ28 √ √
WKQ29 √ √ √
WMQ30 √ √ √
WMQ31 √ √
N50Q32 √ √
N50Q33 √ √
NHQ34 √
NSQ35 √ √
NSQ36 √ √
NHQ37 √
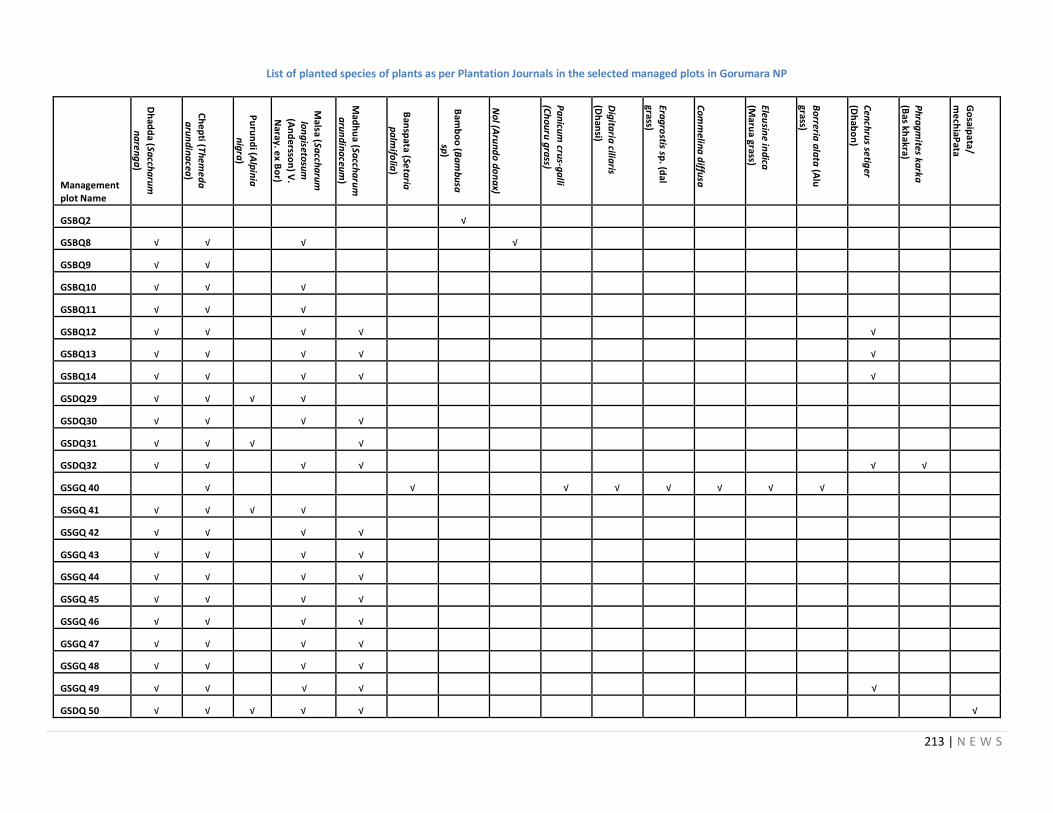
213 | N E W S
List of planted species of plants as per Plantation Journals in the selected managed plots in Gorumara NP
Management plot Name
Dh
add
a (Sacch
aru
m
na
ren
ga
)
Ch
ep
ti (Th
eme
da
a
run
din
acea
)
Pu
run
di (A
lpin
ia
nig
ra)
Malsa (Sa
ccha
rum
lon
giseto
sum
(A
nd
ersso
n) V
.
Naray. e
x Bo
r)
Mad
hu
a (Sacch
aru
m
aru
nd
ina
ceum
)
Ban
spata (Se
taria
pa
lmifo
lia)
Bam
bo
o (B
am
bu
sa
sp)
No
l (Aru
nd
o d
on
ax)
Pa
nicu
m cru
s-ga
lli (C
ho
uru
gra
ss)
Dig
itaria
ciliaris
(Dh
ansi)
Erag
rostis sp
. (dal
grass)
Co
mm
elina
diffu
sa
Eleusin
e ind
ica
(Maru
a grass)
Bo
rreria a
lata
(Alu
grass)
Cen
chru
s setig
er
(Dh
abo
n)
Ph
rag
mites ka
rka
(B
as khakra)
Go
saipa
ta/
me
chiaP
ata
GSBQ2 √
GSBQ8 √ √ √ √
GSBQ9 √ √
GSBQ10 √ √ √
GSBQ11 √ √ √
GSBQ12 √ √ √ √ √
GSBQ13 √ √ √ √ √
GSBQ14 √ √ √ √ √
GSDQ29 √ √ √ √
GSDQ30 √ √ √ √
GSDQ31 √ √ √ √
GSDQ32 √ √ √ √ √ √
GSGQ 40 √ √ √ √ √ √ √ √
GSGQ 41 √ √ √ √
GSGQ 42 √ √ √ √
GSGQ 43 √ √ √ √
GSGQ 44 √ √ √ √
GSGQ 45 √ √ √ √
GSGQ 46 √ √ √ √
GSGQ 47 √ √ √ √
GSGQ 48 √ √ √ √
GSGQ 49 √ √ √ √ √
GSDQ 50 √ √ √ √ √ √

214 | N E W S
GSDQ 51 √ √ √ √
GSDQ 52 √ √ √ √ √
GNKQ1 √ √ √ √ √ √ √
GNKQ2 √ √ √ √
GNKQ3 √ √ √
GNKQ5 √ √ √
GNMQ3 √ √
GNMQ4 √ √ √ √
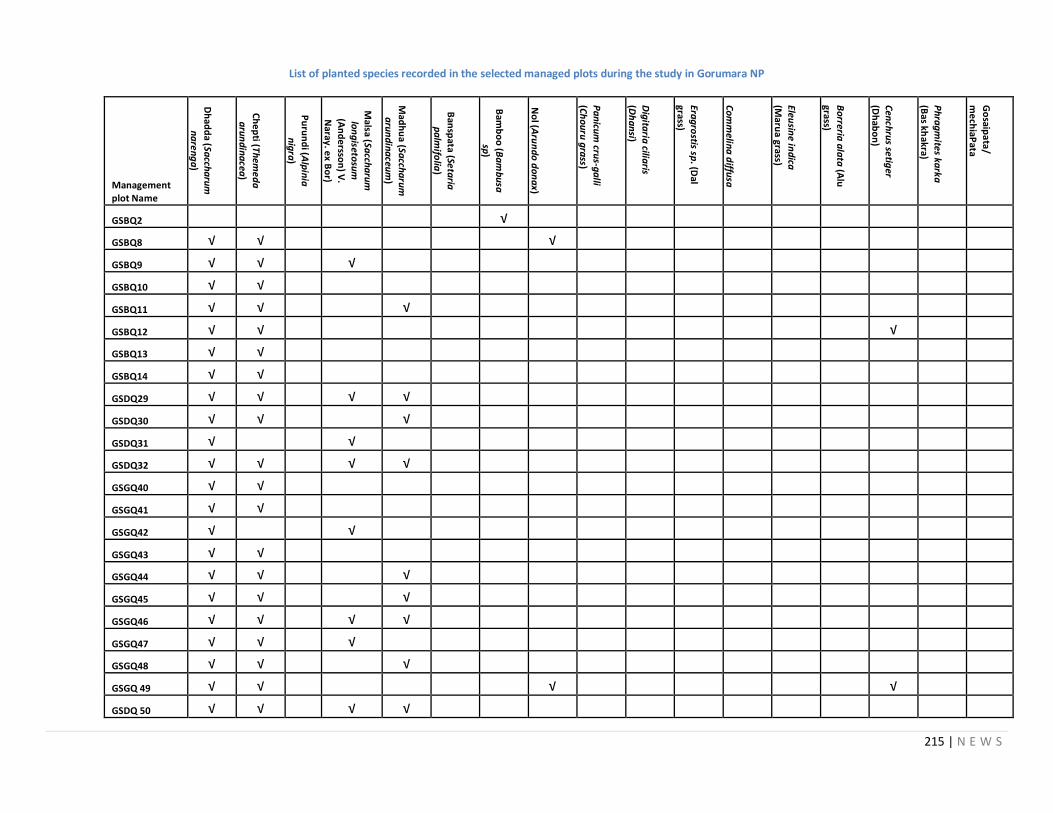
215 | N E W S
List of planted species recorded in the selected managed plots during the study in Gorumara NP
Management plot Name
Dh
add
a (Sacch
aru
m
na
ren
ga
)
Ch
ep
ti (Th
eme
da
aru
nd
ina
cea)
Pu
run
di (A
lpin
ia
nig
ra)
Malsa (Sa
ccha
rum
lo
ng
isetosu
m
(An
de
rsson
) V.
Naray. e
x Bo
r)
Mad
hu
a (Sacch
aru
m
aru
nd
ina
ceum
)
Ban
spata (Se
taria
pa
lmifo
lia)
Bam
bo
o (B
am
bu
sa
sp)
No
l (Aru
nd
o d
on
ax)
Pa
nicu
m cru
s-ga
lli
(Ch
ou
ru g
rass)
Dig
itaria
ciliaris
(Dh
an
si)
Erag
rostis sp
. (Dal
grass)
Co
mm
elina
diffu
sa
Eleusin
e ind
ica
(Maru
a grass)
Bo
rreria a
lata
(Alu
grass)
Cen
chru
s setig
er
(Dh
abo
n)
Ph
rag
mites ka
rka
(Bas kh
akra)
Go
saipa
ta/
me
chiaP
ata
GSBQ2 √
GSBQ8 √ √ √
GSBQ9 √ √ √
GSBQ10 √ √
GSBQ11 √ √ √
GSBQ12 √ √ √
GSBQ13 √ √
GSBQ14 √ √
GSDQ29 √ √ √ √
GSDQ30 √ √ √
GSDQ31 √ √
GSDQ32 √ √ √ √
GSGQ40 √ √
GSGQ41 √ √
GSGQ42 √ √
GSGQ43 √ √
GSGQ44 √ √ √
GSGQ45 √ √ √
GSGQ46 √ √ √ √
GSGQ47 √ √ √
GSGQ48 √ √ √
GSGQ 49 √ √ √ √
GSDQ 50 √ √ √ √
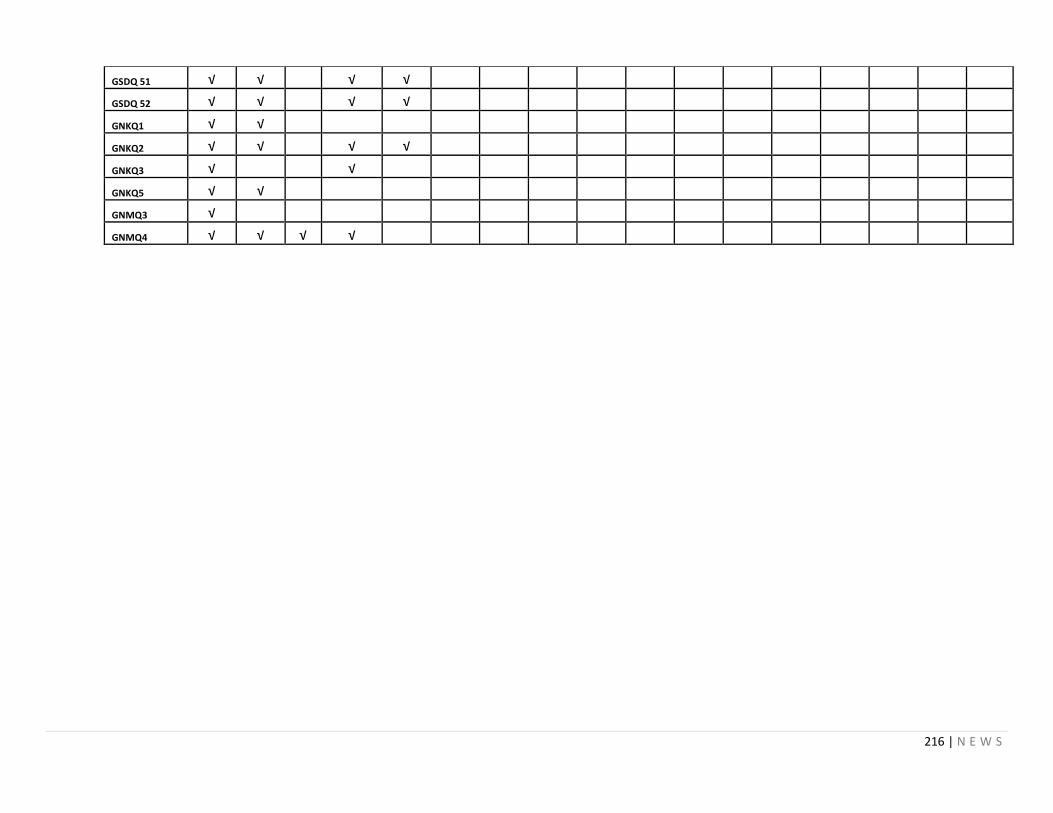
216 | N E W S
GSDQ 51 √ √ √ √
GSDQ 52 √ √ √ √
GNKQ1 √ √
GNKQ2 √ √ √ √
GNKQ3 √ √
GNKQ5 √ √
GNMQ3 √
GNMQ4 √ √ √ √
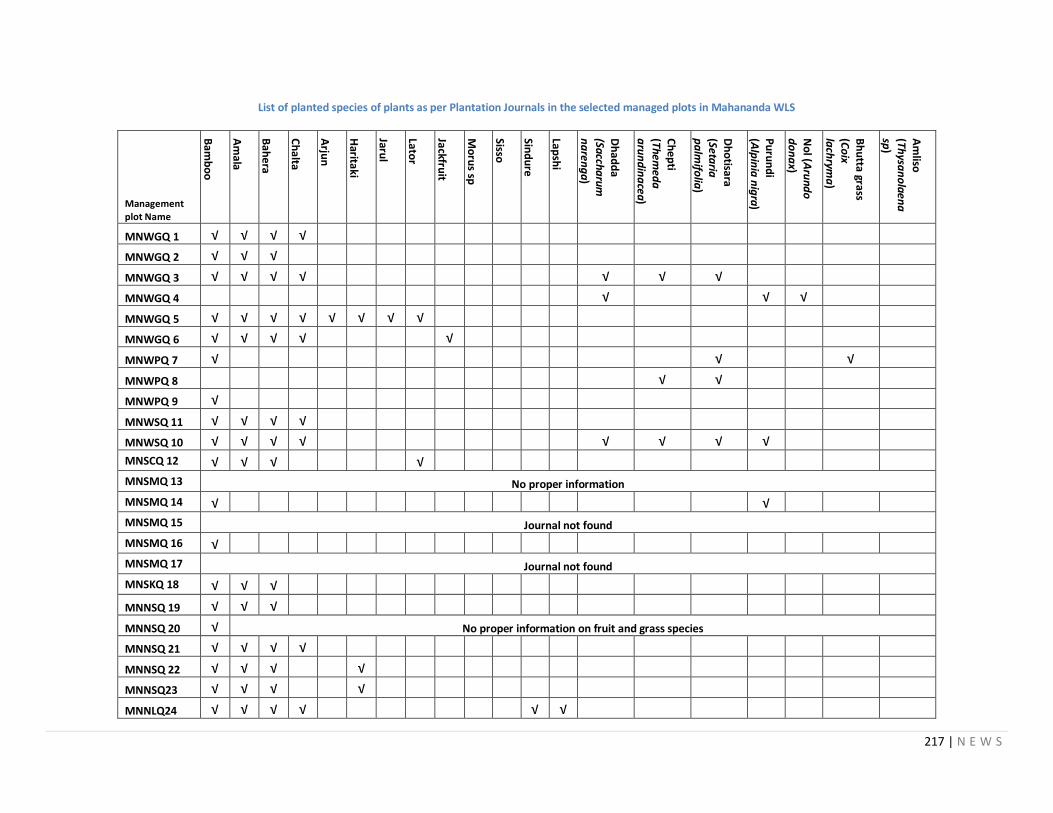
217 | N E W S
List of planted species of plants as per Plantation Journals in the selected managed plots in Mahananda WLS
Management plot Name
Bam
bo
o
Am
ala
Bah
era
Ch
alta
Arju
n
Haritaki
Jarul
Lator
Jackfruit
Mo
rus sp
Sisso
Sind
ure
Lapsh
i
Dh
add
a (Saccha
rum
na
reng
a)
Ch
epti
(Themed
a a
run
din
acea
)
Dh
otisara
(Setaria
p
alm
ifolia
)
Pu
run
di
(Alp
inia
nig
ra)
No
l (Aru
ndo
d
on
ax)
Bh
utta
grass (C
oix
lach
ryma
)
Am
liso
(Thysa
no
laena
sp)
MNWGQ 1 √ √ √ √
MNWGQ 2 √ √ √
MNWGQ 3 √ √ √ √ √ √ √
MNWGQ 4 √ √ √
MNWGQ 5 √ √ √ √ √ √ √ √
MNWGQ 6 √ √ √ √ √
MNWPQ 7 √ √ √
MNWPQ 8 √ √
MNWPQ 9 √
MNWSQ 11 √ √ √ √
MNWSQ 10 √ √ √ √ √ √ √ √
MNSCQ 12 √ √ √ √
MNSMQ 13 No proper information
MNSMQ 14 √ √
MNSMQ 15 Journal not found
MNSMQ 16 √
MNSMQ 17 Journal not found
MNSKQ 18 √ √ √
MNNSQ 19 √ √ √
MNNSQ 20 √ No proper information on fruit and grass species
MNNSQ 21 √ √ √ √
MNNSQ 22 √ √ √ √
MNNSQ23 √ √ √ √
MNNLQ24 √ √ √ √ √ √
218 | N E W S
MNNLQ25 √ √ √
MNNLQ26 √ √ √ √ √ √ √ √
MNNKQ27 √ √ √
MNNKQ28 √ √ √
MNNKQ29 √ √ √
MNS7Q30 √ √ √ √ √
MNS7Q31 √ No proper information on fruit and grass species
MNS7Q32 √ √ √ No proper information on grass species
MNSTQ33 √ √ √ √
MNSTQ34 √ √ √ √ √ √ √ √ √ √
MNSTQ35 √ √ √ √
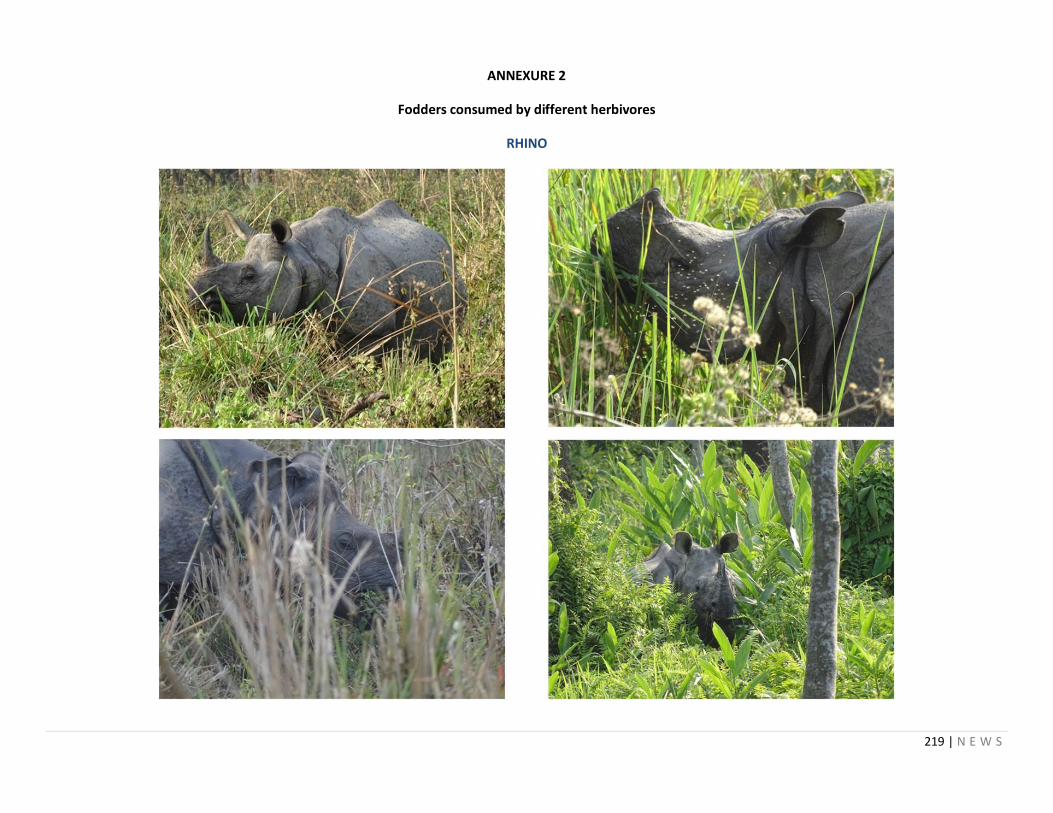
219 | N E W S
ANNEXURE 2
Fodders consumed by different herbivores
RHINO
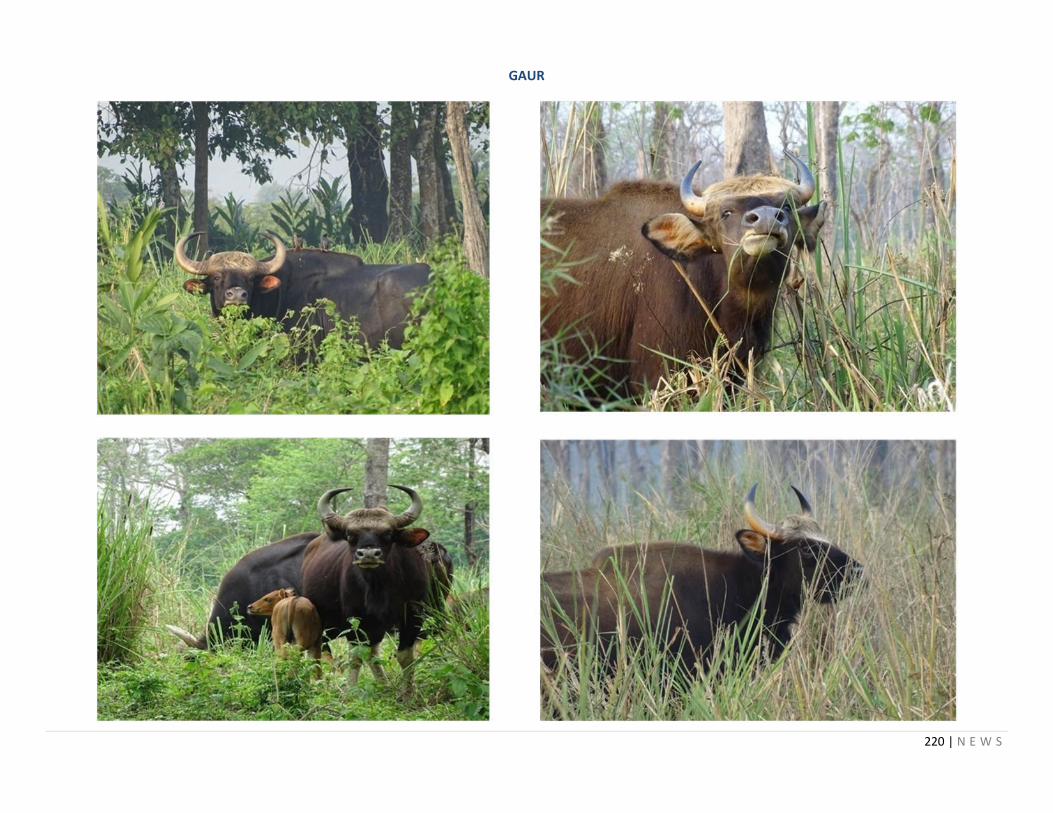
220 | N E W S
GAUR
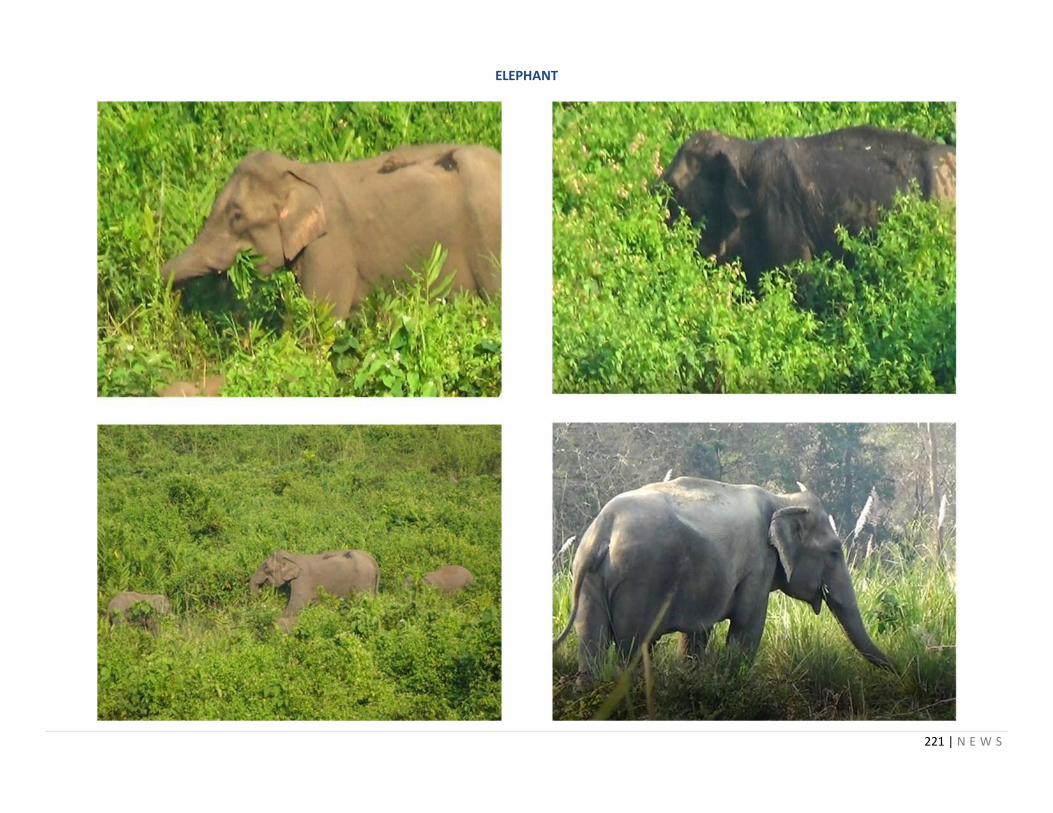
221 | N E W S
ELEPHANT
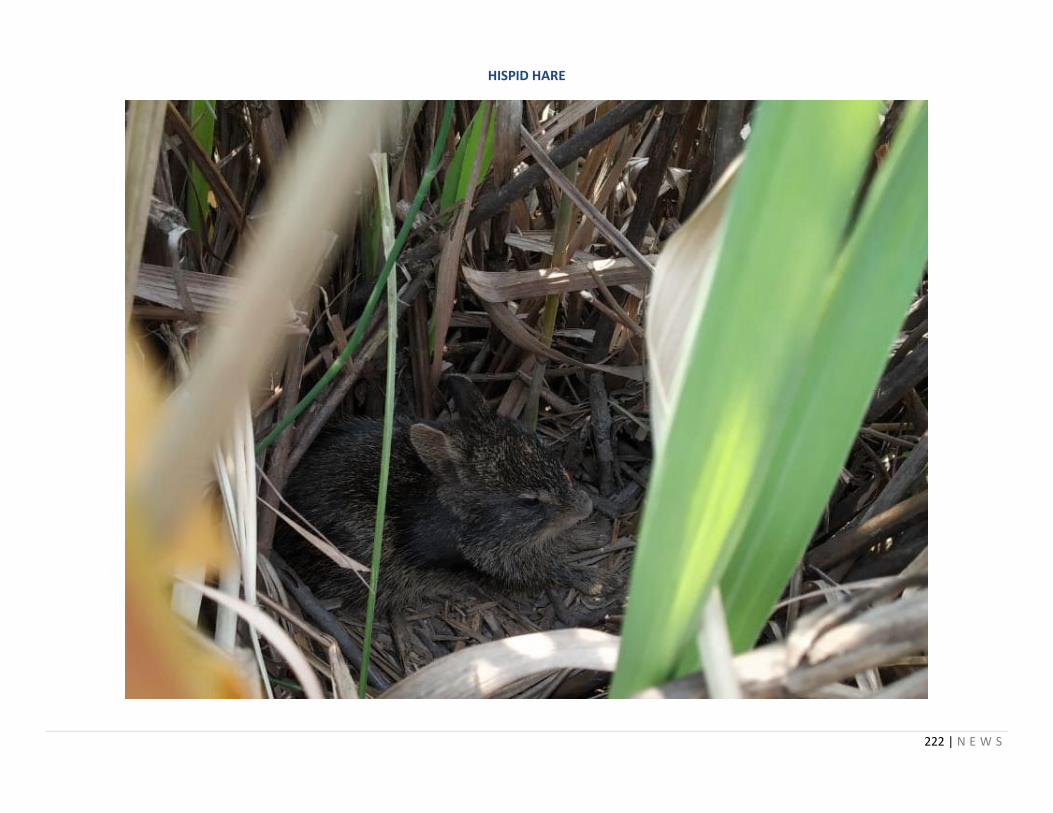
222 | N E W S
HISPID HARE

223 | N E W S
224 | N E W S