Adoption of project management practices: The impact on international development projects of...
40
1 Adoption of project management practices: The impact on international development projects of non-governmental organizations Ruggero Golini a *, Matteo Kalchschmidt a , Paolo Landoni b a [email protected], Università degli Studi di Bergamo, Department of Management, Information and Production Engineering, Via Pasubio, 7, 24044 Dalmine (BG), Italy, Tel. +39 035 205 2048 b [email protected], Università degli Studi di Bergamo, Department of Management, Information and Production Engineering, Via Pasubio, 7, 24044 Dalmine (BG), Italy c [email protected], Politecnico di Milano, Department of Management, Economics and Industrial Engineering, Via Lambruschini 4C - 20156 Milano Cite as: Golini, R., Kalchschmidt, M., Landoni, P., 2015. Adoption of project management practices: The impact on international development projects of non-governmental organizations. International Journal of Project Management 33 (3), 650-663. DOI: http://dx.doi.org/10.1016/j.ijproman.2014.09.006 ABSTRACT International Development (ID) projects carried by Non-Governmental Organizations (NGOs) are considered one of the pillars for providing assistance to developing countries, but these projects are reported to have high failure rates and their performance is often considered not satisfactory. Only recently researchers started to consider project management (PM) practices as possible remedy for the poor performance of ID projects. Following this direction, we have conducted a large-scale survey among project managers working for NGOs and dealing with ID projects to assess the extent of adoption of methodologies and tools. Moreover, this study assesses the impact of the PM practices on project performance. We present an analysis and discussion of the evidence from this international survey administered to almost 500 project managers. The results indicate different
Transcript of Adoption of project management practices: The impact on international development projects of...

1
Adoption of project management practices: The impact on international development projects of non-governmental
organizations
Ruggero Golinia*, Matteo Kalchschmidta, Paolo Landonib
a [email protected], Università degli Studi di Bergamo, Department of Management, Information and Production Engineering, Via Pasubio, 7, 24044 Dalmine (BG), Italy, Tel. +39 035 205 2048 b [email protected], Università degli Studi di Bergamo, Department of Management, Information and Production Engineering, Via Pasubio, 7, 24044 Dalmine (BG), Italy c [email protected], Politecnico di Milano, Department of Management, Economics and Industrial Engineering, Via Lambruschini 4C - 20156 Milano
Cite as: Golini, R., Kalchschmidt, M., Landoni, P., 2015. Adoption of project management
practices: The impact on international development projects of non-governmental
organizations. International Journal of Project Management 33 (3), 650-663.
DOI: http://dx.doi.org/10.1016/j.ijproman.2014.09.006
ABSTRACT
International Development (ID) projects carried by Non-Governmental Organizations (NGOs) are
considered one of the pillars for providing assistance to developing countries, but these projects are
reported to have high failure rates and their performance is often considered not satisfactory. Only
recently researchers started to consider project management (PM) practices as possible remedy for
the poor performance of ID projects. Following this direction, we have conducted a large-scale
survey among project managers working for NGOs and dealing with ID projects to assess the extent
of adoption of methodologies and tools. Moreover, this study assesses the impact of the PM
practices on project performance. We present an analysis and discussion of the evidence from this
international survey administered to almost 500 project managers. The results indicate different

2
levels of maturity in the adoption of PM tools that are related to project success in both the short
and long term.
1. INTRODUCTION
Most international assistance provided by governments and NGOs to developing countries is
provided via projects (Diallo and Thuillier, 2005). In contrast to emergency projects, International
Development (ID) projects do not have the objective to provide immediate assistance to populations
affected by wars or natural disasters, and they usually take place in more stable contexts with the
aim of improving living conditions in terms of economy, education, or health. During the Eighties,
there was a proliferation of such projects. These were promoted by different donors, countries and
organizations but not always in a coordinated way (Morss, 1984). Even in recent years, there has
been a growing trend of money and human capital employed in ID projects (Diallo and Thuillier,
2005; OECD, 2008, 2009). As a consequence, a number of global players have worked for decades
to establish solid project management (PM) practice. The World Bank, US AID, the OECD's
Development Assistance Committee, and the Canadian International Development Agency have
developed their own standards (Landoni and Corti, 2011) and supported related training and
education in developing countries directly or through training organizations.
However, despite the importance and the peculiar critical success factors of ID projects (Hermano
et al., 2013; Ika et al., 2012), limited attention has been devoted in the literature to best practices,
approaches, and management techniques in this field. In fact, several authors have suggested the
need for additional research (Youker, 2003), particularly regarding PM tools and approaches
(Khang and Moe, 2008; Landoni and Corti, 2011).
Generally speaking, there are very few studies in the development and PM literature about
the diffusion of standards and methodologies within organizations (Ahlemann et al., 2009), even
private ones. This represents a gap that researchers and practitioners are attempting to fill and that,
3
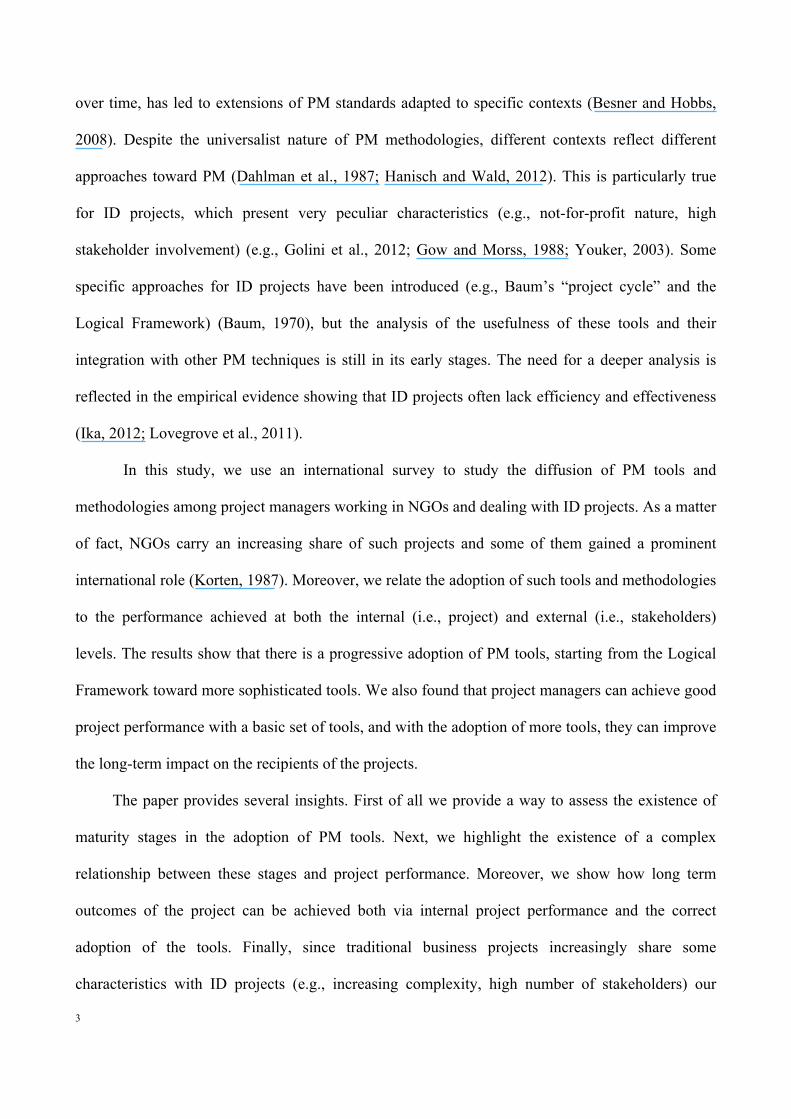
over time, has led to extensions of PM standards adapted to specific contexts (Besner and Hobbs,
2008). Despite the universalist nature of PM methodologies, different contexts reflect different
approaches toward PM (Dahlman et al., 1987; Hanisch and Wald, 2012). This is particularly true
for ID projects, which present very peculiar characteristics (e.g., not-for-profit nature, high
stakeholder involvement) (e.g., Golini et al., 2012; Gow and Morss, 1988; Youker, 2003). Some
specific approaches for ID projects have been introduced (e.g., Baum’s “project cycle” and the
Logical Framework) (Baum, 1970), but the analysis of the usefulness of these tools and their
integration with other PM techniques is still in its early stages. The need for a deeper analysis is
reflected in the empirical evidence showing that ID projects often lack efficiency and effectiveness
(Ika, 2012; Lovegrove et al., 2011).
In this study, we use an international survey to study the diffusion of PM tools and
methodologies among project managers working in NGOs and dealing with ID projects. As a matter
of fact, NGOs carry an increasing share of such projects and some of them gained a prominent
international role (Korten, 1987). Moreover, we relate the adoption of such tools and methodologies
to the performance achieved at both the internal (i.e., project) and external (i.e., stakeholders)
levels. The results show that there is a progressive adoption of PM tools, starting from the Logical
Framework toward more sophisticated tools. We also found that project managers can achieve good
project performance with a basic set of tools, and with the adoption of more tools, they can improve
the long-term impact on the recipients of the projects.
The paper provides several insights. First of all we provide a way to assess the existence of
maturity stages in the adoption of PM tools. Next, we highlight the existence of a complex
relationship between these stages and project performance. Moreover, we show how long term
outcomes of the project can be achieved both via internal project performance and the correct
adoption of the tools. Finally, since traditional business projects increasingly share some
characteristics with ID projects (e.g., increasing complexity, high number of stakeholders) our

4
results can also be useful for scholars and practitioners working outside the ID field.
The paper is organized as follows. In the first section, a literature review on PM practices
and tools and their impact on project performance is presented, leading to the formulation of the
two research questions. In the second section, the research sample and the methodology are
discussed, followed by a third section in which the answers to the two research questions are
presented. The fourth and final section discusses the results of the analysis and the impact of PM
tools on ID project results.
2. LITERATURE REVIEW AND RESEARCH QUESTION
PM practices vary significantly from one type of project to another (Payne and Turner, 1999).
Different tools, techniques, and approaches are applied to different types of projects even within the
same organization to adapt PM methods to the specific needs of each project (Crawford et al.,
2005). This is particularly true for ID projects, which present peculiar characteristics that led to the
development of dedicated methodologies.
First of all, in ID projects, the target “customer” or beneficiary is a community in a developing
country with boundaries that are not clearly defined. This community benefits from the project
output, but its members generally do not fund the project (Ahsan and Gunawan, 2010) and often
they do not have high technical and managerial capabilities (Golini and Landoni, 2014). As a
consequence, beneficiaries are often not included in the project design phases leading to fatal errors
in the execution of the project (Ika, 2012). Moreover, ID projects are frequently carried in difficult
environments in terms of natural, political, or social factors. These projects also involve many
stakeholders in different countries and have to deliver intangible outputs (e.g., training and
education, society empowerment) or outcomes (e.g., alleviation of poverty, improvement of
standards of living, protection of basic human rights) (Youker, 2003).
To include these peculiarities in PM practices, some PM guidelines have been created for NGOs
5
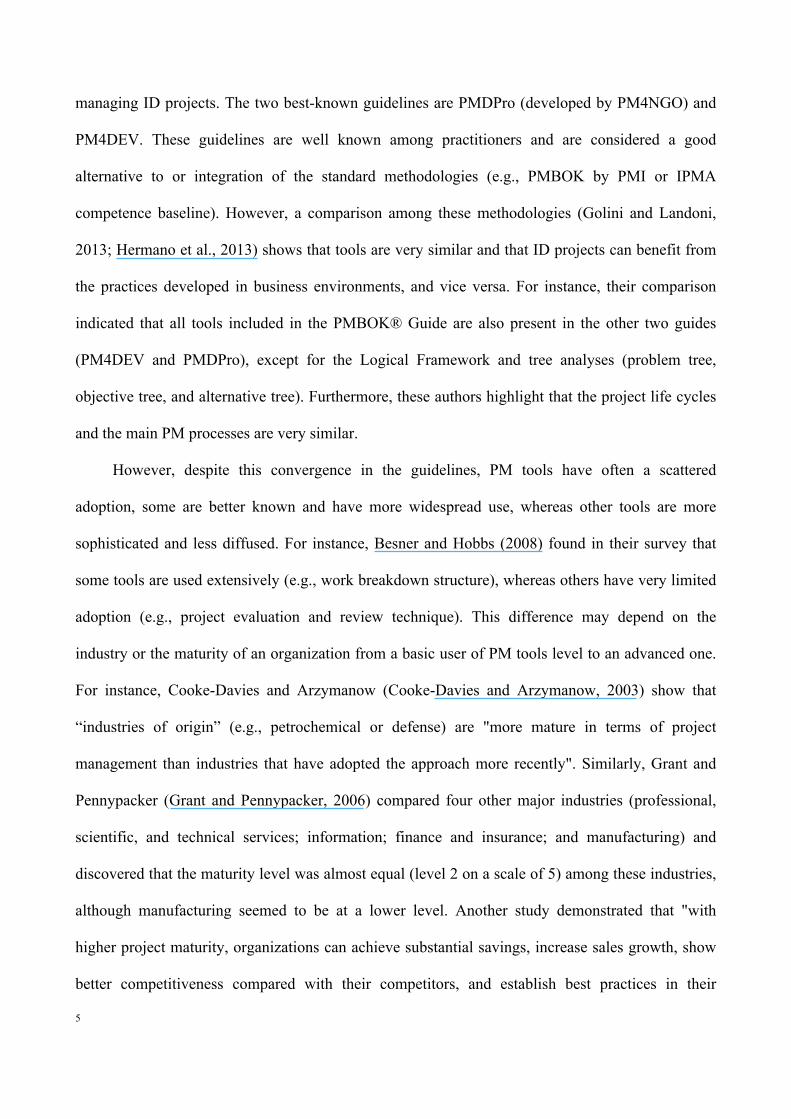
managing ID projects. The two best-known guidelines are PMDPro (developed by PM4NGO) and
PM4DEV. These guidelines are well known among practitioners and are considered a good
alternative to or integration of the standard methodologies (e.g., PMBOK by PMI or IPMA
competence baseline). However, a comparison among these methodologies (Golini and Landoni,
2013; Hermano et al., 2013) shows that tools are very similar and that ID projects can benefit from
the practices developed in business environments, and vice versa. For instance, their comparison
indicated that all tools included in the PMBOK® Guide are also present in the other two guides
(PM4DEV and PMDPro), except for the Logical Framework and tree analyses (problem tree,
objective tree, and alternative tree). Furthermore, these authors highlight that the project life cycles
and the main PM processes are very similar.
However, despite this convergence in the guidelines, PM tools have often a scattered
adoption, some are better known and have more widespread use, whereas other tools are more
sophisticated and less diffused. For instance, Besner and Hobbs (2008) found in their survey that
some tools are used extensively (e.g., work breakdown structure), whereas others have very limited
adoption (e.g., project evaluation and review technique). This difference may depend on the
industry or the maturity of an organization from a basic user of PM tools level to an advanced one.
For instance, Cooke-Davies and Arzymanow (Cooke-Davies and Arzymanow, 2003) show that
“industries of origin” (e.g., petrochemical or defense) are "more mature in terms of project
management than industries that have adopted the approach more recently". Similarly, Grant and
Pennypacker (Grant and Pennypacker, 2006) compared four other major industries (professional,
scientific, and technical services; information; finance and insurance; and manufacturing) and
discovered that the maturity level was almost equal (level 2 on a scale of 5) among these industries,
although manufacturing seemed to be at a lower level. Another study demonstrated that "with
higher project maturity, organizations can achieve substantial savings, increase sales growth, show
better competitiveness compared with their competitors, and establish best practices in their

6
industry or service sector" (Yazici, 2009). Ibbs and Kwak (Ibbs and Kwak, 2000) presented a PM
maturity model and an analysis methodology to assess the maturity of PM processes, and Crawford
(Crawford, 2002) developed another model relating the PMBOK knowledge areas (risk
management, scope management, cost management, etc.) and their level of adoption in a firm to
five maturity levels. Similarly, Pennypacker and Grant (Grant and Pennypacker, 2006), used a
model based on 5 levels (initial processes; structured process and standards; organizational
standards and institutionalized process; managed process; optimizing process).
However, these studies on the maturity of PM focused on business sectors. The development
sector has been neglected, and no information is available on NGOs. For this reason, our first
research question is as follows:
RQ1. What are the extent and the profiles of adoption of project management tools among ID
project managers working in NGOs?
Next, both the academic literature and managerial experience highlight that the proper use of
specific methodologies and tools is critical to manage projects successfully (e.g. Ika et al., 2010;
Papke-Shields et al., 2010). The general suggestion given to project managers is that the effort put
in implementing proper methodologies is justified by the benefits achieved by these tools, and
significant evidence has been provided in different managerial fields. Certification bodies, the
managerial and academic literature, and general practice indicate that companies willing to succeed
in managing projects need to be compliant with certain rules and practices. The empirical evidence
for these considerations is vast and diffused. However, there is limited empirical evidence in
support of a similar positive impact in the case of ID projects (Diallo and Thuillier, 2004; Khang
and Moe, 2008). Moreover, some tools such as the Logical Framework have been criticized as
ineffective (Biggs and Smith, 2003; Smith, 2000). In particular, there is a significant lack of

7
structured evidence concerning the impact of the adoption of PM tools on the performance achieved
by ID project managers. For this reason, ID project managers are often unaware of what makes a
project successful, as demonstrated by the high project failure rate found in these contexts
(Hermano et al., 2013). Failure in ID projects not only involves quality problems, delays, and extra
costs (i.e., internal performance) but also may mean neglecting long-term goals and their impact on
the society (i.e., external performance) (Ika et al., 2012), which are the real goals of an ID
intervention. Although some studies have found that the level of use of PM practices is related to
project success (Papke-Shields et al., 2010), very little evidence has been provided to the specific
case of ID projects (Ika et al., 2010). Therefore, this study aims to identify which methods
contribute most to improving the performance achieved by project managers. We adopt the
distinction between internal and external performance already considered for ID projects by Ika et
al. (Ika et al., 2012). Thus, the second research question we investigate is as follows:
RQ2. Which sets of tools contribute most to enhancing the internal and external performance
achieved by project managers?
3. METHODOLOGY
To answer the above research questions, an international survey was designed and
administered. The survey had a length of four pages (including a cover page with instructions). We
clearly specified that questions should be answered by a Project Manager that performed the
function for at least two years and that all responses would have been treated with absolute
confidentiality. The questionnaire was organized along three sections. The first one regarded
general information about the NGO (e.g., size, annual budget) and the projects managed by the
project manager in the last two years (e.g., size, duration, typology). In this first section also

8
information about the context of the projects and the performance achieved were asked. The second
section focused on methodologies and tools. In particular, for each international standard (e.g.,
IPMA, PMBOK) and for each tool (e.g., Gantt diagram, critical path method) we asked the
percentage of the projects adopting the tool and the level of importance within projects. Finally, the
last section was devoted to the adoption and use of the logical framework (but this section is not
used in this study). Annex 1 reports the questions used in this study as they were asked in extract of
the questionnaire. Also a description of the tools as in Annex 4 was made available to respondents.
The questionnaire was addressed to project managers of NGOs operating in the international
development field and belonging to different continents and areas of application. The research was
conducted globally to avoid biases related to single countries (e.g., diffusion of specific
methodologies, cultural biases) and to support generalizability. The surveyed project managers have
been working for different NGOs and have managed, on average, seven projects each in the last two
years (five months is the median duration of a project), of which 60% were international projects.
Project managers operating in NGOs were contacted directly using information found in
public databases (mainly the Directory of Development Organizations1) and associations of NGOs
(e.g., MESA de articulation2, CONCORD3). It is important to remind that the organizations listed in
these databases do not necessarily have ID projects in their portfolio. Because of this, we clearly
stated at the beginning of the questionnaire that the survey was aimed to organizations dealing with
ID projects and, to make it sure, we also introduced a control question in the survey. Contacts with
NGOs’ networks were very important to increase the size of the sample and to avoid sample biases.
1 http://www.devdir.org
2 http://mesadearticulacion.org/
3 http://www.concordeurope.org/

9
NGOs were contacted by email and phone, when possible, to increase the response rate. Contacts
were searched and managed globally to avoid limiting our considerations to a specific area or
country. The survey was administered in 2012 and the data-gathering process lasted for about four
months. Eventually, 496 organizations provided information useful for the purpose of the research.
Around 30,000 email and phone contacts were made in order to construct the sample, and a
response rate of 1.6 per cent was obtained. Given this quite low response rate (Baruch, 1999;
Melnyk et al., 2012), we contacted about fifty non-respondents by telephone, but we could not
identify a particular reason for the non-responses (e.g., lack of time, lack of interest in the research,
not dealing with ID projects, the NGO secretary did not forward the email to the project managers).
In order to support the validity of our sample, we also checked possible biases due to late
respondents, non-respondents and contacts established through different channels (e.g. email,
telephone), finding that our sample was not affected by such biases. Further analyses indicated that
the low response is mainly due to the fact that many of the organizations contacted did not actually
manage ID projects (about half of the contacts).
Table 1 provides a description of the considered sample. It can be seen that the sample is distributed
among all continents, with a vast majority based in Europe and Africa. The size of the NGOs
considered is rather variable. A significant amount of the sample includes small organizations (57%
of the sample is characterized by less than 20 employees), but the data also consider larger
organizations (i.e., more than 500 employees). The majority of projects (approximately 80%) are
“soft” (i.e., related to the development of services and raising awareness), whereas the share of
“hard” projects (i.e., delivery and integration of equipment and construction of infrastructure) is
approximately 7%.
TABLE 1 ABOUT HERE

10
The level of adoption of PM tools was measured by asking project managers to provide the
percentage of projects in which each tool was employed (measures were based on a 1-5 Likert
scale, on which 1 represented 0% of the projects, 2 represented 1-25%, 3 represented 26-50%, 4
represented 51-75%, and 5 represented 76-100%).
Tools were selected on the basis of a review of the major reference guides in PM in general
(e.g., PMBOK® Guide) and in the ID project field (e.g., PM4DEV, PM4NGOs). Performance
achieved was measured by different items related to internal and external project results – similarly
to Ika et al. (2012). Internal project results (i.e., compliance with time, budget and quality) are the
classical performance indicators of a project and are those for which the NGO is directly
accountable to the donors (Basu, 2013; Hermano et al., 2013). However, it is widely accepted, not
only in the development field, that these measures of performance should be complemented by
other measures (Atkinson, 1999). Considering the literature from different streams (e.g. PM and
economic development) we included the following items (that we have labelled “external project
results”):
• obtain long-term project impact (outcome/goal) (Atkinson, 1999; Edwards and Hulme, 1996;
Salmen, 1987);
• stakeholder/partner involvement (Atkinson, 1999; Bryde, 2003; Clarkson, 1995)
• ownership extension of the project to the local community; (Bracht et al., 1994; Florin and
Wandersman, 1990);
• monitoring and reporting to the stakeholders; (Hermano et al., 2013; Hillman and Keim,
2001);
• economic sustainability after the end of the project; (Barrett and Browne, 1991; Tisdell, 1996)
(Zeller and Meyer, 2002);
• satisfaction of the local community) (Hermano et al., 2013; Ika et al., 2012; Prokopy, 2005;
Toor and Ogunlana, 2010).

11
Table 2 provides the different measures that were used. Project managers were asked to assess this
performance on a 1-5 Likert scale, where 1 represented “Very Low” and 5 represented “Very
High”.
TABLE 2 ABOUT HERE
In order to address the limitations related to self-reported measures we have performed a common
method bias analysis. In fact, self-reported measures can be subject to social desirability thus
generating non-real correlations among the variables. First of all, the questionnaire is designed
following the guidelines provided by the literature (Malhotra et al., 2006): we have guaranteed
anonymity to the respondents and the questions are clear and concise. We also performed Harman’s
single factor test4 showing that a single factor accounts only for the 33% of the variance, confirming
the absence of biases (Podsakoff et al., 2003).
4. RESULTS
(a) Project management tools adoption (RQ1)
To answer the first research question, a two-step cluster analysis was performed. The cluster
analysis considered the variables that measure the adoption of each tool so that natural groupings
(or clusters) within the dataset could be revealed. First, hierarchical cluster analysis, based on
squared Euclidean distance and the Ward method, was used to identify the most suitable number of
4 The test was performed considering the variables representing the adoption of the tools and the
performance.

12
clusters and the cluster centroids. The hierarchical cluster analysis suggested four clusters. Next, the
K-means clustering algorithm was used to iteratively assign each NGO to a cluster (Ketchen and
Shook, 1996).
Table 3 provides a description of the four identified cluster. First, it can be seen that the extent
of adoption of the different tools is largely variable. Some tools are extensively adopted (e.g.,
logical framework and progress report), whereas others are almost neglected (e.g., earned value
management system, issue log). Project managers grouped within the first cluster appear to adopt
only a very limited set of basic tools (i.e., Logical Framework and progress report). Within cluster
number 2, the adoption of these basic tools significantly increases, as does the adoption of other
well-known tools (i.e., Gantt diagrams, cost accounting, and risk analysis and management).
However, more structured and complex tools are still overlooked. In contrast, project managers
grouped within the third cluster begin to manage their projects using a wider set of tools, including
all of the resource management tools (scope management, organizational breakdown structure,
responsibility assignment matrix, stakeholder matrix), although they still overlook some important
control and time/cost planning tools. Lastly, project managers grouped within the fourth cluster
adopt the widest range of tools. A detailed description of each tool is reported in Annex 4.
TABLE 3 ABOUT HERE
PM maturity is defined in the literature as an organization’s capabilities in relation to the PM
processes (management of time, scope, quality, etc.) along the different phases of the project life-
cycle (Ibbs and Kwak, 2000). Specific tools have been developed to manage such processes, and we
measured the extent of adoption of these tools. As shown in Table 3, there are relevant differences
in the adoption of tools in our sample, indicating different degrees of maturity of PM in the ID
projects case. The different clusters are not characterized by high or low adoption of specific sets of

13
tools but rather by the progressive and increasing adoption of tools moving from cluster 1 to cluster
4. We move from a very simple case (i.e., cluster 1) in which few practices are considered to a case
in which all practices are taken into account (i.e., cluster 4). This evidence suggests that practices
can be described by different stages of adoption.
Annex 2 reports descriptive statistics of the clusters: NGOs in cluster 3 and 4 tend to be larger and
to manage longer and bigger projects. On the other side, we did not find significant differences in
the distribution of clusters by country nor project typology (Annex 2).
(b) Tool adoption and performance achieved (RQ2)
The previous results indicate that tool adoption evolves through four stages. Thus, the use of tools
at a certain stage is influenced by the use of tools at other stages (e.g., tools at Stage 1 influence
tools at Stage 2). For this reason, we aim to evaluate which tools have the most significant impact
on both internal and external performance. To assess the impact of tool adoption on the
performance achieved by project managers, a Structural Equation Modeling (SEM) analysis is
conducted. In particular, the analysis aims to evaluate which set of tools contributes most to
enhancing internal and external performance. Figure 1 shows the causal model hypothesized in the
analysis. The model aims to evaluate simultaneously the relative impact of the four stages on
performance, verifying the evolutionary relationship between stages and the relationship between
internal and external performance. In Annex 3 the actual structure of the model is reported.
FIGURE 1 ABOUT HERE
The variables “Tools stage 1”, “Tools stage 2”, “Tools stage 3”, and “Tools stage 4” are
defined as the average adoption of the tools included in each single stage. For instance, the “Tools
stage 1” variable is calculated as the average adoption of the logical framework and the progress
report. We expect the different stages to be related to each other; in particular, we argue that the
14
adoption of tools at later stages can be performed only when the previous stage is adopted. Thus, we
expect a progressive adoption to characterize the considered stages. A similar approach can be
found in Rosenzweig and Roth (2004). The dependent variables (i.e., internal and external project
performance) are caused by one or more variables within the model. Here, two different groups of
performance measures are considered: external and internal project performance. The first includes
all long-term goals of a project/organization, such as obtaining the long-term project impact,
stakeholder/partner involvement, ownership extension of the project to the local community,
monitoring and reporting to the stakeholders, economic sustainability after the end of the project,
and the satisfaction of the local community. These items can be grouped together because they are
all measures of external performance that refer to the long-term impact of the project results
(strategic performance).
By grouping together variables such as the project’s compliance with the budget, the expected
time, and the quality, it is possible to develop a good indicator of the internal performance achieved
by project managers. Therefore, internal performance refers to those measures that relate directly to
the outcome of the project. We expect internal performance to be associated with external
performance. In particular, we expect that projects that achieve better internal performance will be
able to improve their external performance. For this reason, in the theoretical model, we assume a
positive relationship between the two performance measures.
By hypothesizing a four-stage process of PM tool adoption, a series of underlying
assumptions are made and must be tested. In particular, the stage model implies that tool adoption
enhancements are attained in a progression. This implies that the described model allows us to
evaluate which tools contribute more to the different performances. Furthermore, we assume that
more complex tools mediate the impact of different tools on performance. The proposed model
allows evaluating these mediation effects, highlighting which tools contribute the most to
improving the different performance measures.

15
The model was evaluated using IBM – SPSS AMOS software. The resulting model’s chi-
square statistic (chi square=6.025, 3 df, p=0.110) indicates excellent overall fit (see Table 4). The
chi-square/df test provides support for model fit because it is within the range of a “good” fit value
(i.e. 2.01<3). The supplementary stand-alone fit index 1-RMSEA as well as the incremental fit
indices (IFI, NFI, CFI) shown in Table 4 provide additional support for model fit because they are
within the ranges of “good” fit values (Gefen et al., 2000; Hu and Bentler, 1999).
TABLE 4 ABOUT HERE
Table 5 provides the results of the SEM analysis. The model supports the hypothesis that the tool
adoption enhancements are attained in a progression, from Stage 1 to Stage 4. As predicted, these
multivariate results provide empirical evidence supporting the sequencing in tool adoption, as
previously described in the four-stage tool adoption process.
TABLE 5 ABOUT HERE
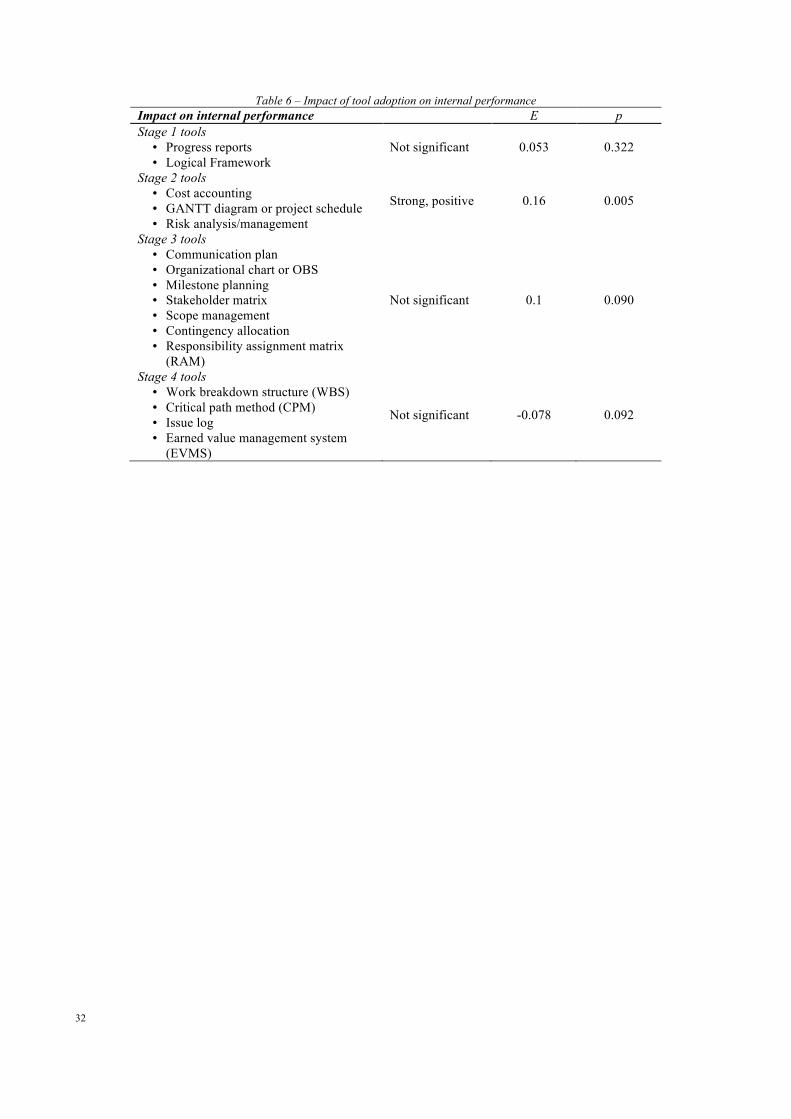
Considering the impact of tool adoption on internal project performance, it can be seen
that the contribution of the set of tools included in the first stage does not significantly contribute
(E=0.053, p=0.322) to improving internal performance. Conversely, the set of tools in the second
stage has a strong positive effect (E=0.16, p=0.005) on internal performance. Finally, the effect of
the tools in stage 3 and 4 on internal performance is not significant (E=0.1, p=0.09 and E= -0.078,
p=0.092).
TABLE 6 ABOUT HERE

16
The results of this analysis are of particular interest for project managers and NGOs because it
can be argued that the set of tools that contribute most to enhancing internal performance are those
included in the second stage of the tool adoption process. This finding indicates that internal
performance can be significantly improved by relying on the basic PM tools adopted by project
managers of the second cluster (that encompasses also the tools of the first cluster). The path
analysis confirms that the methods included in the second stage of the tool adoption process (Gantt,
cost accounting, and risk analysis/management), in combination with those of the first stage
(Progress reports, Logical Framework) are those that significantly improve internal performance
(E=0.160, p=0.005). However, the additional tools adopted at the third and fourth stage is not
significantly improving internal performance. This result can be interpreted considering that the
adoption of complex tools and methodologies, besides the positive effects, requires also additional
costs and time, thus their impact on internal project performance is neutral.
However, when considering the impact of tools adoption on external project performance, a
different picture emerges. Although the contribution of the tools included in the first and second
stages of the tool adoption process can be considered non-significant, this is not true for the tools
associated with the third stage. In fact, all of the human resource management tools (Responsibility
Assignment Matrix, stakeholder matrix, OBS, and communication plan) and the others included in
this stage (scope management, contingency allocation, and communication plan) have a strong
positive impact (E=0.134, p=0.007) on external performance.
TABLE 7 ABOUT HERE
Finally, the tools in stage 4 are not significant on external performance. This result indicates that the
set of tools that contribute most to enhancing external performance are those included in the third
stage of the tool adoption process.

17
Lastly, as expected, internal performance strongly and positively impacts external (strategic)
performance (E=0.458, p=0.000).
5. DISCUSSION AND CONCLUSIONS
The results of this work have shown that in NGOs, some PM tools are frequently adopted (e.g.,
logical framework, progress report), whereas others appear to be neglected (e.g., critical path
method, issue log, earned value management system). Typically, NGOs are more likely to adopt
simple techniques than to focus on more structured and analytical methodologies. Our cluster
analysis allowed us to clearly identify specific maturity stages characterized by different levels of
tools adoption. The gradual leaps observed in the adoption of tools by project managers indicate
that a progression model regulates the tools adoption process. This result may indicate that a
learning model exists that describes the evolution of project managers’ expertise regarding standard
PM practices. This conclusion supports the view of a virtuous learning circle that was also
originally embed in the project cycle management approach (Biggs and Smith, 2003). This evidence
is in line to what was found by other scholars running large scale surveys within business
organizations (White and Fortune, 2002). In summary, differences in tool adoption among project
managers can be explained by the different organizational PM maturity levels of the organization
for which they work. In mature organizations, a higher level of tools adoption is more likely to
occur.
However, differences also exist among private and non-profit organizations. In our data, the logical
framework is one of the most widespread tools, while in standard PM guides (e.g., PMBOK ®
Guide) it is not even mentioned (Golini and Landoni, 2014). On the other side, the work breakdown
structure and critical path method belong to the most advanced cluster while they were found by
previous scholars as the most adopted tools in industry (White and Fortune, 2002). In our view,
both profit and non-profit fields could benefit from each other. Project managers working in the

18
industry consider the definition of clear goals and objectives one of the most critical aspects
(Hyvari, 2006). In this sense the Logical Framework could be a useful tool to be exported to the
business practice. On the other side, the Work Breakdown Structure is fundamental for a correct
definition of the activities and project conceptualization (Globerson, 1994). As a consequence, we
strongly advise project managers working in NGOs to adopt this tool even at early stages.
Moving to the project characteristics, project managers who adopt only a small set of basic
tools are likely to manage only a few small projects despite the type of project or the geographical
location (Annex 2). These differences in tool adoption among NGOs would not be of particular
concern if they had no impact on the outcomes of projects. Although the project managers who
participated in the research generally declared medium-high performance, there are significant
differences in terms of achieved performance among different clusters of project managers. Project
managers who adopt a wider range of tools are more likely to achieve higher external and internal
performance. This finding indicates that organizations that invest more in these methods are capable
of improving their performance, confirming that the project managers’ learning model affects
performance. Thus, it is important to increase both awareness and knowledge of these tools among
NGOs. However, the relationship is not linear, i.e., only some sets of tools do actually improve the
performance. This finding highlights a general trade-off for project managers of every organization
between the contribution of each tool to performance improvement and the necessary effort for its
application.
Our results show that at the first stage only the basic tools are adopted because they are required to
receive funding, but there is a lack of knowledge of practical principles of PM and this brings to a
lower performance. As the project manager feels the need to improve performance, he or she learns
to use new tools (second stage) and acquires core knowledge about PM principles and practices,
strongly increasing the project’s internal performance. In stages 3 and 4 there is a refinement of
managerial techniques through the acquisition of new expertise, which expands the core

19
competences acquired at stage 2. This factor is characterized as induced learning. It represents a
conscious effort by project managers to enhance their managerial expertise regarding standard tools.
The SEM analysis provides evidence of this pattern.
The analysis of external (long-term) performance, in contrast, highlights a different pattern. In
particular, the first two stages do not have a direct impact on external performance; this impact
occurs only indirectly through the project’s internal performance. On the contrary, the tools in stage
3 have a relevant impact on external performance, indicating that the maturity achieved at these
stages allows project managers to focus their attention not only on the project and its short-term
performance, but also on the long-term impact and the real reasons why the project is conducted.
Bringing all together, the model’s results provide empirical evidence confirming the validity
of the four-stage tools adoption process. This finding underlines that tool adoption enhancements
are attained in a progression. Furthermore, the analysis indicates that the methods included in the
second stage of the tool adoption process (Gantt chart, cost accounting, and risk
analysis/management) significantly improve internal project performance. This result is not
surprising because these tools are the ones that specifically address PM issues such as budget and
time compliance. Moreover, as previously discussed, because the peculiarities of several ID projects
can be addressed by using these tools, projects are more likely to have successful results.
When external (strategic) performance measures are considered, the analysis shows that the
methods that significantly contribute to enhancing internal project performance differ from those
that influence internal performance. In particular, external performance can be significantly
improved by adopting the set of tools included in the third stage of the tool adoption process. Once
again, this is due to the nature of the methods considered: tools such as the stakeholder matrix,
responsibility assignment matrix, organizational breakdown structure, and communication plans can
address specific human resource management and strategic performance issues, such as monitoring
and reporting to stakeholders and managing their involvement. In fact, the peculiarities of typical ID

20
projects, such as complex stakeholder management and difficulty in using PM techniques in the
context of other cultures, can be addressed by adopting these methods. Although the other methods
included in the third stage of the tool adoption process (i.e., work breakdown structure, milestone
planning, contingency allocation, and scope management) focus on addressing short-term, project-
related issues, they may indirectly contribute positively to enhancing long-term performance.
Lastly, the path analysis confirms that internal project performance strongly and positively affects
external (strategic) performance. This is in line with several studies that have demonstrated that
organizational performance improvements are associated with improved process maturity (Herbsleb
et al., 1997).
In conclusion, this work provides original evidence on the adoption and impact of PM tools
on project performance in NGOs. The results contribute to the stream of research on practice
effectiveness because they provide empirical evidence of the critical role of some practices in
improving performance. Furthermore, the work contributes to the application of PM in the field of
ID projects. This area of research remains rather neglected. Given the important social and
economic role of these projects and the difficulties of their management, we argue that more
attention should be paid to this area.
From a managerial perspective, this work suggests to project managers that investments in
developing knowledge and practices tend to pay off in terms of improved performance, but they
should be conducted according to a progression. Thus, investments should be planned and
conducted coherently with the project’s environment and characteristics. This evidence also
explains why larger organizations do not have systematically better performance than smaller ones,
even if larger organizations have on average a higher level of maturity in the adoption of tools (see
Annex 2). Thus, we cannot conclude that some tools are made just for large organizations while
others fit also for small organizations: the use of some tools is beneficial regardless the
characteristics of the projects.

21
Such results can also be useful for scholars and practitioners dealing with business
organizations. First of all we provide a way to assess (via cluster analysis and SEM) the existence of
maturity stages in the adoption of PM tools. Next, we highlight the existence of a complex
relationship between these stages and project performance. In particular, we show how it is not
necessary to adopt all the tools as a whole, but every organization should find the right balance
among the tools. Finally, we show how long term outcomes of the project can be achieved both via
internal project performance and the correct adoption of the tools.
This work is not free from limitations. First, the work evaluates the level of adoption of PM
techniques, assuming that the adoption of these techniques is conducted properly. Moreover, there
can be an effect of organizational culture on the effective employment of PM techniques (Biggs and
Smith, 2003) that we did not consider in our paper. Future work may take this issue into account
and address the problem of specifically measuring the impact of the adoption of techniques by
controlling for their correct use. Next, the measures employed in this study are self-reported. Even
if this is quite common in PM surveys (e.g. Jun et al., 2011; Mullaly, 2006) and we controlled the
extent of common method bias, having external and independent performance measure could
further improve the reliability of the results. Moreover, the work is based on an extensive survey
approach that allowed us to shed light on the analyzed relationships. However, the adopted research
approach turned out to have a quite low response rate. Because of the difficulties to establish
preliminary phone contacts with NGOs around the world we followed a mailing strategy where
usually 1-2% response rate is expected. Other scholars had similar response rates using similar
approaches (e.g., Martinsuo et al., 2006). One of the reasons for the low response rate can be also
related to the fact that, since the PM discipline is quite new for NGOs, the level of interest in our
study might have been quite low. Moreover, the adopted instrument does not allow us to fully
understand “why” the identified relationships exist. We suggest that future work should focus on
understanding the reasons and conditions under which these relationships hold by means of

22
different research methodologies (e.g., case studies or action research). For instance, even if the
four clusters are quite evenly distributed by typology of projects and continent, future studies could
test the moderation effect of these factors on the relationship between tools adoption and
performance. Such research design could show what type of tools or best practices better suit
different project contexts. Finally, project success can also be determined by the leadership style
and soft skills of the project manager (Müller and Turner, 2010) as well as by stakeholder
management and involvement (e.g. participatory approaches) (Prokopy, 2005). While in this paper
we decided to focus on tools, these factors could be included in future developments.

23
Acknowledgments
The authors would like to thank Matteo Falgari and Giacomo Rossi for their support in the data
collection phase. Furthermore the authors gratefully acknowledge financial support received by the
PMI Sponsored Research Program.
6. REFERENCES
Ahlemann, F., Teuteberg, F., Vogelsang, K., 2009. Project management standards-Diffusion and application in Germany and Switzerland. International Journal of Project Management, 27, 292-303.
Ahsan, K., Gunawan, I., 2010. Analysis of cost and schedule performance of international development projects. International Journal of Project Management, 28, 68-78.
Atkinson, R., 1999. Project management: cost, time and quality, two best guesses and a phenomenon, its time to accept other success criteria. International Journal of Project Management, 17, 337-342.
Barrett, H., Browne, A., 1991. Environmental and economic sustainability: women's horticultural production in the Gambia. Geography, 241-248.
Baruch, Y., 1999. Response rate in academic studies-A comparative analysis. Human Relations, 52, 421-438.
Basu, R., 2013. Managing quality in projects: An empirical study. International Journal of Project Management.
Baum, W.C., 1970. The project cycle. Finance and development, 7, 2-13.
Besner, C., Hobbs, B., 2008. Project management practice, generic or contextual: A reality check. Project Management Journal, 39, 16-33.
Biggs, S., Smith, S., 2003. A paradox of learning in project cycle management and the role of organizational culture. World Development, 31, 1743-1757.
Bracht, N., Finnegan, J.R., Rissel, C., Weisbrod, R., Gleason, J., Corbett, J., Veblen-Mortenson, S., 1994. Community ownership and program continuation following a health demonstration project. Health Education Research, 9, 243-255.
Bryde, D.J., 2003. Modelling project management performance. International Journal of Quality & Reliability Management, 20, 229-254.
Clarkson, M.E., 1995. A stakeholder framework for analyzing and evaluating corporate social performance. Academy of Management Review, 20, 92-117.
Cooke-Davies, T.J., Arzymanow, A., 2003. The maturity of project management in different industries: An investigation into variations between project management models. International Journal of Project Management, 21, 471-478.
Crawford, J.K., 2002. Project management maturity model; providing a proven path to project management excellence. CRC Press.
Crawford, L., Hobbs, B., Turner, R., 2005. Project categorization systems: Aligning capability with strategy for better results.
Dahlman, C.J., Ross-Larson, B., Westphal, L.E., 1987. Managing technological development: lessons from the newly industrializing countries. World Development, 15, 759-775.
24
Diallo, A., Thuillier, D., 2004. The success dimensions of international development projects: the perceptions of African project coordinators. International Journal of Project Management, 22, 19-31.
Diallo, A., Thuillier, D., 2005. The success of international development projects, trust and communication: an African perspective. International Journal of Project Management, 23, 237-252.
Edwards, M., Hulme, D., 1996. Too close for comfort? The impact of official aid on nongovernmental organizations. World Development, 24, 961-973.
Florin, P., Wandersman, A., 1990. An introduction to citizen participation, voluntary organizations, and community development: Insights for empowerment through research. American Journal of Community Psychology, 18, 41-54.
Gefen, D., Straub, D., Boudreau, M.C., 2000. Structural equation modeling and regression: Guidelines for research practice. Communications of the Association for Information Systems, 4, 7.
Globerson, S., 1994. Impact of various work-breakdown structures on project conceptualization. International Journal of Project Management, 12, 165-171.
Golini, R., Landoni, P., 2013. International Development Projects: Peculiarities and Managerial Approaches. Project Management Institute, Newtown Square, Pennsylvania.
Golini, R., Landoni, P., 2014. International development projects by nongovernmental organizations: an evaluation of the need for specific project management and appraisal tools. Impact Assessment and Project Appraisal, (in press).
Golini, R., Landoni, P., Mozzi, D., 2012. International Development Projects By Non-Governmental Organizations: Peculiarities And Methodologies, PMI Research Conference, Limrick (Ireland).
Gow, D.D., Morss, E.R., 1988. The notorious nine: Critical problems in project implementation. World Development, 16, 1399-1418.
Grant, K.P., Pennypacker, J.S., 2006. Project management maturity: an assessment of project management capabilities among and between selected industries. Engineering Management, IEEE Transactions on, 53, 59-68.
Hanisch, B., Wald, A., 2012. A bibliometric view on the use of contingency theory in project management research. Project Management Journal, 43, 4-23.
Herbsleb, J., Zubrow, D., Goldenson, D., Hayes, W., Paulk, M., 1997. Software quality and the capability maturity model. Communications of the ACM, 40, 30-40.
Hermano, V., Lopez-Paredes, A., Martin-Cruz, N., Pajares, J., 2013. How to manage international development (ID) projects successfully. Is the PMD Pro1 Guide going to the right direction? International Journal of Project Management, 31.
Hillman, A.J., Keim, G.D., 2001. Shareholder value, stakeholder management, and social issues: what's the bottom line? Strategic Management Journal, 22, 125-139.
Hu, L., Bentler, P.M., 1999. Cutoff criteria for fit indexes in covariance structure analysis: Conventional criteria versus new alternatives. Structural Equation Modeling: A Multidisciplinary Journal, 6, 1-55.
Hyvari, I., 2006. Success of projects in different organizational conditions. Project Management Journal, 37, 31.
Ibbs, C.W., Kwak, Y.H., 2000. Assessing project management maturity. Project Management Journal, 31, 32-43.
Ika, L.A., 2012. Project Management for Development in Africa: Why Projects Are Failing and What Can Be Done About It. Project Management Journal, 43, 27-41.
Ika, L.A., Diallo, A., Thuillier, D., 2010. Project management in the international development industry: The project coordinator's perspective. International Journal of Managing Projects in Business, 3, 61-93.
Ika, L.A., Diallo, A., Thuillier, D., 2012. Critical success factors for World Bank projects: An empirical

25
investigation. International Journal of Project Management, 30, 105-116.
Jun, L., Qiuzhen, W., Qingguo, M., 2011. The effects of project uncertainty and risk management on IS development project performance: A vendor perspective. International Journal of Project Management, 29, 923-933.
Ketchen, D.J., Shook, C.L., 1996. The application of cluster analysis in strategic management research: an analysis and critique. Strategic Management Journal, 17, 441-458.
Khang, D.B., Moe, T.L., 2008. Success criteria and factors for international development projects: A life cycle based framework. Project Management Journal, 39, 72-84.
Korten, D.C., 1987. Third generation NGO strategies: A key to people-centered development. World Development, 15, 145-159.
Landoni, P., Corti, B., 2011. The management of international development projects: Moving toward a standard approach or differentiation? Project Management Journal, 42, 45-61.
Lovegrove, N., Gebre, B., Lee, T., Kumar, R., 2011. McKinsey-Devex survey results: Practitioners see need for new approaches to system-wide reform. McKinsey-Devex.
Malhotra, N.K., Kim, S.S., Patil, A., 2006. Common method variance in IS research: A comparison of alternative approaches and a reanalysis of past research. Management Science, 52, 1865-1883.
Martinsuo, M., Hensman, N., Artto, K., Kujala, J., Jaafari, A., 2006. Project-based management as an organizational innovation: Drivers, changes, and benefits of adopting project-based management. Project Management Journal, 37, 87.
Melnyk, S.A., Page, T.J., Wu, S.J., Burns, L.A., 2012. Would you mind completing this survey: Assessing the state of survey research in supply chain management. Journal of Purchasing and Supply Management, 18, 35-45.
Morss, E.R., 1984. Institutional destruction resulting from donor and project proliferation in Sub-Saharan African countries. World Development, 12, 465-470.
Mullaly, M., 2006. Longitudinal analysis of project management maturity. Project Management Journal, 37, 62.
Müller, R., Turner, R., 2010. Leadership competency profiles of successful project managers. International Journal of Project Management, 28, 437-448.
OECD, 2008. OECD annual report 2008, Paris, France.
OECD, 2009. Development Co-operation Report 2009.
Papke-Shields, K.E., Beise, C., Quan, J., 2010. Do project managers practice what they preach, and does it matter to project success? International Journal of Project Management, 28, 650-662.
Payne, J.H., Turner, R.J., 1999. Company-wide project management: the planning and control of programmes of projects of different type. International Journal of Project Management, 17, 55-59.
Podsakoff, P.M., MacKenzie, S.B., Lee, J.Y., Podsakoff, N.P., 2003. Common method biases in behavioral research: A critical review of the literature and recommended remedies. Journal of applied psychology, 88, 879-903.
Prokopy, L.S., 2005. The relationship between participation and project outcomes: Evidence from rural water supply projects in India. World Development, 33, 1801-1819.
Rosenzweig, E.D., Roth, A.V., 2004. Towards a Theory of Competitive Progression: Evidence from High Tech Manufacturing. Production and Operations Management, 13, 354-368.
Salmen, L.F., 1987. Listen to the people: Participant-observation evaluation of development projects; Listen to the people: Participant-observation evaluation of development projects. Oxford University Press.
Smith, P., 2000. A comment on the limitations of the logical framework method, in reply to Gasper, and to

26
Bell. Public Administration and Development, 20, 439-441.
Tisdell, C., 1996. Economic indicators to assess the sustainability of conservation farming projects: an evaluation. Agriculture, ecosystems & environment, 57, 117-131.
Toor, S.-u.-R., Ogunlana, S.O., 2010. Beyond the ‘iron triangle’: Stakeholder perception of key performance indicators (KPIs) for large-scale public sector development projects. International Journal of Project Management, 28, 228-236.
White, D., Fortune, J., 2002. Current practice in project management--an empirical study. International Journal of Project Management, 20, 1-11.
Yazici, H.J., 2009. The role of project management maturity and organizational culture in perceived performance. Project Management Journal, 40, 14-33.
Youker, R., 2003. The nature of international development projects, PMI Conference, Baltimore.
Zeller, M., Meyer, R.L., 2002. The triangle of microfinance: financial sustainability, outreach, and impact. Johns Hopkins University Press.

27
7. Tables
Table 1 – Descriptive statistics
Continent % N. employees (NGO) % Average project
size (USD) % Type of projects %
Africa 27 < 20 57 <100,000 35.9 Delivery and integration of equipment 1.7
America 11 21-50 18 100,000 – 200,000 23.6 Construction of infrastructures 5.5
Asia 21 51-100 11 200,000 – 500,000 17.2 Develop of services (education, finance, etc.) 58.0
Europe 40 101-500 9 500,000 + 20.7 Raising awareness (human rights, etc.) 22.7
Oceania 1 > 500 5 Missing 2.6 Other 10.3 Missing 1.7 Total 100 Total 100 Total 100 Total 100

28
Table 2 – Project performance measures
Type of performance Performance measures Internal (project) performance Comply with the budget
Comply with the expected time Comply with the quality (deliver exactly the output expected)
External (project) performance
Obtain long-term project impact (outcome/goal) Stakeholder/partner involvement Ownership extension of the project to the local community Monitoring and reporting to the stakeholders Economic sustainability after the end of the project Satisfaction of the local community

29
Table 3 – Adoption of tools by the four clusters from 1-5. Tools are listed by decreasing average value (values above 2.9 are highlighted in grey)
Practice Cluster 1 Cluster 2 Cluster 3 Cluster 4 Average Progress reports 2.94 4.63 4.67 4.95 4.47 Logical Framework 3.19 4.40 4.23 4.73 4.22 Cost accounting 2.08 4.22 4.40 4.85 4.11 GANTT diagram or project schedule 2.19 3.22 3.96 4.37 3.59 Risk analysis/management 1.92 3.15 3.82 4.42 3.49 Communication plan 2.35 2.65 3.86 4.55 3.46 Organizational chart or OBS 1.54 2.62 3.73 4.58 3.28 Milestone planning 1.94 2.46 3.66 4.50 3.26 Stakeholder matrix 1.94 1.97 3.51 4.30 3.03 Scope management 1.46 2.04 3.06 4.28 2.79 Contingency allocation 1.73 2.05 2.99 3.92 2.73 Responsibility assignment matrix (RAM)
1.38 1.66 3.15 4.60 2.77
Work breakdown structure (WBS) 1.46 1.88 2.89 4.37 2.68 Critical path method (CPM) 1.40 1.64 2.73 3.88 2.46 Issue log 1.29 1.47 2.70 3.85 2.38 Earned value management system (EVMS)
1.17 1.20 2.07 3.70 2.00
Number of NGO (%)
46 (13.2%)
92 (26.4%)
150 (43.1%)
60 (17.2%)

30
Table 4 –Model fit indexes Fit indices Fit statistic value
Stand-alone Actual value Recommended value
Chi-Square 6.025 - Degrees of Freedom (df) 3 - Probability Level .110 >.10 Chi-Square/df 2.01 <3 1-Root Mean-Square-Error (1-RMSEA) .054 <.05 Incremental Incremental Fit Index (IFI) .996 >.90 Normed Fix Index (NFI) .992 >.90 Comparative Fit Index (CFI) .996 >.90

31
Table 5 – Estimates of the SEM model Outcomes Predictor Estimate S.E. C.R. P Tools stage 2 ß Tools stage 1 0.689 0.048 14.446 0.000 Tools stage 3 ß Tools stage 2 0.644 0.043 14.917 0.000 Tools stage 4 ß Tools stage 3 0.764 0.042 18.054 0.000 Internal performance ß Tools stage 1 0.053 0.054 0.99 0.322
ß Tools stage 2 0.160 0.057 2.834 0.005
ß Tools stage 3 0.100 0.059 1.696 0.090
ß Tools stage 4 -0.078 0.046 -1.684 0.092
External performance ß Tools stage 1 -0.064 0.045 -1.41 0.158
ß Tools stage 2 -0.038 0.048 -0.786 0.432
ß Tools stage 3 0.134 0.05 2.694 0.007
ß Tools stage 4 0.067 0.039 1.706 0.088
ß Project performance 0.458 0.046 9.879 0.000
32
Table 6 – Impact of tool adoption on internal performance Impact on internal performance E p Stage 1 tools
• Progress reports • Logical Framework
Not significant 0.053 0.322
Stage 2 tools • Cost accounting • GANTT diagram or project schedule • Risk analysis/management
Strong, positive 0.16 0.005
Stage 3 tools • Communication plan • Organizational chart or OBS • Milestone planning • Stakeholder matrix • Scope management • Contingency allocation • Responsibility assignment matrix
(RAM)
Not significant 0.1 0.090
Stage 4 tools • Work breakdown structure (WBS) • Critical path method (CPM) • Issue log • Earned value management system
(EVMS)
Not significant -0.078 0.092

33
Table 7 – Impact of tool adoption on external performance Impact on external performance E p Stage 1 tools
• Progress reports • Logical Framework
Not significant -0.064 0.158
Stage 2 tools • Cost accounting • GANTT diagram or project schedule • Risk analysis/management
Not significant -0.038 0.432
Stage 3 tools • Communication plan • Organizational chart or OBS • Milestone planning • Stakeholder matrix • Scope management • Contingency allocation • Responsibility assignment matrix
(RAM)
Strong, positive 0.134 0.007
Stage 4 tools • Work breakdown structure (WBS) • Critical path method (CPM) • Issue log • Earned value management system
(EVMS)
Not significant 0.067 0.088
Project performance Strong, positive 0.458 0.000

34
1. FIGURES
Figure 1 – Theoretical model

35
ANNEX 1 – EXTRACT OF THE QUESTIONNAIRE
Note: only questions used in the paper are included
Section A: General Information
In the following questions, please refer to your country data:
Size of the NGO (# of employees): ___________ Number of projects per year:___________
How many projects have you managed in the last 2 years:________ of which______were international (i.e. beneficiaries live
in another country
Average project duration: __________ months
Average size of the managed projects in the last 2 years (USD):
x < 100.000
100.000 < x < 200.000
200.000 < x < 500.000
x > 500.000
Please specify the prevalent aims of the projects you managed in the last 2 years:
Delivery and integration of products and tools (e.g., medical,
IT, energy equipments)
Construction of buildings or
infrastructures
Development of social, economic, health, and environmental services (education, finance,
diseases,..)
Awareness raising and
campaigning (human rights,
environment, …)
Other: _________
Indicate the importance of the following results for different actors and the performance achieved (1: Very Low - 5: Very High):
Importance for the NGO Average performance achieved on the projects
Comply with the budget Not used in this paper 1 2 3 4 5 Comply with the expected time Not used in this paper 1 2 3 4 5 Comply with quality (deliver exactly the output expected) Not used in this paper 1 2 3 4 5 Obtain long term project impact (outcome / goal) Not used in this paper 1 2 3 4 5 Stakeholder/partners involvement Not used in this paper 1 2 3 4 5 Ownership extension of the project to the local community Not used in this paper 1 2 3 4 5 Monitoring and reporting to the stakeholders Not used in this paper 1 2 3 4 5 Economic sustainability after the end of the project Not used in this paper 1 2 3 4 5 Satisfaction of the local community Not used in this paper 1 2 3 4 5
Section B - Methodologies, tools and performances
For each tool please score the percentage of adoption and the level of importance:
Percentage of your projects adopting the tool
1: 0%; 2:1-25%; 3: 26-50%; 4: 50-75%; 5: 75-100%
Level of importance 1: very low -
5: very high (e.g., used frequently during the project)
Logical Framework 1 2 3 4 5 Not used in this paper GANTT diagram or bar chart or project schedule 1 2 3 4 5 Not used in this paper Critical path method 1 2 3 4 5 Not used in this paper Earned value management system (EVMS) 1 2 3 4 5 Not used in this paper Work breakdown structure (WBS) 1 2 3 4 5 Not used in this paper Responsibility assignment matrix (RAM) 1 2 3 4 5 Not used in this paper Stakeholder Matrix 1 2 3 4 5 Not used in this paper Organizational chart or OBS 1 2 3 4 5 Not used in this paper

36
Percentage of your projects adopting the tool
1: 0%; 2:1-25%; 3: 26-50%; 4: 50-75%; 5: 75-100%
Level of importance 1: very low -
5: very high (e.g., used frequently during the project)
Milestone planning 1 2 3 4 5 Not used in this paper Progress reports 1 2 3 4 5 Not used in this paper Cost accounting 1 2 3 4 5 Not used in this paper Risk analysis/management 1 2 3 4 5 Not used in this paper Contingency allocation 1 2 3 4 5 Not used in this paper Communication plan 1 2 3 4 5 Not used in this paper Issue Log 1 2 3 4 5 Not used in this paper Scope management (tracking change requests, etc.) 1 2 3 4 5 Not used in this paper
ANNEX 2 - DESCRIPTIVE STATISTICS OF THE CLUSTERS
Differences among clusters by NGO and Project Characteristics
Cluster 1 Cluster 2 Cluster 3 Cluster 4 Sample Average
Kruskal-Wallis sig.
Size of the NGO (n. of employees) 15.23 24.88 30.67 41.25 29.08 0.019 Number of projects per year performed by the NGO
5.21 6.23 7.61 5.28 6.52 0.096
Projects managed in the last 2 years by the project manager
6.60 6.88 8.69 6.92 7.64 0.483
Number of international projects managed in the last 2 years by the project manager
2.54 4.21 5.08 3.38 4.22 0.098
Average project duration (months) 11.44 19.96 19.13 21.45 18.87 0.000 Average size of the managed projects in the last 2 years: (1: < 100.000 $; 2: 100.000-200.000 $; 3: 200.000-500.000 $; 4: 500.000+ $)
1.69 2.33 2.32 2.30 2.23 0.004
Differences among clusters by continent
Continent
Total
Africa Asia
Centre-South
America Europe North
America Oceania
Cluster 1 Count 15 7 4 16 3 1 46
% within Continent 15.0% 8.9% 19.0% 12.3% 27.3% 25.0% 13,3%
2 Count 23 18 5 39 4 2 91
% within Continent 23.0% 22.8% 23.8% 30.0% 36.4% 50.0% 26,4%
3 Count 43 34 10 58 4 1 150
% within Continent 43.0% 43.0% 47.6% 44.6% 36.4% 25.0% 43,5%
4 Count 19 20 2 17 0 0 58
% within Continent 19.0% 25.3% 9.5% 13.1% .0% .0% 16,8%
Total Count 100 79 21 130 11 4 345
% within Continent 100,0% 100.0% 100.0% 100.0% 100.0% 100.0% 100.0%

37
Pearson Chi-Square: Value = 15.322; df = 15; Sig. (2-sided) = 0.428

38
Differences among clusters by project typology
Aims of the projects
(1-delivery and integration of tool 2-construction of infrastruct. 3-develop of services 4-awarness rising 5-other)
Total 1 2 3 4 5
Cluster 1 Count 1 4 27 7 6 45
% within aims of the projects 16.7% 22.2% 13.4% 9.0% 17.1% 13,3%
2 Count 5 3 55 17 10 90
% within aims of the projects 83.3% 16.7% 27.2% 21.8% 28.6% 26,5%
3 Count 0 8 89 37 15 149
% within aims of the projects .0% 44.4% 44.1% 47.4% 42.9% 44,0%
4 Count 0 3 31 17 4 55
% within aims of the projects .0% 16.7% 15.3% 21.8% 11.4% 16,2%
Total Count 6 18 202 78 35 339
% within aims of the projects 100,0% 100.0% 100.0% 100.0% 100.0% 100.0%
Pearson Chi-Square: Value = 17.246; df = 12; Sig. (2-sided) = 0.141
ANNEX 3: STRUCTURAL EQUATION MODEL

39
ANNEX 4 - SUMMARY OF PROJECT MANAGEMENT TOOLS
Appendix A. Logical Framework
Appendix B. The logical framework matrix identifies and communicates the logical relationships in a project by tracking the vertical and horizontal reasoning that connects the levels of the matrix. The relationship between the elements on each level of the logical framework illustrates the vertical logic that will result in the achievement of the project’s ultimate goal.
Appendix C. Progress report
Appendix D. The Progress report analyses the work accomplished during a specified time period. It also contains information about what remains to be done on the project.
Appendix E. Cost Accounting Appendix F.
Appendix G. The implementation of a cost accounting system implies the structured allocation by resources of both time and costs to the project. When a performance measurement system is adopted, wok packages are defined in terms of Cost Accounts, thus associating to activities a specific cost based on the amount of resources allocated.
Appendix H. Gantt diagram
Appendix I. The Gantt diagram is a tool that is commonly used to illustrate the schedule of the project. Every activity is represented by a bar together with the dependency relationships between them.
Appendix J. Risk Analysis Appendix K.
Appendix L. Risk analysis implies a proper examination of uncertain events that main significantly influence the project’s performance. Typically this implies a structure evaluation of the probability of a specific event and the evaluation of the impact of this event. Typically proper mitigation actions are often associated so to at least partially avoid the negative impacts of risks.
Appendix M. Communication Plan
Appendix N. Communication Planning is the process of determining the information needed by the project’s stakeholder and defining a communication approach. The Communication Planning process associates to each stakeholder the kind of information and communication required and how these will be provided in terms as who needs which information, when they will need it, how it will be given to them, and by whom, etc.
Appendix O. OBS
Appendix P. The Organizational Breakdown Structure (OBS) is a hierarchically organized depiction of the project organization. It provides a structured description of the resources involved in the project and the hierarchical relationships among them.
Appendix Q. Milestone Schedule
Appendix R. The Milestone Schedule is a simplified version of the Gantt Diagram. Specifically it is a summary-level schedule that identifies the major schedule milestones.
Appendix S. Stakeholder Analysis Matrix
Appendix T. The Stakeholder Analysis Matrix is a tool that describes the characteristics of the relevant stakeholders of the project. Typical it is represented by a matrix that identifies information on each stakeholder, capturing their position referred to their influence, interest and their level of understanding and commitment to the project.
Appendix U. Scope Management
Appendix V. Scope Management is a set of tools and processes aimed at defining and controlling properly the project in terms of work so to guarantee that the project implies all and just the work needed to achieve the project’s goals.
Appendix W. Contingency allocation
Appendix X. Contingency reserve is a specific amount of funds, budget or time allocated to the project to cover, at least partially the risk of overruns of project objectives to a level acceptable to the organization
Appendix Y. Responsibility Assignment Matrix
Appendix Z. The Responsibility Assignment Matrix (RAM) is a matrix that puts in relationship the activities of the project as described in the work breakdown structure and the resources involved in the development of those activities. The RAM allows to map “who is responsible of what” so to clearly state responsibilities and roles.
Appendix AA. Work Breakdown Structure
Appendix BB. The Work Breakdown Structure (WBS) is a basic project document that describes all the work that must be done to complete the project and constitutes the basis for costing, scheduling, and work responsibility. Project objectives are disaggregated so to identify the elementary activities required to perform the project.
Appendix CC. Critical Path Method
Appendix DD. The Critical Path Method (CPM) is an algorithm for scheduling a group of project activities. The goal of the algorithm is to identify a proper schedule of the project that balances the trade-off between the project duration and its cost.
Appendix EE. Issue Log
Appendix FF. The Issue Log is a structured document that provides structured information about occurred issues and helps monitor who is responsible for resolving specific issues by a target date. Issue resolution addresses obstacles that can block the team from achieving its goals.
Appendix GG. Earned Value Management
Appendix II. The EVMS guidelines incorporate best business practices to provide an integrated project planning and control. The processes includes the integration of the project’s scope, schedule and cost objectives, according to which a baseline plan is defined so to guarantee the accomplishment of the

40
System Appendix HH.
project’s objectives. During the project development earned value techniques for performance measurement are used to assess the development of the project both in terms of schedule (i.e. the project is behind or ahead schedule) and cost (i.e. the project is under or over spending).
Definitions adapted from: PMBOK® Guide (2008); A guide to PMD Pro 1 (PM4DEV); Fundamentals of Project Management (PM4DEV); Budd (2010), “A practical guide to earned value project management”; Couillard, Garon, Riznic (2009), “The Logical Framework Approach – Millenium”; Kemp (2005), “A guide to Project Management”; Meredith and Mantel (2009), “Project Management – a managerial approach”; Schwalbe (2006), “Introduction to Project Management”