Community-Based Monitoring of Victoria's Marine National Parks and Marine Sanctuaries
72
PARKS VICTORIA TECHNICAL SERIES NUMBER 19 Community-Based Monitoring of Victoria’s Marine National Parks and Marine Sanctuaries Authors: Rebecca Koss, Patrick Gilmour, Kelly Miller, Alecia Bellgrove, Janine McBurnie, Geoff Wescott and Ashley Bunce March 2005
Transcript of Community-Based Monitoring of Victoria's Marine National Parks and Marine Sanctuaries

P A R K S V I C T O R I A T E C H N I C A L S E R I E S
NUMBER 19
Community-Based Monitoring of Victoria’s Marine National Parks and Marine Sanctuaries
Authors: Rebecca Koss, Patrick Gilmour,
Kelly Miller, Alecia Bellgrove, Janine McBurnie,
Geoff Wescott and Ashley Bunce
March 2005

© Parks Victoria
All rights reserved. This document is subject to the Copyright Act 1968, no part of this publication may be reproduced, stored in a retrieval system, or transmitted in any form, or by any means, electronic, mechanical, photocopying or otherwise without the prior permission of the publisher.
First published 2005
Published by Parks Victoria Level 10, 535 Bourke Street, Melbourne Victoria 3000
Opinions expressed by the Authors of this publication are not necessarily those of Parks Victoria, unless expressly stated. Parks Victoria and all persons involved in the preparation and distribution of this publication do not accept any responsibility for the accuracy of any of the opinions or information contained in the publication.
Authors:
Rebecca Koss – Research Assistant, Deakin University Patrick Gilmour – Research Assistant, Deakin University Dr. Kelly Miller – Lecturer, Deakin University Dr. Alecia Bellgrove – Lecturer, Deakin University Ms. Janine McBurnie –Lecturer, Deakin University Associate Professor Geoff Wescott – Director of Networks and Partnerships, Deakin University Ashley Bunce – Lecturer, Deakin University
National Library of Australia Cataloguing-in-publication data
Includes bibliography. ISSN 1448-4935
Citation
Koss, R., Gilmour, P., Miller, K., Bellgrove, A., McBurnie, J., Wescott, G. and Bunce, A. (2005) Community - Based Monitoring of Victoria’s Marine National Parks and Marine Sanctuaries. Parks Victoria Technical Series No. 19. Parks Victoria, Melbourne.
Printed on environmentally friendly paper

Parks Victoria Technical Paper Series No. 19
Community- Based Monitoring of Victoria’s Marine National Parks and
Marine Sanctuaries
Rebecca Koss
Patrick Gilmour
Kelly Miller
Alecia Bellgrove
Janine McBurnie
Geoff Wescott
Ashley Bunce
School of Ecology and Environment
Deakin University
March 2005

Parks Victoria Technical Series No. 19 Community-Based Marine Monitoring
IV
EXECUTIVE SUMMARY
This study investigated community-based monitoring in Victoria’s Marine National Parks
(MNPs) and Sanctuaries (MSs) from January to May 2004. The primary aim of this study
was to evaluate the potential for community-based monitoring projects to assist in the
collection of data for the management of Victoria’s MNPs and MSs. The pilot habitats that
were assessed included subtidal reefs at the Merri MS, intertidal reefs at Ricketts Point MS
and seagrass beds at Corner Inlet MNP. The three main objectives for this study were to:
Develop a template for the monitoring of marine habitats by community groups.
Assess the quality and integrity of data collected by community volunteers.
Determine a sustainable model for community monitoring of marine habitats.
Three standard operating procedures (SOPs) in the form of a “how to” manual, were
developed for each habitat type. The SOPs were adapted from scientifically robust studies
and developed in consultation with community volunteer groups by means of field trials.
Volunteer feedback assisted in the final SOP design. The SOP will allow Parks Victoria
Rangers to develop community-based programs within the parks. The SOPs are accessible
as Parks Victoria Technical Series Numbers 16, 17 and 18.
Data collected by volunteers across the three habitat sites were assessed and compared to
that collected by scientists. It was found that data quality collected by volunteers was
dependent on habitat type and the type of measurement the volunteer was required to
assess. Volunteer estimation measurements were highly variable across all three habitat
sites, compared to quantitative data collection. Subtidal monitoring had the greatest potential
for inconsistency in data collection.
Intertidal monitoring is the most sustainable of the three habitat monitoring procedures.
Sustainability of community-based monitoring programs is dependent on continued support
and training by the management authority of Victoria’s MNPs and MSs. For the expansion of
the monitoring programs to other MNPs and MSs, the management authority could expand
strong relationships with the community volunteer groups.

Parks Victoria Technical Series No. 19 Community-Based Marine Monitoring
V
CONTENTS PARKS VICTORIA TECHNICAL SERIES 19
Community - Based Monitoring of Victoria’s Marine National Parks and Marine Sanctuaries EXECUTIVE SUMMARY........................................................................................IIVV CONTENTS ………………………………………………………………………………... V INDEX OF FIGURES ................................................................................................ VI INDEX OF TABLES …………….………………………………………………………………… VII 1 INTRODUCTION ..................................................................................................... 1
1.1 Community-based monitoring in marine protected areas .............................................................1 1.2 Project objectives ..........................................................................................................................2 1.3 Project summary ...........................................................................................................................3
2 METHODS............................................................................................................... 4 2.1 Community participation in habitat monitoring ..............................................................................4 2.2 Community - based monitoring evaluation survey ........................................................................9 2.3 Parks Victoria Ranger evaluation survey ………………………………………………………….. 11 2.4 Data analysis...............................................................................................................................11
3 RESULTS.............................................................................................................. 14 3.1 Merri Marine Sanctuary - Subtidal rocky reef monitoring............................................................14 3.2 Ricketts Point Marine Sanctuary - Intertidal monitoring ..............................................................20 3.3 Corner Inlet Marine National Park - Seagrass monitoring ..........................................................34 3.4 Survey of participants and community group members..............................................................38 3.5 Parks Victoria Ranger survey ……………………………………………………………………….. 44
4 DISCUSSION ........................................................................................................ 46 4.1 Data integrity ...............................................................................................................................46 4.2 Community volunteer training .....................................................................................................50 4.3 Community- based monitoring sustainability ..............................................................................51 4.4 Parks Victoria Rangers' perceptions of community - based monitoring ………………………….54
5 CONCLUSION ...................................................................................................... 56 6 SUGGESTED APPROACHES TO COMMUNITY - BASED MONITORING FOR
MANAGEMENT AGENCIES ............................................................................. 58 ACKNOWLEDGMENTS........................................................................................... 59 REFERENCES......................................................................................................... 60 Appendix 1 Parks Victoria Ranger Survey ………………………………………………….. 62
Parks Victoria Technical Series No. 19 Community-Based Marine Monitoring
VI
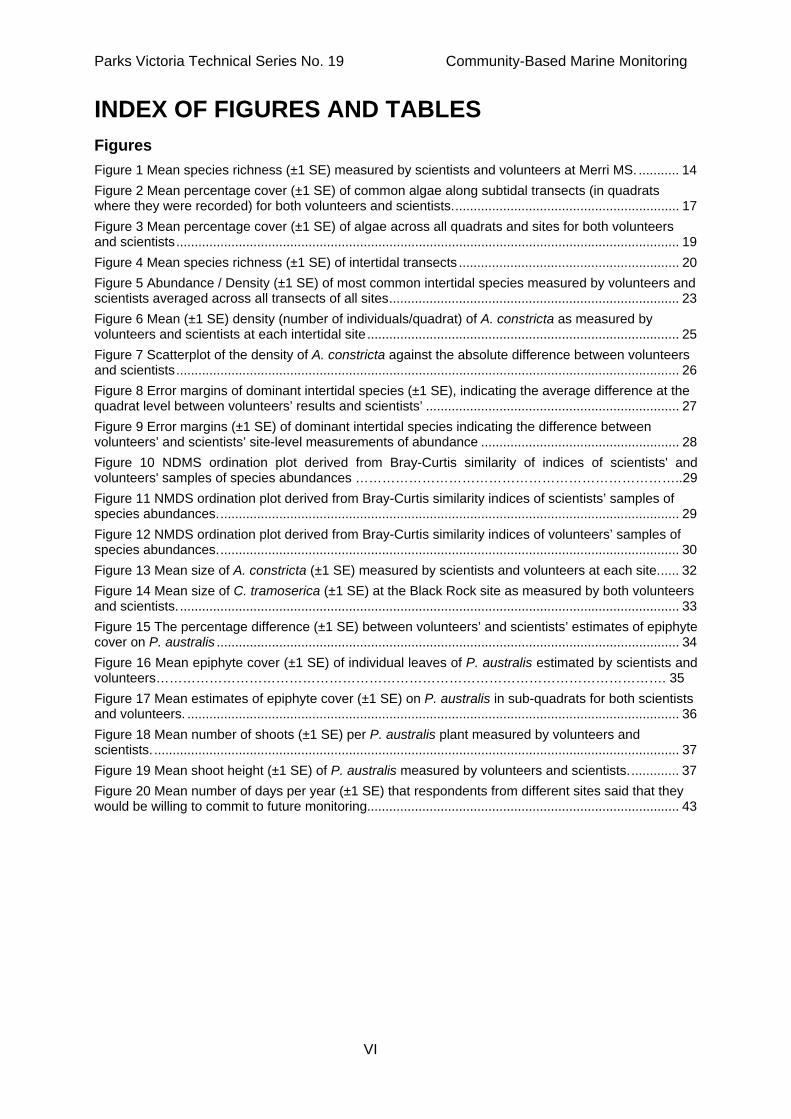
INDEX OF FIGURES AND TABLES Figures Figure 1 Mean species richness (±1 SE) measured by scientists and volunteers at Merri MS. ........... 14 Figure 2 Mean percentage cover (±1 SE) of common algae along subtidal transects (in quadrats where they were recorded) for both volunteers and scientists.............................................................. 17 Figure 3 Mean percentage cover (±1 SE) of algae across all quadrats and sites for both volunteers and scientists......................................................................................................................................... 19 Figure 4 Mean species richness (±1 SE) of intertidal transects ............................................................ 20 Figure 5 Abundance / Density (±1 SE) of most common intertidal species measured by volunteers and scientists averaged across all transects of all sites............................................................................... 23 Figure 6 Mean (±1 SE) density (number of individuals/quadrat) of A. constricta as measured by volunteers and scientists at each intertidal site..................................................................................... 25 Figure 7 Scatterplot of the density of A. constricta against the absolute difference between volunteers and scientists......................................................................................................................................... 26 Figure 8 Error margins of dominant intertidal species (±1 SE), indicating the average difference at the quadrat level between volunteers’ results and scientists’ ..................................................................... 27 Figure 9 Error margins (±1 SE) of dominant intertidal species indicating the difference between volunteers’ and scientists’ site-level measurements of abundance ...................................................... 28 Figure 10 NDMS ordination plot derived from Bray-Curtis similarity of indices of scientists' and volunteers' samples of species abundances ………………………………………………………………..29 Figure 11 NMDS ordination plot derived from Bray-Curtis similarity indices of scientists’ samples of species abundances.............................................................................................................................. 29 Figure 12 NMDS ordination plot derived from Bray-Curtis similarity indices of volunteers’ samples of species abundances.............................................................................................................................. 30 Figure 13 Mean size of A. constricta (±1 SE) measured by scientists and volunteers at each site...... 32 Figure 14 Mean size of C. tramoserica (±1 SE) at the Black Rock site as measured by both volunteers and scientists......................................................................................................................................... 33 Figure 15 The percentage difference (±1 SE) between volunteers’ and scientists’ estimates of epiphyte cover on P. australis .............................................................................................................................. 34 Figure 16 Mean epiphyte cover (±1 SE) of individual leaves of P. australis estimated by scientists and volunteers……………………………………………………………………………………………………. 35 Figure 17 Mean estimates of epiphyte cover (±1 SE) on P. australis in sub-quadrats for both scientists and volunteers. ...................................................................................................................................... 36 Figure 18 Mean number of shoots (±1 SE) per P. australis plant measured by volunteers and scientists. ............................................................................................................................................... 37 Figure 19 Mean shoot height (±1 SE) of P. australis measured by volunteers and scientists.............. 37 Figure 20 Mean number of days per year (±1 SE) that respondents from different sites said that they would be willing to commit to future monitoring..................................................................................... 43

Parks Victoria Technical Series No. 19 Community-Based Marine Monitoring
VII
Tables Table 1 Taxa recorded in and adjacent to the Merri Marine Sanctuary by scientists and
volunteers. ..................................................................................................................... 15 Table 2 Mean species richness recorded by volunteers and scientists in the Merri MS ....... 16 Table 3 Measurements of species diversity in the Merri MS................................................. 16 Table 4 Mean (absolute) difference in algal percentage cover measured by volunteers and
scientists........................................................................................................................ 17 Table 5 Error margins of volunteers’ estimates of algal abundance. .................................... 18 Table 6 Error margins of dominant algae .............................................................................. 19 Table 7 Intertidal species recorded by scientists and/or volunteers and at what site they
occurred. ....................................................................................................................... 21 Table 8 Mean intertidal diversity recorded by volunteers and scientists. .............................. 22 Table 9 Results from one-way ANOVA analyses testing if site had an effect on the absolute
difference between volunteers’ and scientists’ measurements of abundance............... 24 Table 10 Absolute difference (untransformed) between volunteers’ and scientists’
measurements of species abundances......................................................................... 24 Table 11 Absolute difference (untransformed) between volunteers’ and scientists’ measures
of abundance for A. constricta for each site with t-tests ................................................ 24 Table 12 ANOSIM pair-wise comparisons of site for samples collected by scientists. ......... 30 Table 13 ANOSIM pair-wise comparisons of site for samples collected by volunteers......... 30 Table 14 Mean difference between volunteers’ and scientists’ measurements of A. constricta
at the level of quadrats. ................................................................................................. 31 Table 15 Accuracy margins for volunteers’ estimates of the size of A. constricta................. 31 Table 16 Demographic profile of community group members who returned surveys and
participated (P), or did not participate (NP) in monitoring.............................................. 39 Table 17 Main reasons given by respondents for taking part in the monitoring program...... 40 Table 18 Amount of time volunteer respondents from different groups intended to stay to
complete the monitoring. ............................................................................................... 40 Table 19 Percentages of non-participant respondents who cite particular reasons for not
being involved in the monitoring project. ....................................................................... 41 Table 20 Forms of encouragement cited by non-participant respondents as being factors that
may influence their future involvement. ......................................................................... 42 Table 21 Parks Victoria Ranger survey responses of their perceptions associated with
CBM……………………………………………………………………………………………. 44

Parks Victoria Technical Series No. 19 Community-Based Marine Monitoring
1
1 INTRODUCTION 1.1 Community-Based Monitoring In Marine Protected Areas The newly created system of Marine National Parks (MNPs) and Marine Sanctuaries (MSs)
in Victoria, provide the ideal opportunity to develop a community-based monitoring (CBM)
project. Given available resources, detailed monitoring of the MNPs and MSs by Parks
Victoria is likely to be annual at most. Consequently, any robust and standardised
information that can be gathered more frequently will benefit the management of the system.
This is particularly true for factors such as exotic pests which can become a threat over a
short period of time (Barrett et al. 2002) and require ongoing assessments.
Community involvement in the monitoring of marine protected areas (MPAs) is also of value
in developing awareness and raising the profile of natural, cultural and social values among
the public (Parks Victoria 2003). Meaningful involvement can also build community
custodianship and help to communicate findings back to the broader community. Community
participation in the investigation and monitoring of Victorian MPAs is therefore valuable to
management from both an ecological and social perspective.
There is an increasing realisation of the importance of community or volunteer collected data
in management programs. Volunteers can make important contributions towards
management programs (Foster-Smith & Evans 2003; Darwall & Dulvy 1996). Indeed,
volunteers and community groups have already made significant contributions to scientific
knowledge through participation in a range of studies, including involvement in seagrass
monitoring through Seagrass–Watch in Queensland (Campbell & McKenzie 2001), Watching
the Seagrass Grow in New South Wales (Valk 2003), Reef Check (Hodgson et al. 2003), and
the Atlas of Australian Birds (Blakers et al. 1984).
The advantages of using community volunteers can increase the level of public awareness of
ecological problems through active participation in ecological survey work; and the provision
of a survey program requiring simple and inexpensive techniques which can be continued in
the long term using local expertise and financing (Darwall & Dulvy 1996). Such programs can
empower local communities with the ability to actively participate in the preservation of their
local environment. Furthermore, CBM projects have the potential to create partnerships
between groups that may otherwise not occur (e.g. between researchers, local
environment/community groups, and fisheries and management organizations) and to
encourage “stewardship” in local communities (Wescott 2002).
This project evaluated the potential of community-based monitoring projects to assist in the
management of Victorian MPAs. The project developed a template for the monitoring of
marine habitats by community groups that will act as a standard, allowing comparability

Parks Victoria Technical Series No. 19 Community-Based Marine Monitoring
2
across sites and different habitats. It assessed the data collected by volunteers and
compared it to that collected by scientists to understand relative data quality. This project
also investigated participant attitudes to identify a monitoring regime that may act as a model
to encourage sustainability of CBM projects in Victoria’s MPAs.
1.2 Project Objectives The primary aim of this study was to evaluate the potential of CBM projects to assist in
collection of data for the management of MPAs. The habitats (and sites) assessed were
subtidal rocky reefs (Merri MS), intertidal rocky reefs (Ricketts Point MS), and seagrass beds
(Corner Inlet MNP). The major objectives of this study were to:
1. Develop a template for the monitoring of marine habitats by community groups
A template for the monitoring of marine habitats in Victoria’s MPAs by community groups
was developed from the Parks Victoria standard operating procedures for subtidal and
intertidal reef monitoring and existing protocols for monitoring of seagrass habitats. These
operating procedures were modified for ease of use and execution by community group
members and produced in consultation with them. The development of the templates
produced a standard method to allow comparability between sites and to ensure that there
was a scientifically robust approach for all community monitoring projects. The development
of the template incorporated four main aspects:
Development of appropriate methods for the capacity of community groups to undertake
a monitoring program.
Identify species/taxonomic groups that can be easily monitored by community groups.
Production of training resources to assist in improving species identification and
understanding of monitoring protocol.
Needs and capacity of community groups to undertake data management.
2. Assessment of quality and integrity of data collected by community volunteers
The data collected by community groups during an actual monitoring program was tested.
Community groups were trained in monitoring techniques and species identification through
presentations and field exercises. Volunteer data was compared with that collected by
trained scientists to evaluate its quality and integrity. Improvements were made to the
monitoring protocol where necessary. The following aspects were addressed:
Species identification capacity of community groups.
Ability of volunteers to accurately assess species distribution and abundance.

Parks Victoria Technical Series No. 19 Community-Based Marine Monitoring
3
Comparability of data collected by community group volunteers with that collected by
trained scientists.
3. Determining a sustainable model for community monitoring of marine habitats
Community group volunteer attitudes were assessed to assist in the development of a
sustainable model for CBM of marine habitats in Victoria’s MPAs. It assessed the best
practices to maintain energy, interest and involvement of community groups in a marine
habitat. The following aspects were addressed:
The motivation for participants in CBM programs.
The suitability of the CBM template.
The applicability of the CBM template across different habitats and sites.
1.3 Project summary The CBM project was based upon the input and feedback from volunteers to create a user-
friendly monitoring method, for a particular habitat. In conjunction with a Parks Victoria
Ranger, community groups will be able to use the designed monitoring methods in any of
Victoria’s MNPs and MSs. Despite the obvious advantages, the use of volunteers is often
criticised on the grounds that information collected will be unreliable (Darwall & Dulvy 1996).
This study assessed the ability of community volunteers to accurately monitor the three
habitat types.

Parks Victoria Technical Series No. 19 Community-Based Marine Monitoring
4
2 METHODS CBM proceedures were developed and adapted from existing scientific methodologies.
Volunteers from four community groups participated in training sessions and trials of the
templates. These groups were associated with specific MPAs: the Deakin University
Underwater Club monitored subtidal rocky reefs at Merri MS, Marine Care – Ricketts Point
Friends Group monitored intertidal rock platforms at Ricketts Point MS, and Friends of The
Prom and S.E.A.L. Diving Services monitored seagrass beds at Corner Inlet MNP. These
MPAs and associated groups were chosen as a representative system of monitoring to be
undertaken by community groups in regional, urban and rural areas, respectively, across
Victoria. Data collected by scientists were compared to that collected by volunteers to assess
volunteer-collected data accuracy and integrity. The scientists involved in data collection had
postgraduate experience in marine science research. It was imperative for the integrity of
results to have scientists who were familiar with undertaking scientific procedures employed
for statistically sound monitoring. A volunteer was a person of the general public involved in a
community group associated with the MPA who may or may not have experience in marine
monitoring. Feedback on template suitability, training and sustainability of the monitoring
program was gathered through volunteer surveys.
2.1 Community Participation In Habitat Monitoring 2.1.1 MERRI MARINE SANCTUARY - SUBTIDAL ROCKY REEF MONITORING
The Merri MS is located in Warrnambool, situated in western Victoria. The mouth of the
Hopkins River enters the MS. The ‘Deakin University Underwater Club’ participated in the
subtidal rocky reef monitoring. This is an active recreational dive group with approximately
100 members, consisting mainly of undergraduate and postgraduate students of Deakin
University, Warrnambool. The president of the group trained 25 members in an accredited
PADI scientific dive course to assist with this study’s monitoring.
Training Structure
Training of volunteers comprised of two components: a PADI scientific dive training course,
and a macroalgae identification course.
The PADI scientific course was run over one weekend by Phillip Kerr, PADI dive instructor of
Aqua Agri Enterprises and President of the Deakin University Underwater Club. All divers
had internationally recognised ‘open water’ qualifications as a minimum however, the
scientific dive course was necessary to ensure volunteer competency and safety. The
scientific dive course trained and assessed volunteers in underwater identification, size
estimation of fish and invertebrates, and point-count estimation of macroalgae cover. On the
first day divers were trained and tested in a pool, whilst the second day saw divers

Parks Victoria Technical Series No. 19 Community-Based Marine Monitoring
5
undertaking two practice monitoring dives on subtidal reefs at different locations. On
completion of this course volunteers undertook subtidal monitoring in the Merri MS for this
study.
The subtidal habitat has a great diversity of macroalgae species, many being difficult to
identify. The macroalgae identification course gave volunteers an introduction on
identification of the broad range of algal species found in the Merri MS. This course was
presented by Dr. Alecia Bellgrove, lecturer at Deakin University, Warrnambool Campus.
Volunteers were initially trained in the laboratory using herbarium pressings before
developing their skills further in a field excursion to the Merri MS.
Each volunteer was provided with a Victorian 'Reef Watch' field guide comprising a set of
laminated photo identification sheets. Volunteers referred to this guide throughout the PADI
scientific dive course, macroalgae identification course and during monitoring. Other
reference books were on hand for identification of unknown fish and macroalgae species
(See References).
Site Selection
Within the Merri MS, two rocky subtidal reefs were selected. A subtidal rocky reef adjacent
to the sanctuary (outside of the MS) was selected as a reference site. Site selection was
based upon criteria outlined in the Parks Victoria Subtidal Monitoring (Technical Series
Number 18) and was chosen based upon the likelihood of potentially threatening process of
illegal harvesting and collection of animals.
Subtidal Rocky Reef Monitoring
Scientists and volunteer divers from the Deakin University Underwater Club monitored two
transects within the Merri MS and one transect at the reference site adjacent to the MS. The
standard monitoring methods below are summarised from the manual (Koss et al. 2005).
These methods were adapted from the Standard Operational Procedure for Subtidal Reef
Monitoring (Edmunds & Hart 2003) commissioned for Parks Victoria.
A 100m transect line was surveyed by four divers, working in ‘buddy pairs’. Buddy dive pairs
consisted of one scientist and one volunteer. The volunteer collected data independently of
the scientist along the same transect line and quadrat placements allowing for comparison
and analysis of the data collected.
Parks Victoria Technical Series No. 19 Community-Based Marine Monitoring
6
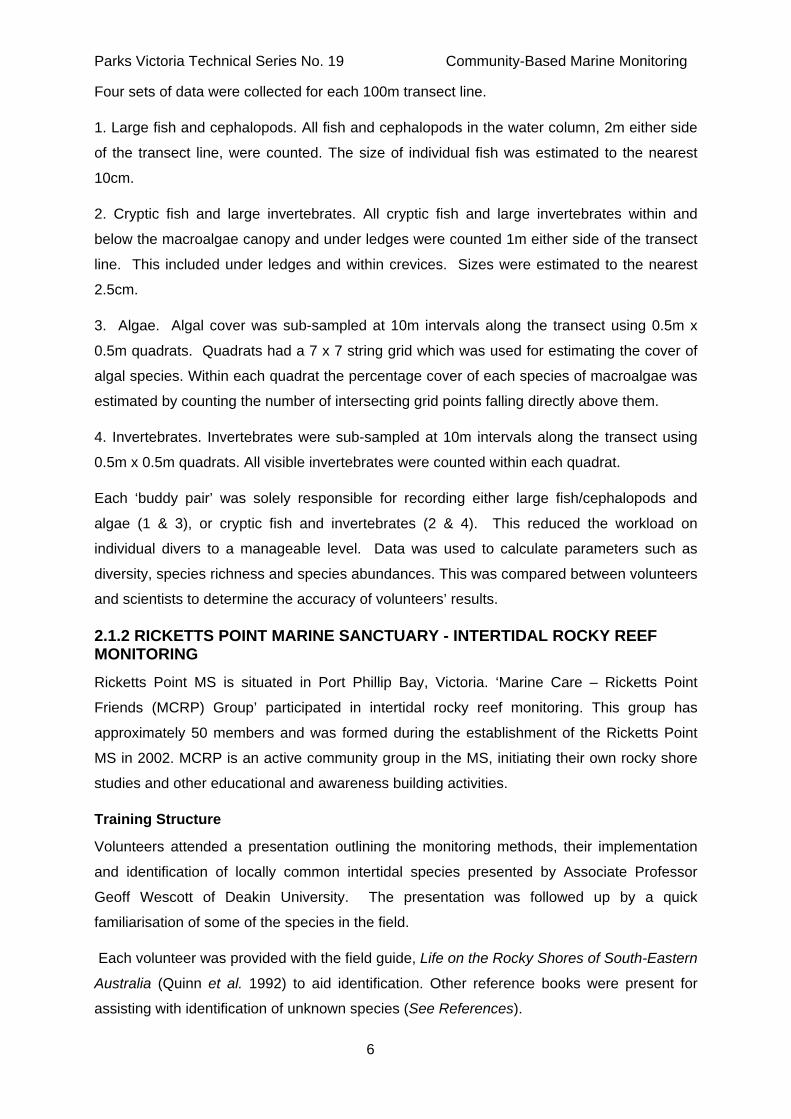
Four sets of data were collected for each 100m transect line.
1. Large fish and cephalopods. All fish and cephalopods in the water column, 2m either side
of the transect line, were counted. The size of individual fish was estimated to the nearest
10cm.
2. Cryptic fish and large invertebrates. All cryptic fish and large invertebrates within and
below the macroalgae canopy and under ledges were counted 1m either side of the transect
line. This included under ledges and within crevices. Sizes were estimated to the nearest
2.5cm.
3. Algae. Algal cover was sub-sampled at 10m intervals along the transect using 0.5m x
0.5m quadrats. Quadrats had a 7 x 7 string grid which was used for estimating the cover of
algal species. Within each quadrat the percentage cover of each species of macroalgae was
estimated by counting the number of intersecting grid points falling directly above them.
4. Invertebrates. Invertebrates were sub-sampled at 10m intervals along the transect using
0.5m x 0.5m quadrats. All visible invertebrates were counted within each quadrat.
Each ‘buddy pair’ was solely responsible for recording either large fish/cephalopods and
algae (1 & 3), or cryptic fish and invertebrates (2 & 4). This reduced the workload on
individual divers to a manageable level. Data was used to calculate parameters such as
diversity, species richness and species abundances. This was compared between volunteers
and scientists to determine the accuracy of volunteers’ results.
2.1.2 RICKETTS POINT MARINE SANCTUARY - INTERTIDAL ROCKY REEF MONITORING
Ricketts Point MS is situated in Port Phillip Bay, Victoria. ‘Marine Care – Ricketts Point
Friends (MCRP) Group’ participated in intertidal rocky reef monitoring. This group has
approximately 50 members and was formed during the establishment of the Ricketts Point
MS in 2002. MCRP is an active community group in the MS, initiating their own rocky shore
studies and other educational and awareness building activities.
Training Structure
Volunteers attended a presentation outlining the monitoring methods, their implementation
and identification of locally common intertidal species presented by Associate Professor
Geoff Wescott of Deakin University. The presentation was followed up by a quick
familiarisation of some of the species in the field.
Each volunteer was provided with the field guide, Life on the Rocky Shores of South-Eastern
Australia (Quinn et al. 1992) to aid identification. Other reference books were present for
assisting with identification of unknown species (See References).

Parks Victoria Technical Series No. 19 Community-Based Marine Monitoring
7
Site Selection
Within Ricketts Point MS, two rocky intertidal reefs were selected for this study. These
intertidal sites included Teahouse Reef and Triangle Reef (situated in front of the
Beaumauris Life Saving Club). The intertidal rocky reef at Black Rock (outside of the MS)
was selected as a reference site (situated over the breakwater wall adjacent to the pier). Site
selection was based upon criteria outlined in the Parks Victoria Technical Series No. 17
(Koss et al. 2005) and were chosen based upon the likelihood of threatening processes
occurring; such as trampling, caused by foot traffic from school groups and recreational
users, illegal collection and harvesting, and freshwater influxes from stormwater drains.
Intertidal Rocky Shore Monitoring
Monitoring took place at each site on a single low tide. The methods call for five transects
per site, though due to logistical constraints, only four were completed at Triangle Reef, and
three at Black Rock. The monitoring methods were derived from the Standard Operational
Procedure for Intertidal Reef Monitoring (Hart et al. 2005) commissioned for Parks Victoria.
Transect baselines were established at each site. Five transects were positioned evenly
between these baselines, running along the gradient of the shore. Each transect was
partitioned into five evenly spaced 2m x 2m sampling locations. A 0.5m x 0.5m quadrat was
randomly placed within each sampling location.
Four sets of data were collected for each quadrat at the five sampling locations along the
transect line.
1. Invertebrate counts. Individuals of each species of invertebrate present were counted to
give a measure of abundance/density.
2. Gastropod shell length. The shell lengths of five individuals from each of five common
gastropod species were measured to identify the size structure of their population.
3. Macroalgae and aggregated invertebrate cover. Quadrats had a 7 x 7 string grid which
was used for estimating percentage cover of algal and highly aggregated species. The
abundance/density of algae and highly aggregated invertebrates (e.g. tube worms) were
measured by counting the number of intersecting grid points on the quadrat that fell directly
above each species.
4. Microhabitat description. The microhabitats (horizontal/flat, vertical/crevice, rock pool,
boulders or sand) present in each quadrat were recorded.
Each transect was surveyed by one or more volunteers and a scientist. Data was collected
independently and used to calculate information such as diversity, species richness, species

Parks Victoria Technical Series No. 19 Community-Based Marine Monitoring
8
abundances, and mean shell size. This data was compared between volunteers and
scientists to determine the accuracy of volunteers’ results.
2.1.3 CORNER INLET MARINE NATIONAL PARK - SEAGRASS MONITORING
Corner Inlet MNP is located in South Gippsland, Eastern Victoria. The inlet is surrounded by
agriculture, hobby farms and Wilsons Promontory National Park. Two community groups,
‘Friends of the Prom’ and ‘S.E.A.L. Diving Services’, participated in the monitoring of
seagrass beds in Corner Inlet MNP. Friends of the Prom (FOP), was established in 1979 and
have approximately 250 members. This group has working bee weekends throughout the
year at Wilsons Promontory National Park with most members travelling from Melbourne.
S.E.A.L. Diving Services is a recreational dive group based in Traralgon, South Gippsland
and have approximately 70 members. This group became involved during the later part of
the study. Two members participated in the monitoring during the winter, despite the lower
temperature. The group’s active participation in marine monitoring led to the possible
eradication of the introduced Northern Pacific Seastar in Anderson Inlet, Victoria.
Training Structure
Volunteers attended a presentation outlining the aims of the monitoring, monitoring
methodologies, and their implementation. This was followed by practise of the monitoring
methods on a grass field and an intertidal seagrass bed. Volunteers were provided with
laminated field summary sheets and percentage cover visual assessment guides as aids in
the field.
Site Selection
Corner Inlet MNP was selected due to the unique beds of Posidonia australis, the largest
stand in Victoria (O’Hara et al. 2002). Nineteen subtidal sites were selected by visual
assessment from a boat for possible monitoring. These sites ranged from dense to sparse P.
australis beds, to shallow patches of mixed seagrass beds with Heterozoestera tasmanica.
Reference sites were P. australis seagrass beds within Corner Inlet, adjacent to the MNP.
Threats associated with these sites included catchment runoff, boat anchor and propeller
damage, and at the time of sampling, recreational and commercial fishing.
Seagrass Monitoring
The standard monitoring methods below are summarised in the Parks Victoria Technical
Series No. 16 (Koss et al. 2005). The methods were derived from baseline monitoring of P.
australis seagrass beds in Corner Inlet (O’Hara et al. 2002), and Queensland Seagrass-
Watch (McKenzie and Campbell 2001) and adapted for use by community groups. Feedback
from community group volunteers resulted in fine tuning these methods to create a more
user friendly approach to monitoring.

Parks Victoria Technical Series No. 19 Community-Based Marine Monitoring
9
Monitoring at each site required three transects, each 50m in length and 25m apart. A 1m x
1m quadrat, divided into 8 sub-quadrats (0.5m x 0.25m), was sampled every 5m along the
transect line.
Five sets of data were collected every 5m for each quadrat.
1. Substrate type. A description of substrate type that the seagrass was growing in was
noted. Substrate type was defined as: Fine Sand (F), Coarse Sand (C), Mud (M), Fine Silt
(S), Shell Grit (SG) and Gravel (G).
2. Percentage seagrass cover was estimated for the whole quadrat. The percentage cover
visual assessment guides were used to class the seagrass as Sparse, Medium, Dense or
Very Dense.
3. Epiphyte percentage cover. Three random sub-quadrats were chosen to measure
epiphyte growth. In each of these sub-quadrats epiphyte cover was estimated in two steps;
a) the percentage cover on a random leaf was estimated; b) epiphyte percentage cover was
estimated for the entire sub-quadrat.
4. Seagrass shoot length. For each sub-quadrat, three random shoots were measured from
base to tip to the nearest 1 cm using a measuring tape.
5. Seagrass shoot density. For each sub-quadrat, three plants were chosen randomly and
the number of shoots for each plant was recorded.
Each transect was surveyed by one volunteer and one scientist. Data was collected
independently and used to calculate parameters such as mean shoot length, shoot density
and epiphyte cover. These values were compared between volunteers and scientists to
determine the accuracy of volunteers’ results.
2.2 Community - Based Monitoring Evaluation Survey This aspect of the project investigated the attitudes of CBM of MPAs. This assisted in
developing a suitable model for CBM of marine habitats in Victoria’s MPAs. If community
groups are to adopt the monitoring techniques, it is important to identify and assess levels of
motivation, interest and involvement for volunteers. Two separate groups were distinguished
within the community groups; volunteers from the community groups who participated in the
monitoring, and volunteers who did not participate specifically in this study but are active in
other activites within their community group.
2.2.1 Survey Design
Input and feedback relating to CBM in MPAs by community group volunteers were collected
with two written surveys; one directed at volunteers who participated in the monitoring

Parks Victoria Technical Series No. 19 Community-Based Marine Monitoring
10
exercises, and one for the remaining members of the community groups who did not
participate.
Two key issues were addressed:
1. The motivation for participants in CBM.
2. Suitability and sustainability of CBM in Victoria’s MPAs.
A cover letter, consent form and a reply paid envelope were included with each survey. The
covering letter outlined the purpose of the study, use of the consent form, issues of
confidentiality and the required return date of the survey. A book prize was offered to
encourage volunteers to return the survey. A reminder letter was distributed by mail 3 – 4
weeks after community members received the surveys to encourage volunteers to complete
and return the survey.
2.2.2 Data Collection
Community Group Participant Volunteers
This group consisted of volunteers who participated in the monitoring of their respective
habitat. It was important to identify if the training was adequate and if the monitoring was
easy to undertake and sustainable in the long term. Volunteer participants received the
survey following the first monitoring session. The 7 page survey consisted of three sections
designed to explore the issues associated with community-based monitoring.
1. Member Profile. A range of information on participants was collated including,
demographic data, level of education, occupation and income. Participants were
surveyed in relation to their reasons for participating in the project, time commitment and
involvement in other community activities.
2. Training. Participants were questioned on the quality of the training as an introduction for
monitoring. Information collected included, time length, clarity and ease of understanding
the training.
3. Monitoring. Topics ranged from ease of monitoring methods, length of time to undertake
monitoring, replication of the monitoring procedures, participant enjoyment of monitoring
and broader values of the monitoring. The volunteer could only complete this section after
participation in at least one monitoring session.
Community Group Non-Participant Volunteers
This group consisted of members of the community groups who did not participate in the
specific monitoring themselves on these occasions. Non-participant volunteers received the
Parks Victoria Technical Series No. 19 Community-Based Marine Monitoring
11
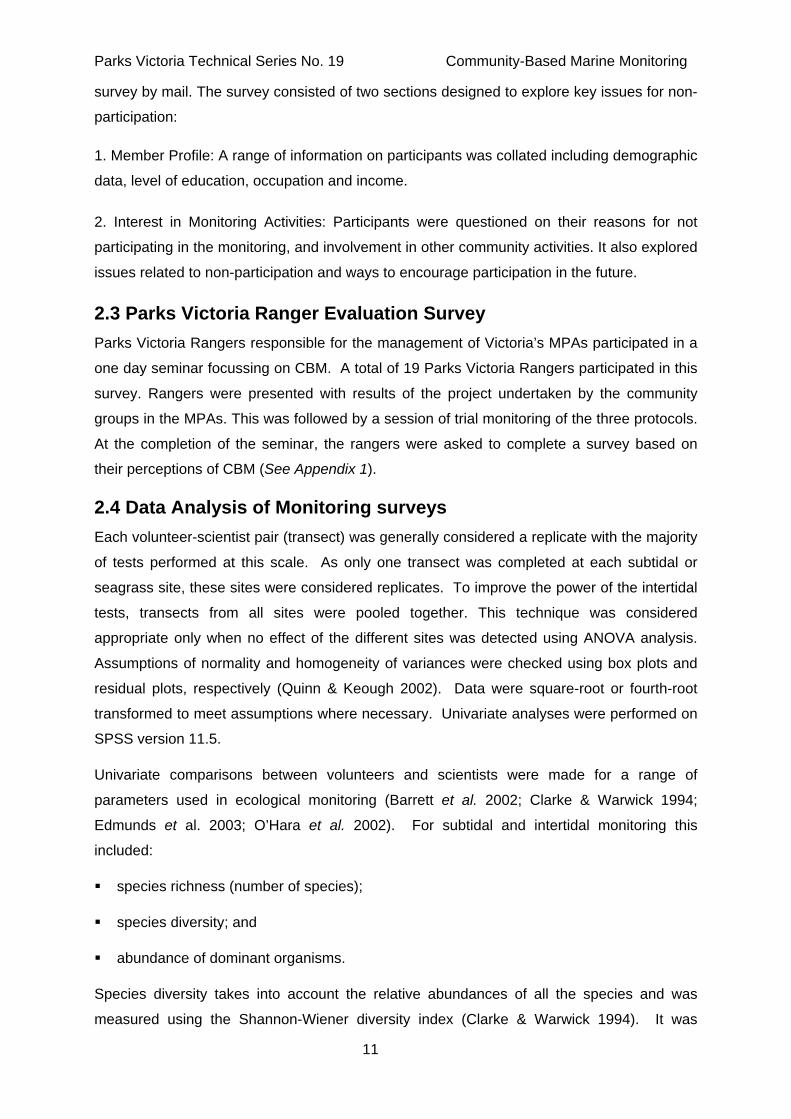
survey by mail. The survey consisted of two sections designed to explore key issues for non-
participation:
1. Member Profile: A range of information on participants was collated including demographic
data, level of education, occupation and income.
2. Interest in Monitoring Activities: Participants were questioned on their reasons for not
participating in the monitoring, and involvement in other community activities. It also explored
issues related to non-participation and ways to encourage participation in the future.
2.3 Parks Victoria Ranger Evaluation Survey Parks Victoria Rangers responsible for the management of Victoria’s MPAs participated in a
one day seminar focussing on CBM. A total of 19 Parks Victoria Rangers participated in this
survey. Rangers were presented with results of the project undertaken by the community
groups in the MPAs. This was followed by a session of trial monitoring of the three protocols.
At the completion of the seminar, the rangers were asked to complete a survey based on
their perceptions of CBM (See Appendix 1).
2.4 Data Analysis of Monitoring surveys Each volunteer-scientist pair (transect) was generally considered a replicate with the majority
of tests performed at this scale. As only one transect was completed at each subtidal or
seagrass site, these sites were considered replicates. To improve the power of the intertidal
tests, transects from all sites were pooled together. This technique was considered
appropriate only when no effect of the different sites was detected using ANOVA analysis.
Assumptions of normality and homogeneity of variances were checked using box plots and
residual plots, respectively (Quinn & Keough 2002). Data were square-root or fourth-root
transformed to meet assumptions where necessary. Univariate analyses were performed on
SPSS version 11.5.
Univariate comparisons between volunteers and scientists were made for a range of
parameters used in ecological monitoring (Barrett et al. 2002; Clarke & Warwick 1994;
Edmunds et al. 2003; O’Hara et al. 2002). For subtidal and intertidal monitoring this
included:
species richness (number of species);
species diversity; and
abundance of dominant organisms.
Species diversity takes into account the relative abundances of all the species and was
measured using the Shannon-Wiener diversity index (Clarke & Warwick 1994). It was
Parks Victoria Technical Series No. 19 Community-Based Marine Monitoring
12
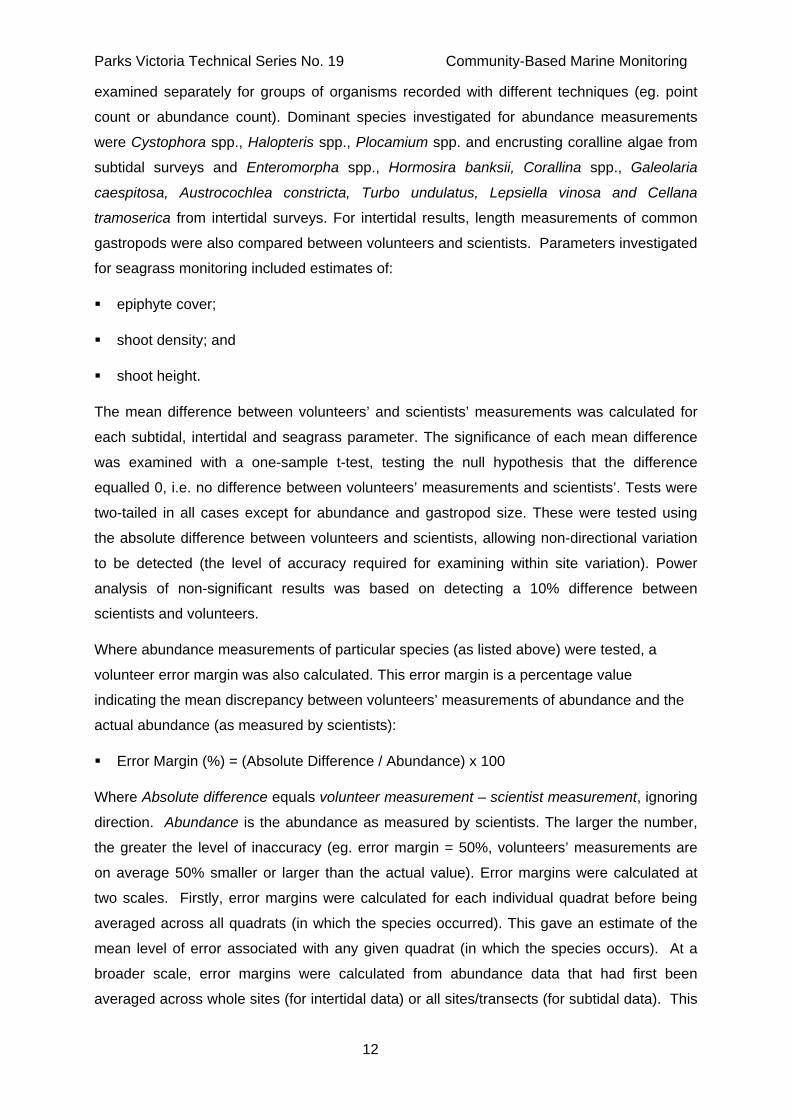
examined separately for groups of organisms recorded with different techniques (eg. point
count or abundance count). Dominant species investigated for abundance measurements
were Cystophora spp., Halopteris spp., Plocamium spp. and encrusting coralline algae from
subtidal surveys and Enteromorpha spp., Hormosira banksii, Corallina spp., Galeolaria
caespitosa, Austrocochlea constricta, Turbo undulatus, Lepsiella vinosa and Cellana
tramoserica from intertidal surveys. For intertidal results, length measurements of common
gastropods were also compared between volunteers and scientists. Parameters investigated
for seagrass monitoring included estimates of:
epiphyte cover;
shoot density; and
shoot height.
The mean difference between volunteers’ and scientists’ measurements was calculated for
each subtidal, intertidal and seagrass parameter. The significance of each mean difference
was examined with a one-sample t-test, testing the null hypothesis that the difference
equalled 0, i.e. no difference between volunteers’ measurements and scientists’. Tests were
two-tailed in all cases except for abundance and gastropod size. These were tested using
the absolute difference between volunteers and scientists, allowing non-directional variation
to be detected (the level of accuracy required for examining within site variation). Power
analysis of non-significant results was based on detecting a 10% difference between
scientists and volunteers.
Where abundance measurements of particular species (as listed above) were tested, a
volunteer error margin was also calculated. This error margin is a percentage value
indicating the mean discrepancy between volunteers’ measurements of abundance and the
actual abundance (as measured by scientists):
Error Margin (%) = (Absolute Difference / Abundance) x 100
Where Absolute difference equals volunteer measurement – scientist measurement, ignoring
direction. Abundance is the abundance as measured by scientists. The larger the number,
the greater the level of inaccuracy (eg. error margin = 50%, volunteers’ measurements are
on average 50% smaller or larger than the actual value). Error margins were calculated at
two scales. Firstly, error margins were calculated for each individual quadrat before being
averaged across all quadrats (in which the species occurred). This gave an estimate of the
mean level of error associated with any given quadrat (in which the species occurs). At a
broader scale, error margins were calculated from abundance data that had first been
averaged across whole sites (for intertidal data) or all sites/transects (for subtidal data). This

Parks Victoria Technical Series No. 19 Community-Based Marine Monitoring
13
gave the level of error associated with the overall abundance of a particular species as
measured by volunteers.
A similar measure termed observer bias (Campbell and McKenzie, 2001) was calculated for
volunteers’ estimates of epiphyte cover of seagrass at the Corner Inlet site according to the
formula:
(Volunteer estimate of % cover / Scientist estimate of % cover) x 100.
Multivariate analyses of species assemblages using non-metric multidimensional scaling
(NMDS) and ANOSIM (Clarke & Warwick 1994) were conducted using Primer version 5.2
software. Limited results from the subtidal habitat restricted multivariate analyses to intertidal
data only. NMDS was based on Bray-Curtis similarity matrices after fourth-root
transformation of abundance data to reduce the dominance of very common species (Clarke
& Warwick 1994, Quinn & Keough 2002). NMDS is an ordination technique that plots
samples (in this case transects) according to the similarity of the species composition and
abundance, such that points closer together are more similar in their assemblages than more
distant points. This is a very useful technique for describing patterns between samples
(Clarke and Warwick 1994, O’Hara et al. 2002) and has the advantage (compared to
richness/diversity indices) of taking into account all of the species present and their
abundances at the same time. Statistical analyses of differences between groups were
performed using ANOSIM (Analysis of Similarity), a non-parametric equivalent of ANOVA
based on Bray-Curtis rank similarities.
Examination of survey data was limited to descriptive statistics and qualitative analysis due
to small sample sizes.

Parks Victoria Technical Series No. 19 Community-Based Marine Monitoring
14
3 RESULTS The accuracy and integrity of volunteer data varied across habitat types. Analysis was
limited for the seagrass and subtidal habitats as collection of monitoring data was restricted
due to unsuitable weather and difficulty in recruiting volunteers at short notice.
3.1 Merri Marine Sanctuary - Subtidal Rocky Reef Monitoring Monitoring data was collected on two separate occasions (29 April 2004, 11 May 2004) by 5
volunteer-scientist pairs. Three transects were surveyed though cryptic fish and invertebrate
data were not collected on the final transect due to a lack of divers. Two transects were
surveyed inside the MS and one adjacent to it, each taking approximately 45-50 minutes to
complete. The difference between volunteers and their paired scientist was averaged across
all transects and the small sample size should be considered when interpreting the data. Fish
length estimates were not compared because of limited data.
3.1.1 Species Richness and Diversity
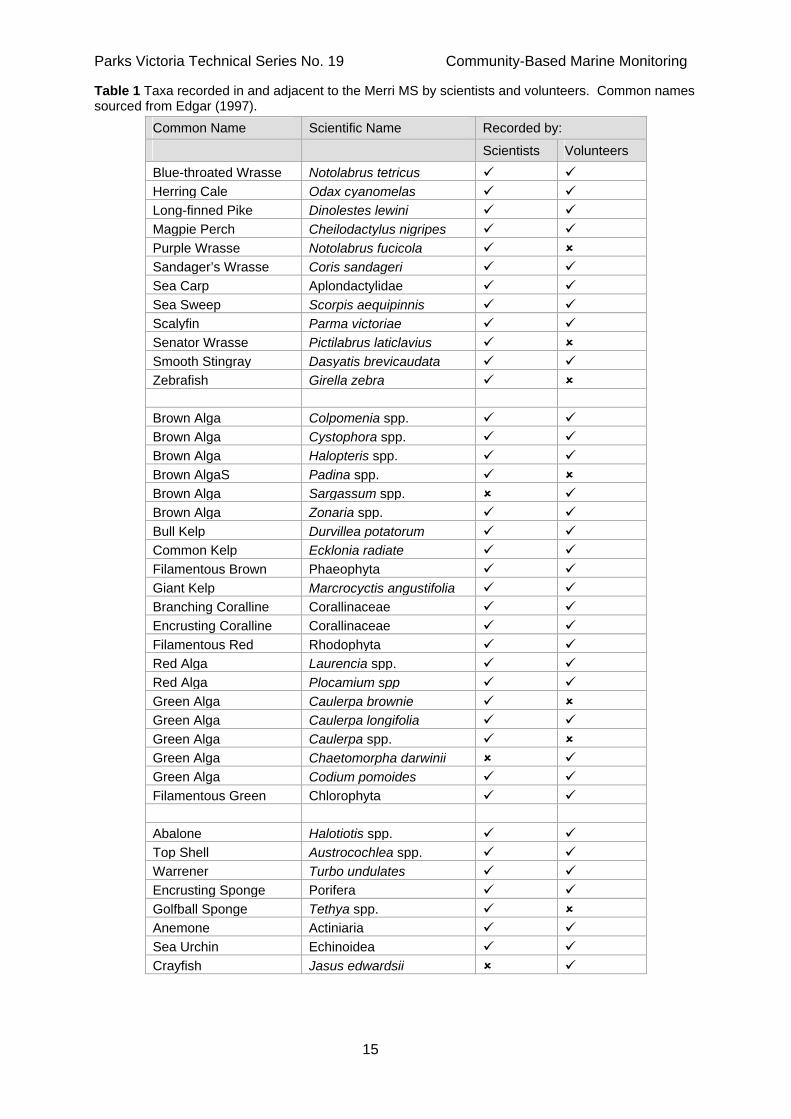
A total of 43 species or taxa were recorded in and adjacent to the Merri MS (Table 1). Thirty-
nine species were recorded by scientists, whilst 36 were recorded by volunteers. There was
no significant difference in the mean species richness recorded by volunteers and scientists
(t = 0.866, d.f. = 2, P = 0.478; Figure 1), although the test had low power (0.102).
Figure 1 Mean species richness (±1 SE) measured by scientists and volunteers at Merri MS.
Scientist Volunteer
Observer Type
0
5
10
15
20
Species
Richness
Parks Victoria Technical Series No. 19 Community-Based Marine Monitoring
15
Table 1 Taxa recorded in and adjacent to the Merri MS by scientists and volunteers. Common names sourced from Edgar (1997).
Common Name Scientific Name Recorded by:
Scientists Volunteers Blue-throated Wrasse Notolabrus tetricus Herring Cale Odax cyanomelas Long-finned Pike Dinolestes lewini Magpie Perch Cheilodactylus nigripes Purple Wrasse Notolabrus fucicola Sandager’s Wrasse Coris sandageri Sea Carp Aplondactylidae Sea Sweep Scorpis aequipinnis Scalyfin Parma victoriae Senator Wrasse Pictilabrus laticlavius Smooth Stingray Dasyatis brevicaudata Zebrafish Girella zebra Brown Alga Colpomenia spp. Brown Alga Cystophora spp. Brown Alga Halopteris spp. Brown AlgaS Padina spp. Brown Alga Sargassum spp. Brown Alga Zonaria spp. Bull Kelp Durvillea potatorum Common Kelp Ecklonia radiate Filamentous Brown Phaeophyta Giant Kelp Marcrocyctis angustifolia Branching Coralline Corallinaceae Encrusting Coralline Corallinaceae Filamentous Red Rhodophyta Red Alga Laurencia spp. Red Alga Plocamium spp Green Alga Caulerpa brownie Green Alga Caulerpa longifolia Green Alga Caulerpa spp. Green Alga Chaetomorpha darwinii Green Alga Codium pomoides Filamentous Green Chlorophyta Abalone Halotiotis spp. Top Shell Austrocochlea spp. Warrener Turbo undulates Encrusting Sponge Porifera Golfball Sponge Tethya spp. Anemone Actiniaria Sea Urchin Echinoidea Crayfish Jasus edwardsii
Parks Victoria Technical Series No. 19 Community-Based Marine Monitoring
16
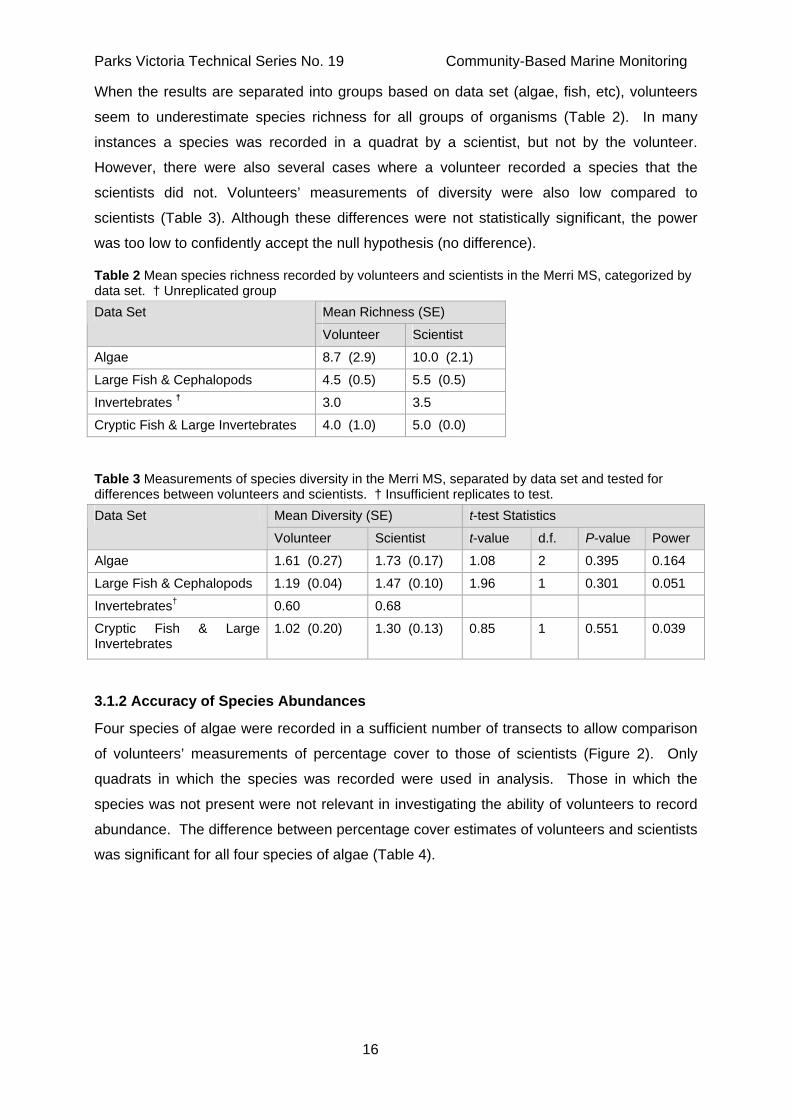
When the results are separated into groups based on data set (algae, fish, etc), volunteers
seem to underestimate species richness for all groups of organisms (Table 2). In many
instances a species was recorded in a quadrat by a scientist, but not by the volunteer.
However, there were also several cases where a volunteer recorded a species that the
scientists did not. Volunteers’ measurements of diversity were also low compared to
scientists (Table 3). Although these differences were not statistically significant, the power
was too low to confidently accept the null hypothesis (no difference).
Table 2 Mean species richness recorded by volunteers and scientists in the Merri MS, categorized by data set. † Unreplicated group
Mean Richness (SE) Data Set
Volunteer Scientist
Algae 8.7 (2.9) 10.0 (2.1)
Large Fish & Cephalopods 4.5 (0.5) 5.5 (0.5)
Invertebrates † 3.0 3.5
Cryptic Fish & Large Invertebrates 4.0 (1.0) 5.0 (0.0)
Table 3 Measurements of species diversity in the Merri MS, separated by data set and tested for differences between volunteers and scientists. † Insufficient replicates to test.
Mean Diversity (SE) t-test Statistics Data Set
Volunteer Scientist t-value d.f. P-value Power
Algae 1.61 (0.27) 1.73 (0.17) 1.08 2 0.395 0.164
Large Fish & Cephalopods 1.19 (0.04) 1.47 (0.10) 1.96 1 0.301 0.051
Invertebrates† 0.60 0.68
Cryptic Fish & Large Invertebrates
1.02 (0.20) 1.30 (0.13) 0.85 1 0.551 0.039
3.1.2 Accuracy of Species Abundances
Four species of algae were recorded in a sufficient number of transects to allow comparison
of volunteers’ measurements of percentage cover to those of scientists (Figure 2). Only
quadrats in which the species was recorded were used in analysis. Those in which the
species was not present were not relevant in investigating the ability of volunteers to record
abundance. The difference between percentage cover estimates of volunteers and scientists
was significant for all four species of algae (Table 4).

Parks Victoria Technical Series No. 19 Community-Based Marine Monitoring
17
Figure 2 Mean percentage cover (±1 SE) of common algae along subtidal transects (in quadrats where they were recorded) for both volunteers and scientists. Table 4 Mean (absolute) difference in algal percentage cover measured by volunteers and scientists. t-tests examine if this value is significantly different to 0. * P <0.05, ** P <0.01. Species Mean Difference (SE) t-value d.f. P-value
Cystophora spp. 8.7 (8.1) 10.69 2 0.005**
Halopteris spp. 14.3 (5.9) 4.87 2 0.020*
Plocamium spp. 9.1 (1.1) 4.37 2 0.025*
Encrusting Coralline 16.3 (2.1) 7.89 2 0.008**
These differences can be expressed as error margins which are relative to the abundance of
the species. As Table 5 shows, the selected species of algae had high error margins,
indicating volunteer measurements were considerably different to actual abundances.
Halopteris spp. was excluded from this examination as in 2 out of 3 instances of the species,
scientists did not record cover but volunteers had, and it is uncertain whether this is due to
volunteer misidentification, or observational error on behalf of the scientist.
Cystophora spp. Halopteris spp.
Plocamium spp.
Encrusting Coralline
Species
0.00
10.00
20.00
30.00
Percentage
Cover
Scientist
Volunteer
Observer Type

Parks Victoria Technical Series No. 19 Community-Based Marine Monitoring
18
Table 5 Error margins of volunteers’ estimates of algal abundance. Values represent the mean difference (±) between volunteers’ results and the actual abundance for quadrats in which the species occurs. Species Error Margin (%) SE n
Cystophora spp. 94.9 5.1 3
Plocamium spp. 79.6 23.5 3
Encrusting Coralline 84.0 16.0 3
The values in Table 5 relate to the accuracy of volunteers at the quadrat level – i.e. how
much error can be expected from any given quadrat. At a broader scale, all quadrats from all
sites/transects were averaged to give the ‘overall’ abundance for that species across the
three sites/transects (Figure 3). This averages out fluctuations between volunteers and
scientists and gives an indication of the accuracy of using several volunteers to record site-
scale abundances. As Table 6 shows, with three volunteers averaged across all quadrats
and sites, estimates of Cystophora spp., Plocamium spp. and encrusting coralline have a
lower error margin than when analysed at the finer scale of quadrats (Table 5). However, the
error margins for Halopteris spp. and encrusting coralline species still show volunteers’
records are considerably different to scientists’.

Parks Victoria Technical Series No. 19 Community-Based Marine Monitoring
19
Figure 3 Mean percentage cover (±1 SE) of algae across all quadrats and sites for both volunteers and scientists (n = 30)
Table 6 Error margins of dominant algae representing the mean difference (±) between volunteers’ results and the actual abundance when abundance is calculated over all 3 sites/transects. Species Error Margin (%)
Cystophora spp. 27.2
Plocamium spp. 11.3
Halopteris spp. 80.0
Encrusting Coralline 48.9
Species
0.0
5.0
10.0
15.0
20.0
Percentage
Cover
Scientist
Volunteer
Observer Type
Cystophora spp.
Halopteris spp.
Plocamium spp.
Encrusting Coralline

Parks Victoria Technical Series No. 19 Community-Based Marine Monitoring
20
3.2 Ricketts Point Marine Sanctuary – Intertidal Rocky Reef Monitoring
Three sites were surveyed by a total of 13 volunteers. Four transects were run at Triangle
Reef, Ricketts Point MS (9 May 2004), 5 at Teahouse Reef, Ricketts Point MS (22 May
2004) and 3 at the reference site Breakwall Reef, Black Rock (23 May 2004).
3.2.1 Species Richness and Diversity
A total of 30 species were recorded throughout the intertidal monitoring (Table 7). While
scientists observed all 30 of these, volunteers recorded only 29, missing one individual of
Onchidella patelloides (Ocean beach slug).
The accuracy of volunteers’ species richness measurements (difference between volunteers’
measurements and scientists’) did not vary between sites when tested with an ANOVA (F2,9 =
0.085, P = 0.920). Pooled across all sites, volunteers recorded a mean species richness
very similar to that recorded by scientists (Figure 4). The difference between their
measurements was not significant (t = 0.713, d.f. = 11, P = 0.491), with a power of 0.628..
Figure 4 Mean species richness (±1 SE) of intertidal transects, pooled across all sites and shown for both volunteers and scientists.
Scientist Volunteer
Observer Type
2.0
4.0
6.0
8.0
10.0
No. of Species/ Transect

Parks Victoria Technical Series No. 19 Community-Based Marine Monitoring
21
Table 7 Intertidal species recorded by scientists and/or volunteers and at what site they occurred. R1 = Triangle Reef, Ricketts Point MS, R2 = Teahouse Reef, Ricketts Point MS, B1 = Breakwall Reef, Black Rock. Common names sourced from Quinn et al. (1992). Common Name Scientific Name Recorded by Recorded in
Sci Vol R1 R2 B1
Green Bait Weed Enteromorpha spp.
Sea Lettuce Ulva spp.
Neptune’s Necklace Hormosira banksii
Turfing Red Algae Capreolia implexa
Coralline Algae Corallina spp.
Encrusting Coralline Corallinaceae
Red Algae Laurencia spp.
Sydney Coral Galeolaria caespitosa
Chiton Polyplacophora
Black Nerite Nerita atramentosa
Conniwink Bembicium melanostomum
Conniwink Bembicium nanum
Ribbed Top Shell Austrocochlea constricta
Warrener Turbo undulates
Variegated Limpet Cellana tramoserica
False Limpet Siphonaria diemenensis
Tall Ribbed limpet Patelloida alticostata
Wine-mouthed lepsiella Lepsiella vinosa
Mudwhelk Batillaria australis
Spengler’s Rock Whelk Cabestana spengleri
Lineated Cominella Cominella lineolate
Ocean Beach Slug Onchidella patelloides
Scallop Bivalvia
Mussel Mytilidae
Beaked Mussel Brachidontes rostratus
Common Sea Star Patiriella calcar
Waratah Anemone Actinia tenebrosa
Anemone Anthothoe albocincta
Little Shore Crab Brachynotus spinosus
Barnacle Cirripedia

Parks Victoria Technical Series No. 19 Community-Based Marine Monitoring
22
Species diversity was examined separately according to the method used to measure
abundance (count or percentage cover). There was no effect of site on the accuracy of
diversity measurements for organisms that were counted (F2,9 = 0.654, P = 0.543) or those
that had percentage cover estimated (F2,9 = 2.064, P = 0.183). This allowed sites to be
pooled, with t-tests results indicating no significant difference between volunteers’ and
scientists’ measurements of diversity (Table 8).
Table 8 Mean intertidal diversity recorded by volunteers and scientists. Separate values are given for organisms that were counted and those that had percentage cover estimated. t-tests examine the significance of the difference between volunteers and scientists. Abundance Measure Mean Diversity (SE) t-test Statistics
Volunteer Scientist t-value d.f P-value Power
Individual Count 1.30 (0.11) 1.33 (0.11) 1.34 11 0.207 0.999
Percent Cover 0.82 (0.09) 0.86 (0.10) 0.89 11 0.391 0.531
3.2.2 Accuracy of Species Abundances
Four species from each of the abundance scales (counts and percentage cover) were
examined for differences between volunteers’ and scientists’ measurements of density
(Figure 5). The species selected were those that occurred on the most number of transects
(greatest replication).

Parks Victoria Technical Series No. 19 Community-Based Marine Monitoring
23
Figure 5 Abundance / Density (±1 SE) of most common intertidal species measured by volunteers and scientists averaged across all transects of all sites. Ent = Enteromorpha spp., Hor = H. banksii, Cor = Corallina spp., Gal = G. caespitosa, Aus = A. constricta, Tur = T. undulatus, Lep = L. vinosa, Cel = C. tramoserica.
To test if site had any effect on the difference between volunteers and scientists, one-factor
ANOVAs were performed on each species in question (Table 9). A. constricta was the only
species for which site was a significant factor and was tested separately for each. Pooling
across site, all of the other species showed a significant difference between measurements
of abundance taken by volunteers and scientists (Table 10).
Species
10.0
20.0
30.0
40.0
50.0
Density/0.25m2
Ent Hor Cor Gal Aus Tur Lep Cel
10.0
20.0
30.0
40.0
50.0
Percentage Cover
Scientist
Volunteer
Observer Type

Parks Victoria Technical Series No. 19 Community-Based Marine Monitoring
24
Table 9 Results from one-way ANOVA analyses testing if site had an effect on the absolute difference between volunteers’ and scientists’ measurements of abundance. † Fourth root / ‡ Square root transformed to improve normality and homogeneity of variances. ** P<0.01 Species F-Ratio d.f P-value
Enteromorpha spp. † 0.44 2,7 0.663
Hormosira banksii † 0.67 1,7 0.439
Corallina spp. † 2.86 2,6 0.135
Galeolaria caespitosa † 0.93 2,8 0.435
Austrocochlea constricta ‡ 10.30 2,9 0.005**
Turbo undulatus † 0.52 2,4 0.632
Lepsiella vinosa † 1.29 2,4 0.370
Cellana tramoserica ‡ 2.74 2,5 0.158
Table 10 Absolute difference (untransformed) between volunteers’ and scientists’ measurements of species abundances, pooled across all sites with t-tests checking if this value is significant. †Fourth-root / ‡Square-root transformed to improve normality * P<0.05, ** P<0.01 Species Mean Difference per
Quadrat (SE) t-value d.f. P-value
Enteromorpha spp. † 4.4 (0.91) 16.86 9 0.000**
Hormosira banksii † 3.1 (0.92) 15.47 8 0.000**
Corallina spp. † 5.6 (3.18) 6.01 8 0.000**
Galeolaria caespitosa † 5.2 (1.34) 15.88 10 0.000**
Turbo undulatus † 1.1 (0.42) 3.71 6 0.005**
Lepsiella vinosa † 0.8 (0.09) 32.42 6 0.000**
Cellana tramoserica ‡ 1.5 (0.85) 2.67 7 0.016*
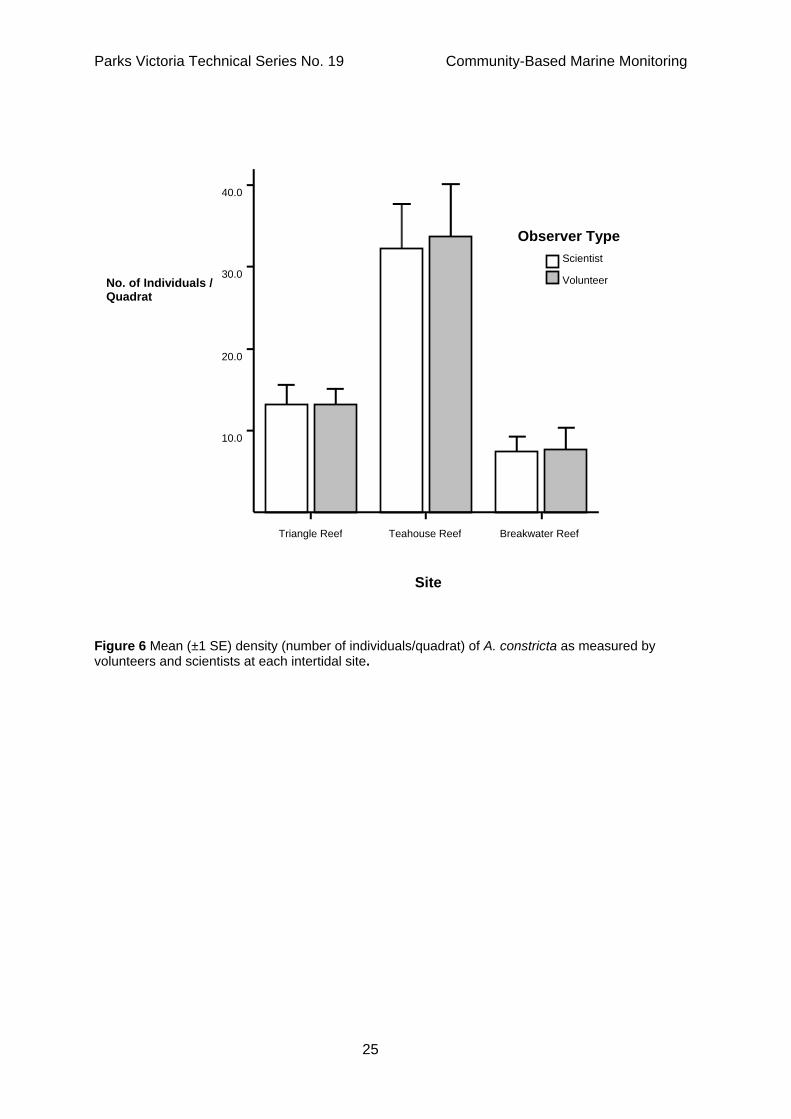
Similarly, volunteers’ and scientists’ records of the density of Austrocochlea constricta were
significantly different to each other for each site, with a much larger difference evident for
results from Teahouse Reef (Table 11). As Figure 6 shows, the abundance of A. constricta
was also far higher at this site. A plot of the absolute difference against abundance (pooled
across the three sites) indicates a strong, significant relationship between these two
variables, with the difference increasing directly in proportion to abundance (Figure 7).
Table 11 Absolute difference (untransformed) between volunteers’ and scientists’ measures of abundance for A. constricta for each site with t-tests checking if this is significant (Square root transformed to improve normality). * P<0.05, ** P<0.01 Site Mean Difference /
Quadrat (SE) t-value d.f. P-value
Triangle Reef 1.3 (0.46) 2.98 3 0.030*
Teahouse Reef 7.5 (1.67) 8.80 4 0.000**
Breakwall Reef 1.4 (0.23) 11.80 2 0.004**
Parks Victoria Technical Series No. 19 Community-Based Marine Monitoring
25
Figure 6 Mean (±1 SE) density (number of individuals/quadrat) of A. constricta as measured by volunteers and scientists at each intertidal site.
Triangle Reef Teahouse Reef Breakwater Reef
Site
10.0
20.0
30.0
40.0
No. of Individuals / Quadrat
Scientist
Volunteer
Observer Type

Parks Victoria Technical Series No. 19 Community-Based Marine Monitoring
26
Figure 7 Scatterplot of the density of A. constricta against the absolute difference between volunteers and scientists (square-root transformed) showing a significant positive relationship (F1,10 = 22.00, P = 0.001). 95% confidence intervals of the mean are shown.
Figure 8 shows the error margins calculated for each of the species examined. The error
margins of volunteers’ results were calculated in the same manner as for subtidal data.
However, unlike the subtidal results, where a volunteer recorded an organism and a scientist
did not, it was concluded that the scientist had ‘missed’ it, and an error margin of -100% was
assigned (the opposite of when a volunteer ‘missed’ an organism). Unlike observations in
the subtidal habitat, the ‘missed’ intertidal species were common, relatively easy to identify
and had no logical alternative recorded by the scientist.
There is clearly a high degree of variability in volunteer accuracy (Figure 8). The most
accurately recorded species was H. banksii, followed by A. constricta. The most inaccurately
recorded species was G. caespitosa, followed by L. vinosa and Corallina spp. The unusual
result of a ‘negative’ accuracy margin for C. tramoserica can be explained by two cases
where volunteers recorded this species but scientists did not, consequently reducing the
mean error margin to below 0.
0.00 10.00 20.00 30.00 40.00 50.00
No. / Quadrat
0.00
1.00
2.00
3.00
4.00
Square-root of
Difference
y = 0.57 + 0.06 * Number per Quadrat
R-Square = 0.69

Parks Victoria Technical Series No. 19 Community-Based Marine Monitoring
27
Figure 8 Error margins of dominant intertidal species (±1 SE), indicating the average difference at the quadrat level between volunteers’ results and scientists’ as a percentage of the abundance. Ent = Enteromorpha spp., Hor = H. banksii, Cor = Corallina spp., Gal = G. caespitosa, Aus = A. constricta, Tur = T. undulatus, Lep = L. vinosa, Cel = C. tramoserica.
The error margins in Figure 8 give an indication of the variability expected from volunteers
when examining results at the scale of quadrats. Estimates of density/abundance at the
scale of site can be calculated by averaging abundances across all quadrats (at a site).
Comparing volunteers’ results to scientists’ at this level shows an overall reduction in error
margins, with A. constricta and H. banksii being the most accurately assessed species
(Figure 9). This confers with accuracy results at the quadrat level. However, G. caespitosa
had a very high error margin at the scale of quadrats, though is the third most accurately
measured species at the site level. L. vinosa and Corallina spp. were inaccurately assessed,
with high and variable deviations from the actual abundance.
Species
-50.0
0.0
50.0
100.0
150.0
Error Margin %
Ent Hor Cor Gal Aus Tur Lep Cel
n=10 n=9 n=9 n=11 n=12 n=7 n=7
n=8

Parks Victoria Technical Series No. 19 Community-Based Marine Monitoring
28
Figure 9 Error margins (±1 SE) of dominant intertidal species indicating the difference between volunteers’ and scientists’ site-level measurements of abundance as a percentage of the abundance. Ent = Enteromorpha spp., Hor = H. banksii, Cor = Corallina spp., Gal = G. caespitosa, Aus = A. constricta, Tur = T. undulatus, Lep = L. vinosa, Cel = C. tramoserica.
3.2.3 Community Composition
Multivariate analyses allow the abundance and composition all of species in a sample
(transect) to be compared in a single test. Volunteers’ and scientists’ results were relatively
similar to each other compared to the differences between transect (Figure 10). This is
supported by a two-way ANOSIM analysis showing no significant difference between
volunteers and scientists (R = -0.197, P = 0.966). A difference between sites was apparent
(R = 0.582, P = 0.001). This difference could be detected using only the data from scientists -
a NMDS ordination shows three clear grouping of samples, corresponding to the three sites
from which they were collected (Figure 11). ANOSIM analysis revealed site to be a
significant factor (R = 0.615, P = 0.001) with all pair-wise comparisons being significantly
different (Table 13). However, an NMDS ordination of only samples taken by volunteers
indicates only two clear groupings (Figure 12).
Species
-50.0
0.0
50.0
100.0
Error Margin (%)
Ent Hor Cor Gal Aus Tur Lep Cel
n=3 n=2 n=3 n=3 n=3 n =3 n=3 n=3

Parks Victoria Technical Series No. 19 Community-Based Marine Monitoring
29
Stress: 0.16Stress: 0.16
Figure 10 NMDS ordination plot derived from Bray-Curtis similarity indices of scientists’ (hashed) and volunteers’ (clear) samples of species abundances. Stress < 0.20 indicates plot is a good representation of the relationships. = Triangle Reef, Ricketts Point MS, = Teahouse Reef, Ricketts Point MS, = Breakwall Reef, Black Rock.
Stress: 0.12
Figure 11 NMDS ordination plot derived from Bray-Curtis similarity indices of scientists’ samples of species abundances. Stress < 0.20 indicates plot is a good representation of the relationships. = Triangle Reef, Ricketts Point MS , = Teahouse Reef, Ricketts Point MS, = Breakwall Reef, Black Rock.

Parks Victoria Technical Series No. 19 Community-Based Marine Monitoring
30
Stress: 0.11
Figure 12 NMDS ordination plot derived from Bray-Curtis similarity indices of volunteers’ samples of species abundances. Stress < 0.20 indicates plot is a good representation of the relationships. = Triangle Reef, Ricketts Point MS, = Teahouse Reef, Ricketts Point MS, = Breakwall Reef, Black Rock.
ANOSIM analysis again revealed a significant difference between sites (R = 0.550, P =
0.002), though unlike for scientists, pair-wise comparisons did not show a distinction between
site 1 and 2 - the two Ricketts Point MS sites (Table 14). Volunteers’ samples were therefore
not as precise as scientists as they were less able to discern different sites.
Table 13 ANOSIM pair-wise comparisons of site for samples collected by scientists. Group 1 = Triangle Reef; 2 = Teahouse Reef; 3 = Breakwall Reef. * P <0.05 Group Comparison R-Statistic P-value
1,2 0.438 0.016*
1,3 0.778 0.029*
2,3 0.774 0.018*
Table 14 ANOSIM pair-wise comparisons of site for samples collected by volunteers. Group 1 = Triangle Reef; 2 = Teahouse Reef; 3 = Breakwall Reef. * P <0.05 Group Comparison R-Statistic P-value
1,2 0.219 0.111
1,3 0.759 0.029*
2,3 0.805 0.018*

Parks Victoria Technical Series No. 19 Community-Based Marine Monitoring
31
3.2.4 Measurement of Size
A. constricta was the only species that occurred in sufficient numbers to allow a comparison
of accuracy between sites. ANOVA analysis showed that the mean absolute difference
(square-root transformed) between volunteers and scientists varied significantly between site
(F2,9 = 5.11, P = 0.033). Analysing each site separately revealed the difference between
volunteers and scientists to be significant in every case (Table 14). Though the differences
in Table 14 are significant, they are small when compared to the actual size of the animals,
as the error margins in Table 15 show. If all quadrats are averaged first to give a mean
overall size for each site (Figure 13), the difference between volunteers and scientists (error
margin) is further reduced to just 2.5% (SE = 1.1, n = 3).
Table 14 Mean difference between volunteers’ and scientists’ measurements of A. constricta at the level of quadrats. t-test results based on square root transformed data. * P < 0.05 ** P < 0.01 Site Difference in mm (SE) t-value d.f P-value
Triangle Reef 0.4 (0.1) 6.207 3 0.004**
Teahouse Reef 0.7 (0.2) 6.785 4 0.001**
Breakwall Reef 1.5 (0.4) 7.745 2 0.008**
Table 15 Accuracy margins for volunteers’ estimates of the size of A. constricta, expressed as a percentage of the actual size. Site Error Margin % SE n
Triangle Reef 3.1 0.9 4
Teahouse Reef 4.7 1.5 5
Breakwall Reef 10.0 2.0 3

Parks Victoria Technical Series No. 19 Community-Based Marine Monitoring
32
Figure 13 Mean size of A. constricta (±1 SE) measured by scientists and volunteers at each site.
Size comparisons were also made between observers’ measurements of C. tramoserica,
though analysis was limited to Black Rock because of a lack of data from the other sites.
The mean difference in length of +/- 0.9 mm was not found to be significant (t = 2.722, d.f. =
2, P = 0.057). A power of 0.911 means a high level of confidence in this result. This
translated to an error margin of 4.9% (SE = 1.8, n = 3), which was reduced further to just
0.4% when the mean size of individuals was calculated for the entire site (Figure 14).
Triangle Reef Teahouse Reef Breakwall Reef
Site
5.00
10.00
15.00
20.00
Mean Size (mm)
Scientist
Volunteer
Observer Type

Parks Victoria Technical Series No. 19 Community-Based Marine Monitoring
33
Figure 14 Mean size of C. tramoserica (±1 SE) at the Black Rock site as measured by both volunteers and scientists.
Volunteer Scientist
Observer Type
5.0
10.0
15.0
20.0
25.0
Size (mm)

Parks Victoria Technical Series No. 19 Community-Based Marine Monitoring
34
3.3 Corner Inlet Marine National Park - Seagrass Monitoring Seven volunteers participated in the summer training session. Due to inclement weather, P.
australis monitoring data was not collected by these volunteers and only one was able to
participate in a subsequent excursion (14 March 2004). Two volunteers from the S.E.A.L.
Diving Services group were involved in a monitoring exercise on the 11 June 2004 in colder
winter conditions. Overall, three transects were completed by three volunteer-scientist pairs
over two separate days. Only P. australis was present along these transects and
consequently identification skills were not addressed.
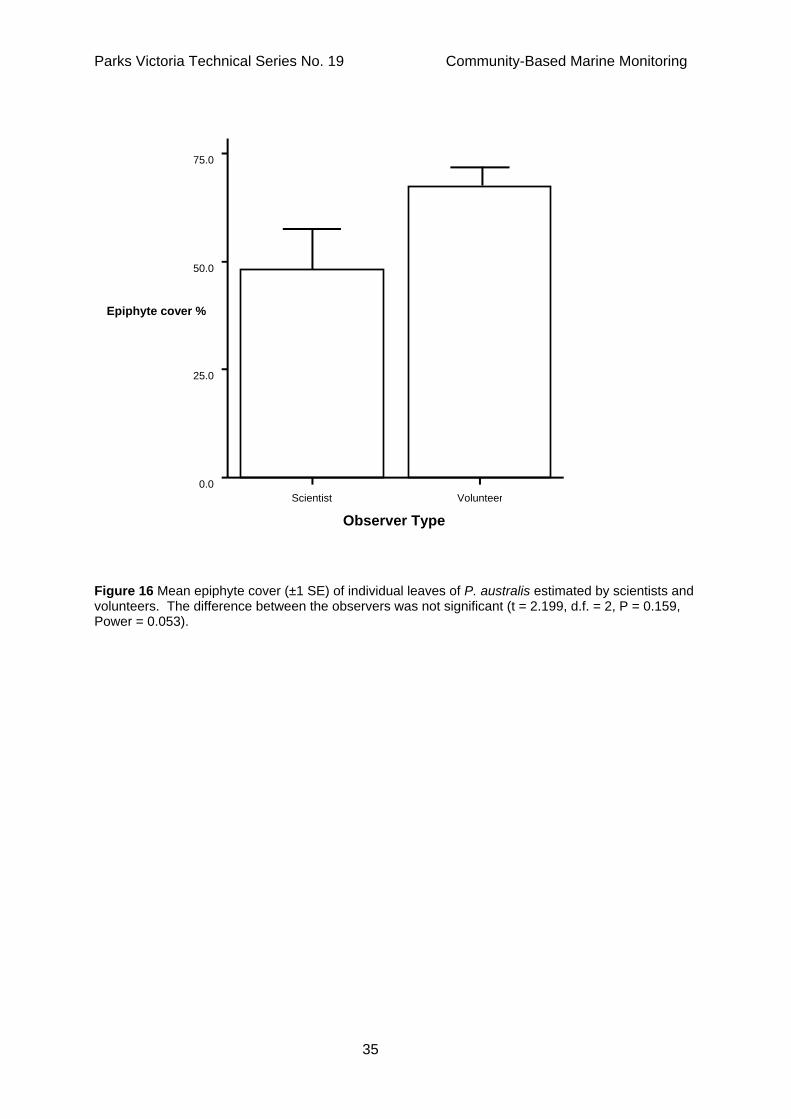
Observer bias was high and variable for estimates of single leaf epiphyte cover, and total
epiphyte cover. The mean proportional difference between volunteers’ estimates and
scientists’ estimates was 49.0% for single leaf epiphyte cover and 24.3% for total epiphyte
cover (Figure 15). The net differences between volunteers’ and scientists’ estimates are
shown in Figures 16 and 17 for leaf cover and total cover respectively. Though neither were
significantly different, the very low power of the tests (high standard deviation and low level
of replication) means that this result is unreliable.
Figure 15 The percentage difference (±1 SE) between volunteers’ and scientists’ estimates of epiphyte cover on P. australis shown for single leaf measurements, and overall.
Epiphyte cover of leaves Epiphyte cover overall
Parameter
0.0
25.0
50.0
75.0
Percentage
difference
Parks Victoria Technical Series No. 19 Community-Based Marine Monitoring
35
Figure 16 Mean epiphyte cover (±1 SE) of individual leaves of P. australis estimated by scientists and volunteers. The difference between the observers was not significant (t = 2.199, d.f. = 2, P = 0.159, Power = 0.053).
Scientist Volunteer
Observer Type
0.0
25.0
50.0
75.0
Epiphyte cover %

Parks Victoria Technical Series No. 19 Community-Based Marine Monitoring
36
Figure 17 Mean estimates of epiphyte cover (±1 SE) on P. australis in sub-quadrats for both scientists and volunteers. The difference between observers was not significant (t = 0.654, d.f. = 2, P = 0.580, Power = 0.062).
The difference between observers measurements of shoot density was 0.16 (shoots/plant).
This was only 6% of the mean density and not a significant value (t = -0.903, d.f. = 2, P =
0.462). There was also little variation in shoot height measurements between volunteers and
scientists, with a mean difference of 0.1 cm, or 4% of the height measured by scientists.
This difference was not significant (t = 0.549, d.f. = 2, P = 0.638). Despite the low power of
these tests to detect a significant difference (0.144 and 0.153 respectively), the overall mean
differences were relatively small. The mean shoot density and height as measured by
volunteers and scientists are shown in Figures 18 and 19 respectively.
Scientist Volunteer
Observer Type
0.0
20.0
40.0
60.0
Epiphyte cover

Parks Victoria Technical Series No. 19 Community-Based Marine Monitoring
37
Figure 18 Mean number of shoots (±1 SE) per P. australis plant measured by volunteers and scientists.
Figure 19 Mean shoot height (±1 SE) of P. australis measured by volunteers and scientists.
Scientist Volunteer
Observer Type
0.0
1.0
2.0
3.0
Shoots / Plant
Scientist Volunteer
Observer Type
0.0
10.0
20.0
30.0
Mean Shoot Height (cm)

Parks Victoria Technical Series No. 19 Community-Based Marine Monitoring
38
3.4 Survey of participants and community group members Survey response rates were generally good with a total of 122 surveys returned. Volunteers
who participated at Merri had a response rate of 56% (n=9) while those from Ricketts Point
had a response rate of 77% (n=13). Corner Inlet volunteers also had a 56% (n=9) response
rate. Non-participants from the community groups were more varied. Approximately 10%
(n=50) from Merri, 48% (n=65) from Ricketts Point and 45% (n=200) from Corner Inlet
returned the non-participant surveys.
3.4.1 Demographics
The demographics of the different community groups varied considerably (Table 16).
Participants tended to fall in younger age brackets than non-participants, although the
Ricketts point group showed a more even spread of age. Overall, group members had very
high levels of education, with 66% of respondents having tertiary qualifications. The majority
of participants at Corner Inlet and Ricketts Point were employed, with the Merri group
consisting solely of students. More than a third of non-participants who responded from
Corner Inlet were retired.
While all of the members at Merri (n=9), and 92.5% of Ricketts Point members (n=40) lived
less than 50 km from the monitoring site, 86.1% of the members from the Corner Inlet group
lived more than 50 km and 63.9% lived more than 150 km away.
Approximately half of all respondents (n=122) were also involved in other conservation
groups and/or other volunteer/friends groups.

Par
ks V
icto
ria T
echn
ical
Ser
ies
No.
19
Com
mun
ity-B
ased
Mar
ine
Mon
itorin
g
39
Tabl
e 16
Dem
ogra
phic
pro
file
of c
omm
unity
gro
up m
embe
rs w
ho re
turn
ed s
urve
ys a
nd p
artic
ipat
ed (P
), or
did
not
par
ticip
ate
(NP
) in
mon
itorin
g. W
here
co
lum
n to
tals
do
not e
qual
100
% th
e di
ffere
nce
repr
esen
ts th
e pr
opor
tion
who
cho
se n
ot to
resp
ond
to th
at q
uest
ion.
V
aria
ble
Cat
egor
y M
erri
Ric
ketts
Poi
nt
Cor
ner I
nlet
To
tal
P (n
=5)
NP
(n=4
) P
(n=1
0)
NP
(n=3
1)
P (n
=5)
NP
(n=6
7)
P (n
= 2
0)
NP
(n=1
02)
Age
18-3
0 ye
ars
100
100
3019
08
4015
31
-45
year
s 0
020
2380
2730
25
46-6
0 ye
ars
0 0
3023
2030
2027
O
ver 6
0 ye
ars
0 0
2036
036
1034
Gen
der
Mal
e60
25
4048
8049
5548
Fe
mal
e40
75
6048
2051
4551
Edu
catio
n S
econ
dary
40
75
1013
2015
2017
Ta
fe/T
echn
ical
0
050
320
1330
10
Terti
ary
60
2540
7760
6750
69
Oth
er0
00
70
30
4
O
ccup
atio
n S
tude
nt
100
100
1010
00
307
Em
ploy
ed
0 0
5045
100
6150
54
Ret
ired
0 0
2032
034
1032
U
nem
ploy
ed
0 0
03
00
01
D
omes
tic D
utie
s 0
00
100
30
5
In
com
e 1-
15,5
99
40
7510
260
615
15
15,6
00 –
25,
999
60
2530
100
1930
17
26,0
00 –
41,
599
0 0
3026
2027
2026
41
,600
– 5
1,99
9 0
010
130
215
18
52,0
00 –
77,
999
0 0
013
2012
512
78
,000
+ 0
010
740
515
5

Parks Victoria Technical Series No. 19 Community – Based Marine Monitoring
40
3.4.2 Participant Volunteer Profile
The main reason behind people participating in the monitoring was to assist with scientific
research, which was consistent across sites (Table 17). One respondent from the Deakin
University Underwater Club stated that they participated ‘to gain experience’.
Table 17 Main reasons given by respondents for taking part in the monitoring program. Main reason for participating in monitoring Percentage of
respondents (n = 20)
To work close to nature 30
To socialize with others with same conservation passions 5
To learn more about marine habitats 10
To assist with scientific research 50
Other 5
3.4.3 Exertion and Time Involved in Monitoring
More volunteers from Corner Inlet (20% n=5) and Merri (40% n=5) said that they exerted a
lot of physical effort in undertaking the monitoring than did those at Ricketts Point (11% n=9).
Sixty percent of volunteers at these sites (n=5) also thought that the monitoring took a long
time compared to only 33% at Ricketts point (n=9). Table 18 shows the amount of time
volunteers intended to stay to complete the monitoring, and indicates that Ricketts Point
participants generally planned for less than a day whereas other groups had varied notions
about how long was required.
Table 18 Amount of time volunteer respondents from different groups intended to stay to complete the monitoring. Intended Time Merri (n=3) Ricketts (n=10) Corner Inlet (n=5) Total (n=18)
0-5 hours 33 70 40 55
5-8 hours (day) 33 20 40 30
> 8 hours (>1 day) 33 10 20 15
3.4.4 Training and Identification
Forty percent of volunteers (n=5) from Merri said they were not confident identifying the flora
and fauna. At Ricketts Point however, this value was only 10% (n = 10). Similarly, more
volunteers at Ricketts Point (60% n=10) found the flora and fauna identification guide easier
to use than did volunteers working at Merri (40% n=5). However, suggestions for improving
the guides were particularly detailed from the Ricketts Point group, and are typified by the
response by one volunteer:

Parks Victoria Technical Series No. 19 Community – Based Marine Monitoring
41
‘In some instances, pictures of an organism from more than one angle, and with varying
degrees of wear, markings, shape and colouring – maybe 4 or 5 pictures for certain difficult
organisms’ (MCFRP volunteer, May 2004).
Interestingly, despite the higher confidence levels at Ricketts Point, there was a higher rate
of dissatisfaction with the training. While all of the volunteers that responded from Corner
Inlet (n=5) and Merri (n=5) thought that the training information was clearly delivered and
easy to understand, 40% of volunteers from Ricketts Point thought that the information was
not clearly delivered and 30% thought that it was not easy to understand (n=10). Again there
was much feedback from this group on how to improve the training, mainly dealing with
explanations of complex/confusing methods, and is an indication of the dedication and
thoroughness of group members. Only 10% (n=10) from the group thought that more time
needed to be spent on training, with 20% from Merri and 0% from Corner Inlet responding in
the same way. All respondents (n=20) said that they understood why the monitoring required
specific guidelines to be followed.
3.4.5 Non-Participant Volunteer Profile
The reasons given for not participating are shown in Table 19. Clearly a lack of time was the
primary reason for not being involved with 54% (n=102) citing this. The next most frequently
recorded response was ‘Other’, with a variety of reasons being given. The most commonly
occurring ones included not being able to swim, living too far away, being ‘too old’/physically
incapable or not knowing about the project.
Table 19 Percentages of non-participant respondents who cite particular reasons for not being involved in the monitoring project. Reasons for not participating in monitoring Percentage of
respondents (n = 102)
Lack of time 54
Do not enjoy being involved in scientific monitoring 3
Lack of confidence in ability to conduct scientific monitoring 10
Prefer to be financial supporter without doing activities 5
Ill health 5
Financial limitations 5
Other 23
No response 9
Not surprisingly therefore, a range of suitable dates (45%) and further information on what is
required (54%) were the two most frequently marked responses when asked what could be
done to encourage participation (Table 20). Other forms of encouragement most commonly

Parks Victoria Technical Series No. 19 Community – Based Marine Monitoring
42
suggested involve changing the type of monitoring (to something less physically demanding).
All respondents (n=4) from Merri, 89% (n=27) from Ricketts Point and 73% (n=62) from
Corner Inlet said that they would participate in the future. This is however an idealistic
response with many people qualifying it with clauses such as:
‘Time permitting and other commitments’ (Friends of the Prom member, March 2004).
Table 20 Forms of encouragement cited by non-participant respondents as being factors that may influence their future involvement. Form of encouragement Percentage of
Respondents (n=72)
Payment to be involved in scientific monitoring 7
A range of suitable dates to undertake the scientific monitoring 44
Greater involvement from other community group members 0
Further scientific support from Parks Victoria/Deakin University 6
Further information on what is required of me 54
Other 10
When non-participants were asked how much time they would be willing to commit to
voluntary scientific monitoring, 64 people responded (out of 102). Those from Ricketts Point
and Merri stated an average commitment approximately double that proposed by Friends of
the Prom members (Figure 20). Interestingly, Friends of the Prom members were more likely
to give a response in terms of days / year whereas the Ricketts Point and Merri groups were
more likely to express it as hours / week. This is perhaps indicative of the level of
commitment required to monitor habitats that may be far away from the majority of group
members.

Parks Victoria Technical Series No. 19 Community – Based Marine Monitoring
43
Figure 20 Mean number of days per year (±1 SE) that respondents from different sites said that they would be willing to commit to future monitoring.
3.4.6 Sustainability of Monitoring
In total, all volunteer respondents (n = 20) said that they enjoyed the monitoring, though one
volunteer did qualify this:
‘Got very cold through being under then out of the water continually’ (Friends of the Prom
member, February, 2004).
After completing the monitoring, 18 out of 19 volunteers said that they felt that they had
contributed something to the environment and 14 out of 15 thought that the monitoring had a
broader value.
While 90% of Ricketts Point volunteers (n=10) thought that they could train other members,
only 60% thought so in the Merri (n=5) and Corner Inlet (n=5) groups. One person from
Corner Inlet was the only one who thought that their community group could not conduct this
annually:
Merri Ricketts Point Corner Inlet
Site
0
5
10
15
Mean number of days

Parks Victoria Technical Series No. 19 Community – Based Marine Monitoring
44
‘If the monitoring is only to be done once a year the same people are unlikely to be available
and much of the training will have been forgotten’ (Friends of the Prom member, March
2004).
When asked if they would participate in the monitoring again, all respondents said yes (n=
12).
3.5 Parks Victoria Ranger Survey Nineteen rangers completed the Parks Victoria Ranger survey on 17 August 2004. All
respondents (100%) agreed that it is important to engage community groups in scientific
monitoring of Victoria’s MPAs. Table 21 summarises the response rate, in percentages, of
key survey questions.
Table 21 Parks Victoria Ranger survey responses associated with CBM programs (n = 19) Question Yes (%) No (%) Are community groups capable of collecting scientifically sound data? 95 5 Are data collected by community groups valid for scientific analysis? 89 11 Is data collection by community groups feasible in the long term? 95 5 Do you feel that community groups will be interested in maintaining annual monitoring of MNPs and MSs?
89 11
The top five limitations for using community groups to undertake scientific monitoring in
MNPs and MSs, as perceived by rangers, include:
1. Funding/Logistics/Equipment.
2. Skills and training of volunteers.
3. Accuracy of data collection.
4. Volunteers understanding scientific concepts.
5. Fading enthusiasm by volunteers for long term monitoring.
Positive aspects associated with community-based monitoring of MNPs and MSs, as
perceived by respondents, were:
1. Ownership/Custodianship/Stewardship of the MPA by the community group.
2. Contribution to management of Victoria’s MPAs.

Parks Victoria Technical Series No. 19 Community – Based Marine Monitoring
45
3. Increased awareness (values and objectives) of MPAs and the management authority’s
role in managing Victoria’s MPAs.
4. Capacity building and forming relationships between community groups and management
authority staff.
5. Baseline data accumulation of Victoria’s MPAs.

Parks Victoria Technical Series No. 19 Community – Based Marine Monitoring
46
4 DISCUSSION Volunteers working on intertidal sites recorded the most accurate data, possibly due to their
familiarity with the habitat and the greater ease with which it could be surveyed. Subtidal
records of abundance and species diversity were largely unreliable however they suffered
from a lack of replication due to adverse conditions. Poor weather and the problem of
organising volunteers at short notice were also issues facing investigations at Corner Inlet
MNP. Logistical considerations and community group demographics appear to be important
issues affecting both the reliability of data, and the long-term sustainability of monitoring.
4.1 Data Integrity 4.1.1 Merri Marine Sanctuary Subtidal Monitoring
Data collected by volunteers was highly variable and often very different to that collected by
scientists. Interpretation of these results must be cautious however, as only three transects
(replicates) were surveyed, one incompletely. This generally led to very low statistical power
for detecting difference. It should also be kept in mind that results from this dynamic habitat
will inherently have a high degree of variability (Barrett et al. 2002).
Both volunteers and scientists ‘missed’ species which were recorded by their counterpart.
Studies such as Darwall and Dulvy (1996) have attributed this to misidentification of species
by the volunteers. Misidentification, particularly of algal species, is certainly a possibility and
could account for scientists not recording a species where volunteers did. However, in one
case, a crayfish (Jasus edwardsii) was recorded by a volunteer but not by a scientist and in
this instance it is very unlikely that the species was misidentified. This could be explained by
the differing viewpoints of the paired volunteer and scientist. Due to the rugose structure of
the reef, it is unlikely that pairs of observers witnessed exactly the same things. This makes
identification and observational discrepancies very difficult to separate from each other,
despite there being a trend for scientists to record more species. While data from more
comparisons of volunteers and scientists would aid this, experimental evaluation of
identification skills may be more informative.
As with species diversity and richness measurements, variation in algal abundance records
of volunteers and scientists may also relate to a combination of observational and
identification errors. The net result is that volunteers’ measurements have a high margin of
error. Mean estimates of quadrat cover were more than 75% above or below the actual
cover. At this scale, volunteer data may be questionable. By averaging across all the
quadrats the error margin is reduced. Though this is at the expense of information such as
depth, co-occurring species, etc, broad scale information collected by volunteer divers may

Parks Victoria Technical Series No. 19 Community – Based Marine Monitoring
47
prove to be useful in detecting large shifts in community ecology, such as the population
explosions of Coscinasterias muricata detected by Barrett et al. (2002).
The difference between volunteers and scientists may also have links to the underlying
diving skills held by scientists. In an environment where there are many physical and mental
demands on participants’ concentration, it would not be surprising if more accurate records
are made simply because the observers are more comfortable and competent in the water,
allowing them to devote more attention and energy to surveying the reef. Other complications
relating to surveying the subtidal environment may further compound differences observed
between volunteers and scientists. This can include the limited availability of reference
material underwater and the similar morphology of many species of algae. Furthermore, the
time limits imposed by diving (i.e. air/nitrogen restrictions) only serve to add an element of
haste to observations and measurements.
Further training of volunteers has been shown by Darwall and Dulvy (1996) to improve
accuracy, though this may relate as much to the enhanced diving experience as to the
training. Volunteer monitors in the present study could also be expected to show
improvements in performance with additional training or perhaps merely with an increase in
experience level.
Barrett et al. (2002) and Campbell and McKenzie (2001) also found that averaging across
several volunteers significantly improved the agreement between their results and research
divers. This means that given sufficient experience, training and favourable conditions,
volunteers may be able to survey sites with sufficient accuracy as to provide useful results to
natural resource managers on broad changes in subtidal MPAs.
4.1.2 Ricketts Point Marine Sanctuary Intertidal Monitoring
Intertidal rocky reefs at Ricketts Point MS and at the reference site at Black Rock were easily
accessible and were not as reliant on weather conditions for monitoring as either the Merri
MS, or Corner Inlet MNP sites. This allowed 3 sites and a total of 12 transects to be
surveyed and a large number of volunteers to become involved. This is indicative of the
potential for establishing sustainable monitoring programs at similar locations.
Volunteers made accurate assessments of both the species richness and diversity in the
intertidal habitat. In the present study discrepancies between volunteers and scientists could
mainly be attributed to observational error (i.e. did not see) as there were few cases in which
species could have potentially been confused. This contrasts with subtidal surveys where
algal identification was more difficult. Also, studies on other intertidal reefs throughout

Parks Victoria Technical Series No. 19 Community – Based Marine Monitoring
48
Victoria (Edmunds et al. 2003) have found numerous morphologically similar species that
could be easily confused by volunteers or inexperienced scientists. Most of the species
recorded had been observed by the volunteers through previous experience and it would be
of interest to examine the accuracy of less experienced volunteers. Grouping of similar or
unidentifiable species into higher taxonomic categories may allow more robust assessments
to be made if identification skills are in doubt (Darwall and Dulvy 1996; Oliver and Beattie
1996).
The independence of volunteers and scientists may be questionable considering the close
working conditions inherent in the design. This may have improved volunteer accuracy in
assessing species richness, even though interaction was kept to a minimum. Correct
identification was a priority for these volunteers and it is likely that several had equal or
superior taxonomic skills to some of the scientists. Separating volunteers and scientists
completely, or using controlled experiments, may increase precision of the evaluation.
Volunteers were able to measure the abundance of Hormosira banksii and Austrocochlea
constricta at a site quite accurately, on average within 5% of that assessed by scientists.
When examining the distribution of species within a site however, information at the quadrat
level is required. At this scale the error margins were increased substantially, and the
confidence in volunteers’ measurements drops. The useability of this data therefore
depends on the level of accuracy required by managers. While site level abundances can be
used, they may ignore important changes in community distribution. This could include
spatially variable effects like trampling (Keough and Quinn 1998). Also, should the
abundance data only be used at the site level, the monitoring methodology may be
unnecessarily complex considering it is designed to detect within shore variations.
Simplification could make it more volunteer-friendly, better meeting the requirements of
community-groups and managers alike.
Foster-Smith & Evans (2003) found that using qualitative abundance scales, volunteers
could only accurately assess the abundance of the common and easily identified lugworm,
Arenicola marina, out of a variety of intertidal organisms. The two species most accurately
assessed in this study were also the two most commonly occurring. This may influence
volunteer measurements in several ways. Firstly, small, random variations between
volunteers and scientists would have a much larger effect on abundance measurements of
rarer species compared to abundant ones. Secondly, when volunteers are frequently
encountering a common species, they would be more familiar with it and more likely to
observe, identify and record it. Thirdly, both A. constricta and H. banksii are relatively large,

Parks Victoria Technical Series No. 19 Community – Based Marine Monitoring
49
conspicuous, easily identified organisms. Less abundant, smaller, and more difficult to
identify species such as Corallina spp. or L. vinosa are conversely less accurately measured.
Multivariate statistics are being used increasingly to analyse community and environmental
changes (Clarke and Warwick 1994; Barrett et al. 2002; O’Hara et al. 2002). The data
collected by scientists in this study was more informative than that collected by volunteers as
it allowed all three sites to be separated based on their community composition. Volunteers’
results on the other hand were unable to discern between the two Ricketts Point MS sites.
Volunteers’ data will thus not be as precise in detecting changes in intertidal communities,
though the question is: how precise do they need to be? Barrett et al. (2002) similarly found
that volunteer NMDS ordinations were not as precise as scientists, though they were
sufficiently able to detect community changes that occurred over short periods of time.
Considering that professional scientific monitoring will still continue, the more frequent
monitoring by volunteers may still yield useful results in detecting any major changes that
could occur over shorter periods of time, such as infestations of exotic pests.
Volunteers were found to accurately measure the shell length of both Austrocochlea
constricta and Cellana tramoserica. This agrees with results from Foster-Smith and Evans
(2003) for volunteer measurements of the size of the intertidal molluscs Nucella lapillus,
Gibbula cineraria and Gibbula umbilicalis. The accuracy is dependent on a sufficient number
of samples being taken. Approximately 50 measurements of A. constricta in this study gave
a mean difference between volunteers and scientists of <5%, and would be considered a
minimum.
4.1.3 Corner Inlet Marine National Park Seagrass Monitoring
While data collection was limited due to adverse weather, conditions on the days when
monitoring actually took place were close to ideal. It should therefore be kept in mind that
under less suitable conditions the monitoring would become more difficult to conduct due to
reduced visibility, waves and exposure. The accuracy of results under less than favourable
conditions may be reduced accordingly.
Volunteer estimates of epiphyte cover were not accurate. This may relate to the fact that as
they were essentially qualitative in nature, they rely entirely on the judgement of the
volunteer. Similar studies examining qualitative measurements taken by volunteers have
found them to be variable and often unreliable (Campbell and McKenzie 2001, Foster-Smith
and Evans, 2003). Quantitative measurements such as height and shoot density were far
more accurately measured by volunteers and provided useable information at the transect
Parks Victoria Technical Series No. 19 Community – Based Marine Monitoring
50
level. This was found to be an appropriate scale for monitoring the P. australis beds at
Corner Inlet (O’Hara et al 2002).
To improve volunteer estimates of epiphyte cover, Campbell and McKenzie’s (2001) used
multiple volunteers per transect and averaged their results. Considering the low number of
volunteers that were available to participate in the present study, this would reduce the
capacity of monitoring groups. An alternative may be to change the survey methodology so
that epiphyte cover is assessed quantitatively.
4.2 Community Volunteer Training Training requirements differed between habitat types. Extensive training was required before
volunteers could undertake subtidal monitoring and was considered critical in ensuring their
safety. Similar community monitoring programs involving SCUBA in Mafia Island Marine
Park, Tanzania, trained volunteer groups in species identification and ecological survey
techniques through dive training (Darwall & Dulvy 1996). The training program used in the
present study allowed organisers to evaluate the ‘in-water’ competency of divers in a
controlled, safe environment, rather than in potentially hazardous field conditions. This is
important considering that divers not only need to have basic dive skills, but also need to be
competent in equipment manipulation, underwater observations and data collection whilst
maintaining buoyancy control and buddy contact. Training of volunteers for intertidal and
seagrass monitoring took less time as the methods and identification guidelines were
relatively straightforward. This was reflected in the fact that MCRP participants were more
confident in their identification skills than participants from the Deakin University Underwater
Club group.
Despite more than 60% of all participants reporting that they could train other members in the
monitoring techniques, it is recommended that initial training of volunteer groups should be
undertaken by a professional who is familiar with the techniques and their underlying
principles. The reasons for this are two-fold. First, it will reduce inconsistencies in data
collection that may arise from volunteers teaching volunteers. Second, visible involvement by
the management body will help participants realise that there is an investment in the data
they will be collecting as being important and therefore, needs to be collected accurately.
Professional training would introduce community volunteers to best scientific practices when
selecting appropriate monitoring sites, aid in species identification, and the appropriate
management of collected data.
Many successful volunteer based monitoring programs have cited the use of a facilitator from
the management authority or a research group to train, supervise and support volunteer
monitoring (Arundel and Fairweather 2003; Barrett et al. 2002; Campbell and McKenzie

Parks Victoria Technical Series No. 19 Community – Based Marine Monitoring
51
2001; Darwell and Dulvy 1996; Hodgson et al. 2003). Community monitoring of Tasmanian
inshore reef ecosystems (Barrett et al. 2002) found that with good training and professional
facilitation of volunteers, CBM may provide data with sufficient reliability to detect substantial
shifts in reef ecosystems. These representatives, or facilitators, can provide groups with
access to monitoring materials such as reference guides, transects, quadrats, slates, data
sheets and other equipment and also play a valuable role in providing feedback to the
volunteers (Campbell & McKenzie 2001), many of whom in this study expressed a strong
interest in the outcomes of the monitoring research. It is also essential that events are well
coordinated and adequate post monitoring support is available to ensure species are
identified and recorded accurately and legibly (Barrett et al. 2002).
Initial training on monitoring methods and flora and fauna identification will allow community
group volunteers to pass on this knowledge to other members in the group. This, in turn, can
lead to an increase in volunteer monitoring participation. This was supported in this study by
survey results where only 1 from 21 participating volunteers, across all three habitat types,
viewed that the community group could not undertake monitoring annually as the training
would be forgotten. This indicates the need for on-going support by management authorities,
through Parks Victoria Rangers, to community groups involved with MPA monitoring.
4.3 COMMUNITY- BASED MONITORING SUSTAINABILITY 4.3.1 Monitoring Effort
Maintaining volunteer enthusiasm, interest and motivation is essential for the long-term
sustainability of any volunteer-based monitoring project, a notion supported by Campbell &
McKenzie’s (2001) three year study on community-based seagrass monitoring in
Queensland. Volunteer participants who undertook subtidal or seagrass monitoring, in the
present study of Victoria’s MPAs, felt that they had exerted a lot more energy and time
conducting the surveys than intertidal rocky reef volunteers. These two factors may limit
volunteer involvement in subtidal and seagrass habitat monitoring. Discomforts such as
exposure to cold water, time taken to put on SCUBA equipment, and descent time to the
monitoring start position for subtidal monitoring, contributed to monitoring effort. The
requirement of technical equipment (e.g. SCUBA, wetsuits and waterproof materials) for
seagrass and subtidal monitoring may also be seen by community-groups as too difficult to
obtain or they may be limited by a lack of SCUBA qualifications. Intertidal monitoring did not
require a great amount of energy to execute. MCRP volunteers were able to undertake
monitoring during all types of weather conditions, and the intertidal platform was accessible
from the shore during low tide. Intertidal rocky reef monitoring took less time then expected
to complete as wetsuits and specialised equipment were not needed. Reference books were
Parks Victoria Technical Series No. 19 Community – Based Marine Monitoring
52
easily accessible and utilised during intertidal monitoring to identify unknown flora and fauna.
Because of the decreased amount of effort required, intertidal rocky reef monitoring appears
to be the most sustainable of the three habitat monitoring procedures.
Despite the amount of effort and energy required for subtidal and seagrass monitoring, all
volunteer participants across the three habitat types responded that they enjoyed monitoring
and would partake in monitoring again. All participating volunteers, across all three habitat
types, would like to undertake monitoring on an annual basis. Whether or not this is feasible,
is dependent upon the organisation and motivation of individual groups. Although a single
session of monitoring only takes 2-3 hours to complete at each site, an ideal situation, for
most members, would require monitoring dates to suit them when they have no other
commitments and the weather is favourable for monitoring. This highlights the importance for
organisation and scheduling of monitoring with advance notice. Initial assistance from the
management authority is crucial for planning and structuring the monitoring requirements,
goals and timeframes (Campbell & McKenzie, 2001). This needs to be followed by continued
support, such as regular reports to community groups, presentations and ongoing training
(Campbell & McKenzie, 2001). This demonstrates to the community groups that their efforts
are producing valuable information, particularly as many were involved primarily to assist
with scientific research in this study.
4.3.2 Community Group Demographics
The demographic profile of a community group is an important factor when identifying
volunteer commitment time for participation and sustainability of monitoring. For sustainable
monitoring of a Victorian MNP or MS, community groups need to be associated with an MPA
which is in close proximity to their residence so that members are willing to commit time to
undertake surveys at least annually. There is a correlation between the distance a volunteer
lives from a monitoring site and volunteer monitoring time commitment. Community group
volunteers living in close proximity to the monitoring site are willing to spend more time
participating in a monitoring program. In the present study, all volunteer monitoring
participants who responded to the survey, stated that they would be involved in monitoring
again. A large proportion of non-participants (>70%) responded that they would participate in
the future, though the majority of these responses were conditional to factors such as
suitable monitoring dates and more information on the monitoring requirements. The actual
number likely to become involved could be a lot less than this. The amount of time
community-group members proposed they would commit to monitoring would also be subject
to these conditions. University students in the Deakin University Underwater Club were
enthusiastic to participate in the monitoring. However, much of their free time was limited by
the need to study, as was also found by Barrett et al. (2002).

Parks Victoria Technical Series No. 19 Community – Based Marine Monitoring
53
The proposed involvement of non-participants is notably lower for the FOP community group
than for MCRP or Deakin University Underwater Club. The lower non-participant involvement
for FOP members can be attributed to:
The majority of group members live >150km from the MPA.
There are a high proportion of members over the age of 60, and while this is similar to the
ratio RPMC, many respondents envisaged their physical mobility and fitness to be too
low.
The group is primarily associated with the terrestrial Wilsons Promontory National Park,
monitoring of Corner Inlet MNP was often beyond members’ fields of interest.
This highlights some important demographic features of a rural community group, as
opposed to a regional or urban community group, that may affect the long-term success of a
monitoring program.
4.3.3 Community Group Stewardship
The collection of scientific data is not the sole outcome of engaging community members in
research (Foster-Smith & Evans 2003). A range of secondary benefits flow on from the
experience and knowledge gained by volunteers:
A filtering effect of knowledge into the greater volunteer group, and then the wider
community.
Raising public awareness through media interest of volunteer surveys not normally given
to scientific studies.
Increasing the sense of personal/group custodianship of an area, leading not only to
continued monitoring, but also promoting responsible use of the local resource.
Monitoring methods should not be seen as constricting enjoyment, but rather encouraging
discovery of marine flora, fauna and at a larger scale, habitats. This assists in promoting
marine habitat education, awareness, conservation and stewardship. The knowledge of a
volunteer can be communicated to other members in the group and at a greater scale to the
local community. Volunteer enjoyment in monitoring a MPA leads to a sense of
custodianship for that marine habitat, and therefore the volunteer is willing to continue the
monitoring for the long term. Foster-Smith and Evans (2003) found major educational and
social benefits involving volunteers in scientific projects. Some of these benefits included
raising volunteer’s feelings of responsibility to the environment, increasing their knowledge of
environmental issues, to broadening their horizons through meeting different people and
experiencing different ecosystems, and providing oppurtunites for volunteers to solve

Parks Victoria Technical Series No. 19 Community – Based Marine Monitoring
54
environmental problems (Foster-Smith & Evans 2003). In addition to this, the media are
keen to report the results of studies involving volunteers, and therefore the results of
volunteer surveys may have wider impacts than scientific studies undertaken by research
institutions (Foster–Smith & Evans 2003).
Management authorities need to recognise the importance of developing strong partnerships
with community groups for long term sustainability of CBM programs. Collaborative
management through partnerships allows community groups to be involved in coastal
management and care (Wescott 1998). Co-ordination of community groups and reporting
findings back to the groups are important components to a program’s success. Feedback
from community groups can be incorporated into management policies and community
programs to be evaluated accordingly. Programs such as Reef Check (Hodgson et al. 2003)
and Seagrass-Watch in Queensland (McKenzie & Campbell 2002) are examples of
partnership programs between government, research centres and community groups.
Campbell and McKenzie (2001) found that community volunteers believed that ongoing
commitment of government co-ordination, support, reporting and feedback at state and
national levels is not only a key element to the programs success, but also for the ongoing
success of the Seagrass–Watch program.
Management authorities should sponsor projects which truly empower the community group
(Wescott 1998). This will encourage community group participation and long term
sustainability of the monitoring. Awarding of certificates to individual volunteers within the
group or to the community group as a whole, acknowledges and recognises their contribution
towards MPA baseline data collection and at a higher level, coastal zone management. It
may be an excellent way to formally acknowledge the help of volunteers, whilst building a
sense of custodianship and responsibility for an area. Regular presentations of how
volunteer collected data are used can be undertaken to demonstrate the importance of
continuing monitoring over the long term.
4.4 Parks Victoria Rangers’ Perceptions of Community - Based Monitoring
Parks Victoria Rangers’ responses indicate that community - based monitoring in Victoria’s
MPAs can be successful and lead to positive benefits such as community ownership of an
MPA. Many responsees did highlight the importance for community - based monitoring to be
successful in the long term, the community groups must be well trained and supervised with
ongoing support and funding from the management authority. To maintain community group
enthusiasm and energy, many Rangers indicated that the data collected by the community
group must be seen as of value to the management authority. Some problems which may

Parks Victoria Technical Series No. 19 Community – Based Marine Monitoring
55
arise with long term monitoring include the community groups being dynamic and
changeable not only in member numbers, but areas of environmental interest, and an aging
population involved with voluntary groups. Some suggestions to ensure success of
community - based monitoring included: weekend workshops to train and supervise
community groups, involvement of school groups and a “marine volunteer club” with an
annual newsletter.

Parks Victoria Technical Series No. 19 Community – Based Marine Monitoring
56
5 CONCLUSION Local community groups are often the first to notice changes in their local coastal marine
environment (Campbell & McKenzie 2001). Community – based monitoring of Victoria’s
MNPs and MSs has the potential to provide useful, reliable information to management
authorities. With correct implementation and adequate support, the long-term sustainability of
a monitoring program is possible. Results from this study do show however that there will be
varying levels of success across different habitat types.
The rocky intertidal habitat at Ricketts Point MS proved to be effectively surveyed by MCRP
volunteers. Although the volunteers were not as accurate as scientists, they were suitably
able to detect shifts in the abundance and size distribution of common organisms. The
majority of members lived in close proximity to the sanctuary and were very keen to
contribute time and energy to long-term, repeated monitoring.
The subtidal habitat at the Merri MS was not accurately assessed by volunteer Deakin
University Underwater Club divers, and only a small amount of information and replication
was gathered relative to the investment of resources. Enthusiasm levels were high in
volunteers, especially taking into account the additional physical and mental demands
associated with underwater monitoring. However, study pressures on students (Barrett et al
2002), and the transitory nature of club members may make this a less than ideal example of
a sustainable community group monitoring. Further investigation of the potential of
community groups to monitor subtidal habitats is required.
While the seagrass habitat at Corner Inlet MNP had a higher degree of monitoring accuracy
than the Merri MS, the quantity of data collected was similarly low. Further research over the
summer months, when favourable weather patterns are more frequent, may improve the rate
of data collection in these habitats. Most Friends of the Prom members generally live a long
distance from the monitoring site and commitment levels were consequently lower. The
S.E.A.L. Diving Services group is based closer to the MNP and has a demonstrated interest
in the local marine environment.
This study has highlighted several important factors for development of a successful
sustainable community – based monitoring program:
Community group should be in close proximity to and involved directly with the MPA.
Monitoring of rocky reef intertidal habitats, where possible, will provide the greatest return
of investment.
Parks Victoria Technical Series No. 19 Community – Based Marine Monitoring
57
Provision of a professional facilitator to train, guide and act as a liaison between the
community group and the management authority.
Provision of numerous, detailed photographic reference aids and monitoring equipment.
Use of quantitative data and multiple volunteers to reduce overall variation and improve
reliability of results.
The motivation and involvement of the management authority in community based
monitoring of Victoria’s MPAs must be clearly defined before delivery of the monitoring
protocols to community groups.
This monitoring program will not substitute professional, experienced evaluation of habitats
although it will aid management strategies over time and can be effective in detecting large
shifts in communities (such as caused by introduced pests) that would not be detected
sooner than if monitored on a less frequent basis. Additionally the flow on effect of increased
community knowledge, awareness and sense of custodianship fits into the management
strategies of Victoria’s MPA (Parks Victoria, 2003).

Parks Victoria Technical Series No. 19 Community – Based Marine Monitoring
58
6 SUGGESTED APPROACHES TO COMMUNITY - BASED MONITORING FOR MANAGEMENT AGENCIES
Suggestion 1: Initial training of community group volunteers should be delivered by a
professional facilitator who is familiar with the standard operating methodologies, the flora
and fauna of that habitat and is known to be a good communicator.
Suggestion 2: Management authorities should provide on-going support and equipment for
CBM through partnership programs.
Suggestion 3: A web based data system should be established for ease of data entry. This
information can then be accessed by all community groups as well as mangers for the MPAs.
Suggesttion 4: Certificates of participation for community groups to recognise and
acknowledge their contribution to the understanding and management of Victorian MPAs and
regular presentations of how the data is used by the management authority.
Suggestion 5: Park Victoria Rangers should continue to assist and support community-
based monitoring in Victoria’s MPAs.
Suggestion 6: Newspaper and radio advertising for initial training will increase public
awareness and participation in the monitoring.
Suggestion 7: Community groups involved in monitoring of Victoria’s MPAs should be
informed that they can contact one another on the Parks Victoria website.
Suggestion 8: Annual reports or newsletters produced to inform involved community groups
how community data collection is assisting management.
Parks Victoria Technical Series No. 19 Community – Based Marine Monitoring
59
ACKNOWLEDGMENTS This study was approved by the Deakin University Human Research Ethics Committee,
project number EC 296-2003.
The project team would like to thank and acknowledge all community groups involved with
community - based monitoring of Victoria’s MPAs. These groups include: Friends of the
Prom, S.E.A.L. Diving Services, Marine Care – Ricketts Point Friends Group and the Deakin
University Underwater Club. Without their enthusiastic involvement and feedback this project
would not be possible.
A large thank you to Dr. Anthony Boxshall from Parks Victoria for his overall input to the
commuity – based monitoring project. The project team would also like to thank Wendy
Roberts from ‘Reef Watch’ for providing the Deakin University Underwater Club with
underwater ‘Reef Watch’ kits and an informative and colourful presentation to the Deakin
University Underwater Club. We would also like to thank Chelsea Ingwersen from Australian
Marine Ecology for her fascinating presentation on scientific monitoring of Victoria’s MPAs to
the Deakin University Underwater Club. Without the assistance of the following Parks
Victoria Rangers, much of this monitoring would not have been conducted: Jonothan
Stevenson and Peter Johnston. The project team would like to thank Phillip Kerr from Aqua
Agri Enterprises for teaching the PADI scientific dive course to the Deakin University
Underwater Club volunteers, and Daniel Ierodiaconou for his hard work in producing the
Deakin SCUBA Diving Safety Operations Manual and getting volunteers into the water during
favourable conditions.

Parks Victoria Technical Series No. 19 Community – Based Marine Monitoring
60
REFERENCES Arundel, H. & Fairweather, P. (2003) South-west intertidal habitat assessment and education
project. Prepared for Parks Victoria, Melbourne, Australia.
Barrett, N., Edgar, G. & Morton, A. (2002) Monitoring of Tasmanian Inshore Reef
Ecosystems: An assessment of the potential for volunteer monitoring programs and
summary of changes within Maria Island Marine Reserve from 1992-2001. Tasmanian
Aquaculture and Fisheries Institute and University of Tasmania, Australia.
Campbell, S.J. & McKenzie, L.J. (2001) Seagrass-Watch: Community-based monitoring of
seagrass meadows in Hervey Bay and Whitsunday Regions: 1998-2001. DPI Information
Series QI000, DPI Cairns, Australia.
Clark, K. R. & Warwick, R. M. (1994) Changes in marine communities: an approach to
statistical analysis and interpretation. Plymouth Marine Laboratory, Plymouth, United
Kingdom.
Darwall, W.R.T. & Dulvy, N.K. (1996) An evaluation of the suitability of non-specialist
volunteer researchers for coral reef fish surveys. Mafia Island, Tanzania – A case study.
Biological Conservation, 78, 223-31.
Edgar, G.J. (1997) Australian marine life: the plants and animals of temperate waters. Reed
Books, Melbourne, Australia.
Edmunds, M. & Hart, S. (2003) Parks Victoria Standard Operating Procedure: Biological
Monitoring of Subtidal Reefs. Parks Victoria Technical Series No. 9 Parks Victoria,
Melbourne, Australia.
Hart, S.P. and Edmunds, M. (2005) Parks Victoria Standard Operating Procedure: Biological
Monitoring of Intertidal Reefs. Parks Victoria Technical Series No. 21. Parks Victoria,
Melbourne.
Foster-Smith, J. & Evans, S.M. (2003) The value of marine ecological data collected by
volunteers. Biological Conservation. 113, 199-213.
Hodgson, G., Maun, L. & Shuman, C. (2003) Reef Check Survey Manual for Coral Reefs of
the Indo Pacific, Hawaii, Atlantic/Caribbean, Red Sea and Arabian Gulf. Reef Check, Institute
of the Environment, University of California, Los Angeles, CA, USA.

Parks Victoria Technical Series No. 19 Community – Based Marine Monitoring
61
Keough, M.J. & Quinn G.P. (1998) Effects of periodic disturbances from trampling on rocky
intertidal algal beds. Ecological Applications, 8, 141-161.
Koss, R. Bunce, A., Gilmour, P. and McBurnie, J. (2005) Sea Search: Community–Based
Monitoring of Victoria’s Marine National Parks and Marine Sanctuaries - Seagrass
Monitoring. Parks Victoria Technical Series No. 16. Parks Victoria, Melbourne.
Koss, R. Gilmour, P., Wescott, G., Bunce, A., and Miller, K. (2005) Sea Search: Community -
Based Monitoring of Victoria’s Marine National Parks and Marine Sanctuaries: Intertidal
Monitoring. Parks Victoria Technical Series No. 17. Parks Victoria, Melbourne.
Koss, R. Bellgrove, A., Ierodiaconou, D., Gilmour, P. and Bunce, A. (2005) Sea Search:
Community-Based Monitoring of Victoria’s Marine National Parks and Marine Sanctuaries:
Subtidal Monitoring. Parks Victoria Technical Series No.18. Parks Victoria, Melbourne.
McKenzie, L.J. & Campbell, S.J. (2002) Seagrass – Watch: Manual for Community (citizen)
Monitoring of Seagrass Habitat. Western Pacific Edition, QFS, NFC, Cairns, Australia.
O’Hara, T.D., Norman, M.D. & Staples, D.A. (2002) Baseline monitoring of Posidonia
australis seagrass beds in Corner Inlet, Victoria. Museum of Victoria, Melbourne, Australia.
Oliver, I. & Beattie A.J. (1996) Invertebrate morphospecies as surrogates for species: a case
study. Conservation Biology, 10, 99-109.
Parks Victoria (2003) Victoria’s System of Marine National Parks and Marine Sanctuaries:
Management Strategy 2003 – 2010. Parks Victoria, Melbourne, Australia.
Quinn, G. P. & Keough, M. J. (2002) Experimental design and data analysis for biologists.
Cambridge University Press, Cambridge, United Kingdom.
Quinn, G. P., Wescott, G. C. & Synnot, R. N. (1992) Life on the rocky shores of south-
eastern Australia. Victorian National Parks Association, Melbourne, Australia.
Wescott, G. (1998) Reforming Coastal Management to improve community participation and
integration in Victoria, Australia. Coastal Management, 26, 3-15.
Wescott, G. (2002) Partnerships for capacity building: community, governments and
universities working together. Ocean and Coastal Management, 45, 549-571.

Parks Victoria Technical Series No. 19 Community – Based Marine Monitoring
62
APPENDIX 1 Community- Based Monitoring of Victorian Marine National Parks and Sanctuaries
Survey of Parks Victoria Rangers This is an anonymous survey. Please do not write your name, or any other comments that
will make you identifiable on the following pages. These details are only required on the
separate Consent Form which will not be linked with this survey at any time. Please read the
covering letter and fill in the enclosed Consent Form before you complete the following
questions. Please answer the questions in this survey on behalf of yourself only (i.e. do not include answers for other family members or other members of your household).
Section A. 1. Is it important to engage community groups in scientific monitoring of Victoria’s Marine
National Parks and Sanctuaries? (Please circle)
Yes No
If No, why not?
_____________________________________________________________
2. Are community groups capable of collecting scientifically sound data? (Please circle)
Yes No
If No, why not?
______________________________________________________________
3. Are data collected by community groups valid for scientific analysis? (Please circle)
Yes No
If No, why not?
_______________________________________________________________
4. Are you willing to train community groups the scientific methodologies to undertake data
collection? (Please circle)
Yes No
If No, why not?
__________________________________________________________________

Parks Victoria Technical Series No. 19 Community – Based Marine Monitoring
63
5. Do you feel confident using and demonstrating the use of basic scientific equipment?
(Please circle)
Yes No
6. Is liaising and organising days for community groups to undertake data collection part of
your Parks Victoria Ranger role? (Please circle)
Yes No
If No, why not?
__________________________________________________________________
7. Is data collection by community groups feasible in the long term? (Please circle)
Yes No
If No, why not?
__________________________________________________________________
8. Do you feel that community groups will be interested in maintaining annual monitoring of
the marine national parks and sanctuaries? (Please circle)
Yes No
If No, why not?
__________________________________________________________________
9. Is acting upon feedback from community groups an important part of your role as a Parks
Victoria Ranger? (Please circle)
Yes No
If No, why not?
_______________________________________________________________
10. What are the limitations for using community groups to undertake scientific monitoring in
marine national parks and sanctuaries? (Please state below)
__________________________________________________________________
11. What are the positive aspects of including community groups in scientific monitoring in
marine national parks and sanctuaries? (Please state below)
__________________________________________________________________

Parks Victoria Technical Series No. 19 Community – Based Marine Monitoring
64
12. Are community groups involved with scientific monitoring in the long term, a positive
investment for Parks Victoria and why? (Please state below)
__________________________________________________________________

Parks Victoria is responsible for managing the Victorian protected
area network, which ranges from wilderness areas to metropolitan
parks and includes both marine and terrestrial components.
Our role is to protect the natural and cultural values of the parks
and other assets we manage, while providing a great range of
outdoor opportunities for all Victorians and visitors.
A broad range of environmental research and monitoring activities
supported by Parks Victoria provides information to enhance park
management decisions. This Technical Series highlights some of
the environmental research and monitoring activities done within
Victoria’s protected area network.
Healthy Parks Healthy People
For more information contact the Parks Victoria Information Centre
on 13 1963, or visit www.parkweb.vic.gov.au