Rural Complexity, Regional Diversity. Some observations from Victoria's Regional Matters Atlas 2005
22
Australasian Journal of Regional Studies, Vol. 12, No. 3, 2006 343 RURAL COMPLEXITY, REGIONAL DIVERSITY. SOME OBSERVATIONS FROM VICTORIA’S REGIONAL MATTERS ATLAS 2005 Fiona McKenzie 1 Team Leader, Regional Atlas Project, Department of Sustainability and Environment, 8 Nicholson Street, East Melbourne, Victoria 3002. ABSTRACT: In April 2006 the Victorian Government released Regional Matters. An Atlas of Regional Victoria 2005. This publication is the outcome of a whole of government approach to regional information collation and is being used by a range of policy makers and practitioners at all levels of government. The Atlas is an example of ways in which integrated understandings of regional issues can be developed through spatial analysis and visual representation. One theme which emerged from the Atlas is the way in which rural areas are undergoing significant social and economic change. Such change is not always visible in aggregate data or in traditional information sources. By examining issues such as peri-urban development and community characteristics with a wider set of inter-disciplinary information we can explore emerging issues in innovative ways. 1. INTRODUCTION Regional Matters – An Atlas of Regional Victoria 2005 (‘The Atlas’) builds upon a previous edition released in 2002. Like its predecessor, the 2005 Atlas represents some of the key issues associated with the impact of regional change 2 . The Atlas is primarily aimed at decision-makers at 1 The views expressed in this paper are those of the author and should not be regarded as representing the views of the Victorian Government nor the Department of Sustainability and Environment. 2 Regional Victoria is defined in the Atlas as those parts of Victoria outside the Melbourne metropolitan area.
-
Upload
independent -
Category
Documents
-
view
1 -
download
0
Transcript of Rural Complexity, Regional Diversity. Some observations from Victoria's Regional Matters Atlas 2005
Australasian Journal of Regional Studies, Vol. 12, No. 3, 2006 343
RURAL COMPLEXITY, REGIONAL DIVERSITY.SOME OBSERVATIONS FROM VICTORIA’SREGIONAL MATTERS ATLAS 2005
Fiona McKenzie1
Team Leader, Regional Atlas Project, Department ofSustainability and Environment, 8 Nicholson Street, EastMelbourne, Victoria 3002.
ABSTRACT: In April 2006 the Victorian Government releasedRegional Matters. An Atlas of Regional Victoria 2005. This publication isthe outcome of a whole of government approach to regionalinformation collation and is being used by a range of policymakers and practitioners at all levels of government. TheAtlas is an example of ways in which integratedunderstandings of regional issues can be developed throughspatial analysis and visual representation. One theme whichemerged from the Atlas is the way in which rural areas areundergoing significant social and economic change. Suchchange is not always visible in aggregate data or intraditional information sources. By examining issues suchas peri-urban development and community characteristics witha wider set of inter-disciplinary information we can exploreemerging issues in innovative ways.
1. INTRODUCTION
Regional Matters – An Atlas of Regional Victoria 2005 (‘TheAtlas’) builds upon a previous edition released in2002. Like its predecessor, the 2005 Atlas representssome of the key issues associated with the impact ofregional change2.
The Atlas is primarily aimed at decision-makers at
1 The views expressed in this paper are those of the authorand should not be regarded as representing the views of theVictorian Government nor the Department of Sustainabilityand Environment.2 Regional Victoria is defined in the Atlas as those partsof Victoria outside the Melbourne metropolitan area.
344 Fiona McKenzie
all levels of government. However, the Atlas has alsoproven popular with a wider audience of communitygroups, teachers, peak bodies and private businesses.It has proven particularly useful for those dealingwith cross-agency projects where a variety ofdisciplines and perspectives are represented.
The publication contains information based aroundeight themes: changing populations; communitywellbeing; servicing communities; industry and skills;water in a dry land; land and people; coastaldevelopment, and energy choices. Each theme containsinformation of relevance to social, environmental andeconomic issues, so a triple-bottom line approach isdiscernable in the document’s design.
The Regional Atlas was developed with theassistance of an inter-agency group, comprisingrepresentatives from each Victorian Governmentdepartment. It therefore takes a whole-of-governmentapproach and highlights the linkages between regionaltrends such as population change, economic activityand service provision. It offers a good example ofhow inter-departmental co-operation can lead to abroader understanding of issues. For instance,agriculture is as much about economic restructuring,community cohesion and environmental sustainability asit is about crops and animal husbandry. Regionaleconomic development is not just about industries andemployment – it is also about communities, lifestylesand the services needed to attract skilled workers.
The Atlas does not categorise information undertraditional government policy portfolio headings suchas health, education, transport or environment. Thisis a deliberate approach, aiming to break downdisciplinary and departmental ‘silos’ in order tocreatively explore some of the challenges facing ourcommunity, environment and economy. A theme whichemerged from the Atlas is the way in which rural areasare undergoing significant social and economic change.This paper highlights various aspects of this rural
Rural Complexity, Regional Diversity 345
change including peri-urban development and thechanging socio-economic characteristics of ruralcommunities.
2. PERI-URBAN DEVELOPMENT
‘Peri-urban’ literally means the area around anurban settlement. It is distinctive in its diversity,having a mix of land uses and residents. It is ruralin appearance but many residents will have jobs in thenearby urban area to which they commute. Thesettlement pattern of Victoria has created a largearea of potential peri-urban development ringed by theregional centres of Geelong, Ballarat, Bendigo,Wodonga and Latrobe. Within this region are towns andrural areas that have become popular for thosecommuting to jobs in these regional centres orMelbourne.
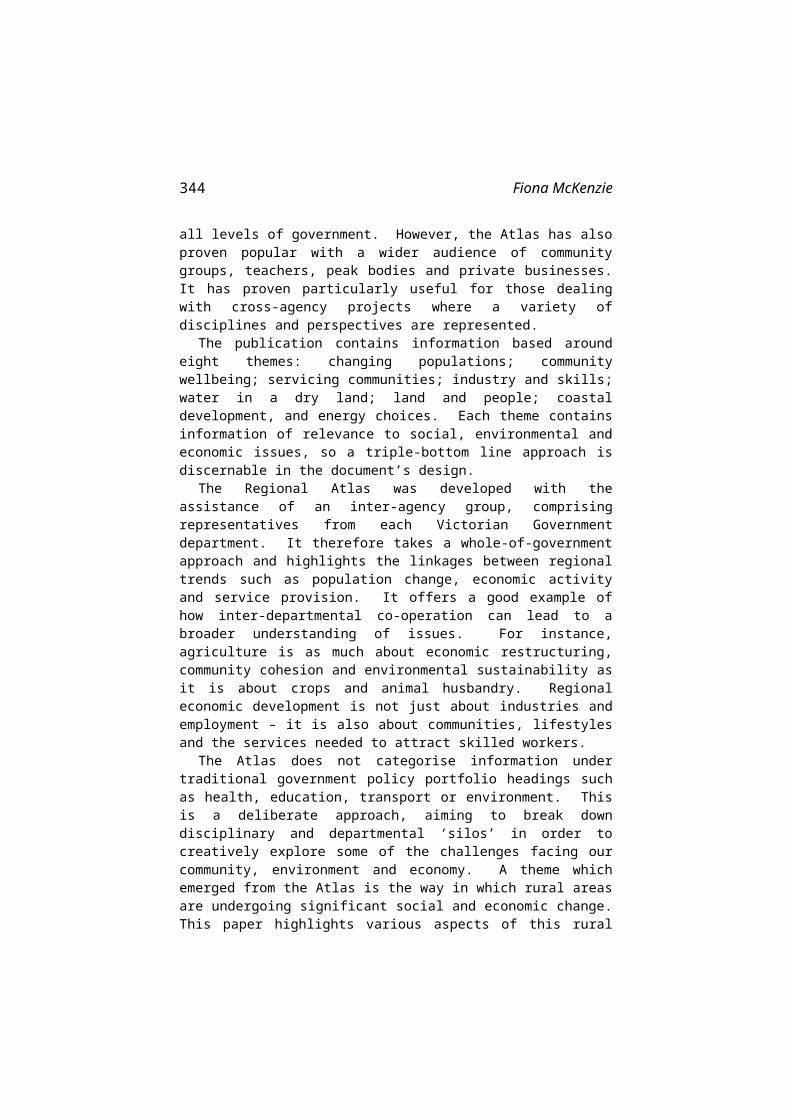
A feature of peri-urban areas over the past 40years has been strong population growth. Thestrongest period of growth for many of these regionswas in the 1980s when rural living became a popularoption. The 1990s saw greater growth rates inMelbourne and some of the high peri-urban growth ratesplateaued (Figure 1). Nevertheless, the popularity ofliving in rural landscapes within driving access of alarge urban centre has been maintained in the Geelong-Ballarat-Bendigo regions.
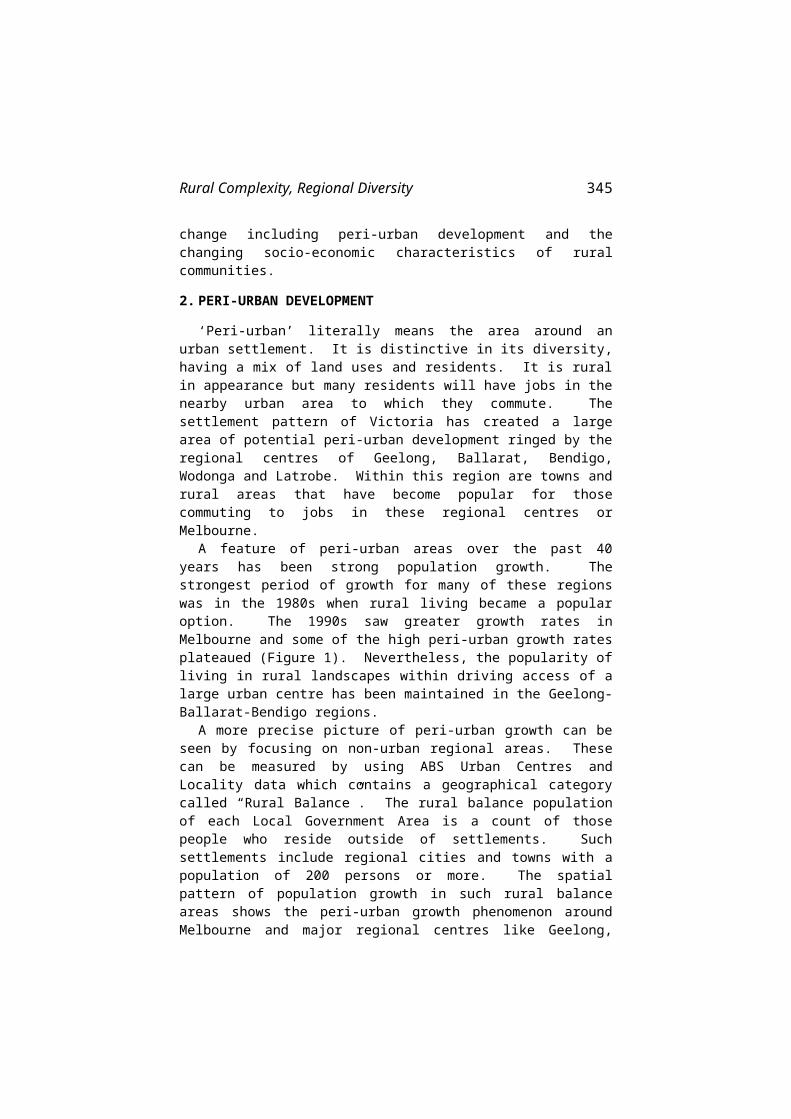
A more precise picture of peri-urban growth can beseen by focusing on non-urban regional areas. Thesecan be measured by using ABS Urban Centres andLocality data which contains a geographical categorycalled “Rural Balance”. The rural balance populationof each Local Government Area is a count of thosepeople who reside outside of settlements. Suchsettlements include regional cities and towns with apopulation of 200 persons or more. The spatialpattern of population growth in such rural balanceareas shows the peri-urban growth phenomenon aroundMelbourne and major regional centres like Geelong,
346 Fiona McKenzie
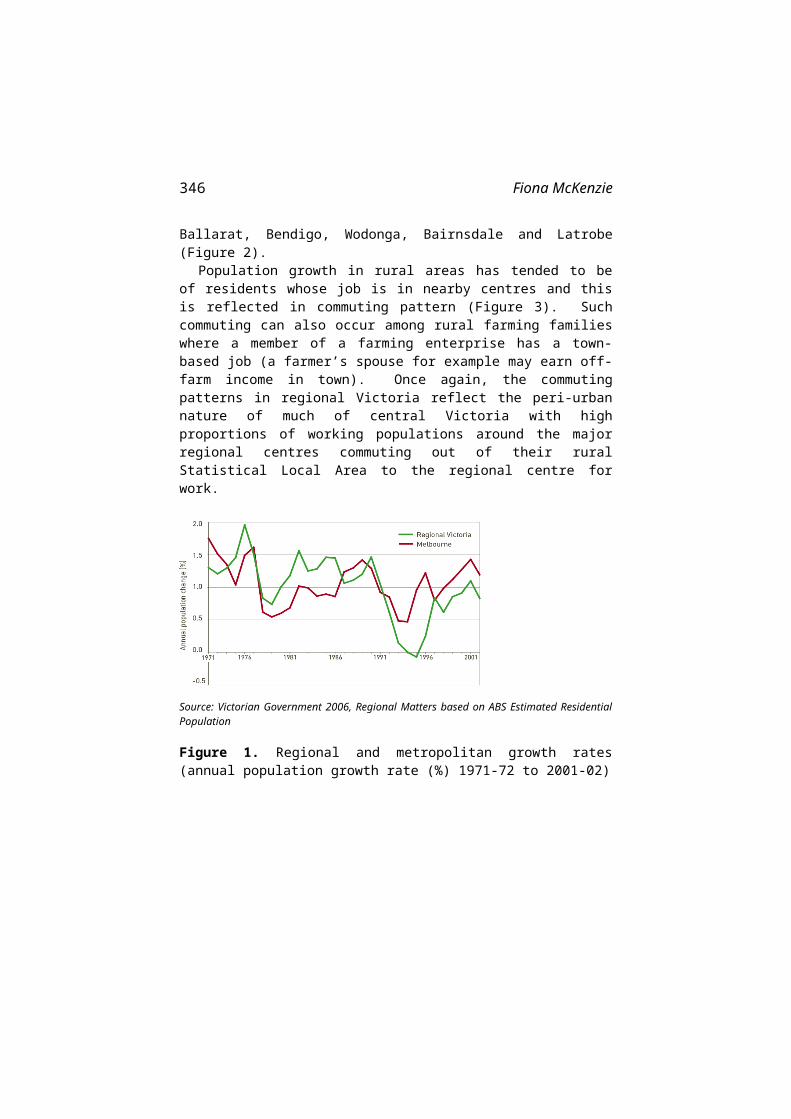
Ballarat, Bendigo, Wodonga, Bairnsdale and Latrobe(Figure 2).
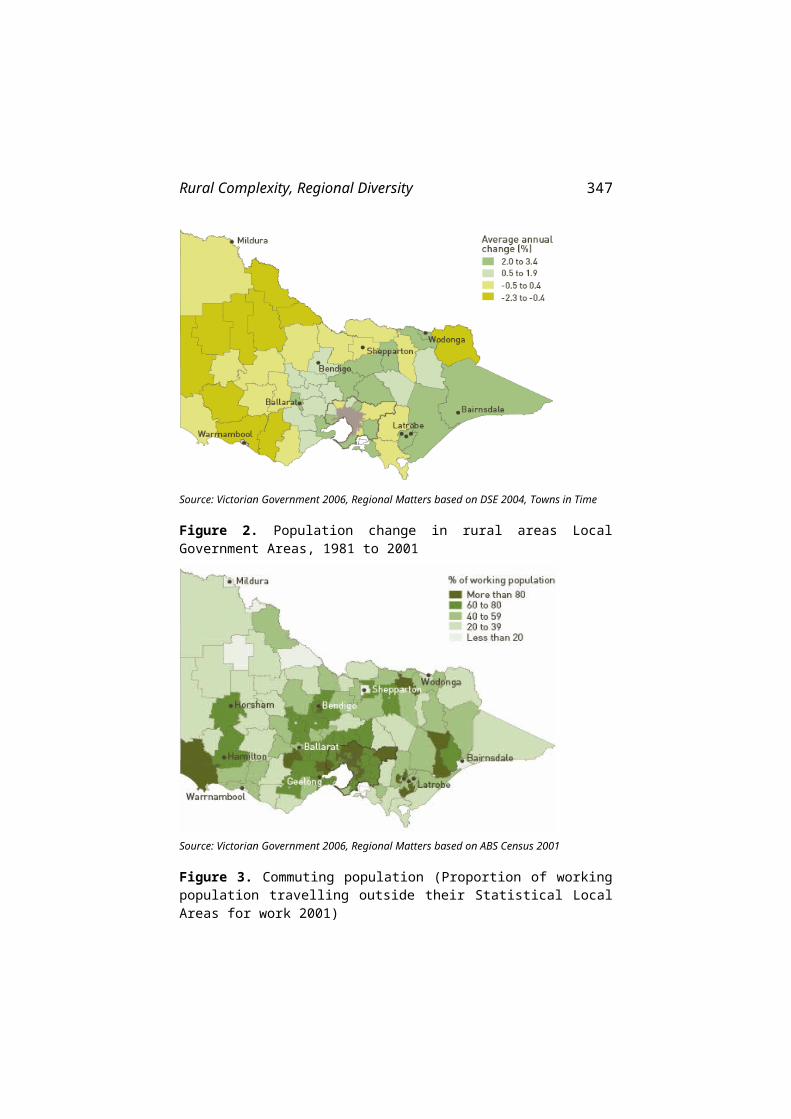
Population growth in rural areas has tended to beof residents whose job is in nearby centres and thisis reflected in commuting pattern (Figure 3). Suchcommuting can also occur among rural farming familieswhere a member of a farming enterprise has a town-based job (a farmer’s spouse for example may earn off-farm income in town). Once again, the commutingpatterns in regional Victoria reflect the peri-urbannature of much of central Victoria with highproportions of working populations around the majorregional centres commuting out of their ruralStatistical Local Area to the regional centre forwork.
Source: Victorian Government 2006, Regional Matters based on ABS Estimated ResidentialPopulation
Figure 1. Regional and metropolitan growth rates(annual population growth rate (%) 1971-72 to 2001-02)
Rural Complexity, Regional Diversity 347
Source: Victorian Government 2006, Regional Matters based on DSE 2004, Towns in Time
Figure 2. Population change in rural areas LocalGovernment Areas, 1981 to 2001
Source: Victorian Government 2006, Regional Matters based on ABS Census 2001
Figure 3. Commuting population (Proportion of workingpopulation travelling outside their Statistical LocalAreas for work 2001)
348 Fiona McKenzie
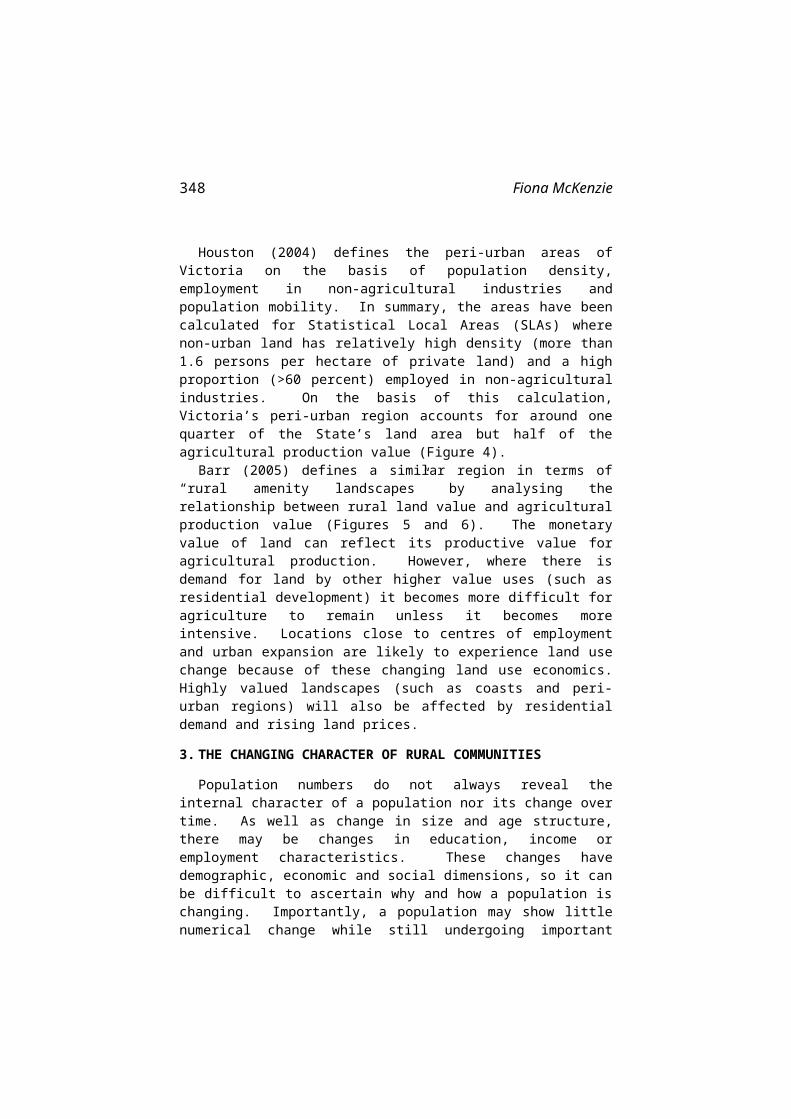
Houston (2004) defines the peri-urban areas ofVictoria on the basis of population density,employment in non-agricultural industries andpopulation mobility. In summary, the areas have beencalculated for Statistical Local Areas (SLAs) wherenon-urban land has relatively high density (more than1.6 persons per hectare of private land) and a highproportion (>60 percent) employed in non-agriculturalindustries. On the basis of this calculation,Victoria’s peri-urban region accounts for around onequarter of the State’s land area but half of theagricultural production value (Figure 4).
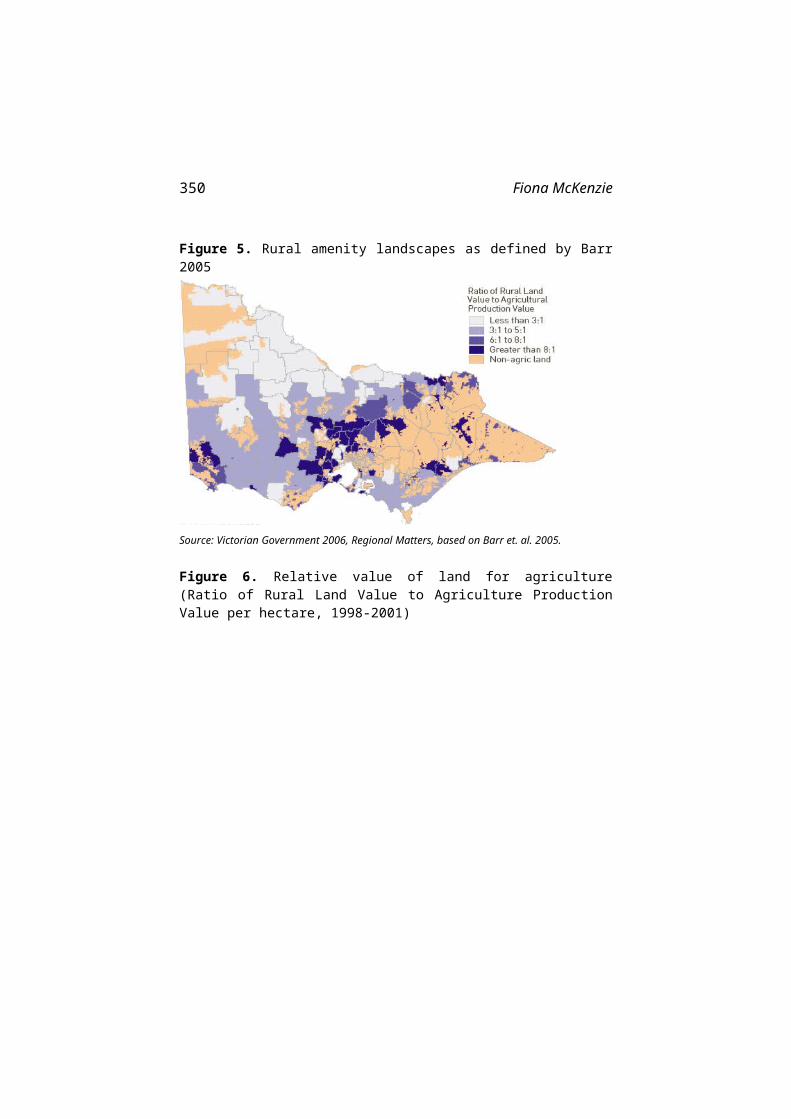
Barr (2005) defines a similar region in terms of“rural amenity landscapes” by analysing therelationship between rural land value and agriculturalproduction value (Figures 5 and 6). The monetaryvalue of land can reflect its productive value foragricultural production. However, where there isdemand for land by other higher value uses (such asresidential development) it becomes more difficult foragriculture to remain unless it becomes moreintensive. Locations close to centres of employmentand urban expansion are likely to experience land usechange because of these changing land use economics.Highly valued landscapes (such as coasts and peri-urban regions) will also be affected by residentialdemand and rising land prices.
3. THE CHANGING CHARACTER OF RURAL COMMUNITIES
Population numbers do not always reveal theinternal character of a population nor its change overtime. As well as change in size and age structure,there may be changes in education, income oremployment characteristics. These changes havedemographic, economic and social dimensions, so it canbe difficult to ascertain why and how a population ischanging. Importantly, a population may show littlenumerical change while still undergoing important

Rural Complexity, Regional Diversity 349
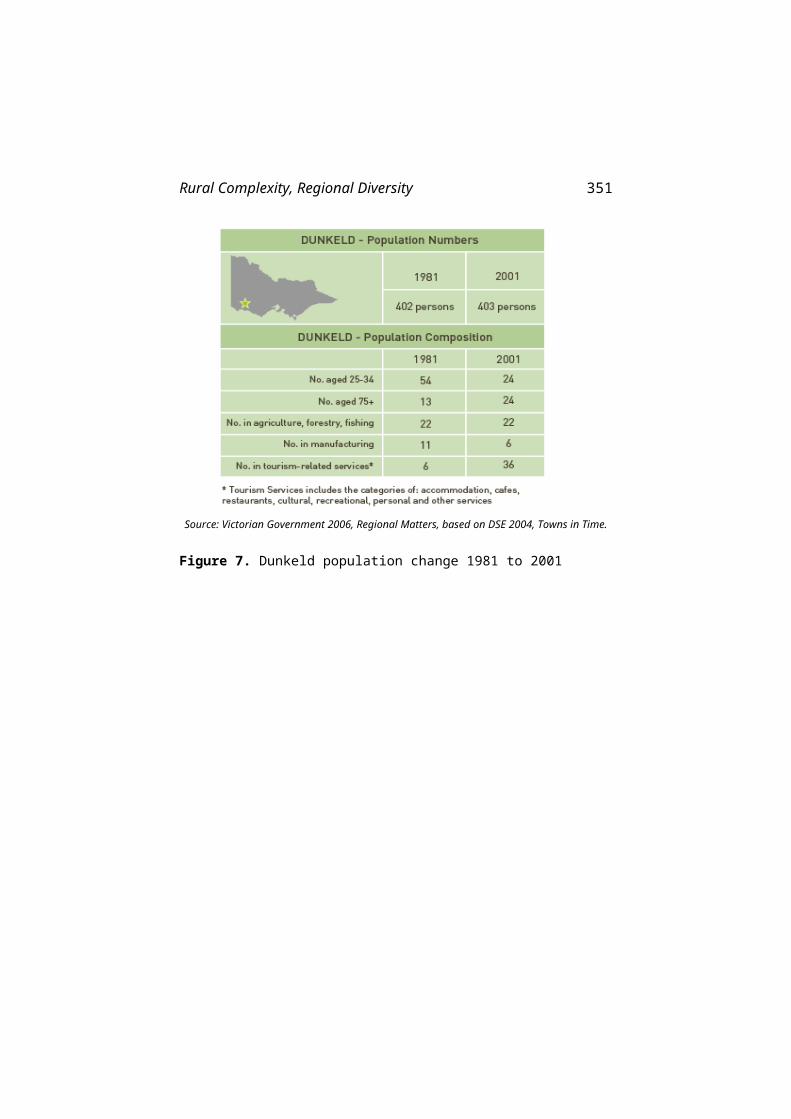
structural and compositional change. Dunkeld inwestern Victoria is a good example of this, havingexperienced almost no numerical change in the past 20years but undergoing substantial demographic andeconomic change (Figure 7).
Source: Victorian Government 2006, Regional Matters based on Houston 2004
Figure 4. Peri-urban regions as defined by Houston2004
Source: Victorian Government 2006, Regional Matters, based on Barr et. al. 2005.
350 Fiona McKenzie
Figure 5. Rural amenity landscapes as defined by Barr2005
Source: Victorian Government 2006, Regional Matters, based on Barr et. al. 2005.
Figure 6. Relative value of land for agriculture(Ratio of Rural Land Value to Agriculture ProductionValue per hectare, 1998-2001)
Rural Complexity, Regional Diversity 351
Source: Victorian Government 2006, Regional Matters, based on DSE 2004, Towns in Time.
Figure 7. Dunkeld population change 1981 to 2001
352 Fiona McKenzie
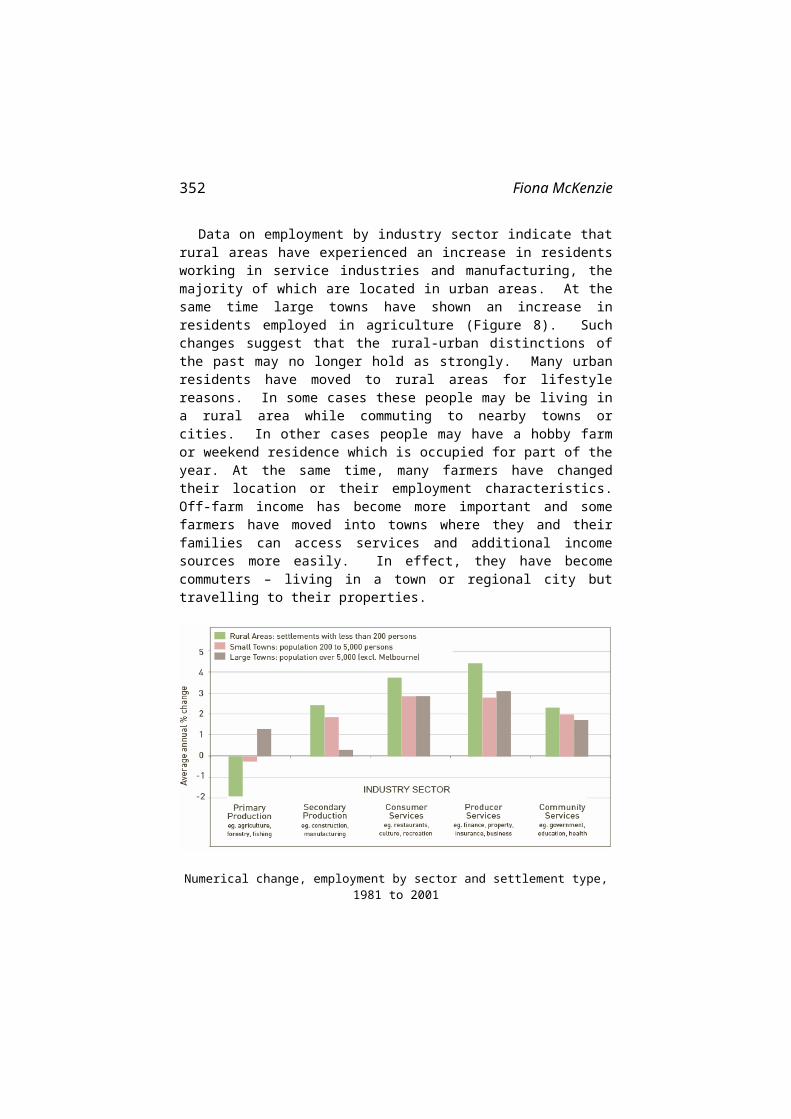
Data on employment by industry sector indicate thatrural areas have experienced an increase in residentsworking in service industries and manufacturing, themajority of which are located in urban areas. At thesame time large towns have shown an increase inresidents employed in agriculture (Figure 8). Suchchanges suggest that the rural-urban distinctions ofthe past may no longer hold as strongly. Many urbanresidents have moved to rural areas for lifestylereasons. In some cases these people may be living ina rural area while commuting to nearby towns orcities. In other cases people may have a hobby farmor weekend residence which is occupied for part of theyear. At the same time, many farmers have changedtheir location or their employment characteristics.Off-farm income has become more important and somefarmers have moved into towns where they and theirfamilies can access services and additional incomesources more easily. In effect, they have becomecommuters – living in a town or regional city buttravelling to their properties.
Numerical change, employment by sector and settlement type,1981 to 2001
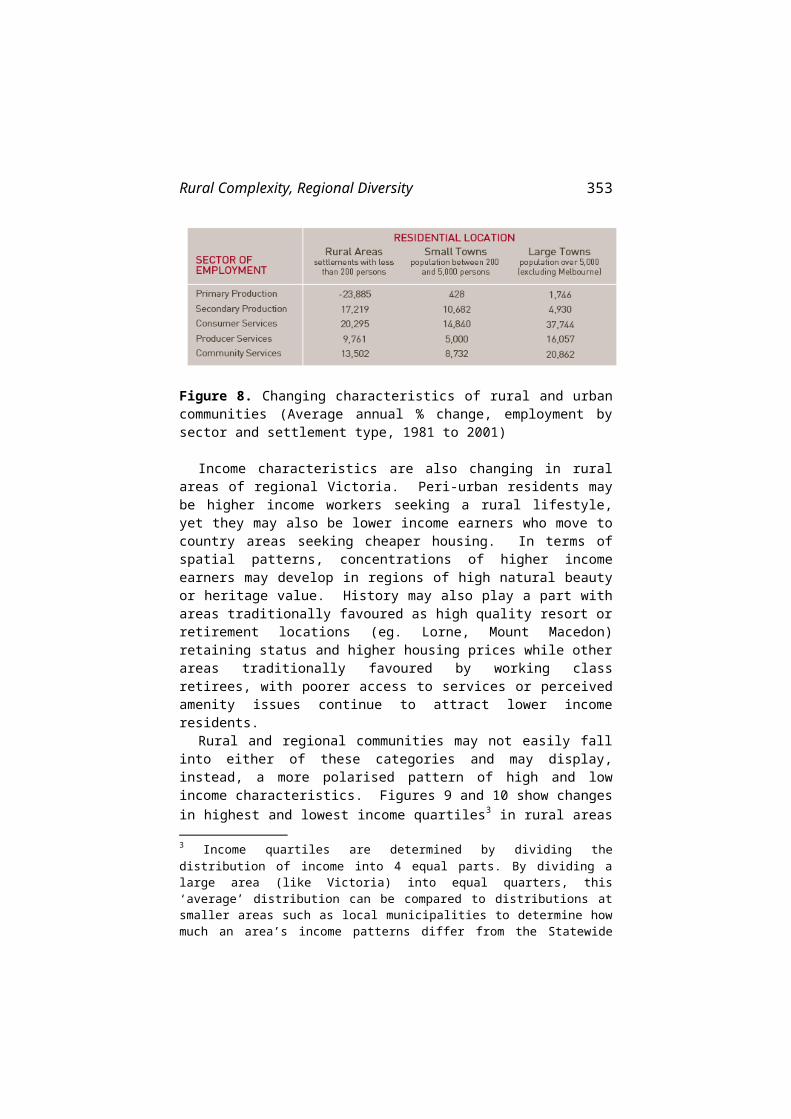
Rural Complexity, Regional Diversity 353
Figure 8. Changing characteristics of rural and urbancommunities (Average annual % change, employment bysector and settlement type, 1981 to 2001)
Income characteristics are also changing in ruralareas of regional Victoria. Peri-urban residents maybe higher income workers seeking a rural lifestyle,yet they may also be lower income earners who move tocountry areas seeking cheaper housing. In terms ofspatial patterns, concentrations of higher incomeearners may develop in regions of high natural beautyor heritage value. History may also play a part withareas traditionally favoured as high quality resort orretirement locations (eg. Lorne, Mount Macedon)retaining status and higher housing prices while otherareas traditionally favoured by working classretirees, with poorer access to services or perceivedamenity issues continue to attract lower incomeresidents.
Rural and regional communities may not easily fallinto either of these categories and may display,instead, a more polarised pattern of high and lowincome characteristics. Figures 9 and 10 show changesin highest and lowest income quartiles3 in rural areas
3 Income quartiles are determined by dividing thedistribution of income into 4 equal parts. By dividing alarge area (like Victoria) into equal quarters, this‘average’ distribution can be compared to distributions atsmaller areas such as local municipalities to determine howmuch an area’s income patterns differ from the Statewide
354 Fiona McKenzie
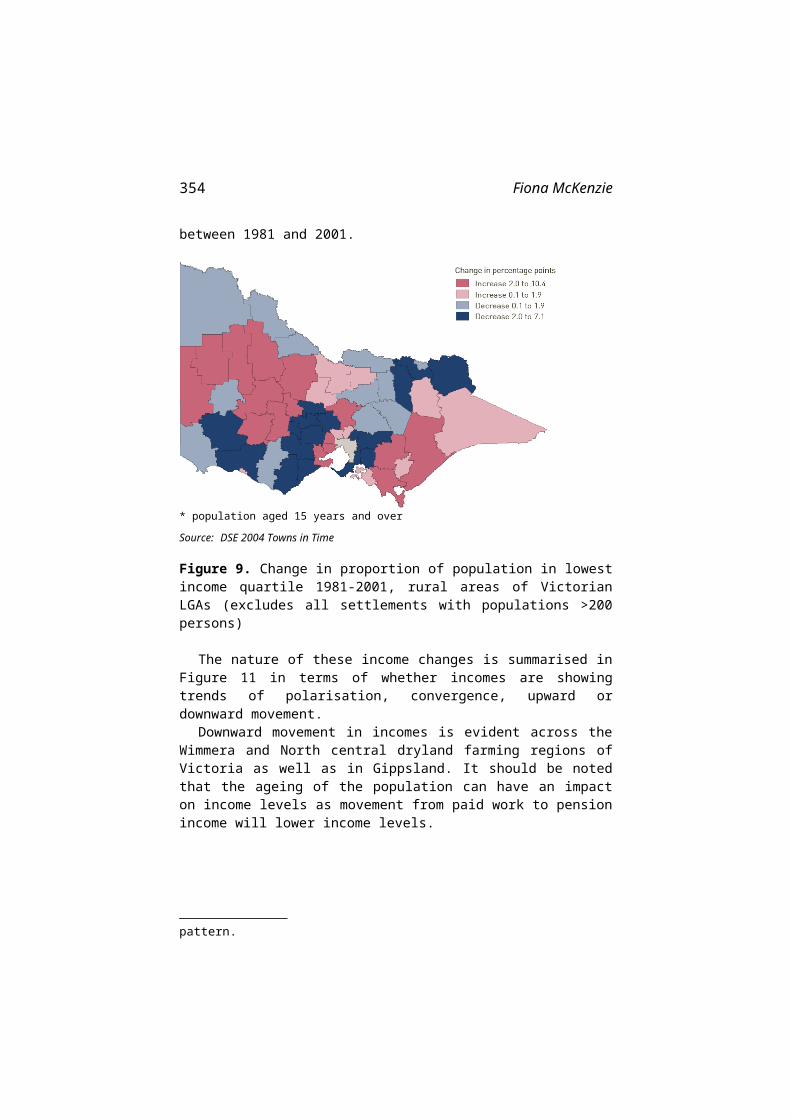
between 1981 and 2001.
* population aged 15 years and over
Source: DSE 2004 Towns in Time
Figure 9. Change in proportion of population in lowestincome quartile 1981-2001, rural areas of VictorianLGAs (excludes all settlements with populations >200persons)
The nature of these income changes is summarised inFigure 11 in terms of whether incomes are showingtrends of polarisation, convergence, upward ordownward movement.
Downward movement in incomes is evident across theWimmera and North central dryland farming regions ofVictoria as well as in Gippsland. It should be notedthat the ageing of the population can have an impacton income levels as movement from paid work to pensionincome will lower income levels.
pattern.
Rural Complexity, Regional Diversity 355
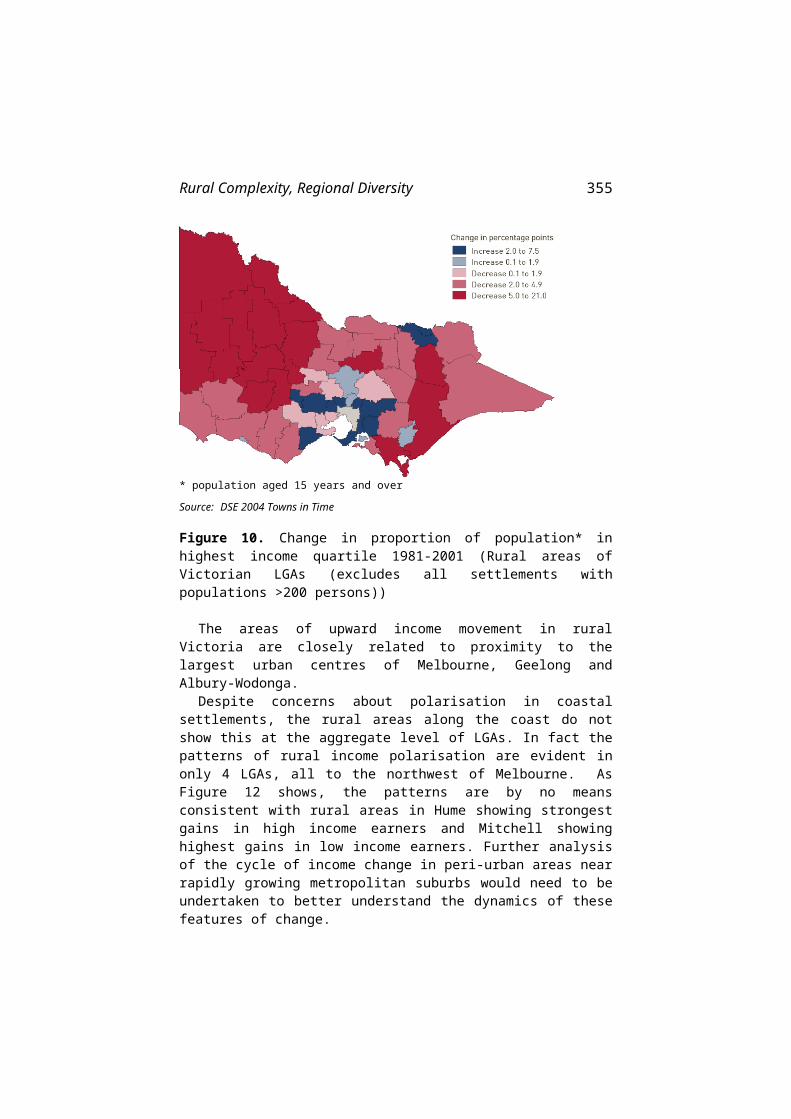
* population aged 15 years and over
Source: DSE 2004 Towns in Time
Figure 10. Change in proportion of population* inhighest income quartile 1981-2001 (Rural areas ofVictorian LGAs (excludes all settlements withpopulations >200 persons))
The areas of upward income movement in ruralVictoria are closely related to proximity to thelargest urban centres of Melbourne, Geelong andAlbury-Wodonga.
Despite concerns about polarisation in coastalsettlements, the rural areas along the coast do notshow this at the aggregate level of LGAs. In fact thepatterns of rural income polarisation are evident inonly 4 LGAs, all to the northwest of Melbourne. AsFigure 12 shows, the patterns are by no meansconsistent with rural areas in Hume showing strongestgains in high income earners and Mitchell showinghighest gains in low income earners. Further analysisof the cycle of income change in peri-urban areas nearrapidly growing metropolitan suburbs would need to beundertaken to better understand the dynamics of thesefeatures of change.
356 Fiona McKenzie
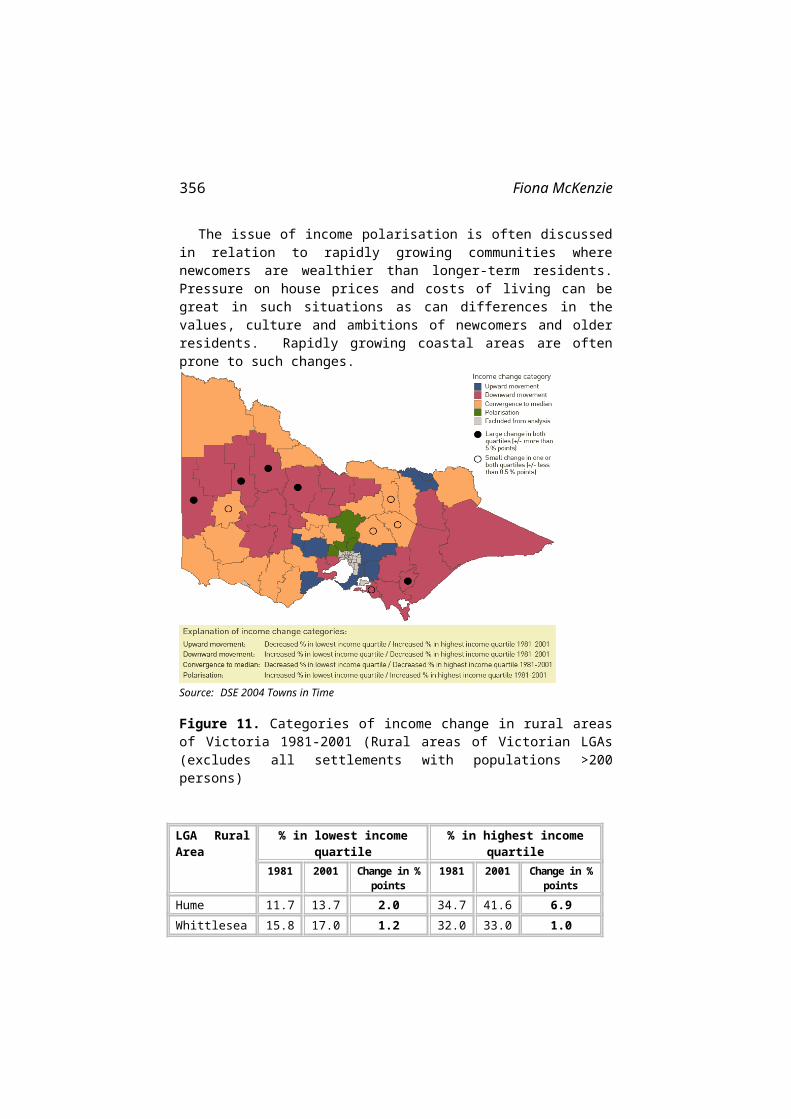
The issue of income polarisation is often discussedin relation to rapidly growing communities wherenewcomers are wealthier than longer-term residents.Pressure on house prices and costs of living can begreat in such situations as can differences in thevalues, culture and ambitions of newcomers and olderresidents. Rapidly growing coastal areas are oftenprone to such changes.
Source: DSE 2004 Towns in Time
Figure 11. Categories of income change in rural areasof Victoria 1981-2001 (Rural areas of Victorian LGAs(excludes all settlements with populations >200persons)
LGA RuralArea
% in lowest incomequartile
% in highest incomequartile
1981 2001 Change in %points
1981 2001 Change in %points
Hume 11.7 13.7 2.0 34.7 41.6 6.9Whittlesea 15.8 17.0 1.2 32.0 33.0 1.0
Rural Complexity, Regional Diversity 357
Melton 16.9 19.4 2.5 29.5 32.0 2.4Mitchell 14.4 18.7 4.3 25.5 26.9 1.4
Source: DSE 2004 Towns in Time
Figure 12. Rural areas categorised as having incomepolarisation between 1981 and 2001
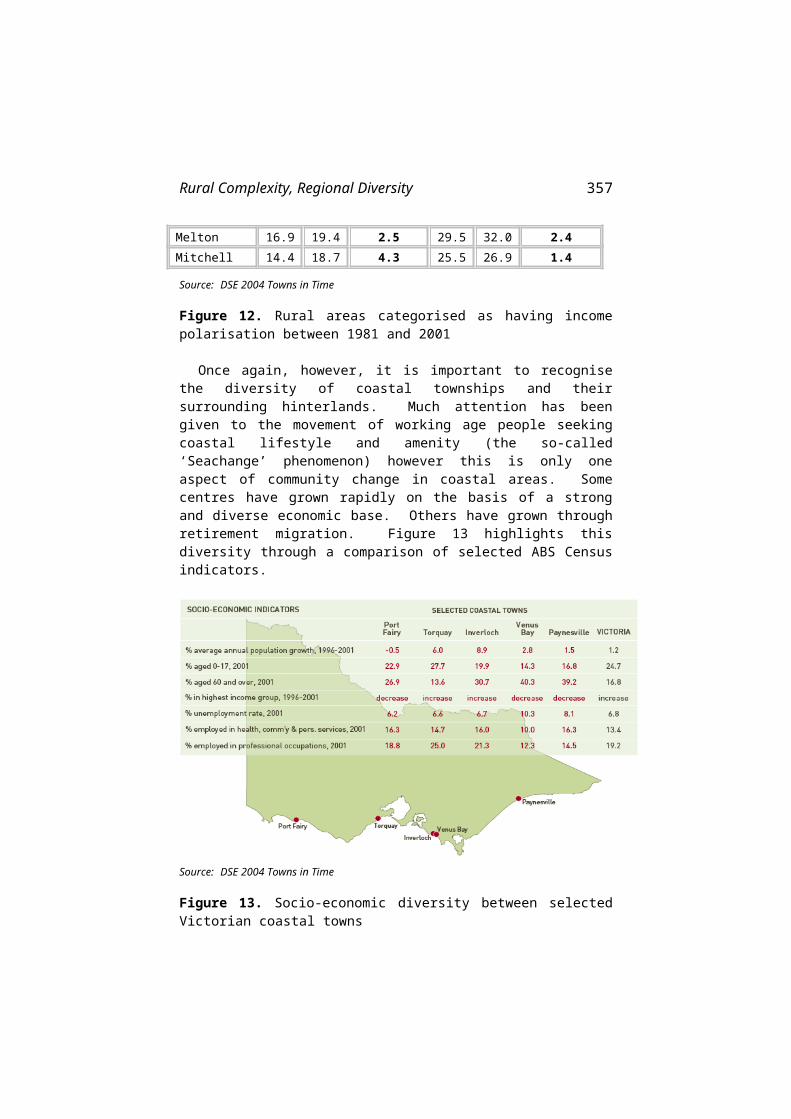
Once again, however, it is important to recognisethe diversity of coastal townships and theirsurrounding hinterlands. Much attention has beengiven to the movement of working age people seekingcoastal lifestyle and amenity (the so-called‘Seachange’ phenomenon) however this is only oneaspect of community change in coastal areas. Somecentres have grown rapidly on the basis of a strongand diverse economic base. Others have grown throughretirement migration. Figure 13 highlights thisdiversity through a comparison of selected ABS Censusindicators.
Source: DSE 2004 Towns in Time
Figure 13. Socio-economic diversity between selectedVictorian coastal towns
358 Fiona McKenzie
The fastest regional population growth rates inVictoria in recent years have been in coastal areasclose to Melbourne – the coastal parts of the City ofGreater Geelong and the Shires of Surf Coast and BassCoast. Much of this is related to the growth ofMelbourne and Geelong and the subsequent expansion ofthe commuter belt. More distant coastal areas havegenerally had lower population growth rates with theexception of the Gippsland Lakes region which remainsa popular retirement destination. Population growthis projected to continue in these areas, extendingbeyond Surf Coast into Colac-Otway to the west ofMelbourne and beyond Bass Coast into South Gippslandto the east. Regional centres like Warrnambool andBairnsdale are also expected to grow.
Most coastal towns in Victoria have a higher thanaverage proportion of older age residents. Where thetown has a diverse economy there are opportunities fora wide range of services to be provided. Howevertowns which are facing economic challenges may have avulnerable economic base and a shrinking working agepopulation. This can make the provision of servicessuch as health and transport more difficult.
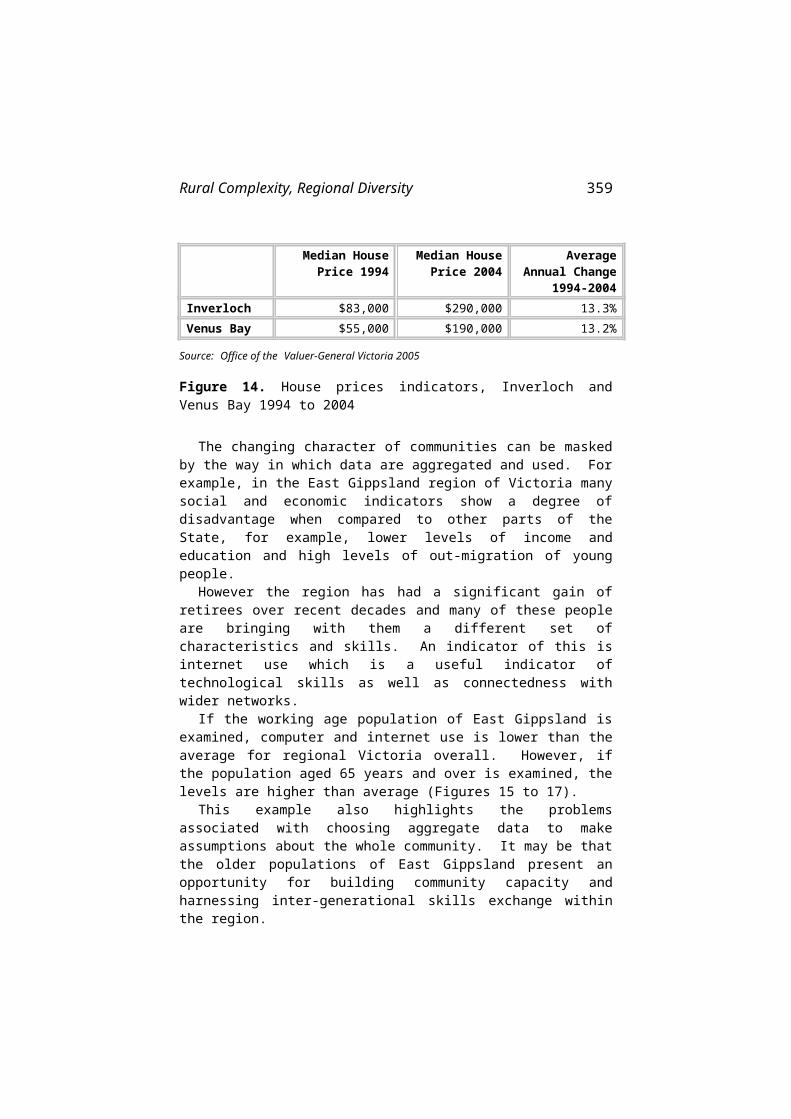
It is interesting to note how towns in very closeproximity can vary greatly in characteristics.Inverloch and Venus Bay are 19 kilometres apart on theVictorian coast east of Melbourne. The town ofInverloch has become increasingly popular for retireesand holiday home owners. In contrast, the populationof Venus Bay has a profile of older low incomeresidents, relatively high unemployment rate and acontinued out-migration of young adult age groups.Inverloch is more accessible by road than Venus Bayand is closer to Melbourne. Median house pricesincreased by almost the same rate in each town between1994 and 2004 (13 percent per annum), yet house pricesin Venus Bay remain around 65 percent the price ofthose in nearby Inverloch (Figure 14).
Rural Complexity, Regional Diversity 359
Median HousePrice 1994
Median HousePrice 2004
AverageAnnual Change
1994-2004Inverloch $83,000 $290,000 13.3%Venus Bay $55,000 $190,000 13.2%
Source: Office of the Valuer-General Victoria 2005
Figure 14. House prices indicators, Inverloch andVenus Bay 1994 to 2004
The changing character of communities can be maskedby the way in which data are aggregated and used. Forexample, in the East Gippsland region of Victoria manysocial and economic indicators show a degree ofdisadvantage when compared to other parts of theState, for example, lower levels of income andeducation and high levels of out-migration of youngpeople.
However the region has had a significant gain ofretirees over recent decades and many of these peopleare bringing with them a different set ofcharacteristics and skills. An indicator of this isinternet use which is a useful indicator oftechnological skills as well as connectedness withwider networks.
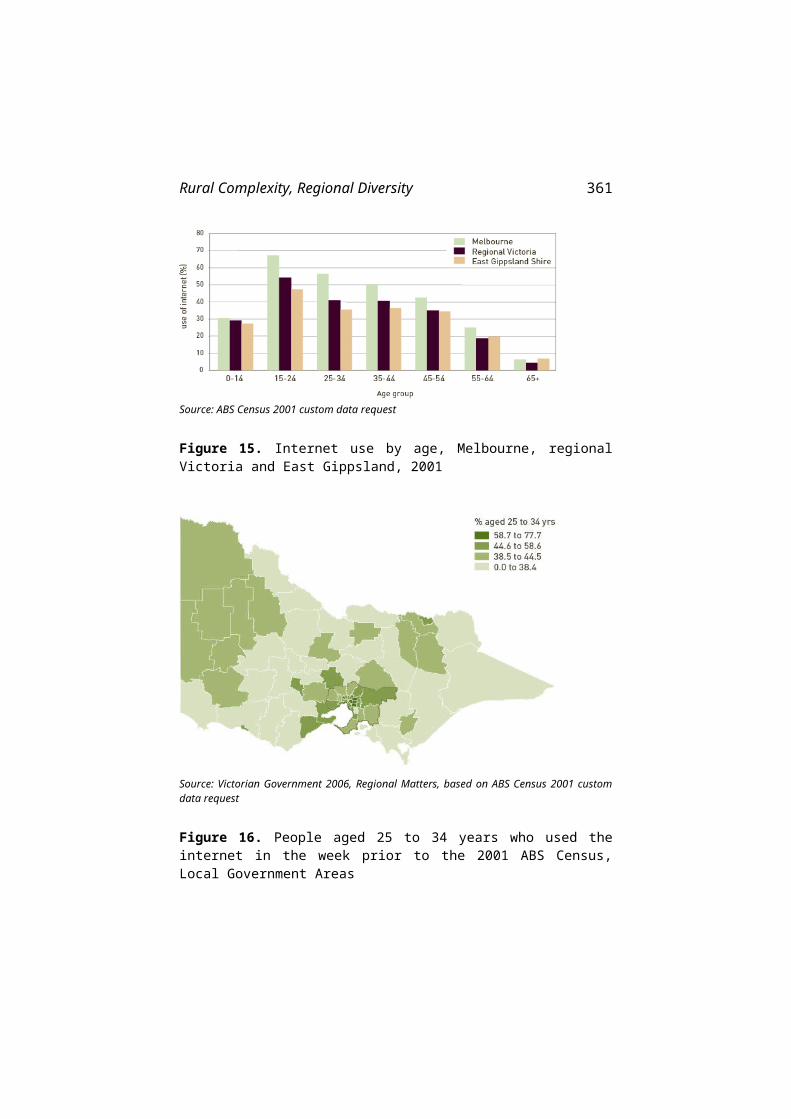
If the working age population of East Gippsland isexamined, computer and internet use is lower than theaverage for regional Victoria overall. However, ifthe population aged 65 years and over is examined, thelevels are higher than average (Figures 15 to 17).
This example also highlights the problemsassociated with choosing aggregate data to makeassumptions about the whole community. It may be thatthe older populations of East Gippsland present anopportunity for building community capacity andharnessing inter-generational skills exchange withinthe region.
360 Fiona McKenzie
4. CONCLUSION
In analysing regional change, it is relatively easyto use broad indicators such as population change.Yet it is the less visible changes occurring inregional areas that are having a profound effect onthe relationship between urban and rural communities;travel and work patterns; and the internal dynamics ofregional communities.
Rural Complexity, Regional Diversity 361
Source: ABS Census 2001 custom data request
Figure 15. Internet use by age, Melbourne, regionalVictoria and East Gippsland, 2001
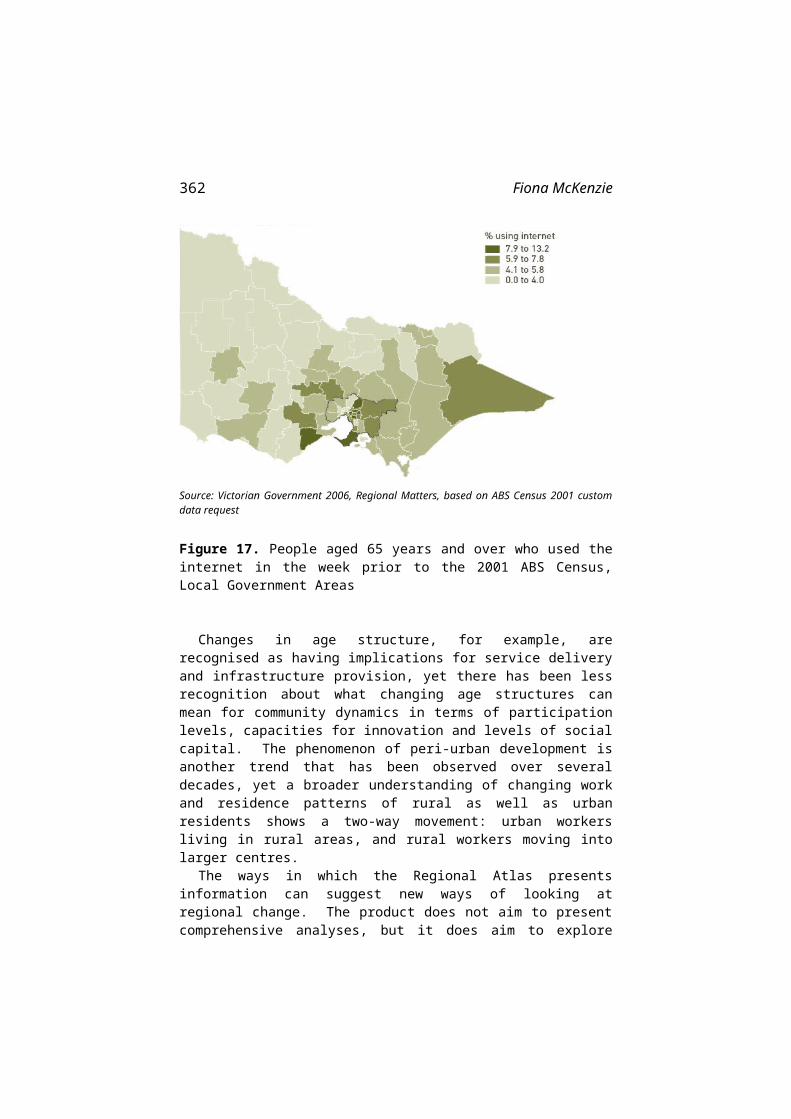
Source: Victorian Government 2006, Regional Matters, based on ABS Census 2001 customdata request
Figure 16. People aged 25 to 34 years who used theinternet in the week prior to the 2001 ABS Census,Local Government Areas
362 Fiona McKenzie
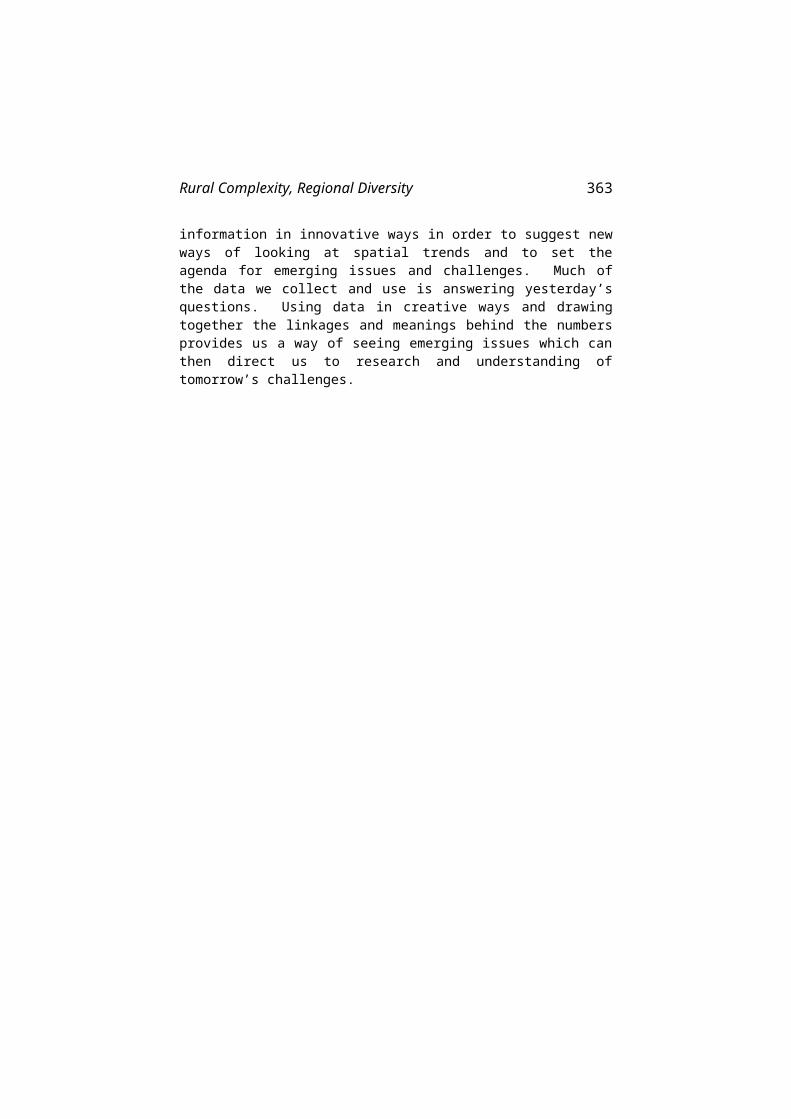
Source: Victorian Government 2006, Regional Matters, based on ABS Census 2001 customdata request
Figure 17. People aged 65 years and over who used theinternet in the week prior to the 2001 ABS Census,Local Government Areas
Changes in age structure, for example, arerecognised as having implications for service deliveryand infrastructure provision, yet there has been lessrecognition about what changing age structures canmean for community dynamics in terms of participationlevels, capacities for innovation and levels of socialcapital. The phenomenon of peri-urban development isanother trend that has been observed over severaldecades, yet a broader understanding of changing workand residence patterns of rural as well as urbanresidents shows a two-way movement: urban workersliving in rural areas, and rural workers moving intolarger centres.
The ways in which the Regional Atlas presentsinformation can suggest new ways of looking atregional change. The product does not aim to presentcomprehensive analyses, but it does aim to explore
Rural Complexity, Regional Diversity 363
information in innovative ways in order to suggest newways of looking at spatial trends and to set theagenda for emerging issues and challenges. Much ofthe data we collect and use is answering yesterday’squestions. Using data in creative ways and drawingtogether the linkages and meanings behind the numbersprovides us a way of seeing emerging issues which canthen direct us to research and understanding oftomorrow’s challenges.
364 Fiona McKenzie
REFERENCES
Barr, N. (2005) The Changing Social Landscape of Rural Victoria,with contributions from R. Wilkinson and K. Karunaratne.Department of Primary Industries: VictorianGovernment, Melbourne.
Burnley, I. and Murphy, P. (2004) Sea Change. Movementfrom Metropolitan to Arcadian Australia. University of NewSouth Wales Press: Sydney.
Department of Sustainability and Environment (DSE)(2004) Towns in Time. Victorian Government: Melbourne.www.dse.vic.gov.au/research.
Department of Sustainability and Environment (DSE)(2004) Victoria in Future. Victorian State Government Populationand Household Projections 2001–2031. Victorian Government:Melbourne. www.dse.vic.gov.au/research.
Department of Sustainability and Environment (DSE)(2005) Planning Scheme Zones, Victorian Government:Melbourne.
Houston, P. (2004) National Audit of Peri-urban Agriculture.Rural Industries Research and DevelopmentCorporation (RIRDC) Project No. SAR-40A. Accessibleat www.rirdc.gov.au.
National Sea Change Taskforce (NSCT) (2005) Meeting theSea Change Challenge: Sea Change Communities in Coastal Australia.Prepared by N. Gurran C. Squires & E. Blakey,Planning Research Centre University of Sydney.Accessible atwww.arch.usyd.edu.au/web/research/prc/.
Office of the Valuer-General (2005) A Guide to PropertyValues 2004, Department of Sustainability andEnvironment, Victorian Government: Melbourne.
Salt, B. (2004) The Big Shift. Hardie Grant Publishing.Victorian Government 2006, Regional Matters – An Atlas of
Regional Victoria 2005, produced by the Department ofSustainability and Environment, Melbourne.www.dse.vic.gov.au/regionalmatters.