EDUCATION MATTERS
208
EDUCATION MATTERS Investing in America’s Future FISCAL YEAR 2022 BUDGET ANALYSIS July 2021
-
Upload
khangminh22 -
Category
Documents
-
view
0 -
download
0
Transcript of EDUCATION MATTERS

EDUCATION MATTERSInvesting in America’s Future
FISCAL YEAR 2022 BUDGET ANALYSIS
July 2021
CEF’s FY 2022 BUDGET ANALYSIS 2
Table of ContentsIntroduction
About CEF ................................................................................................................................................................................... 4 Acknowledgments..................................................................................................................................................................... 5 CEF Position Statement on the President’s FY 2022 Budget Request ........................................................................... 6 Summary/Analysis of the President’s FY 2022 Budget for Education ........................................................................... 7 Changes in the FY 2022 Education Budget .......................................................................................................................13FY 2022 President’s Budget for Selected Department of Education and Related Programs ..................................15 President’s FY 2022 Request for New Education Programs ..........................................................................................18
Charts and Graphs
Charts and Graphs ...........................................................................................................................................................19-35
Part I: The Foundation for Success – Early Childhood, Elementary, and Secondary Education
Section Overview. ...................................................................................................................................................................37Title I Grants to States ...........................................................................................................................................................39Comprehensive Literacy Development Program: LEARN ..............................................................................................44Innovative Approaches to Literacy .....................................................................................................................................47Impact Aid ................................................................................................................................................................................49Supporting Effective Instruction State Grants .................................................................................................................51Nita M. Lowey 21st Century Community Learning Centers ...........................................................................................54Grants for State Assessment ...............................................................................................................................................57Education for Homeless Children and Youth ...................................................................................................................59Rural Education Achievement Program .............................................................................................................................61Comprehensive Centers .......................................................................................................................................................63Student Support and Academic Enrichment Grants ......................................................................................................65School Safety National Activities ........................................................................................................................................68Promise Neighborhoods .......................................................................................................................................................70Full-Service Community Schools ........................................................................................................................................72Indian Education Formula Grants .......................................................................................................................................74Education Innovation and Research (EIR) ........................................................................................................................76Teacher and School Leader Incentive Grants ...................................................................................................................78Supporting Effective Educator Development (SEED) Grants .........................................................................................80Charter Schools Program .....................................................................................................................................................82Magnet Schools Assistance Program ................................................................................................................................84Ready To Learn .......................................................................................................................................................................86Assistance for Arts Education .............................................................................................................................................88Gifted and Talented Program ...............................................................................................................................................90Statewide Family Engagement Centers .............................................................................................................................92Language Acquisition Grants ..............................................................................................................................................94IDEA State Grants ...................................................................................................................................................................96IDEA Preschool Program ......................................................................................................................................................98IDEA Infants and Toddlers with Disabilities .....................................................................................................................100IDEA National Activities .......................................................................................................................................................102School Renovation and Modernization ...........................................................................................................................104
CEF’s FY 2022 BUDGET ANALYSIS 3
Part II: Education, Careers, and Lifelong Learning
Carl D. Perkins Career and Technical Education Act ................................................................................................................ 108Adult Education and Family Literacy Act .................................................................................................................................... 111Library Services and Technology Act .......................................................................................................................................... 114Office of Museum Services ........................................................................................................................................................... 117Workforce Innovation and Opportunity Act (WIOA) .................................................................................................................. 119
Part III: The Gateway to Opportunity — Higher Education
Section Overview ..........................................................................................................................................................................122Federal Pell Grant Program .........................................................................................................................................................126Federal Supplemental Educational Opportunity Grants ........................................................................................................131Federal Work-Study Program (FWS) .........................................................................................................................................133William D. Ford Federal Direct Loan Program .........................................................................................................................135Public Service Loan Forgiveness ..............................................................................................................................................138Teacher Education Assistance for College and Higher Education Grants Program (TEACH) ........................................140High School Equivalency Program (HEP) and College Assistance Migrant Program (CAMP) .......................................142Title III and Title V: Institutional Aid ...................................................................................................................................144-152
Historically Black Colleges and Universities (HBCU) ......................................................................................................144Developing Hispanic-Serving Institutions Program (HSI) ..............................................................................................147Tribal Colleges and Universities .........................................................................................................................................150 Other Title III Programs ........................................................................................................................................................152
International Education Programs and Foreign Language Studies .....................................................................................153Federal TRIO Programs ...............................................................................................................................................................155Gaining Early Awareness and Readiness for Undergraduate Programs (GEAR UP) ........................................................158Graduate Education ......................................................................................................................................................................161Child Care Access Means Parents in School (CCAMPIS) .....................................................................................................163Teacher Quality Partnership Grants ..........................................................................................................................................165Student Aid Administration .........................................................................................................................................................167Federally Funded Research .........................................................................................................................................................169Segal AmeriCorps Education Award .........................................................................................................................................171
Part IV: Forging Success — Educational Research, Statistics, and Improvement
The Institute of Education Sciences ......................................................................................................................................... 174Regional Education Laboratories (RELs) ................................................................................................................................. 176Education Research, Development, and Dissemination ....................................................................................................... 178National Center for Education Statistics.................................................................................................................................. 180National Assessment of Educational Progress ...................................................................................................................... 182Research in Special Education .................................................................................................................................................. 184Statewide Longitudinal Data Systems ..................................................................................................................................... 186
Part V: Education-Related Programs — Meeting the Human Needs of America’s Children
Head Start ....................................................................................................................................................................................... 189Child Care and Development Block Grant ................................................................................................................................ 192Preschool Development Grants Act ........................................................................................................................................... 194Child Nutrition Programs ............................................................................................................................................................. 196Medicaid: Early Periodic Screening, Diagnosis, and Treatment Program .......................................................................... 198Intra-Agency Programs to Address School Safety & School/Community Violence Prevention .................................... 200Youth Mentoring Initiative ............................................................................................................................................................ 202 Secure Rural Schools and Community Self-Determination Act ........................................................................................... 204
CEF’s 2021 Member Roster ......................................................................................................................................................... 206
Table of Contents, continued
CEF’s FY 2022 BUDGET ANALYSIS 4
Introduction
The Committee for Education Funding (CEF), the nation’s oldest and largest education coalition, is a nonpartisan and nonprofit organization focused on the common goal of ensuring adequate federal financial support for education. CEF’s more than 100 member organizations and institutions represent the continuum of education — early childhood education, elementary and secondary education, higher education, adult and workforce education, and educational enhancements such as libraries and museums. Members include students and families, teachers and faculty, administrators, specialized instructional support personnel and other school employees, school board members, librarians, businesses, and education-related organizations.
CEF provides its members, the public, the U.S. Congress, the Executive Branch, and the media with information in support of federal investments in education. CEF’s #HearOurEdStories social media campaign lets teachers, students, parents, and others in the education community tell their members of Congress why federal education funding is so important. It supports CEF’s “5¢ Makes Sense” advocacy campaign to increase investments in education from its historic average of about 2 percent to 5 percent of the federal budget.
CEF is managed by American Continental Group and is governed by the membership as a whole, with a 16-member Board of Directors, including four officers and eight other Board members elected by the membership. CEF publishes timely updates, sponsors briefings on current funding and policy issues led by recognized experts, and holds weekly meetings of its membership that provide a forum for information exchange and policy discussions. CEF provides information and assistance to members of Congress and the Administration on education funding issues and holds numerous briefings and policy meetings with congressional staff and Administration officials during the year. CEF also shares information and advocacy on Twitter and Instagram (@edfunding) and shows briefings on Facebook (Cmte4edfunding). At its annual fall Gala, CEF honors outstanding advocates of federal education investment.
You can find a list of CEF members at the end of this book and online at https://cef.org/about/cef-members/. CEF invites inquiries regarding CEF membership or its publications. CEF’s website (www.cef.org) also has fact sheets, funding tables, and charts on education funding and the importance of the federal investment.
Downloadable versions of the charts in this analysis are available on the CEF website. The site also includes many additional charts on the need for increased federal investments in education, educational outcomes, public opinion, and education funding at the state and federal level.
For questions or additional information, please contact CEF’s Executive Director Sarah Abernathy at [email protected], or CEF’s president Luis Maldonado at [email protected].
1800 M Street, NW, Suite 500 SouthWashington, DC 20036(202) 327-8125www.cef.orgTwitter and Instagram: @edfunding
About CEF

CEF’s FY 2022 BUDGET ANALYSIS 5
This report would not have been possible without the contributions of the following CEF members and staff, as well as many other CEF members who wrote about specific programs:
managing editorMyrna Mandlawitz, MRM Associates, LLC
section editors Part I: Elementary and Secondary Education Nicole Jarvis, National Association of Federally Impacted SchoolsLindsay Kubatzky, National Center for Learning DisabilitiesZachary Scott, National Association of Secondary School PrincipalsNick Spina, American Federation of School Administrators
Part II: Education, Careers, and Lifelong Learning Kevin Maher, American Library Association
Part III: Higher EducationPeter DeYoe, Harvard UniversityRachel Gentry, National Association of Student Financial Aid AdministratorsEmily Jeffries, National Council for Community and Education PartnershipsCarl Welliver, University of California
Part IV: Educational Research and StatisticsChristy Talbot, American Educational Research Association
Part V: Education-Related ProgramsErik Peterson, Afterschool AllianceKelly Vaillancourt Strobach, National Association of School Psychologists
Charts and GraphsSarah Abernathy, Committee for Education Funding
Book Design and Interactive LayoutKaren Seidman, Seidman Says! Communications
committee for education funding staffSarah Abernathy, Executive DirectorSheryl Cohen, Senior Advisor
Acknowledgments

CEF’s FY 2022 BUDGET ANALYSIS 6
“The President’s budget makes an unprecedented funding increase for education that will have immediate and long-term impacts on teaching and learning, and will make it possible both to continue education investments begun with pandemic-relief funding and to address long-ignored needs across the education continuum.”
The Committee for Education Funding (CEF), the nation’s oldest and largest education coalition, is a nonprofit, nonpartisan coalition of more than 100 member organizations and institutions that represent the continuum of education — from early childhood, elementary and secondary, and higher education, to adult and workforce education, and the educational enhancements that increase student achievement, including students, teachers and faculty, parents, administrators, specialized instructional support personnel, librarians, other school personnel, and school board members.
CEF strongly supports the president’s record increases for education in FY 2022
The majority of Americans want greater investments in public education, with two-thirds of respondents in a May 2021 poll saying the U.S. spends too little on education. The president’s budget reflects this majority view by dramatically increasing support for education across the continuum. If Congress enacts the president’s budget, discretionary spending on education programs would increase to 3.7 percent of total federal spending in 2022 as a result of new programs and spending down the COVID relief already enacted for education.
For decades, education spending has accounted for only about 2 percent of the federal budget despite growing needs, and regular (not COVID-related) funding for Department of Education programs is currently $7 billion below the level of a decade ago in inflation-adjusted terms. The president’s budget includes a historic $29.8 billion (40.8 percent) increase in discretionary spending for education programs, as well as increases for education-related programs in other agencies, including Head Start, child care, preschool, and museum programs. The budget also includes new mandatory spending for education programs, including:
• $87 billion over ten years to modernize education and child care infrastructure;• $165 billion over ten years for universal preschool;• $272 billion over ten years to support access to higher education, including free community
college;• $8 billion over ten years to train more teachers; and, • $225 billion over ten years to provide child care to families.
These investments, in conjunction with the president’s requested increase in annual discretionary funding, would start to backfill years of underfunding of education and would allow school districts, colleges, and other education providers to continue and expand some of the services they started with one-time COVID-relief funding.
Investments in education are among the most important and profitable that the nation can make. Simply put, education pays — for students, families, communities, and the economy. CEF urges Congress to pass the president’s increased investments in education to maximize opportunities for students and their families, schools, and our nation.
CEF Position StatementPresident’s Fiscal Year 2022 Education Budget
CEF’s FY 2022 BUDGET ANALYSIS 7
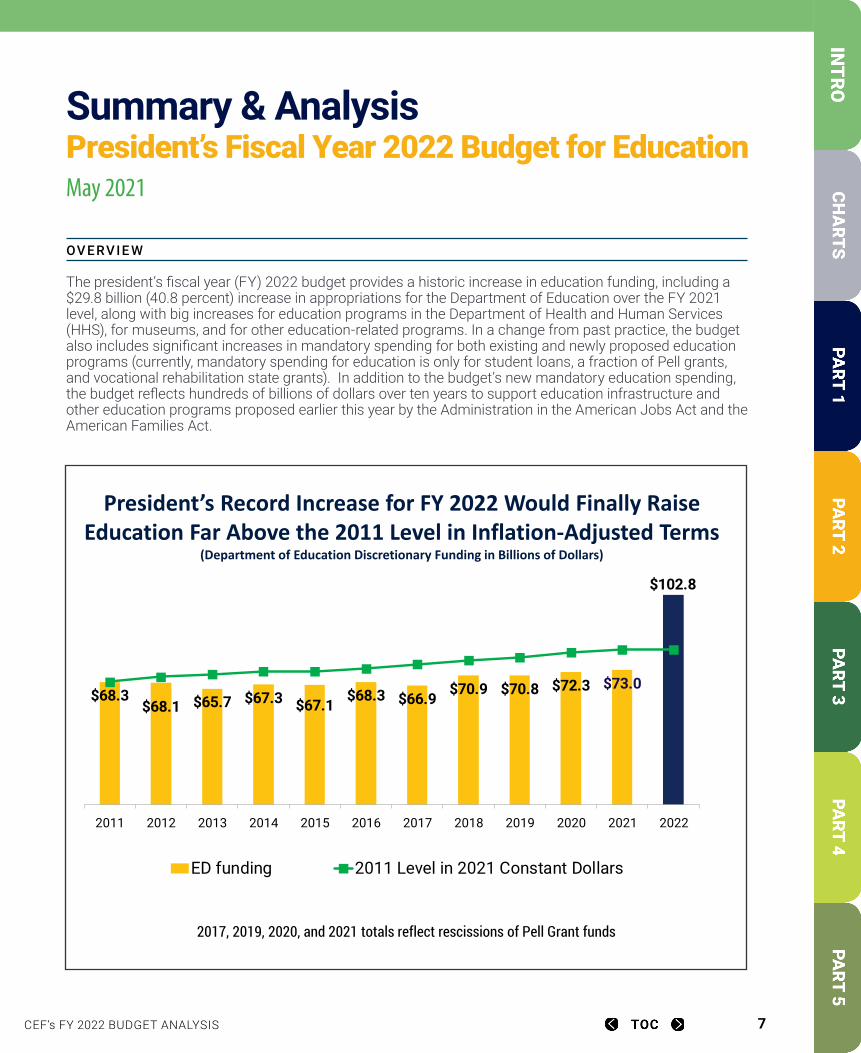
OV ERV IE W
The president’s fiscal year (FY) 2022 budget provides a historic increase in education funding, including a $29.8 billion (40.8 percent) increase in appropriations for the Department of Education over the FY 2021 level, along with big increases for education programs in the Department of Health and Human Services (HHS), for museums, and for other education-related programs. In a change from past practice, the budget also includes significant increases in mandatory spending for both existing and newly proposed education programs (currently, mandatory spending for education is only for student loans, a fraction of Pell grants, and vocational rehabilitation state grants). In addition to the budget’s new mandatory education spending, the budget reflects hundreds of billions of dollars over ten years to support education infrastructure and other education programs proposed earlier this year by the Administration in the American Jobs Act and the American Families Act.
Summary & Analysis President’s Fiscal Year 2022 Budget for EducationMay 2021
$68.3$68.1 $65.7 $67.3 $67.1 $68.3 $66.9 $70.9 $70.8 $72.3 $73.0
$102.8
2011 2012 2013 2014 2015 2016 2017 2018 2019 2020 2021 2022
ED funding 2011 Level in 2021 Constant Dollars
2017, 2019, 2020, and 2021 totals reflect rescissions of Pell Grant funds
President’s Record Increase for FY 2022 Would Finally Raise Education Far Above the 2011 Level in Inflation-Adjusted Terms
(Department of Education Discretionary Funding in Billions of Dollars)
CEF’s FY 2022 BUDGET ANALYSIS 8
The Administration views its FY 2022 budget as part of a holistic fiscal and policy plan that includes two earlier large tax, spending, and policy proposals intended to support Americans, boost the economy, and begin implementation of some education and other proposals President Biden pledged to address. New funding is focused on education themes the president has mentioned since his campaign: equity, diversity of and training for educators, students’ health, infrastructure, college affordability, and career pathways. The biggest education proposals focus on early childhood education, child care, education infrastructure, Title I, special education, teacher preparation, free community college, and Pell grants. Despite the record increase for education funding, several large programs do not receive any increase, including Title IV-A, almost all the Title I and Innovation and Improvement programs, and the two campus-based aid programs (Work Study and SEOG).
In poll after poll, Americans support greater investments in education. For decades, education has accounted for only about 2 cents of every federal dollar. CEF’s “5 Cents Makes Sense” campaign has a goal of increasing education funding from 2 to 5 percent of the federal budget. Assuming enactment of the president’s budget, that share temporarily rises to 3.7 percent in FY 2022. This increased percentage is due both to the record new education spending the president has requested and because in FY 2022 school districts will still be spending down COVID relief enacted for education, while the bulk of emergency COVID assistance for other purposes (unemployment insurance, rental assistance, business supports, etc.) already will have been spent. That timing leads to a temporary but big increase in the share of the budget that supports education. Even with the president’s large requested increases in education funding, education will begin to decline again as a share of the federal budget in FY 2025, without having reached 5 cents of every federal dollar.
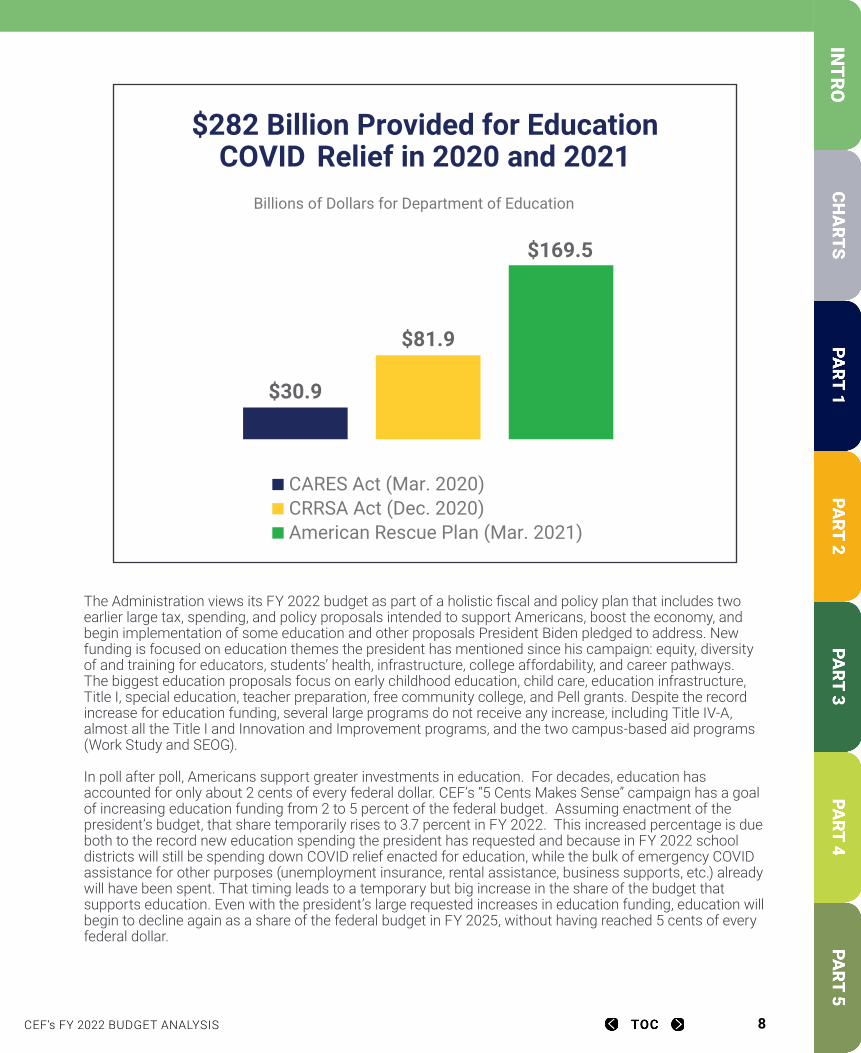
$282 Billion Provided for EducationCOVID-Relief in 2020 and 2021
$30.9
$81.9
$169.5
Billions of Dollars for Department of Education
CARES Act (Mar. 2020)CRRSA Act (Dec. 2020)American Rescue Plan (Mar. 2021)
CEF’s FY 2022 BUDGET ANALYSIS 9
NEW EDUCATION PROGR AMS PROPOSED IN THE PRESIDENT’S BUDGET
Some of the biggest funding increases are for new education programs summarized below and not included in the articles in the book, which cover the impact of the president’s budget on existing education programs. The new programs are also listed in a table, “President’s FY 2022 Request for New Education Programs,” on page 18 that shows which programs are funded with annual appropriations and which are mandatory funding that would be provided through enactment of authorizing language creating the new program.
$20 billion in FY 2022 appropriations for a Title I Equity Grant. This is the largest single increase for an education program for FY 2022. The president campaigned on a pledge to triple Title I funding. His first budget goes more than two-thirds of the way toward that goal, providing $20 billion for a new Title I formula grant that gives a greater share of funding to the highest poverty schools while providing incentives for states and localities to distribute their own funding more equitably. Part of the funding would support better pay for educators.
$1 billion in FY 2022 appropriations for a School-Based Health Professionals program for the first year of a 10-year campaign to double the number of school counselors, school nurses, and school mental health professionals. Funding would align with the formula for the Title I state grant program, with priority given to Title I-eligible schools, and states would match 25 percent of the funds.
$100 million in FY 2022 appropriations for a Fostering Diverse Schools competitive grant program to develop and implement plans to support voluntary changes that increase racial and ethnic diversity in preschool through grade 12 public schools.
$25 million in FY 2022 appropriations for a Climate Resilient Schools competitive grant program to develop school modernization plans that help guide the use of $50 billion over five years proposed in the American Jobs Plan to modernize and build new safe and healthy schools.
NEW EDUCATION PROGR AMS PROPOSED IN THE AMERICAN JOBS PLAN AND THE AMERICAN FAMILIES PLAN WITH MANDATORY SPENDING
In March, the president announced the American Jobs Plan that included more than $200 billion over ten years in direct investments in education and child care infrastructure and workforce training. In late April, the president announced the American Families Plan as the second part of his Build Back Better economic recovery and infrastructure proposal, and it included more than $700 billion over ten years for education and child care programs. These proposals are for mandatory spending not controlled annually by the appropriations process. As of June, Congress had not enacted these proposals. In total, the president’s budget includes more than $41 billion in mandatory spending in FY 2022 for new Department of Education programs and additional mandatory funding increases for existing programs, as well as another $21 billion for education-related programs in the Departments of Health and Human Services and Labor. Some of the mandatory spending would supplement existing discretionary programs (such as Pell grants, Teacher Quality Partnerships, and IDEA personnel preparation), but most is designated for large, new programs. The following mandatory spending programs for education were proposed in the American Jobs Plan and the American Families Plan and are reflected in the budget. The mandatory spending totals below are outlays. 1
1 Outlays measure the deficit impact of a program, counting the money out the door and not the budget authority authorized in that particular year. Discretionary appropriations are measured by the budget authority provided for a year, while mandatory programs are measured by how much is outlaid. In some cases, the ten-year outlay total is less than the amount of budget authority provided, and agency budget materials often use the budget authority total while the Office and Management and Budget tables use outlays to measure the deficit impact.
CEF’s FY 2022 BUDGET ANALYSIS 10
$87 billion in education-related infrastructure over ten years, proposed in the American Jobs Plan. The total includes $50 billion for modernizing or building new elementary and secondary schools
($10 billion in FY 2022), $25 billion for child care facilities, and $12 billion for infrastructure and technology at community colleges, including areas where there are education “deserts” ($2.4 billion in FY 2022). With a few exceptions, the federal government has not generally funded education infrastructure, leaving that to states and localities.
$8 billion for teacher preparation and education over ten years, spread over several new programs and as a supplement for some existing discretionary programs, intended to address teacher shortages, improve training and teacher supports, and increase diversity in the educator workforce. The funding is all proposed in the American Families Plan, and the total includes an increase for TEACH grants and mandatory support for the following new programs:
o $2.4 billion over ten years to expand Teacher Quality Partnerships. The existing Partnership program also gets an $80 million increase in discretionary spending for FY 2022.
o $1.6 billion in FY 2022 for Answer the Call – Supporting In-Demand Credentials for Teachers. This one-time mandatory funding would provide grants to states for public school teachers to get advanced certifications in in-demand subject areas.
o $1.6 billion over ten years for Expanding Opportunities for Teacher Leadership and Development.
o $802 million over ten years for Individuals with Disabilities Education Act (IDEA) personnel preparation. The existing IDEA personnel preparation program also gets a $160 million
(177.2 percent) increase in discretionary funding for FY 2022.
o $343 million over ten years to create Hawkins Centers for Excellence. The program was authorized in 2008 but never funded. The budget also provides $20 million in discretionary funding for FY 2022 for this program of competitive grants to expand the diversity of the teacher workforce by supporting teacher training at Historically Black Colleges and Universities (HBCUs), Tribally Controlled Colleges and Universities (TCCUs), and other Minority-Serving Institutions (MSIs).
$120.5 billion for community colleges. That total includes $108.5 billion over ten years to make community college free for two years, proposed in the American Families Plan, and $12 billion for community college infrastructure proposed in the American Jobs Plan (described earlier). The Completion Grants described below are also available for community colleges and other institutions.
$94.4 billion over ten years for other college completion and affordability programs. This total, all for programs proposed in the American Families Plan, includes:
o $53.3 billion over ten years for Completion Grants to support retention and completion at public and nonprofit institutions serving many low-income students, including community colleges. The funds could support a variety of services, including academic supports, direct student services such as child care and addressing food and housing insecurity, career coaching, and improving transfer student success.
o $39.4 billion over ten years for Advancing Affordability for Students to provide grants to HBCUs, TCCUs, and other MSIs to subsidize tuition for students whose families earn less than $125,000 a year.
o $1.7 billion over ten years for Health Professionals of the Future for competitive grants to HBCUs, TCCUs, and MSIs to create or expand graduate programs that prepare students for health care professions.
CEF’s FY 2022 BUDGET ANALYSIS 11
$8.7 billion over ten years for Expanded Career Pathways for Middle and High School Students, proposed in the American Jobs Plan. Priority would go to programs that connect students to in-demand and STEM fields and that help community colleges offer workforce training programs. The budget also provides a $128 million increase in discretionary funding for FY 2022 for career and technical education.
$870 million over ten years to expand adult education, proposed in the American Jobs Plan, to help job-seeking adults gain foundational skills and career services. In addition, the budget also provides a $25 million increase for adult education national leadership activities for programs to help low-skilled adults without a high school degree or equivalency.
NEW EDUCATION-RELATED PROGR AMS IN HHS AND DEPARTMENT OF LABOR PROPOSED IN THE AMERICAN JOBS PLAN AND THE AMERICAN FAMILIES PLAN WITH MANDATORY SPENDING
In addition to the Department of Education programs described above, the budget and the American Families Plan and the American Jobs Plan include significant mandatory funding for new education-related programs in HHS and the Department of Labor. The Labor programs include several workforce development programs, including funding to expand existing apprenticeship programs, assistance to workers facing specific barriers to employment, and career services. It also includes $6.6 billion over ten years for community college training partnerships, a competitive grant proposed in the American Jobs Plan to help community colleges provide high-quality training programs.
The HHS budget includes close to $400 billion over ten years in mandatory spending for new early childhood programs including:
$139.2 billion over ten years to provide universal preschool grants to states, proposed in the American Families Plan, to offer early learning to all 3- and 4-year-olds. This partnership with states would allow families to choose among child care providers, Head Start, schools, or other community-based providers and would guarantee a minimum wage of $15 an hour for preschool educators.
$25.7 billion over ten years for a Head Start educator program, proposed in the American Families Plan, to pay Head Start workers $15 an hour and to pay Head Start teachers salaries comparable to kindergarten teachers with comparable qualifications.
$225 billion over ten years for Child Care for American Families, which includes both subsidies to lower income families and supports for child care providers to increase supply and access to high-quality child care.
CEF’s FY 2022 BUDGET ANALYSIS 12
CEF BU DGE T BOOK
With this year’s budget book, CEF is pleased to offer a new interactive digital format that makes it easier to navigate directly to specific articles or sections and to maneuver within the book. As always, the book provides a comprehensive picture of the national education programs in the president’s budget, including several that are not part of the Department of Education and several not funded by annual discretionary appropriations. There are also charts illustrating overall funding levels, as well as the funding history of each program for the past 15 years. Most articles include a vignette showing real-world examples of how each program’s funding makes a difference in access to high-quality education and educational achievement.
Articles that include a video icon have an accompanying video vignette posted online. The articles describe each program’s purpose, detail the recent funding history, and demonstrate the impact of the president’s FY 2022 budget. The articles are written by CEF members, and their contact information is provided for those who have more questions.
MOR E IN FOR M ATION ON CEF’s WEBSITE
All the charts in this book, along with additional budget and education charts and the video vignettes, are available through CEF’s website at https://cef.org/cef-budget-book/. Further information on the president’s budget, education charts, fact sheets, and descriptive and advocacy materials are also on CEF’s website at www.cef.org.
CEF VIDEO
CEF’s FY 2022 BUDGET ANALYSIS 13
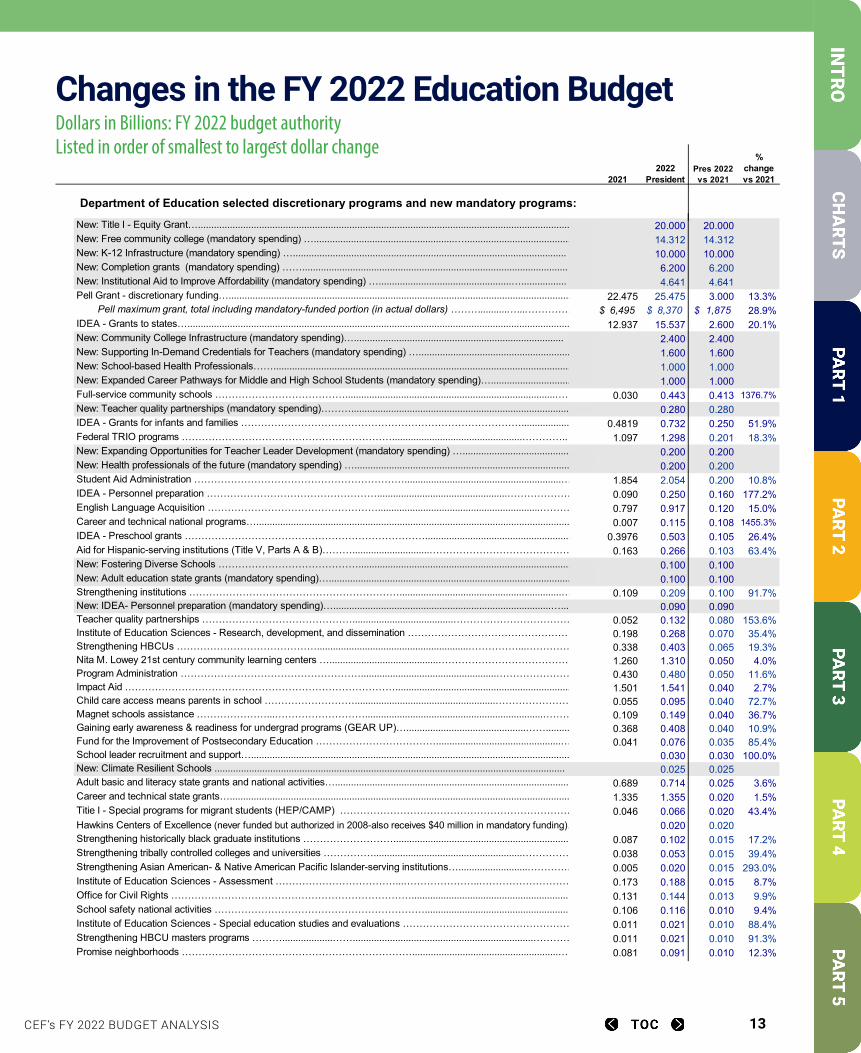
Changes in the FY 2022 Education Budget Dollars in Billions: FY 2022 budget authority Listed in order of smallest to largest dollar change
Changes in the FY 2022 Education Budget Dollars in Billions: FY 2022 budget authorityListed in order of smallest to largest dollar change
Programs with funding increases20.000 20.00014.312 14.31210.000 10.000
6.200 6.2004.641 4.641
22.475 25.475 3.000 13.3%6,495$ 8,370$ 1,875$ 28.9%12.937 15.537 2.600 20.1%
2.400 2.4001.600 1.6001.000 1.0001.000 1.000
0.030 0.443 0.413 1376.7%0.280 0.280
0.4819 0.732 0.250 51.9%1.097 1.298 0.201 18.3%
0.200 0.2000.200 0.200
1.854 2.054 0.200 10.8%0.090 0.250 0.160 177.2%0.797 0.917 0.120 15.0%0.007 0.115 0.108 1455.3%
0.3976 0.503 0.105 26.4%0.163 0.266 0.103 63.4%
0.100 0.1000.100 0.100
0.109 0.209 0.100 91.7%0.090 0.090
0.052 0.132 0.080 153.6%0.198 0.268 0.070 35.4%0.338 0.403 0.065 19.3%1.260 1.310 0.050 4.0%0.430 0.480 0.050 11.6%1.501 1.541 0.040 2.7%0.055 0.095 0.040 72.7%0.109 0.149 0.040 36.7%0.368 0.408 0.040 10.9%0.041 0.076 0.035 85.4%
0.030 0.030 100.0%0.025 0.025
0.689 0.714 0.025 3.6%1.335 1.355 0.020 1.5%0.046 0.066 0.020 43.4%
0.020 0.0200.087 0.102 0.015 17.2%0.038 0.053 0.015 39.4%0.005 0.020 0.015 293.0%0.173 0.188 0.015 8.7%0.131 0.144 0.013 9.9%0.106 0.116 0.010 9.4%0.011 0.021 0.010 88.4%0.011 0.021 0.010 91.3%0.081 0.091 0.010 12.3%0.014 0.023 0.009 63.3%0.005 0.012 0.007 136.7%0.019 0.025 0.006 31.5%2.143 2.149 0.006 0.3%0.188 0.193 0.005 2.7%0.013 0.018 0.005 37.4%0.044 0.049 0.005 11.3%0.181 0.186 0.005 2.8%0.017 0.020 0.003 17.7%0.027 0.030 0.003 10.0%0.014 0.015 0.001 10.0%
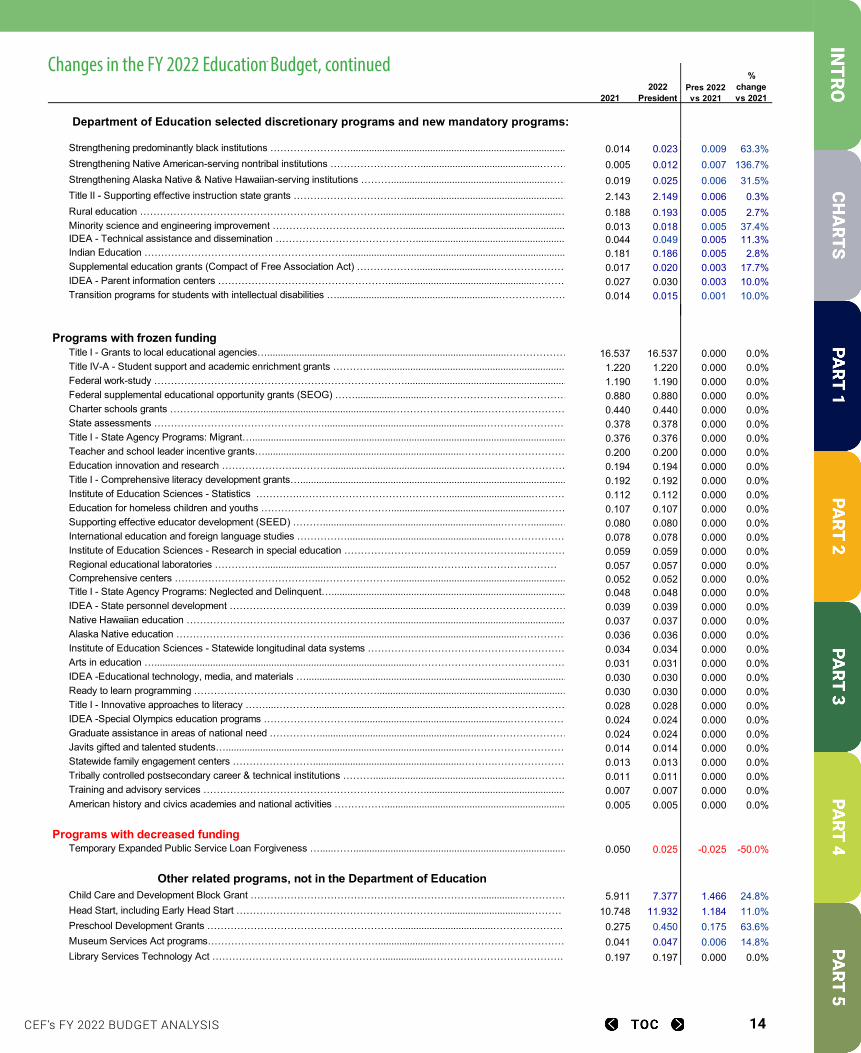
Programs with frozen funding16.537 16.537 0.000 0.0%
1.220 1.220 0.000 0.0%1.190 1.190 0.000 0.0%0.880 0.880 0.000 0.0%0.440 0.440 0.000 0.0%0.378 0.378 0.000 0.0%0.376 0.376 0.000 0.0%0.200 0.200 0.000 0.0%0.194 0.194 0.000 0.0%0.192 0.192 0.000 0.0%0.112 0.112 0.000 0.0%0.107 0.107 0.000 0.0%0.080 0.080 0.000 0.0%0.078 0.078 0.000 0.0%0.059 0.059 0.000 0.0%0.057 0.057 0.000 0.0%0.052 0.052 0.000 0.0%0.048 0.048 0.000 0.0%0.039 0.039 0.000 0.0%0.037 0.037 0.000 0.0%0.036 0.036 0.000 0.0%0.034 0.034 0.000 0.0%0.031 0.031 0.000 0.0%0.030 0.030 0.000 0.0%0.030 0.030 0.000 0.0%0.028 0.028 0.000 0.0%0.024 0.024 0.000 0.0%0.024 0.024 0.000 0.0%0.014 0.014 0.000 0.0%0.013 0.013 0.000 0.0%0.011 0.011 0.000 0.0%0.007 0.007 0.000 0.0%0.005 0.005 0.000 0.0%
Programs with decreased funding0.050 0.025 -0.025 -50.0%
5.911 7.377 1.466 24.8%10.748 11.932 1.184 11.0%
0.275 0.450 0.175 63.6%0.041 0.047 0.006 14.8%0.197 0.197 0.000 0.0%
Preschool Development Grants …………………………………………………....................................…………………Museum Services Act programs…………………………………………….........................………………………………Library Services Technology Act ……………………………………………..................………………………………….
Training and advisory services ………………………………………………………….........................................................……American history and civics academies and national activities ……………............................................................................
Temporary Expanded Public Service Loan Forgiveness ….....…….......................................................................................
Child Care and Development Block Grant …………………………………………………………….............……………Head Start, including Early Head Start ………………………………………………………................................………
IDEA -Special Olympics education programs ………………………...........................................................……………………Graduate assistance in areas of national need ……………................................................................…………………………Javits gifted and talented students…...........................................................................................…………………………..Statewide family engagement centers ……………………........................................................……….…………………….Tribally controlled postsecondary career & technical institutions ……….............................................................………………
Institute of Education Sciences - Statewide longitudinal data systems …………………………………………………………Arts in education …..................................................................................................………………………………………………IDEA -Educational technology, media, and materials …....................................................................................................Ready to learn programming ……………………………………….………......................................................................………Title I - Innovative approaches to literacy ……....………….............................................................……………………………
Comprehensive centers ……………………………………...…………………......................................................................…Title I - State Agency Programs: Neglected and Delinquent….............................................................................................IDEA - State personnel development ………………………………........................................…………………………………Native Hawaiian education …………………………………………………….........................................................................…Alaska Native education …………………………………………....................................................................…………………
Education for homeless children and youths …………………………………..........................................................…………Supporting effective educator development (SEED) ………...................................................................………...........………International education and foreign language studies ……………..........................................................………………………Institute of Education Sciences - Research in special education …………………….………………………...………………Regional educational laboratories ……………............................................................………….………………………
Education innovation and research …………………...………..................................................................……………………Title I - Comprehensive literacy development grants…........................................................................................................ Institute of Education Sciences - Statistics ………….………………………………………...............................………………
Federal supplemental educational opportunity grants (SEOG) ……...........................…………………………………………Charter schools grants ………….....................................................................……………………...……………………………State assessments ……………………………………………............................................................……………………………Title I - State Agency Programs: Migrant…........................................................................................................................Teacher and school leader incentive grants…..........................................................................…………………………………
IDEA - Parent information centers …………………………………………….......................................................………………Transition programs for students with intellectual disabilities ….............................................................………………………
Title I - Grants to local educational agencies…..........................................................................................……………………Title IV-A - Student support and academic enrichment grants ………….......................................................................…....…Federal work-study ………………………………………………………………….................................................................…
Rural education ………………………………………………………………...................................................................………Minority science and engineering improvement …………………………………....................................................................…IDEA - Technical assistance and dissemination ……………………………………..............................................................…Indian Education ……………………………………………………........................................................................................…Supplemental education grants (Compact of Free Association Act) ……………….............................…………………………
Promise neighborhoods …………………………………………………………….......................................................…………Strengthening predominantly black institutions ……………………...................................................................................……Strengthening Native American-serving nontribal institutions ……………………….............................................……………Strengthening Alaska Native & Native Hawaiian-serving institutions ………............................................................…………Title II - Supporting effective instruction state grants ……………………………...........................................................………
Institute of Education Sciences - Assessment ………………………………...…………………..………………………………Office for Civil Rights ………………………………………………………………...................................................................…School safety national activities ………………………………………………………................................................................Institute of Education Sciences - Special education studies and evaluations …………………………………………………Strengthening HBCU masters programs ………...................……....................................................................…………….…
Titie I - Special programs for migrant students (HEP/CAMP) ……………………………………………………………………Hawkins Centers of Excellence (never funded but authorized in 2008-also receives $40 million in mandatory funding)…....Strengthening historically black graduate institutions ………………………........................................................................…Strengthening tribally controlled colleges and universities ……………........................................................……………………Strengthening Asian American- & Native American Pacific Islander-serving institutions…..........................…………………
Fund for the Improvement of Postsecondary Education ………………………………...............................................……….School leader recruitment and support…............................................................................................................................ New: Climate Resilient Schools ....................................................................................................................................Adult basic and literacy state grants and national activities…..................................................................................................Career and technical state grants….........................................................................................................................................
Impact Aid ………………………………………………………………………........................................................................…Child care access means parents in school ……………………….....................................................…………………………Magnet schools assistance …………………...………………………...................................................................……………Gaining early awareness & readiness for undergrad programs (GEAR UP)….............................................……..........
Institute of Education Sciences - Research, development, and dissemination …………………………………………………Strengthening HBCUs …………………………………….........................................................……………...…………………Nita M. Lowey 21st century community learning centers ….........................................…………………………………………Program Administration ………………………………………………...................................................…………………………
New: Fostering Diverse Schools ……………………………………..................................................................................…New: Adult education state grants (mandatory spending)…............................................................................................Strengthening institutions ……………………………………………………….............................................................…………New: IDEA- Personnel preparation (mandatory spending)…..................................................................................…...Teacher quality partnerships ………………………………………......................................……………………………………
Pres 2022 vs 2021
% change vs 2021
Department of Education selected discretionary programs and new mandatory programs:
Other related programs, not in the Department of Education
2021 2022 President
New: Title I - Equity Grant…................................................................................................................................................New: Free community college (mandatory spending) ….....................................................….............................................New: K-12 Infrastructure (mandatory spending) ….......................................................................................................New: Completion grants (mandatory spending) ……....................................................................................................New: Institutional Aid to Improve Affordability (mandatory spending) …..................................................….................
New: Community College Infrastructure (mandatory spending)…...............................................................................New: Supporting In-Demand Credentials for Teachers (mandatory spending) ….............................................................New: School-based Health Professionals……....................................................................................................................
Pell Grant - discretionary funding….................................................................................................................................... Pell maximum grant, total including mandatory-funded portion (in actual dollars) ………...........…...…………………IDEA - Grants to states….......................................................................................................................................................
New: Expanding Opportunities for Teacher Leader Development (mandatory spending) …..............................................New: Health professionals of the future (mandatory spending) …....................................................................................
New: Expanded Career Pathways for Middle and High School Students (mandatory spending)….....................................Full-service community schools …………………………………...............................................................................…………New: Teacher quality partnerships (mandatory spending)………..........................................................................................IDEA - Grants for infants and families …………………………………………………………………………...........................Federal TRIO programs ……………………………………………………….................................................…………..
Aid for Hispanic-serving institutions (Title V, Parts A & B)……….............................……………………………………………
Student Aid Administration ………………………………………………………...........................................................…………IDEA - Personnel preparation …………………………………………….................................................………………………English Language Acquisition …………………………………………….............................................................………………Career and technical national programs…..........................................................................................................................IDEA - Preschool grants ………………………………………………………………............................................................…
Changes in the FY 2022 Education Budget
Dollars in Billions: FY 2022 budget authorityListed in order of smallest to largest dollar change
Programs with funding increasesNew: Title I - Equity Grant….............................................................................................................................................. 20.000 20.000New: Free community college (mandatory spending) ….....................................................…........................................ 14.312 14.312New: K-12 Infrastructure (mandatory spending) …....................................................................................................... 10.000 10.000New: Completion grants (mandatory spending) …….................................................................................................... 6.200 6.200New: Institutional Aid to Improve Affordability (mandatory spending) …..................................................…................. 4.641 4.641Pell Grant - discretionary funding…................................................................................................................................ 22.475 25.475 3.000 13.3% Pell maximum grant, total including mandatory-funded portion (in actual dollars) ………...........…...……………… 6,495$ 8,370$ 1,875$ 28.9%IDEA - Grants to states…............................................................................................................................................... 12.937 15.537 2.600 20.1%New: Community College Infrastructure (mandatory spending)…............................................................................... 2.400 2.400New: Supporting In-Demand Credentials for Teachers (mandatory spending) …............................................................. 1.600 1.600New: School-based Health Professionals…….................................................................................................................... 1.000 1.000New: Expanded Career Pathways for Middle and High School Students (mandatory spending)…..................................... 1.000 1.000Full-service community schools …………………………………...............................................................................…… 0.030 0.443 0.413 1376.7%New: Teacher quality partnerships (mandatory spending)……….......................................................................................... 0.280 0.280IDEA -Grants for infants and families …………………………………………………………………………........................ 0.4819 0.732 0.250 51.9%Federal TRIO programs ……………………………………………………………….. 1.097 1.298 0.201 18.3%New: Expanding Opportunities for Teacher Leader Development (mandatory spending) ….............................................. 0.200 0.200New: Health professionals of the future (mandatory spending) ….................................................................................... 0.200 0.200Student Aid Administration ………………………………………………………...........................................................…… 1.854 2.054 0.200 10.8%IDEA - Personnel preparation …………………………………………….................................................…………………… 0.090 0.250 0.160 177.2%English Language Acquisition …………………………………………….............................................................………… 0.797 0.917 0.120 15.0%Career and technical national programs…..................................................................................................................... 0.007 0.115 0.108 1455.3%IDEA - Preschool grants ………………………………………………………………........................................................... 0.3976 0.503 0.105 26.4%Aid for Hispanic-serving institutions (Title V, Parts A & B)……….............................……………………………………… 0.163 0.266 0.103 63.4%New: Fostering Diverse Schools ……………………………………..................................................................................… 0.100 0.100New: Adult education state grants (mandatory spending)…............................................................................................ 0.100 0.100Strengthening institutions ……………………………………………………….............................................................…… 0.109 0.209 0.100 91.7%New: IDEA- Personnel preparation (mandatory spending)…..................................................................................…... 0.090 0.090Teacher quality partnerships ………………………………………......................................………………………………… 0.052 0.132 0.080 153.6%Institute of Education Sciences - Research, development, and dissemination …………………………………………… 0.198 0.268 0.070 35.4%Strengthening HBCUs …………………………………….........................................................……………...……………… 0.338 0.403 0.065 19.3%Nita M. Lowey 21st century community learning centers ….........................................…………………………………… 1.260 1.310 0.050 4.0%Program Administration ………………………………………………...................................................……………………… 0.430 0.480 0.050 11.6%Impact Aid ………………………………………………………………………..................................................................... 1.501 1.541 0.040 2.7%Child care access means parents in school ……………………….....................................................…………………… 0.055 0.095 0.040 72.7%Magnet schools assistance …………………...………………………...................................................................………… 0.109 0.149 0.040 36.7%Gaining early awareness & readiness for undergrad programs (GEAR UP)….............................................…….......... 0.368 0.408 0.040 10.9%Fund for the Improvement of Postsecondary Education ………………………………...............................................…… 0.041 0.076 0.035 85.4%School leader recruitment and support…............................................................................................................................ 0.030 0.030 100.0%New: Climate Resilient Schools .................................................................................................................................... 0.025 0.025Adult basic and literacy state grants and national activities…........................................................................................ 0.689 0.714 0.025 3.6%Career and technical state grants…............................................................................................................................... 1.335 1.355 0.020 1.5%Titie I - Special programs for migrant students (HEP/CAMP) ………………………………………………………………… 0.046 0.066 0.020 43.4%Hawkins Centers of Excellence (never funded but authorized in 2008) (also receives $40 million in mandatory funding)…..... 0.020 0.020Strengthening historically black graduate institutions ………………………................................................................... 0.087 0.102 0.015 17.2%Strengthening tribally controlled colleges and universities ……………........................................................…………… 0.038 0.053 0.015 39.4%Strengthening Asian American- & Native American Pacific Islander-serving institutions…..........................…………… 0.005 0.020 0.015 293.0%Institute of Education Sciences - Assessment ………………………………...…………………..…………………………… 0.173 0.188 0.015 8.7%Office for Civil Rights ………………………………………………………………................................................................ 0.131 0.144 0.013 9.9%School safety national activities ……………………………………………………….......................................................... 0.106 0.116 0.010 9.4%Institute of Education Sciences - Special education studies and evaluations ……………………………………………… 0.011 0.021 0.010 88.4%Strengthening HBCU masters programs ………...................……....................................................................………… 0.011 0.021 0.010 91.3%Promise neighborhoods …………………………………………………………….......................................................…… 0.081 0.091 0.010 12.3%Strengthening predominantly black institutions ……………………................................................................................ 0.014 0.023 0.009 63.3%Strengthening Native American-serving nontribal institutions ……………………….............................................……… 0.005 0.012 0.007 136.7%Strengthening Alaska Native & Native Hawaiian-serving institutions ………............................................................…… 0.019 0.025 0.006 31.5%Title II - Supporting effective instruction state grants ……………………………...........................................................… 2.143 2.149 0.006 0.3%Rural education ………………………………………………………………...................................................................…… 0.188 0.193 0.005 2.7%Minority science and engineering improvement ………………………………….............................................................. 0.013 0.018 0.005 37.4%IDEA - Technical assistance and dissemination ……………………………………......................................................... 0.044 0.049 0.005 11.3%Indian Education ……………………………………………………..................................................................................... 0.181 0.186 0.005 2.8%Supplemental education grants (Compact of Free Association Act) ……………….............................…………………… 0.017 0.020 0.003 17.7%IDEA - Parent information centers …………………………………………….......................................................………… 0.027 0.030 0.003 10.0%Transition programs for students with intellectual disabilities ….............................................................………………… 0.014 0.015 0.001 10.0%
Programs with frozen fundingTitle I - Grants to local educational agencies…..........................................................................................……………… 16.537 16.537 0.000 0.0%Title IV-A - Student support and academic enrichment grants ………….......................................................................… 1.220 1.220 0.000 0.0%Federal work-study …………………………………………………………………............................................................... 1.190 1.190 0.000 0.0%Federal supplemental educational opportunity grants (SEOG) ……...........................……………………………………… 0.880 0.880 0.000 0.0%Charter schools grants ………….....................................................................……………………...……………………… 0.440 0.440 0.000 0.0%State assessments ……………………………………………............................................................……………………… 0.378 0.378 0.000 0.0%Title I - State Agency Programs: Migrant….................................................................................................................... 0.376 0.376 0.000 0.0%Teacher and school leader incentive grants…..........................................................................…………………………… 0.200 0.200 0.000 0.0%Education innovation and research …………………...………..................................................................………………… 0.194 0.194 0.000 0.0%Title I - Comprehensive literacy development grants….................................................................................................. 0.192 0.192 0.000 0.0%Institute of Education Sciences - Statistics ………….………………………………………...............................………… 0.112 0.112 0.000 0.0%Education for homeless children and youths …………………………………..........................................................……… 0.107 0.107 0.000 0.0%Supporting effective educator development (SEED) ………...................................................................………...........… 0.080 0.080 0.000 0.0%International education and foreign language studies ……………..........................................................………………… 0.078 0.078 0.000 0.0%Institute of Education Sciences - Research in special education …………………….………………………...…………… 0.059 0.059 0.000 0.0%Regional educational laboratories ……………............................................................………….………………………… 0.057 0.057 0.000 0.0%Comprehensive centers ……………………………………...…………………................................................................... 0.052 0.052 0.000 0.0%Title I - State Agency Programs: Neglected and Delinquent…....................................................................................... 0.048 0.048 0.000 0.0%IDEA - State personnel development ………………………………........................................……………………………… 0.039 0.039 0.000 0.0%Native Hawaiian education ……………………………………………………..................................................................... 0.037 0.037 0.000 0.0%Alaska Native education …………………………………………....................................................................……………… 0.036 0.036 0.000 0.0%Institute of Education Sciences - Statewide longitudinal data systems ……………………………………………………… 0.034 0.034 0.000 0.0%Arts in education …..................................................................................................………………………………………… 0.031 0.031 0.000 0.0%IDEA -Educational technology, media, and materials …................................................................................................ 0.030 0.030 0.000 0.0%Ready to learn programming ……………………………………….………......................................................................… 0.030 0.030 0.000 0.0%Title I - Innovative approaches to literacy ……....………….............................................................……………………… 0.028 0.028 0.000 0.0%IDEA -Special Olympics education programs ………………………...........................................................……………… 0.024 0.024 0.000 0.0%Graduate assistance in areas of national need ……………................................................................…………………… 0.024 0.024 0.000 0.0%Javits gifted and talented students…...........................................................................................………………………… 0.014 0.014 0.000 0.0%Statewide family engagement centers ……………………........................................................……….…………………… 0.013 0.013 0.000 0.0%Tribally controlled postsecondary career & technical institutions ……….............................................................……… 0.011 0.011 0.000 0.0%Training and advisory services …………………………………………………………........................................................ 0.007 0.007 0.000 0.0%American history and civics academies and national activities ……………................................................................... 0.005 0.005 0.000 0.0%
Programs with decreased fundingTemporary Expanded Public Service Loan Forgiveness ….....……................................................................................ 0.050 0.025 -0.025 -50.0%
Child Care and Development Block Grant ……………………………………………………………………… 5.911 7.377 1.466 24.8%Head Start, including Early Head Start …………………………………………………………… 10.748 11.932 1.184 11.0%Preschool Development Grants ………………………………………………………………… 0.275 0.450 0.175 63.6%Museum Services Act programs………………………………………………………………………… 0.041 0.047 0.006 14.8%Library Services Technology Act ……………………………………………………………………………. 0.197 0.197 0.000 0.0%
Pres 2022 vs 2021
% change vs 2021
Department of Education selected discretionary programs and new mandatory programs:
Other related programs, not in the Department of Education
20212022
President
CEF’s FY 2022 BUDGET ANALYSIS 14
Changes in the FY 2022 Education Budget
Dollars in Billions: FY 2022 budget authorityListed in order of smallest to largest dollar change
Programs with funding increasesNew: Title I - Equity Grant….............................................................................................................................................. 20.000 20.000New: Free community college (mandatory spending) ….....................................................…........................................ 14.312 14.312New: K-12 Infrastructure (mandatory spending) …....................................................................................................... 10.000 10.000New: Completion grants (mandatory spending) …….................................................................................................... 6.200 6.200New: Institutional Aid to Improve Affordability (mandatory spending) …..................................................…................. 4.641 4.641Pell Grant - discretionary funding…................................................................................................................................ 22.475 25.475 3.000 13.3% Pell maximum grant, total including mandatory-funded portion (in actual dollars) ………...........…...……………… 6,495$ 8,370$ 1,875$ 28.9%IDEA - Grants to states…............................................................................................................................................... 12.937 15.537 2.600 20.1%New: Community College Infrastructure (mandatory spending)…............................................................................... 2.400 2.400New: Supporting In-Demand Credentials for Teachers (mandatory spending) …............................................................. 1.600 1.600New: School-based Health Professionals…….................................................................................................................... 1.000 1.000New: Expanded Career Pathways for Middle and High School Students (mandatory spending)…..................................... 1.000 1.000Full-service community schools …………………………………...............................................................................…… 0.030 0.443 0.413 1376.7%New: Teacher quality partnerships (mandatory spending)……….......................................................................................... 0.280 0.280IDEA -Grants for infants and families …………………………………………………………………………........................ 0.4819 0.732 0.250 51.9%Federal TRIO programs ……………………………………………………………….. 1.097 1.298 0.201 18.3%New: Expanding Opportunities for Teacher Leader Development (mandatory spending) ….............................................. 0.200 0.200New: Health professionals of the future (mandatory spending) ….................................................................................... 0.200 0.200Student Aid Administration ………………………………………………………...........................................................…… 1.854 2.054 0.200 10.8%IDEA - Personnel preparation …………………………………………….................................................…………………… 0.090 0.250 0.160 177.2%English Language Acquisition …………………………………………….............................................................………… 0.797 0.917 0.120 15.0%Career and technical national programs…..................................................................................................................... 0.007 0.115 0.108 1455.3%IDEA - Preschool grants ………………………………………………………………........................................................... 0.3976 0.503 0.105 26.4%Aid for Hispanic-serving institutions (Title V, Parts A & B)……….............................……………………………………… 0.163 0.266 0.103 63.4%New: Fostering Diverse Schools ……………………………………..................................................................................… 0.100 0.100New: Adult education state grants (mandatory spending)…............................................................................................ 0.100 0.100Strengthening institutions ……………………………………………………….............................................................…… 0.109 0.209 0.100 91.7%New: IDEA- Personnel preparation (mandatory spending)…..................................................................................…... 0.090 0.090Teacher quality partnerships ………………………………………......................................………………………………… 0.052 0.132 0.080 153.6%Institute of Education Sciences - Research, development, and dissemination …………………………………………… 0.198 0.268 0.070 35.4%Strengthening HBCUs …………………………………….........................................................……………...……………… 0.338 0.403 0.065 19.3%Nita M. Lowey 21st century community learning centers ….........................................…………………………………… 1.260 1.310 0.050 4.0%Program Administration ………………………………………………...................................................……………………… 0.430 0.480 0.050 11.6%Impact Aid ………………………………………………………………………..................................................................... 1.501 1.541 0.040 2.7%Child care access means parents in school ……………………….....................................................…………………… 0.055 0.095 0.040 72.7%Magnet schools assistance …………………...………………………...................................................................………… 0.109 0.149 0.040 36.7%Gaining early awareness & readiness for undergrad programs (GEAR UP)….............................................…….......... 0.368 0.408 0.040 10.9%Fund for the Improvement of Postsecondary Education ………………………………...............................................…… 0.041 0.076 0.035 85.4%School leader recruitment and support…............................................................................................................................ 0.030 0.030 100.0%New: Climate Resilient Schools .................................................................................................................................... 0.025 0.025Adult basic and literacy state grants and national activities…........................................................................................ 0.689 0.714 0.025 3.6%Career and technical state grants…............................................................................................................................... 1.335 1.355 0.020 1.5%Titie I - Special programs for migrant students (HEP/CAMP) ………………………………………………………………… 0.046 0.066 0.020 43.4%Hawkins Centers of Excellence (never funded but authorized in 2008) (also receives $40 million in mandatory funding)…..... 0.020 0.020Strengthening historically black graduate institutions ………………………................................................................... 0.087 0.102 0.015 17.2%Strengthening tribally controlled colleges and universities ……………........................................................…………… 0.038 0.053 0.015 39.4%Strengthening Asian American- & Native American Pacific Islander-serving institutions…..........................…………… 0.005 0.020 0.015 293.0%Institute of Education Sciences - Assessment ………………………………...…………………..…………………………… 0.173 0.188 0.015 8.7%Office for Civil Rights ………………………………………………………………................................................................ 0.131 0.144 0.013 9.9%School safety national activities ……………………………………………………….......................................................... 0.106 0.116 0.010 9.4%Institute of Education Sciences - Special education studies and evaluations ……………………………………………… 0.011 0.021 0.010 88.4%Strengthening HBCU masters programs ………...................……....................................................................………… 0.011 0.021 0.010 91.3%Promise neighborhoods …………………………………………………………….......................................................…… 0.081 0.091 0.010 12.3%Strengthening predominantly black institutions ……………………................................................................................ 0.014 0.023 0.009 63.3%Strengthening Native American-serving nontribal institutions ……………………….............................................……… 0.005 0.012 0.007 136.7%Strengthening Alaska Native & Native Hawaiian-serving institutions ………............................................................…… 0.019 0.025 0.006 31.5%Title II - Supporting effective instruction state grants ……………………………...........................................................… 2.143 2.149 0.006 0.3%Rural education ………………………………………………………………...................................................................…… 0.188 0.193 0.005 2.7%Minority science and engineering improvement ………………………………….............................................................. 0.013 0.018 0.005 37.4%IDEA - Technical assistance and dissemination ……………………………………......................................................... 0.044 0.049 0.005 11.3%Indian Education ……………………………………………………..................................................................................... 0.181 0.186 0.005 2.8%Supplemental education grants (Compact of Free Association Act) ……………….............................…………………… 0.017 0.020 0.003 17.7%IDEA - Parent information centers …………………………………………….......................................................………… 0.027 0.030 0.003 10.0%Transition programs for students with intellectual disabilities ….............................................................………………… 0.014 0.015 0.001 10.0%
Programs with frozen fundingTitle I - Grants to local educational agencies…..........................................................................................……………… 16.537 16.537 0.000 0.0%Title IV-A - Student support and academic enrichment grants ………….......................................................................… 1.220 1.220 0.000 0.0%Federal work-study …………………………………………………………………............................................................... 1.190 1.190 0.000 0.0%Federal supplemental educational opportunity grants (SEOG) ……...........................……………………………………… 0.880 0.880 0.000 0.0%Charter schools grants ………….....................................................................……………………...……………………… 0.440 0.440 0.000 0.0%State assessments ……………………………………………............................................................……………………… 0.378 0.378 0.000 0.0%Title I - State Agency Programs: Migrant….................................................................................................................... 0.376 0.376 0.000 0.0%Teacher and school leader incentive grants…..........................................................................…………………………… 0.200 0.200 0.000 0.0%Education innovation and research …………………...………..................................................................………………… 0.194 0.194 0.000 0.0%Title I - Comprehensive literacy development grants….................................................................................................. 0.192 0.192 0.000 0.0%Institute of Education Sciences - Statistics ………….………………………………………...............................………… 0.112 0.112 0.000 0.0%Education for homeless children and youths …………………………………..........................................................……… 0.107 0.107 0.000 0.0%Supporting effective educator development (SEED) ………...................................................................………...........… 0.080 0.080 0.000 0.0%International education and foreign language studies ……………..........................................................………………… 0.078 0.078 0.000 0.0%Institute of Education Sciences - Research in special education …………………….………………………...…………… 0.059 0.059 0.000 0.0%Regional educational laboratories ……………............................................................………….………………………… 0.057 0.057 0.000 0.0%Comprehensive centers ……………………………………...…………………................................................................... 0.052 0.052 0.000 0.0%Title I - State Agency Programs: Neglected and Delinquent…....................................................................................... 0.048 0.048 0.000 0.0%IDEA - State personnel development ………………………………........................................……………………………… 0.039 0.039 0.000 0.0%Native Hawaiian education ……………………………………………………..................................................................... 0.037 0.037 0.000 0.0%Alaska Native education …………………………………………....................................................................……………… 0.036 0.036 0.000 0.0%Institute of Education Sciences - Statewide longitudinal data systems ……………………………………………………… 0.034 0.034 0.000 0.0%Arts in education …..................................................................................................………………………………………… 0.031 0.031 0.000 0.0%IDEA -Educational technology, media, and materials …................................................................................................ 0.030 0.030 0.000 0.0%Ready to learn programming ……………………………………….………......................................................................… 0.030 0.030 0.000 0.0%Title I - Innovative approaches to literacy ……....………….............................................................……………………… 0.028 0.028 0.000 0.0%IDEA -Special Olympics education programs ………………………...........................................................……………… 0.024 0.024 0.000 0.0%Graduate assistance in areas of national need ……………................................................................…………………… 0.024 0.024 0.000 0.0%Javits gifted and talented students…...........................................................................................………………………… 0.014 0.014 0.000 0.0%Statewide family engagement centers ……………………........................................................……….…………………… 0.013 0.013 0.000 0.0%Tribally controlled postsecondary career & technical institutions ……….............................................................……… 0.011 0.011 0.000 0.0%Training and advisory services …………………………………………………………........................................................ 0.007 0.007 0.000 0.0%American history and civics academies and national activities ……………................................................................... 0.005 0.005 0.000 0.0%
Programs with decreased fundingTemporary Expanded Public Service Loan Forgiveness ….....……................................................................................ 0.050 0.025 -0.025 -50.0%
Child Care and Development Block Grant ……………………………………………………………………… 5.911 7.377 1.466 24.8%Head Start, including Early Head Start …………………………………………………………… 10.748 11.932 1.184 11.0%Preschool Development Grants ………………………………………………………………… 0.275 0.450 0.175 63.6%Museum Services Act programs………………………………………………………………………… 0.041 0.047 0.006 14.8%Library Services Technology Act ……………………………………………………………………………. 0.197 0.197 0.000 0.0%
Pres 2022 vs 2021
% change vs 2021
Department of Education selected discretionary programs and new mandatory programs:
Other related programs, not in the Department of Education
20212022
President
Changes in the FY 2022 Education Budget, continued
Changes in the FY 2022 Education Budget Dollars in Billions: FY 2022 budget authorityListed in order of smallest to largest dollar change
Programs with funding increases20.000 20.00014.312 14.31210.000 10.000
6.200 6.2004.641 4.641
22.475 25.475 3.000 13.3%6,495$ 8,370$ 1,875$ 28.9%12.937 15.537 2.600 20.1%
2.400 2.4001.600 1.6001.000 1.0001.000 1.000
0.030 0.443 0.413 1376.7%0.280 0.280
0.4819 0.732 0.250 51.9%1.097 1.298 0.201 18.3%
0.200 0.2000.200 0.200
1.854 2.054 0.200 10.8%0.090 0.250 0.160 177.2%0.797 0.917 0.120 15.0%0.007 0.115 0.108 1455.3%
0.3976 0.503 0.105 26.4%0.163 0.266 0.103 63.4%
0.100 0.1000.100 0.100
0.109 0.209 0.100 91.7%0.090 0.090
0.052 0.132 0.080 153.6%0.198 0.268 0.070 35.4%0.338 0.403 0.065 19.3%1.260 1.310 0.050 4.0%0.430 0.480 0.050 11.6%1.501 1.541 0.040 2.7%0.055 0.095 0.040 72.7%0.109 0.149 0.040 36.7%0.368 0.408 0.040 10.9%0.041 0.076 0.035 85.4%
0.030 0.030 100.0%0.025 0.025
0.689 0.714 0.025 3.6%1.335 1.355 0.020 1.5%0.046 0.066 0.020 43.4%
0.020 0.0200.087 0.102 0.015 17.2%0.038 0.053 0.015 39.4%0.005 0.020 0.015 293.0%0.173 0.188 0.015 8.7%0.131 0.144 0.013 9.9%0.106 0.116 0.010 9.4%0.011 0.021 0.010 88.4%0.011 0.021 0.010 91.3%0.081 0.091 0.010 12.3%0.014 0.023 0.009 63.3%0.005 0.012 0.007 136.7%0.019 0.025 0.006 31.5%2.143 2.149 0.006 0.3%0.188 0.193 0.005 2.7%0.013 0.018 0.005 37.4%0.044 0.049 0.005 11.3%0.181 0.186 0.005 2.8%0.017 0.020 0.003 17.7%0.027 0.030 0.003 10.0%0.014 0.015 0.001 10.0%
Programs with frozen funding16.537 16.537 0.000 0.0%
1.220 1.220 0.000 0.0%1.190 1.190 0.000 0.0%0.880 0.880 0.000 0.0%0.440 0.440 0.000 0.0%0.378 0.378 0.000 0.0%0.376 0.376 0.000 0.0%0.200 0.200 0.000 0.0%0.194 0.194 0.000 0.0%0.192 0.192 0.000 0.0%0.112 0.112 0.000 0.0%0.107 0.107 0.000 0.0%0.080 0.080 0.000 0.0%0.078 0.078 0.000 0.0%0.059 0.059 0.000 0.0%0.057 0.057 0.000 0.0%0.052 0.052 0.000 0.0%0.048 0.048 0.000 0.0%0.039 0.039 0.000 0.0%0.037 0.037 0.000 0.0%0.036 0.036 0.000 0.0%0.034 0.034 0.000 0.0%0.031 0.031 0.000 0.0%0.030 0.030 0.000 0.0%0.030 0.030 0.000 0.0%0.028 0.028 0.000 0.0%0.024 0.024 0.000 0.0%0.024 0.024 0.000 0.0%0.014 0.014 0.000 0.0%0.013 0.013 0.000 0.0%0.011 0.011 0.000 0.0%0.007 0.007 0.000 0.0%0.005 0.005 0.000 0.0%
Programs with decreased funding0.050 0.025 -0.025 -50.0%
5.911 7.377 1.466 24.8%10.748 11.932 1.184 11.0%
0.275 0.450 0.175 63.6%0.041 0.047 0.006 14.8%0.197 0.197 0.000 0.0%
Preschool Development Grants …………………………………………………....................................…………………Museum Services Act programs…………………………………………….........................………………………………Library Services Technology Act ……………………………………………..................………………………………….
Training and advisory services ………………………………………………………….........................................................……American history and civics academies and national activities ……………............................................................................
Temporary Expanded Public Service Loan Forgiveness ….....…….......................................................................................
Child Care and Development Block Grant …………………………………………………………….............……………Head Start, including Early Head Start ………………………………………………………................................………
IDEA -Special Olympics education programs ………………………...........................................................……………………Graduate assistance in areas of national need ……………................................................................…………………………Javits gifted and talented students…...........................................................................................…………………………..Statewide family engagement centers ……………………........................................................……….…………………….Tribally controlled postsecondary career & technical institutions ……….............................................................………………
Institute of Education Sciences - Statewide longitudinal data systems …………………………………………………………Arts in education …..................................................................................................………………………………………………IDEA -Educational technology, media, and materials …....................................................................................................Ready to learn programming ……………………………………….………......................................................................………Title I - Innovative approaches to literacy ……....………….............................................................……………………………
Comprehensive centers ……………………………………...…………………......................................................................…Title I - State Agency Programs: Neglected and Delinquent….............................................................................................IDEA - State personnel development ………………………………........................................…………………………………Native Hawaiian education …………………………………………………….........................................................................…Alaska Native education …………………………………………....................................................................…………………
Education for homeless children and youths …………………………………..........................................................…………Supporting effective educator development (SEED) ………...................................................................………...........………International education and foreign language studies ……………..........................................................………………………Institute of Education Sciences - Research in special education …………………….………………………...………………Regional educational laboratories ……………............................................................………….………………………
Education innovation and research …………………...………..................................................................……………………Title I - Comprehensive literacy development grants…........................................................................................................ Institute of Education Sciences - Statistics ………….………………………………………...............................………………
Federal supplemental educational opportunity grants (SEOG) ……...........................…………………………………………Charter schools grants ………….....................................................................……………………...……………………………State assessments ……………………………………………............................................................……………………………Title I - State Agency Programs: Migrant…........................................................................................................................Teacher and school leader incentive grants…..........................................................................…………………………………
IDEA - Parent information centers …………………………………………….......................................................………………Transition programs for students with intellectual disabilities ….............................................................………………………
Title I - Grants to local educational agencies…..........................................................................................……………………Title IV-A - Student support and academic enrichment grants ………….......................................................................…....…Federal work-study ………………………………………………………………….................................................................…
Rural education ………………………………………………………………...................................................................………Minority science and engineering improvement …………………………………....................................................................…IDEA - Technical assistance and dissemination ……………………………………..............................................................…Indian Education ……………………………………………………........................................................................................…Supplemental education grants (Compact of Free Association Act) ……………….............................…………………………
Promise neighborhoods …………………………………………………………….......................................................…………Strengthening predominantly black institutions ……………………...................................................................................……Strengthening Native American-serving nontribal institutions ……………………….............................................……………Strengthening Alaska Native & Native Hawaiian-serving institutions ………............................................................…………Title II - Supporting effective instruction state grants ……………………………...........................................................………
Institute of Education Sciences - Assessment ………………………………...…………………..………………………………Office for Civil Rights ………………………………………………………………...................................................................…School safety national activities ………………………………………………………................................................................Institute of Education Sciences - Special education studies and evaluations …………………………………………………Strengthening HBCU masters programs ………...................……....................................................................…………….…
Titie I - Special programs for migrant students (HEP/CAMP) ……………………………………………………………………Hawkins Centers of Excellence (never funded but authorized in 2008-also receives $40 million in mandatory funding)…....Strengthening historically black graduate institutions ………………………........................................................................…Strengthening tribally controlled colleges and universities ……………........................................................……………………Strengthening Asian American- & Native American Pacific Islander-serving institutions…..........................…………………
Fund for the Improvement of Postsecondary Education ………………………………...............................................……….School leader recruitment and support…............................................................................................................................ New: Climate Resilient Schools ....................................................................................................................................Adult basic and literacy state grants and national activities…..................................................................................................Career and technical state grants….........................................................................................................................................
Impact Aid ………………………………………………………………………........................................................................…Child care access means parents in school ……………………….....................................................…………………………Magnet schools assistance …………………...………………………...................................................................……………Gaining early awareness & readiness for undergrad programs (GEAR UP)….............................................……..........
Institute of Education Sciences - Research, development, and dissemination …………………………………………………Strengthening HBCUs …………………………………….........................................................……………...…………………Nita M. Lowey 21st century community learning centers ….........................................…………………………………………Program Administration ………………………………………………...................................................…………………………
New: Fostering Diverse Schools ……………………………………..................................................................................…New: Adult education state grants (mandatory spending)…............................................................................................Strengthening institutions ……………………………………………………….............................................................…………New: IDEA- Personnel preparation (mandatory spending)…..................................................................................…...Teacher quality partnerships ………………………………………......................................……………………………………
Pres 2022 vs 2021
% change vs 2021
Department of Education selected discretionary programs and new mandatory programs:
Other related programs, not in the Department of Education
2021 2022 President
New: Title I - Equity Grant…................................................................................................................................................New: Free community college (mandatory spending) ….....................................................….............................................New: K-12 Infrastructure (mandatory spending) ….......................................................................................................New: Completion grants (mandatory spending) ……....................................................................................................New: Institutional Aid to Improve Affordability (mandatory spending) …..................................................….................
New: Community College Infrastructure (mandatory spending)…...............................................................................New: Supporting In-Demand Credentials for Teachers (mandatory spending) ….............................................................New: School-based Health Professionals……....................................................................................................................
Pell Grant - discretionary funding….................................................................................................................................... Pell maximum grant, total including mandatory-funded portion (in actual dollars) ………...........…...…………………IDEA - Grants to states….......................................................................................................................................................
New: Expanding Opportunities for Teacher Leader Development (mandatory spending) …..............................................New: Health professionals of the future (mandatory spending) …....................................................................................
New: Expanded Career Pathways for Middle and High School Students (mandatory spending)….....................................Full-service community schools …………………………………...............................................................................…………New: Teacher quality partnerships (mandatory spending)………..........................................................................................IDEA - Grants for infants and families …………………………………………………………………………...........................Federal TRIO programs ……………………………………………………….................................................…………..
Aid for Hispanic-serving institutions (Title V, Parts A & B)……….............................……………………………………………
Student Aid Administration ………………………………………………………...........................................................…………IDEA - Personnel preparation …………………………………………….................................................………………………English Language Acquisition …………………………………………….............................................................………………Career and technical national programs…..........................................................................................................................IDEA - Preschool grants ………………………………………………………………............................................................…
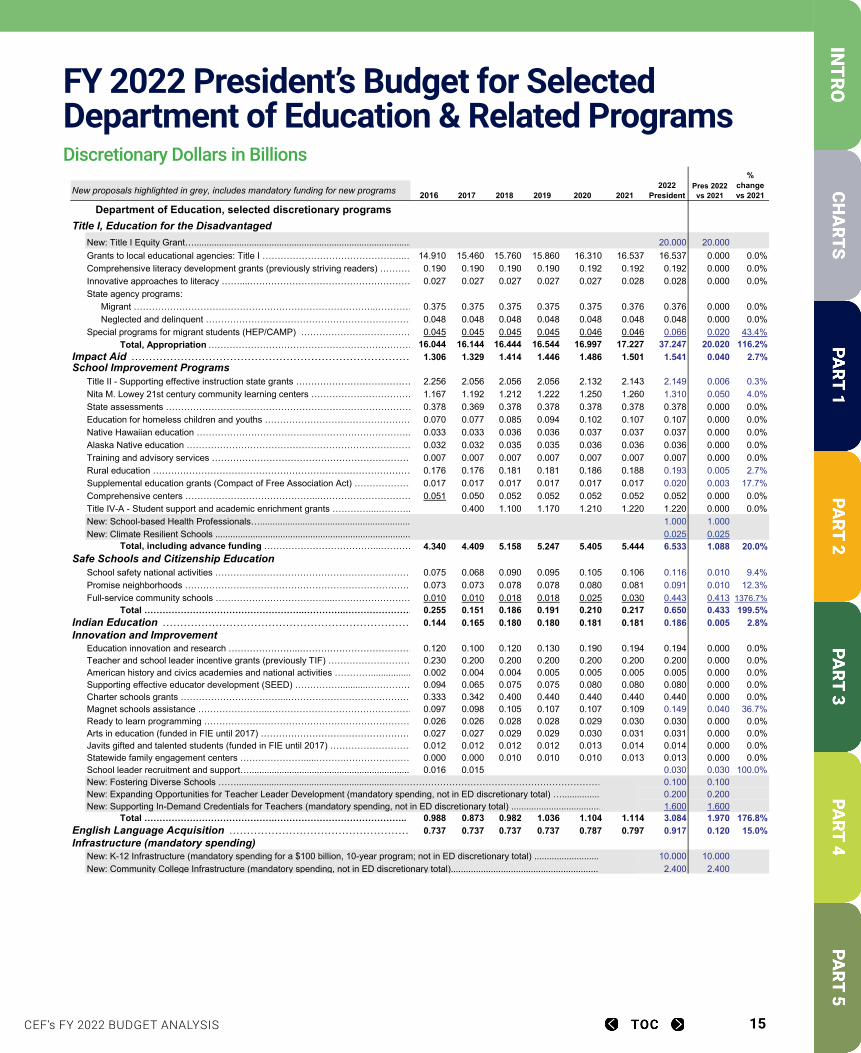
CEF’s FY 2022 BUDGET ANALYSIS 15
FY 2022 President’s Budget for Selected Department of Education & Related Programs
Title I, Education for the Disadvantaged20.000 20.000
14.910 15.460 15.760 15.860 16.310 16.537 16.537 0.000 0.0%0.190 0.190 0.190 0.190 0.192 0.192 0.192 0.000 0.0%0.027 0.027 0.027 0.027 0.027 0.028 0.028 0.000 0.0%
0.375 0.375 0.375 0.375 0.375 0.376 0.376 0.000 0.0%0.048 0.048 0.048 0.048 0.048 0.048 0.048 0.000 0.0%0.045 0.045 0.045 0.045 0.046 0.046 0.066 0.020 43.4%
16.044 16.144 16.444 16.544 16.997 17.227 37.247 20.020 116.2%1.306 1.329 1.414 1.446 1.486 1.501 1.541 0.040 2.7%
2.256 2.056 2.056 2.056 2.132 2.143 2.149 0.006 0.3%1.167 1.192 1.212 1.222 1.250 1.260 1.310 0.050 4.0%0.378 0.369 0.378 0.378 0.378 0.378 0.378 0.000 0.0%0.070 0.077 0.085 0.094 0.102 0.107 0.107 0.000 0.0%0.033 0.033 0.036 0.036 0.037 0.037 0.037 0.000 0.0%0.032 0.032 0.035 0.035 0.036 0.036 0.036 0.000 0.0%0.007 0.007 0.007 0.007 0.007 0.007 0.007 0.000 0.0%0.176 0.176 0.181 0.181 0.186 0.188 0.193 0.005 2.7%0.017 0.017 0.017 0.017 0.017 0.017 0.020 0.003 17.7%0.051 0.050 0.052 0.052 0.052 0.052 0.052 0.000 0.0%
0.400 1.100 1.170 1.210 1.220 1.220 0.000 0.0%1.000 1.0000.025 0.025
Total, including advance funding ………………………………...………… 4.340 4.409 5.158 5.247 5.405 5.444 6.533 1.088 20.0%Safe Schools and Citizenship Education
0.075 0.068 0.090 0.095 0.105 0.106 0.116 0.010 9.4%0.073 0.073 0.078 0.078 0.080 0.081 0.091 0.010 12.3%0.010 0.010 0.018 0.018 0.025 0.030 0.443 0.413 1376.7%
Total ……………………………………………..…………..…………………… 0.255 0.151 0.186 0.191 0.210 0.217 0.650 0.433 199.5%0.144 0.165 0.180 0.180 0.181 0.181 0.186 0.005 2.8%
0.120 0.100 0.120 0.130 0.190 0.194 0.194 0.000 0.0%0.230 0.200 0.200 0.200 0.200 0.200 0.200 0.000 0.0%0.002 0.004 0.004 0.005 0.005 0.005 0.005 0.000 0.0%0.094 0.065 0.075 0.075 0.080 0.080 0.080 0.000 0.0%0.333 0.342 0.400 0.440 0.440 0.440 0.440 0.000 0.0%0.097 0.098 0.105 0.107 0.107 0.109 0.149 0.040 36.7%0.026 0.026 0.028 0.028 0.029 0.030 0.030 0.000 0.0%0.027 0.027 0.029 0.029 0.030 0.031 0.031 0.000 0.0%0.012 0.012 0.012 0.012 0.013 0.014 0.014 0.000 0.0%0.000 0.000 0.010 0.010 0.010 0.013 0.013 0.000 0.0%0.016 0.015 0.030 0.030 100.0%
0.100 0.1000.200 0.2001.600 1.600
Total …………………………………….…………………………………….. 0.988 0.873 0.982 1.036 1.104 1.114 3.084 1.970 176.8%0.737 0.737 0.737 0.737 0.787 0.797 0.917 0.120 15.0%
Infrastructure (mandatory spending)10.000 10.0002.400 2.400
Special Education (Individuals with Disabilities Education Act)State grants:
11.913 12.003 12.278 12.364 12.764 12.937 15.537 2.600 20.1%0.368 0.368 0.381 0.391 0.394 0.3976 0.503 0.105 26.4%0.459 0.459 0.470 0.470 0.477 0.4819 0.732 0.250 51.9%
12.740 12.830 13.129 13.225 13.636 13.817 16.772 2.955 21.4%0.042 0.039 0.039 0.039 0.039 0.039 0.039 0.000 0.0%0.044 0.044 0.044 0.044 0.044 0.044 0.049 0.005 11.3%0.010 0.013 0.016 0.018 0.020 0.024 0.024 0.000 0.0%0.084 0.084 0.084 0.087 0.090 0.090 0.250 0.160 177.2%
0.090 0.0900.027 0.027 0.027 0.027 0.027 0.027 0.030 0.003 10.0%0.030 0.028 0.028 0.028 0.030 0.030 0.030 0.000 0.0%
Total, Appropriation….............................................................................. 12.959 13.064 13.366 13.469 13.885 14.071 17.283 3.213 22.8%Career and technical education
1.118 1.118 1.193 1.263 1.283 1.335 1.355 0.020 1.5%0.007 0.007 0.007 0.007 0.007 0.007 0.115 0.108 1455.3%
1.000 1.000Adult Education
Adult basic and literacy state grants and national activities 0.596 0.596 0.631 0.656 0.671 0.689 0.714 0.025 3.6%0.100 0.100
Department of Education, selected discretionary programs
President's FY 2022 Request for Selected Department of Education & Related ProgramsDollars in Billions
2016 2017 2018 2019 2020 20212022
PresidentPres 2022 vs 2021
% change vs 2021New proposals highlighted in grey, includes mandatory funding for new programs
New: Title I Equity Grant….......................................................................................
Migrant ……………………………………………………………………..…………Neglected and delinquent ……………………………………………………………
Special programs for migrant students (HEP/CAMP) ………………………………Total, Appropriation ……………………………………………………………
Impact Aid ………………………………………………………………………
Grants to local educational agencies: Title I ………………………………………..…Comprehensive literacy development grants (previously striving readers) …………Innovative approaches to literacy ……....………………………………………………State agency programs:
Education for homeless children and youths …………………………………………Native Hawaiian education ……………………………………………………………..Alaska Native education …………………………………………………………………Training and advisory services …………………………………………………………Rural education ……………………………………………………………………………
School Improvement ProgramsTitle II - Supporting effective instruction state grants …………………………………Nita M. Lowey 21st century community learning centers ……………………………State assessments ………………………………………………………………………
School safety national activities …………………………………………………………Promise neighborhoods …………………………………………………………………Full-service community schools ………………………………....………………………
Supplemental education grants (Compact of Free Association Act) …………………Comprehensive centers ……………………………………...…………………………Title IV-A - Student support and academic enrichment grants …………....………..New: School-based Health Professionals…............................................................New: Climate Resilient Schools ..............................................................................
Supporting effective educator development (SEED) ……………...........……………Charter schools grants ……………………………...……………………………………Magnet schools assistance …………………...…………………………………………Ready to learn programming ……………………………………….……………………
Indian Education ………………………………………………………………Innovation and Improvement
Education innovation and research …………………...…………………………………Teacher and school leader incentive grants (previously TIF) ………………………American history and civics academies and national activities …………................
New: Fostering Diverse Schools ……..............................................................……………………………………………………………New: Expanding Opportunities for Teacher Leader Development (mandatory spending, not in ED discretionary total) ….................New: Supporting In-Demand Credentials for Teachers (mandatory spending, not in ED discretionary total) .....................................
English Language Acquisition ………………………………………………
New: K-12 Infrastructure (mandatory spending for a $100 billion, 10-year program; not in ED discretionary total) ............................
Arts in education (funded in FIE until 2017) ……………………………………………Javits gifted and talented students (funded in FIE until 2017) ………………………Statewide family engagement centers ………………….....……….…………………School leader recruitment and support….................................................................
State personnel development ……………………………………………………………Technical assistance and dissemination ………………………………………………Special Olympics education programs …………………………………………………Personnel preparation ……………………………………………………………………New: Personnel preparation (mandatory spending, not in ED discretionary total)……......................................................................
New: Community College Infrastructure (mandatory spending, not in ED discretionary total)............................................................
Grants to states ………………………………………………………………………Preschool grants ………………………………………………………………………Grants for infants and families ………………………………………………………
Subtotal, State grants ……………………………………………………
New: Adult education state grants (mandatory spending, not in ED discretionary total)….................................................................
Parent information centers ………………………………………………………………Educational technology, media, and materials …....................................................
State grants…..........................................................................................................National programs…................................................................................................New: Expanded Career Pathways for Middle and High School Students (mandatory spending, not in ED discretionary total)…......
Discretionary Dollars in Billions
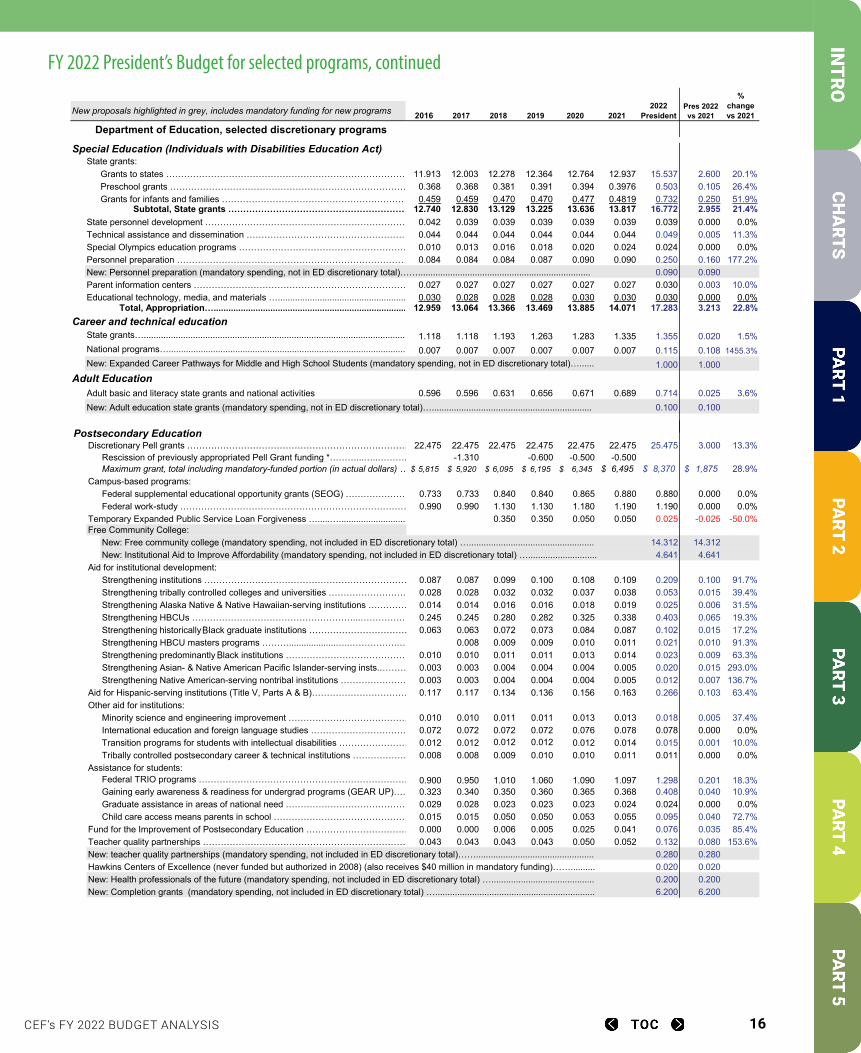
CEF’s FY 2022 BUDGET ANALYSIS 16
FY 2022 President’s Budget for selected programs, continued
Title I, Education for the Disadvantaged20.000 20.000
14.910 15.460 15.760 15.860 16.310 16.537 16.537 0.000 0.0%0.190 0.190 0.190 0.190 0.192 0.192 0.192 0.000 0.0%0.027 0.027 0.027 0.027 0.027 0.028 0.028 0.000 0.0%
0.375 0.375 0.375 0.375 0.375 0.376 0.376 0.000 0.0%0.048 0.048 0.048 0.048 0.048 0.048 0.048 0.000 0.0%0.045 0.045 0.045 0.045 0.046 0.046 0.066 0.020 43.4%
16.044 16.144 16.444 16.544 16.997 17.227 37.247 20.020 116.2%1.306 1.329 1.414 1.446 1.486 1.501 1.541 0.040 2.7%
2.256 2.056 2.056 2.056 2.132 2.143 2.149 0.006 0.3%1.167 1.192 1.212 1.222 1.250 1.260 1.310 0.050 4.0%0.378 0.369 0.378 0.378 0.378 0.378 0.378 0.000 0.0%0.070 0.077 0.085 0.094 0.102 0.107 0.107 0.000 0.0%0.033 0.033 0.036 0.036 0.037 0.037 0.037 0.000 0.0%0.032 0.032 0.035 0.035 0.036 0.036 0.036 0.000 0.0%0.007 0.007 0.007 0.007 0.007 0.007 0.007 0.000 0.0%0.176 0.176 0.181 0.181 0.186 0.188 0.193 0.005 2.7%0.017 0.017 0.017 0.017 0.017 0.017 0.020 0.003 17.7%0.051 0.050 0.052 0.052 0.052 0.052 0.052 0.000 0.0%
0.400 1.100 1.170 1.210 1.220 1.220 0.000 0.0%1.000 1.0000.025 0.025
Total, including advance funding ………………………………...………… 4.340 4.409 5.158 5.247 5.405 5.444 6.533 1.088 20.0%Safe Schools and Citizenship Education
0.075 0.068 0.090 0.095 0.105 0.106 0.116 0.010 9.4%0.073 0.073 0.078 0.078 0.080 0.081 0.091 0.010 12.3%0.010 0.010 0.018 0.018 0.025 0.030 0.443 0.413 1376.7%
Total ……………………………………………..…………..…………………… 0.255 0.151 0.186 0.191 0.210 0.217 0.650 0.433 199.5%0.144 0.165 0.180 0.180 0.181 0.181 0.186 0.005 2.8%
0.120 0.100 0.120 0.130 0.190 0.194 0.194 0.000 0.0%0.230 0.200 0.200 0.200 0.200 0.200 0.200 0.000 0.0%0.002 0.004 0.004 0.005 0.005 0.005 0.005 0.000 0.0%0.094 0.065 0.075 0.075 0.080 0.080 0.080 0.000 0.0%0.333 0.342 0.400 0.440 0.440 0.440 0.440 0.000 0.0%0.097 0.098 0.105 0.107 0.107 0.109 0.149 0.040 36.7%0.026 0.026 0.028 0.028 0.029 0.030 0.030 0.000 0.0%0.027 0.027 0.029 0.029 0.030 0.031 0.031 0.000 0.0%0.012 0.012 0.012 0.012 0.013 0.014 0.014 0.000 0.0%0.000 0.000 0.010 0.010 0.010 0.013 0.013 0.000 0.0%0.016 0.015 0.030 0.030 100.0%
0.100 0.1000.200 0.2001.600 1.600
Total …………………………………….…………………………………….. 0.988 0.873 0.982 1.036 1.104 1.114 3.084 1.970 176.8%0.737 0.737 0.737 0.737 0.787 0.797 0.917 0.120 15.0%
Infrastructure (mandatory spending)10.000 10.0002.400 2.400
Special Education (Individuals with Disabilities Education Act)State grants:
11.913 12.003 12.278 12.364 12.764 12.937 15.537 2.600 20.1%0.368 0.368 0.381 0.391 0.394 0.3976 0.503 0.105 26.4%0.459 0.459 0.470 0.470 0.477 0.4819 0.732 0.250 51.9%
12.740 12.830 13.129 13.225 13.636 13.817 16.772 2.955 21.4%0.042 0.039 0.039 0.039 0.039 0.039 0.039 0.000 0.0%0.044 0.044 0.044 0.044 0.044 0.044 0.049 0.005 11.3%0.010 0.013 0.016 0.018 0.020 0.024 0.024 0.000 0.0%0.084 0.084 0.084 0.087 0.090 0.090 0.250 0.160 177.2%
0.090 0.0900.027 0.027 0.027 0.027 0.027 0.027 0.030 0.003 10.0%0.030 0.028 0.028 0.028 0.030 0.030 0.030 0.000 0.0%
Total, Appropriation….............................................................................. 12.959 13.064 13.366 13.469 13.885 14.071 17.283 3.213 22.8%Career and technical education
1.118 1.118 1.193 1.263 1.283 1.335 1.355 0.020 1.5%0.007 0.007 0.007 0.007 0.007 0.007 0.115 0.108 1455.3%
1.000 1.000Adult Education
Adult basic and literacy state grants and national activities 0.596 0.596 0.631 0.656 0.671 0.689 0.714 0.025 3.6%0.100 0.100
Department of Education, selected discretionary programs
President's FY 2022 Request for Selected Department of Education & Related ProgramsDollars in Billions
2016 2017 2018 2019 2020 20212022
PresidentPres 2022 vs 2021
% change vs 2021New proposals highlighted in grey, includes mandatory funding for new programs
New: Title I Equity Grant….......................................................................................
Migrant ……………………………………………………………………..…………Neglected and delinquent ……………………………………………………………
Special programs for migrant students (HEP/CAMP) ………………………………Total, Appropriation ……………………………………………………………
Impact Aid ………………………………………………………………………
Grants to local educational agencies: Title I ………………………………………..…Comprehensive literacy development grants (previously striving readers) …………Innovative approaches to literacy ……....………………………………………………State agency programs:
Education for homeless children and youths …………………………………………Native Hawaiian education ……………………………………………………………..Alaska Native education …………………………………………………………………Training and advisory services …………………………………………………………Rural education ……………………………………………………………………………
School Improvement ProgramsTitle II - Supporting effective instruction state grants …………………………………Nita M. Lowey 21st century community learning centers ……………………………State assessments ………………………………………………………………………
School safety national activities …………………………………………………………Promise neighborhoods …………………………………………………………………Full-service community schools ………………………………....………………………
Supplemental education grants (Compact of Free Association Act) …………………Comprehensive centers ……………………………………...…………………………Title IV-A - Student support and academic enrichment grants …………....………..New: School-based Health Professionals…............................................................New: Climate Resilient Schools ..............................................................................
Supporting effective educator development (SEED) ……………...........……………Charter schools grants ……………………………...……………………………………Magnet schools assistance …………………...…………………………………………Ready to learn programming ……………………………………….……………………
Indian Education ………………………………………………………………Innovation and Improvement
Education innovation and research …………………...…………………………………Teacher and school leader incentive grants (previously TIF) ………………………American history and civics academies and national activities …………................
New: Fostering Diverse Schools ……..............................................................……………………………………………………………New: Expanding Opportunities for Teacher Leader Development (mandatory spending, not in ED discretionary total) ….................New: Supporting In-Demand Credentials for Teachers (mandatory spending, not in ED discretionary total) .....................................
English Language Acquisition ………………………………………………
New: K-12 Infrastructure (mandatory spending for a $100 billion, 10-year program; not in ED discretionary total) ............................
Arts in education (funded in FIE until 2017) ……………………………………………Javits gifted and talented students (funded in FIE until 2017) ………………………Statewide family engagement centers ………………….....……….…………………School leader recruitment and support….................................................................
State personnel development ……………………………………………………………Technical assistance and dissemination ………………………………………………Special Olympics education programs …………………………………………………Personnel preparation ……………………………………………………………………New: Personnel preparation (mandatory spending, not in ED discretionary total)……......................................................................
New: Community College Infrastructure (mandatory spending, not in ED discretionary total)............................................................
Grants to states ………………………………………………………………………Preschool grants ………………………………………………………………………Grants for infants and families ………………………………………………………
Subtotal, State grants ……………………………………………………
New: Adult education state grants (mandatory spending, not in ED discretionary total)….................................................................
Parent information centers ………………………………………………………………Educational technology, media, and materials …....................................................
State grants…..........................................................................................................National programs…................................................................................................New: Expanded Career Pathways for Middle and High School Students (mandatory spending, not in ED discretionary total)…......
2
President's FY 2022 Request for Selected Department of Education & Related ProgramsDollars in Billions
2016 2017 2018 2019 2020 20212022
PresidentPres 2022 vs 2021
% change vs 2021New proposals highlighted in grey, includes mandatory funding for new programs
Postsecondary Education22.475 22.475 22.475 22.475 22.475 22.475 25.475 3.000 13.3%
-1.310 -0.600 -0.500 -0.5005,815$ 5,920$ 6,095$ 6,195$ 6,345$ 6,495$ 8,370$ 1,875$ 28.9%
Campus-based programs:0.733 0.733 0.840 0.840 0.865 0.880 0.880 0.000 0.0%0.990 0.990 1.130 1.130 1.180 1.190 1.190 0.000 0.0%
0.350 0.350 0.050 0.050 0.025 -0.025 -50.0%Free Community College:
14.312 14.3124.641 4.641
Aid for institutional development:0.087 0.087 0.099 0.100 0.108 0.109 0.209 0.100 91.7%0.028 0.028 0.032 0.032 0.037 0.038 0.053 0.015 39.4%0.014 0.014 0.016 0.016 0.018 0.019 0.025 0.006 31.5%0.245 0.245 0.280 0.282 0.325 0.338 0.403 0.065 19.3%0.063 0.063 0.072 0.073 0.084 0.087 0.102 0.015 17.2%
0.008 0.009 0.009 0.010 0.011 0.021 0.010 91.3%0.010 0.010 0.011 0.011 0.013 0.014 0.023 0.009 63.3%0.003 0.003 0.004 0.004 0.004 0.005 0.020 0.015 293.0%0.003 0.003 0.004 0.004 0.004 0.005 0.012 0.007 136.7%0.117 0.117 0.134 0.136 0.156 0.163 0.266 0.103 63.4%
Other aid for institutions:0.010 0.010 0.011 0.011 0.013 0.013 0.018 0.005 37.4%0.072 0.072 0.072 0.072 0.076 0.078 0.078 0.000 0.0%0.012 0.012 0.012 0.012 0.012 0.014 0.015 0.001 10.0%0.008 0.008 0.009 0.010 0.010 0.011 0.011 0.000 0.0%
Assistance for students:0.900 0.950 1.010 1.060 1.090 1.097 1.298 0.201 18.3%0.323 0.340 0.350 0.360 0.365 0.368 0.408 0.040 10.9%0.029 0.028 0.023 0.023 0.023 0.024 0.024 0.000 0.0%0.015 0.015 0.050 0.050 0.053 0.055 0.095 0.040 72.7%0.000 0.000 0.006 0.005 0.025 0.041 0.076 0.035 85.4%0.043 0.043 0.043 0.043 0.050 0.052 0.132 0.080 153.6%
0.280 0.2800.020 0.0200.200 0.2006.200 6.200
Institute of Education SciencesResearch and statistics:
0.195 0.188 0.193 0.193 0.196 0.198 0.268 0.070 35.4%0.112 0.110 0.110 0.110 0.111 0.112 0.112 0.000 0.0%0.054 0.054 0.055 0.055 0.056 0.057 0.057 0.000 0.0%0.157 0.157 0.157 0.159 0.161 0.173 0.188 0.015 8.7%0.054 0.054 0.056 0.056 0.057 0.059 0.059 0.000 0.0%0.035 0.032 0.032 0.032 0.033 0.034 0.034 0.000 0.0%0.011 0.011 0.011 0.011 0.011 0.011 0.021 0.010 88.4%
Total …………………………………………………………………………… 0.618 0.605 0.613 0.615 0.623 0.642 0.737 0.095 14.8%0.432 0.432 0.430 0.430 0.430 0.430 0.480 0.050 11.6%1.552 1.577 1.679 1.679 1.769 1.854 2.054 0.200 10.8%0.107 0.109 0.117 0.125 0.130 0.131 0.144 0.013 9.9%
DISCRETIONARY APPROPRIATION* 68.306 *66.929 70.867 *70.848 *72.251 *73.037 102.823 29.786 40.8%DISCRETIONARY TOTAL EXCLUDING PELL GRANTS 45.581 45.764 48.392 48.973 50.276 51.062 77.348 26.286 36.0%
9.168 9.253 9.863 10.083 10.613 10.748 11.932 1.184 11.0%2.761 2.856 5.226 5.288 5.826 5.911 7.377 1.466 24.8%0.250 0.250 0.250 0.248 0.275 0.275 0.450 0.175 63.6%0.183 0.184 0.189 0.189 0.195 0.197 0.197 0.000 0.0%0.031 0.032 0.035 0.035 0.039 0.041 0.047 0.006 14.8%
* 2017, 2019, 2020, and 2021 totals reflect rescissions of previously appropriated funding for Pell Grants.
Other related programs, not in the Department of Education
Discretionary Pell grants …………………………………………………………………Rescission of previously appropriated Pell Grant funding *………...…..……….Maximum grant, total including mandatory-funded portion (in actual dollars) …
Federal supplemental educational opportunity grants (SEOG) …………………
Strengthening tribally controlled colleges and universities ………………………Strengthening Alaska Native & Native Hawaiian-serving institutions ……………Strengthening HBCUs ………………………………………………...………………Strengthening historically black graduate institutions ……………………………Strengthening HBCU masters programs ………...................…..…………….…
Federal work-study ……………………………………………………………………Temporary Expanded Public Service Loan Forgiveness ….....…............................
New: Free community college (mandatory spending, not included in ED discretionary total) …...................................................New: Institutional Aid to Improve Affordability (mandatory spending, not included in ED discretionary total) …............................
Strengthening institutions ……………………………………………………………
International education and foreign language studies ……………………………Transition programs for students with intellectual disabilities ……………………Tribally controlled postsecondary career & technical institutions ………………
Federal TRIO programs ………………………………………………………………Gaining early awareness & readiness for undergrad programs (GEAR UP)……
Strengthening predominantly black institutions ……………………………………Strengthening Asian- & Native American Pacific Islander-serving insts.………Strengthening Native American-serving nontribal institutions ……………………
Aid for Hispanic-serving institutions (Title V, Parts A & B)……………………………
Minority science and engineering improvement ……………………………………
Hawkins Centers of Excellence (never funded but authorized in 2008) (also receives $40 million in mandatory funding)……..........New: Health professionals of the future (mandatory spending, not included in ED discretionary total) …..........................................New: Completion grants (mandatory spending, not included in ED discretionary total) ….................................................................
Research, development, and dissemination ………………………………………Statistics ………….……………………………………………………………………
Graduate assistance in areas of national need ……………………………………Child care access means parents in school ………………………………………
Fund for the Improvement of Postsecondary Education ………………………………Teacher quality partnerships ……………………………………………………………New: teacher quality partnerships (mandatory spending, not included in ED discretionary total)……................................................
Preschool Development Grants ……………………………………………Library Services Technology Act …………………………………………Museum Services Act programs ……………………………………………
Program Administration ……………………………………………………Student Aid Administration …………………………………………………Office for Civil Rights …………………………………………………………
Head Start, including Early Head Start ……………………………………Child Care and Development Block Grant ………………………………
Regional educational laboratories …………………….…………………………………Assessment ………………………………...…………………..…………………………Research in special education …………………….………………………...…………Statewide longitudinal data systems ……………………………………………………Special education studies and evaluations ……………………………………………
2
B
B
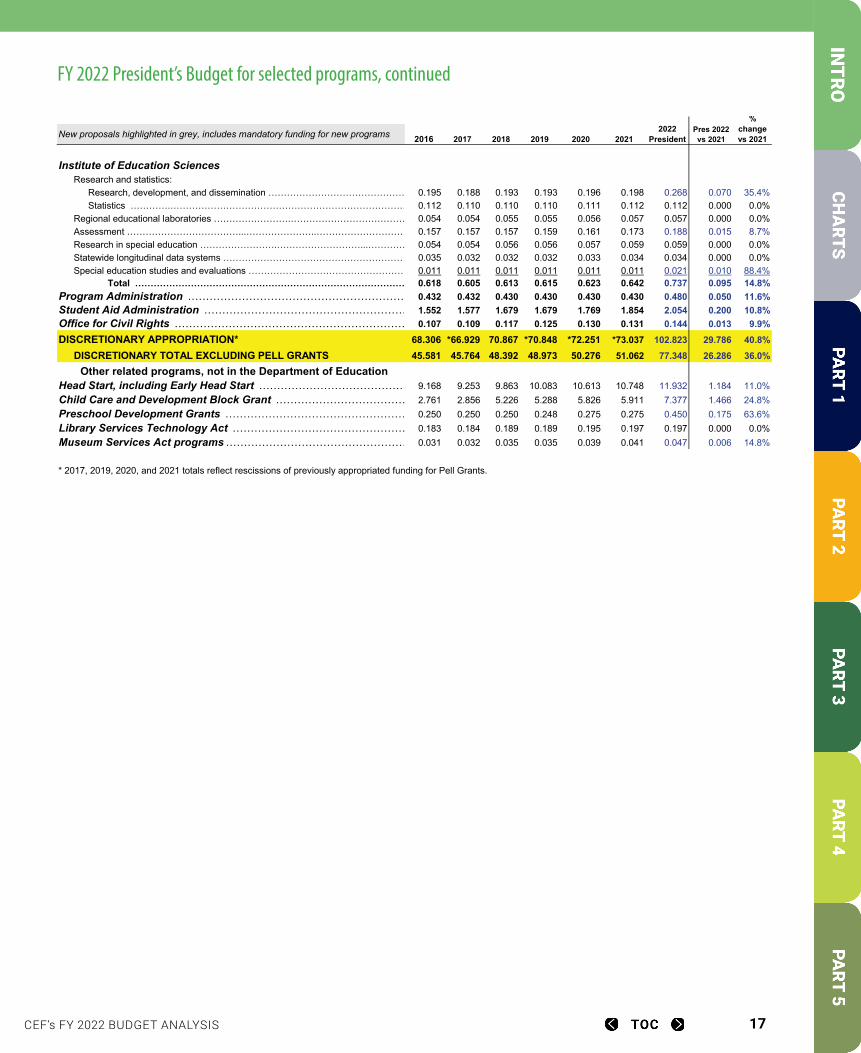
CEF’s FY 2022 BUDGET ANALYSIS 17
2
President's FY 2022 Request for Selected Department of Education & Related ProgramsDollars in Billions
2016 2017 2018 2019 2020 20212022
PresidentPres 2022 vs 2021
% change vs 2021New proposals highlighted in grey, includes mandatory funding for new programs
Postsecondary Education22.475 22.475 22.475 22.475 22.475 22.475 25.475 3.000 13.3%
-1.310 -0.600 -0.500 -0.5005,815$ 5,920$ 6,095$ 6,195$ 6,345$ 6,495$ 8,370$ 1,875$ 28.9%
Campus-based programs:0.733 0.733 0.840 0.840 0.865 0.880 0.880 0.000 0.0%0.990 0.990 1.130 1.130 1.180 1.190 1.190 0.000 0.0%
0.350 0.350 0.050 0.050 0.025 -0.025 -50.0%Free Community College:
14.312 14.3124.641 4.641
Aid for institutional development:0.087 0.087 0.099 0.100 0.108 0.109 0.209 0.100 91.7%0.028 0.028 0.032 0.032 0.037 0.038 0.053 0.015 39.4%0.014 0.014 0.016 0.016 0.018 0.019 0.025 0.006 31.5%0.245 0.245 0.280 0.282 0.325 0.338 0.403 0.065 19.3%0.063 0.063 0.072 0.073 0.084 0.087 0.102 0.015 17.2%
0.008 0.009 0.009 0.010 0.011 0.021 0.010 91.3%0.010 0.010 0.011 0.011 0.013 0.014 0.023 0.009 63.3%0.003 0.003 0.004 0.004 0.004 0.005 0.020 0.015 293.0%0.003 0.003 0.004 0.004 0.004 0.005 0.012 0.007 136.7%0.117 0.117 0.134 0.136 0.156 0.163 0.266 0.103 63.4%
Other aid for institutions:0.010 0.010 0.011 0.011 0.013 0.013 0.018 0.005 37.4%0.072 0.072 0.072 0.072 0.076 0.078 0.078 0.000 0.0%0.012 0.012 0.012 0.012 0.012 0.014 0.015 0.001 10.0%0.008 0.008 0.009 0.010 0.010 0.011 0.011 0.000 0.0%
Assistance for students:0.900 0.950 1.010 1.060 1.090 1.097 1.298 0.201 18.3%0.323 0.340 0.350 0.360 0.365 0.368 0.408 0.040 10.9%0.029 0.028 0.023 0.023 0.023 0.024 0.024 0.000 0.0%0.015 0.015 0.050 0.050 0.053 0.055 0.095 0.040 72.7%0.000 0.000 0.006 0.005 0.025 0.041 0.076 0.035 85.4%0.043 0.043 0.043 0.043 0.050 0.052 0.132 0.080 153.6%
0.280 0.2800.020 0.0200.200 0.2006.200 6.200
Institute of Education SciencesResearch and statistics:
0.195 0.188 0.193 0.193 0.196 0.198 0.268 0.070 35.4%0.112 0.110 0.110 0.110 0.111 0.112 0.112 0.000 0.0%0.054 0.054 0.055 0.055 0.056 0.057 0.057 0.000 0.0%0.157 0.157 0.157 0.159 0.161 0.173 0.188 0.015 8.7%0.054 0.054 0.056 0.056 0.057 0.059 0.059 0.000 0.0%0.035 0.032 0.032 0.032 0.033 0.034 0.034 0.000 0.0%0.011 0.011 0.011 0.011 0.011 0.011 0.021 0.010 88.4%
Total …………………………………………………………………………… 0.618 0.605 0.613 0.615 0.623 0.642 0.737 0.095 14.8%0.432 0.432 0.430 0.430 0.430 0.430 0.480 0.050 11.6%1.552 1.577 1.679 1.679 1.769 1.854 2.054 0.200 10.8%0.107 0.109 0.117 0.125 0.130 0.131 0.144 0.013 9.9%
DISCRETIONARY APPROPRIATION* 68.306 *66.929 70.867 *70.848 *72.251 *73.037 102.823 29.786 40.8%DISCRETIONARY TOTAL EXCLUDING PELL GRANTS 45.581 45.764 48.392 48.973 50.276 51.062 77.348 26.286 36.0%
9.168 9.253 9.863 10.083 10.613 10.748 11.932 1.184 11.0%2.761 2.856 5.226 5.288 5.826 5.911 7.377 1.466 24.8%0.250 0.250 0.250 0.248 0.275 0.275 0.450 0.175 63.6%0.183 0.184 0.189 0.189 0.195 0.197 0.197 0.000 0.0%0.031 0.032 0.035 0.035 0.039 0.041 0.047 0.006 14.8%
* 2017, 2019, 2020, and 2021 totals reflect rescissions of previously appropriated funding for Pell Grants.
Other related programs, not in the Department of Education
Discretionary Pell grants …………………………………………………………………Rescission of previously appropriated Pell Grant funding *………...…..……….Maximum grant, total including mandatory-funded portion (in actual dollars) …
Federal supplemental educational opportunity grants (SEOG) …………………
Strengthening tribally controlled colleges and universities ………………………Strengthening Alaska Native & Native Hawaiian-serving institutions ……………Strengthening HBCUs ………………………………………………...………………Strengthening historically black graduate institutions ……………………………Strengthening HBCU masters programs ………...................…..…………….…
Federal work-study ……………………………………………………………………Temporary Expanded Public Service Loan Forgiveness ….....…............................
New: Free community college (mandatory spending, not included in ED discretionary total) …...................................................New: Institutional Aid to Improve Affordability (mandatory spending, not included in ED discretionary total) …............................
Strengthening institutions ……………………………………………………………
International education and foreign language studies ……………………………Transition programs for students with intellectual disabilities ……………………Tribally controlled postsecondary career & technical institutions ………………
Federal TRIO programs ………………………………………………………………Gaining early awareness & readiness for undergrad programs (GEAR UP)……
Strengthening predominantly black institutions ……………………………………Strengthening Asian- & Native American Pacific Islander-serving insts.………Strengthening Native American-serving nontribal institutions ……………………
Aid for Hispanic-serving institutions (Title V, Parts A & B)……………………………
Minority science and engineering improvement ……………………………………
Hawkins Centers of Excellence (never funded but authorized in 2008) (also receives $40 million in mandatory funding)……..........New: Health professionals of the future (mandatory spending, not included in ED discretionary total) …..........................................New: Completion grants (mandatory spending, not included in ED discretionary total) ….................................................................
Research, development, and dissemination ………………………………………Statistics ………….……………………………………………………………………
Graduate assistance in areas of national need ……………………………………Child care access means parents in school ………………………………………
Fund for the Improvement of Postsecondary Education ………………………………Teacher quality partnerships ……………………………………………………………New: teacher quality partnerships (mandatory spending, not included in ED discretionary total)……................................................
Preschool Development Grants ……………………………………………Library Services Technology Act …………………………………………Museum Services Act programs ……………………………………………
Program Administration ……………………………………………………Student Aid Administration …………………………………………………Office for Civil Rights …………………………………………………………
Head Start, including Early Head Start ……………………………………Child Care and Development Block Grant ………………………………
Regional educational laboratories …………………….…………………………………Assessment ………………………………...…………………..…………………………Research in special education …………………….………………………...…………Statewide longitudinal data systems ……………………………………………………Special education studies and evaluations ……………………………………………
2
2
President's FY 2022 Request for Selected Department of Education & Related ProgramsDollars in Billions
2016 2017 2018 2019 2020 20212022
PresidentPres 2022 vs 2021
% change vs 2021New proposals highlighted in grey, includes mandatory funding for new programs
Postsecondary Education22.475 22.475 22.475 22.475 22.475 22.475 25.475 3.000 13.3%
-1.310 -0.600 -0.500 -0.5005,815$ 5,920$ 6,095$ 6,195$ 6,345$ 6,495$ 8,370$ 1,875$ 28.9%
Campus-based programs:0.733 0.733 0.840 0.840 0.865 0.880 0.880 0.000 0.0%0.990 0.990 1.130 1.130 1.180 1.190 1.190 0.000 0.0%
0.350 0.350 0.050 0.050 0.025 -0.025 -50.0%Free Community College:
14.312 14.3124.641 4.641
Aid for institutional development:0.087 0.087 0.099 0.100 0.108 0.109 0.209 0.100 91.7%0.028 0.028 0.032 0.032 0.037 0.038 0.053 0.015 39.4%0.014 0.014 0.016 0.016 0.018 0.019 0.025 0.006 31.5%0.245 0.245 0.280 0.282 0.325 0.338 0.403 0.065 19.3%0.063 0.063 0.072 0.073 0.084 0.087 0.102 0.015 17.2%
0.008 0.009 0.009 0.010 0.011 0.021 0.010 91.3%0.010 0.010 0.011 0.011 0.013 0.014 0.023 0.009 63.3%0.003 0.003 0.004 0.004 0.004 0.005 0.020 0.015 293.0%0.003 0.003 0.004 0.004 0.004 0.005 0.012 0.007 136.7%0.117 0.117 0.134 0.136 0.156 0.163 0.266 0.103 63.4%
Other aid for institutions:0.010 0.010 0.011 0.011 0.013 0.013 0.018 0.005 37.4%0.072 0.072 0.072 0.072 0.076 0.078 0.078 0.000 0.0%0.012 0.012 0.012 0.012 0.012 0.014 0.015 0.001 10.0%0.008 0.008 0.009 0.010 0.010 0.011 0.011 0.000 0.0%
Assistance for students:0.900 0.950 1.010 1.060 1.090 1.097 1.298 0.201 18.3%0.323 0.340 0.350 0.360 0.365 0.368 0.408 0.040 10.9%0.029 0.028 0.023 0.023 0.023 0.024 0.024 0.000 0.0%0.015 0.015 0.050 0.050 0.053 0.055 0.095 0.040 72.7%0.000 0.000 0.006 0.005 0.025 0.041 0.076 0.035 85.4%0.043 0.043 0.043 0.043 0.050 0.052 0.132 0.080 153.6%
0.280 0.2800.020 0.0200.200 0.2006.200 6.200
Institute of Education SciencesResearch and statistics:
0.195 0.188 0.193 0.193 0.196 0.198 0.268 0.070 35.4%0.112 0.110 0.110 0.110 0.111 0.112 0.112 0.000 0.0%0.054 0.054 0.055 0.055 0.056 0.057 0.057 0.000 0.0%0.157 0.157 0.157 0.159 0.161 0.173 0.188 0.015 8.7%0.054 0.054 0.056 0.056 0.057 0.059 0.059 0.000 0.0%0.035 0.032 0.032 0.032 0.033 0.034 0.034 0.000 0.0%0.011 0.011 0.011 0.011 0.011 0.011 0.021 0.010 88.4%
Total …………………………………………………………………………… 0.618 0.605 0.613 0.615 0.623 0.642 0.737 0.095 14.8%0.432 0.432 0.430 0.430 0.430 0.430 0.480 0.050 11.6%1.552 1.577 1.679 1.679 1.769 1.854 2.054 0.200 10.8%0.107 0.109 0.117 0.125 0.130 0.131 0.144 0.013 9.9%
DISCRETIONARY APPROPRIATION* 68.306 *66.929 70.867 *70.848 *72.251 *73.037 102.823 29.786 40.8%DISCRETIONARY TOTAL EXCLUDING PELL GRANTS 45.581 45.764 48.392 48.973 50.276 51.062 77.348 26.286 36.0%
9.168 9.253 9.863 10.083 10.613 10.748 11.932 1.184 11.0%2.761 2.856 5.226 5.288 5.826 5.911 7.377 1.466 24.8%0.250 0.250 0.250 0.248 0.275 0.275 0.450 0.175 63.6%0.183 0.184 0.189 0.189 0.195 0.197 0.197 0.000 0.0%0.031 0.032 0.035 0.035 0.039 0.041 0.047 0.006 14.8%
* 2017, 2019, 2020, and 2021 totals reflect rescissions of previously appropriated funding for Pell Grants.
Other related programs, not in the Department of Education
Discretionary Pell grants …………………………………………………………………Rescission of previously appropriated Pell Grant funding *………...…..……….Maximum grant, total including mandatory-funded portion (in actual dollars) …
Federal supplemental educational opportunity grants (SEOG) …………………
Strengthening tribally controlled colleges and universities ………………………Strengthening Alaska Native & Native Hawaiian-serving institutions ……………Strengthening HBCUs ………………………………………………...………………Strengthening historically black graduate institutions ……………………………Strengthening HBCU masters programs ………...................…..…………….…
Federal work-study ……………………………………………………………………Temporary Expanded Public Service Loan Forgiveness ….....…............................
New: Free community college (mandatory spending, not included in ED discretionary total) …...................................................New: Institutional Aid to Improve Affordability (mandatory spending, not included in ED discretionary total) …............................
Strengthening institutions ……………………………………………………………
International education and foreign language studies ……………………………Transition programs for students with intellectual disabilities ……………………Tribally controlled postsecondary career & technical institutions ………………
Federal TRIO programs ………………………………………………………………Gaining early awareness & readiness for undergrad programs (GEAR UP)……
Strengthening predominantly black institutions ……………………………………Strengthening Asian- & Native American Pacific Islander-serving insts.………Strengthening Native American-serving nontribal institutions ……………………
Aid for Hispanic-serving institutions (Title V, Parts A & B)……………………………
Minority science and engineering improvement ……………………………………
Hawkins Centers of Excellence (never funded but authorized in 2008) (also receives $40 million in mandatory funding)……..........New: Health professionals of the future (mandatory spending, not included in ED discretionary total) …..........................................New: Completion grants (mandatory spending, not included in ED discretionary total) ….................................................................
Research, development, and dissemination ………………………………………Statistics ………….……………………………………………………………………
Graduate assistance in areas of national need ……………………………………Child care access means parents in school ………………………………………
Fund for the Improvement of Postsecondary Education ………………………………Teacher quality partnerships ……………………………………………………………New: teacher quality partnerships (mandatory spending, not included in ED discretionary total)……................................................
Preschool Development Grants ……………………………………………Library Services Technology Act …………………………………………Museum Services Act programs ……………………………………………
Program Administration ……………………………………………………Student Aid Administration …………………………………………………Office for Civil Rights …………………………………………………………
Head Start, including Early Head Start ……………………………………Child Care and Development Block Grant ………………………………
Regional educational laboratories …………………….…………………………………Assessment ………………………………...…………………..…………………………Research in special education …………………….………………………...…………Statewide longitudinal data systems ……………………………………………………Special education studies and evaluations ……………………………………………
2
FY 2022 President’s Budget for selected programs, continued
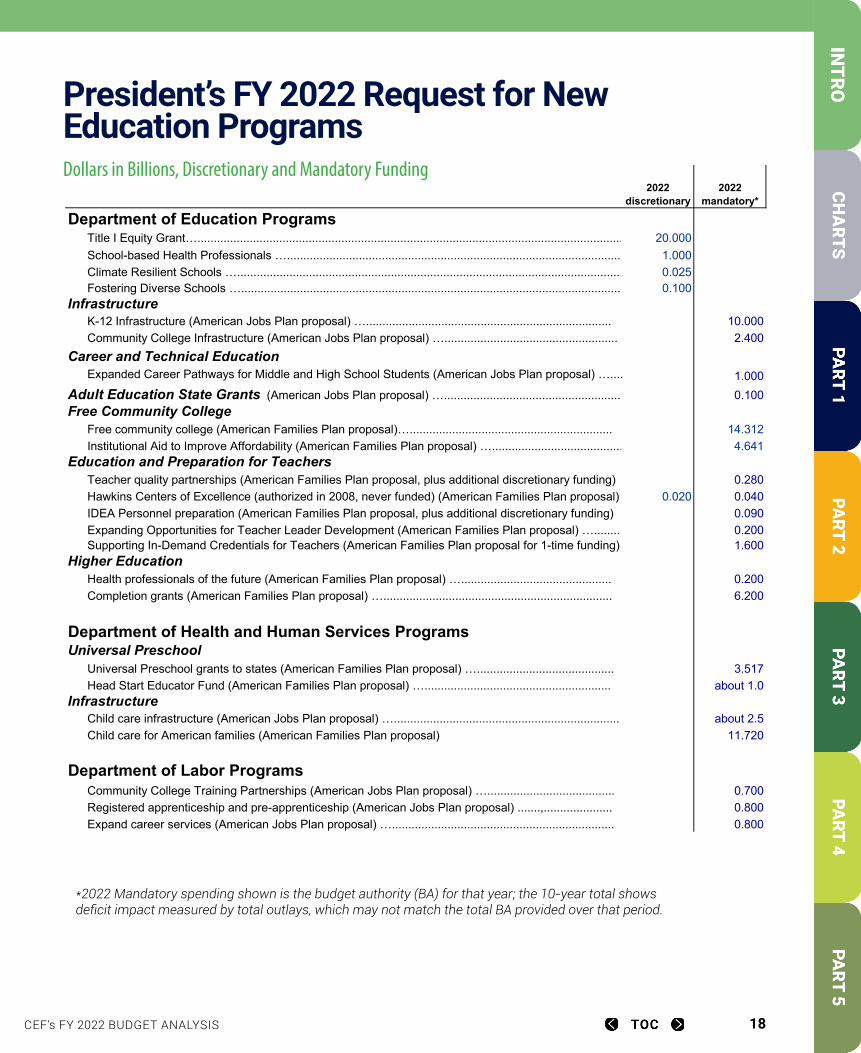
CEF’s FY 2022 BUDGET ANALYSIS 18
*2022 Mandatory spending shown is the budget authority (BA) for that year; the 10-year total shows deficit impact measured by total outlays, which may not match the total BA provided over that period.
President’s FY 2022 Request for New Education Programs
Department of Education Programs20.0001.0000.0250.100
Infrastructure10.0002.400
Career and Technical Education1.0000.100
Free Community College14.3124.641
Education and Preparation for Teachers0.280
0.020 0.0400.0900.2001.600
Higher Education0.2006.200
Department of Health and Human Services ProgramsUniversal Preschool
3.517about 1.0
Infrastructureabout 2.5
11.720
Department of Labor Programs0.7000.8000.800
Child care infrastructure (American Jobs Plan proposal) ….....................................................................Child care for American families (American Families Plan proposal)
Community College Training Partnerships (American Jobs Plan proposal) ….......................................Registered apprenticeship and pre-apprenticeship (American Jobs Plan proposal) .......,.....................Expand career services (American Jobs Plan proposal) …....................................................................
Supporting In-Demand Credentials for Teachers (American Families Plan proposal for 1-time funding)
Health professionals of the future (American Families Plan proposal) …..............................................Completion grants (American Families Plan proposal) …......................................................................
Universal Preschool grants to states (American Families Plan proposal) …..........................................Head Start Educator Fund (American Families Plan proposal) ….........................................................
Institutional Aid to Improve Affordability (American Families Plan proposal) …........................................
Teacher quality partnerships (American Families Plan proposal, plus additional discretionary funding)Hawkins Centers of Excellence (authorized in 2008, never funded) (American Families Plan proposal)IDEA Personnel preparation (American Families Plan proposal, plus additional discretionary funding)Expanding Opportunities for Teacher Leader Development (American Families Plan proposal) …........
* 2022 Mandatory spending shown is the budget authority (BA) for that year; the 10-year total shows deficit impact measured by total o which may not match the total BA provided over that period.
President's FY 2022 Request for New Education Programs
2022 mandatory*
2022 discretionary
Title I Equity Grant…..................................................................................................................................School-based Health Professionals ….......................................................................................................Climate Resilient Schools …......................................................................................................................Fostering Diverse Schools ….....................................................................................................................
K-12 Infrastructure (American Jobs Plan proposal) …...........................................................................Community College Infrastructure (American Jobs Plan proposal) ….....................................................
Expanded Career Pathways for Middle and High School Students (American Jobs Plan proposal) …....
Adult Education State Grants (American Jobs Plan proposal) …......................................................
Free community college (American Families Plan proposal)…..............................................................
Dollars in Billions, Discretionary and Mandatory Funding
CEF’s FY 2022 BUDGET ANALYSIS 19
Charts & Graphs The Need to Invest in Education
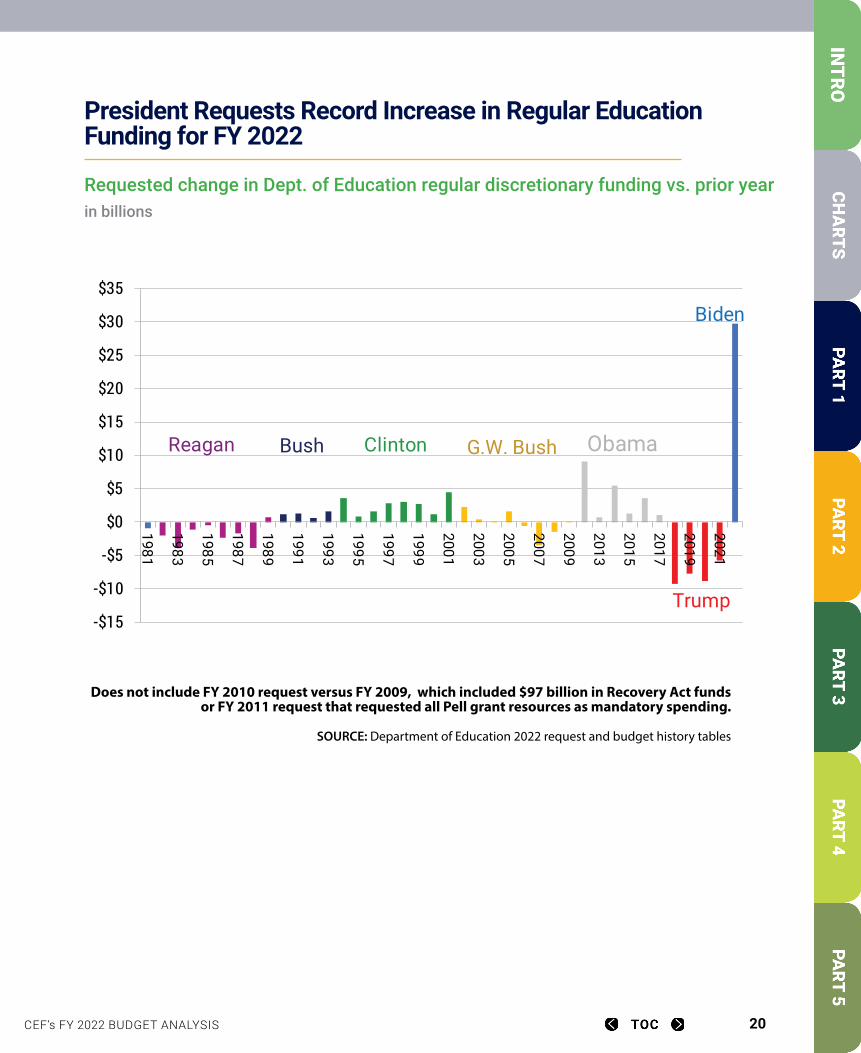
CEF’s FY 2022 BUDGET ANALYSIS 20
President Requests Record Increase in Regular Education Funding for FY 2022
Requested change in Dept. of Education regular discretionary funding vs. prior yearin billions
Does not include FY 2010 request versus FY 2009, which included $97 billion in Recovery Act funds or FY 2011 request that requested all Pell grant resources as mandatory spending.
SOURCE: Department of Education 2022 request and budget history tables
President Requests Record Increase in Regular Education Funding for FY 2022
Requested change in Dept. of Education regular discretionary funding vs. prior year, in billions
-$15
-$10
-$5
$0
$5
$10
$15
$20
$25
$30
$35
1981
1983
1985
1987
1989
1991
1993
1995
1997
1999
2001
2003
2005
2007
2009
2013
2015
2017
2019
2021
Bush Clinton G.W. Bush Obama
Trump
Reagan
Biden
Does not include FY 2010 request versus FY 2009, which included $97 billion in Recovery Act funds, or FY 2011 request that requested all Pell grant resources as mandatory spending.
Source: Department of Education 2022 request and budget history tables
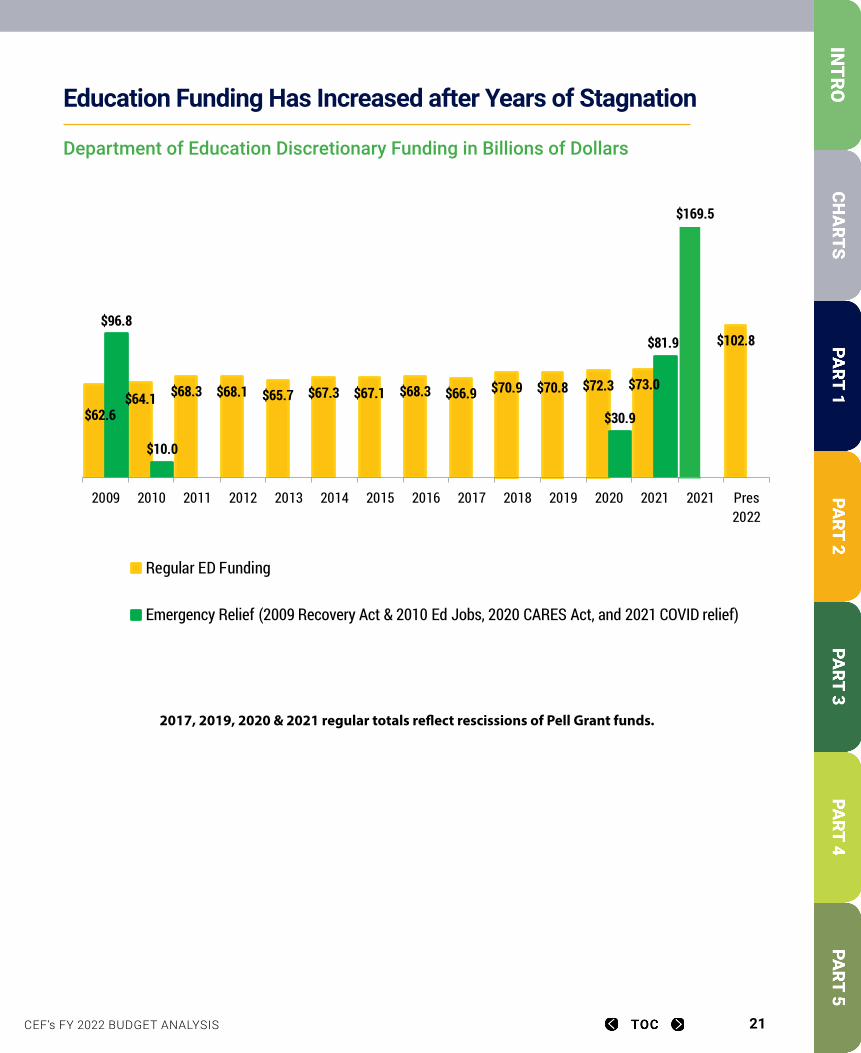
CEF’s FY 2022 BUDGET ANALYSIS 21
Education Funding Has Increased after Years of Stagnation
$62.6$64.1 $68.3 $68.1 $65.7 $67.3 $67.1 $68.3 $66.9 $70.9 $70.8 $72.3 $73.0
$169.5
$102.8$96.8
$10.0
$30.9
$81.9
2009 2010 2011 2012 2013 2014 2015 2016 2017 2018 2019 2020 2021 2021 Pres2022
Regular ED Funding
Emergency Relief (2009 Recovery Act & 2010 Ed Jobs, 2020 CARES Act & 2021 COVID relief)
2017, 2019, 2020 & 2021 regular totals reflect rescissions of Pell Grant funds
Education Funding Has Increased After Years of Stagnation(Department of Education Discretionary Funding in Billions of Dollars)
Department of Education Discretionary Funding in Billions of Dollars
2017, 2019, 2020 & 2021 regular totals reflect rescissions of Pell Grant funds.
$62.6$64.1 $68.3 $68.1 $65.7 $67.3 $67.1 $68.3 $66.9 $70.9 $70.8 $72.3 $73.0
$169.5
$102.8$96.8
$10.0
$30.9
$81.9
2009 2010 2011 2012 2013 2014 2015 2016 2017 2018 2019 2020 2021 2021 Pres2022
Regular ED Funding
Emergency Relief (2009 Recovery Act & 2010 Ed Jobs, 2020 CARES Act, and 2021 COVID relief)
2017, 2019, 2020 & 2021 regular totals reflect rescissions of Pell Grant funds
Education Funding Has Increased After Years of Stagnation(Department of Education Discretionary Funding in Billions of Dollars)
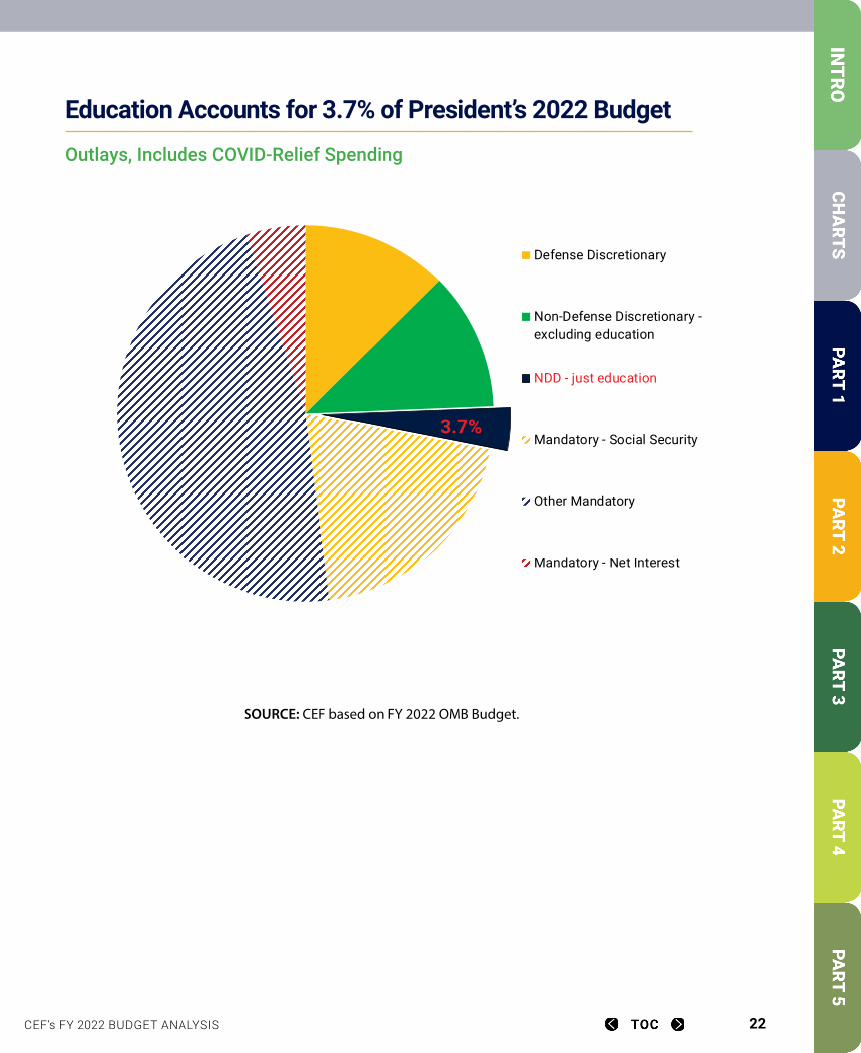
CEF’s FY 2022 BUDGET ANALYSIS 22
Education Accounts for 3.7% of President’s 2022 Budget
Outlays, Includes COVID-Relief Spending
Defense Discretionary
Non-Defense Discretionary -excluding education
NDD - just education
Mandatory - Social Security
Other Mandatory
Mandatory - Net Interest
3.7%
Education Accounts for 3.7% of President’s 2022 Budget
SOURCE: CEF based on FY2022 OMB Budget
Outlays, Includes COVID-Relief Spending
SOURCE: CEF based on FY 2022 OMB Budget.
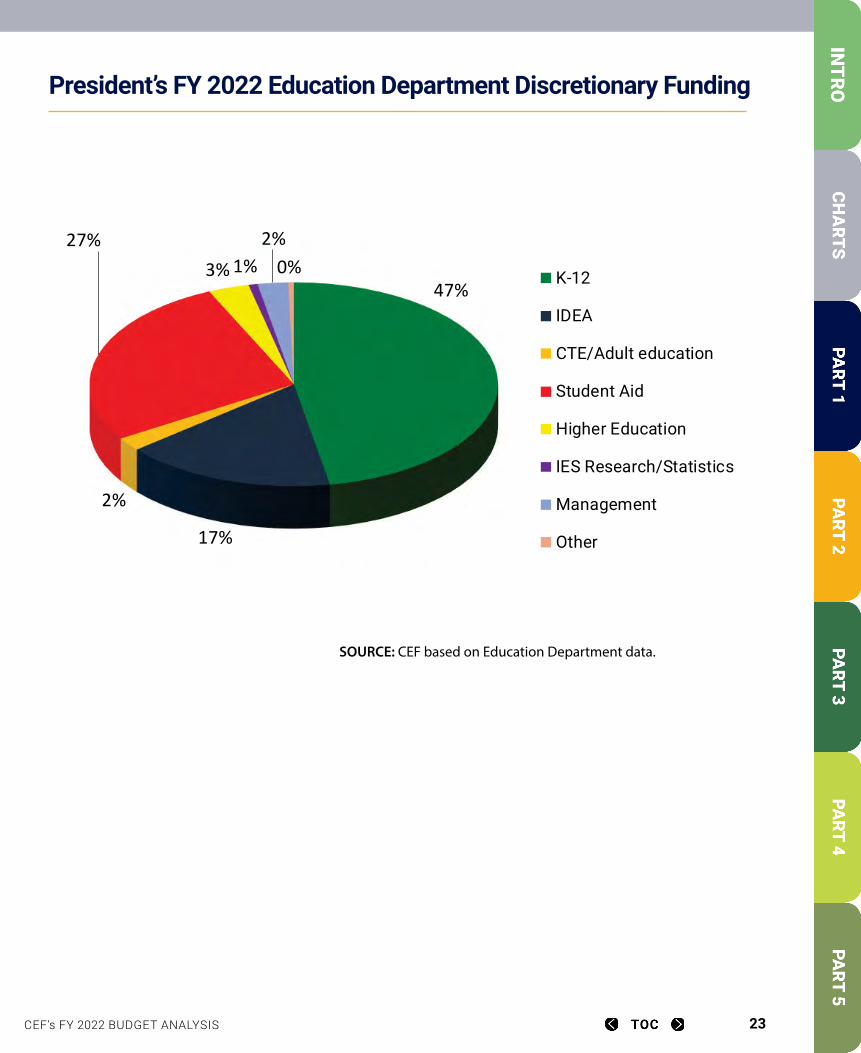
CEF’s FY 2022 BUDGET ANALYSIS 23
President’s FY 2022 Education Department Discretionary Funding
47%
17%
2%
27%3%1%
2%0% K-12
IDEA
CTE/Adult education
Student Aid
Higher Education
IES Research/Statistics
Management
Other
President’s FY 2022 Education Department Discretionary Funding
Source: CEF based on Education Department data
SOURCE: CEF based on Education Department data.
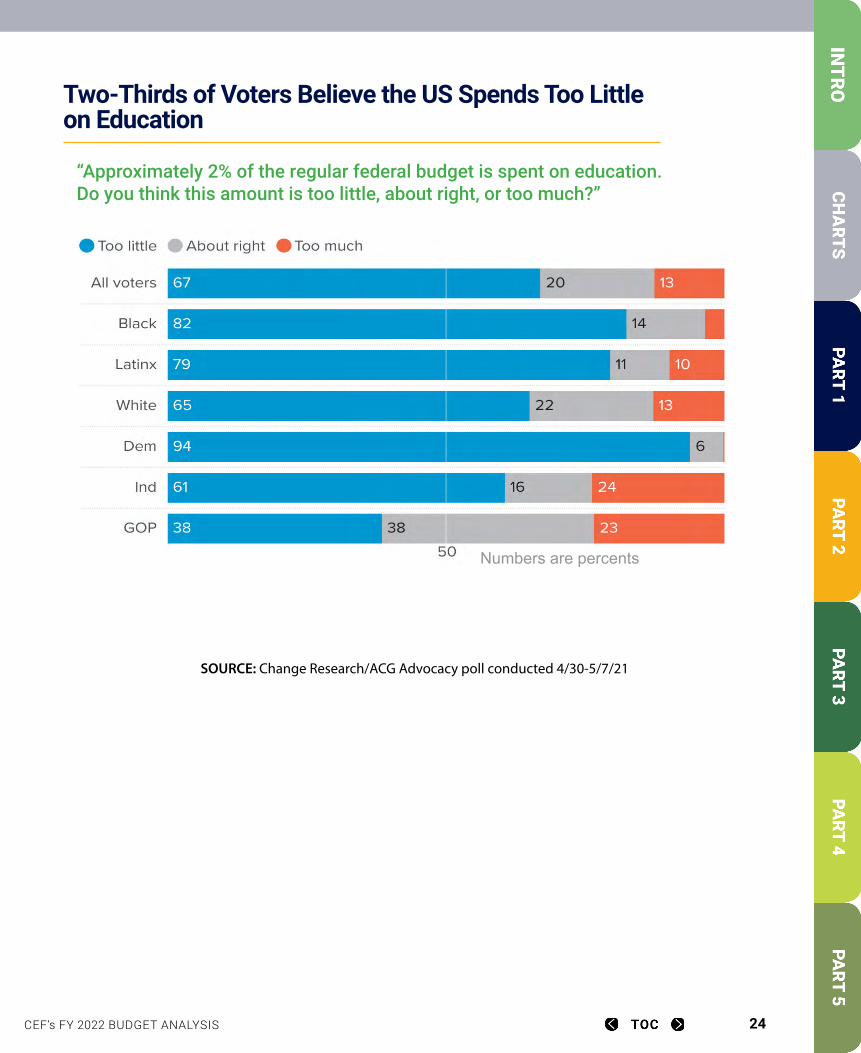
CEF’s FY 2022 BUDGET ANALYSIS 24
Two-Thirds of Voters Believe the US Spends Too Little on Education
SOURCE: Change Research/ACG Advocacy poll conducted 4/30-5/7/21
Two Thirds of Voters Believe the US Spends Too Little on Education
Source: Change Research/ACG Advocacy poll conducted 4/30-5/7/21
Numbers are percents
“Approximately 2% of the regular federal budget is spent on education. Do you think this amount is too little, about right, or too much?”
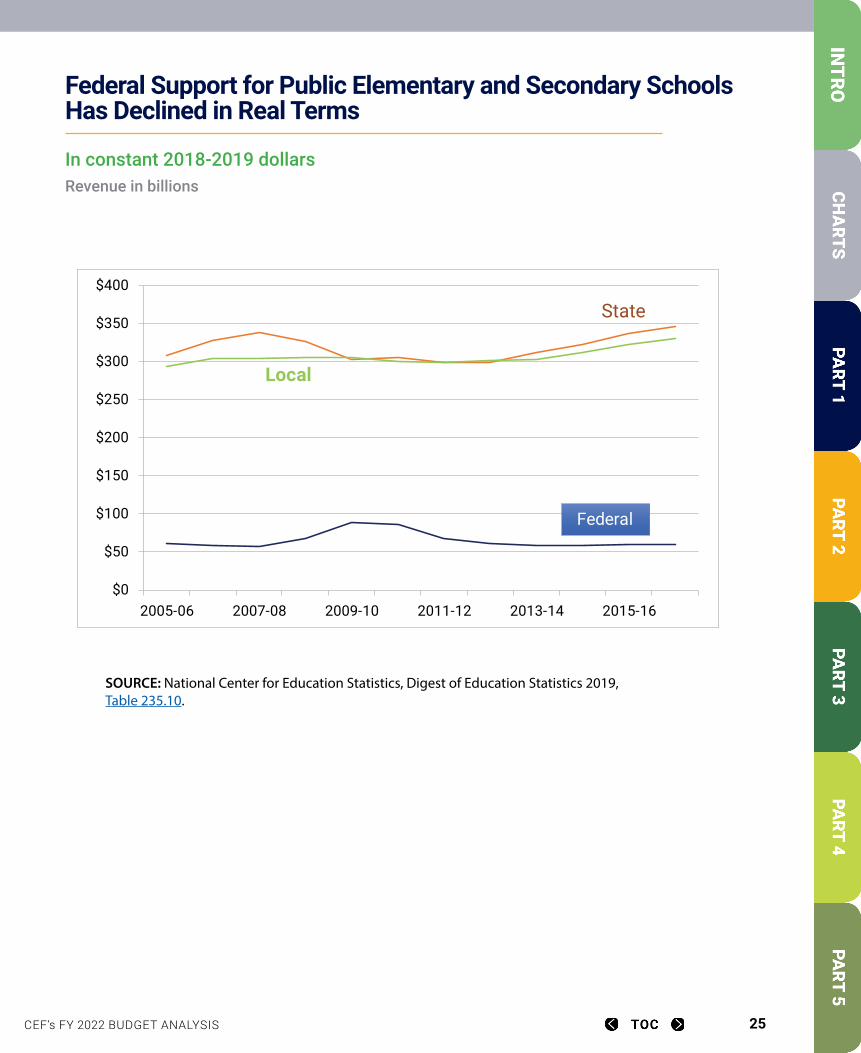
CEF’s FY 2022 BUDGET ANALYSIS 25
Federal Support for Public Elementary and Secondary Schools Has Declined in Real Terms
In constant 2018-2019 dollarsRevenue in billions
Federal Support for Public Elementary and Secondary Schools Has Declined in Real Terms
(in constant 2018-2019 dollars)
SOURCE: National Center for Education Statistics, Digest of Education Statistics 2019, Table 235.10.
$0
$50
$100
$150
$200
$250
$300
$350
$400
2005-06 2007-08 2009-10 2011-12 2013-14 2015-16
Federal
Local
State
Revenue in billions
SOURCE: National Center for Education Statistics, Digest of Education Statistics 2019, Table 235.10.
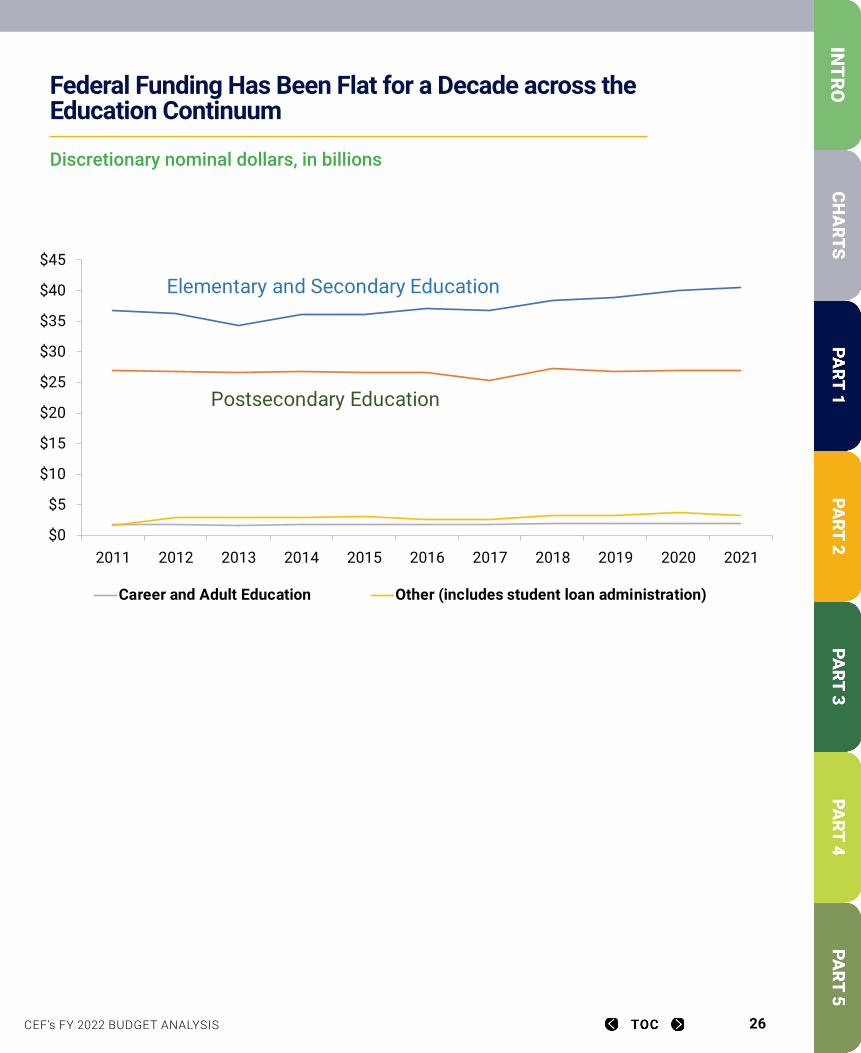
CEF’s FY 2022 BUDGET ANALYSIS 26
Federal Funding Has Been Flat for a Decade across the Education Continuum
Discretionary nominal dollars, in billions
Federal Funding Has Been Flat for a DecadeAcross Education Continuum
(Discretionary nominal dollars, in billions)
Elementary and Secondary Education
$0
$5
$10
$15
$20
$25
$30
$35
$40
$45
2011 2012 2013 2014 2015 2016 2017 2018 2019 2020 2021
Career and Adult Education Other (includes student loan administration)
Postsecondary Education
Elementary and Secondary Education
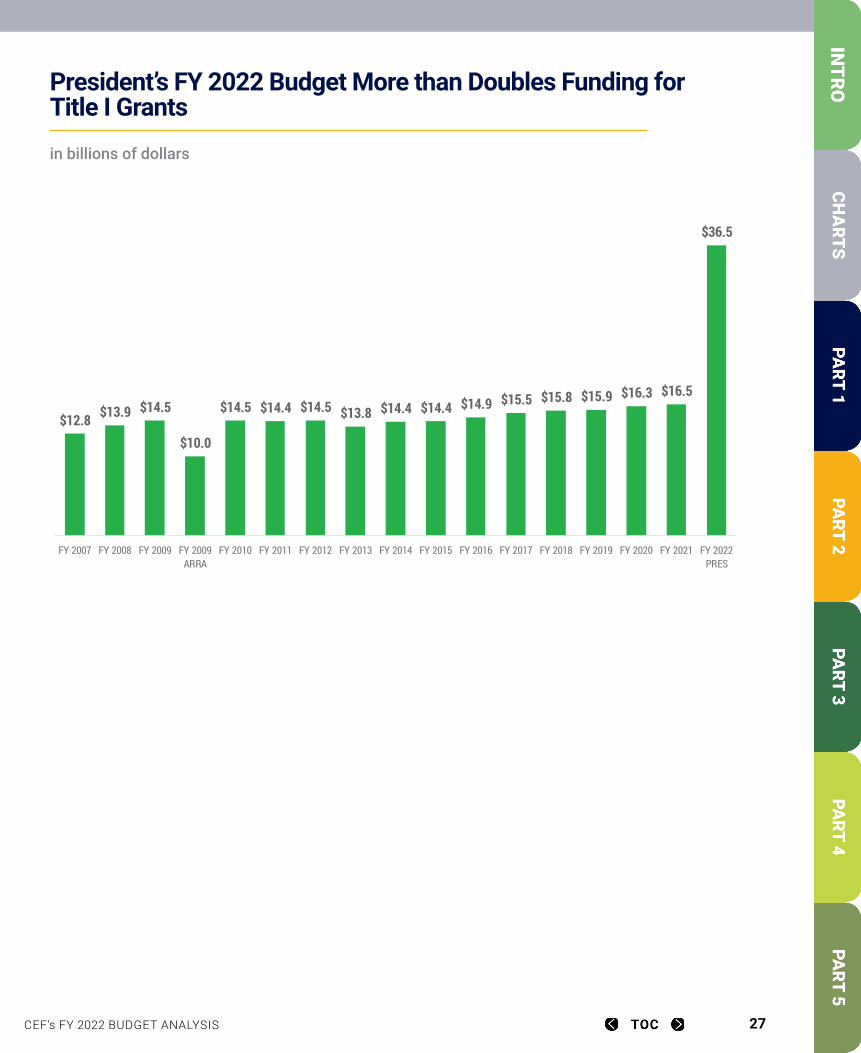
CEF’s FY 2022 BUDGET ANALYSIS 27
President’s FY 2022 Budget More than Doubles Funding for Title I Grants
in billions of dollars
President’s FY 2022 Budget More than Doubles Funding for Title I Grants
(Billions of Dollars)
$12.8 $13.9 $14.5
$10.0
$14.5 $14.4 $14.5 $13.8 $14.4 $14.4 $14.9 $15.5 $15.8 $15.9 $16.3 $16.5
$36.5
FY 2007 FY 2008 FY 2009 FY 2009ARRA
FY 2010 FY 2011 FY 2012 FY 2013 FY 2014 FY 2015 FY 2016 FY 2017 FY 2018 FY 2019 FY 2020 FY 2021 FY 2022PRES
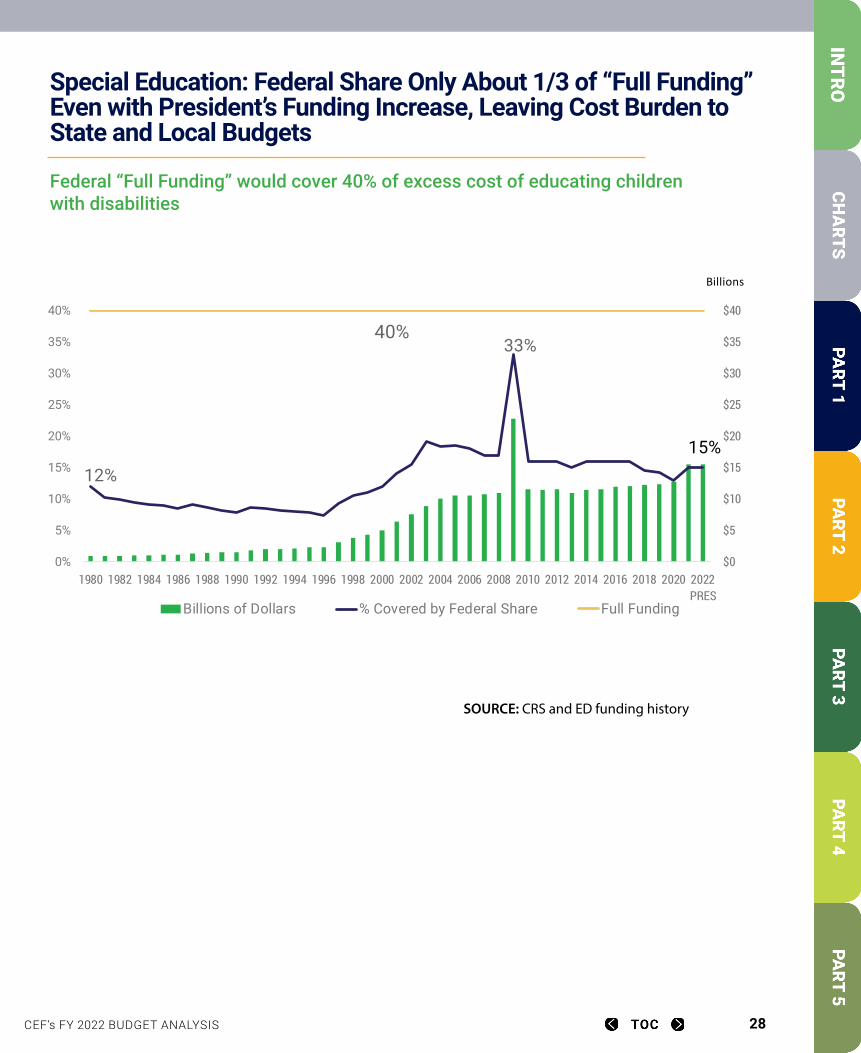
CEF’s FY 2022 BUDGET ANALYSIS 28
Special Education: Federal Share Only About 1/3 of “Full Funding” Even with President’s Funding Increase, Leaving Cost Burden to State and Local Budgets
Federal “Full Funding” would cover 40% of excess cost of educating children with disabilities
12%
33%
15%
40%
$0
$5
$10
$15
$20
$25
$30
$35
$40
0%
5%
10%
15%
20%
25%
30%
35%
40%
1980 1982 1984 1986 1988 1990 1992 1994 1996 1998 2000 2002 2004 2006 2008 2010 2012 2014 2016 2018 2020 2022PRES
Federal “Full Funding” would cover 40% of excess cost of educating children with disabilities
Billions of Dollars % Covered by Federal Share Full Funding
Billions
Source: CRS and ED funding history
Special Education: Federal Share Only About 1/3 of “Full Funding” Even with President’s Funding Increase, Leaving Cost Burden to State
and Local Budgets
SOURCE: CRS and ED funding history
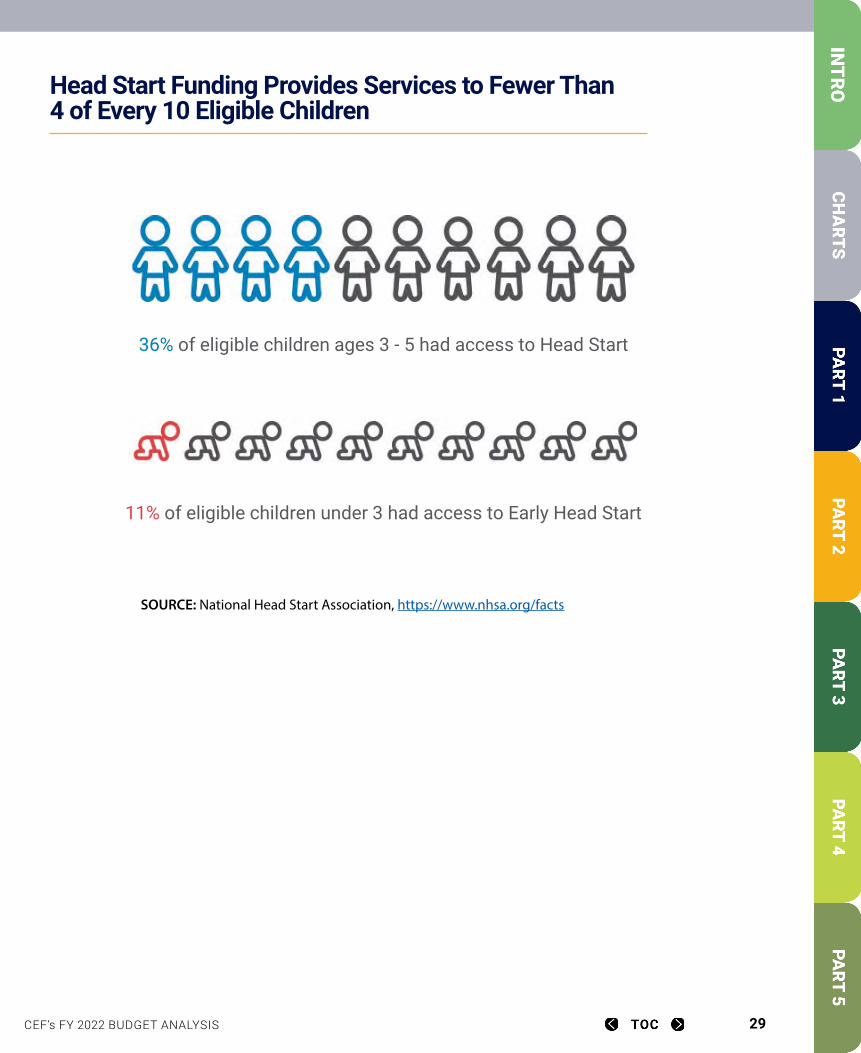
CEF’s FY 2022 BUDGET ANALYSIS 29
Head Start Funding Provides Services to Fewer Than 4 of Every 10 Eligible Children
36% of eligible children ages 3 - 5 had access to Head Start
11% of eligible children under 3 had access to Early Head Start
Head Start Funding Provides Services to Fewer Than 4 of Every 10 Eligible Children
Source: National Head Start Association, https://www.nhsa.org/factsSOURCE: National Head Start Association, https://www.nhsa.org/facts
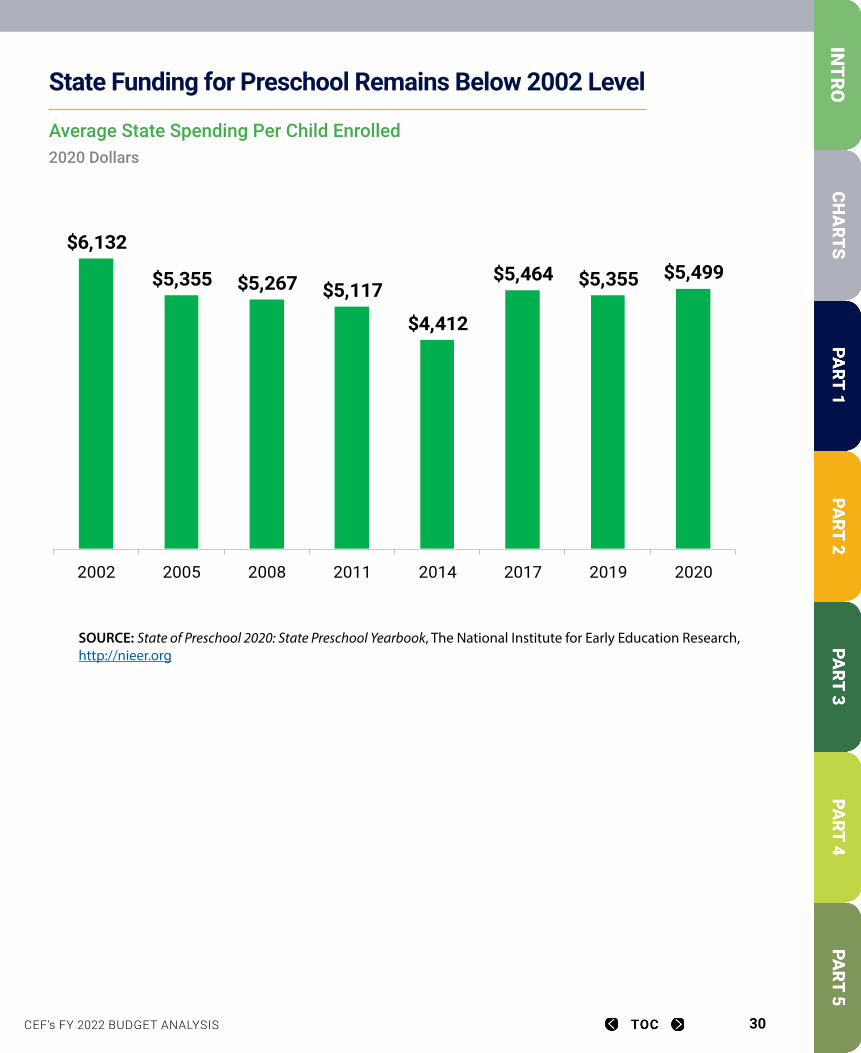
CEF’s FY 2022 BUDGET ANALYSIS 30
State Funding for Preschool Remains Below 2002 Level
Average State Spending Per Child Enrolled 2020 Dollars
SOURCE: State of Preschool 2020: State Preschool Yearbook, The National Institute for Early Education Research, http://nieer.org
State Funding for Preschool Remains Below 2002 Level
$6,132
$5,355 $5,267 $5,117
$4,412
$5,464 $5,355 $5,499
2002 2005 2008 2011 2014 2017 2019 2020
Average State Spending Per Child Enrolled (2020 Dollars)
SOURCE: State of Preschool 2020: State Preschool Yearbook, The National Institute for Early Education Research, http://nieer.org
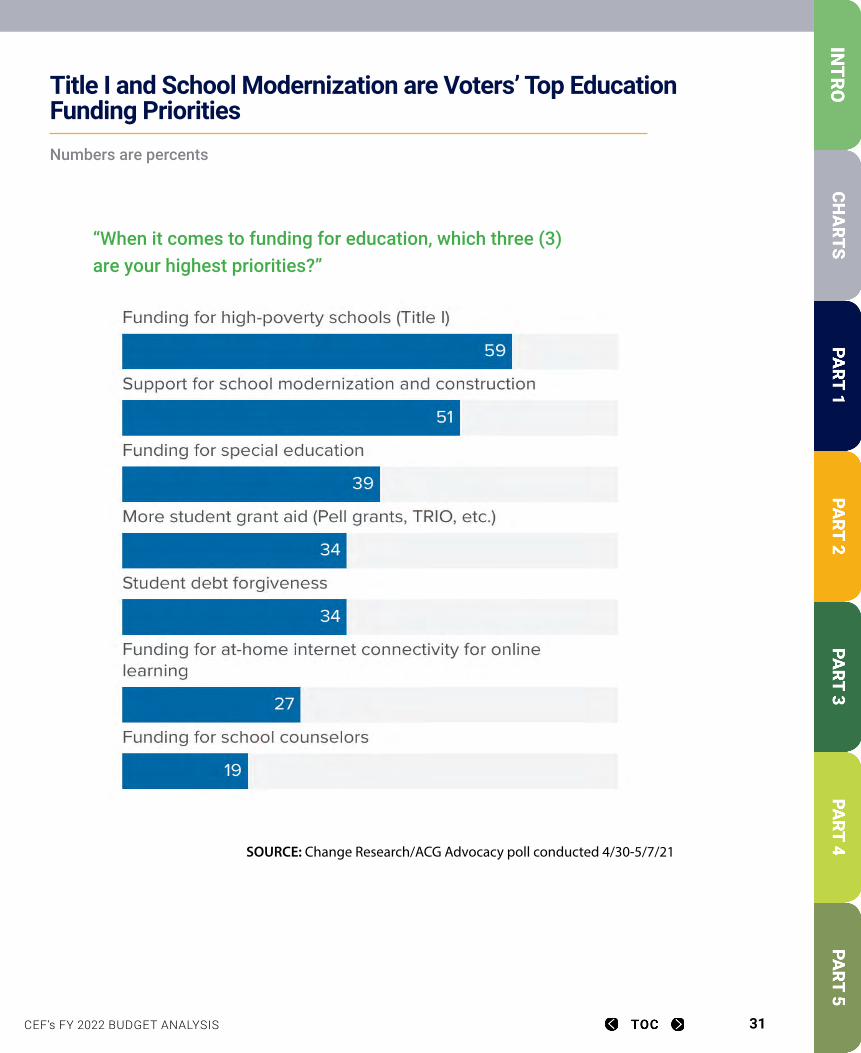
CEF’s FY 2022 BUDGET ANALYSIS 31
Title I and School Modernization are Voters’ Top Education Funding Priorities
Title I and School Modernization are Voters’ Top Education Funding Priorities
Source: Change Research/ACG Advocacy poll conducted 4/30-5/7/21
Numbers are percents
SOURCE: Change Research/ACG Advocacy poll conducted 4/30-5/7/21
“When it comes to funding for education, which three (3)are your highest priorities?”
Numbers are percents
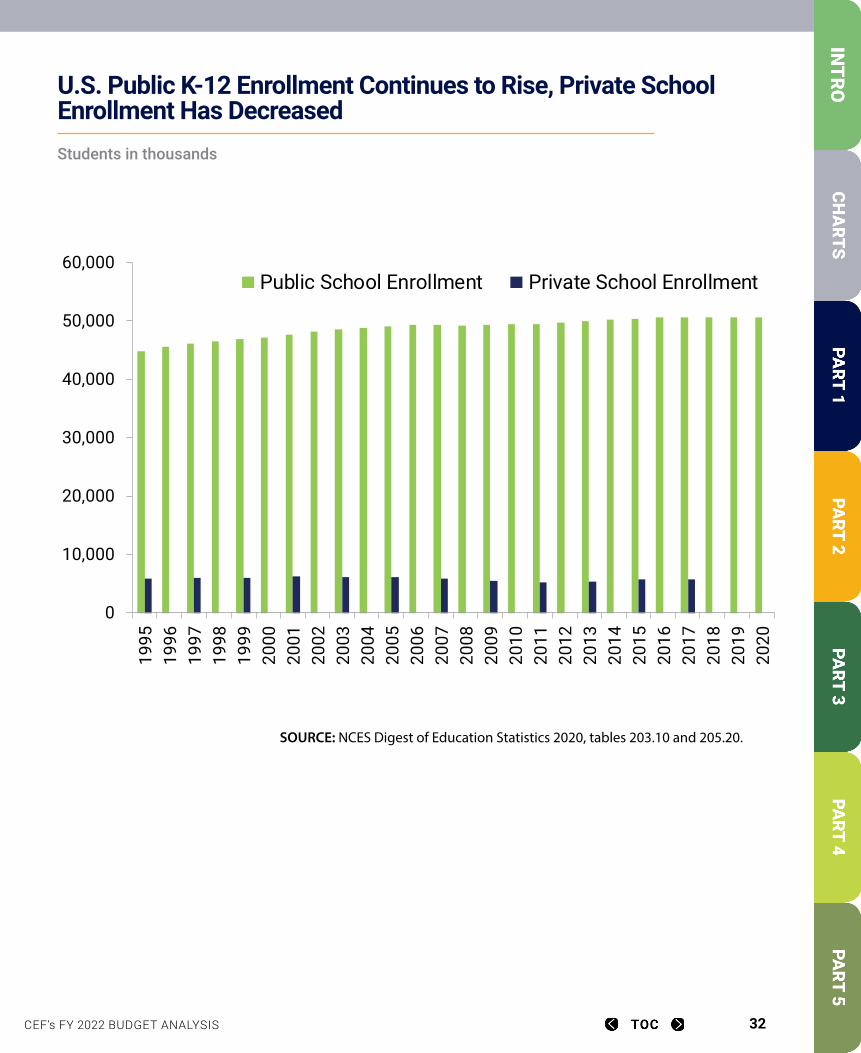
CEF’s FY 2022 BUDGET ANALYSIS 32
U.S. Public K-12 Enrollment Continues to Rise, Private School Enrollment Has DecreasedStudents in thousands
U.S. Public K-12 Enrollment Continues to Rise, Private School Enrollment Has Decreased
(Students in thousands)
0
10,000
20,000
30,000
40,000
50,000
60,000
1995
1996
1997
1998
1999
2000
2001
2002
2003
2004
2005
2006
2007
2008
2009
2010
2011
2012
2013
2014
2015
2016
2017
2018
2019
2020
Public School Enrollment Private School Enrollment
Source: NCES Digest of Education Statistics 2020, tables 203.10 and 205.20, SOURCE: NCES Digest of Education Statistics 2020, tables 203.10 and 205.20.
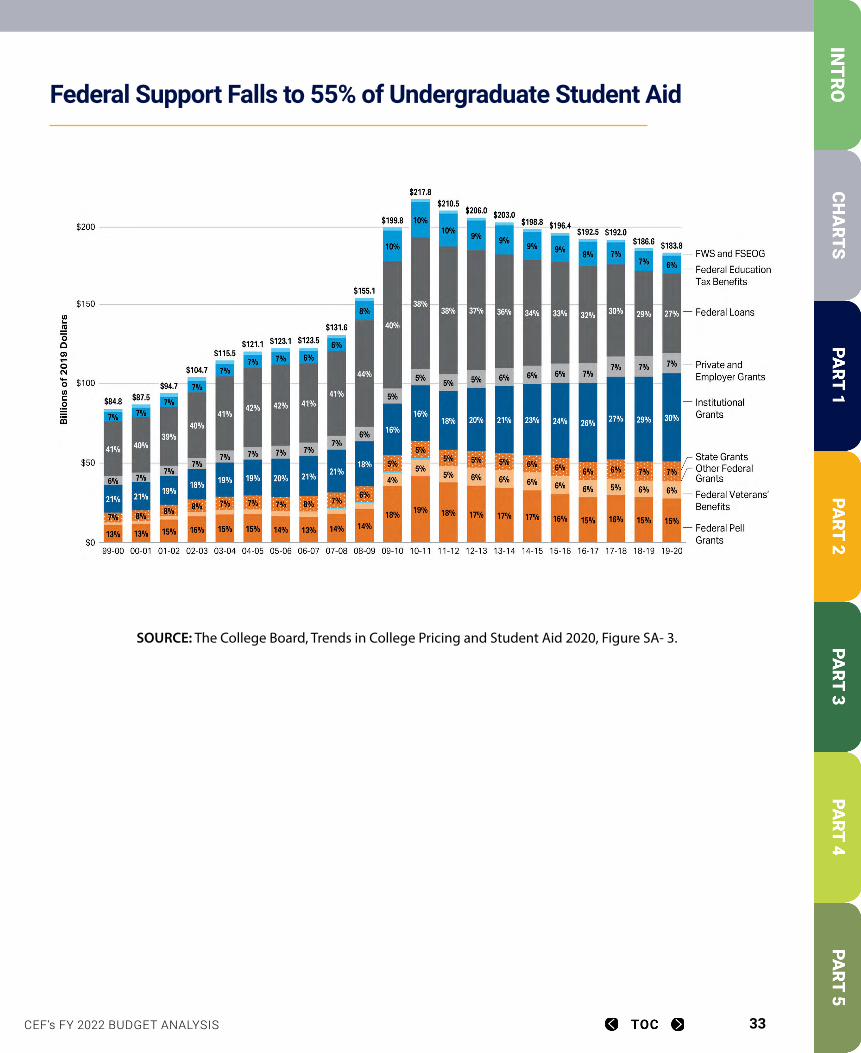
CEF’s FY 2022 BUDGET ANALYSIS 33
Federal Support Falls to 55% of Undergraduate Student AidFederal Support Falls to 55% of Undergraduate Student Aid
Source: The College Board, Trends in College Pricing and Student Aid 2020, Figure SA- 3.SOURCE: The College Board, Trends in College Pricing and Student Aid 2020, Figure SA- 3.
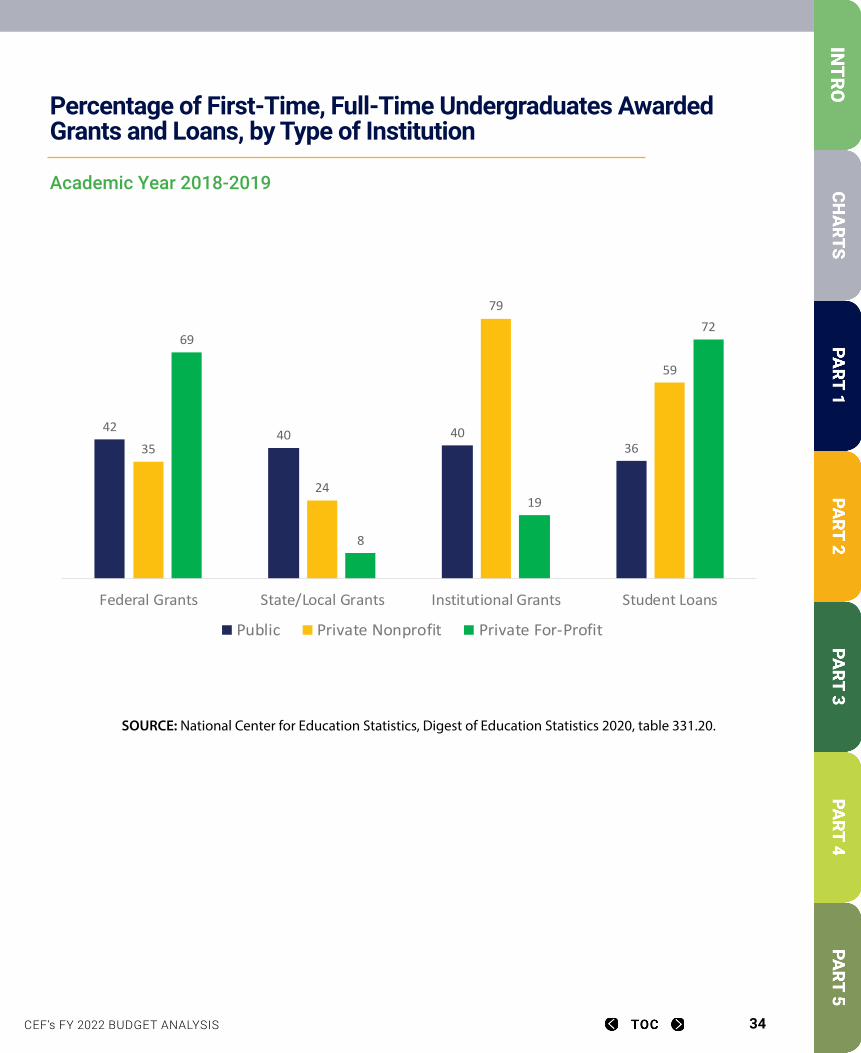
CEF’s FY 2022 BUDGET ANALYSIS 34
Percentage of First-Time, Full-Time Undergraduates Awarded Grants and Loans, by Type of Institution
Academic Year 2018-2019
Percentage of First-Time, Full-Time Undergraduates Awarded Grants and Loans, by Type of Institution
Academic Year 2018-2019
42 40 403635
24
79
59
69
8
19
72
Federal Grants State/Local Grants Institutional Grants Student Loans
Public Private Nonprofit Private For-Profit
SOURCE: National Center for Education Statistics, Digest of Education Statistics 2020, table 331.20.
SOURCE: National Center for Education Statistics, Digest of Education Statistics 2020, table 331.20.
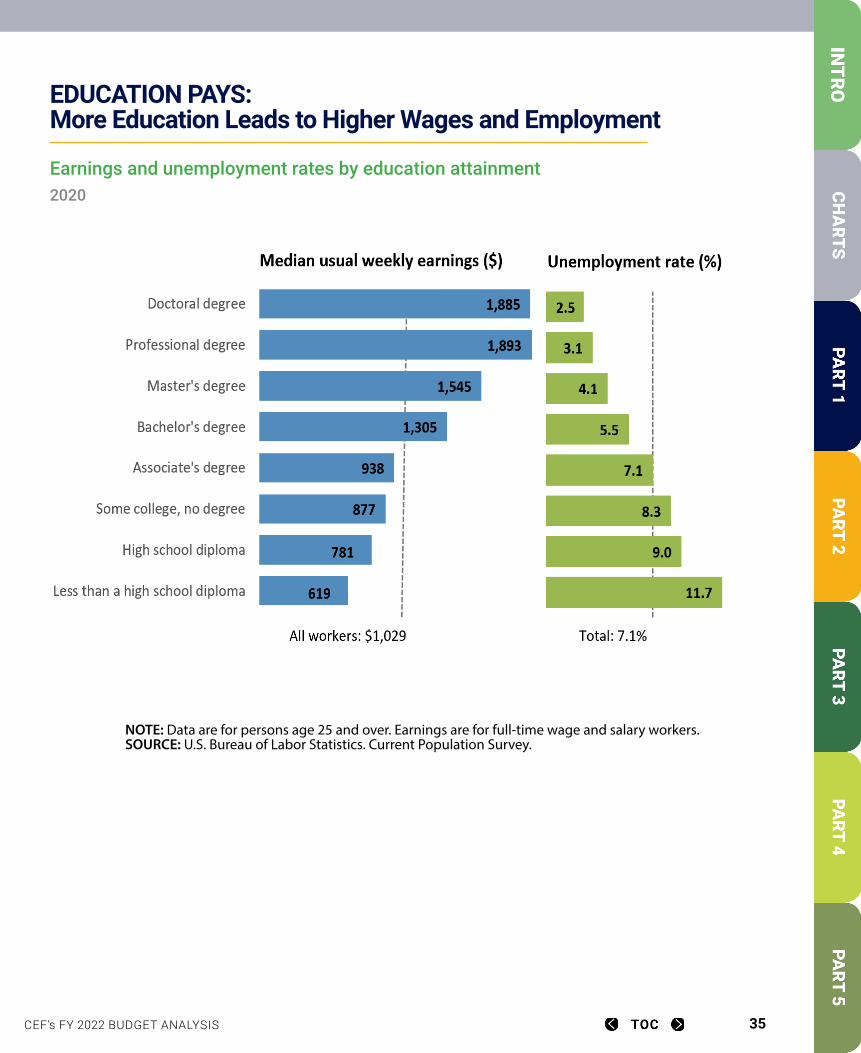
CEF’s FY 2022 BUDGET ANALYSIS 35
EDUCATION PAYS: More Education Leads to Higher Wages and Employment
Earnings and unemployment rates by education attainment2020
EDUCATION PAYS: More Education Leads to Higher Wages and Employment
NOTE: Data are for persons age 25 and over. Earnings are for full-time wage and salary workers.SOURCE: U.S. Bureau of Labor Statistics. Current Population Survey.
CEF’s FY 2022 BUDGET ANALYSIS 36
PART 1: The Foundation for SuccessEarly Childhood, Elementary and Secondary Education
CEF’s FY 2022 BUDGET ANALYSIS 37
President Biden’s FY 2022 education budget builds on the support for education provided in the 2020 and 2021 COVID-relief measures and reflects priorities of equity, diversity and training for educators, health of students, infrastructure, expanding career pathways, and access to college. The early childhood and K-12 education budget also includes hundreds of billions of dollars over 10 years in mandatory spending proposed in the American Jobs Act and the American Families Act, which would require authorization separate from the annual appropriations process. The president’s budget for FY 2022 almost doubles funding for early childhood programs and elementary and secondary education programs through a combination of annual appropriations and new mandatory spending programs yet to be enacted. These record education investments reflect significant progress toward fulfilling the president’s pledges to triple Title I funding, fully fund special education, and provide preschool for all, among other priorities.
Some programs had been frozen for years until small increases in FY 2019 or FY 2020 and much more modest increases in FY 2021. The 2020 and 2021 COVID-relief packages will help schools and early childhood programs address pandemic-related costs but will not support the ongoing program needs or compensate for years of underfunding. Enacting the K-12 investments in the president’s budget would, in fact, turn the tide.
Below is a summary of the budget’s biggest funding increases. The articles in this section provide details for each existing program, including a real-world example of what the program is accomplishing, the impact of the president’s budget, and the need for the program. The summary and analysis at the beginning of this book describes the newly proposed education programs.
Early childhood education (Head Start, Child Care and Development Block Grants, Preschool Development Grants, new preschool for all, new child care facilities and support funding) – The budget provides large increases ranging from 11 to 64 percent for the three current programs. With mandatory funding proposed in the American Jobs Act and in the American Families Act, the budget makes huge and ongoing investments, providing grants to states for universal preschool for all 3- and 4-year-olds. The budget also invests in child care by subsidizing costs for lower income families, providing a $15 minimum wage to child care workers, and helping build and upgrade child care facilities.
K-12 education – The bulk of the president’s discretionary funding increases for education are for elementary and secondary education programs. No programs are cut, although many do not receive increases. Most of the increased funding is for new programs. The biggest discretionary funding increases are:
• $20 billion for new Title I equity grant – This one program accounts for two-thirds of the total $29.8 billion discretionary increase for the Department of Education. This funding goes more than two-thirds the way toward reaching the president’s goal of tripling Title I. A greater share of funding would be allocated to the highest poverty schools to support better pay for educators and provide incentives for states and localities to distribute their own funding more equitably.
• $3.2 billion discretionary increase for special education – The budget increases funding for the Individuals with Disabilities Education Act (IDEA) state grant program by $2.6 billion (20.1 percent), raising the federal share of special education costs to 15 percent of the average national per pupil extra cost. The president’s goal is to “fully fund” special education, which would increase the federal contribution to 40 percent of excess costs.
• $1 billion for School-Based Health Professionals – This new discretionary-funded program represents the first year of a ten-year campaign to double the number of school mental health professionals and school nurses. States are expected to match 25 percent of the funds, and priority would be given to Title I-eligible schools.
Section OverviewPART 1: The Foundation for Success
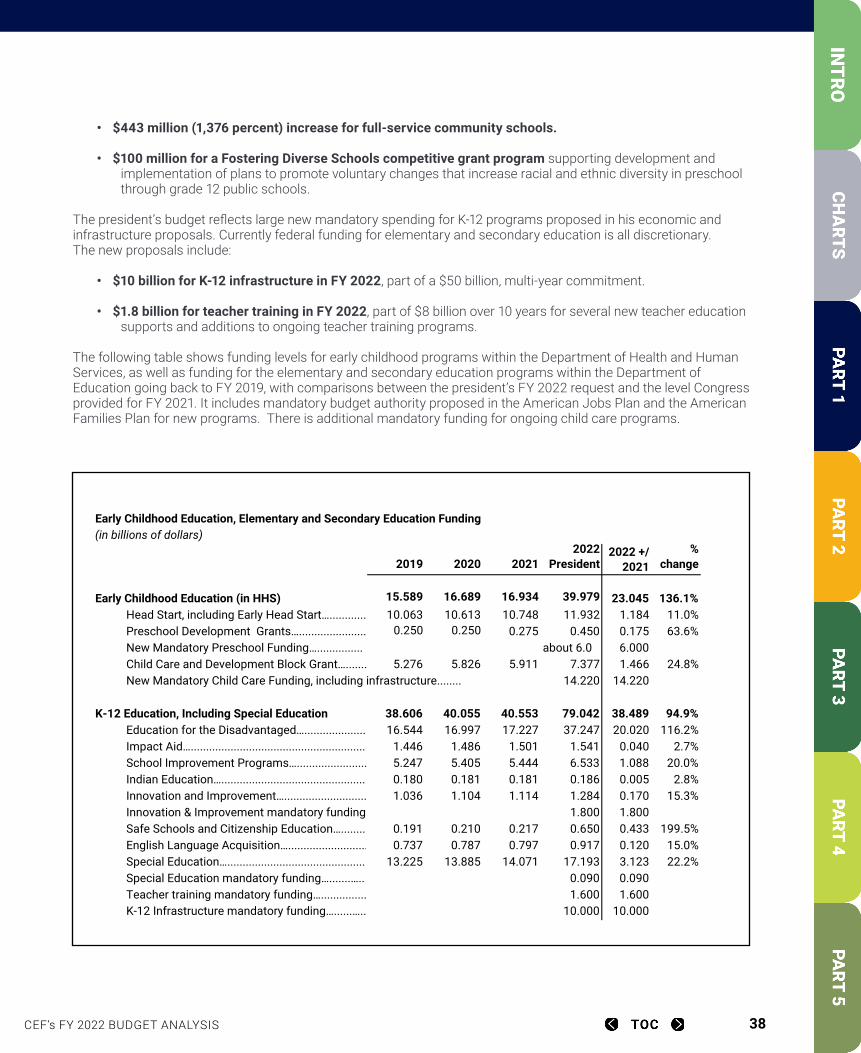
CEF’s FY 2022 BUDGET ANALYSIS 38
• $443 million (1,376 percent) increase for full-service community schools.
• $100 million for a Fostering Diverse Schools competitive grant program supporting development and implementation of plans to promote voluntary changes that increase racial and ethnic diversity in preschool through grade 12 public schools.
The president’s budget reflects large new mandatory spending for K-12 programs proposed in his economic and infrastructure proposals. Currently federal funding for elementary and secondary education is all discretionary. The new proposals include:
• $10 billion for K-12 infrastructure in FY 2022, part of a $50 billion, multi-year commitment.
• $1.8 billion for teacher training in FY 2022, part of $8 billion over 10 years for several new teacher education supports and additions to ongoing teacher training programs.
The following table shows funding levels for early childhood programs within the Department of Health and Human Services, as well as funding for the elementary and secondary education programs within the Department of Education going back to FY 2019, with comparisons between the president’s FY 2022 request and the level Congress provided for FY 2021. It includes mandatory budget authority proposed in the American Jobs Plan and the American Families Plan for new programs. There is additional mandatory funding for ongoing child care programs.
$1 billion for School-Based Health Professionals – This new discretionary-funded program represents the first year of a ten-year campaign to double the number of school mental health professionals and school nurses. States are expected to match 25 percent of the funds, and priority would be given to Title I-eligible schools.
$443 million (1,376 percent) increase for full-service community schools. $100 million for a Fostering Diverse Schools competitive grant program supporting
development and implementation of plans to support voluntary changes that increase racial and ethnic diversity in preschool through grade 12 public schools.
The president’s budget reflects large new mandatory spending for K-12 programs proposed in his economic and infrastructure proposals. Currently federal funding for elementary and secondary education is all discretionary. The new proposals include:
$10 billion for K-12 infrastructure in FY 2022, part of a $50 billion, multi-year commitment. $1.8 billion for teacher training in FY 2022, part of $8 billion over 10 years for several new
teacher education supports and additions to ongoing teacher training programs.
The following table shows funding levels for early childhood programs within the Department of Health and Human Services as well as funding for the elementary and secondary education programs within the Department of Education going back to FY 2019, with comparisons between the president’s FY 2022 request and the level Congress provided for FY 2021. It includes mandatory budget authority proposed in the American Jobs Plan and the American Families Plan for new programs. There is additional mandatory funding for ongoing child care programs.
Early Childhood Education, Elementary and Secondary Education Funding(in billions of dollars)
2019 2020 20212022
President2022 +/-
2021%
change
Early Childhood Education (in HHS) 15.589 16.689 16.934 39.979 23.045 136.1%Head Start, including Early Head Start…............ 10.063 10.613 10.748 11.932 1.184 11.0%Preschool Development Grants…...................... 0.250 0.250 0.275 0.450 0.175 63.6%New Mandatory Preschool Funding…............... about 6.0 6.000Child Care and Development Block Grant…....... 5.276 5.826 5.911 7.377 1.466 24.8%New Mandatory Child Care Funding, including infrastructure........ 14.220 14.220
K-12 Education, Including Special Education 38.606 40.055 40.553 79.042 38.489 94.9%Education for the Disadvantaged…..................... 16.544 16.997 17.227 37.247 20.020 116.2%Impact Aid….......................................................... 1.446 1.486 1.501 1.541 0.040 2.7%School Improvement Programs…....................... 5.247 5.405 5.444 6.533 1.088 20.0%Indian Education…................................................ 0.180 0.181 0.181 0.186 0.005 2.8%Innovation and Improvement…........................... 1.036 1.104 1.114 1.284 0.170 15.3%Innovation & Improvement mandatory funding 1.800 1.800Safe Schools and Citizenship Education…......... 0.191 0.210 0.217 0.650 0.433 199.5%English Language Acquisition….......................... 0.737 0.787 0.797 0.917 0.120 15.0%Special Education….............................................. 13.225 13.885 14.071 17.193 3.123 22.2%Special Education mandatory funding….......….. 0.090 0.090Teacher training mandatory funding…............... 1.600 1.600K-12 Infrastructure mandatory funding…......….. 10.000 10.000
CEF’s FY 2022 BUDGET ANALYSIS 39
Shady Lane Elementary in Columbus City Schools (Franklin County, OH) is a Title I schoolwide program serving 301 students. The student population is 100 percent economically disadvantaged, 6.9 percent English language learners, and 78 percent students of color, reflecting the composition of the city of Columbus. Expectations of excellence and high achievement have contributed to closing achievement gaps across subgroups. The achievement gap between white and Black students narrowed in every tested area from 2018 to 2020.
All Shady Lane students engage in a structured environment focusing on social and emotional needs and development infused in a robust academic curriculum. In addition, all students participate in weekly art, music, and physical education classes. With a Unified Arts environment, students in grades 4 and 5 have the opportunity to participate in band, orchestra, and/or choir. All students are part of at least two performances each year, ranging from plays in kindergarten to full musical productions in the upper grades. Every student displays a piece of artwork at the annual school-wide art show. Family engagement is another keystone value at Shady Lane with two family engagement nights focusing on reading and math. Families learn how their child is progressing, as well as receiving “Make It, Take It” activities to help them at home. With more than 300 years of combined teaching experience, Shady Lane prides itself on meeting the needs of all students and their families.
DES CRIP TION
As the cornerstone of the Elementary and Secondary Education Act (ESEA), Title I provides funds mainly to school districts to help disadvantaged children achieve proficiency on challenging academic standards and to improve the performance of low-achieving schools. Amended in 2015 by the Every Student Succeeds Act (ESSA), the Title I program continues the traditional federal focus on closing achievement gaps and improving the academic achievement of underperforming groups of students. Title I funding is allocated primarily by formula grants to states and in turn to school districts based on the number and concentration of low-income children and other categories of disadvantaged children residing in those jurisdictions. Two-thirds of children served by Title I are minority students. Children participating in Title I receive reading, language arts, and mathematics instruction through schoolwide approaches or targeted assistance strategies. School districts implement ESSA under state plans reviewed and approved by the U.S. Department of Education. States also identify low-performing and consistently underperforming schools. Identified schools are required to undertake comprehensive or targeted improvement measures to increase academic proficiency, as well as boost school performance on four other accountability indicators. ESSA provides more flexibility to states in designing their accountability systems within the parameters of federal law and allows substantial local discretion in developing school improvement interventions. States also must continue to implement challenging standards aligned with entry-level college coursework and relevant career skills, as well as maintain a system of state academic assessments. These requirements have been adjusted to reflect the public health protocols resulting from the COVID-19 pandemic.A variety of specialized subprograms are also authorized under Title I, including programs for Migratory Children and Neglected and Delinquent Children and a separate State Assessment Grant program. The previous authorization for School Improvement Grants was replaced with a larger state set-aside authority, reserving funds out of the federal Title I school district allocations to continue state-awarded subgrants for comprehensive and targeted interventions in low-performing schools.
Title I Grants to StatesTitle 1, Elementary & Secondary Education Act (Every Student Succeeds Act)
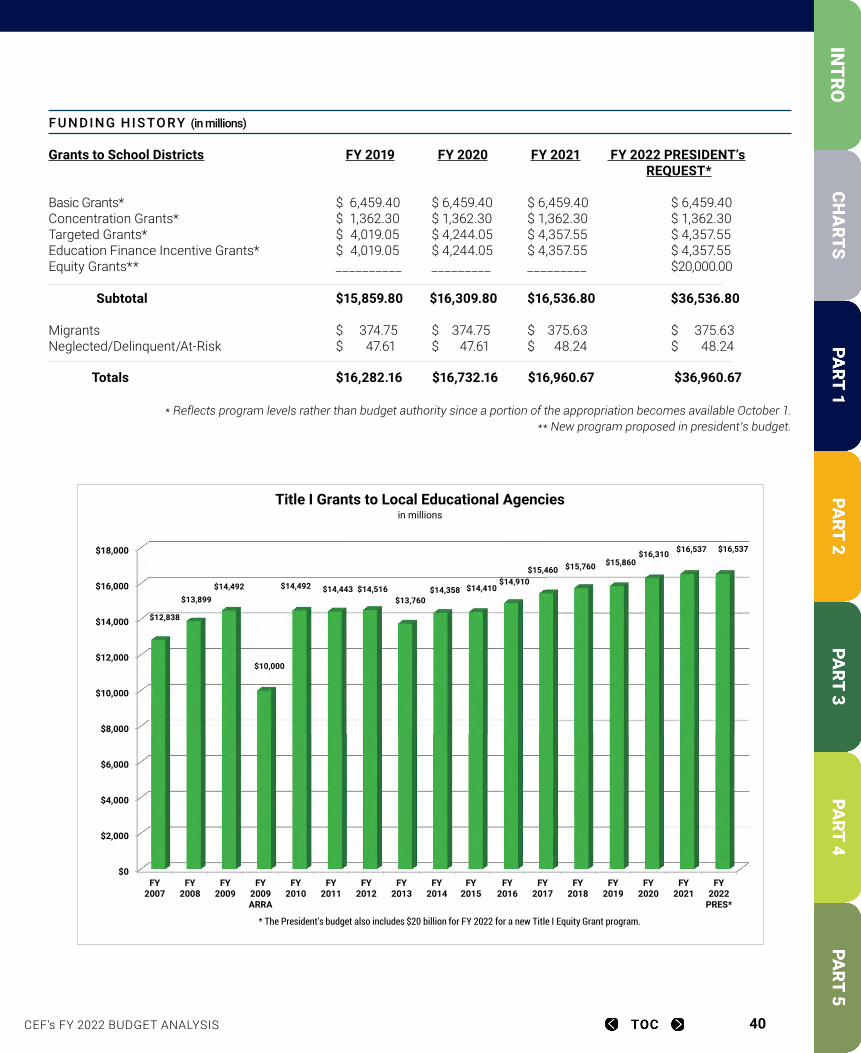
CEF’s FY 2022 BUDGET ANALYSIS 40
F U N DING HIS TORY (in millions)
Grants to School Districts FY 2019 FY 2020 FY 2021 FY 2022 PRESIDENT’s REQUEST*
Basic Grants* $ 6,459.40 $ 6,459.40 $ 6,459.40 $ 6,459.40Concentration Grants* $ 1,362.30 $ 1,362.30 $ 1,362.30 $ 1,362.30Targeted Grants* $ 4,019.05 $ 4,244.05 $ 4,357.55 $ 4,357.55Education Finance Incentive Grants* $ 4,019.05 $ 4,244.05 $ 4,357.55 $ 4,357.55Equity Grants** __________ _________ _________ $20,000.00
Subtotal $15,859.80 $16,309.80 $16,536.80 $36,536.80
Migrants $ 374.75 $ 374.75 $ 375.63 $ 375.63Neglected/Delinquent/At-Risk $ 47.61 $ 47.61 $ 48.24 $ 48.24
Totals $16,282.16 $16,732.16 $16,960.67 $36,960.67
* Reflects program levels rather than budget authority since a portion of the appropriation becomes available October 1.** New program proposed in president’s budget.FY 2007 FY 2008 FY 2009 FY 2009 ARRA FY 2010 FY 2011 FY 2012 FY 2013 FY 2014 FY 2015 FY 2016 FY 2017 FY 2018 FY 2019 FY 2020
Appropriat 12,838$ 13,899$ 14,492$ 10,000$ 14,492$ 14,443$ 14,516$ 13,760$ 14,358$ 14,410$ 14,910$ 15,460$ 15,760$ 15,860$ 16,310$
Authorized 25,000$ 25,000$
$0
$2,000
$4,000
$6,000
$8,000
$10,000
$12,000
$14,000
$16,000
$18,000
FY2007
FY2008
FY2009
FY2009ARRA
FY2010
FY2011
FY2012
FY2013
FY2014
FY2015
FY2016
FY2017
FY2018
FY2019
FY2020
FY2021
FY2022
PRES*
$12,838
$13,899$14,492
$10,000
$14,492 $14,443 $14,516$13,760
$14,358 $14,410$14,910
$15,460 $15,760 $15,860$16,310 $16,537 $16,537
Title I Grants to Local Educational Agencies in millions
* The President's budget also includes $20 billion for FY 2022 for a new Title I Equity Grant program.
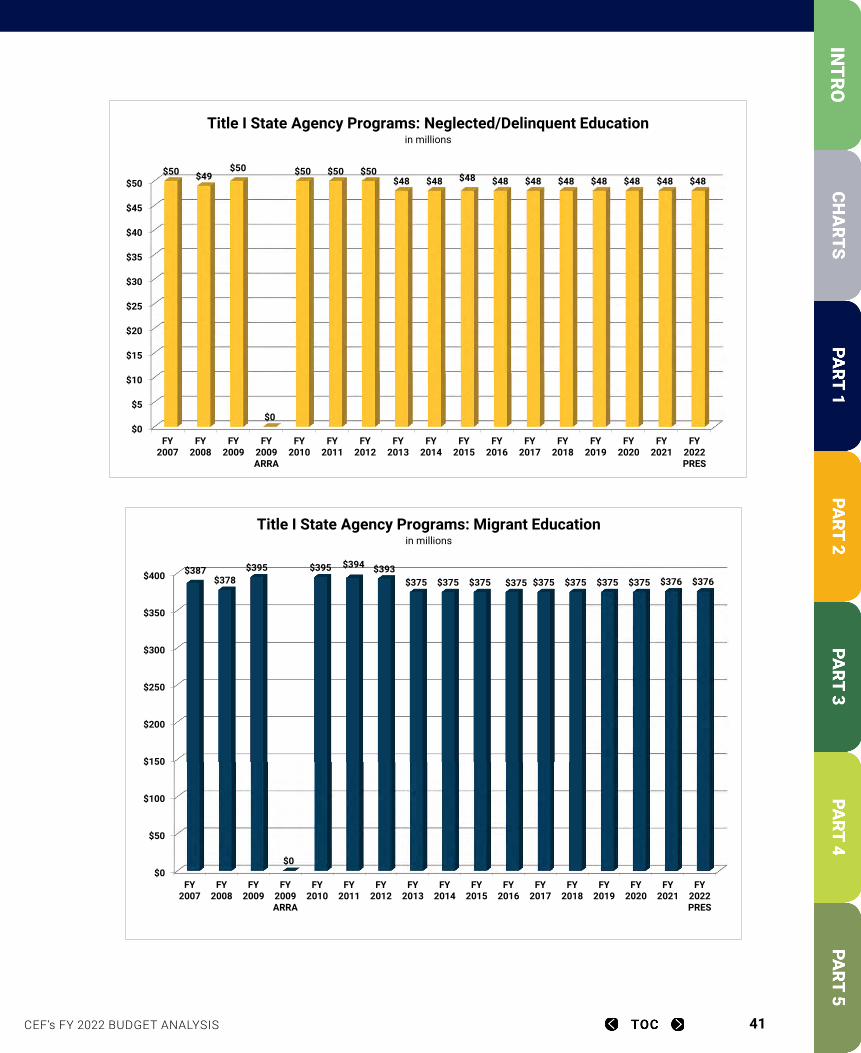
CEF’s FY 2022 BUDGET ANALYSIS 41
FY 2007 FY 2008 FY 2009 FY 2009 ARFY 2010 FY 2011 FY 2012 FY 2013 FY 2014 FY 2015 FY 2016 FY 2017 FY 2018 FY 2019 FY 2020 FY 2021 FY 2022 PRES387 378 395 0 395 394 393 375 375 375 375 375 375 375 375 376 376
$0
$50
$100
$150
$200
$250
$300
$350
$400
FY2007
FY2008
FY2009
FY2009ARRA
FY2010
FY2011
FY2012
FY2013
FY2014
FY2015
FY2016
FY2017
FY2018
FY2019
FY2020
FY2021
FY2022PRES
$387$378
$395
$0
$395 $394 $393$375 $375 $375 $375 $375 $375 $375 $375 $376 $376
Title I State Agency Programs: Migrant Educationin millions
FY 2007 FY 2008 FY 2009 FY 2009 ARFY 2010 FY 2011 FY 2012 FY 2013 FY 2014 FY 2015 FY 2016 FY 2017 FY 2018 FY 2019 FY 2020 FY 2021 FY 2022 PRES50 49 50 0 50 50 50 48 48 48 48 48 48 48 48 48 48
$0
$5
$10
$15
$20
$25
$30
$35
$40
$45
$50
FY2007
FY2008
FY2009
FY2009ARRA
FY2010
FY2011
FY2012
FY2013
FY2014
FY2015
FY2016
FY2017
FY2018
FY2019
FY2020
FY2021
FY2022PRES
$50 $49$50
$0
$50 $50 $50$48 $48 $48 $48 $48 $48 $48 $48 $48 $48
Title I State Agency Programs: Neglected/Delinquent Educationin millions
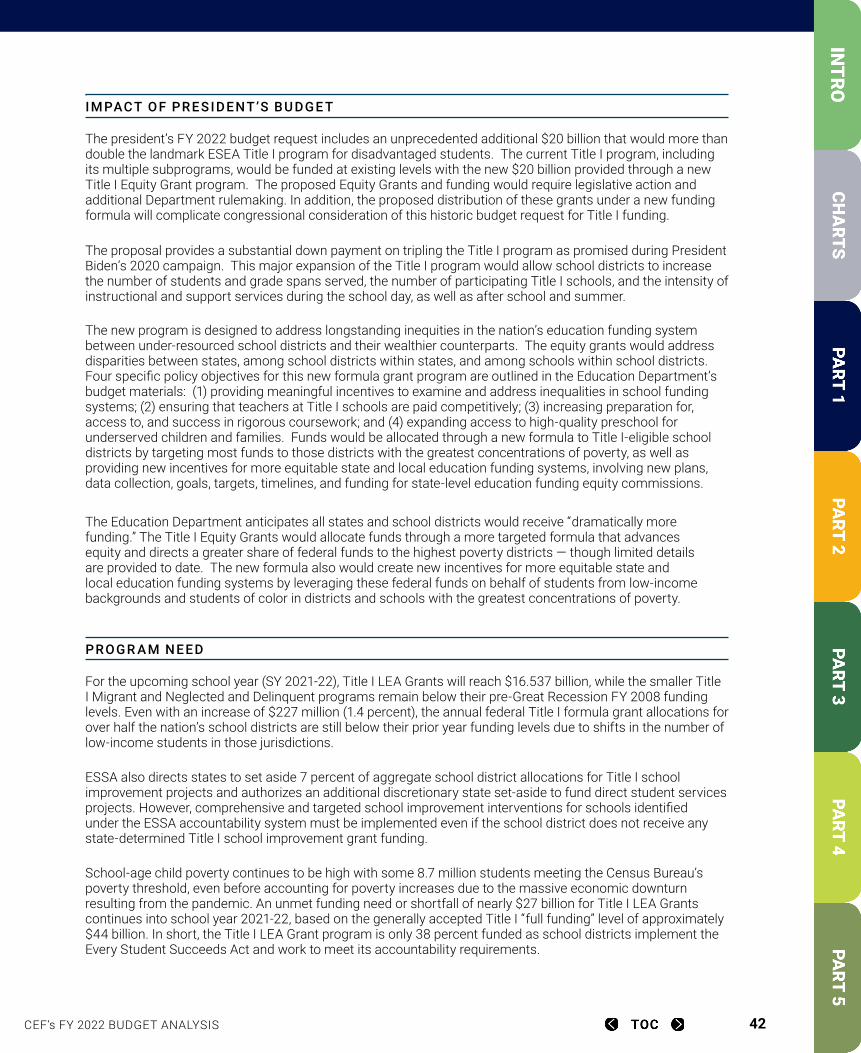
CEF’s FY 2022 BUDGET ANALYSIS 42
. IM PACT OF PR ES IDENT’S BU DGE T
The president’s FY 2022 budget request includes an unprecedented additional $20 billion that would more than double the landmark ESEA Title I program for disadvantaged students. The current Title I program, including its multiple subprograms, would be funded at existing levels with the new $20 billion provided through a new Title I Equity Grant program. The proposed Equity Grants and funding would require legislative action and additional Department rulemaking. In addition, the proposed distribution of these grants under a new funding formula will complicate congressional consideration of this historic budget request for Title I funding.
The proposal provides a substantial down payment on tripling the Title I program as promised during President Biden’s 2020 campaign. This major expansion of the Title I program would allow school districts to increase the number of students and grade spans served, the number of participating Title I schools, and the intensity of instructional and support services during the school day, as well as after school and summer.
The new program is designed to address longstanding inequities in the nation’s education funding system between under-resourced school districts and their wealthier counterparts. The equity grants would address disparities between states, among school districts within states, and among schools within school districts. Four specific policy objectives for this new formula grant program are outlined in the Education Department’s budget materials: (1) providing meaningful incentives to examine and address inequalities in school funding systems; (2) ensuring that teachers at Title I schools are paid competitively; (3) increasing preparation for, access to, and success in rigorous coursework; and (4) expanding access to high-quality preschool for underserved children and families. Funds would be allocated through a new formula to Title I-eligible school districts by targeting most funds to those districts with the greatest concentrations of poverty, as well as providing new incentives for more equitable state and local education funding systems, involving new plans, data collection, goals, targets, timelines, and funding for state-level education funding equity commissions.
The Education Department anticipates all states and school districts would receive “dramatically more funding.” The Title I Equity Grants would allocate funds through a more targeted formula that advances equity and directs a greater share of federal funds to the highest poverty districts — though limited details are provided to date. The new formula also would create new incentives for more equitable state and local education funding systems by leveraging these federal funds on behalf of students from low-income backgrounds and students of color in districts and schools with the greatest concentrations of poverty.
PROGR A M N EED
For the upcoming school year (SY 2021-22), Title I LEA Grants will reach $16.537 billion, while the smaller Title I Migrant and Neglected and Delinquent programs remain below their pre-Great Recession FY 2008 funding levels. Even with an increase of $227 million (1.4 percent), the annual federal Title I formula grant allocations for over half the nation’s school districts are still below their prior year funding levels due to shifts in the number of low-income students in those jurisdictions.
ESSA also directs states to set aside 7 percent of aggregate school district allocations for Title I school improvement projects and authorizes an additional discretionary state set-aside to fund direct student services projects. However, comprehensive and targeted school improvement interventions for schools identified under the ESSA accountability system must be implemented even if the school district does not receive any state-determined Title I school improvement grant funding.
School-age child poverty continues to be high with some 8.7 million students meeting the Census Bureau’s poverty threshold, even before accounting for poverty increases due to the massive economic downturn resulting from the pandemic. An unmet funding need or shortfall of nearly $27 billion for Title I LEA Grants continues into school year 2021-22, based on the generally accepted Title I “full funding” level of approximately $44 billion. In short, the Title I LEA Grant program is only 38 percent funded as school districts implement the Every Student Succeeds Act and work to meet its accountability requirements.
CEF’s FY 2022 BUDGET ANALYSIS 43
Nearly 90 percent of the nation’s school districts and over half of all public schools participate in the ESEA Title I program. At the FY 2021 funding level, a majority of these Title I-eligible school districts will actually again see a reduction in their federal Title I formula grant allocation. A significant funding increase for FY 2022 is needed to help meet program responsibilities under the ESSA accountability system, particularly since the appropriation levels over the past decade have too often failed to keep pace with inflation. The pandemic-related learning losses for educationally disadvantaged children attributed to emergency school closures and remote learning situations will further exacerbate the academic deficits the Title I program was created to address. The effects of pandemic learning loss will extend for multiple school years and require accelerated instructional strategies, extended time, and significant costs to recoup the interrupted learning experienced in school years 2019-20 and 2020-21.
CONTACT IN FO
Jeff Simering Council of the Great City Schools (202) 393-2427 | [email protected]
CEF’s FY 2022 BUDGET ANALYSIS 44
Comprehensive Literacy State Development (CLSD) Program: Literacy Education for All, Results for the Nation (LEARN)Title II, Part B, Elementary & Secondary Education Act (Every Student Succeeds Act) The LEARN program is based on the successes of the Striving Readers Comprehensive Literacy (SRCL) program, which first received funding in 2011 to provide comprehensive literacy development grants to six states (GA, LA, MT, NV, PA, and TX). In fall 2017, SRCL grants were awarded to a cohort of 11 states (GA, KS, KY, LA, MD, MN, MT, NM, ND, OH, and OK), the Bureau of Indian Education, and four territories. In 2019, an additional 13 grantees (AK, AR, CA, GA, HI, KY, LA, MN, MT, ND, NM, OH, and RI) received CLSD awards. These new grantees are now implementing their comprehensive literacy plans and gathering information about the results for participating students and educators. In Ohio, each subgrantee is required to submit a local literacy plan aligned to Ohio’s Plan to Raise Literacy Achievement. The state proposes to establish model literacy sites across Ohio’s diverse 16 regions. Model sites will serve as incubators for sustainable literacy development practices and demonstration sites for districts and schools considering implementing new practices. To gauge awardees’ performance, Ohio will analyze the percentage of 4-year-olds who achieve significant gains in oral language skills on the Kindergarten Readiness Assessment and Early Learning Assessment for preschool and the percentage of fifth grade, eighth grade, and high school learners who meet or exceed proficiency on state reading and English language arts assessments.
DES CRIP TION
Title II (Part B, Subpart 2, Section 2221) of the Every Student Succeeds Act (ESSA) authorizes a comprehensive literacy program entitled “Literacy Education for All, Results for the Nation” (LEARN). The foundational base for the program was the SRCL program, first funded in FY 2010, which has been renamed as the Comprehensive Literacy State Development (CLSD) program. LEARN provides competitive grants to states to help local school districts develop comprehensive, evidence-based literacy instruction and intervention plans for children and youth, birth through grade 12, struggling to reach literacy proficiency. At least 95 percent of grant funds must be distributed to local school districts with priority to entities serving the greatest number/percentage of disadvantaged students in low-performing schools. Grantee states must allocate not less than 15 percent of funds for children from birth through kindergarten entry, 40 percent for students in kindergarten through grade 5, and 40 percent for students in grades 6 through 12.
. F U N DING HIS TORY (in millions)
FY 2019 FY 2020 FY 2021 FY 2022 PRESIDENT’s REQUEST $190.00 $192.00 $192.00 $192.00
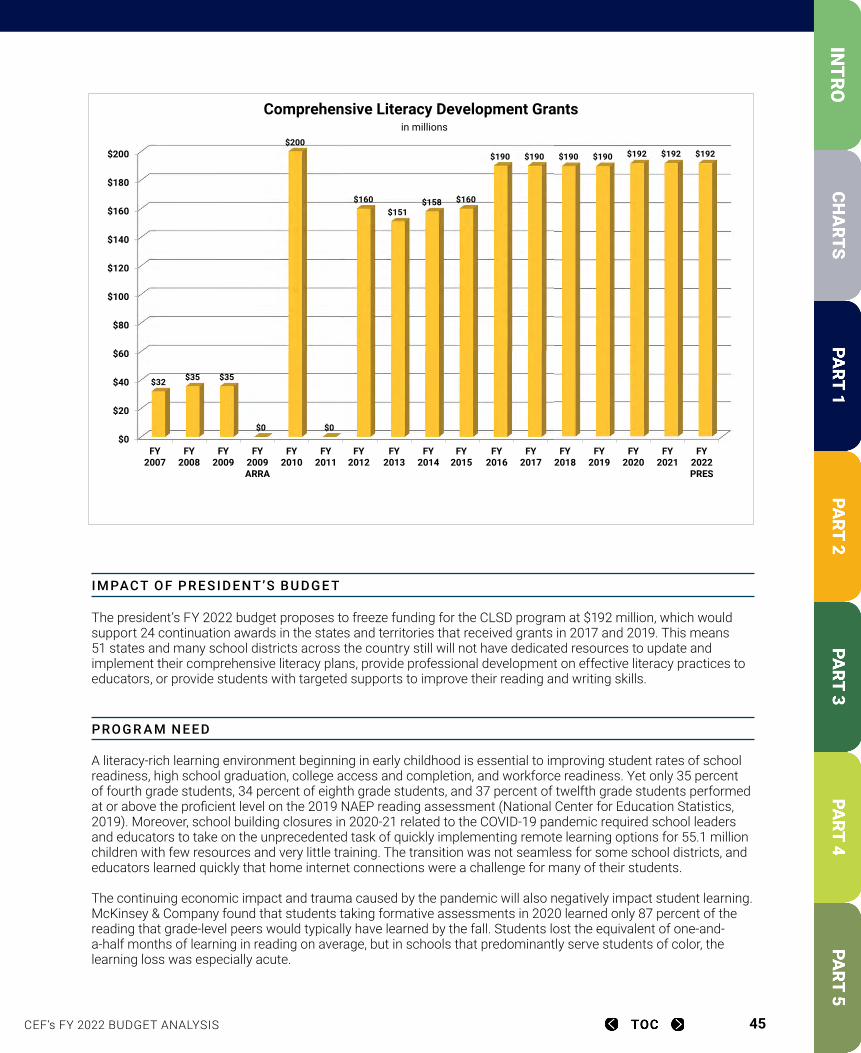
CEF’s FY 2022 BUDGET ANALYSIS 45
. IM PACT OF PR ES IDENT’S BU DGE T
The president’s FY 2022 budget proposes to freeze funding for the CLSD program at $192 million, which would support 24 continuation awards in the states and territories that received grants in 2017 and 2019. This means 51 states and many school districts across the country still will not have dedicated resources to update and implement their comprehensive literacy plans, provide professional development on effective literacy practices to educators, or provide students with targeted supports to improve their reading and writing skills.
PROGR A M N EED
A literacy-rich learning environment beginning in early childhood is essential to improving student rates of school readiness, high school graduation, college access and completion, and workforce readiness. Yet only 35 percent of fourth grade students, 34 percent of eighth grade students, and 37 percent of twelfth grade students performed at or above the proficient level on the 2019 NAEP reading assessment (National Center for Education Statistics, 2019). Moreover, school building closures in 2020-21 related to the COVID-19 pandemic required school leaders and educators to take on the unprecedented task of quickly implementing remote learning options for 55.1 million children with few resources and very little training. The transition was not seamless for some school districts, and educators learned quickly that home internet connections were a challenge for many of their students. The continuing economic impact and trauma caused by the pandemic will also negatively impact student learning. McKinsey & Company found that students taking formative assessments in 2020 learned only 87 percent of the reading that grade-level peers would typically have learned by the fall. Students lost the equivalent of one-and-a-half months of learning in reading on average, but in schools that predominantly serve students of color, the learning loss was especially acute.
FY 2007 FY 2008 FY 2009 FY 2009 ARR FY 2010 FY 2011 FY 2012 FY 2013 FY 2014 FY 2015 FY 2016 FY 2017 FY 2018 FY 2019 FY 2020 FY 2021 FY 2022 PRES32$ 35$ 35$ -$ 200$ -$ 160$ 151$ 158$ 160$ 190$ 190$ 190$ 190$ 192$ 192$ 192$
$0
$20
$40
$60
$80
$100
$120
$140
$160
$180
$200
FY2007
FY2008
FY2009
FY2009ARRA
FY2010
FY2011
FY2012
FY2013
FY2014
FY2015
FY2016
FY2017
FY2018
FY2019
FY2020
FY2021
FY2022PRES
$32 $35 $35
$0
$200
$0
$160$151
$158 $160
$190 $190 $190 $190 $192 $192 $192
Comprehensive Literacy Development Grantsin millions
CEF’s FY 2022 BUDGET ANALYSIS 46
Creating a globally competent workforce depends on students cultivating and using their reading and writing skills to excel in areas such as math, science, and technology. Through comprehensive literacy grants, LEARN funds critical professional development to improve literacy instruction for struggling readers and writers from birth through high school. It is therefore essential the program receive no less than $500 million in FY 2022 as part of an effort to expand the grants to all 50 states.
CONTACT IN FO
Amanda Karhuse National Association of Secondary School Principals (703) 627-6421 • [email protected]
Kevin Maher American Library Association (703) 860-7292 • [email protected]

CEF’s FY 2022 BUDGET ANALYSIS 47
Innovative Approaches to LiteracyTitle II, Part B, Elementary & Secondary Education Act (Every Student Succeeds Act) The mission of the Yukon-Koyukuk School District is to provide students the skills and knowledge to become contributing members of their families, communities, and society. In 2018 the district received an IAL grant to address the needs of its students and families, motivating students to read for learning as well as enjoyment. The grant supports access to up-to-date material and trained librarian staff. The district is working with the Parents and Children Together program to distribute high-quality fiction, non-fiction and STEM-related books to students. This successful program reaches 100 percent of the district’s students, is increasing the book-to-student ratio, and enhancing the literacy teaching skills of school library workers.
DES CRIP TION
Recognizing the link between early literacy and future success, Senator Jack Reed (D-RI) and the late Senator Thad Cochran (R-MS) sponsored legislation directing the Department of Education to create the Innovative Approaches to Literacy (IAL) grant program, targeting underserved school libraries and nonprofit organizations. In 2012, IAL replaced the Improving Literacy through School Libraries program. At least half these grants are reserved for school libraries —the only source of federal funds for those entities. IAL grants target high-need communities by providing support for schools that develop and enhance innovative and effective school library programs, provide early literacy services, and provide high-quality and reading level-appropriate books for children. These IAL grants provide models for school libraries of how to create effective literacy programs.
Many school libraries across the United States have a challenging time keeping books and materials up to date when states and local school districts are faced with deep budget cuts. The average copyright date of materials in one high school library in a North Dakota high school is 1965, with books on the shelves dating back as far as the 1930s. Sadly, this is not an exception. Many schools across the country face this very same problem. In addition, some children do not have books to read on their own or with family. IAL allows schools and nonprofits to provide children with books to keep in their homes. Recent reading scores announced in the 2019 National Assessment of Education Progress show a decline in reading scores for fourth and eighth grade students. Many experts predict these scores may lag further as a result of the strains on schools and school librarians during the COVID-19 pandemic. This troubling decline demonstrates the continued need for IAL, and the program should be increased to reach students in every state. F U N DING HIS TORY (in millions)
FY 2019 FY 2020 FY 2021 FY 2022 PRESIDENT’s REQUEST $27.00 $27.00 $28.00 $28.00
CEF’s FY 2022 BUDGET ANALYSIS 48
. IM PACT OF PR ES IDENT’S BU DGE T
The president’s FY 2022 budget recommends $28 million for IAL to support effective literacy programs through school libraries and nonprofits. The pandemic continues to strain young students and families, which has negatively impacted reading proficiency and learning — particularly for children in underserved communities. Boosting investment in the IAL program to $50 million is vitally important and will help meet more states’ needs. Children introduced to literacy at an early age are more likely to become lifelong readers, graduate high school, and enroll in college. However, more than one in three American children start kindergarten lacking literacy skills, and many have no books in their homes. IAL grants to nonprofit organizations and school libraries support the distribution of books to young children and support targeted literacy guidance. These critical functions must continue with federal support dedicated to school libraries and nonprofits.
PROGR A M N EED
According to the American Academy of Pediatrics, children introduced to early reading and literacy support tend to read earlier and excel in school compared to children who lack the same access to books and literacy activities. Early literacy mastery is a strong indicator of future success in school and in life. Unfortunately, more than one in three American children start kindergarten without foundational skills to learn to read. Funding for IAL remains below the FY 2012 appropriations level of $28.57 million. This minimal funding level means no grants for many school libraries in low-income areas and fewer opportunities for children to receive literacy training. Families will continue to struggle to shrink literacy and technology gaps without this important support program. School libraries provide equitable physical and intellectual access to the resources and tools required for learning in a warm, stimulating, and safe environment.
The strains on school library resources and literacy support have been exasperated by the COVID-19 pandemic, particularly among students most in need of these services. Ensuring children have books and targeted literacy resources, whether schools are in remote, in-person, or hybrid learning mode, is an urgent need for young students struggling to acquire and increase literacy skills.
The program must be maintained at a minimum at $50 million in FY 2022, so all students have access to 21st century library and literacy programs.
CONTACT IN FO
Kevin Maher American Library Association (202) 628-8410 | [email protected]
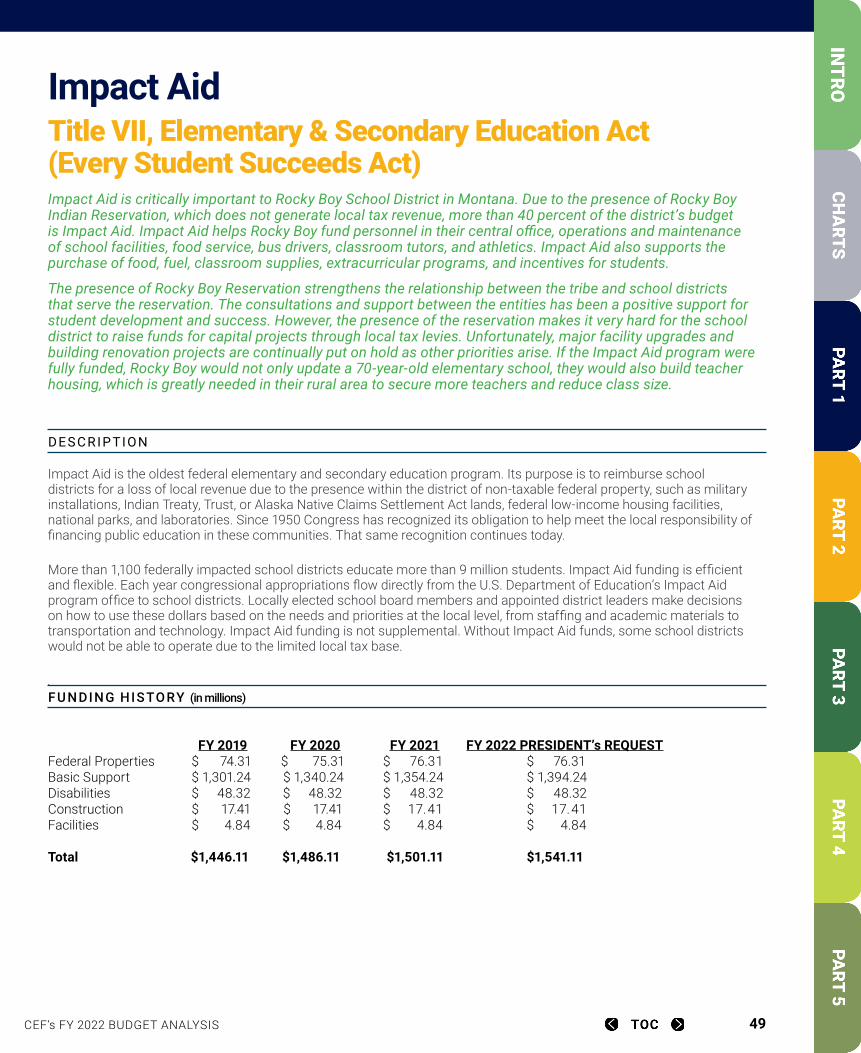
CEF’s FY 2022 BUDGET ANALYSIS 49
Impact AidTitle VII, Elementary & Secondary Education Act (Every Student Succeeds Act) Impact Aid is critically important to Rocky Boy School District in Montana. Due to the presence of Rocky Boy Indian Reservation, which does not generate local tax revenue, more than 40 percent of the district’s budget is Impact Aid. Impact Aid helps Rocky Boy fund personnel in their central office, operations and maintenance of school facilities, food service, bus drivers, classroom tutors, and athletics. Impact Aid also supports the purchase of food, fuel, classroom supplies, extracurricular programs, and incentives for students.
The presence of Rocky Boy Reservation strengthens the relationship between the tribe and school districts that serve the reservation. The consultations and support between the entities has been a positive support for student development and success. However, the presence of the reservation makes it very hard for the school district to raise funds for capital projects through local tax levies. Unfortunately, major facility upgrades and building renovation projects are continually put on hold as other priorities arise. If the Impact Aid program were fully funded, Rocky Boy would not only update a 70-year-old elementary school, they would also build teacher housing, which is greatly needed in their rural area to secure more teachers and reduce class size.
DES CRIP TION
Impact Aid is the oldest federal elementary and secondary education program. Its purpose is to reimburse school districts for a loss of local revenue due to the presence within the district of non-taxable federal property, such as military installations, Indian Treaty, Trust, or Alaska Native Claims Settlement Act lands, federal low-income housing facilities, national parks, and laboratories. Since 1950 Congress has recognized its obligation to help meet the local responsibility of financing public education in these communities. That same recognition continues today.
More than 1,100 federally impacted school districts educate more than 9 million students. Impact Aid funding is efficient and flexible. Each year congressional appropriations flow directly from the U.S. Department of Education’s Impact Aid program office to school districts. Locally elected school board members and appointed district leaders make decisions on how to use these dollars based on the needs and priorities at the local level, from staffing and academic materials to transportation and technology. Impact Aid funding is not supplemental. Without Impact Aid funds, some school districts would not be able to operate due to the limited local tax base. . F U N DING HIS TORY (in millions)
FY 2019 FY 2020 FY 2021 FY 2022 PRESIDENT’s REQUEST Federal Properties $ 74.31 $ 75.31 $ 76.31 $ 76.31 Basic Support $ 1,301.24 $ 1,340.24 $ 1,354.24 $ 1,394.24 Disabilities $ 48.32 $ 48.32 $ 48.32 $ 48.32 Construction $ 17.41 $ 17.41 $ 17.41 $ 17.41 Facilities $ 4.84 $ 4.84 $ 4.84 $ 4.84
Total $1,446.11 $1,486.11 $1,501.11 $1,541.11
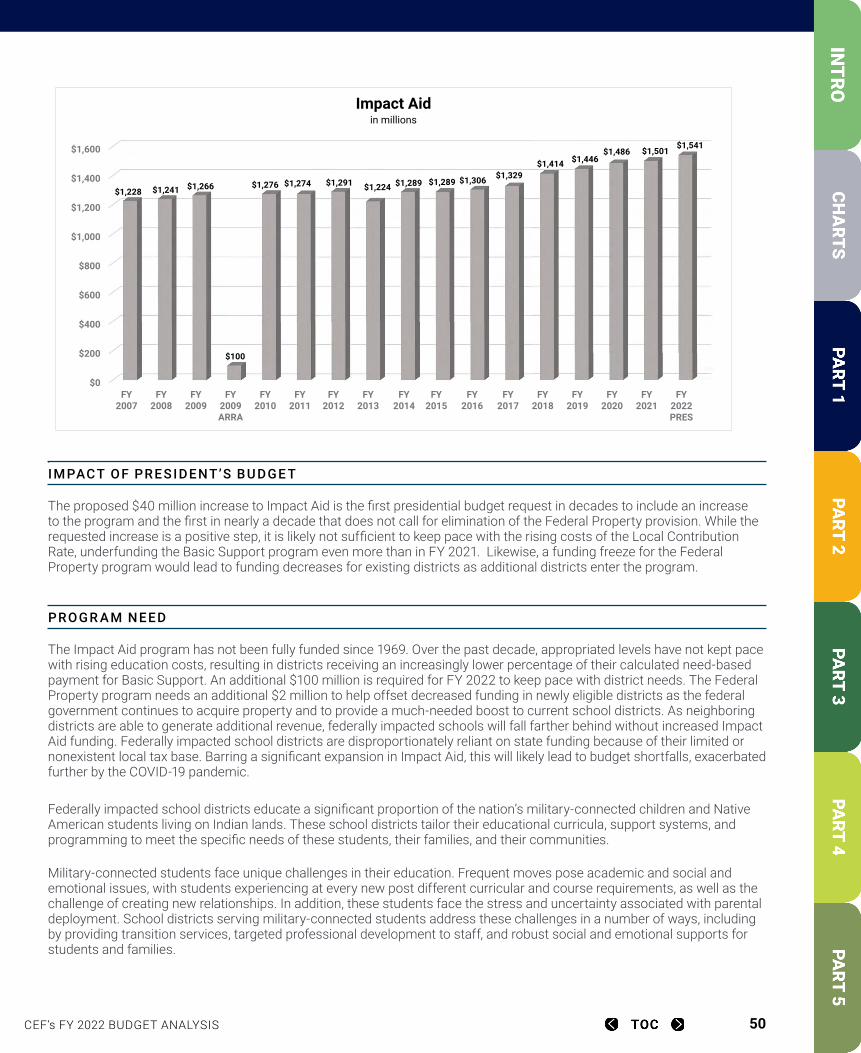
CEF’s FY 2022 BUDGET ANALYSIS 50
. IM PACT OF PR ES IDENT’S BU DGE T
The proposed $40 million increase to Impact Aid is the first presidential budget request in decades to include an increase to the program and the first in nearly a decade that does not call for elimination of the Federal Property provision. While the requested increase is a positive step, it is likely not sufficient to keep pace with the rising costs of the Local Contribution Rate, underfunding the Basic Support program even more than in FY 2021. Likewise, a funding freeze for the Federal Property program would lead to funding decreases for existing districts as additional districts enter the program.
PROGR A M N EED
The Impact Aid program has not been fully funded since 1969. Over the past decade, appropriated levels have not kept pace with rising education costs, resulting in districts receiving an increasingly lower percentage of their calculated need-based payment for Basic Support. An additional $100 million is required for FY 2022 to keep pace with district needs. The Federal Property program needs an additional $2 million to help offset decreased funding in newly eligible districts as the federal government continues to acquire property and to provide a much-needed boost to current school districts. As neighboring districts are able to generate additional revenue, federally impacted schools will fall farther behind without increased Impact Aid funding. Federally impacted school districts are disproportionately reliant on state funding because of their limited or nonexistent local tax base. Barring a significant expansion in Impact Aid, this will likely lead to budget shortfalls, exacerbated further by the COVID-19 pandemic.
Federally impacted school districts educate a significant proportion of the nation’s military-connected children and Native American students living on Indian lands. These school districts tailor their educational curricula, support systems, and programming to meet the specific needs of these students, their families, and their communities.
Military-connected students face unique challenges in their education. Frequent moves pose academic and social and emotional issues, with students experiencing at every new post different curricular and course requirements, as well as the challenge of creating new relationships. In addition, these students face the stress and uncertainty associated with parental deployment. School districts serving military-connected students address these challenges in a number of ways, including by providing transition services, targeted professional development to staff, and robust social and emotional supports for students and families.
FY 2007 FY 2008 FY 2009 FY 2009 ARRFY 2010 FY 2011 FY 2012 FY 2013 FY 2014 FY 2015 FY 2016 FY 2017 FY 2018 FY 2019 FY 2020 FY 2021 FY 2022 PRES1,228$ 1,241$ 1,266$ 100$ 1,276$ 1,274$ 1,291$ 1,224$ 1,289$ 1,289$ 1,306$ 1,329$ 1,414$ 1,446$ 1,486$ 1,501$ 1,541$
$0
$200
$400
$600
$800
$1,000
$1,200
$1,400
$1,600
FY2007
FY2008
FY2009
FY2009ARRA
FY2010
FY2011
FY2012
FY2013
FY2014
FY2015
FY2016
FY2017
FY2018
FY2019
FY2020
FY2021
FY2022PRES
$1,228 $1,241 $1,266
$100
$1,276 $1,274 $1,291 $1,224 $1,289 $1,289 $1,306 $1,329 $1,414 $1,446
$1,486 $1,501 $1,541
Impact Aidin millions

CEF’s FY 2022 BUDGET ANALYSIS 51
Students living on Indian trust or treaty land or Alaska Native Claims Settlement Act land – most of whom are Native American — also face distinct challenges related to their education. School districts serving these students consult with tribal leaders, community stakeholders, and parents to identify and address specific needs. With the often stark realities of reservation life — which in many places includes high rates of poverty and unemployment, rural and remote lifestyles, and the intersection of different identities and cultures — schools help students by addressing local priorities such as daily nutrition, physical and mental health supports, assistance with broadband access and technology, and culturally relevant curriculum, including the integration of Native languages and traditions.
CONTACT IN FO
Leslie Finnan National Association of Federally Impacted Schools (202) 624-3614 | [email protected]
Supporting Effective Instruction State GrantsTitle II, Part A, Elementary & Secondary Education Act (Every Student Succeeds Act) A number of states, including Arizona, Delaware, Idaho, Kansas, Ohio, and Washington, are leveraging Title II, Part A funding to provide comprehensive induction programs to early career teachers. Washington offers induction and mentoring for new teachers through the Beginning Educator Support Team (BEST) program. Since 2012, the Office of the Superintendent of Public Instruction has offered a competitive grant to create BEST programs in districts around the state. Required induction components included ongoing professional learning for beginning teachers, monthly formative observations and feedback on beginning teachers’ practice, release time for observation of accomplished teachers, and professional learning for mentors. In addition to state funding, Washington leverages Title II, Part A funds to further support these programs.
After the onset of the pandemic, Washington pivoted its professional learning efforts online. Induction trainings were conducted over Zoom, mentors replaced face-to-face meetings with virtual gatherings, observations shifted to fit digital learning environments, and tips in monthly newsletters included how to mentor virtually. In addition, mentors changed the focus of their online events to share best practices on how to engage students through a computer screen and coached around social and emotional learning for mentees and their students. BEST has also shifted its 2021 Spring Symposium to an online format with interactive trainings spread out over two days.
DES CRIP TION
Previously known as Improving Teacher Quality State Grants, the Supporting Effective Instruction State Grant program is authorized under Title II, Part A of the Every Student Succeeds Act (ESSA). The program focuses on improving student academic achievement by bolstering skills and expertise of teachers, principals, and other educators and increasing the number of high-quality teachers and principals in schools. While the program allows for versatility in using the funds for educators, states may reserve up to 3 percent of these funds solely for leadership development activities. The large majority of Title II, Part A funding is distributed by formula to local school districts from state grants, with a separate allocation for National Activities.
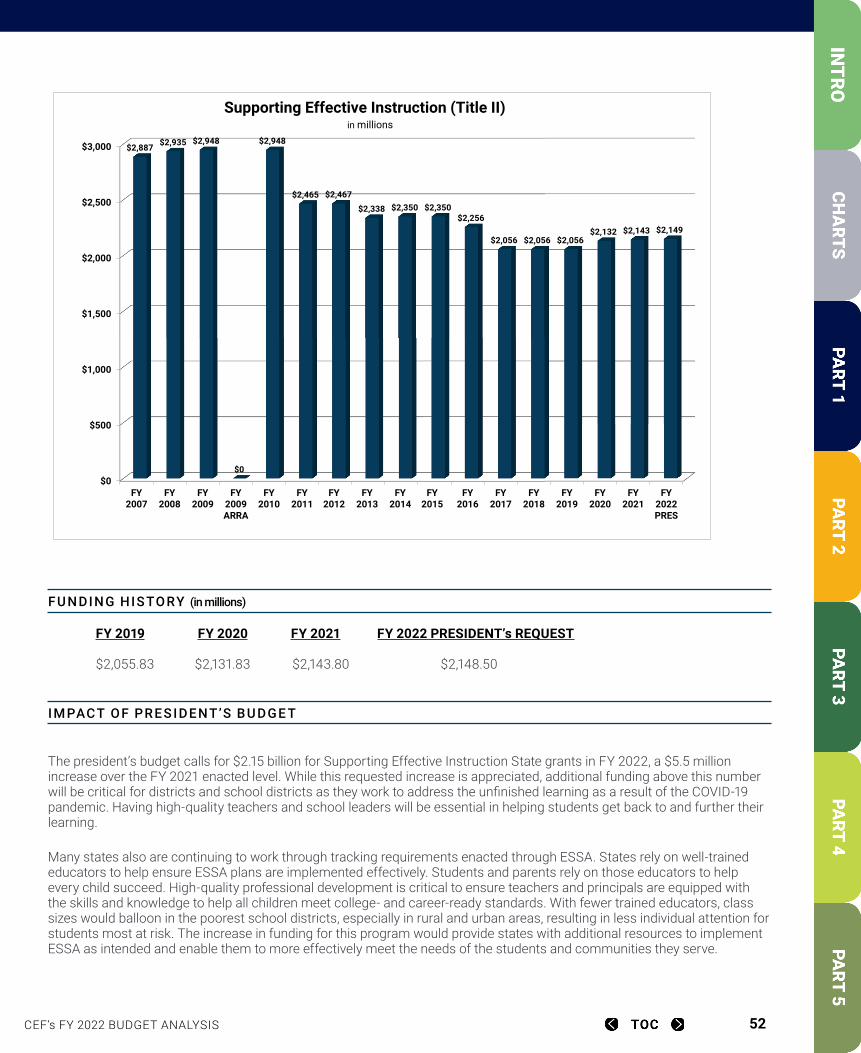
CEF’s FY 2022 BUDGET ANALYSIS 52
. F U N DING HIS TORY (in millions)
FY 2019 FY 2020 FY 2021 FY 2022 PRESIDENT’s REQUEST $2,055.83 $2,131.83 $2,143.80 $2,148.50
. IM PACT OF PR ES IDENT’S BU DGE T
The president’s budget calls for $2.15 billion for Supporting Effective Instruction State grants in FY 2022, a $5.5 million increase over the FY 2021 enacted level. While this requested increase is appreciated, additional funding above this number will be critical for districts and school districts as they work to address the unfinished learning as a result of the COVID-19 pandemic. Having high-quality teachers and school leaders will be essential in helping students get back to and further their learning.
Many states also are continuing to work through tracking requirements enacted through ESSA. States rely on well-trained educators to help ensure ESSA plans are implemented effectively. Students and parents rely on those educators to help every child succeed. High-quality professional development is critical to ensure teachers and principals are equipped with the skills and knowledge to help all children meet college- and career-ready standards. With fewer trained educators, class sizes would balloon in the poorest school districts, especially in rural and urban areas, resulting in less individual attention for students most at risk. The increase in funding for this program would provide states with additional resources to implement ESSA as intended and enable them to more effectively meet the needs of the students and communities they serve.
FY 2007 FY 2008 FY 2009 FY 2009 ARR FY 2010 FY 2011 FY 2012 FY 2013 FY 2014 FY 2015 FY 2016 FY 2017 FY 2018 FY 2019 FY 2020 FY 2021 FY 2022 PRES2,887$ 2,935$ 2,948$ -$ 2,948$ 2,465$ 2,467$ 2,338$ 2,350$ 2,350$ 2,256$ 2,056$ 2,056$ 2,056$ 2,132$ 2,143$ 2,149$
$0
$500
$1,000
$1,500
$2,000
$2,500
$3,000
FY2007
FY2008
FY2009
FY2009ARRA
FY2010
FY2011
FY2012
FY2013
FY2014
FY2015
FY2016
FY2017
FY2018
FY2019
FY2020
FY2021
FY2022PRES
$2,887 $2,935 $2,948
$0
$2,948
$2,465 $2,467
$2,338 $2,350 $2,350$2,256
$2,056 $2,056 $2,056$2,132 $2,143 $2,149
Supporting Effective Instruction (Title II)in millions
CEF’s FY 2022 BUDGET ANALYSIS 53
PROGR A M N EED
This essential program is authorized at $2.29 billion. Even with the more than $11 million FY 2021 increase, the funding level is still substantially below the amount states received earlier this decade.
Many states have faced new challenges to delivering instruction in response to the COVID-19 pandemic. Overnight schools had to shift their classrooms online without time to plan for creating sustained digital learning environments. To effectively deliver engaging instruction in a virtual setting, educators need sustained, intensive, collaborative, job-embedded and data-driven professional learning opportunities. This training helps educators learn new approaches to pedagogy and develop and refine their practice in how to use technology, assess student needs, and provide personalized virtual instruction.
States also face continuing teacher and principal shortages, challenged by both recruitment and retention. Recent reports show educator shortages have been exacerbated by the pandemic as district budgets have been cut and schools forced to lay off educators. The pandemic has also placed a significant strain on the mental health of educators, a good number of whom are now considering leaving their professions. Evidence suggests strong induction and support for early-career or newly arriving educators can be an effective policy to ensure individuals remain in the classroom. Research points to several key elements of high-quality induction most strongly associated with reduced levels of turnover — having a mentor from the same field, common planning time with other educators, regularly scheduled collaboration with others, and being part of an external network of educators serving in the same role. A national study of induction found beginning teachers who receive a comprehensive set of induction supports stay in teaching at rates more than twice that of teachers who lack these supports. For educators entering the field without these pre-service clinical practices, induction and mentoring will be even more important.
The important role of teachers and principals in enabling student success is well documented. The two most influential school-based factors for student achievement are good teachers and principals, respectively. Yet the United States is facing one of its largest educator shortages in the last 30 years, with almost every state understaffed and significant shortages in some states and fields. As previously noted, these shortages are likely to be exacerbated by the COVID-19 pandemic as well. Educator retention must become a priority of school districts if they hope to curb this growing trend. Many educators leave the classroom well before retirement age due to lack of support and access to high-quality professional development opportunities, poor working conditions, and inadequate salary. Title II, Part A can play a large part in supporting state and local efforts to address these challenges.
Despite these needs and at a time when public school enrollment continues to grow, almost half of states are providing less formula funding now than they did ten years ago. Critical federal Title II, Part A funds are used by states to develop and improve support systems and professional development for teachers and principals. In several states, Title II, Part A is the only funding available for educator professional development. Without significant funding for Title II, Part A, growth in the educator workforce will be impeded and the shortages will increase, directly impacting students’ success.
CONTACT IN FO
Stephen Kostyo Learning Policy Institute (202) 991-5234 • [email protected]
Zachary Scott National Association of Secondary School Principals (703) 860-7292 • [email protected]
CEF’s FY 2022 BUDGET ANALYSIS 54
Nita M. Lowey 21st Century Community Learning Centers Title IV, Part B, Elementary & Secondary Education Act (Every Student Succeeds Act) Valley Heights Community Education is located in rural Waterville, Kansas, serving roughly 70 students in grades pre-K-6th grade. The program is in the fourth year of a five-year 21st Century Community Learning Center grant. During a typical school year, students in Valley Heights Community Education take part in academic programming, college and career readiness activities, and robotics. In response to COVID-19, the program has transitioned to provide daily meals and deliver school work to their students and families, as well as conduct regular check-ins with families. Since schools closed in Kansas, Valley Heights has served a greater number of meals than they serve during a typical school year. In summer 2020, the program operated in person following CDC COVID-19 safety guidelines and substituted its typical summer robotics offerings with outside learning, physical activity, and more. Working with the school district, the program has helped the school counselor, along with the family advocate, conduct more than 300 home visits to students in the program, strengthening the relationships between families, the school, and Valley Heights Community Education. To best serve their rural families, many of whom have limited internet access, Valley Heights 21st CCLC provided the option for families to receive hard copies of school work and other information from the school to be delivered with their meals in order to ensure all families received the necessary information, regardless of internet access. 21st CCLC funding has allowed Valley Heights to expand beyond the school year to also offer a summer learning program each summer.
DES CRIP TION
The Nita M. Lowey 21st Century Community Learning Centers (21st CCLC) formula grant program provides financial support to local communities for afterschool, before-school, and summer learning programs serving students in low-performing schools. Programs are provided three- to five-year seed grants that support partnerships among community-based organizations, faith-based partners, private providers, and school partners (public, private, and charter). Locally funded programs keep children and teenagers safe online and offline, inspire young people to learn, and give parents peace of mind. Services include academic enrichment programs to help students meet state and local education standards and activities to complement the regular academic program, such as hands-on experiential activities, counseling programs, social and emotional learning, art, music, financial literacy, environmental education, STEM activities, physical activity, and nutrition education. The Every Student Succeeds Act (ESSA) updated performance metrics for 21st CCLC and allows funds to be used in expanded learning programs where at least 300 hours are added during the year, schools partner with community organizations, and activities do not supplant existing programs. In fall 2020 the U.S. Department of Education granted a waiver to 43 states allowing local 21st CCLC programs the ability to provide in-person programs to students in virtual school.
. F U N DING HIS TORY (in millions)
FY 2019 FY 2020 FY 2021 FY 2022 PRESIDENT’s REQUEST $1,221.67 $1,249.67 $1,259.67 $1,309.67
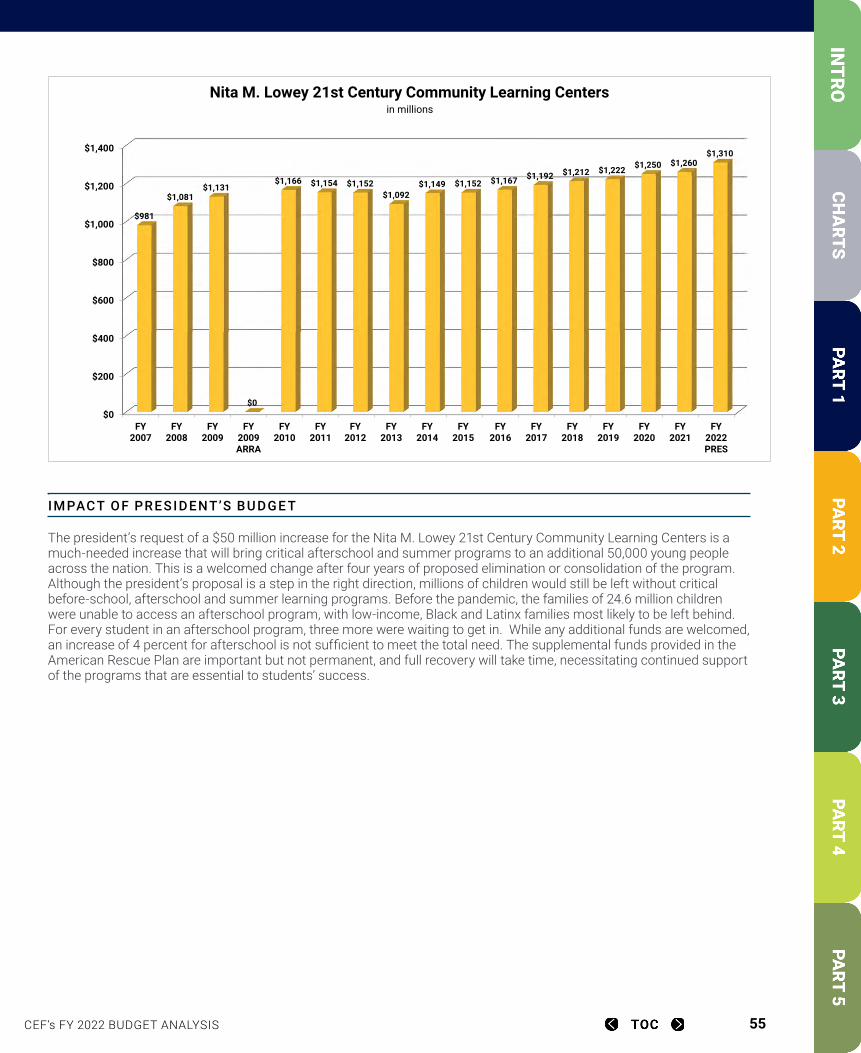
CEF’s FY 2022 BUDGET ANALYSIS 55
. IM PACT OF PR ES IDENT’S BU DGE T
The president’s request of a $50 million increase for the Nita M. Lowey 21st Century Community Learning Centers is a much-needed increase that will bring critical afterschool and summer programs to an additional 50,000 young people across the nation. This is a welcomed change after four years of proposed elimination or consolidation of the program. Although the president’s proposal is a step in the right direction, millions of children would still be left without critical before-school, afterschool and summer learning programs. Before the pandemic, the families of 24.6 million children were unable to access an afterschool program, with low-income, Black and Latinx families most likely to be left behind. For every student in an afterschool program, three more were waiting to get in. While any additional funds are welcomed, an increase of 4 percent for afterschool is not sufficient to meet the total need. The supplemental funds provided in the American Rescue Plan are important but not permanent, and full recovery will take time, necessitating continued support of the programs that are essential to students’ success.
FY 2007 FY 2008 FY 2009 FY 2009 ARFY 2010 FY 2011 FY 2012 FY 2013 FY 2014 FY 2015 FY 2016 FY 2017 FY 2018 FY 2019 FY 2020 FY 2021 FY 2022 PRES981$ 1,081$ 1,131$ -$ 1,166$ 1,154$ 1,152$ 1,092$ 1,149$ 1,152$ 1,167$ 1,192$ 1,212$ 1,222$ 1,250$ 1,260$ 1,310$
2009 level in 2018 constant dollars14171222
1950.1376147 percent deline in real dollars
$0
$200
$400
$600
$800
$1,000
$1,200
$1,400
FY2007
FY2008
FY2009
FY2009ARRA
FY2010
FY2011
FY2012
FY2013
FY2014
FY2015
FY2016
FY2017
FY2018
FY2019
FY2020
FY2021
FY2022PRES
$981
$1,081$1,131
$0
$1,166 $1,154 $1,152$1,092
$1,149 $1,152 $1,167 $1,192 $1,212 $1,222 $1,250 $1,260$1,310
Nita M. Lowey 21st Century Community Learning Centersin millions
CEF’s FY 2022 BUDGET ANALYSIS 56
PROGR A M N EED
Currently about 1.7 million low-income students are positively impacted by 21st CCLC. However, about 9.6 million students are eligible and would participate if funding and access to local community programs were available. The America After 3PM study released in December 2020 found that for every student in an afterschool program there are three students who would attend programs if one were accessible or affordable. The outcomes of student participation under this program are clear: Students who attended 21st CCLC programs made significant improvements in classroom behavior, homework completion, and class participation. Students also made gains in math and English. Another study indicates regular participation in afterschool programs by students during the elementary years resulted in narrowing the math achievement gap at grade five between high- and low-income students, improving work habits, and reducing the number of school absences (What Does the Research Say about 21st CCLC, Afterschool Alliance, 2017). Closing achievement gaps and equalizing opportunity require the combination of quality, commitment, and time provided through 21st CCLC programs supported by strong evidence and research. The pandemic has exacerbated the need for 21st CCLC programs, as they have stepped in to provide in-person supervised learning for students in virtual school and helped accelerate student learning, allowing young people to catch up and move forward.
CONTACT IN FO
Erik Peterson Afterschool Alliance (202) 347-2030 ext. 1005 | [email protected]
Ellen Fern BOSE Public Affairs Group (202) 349-2306 | [email protected]
CEF’s FY 2022 BUDGET ANALYSIS 57
Grants for State Assessment Title I, Part B, Elementary & Secondary Education Act (Every Student Succeeds Act) States use Grants for State Assessment to support development and administration of reading and mathematics as required under ESSA, including purchasing test materials and staffing positions. States would be unable to meet ESSA requirements without this funding. In addition to general reading and math assessments, states also use grant funds for English Language Proficiency (ELP) assessments. One state shared, “We would be in big trouble if the allocation decreased or was eliminated!” They added being able to use funds for both general and ELP assessments “frees up some of our state funds to build early learning formative assessments and secure technical assistance to enhance the technical quality of our systems,” important long-term strategies that would not otherwise be possible. Another state has used grant funds to “develop high-quality, technology-enhanced assessment items, and to continue to acquire copyright permissions for high-quality passages for use in assessing students’ ability to read and to write in response to complex texts.” States also use funds to develop enhanced parent reports that offer greater detail about students’ strengths and weaknesses, information about resources to help students succeed, and longitudinal data to show parents how students have performed over time. The variety of assessments and reliable and actionable resources for educators, students, and parents supported by Grants for State Assessment are critically important to students’ success across the country.
DES CRIP TION
These grants encourage and support state efforts to develop and implement high-quality assessments aligned with challenging state academic standards to measure the academic achievement of all students. Continued federal support for these grants is particularly critical as many states revise existing or develop new assessments to meet the requirements of the Every Student Succeeds Act (ESSA). Sufficient funding also will allow states to conduct audits of existing assessment systems to determine strategies for streamlining the development and administration of those tests. This program provides formula and, when appropriations levels permit, competitive funds to develop and implement assessments required under ESSA.
. F U N DING HIS TORY (in millions)
FY 2019 FY 2020 FY 2021 FY 2022 PRESIDENT’s REQUEST $378.00 $378.00 $378.00 $378.00
. IM PACT OF PR ES IDENT’S BU DGE T
The president’s budget includes $369.1 million for State Assessment Grants and $8.9 million for Competitive Assessment Grants, an amount equal to the FY 2021 appropriation. Assessments provide parents and educators with information they need to help students progress and have improved academic outcomes. State assessments help identify schools that need support in closing achievement gaps and providing quality instruction and opportunities for all students to be successful.
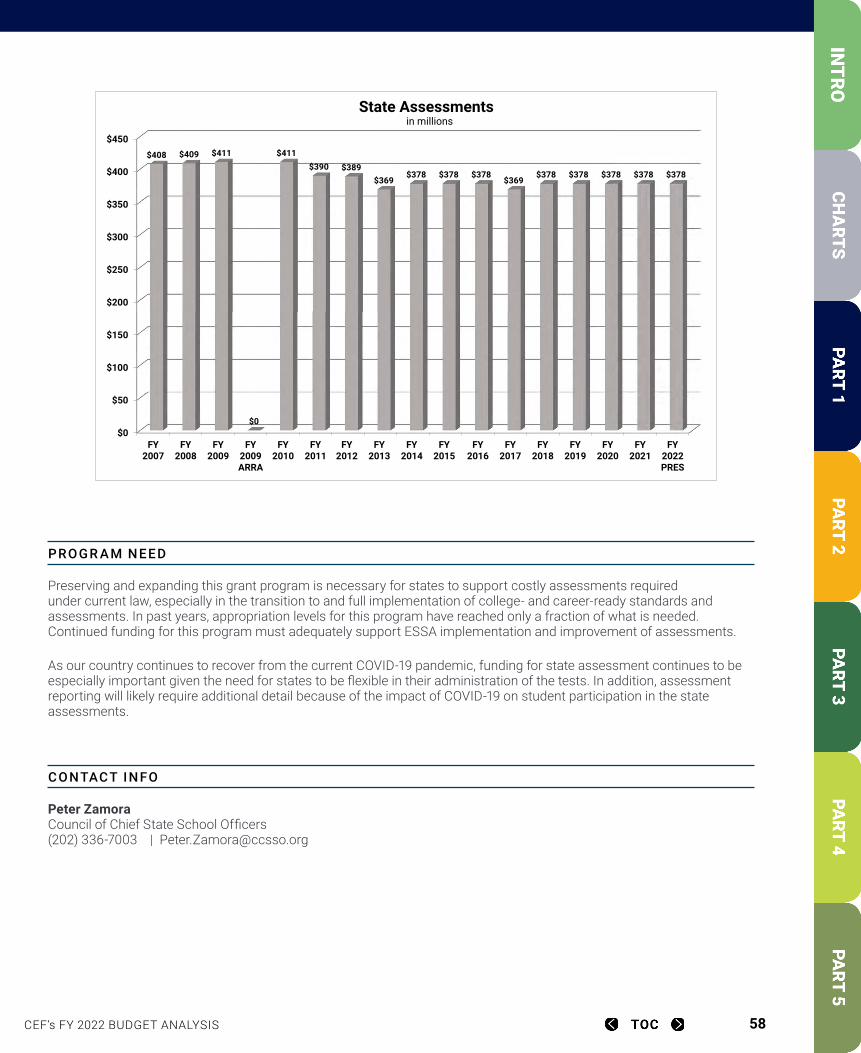
CEF’s FY 2022 BUDGET ANALYSIS 58
PROGR A M N EED
Preserving and expanding this grant program is necessary for states to support costly assessments required under current law, especially in the transition to and full implementation of college- and career-ready standards and assessments. In past years, appropriation levels for this program have reached only a fraction of what is needed. Continued funding for this program must adequately support ESSA implementation and improvement of assessments.
As our country continues to recover from the current COVID-19 pandemic, funding for state assessment continues to be especially important given the need for states to be flexible in their administration of the tests. In addition, assessment reporting will likely require additional detail because of the impact of COVID-19 on student participation in the state assessments.
CONTACT IN FO
Peter Zamora Council of Chief State School Officers (202) 336-7003 | [email protected]
FY 2007 FY 2008 FY 2009 FY 2009 ARFY 2010 FY 2011 FY 2012 FY 2013 FY 2014 FY 2015 FY 2016 FY 2017 FY 2018 FY 2019 FY 2020 FY 2021 FY 2022 PRES408$ 409$ 411$ -$ 411$ 390$ 389$ 369$ 378$ 378$ 378$ 369$ 378$ 378$ 378$ 378$ 378$
$0
$50
$100
$150
$200
$250
$300
$350
$400
$450
FY2007
FY2008
FY2009
FY2009ARRA
FY2010
FY2011
FY2012
FY2013
FY2014
FY2015
FY2016
FY2017
FY2018
FY2019
FY2020
FY2021
FY2022PRES
$408 $409 $411
$0
$411$390 $389
$369$378 $378 $378
$369$378 $378 $378 $378 $378
State Assessmentsin millions
CEF’s FY 2022 BUDGET ANALYSIS 59
Education for Homeless Children and YouthTitle VII-B, McKinney-Vento Homeless Assistance Act In FY 2019, America’s public schools served 1,384,301 students experiencing homelessness under the McKinney-Vento Homeless Assistance Act. Homelessness impacts 145 students in Belleville Township High School District #201 (IL), representing 2.3 percent of our total student body. Belleville is located east of downtown St. Louis and includes areas considered urban, some suburban, and some rural. The vast majority of students who qualify for McKinney-Vento services are sharing living arrangements — “doubled-up” — with family or friends due to lack of fixed, adequate housing. McKinney-Vento funding allows schools to provide these students with school supplies, backpacks, clothing, and hygiene supplies. More importantly, these funds allow the schools to provide professional development for educators and specialized instructional support personnel to help them better respond to the needs of homeless children and youth.
One of the most significant benefits of the Education for Homeless Children and Youth (EHCY) program for our students is the ability to avoid long periods of absence because they lack proper documentation normally required to enroll in school. Traditionally, schools require documentation prior to enrollment, but students experiencing homelessness are entitled to immediate enrollment. This minimizes educational disruption, allows for stronger acquisition of skills, and at the high school level affords students every opportunity to earn credit necessary for graduation. According to data reported to the U.S. Department of Education from states that disaggregate graduation rates for homeless youths, these students face significant gaps in high school graduation rates compared to their peers. Despite the national statistics, in Belleville 90.6 percent of students in the graduating class of 2019 who enrolled as homeless graduated within 4 years, just slightly below the district’s overall graduation rate of 91 percent. Continued funding for this program is vital, as our school works to meet the often complex needs of students experiencing homeless in order to maximize their educational success.
- Melissa Taylor, Director of Student Services Belleville (IL) Township High School District #201
DES CRIP TION
The Education for Homeless Children and Youth (EHCY) Program is the education subtitle of the McKinney-Vento Homeless Assistance Act. Under this program, students experiencing homelessness may continue their education at their school of origin (the school they attended before becoming homeless) or the school in the area where they are currently staying. Each school district appoints a homeless program liaison. The liaison assists students and their families to navigate this choice and helps students enroll in the new school immediately, even without the traditionally required documents for registration. This process decreases educational disruption. If a student stays at the school of origin, districts must provide transportation assistance as well.
Funding from the McKinney-Vento Homeless Assistance Act supports state coordinators and homeless liaisons in school districts to help identify homeless students, assist with school enrollment, provide services including emergency transportation, school supplies, clothing to meet dress code requirements, hygiene products, professional development for educators, and referrals for community services.
. F U N DING HIS TORY (in millions)
FY 2019 FY 2020 FY 2021 FY 2022 PRESIDENT’s REQUEST $93.50 $101.50 $106.50 $106.50
CEF’s FY 2022 BUDGET ANALYSIS 60
. IM PACT OF PR ES IDENT’S BU DGE T
The National Center for Homeless Education reports that during the 2018-19 school year, 1,384,301 students in America’s public schools experienced homelessness. This means that, prior to COVID-19, 2.71 percent of the public school students in our country experienced homelessness. This number has likely skyrocketed due to economic impact of the pandemic. Homelessness disproportionately impacts students of color, students with disabilities, and students who are English learners. In fact, the largest subgroup of students experiencing homelessness are those who receive services under the Individuals with Disabilities Education Act (IDEA). Congress demonstrated a commitment to this program by providing funds well over what the previous Administration requested. This year, the American Rescue Plan Act included $800 million for homeless students, but these funds were separate grants not designated under McKinney-Vento.
With the increased number of public school students experiencing homelessness and the negative effect housing instability has on children’s academic performance and health needs, McKinney-Vento funds are crucial. Even with dedicated federal funding, school districts have increased local costs with the rise in homeless student populations, particularly in the area of transportation, which is not covered by the EHCY program.
PROGR A M N EED
This program helps remove barriers faced by children and youth experiencing homelessness to enrolling, attending, and succeeding in school. Homelessness has an impact on academic achievement due to frequent mobility, increased absences, and higher stress. All of these factors lead to an interruption of education, lower educational achievement, and an increased risk of dropping out of school. Homelessness among preschool age children is associated with delays in language, literacy, and social and emotional development. At the elementary level, achievement gaps between homeless and low-income students persist and may even worsen over time. States that disaggregate graduation and dropout rates of homeless youth have found higher dropout and lower graduation rates compared to their peers. The McKinney-Vento Homeless Assistance Act is designed to protect the rights of students experiencing homelessness and offer educational stability despite difficult life circumstances. Funds support services such as tutoring or other instructional supports, referrals for health services, emergency transportation, clothing, and school supplies. The McKinney-Vento program is a critical support for all children and youth experiencing homelessness.
CONTACT IN FO
Melissa Taylor Council of Administrators of Special Education Illinois Alliance of Administrators of Special Education (618) 222-8273 | [email protected]
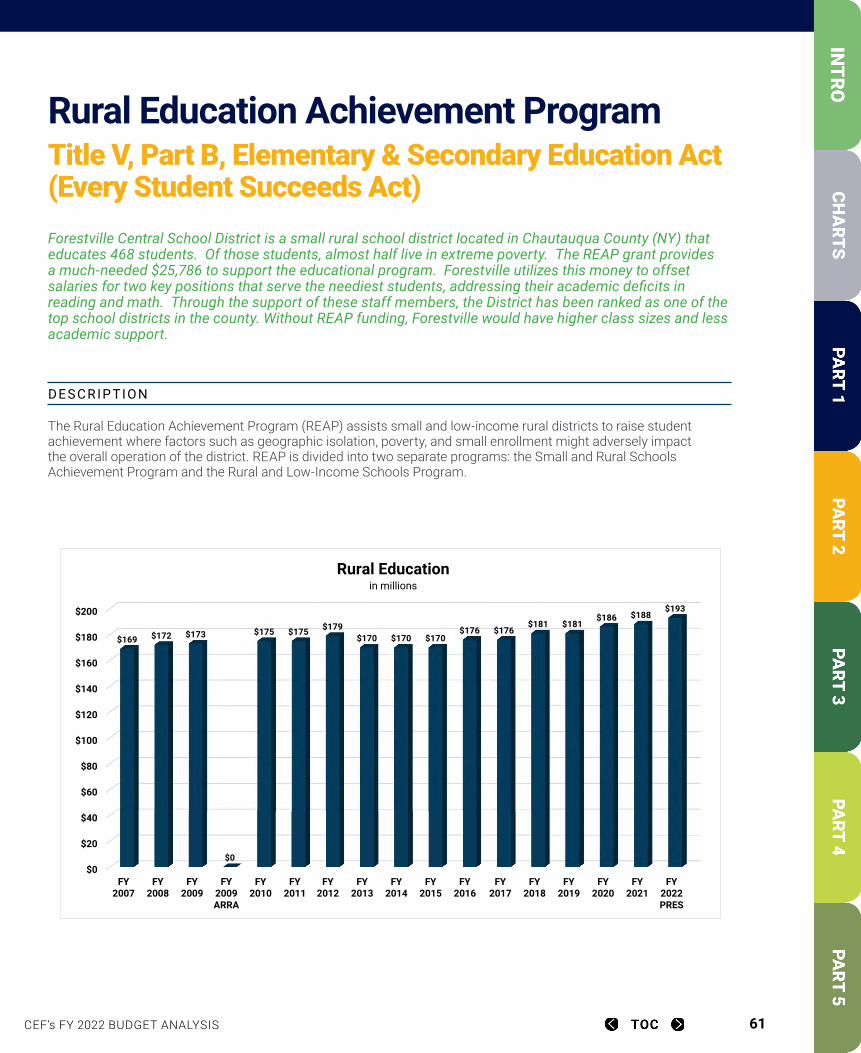
CEF’s FY 2022 BUDGET ANALYSIS 61
Rural Education Achievement Program Title V, Part B, Elementary & Secondary Education Act (Every Student Succeeds Act) Forestville Central School District is a small rural school district located in Chautauqua County (NY) that educates 468 students. Of those students, almost half live in extreme poverty. The REAP grant provides a much-needed $25,786 to support the educational program. Forestville utilizes this money to offset salaries for two key positions that serve the neediest students, addressing their academic deficits in reading and math. Through the support of these staff members, the District has been ranked as one of the top school districts in the county. Without REAP funding, Forestville would have higher class sizes and less academic support.
DES CRIP TION
The Rural Education Achievement Program (REAP) assists small and low-income rural districts to raise student achievement where factors such as geographic isolation, poverty, and small enrollment might adversely impact the overall operation of the district. REAP is divided into two separate programs: the Small and Rural Schools Achievement Program and the Rural and Low-Income Schools Program.
FY 2007 FY 2008 FY 2009 FY 2009 ARFY 2010 FY 2011 FY 2012 FY 2013 FY 2014 FY 2015 FY 2016 FY 2017 FY 2018 FY 2019 FY 2020 FY 2021 FY 2022 PRES169$ 172$ 173$ -$ 175$ 175$ 179$ 170$ 170$ 170$ 176$ 176$ 181$ 181$ 186$ 188$ 193$
$0
$20
$40
$60
$80
$100
$120
$140
$160
$180
$200
FY2007
FY2008
FY2009
FY2009ARRA
FY2010
FY2011
FY2012
FY2013
FY2014
FY2015
FY2016
FY2017
FY2018
FY2019
FY2020
FY2021
FY2022PRES
$169 $172 $173
$0
$175 $175 $179$170 $170 $170
$176 $176$181 $181
$186 $188$193
Rural Educationin millions
CEF’s FY 2022 BUDGET ANALYSIS 62
. F U N DING HIS TORY (in millions)
FY 2019 FY 2020 FY 2021 FY 2022 PRESIDENT’s REQUEST $180.84 $185.84 $187.84 $192.84
. IM PACT OF PR ES IDENT’S BU DGE T
The president proposes a $5 million increase to REAP, a welcome increased investment in the nation’s only K-12 program dedicated to supporting the nation’s rural schools and the students they serve. The proposed funding helps preserve the important flexible programming REAP has historically made possible.
PROGR A M N EED
A funding level of $200 million for REAP is necessary for rural districts to overcome the additional costs associated with geographic isolation, a smaller number of students, higher transportation and employee benefit costs, and increased poverty, particularly in light of the COVID pandemic, The $5 million increase in the president’s budget represents a small step toward the necessary $200 million.
CONTACT IN FO
Noelle Ellerson Ng AASA: The School Superintendents Association (703) 875-0764 | [email protected]
CEF’s FY 2022 BUDGET ANALYSIS 63
Comprehensive Centers Title II, Sec. 203, Education Technical Assistance Act In 2019, Alabama’s State Superintendent of Education enlisted the Region 7 Comprehensive Center (R7CC) to form an intensive five-year collaborative project with the Alabama Reading Initiative and multiple other teams within the Alabama State Department of Education (ALSDE). The aim of the project is to help ALSDE meet the state’s goal of ensuring all students are able to read at or above grade level by the end of third grade. In the project’s first year, the R7CC met all of its expected outcomes and successfully collaborated with the ALSDE to create a state-wide coaching framework for literacy and math coaches in every school in the state. Over the next three years, the R7CC will continue to work with ALSDE to identify the best evidence-based K-3 literacy instructional practices in the classroom as well as build the state department of education’s capacity to improve literacy outcomes in grades K-3. By the end of the project, the R7CC will have helped ALSDE create a sustainable pathway to support K-3 literacy achievement throughout the state of Alabama.
DES CRIP TION
The Comprehensive Centers, which include 19 regional centers and one national center, help states implement the Elementary and Secondary Education Act and other federal school improvement programs. The Centers provide technical assistance that helps build states’ capacity to assist districts and schools. Previously, the Comprehensive Centers program included content centers focused on specific topics set by the Secretary of Education. In the most recent grant competition, the U.S. Department of Education eliminated the content centers and, instead, expanded the number of regional centers. The Department also added one national comprehensive center charged with providing high-quality universal and targeted capacity-building services to the regional centers and state education departments. Throughout the COVID-19 pandemic, Comprehensive Centers have provided resources and technical assistance to state departments of education to meet the needs of students and educators during significant disruptions. . F U N DING HIS TORY (in millions)
FY 2019 FY 2020 FY 2021 FY 2022 PRESIDENT’s REQUEST $52.00 $52.00 $52.00 $52.00
. IM PACT OF PR ES IDENT’S BU DGE T
The president’s budget freezes funding for the Comprehensive Centers at $52 million in FY 2022. The lack of additional investment could limit the Centers’ ability to provide states and districts robust, evidenced-based technical assistance to respond to the unique needs of each student and advance a more equitable education system. Evidenced-based strategies and interventions are required under the American Rescue Plan to support student learning and recovery from the pandemic. Freezing funding for critical federal research and technical assistance programs at such a crucial time means states and districts will not have the additional support they need to identify and implement evidenced-based policies and practices in response to the pandemic. This assistance is also vital to help build capacity for system-level change to address issues such diversifying the teaching workforce and supporting continuous improvement.

CEF’s FY 2022 BUDGET ANALYSIS 64
PROGR A M N EED
The need to focus on what works for students, educators and school leaders using research and evidence-based practices has always been critical. However, this is more important than ever. As a result of the pandemic’s disruptions to education systems, schools must now work to recover and meet the profound learning and social and emotional needs of all students. States, districts, and schools cannot confront these challenges without research and evidenced-based interventions. Leveraging applied research and findings from Regional Educational Laboratories, Comprehensive Centers can provide intensive technical assistance to state departments of education on policies and practices that will help address learning disruption and meet the social and emotional learning needs of students in remote, hybrid and in-person settings now and in the future.
CONTACT IN FO
Jacki Ball Knowledge Alliance (202) 770-2218 | [email protected]
CEF’s FY 2022 BUDGET ANALYSIS 65
Student Support and Academic Achievement GrantsTitle IV, Part A, Elementary & Secondary Education Act (Every Student Succeeds Act) “The digital divide exacerbated summer learning loss during the COVID-19 pandemic, especially when children had little access to in-person learning. The funding and flexibility from Title IV-A are critical to closing these educational and opportunity gaps. The pandemic has presented challenges and opportunities, particularly with respect to technology integration as a core element in summer program planning. Title IV-A helps districts and out of school time providers flip the script on how society embraces technology, moving youth from content consumption to content creation and allowing educators to modernize their own teaching practices to better meet students’ needs.
During the pandemic, summer learning programs proved to be innovation hubs, using technology to meaningfully engage students. Cell phones and laptops became movie production tools, storytelling devices, and social convening platforms. With these innovations, schools can provide educational environments where technology is accessible, embraced, and seamlessly integrated into learning. Continued funding for Title IV-A will allow summer programs to do exactly that!”
- Brodrick Clarke, Direct of Training, National Summer Learning Association
DES CRIP TION
Title IV, Part A, Every Student Succeeds Act (ESSA), is a flexible block grant program authorized at $1.6 billion. This grant supports activities in three broad areas: (1) providing students with a well-rounded education (e.g., college and career counseling, STEM, arts and music, civics, advanced placement); (2) supporting safe and healthy students (e.g., comprehensive school mental health, drug and violence prevention, health and physical education); and (3) supporting the effective use of technology.
Each state receives an allocation based on the ESSA-Title I funding formula, and, using that same formula, states allocate funds to local school districts. Any school district receiving an amount above $30,000 must conduct a needs assessment and expend 20 percent of its grant on safe and healthy school activities and 20 percent on activities to provide a well-rounded education program. The district may spend the remaining 60 percent of funds on any of the three broad areas but must spend at least a portion of their grant on activities to support the effective use of technology. No more than 15 percent of a district’s funds may be spent on devices, equipment, software, and digital content. If a district receives an allocation below $30,000, the law does not require a needs assessment or specific percentage set-asides for well-rounded and safe and healthy programs. The 15 percent technology purchase cap would still apply.
. F U N DING HIS TORY (in millions)
FY 2019 FY 2020 FY 2021 FY 2022 PRESIDENT’s REQUEST $1,1700.00 $1,210.00 $1,220.00 $1,220.00

CEF’s FY 2022 BUDGET ANALYSIS 66
. IM PACT OF PR ES IDENT’S BU DGE T
While not at full funding of $1.6 billion or the $2 billion many advocates have recommended, President Biden’s request of $1.22 billion for the Student Support and Academic Enrichment grants is a signal of an important federal commitment to the well-being of children, educators, and the education system as a whole. This flexible funding stream has allowed states and districts to invest in a wide range of evidence-based programs that offer the support students need to succeed and thrive academically, emotionally, and socially. The continued funding for Title IV-A will offer states and districts the ability to continue building on their successes, address lessons learned, and expand access to programs where needed.
PROGR A M N EED
Now more than ever, in the wake of the COVID-19 pandemic, districts need the investments Congress has made in the Title IV-A program since its inception. This flexible funding has allowed districts to maintain ongoing support in all three program areas: safe and healthy students, well-rounded education, and the effective use of technology.
Continued investment in Title IV-A, especially given the uncertain times, will provide districts the opportunity to build on the past three years’ successes, as well as the ability to use funds to address issues the pandemic has made apparent and exacerbated — from the need for all students to have access to technology for remote learning to providing mental health supports virtually. As school systems begin the journey back to normal, they need the flexibility of Title IV-A funds to support these important program goals.
Evidence supports a direct correlation between health and learning essential to academic success, school completion, and the development of healthy, resilient, and productive citizens. Schools are uniquely positioned to help children and youth acquire lifelong, health-promoting knowledge, skills, attitudes, and behaviors through comprehensive health and physical education, nutrition, comprehensive school mental and behavioral health services, counseling, and integration among all education and health programs.
FY 2017 FY 2018 FY 2019 FY 2020 FY 2021 FY 2022 PRESAppropriations 400$ 1,100$ 1,170$ 1,210$ 1,220$ 1,220$
$0
$200
$400
$600
$800
$1,000
$1,200
$1,400
FY 2017 FY 2018 FY 2019 FY 2020 FY 2021 FY 2022 PRES
$400
$1,100$1,170
$1,210 $1,220 $1,220
Student Support and Academic Enrichment Grants (Title IV-A)in millions
CEF’s FY 2022 BUDGET ANALYSIS 67
Federal investments in education technology ensure schools have technology-proficient educators, well-equipped classrooms, sufficiently supported administrative structures, and a curriculum optimized to take advantage of the benefits technology offers all students. The federal government must continue to invest in these key components of digital teaching and learning. Schools alone cannot afford to make the significant investments required to close learning and opportunity gaps and provide students with skills necessary to compete in the modern workforce.
To meet these important educational goals, Congress must provide at minimum full funding of $1.6 billion or beyond for the Student Support and Academic Enrichment Grant Program.
CONTACT IN FO
technology provisionsAlly TalcottNational Summer Learning Association (202) 594-1065 | [email protected]
safe and healthy provisions Kelly Vaillancourt StrobachNational Association of School Psychologists(301) 657-0270 | [email protected]
well-rounded provisionsTooshar SwainNational Association for Music Education(703) 860-4000, ext. 224 | [email protected]
CEF’s FY 2022 BUDGET ANALYSIS 68
School Safety National ActivitiesTitle IV, Part F, Elementary & Secondary Education Act (Every Student Succeeds Act)
The Osage County Interlocal Cooperative (OCIC), an educational cooperative representing 13 rural school districts, received a five-year Mental Health Service Professional Demonstration Grant, titled Project PREPARE (Providing Real-world Experiences for Professionals to Advance Rural Education). This project has three primary goals: (1) recruit students in Oklahoma to work in the schools as school-based mental health professionals, (2) provide specialized practicum and didactic training for school-based mental health graduate students, and (3) retain school-
based mental health professionals to advance rural education through service internships and subsequently full-time employment in high-need schools. This funding has been essential to helping address the critical shortage of school psychologists in Oklahoma by simultaneously providing comprehensive prevention and intervention training experiences to graduate students and supporting rural schools with assessment, intervention, and consultation services that would otherwise be unavailable. Project PREPARE seeks to support and expand Multi-Tiered Systems of Support (MTSS) in these rural schools, including better integration of school-based mental health services, such as social work and counseling services, as well as strengthened partnerships with community mental health agencies.
DES CRIP TION
The Safe and Drug-Free Schools and Communities Act (SDFSCA) was previously authorized as a national discretionary grant program focused on drug, violence, and bullying prevention and school-based mental health services. For more than a decade only the national programs have been funded. Now referred to as School Safety National Activities, these funds are used for state and local school safety and violence prevention. Several programs specifically focus on growing the number of school-employed mental health professionals and increasing access to comprehensive social emotional learning and mental and behavioral health services. Activities may be carried out by states and local school districts and other public and private nonprofit organizations. . F U N DING HIS TORY (in millions)
FY 2019 FY 2020 FY 2021 FY 2021 PRESIDENT’s REQUEST $95.00 $105.00 $106.00 $116.00
CEF VIDEO
CEF’s FY 2022 BUDGET ANALYSIS 69
. IM PACT OF PR ES IDENT’S BU DGE T
The president’s budget request provides a slight increase for this program specifically for Project Prevent, targeted to help schools and communities break the pervasive cycle of violence. Remaining funds can be used at the Department’s discretion for competitive grants designed to support positive learning environments and implement evidence-based violence prevention strategies. Current grants funded from this program include: School Climate Transformation Grants to provide for multi-tiered systems of support to improve school climate and behavioral outcomes for all students and help address the opioid crisis; Grants to States for Emergency Management that help states strengthen school emergency operations plans; School Based Mental Health Services Providers Demonstration Grants to help expand the pipeline of school psychologists, school counselors, school social workers, and other mental health professionals; and, School Based Mental Health Services Providers Grants, intended to improve the availability of comprehensive mental and behavioral health and social and emotional learning programs and providers in schools.
This budget request does not allow for new competitions for the two grants specifically intended to address the shortage of school-employed mental health professionals. The president’s budget request does include $1 billion for a new program directed at doubling the number of school psychologists, counselors, and social workers. However, with the dire and immediate need to address these shortages, the most efficient and effective way to get the money to where it is needed now is via these two existing grants.
PROGR A M N EED
States and school districts annually pay billions of dollars to respond to the consequences of substance abuse, school violence, and unaddressed mental health needs. Due to the COVID-19 pandemic and effects of systemic racism, our students need access more than ever to comprehensive and trauma-informed mental and behavioral health services. The costs to young people and society as a whole multiply when issues such as truancy, school dropout, juvenile detention and incarceration, and diminished academic success are not addressed. Ongoing state and local budget constraints have resulted in reductions for critical prevention services, all of which are exacerbated by the impact of COVID-19. Schools and districts continue to have significant difficulty initiating and maintaining, much less strengthening, current school safety, school climate, and student well-being programs.
School districts are often directed to use Title I funds for these purposes. However, Title I is already stretched thin and scarcely meeting program needs with the number of students in poverty at the highest level in 50 years. The Every Student Succeeds Act (ESSA) replaced SDFSCA with a new formula grant, the Student Support and Academic Enrichment Grants (Title IV-A). Title IV-A (see corresponding article) provides flexible funding to school districts to improve student outcomes through a wide range of activities, including supporting safe and healthy students. Again, this is not the answer, as this grant includes multiple allowable uses under competing needs and priorities, many of which schools are already struggling to meet.
In recognition of the need to address the shortage of school mental health professionals, beginning in FY 2019 Congress directed the Department of Education to set aside up to $10 million to develop and implement a Mental Health Demonstration Grant to help improve the pipeline of school-based mental health providers to high-need school districts. These professionals — school psychologists, school counselors, and school social workers — are critical to efforts to improve school climate, school safety, and violence prevention. In FY 2020, an additional $10 million was set aside to help districts hire these professionals in an effort to improve school climate and address students’ social and emotional learning. In FY 2021 this effort received an increase of $1 million. Significant funding is needed to make meaningful progress toward remedying the shortages of these critical professionals.
CONTACT IN FO
Kelly Vaillancourt Strobach National Association of School Psychologists (301) 657-0270 | [email protected]
CEF’s FY 2022 BUDGET ANALYSIS 70
Promise NeighborhoodsTitle XIV, American Recovery and Reinvestment Act of 2009Title IV, Part F, Elementary & Secondary Education Act (Every Student Succeeds Act) Administered by Partners for Education at Berea College, the Knox Promise Neighborhood, a five-year, cradle-to-career grant serving Knox County and Corbin (KY), is helping students in schools in central, eastern, and southeastern Kentucky to succeed. Berea College was awarded federal Promise Neighborhood funds by the U.S. Department of Education for the Knox Promise Neighborhood (2017-21). The total project cost is $45 million — $30 million (67 percent) from federal Promise Neighborhood funds and $15 million (33 percent) from non-federal funds. The initiative supports early childhood programs and also provides resources and staff to help students in K-12 and postsecondary institutions. As an example, rotating Literacy Academies are offered at Corbin Independent, Barbourville Independent, and Knox County Schools. These academies connect families with the online “myON” platform, providing access to thousands of free digital books to strengthen literacy and help parents and adults read to children. Neighborhood funding also supports literacy and wellness services through Save the Children, a private international organization dedicated to ensuring children get a healthy start to life, including help with reading, a core education component. In addition to home visiting and school-based services, Save the Children offers playgroups for children ages 3-5 not currently enrolled in a preschool or Head Start. Children and parents participate together in fun and engaging high-quality learning experiences in a preschool setting. Experiences include math concepts, language and literacy skills, science, and art. In addition to direct support to families, the Knox Promise Neighborhood has provided preschools with technology and curriculum designed to enhance cognitive development and, specifically, math skills. Coaching and professional development for Neighborhood teachers and early childhood staff are also supported.
DES CRIP TION
Promise Neighborhoods is a place-based initiative to help revitalize distressed communities by making high-quality systems of support available to every child and youth. Inspired by the Harlem Children’s Zone, Promise Neighborhood grants fund entities including community-based organizations, local universities, neighborhood associations, faith-based organizations, and community foundations to provide coordinated, comprehensive services and school supports aimed at breaking the cycle of poverty. Promise Neighborhoods build partnerships among schools, community organizations and community members, and local businesses to wrap children in coordinated health, social, community, and educational supports from cradle to career. These services and supports are designed to build a continuum of both educational programs and family and community assistance and can include well-designed early learning and out-of-school time activities, mental health services, job training, and crime prevention programs.
. F U N DING HIS TORY (in millions)
FY 2019 FY 2020 FY 2021 FY 2022 PRESIDENT’s REQUEST $78.25 $80.00 $81.00 $91.00
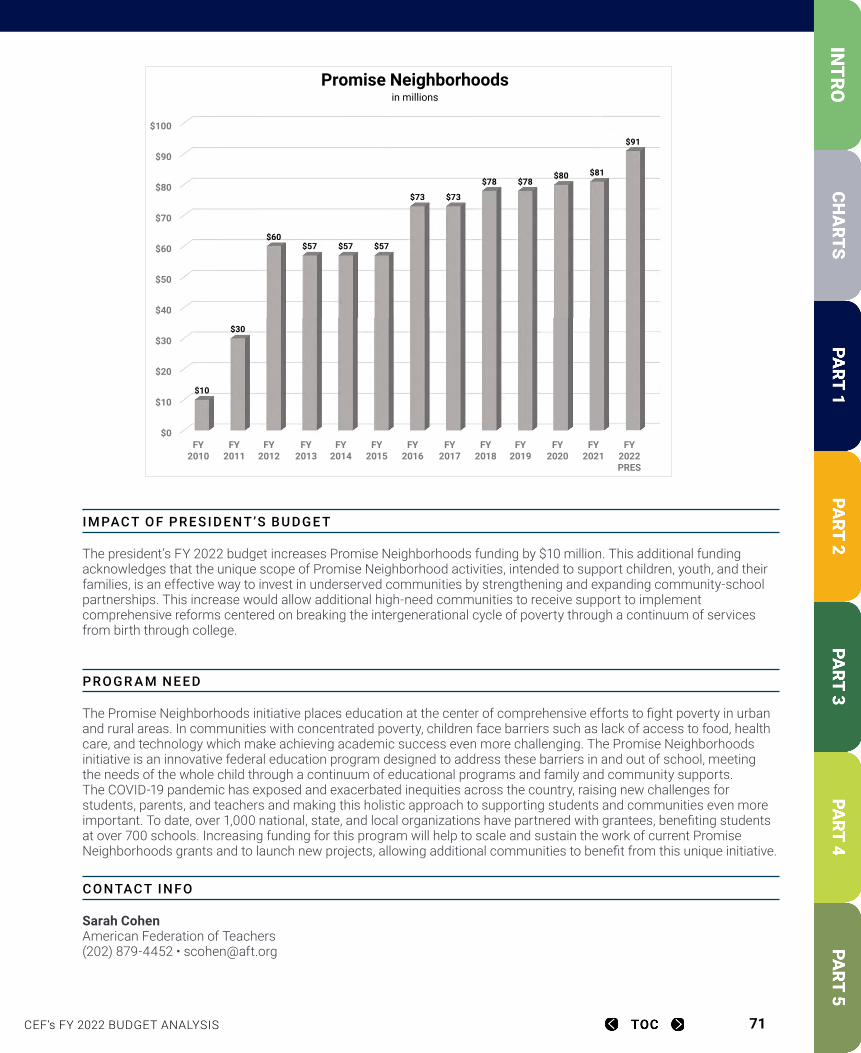
CEF’s FY 2022 BUDGET ANALYSIS 71
. IM PACT OF PR ES IDENT’S BU DGE T
The president’s FY 2022 budget increases Promise Neighborhoods funding by $10 million. This additional funding acknowledges that the unique scope of Promise Neighborhood activities, intended to support children, youth, and their families, is an effective way to invest in underserved communities by strengthening and expanding community-school partnerships. This increase would allow additional high-need communities to receive support to implement comprehensive reforms centered on breaking the intergenerational cycle of poverty through a continuum of services from birth through college.
PROGR A M N EED
The Promise Neighborhoods initiative places education at the center of comprehensive efforts to fight poverty in urban and rural areas. In communities with concentrated poverty, children face barriers such as lack of access to food, health care, and technology which make achieving academic success even more challenging. The Promise Neighborhoods initiative is an innovative federal education program designed to address these barriers in and out of school, meeting the needs of the whole child through a continuum of educational programs and family and community supports. The COVID-19 pandemic has exposed and exacerbated inequities across the country, raising new challenges for students, parents, and teachers and making this holistic approach to supporting students and communities even more important. To date, over 1,000 national, state, and local organizations have partnered with grantees, benefiting students at over 700 schools. Increasing funding for this program will help to scale and sustain the work of current Promise Neighborhoods grants and to launch new projects, allowing additional communities to benefit from this unique initiative.
CONTACT IN FO
Sarah Cohen American Federation of Teachers (202) 879-4452 • [email protected]
FY 2010 FY 2011 FY 2012 FY 2013 FY 2014 FY 2015 FY 2016 FY 2017 FY 2018 FY 2019 FY 2020 FY 2021 FY 2022 PRES10$ 30$ 60$ 57$ 57$ 57$ 73$ 73$ 78$ 78$ 80$ 81$ 91$
$0
$10
$20
$30
$40
$50
$60
$70
$80
$90
$100
FY2010
FY2011
FY2012
FY2013
FY2014
FY2015
FY2016
FY2017
FY2018
FY2019
FY2020
FY2021
FY2022PRES
$10
$30
$60$57 $57 $57
$73 $73
$78 $78$80 $81
$91
Promise Neighborhoodsin millions

CEF’s FY 2022 BUDGET ANALYSIS 72
Full-Service Community SchoolsTTitle IV, Part F, Elementary & Secondary Education Act (Every Student Succeeds Act) When the COVID-19 pandemic shuttered California schools in March 2020, Felicitas and Gonzalo Mendez High School, a community school in East Los Angeles, was well positioned to meet the moment. Regular monthly meetings of the community school coordinator and community partners to track student engagement and coordinate delivery of supports and services now became weekly virtual meetings. When families were unreachable by phone call or text, extensive existing relationships were used to conduct distanced home visits and deliver resources like Wi-Fi hotspots, desks, or EBT cards.
Over the summer, Mendez administrators created opportunities for families, students, and staff to think together about how to incorporate learning from the past year into the coming year. Teachers elevated the need for less screen time for students. In response, the school’s scheduling subcommittee proposed to switch to a quarter system in Fall 2020 that provided students and teachers with the same amount of teaching and learning time over the course of the year with fewer concurrent classes. This collaborative process to determine scheduling garnered broad buy-in from families and teachers, who in turn could more effectively support students with virtual learning.
DES CRIP TION
The Full-Service Community Schools (FSCS) program provides dedicated funding to implement community schools, a place-based strategy tailored to local assets and needs. Schools partner with community agencies and allocate resources to serve the whole child, providing an integrated focus on academics, health and social services, youth and community development, and community engagement. Many operate on all-day and year-round schedules as neighborhood hubs. Community school coordinators organize services for students and families through partnerships with nonprofit and government organizations, including health clinics, food banks, and after-school programs. These schools offer students an enriched curriculum — art, music, science, sports, tutoring, and hands-on projects and internships. They engage families through invitations to participate in school decisions. Research shows community schools reap big dividends including closing achievement gaps and increasing attendance and graduation rates, while decreasing disciplinary rates.
Although the community schools approach is appropriate for students of all backgrounds, many community schools are located in neighborhoods where structural forces such as poverty shape the experiences of young people and erect barriers to learning and school success. Community schools vary in the programs they offer and the ways they operate, depending on their local context. Four features—or pillars—appear in most effective community schools and support the conditions for high-quality teaching and learning: (1) integrated student supports; (2) expanded and enriched learning time and opportunities; (3) active family and community engagement, and 4) collaborative leadership and practices.
. F U N DING HIS TORY (in millions)
FY 2019 FY 2020 FY 2021 FY 2022 PRESIDENT’s REQUEST $17.50 $25.00 $30.00 $443.00
.

CEF’s FY 2022 BUDGET ANALYSIS 73
IM PACT OF PR ES IDENT’S BU DGE T
The president’s FY 2022 budget provides $443 million for the FSCS program, a more than $400 million increase over the FY 2021 level, at a time when COVID-19 has intensified economic insecurity, food scarcity, and mental health challenges for many students and families. Community schools have partnered with community agencies and local government to address these challenges by establishing trusting relationships and providing well-coordinated services and supports. The president’s budget request will help more communities equitably recover from the impacts of the pandemic and address the out-of-school barriers to learning that children the farthest from opportunity face. Greater funding for FSCS will enable the U.S. Department of Education to award more five-year community schools grants, giving more students access to integrated supports such as nutritional, dental, and counseling services that are essential to enable students to learn. Students and families will also benefit from academic supports that come from expanded learning opportunities — before and after school enrichment, a longer school day, summer programming, and community-based projects — which can help mitigate lost instructional time and accelerate learning. Schools will also benefit from a full-time community school coordinator, required by the program, to lead efforts to engage families and community partners, and coordinate services and support. In short, more communities will have access to the essential resources that community schools provide which help improve student learning and community outcomes.
PROGR A M N EED
Childhood poverty and resegregation of schools, along with inequality in school funding and resources, have long resulted in unequal educational outcomes. Prior to the pandemic, more than half of children attending public schools (25 million) qualified for free or reduced-price lunch—the highest percentage since the National Center for Education Statistics began tracking this figure decades ago. In the past year, skyrocketing unemployment rates and widespread school closures due to COVID-19 have created economic instability and food insecurity for many children and families, exacerbating longstanding inequities. In addition, some parents have expressed concerns about their families’ mental health and the progress their children are making in school, especially in lower-income communities.
Historically underserved communities have borne the brunt of the pandemic. As we recover from the impact of COVID-19 and work to end childhood poverty and address structural inequities, our country must fund the supports necessary to address the out-of-school barriers for the most vulnerable students. In order for all children to reach their full potential, at-risk communities need the locally tailored supports community schools provide, from integrated wraparound services, including health and nutrition, to expanded learning time and opportunities such as weekend programming and before- and afterschool enrichment. Community schools have a coordinated infrastructure, strong student and family relationships, and partnerships with nonprofit and government agencies that enable them to respond effectively in moments of crisis and provide ongoing support to students and families. The research is clear that well-implemented community schools lead to improvement in student and school outcomes and positively contribute to meeting the educational needs of low-achieving students in high-poverty schools.
Thus far under the program, the Department of Education has awarded 55 grants, with 30 awards expected this year. Despite the growing need for community schools, the FY 2021 appropriation was only $30 million, making the president’s budget request of $443 million even more important to increase the reach of the program and fulfill the Administration’s promise to have community schools reach at least 300,000 more students and families.
CONTACT IN FO
Michael A. DiNapoli, Jr. Learning Policy Institute (202) 804-6619, ext. 331 [email protected]
CEF’s FY 2022 BUDGET ANALYSIS 74
Indian Education Formula Grants (U.S. Department of Education) Title VI, Part A, Elementary and Secondary Education Act (Every Student Succeeds Act) The Gallup McKinley County School District (GMCS) serves 11,279 Native students that make up over 77 percent of the student population. Serving students on and near the Navajo Nation, GMCS utilizes funds from the Title VI Indian Education Formula Grant to support the Cultural Education Department. When first established, the Department brought together district staff, Diné language teachers, and representatives from the Diné Department of Education to ensure effective collaboration and communication across jurisdictions. From this work, GCMS developed a roadmap for engaging systemic change rooted in Diné language and culture, building cultural and academic supports for Native students and their families throughout the district.
DES CRIP TION
Approximately 620,000 or 93 percent of Native children are currently enrolled in public schools, both urban and rural, while 48,000 or 7 percent attend schools within the Bureau of Indian Education (BIE) system. There are 183 BIE-funded schools (including 14 peripheral dormitories) located on 63 reservations in 23 states. Funding for Native students is included both in the Department of Education and the Department of Interior through the Bureau of Indian Education.
Title VI, Part A, supports educational improvement and reform for Indian students, helping to ensure they receive every opportunity to achieve to high standards. The activities include: (1) direct assistance to local school districts and Department of the Interior BIE schools for the education of Indian children; (2) special programs, including demonstrations and the training of Indian individuals as educators; and (3) Native language, research, evaluation, data collection, technical assistance, and other national activities. The programs promote efforts to meet the unique educational and culturally related academic needs of American Indian and Alaska Native students.
. F U N DING HIS TORY (in millions)
FY 2019 FY 2020 FY 2021 FY 2022 PRESIDENT’s REQUEST Grants to LEAs $105.38 $105.38 $105.38 $110.38 Special Programs for Indian Children $ 67.99 $ 67.99 $ 67.99 $ 63.99National Activities $ 6.87 $ 7.37 $ 7.87 $ 7.87
Total $180.24 $180.74 $181.24 $186.24
. IM PACT OF PR ES IDENT’S BU DGE T
The Administration’s FY 2022 budget provides a slight increase in funding for Indian Education in the U.S. Department of Education. Despite overall increases, the president’s budget falls short of funding levels necessary to fully address the need in college and career readiness programs and professional development grants for schools that serve Native students. Schools and tribes are forced to stretch further the already limited amount allocated to meet the needs of Native students as a result of increased costs of the pandemic that continue to disproportionately impact tribal communities and a growing Native student population. In other words, taking into account rising enrollments, increasing costs of providing services, a deadly pandemic, and inflation, a marginal increase in funding is insufficient.
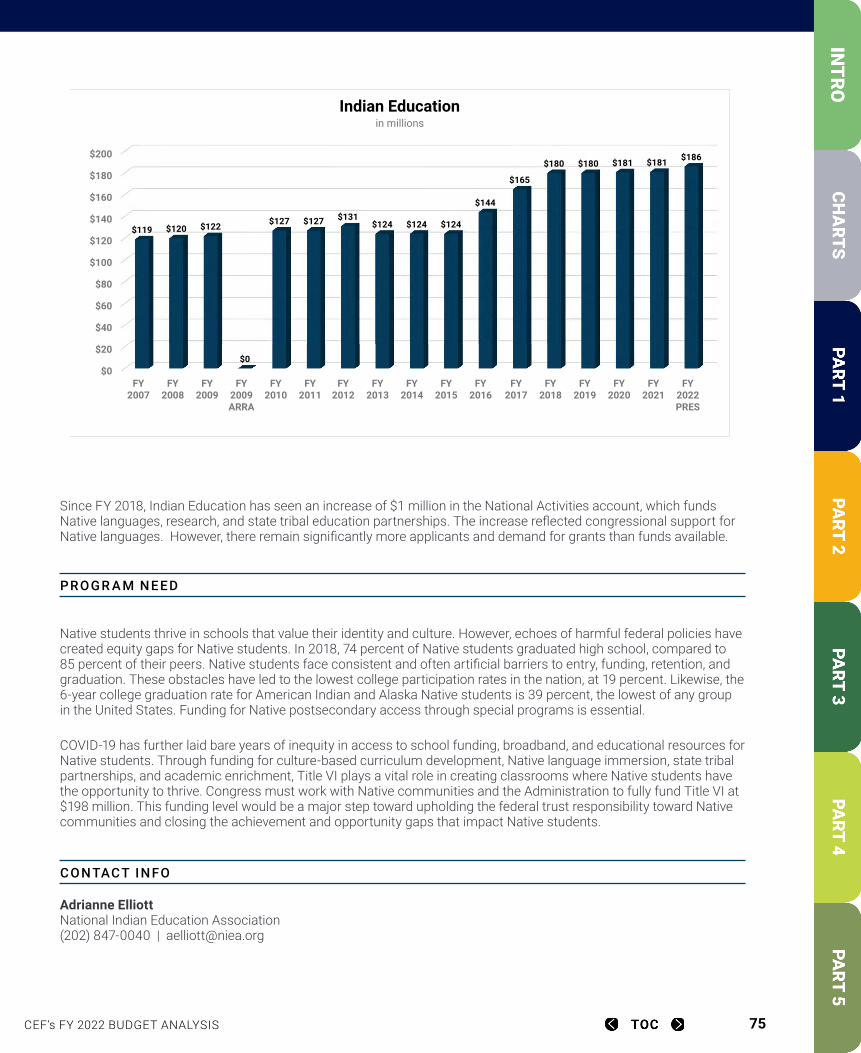
CEF’s FY 2022 BUDGET ANALYSIS 75
Since FY 2018, Indian Education has seen an increase of $1 million in the National Activities account, which funds Native languages, research, and state tribal education partnerships. The increase reflected congressional support for Native languages. However, there remain significantly more applicants and demand for grants than funds available.
PROGR A M N EED
Native students thrive in schools that value their identity and culture. However, echoes of harmful federal policies have created equity gaps for Native students. In 2018, 74 percent of Native students graduated high school, compared to 85 percent of their peers. Native students face consistent and often artificial barriers to entry, funding, retention, and graduation. These obstacles have led to the lowest college participation rates in the nation, at 19 percent. Likewise, the 6-year college graduation rate for American Indian and Alaska Native students is 39 percent, the lowest of any group in the United States. Funding for Native postsecondary access through special programs is essential.
COVID-19 has further laid bare years of inequity in access to school funding, broadband, and educational resources for Native students. Through funding for culture-based curriculum development, Native language immersion, state tribal partnerships, and academic enrichment, Title VI plays a vital role in creating classrooms where Native students have the opportunity to thrive. Congress must work with Native communities and the Administration to fully fund Title VI at $198 million. This funding level would be a major step toward upholding the federal trust responsibility toward Native communities and closing the achievement and opportunity gaps that impact Native students.
CONTACT IN FO
Adrianne Elliott National Indian Education Association (202) 847-0040 | [email protected]
FY 2007 FY 2008 FY 2009 FY 2009 ARFY 2010 FY 2011 FY 2012 FY 2013 FY 2014 FY 2015 FY 2016 FY 2017 FY 2018 FY 2019 FY 2020 FY 2021 FY 2022 PRES119$ 120$ 122$ -$ 127$ 127$ 131$ 124$ 124$ 124$ 144$ 165$ 180$ 180$ 181$ 181$ 186$
$0
$20
$40
$60
$80
$100
$120
$140
$160
$180
$200
FY2007
FY2008
FY2009
FY2009ARRA
FY2010
FY2011
FY2012
FY2013
FY2014
FY2015
FY2016
FY2017
FY2018
FY2019
FY2020
FY2021
FY2022PRES
$119 $120 $122
$0
$127 $127 $131$124 $124 $124
$144
$165
$180 $180 $181 $181 $186
Indian Education in millions
CEF’s FY 2022 BUDGET ANALYSIS 76
Education Innovation and ResearchTitle IV, Part F, Elementary & Secondary Education Act (Every Student Succeeds Act) Future Forward is a literacy intervention for students in grades K-3 struggling with reading that combines intensive one-on-one tutoring during the school day with family engagement support embedded in all aspects of the program. Initially developed in the Milwaukee Public Schools, the Future Forward model was awarded an Investing in Innovation (i3) grant in 2010 by the U.S. Department of Education to further develop and test the impact of the program. The external evaluation found the program yielded positive, statistically significant impacts on reading achievement, literacy, and regular school attendance. For example, participating students were absent from school 5.8 fewer times than control students and were 27 percent less likely to be chronically absent from school. Additionally, students participating in Future Forward were six times more likely to reach grade-level reading benchmarks than control students, with the benefit most significant for students who began the program with greater literacy instruction needs. Education Analytics was awarded a $7.8 million Education Innovation and Research grant in 2017 to implement and evaluate the impact of Future Forward across multiple regions in the country. The initial evaluation of the program model met What Works Clearinghouse standards and suggested promise for Future Forward’s impact as currently implemented in 14 sites across three different states. A 2018-19 evaluation of the Future Forward program affirmed the significant positive impact on student reading and attendance, the greatest positive effect found for students most at risk of not regularly attending school. During the COVID-19 pandemic, Future Forward effectively pivoted to a virtual format to meet student need by combining video conferencing and shared access to thousands of book titles and progress metrics.
DES CRIP TION
Education Innovation and Research (EIR) supports development, testing, replication, and expansion of innovative, evidence-based education strategies. EIR provides flexible funding for a broad range of field-driven projects and allows states, school districts, nonprofits, higher education, and small businesses to develop and grow creative programs to improve student achievement. The program establishes different categories of grants that align to the strength of evidence supporting the proposal and explicitly requires grantees to help build the evidence base by conducting independent evaluations of the effectiveness of their grant-funded activities.
. F U N DING HIS TORY (in millions)
FY 2019 FY 2020 FY 2021 FY 2022 PRESIDENT’s REQUEST $130.00 $190.00 $194.00 $194.00
. IM PACT OF PR ES IDENT’S BU DGE T
Over the years, EIR has funded evidenced-based innovations in social and emotional learning, STEM, and computer science with a focus on improving outcomes for high-need students. Investments in EIR have allowed for proven innovations to be scaled to provide greater access and improved achievement for more students. The president’s budget freezes funding for EIR at $194 million at a time when innovation and evidence-based education strategies are critical to promote equity and adequacy for each student. Without increased funding, states and districts will not have the critical resources needed to develop and scale up evidence-based innovations that are needed to address the impacts of the pandemic on students and educators, especially student populations who have been historically underserved and significantly impacted by the pandemic.

CEF’s FY 2022 BUDGET ANALYSIS 77
PROGR A M N EED
Continued investment in this program is particularly important since ESSA requires states and school districts to support the use of evidence-based interventions in schools identified for comprehensive support and improvement or in implementing targeted support and improvement plans. Robust federal investment in identifying such interventions through the EIR program is essential to ensuring local districts have the necessary tools to address the persistent challenges in their lowest performing schools as well as providing greater scale of effective programs that focus on the pandemic recovery needs of districts.
CONTACT IN FO
Jacki Ball Knowledge Alliance (202) 770-2218 | [email protected]
FY 09 ARRAFY 2010 FY 2011 FY 2012 FY 2013 FY 2014 FY 2015 FY 2016 FY 2017 FY 2018 FY 2019 FY 2020 FY 2021 FY 2022 PRES650$ -$ 150$ 149$ 142$ 142$ 120$ 120$ 100$ 120$ 130$ 190$ 194$ 194$
$0
$100
$200
$300
$400
$500
$600
$700
FY 09ARRA
FY 2010 FY 2011 FY 2012 FY 2013 FY 2014 FY 2015 FY 2016 FY 2017 FY 2018 FY 2019 FY 2020 FY 2021 FY 2022PRES
$650
$0
$150 $149 $142 $142$120 $120
$100$120 $130
$190 $194 $194
Education Innovation and Research in millions
ESSA incorporated a revised version of i3 as the new Education Innovation and Research program.
CEF’s FY 2022 BUDGET ANALYSIS 78
Teacher and School Leader Incentive GrantsTitle II, Part B, Elementary & Secondary Education Act (Every Student Succeeds Act) The Anderson-Shiro Consolidated Independent School District partnered with Education Service Center Region 18 Texas Center for Educator Excellence (TxCEE) to implement the 2018 Texas TSL Project. Through participation in the program, the District implemented an involved stakeholder process to select a value-added model, a performance-based compensation system, and utilization of the Texas Teacher Evaluation and Support System. Anderson-Shiro also worked with TxCEE to implement a strong Student Learning Objective process that measures individual student growth with the purpose of improving educator effectiveness and student achievement. This collaborative process has provided an opportunity for teachers to gain a more in-depth understanding of the Texas Essential Knowledge and Skills (TEKS) state standards and student progress for mastery of the TEKS.
DES CRIP TION
Formerly known as the Teacher Incentive Fund, the Teacher and School Leader Incentive Grants (TSL) program supports efforts to develop, implement, improve, or expand human capital management systems or performance-based compensation systems in schools. Recognizing the critical role of effective school leadership on student achievement, the program advances comprehensive evaluation and supports for all educators. Through supports such as career ladders, peer-to-peer mentoring, and professional development, districts can utilize TSL to increase student achievement by increasing educators’ effectiveness.
According to the U.S. Department of Education, eligible entities include local education agencies (LEAs), including charter schools that are LEAs; state departments of education or other designated state agencies; the Bureau of Indian Education (BIE); and partnerships of LEAs, state agencies, and the BIE with nonprofit or for-profit entities. The grant period is three years, and the Department has discretion to provide up to an additional two years of funding if the grantee demonstrates success. In making grants, the Department is required to give priority to applicants that support teachers, principals, and other school leaders in high-need schools and to ensure an equitable geographic distribution of grants, including the distribution of grants between rural and urban areas. An LEA, whether individually or as part of a consortium, is permitted to receive a grant under this program only twice.
. F U N DING HIS TORY (in millions)
FY 2019 FY 2020 FY 2021 FY 2022 PRESIDENT’s REQUEST $200.00 $200.00 $200.00 $200.00
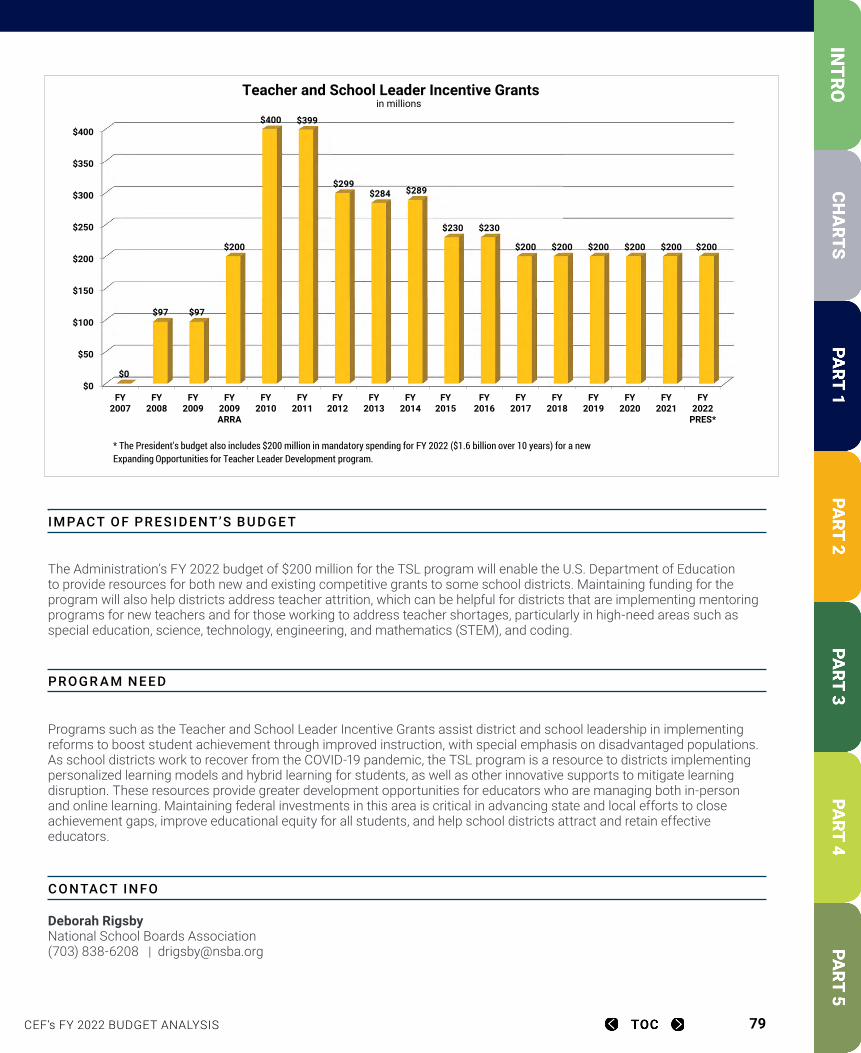
CEF’s FY 2022 BUDGET ANALYSIS 79
. IM PACT OF PR ES IDENT’S BU DGE T
The Administration’s FY 2022 budget of $200 million for the TSL program will enable the U.S. Department of Education to provide resources for both new and existing competitive grants to some school districts. Maintaining funding for the program will also help districts address teacher attrition, which can be helpful for districts that are implementing mentoring programs for new teachers and for those working to address teacher shortages, particularly in high-need areas such as special education, science, technology, engineering, and mathematics (STEM), and coding.
PROGR A M N EED
Programs such as the Teacher and School Leader Incentive Grants assist district and school leadership in implementing reforms to boost student achievement through improved instruction, with special emphasis on disadvantaged populations. As school districts work to recover from the COVID-19 pandemic, the TSL program is a resource to districts implementing personalized learning models and hybrid learning for students, as well as other innovative supports to mitigate learning disruption. These resources provide greater development opportunities for educators who are managing both in-person and online learning. Maintaining federal investments in this area is critical in advancing state and local efforts to close achievement gaps, improve educational equity for all students, and help school districts attract and retain effective educators.
CONTACT IN FO
Deborah Rigsby National School Boards Association (703) 838-6208 | [email protected]
FY 2007 FY 2008 FY 2009 FY 2009 AR FY 2010 FY 2011 FY 2012 FY 2013 FY 2014 FY 2015 FY 2016 FY 2017 FY 2018 FY 2019 FY 2020 FY 2021 FY 2022 PRES*0$ 97$ 97$ 200$ 400$ 399$ 299$ 284$ 289$ 230$ 230$ 200$ 200$ 200$ 200$ 200$ 200$
$0
$50
$100
$150
$200
$250
$300
$350
$400
FY2007
FY2008
FY2009
FY2009ARRA
FY2010
FY2011
FY2012
FY2013
FY2014
FY2015
FY2016
FY2017
FY2018
FY2019
FY2020
FY2021
FY2022
PRES*
$0
$97 $97
$200
$400 $399
$299 $284 $289
$230 $230
$200 $200 $200 $200 $200 $200
Teacher and School Leader Incentive Grantsin millions
* The President's budget also includes $200 million in mandatory spending for FY 2022 ($1.6 billion over 10 years) for a new Expanding Opportunities for Teacher Leader Development program.
CEF’s FY 2022 BUDGET ANALYSIS 80
Supporting Effective Educator Development (SEED) Grants Title II, Part B, Elementary & Secondary Education Act (Every Student Succeeds Act) With the support of federal SEED funding, Teach For America (TFA) will recruit, rigorously select, and prepare 7,500 teachers and place them in high-need schools to teach all P-12 grades and subjects. Through pre-service and ongoing training focused on equipping teachers with a core set of knowledge, skills, and mindsets, these educators will put their students on a path toward academic, social, and personal growth. SEED funding specifically will support TFA’s work to recruit and select talented individuals to ensure a diverse group of top leaders in high-need classrooms across the country. Funds will be used to provide intensive preparation through virtual summer teacher training (STT) to equip teachers with a core set of knowledge, skills, and mindsets to facilitate supportive, inclusive classrooms accessible to all students. In addition, SEED dollars help teachers build on the foundational knowledge and skills they acquire at STT and develop into effective teachers through ongoing regional support during their first two years in the classroom. Grants also increase access to effective STEM teachers by fielding a teaching corps nearly one-third of whom are trained to teach math and science, as well as to provide teachers strategies to promote students’ social and emotional health.
DES CRIP TION
The Supporting Effective Educator Development (SEED) program provides competitive grants to national nonprofit organizations, institutions of higher education, the Bureau of Indian Education, and partnerships for projects supported by a level of at least moderate evidence to improve educator effectiveness. Funds are used to support alternative preparation and certification activities and professional development activities for teachers, principals, and other school leaders. In the FY 2020 appropriations bill, Congress directed the U.S. Department of Education to provide awards to support professional development activities that help educators incorporate social and emotional learning into teaching and support pathways into teaching that provide a strong foundation in child development and learning. Grants also enable services and learning opportunities to be freely available to local school districts. SEED grants create learning and career growth opportunities for aspiring and current educators serving students in high-need schools. In FY 2018, the Department of Education awarded 14 new three-year SEED grants, and 16 new grants were awarded in 2020. Grantees focus on supporting improved school leadership and evidence-based professional development in a variety of settings, as well as high-quality instruction across a range of subject areas including literacy, science, technology, engineering and mathematics (STEM).
. F U N DING HIS TORY (in millions)
FY 2019 FY 2020 FY 2021 FY 2022 PRESIDENT’s REQUEST $75.00 $80.00 $80.00 $80.00
CEF’s FY 2022 BUDGET ANALYSIS 81
. IM PACT OF PR ES IDENT’S BU DGE T
The president’s FY 2022 budget maintains the FY 2021 funding level for Supporting Effective Educator Development. These competitive grants go to institutions of higher education, national nonprofit entities, and the Bureau of Indian Education (BIE) to provide educators with evidence-based professional development and support pathways that allow educators with nontraditional preparation and certification to obtain employment in traditionally underserved school districts. At the requested level the Department of Education would use the majority of the funds for new grant awards, a quarter of the funds for renewal awards, and the remaining portion for continuation grant awards.
PROGR A M N EED
Funding for the SEED program will support evidence-based national teacher, principal, and school leader preparation, certification, and professional development programs to prepare educators to effectively serve communities and students most in need. The SEED program is critical to ensuring a continued competitive and merit-based avenue for national nonprofits, institutions of higher education, the Bureau of Indian Affairs, and partnerships engaging in the difficult and important work of equipping educators with the skills to succeed in our nation’s underserved school districts and high-need schools.
CONTACT IN FO
Kelly Broughan Teach For America (202) 650-7872 | [email protected]
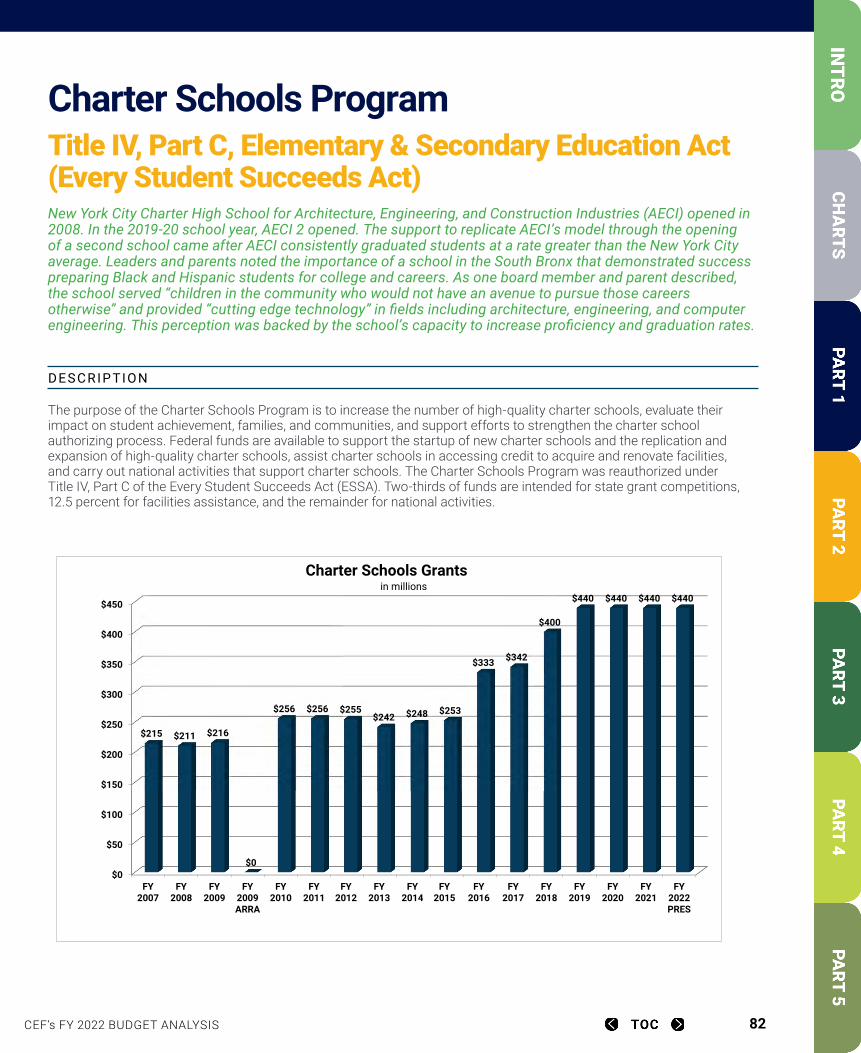
CEF’s FY 2022 BUDGET ANALYSIS 82
Charter Schools ProgramTitle IV, Part C, Elementary & Secondary Education Act (Every Student Succeeds Act) New York City Charter High School for Architecture, Engineering, and Construction Industries (AECI) opened in 2008. In the 2019-20 school year, AECI 2 opened. The support to replicate AECI’s model through the opening of a second school came after AECI consistently graduated students at a rate greater than the New York City average. Leaders and parents noted the importance of a school in the South Bronx that demonstrated success preparing Black and Hispanic students for college and careers. As one board member and parent described, the school served “children in the community who would not have an avenue to pursue those careers otherwise” and provided “cutting edge technology” in fields including architecture, engineering, and computer engineering. This perception was backed by the school’s capacity to increase proficiency and graduation rates.
DES CRIP TION
The purpose of the Charter Schools Program is to increase the number of high-quality charter schools, evaluate their impact on student achievement, families, and communities, and support efforts to strengthen the charter school authorizing process. Federal funds are available to support the startup of new charter schools and the replication and expansion of high-quality charter schools, assist charter schools in accessing credit to acquire and renovate facilities, and carry out national activities that support charter schools. The Charter Schools Program was reauthorized under Title IV, Part C of the Every Student Succeeds Act (ESSA). Two-thirds of funds are intended for state grant competitions, 12.5 percent for facilities assistance, and the remainder for national activities.
FY 2007 FY 2008 FY 2009 FY 2009 AR FY 2010 FY 2011 FY 2012 FY 2013 FY 2014 FY 2015 FY 2016 FY 2017 FY 2018 FY 2019 FY 2020 FY 2021 FY 2022 PRES215$ 211$ 216$ -$ 256$ 256$ 255$ 242$ 248$ 253$ 333$ 342$ 400$ 440$ 440$ 440$ 440$
$0
$50
$100
$150
$200
$250
$300
$350
$400
$450
FY2007
FY2008
FY2009
FY2009ARRA
FY2010
FY2011
FY2012
FY2013
FY2014
FY2015
FY2016
FY2017
FY2018
FY2019
FY2020
FY2021
FY2022PRES
$215 $211 $216
$0
$256 $256 $255$242 $248 $253
$333 $342
$400
$440 $440 $440 $440
Charter Schools Grantsin millions
CEF’s FY 2022 BUDGET ANALYSIS 83
. F U N DING HIS TORY (in millions)
FY 2019 FY 2020 FY 2021 FY 2022 PRESIDENT’s REQUEST $440.00 $440.00 $440.00 $440.00
*. IM PACT OF PR ES IDENT’S BU DGE T
The president’s budget freezes funding for the Charter School Program (CSP) and also proposes funding levels for the four authorized uses of CSP under ESSA: (1) State Entity and Charter Developer, $225 million; (2) Charter Management Organizations, $140 million; (3) Facilities, $60 million; and (4) National Activities, no less than $15 million. The president’s budget proposal would provide the critical funds necessary to continue the operation of current charter schools and allow for the possible creation of new charter schools in the future.
PROGR A M N EED
Charter School Program funding supports innovation and expands opportunities in charter schools for students with disabilities, English learners, and low-income students. The program also helps ensure suitable facilities necessary to strengthen charter schools and those they educate.
CONTACT IN FO
Laura Kaloi Stride Policy Solutions (202) 210-1494 | [email protected]
CEF’s FY 2022 BUDGET ANALYSIS 84
Magnet Schools Assistance ProgramTitle IV, Part D, Elementary & Secondary Education Act (Every Student Succeeds Act) Since welcoming their first students in 2011, Marine Science Magnet High School (MSMHS) has received awards and recognition for academic rigor. In 2018 – for a state record fifth time since opening in 2011 – the school, under the motto “effort creates ability,” received the Connecticut State Department of Education School of Distinction Award for the Highest Overall Performance. As a regional marine and aquaculture magnet school, MSMHS focuses on creating capable stewards of the ocean and preparing students for postsecondary education. MSMHS sets a high bar with its marine science themed programs and opportunities, as well as academically rigorous college preparatory opportunities that meet the needs of all students.
Cecelia Hosley is one of the 99 percent of all MSMHS graduates who have gone on to a two- or four-year college or university. Through the program at MSMHS, Hosley turned her love of being on the water into an interest in marine and environmental science. She went on to become the valedictorian of the school’s first graduating class and attended the Coast Guard Academy. Today she leads a crew of 25 as executive officer aboard the Coast Guard cutter Angela McShan, protecting marine life, our shared waters, and the people who fish them.
DES CRIP TION
The Magnet Schools Assistance Program (MSAP) was reauthorized in the Every Student Succeeds Act (ESSA) and provides multi-year grants to local school districts to establish magnet schools. It is the only federal education grant designed specifically to promote innovation, choice, and diversity in the classroom. MSAP funds may be used for implementation of specialized curricula and instruction, teacher professional development, and purchases of equipment, technology, and other resources that will enable magnet programs to operate and sustain themselves at a high-performing level.
. F U N DING HIS TORY (in millions)
FY 2019 FY 2020 FY 2021 FY 2022 PRESIDENT’s REQUEST $107.00 $107.00 $109.00 $149.00
.
. IM PACT OF PR ES IDENT’S BU DGE T
MSAP grants are critical for schools to launch magnet programs. While Magnet Schools of America (MSA) appreciates the additional funding for MSAP grants, MSA believes funding should be doubled, equal amounts for the current program and to support schools in sustaining their magnet programs.
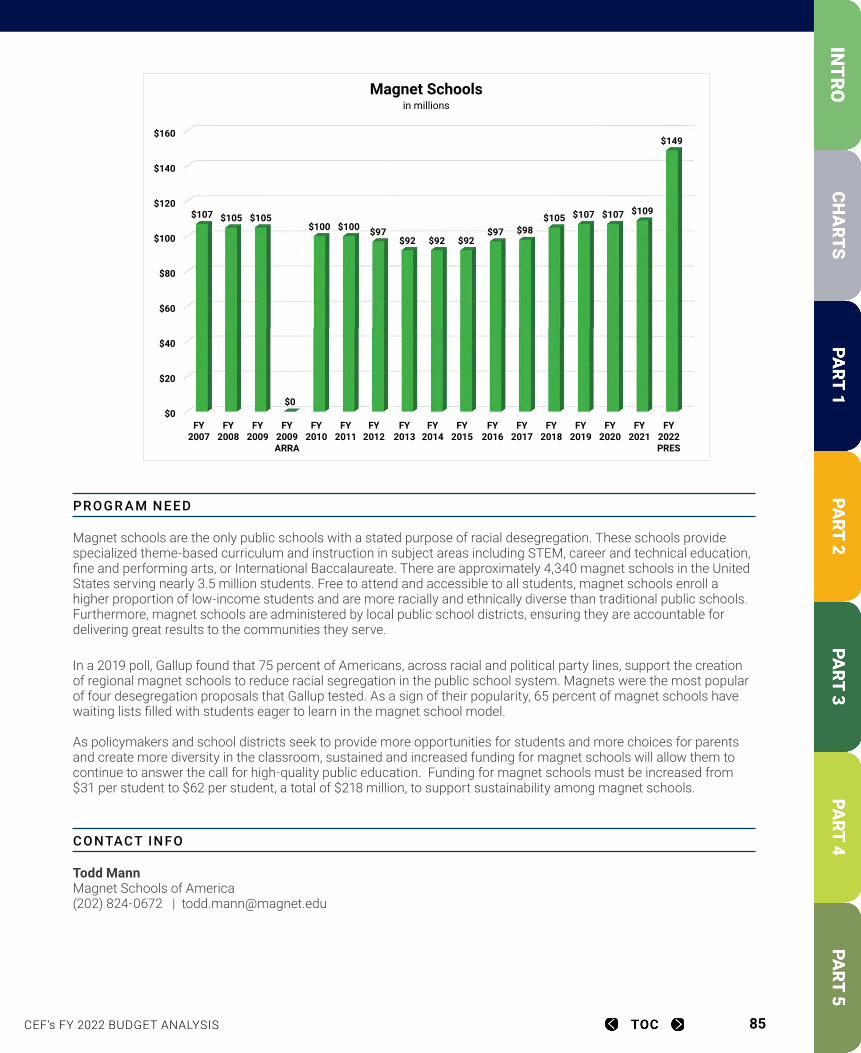
CEF’s FY 2022 BUDGET ANALYSIS 85
PROGR A M N EED
Magnet schools are the only public schools with a stated purpose of racial desegregation. These schools provide specialized theme-based curriculum and instruction in subject areas including STEM, career and technical education, fine and performing arts, or International Baccalaureate. There are approximately 4,340 magnet schools in the United States serving nearly 3.5 million students. Free to attend and accessible to all students, magnet schools enroll a higher proportion of low-income students and are more racially and ethnically diverse than traditional public schools. Furthermore, magnet schools are administered by local public school districts, ensuring they are accountable for delivering great results to the communities they serve.
In a 2019 poll, Gallup found that 75 percent of Americans, across racial and political party lines, support the creation of regional magnet schools to reduce racial segregation in the public school system. Magnets were the most popular of four desegregation proposals that Gallup tested. As a sign of their popularity, 65 percent of magnet schools have waiting lists filled with students eager to learn in the magnet school model. As policymakers and school districts seek to provide more opportunities for students and more choices for parents and create more diversity in the classroom, sustained and increased funding for magnet schools will allow them to continue to answer the call for high-quality public education. Funding for magnet schools must be increased from $31 per student to $62 per student, a total of $218 million, to support sustainability among magnet schools.
CONTACT IN FO
Todd Mann Magnet Schools of America (202) 824-0672 | [email protected]
FY 2007 FY 2008 FY 2009 FY 2009 ARFY 2010 FY 2011 FY 2012 FY 2013 FY 2014 FY 2015 FY 2016 FY 2017 FY 2018 FY 2019 FY 2020 FY 2021 FY 2022 PRES107$ 105$ 105$ -$ 100$ 100$ 97$ 92$ 92$ 92$ 97$ 98$ 105$ 107$ 107$ 109$ 149$
$0
$20
$40
$60
$80
$100
$120
$140
$160
FY2007
FY2008
FY2009
FY2009ARRA
FY2010
FY2011
FY2012
FY2013
FY2014
FY2015
FY2016
FY2017
FY2018
FY2019
FY2020
FY2021
FY2022PRES
$107 $105 $105
$0
$100 $100 $97$92 $92 $92
$97 $98$105 $107 $107 $109
$149
Magnet Schoolsin millions
CEF’s FY 2022 BUDGET ANALYSIS 86
Ready To LearnTitle IV, Part F, Elementary & Secondary Education Act (Every Student Succeeds Act)
As part of their local Ready To Learn (RTL) work, Kentucky Educational Television (KET) conducted 16 Family and Community Learning workshop series for 217 families in Louisville and Eastern Kentucky and presented 22 Educator and Community Learning sessions granting 706 professional development certificates to educators in RTL communities. Family and Community Learning Workshops consist of 4 sessions that engage families with children ages 3-8 in hands-on learning utilizing PBS KIDS media. The workshops aim to foster collaboration,
communication, and fun among family members, while supporting grown-ups’ confidence and comfort to help in their children’s learning.
The goal of Educator and Community Learning Workshops (formerly Playful Learning for Educators) is to empower educators with the tools, skills, and confidence to bring similar media-rich, play-based, and learner-centered experiences into their own environments and communities. KET provided professional development for educators through a hybrid course pilot program. The “Supporting Play with Media and Technology” course gave educators the opportunity to explore how technology and media can promote playful learning in science in their own classrooms. The pilot, a partnership with Maryland Public Television funded by the Ready To Learn grant, provided educators the opportunity to participate in a virtual self-paced course, an in-person learning experience, and an independent learning project. Adjustments were made to the course in response to COVID-19, enabling educators to complete it through additional virtual meetings. This hybrid course fills an ongoing need for high-quality professional development in Kentucky.
DES CRIP TION
Ready To Learn uses the power of public television’s on-air, online, mobile, and on the ground educational content to build the math and reading skills of children between the ages of two and eight, especially those from low-income families. First authorized in 1992 and reauthorized in 2001 and 2015, Ready To Learn is a competitive grant program funding the research and development of high-quality, scientifically based, multimedia educational content that can be used at home and in the classroom. This content is available free to children nationwide. Ready To Learn grants are a critical part of the development of public television’s groundbreaking educational children’s programming like Molly of Denali, Ready Jet Go!, The Cat in the Hat Knows a Lot About That, Peg + Cat, SUPER WHY!, Martha Speaks, and many others that have been proven to help prepare children for success in school.
Ready To Learn leverages national-local partnerships that bring the very best educational media content to teachers and caregivers in schools, preschools, and home schools, along with supporting educational content, materials, and training to help incorporate these media resources into a variety of learning settings. Ready To Learn content is on public television, online, in mobile apps, and available through in person engagement. Partnerships also include Head Start and other childcare centers, libraries, mobile learning labs, Boys and Girls Clubs, and community centers.
Ready To Learn’s math and literacy content is rigorously tested and evaluated to assess its impact on children’s learning. Since 2005, more than 100 research and evaluation studies have shown Ready To Learn literacy and math content engages children, enhances early learning skills, and allows children to make significant academic gains that help to close the achievement gap.
.
CEF VIDEO
CEF’s FY 2022 BUDGET ANALYSIS 87
F U N DING HIS TORY (in millions)
FY 2019 FY 2020 FY 2021 FY 2022 PRESIDENT’s REQUEST $27.74 $29.00 $29.50 $29.50
. IM PACT OF PR ES IDENT’S BU DGE T
The president’s budget recommends freezing funding, which would erode the purchasing power of the Ready To Learn funded projects and limit the ability of Ready To Learn grantees to expand on-the-ground community engagement that ensures the effectiveness of this program.
For FY 2022, a funding level of $30 million is recommended to support the continued creation of high-quality, proven effective educational media content. This funding level will also support expanded on-the-ground community engagement and outreach to ensure these resources reach the children, families, teachers, and schools that need them the most.
PROGR A M N EED
Research shows children who start school behind stay behind, so it is critical to ensure all children are prepared when they enter K-12 education. However, in the United States 52 percent of children ages three and four do not attend preschool. In addition, of the more than 25 million American children under age six, 43 percent are living in low-income households. Research shows these children often struggle with early math and literacy skills, setting them on a downward trajectory once they enter school. Children from low-income families tend on average to score as much as 25 points lower on standardized tests than their higher income peers.
The need for the high-quality educational media content created by Ready To Learn became even more critical during the pandemic. With schools and daycare facilities closed, parents and caregivers were desperate for trusted educational resources to help kids continue learning at home. PBS KIDS is considered by 86 percent of parents to be a trusted and safe source for kids to watch television and play digital games and apps, making public television a critical resource during these challenging times.
During the pandemic, local public television stations in all 50 States, U.S. territories and the District of Columbia leveraged Ready To Learn resources to provide families and educators with robust educational content to help support learning. In the first 8 weeks of the pandemic, 23 million students and families were reached by public television’s over-the-air broadcast content, and 21 million children, parents and educators engaged with public television’s digital content. Users of PBS LearningMedia increased by 240 percent during the pandemic, providing free access to tens of thousands of state curriculum-aligned digital learning objects including Ready To Learn created content. In addition, users of PBS Parents grew by 80 percent.
There is clearly a need for high-quality educational content for young children, and Ready To Learn is helping meet that need. Through local public television stations, nearly 97 percent of American families have access to Ready To Learn content that is proven to help children learn. Funding for this program has created scientifically researched, award-winning educational programming that is helping to close the opportunity gap.
CONTACT IN FO
Kate Riley America’s Public Television Stations (202) 654-4206 | [email protected]
CEF’s FY 2022 BUDGET ANALYSIS 88
Assistance for Arts EducationTitle IV, Part F, Elementary & Secondary Education Act (Every Student Succeeds Act) ”As the only art teacher in my district, I had gotten used to working in isolation. Our Mastering the Arts program, made possible by an Assistance for Arts Education grant, has been instrumental in opening my eyes to the creative ways other teachers incorporate art as both a learning method and a product of learning. When I sit down to plan my lessons, I now find myself with copies of our math and science standards open on my desktop. I check our grade-level pacing guides to find places to tie my own standards to their curriculum.
Now my art classes observe chemical reactions as their clay sculptures are heated inside a kiln. Fifth graders use images from the Hubble Space Telescope and National Geographic to discuss how photography can teach scientists about how our universe works, document life on earth, and encourage conservation of resources. Second grade students use fractions in art to build castles in the style of Mary Blair by cutting whole, half, and quarter pieces. The list of projects is growing every year! This grant provided amazing experiences for me as a teacher, and I can see my students lighting up as they make the same connections.”
- Staci Simonsen, K-5 Art Specialist, Wahoo (NE) Public Schools
DES CRIP TION
Authorized under Title IV, Part F of the Every Student Succeeds Act (ESSA), the Assistance for Arts Education program promotes arts education for students, including disadvantaged students and students with disabilities, through competitive and non-competitive grant awards. In recent years, the U.S. Department of Education awarded three types of grants: Assistance for Arts Education Development and Dissemination (AAEDD), Professional Development for Arts Educators (PDAE), and the Arts in Education National Program (AENP). AAEDD grants supported the expansion, evaluation, and dissemination of innovative models that demonstrate effective arts integration, standards-based instruction, and student academic performance in music and the arts. PDAE grants supported the implementation of model professional development programs that used arts integration to improve students’ academic performance in high- poverty schools. AENP grants supported similar community and national activities, emphasizing service to children from low-income families and children with disabilities. In January 2021, the Department of Education announced the three categories would be combined into a single grant program to recognize and encourage different, creative, and innovative approaches grantees can use to increase access to the arts and integrate arts into the learning process.
. F U N DING HIS TORY (in millions)
FY 2019 FY 2020 FY 2021 FY 2022 PRESIDENT’s REQUEST $29.00 $30.00 $30.50 $30.50

CEF’s FY 2022 BUDGET ANALYSIS 89
. IM PACT OF PR ES IDENT’S BU DGE T
The president’s budget for FY 2022 proposes continued support for the Assistance for Arts Education program. Funding continuity is imperative, as many of the grants awarded under this program support ongoing, multi-year projects. Especially now that applicants will have more flexibility in their grant applications, increased funding would provide more numerous and more meaningful opportunities for professional development and dissemination of effective models for arts education and arts integration. The focus this grant places on the production and dissemination of innovative models for arts education means that an increased federal investment would yield improved practices that can be further replicated across the country.
PROGR A M N EED
The disruption students have experienced during the COVID-19 pandemic makes federal funding for arts education more important than ever before. Music and arts education create environments highly conducive to students’ social and emotional learning, a key focus for schools across the nation as students return to campus. When exposed to the arts, students are much more engaged in learning and excited about school, another urgent concern after a year of distance learning. Arts integration techniques promoted by this grant have been shown to positively impact student learning and epitomize the concept of a “well-rounded education.” Indeed, research studies — many of which were funded through this program — continue to indicate the adoption of arts integration and STEAM (science, technology, engineering, arts, and math) strategies is beneficial to students’ academic achievement. Yet despite ESSA’s enumeration of music and the arts as well-rounded education subjects, inequitable access to high-quality arts education persists. The most recent National Assessment of Education Progress Arts Assessment revealed significant disparities in music and visual art achievement across racial, socio-economic, and gender groups. Furthermore, music and arts educators frequently cite the need for additional training on teaching students with disabilities. Adequate funding for the Assistance for Arts Education program will support additional competitive grants to improve music and arts learning, and findings from model projects may be more widely disseminated.
CONTACT IN FO
Tooshar Swain National Association for Music Education 571-323-5926 | [email protected]
CEF’s FY 2022 BUDGET ANALYSIS 90
Gifted and Talented ProgramTitle IV, Part F, Elementary & Secondary Education Act (Every Student Succeeds Act)) Early in the COVID-19 pandemic, students ages 5 through 18 participating in the Javits Gifted and Talented Students Education Program grant to A.D. Henderson University School and Florida Atlantic University High School identified the crisis shortage of personal protective equipment (PPE) as a priority and decided to act. The Javits grant fosters student and faculty exploration of complex challenges in cutting edge science and technology such as cybersecurity, autonomous vehicles, robotics, virtual reality, augmented reality, automation, and artificial intelligence. Reacting to the pandemic and PPE shortage crisis, students and faculty members began production of 3D-printed face shields, intubation chambers, and ear savers to support local health care workers at several local hospitals in Palm Beach County. Students check out and bring home 3D printers to create PPE and then participate in socially distanced drop-off events outside their school, where hospital representatives are able to pick up the PPE. The project director attributes this initiative, in part, to the strong school culture that the Javits project has helped to build over the last few years, with focus on institutionalizing practices that support student social and emotional learning as well as academic growth.
DES CRIP TION
As the only federal program dedicated to addressing the unique educational needs of gifted and talented students, the Jacob K. Javits Gifted and Talented Students Education Act focuses its resources on children traditionally underrepresented in gifted education programs – students with disabilities, English language learners, and individuals from economically disadvantaged backgrounds. Through a system of competitive research grants, state capacity building grants, and a national research center on gifted education, the Javits Act fills a critical void in our nation’s education system.
. F U N DING HIS TORY (in millions)
FY 2019 FY 2020 FY 2021 FY 2022 PRESIDENT’s REQUEST $12.00 $13.00 $13.50 $13.50
. IM PACT OF PR ES IDENT’S BU DGE T
The FY 2022 request of $13.5 million is just enough to cover continuation costs of current Javits grants, and a more robust investment is required to adequately address the needs of high-ability students across the nation. Greater funding would allow enhanced research, development of interventions to increase the number of disadvantaged students performing at advanced levels, and support for closing the achievement gap among students at the highest levels of academic attainment.

CEF’s FY 2022 BUDGET ANALYSIS 91
PROGR A M N EED
Reports indicate every state has a growing “excellence gap,” with students from low-income or minority backgrounds less likely to reach advanced levels on state and national assessments than their more advantaged peers. As with most preexisting inequities, the COVID-19 pandemic has likely further exacerbated that excellence gap. The Javits program is the only federally funded national effort that confronts this reality by supporting evidence-based research to inform educators about how to most effectively serve gifted and talented students. An investment of at least $32 million is essential to assist states to expand their capacity to provide services to gifted students, especially students from disadvantaged backgrounds, and to implement innovative approaches. As the nation works to address the challenges students have endured because of the pandemic, this federal investment is more critical than ever.
CONTACT IN FO
Kuna Tavalin Council for Exceptional Children (202) 669-2669 | [email protected]
CEF’s FY 2022 BUDGET ANALYSIS 92
Statewide Family Engagement CentersTitle IV, Part E, Elementary & Secondary Education Act (Every Student Succeeds Act) Statewide Family Engagement Center (SFEC) grantees are in their third year of a five-year grant cycle. The 12 grantees hail from rural, suburban, and urban areas across the country. They focus on evidence-based programming that targets marginalized families to involve them actively in their children’s education and on developing robust statewide partnerships to reach and engage more parents in leadership and educational decision making. As schools have pivoted to remote and hybrid operation due to the pandemic, families have been thrust into the role of supervising and supporting daily schooling. The parents at Everett Elementary School, one of the Lincoln public schools that partners with the Nebraska Statewide Family Engagement Center, sought guidance on how to support their children in the new remote learning environment. Seeing the need for parents to navigate virtual resources, the SFEC’s family literacy staff, working with Everett, teamed up with teachers and the school librarian to teach parents how to use various digital learning platforms. With their assistance, parents were able to explore and learn these online resources and better support their children’s education at home during remote learning. Parents who once faced challenges simply logging onto the Zoom virtual platform have now become digital literacy leaders in their local community and continue to grow in their roles as co-teacher and advocate for their children.
DES CRIP TION
The Statewide Family Engagement Centers (SFEC) program, authorized at $10 million under the Every Student Succeeds Act (ESSA), provides federal competitive grants to statewide organizations or a consortium of statewide organizations to promote and implement evidenced-based family engagement strategies. The SFEC program provides technical assistance and partnership development to states and school districts on fostering meaningful engagement with families to further their children’s academic and developmental progress. SFECs also provide vital direct services to improve the communication among children, teachers, school leaders, counselors, administrators, and other school personnel to enhance parent understanding and engagement in district, state, and federal education policies.
. F U N DING HIS TORY (in millions)
FY 2019 FY 2020 FY 2021 FY 2022 PRESIDENT’s REQUEST $10.00 $10.00 $12.50 $12.50
. IM PACT OF PR ES IDENT’S BU DGE T
The president’s budget freezes funding for the SEFC program, enabling the U.S. Department of Education at least to support continuation grants and possibly some new awards. A dedicated funding stream for the SEFC grant program must be maintained and the funding level increased to ensure evidence-based direct services and systemic improvement of family engagement are continued and new awards are granted. This federal investment to improve and expand family engagement in public education will help put more families at the table as equal partners in their child’s education.
CEF’s FY 2022 BUDGET ANALYSIS 93
PROGR A M N EED
Research shows parent and family engagement matters for student success, improving both school and life outcomes. Family engagement contributes to improved student attendance and achievement, decreased disciplinary issues, and improved family and school partnerships. Effective family engagement means schools and school districts prepare families to understand content and achievement standards and state and local academic assessments. Research shows a student’s academic achievement is directly linked to the education level of the primary caretaker. Thus, truly robust family engagement includes conducting adult education instruction alongside early childhood education such as the family literacy model, a grant priority for the Statewide Family Engagement Centers. Engaged families are better equipped to monitor their child’s progress and work with educators to improve achievement.
Due to the COVID-19 pandemic, many homes have become the classroom and parents have become surrogate teachers, responsible for their children’s learning. Building closures have placed more challenges on parents seeking to engage with their child’s teacher. Effective engagement between parents and the school and teachers is more challenging while, at the same time, families have become even more critical to their children’s academic success.
Funds for Statewide Family Engagement Centers are designed to provide schools and districts with techniques to educate teachers, specialized instructional support personnel, principals, and other staff to engage all families, especially those who are marginalized, in a meaningful way. Centers build ties among the community, families, and schools. SFECs quickly adapted to conducting their work virtually and have altered their approach to support parents’ evolving needs more effectively during the pandemic. This kind of support is valuable for all parents and of critical importance to parents who themselves struggled in school or failed to graduate from high school. Family engagement is an essential component of supporting the students most impacted by the pandemic to mitigate disruptions in learning.
CONTACT IN FO
Kuna Tavalin Stride Policy Solutions (202) 669-2669 | [email protected]
Leslie Lina Paluch National PTA (703) 679-2092 | [email protected]
CEF’s FY 2022 BUDGET ANALYSIS 94
Language Acquisition GrantsTitle III, Part A, Elementary & Secondary Education Act (Every Student Succeeds Act) Title III funds in Oakland Unified School District support professional learning, building educators’ capacity to provide language rich instruction for English language learners (ELLs). Language specialists provide foundational professional development and sustained learning for teachers, with an emphasis on integrated and designated English Language Development (ELD). Specialists also support school leaders in the implementation of structures and systems of continuous improvement for ELLs, such as self-assessments on ELD implementation, site-based ELL reviews, and data analysis protocols.
DES CRIP TION
Language Acquisition Grants are provided on a formula basis to improve instructional programs for English learners (ELLs). Programs aim to develop academic English and high levels of academic achievement to enable ELLs to meet the same challenging state content and performance standards as their English-proficient peers. The program assists states, school districts, and institutions of higher education in building capacity to more effectively teach ELL students through efforts including upgrading curricula, acquiring instructional materials, and providing teacher training opportunities. Title III funds may also be used to pay for activities that enhance educational opportunities for immigrant children and youth.. F U N DING HIS TORY (in millions)
FY 2019 FY 2020 FY 2021 FY 2022 PRESIDENT’s REQUEST $737.40 $787.40 $797.40 $917.40
. IM PACT OF PR ES IDENT’S BU DGE T
The president’s FY 2022 budget provides $917.40 million for Title III funding for English language learners. This 15 percent increase above FY 2021 includes a $20 million set-aside in National Activities for additional support to states where a large number of unaccompanied migrant children have been placed by the Office of Refugee Resettlement. These increases would have a significant impact on the preparedness and achievement of ELLs and would put them in a much better position to succeed.
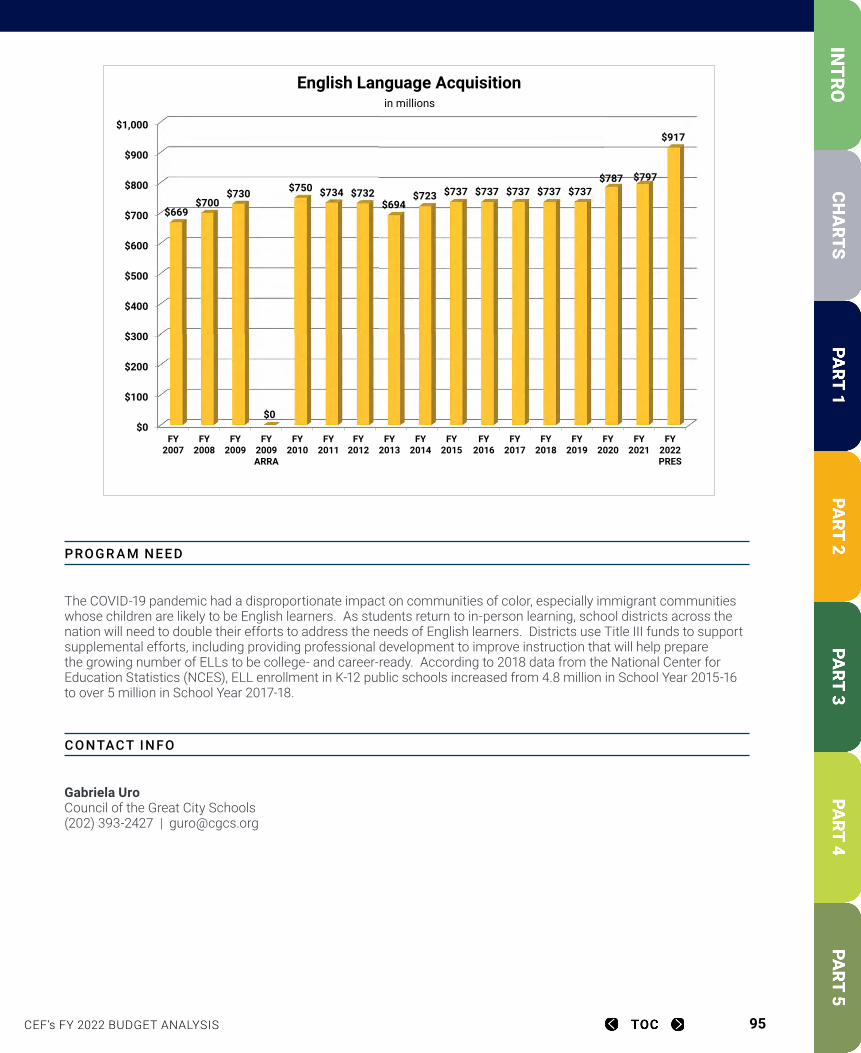
CEF’s FY 2022 BUDGET ANALYSIS 95
PROGR A M N EED
The COVID-19 pandemic had a disproportionate impact on communities of color, especially immigrant communities whose children are likely to be English learners. As students return to in-person learning, school districts across the nation will need to double their efforts to address the needs of English learners. Districts use Title III funds to support supplemental efforts, including providing professional development to improve instruction that will help prepare the growing number of ELLs to be college- and career-ready. According to 2018 data from the National Center for Education Statistics (NCES), ELL enrollment in K-12 public schools increased from 4.8 million in School Year 2015-16 to over 5 million in School Year 2017-18.
CONTACT IN FO
Gabriela Uro Council of the Great City Schools (202) 393-2427 | [email protected]
FY 2007 FY 2008 FY 2009 FY 2009 ARFY 2010 FY 2011 FY 2012 FY 2013 FY 2014 FY 2015 FY 2016 FY 2017 FY 2018 FY 2019 FY 2020 FY 2021 FY 2022 PRES669$ 700$ 730$ -$ 750$ 734$ 732$ 694$ 723$ 737$ 737$ 737$ 737$ 737$ 787$ 797$ 917$
$0
$100
$200
$300
$400
$500
$600
$700
$800
$900
$1,000
FY2007
FY2008
FY2009
FY2009ARRA
FY2010
FY2011
FY2012
FY2013
FY2014
FY2015
FY2016
FY2017
FY2018
FY2019
FY2020
FY2021
FY2022PRES
$669$700
$730
$0
$750 $734 $732$694
$723 $737 $737 $737 $737 $737$787 $797
$917
English Language Acquisitionin millions
CEF’s FY 2022 BUDGET ANALYSIS 96
IDEA State Grants Part B, Individuals with Disabilities Education Act (IDEA) In March 2020, as schools closed their doors due to the COVID-19 pandemic, many students with disabilities and their families were left without critical in-person supports and services. Educators quickly came together to figure out how to meet their students’ needs. For example, take Kim, a special educator in Bethesda, Maryland. To help her students continue to thrive in a distance learning environment, she set daily routines and expectations to provide them stability. She identified the evidence-based practices she could continue using during virtual learning. Additionally, she partnered with specialized instructional support personnel to ensure technology could be used and adjusted to meet individual students’ needs, no matter their disability. In many places, speech-language pathologists and occupational therapists met with students virtually and continued to provide interventions and specialized instructional support services as outlined in their students’ IEPs. Educators embraced the importance of family-school collaboration, working closely with parents to meet students’ needs, hosting virtual meetings, and sharing more information than ever before. These best practices in special education have allowed many students with disabilities to thrive during the pandemic with the support of dedicated educators, school staff, and families. Though needs may grow while schools remain closed, IDEA funds allow general and special educators to customize learning for each student and meet their needs during this difficult time and into the future.
DES CRIP TION
The Individuals with Disabilities Education Act (IDEA) State Grant program (Part B) provides services and supports to around 6.5 million students, or 13 percent, of all public school students from ages 5-21 (unless a state sets a higher termination age). To be eligible for Part B services, students must meet one of 13 enumerated disability categories and must need educational supports and services in order to make academic progress on a level relative to peers without disabilities. The majority of students with disabilities are educated in the general education classroom for 80 percent or more of the school day. An Individualized Education Program (IEP) is designed for each student with input from general and special education staff, other specialists, the child’s parents, and the student as appropriate. Part B funds are sent to states through a specific funding formula. In turn, states pass the bulk of funds to local school districts to provide students with the essential specialized instruction designed to meet their unique needs and prepare them for further education, employment, and independent living. Allowable uses of funds include hiring teachers and specialized instructional support personnel, such as speech-language pathologists and school psychologists, and purchasing assistive technology. States monitor local school districts for compliance with the law, provide technical assistance, and offer mediation services.
. F U N DING HIS TORY (in millions)
FY 2019 FY 2020 FY 2021 FY 2022 PRESIDENT’s REQUEST $12,364.39 $12,764 .39 $12,937.46 $15,537.43
. IM PACT OF PR ES IDENT’S BU DGE T
The president’s FY 2022 budget of $15.54 billion for IDEA State Grants adds $2.6 billion, or a 20.1 percent increase over FY 2021. This additional funding would provide a per-child average of approximately $2,390. These federal dollars are desperately needed, as previous funding increases have only covered a portion of annual inflation. The current federal contribution is around 13 percent of excess costs of educating students with disabilities, far below the 40 percent funding promised by Congress when IDEA was first enacted in 1975. The current level does not acknowledge increased costs faced by states and local school districts in meeting the needs of students with disabilities, nor does it factor in the growing number of students. Over time, these increased costs have resulted in an erosion of purchasing power and resources.
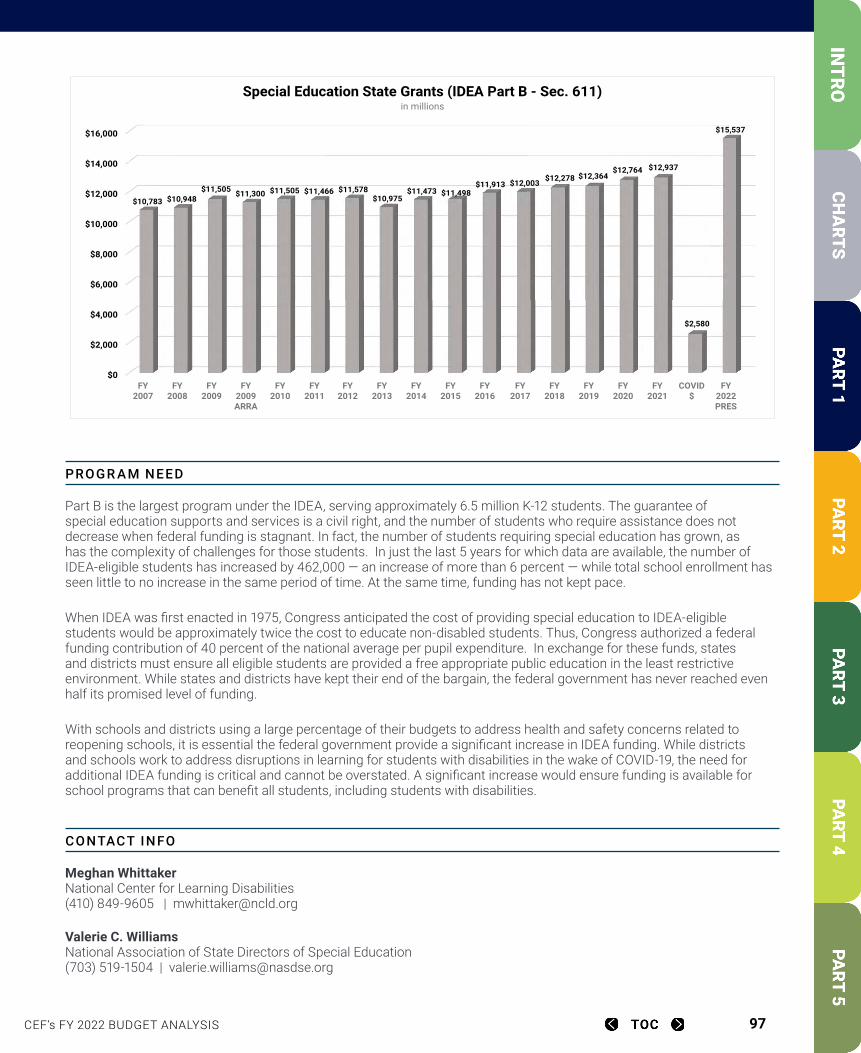
CEF’s FY 2022 BUDGET ANALYSIS 97
PROGR A M N EED
Part B is the largest program under the IDEA, serving approximately 6.5 million K-12 students. The guarantee of special education supports and services is a civil right, and the number of students who require assistance does not decrease when federal funding is stagnant. In fact, the number of students requiring special education has grown, as has the complexity of challenges for those students. In just the last 5 years for which data are available, the number of IDEA-eligible students has increased by 462,000 — an increase of more than 6 percent — while total school enrollment has seen little to no increase in the same period of time. At the same time, funding has not kept pace.
When IDEA was first enacted in 1975, Congress anticipated the cost of providing special education to IDEA-eligible students would be approximately twice the cost to educate non-disabled students. Thus, Congress authorized a federal funding contribution of 40 percent of the national average per pupil expenditure. In exchange for these funds, states and districts must ensure all eligible students are provided a free appropriate public education in the least restrictive environment. While states and districts have kept their end of the bargain, the federal government has never reached even half its promised level of funding.
With schools and districts using a large percentage of their budgets to address health and safety concerns related to reopening schools, it is essential the federal government provide a significant increase in IDEA funding. While districts and schools work to address disruptions in learning for students with disabilities in the wake of COVID-19, the need for additional IDEA funding is critical and cannot be overstated. A significant increase would ensure funding is available for school programs that can benefit all students, including students with disabilities.
CONTACT IN FO
Meghan Whittaker National Center for Learning Disabilities (410) 849-9605 | [email protected]
Valerie C. Williams National Association of State Directors of Special Education (703) 519-1504 | [email protected]
FY 2007 FY 2008 FY 2009 FY 2009 ARFY 2010 FY 2011 FY 2012 FY 2013 FY 2014 FY 2015 FY 2016 FY 2017 FY 2018 FY 2019 FY 2020 FY 2021 COVID $ FY 2022 PRES10,783$ 10,948$ 11,505$ 11,300$ 11,505$ 11,466$ 11,578$ 10,975$ 11,473$ 11,498$ 11,913$ 12,003$ 12,278$ 12,364$ 12,764$ 12,937$ 2,580$ 15,537$
$0
$2,000
$4,000
$6,000
$8,000
$10,000
$12,000
$14,000
$16,000
FY2007
FY2008
FY2009
FY2009ARRA
FY2010
FY2011
FY2012
FY2013
FY2014
FY2015
FY2016
FY2017
FY2018
FY2019
FY2020
FY2021
COVID$
FY2022PRES
$10,783 $10,948 $11,505 $11,300 $11,505 $11,466 $11,578
$10,975 $11,473 $11,498
$11,913 $12,003 $12,278 $12,364 $12,764 $12,937
$2,580
$15,537
Special Education State Grants (IDEA Part B - Sec. 611)in millions
CEF’s FY 2022 BUDGET ANALYSIS 98
IDEA Preschool ProgramPart B, Sec. 619, Individuals with Disabilities Education Act (IDEA) Noah is a five-year old boy with Autism who is learning how to effectively communicate with others. Before the pandemic, Noah’s educators and therapists were using play-based sessions to help shape his language, using real-time scenarios, props, and problem solving. When the pandemic closed schools in March 2020, Noah’s educators had to shift to teletherapy in order to continue to support him. They collaborated closely with his parents, each week sharing plans that described the goals and strategies and suggestions for play. In weekly coaching sessions, educators would meet with Noah’s parents about his progress, troubleshoot the challenges, and continue to lay out activities that could help him grow. This is just one example of the many dedicated educators and specialized instructional support personnel who work with students through IDEA’s Part B, Section 619 program and the innovative ways they have supported students and families during the pandemic to ensure growth and full participation early in children’s academic lives.
DES CRIP TION
States and local school districts use IDEA Preschool Grants to help ensure children with disabilities ages 3 through 5 are identified early and receive a free appropriate public education. In addition, the federal contribution to preschool special education facilitates the continuity of services for children with disabilities transitioning to school from the Infant and Toddler program (Part C, ages birth through 2) which provides early intervention services.
. F U N DING HIS TORY (in millions)
FY 2019 FY 2020 FY 2021 FY 2022 PRESIDENT’s REQUEST $391.12 $394.12 $397.62 $502.62
. IM PACT OF PR ES IDENT’S BU DGE T
The president’s FY 2022 budget increases funding for the IDEA Preschool Grants program to $502.62 million. In FY 2016 this program saw a small increase of $15 million, the first forward movement in over a decade. In FY 2017 funding for the IDEA Preschool program was again frozen, and in subsequent years, there were only small increases. The president’s FY 2022 budget brings welcome relief and finally moves the needle on funding and support for children with disabilities. Research affirms early childhood special education can help avoid the need for more costly and intensive services and supports when children are older. As the number of students served under IDEA’s Part C Infant and Toddler program increases, additional funding for the Preschool program will be necessary to continue to serve those children when they reach age three.
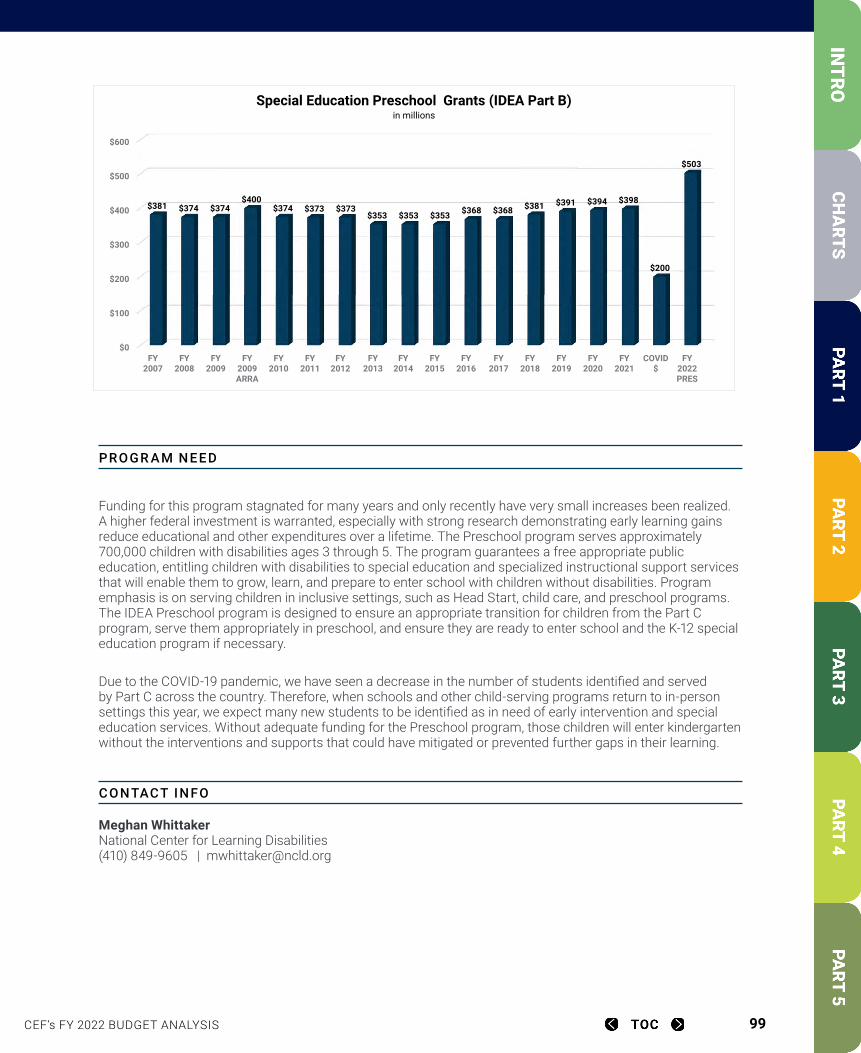
CEF’s FY 2022 BUDGET ANALYSIS 99
PROGR A M N EED
Funding for this program stagnated for many years and only recently have very small increases been realized. A higher federal investment is warranted, especially with strong research demonstrating early learning gains reduce educational and other expenditures over a lifetime. The Preschool program serves approximately 700,000 children with disabilities ages 3 through 5. The program guarantees a free appropriate public education, entitling children with disabilities to special education and specialized instructional support services that will enable them to grow, learn, and prepare to enter school with children without disabilities. Program emphasis is on serving children in inclusive settings, such as Head Start, child care, and preschool programs. The IDEA Preschool program is designed to ensure an appropriate transition for children from the Part C program, serve them appropriately in preschool, and ensure they are ready to enter school and the K-12 special education program if necessary.
Due to the COVID-19 pandemic, we have seen a decrease in the number of students identified and served by Part C across the country. Therefore, when schools and other child-serving programs return to in-person settings this year, we expect many new students to be identified as in need of early intervention and special education services. Without adequate funding for the Preschool program, those children will enter kindergarten without the interventions and supports that could have mitigated or prevented further gaps in their learning.
CONTACT IN FO
Meghan Whittaker National Center for Learning Disabilities (410) 849-9605 | [email protected]
FY 2007 FY 2008 FY 2009 FY 2009 ARFY 2010 FY 2011 FY 2012 FY 2013 FY 2014 FY 2015 FY 2016 FY 2017 FY 2018 FY 2019 FY 2020 FY 2021 COVID $ FY 2022 PRES381$ 374$ 374$ 400$ 374$ 373$ 373$ 353$ 353$ 353$ 368$ 368$ 381$ 391$ 394$ 398$ 200$ 503$
$0
$100
$200
$300
$400
$500
$600
FY2007
FY2008
FY2009
FY2009ARRA
FY2010
FY2011
FY2012
FY2013
FY2014
FY2015
FY2016
FY2017
FY2018
FY2019
FY2020
FY2021
COVID$
FY2022PRES
$381 $374 $374 $400
$374 $373 $373 $353 $353 $353 $368 $368 $381 $391 $394 $398
$200
$503
Special Education Preschool Grants (IDEA Part B)in millions
CEF’s FY 2022 BUDGET ANALYSIS 100
IDEA Infants and Toddlers with Disabilities Part C, Individuals with Disabilities Education Act (IDEA) At 13 months of age, Tommy was referred to a local IDEA-Part C program by his pediatrician after being diagnosed with cerebral palsy. Tommy’s parents indicated he seemed to understand everything they said. However, his attempts at speech and using basic signs were making him increasingly frustrated as he tried to communicate with family and children in his child care setting. Tommy’s parents wanted him to have an effective means to interact with others around him in his everyday activities. They also wanted to learn how to best support Tommy’s language and communication skills and ensure he had a functional and robust way to express himself in child care and future school settings.
Through the Part C program, a speech-language pathologist (SLP) performed a clinical evaluation of Tommy’s speech, language, cognitive, and social skills in his natural home and child care environments. Based on initial findings, the SLP referred Tommy to the early intervention team for augmentative and alternative communication (AAC) assessments. The SLP on that team collaborated with Tommy’s family to implement an AAC system and strategies that maximized his ability to communicate autonomously. The SLP also consulted with the team’s occupational therapist to facilitate Tommy’s visual and motor access to the system. The SLP trained Tommy’s family and child care providers in aided language stimulation and supported them in learning to model and use the AAC and multimodal communication systems. By the time Tommy transitioned to preschool, he was able to spontaneously convey his own ideas, initiate interactions with his teachers and peers, and make new friends.
DES CRIP TION
The IDEA-Part C Infants and Toddlers with Disabilities program serves approximately 427,000 children, birth through age two, and their families. These formula grants to states are used to develop and implement a statewide comprehensive, multidisciplinary, interagency early intervention system. Congress enacted this program after determining there was an urgent and substantial need to provide the earliest intervention possible for young children who have, or are at risk of having, disabilities or developmental delays. Studies have demonstrated that providing early intervention services to children and their families is one of the most effective strategies in helping children with disabilities attain favorable educational outcomes.
. F U N DING HIS TORY (in millions)
FY 2019 FY 2020 FY 2021 FY 2022 PRESIDENT’s REQUEST $470.00 $477.00 $481.85 $731.85
. IM PACT OF PR ES IDENT’S BU DGE T
The president’s FY 2022 budget reflects a $250 million increase over the previous fiscal year, representing a substantial investment that will improve academic and developmental outcomes for children with disabilities. According to the budget, Part C investments would also be paired with reforms to expand access to services for underserved children, including children of color and children from low-income families.
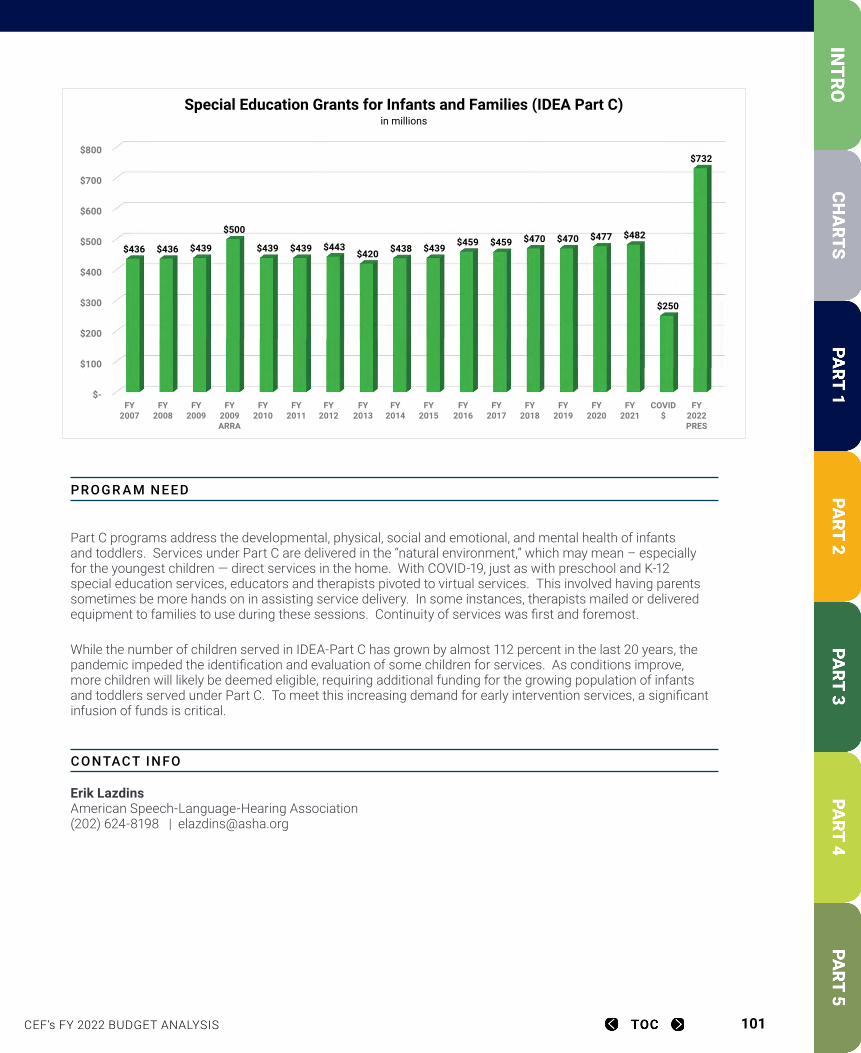
CEF’s FY 2022 BUDGET ANALYSIS 101
FY 2007 FY 2008 FY 2009 FY 2009 ARRAFY 2010 FY 2011 FY 2012 FY 2013 FY 2014 FY 2015 FY 2016 FY 2017 FY 2018 FY 2019 FY 2020 FY 2021 COVID $ FY 2022 PRES436$ 436$ 439$ 500$ 439$ 439$ 443$ 420$ 438$ 439$ 459$ 459$ 470$ 470$ 477$ 482$ 250$ 732$
$-
$100
$200
$300
$400
$500
$600
$700
$800
FY2007
FY2008
FY2009
FY2009ARRA
FY2010
FY2011
FY2012
FY2013
FY2014
FY2015
FY2016
FY2017
FY2018
FY2019
FY2020
FY2021
COVID$
FY2022PRES
$436 $436 $439
$500
$439 $439 $443 $420 $438 $439 $459 $459 $470 $470 $477 $482
$250
$732
Special Education Grants for Infants and Families (IDEA Part C)in millions
PROGR A M N EED
Part C programs address the developmental, physical, social and emotional, and mental health of infants and toddlers. Services under Part C are delivered in the “natural environment,” which may mean – especially for the youngest children — direct services in the home. With COVID-19, just as with preschool and K-12 special education services, educators and therapists pivoted to virtual services. This involved having parents sometimes be more hands on in assisting service delivery. In some instances, therapists mailed or delivered equipment to families to use during these sessions. Continuity of services was first and foremost.
While the number of children served in IDEA-Part C has grown by almost 112 percent in the last 20 years, the pandemic impeded the identification and evaluation of some children for services. As conditions improve, more children will likely be deemed eligible, requiring additional funding for the growing population of infants and toddlers served under Part C. To meet this increasing demand for early intervention services, a significant infusion of funds is critical.
CONTACT IN FO
Erik Lazdins American Speech-Language-Hearing Association (202) 624-8198 | [email protected]
CEF’s FY 2022 BUDGET ANALYSIS 102
IDEA National Activities Part D, Individuals with Disabilities Education Act (IDEA)
The University of Tennessee Department of Special Education is recruiting, preparing, and graduating fully certified teachers of the deaf/hard of hearing (ToD) and speech-language pathologists (SLPs) to serve as direct service providers and consultants to improve the early language and code-based pre-literacy skills of children who are deaf/hard of hearing (d/hh), regardless of their preferred mode of communication. Program scholars graduate with master’s degrees and state licensure, and SLPs are prepared to start a clinical fellowship year
to meet national certification requirements. It is anticipated the project will prepare at least 30 credentialed ToD and SLPs, and programs like these are especially critical now. Even as the number of deaf and hard of hearing students has remained constant, the number of teachers of the deaf graduating annually has dropped from 1,680 in 1982 to approximately 600 anticipated in 2022, a decrease of almost two-thirds.
DES CRIP TION
Part D programs are often referred to as the “backbone” of special education, providing an infrastructure that serves as a quality assurance mechanism for the provision of mandated services to students with disabilities. States, institutions of higher education, and nonprofit expert organizations receive funding through these competitive grant programs to support the provision of evidence-based strategies for students and connect families to important information and resources to assist their children. Grants are used for the following activities, each with a separate funding stream: (1) state personnel development (2) technical assistance and dissemination; (3) personnel preparation; (4) parent information centers; (5) technology and media centers; and (6) Special Olympics education programs.
. F U N DING HIS TORY (in millions)
FY 2019 FY 2020 FY 2021 FY 2022 PRESIDENT’s REQUEST State Personnel Development Grants $38.63 $38.63 $38.63 $ 38.63Technical Assistance & Dissemination $44.35 $44.35 $44.35 $ 49.35Personnel Preparation $87.20 $89.70 $90.20 $250.00Parent Information Centers $27.41 $27.41 $27.41 $ 30.15Technology and Media Centers $28.05 $29.55 $29.55 $ 29.55Special Olympics Education Program $17.58 $20.08 $23.68 $ 23.68
. IM PACT OF PR ES IDENT’S BU DGE T
Of all the personnel shortage areas in education, the field of special education faces the most daunting challenges, only further exacerbated during the pandemic. The lack of access to a full special education workforce threatens the capacity to deliver the promise of IDEA and serve the 8.1 million students enrolled in special education programs. The president’s request, coupled with an additional $90 million in mandatory spending proposed in the American Families Plan, represents the highest level of funding ever provided to the Personnel Preparation account. This level of investment is critical, particularly as students and educators return to in-person schooling and manage the social, emotional, and academic effects of the pandemic. Continued investments in other Part D programs are also crucial to address the many facets of successfully delivering mandated services for students with disabilities.
CEF VIDEO
CEF’s FY 2022 BUDGET ANALYSIS 103
PROGR A M N EED
While these programs represent less than 2 percent of the national expenditure for educating students with disabilities, they provide the critical infrastructure of practice improvements that support the implementation of the IDEA. Given the challenges in ensuring the provision of a free appropriate public education (FAPE) to students with disabilities during the unprecedented COVID-19 pandemic, these programs have become even more essential — providing support to parents, technology and media support, technical assistance, and personnel development. As special educators provide services remotely, in person, and in hybrid delivery models, they work to ensure every student has access to the services they need. Schools are increasingly short-staffed and often challenged to secure the qualified special educators needed. Critical shortages prior to the pandemic have been exacerbated, and the need for an investment in the pipeline of qualified personnel has never been greater. These funds support more than 50 technical assistance and dissemination centers, higher education personnel preparation programs to prepare effective special educators and specialized instructional support personnel, centers that provide parental assistance in all 50 states, technology and media centers, and Special Olympics education programs. Ensuring a solid foundation for the delivery of services under Part B of IDEA, the Part D National Activities are a vital federal investment.
CONTACT IN FO
Barbara Raimondo Conference of Educational Administrators of Schools and Programs for the Deaf (202) 999-2204 | [email protected]
Jane E. West Higher Education Consortium for Special Education (202) 812-9096 | [email protected]
Kaitlyn Brennan Higher Education Consortium for Special Education (412) 853-8409 | [email protected]
CEF’s FY 2022 BUDGET ANALYSIS 104
School Renovation and Modernization American Recovery and Reinvestment Act of 2009Consolidated Appropriations Act of 2016 Despite receiving over $50 million in Qualified School Construction Bonds (QSCBs) through the American Recovery and Reinvestment Act of 2009, the Jefferson County Public Schools (JCPS) in Louisville, Kentucky currently has over $1 billion in current facility needs. The school district is the largest in the state and has more than twice the enrollment and twice the number of students in poverty as Kentucky’s second largest district. Jefferson County used their QSCB allocation to perform renovations at a number of existing schools, focusing on updating HVAC systems at Iroquois High School and Bowen, Camp Taylor, Fern Creek, Layne, and Blue Lick Elementary Schools. Proceeds from the sale of QSCBs were also used to install an elevator and improve accessibility at Lincoln Elementary Performing Arts. More than a decade has passed since the QSCBs were issued and updates were performed, and the district will continue to make principal payments on those bond projects until 2029. Despite the QSCB support, one in five of the school district’s 155 school buildings are currently considered near the end of life and will require moving students out of the building when the HVAC or another building system fails. The school district’s facility needs are particularly dire in the segregated areas of the city. The newest high school in west Louisville was constructed in 1952 and is about to turn 70 years old.
DES CRIP TION
Federal support for school renovation and modernization has waned in recent years. The American Recovery and Reinvestment Act (ARRA) of 2009 authorized Qualified School Construction Bonds (QSCBs) and extended Qualified Zone Academy Bonds (QZABs) to help states and school districts address the challenges they face in modernizing aging schools. QSCB and QZAB bondholders receive a federal tax credit in lieu of interest payments, and the subsequent Hiring Incentives to Restore Employment (HIRE) Act of 2010 (P.L. 111–147) amended the Internal Revenue Code to allow the option of issuing QSCBs and QZABs with a direct-pay subsidy. School districts issuing these federal school construction bonds receive interest-free bonding authority that can be used for specific infrastructure and instructional improvements, including enhancing building safety, expanding facilities to allow for smaller class sizes, and increasing access to learning technologies. QSCBs offered additional benefits and can be used for new construction and land acquisition. Another option for school districts in recent years was the now-expired Build America Bonds (BABs), taxable bonds with a 35 percent interest subsidy rate from the Treasury Department.
Federal grants for school modernization and repair are rarer, aside from recent support for charter school facilities and certain eligible school districts that receive Impact Aid. Congress did approve a one-time $1.2 billion appropriation for emergency school repairs in FY 2002, and recently authorized the use of COVID-19 stimulus funds to be used for school facility repairs and improvements to air quality systems under the Elementary and Secondary Schools Emergency Relief (ESSER) program.
CEF’s FY 2022 BUDGET ANALYSIS 105
. F U N DING HIS TORY (in millions)
FY 2019 FY 2020 FY 2021 FY 2022 PRESIDENT’s REQUEST Qualified Zone Academy Bonds* $ 0.00 $ 0.00 $ 0.00 $ 0.00Qualified School Construction Bonds* $ 0.00 $ 0.00 $ 0.00 $ 0.00Qualified School Infrastructure Bonds** ---- ---- ---- $16,700.00K-12 Infrastructure Grants (mandatory)** ---- ---- ---- $10,000.00
*The school construction bonding provisions are traditionally authorized and funded through tax legislation for specific calendar years rather than annual federal appropriations. Previously authorized bonding authority for school facility improvements remains available.
** Proposed in American Jobs Plan.
. IM PACT OF PR ES IDENT’S BU DGE T
Federal bond programs operate according to calendar rather than federal fiscal years. ARRA authorized QSCBs and BABs for the first time in 2009, while extending and expanding the existing QZAB program’s authorization. A QZAB extension was approved by Congress in subsequent years, most recently in the 113th Congress for 2015 and 2016. The tax reform overhaul in 2017 repealed tax credit bonds, although previous bonding allocations for QSCBs and QZABs remained available for use until exhausted.
At the end of March, President Biden announced a $2 trillion American Jobs Plan to stabilize the nation’s workforce and rebuild the country’s essential infrastructure. The proposed American Jobs Plan includes $100 billion for K-12 school construction and renovation, dedicating $50 billion in grants and $50 billion in bonds to create safe and healthy learning environments that are modern and energy-efficient. The Administration’s FY 2022 budget outlines additional details on the two streams of school infrastructure support. The U.S. Department of Education would fund the $50 billion in grants, with $10 billion in mandatory funding budgeted each year over the next five years. The U.S. Department of the Treasury would provide $50 billion in interest-free Qualified School Infrastructure Bonds (QSIBs) over three years — $16.7 billion a year for calendar years 2022, 2023, and 2024. The Department of Education budget also includes $12 billion in mandatory funding for a Community College Infrastructure program, or $2.4 billion annually over five years.
PROGR A M N EED
The nation’s school modernization needs have become even more urgent since the COVID-19 pandemic, as school districts must update and replace ventilation systems, update technology, reconfigure buildings and classrooms, and test and repair plumbing and other systems to meet public health and remote learning requirements.
Even prior to the emergency, the federal government’s disregard for the nation’s school facility needs persisted despite a growing body of evidence. Studies released by the Institute of Education Sciences in 2014 and the Center for Green Schools in 2016 estimated a nationwide need between $145 and $200 billion to modernize school facilities. The 2021 Infrastructure Report Card released by the American Society of Civil Engineers gave the nation’s schools a grade of “D+.” A 2020 Government Accountability Office (GAO) study on school facilities estimated that over half of school districts in the nation need to update or replace at least two building systems (such as HVAC, lighting, plumbing, and security) in many of their schools, about 26 percent need to update or replace at least six systems, and 41 percent of school districts need to update or replace HVAC systems, about 36,000 schools nationwide.
CEF’s FY 2022 BUDGET ANALYSIS 106
In the 10 years after the Great Recession, state capital funding for schools dropped 31 percent as a share of the economy. The American Jobs Plan’s support for school construction is long overdue and especially crucial during the upcoming period of pandemic recovery, as funding for capital projects is historically cut when state and local budgets decline. The American Jobs Plan is modeled after the Reopen and Rebuild America’s Schools Act, which was introduced in both the House and Senate early in the 117th Congress and would provide $130 billion in grants and bonding authority to support long-term health, safety, and technological improvements to public school facilities. Continuous federal investment in school modernization is necessary to address long-established local needs and will help more students receive a high-quality education in safe, modern, and well-equipped buildings. Funds for school modernization would not only improve public schools seeking to reopen and begin the academic recovery from pandemic-related learning disruption but would also put hundreds of thousands of Americans in the construction industry back to work.
CONTACT IN FO
Manish Naik Council of the Great City Schools (202) 393-2427 | [email protected]
CEF’s FY 2022 BUDGET ANALYSIS 107
PART 2: Education, Career, andLifelong Learning
CEF’s FY 2022 BUDGET ANALYSIS 108
Carl D. Perkins Career and Technical Education Act(Strengthening Career and Technical Education for the 21st Century Act, Perkins V) Rhode Island’s CTE Innovation and Equity Grants is an initiative under PrepareRI, a statewide effort to equip all Rhode Island youth with the skills needed for high-wage jobs. These grants aim to expand access to high-quality career preparation opportunities in priority industries for historically marginalized learner populations. The initiative was piloted in 2018 at eight local sites, where funds were used for efforts such as recruiting female students into information technology programs, students of color and low-income students to finance programs, and English learners to pre-engineering programs. After the success of the first round of grants, Rhode Island is continuing the program with funding from the Strengthening Career and Technical Education for the 21st Century Act (Perkins V). Because of Perkins V funding, what was originally a one-time investment has now been formalized and expanded. Funds are intended to address access, participation, or performance gaps of specific learner populations enrolled in priority program areas. To be eligible, recipients must complete a root cause analysis and propose specific program-level solutions to address identified causes of these gaps. To ensure Perkins dollars are actively helping to close equity gaps, there is specific emphasis on making new seats in high-quality CTE pathways available for previously underrepresented learners, giving targeted impact to a statewide investment.
DES CRIP TION
The Strengthening Career and Technical Education for the 21st Century Act, the 2018 reauthorization known as Perkins V, provides investments in Career and Technical Education (CTE) programs in all 50 states and the territories. These programs currently serve over 12 million learners a year. CTE programs provide middle and high school, postsecondary, and adult learners with the knowledge and skills to be prepared for college and careers. Students enrolled in CTE programs progress along a pathway of increasingly specific academic and technical courses. They often have the opportunity to participate in internships, engage with employers, and apply their knowledge and skills through hands-on projects. The federal investment in Perkins V is essential for increasing learner access to high-quality CTE programs. With a focus on program improvement, this investment has been critical to ensuring programs meet the ever-changing needs of learners and employers.
F U N DING HIS TORY (in millions)
FY 2019 FY 2020 FY 2021 FY 2022 PRESIDENT’s REQUEST
CTE State Grants $1,262.60 $1,282.60 $1,334.85 $1,354.85 National Programs $ 7.42 $ 7.42 $ 7.42 $ 115.42
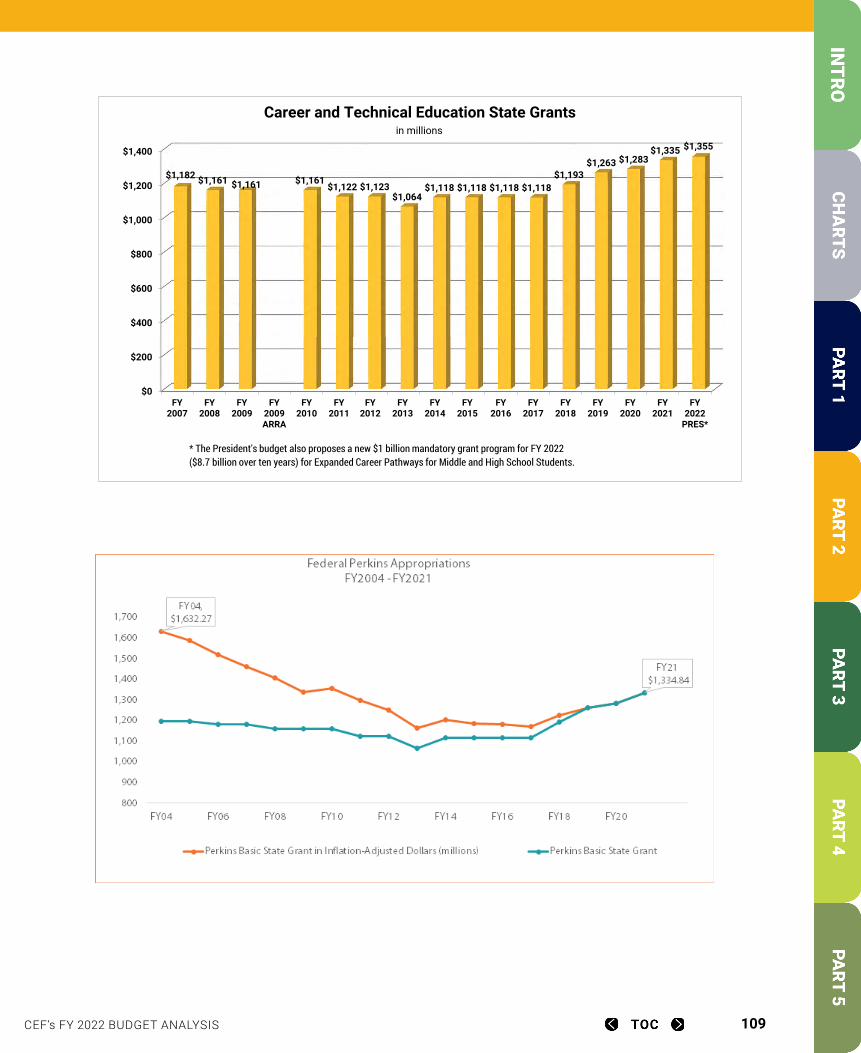
CEF’s FY 2022 BUDGET ANALYSIS 109
With the recent reauthorization of Perkins, a robust federal investment in CTE State Grants is now more critical than ever. Today CTE is preparing learners of all backgrounds for promising career paths and giving employers and the American economy a competitive edge. However, new skilled careers are emerging faster than schools, colleges, and CTE programs – with current resources – can prepare learners for these opportunities. Between FY 2004 and FY 2017, funding for CTE State Grants declined by over $77 million dollars, the equivalent of $427 million inflation-adjusted dollars (28 percent). While Perkins CTE State Grant funding has risen modestly since FY 2017, these increases are not sufficient to compensate for the previous decade of cuts and the growing need for skilled workers. Expanding the federal investment in CTE programs will create a brighter future for our country – creating more career options for learners, better results for employers, and increased economic growth.
In addition, COVID-19 has deeply affected the foundations of American society, including our education systems and the economy. With millions of Americans unemployed and some industry sectors shuttered or undergoing rapid transformation, Black and Latinx workers, workers with a high school education or less, and female workers have been disproportionately impacted. CTE is vital to putting the country on the road to recovery.
Contact Information Michael Matthews Association for Career and Technical Education (703) 683-9316 • [email protected]
Meredith Hills Advance CTE (301) 588-9630 • [email protected]
Adult Education and Family Literacy Act Title II, Workforce Innovation and Opportunity Act (WIOA)
FY 2007 FY 2008 FY 2009 FY 2009 ARFY 2010 FY 2011 FY 2012 FY 2013 FY 2014 FY 2015 FY 2016 FY 2017 FY 2018 FY 2019 FY 2020 FY 2021 FY 2022 PRNominal dollars 1,182$ 1,161$ 1,161$ 1,161$ 1,122$ 1,123$ 1,064$ 1,118$ 1,118$ 1,118$ 1,118$ 1,193$ 1,263$ 1,283$ 1,335$ 1,355$
Constant 2019 dollars 1569 1508 1505 1473 1443 1402 1375 1360 1360 1346 1311 1282
$0
$200
$400
$600
$800
$1,000
$1,200
$1,400
FY2007
FY2008
FY2009
FY2009ARRA
FY2010
FY2011
FY2012
FY2013
FY2014
FY2015
FY2016
FY2017
FY2018
FY2019
FY2020
FY2021
FY2022
PRES*
$1,182 $1,161 $1,161 $1,161$1,122 $1,123
$1,064$1,118 $1,118 $1,118 $1,118
$1,193$1,263 $1,283
$1,335 $1,355
Career and Technical Education State Grants in millions
* The President's budget also proposes a new $1 billion mandatory grant program for FY 2022 ($8.7 billion over ten years) for Expanded Career Pathways for Middle and High School Students.
CEF’s FY 2022 BUDGET ANALYSIS 110
. IM PACT OF PR ES IDENT’S BU DGE T
Although CTE has received modest increases in recent budget cycles, it remains chronically underfunded, so the proposed increase for CTE State Grants would help ensure all students continue to have access to high-quality career and technical education programs. The proposed increase for National Programs would fund competitive awards for middle and high school CTE innovation projects aimed at advancing equity. However, there are concerns regarding equitable access to these funds, given that awards are made competitively rather than by formula and exclude postsecondary CTE.
The president’s budget also includes $1 billion annually for 10 years for middle and high school career pathways through the American Jobs Plan. Although this was included in the request, the funding would not be reflected in the appropriations bill, only through passage of new legislation.
PROGR A M N EED
With the recent reauthorization of Perkins, a robust federal investment in CTE State Grants is now more critical than ever. Today CTE is preparing learners of all backgrounds for promising career paths and giving employers and the American economy a competitive edge. However, with current resources, new skilled careers are emerging faster than schools, colleges, and CTE programs can prepare learners for these opportunities. Between FY 2004 and FY 2017, funding for CTE State Grants declined by over $77 million, the equivalent of $427 million inflation-adjusted dollars (28 percent). While Perkins CTE State Grant funding has risen modestly since FY 2017, these increases are not sufficient to compensate for the previous decade of cuts and the growing need for skilled workers. Expanding the federal investment in CTE programs will create a brighter future for our country — creating more career options for learners, better results for employers, and increased economic growth.
In addition, COVID-19 has deeply affected the foundations of American society, including our education systems and the economy. With millions of Americans unemployed and some industry sectors shuttered or undergoing rapid transformation, Black and Latinx workers, workers with a high school education or less, and female workers have been disproportionately impacted. CTE is vital to putting the country on the road to recovery.
CONTACT IN FO
Michael Matthews Association for Career and Technical Education (703) 683-9316 | [email protected]
Meredith Hills Advance CTE (301) 588-9630 | [email protected]
CEF’s FY 2022 BUDGET ANALYSIS 111
Adult Education and Family Literacy Act Title II, Workforce Innovation and Opportunity Act (WIOA) If there is one word that describes Tatiana Baciu, it is “motivated.” She came to the United States from Moldova in 2015, determined to establish herself and contribute to her new community. However, she quickly found her limited English language skills prevented her from obtaining employment and participating actively in civic and community life.
Tatiana was determined to “use all my possibilities in search of a fulfilling life.” Eventually she found employment at a day care center and enrolled in English classes through My American Dream. Finally it seemed her life was on track and moving in the right direction. Then the pandemic happened.
“I was laid off and the daycare was locked,” says Tatiana. “I missed the children and my coworkers, and I missed work in general.” Without a regular work schedule to give meaning and structure to her days, Tatiana could easily have lost motivation, but her adult education program was there, providing instruction online. “We got great support and encouragement to continue our learning path in spite of the great social change that affected everyone,” Tatiana says.
Participating in English classes has kept Tatiana moving forward. “I practice almost every day, so my study is organized and systematic. I can see some results and this inspires me.” When Tatiana is able to go back to work, she will have the English skills she needs to achieve her goals.
DES CRIP TION
The Adult Education and Family Literacy Act (AEFLA) embodies the federal commitment to education for adults who lack a high school credential or basic literacy, numeracy and English language skills. AEFLA also supports further education and career development opportunities for adults to achieve social and financial security for themselves and their families, engage actively in their children’s educational development, and participate fully in their communities.
The 2014 AEFLA reauthorization in the Workforce Innovation and Opportunity Act (WIOA) promoted greater integration of adult education with occupational education and career pathways systems. To that end, WIOA authorized use of funds for integrated education and training and codified the Integrated English Literacy and Civics Education program.
Most AEFLA funds go as block grants to states and are then distributed through competitive grants to local adult education providers operating independently or as part of school districts, community colleges, libraries, unions, and other entities. States provide a 25 percent match to federal funds and must satisfy a “maintenance of effort” provision requiring expenditure of at least 90 percent of the prior year contribution. Some funds are allocated to support teacher training, curriculum development, and accountability measurement. A formula set-aside supports national leadership activities conducted by the U.S. Department of Education which must “enhance the quality and outcomes of adult education and literacy activities and programs nationwide” (WIOA, Sec. 242).
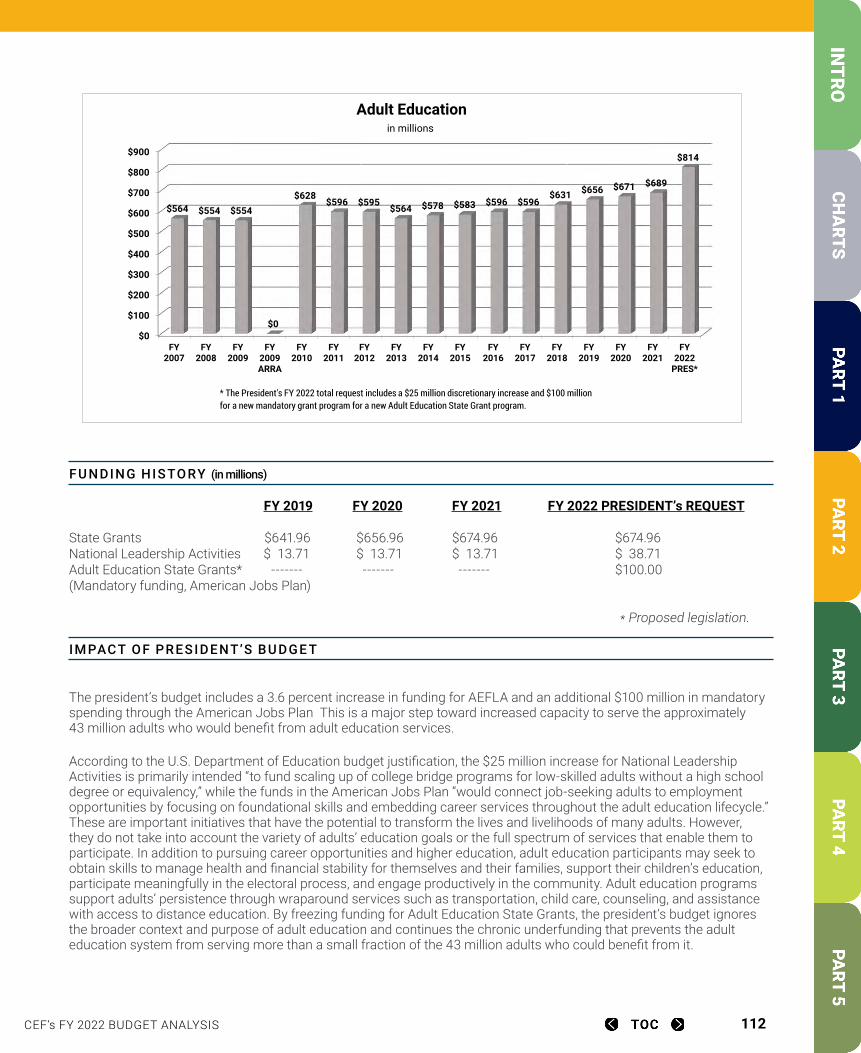
CEF’s FY 2022 BUDGET ANALYSIS 112
F U N DING HIS TORY (in millions)
FY 2019 FY 2020 FY 2021 FY 2022 PRESIDENT’s REQUEST
State Grants $641.96 $656.96 $674.96 $674.96National Leadership Activities $ 13.71 $ 13.71 $ 13.71 $ 38.71Adult Education State Grants* ------- ------- ------- $100.00(Mandatory funding, American Jobs Plan)
* Proposed legislation.. IM PACT OF PR ES IDENT’S BU DGE T
The president’s budget includes a 3.6 percent increase in funding for AEFLA and an additional $100 million in mandatory spending through the American Jobs Plan This is a major step toward increased capacity to serve the approximately 43 million adults who would benefit from adult education services.
According to the U.S. Department of Education budget justification, the $25 million increase for National Leadership Activities is primarily intended “to fund scaling up of college bridge programs for low-skilled adults without a high school degree or equivalency,” while the funds in the American Jobs Plan “would connect job-seeking adults to employment opportunities by focusing on foundational skills and embedding career services throughout the adult education lifecycle.” These are important initiatives that have the potential to transform the lives and livelihoods of many adults. However, they do not take into account the variety of adults’ education goals or the full spectrum of services that enable them to participate. In addition to pursuing career opportunities and higher education, adult education participants may seek to obtain skills to manage health and financial stability for themselves and their families, support their children’s education, participate meaningfully in the electoral process, and engage productively in the community. Adult education programs support adults’ persistence through wraparound services such as transportation, child care, counseling, and assistance with access to distance education. By freezing funding for Adult Education State Grants, the president’s budget ignores the broader context and purpose of adult education and continues the chronic underfunding that prevents the adult education system from serving more than a small fraction of the 43 million adults who could benefit from it.
FY 2007 FY 2008 FY 2009 FY 2009 ARFY 2010 FY 2011 FY 2012 FY 2013 FY 2014 FY 2015 FY 2016 FY 2017 FY 2018 FY 2019 FY 2020 FY 2021 FY 2022 PRES*564$ 554$ 554$ -$ 628$ 596$ 595$ 564$ 578$ 583$ 596$ 596$ 631$ 656$ 671$ 689$ 814$
$0
$100
$200
$300
$400
$500
$600
$700
$800
$900
FY2007
FY2008
FY2009
FY2009ARRA
FY2010
FY2011
FY2012
FY2013
FY2014
FY2015
FY2016
FY2017
FY2018
FY2019
FY2020
FY2021
FY2022
PRES*
$564 $554 $554
$0
$628$596 $595
$564 $578 $583 $596 $596$631 $656 $671 $689
$814
Adult Educationin millions
* The President's FY 2022 total request includes a $25 million discretionary increase and $100 million for a new mandatory grant program for a new Adult Education State Grant program.
CEF’s FY 2022 BUDGET ANALYSIS 113
PROGR A M N EED
The 2017 Survey of Adult Skills showed almost 20 percent of adults scored at the lowest literacy proficiency level. Many of these individuals are in the workforce—64 percent of adults with limited literacy are employed—but they earn low wages and lack skills to succeed in postsecondary education and career training. Low skill levels also limit their ability to provide effectively for their families, support their children’s education, and participate fully in community life. Yet today the publicly funded adult education system only serves about 1.1 million people annually, in contrast with about 2.8 million people served in 2002. Millions of low-skilled adults surveyed would like to enroll in adult education services but cannot access a program or experience long waits for enrollment.
The COVID-19 pandemic has exacerbated the participation challenge. Adult education programs transitioned to distance models wherever possible, and anecdotal evidence shows online learning can mitigate the transportation, child care, and other logistical factors that impede in-person participation for many adults. However, individuals who can benefit most from adult education opportunities are also those who are most likely to lack the necessary digital skills and broadband access. Digital literacy instruction has been an important component of adult education for years, but the past year has given it a foundational role.
Meeting demand for services is vital to the country’s economy and the public good. Research demonstrates attainment of higher levels of literacy correlates with improved job opportunities, greater income potential, and decreased dependence on public support for health care, housing, and other services. Federal, state, and local governments recoup their investment in adult education through higher tax revenue and lower expenditures when fewer adults rely on public benefits. In addition, newer career pathway and integrated education and training program models show great promise in enabling adults to achieve educational and career objectives efficiently and effectively. A robust investment for FY 2022 will ensure adult education can continue to empower adults to build better lives for themselves and their children.
CONTACT IN FO
Deborah Kennedy National Coalition for Literacy (202) 364-1964 | [email protected]
Michele Diecuch ProLiteracy (315) 214-2576 | [email protected]
CEF’s FY 2022 BUDGET ANALYSIS 114
Library Services and Technology Act The Museum and Library Services Act
The State Library of Ohio provided a modest grant to the Westlake Porter Public Library in suburban Cleveland which brought together seniors and high school students. This grant allowed the library to train local high school volunteers to help senior citizens at residential facilities increase technology skills. The teens received sensitivity training to help them empathize with the visual, auditory, and mobility issues faced by seniors. They helped seniors learn to use tablets, introducing them to terminology, touch screen commands, internet access, email, and applications. The teens also demonstrated STEM technology, such as electronic circuits with motorized parts, robots, wearable technology, and 3D printing. The project leaders found that seniors were more interested in tablet instruction than the STEM technology, and individualized instruction worked better than a pre-set curriculum. The project succeeded in making senior citizens more comfortable with technology and encouraged intergenerational teamwork.
DES CRIP TION
Administered by the Institute of Museum and Library Services (IMLS), the Library Services and Technology Act (LSTA) is the only source of direct federal funding for libraries. The LSTA Grants to States program is a population-based grant to all 50 states and the territories. Each state is required to provide a one-third match. The state library agency determines at the local level how best to spend its allotted funds. States use their grants to help veterans transition to civilian life, assist small businesses to expand their technology resources, help patrons build resumes and find jobs, and support families with children with disabilities get the resources they need. Funding supports children in completing homework assignments and building literacy skills and lifelong learners in attaining career training and providing access to digital resources. LSTA also provides money to states for professional development for librarians under the Laura Bush 21st Century Library Professionals program, supporting recruitment and education of the next generation of librarians and facility and library leaders. Funds also support National Leadership Grants and grants for Native American Library Services. Federal Support for libraries has been a national priority since 1956 with the creation of the Library Services Act, the subsequent Library Services and Construction Act in 1962, and the current LSTA created in 1996.
F U N DING HIS TORY (in millions)
FY 2019 FY 2020 FY 2021 FY 2022 PRESIDENT’s REQUEST $189.27 $195.47 $197.47 $197.47
. IM PACT OF PR ES IDENT’S BU DGE T
The president’s budget includes $197.47 million for LSTA in FY 2022. Libraries use LSTA support for valuable services, information, and technology, both on and off their premises. While the budget acknowledges the return on investment for libraries, institutions are seeing record levels of users seeking out their services — more than 4 million daily visits — which argues for an increase in funding for LSTA to at least $213.50 million. LSTA funding is further amplified by a required state match of 33 percent of the amount of their LSTA Grants to States.
LSTA supports a wide range of services to small businesses, veterans, job seekers, students, families, and many others. LSTA allows states and local public libraries to create services specific to their patrons’ needs, many of which will be eliminated without LSTA support. The modest investment in libraries is repaid when a job seeker finds employment, a child learns to read, veterans transition to civilian life, a student completes homework and gets into college, children and adults with print disabilities can access books, and entrepreneurs are able to grow their businesses online — all through their local library. In short, libraries and trained librarians make communities better places to live.
CEF VIDEO
CEF VIDEO
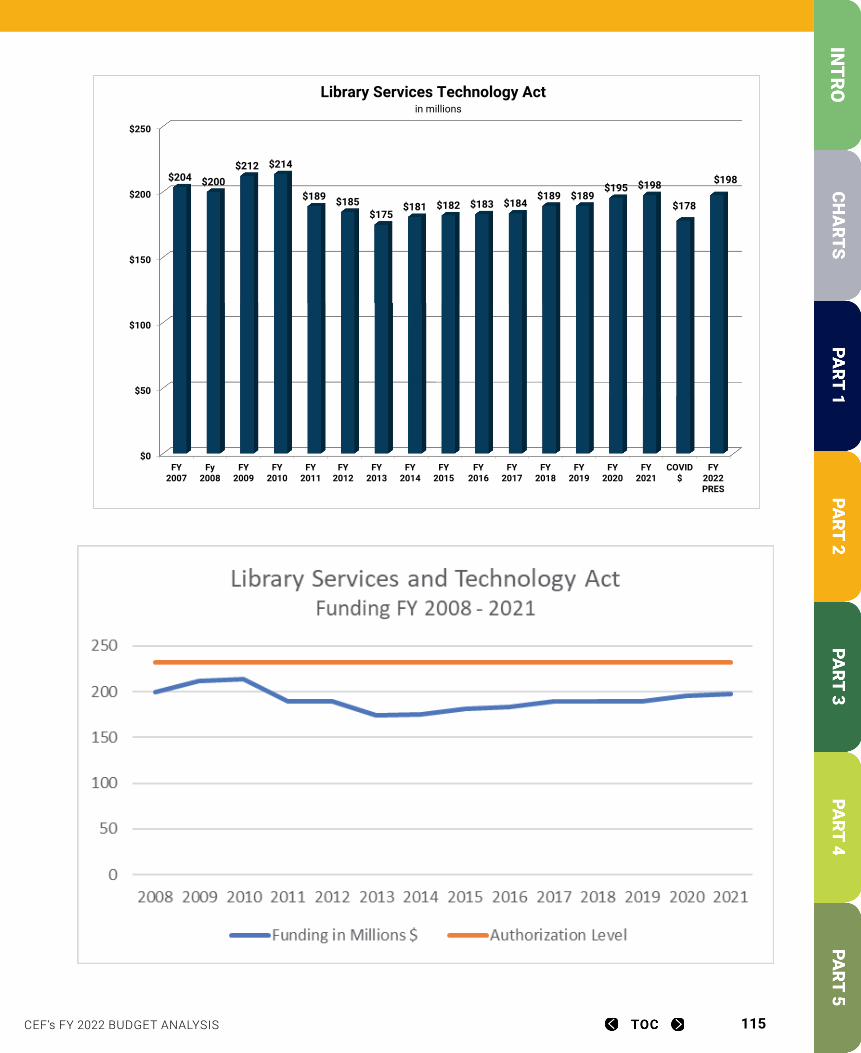
CEF’s FY 2022 BUDGET ANALYSIS 115
FY 2007 Fy 2008 FY 2009 FY 2010 FY 2011 FY 2012 FY 2013 FY 2014 FY 2015 FY 2016 FY 2017 FY 2018 FY 2019 FY 2020 FY 2021 COVID $ FY 2022 PRES203.5 200 212.2 213.5 189 184.7 175 180.9 182 182.9 183.6 189.3 189.3 195.4 197.5 178 197.5
$0
$50
$100
$150
$200
$250
FY2007
Fy2008
FY2009
FY2010
FY2011
FY2012
FY2013
FY2014
FY2015
FY2016
FY2017
FY2018
FY2019
FY2020
FY2021
COVID$
FY2022PRES
$204 $200$212 $214
$189 $185$175
$181 $182 $183 $184$189 $189
$195 $198
$178
$198
Library Services Technology Actin millions
Office of Museum Services Institute of Museum and Library Services In 2020 the Connecticut Science Center in Hartford, Connecticut, was awarded a $327,695 Office of Museum Services CARES Act grant in response to the COVID-19 crisis to create a digital infrastructure and content for use by school districts, families, and the public. The multifaceted project will make virtual learning a permanent part of the museum's infrastructure. The multimedia specialist – a new position – will prepare, test, and operate multimedia equipment for virtual classrooms and outreach programming, as well as assist with technical support of in-house productions. A new app will enable an enhanced onsite experience for visitors and additional engagement when offsite. The museum will also update its exhibits to reflect content on virology and epidemiology and develop programs that address the deep need for understanding of immunology, COVID-19, vaccines, and the threat of other pandemics. The project will also include the creation of a digital library of resources and professional development for teachers.
Description Despite its small size, the IMLS Office of Museum Services (OMS) is the largest source of federal funding dedicated to helping our nation’s museums connect people to information and ideas. OMS supports all types of museums— including historic sites and living collections like zoos and aquariums—in their work to stimulate lifelong learning for every American, spur economic development, and anchor community identity. OMS, which receives funding under the Museum Services Act and the African American History and Culture Act, awards competitive discretionary grants in every state. These grants are used to preserve and digitize collections, educate students, reach new audiences, and enhance community engagement. During the COVID-19 pandemic, OMS has provided critical leadership to the museum community through its CARES Act grants. For example, the agency has been providing science-based information and recommended practices to reduce the risk of transmission of COVID-19 to staff and visitors engaging in the delivery of museum services. The 2018-22 Institute of Museum and Library Services (IMLS) strategic plan focuses on promoting lifelong learning, strengthening the capacity of museums to serve their communities, increasing access to information and ideas, and strategically aligning resources to maximize public value. Funding History (in millions)
CEF’s FY 2022 BUDGET ANALYSIS 116
PROGR A M N EED
With bipartisan support, Congress reauthorized LSTA in 2018. The Museum and Library Services Act (P.L. 115-410) strengthened LSTA to support data-driven tools to tailor services to address and meet community needs, help libraries prepare for and provide services after a disaster or emergency, enhance services for Native Americans, and recruit and train library and information science professionals from a broad range of backgrounds. Congress continues to demonstrate wide bipartisan support for LSTA through annual “Dear Appropriator” letters.
Libraries provide patrons with a wide array of services, many of which are supported by LSTA funds. Consider that 77 percent of libraries offer online health resources, 95 percent offer online homework assistance, 95 percent provide summer reading programs, 97 percent help patrons complete online government forms, 84 percent offer technology training, and nearly 100 percent offer free Wi-Fi access. LSTA grants allow patrons to participate in a 21st century Internet-driven economy which makes communities better places to live. For many users, the library is often the only free resource available to access the Internet, utilize 3D printers, retrieve government information, file forms, find career and educational tools, apply for jobs, or utilize commercial databases.
Current funding for LSTA is well below the authorized level of $232 million and below the previous authorization level in FY 2010 level of $213.50 million. Strains on libraries have been exacerbated by the COVID-19 pandemic, particularly affecting those most in need of these services. To ensure patrons have continued access to all that libraries have to offer, Congress must fund LSTA at least at the current authorized level.
CONTACT IN FO
Kevin Maher American Library Association (202) 628-8410 | [email protected]
CEF’s FY 2022 BUDGET ANALYSIS 117
Office of Museum ServicesInstitute of Museum and Library Services In 2020, the Connecticut Science Center in Hartford, Connecticut, was awarded a $327,695 Office of Museum Services CARES Act grant in response to the COVID-19 crisis to create a digital infrastructure and content for use by school districts, families, and the public. The multifaceted project will make virtual learning a permanent part of the museum’s infrastructure. The multimedia specialist — a new position – will prepare, test, and operate multimedia equipment for virtual classrooms and outreach programming, as well as assist with technical support of in-house productions. A new app will enable an enhanced onsite experience for visitors and additional engagement when offsite. The museum will also update its exhibits to reflect content on virology and epidemiology and develop programs that address the deep need for understanding of immunology, COVID-19, vaccines, and the threat of other pandemics. The project will also include the creation of a digital library of resources and professional development for teachers.
DES CRIP TION
Despite its small size, the IMLS Office of Museum Services (OMS) is the largest source of federal funding dedicated to helping our nation’s museums connect people to information and ideas. OMS supports all types of museums — including historic sites and living collections like zoos and aquariums — in their work to stimulate lifelong learning for every American, spur economic development, and anchor community identity. OMS, which receives funding under the Museum Services Act and the African American History and Culture Act, awards competitive discretionary grants in every state. These grants are used to preserve and digitize collections, educate students, reach new audiences, and enhance community engagement.
During the COVID-19 pandemic, OMS has provided critical leadership to the museum community through its CARES Act grants. For example, the agency has been providing science-based information and recommended practices to reduce the risk of transmission of COVID-19 to staff and visitors engaging in the delivery of museum services. The 2018-22 Institute of Museum and Library Services (IMLS) strategic plan focuses on promoting lifelong learning, strengthening the capacity of museums to serve their communities, increasing access to information and ideas, and strategically aligning resources to maximize public value.
F U N DING HIS TORY (in millions)
FY 2019 FY 2020 FY 2021 FY 2022 PRESIDENT’s REQUEST $34.72 $38.52 $40.52 $46.51
. IM PACT OF PR ES IDENT’S BU DGE T
The president’s FY 2022 budget for OMS is $46.51 million. Despite its miniscule cost in the scope of the federal budget, OMS makes an immense contribution to museums’ ability to care for their collections, educate learners of every age, and serve their communities. The minimal federal investment made through OMS grants also leverages significant private, state, and local funding for maximum impact.
Despite its outsized impact, funding for OMS still meets only a fraction of the need. The president’s budget should recognize the bipartisan consensus in Congress that this program is an excellent use of taxpayer dollars. OMS has set records for bipartisan congressional support during the appropriations submission process in each of the last several years, with 178 representatives and 41 senators signing FY 2022 appropriations letters on its behalf.
CEF’s FY 2022 BUDGET ANALYSIS 118
PROGR A M N EED
Current funding for OMS reaches only a fraction of the nation’s museums, and many highly rated applications go unfunded. Congress must provide $80 million in FY 2022 for the IMLS Office of Museum Services, an increase of nearly $40 million. These funds are needed for museums to recover from the pandemic and continue to serve their communities. Within this $80 million appropriation, $2.5 million should be used to establish a roadmap to support a Grants to States program administered by OMS, as authorized by the Museum and Library Services Act [20 U.S.C. Section 9173(a)(4)], in addition to the agency’s current direct grants to museums. This program would merge federal priorities with state-defined needs, expand the reach of museums, address underserved populations, and meet the needs of the current and future museum workforce.
IMLS CARES Act Grants helped museums support their response to the pandemic. IMLS received 1,088 applications from museums requesting $261.53 million but was only able to fund 39 awards or 4 percent for a total of $8.28 million. Pre-pandemic, museums spent over $2 billion every year on education programs, three-quarters of which was at the K-12 level. However, they could do much more for their communities with greater resources.
In FY 2020 Congress provided $252 million to IMLS, $38.51 million of which was directed to the Office of Museum Services. With this funding, OMS provided 252 grants to museums and related organizations in 46 states and the District of Columbia. That same year OMS received 784 applications requesting nearly $146 million. By leveraging significant private, state, and local funding, OMS grants amplify a small federal investment for maximum impact in the community.
CONTACT IN FO
Barry Szczesny American Alliance of Museums (202) 218-7699 | [email protected]
CEF’s FY 2022 BUDGET ANALYSIS 119
Workforce Innovation and Opportunity Act (WIOA) Myranda was a full-time nursing student at North Central Michigan College, while also working a full-time job and taking care of her family and three children. She constantly worried about how she was going to afford textbooks, classes, supplies, and other necessities.
When she discovered the Class Room Training (CRT) program through Michigan Works!, she immediately took advantage of the opportunity to jump on board with financial assistance for school. Thanks to the support this program offered, she was able to cut back some hours at work without having to worry about making ends meet for her family, and keep her focus on the most important thing – nursing school. Thanks to the help MW! provided, Myranda participated in the Student Nurses Association, received her Associate of Applied Sciences degree in Nursing, and passed the NCLEX exam.
DES CRIP TION
Congress passed the Workforce Innovation and Opportunity Act (WIOA) in July 2014 as the replacement to the Workforce Investment Act. The purpose of the Act is to align the national workforce development system, including education and economic development, in order to create a coordinated response to economic and labor market challenges on the national, state, and local levels. WIOA emphasizes the role of local business-led workforce development boards in analyzing regional labor market data, consulting with businesses to vet the data and determine skill needs, communicating findings to the regional system, and evaluating training investments based on efficiency, effectiveness, access, and equity for current and emerging job seekers. The overall objective is to connect businesses and the labor force to ensure the region’s economic resiliency.
F U N DING HIS TORY (in millions)
FY 2019 FY 2020 FY 2021 FY 2022 PRESIDENT’s REQUEST WIOA Adult $ 845.56 $ 854.65 $ 862.47 $ 899.99WIOA Youth $ 903.42 $ 912.91 $ 921.13 $ 963.84Dislocated Worker $1,261.72 $1,322.91 $1,342.41 $1,536.14
. IM PACT OF PR ES IDENT’S BU DGE T
The president’s budget contains a 4.3 percent increase in funding for WIOA Adult activities, a 4.6 percent increase for WIOA Youth activities, and a 14.9 percent increase for Dislocated Worker activities. These numbers reflect a strong emphasis on development of workforce skills, particularly retraining and developing skills that allow workers to move into new areas of employment. These WIOA activities provide essential support for the many low-income, low-skilled adults, and youth who lost jobs as a result of the pandemic and now face barriers to re-employment because their skill sets do not match the requirements of a changing work environment. The investment in workforce development proposed in the president’s budget, while sufficient to serve the needs of only a fraction of the adults and youth who could benefit from it, will still go a long way toward ameliorating the economic effects of COVID-19.

CEF’s FY 2022 BUDGET ANALYSIS 120
PROGR A M N EED
Prior to 2020, an average of four million job seekers a year received training referrals and other employment-related services from the nation’s 550 local workforce boards and 2,500 American Job Centers. The COVID-19 pandemic and its economic fallout have multiplied the essential role of this national workforce development system many times over. While 52 percent of jobs require postsecondary training but not a college degree, only 43 percent of workers have access to the digital and other skills training that qualifies them for these middle-skill jobs. As a result, millions of Americans file for unemployment while businesses in fast-growing areas such as advanced manufacturing, health care, and information technology struggle to fill available positions.
WIOA Title I funding enables state and local workforce development boards to analyze the skill needs of local labor markets and provide job match assistance, career counseling, skills assessments, and limited tuition assistance for skill development. Using state-of-the-art career navigation systems and related technology tools, workforce development board staff connect job seekers with training opportunities, career guidance, and employers seeking workers, as well as critical services such as coaching. For entry-level and middle-skill workers alike, the workforce development boards are thus lifelines in this time of economic and public health crisis.
CONTACT IN FO
Deborah Kennedy National Coalition for Literacy (202) 346-1964 | [email protected]
CEF’s FY 2022 BUDGET ANALYSIS 121
PART 3: The Gateway to OpportunityHigher Education
CEF’s FY 2022 BUDGET ANALYSIS 122
President Biden’s FY 2022 budget makes a historic investment in education funding, increasing discretionary education spending by 40.8 percent. For higher education, the Administration proposes a 30.2 percent increase for annually appropriated discretionary programs, and a 287 percent increase when mandatory spending proposals are included. While this is a strong statement of support for the federal role in higher education, some long-proven higher education programs are frozen. Overall, the budget recognizes the power of education as a critical component in hastening the post-pandemic economic recovery, improving lives through opportunity, and correcting long-term inequities. Most federal funding for higher education included in the president’s budget goes to low-income students in the form of federal student financial aid. The cornerstone of federal student aid is the Pell Grant program, which provides grant aid to the neediest college students. The president’s budget proposes a historic increase of $1,875 to the FY 2022 maximum Pell Grant, resulting in a total maximum grant of $8,370 during award year 2022-23. To reach that goal, the budget outlines a $400 increase in annually appropriated funds — the largest discretionary award increase since 2009 — combined with a mandatory funding increase of $1,475 through the American Families Plan. The Administration touts the overall $1,875 increase to the maximum award as a significant down payment on the president’s commitment to double the maximum Pell Grant. Further, the budget extends eligibility for Pell Grants, campus-based aid, and federal student loans to Deferred Action for Childhood Arrival (DACA) recipients.
Despite the substantial investment in the Pell Grant program, the budget freezes FY 2022 funding levels for both the Federal Supplemental Educational Opportunity Grant (SEOG) program and the Federal Work-Study (FWS) program, requesting $880 million and $1.19 billion, respectively.
The president’s FY 2022 budget projects the Administration’s interest in working with Congress to ease the burden of student debt by amending the Higher Education Act. More specifically, the budget emphasizes the need for improvements to Income Driven Repayment (IDR) and Public Service Loan Forgiveness (PSLF) that make the programs “more accessible and generous.”
Important programs that promote access to college, enhance academic preparation and support services, and assist low-income and first-generation students to succeed in postsecondary education receive increases in the budget. Gaining Early Awareness and Readiness for Undergraduate Programs (GEAR UP) is $40 million above the FY 2021 level, and the Federal TRIO program receives a $200.8 million increase.
The budget proposes major increases in programs targeted to communities underserved in higher education and that enroll a large proportion of minority and disadvantaged students, calling for investments in additional support programs for these populations. The proposal includes an overall increase of $551 million (including $247 million in discretionary funding) for Aid for Institutional Development (Title III programs), as well as a $299 million increase (including $103 million in discretionary funding) for Aid for Hispanic-Serving Institutions (Title V). On the mandatory side, the president proposes tripling the funding authorized in the FUTURE Act for minority-serving institutions.
The budget also highlights the teacher shortage and the need to recruit and retain teachers by doubling the TEACH Grant from $4,000 to $8,000, expanding its reach to include early childhood educators, and making reforms to improve the program. Discretionary funding is raised by $80 million and $280 million in new mandatory funding is proposed for the Teacher Quality Partnership program that supports partnerships between local school districts and higher education institutions to produce skilled teachers.
Other small but important higher education programs are frozen or receive only modest increases. Graduate Assistance in Areas of National Need (GAANN), the only grant aid available through the Department of Education for graduate students in the humanities, and Title VI-International Education and Foreign Language Studies are both frozen at the FY 2021 level. The Fund for Improvement in Postsecondary Education (FIPSE), which funds pilot and experimental projects for innovations in higher education, is slated for a $35 million increase. Child Care Access Means Parents in School (CCAMPIS), which helps low-income parents pursue and complete postsecondary study, receives a $40 million increase.
Section OverviewPART 3: The Gateway to Opportunity – Higher Education
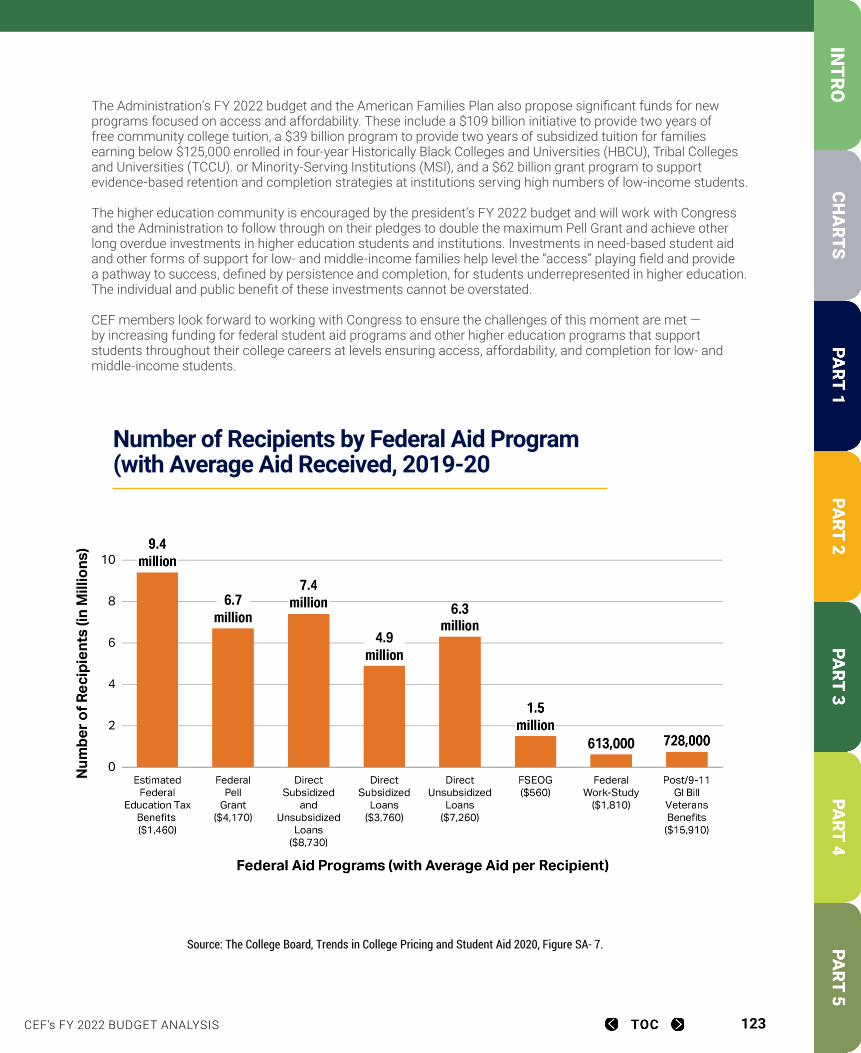
CEF’s FY 2022 BUDGET ANALYSIS 123
The Administration’s FY 2022 budget and the American Families Plan also propose significant funds for new programs focused on access and affordability. These include a $109 billion initiative to provide two years of free community college tuition, a $39 billion program to provide two years of subsidized tuition for families earning below $125,000 enrolled in four-year Historically Black Colleges and Universities (HBCU), Tribal Colleges and Universities (TCCU). or Minority-Serving Institutions (MSI), and a $62 billion grant program to support evidence-based retention and completion strategies at institutions serving high numbers of low-income students.
The higher education community is encouraged by the president’s FY 2022 budget and will work with Congress and the Administration to follow through on their pledges to double the maximum Pell Grant and achieve other long overdue investments in higher education students and institutions. Investments in need-based student aid and other forms of support for low- and middle-income families help level the “access” playing field and provide a pathway to success, defined by persistence and completion, for students underrepresented in higher education. The individual and public benefit of these investments cannot be overstated.
CEF members look forward to working with Congress to ensure the challenges of this moment are met — by increasing funding for federal student aid programs and other higher education programs that support students throughout their college careers at levels ensuring access, affordability, and completion for low- and middle-income students.
Number of Recipients by Federal Aid Program (with Average Aid Received), 2019-20
Source: The College Board, Trends in College Pricing and Student Aid 2020, Figure SA- 7.
Number of Recipients by Federal Aid Program (with Average Aid Received, 2019-20
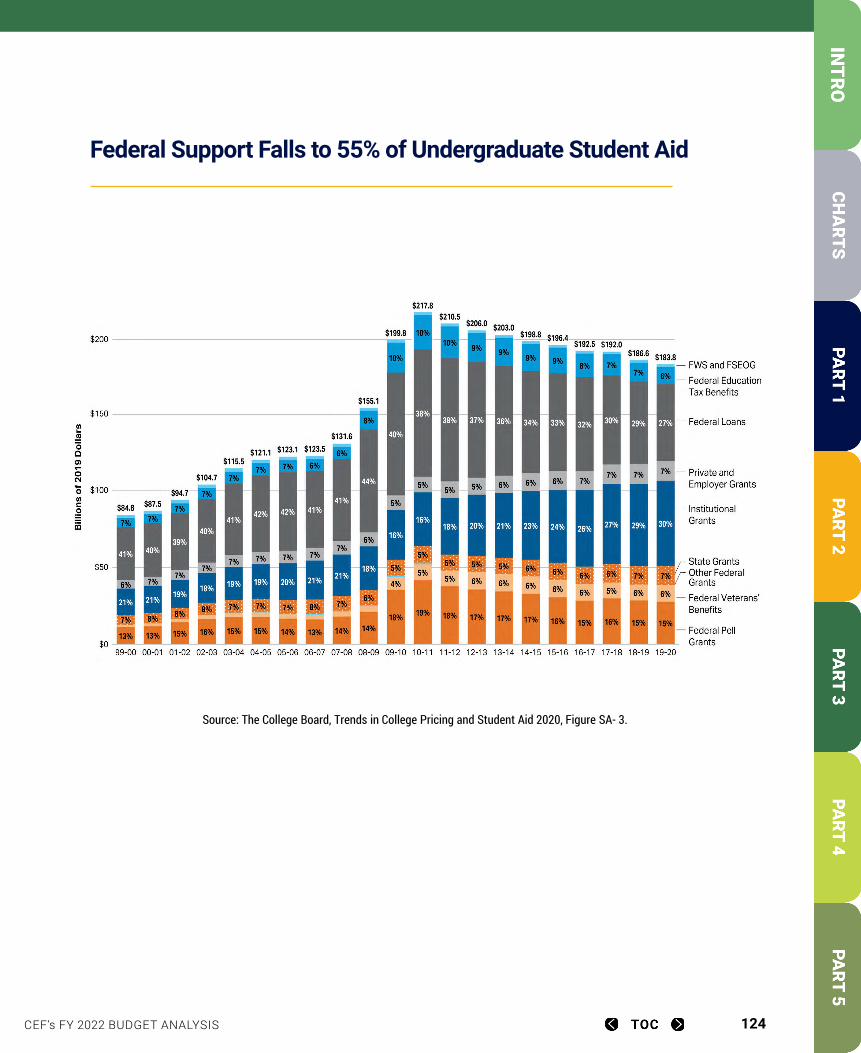
CEF’s FY 2022 BUDGET ANALYSIS 124
Federal Support Falls to 55% of Undergraduate Student Aid
Source: The College Board, Trends in College Pricing and Student Aid 2020, Figure SA- 3.
Federal Support Falls to 55% of Undergraduate Student Aid
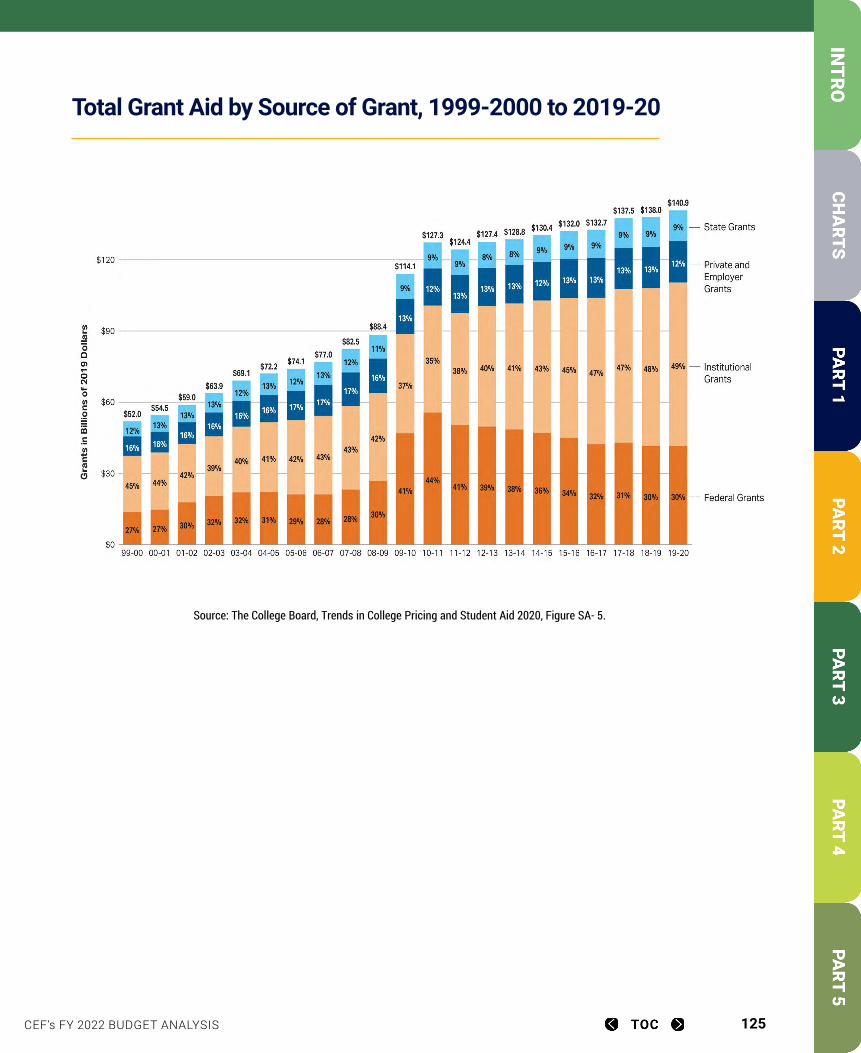
CEF’s FY 2022 BUDGET ANALYSIS 125
Total Grant Aid by Source of Grant, 1999-2000 to 2019-20
Source: The College Board, Trends in College Pricing and Student Aid 2020, Figure SA- 5.
Total Grant Aid by Source of Grant, 1999-2000 to 2019-20
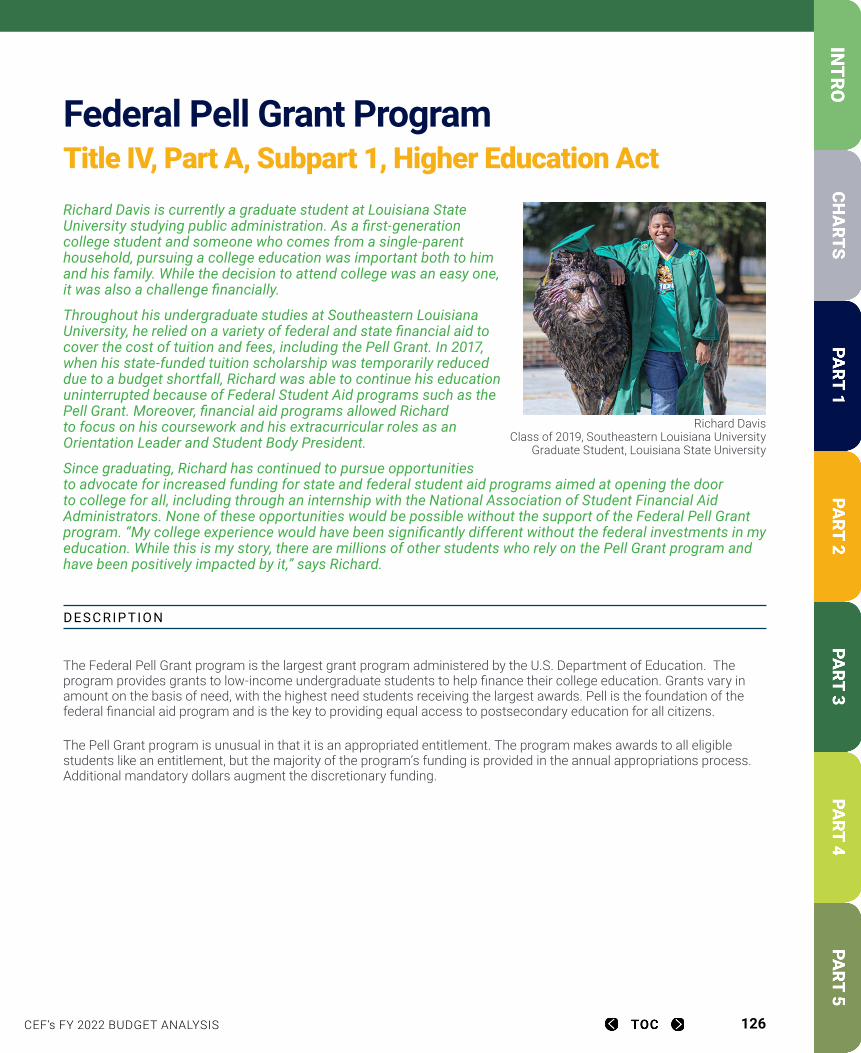
CEF’s FY 2022 BUDGET ANALYSIS 126
Federal Pell Grant ProgramTitle IV, Part A, Subpart 1, Higher Education Act Richard Davis is currently a graduate student at Louisiana State University studying public administration. As a first-generation college student and someone who comes from a single-parent household, pursuing a college education was important both to him and his family. While the decision to attend college was an easy one, it was also a challenge financially.
Throughout his undergraduate studies at Southeastern Louisiana University, he relied on a variety of federal and state financial aid to cover the cost of tuition and fees, including the Pell Grant. In 2017, when his state-funded tuition scholarship was temporarily reduced due to a budget shortfall, Richard was able to continue his education uninterrupted because of Federal Student Aid programs such as the Pell Grant. Moreover, financial aid programs allowed Richard to focus on his coursework and his extracurricular roles as an Orientation Leader and Student Body President.
Since graduating, Richard has continued to pursue opportunities to advocate for increased funding for state and federal student aid programs aimed at opening the door to college for all, including through an internship with the National Association of Student Financial Aid Administrators. None of these opportunities would be possible without the support of the Federal Pell Grant program. “My college experience would have been significantly different without the federal investments in my education. While this is my story, there are millions of other students who rely on the Pell Grant program and have been positively impacted by it,” says Richard.
DES CRIP TION
The Federal Pell Grant program is the largest grant program administered by the U.S. Department of Education. The program provides grants to low-income undergraduate students to help finance their college education. Grants vary in amount on the basis of need, with the highest need students receiving the largest awards. Pell is the foundation of the federal financial aid program and is the key to providing equal access to postsecondary education for all citizens.
The Pell Grant program is unusual in that it is an appropriated entitlement. The program makes awards to all eligible students like an entitlement, but the majority of the program’s funding is provided in the annual appropriations process. Additional mandatory dollars augment the discretionary funding.
Richard DavisClass of 2019, Southeastern Louisiana University
Graduate Student, Louisiana State University
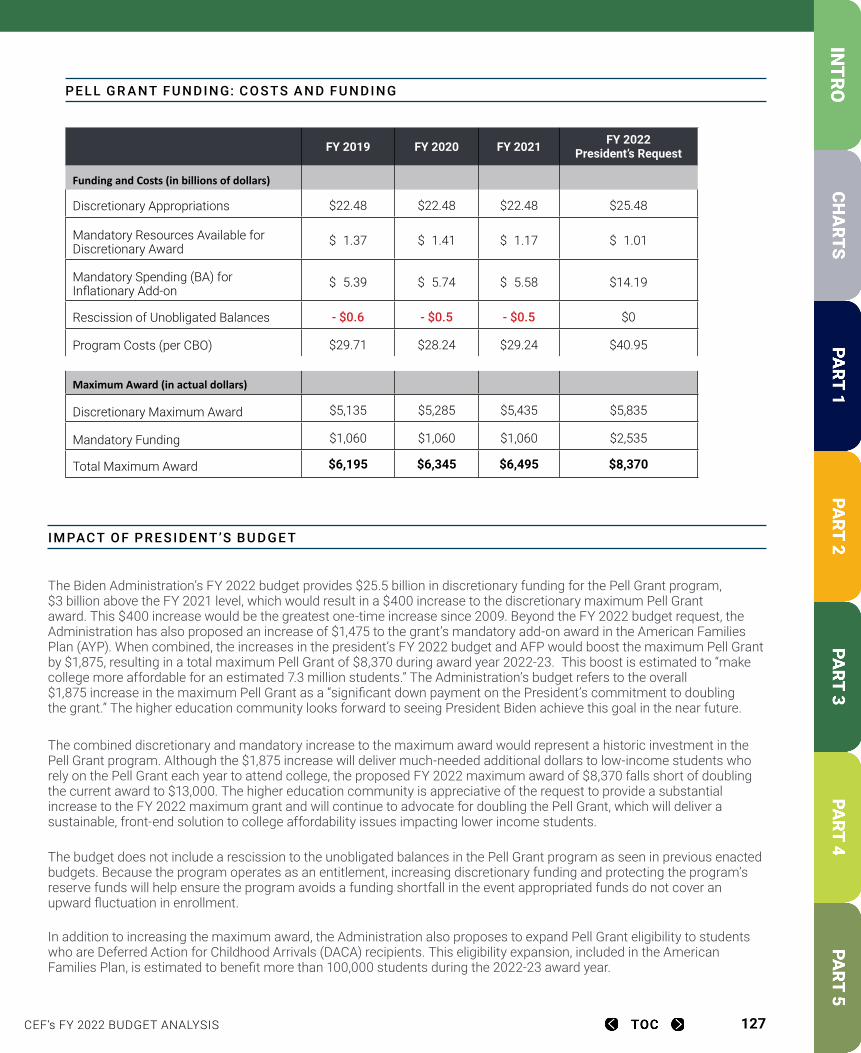
CEF’s FY 2022 BUDGET ANALYSIS 127
PELL GR A NT F U N DING: COS TS A N D F U N DING
FY 2019
FY 2020 FY 2021 FY 2022 President’s Request
Funding and Costs (in billions of dollars)
Discretionary Appropriations $22.48 $22.48 $22.48 $25.48 Mandatory Resources Available for Discretionary Award
$ 1.37 $ 1.41 $ 1.17 $ 1.01
Mandatory Spending (BA) for Inflationary Add-on
$ 5.39 $ 5.74 $ 5.58 $14.19
Rescission of Unobligated Balances - $0.6 - $0.5 - $0.5 $0
Program Costs (per CBO) $29.71 $28.24 $29.24 $40.95
Maximum Award (in actual dollars)
Discretionary Maximum Award $5,135 $5,285 $5,435 $5,835
Mandatory Funding $1,060 $1,060 $1,060 $2,535
Total Maximum Award $6,195 $6,345 $6,495 $8,370
IM PACT OF PR ES IDENT’S BU DGE T
The Biden Administration’s FY 2022 budget provides $25.5 billion in discretionary funding for the Pell Grant program, $3 billion above the FY 2021 level, which would result in a $400 increase to the discretionary maximum Pell Grant award. This $400 increase would be the greatest one-time increase since 2009. Beyond the FY 2022 budget request, the Administration has also proposed an increase of $1,475 to the grant’s mandatory add-on award in the American Families Plan (AYP). When combined, the increases in the president’s FY 2022 budget and AFP would boost the maximum Pell Grant by $1,875, resulting in a total maximum Pell Grant of $8,370 during award year 2022-23. This boost is estimated to “make college more affordable for an estimated 7.3 million students.” The Administration’s budget refers to the overall $1,875 increase in the maximum Pell Grant as a “significant down payment on the President’s commitment to doubling the grant.” The higher education community looks forward to seeing President Biden achieve this goal in the near future.
The combined discretionary and mandatory increase to the maximum award would represent a historic investment in the Pell Grant program. Although the $1,875 increase will deliver much-needed additional dollars to low-income students who rely on the Pell Grant each year to attend college, the proposed FY 2022 maximum award of $8,370 falls short of doubling the current award to $13,000. The higher education community is appreciative of the request to provide a substantial increase to the FY 2022 maximum grant and will continue to advocate for doubling the Pell Grant, which will deliver a sustainable, front-end solution to college affordability issues impacting lower income students.
The budget does not include a rescission to the unobligated balances in the Pell Grant program as seen in previous enacted budgets. Because the program operates as an entitlement, increasing discretionary funding and protecting the program’s reserve funds will help ensure the program avoids a funding shortfall in the event appropriated funds do not cover an upward fluctuation in enrollment.
In addition to increasing the maximum award, the Administration also proposes to expand Pell Grant eligibility to students who are Deferred Action for Childhood Arrivals (DACA) recipients. This eligibility expansion, included in the American Families Plan, is estimated to benefit more than 100,000 students during the 2022-23 award year.
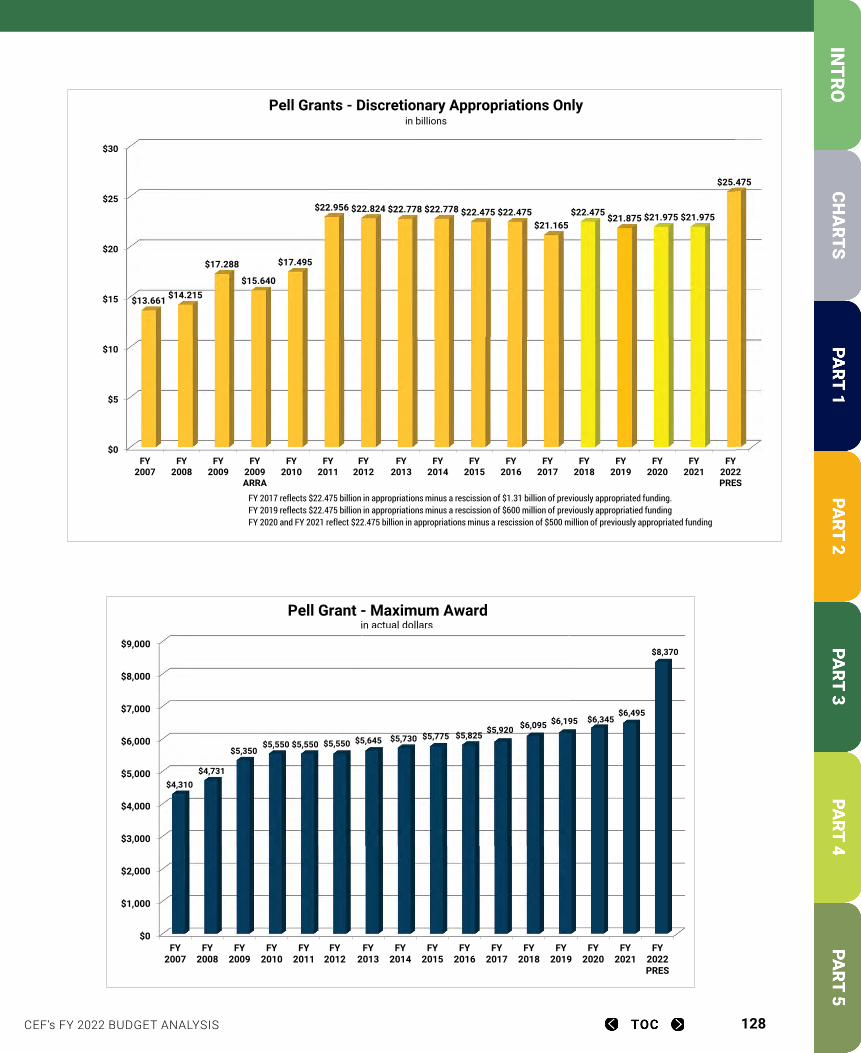
CEF’s FY 2022 BUDGET ANALYSIS 128
FY 2007 FY 2008 FY 2009 FY 2010 FY 2011 FY 2012 FY 2013 FY 2014 FY 2015 FY 2016 FY 2017 FY 2018 FY 2019 FY 2020 FY 2021 FY 2022 PRES4,310$ 4,731$ 5,350$ 5,550$ 5,550$ 5,550$ $5,645 $5,730 $5,775 $5,825 $5,920 $6,095 $6,195 $6,345 $6,495 $8,370
$0
$1,000
$2,000
$3,000
$4,000
$5,000
$6,000
$7,000
$8,000
$9,000
FY2007
FY2008
FY2009
FY2010
FY2011
FY2012
FY2013
FY2014
FY2015
FY2016
FY2017
FY2018
FY2019
FY2020
FY2021
FY2022PRES
$4,310 $4,731
$5,350 $5,550 $5,550 $5,550 $5,645 $5,730 $5,775 $5,825 $5,920 $6,095 $6,195 $6,345
$6,495
$8,370
Pell Grant - Maximum Awardin actual dollars
FY 2007 FY 2008 FY 2009 FY 2009 ARFY 2010 FY 2011 FY 2012 FY 2013 FY 2014 FY 2015 FY 2016 FY 2017 FY 2018 FY 2019 FY 2020 FY 2021 FY 2022 PRES13.661 14.215 17.288 15.64 17.495 22.956 22.824 22.778 22.778 22.475 22.475 21.165 22.475 21.875 21.975 21.975 25.475
$0
$5
$10
$15
$20
$25
$30
FY2007
FY2008
FY2009
FY2009ARRA
FY2010
FY2011
FY2012
FY2013
FY2014
FY2015
FY2016
FY2017
FY2018
FY2019
FY2020
FY2021
FY2022PRES
$13.661 $14.215
$17.288
$15.640
$17.495
$22.956 $22.824 $22.778 $22.778 $22.475 $22.475$21.165
$22.475 $21.875 $21.975 $21.975
$25.475
Pell Grants - Discretionary Appropriations Onlyin billions
FY 2017 reflects $22.475 billion in appropriations minus a rescission of $1.31 billion of previously appropriated funding. FY 2019 reflects $22.475 billion in appropriations minus a rescission of $600 million of previously appropriatied fundingFY 2020 and FY 2021 reflect $22.475 billion in appropriations minus a rescission of $500 million of previously appropriated funding
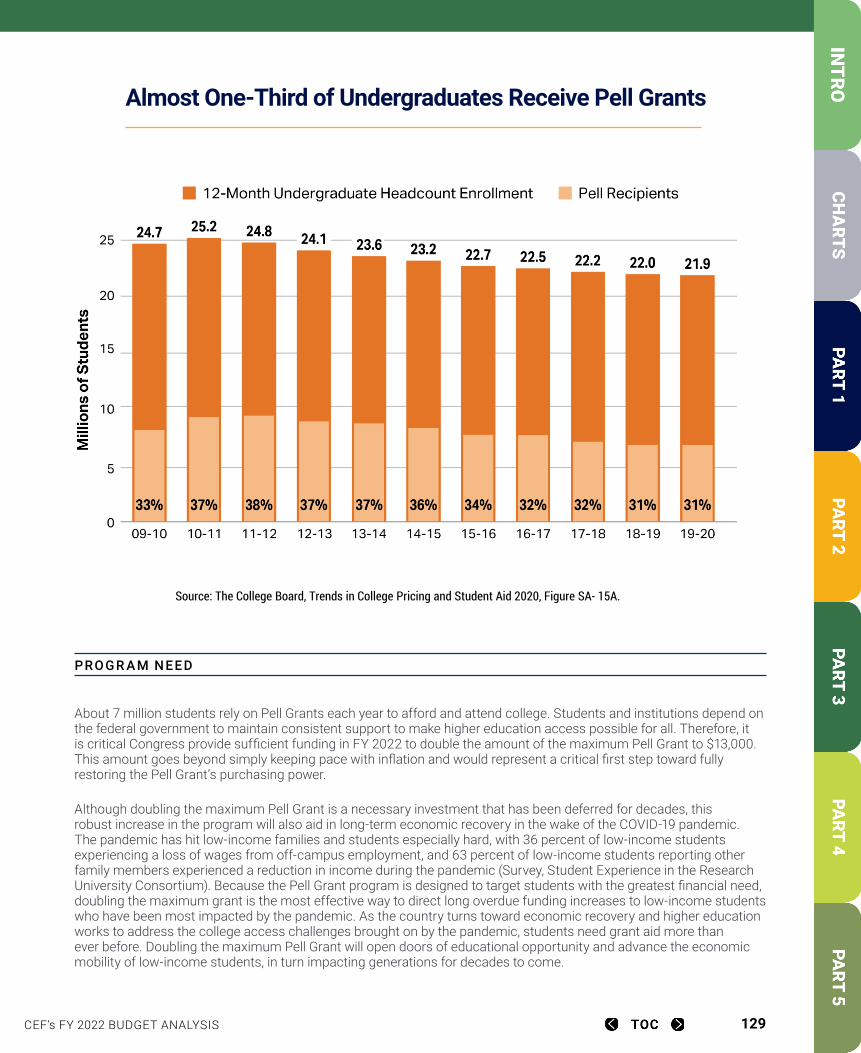
CEF’s FY 2022 BUDGET ANALYSIS 129
Almost One-Third of Undergraduates Receive Pell Grants
Source: The College Board, Trends in College Pricing and Student Aid 2020, Figure SA- 15A.
PROGR A M N EED
About 7 million students rely on Pell Grants each year to afford and attend college. Students and institutions depend on the federal government to maintain consistent support to make higher education access possible for all. Therefore, it is critical Congress provide sufficient funding in FY 2022 to double the amount of the maximum Pell Grant to $13,000. This amount goes beyond simply keeping pace with inflation and would represent a critical first step toward fully restoring the Pell Grant’s purchasing power.
Although doubling the maximum Pell Grant is a necessary investment that has been deferred for decades, this robust increase in the program will also aid in long-term economic recovery in the wake of the COVID-19 pandemic. The pandemic has hit low-income families and students especially hard, with 36 percent of low-income students experiencing a loss of wages from off-campus employment, and 63 percent of low-income students reporting other family members experienced a reduction in income during the pandemic (Survey, Student Experience in the Research University Consortium). Because the Pell Grant program is designed to target students with the greatest financial need, doubling the maximum grant is the most effective way to direct long overdue funding increases to low-income students who have been most impacted by the pandemic. As the country turns toward economic recovery and higher education works to address the college access challenges brought on by the pandemic, students need grant aid more than ever before. Doubling the maximum Pell Grant will open doors of educational opportunity and advance the economic mobility of low-income students, in turn impacting generations for decades to come.
Almost One-Third of Undergraduates Receive Pell Grants
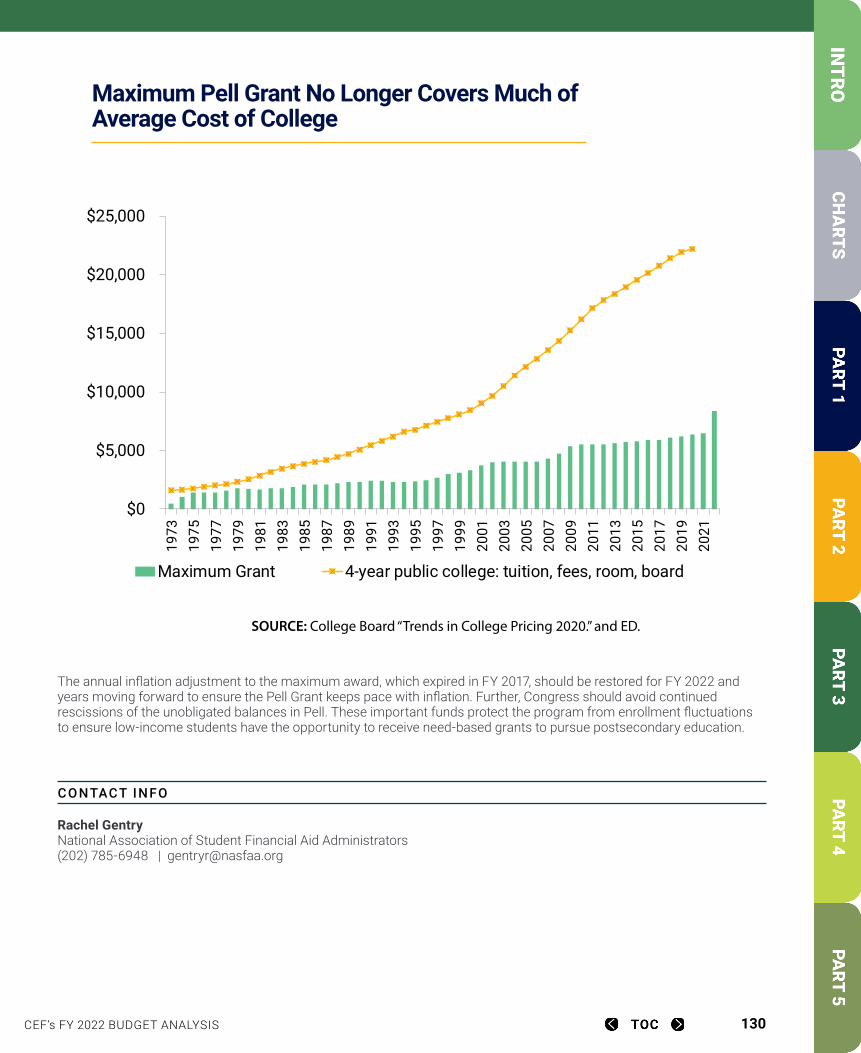
CEF’s FY 2022 BUDGET ANALYSIS 130
The annual inflation adjustment to the maximum award, which expired in FY 2017, should be restored for FY 2022 and years moving forward to ensure the Pell Grant keeps pace with inflation. Further, Congress should avoid continued rescissions of the unobligated balances in Pell. These important funds protect the program from enrollment fluctuations to ensure low-income students have the opportunity to receive need-based grants to pursue postsecondary education.
CONTACT IN FO
Rachel Gentry National Association of Student Financial Aid Administrators (202) 785-6948 | [email protected]
Maximum Pell Grant No Longer Covers Much of Average Cost of College
Source: College Board “Trends in College Pricing 2020,” and ED
$0
$5,000
$10,000
$15,000
$20,000
$25,000
1973
1975
1977
1979
1981
1983
1985
1987
1989
1991
1993
1995
1997
1999
2001
2003
2005
2007
2009
2011
2013
2015
2017
2019
2021
Maximum Grant 4-year public college: tuition, fees, room, board
Maximum Pell Grant No Longer Covers Much of Average Cost of College
SOURCE: College Board “Trends in College Pricing 2020.” and ED.
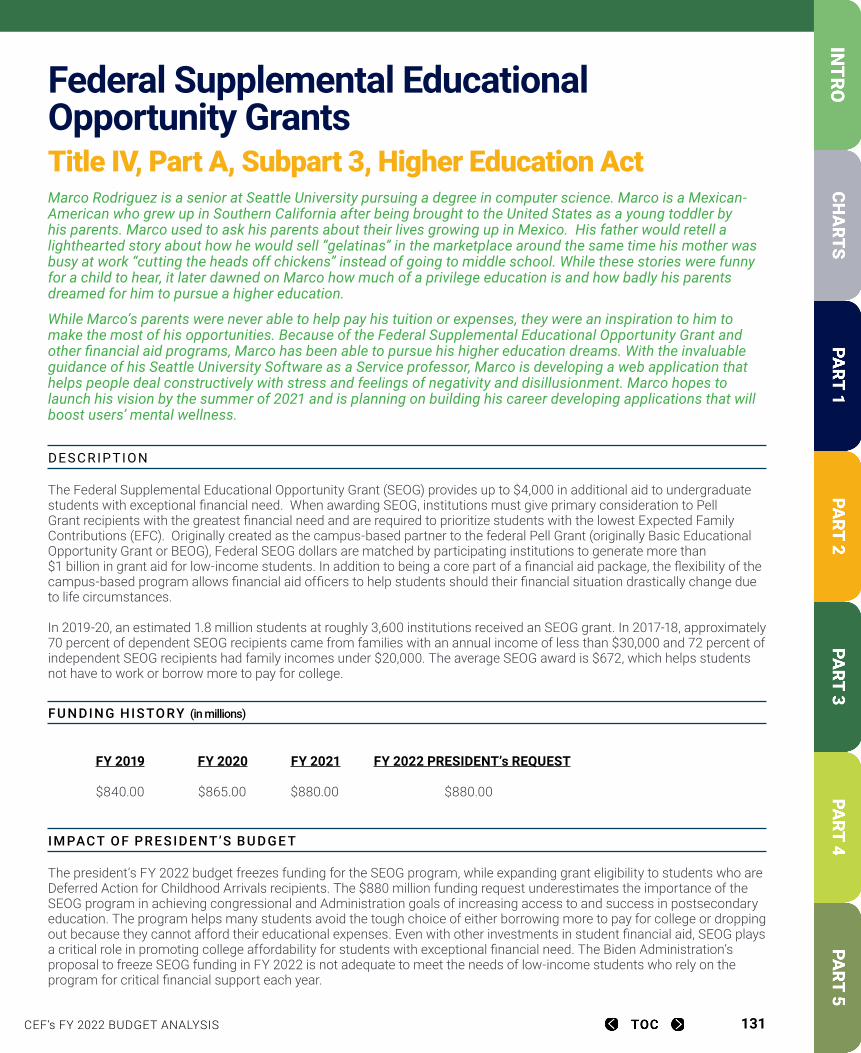
CEF’s FY 2022 BUDGET ANALYSIS 131
Federal Supplemental Educational Opportunity GrantsTitle IV, Part A, Subpart 3, Higher Education Act Marco Rodriguez is a senior at Seattle University pursuing a degree in computer science. Marco is a Mexican-American who grew up in Southern California after being brought to the United States as a young toddler by his parents. Marco used to ask his parents about their lives growing up in Mexico. His father would retell a lighthearted story about how he would sell “gelatinas” in the marketplace around the same time his mother was busy at work “cutting the heads off chickens” instead of going to middle school. While these stories were funny for a child to hear, it later dawned on Marco how much of a privilege education is and how badly his parents dreamed for him to pursue a higher education.
While Marco’s parents were never able to help pay his tuition or expenses, they were an inspiration to him to make the most of his opportunities. Because of the Federal Supplemental Educational Opportunity Grant and other financial aid programs, Marco has been able to pursue his higher education dreams. With the invaluable guidance of his Seattle University Software as a Service professor, Marco is developing a web application that helps people deal constructively with stress and feelings of negativity and disillusionment. Marco hopes to launch his vision by the summer of 2021 and is planning on building his career developing applications that will boost users’ mental wellness.
DES CRIP TION
The Federal Supplemental Educational Opportunity Grant (SEOG) provides up to $4,000 in additional aid to undergraduate students with exceptional financial need. When awarding SEOG, institutions must give primary consideration to Pell Grant recipients with the greatest financial need and are required to prioritize students with the lowest Expected Family Contributions (EFC). Originally created as the campus-based partner to the federal Pell Grant (originally Basic Educational Opportunity Grant or BEOG), Federal SEOG dollars are matched by participating institutions to generate more than $1 billion in grant aid for low-income students. In addition to being a core part of a financial aid package, the flexibility of the campus-based program allows financial aid officers to help students should their financial situation drastically change due to life circumstances. In 2019-20, an estimated 1.8 million students at roughly 3,600 institutions received an SEOG grant. In 2017-18, approximately 70 percent of dependent SEOG recipients came from families with an annual income of less than $30,000 and 72 percent of independent SEOG recipients had family incomes under $20,000. The average SEOG award is $672, which helps students not have to work or borrow more to pay for college.
F U N DING HIS TORY (in millions)
FY 2019 FY 2020 FY 2021 FY 2022 PRESIDENT’s REQUEST $840.00 $865.00 $880.00 $880.00
IM PACT OF PR ES IDENT’S BU DGE T
The president’s FY 2022 budget freezes funding for the SEOG program, while expanding grant eligibility to students who are Deferred Action for Childhood Arrivals recipients. The $880 million funding request underestimates the importance of the SEOG program in achieving congressional and Administration goals of increasing access to and success in postsecondary education. The program helps many students avoid the tough choice of either borrowing more to pay for college or dropping out because they cannot afford their educational expenses. Even with other investments in student financial aid, SEOG plays a critical role in promoting college affordability for students with exceptional financial need. The Biden Administration’s proposal to freeze SEOG funding in FY 2022 is not adequate to meet the needs of low-income students who rely on the program for critical financial support each year.
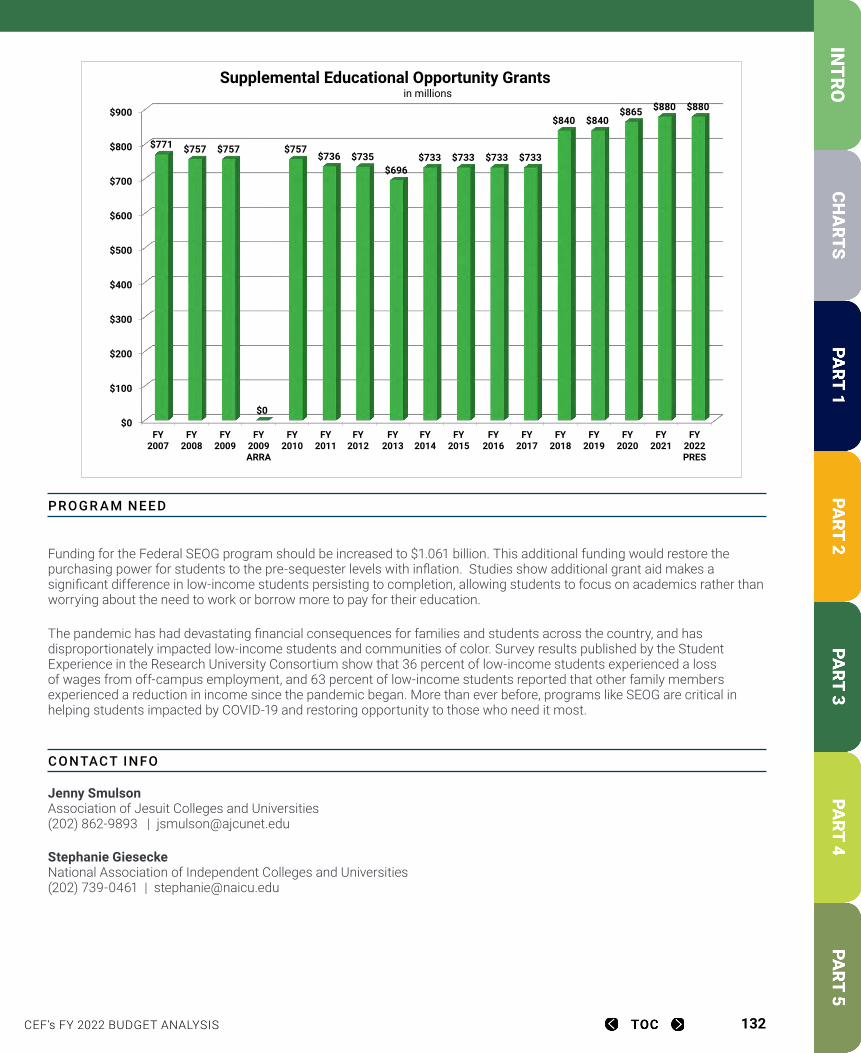
CEF’s FY 2022 BUDGET ANALYSIS 132
PROGR A M N EED
Funding for the Federal SEOG program should be increased to $1.061 billion. This additional funding would restore the purchasing power for students to the pre-sequester levels with inflation. Studies show additional grant aid makes a significant difference in low-income students persisting to completion, allowing students to focus on academics rather than worrying about the need to work or borrow more to pay for their education.
The pandemic has had devastating financial consequences for families and students across the country, and has disproportionately impacted low-income students and communities of color. Survey results published by the Student Experience in the Research University Consortium show that 36 percent of low-income students experienced a loss of wages from off-campus employment, and 63 percent of low-income students reported that other family members experienced a reduction in income since the pandemic began. More than ever before, programs like SEOG are critical in helping students impacted by COVID-19 and restoring opportunity to those who need it most.
CONTACT IN FO
Jenny Smulson Association of Jesuit Colleges and Universities (202) 862-9893 | [email protected]
Stephanie Giesecke National Association of Independent Colleges and Universities (202) 739-0461 | [email protected]
FY 2007 FY 2008 FY 2009 FY 2009 ARFY 2010 FY 2011 FY 2012 FY 2013 FY 2014 FY 2015 FY 2016 FY 2017 FY 2018 FY 2019 FY 2020 FY 2021 FY 2022 PRESSEOG 771$ 757$ 757$ -$ 757$ 736$ 735$ 696$ 733$ 733$ 733$ 733$ 840$ 840$ 865$ 880$ 880$
Work-Stud $980 $980 $980 $200 $980 $979 $977 $926 $975 $975 $989 $989 $1,130 $1,130Pell Maxim $4,310 $4,731 $5,350 $5,550 $5,550 $5,550 $5,645 $5,730 $5,850 $5,815 $5,920
$0
$100
$200
$300
$400
$500
$600
$700
$800
$900
FY2007
FY2008
FY2009
FY2009ARRA
FY2010
FY2011
FY2012
FY2013
FY2014
FY2015
FY2016
FY2017
FY2018
FY2019
FY2020
FY2021
FY2022PRES
$771 $757 $757
$0
$757$736 $735
$696$733 $733 $733 $733
$840 $840$865 $880 $880
Supplemental Educational Opportunity Grantsin millions
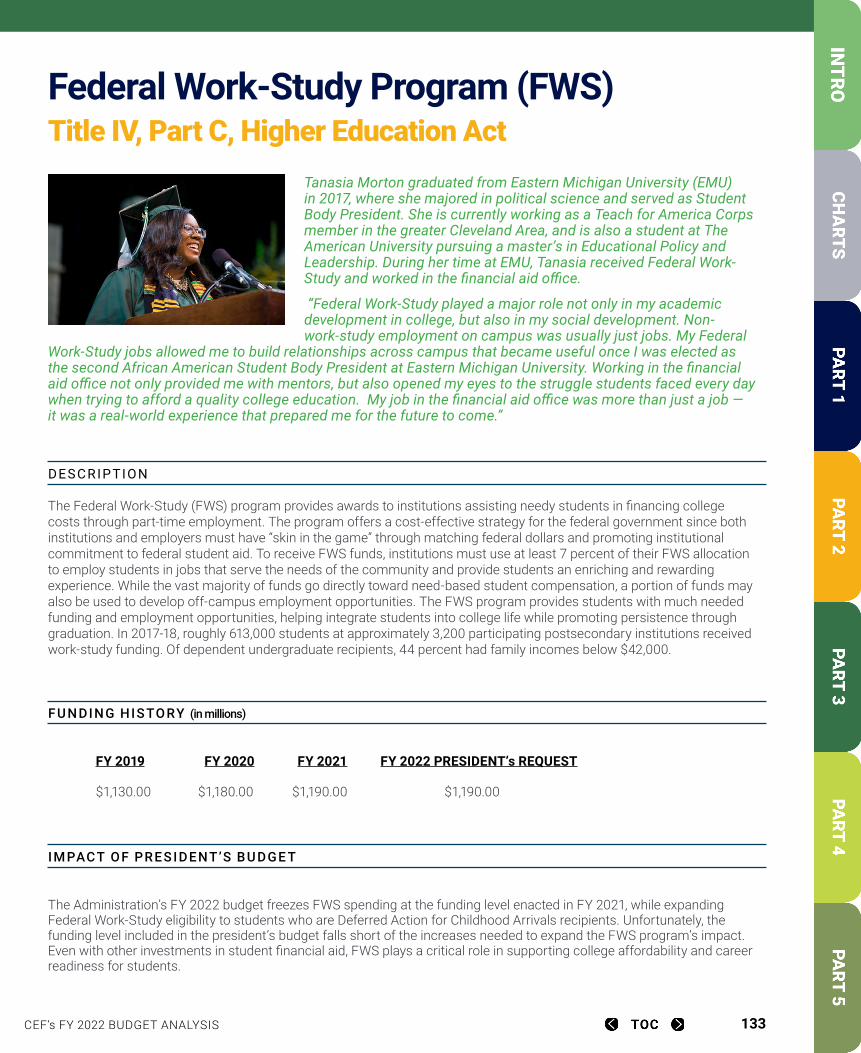
CEF’s FY 2022 BUDGET ANALYSIS 133
Federal Work-Study Program (FWS) Title IV, Part C, Higher Education Act
Tanasia Morton graduated from Eastern Michigan University (EMU) in 2017, where she majored in political science and served as Student Body President. She is currently working as a Teach for America Corps member in the greater Cleveland Area, and is also a student at The American University pursuing a master’s in Educational Policy and Leadership. During her time at EMU, Tanasia received Federal Work-Study and worked in the financial aid office.
“Federal Work-Study played a major role not only in my academic development in college, but also in my social development. Non-work-study employment on campus was usually just jobs. My Federal
Work-Study jobs allowed me to build relationships across campus that became useful once I was elected as the second African American Student Body President at Eastern Michigan University. Working in the financial aid office not only provided me with mentors, but also opened my eyes to the struggle students faced every day when trying to afford a quality college education. My job in the financial aid office was more than just a job — it was a real-world experience that prepared me for the future to come.”
DES CRIP TION
The Federal Work-Study (FWS) program provides awards to institutions assisting needy students in financing college costs through part-time employment. The program offers a cost-effective strategy for the federal government since both institutions and employers must have “skin in the game” through matching federal dollars and promoting institutional commitment to federal student aid. To receive FWS funds, institutions must use at least 7 percent of their FWS allocation to employ students in jobs that serve the needs of the community and provide students an enriching and rewarding experience. While the vast majority of funds go directly toward need-based student compensation, a portion of funds may also be used to develop off-campus employment opportunities. The FWS program provides students with much needed funding and employment opportunities, helping integrate students into college life while promoting persistence through graduation. In 2017-18, roughly 613,000 students at approximately 3,200 participating postsecondary institutions received work-study funding. Of dependent undergraduate recipients, 44 percent had family incomes below $42,000.
F U N DING HIS TORY (in millions)
FY 2019 FY 2020 FY 2021 FY 2022 PRESIDENT’s REQUEST $1,130.00 $1,180.00 $1,190.00 $1,190.00
IM PACT OF PR ES IDENT’S BU DGE T
The Administration’s FY 2022 budget freezes FWS spending at the funding level enacted in FY 2021, while expanding Federal Work-Study eligibility to students who are Deferred Action for Childhood Arrivals recipients. Unfortunately, the funding level included in the president’s budget falls short of the increases needed to expand the FWS program’s impact. Even with other investments in student financial aid, FWS plays a critical role in supporting college affordability and career readiness for students.
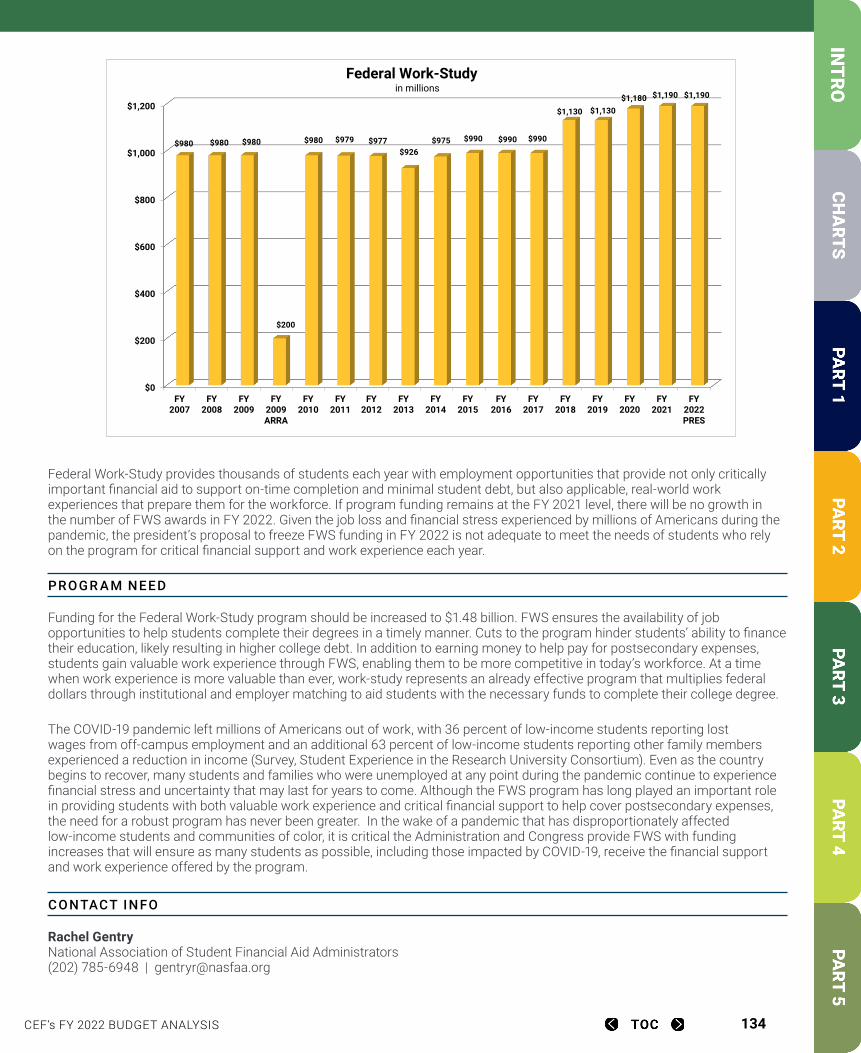
CEF’s FY 2022 BUDGET ANALYSIS 134
Federal Work-Study provides thousands of students each year with employment opportunities that provide not only critically important financial aid to support on-time completion and minimal student debt, but also applicable, real-world work experiences that prepare them for the workforce. If program funding remains at the FY 2021 level, there will be no growth in the number of FWS awards in FY 2022. Given the job loss and financial stress experienced by millions of Americans during the pandemic, the president’s proposal to freeze FWS funding in FY 2022 is not adequate to meet the needs of students who rely on the program for critical financial support and work experience each year.
PROGR A M N EED
Funding for the Federal Work-Study program should be increased to $1.48 billion. FWS ensures the availability of job opportunities to help students complete their degrees in a timely manner. Cuts to the program hinder students’ ability to finance their education, likely resulting in higher college debt. In addition to earning money to help pay for postsecondary expenses, students gain valuable work experience through FWS, enabling them to be more competitive in today’s workforce. At a time when work experience is more valuable than ever, work-study represents an already effective program that multiplies federal dollars through institutional and employer matching to aid students with the necessary funds to complete their college degree.
The COVID-19 pandemic left millions of Americans out of work, with 36 percent of low-income students reporting lost wages from off-campus employment and an additional 63 percent of low-income students reporting other family members experienced a reduction in income (Survey, Student Experience in the Research University Consortium). Even as the country begins to recover, many students and families who were unemployed at any point during the pandemic continue to experience financial stress and uncertainty that may last for years to come. Although the FWS program has long played an important role in providing students with both valuable work experience and critical financial support to help cover postsecondary expenses, the need for a robust program has never been greater. In the wake of a pandemic that has disproportionately affected low-income students and communities of color, it is critical the Administration and Congress provide FWS with funding increases that will ensure as many students as possible, including those impacted by COVID-19, receive the financial support and work experience offered by the program.
CONTACT IN FO
Rachel Gentry National Association of Student Financial Aid Administrators (202) 785-6948 | [email protected]
FY 2007 FY 2008 FY 2009 FY 2009 ARFY 2010 FY 2011 FY 2012 FY 2013 FY 2014 FY 2015 FY 2016 FY 2017 FY 2018 FY 2019 FY 2020 FY 2021 FY 2022 PRES980$ 980$ 980$ 200$ 980$ 979$ 977$ 926$ 975$ 990$ 990$ 990$ 1,130$ 1,130$ 1,180$ 1,190$ 1,190$
$0
$200
$400
$600
$800
$1,000
$1,200
FY2007
FY2008
FY2009
FY2009ARRA
FY2010
FY2011
FY2012
FY2013
FY2014
FY2015
FY2016
FY2017
FY2018
FY2019
FY2020
FY2021
FY2022PRES
$980 $980 $980
$200
$980 $979 $977 $926
$975 $990 $990 $990
$1,130 $1,130 $1,180 $1,190 $1,190
Federal Work-Studyin millions
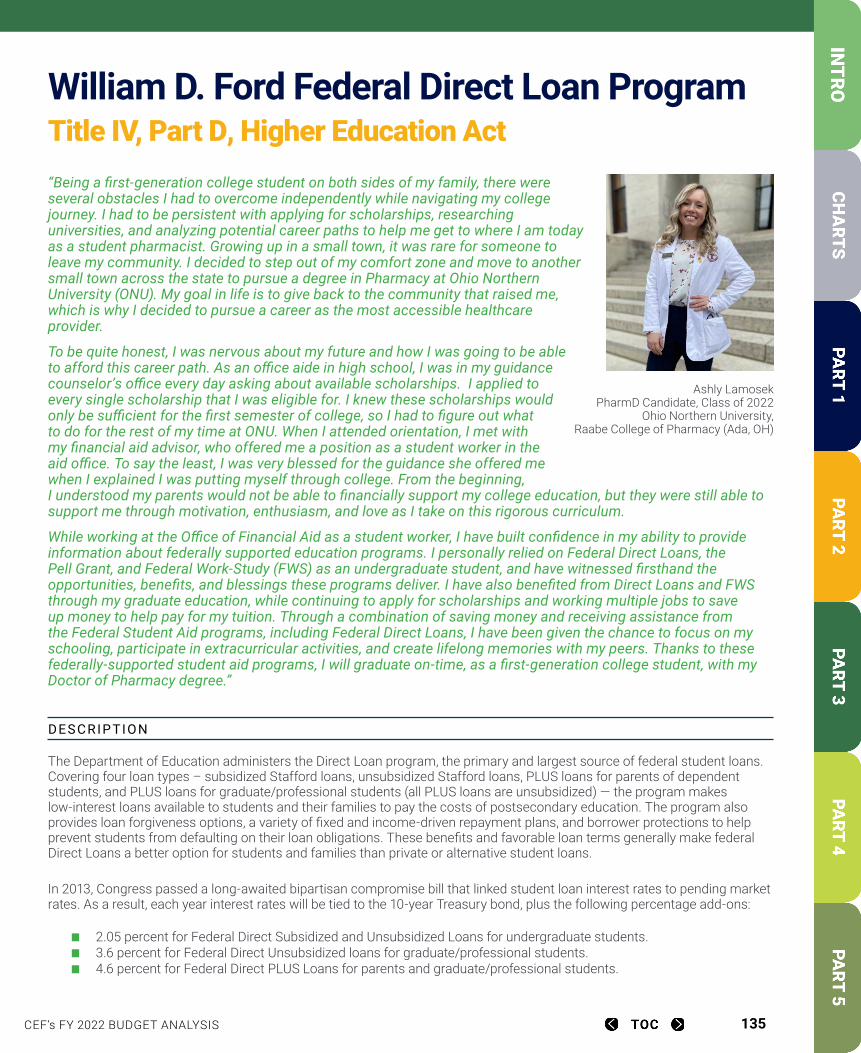
CEF’s FY 2022 BUDGET ANALYSIS 135
William D. Ford Federal Direct Loan ProgramTitle IV, Part D, Higher Education Act “Being a first-generation college student on both sides of my family, there were several obstacles I had to overcome independently while navigating my college journey. I had to be persistent with applying for scholarships, researching universities, and analyzing potential career paths to help me get to where I am today as a student pharmacist. Growing up in a small town, it was rare for someone to leave my community. I decided to step out of my comfort zone and move to another small town across the state to pursue a degree in Pharmacy at Ohio Northern University (ONU). My goal in life is to give back to the community that raised me, which is why I decided to pursue a career as the most accessible healthcare provider.
To be quite honest, I was nervous about my future and how I was going to be able to afford this career path. As an office aide in high school, I was in my guidance counselor’s office every day asking about available scholarships. I applied to every single scholarship that I was eligible for. I knew these scholarships would only be sufficient for the first semester of college, so I had to figure out what to do for the rest of my time at ONU. When I attended orientation, I met with my financial aid advisor, who offered me a position as a student worker in the aid office. To say the least, I was very blessed for the guidance she offered me when I explained I was putting myself through college. From the beginning, I understood my parents would not be able to financially support my college education, but they were still able to support me through motivation, enthusiasm, and love as I take on this rigorous curriculum.
While working at the Office of Financial Aid as a student worker, I have built confidence in my ability to provide information about federally supported education programs. I personally relied on Federal Direct Loans, the Pell Grant, and Federal Work-Study (FWS) as an undergraduate student, and have witnessed firsthand the opportunities, benefits, and blessings these programs deliver. I have also benefited from Direct Loans and FWS through my graduate education, while continuing to apply for scholarships and working multiple jobs to save up money to help pay for my tuition. Through a combination of saving money and receiving assistance from the Federal Student Aid programs, including Federal Direct Loans, I have been given the chance to focus on my schooling, participate in extracurricular activities, and create lifelong memories with my peers. Thanks to these federally-supported student aid programs, I will graduate on-time, as a first-generation college student, with my Doctor of Pharmacy degree.”
DES CRIP TION
The Department of Education administers the Direct Loan program, the primary and largest source of federal student loans. Covering four loan types – subsidized Stafford loans, unsubsidized Stafford loans, PLUS loans for parents of dependent students, and PLUS loans for graduate/professional students (all PLUS loans are unsubsidized) — the program makes low-interest loans available to students and their families to pay the costs of postsecondary education. The program also provides loan forgiveness options, a variety of fixed and income-driven repayment plans, and borrower protections to help prevent students from defaulting on their loan obligations. These benefits and favorable loan terms generally make federal Direct Loans a better option for students and families than private or alternative student loans.
In 2013, Congress passed a long-awaited bipartisan compromise bill that linked student loan interest rates to pending market rates. As a result, each year interest rates will be tied to the 10-year Treasury bond, plus the following percentage add-ons:
2.05 percent for Federal Direct Subsidized and Unsubsidized Loans for undergraduate students. 3.6 percent for Federal Direct Unsubsidized loans for graduate/professional students. 4.6 percent for Federal Direct PLUS Loans for parents and graduate/professional students.
Ashly Lamosek PharmD Candidate, Class of 2022
Ohio Northern University, Raabe College of Pharmacy (Ada, OH)
CEF’s FY 2022 BUDGET ANALYSIS 136
In addition, the law set caps on these rates: 8.25 percent for undergraduate Stafford, 9.5 percent for graduate Stafford, and 10.5 percent for PLUS. Loans would be “variable-fixed,” meaning students would receive a new rate with each new loan, with that rate remaining fixed for the life of the loan.
As of July 2012, graduate students no longer qualify for an in-school interest subsidy on federal loans. Direct Loan borrowers pay an origination fee on every new loan disbursed. Established in statute, for subsidized and unsubsidized loans the origination fee is 1 percent, and for PLUS loans the fee is 4 percent. Under the Budget Control Act, origination fees are increased annually based on the mandatory adjustment percentage provided by the Office of Management and Budget. For loans disbursed on or after October 1, 2020, the direct subsidized and direct unsubsidized loan fee is 1.057 percent, while the fee for direct PLUS loans is 4.228 percent.
IM PACT OF PR ES IDENT’S BU DGE T
The president’s FY 2022 budget makes available approximately $91.2 billion in new Direct Loans to help students and families pay for college. The budget also expresses the Administration’s interest in working with Congress to ease the burden of student debt by amending the Higher Education Act, including through improvements to Income-Driven Repayment (IDR) and Public Service Loan Forgiveness (PSLF) that make the programs “more accessible and generous.”
The budget proposes developing an IDR plan that “allows borrowers to make affordable monthly payments without being unfairly burdened by accumulating interest,” assists borrowers in avoiding delinquency and default, and provides a pathway to forgiveness after a reasonable number of monthly payments. The request also supports simplifying loan forgiveness for borrowers working in public service by creating an expanded PSLF program that makes forgiveness easily attainable for eligible borrowers.
The budget also expresses support for expanding eligibility for Federal Student Aid to students who are Deferred Action for Childhood Arrivals (DACA) recipients, known as DREAMers. The budget extends Pell Grant and Campus-Based Aid eligibility to DACA recipients, and also states the Administration would “like to work with Congress to ensure these students are eligible for federal student loans.”
PROGR A M N EED
Under sequestration imposed by the Budget Control Act, loan origination fees are increased annually based on the mandatory adjustment percentage provided by the Office of Management and Budget. Origination fee increases present unpredictability for students and a heavy administrative burden for financial aid administrators, as both are forced to make adjustments in the middle of an award year, creating confusion for students and families. Student loan origination fees are a hidden tax on students and should be eliminated.
Students depend on federal student loans, a form of self-help aid, to finance the cost of college. The restoration of eligibility for the in-school interest subsidy for graduate and professional students would aid our nation’s commitment to advanced education while limiting student debt. Ensuring the in-school interest subsidy remains in place for undergraduates also remains an important priority.
The COVID-19 pandemic has had devastating financial consequences for families and students across the country, including many federal student loan borrowers. To mitigate the challenges facing borrowers during the pandemic, the pause on monthly payments, interest accrual, and collections for most federal student loan borrowers has been extended through September 30, 2021. This relief is critical for borrowers who have been economically impacted by the pandemic. When the current pause ends, it is essential there is adequate support in place for the millions of borrowers who will transition back into repayment simultaneously. All stakeholders, including the Department of Education and student loan servicers, should make proactive preparations to ensure borrowers experience a smooth and successful transition.
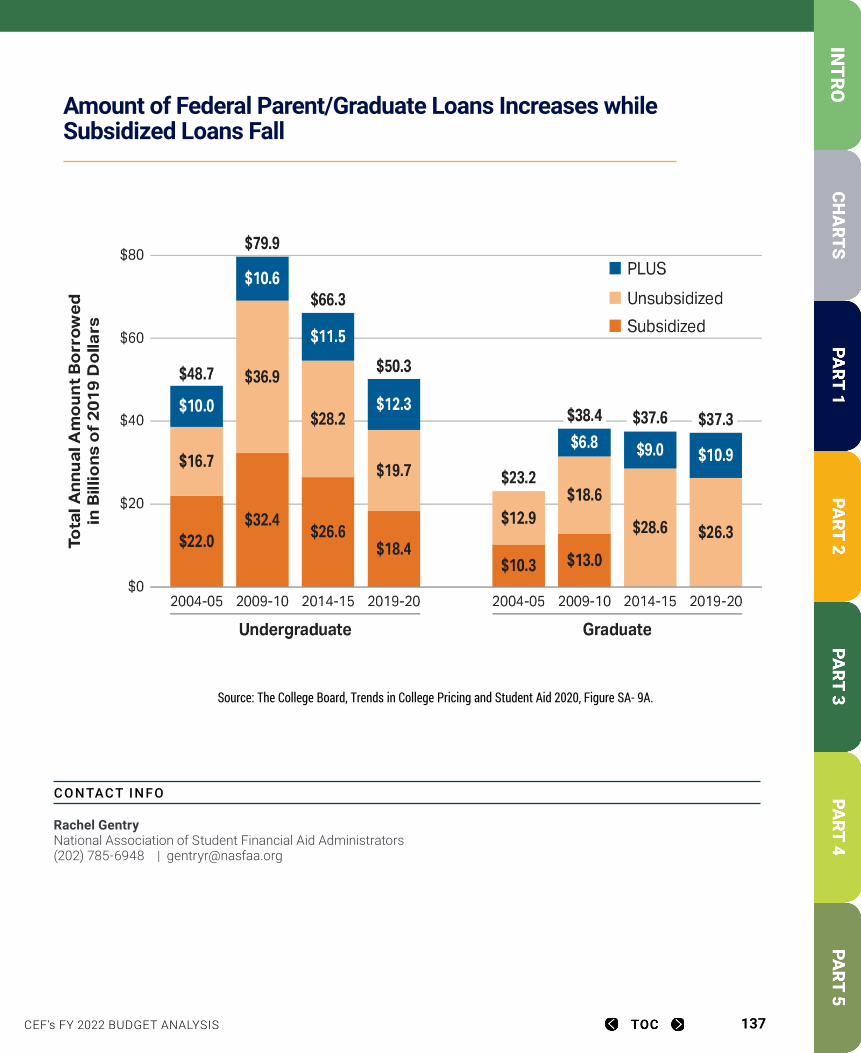
CEF’s FY 2022 BUDGET ANALYSIS 137
CONTACT IN FO
Rachel Gentry National Association of Student Financial Aid Administrators (202) 785-6948 | [email protected]
Amount of Federal Parent/Graduate Loans Increases while Subsidized Loans Fall
Source: The College Board, Trends in College Pricing and Student Aid 2020, Figure SA- 9A.
Amount of Federal Parent/Graduate Loans Increases while Subsidized Loans Fall
CEF’s FY 2022 BUDGET ANALYSIS 138
Public Service Loan ForgivenessTitle IV, Part D, Section 455 of the Higher Education Act ”As a black woman attempting to mitigate the financial effects of structural racism, being a public servant at the National Institutes of Health would not have been an option for me without PSLF. PSLF gives me peace of mind knowing that working in public interest is a decision that will not negatively impact my financial future, but instead allows me to pursue my passion helping the public instead of following the money.”
— Nadia Nimley, PSLF Program Participant
DES CRIP TION
Created in 2007 with large bipartisan support, the Public Service Loan Forgiveness (PSLF) program is an education and workforce investment initiative for federal student loan borrowers who enter and persist in public service fields. PSLF allows borrowers who make 120 qualifying monthly payments while working full-time for an eligible public service employer to have the remaining balance of their qualifying federal Direct Loans forgiven.
PSLF was created before Direct Loans became the primary federal loan that borrowers used to finance their education and before numerous other income-driven repayment plans were introduced. Thus, the repayment criteria left many borrowers believing they would qualify, only to find out later they were enrolled in incorrect repayment plans. To address this problem, in 2018 Congress created an additional fund – the Temporary Expanded Public Service Loan Forgiveness Fund (TEPSLF) – that would allow those in ineligible repayment plans to become eligible and apply for loan forgiveness.
F U N DING HIS TORY (in millions)
FY 2019 FY 2020 FY 20201 FY 2022 PRESIDENT’s REQUEST $350.00* $350.00* $50.00* $25.00*
* PSLF is a mandatory spending program; thus, it does not need an annual appropriation. The amounts listed are for the TEPSLF fund operated out of the Department of Education.
IM PACT OF PR ES IDENT’S BU DGE T
The president’s FY 2022 budget calls on Congress to work together with the Administration on changes to the PSLF program and includes $25 million in funding for the TEPSLF program.
CEF’s FY 2022 BUDGET ANALYSIS 139
PROGR A M N EED
Graduates employed in public service provide an immeasurable benefit to American society. Thus, increasing the quantity and quality of graduates who pursue public interest work should be a priority for the federal government. PSLF was created to do just that. The goals of the PSLF program are to encourage individuals to enter public service fields, create incentives that promote a long-term commitment to public service, and increase vital services to individuals, states, and the nation. Hence, the primary benefit of PSLF derives from the value that directly accrues to the beneficiaries of those services and society in general.
Additionally, students who pursue postsecondary education, especially those attending graduate or professional school, should be free to give back to society without the long-term burden of student loan debt. PSLF makes it feasible for professionals to enter public service careers, such as teaching, legal aid, and law enforcement, which are typically compensated at a level that can make it difficult for them to repay their student loans.
With education costs continuing to rise and workforce shortages in high-need areas, the PSLF program is more important than ever. Therefore, it is not only critical that Congress work on strengthening the program and fixing PSLF’s ongoing implementation issues, but they must also provide an adequate funding stream for borrowers who completed all other aspects of the program but were denied due to immaterial technicalities. In short, Congress must make improvements to strengthen the PSLF program, address implementation issues, and raise the TEPSLF program funding level back to $350 million per year until a broader permanent solution for ineligible borrowers can be achieved through a reauthorization of the Higher Education Act.
CONTACT IN FO
Monica Konaté AccessLex Institute (202) 596-3193 | [email protected]
CEF’s FY 2022 BUDGET ANALYSIS 140
Teacher Education Assistance for College and Higher Education Grant Program (TEACH)Title IV, Part A, Subpart 9, Higher Education Act
“One of the biggest influences on my decision to pursue a path in education was my experience with K-12 educators. As I am sure many can relate, middle school can be a pretty stressful environment, but I believe that I had some truly phenomenal middle school educators who supported me both academically and socially. They were the type of teachers who cared about their students as individuals, and they inspired me to want to help students as well. The best part about the TEACH Grant is that it helped me feel confident that I could afford my college education without working 20
hours a week or more and still be a full-time student. Another part that I really admire is that it helps bring attention to K-12 content areas that schools and college students do not consider. I think that K-12 schools need educators with a wide range of competencies to ensure a well-rounded knowledge base; TEACH Grant helps to support that. When thinking about my future, I am really grateful for how thorough and informative the UNI TEACH Grant counseling is. There is a good chance that I go on to fully fulfill my TEACH Grant requirements at a K-12 level.”
— Baylee Smith, Senior, Middle Level Education Major (K-8),Math/Elementary Education, University of Northern Iowa
DES CRIP TION
A mandatory spending program subject to sequestration, the TEACH grant program provides up to $4,000 annually for a maximum total of $16,000 in grant aid to undergraduate and post baccalaureate students who plan to become teachers of high-need subjects (e.g., mathematics, science, special education, foreign languages, bilingual education, and reading). In addition, current teachers or retirees from high-need fields are eligible for $4,000 per year, for a maximum of $8,000, to pursue master’s degrees, also with a focus on high-need subjects. Students must maintain a 3.25 GPA to remain eligible to receive TEACH grants. Within eight years of finishing the program, grant recipients must fulfill a four-year teaching obligation in schools receiving Title I funds. If the service obligation is not fulfilled, the grants convert to unsubsidized loans to be repaid with interest. For budget and financial management purposes, the TEACH grant program is operated as a loan program with 100 percent forgiveness of outstanding principal and interest upon completion of the service component.
F U N DING HIS TORY (aid available in millions)
FY 2019 FY 2020 FY 2021 FY 2022 PRESIDENT’s REQUEST $85.50 $78.40 $79.40 $172.20
IM PACT OF PR ES IDENT’S BU DGE T
President Biden’s budget proposes to double the maximum grant to $8,000 and provides an increase of $54.8 million above the FY 2021 appropriation. This funding level will support more than 39,000 students. The budget would also expand the TEACH Grant program to cover early childhood educators and remove the GPA requirement to provide more equitable access to the program. The proposal also seeks reforms that would reduce the likelihood and harm of grant-to-loan conversions. The TEACH grant program will continue to increase the number of profession-ready educators teaching high-need subjects in high-need schools.
CEF VIDEO
CEF’s FY 2022 BUDGET ANALYSIS 141
PROGR A M N EED
For the 2021-22 academic year, the maximum award has been reduced by 5.9 percent to a cap of $3,764 due to sequestration. This reduction in grant aid transfers the financial burden to students on the path to becoming educators and may result in increased need for financial aid assistance such as loans.
Enrollment in teacher preparation programs is declining while, at the same time, teacher shortages are on the rise. TEACH grants represent a vital federal commitment to the future of the teaching profession. With the ever-increasing costs of higher education and a concern about debt for professionals in a field with historically lower salaries, TEACH grants assist candidates in managing their debt load and pursuing their teaching careers. Over the last five award years, grants have been distributed to more than 150,000 teacher candidates in high-need subject areas who maintain at least a 3.25 GPA and commit to four-year service obligations in high-need schools. The TEACH grant program has been successful in attracting teachers to work in the highest need classrooms across the nation and have assisted students in all 50 states, Puerto Rico, and Guam.
CONTACT IN FO
Michael Rose American Association of Colleges for Teacher Education (202) 478-4506 | [email protected]

CEF’s FY 2022 BUDGET ANALYSIS 142
High School Equivalency Program (HEP) and College Assistance Migrant Program (CAMP)Title IV, Part A, Subpart 5, Higher Education Act Vicente Peña Pérez came to the United States with his parents seeking asylum from an extremely violent community in Mexico. His academic journey in America began as an Out-of-School-Youth in the Migrant Education Program.
Vicente enrolled in the High School Equivalency Program (HEP) at Santa Rosa Junior College (SRJC) in 2016. Within a year, Vicente obtained a High School Equivalency Diploma (HSED), enrolled full time in college level Math and English as a second language courses. He participated in extracurricular activities, volunteered to help organize student events through the HEP Ambassadors Club, and worked in the HEP office as a student assistant. After obtaining his HSED, Vicente joined the staff at SRJC’s Welcome and Connect Center, providing bilingual services to first-year students. He continued to support students during the COVID-19 pandemic, providing technical assistance to students participating in the laptop loan program, helping with the setup and making sure students were able to continue with online instruction.
Vicente quickly progressed with English language acquisition, and it was not long before he was in a transfer level STEM track. “I have always had the goal of being a scientist, especially in particle physics.” He joined MESA (Math, Engineering and Science Achievement), a program that helps disadvantaged students attain STEM degrees from four-year institutions. When the S-STEM Miles Scholarship program at SRJC began, he earned a spot as a Miles Scholar as well! Last summer his efforts paid off when he was selected to be an intern at the Oak Ridge National Lab in Tennessee, where he calibrated pixels recreating solar wind environments.
Vicente obtained Associate (AA/AS) Degrees this spring in Natural Science, Mathematics, and Physics and has been accepted to the University of California, Santa Cruz as a physics major with a full scholarship. Beginning as an English language learner, earning his HSED, matriculating into transfer level classes, completing multiple Associate Degrees, and transferring to the university system in just four years, Vicente is a testament to hard work, perseverance, and commitment.
DES CRIP TION
For nearly five decades, the High School Equivalency Program (HEP) and College Assistance Migrant Program (CAMP) projects have successfully closed the access and completion gaps for children of agricultural workers. HEP and CAMP are the only federal programs that provide this student population with the educational opportunities and supports to succeed in higher education. HEP recruits children of agricultural workers ages 16 and over, providing academic and comprehensive support services to help them obtain a High School Equivalency Diploma and gain employment or admission to postsecondary institutions or training programs. CAMP assists students in their first year of college with academic and personal counseling, stipends, and other support services, and helps students obtain financial aid for their remaining undergraduate education. Currently there are approximately 100 HEP and CAMP programs at institutions of higher education throughout the United States.
F U N DING HIS TORY (in millions)
FY 2019 FY 2020 FY 2021 FY 2022 PRESIDENT’s REQUEST $44.62 $45.62 $46.12 $66.12
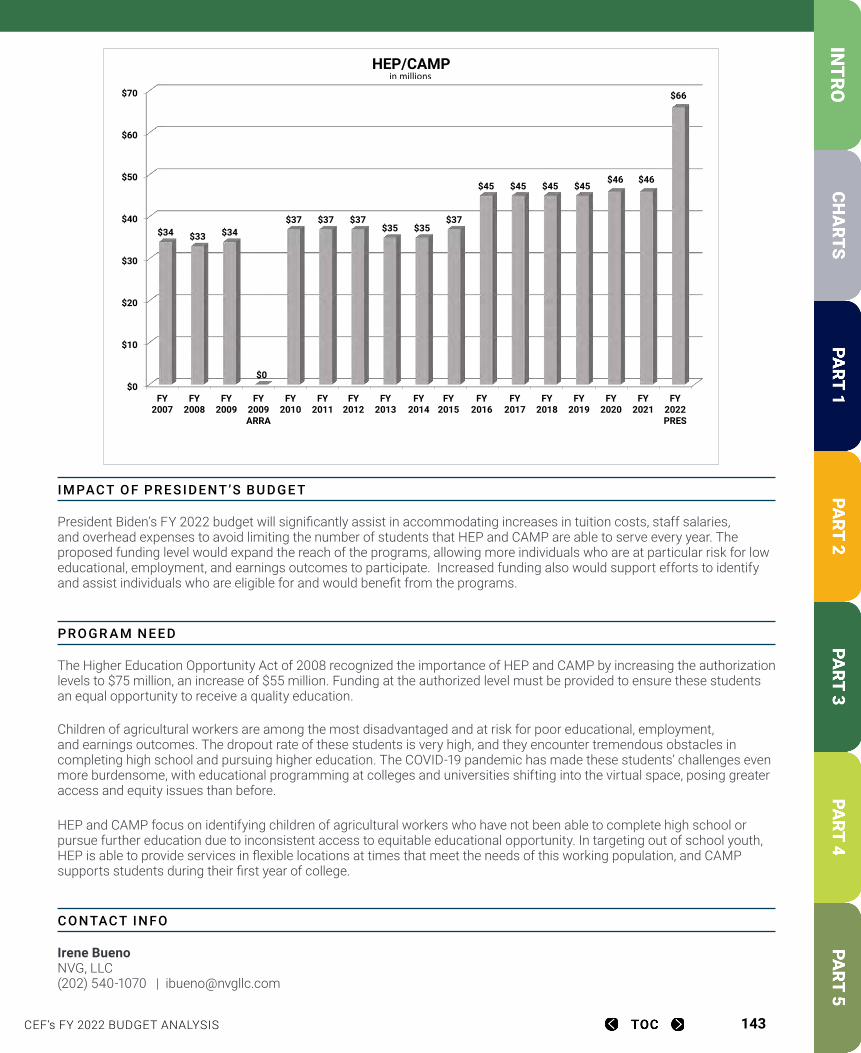
CEF’s FY 2022 BUDGET ANALYSIS 143
IM PACT OF PR ES IDENT’S BU DGE T
President Biden’s FY 2022 budget will significantly assist in accommodating increases in tuition costs, staff salaries, and overhead expenses to avoid limiting the number of students that HEP and CAMP are able to serve every year. The proposed funding level would expand the reach of the programs, allowing more individuals who are at particular risk for low educational, employment, and earnings outcomes to participate. Increased funding also would support efforts to identify and assist individuals who are eligible for and would benefit from the programs.
PROGR A M N EED
The Higher Education Opportunity Act of 2008 recognized the importance of HEP and CAMP by increasing the authorization levels to $75 million, an increase of $55 million. Funding at the authorized level must be provided to ensure these students an equal opportunity to receive a quality education.
Children of agricultural workers are among the most disadvantaged and at risk for poor educational, employment, and earnings outcomes. The dropout rate of these students is very high, and they encounter tremendous obstacles in completing high school and pursuing higher education. The COVID-19 pandemic has made these students’ challenges even more burdensome, with educational programming at colleges and universities shifting into the virtual space, posing greater access and equity issues than before.
HEP and CAMP focus on identifying children of agricultural workers who have not been able to complete high school or pursue further education due to inconsistent access to equitable educational opportunity. In targeting out of school youth, HEP is able to provide services in flexible locations at times that meet the needs of this working population, and CAMP supports students during their first year of college.
CONTACT IN FO
Irene Bueno NVG, LLC (202) 540-1070 | [email protected]
FY 2007 FY 2008 FY 2009 FY 2009 ARRAFY 2010 FY 2011 FY 2012 FY 2013 FY 2014 FY 2015 FY 2016 FY 2017 FY 2018 FY 2019 FY 2020 FY 2021 FY 2022 PRES34$ 33$ 34$ -$ 37$ 37$ 37$ 35$ 35$ 37$ 45$ 45$ 45$ 45$ 46$ 46$ 66$
$0
$10
$20
$30
$40
$50
$60
$70
FY2007
FY2008
FY2009
FY2009ARRA
FY2010
FY2011
FY2012
FY2013
FY2014
FY2015
FY2016
FY2017
FY2018
FY2019
FY2020
FY2021
FY2022PRES
$34 $33 $34
$0
$37 $37 $37$35 $35
$37
$45 $45 $45 $45$46 $46
$66
HEP/CAMPin millions
CEF’s FY 2022 BUDGET ANALYSIS 144
Historically Black Colleges and Universities (HBCUs)Title III, Parts B, C, D, and F, Higher Education Act
“I have always taken my academic career seriously and ensure that my work is submitted on time and done to the best of my ability. As an English major at Bennett College, one of the most helpful tools on campus was the Holgate Library. I spent an average of 25 hours a week in the library reading, writing, planning, or simply enjoying my quiet escape from the outside world. The library provided unlimited resources and silence that allowed me to concentrate on completing my assignments quickly and efficiently. Since I have transitioned back home, I have found it very difficult to complete simple assignments because of my environment and lack of interest.
Being a daughter, sister, and full-time college student is a task, especially when everyone in your household is COVID-19 positive at one time. Staying on top of assignments while also looking after your family is a vast responsibility. I have also observed that I experience frequent moments of disinterest and boredom when completing school work. Transitioning from seeing my professors every day to looking at them through a computer screen was a change I did not know was going to be so arduous. As a ‘Zoomer,’ or Gen Z student, electronics and social media should be my strong suit. But, after being completely virtual for over a year, I can barely remember what an in-person class looks, feels, smells, and sounds like.
Despite spending an entire year of my undergraduate studies in a completely remote setting, I have maintained a 3.9 GPA, as well as two fellowships. I have seen the opportunities and experiences presented to me during this pandemic and I can’t wait for the many more to come!”
— Ashley King, Bennett College ‘22
DES CRIP TION
Historically Black Colleges and Universities (HBCUs) were created as early as 1837 to provide African Americans access to higher education. Noted for their contributions in educating “black, low-income and educationally disadvantaged Americans,” the 101 accredited HBCUs today constitute the class of institutions that satisfy the statutory definition of the term “HBCU” in Title III, Part B, of the Higher Education Act of 1965 (HEA).
HBCUs represent only 3 percent of all colleges and universities but enroll 10 percent of African American undergraduates, produce 16 percent of the nation’s African American college graduates with bachelor’s degrees, and award 21 percent of African Americans with bachelor’s degrees in science, technology, engineering, and mathematics (STEM) fields. In addition, these institutions well exceed the return on the nation’s investment: While they comprise only 8.5 percent of four-year institutions in their states, they enroll 24 percent of all Black undergraduates pursuing a bachelor’s degree and award on average 26 percent of all bachelor’s degrees and 32 percent of STEM degrees earned by Black students.
Today, nearly 300,000 students attend HBCUs which include two- and four-year, public and private, and single-sex and coed institutions, located primarily in Southern states. HBCUs disproportionately enroll low-income, first-generation college students – precisely the students the country should support to obtain college degrees.
The HEA authorizes the following programs that benefit HBCUs:
Strengthening HBCUs (Title III, Part B) Title III programs are the cornerstone of federal support to HBCUs, providing critical operating and capital resources for institutions. Title III discretionary funding provides support for undergraduate and graduate education programs and support services essential for student success. Strengthening HBCUs (Section 323) provides foundational institutional support to accredited HBCUs. Strengthening Historically Black Graduate Institutions (Section 326) provides support to HBCU postbaccalaureate and professional programs in medicine, law, veterinary medicine, and other disciplines.
CEF VIDEO

CEF’s FY 2022 BUDGET ANALYSIS 145
Endowment Challenge Grants (Title III, Part C) Endowment Challenge Grants provide matching grants to increase the endowment funds at institutions that qualify for funding under Title III, Parts A and B, of the HEA, including HBCUs. This program has been in existence since the Higher Education Amendments of 1986 but has not received funding since FY 1995.
HBCU Capital Financing Program (Title III, Part D)
The HBCU Capital Financing Program provides HBCUs with access to low-interest loans not available elsewhere to support the repair, renovation, and construction or acquisition of educational facilities, instructional equipment, and physical infrastructure. As a result of these investments, HBCUs are able to provide students with enhanced learning and living environments, rebuild and restore historic buildings, and provide jobs in communities still feeling the effects of the Great Recession.
Minority Science and Engineering Improvement Program (Title III, Part E)
These grants are designed to increase participation of underrepresented ethnic and racial minorities in science and engineering programs and support science and engineering programs at predominantly minority institutions. Colleges and universities eligible to receive funding under Title III and V of the HEA are able to receive assistance under MSEIP.
Strengthening Historically Black Colleges and Universities and Other Minority-Serving Institutions (Title III, Part F)
Title III mandatory funding supplements and works in conjunction with the discretionary forumula program to enhance academic instruction at HBCUs, especially in the STEM fields.
Master’s Degree Programs at HBCUs (Title VII, Subpart 4)
The Master’s Degrees Programs at HBCUs (Section 723) provide funding to 18 HBCUs to improve graduate education opportunities at the master’s level in mathematics, engineering, physical or natural sciences, computer science, information technology, nursing, allied health, or other scientific disciplines where African American students are underrepresented.
F U N DING HIS TORY (in millions)
FY 2019 FY 2020 FY 2021 FY 2022 PRESIDENT’s REQUEST Strengthening HBCUs(discretionary) $ 282.42 $ 324.79 $ 337.62 $ 402.62(mandatory)* $ 79.73 $ 79.99 $ 80.16 $ 247.16
Strengthening HBGIs $ 73.04 $ 84.00 $ 87.31 $ 102.31
Master’s Degree Programs at HBCUs and PBIs $ 8.66 $ 9.96 $ 10.96 $ 20.96
MSEIP $ 11.14 $ 12.64 $ 13.37 $ 18.37
* Mandatory totals include funds provided by the Student Aid and Fiscal Responsibility Act (SAFRA) within the Health Care and Education Reconciliation Act of 2010 and mandatory appropriations provided under Title VIII, Part AA, Sections 897 of the HEA.
Amounts include a sequester reduction 6.2 percent in 2019.
CEF’s FY 2022 BUDGET ANALYSIS 146
IM PACT OF PR ES IDENT’S BU DGE T
President Biden’s FY 2022 budget provides much-needed increases to the pivotal programs directly impacting HBCUs. This funding is crucial to ensuring these institutions have the resources needed to continue to adequately provide quality academic programming, enhanced student support services, and the proper training to students, faculty, and staff. The Strengthening HBCU Program has never been funded at its authorized level of $375 million, and President Biden is calling for a $402.62 million investment. This is one of many examples of how the president is making clear his priorities, and HBCUs are long overdue the financial support they need to thrive in the 21st century.
PROGR A M N EED
HBCUs are an important strategy in closing the college attainment gap between minority and low-income students and their more advantaged peers. Despite the need, a wave of cutbacks beginning in FY 2011 has undermined the important work of HBCUs in giving students of color a strong postsecondary education. The pandemic has left these institutions mainly focused on continuing to provide academic programming to students virtually, even as they have endured massive revenue losses. While there have been funding set asides for HBCUs in past COVID relief proposals, significant increased federal investments are needed to strengthen the capacity of HBCUs to prepare first-generation, low-income students of color for careers of success and service through programs specifically designed for this purpose.
CONTACT IN FO
Emmanual A. Guillory National Association of Independent Colleges and Universities (202) 739-0478 | [email protected]
CEF’s FY 2022 BUDGET ANALYSIS 147
Developing Hispanic-Serving Institutions (HSIs) ProgramTitle III, Part F; Title V, Parts A-B, Higher Education Act Title V, Part A: Using its Developing Hispanic-Serving Institutions grant, the University of Texas at San Antonio (UTSA) created the First Generation and Transfer Student Center (FGTSC), which primarily provides mentorship services to undergraduate students through the First to Go and Graduate (F2G&G) and the Roadrunner Transition Experience (RTE) programs. The purpose of F2G&G, which features a first-generation mentorship program incorporating Peer and Faculty Mentorship, is to promote improved academic success, persistence, and successful graduation of program participants. F2G&G seeks to develop and support an institution-wide culture that actively recognizes, encourages, and supports first-generation college students. RTE features a transfer-student mentorship program that incorporates Peer to Peer Mentorship. Through regular meetings with Peer Mentors, students build on assets they bring from their previous institutions, while learning how to navigate the UTSA setting and all that it offers. For the 2017 cohort, F2G&G had an 85 percent one-year retention rate, and for RTE, 86 percent. The one-year retention rate for sophomores and juniors was 87 percent and 90 percent, respectively. Title V, Part B: California State University, Fullerton (CSUF) used its Promoting Postbaccalaureate Opportunities for Hispanic Americans (PPOHA) grant to create the Latina/o Graduate Students: SOAR (Strengthening Opportunities, Access and Resources). The project’s goal – to increase the number of Hispanic students who enroll in and achieve a graduate degree in a timely manner – will be addressed through fostering meaningful engaged learning experiences for Hispanic students, expanding academic offerings, and enhancing program quality. Created in 2014, SOAR offers advising, academic resources, professional development and networking opportunities, and scholarships. All graduate students are eligible for some of these opportunities. Since its inception, SOAR has supported 300 Elevar Scholars scholarship students, advised 2,000 students through the admissions process and 200 students on academic probation, and served at least 800 students in academic, cultural, and professional development workshops. In addition, thousands of students have used the Graduate Student Success Center for advising, tutoring, and resources, as well as a place to study.
Title III, Part F: Arizona Western College, an Arizona Hispanic-Serving Institution, received an HSI-STEM grant for Informatics-STEMing Into New Careers for Today and Tomorrow (INSTINCT2). In cooperation with the University of Arizona South, a Hispanic-Serving Institution, the project established the first locally available STEM-designated Computer and Information Science pathway in Yuma and La Paz Counties.
DES CRIP TION
Developing Hispanic-Serving Institutions (Title V, Part A) provides competitive grants to HSIs, defined as nonprofit higher education institutions with enrollment of at least 25 percent Hispanic undergraduate full-time equivalent students. In 2020, only 170 grants were awarded out of 501 eligible grantees. HSIs enroll and educate a disproportionate number of non-white, low-income, and professional students. Program purposes are to expand educational opportunities for and improve academic attainment of Hispanic students and expand and enhance academic offerings, program quality, and institutional stability. Funds may be used to purchase laboratory equipment and construct instructional facilities, support faculty development, and provide academic tutoring/counseling programs and student support services, such as outreach, mentoring, and fellowships. Other uses of funds include providing administrative management, articulation agreements, program facilitation and education, and financial information to improve students’ financial and economic literacy. Five-year individual development grants and five-year cooperative arrangement development grants may be awarded under Title V, Part A.
CEF’s FY 2022 BUDGET ANALYSIS 148
Promoting Postbaccalaureate Opportunities for Hispanic Americans Program (Title V, Part B) funds competitive grants to HSIs to provide graduate school opportunities and improved academic attainment for Hispanic students. In 2020, only 88 out of an eligible 529 grantees received awards. Funds also support expanded postbaccalaureate academic offerings and enhanced program quality in postsecondary institutions educating the majority of Hispanic college students, helping large numbers of Hispanic and low-income students complete postsecondary degrees. To receive a PPOHA grant, a higher education institution must offer a postbaccalaureate certificate or program, be designated as an eligible institution, and meet the program-specific requirements to be defined as an HSI.
Hispanic-Serving Institutions Science, Technology, Engineering and Mathematics and Articulation Programs (Title III, Part F) funds competitive grants to increase the number of Hispanic and other low-income students attaining degrees in the fields of science, technology, engineering, or mathematics and develop model transfer and articulation agreements between two- and four-year institutions in these fields. Grants are competitively awarded to postsecondary institutions designated as HSIs. In 2020, only 17 of a possible 210 eligible grantees received awards.
Despite the continued growth of HSIs since their establishment in 1995, the funding for these institutions remains stagnant.
F U N DING HIS TORY (in millions)
FY 2019 FY 2020 FY 2021 FY 2022 PRESIDENT’s REQUEST Title III—Part F*(mandatory) $ 93.80* $ 94.10* $ 94.30* $290.30*** Title V—Part A $124.42 $143.08 $148.73 $236.73
Title V—Part B $ 11.16 $ 12.84 $ 13.85 $ 28.85
Title V—Part B**(mandatory) --- --- --- ** Total $227.64 $250.02 $256.88 $555.88
* Mandatory totals include funds provided by the Student Aid and Fiscal Responsibility Act (SAFRA) within the Health Care and Education Reconciliation Act of 2010 and mandatory appropriations provided under Title VIII, Part AA, Sections 897 and 898 of the HEA. Most
recently, Title III, Part F was permanently extended with the enactment of the FUTURE Act on December 17, 2019.
** $10.6 million in mandatory funds for Title V, Part B, as authorized in the Higher Education Act, ended after FY 2014, effectively cutting funding by 50 percent..
*** The amount requested for FY 2022 does not reflect an anticipated reduction pursuant to the Budget Control Act of 2011.,
IM PACT OF PR ES IDENT’S BU DGE T
President Biden’s FY 2022 budget helps address the growing needs of HSIs, with funding for Title V, Part A at $236.7 million and Title V, Part B at $28.8 million. The budget also supports increasing the Title III, Part F mandatory funding request to $296 million. In addition to the $1,475 Pell Grant increase proposed in the American Families Plan, the Administration’s budget also includes $3 billion to increase the maximum Pell Grant by $400 per student and supports extending Pell Grant eligibility to DACA students.
The number of HSIs grew from 311 in 2010 to 569 in 2019, with corresponding increases in the number of Hispanic students gaining access to higher education. HSIs educate over 5 million undergraduate and graduate students despite persistently low federal funding levels. While the FY 2022 budget provides funding enhancements for HSIs, they are inadequate and inequitable. Funding for Title V, Parts A and B should be dramatically increased to meet the funding needs of HSIs. This would allow HSI institutions to better serve Hispanic students, whose postsecondary enrollment has surged by over 1 million students since 2010.
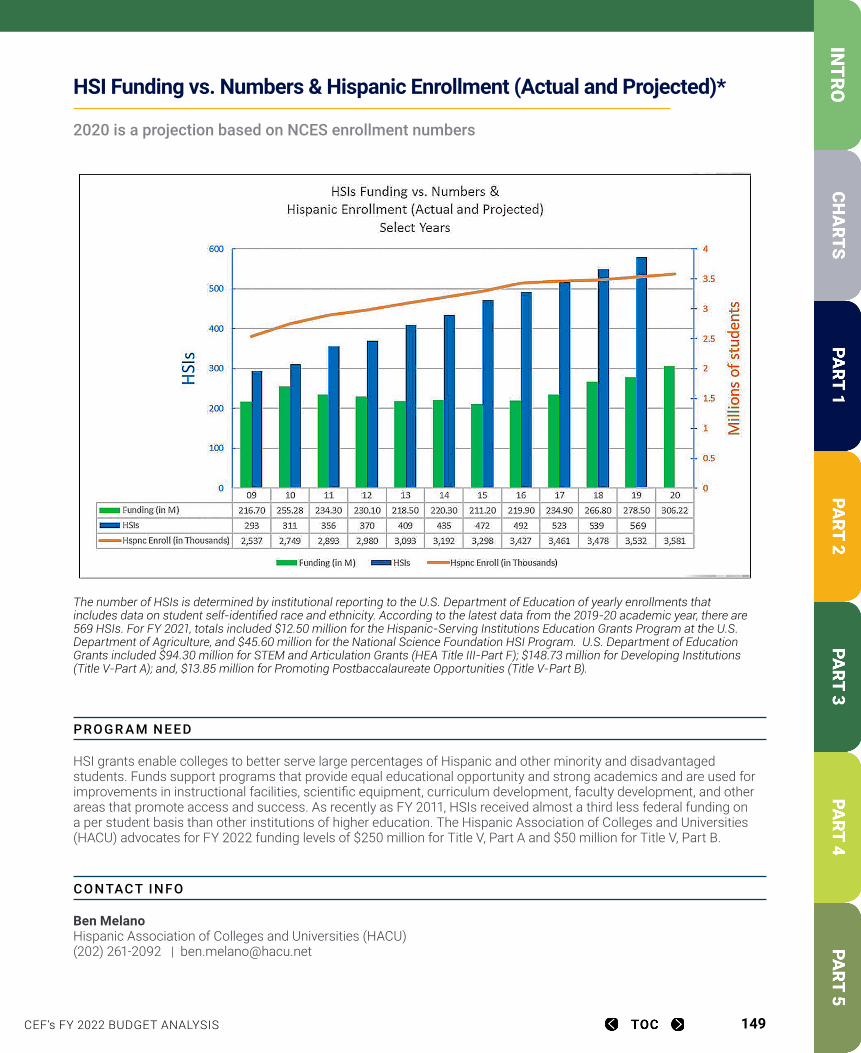
CEF’s FY 2022 BUDGET ANALYSIS 149
PROGR A M N EED
HSI grants enable colleges to better serve large percentages of Hispanic and other minority and disadvantaged students. Funds support programs that provide equal educational opportunity and strong academics and are used for improvements in instructional facilities, scientific equipment, curriculum development, faculty development, and other areas that promote access and success. As recently as FY 2011, HSIs received almost a third less federal funding on a per student basis than other institutions of higher education. The Hispanic Association of Colleges and Universities (HACU) advocates for FY 2022 funding levels of $250 million for Title V, Part A and $50 million for Title V, Part B.
CONTACT IN FO
Ben Melano Hispanic Association of Colleges and Universities (HACU) (202) 261-2092 | [email protected]
The number of HSIs is determined by institutional reporting to the U.S. Department of Education of yearly enrollments that includes data on student self-identified race and ethnicity. According to the latest data from the 2019-20 academic year, there are 569 HSIs. For FY 2021, totals included $12.50 million for the Hispanic-Serving Institutions Education Grants Program at the U.S. Department of Agriculture, and $45.60 million for the National Science Foundation HSI Program. U.S. Department of Education Grants included $94.30 million for STEM and Articulation Grants (HEA Title III-Part F); $148.73 million for Developing Institutions (Title V-Part A); and, $13.85 million for Promoting Postbaccalaureate Opportunities (Title V-Part B).
HSI Funding vs. Numbers & Hispanic Enrollment (Actual and Projected)* 2020 is a projection based on NCES enrollment numbers
CEF’s FY 2022 BUDGET ANALYSIS 150
Tribal Colleges and UniversitiesTitle III, Parts A and F, Higher Education Act “We are proud of this tribal institution… We see great things happening here and I’m glad Dr. Guy has a vision for the Navajo people as well as this institution. The two students are reflecting the resilience of our people since time immemorial. I want to say thank you. There is hope.”
— Jonathan Nez, Navajo Nation President December 2019 Pinning Ceremony, Veterinary Technician Graduation
Navajo Technical University (Crownpoint, AZ)
In December 2019, Selena Saunders and Krystal Louis became the first graduates and licensed veterinary technicians from the newly accredited veterinary technology program at Navajo Technical University (NTU). Across the Navajo Nation veterinary technicians are in high demand to support the traditional Navajo way of life, which is heavily based on farming and ranching. With support from Title III—TCU, NTU is responding to these unique local needs while also addressing ongoing institutional infrastructure and broadband needs. To help students succeed, NTU has developed the First Year Experience program to support underprepared high school students in ways that also strengthen Navajo culture and language. All of this is only made possible through the Title III-TCU program.
DES CRIP TION
The goal of the Title III, Strengthening Institutions program is “to improve the academic quality, institutional management, and fiscal stability of eligible institutions, to increase their self-sufficiency and strengthen their capacity to make a substantial contribution to the higher education resources of the Nation.” The Title III program is vital to Tribal Colleges and Universities (TCU) – geographically isolated, small, open-access institutions chartered by federally recognized Indian tribes or the federal government. The program is designed to address the critical unmet needs of American Indian and Alaska Native students in order to effectively prepare them to succeed in a globally competitive workforce. The Title III-TCU program has two parts: Part A (annual discretionary funding) and Part F (mandatory funding). Funds from both Parts A and F are distributed to the 35 accredited TCUs by formula.
F U N DING HIS TORY (in millions)
FY 2019 FY 2020 FY 2021 FY 2022 PRESIDENT’s REQUEST TOTALLY CONTROLLED COLLEGES & UNIVERSITIESDiscretionary (Part A) $31.85 $36.63 $38.08 $53.08Mandatory (Part F) $28.14 $28.23 $28.29 $87.29
IM PACT OF PR ES IDENT’S BU DGE T
Under the president’s FY 2022 budget, Title III-TCU Part A (discretionary) would be significantly increased to provide much-needed resources to tribally and federally charted colleges currently operating more than 75 campuses and sites in 16 states. Strong investments in federal funding are necessary to ensure these institutions are able to maintain current programs and expand their capacity to meet the growing needs of students seeking to access and succeed in higher education.
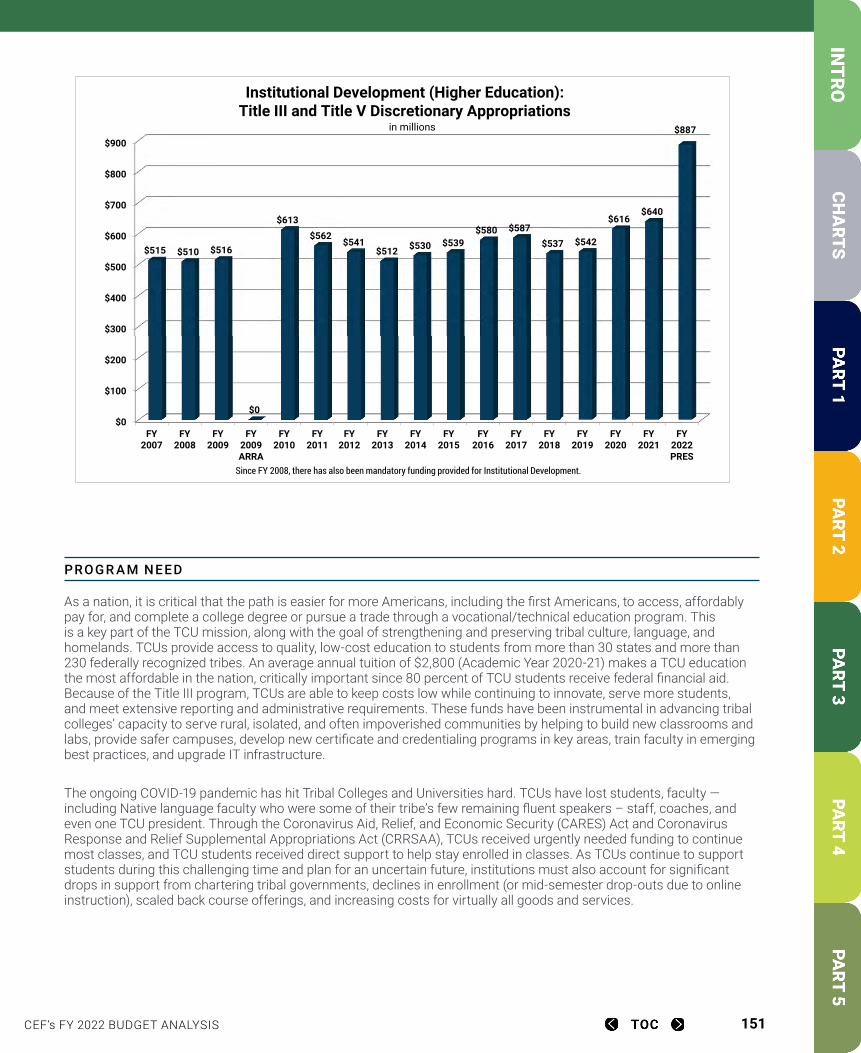
CEF’s FY 2022 BUDGET ANALYSIS 151
PROGR A M N EED
As a nation, it is critical that the path is easier for more Americans, including the first Americans, to access, affordably pay for, and complete a college degree or pursue a trade through a vocational/technical education program. This is a key part of the TCU mission, along with the goal of strengthening and preserving tribal culture, language, and homelands. TCUs provide access to quality, low-cost education to students from more than 30 states and more than 230 federally recognized tribes. An average annual tuition of $2,800 (Academic Year 2020-21) makes a TCU education the most affordable in the nation, critically important since 80 percent of TCU students receive federal financial aid. Because of the Title III program, TCUs are able to keep costs low while continuing to innovate, serve more students, and meet extensive reporting and administrative requirements. These funds have been instrumental in advancing tribal colleges’ capacity to serve rural, isolated, and often impoverished communities by helping to build new classrooms and labs, provide safer campuses, develop new certificate and credentialing programs in key areas, train faculty in emerging best practices, and upgrade IT infrastructure.
The ongoing COVID-19 pandemic has hit Tribal Colleges and Universities hard. TCUs have lost students, faculty — including Native language faculty who were some of their tribe’s few remaining fluent speakers – staff, coaches, and even one TCU president. Through the Coronavirus Aid, Relief, and Economic Security (CARES) Act and Coronavirus Response and Relief Supplemental Appropriations Act (CRRSAA), TCUs received urgently needed funding to continue most classes, and TCU students received direct support to help stay enrolled in classes. As TCUs continue to support students during this challenging time and plan for an uncertain future, institutions must also account for significant drops in support from chartering tribal governments, declines in enrollment (or mid-semester drop-outs due to online instruction), scaled back course offerings, and increasing costs for virtually all goods and services.
FY 2007 FY 2008 FY 2009 FY 2009 ARFY 2010 FY 2011 FY 2012 FY 2013 FY 2014 FY 2015 FY 2016 FY 2017 FY 2018 FY 2019 FY 2020 FY 2021 FY 2022 PRES515$ 510$ 516$ $0 613$ 562$ 541$ 512$ 530$ 539$ 580$ 587$ 537$ 542$ 616$ 640$ 887$
$0
$100
$200
$300
$400
$500
$600
$700
$800
$900
FY2007
FY2008
FY2009
FY2009ARRA
FY2010
FY2011
FY2012
FY2013
FY2014
FY2015
FY2016
FY2017
FY2018
FY2019
FY2020
FY2021
FY2022PRES
$515 $510 $516
$0
$613
$562$541
$512 $530 $539$580 $587
$537 $542
$616$640
$887
Institutional Development (Higher Education):Title III and Title V Discretionary Appropriations
in millions
Since FY 2008, there has also been mandatory funding provided for Institutional Development.
CEF’s FY 2022 BUDGET ANALYSIS 152
Other Title III ProgramsTitle III, Parts A and F, Higher Education ActThese programs are intended to help eligible institutions of higher education increase their self-sufficiency and expand capacity to serve low-income students by providing funds to improve and strengthen the academic quality, institutional management, and fiscal stability of eligible institutions. Alaska Native and Native Hawaiian-Serving InstitutionsAn Alaska Native-serving institution may receive a grant under Title III, Sec. 317, if, at the time of application, it has an enrollment of undergraduate students of whom at least 20 percent are Alaska Native. A Native Hawaiian-serving institution may receive a grant under Sec. 317 if, at the time of application, undergraduate enrollment is at least 10 percent Native Hawaiian students.
Funding History (in millions)
FY 2019 FY 2020 FY 2021 FY 2022 PRESIDENT’s REQUESTDiscretionary $15.93 $18.32 $19.04 $25.04Mandatory $14.07 $14.12 $14.15 $43.15
Asian American and Native American Pacific Islander-serving InstitutionsAn Asian American and Native American Pacific Islander-serving institution may receive a grant under Title III, Sec. 320, if, at the time of application, it has an enrollment of undergraduate students of whom at least 10 percent are Asian American and Native American Pacific Islander.
Funding History (in millions)
FY 2019 FY 2020 FY 2021 FY 2022 PRESIDENT’s REQUESTDiscretionary $3.86 $4.44 $5.41 $20.12Mandatory $4.69 $4.71 $4.72 $14.72
Native American-Serving, Nontribal InstitutionsA Native American-serving, nontribal institution (NASNTI) may receive a grant under Title III, Sec. 319, if, at the time of application, it has an enrollment of undergraduate students of whom at least 10 percent are Native American. Students self-identify as American Indian, and no documentation of tribal membership is required in determining the percentage of Native American students enrolled at a NASNTIs.
Funding History (in millions)
FY 2019 FY 2020 FY 2021 FY 2022 PRESIDENT’s REQUESTDiscretionary $3.86 $3.86 $5.12 $12.12Mandatory $4.69 $4.71 $4.72 $14.72
CONTACT IN FO
Patrese Atine American Indian Higher Education Consortium (703) 838-0400 | [email protected]
CEF’s FY 2022 BUDGET ANALYSIS 153
International Education Programs and Foreign Language StudiesTitle VI, Parts A and B, Higher Education ActSection 102(b)(6), Mutual Educational and Cultural Exchange (Fulbright Hays) Act The Office of Resources for International and Area Studies (ORIAS) is the joint K-14 outreach program of the eight Title VI National Resource Centers at UC Berkeley. ORIAS works to connect teachers and districts with the scholarly resources at UC Berkeley and beyond.
On March 16, 2020, in response to a clear need among educators for COVID-related information, ORIAS cohosted an event called “Ask a Public Health Expert: COVID 19 Informational Webinar for Educators.” The event featured a virologist with experience working in China during the SARS epidemic. Over the following months, ORIAS offered the Global Views of COVID-19 webinar series to help teachers deepen their understanding of the unfolding pandemic. Each event in the series reinforced the benefits and importance of global and area studies knowledge. “Responses and Perspectives in China, Taiwan and Italy” showcased early attempts to contain the pandemic. “Lessons from the 1918 Flu Pandemic in India and Indonesia” provided a framework to understand disease spread and waves of infection. “The Perspective from Rwanda” highlighted the use of radio, public broadcasts, and collaborative lesson-building in education. “Special Session of the TransAtlantic Educators Dialogue” (in collaboration with Illinois European Union Center) brought together educators from across Europe and the United States to talk and learn from one another. The final event in the series, “Design Challenge: Imagining Classrooms in Fall 2020,” drew on policies in Taiwan, Canada, and Iceland as a foundation for discussion. These free, online programs made possible by federal grants to UC Berkeley’s National Resource Centers, reached 675 educators.
DES CRIP TION
The International Education and Foreign Language Studies (IEFLS) Domestic Programs support comprehensive language training, academic research and programming, intensive study of world areas and cultures, and extensive outreach to K-12 classrooms. In addition, funds support collaborations between four-year postsecondary institutions and community colleges and strong ties between U.S. higher education institutions and international partners. These efforts promote American students’ global competencies and enhance their understanding of populations around the world. Title VI programs offer resources and expertise that serve the nation’s economic, diplomatic, defense, and national security needs. Programs also facilitate university collaborations on international issues with federal, state, and local agencies, business and industry, and the military.
The International Education and Foreign Language Studies (IEFLS) Overseas Programs (Fulbright-Hays Act) support overseas study and research for American students, teachers, and college faculty. Institutions support short-term projects, group training, and research in modern foreign languages and intensive language training in major world areas (excluding Western Europe). In addition, programs provide opportunities overseas to study and conduct advanced research and fellowships for scholars specializing in less commonly taught languages and major world areas outside Western Europe.
Title VI programs fund collaborations and partnerships among educational entities, businesses, governments, and programs and fellowships at higher education institutions. Programs focus on increasing the number of experts in world languages and area studies to meet national security needs and train a globally competent workforce. Among these programs are:
National Resource Centers (NRCs) at universities that train students and scholars, maintain library collections and research facilities, conduct research on world affairs, operate summer institutes in the United States and abroad, and provide expertise at all levels of government.
CEF’s FY 2022 BUDGET ANALYSIS 154
Foreign Language and Area Studies (FLAS) Fellowships that support academic year and summer fellowships for graduate and undergraduate level training at universities offering programs of excellence.
Centers for International Business Education (CIBE) that focus comprehensive university expertise on improving international business education across disciplines.
Language Resource Centers (LRCs) that support improvements in teaching and learning of less commonly taught foreign languages
F U N DING HIS TORY (in millions)
FY 2019 FY 2020 FY 2021 FY 2022 PRESIDENT’s REQUEST Domestic Programs $65.10 $68.10 $69.35 $69.35 Overseas Programs $ 7.06 $ 8.06 $ 8.81 $ 8.81
IM PACT OF PR ES IDENT’S BU DGE T
Freezing funding for Title VI programs at a time when international cooperation and collaboration are essential — particularly in the wake of a global pandemic that has reinforced the vital importance of bridging international boundaries — is an untimely restriction of federal resources. The substantial investments made in responding to the COVID-19 pandemic by educational entities, students and scholars, businesses and other stakeholders who operate to advance international cooperation and partnerships warrant increased funding that supports ongoing and future efforts to improve global development.
PROGR A M N EED
Title VI programs are not duplicative and, in fact, serve as a critical national resource. All Title VI programs expand access to international studies and language programs and help deliver global opportunities to a broader population. As evidenced by the global pandemic and its vast worldwide implications, the value of international cooperation and mutual exchange cannot be overstated. Increasing federal funding to support these interactions must be a national priority.
A strong federal investment in Title VI is necessary to expand capacity in international education, research, and foreign language studies. In an increasingly global economy, additional funds are needed to address the severe shortage of Americans with proficiency in less commonly taught languages and to strengthen the nation’s competitive advantage.
CONTACT IN FO
Crystal Martinez and Carl Welliver University of California(202) 974-6308 | [email protected] (202) 974-6302 | [email protected]
CEF’s FY 2022 BUDGET ANALYSIS 155
Federal TRIO ProgramsTitle IV, Part A, Subpart 2, Higher Education Act The Chico Enterprise-Record (Chico, CA), in its article “First-generation graduates feeling bittersweet after coronavirus wipes out commencement ceremony,” highlighted the story of one TRIO student’s experience: “For Brigitte Dahrouj, a political science major and first-generation college graduate from Chico, the graduation ceremony was to be a final moment to convene with her peers and professors. She was to gleefully don her cap that would be emblazoned with a tribute to TRIO-SSS, a federally funded grant program that assists first-generation college students from low-income backgrounds.”
“TRIO is 100 percent the reason I’m not only in college but graduating. This program has meant so much to me and I wanted to pay tribute to it.”
– Brigitte Dahrouj, Class of 2020 Political Science Senior, TRIO SSS Alumna
“I am a first-generation student, raised in a low-income, single-parent household, which experienced substance abuse and mental health struggles. I was forced to drop out of college. Alcoholism cost me my job and housing, which resulted in homelessness. I restarted my academic journey through TRIO’s Educational Opportunity Center [EOC] in Las Vegas in 2009. EOCs help adults like me re-enter the education pipeline and successfully navigate the complex college admissions and financial aid processes. My program director worked with me one-on-one
to guide me through the first steps of completing the FAFSA and on my journey to enrolling. In 2016, I graduated from California State University-Sacramento with a Bachelor of Social Work and a minor in Native American Studies. In 2019 at age 43, I graduated from California State University-Sacramento with a Master of Social Work. Today I’m employed as an Associate Clinical Social Worker. I made many attempts, but it was TRIO that finally put me on the path to achieving my academic goals. While TRIO is only able to serve a fraction of first-generation, low-income students who are eligible for services, I was one of the lucky ones.”
– Virgil Rambeau
DES CRIP TION
The TRIO programs provide a pipeline of educational outreach and supportive services to more than 800,000 low-income students ranging from sixth graders to doctoral candidates, adult learners, and students with disabilities. Through seven programs (Talent Search, Upward Bound, Upward Bound Math-Science, Student Support Services, Ronald E. McNair Postbaccalaureate Achievement, Educational Opportunity Centers, and Veterans Upward Bound), TRIO motivates and prepares first-generation individuals from families with incomes below 150 percent of the poverty level and where neither parent has a college degree. Through nearly 3,000 projects, TRIO operates in virtually every congressional district in the United States and several independent territories.
TRIO programs often make the difference in a student’s ability to attend and complete a college program. For low-income youth who would be the first members of their families to attend college, TRIO provides college coaching, experiential learning, and assistance in applying to and paying for college. TRIO offers academic tutoring, personal mentoring and advising, assistance with college transfer, and other retention services to ensure higher graduation rates. TRIO also provides adult learners with the opportunity to reorient themselves to the classroom and the supports necessary to balance higher education with the responsibilities of career and family. TRIO serves a crucial function as it shores up the federal investment in aid programs like the Pell Grant and other financial supports.
CEF VIDEO
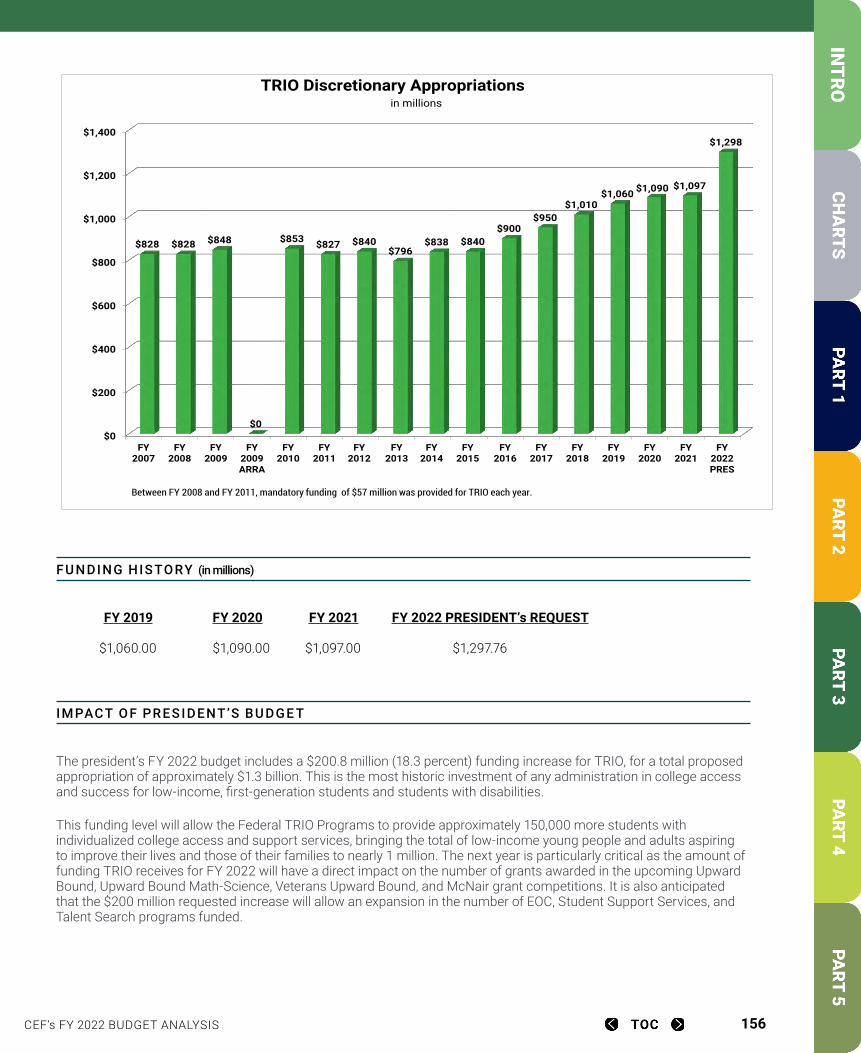
CEF’s FY 2022 BUDGET ANALYSIS 156
F U N DING HIS TORY (in millions)
FY 2019 FY 2020 FY 2021 FY 2022 PRESIDENT’s REQUEST $1,060.00 $1,090.00 $1,097.00 $1,297.76
IM PACT OF PR ES IDENT’S BU DGE T
The president’s FY 2022 budget includes a $200.8 million (18.3 percent) funding increase for TRIO, for a total proposed appropriation of approximately $1.3 billion. This is the most historic investment of any administration in college access and success for low-income, first-generation students and students with disabilities.
This funding level will allow the Federal TRIO Programs to provide approximately 150,000 more students with individualized college access and support services, bringing the total of low-income young people and adults aspiring to improve their lives and those of their families to nearly 1 million. The next year is particularly critical as the amount of funding TRIO receives for FY 2022 will have a direct impact on the number of grants awarded in the upcoming Upward Bound, Upward Bound Math-Science, Veterans Upward Bound, and McNair grant competitions. It is also anticipated that the $200 million requested increase will allow an expansion in the number of EOC, Student Support Services, and Talent Search programs funded.
FY 2007 FY 2008 FY 2009 FY 2009 ARFY 2010 FY 2011 FY 2012 FY 2013 FY 2014 FY 2015 FY 2016 FY 2017 FY 2018 FY 2019 FY 2020 FY 2021 FY 2022 PRES828$ 828$ 848$ -$ 853$ 827$ 840$ 796$ 838$ 840$ 900$ 950$ 1,010$ 1,060$ 1,090$ 1,097$ 1,298$
$0
$200
$400
$600
$800
$1,000
$1,200
$1,400
FY2007
FY2008
FY2009
FY2009ARRA
FY2010
FY2011
FY2012
FY2013
FY2014
FY2015
FY2016
FY2017
FY2018
FY2019
FY2020
FY2021
FY2022PRES
$828 $828 $848
$0
$853 $827 $840$796
$838 $840$900
$950$1,010
$1,060 $1,090 $1,097
$1,298
TRIO Discretionary Appropriationsin millions
Between FY 2008 and FY 2011, mandatory funding of $57 million was provided for TRIO each year.
CEF’s FY 2022 BUDGET ANALYSIS 157
PROGR A M N EED
Through the creation of TRIO, the federal government assumed the role of ensuring all students — regardless of background — have equal access to a college education. Without the intervention of the Federal TRIO Programs, students from low-income families, students who will be the first in their families to earn college degrees, students with disabilities, and other underrepresented students would not receive the supportive services necessary even to consider the possibility of college.
Such support is more important than ever due to the challenges presented by school closures, remote learning, economic hardship, and students’ added family responsibilities in the wake of the coronavirus crisis. Students from low-income backgrounds, in particular, faced tremendous pressure to halt their studies to help provide additional child care and financial support to their families.
CONTACT IN FO
Stephanie Salvador Council for Opportunity in Education (202) 347-7430 | [email protected]
CEF’s FY 2022 BUDGET ANALYSIS 158
Gaining Early Awareness and Readiness for Undergraduate Programs (GEAR UP)Title IV, Part A, Subpart 2, Higher Education Act “As the son of immigrant parents, I never thought going to college would be an option. When I was younger, my parents worked long hours to provide for our family. At a young age, they instilled in me the value of hard work. While I always did well academically, I never saw myself pursuing higher education. If not for the support and encouragement that I got from GEAR UP, I would not have gone to college. GEAR UP gave me the tools and resources I needed to be successful. To me, GEAR UP was more than just a college access program — it was a family. Ten years later, I am still in contact with the GEAR UP staff that helped me get to college. I am proud to say that because of GEAR UP, I was the first in my family to attend and graduate from a four-year university.
After college, I spent time working in the radio industry. While it was a great experience, I wanted to give back to a program that gave so much to me. I currently mentor GEAR UP students in Southern California. I see a lot of myself in them. I was once told that when you walk through the door of opportunity, you want to make sure you leave it open for the person coming up behind you. I know firsthand the generational impact that a college degree has on families, and I want to make sure that every student I work with has that same opportunity.”
— William Ruiz, GEAR UP Alumnus
DES CRIP TION
GEAR UP is a highly competitive discretionary grant program that increases the number of low-income, minority, and first-generation students prepared to enter and succeed in postsecondary education. The program is expected to serve over 520,000 students in FY 2021. Beginning no later than seventh grade, the program serves entire grade levels of students through high school and into their first year of college. GEAR UP provides a comprehensive suite of research-based programs that address academic, social, and financial barriers to higher education. Common programs include tutoring, mentoring, academic preparation, financial literacy education, parental engagement, scholarships, and professional development for educators. GEAR UP fosters partnerships among K-12 schools, institutions of higher education, local school districts, state departments of education, businesses, and community-based organizations to strengthen local pathways to college. These partnerships are required to match federal funding dollar for dollar, effectively doubling the investment to improve low-income students’ college readiness and completion.
F U N DING HIS TORY (in millions)
FY 2019 FY 2020 FY 2021 FY 2022 PRESIDENT’s REQUEST $360.00 $365.00 $368.00 $408
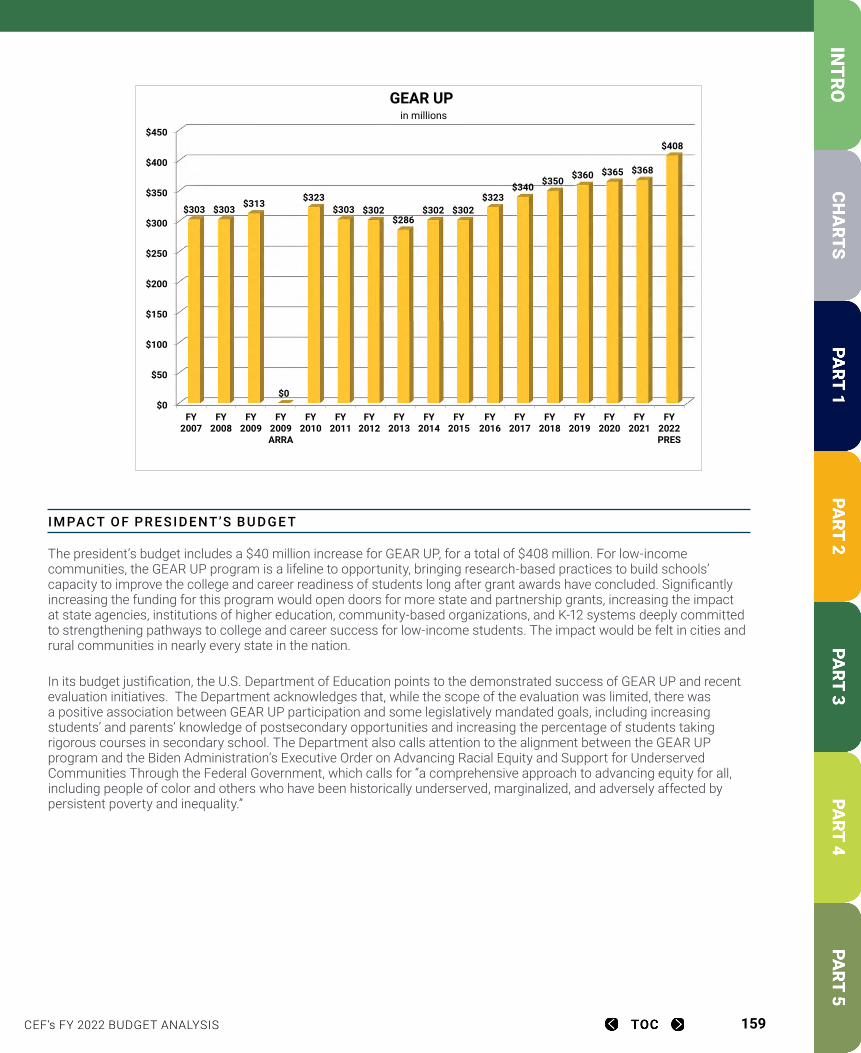
CEF’s FY 2022 BUDGET ANALYSIS 159
IM PACT OF PR ES IDENT’S BU DGE T
The president’s budget includes a $40 million increase for GEAR UP, for a total of $408 million. For low-income communities, the GEAR UP program is a lifeline to opportunity, bringing research-based practices to build schools’ capacity to improve the college and career readiness of students long after grant awards have concluded. Significantly increasing the funding for this program would open doors for more state and partnership grants, increasing the impact at state agencies, institutions of higher education, community-based organizations, and K-12 systems deeply committed to strengthening pathways to college and career success for low-income students. The impact would be felt in cities and rural communities in nearly every state in the nation.
In its budget justification, the U.S. Department of Education points to the demonstrated success of GEAR UP and recent evaluation initiatives. The Department acknowledges that, while the scope of the evaluation was limited, there was a positive association between GEAR UP participation and some legislatively mandated goals, including increasing students’ and parents’ knowledge of postsecondary opportunities and increasing the percentage of students taking rigorous courses in secondary school. The Department also calls attention to the alignment between the GEAR UP program and the Biden Administration’s Executive Order on Advancing Racial Equity and Support for Underserved Communities Through the Federal Government, which calls for “a comprehensive approach to advancing equity for all, including people of color and others who have been historically underserved, marginalized, and adversely affected by persistent poverty and inequality.”
FY 2007 FY 2008 FY 2009 FY 2009 ARFY 2010 FY 2011 FY 2012 FY 2013 FY 2014 FY 2015 FY 2016 FY 2017 FY 2018 FY 2019 FY 2020 FY 2021 FY 2022 PRES303$ 303$ 313$ -$ 323$ 303$ 302$ 286$ 302$ 302$ 323$ 340$ 350$ 360$ 365$ 368$ 408$
$0
$50
$100
$150
$200
$250
$300
$350
$400
$450
FY2007
FY2008
FY2009
FY2009ARRA
FY2010
FY2011
FY2012
FY2013
FY2014
FY2015
FY2016
FY2017
FY2018
FY2019
FY2020
FY2021
FY2022PRES
$303 $303 $313
$0
$323$303 $302
$286$302 $302
$323$340 $350 $360 $365 $368
$408
GEAR UPin millions
CEF’s FY 2022 BUDGET ANALYSIS 160
PROGR A M N EED
For the most recent year in which there is a substantial sample, the U.S. Department of Education reports 77.3 percent of the GEAR UP class of 2014 enrolled in a postsecondary institution immediately following high school graduation. Considering that nationally only 45.5 percent of low-income students did the same over the prior year, GEAR UP is clearly a catalyst for results. Achieving these outcomes at a modest annual federal investment of just under $530 per GEAR UP student speaks to the power of these highly flexible, locally led programs. Additionally, an independent study from the New America Foundation, Rebalancing Resources and Incentives in Federal Student Aid, cites GEAR UP as “the most promising of these [college outreach] programs.” The study recommends tripling GEAR UP funding to expand grantees’ capacity to serve multiple cohorts.
COVID-19 has dramatically impacted college-going rates for low-income students. This impact has been seen largely among first-time, first-year students. The National Student Clearinghouse reports, “For graduates at high-poverty high schools there was a 32.6 percent decline in attending college, compared with a 16.4 percent decline for graduates of low-poverty schools.” GEAR UP programs have shown their strength and success in the face of new challenges brought on by the pandemic, quickly pivoting to virtual advising, virtual tutoring, and virtual family engagement workshops. However, the COVID-19 pandemic made it clear that higher education is still not accessible and attainable for all students.
Despite GEAR UP’s demonstrated success increasing high school graduation and college enrollment rates for students from low-income and working-class backgrounds, only a fraction of eligible students and communities benefit from the program. Without increased funding, an open competition for new grant awards may not be possible and no new students will be able to benefit from research-driven GEAR UP services. Modestly increasing GEAR UP to $435 million in FY 2022 would propel the program’s momentum to strengthen the pathway to postsecondary education and allow an additional 100,000 new students into the program.
CONTACT IN FO
Emily Jeffries National Council for Community and Education Partnerships (202) 530-1135, ext. 2120 | [email protected]
CEF’s FY 2022 BUDGET ANALYSIS 161
Graduate EducationTitle VII, Part A, Subpart 2, Higher Education Act The Graduate Assistance in Areas of National Need (GAANN) program at the Department of Materials Science and Engineering (MSE) at the University of California, Davis recruits Ph.D. students from undergraduates with superior ability and demonstrated financial need. UC Davis’s interdisciplinary program explicitly seeks to increase the pool of traditionally underrepresented students by soliciting applications for disciplines, such as the biological and physical sciences, with larger student populations and larger numbers of the targeted groups. These students would normally enter the work force with a bachelor’s degree or might pursue graduate studies in other majors.
All students in good standing are supported throughout their studies and graduate with a Ph.D. within five years. GAANN fellowships support the first year for students with non-traditional academic backgrounds to take courses that provide the expertise expected of incoming students with conventional (MSE or chemical engineering) training. Fellows receive at least one year of supervision in teaching at UC Davis and at a local community college, as well as professional advising. UC Davis also encourages participation in a year-long program focusing on professional development and leadership and assisting graduate students with job placement in academia or industry, setting students up for further success once they complete their studies.
DES CRIP TION
The only U.S. Department of Education scholarship assistance for graduate students is provided through the GAANN program. Through highly competitive awards to institutions, GAANN provides fellowships to graduate students who demonstrate financial need and have superior academic ability. Eligible institutions must seek talented students from underrepresented backgrounds, offer social and academic supports, and provide an institutional match of 25 percent. After consultation with appropriate federal agencies including the National Science Foundation, the Department of Defense, and the Department of Homeland Security, the Department of Education designates certain academic fields as “areas of national need” for the awards competition. In recent years, these areas included STEM fields (science, technology, engineering, and mathematics), critically needed foreign languages and area studies, and nursing.
F U N DING HIS TORY (in millions)
FY 2019 FY 2020 FY 2021 FY 2022 PRESIDENT’s REQUEST $23.05 $23.05 $23.55 $23.55
IM PACT OF PR ES IDENT’S BU DGE T
Graduate students already face challenges accessing funding support for their educational pursuits from the federal government. With funding levels for GAANN declining from FY 2016 to FY 2018 and remaining essentially frozen to the present day, this source of critical funding for graduate students continues to stagnate in value. While future graduate students may benefit from the substantial investments made in President Biden’s overall FY 2022 budget, the need for additional investment in currently enrolled, diverse, and high-achieving graduate students is evident.
CEF’s FY 2022 BUDGET ANALYSIS 162
PROGR A M N EED
GAANN is the only source of grant support for graduate students in the Department of Education. Recipients of these highly competitive awards are academically talented, financially needy students who are pursuing graduate degrees in critical scientific and technical fields identified by the federal government as areas of national need. A stronger national commitment to graduate education through GAANN and other programs is needed to assure a continued pipeline of skilled workers in all sectors of the economy, as well as qualified professors who will mentor and train the teachers and students of tomorrow. Graduate students drive excellence in teaching and learning, discover and patent new inventions, develop new products and solutions, and influence the worlds of music, art, and design. Graduate students also add to our nation’s economic competitiveness, innovation, and national security in business, academia, government, and a broad range of fields.
The COVID-19 pandemic has severely affected students pursuing higher education. Students have experienced loss of employment or reduced hours, decreased access to affordable housing, food, and child care, and increased costs associated with transitioning to remote learning. Additionally, students who were working in laboratories or other facilities on campuses have been forced to suspend their work, further affecting their ability to graduate on time and give back to their communities.
CONTACT IN FO
Crystal Martinez and Carl Welliver University of California(202) 974-6308 | [email protected] (202) 974-6302 | [email protected]
CEF’s FY 2022 BUDGET ANALYSIS 163
Child Care Access Means Parents in School (CCAMPIS)Title IV, Part A, Subpart 7, Higher Education Act “I love this place… I have straight As because I have time to focus on my school work.”
This is just one of the many glowing things student parents have to say about the Richard M. Guon Childcare Center at Monroe Community College in Rochester, NY. A longtime CCAMPIS grantee, Monroe uses its grant funds to subsidize day care costs for student parents with financial need. The Center has been open throughout the pandemic and has been a lifeline for student parents engaged in online and in-person coursework. Data collected by Monroe showed significantly higher persistence and on-time graduation rates for student parents that used the Guon Center compared to those that did not. In the 2020 spring semester, which was disrupted by the pandemic, half the student parents with children in the center made the Dean’s List. Without CCAMPIS funding, the Guon Center would not be able to serve nearly as many student parents as it does now.
DES CRIP TION
Created in the Higher Education Amendments of 1998, the CCAMPIS program supports the participation of low-income parents in postsecondary education through campus-based child care services. Grants are awarded through a competitive process to institutions of higher education that enroll large numbers of Pell Grant recipients. In addition to campus-based child care for infants and toddlers, the program funds parenting classes and before- and after-school care for older children.
F U N DING HIS TORY (in millions)
FY 2019 FY 2020 FY 2021 FY 2022 PRESIDENT’s REQUEST $50.00 $53.00 $55.00 $95.00
IMPACT OF PR ES IDENT’S BU DGE T
The president’s FY 22 budget includes $95 million for CCAMPIS, a 72.7 percent increase over the current funding level. This amount would support 372 continuation awards and 240 new awards.
PROGR A M N EED
While there are hundreds of campus child care centers in the United States, they are only able to meet a small percentage of the demand for services. Expanding access to on-campus child care helps increase access to higher education for low-income students, and it increases retention, especially for single parents. Without an increased investment, thousands of low-income students across the country will continue to lack access to quality child care, and this is often cited as the reason why students with young children withdraw prior to completing a certificate or degree.
CEF’s FY 2022 BUDGET ANALYSIS 164
Due to the pandemic, a lack of child care options was seen as an exacerbating factor in significant enrollment declines at community colleges in the fall 2020 semester. In a typical economic downturn, college enrollments generally increase as workers return to school to upgrade their skills and obtain new jobs. As millions of people begin to reenter the workforce after the pandemic, expanding child care will be essential to allow retraining and reemployment.
The CCAMPIS program needs an increasing and stable investment to demonstrate a commitment to this program and help institutions plan child care centers and parent support services.
CONTACT IN FO
James Hermes American Association of Community Colleges(202) 728-0200 | [email protected]
CEF’s FY 2022 BUDGET ANALYSIS 165
Teacher Quality Partnership GrantsTitle II, Part A, Higher Education Act
Taught by graduates of the Newark-Montclair Urban Teacher Residency (NJ), Deliris Diaz was a standout in science and valedictorian at East Side High School. She is now a recent graduate of the same program and teaching at East Side. The Newark-Montclair Urban Teacher Residency is an innovative program partnering Montclair State University and the Newark Public Schools supported by a Teacher Quality Partnership Grant to recruit and prepare teachers to succeed in the profession. Diaz switched careers from
STEM research, earning her Master of Arts in Teaching in 2019 as part of the residency program.
“Although my students see me as a very young teacher, they often see me as a very relatable teacher, someone who understands and someone who’s always pushing them to be the very best. Just to show them that physics is not so intimidating, that if you just give it a chance, you are more capable than what you let yourself be.” — Deliris Diaz (M.A. ’19)
DES CRIP TION
The Teacher Quality Partnership (TQP) program funds competitive grants to partnerships of higher education institutions, high-need local school districts, and other stakeholders to transform and strengthen educator preparation. At the heart of the TQP program is a focus on deepening the partnership between preK-12 and higher education as the two sectors collaborate to prepare profession-ready educators in high-need fields. The program extends clinical practice and includes the option of a residency for master’s level programs, as well as a stronger integration of education curricula with the arts and sciences. In addition, TQP grantees develop metrics to evaluate the effectiveness of program graduates once they enter the classroom. Graduates of TQP residency programs agree to serve in a high-need school for three years, ensuring teachers are prepared to serve where they are needed most.
F U N DING HIS TORY (in millions)
FY 2019 FY 2020 FY 2021 FY 2022 PRESIDENT’s REQUEST $43.09 $50.09 $52.09 $132.09
IM PACT OF PR ES IDENT’S BU DGE T
The president’s budget provides $80 million (153.6 percent) increase in discretionary funding and proposes $280 million in new manadtory funding for the TQP program. Increased funding for Teacher Quality Partnership Grants will help ensure that additional institutions of higher education received funding through the program to train the next generation of profession-ready educators. The FY 2022 funding level would support approximately $91.3 million in new awards under the program.
CEF VIDEO
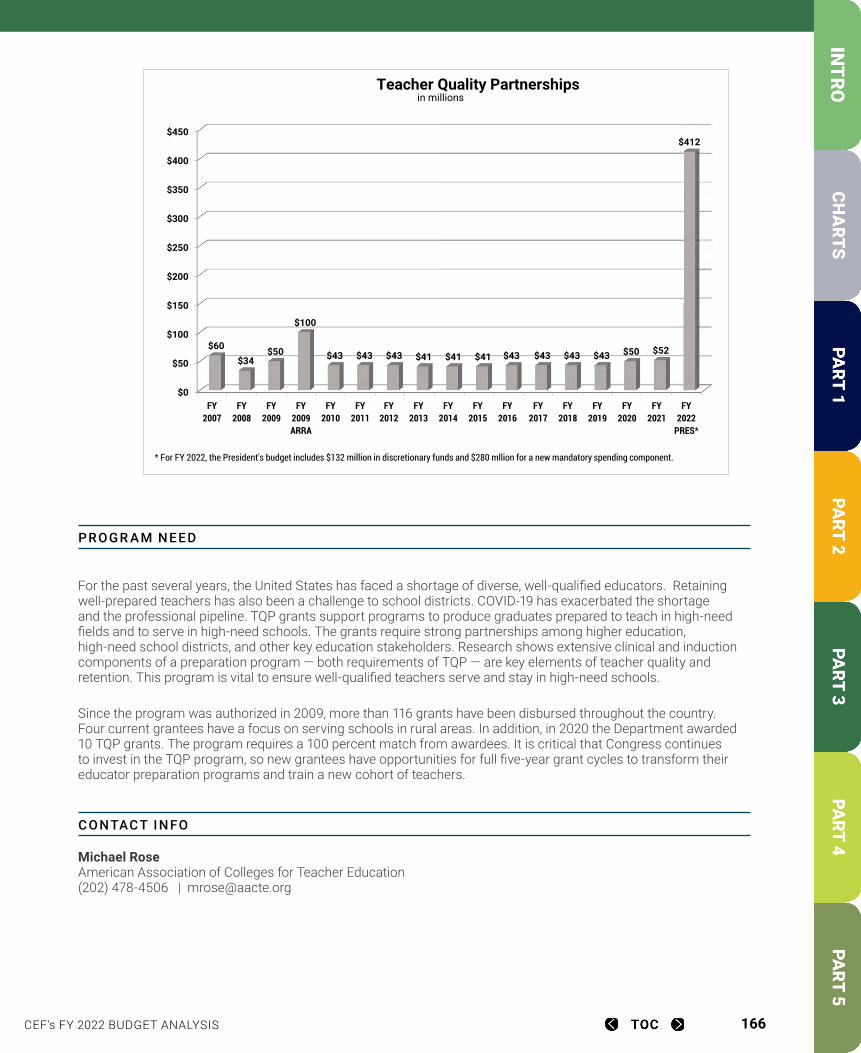
CEF’s FY 2022 BUDGET ANALYSIS 166
PROGR A M N EED
For the past several years, the United States has faced a shortage of diverse, well-qualified educators. Retaining well-prepared teachers has also been a challenge to school districts. COVID-19 has exacerbated the shortage and the professional pipeline. TQP grants support programs to produce graduates prepared to teach in high-need fields and to serve in high-need schools. The grants require strong partnerships among higher education, high-need school districts, and other key education stakeholders. Research shows extensive clinical and induction components of a preparation program — both requirements of TQP — are key elements of teacher quality and retention. This program is vital to ensure well-qualified teachers serve and stay in high-need schools.
Since the program was authorized in 2009, more than 116 grants have been disbursed throughout the country. Four current grantees have a focus on serving schools in rural areas. In addition, in 2020 the Department awarded 10 TQP grants. The program requires a 100 percent match from awardees. It is critical that Congress continues to invest in the TQP program, so new grantees have opportunities for full five-year grant cycles to transform their educator preparation programs and train a new cohort of teachers.
CONTACT IN FO
Michael Rose American Association of Colleges for Teacher Education (202) 478-4506 | [email protected]
FY 2007 FY 2008 FY 2009 FY 2009 ARFY 2010 FY 2011 FY 2012 FY 2013 FY 2014 FY 2015 FY 2016 FY 2017 FY 2018 FY 2019 FY 2020 FY 2021 FY 2022 PRES*60$ 34$ 50$ 100$ 43$ 43$ 43$ 41$ 41$ 41$ $43 43$ 43$ 43$ 50$ 52$ 412$
$0
$50
$100
$150
$200
$250
$300
$350
$400
$450
FY2007
FY2008
FY2009
FY2009ARRA
FY2010
FY2011
FY2012
FY2013
FY2014
FY2015
FY2016
FY2017
FY2018
FY2019
FY2020
FY2021
FY2022
PRES*
$60 $34
$50
$100
$43 $43 $43 $41 $41 $41 $43 $43 $43 $43 $50 $52
$412
Teacher Quality Partnershipsin millions
* For FY 2022, the President's budget includes $132 million in discretionary funds and $280 mllion for a new mandatory spending component.
CEF’s FY 2022 BUDGET ANALYSIS 167
Student Aid AdministrationTitle I, Part D, and Title IV, Part D, Higher Education Act 2020 was a challenging year for millions of college students — but for Nick Schmitt, a first-generation college student at Evergreen State College in Washington, the economic hardships of the pandemic could have derailed all the progress they had made toward getting a degree. Nick had already put a lot on the line to pay for college, although getting a Pell Grant and state aid helped. Even before the pandemic, Nick occasionally struggled to pay for essentials like course materials or food. When their college went remote in the spring, Nick lost their work-study job as a lab science aide on campus, which they relied on to cover rent and daily costs. With an emergency grant from their college and the CARES Act’s Higher Education Emergency Relief Fund, Nick was able to pay the bills and commit to staying enrolled for the fall term of their senior year. Now, with that coveted degree finally within reach, Nick is beginning to explore the options for repayment after the grace period ends six months after graduation — or after the federal student loan repayment freeze is lifted. The Student Aid Administration is not only responsible for backing loans to students like Nick, but also for getting students the information they need to make informed repayment decisions and offering guidance for institutions as they navigate the financial implications of the pandemic.
DES CRIP TION
Student Aid Administration funds are used to administer the federal student financial assistance programs authorized under Title IV of the Higher Education Act. Federal Student Aid (FSA), a part of the Department of Education, is the largest provider of student financial aid for postsecondary students in the nation. In FY 2020, FSA processed just over 17.8 million student financial aid applications, dispersing more than $115.6 billion in federal grants, loans, and work-study funds to help millions of students pursue postsecondary education. FSA administers a loan portfolio of more than $1.5 trillion and protects students and taxpayers by ensuring federal resources are used appropriately.
Student Aid Administration funds are used to educate students and their families about financial aid and to process financial aid applications, originate, disburse, and service student loans, and collect defaulted loans. Administration funds ensure federal resources are used appropriately by schools, guaranty agencies, and students. Funds are also used to improve services for students, parents, schools, and other program participants, reduce student aid administration costs, increase the efficiency of program operations, and oversee student aid processing and delivery systems. These dollars also underwrite functions such as enforcement, data collection, analysis, and public dissemination of information.
F U N DING HIS TORY (in millions)
FY 2019 FY 2020 FY 2021 FY 2022 PRESIDENT’s REQUEST $1,678.94 $1,768.94 $1,853.94 $2,053.94
CEF’s FY 2022 BUDGET ANALYSIS 168
IM PACT OF PR ES IDENT’S BU DGE T
The president’s FY 2022 budget includes more than $2.05 billion for the Student Aid Administration and a $200 million (10.8 percent) increase compared to the final FY 2021 appropriation. According to the president’s budget, these funds are specifically needed to manage the student loan portfolio, particularly restarting repayment after federal forbearance ends. In addition, the increase will support continued IT security improvements to ensure the integrity of the Department of Education’s systems and protect the data of more than 75 million parents and students against potential breaches.
PROGR A M N EED
The president’s budget supports many of the priorities of the previous Department of Education to improve student borrowers’ experiences with Federal Student Aid. In addition to a more streamlined and mobile-friendly StudentAid.gov experience, FSA has indicated they want to improve borrower education, customer service, and access to income-driven repayment programs and Public Service Loan Forgiveness. The Department of Education also will continue efforts to implement FAFSA simplification after the FUTURE Act (December 2019) and the Consolidated Appropriations Act for 2021 (December 2020).
The Student Aid Administration needs stable, annually increased funding so it can successfully implement these new initiatives, on top of its core mission of dispersing Title IV aid. Historically, negotiations to set biannual spending caps and freezes in Department of Education funding complicated the Student Aid Administration and other offices’ work and timelines. Increased and stable investment is needed to educate students and families better about the process for obtaining and repaying loans, to ensure enforcement and oversight of Title IV programs, and to improve the customer service experience.
CONTACT IN FO
Kaitlyn Vitez American Association of University Professors (908) 894-0642 | [email protected]
CEF’s FY 2022 BUDGET ANALYSIS 169
Federally Funded Research The COVID-19 pandemic has upended life as we know it. Thankfully researchers at the University of Southern California (USC) have developed a new method to counter emergent mutations and accelerate vaccine development by using artificial intelligence (AI). When applied to COVID-19, the research team at the USC Viterbi School of Engineering can use computer modeling to quickly identify characteristics of the virus, spike proteins, and receptors from a bioinformation database containing virus-related information from scientists around the world. Once recognized, the AI-assisted program will predict potential solutions that would work against the virus and begin constructing a multi-epitope vaccine, which can attack the spike proteins that the coronavirus uses to penetrate a host cell. Vaccines target the region, or epitope, of the contagion to disrupt the spike protein, neutralizing the ability of the virus to replicate. Moreover, the engineers can construct a new multi-epitope vaccine for a new virus and validate its quality within an hour. By contrast, current processes to control the virus require growing the pathogen in the lab, deactivating it, and injecting the virus that caused a disease—a time-consuming process. USC’s AI-assisted method is especially useful during this stage of the pandemic as mutations start to appear and some scientists raise concerns about them minimizing the effectiveness of vaccines. Support for the study comes from the National Science Foundation, the U.S. Army Research Office, Defense Advanced Research Projects Agency (DARPA), and Northrop Grumman.
DES CRIP TION
From the time of our nation’s founding, the federal government has played a critical role in supporting research and scientific discovery. Since World War II, American leaders have agreed we must invest in science and engineering at our universities to keep the country safe, healthy, and globally competitive. The returns on those investments form the basis of our economic and national security and have yielded health and technology advances that far outpace those of any other nation. Federal agencies that fund university research include, among others, the National Institutes of Health (NIH); the National Science Foundation (NSF); the Departments of Defense, Energy, Commerce, Agriculture, Interior, Homeland Security, Transportation, and Education; the National Aeronautics and Space Administration; the National Oceanic and Atmospheric Administration; and, the National Endowment for the Humanities. In addition to spurring new discoveries, these research investments are central to educating students, playing a significant role in preparing the American workforce in all sectors of the economy.
F U N DING HIS TORY (in billions)
FY 2019 FY 2020 FY 2021 FY 2022 PRESIDENT’s REQUEST $82.28 $90.23 $87.83 $98.51
CEF’s FY 2022 BUDGET ANALYSIS 170
IM PACT OF PR ES IDENT’S BU DGE T
The president’s FY 2022 budget would increase basic and applied research accounts across the federal research landscape by almost $11 billion relative to FY 2021. The Department of Energy would receive $1 billion to create a new Advanced Research Projects Agency for Climate and reinvest in the existing Advanced Research Projects Agency-Energy with an additional $500 million. The NSF budget would grow 20 percent above FY 2021 for a total of $10.2 billion, while the NIH budget would also receive an increase of $9 billion for a total of $51.9 billion. Despite increases to the overall Department of Defense budget, basic (6.1) and applied (6.2) research programs would be cut, a decrease of 13.07 and 14.47 percent respectively. The Agriculture and Food Research Initiative (AFRI), the Department of Agriculture’s flagship competitive research grant program, would receive $700 million, an increase of $265 million above the FY 2021 level.
PROGR A M N EED
A decade of low discretionary spending caps has had a negative effect on federal research funding in the aggregate, and funding levels have not kept up with growing needs. At the same time research has stalled or been shut down due to the COVID-19 pandemic and other countries have been increasing their investments, the deterioration of federal funding for research is creating an innovation deficit for the United States. This puts the nation at a competitive disadvantage and endangers our role as a world innovation leader. As an investment with a proven track record of strong returns, federal funding for research is closely tied to our nation’s economic health. Insufficiently funding this investment will have deleterious impacts on the nation’s economic recovery efforts and future federal budgets, constricting funding for all programs into the foreseeable future. We must close the innovation deficit with robust federal support for research. For FY 2022, higher education groups support an additional $3 billion for NIH, at least $10 billion total for NSF, $675 million for AFRI, and funding at least above inflationary growth for all agencies.
CONTACT IN FO
Flannery Geoghegan University of Southern California(202) 824-5874 | [email protected]
CEF’s FY 2022 BUDGET ANALYSIS 171
Segal AmeriCorps Education AwardNational and Community Service Act ”After graduating from college, I found myself having to choose between pursuing a well-paid job or a commitment to service through TFA. The former would allow me to pay off student loans and provide financial support to my family at home. The latter—a chance to pay it forward and serve those who grew up in similar circumstances. Many college grads, especially those of color, find themselves in the same position—help those like them or help yourself. The Segal AmeriCorps Education Award helps encourage students to choose service over self. The AmeriCorps award was pivotal, as it allowed me to pay off a reasonable sum of my college debt while allowing me to serve my students.”
—Julian Torres 2010 Teach For America Dallas-Fort Worth Corps Member
DES CRIP TION
The Segal AmeriCorps Education Award is a benefit given to participants who complete service in an approved AmeriCorps program — AmeriCorps VISTA, AmeriCorps NCCC, or AmeriCorps State and National. Teach For America is a proud member of the AmeriCorps national service network. Individuals teaching in low-income areas who work to expand educational opportunity in ways that can change children’s lives are eligible for Segal AmeriCorps Education Awards. AmeriCorps teaching programs recruit diverse groups of leaders with records of achievement and provide intensive training, support, and career development to help these exceptional people increase their impact in low-income communities.
The maximum amount of a full-time Segal AmeriCorps Education Award ($6,345 in FY 2021) is equivalent to the maximum amount of the Pell Grant for the year in which the national service position was approved. The value of the award is prorated based on the length of service. Education awards can be used toward repayment of qualified student loans and/or payment of higher education expenses. Many Teach For America participants use their awards to obtain teaching certification. AmeriCorps also provides a loan forbearance benefit, allowing members to postpone regular monthly student loan payments during their service. Additionally, AmeriCorps will pay up to 100 percent of the interest accrued on qualified student loans after each successful year served as an AmeriCorps member.
F U N DING HIS TORY (in millions)
FY 2019 FY 2020 FY 2021 FY 2022 PRESIDENT’s REQUEST $1,082.96 $1,104.30 $1,121.10 $1,210.27
IM PACT OF PR ES IDENT’S BU DGE T
The president’s FY 2022 budget would provide AmeriCorps with $1.21 billion, an increase of $89.2 million over current-year funding. This increase will support AmeriCorps and its state and local partners in service to expand engagement and opportunities for volunteerism. The president’s budget would fund 62,000 total AmeriCorps slots.

CEF’s FY 2022 BUDGET ANALYSIS 172
PROGR A M N EED
Record numbers of Americans are stepping forward to serve. At the same time, more communities are looking for innovative ways to address local challenges, including placing effective teachers in our lowest performing schools. This reality makes a strong investment in national service even more important. A recent Columbia University economics study found for every dollar invested in national service, the returns to society equal $3.95 in higher earnings, increased output, and other community-wide benefits. Continuing funding for the Corporation for National and Community Service and providing Segal AmeriCorps Education Awards will engage millions of Americans in service and especially help teachers in low-income areas.
CONTACT IN FO
Kelly Broughan Teach For America(202) 650-7872 | [email protected]

CEF’s FY 2022 BUDGET ANALYSIS 173
PART 4: Forging SuccessEducational Research, Statistics and Improvement
CEF’s FY 2022 BUDGET ANALYSIS 174
The Institute of Education SciencesTitle I, Education Sciences Reform Act Each of the centers in the Institute of Education Sciences (IES) work together to support research, report data, and produce evidence-based resources to help improve educational outcomes for all students. The COVID-19 pandemic created a need for data and tools to support learning and instruction as schools pivoted to remote learning last March. Across its programs, IES has supported several efforts to help inform decisions and to gather data to understand the impact the COVID-19 response has had on education. The National Center for Research on Education Access and Choice, based at Tulane University, produced reports analyzing how schools implemented COVID-19 mitigation strategies and providing guidance on the level of community spread that would enable school reopening. The What Works Clearinghouse produced a synthesis of crowd-sourced studies on distance learning and technology platforms to highlight evidence-based interventions. Several of the Regional Educational Laboratories held webinars for teachers, administrators, and policymakers with resources and information to guide remote instruction and decision making on school reopening.
DES CRIP TION
The Institute of Education Sciences (IES) is a semi-independent agency within the Department of Education that houses major federal education research programs, including development, statistics, assessments, and program evaluation. The IES Director oversees the operation of the Institute through four national centers: the National Center for Education Research, the National Center for Education Statistics, the National Center for Education Evaluation and Regional Assistance, and the National Center for Special Education Research. IES supports activities across all four centers to establish an evidence base for education policy and practice and to communicate research-based findings and disseminate resources to policymakers, school and district leaders, and educators.
. F U N DING HIS TORY (in millions)
FY 2019 FY 2020 FY 2021 FY 2022 PRESIDENT’s REQUEST $615.46 $623.46 $642.46 $737.47
. IM PACT OF PR ES IDENT’S BU DGE T
The FY 2022 budget for IES overall represents a 14.8 percent increase over FY 2021. This critical funding reflects the continued need to understand the impacts of the COVID-19 pandemic on academic outcomes and the need for social and emotional supports. In addition, the additional funds acknowledge the need to address longstanding, growing gaps in achievement, as observed in declines in scores among the lowest performing students on the 2019 National Assessment of Educational Progress reading, math, and science tests. IES has introduced new research programs, such as systemic replication and transformative research, with the potential to inform innovative practice. The amount included in the Administration’s FY 2022 budget would provide the flexibility for IES to expand these programs while also maintaining its core research, statistics, and dissemination programs.Funding for IES is particularly important in FY 2022. The investment in IES on evidence-based resources and strategies helps school districts make smart decisions that will positively impact student and school performance. IES also will have additional responsibility for evaluating programs for learning agendas developed in the implementation of the Foundations for Evidence-based Policymaking Act.
CEF’s FY 2022 BUDGET ANALYSIS 175
PROGR A M N EED
The program need for research and evidence to improve education has always been substantial, but the pandemic has made even clearer the need to boost investment for IES. In addition to resources needed to address learning disruption and learning recovery, additional funding can supplement research and data collection that were underway in the field and affected by COVID-19 mitigation strategies. The shift to remote instruction interrupted ongoing research of in-person educational interventions. Although many IES grantees pivoted their work to account for remote and hybrid instruction, other grants have been on pause as researchers wait for schools to return to in-person instruction to be able to continue their work. The response to the pandemic has also resulted in reduced survey response rates and delays in data collection, such as the next iteration of the Early Childhood Longitudinal Study, as schools prioritized the imminent challenges they faced to continue instruction as safely as possible.
The Friends of IES coalition, which supports the mission of IES and seeks to ensure adequate funding for the agency, is requesting at least $700 million for IES in FY 2022.
CONTACT IN FO
Christy Talbot American Educational Research Association(202) 238-3200 | [email protected]
CEF’s FY 2022 BUDGET ANALYSIS 176
Regional Educational Laboratories (RELs)Title I, Education Sciences Reform Act From 2017 through 2019, REL Northwest worked with The Professional Educator Standards Board to better understand the critical teacher shortage in the state of Washington and provide evidence-based next steps for reducing those shortages and increasing teacher workforce diversity. Washington was particularly interested in “grow-your-own” teacher policies that seek to identify and support current paraeducators and teachers with limited certification interested in pursuing full certification. That interest led them to ask REL Northwest to analyze the responses to a survey of all 1,834 limited certificated teachers in the state. The study found more than two-thirds of limited certificated teacher respondents were interested in pursuing full certification, especially in hard-to-fill subject areas. The study also found a larger percentage of teachers of color than white teachers wanted to become fully certificated, but faced several barriers to doing so, including financial considerations, time, and the certification process itself. REL Northwest’s report provided research-based considerations for state and local leaders to recruit and retain a larger, more diverse teaching force. Leveraging the research findings from REL Northwest, the Washington state legislature made modifications to certain prerequisites for admission to teacher preparation programs to minimize a potential barrier to entry for diverse teacher candidates.
DES CRIP TION
The Regional Educational Laboratory program (REL) is comprised of a national network of ten regional labs that help states and districts systematically use data and research to improve student outcomes and support their school improvement efforts. Created in 1966 and currently authorized under the Education Sciences Reform Act of 2002, RELs carry out three broad types of work: applied research, dissemination of findings from rigorous research, and technical support for use of research. The current REL contracts were awarded in FY 2017 and include an explicit focus on supporting sustained, ongoing partnerships with stakeholders at the state and district levels. Much of the proposed work is conducted through REL research-practitioner partnerships where researchers and educators work together on a problem and generate solutions that improve student outcomes. During the pandemic, RELs have provided evidence-based resources and guidance to support teaching and learning for states, school districts, educators, families, and caregivers.
. F U N DING HIS TORY (in millions)
FY 2019 FY 2020 FY 2021 FY 2022 PRESIDENT’s REQUEST $55.42 $56.02 $57.02 $57.02
CEF’s FY 2022 BUDGET ANALYSIS 177
. IM PACT OF PR ES IDENT’S BU DGE T
The president’s FY 2022 budget represents a funding freeze for the REL program. RELs carry out three broad types of work: applied research, dissemination of findings from rigorous research, and technical support for use of research. During the pandemic, RELs pivoted quickly from current work to provide research-based resources on remote learning and other information to address the myriad implications and challenges facing students and educators without access to in-person learning. At this crucial time, a funding freeze for federal research and technical assistance programs means states and districts will not have needed support to identify and implement evidence-based policies and practices in response to the pandemic, as required under the American Rescue Plan. Additional funding is also required to help build capacity for system-level change to address critical issues facing states and districts, such as diversifying the teaching workforce and supporting continuous improvement.
PROGR A M N EED
The need to focus on what works for students, educators and school leaders using research and evidence-based practices has always been critical. As the education system seeks to recover and meet the profound learning and social and emotional needs of students due to the pandemic, states, districts, and schools cannot confront these challenges without research and evidence-based interventions. RELs can play an important role in testing, evaluating, and widely disseminating teaching and learning interventions to address learning disruption and help meet the social and emotional learning needs of students in remote, hybrid, and in-person settings now and in the future.
CONTACT IN FO
Jacki Ball Knowledge Alliance (202) 770-2218 | [email protected]
CEF’s FY 2022 BUDGET ANALYSIS 178
Education Research, Development, and DisseminationTitle I, Education Sciences Reform Act The National Center for Rural Education Research Networks (NCRERN), based at Harvard University and supported with IES funding, is providing guidance on evidence-based practices and continuous improvement to rural school districts in New York and Ohio. During the COVID-19 pandemic, NCRERN researchers conducted interviews with rural school district officials on their concerns and response related to closing schools. Rural district officials highlighted creative ways they distributed food, as well as concerns regarding broadband access and student safety. In addition, NCRERN worked with rural districts to inform their practices for taking attendance during remote instruction, recommending tracking exposure to content and assignment submission.
DES CRIP TION
The Research, Development, and Dissemination appropriation provides support for IES core education research topic areas, including reading and writing, early learning, mathematics and science education, teacher effectiveness and pedagogy, and education systems and policies. It includes the National Research and Development Centers that address specific topics such as early childhood development and learning, testing and assessment, and reading comprehension. These funds also support the What Works Clearinghouse, the Education Research Information Clearinghouse, and impact studies. Professional development and fellowship grants help build the capacity for early career researchers to conduct rigorous research.
. F U N DING HIS TORY (in millions)
FY 2019 FY 2020 FY 2021 FY 2022 PRESIDENT’s REQUEST $192.70 $195.88 $197.88 $267.88
. IM PACT OF PR ES IDENT’S BU DGE T
The Administration’s FY 2022 request would provide a generous 35.4 percent increase to Research, Development, and Dissemination (RDD). The $268 million in the budget would support additional research and training grants from the National Center for Education Research (NCER). The budget also would provide continued funding for dissemination activities at the National Center for Educational Evaluation and Technical Assistance (NCEE). The increase for RDD would allow greater flexibility for NCER to fund promising research in core areas, support more research to address longstanding academic gaps exacerbated by the pandemic, and expand innovative research programs that will further evidence-based practice.
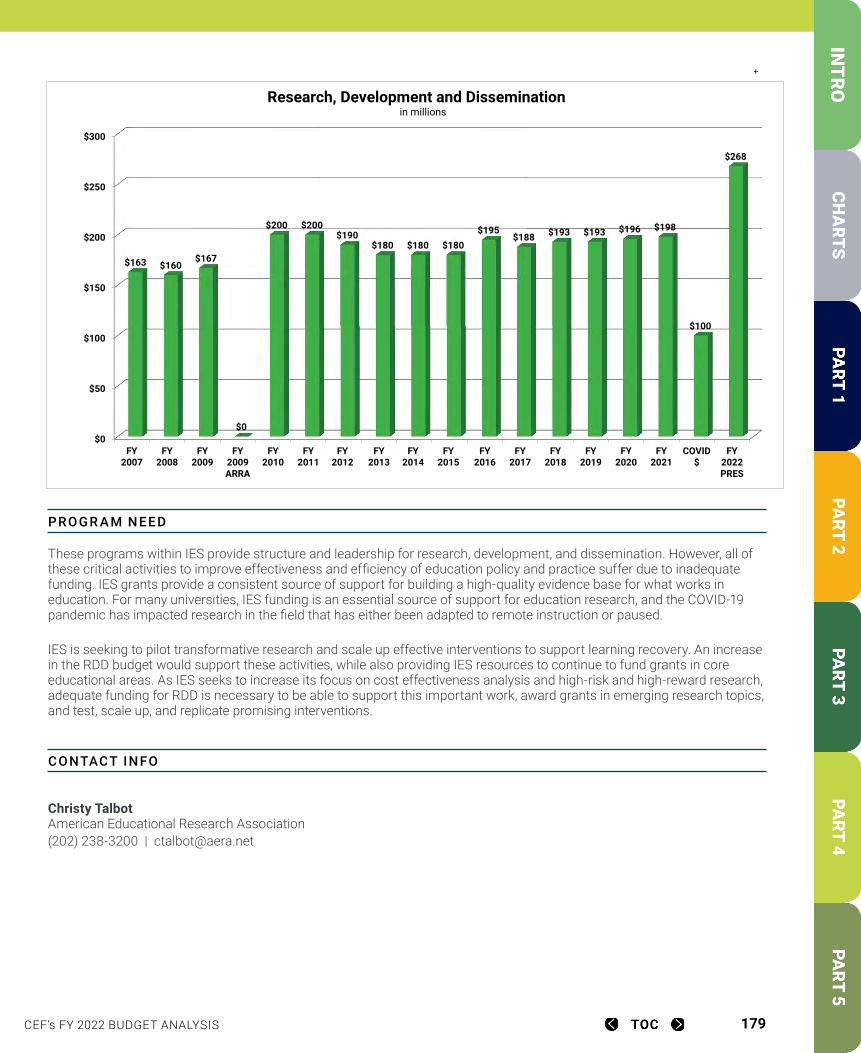
CEF’s FY 2022 BUDGET ANALYSIS 179
PROGR A M N EED
These programs within IES provide structure and leadership for research, development, and dissemination. However, all of these critical activities to improve effectiveness and efficiency of education policy and practice suffer due to inadequate funding. IES grants provide a consistent source of support for building a high-quality evidence base for what works in education. For many universities, IES funding is an essential source of support for education research, and the COVID-19 pandemic has impacted research in the field that has either been adapted to remote instruction or paused.
IES is seeking to pilot transformative research and scale up effective interventions to support learning recovery. An increase in the RDD budget would support these activities, while also providing IES resources to continue to fund grants in core educational areas. As IES seeks to increase its focus on cost effectiveness analysis and high-risk and high-reward research, adequate funding for RDD is necessary to be able to support this important work, award grants in emerging research topics, and test, scale up, and replicate promising interventions.
CONTACT IN FO
Christy Talbot American Educational Research Association(202) 238-3200 | [email protected]
FY 2007 FY 2008 FY 2009 FY 2009 ARFY 2010 FY 2011 FY 2012 FY 2013 FY 2014 FY 2015 FY 2016 FY 2017 FY 2018 FY 2019 FY 2020 FY 2021 COVID $ FY 2022 PRES163$ 160$ 167$ -$ 200$ 200$ 190$ 180$ 180$ 180$ 195$ 188$ 193$ 193$ 196$ 198$ 100$ 268$
+
$0
$50
$100
$150
$200
$250
$300
FY2007
FY2008
FY2009
FY2009ARRA
FY2010
FY2011
FY2012
FY2013
FY2014
FY2015
FY2016
FY2017
FY2018
FY2019
FY2020
FY2021
COVID$
FY2022PRES
$163 $160$167
$0
$200 $200$190
$180 $180 $180$195
$188 $193 $193 $196 $198
$100
$268
Research, Development and Disseminationin millions
CEF’s FY 2022 BUDGET ANALYSIS 180
National Center for Education StatisticsTitle I, Education Sciences Reform Act The National Postsecondary Student Aid Study (NPSAS) includes data on the ways that postsecondary students finance their education. The most recent data collection of this survey, NPSAS:20, began in the midst of the COVID-19 pandemic. Shortly after postsecondary institutions pivoted to remote instruction, the National Center for Education Statistics added questions to the survey while in the field to gather information on changes to student and family income and financial situation, receipt of refunds for room and board, tuition, study abroad programs, and technology and adaptation to distance learning. These data indicators on the NPSAS:20 will be important for policymakers and institutions of higher education to inform future institutional response and understand potential long-term impacts of COVID-19 on student financial aid and postsecondary outcomes.
DES CRIP TION
The National Center for Education Statistics (NCES) collects and synthesizes statistics for studies on a wide range of education topics such as teacher shortages, comparisons of student achievement between America and other nations, high school dropout rates, preparation for higher education, and college costs. With this information, NCES provides objective statistical reports on the condition of education in the United States. These data and reports are invaluable to policymakers, practitioners, analysts, and researchers in appraising a range of education topics.
. F U N DING HIS TORY (in millions)
FY 2019 FY 2020 FY 2021 FY 2022 PRESIDENT’s REQUEST $109.50 $110.50 $111.50 $111.50
. IM PACT OF PR ES IDENT’S BU DGE T
The president’s budget would support the collection, analysis, and dissemination of education-related statistics in response to legislative requirements and the needs of data providers, data users, and education policy analysts. Education statistics collected by NCES enable policymakers and practitioners to identify challenges and policy priorities in education, develop new systems, and evaluate and refine current systems. Under the frozen funding proposed for FY 2022, NCES would continue to be constrained in collecting, disaggregating, and disseminating data on important education indicators, such as information on the educator workforce and school crime and safety.
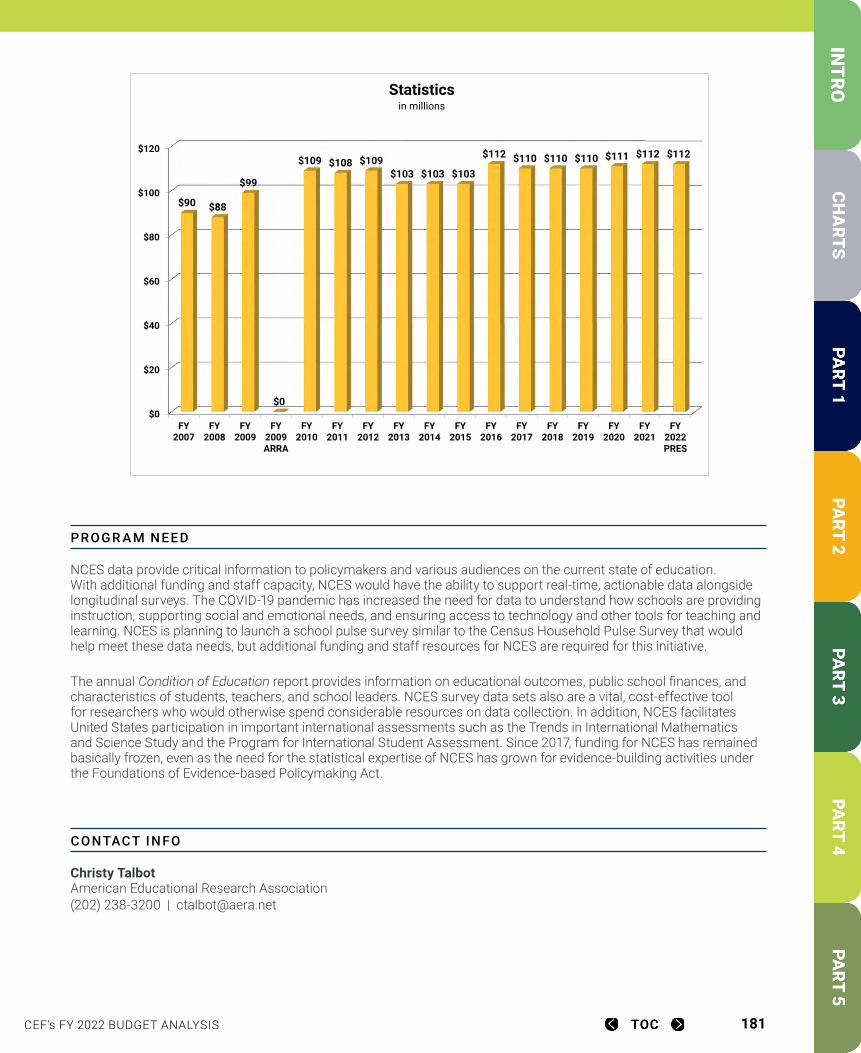
CEF’s FY 2022 BUDGET ANALYSIS 181
PROGR A M N EED
NCES data provide critical information to policymakers and various audiences on the current state of education. With additional funding and staff capacity, NCES would have the ability to support real-time, actionable data alongside longitudinal surveys. The COVID-19 pandemic has increased the need for data to understand how schools are providing instruction, supporting social and emotional needs, and ensuring access to technology and other tools for teaching and learning. NCES is planning to launch a school pulse survey similar to the Census Household Pulse Survey that would help meet these data needs, but additional funding and staff resources for NCES are required for this initiative.
The annual Condition of Education report provides information on educational outcomes, public school finances, and characteristics of students, teachers, and school leaders. NCES survey data sets also are a vital, cost-effective tool for researchers who would otherwise spend considerable resources on data collection. In addition, NCES facilitates United States participation in important international assessments such as the Trends in International Mathematics and Science Study and the Program for International Student Assessment. Since 2017, funding for NCES has remained basically frozen, even as the need for the statistical expertise of NCES has grown for evidence-building activities under the Foundations of Evidence-based Policymaking Act.
CONTACT IN FO
Christy Talbot American Educational Research Association(202) 238-3200 | [email protected]
FY 2007 FY 2008 FY 2009 FY 2009 ARFY 2010 FY 2011 FY 2012 FY 2013 FY 2014 FY 2015 FY 2016 FY 2017 FY 2018 FY 2019 FY 2020 FY 2021 FY 2022 PRES90 88 99 0 109 108 109 103 103 103 112 110 110 110 111 112 112
$0
$20
$40
$60
$80
$100
$120
FY2007
FY2008
FY2009
FY2009ARRA
FY2010
FY2011
FY2012
FY2013
FY2014
FY2015
FY2016
FY2017
FY2018
FY2019
FY2020
FY2021
FY2022PRES
$90 $88
$99
$0
$109 $108 $109$103 $103 $103
$112 $110 $110 $110 $111 $112 $112
Statisticsin millions
CEF’s FY 2022 BUDGET ANALYSIS 182
National Assessment of Educational ProgressTitle I, Education Sciences Reform Act The Long-Term Trend (LTT) assessment, part of the suite of the National Assessment of Educational Progress, began in the 1970s to measure outcomes and track achievement trends over time for students aged 9, 13, and 17. Until 2012, these assessments were typically administered every 4 years; however, budget constraints resulted in the delay of the 2016 assessment to 2020. The 9-year-old and 13-year-old LTT assessments were administered in the beginning of 2020 and the fall of 2019, respectively. However, the 17-year-old LTT assessment, scheduled to begin in March 2020, was postponed as schools transitioned to remote instruction to mitigate the spread of COVID-19. As schools continued to face challenges in the 2020-21 school year to provide in-person instruction due to COVID-19 community spread, the National Assessment Governing Board agreed to delay the 17-year-old LTT to 2022. The postponement of this assessment, along with several mandatory and voluntary assessments that had been scheduled for 2021, will impact the schedule of future assessments in science, civics, and U.S. history.
DES CRIP TION
The National Assessment of Educational Progress (NAEP) is the only representative and continuing assessment of American students’ achievement. NAEP, the “nation’s report card,” describes the educational achievement of students at grades 4, 8, and 12, and provides information about special subpopulations (e.g., by race/ethnicity, students in urban school districts). It offers an objective national measurement for appraising state-developed achievement standards that guide the understanding of state and district educational outcomes on a comparable scale. NAEP is also the source of unbiased student performance data for policymakers, educators, parents, and the public.
. F U N DING HIS TORY (in millions)
FY 2019 FY 2020 FY 2021 FY 2022 PRESIDENT’s REQUEST $151.00 $153.00 $165.00 $180.00
. IM PACT OF PR ES IDENT’S BU DGE T
The Administration’s FY 2022 budget includes $180 million for the National Assessment of Educational Progress, an increase of $15 million over FY 2021. The additional funding in the request would address increases in costs for developing and administering digital-based assessments. This funding level will enable IES to continue to administer the 4th and 8th grade assessments in math and reading every two years, as required under the Every Student Succeeds Act (ESSA). In addition, the increased funding for NAEP would provide the capacity for the National Center for Education Statistics to conduct research activities to inform the development of future assessments.
CEF’s FY 2022 BUDGET ANALYSIS 183
PROGR A M N EED
NAEP plays a critical role in benchmarking national education progress, including for the 27 large districts that participate in the Trial Urban District Assessment. Since most states and districts use their own unique assessments, such a benchmark is essential. NAEP is also an important resource for observing long-term trends in student achievement.
The varying conditions of in-person instruction and COVID-19 community spread led to the postponement of the scheduled 4th and 8th grade reading and math assessments to 2022. However, additional funding for NAEP is critical for not just test administration, but also for ongoing planning and activities that inform the reporting of results. As one example, the mechanism for the NAEP school background questionnaires is being used for the 2021 NAEP School Survey. The survey will provide information on the status of in-person instruction, disaggregated data on attendance and enrollment by instructional mode, and the number of hours that students receive asynchronous instruction in remote settings. These indicators, among other survey items on the school, teacher, and student background questionnaires, will also provide context for the 2022 NAEP results. The reporting of these indicators is especially important as policymakers, researchers, and the public seek to understand how the pandemic has impacted learning and instruction.
Even prior to the current needs to support the mandated math and reading assessments, the investment in NAEP had not kept pace with the increased costs for developing and administering assessments. As a result, the National Assessment Governing Board voted in 2019 to cancel future scheduled assessments in arts, economics, foreign languages, and geography. Assessments in those subjects provide important information on equitable access to coursework and student achievement that are not otherwise measured at the national or state level. States have also cited costs as one reason for declining participation in assessments beyond those required by ESSA.
CONTACT IN FO
Christy Talbot American Educational Research Association(202) 238-3200 | [email protected]

CEF’s FY 2022 BUDGET ANALYSIS 184
Research in Special Education / Special Education Studies and EvaluationTitle I, Education Sciences Reform Act The National Center for Special Education Research (NCSER) is one of the largest sources of funding for research and development on special education and related services. NCSER funds research on the full range of issues facing children with disabilities, from early childhood through transition to adulthood, including research into academic progress and social and behavioral outcomes. Through a NCSER grant, Dr. Nancy Jordan, Dean Family Endowed Chair and Professor specializing in Learning Sciences at the University of Delaware, is leading a group of researchers to study fraction sense intervention for middle schoolers. Competence with fractions is crucial for success in math as well as for many careers and vocations. Students who leave 6th grade without fundamental understandings of fractions may experience cascading difficulties that lead to lifelong avoidance of math. There is a great need for validated interventions in this age group to help circumvent a cycle of failure. NCSER funds groundbreaking research, such as Dr. Jordan’s, to implement high quality and evidenced-based interventions to address the academic, social, and behavioral outcomes between students with disabilities and their peers without.
DES CRIP TION
This program supports research to address gaps in scientific knowledge necessary to improve special education and early intervention services and results for infants, toddlers, children, and youth with disabilities. Special Education Studies and Evaluation funds competitive grants to assess the implementation of the Individuals with Disabilities Education Act (IDEA) and the effectiveness of special education and early intervention programs and services.
. F U N DING HIS TORY (in millions)
FY 2019 FY 2020 FY 2021 FY 2022 PRESIDENT’s REQUEST Research in Special Education $56.00 $56.50 $58.50 $58.50Studies and Evaluation $10.82 $10.82 $11.32 $21.32
. IM PACT OF PR ES IDENT’S BU DGE T
The president’s budget includes $59 million in FY 2022 for Research in Special Education, a freeze in funding at the current level, and an additional $10 million for Special Education Studies and Evaluation. The budget’s FY 2022 level precludes additional high-quality, rigorous research on special education and related services and the full range of issues facing children with disabilities, their families, and school personnel. Findings from research funded by these programs help inform interventions, teaching strategies, and other critical factors in educating children with disabilities. Additional funding could support important research focused on finding solutions to special education challenges in school districts across the country, including new and heightened challenges due to COVID-19, such as delivery of services in a virtual environment.
CEF’s FY 2022 BUDGET ANALYSIS 185
PROGR A M N EED
As the nation continues to respond to the COVID-19 pandemic, NCSER is uniquely positioned to fund researchers to test and bring to scale interventions to address learning disruption, particularly for students with disabilities, many of whom have faced significant barriers to educational access during the past year. Additional funding is needed to support data and evidence-based resources to guide teachers, administrators, and policymakers in state and local education agencies on continued COVID-19 response and recovery. Funding for special education research was cut a decade ago, including through sequestration. Since then, it has remained static, preventing the agency from funding a number of high-quality research proposals submitted. NCSER work, for example, has targeted youth with high functioning autism experiencing high levels of anxiety, individuals with Down syndrome learning to read, and students with learning disabilities studying to master math word problems. NCSER provides special educators and administrators research-based resources that support the provision of a free appropriate public education and early intervention services to children and youth with disabilities.
CONTACT IN FO
Lindsay Kubatzky National Center for Learning Disabilities(301) 909-8399 | [email protected]
Kuna Tavalin Council for Exceptional Children(202) 669-2669 | [email protected]

CEF’s FY 2022 BUDGET ANALYSIS 186
Statewide Longitudinal Data SystemsTitle I, Education Sciences Reform Act The Kentucky Center for Statistics (KYSTATS), the state’s longitudinal data system, contains a wide range of data across education and the workforce, including K-12 administrative data, child care and social services data from the Cabinet for Health and Family Services, and workforce training and licensure data. KYSTATS has partnered with the University of Kentucky to analyze data within the SLDS to help answer questions aligned with the KYSTATS Governing Board’s research agenda to inform state policy. The current research agenda includes the evaluation of outcomes and barriers for education and workforce programs and connecting the supply and demand of Kentucky’s future workforce, among other items. This partnership has led to University of Kentucky researchers using KYSTATS to answer questions on postsecondary attainment that are aligned with the state’s goal for 60 percent of the population to obtain a postsecondary degree or certificate by 2030.
DES CRIP TION
The Statewide Longitudinal Data Systems (SLDS) program provides competitive grants to states to assist in design, development, and implementation of longitudinal data systems that can follow individual students throughout their school career while protecting their identifiable information. Systems developed through these grants help improve data quality, promote linkages across school levels, encourage the accurate and timely generation of data for reporting and improving student outcomes, and facilitate research to further improve student achievement.
. F U N DING HIS TORY (in millions)
FY 2019 FY 2020 FY 2021 FY 2022 PRESIDENT’s REQUEST $32.28 $33.00 $33.50 $33.50
. IM PACT OF PR ES IDENT’S BU DGE T
The Statewide Longitudinal Data Systems (SLDS) program provides competitive grants to states to assist in design, development, and implementation of longitudinal data systems that can follow individual students throughout their school career while protecting their identifiable information. Systems developed through these grants help improve data quality, promote linkages across school levels, encourage the accurate and timely generation of data for reporting and improving student outcomes, and facilitate research to further improve student achievement.
CEF’s FY 2022 BUDGET ANALYSIS 187
PROGR A M N EED
States’ work is far from complete on building and utilizing student data systems. Grants provided to states in the FY 2019 competition allow states to support SLDS infrastructure to improve the linking and use of education data in the state, incorporate indicators on school choice, or examine issues of equity, with an additional option to test a school-level poverty measure. The SLDS program funded 28 states in the FY 2019 competition, with an average grant award of $3.3 million. Due to essentially frozen funding for SLDS, the maximum amount for the grants awarded during FY 2020 was lower than in previous competitions.
The program has very successfully enabled the vast majority of states to develop a structure for streamlining federal reporting of K-12 information and linking early childhood, K-12, postsecondary, and workforce data. State demand for this program is well established: during the FY 2019 cycle, 16 SLDS grant applications from states went unfunded. Additional funding support for SLDS can also help states provide essential data that inform evidence-based responses to the COVID-19 pandemic and partner with researchers to examine long-term outcomes of state education policies.
CONTACT IN FO
Christy Talbot American Educational Research Association(202) 238-3200 | [email protected]
CEF’s FY 2022 BUDGET ANALYSIS 188
PART 5: Education-Related ProgramsMeeting the Human Needs of America’s Children
CEF’s FY 2022 BUDGET ANALYSIS 189
Head StartEconomic Opportunity Act of 1964 ”I am very grateful for my extended family at Jeanne Kenney YMCA Head Start program. I have three children, and the pandemic was a difficult time for all of us. However, the teachers and Site Director of Jeanne Kenney YMCA were very supportive and went the extra mile to ensure my family had essentials like breakfast and lunch meals, laundry detergent, cleaning supplies, and PPE. The teachers also helped with enrolling my children into Chicago Public Schools for services. They made the process easy for me. I cannot say enough about the support I received from Jeanne Kenney YMCA Head Start program. I can go into the Site Director’s office anytime to vent and share what is going on in my personal life. Dr. Lawrence is always there to listen to me and never judges me. The JK staff are truly an extended family to me. They counsel me, support my entire family, and make sure my family has household necessities.”
— Courtesy of the Jeanne Kenney YMCA, a branch of the YMCA of Metro Chicago
DES CRIP TION
Administered by the U.S. Department of Health and Human Services, Head Start is a federal grant program created as part of the Economic Opportunity Act of 1964. The program was established to provide comprehensive child development services to 3- to 5-year-old children from economically disadvantaged families to prepare them to succeed in school. Serving over 1 million children annually, Head Start provides a comprehensive set of services including education, nutrition, health care, and social services to promote the healthy social, emotional, and cognitive development of young children and emphasizes parents’ engagement in their child’s learning and development.
Congress established Early Head Start in FY 1995 to serve children from birth to age 3. Early Head Start, serving approximately 163,000 families, promotes healthy prenatal outcomes for pregnant women, enhances the development of young children, and promotes healthy family functioning. In addition, the Migrant and Seasonal Head Start (MSHS) program serves approximately 30,000 children of migrant farmworker families, and the American Indian and Alaskan Native Head Start program serves approximately 23,000 children and their families. In 2014, the Early Head Start-Child Care Partnerships (EHS-CCP) grant program was created to foster partnerships between Early Head Start and child care providers to increase the supply of high-quality early care and learning environments, better align early childhood policies, regulations, resources and quality improvement for all children, and improve family and child well-being.
Head Start programs adhere to rigorous program standards and practices and have a demonstrated record of improving child health, development, and school readiness. For more than 50 years, Head Start has served as a laboratory for innovation – generating best practices and research, promoting parent involvement and professional development, and influencing state and local policies to promote and expand high-quality care and education for young children.
. F U N DING HIS TORY (in millions)*
FY 2019 FY 2020 FY 2021 FY 2022 PRESIDENT’s REQUEST $10,083.47 $10,613.10 $10,748.10 $11,932.10
* Allocations include Early Head Start, Migrant and Seasonal Head Start and Native American and Alaskan Native Head Start, as well as funds for Early Head Start-Child Care Partnerships
.
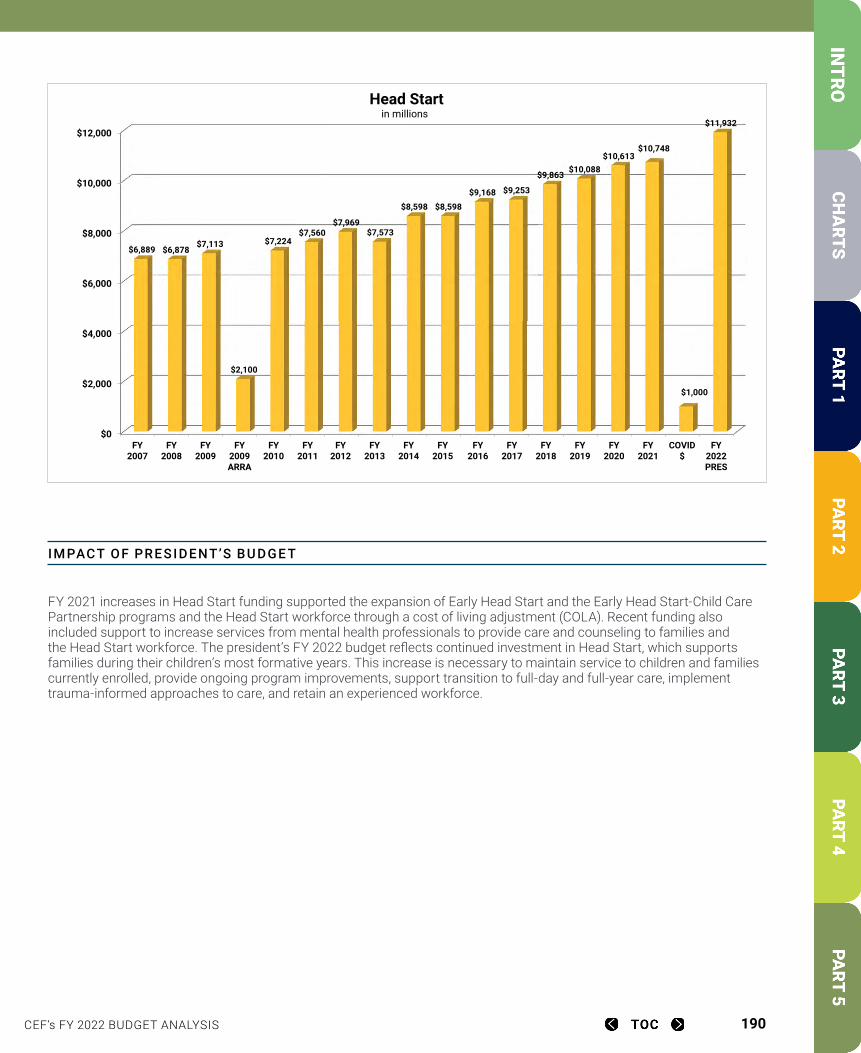
CEF’s FY 2022 BUDGET ANALYSIS 190
IM PACT OF PR ES IDENT’S BU DGE T
FY 2021 increases in Head Start funding supported the expansion of Early Head Start and the Early Head Start-Child Care Partnership programs and the Head Start workforce through a cost of living adjustment (COLA). Recent funding also included support to increase services from mental health professionals to provide care and counseling to families and the Head Start workforce. The president’s FY 2022 budget reflects continued investment in Head Start, which supports families during their children’s most formative years. This increase is necessary to maintain service to children and families currently enrolled, provide ongoing program improvements, support transition to full-day and full-year care, implement trauma-informed approaches to care, and retain an experienced workforce.
FY 2007 FY 2008 FY 2009 FY 2009 ARFY 2010 FY 2011 FY 2012 FY 2013 FY 2014 FY 2015 FY 2016 FY 2017 FY 2018 FY 2019 FY 2020 FY 2021 COVID $ FY 2022 PRES6,889$ 6,878$ 7,113$ 2,100$ 7,224$ 7,560$ 7,969$ 7,573$ 8,598$ 8,598$ 9,168$ 9,253$ 9,863$ 10,088$ 10,613$ 10,748$ 1,000$ 11,932$
$0
$2,000
$4,000
$6,000
$8,000
$10,000
$12,000
FY2007
FY2008
FY2009
FY2009ARRA
FY2010
FY2011
FY2012
FY2013
FY2014
FY2015
FY2016
FY2017
FY2018
FY2019
FY2020
FY2021
COVID$
FY2022PRES
$6,889 $6,878 $7,113
$2,100
$7,224 $7,560
$7,969 $7,573
$8,598 $8,598
$9,168 $9,253
$9,863 $10,088 $10,613
$10,748
$1,000
$11,932
Head Startin millions
CEF’s FY 2022 BUDGET ANALYSIS 191
PROGR A M N EED
Children and families enrolled in Head Start are among those who have been most adversely affected by the COVID-19 pandemic, economic destabilization, and systemic and historical racism. Congress provided $750 million for Head Start through the CARES Act and an additional $250 million through the CRRSA Act to meet rising operational costs as a result of COVID. Even before the pandemic, Head Start programs were under-resourced, making it a challenge to maximize Head Start’s impact. Challenges include recruiting and retaining staff, meeting the mental health needs of children and families, adapting to rising operating expenses, and dealing with aging facilities.
Despite modest program increases in recent years, Head Start funding levels support less than 50 percent of eligible preschool-aged children and less than 10 percent of children eligible for Early Head Start. Increased funding is critical to ensuring a greater number of children from low-income families have access to Head Start programs and a healthy start to life. Nearly 38 percent of children — 27.6 million — in the United States live in low-income households, and 17.7 percent of children under 5 live in poverty. Economic insecurity in the early years can create lifelong disadvantages for children, ranging from poor health to low achievement in school. Because the first five years of life are the most critical for learning and development, all young children — regardless of family income — need a strong beginning. Providing ample funding for Head Start will ensure families have access to quality early care and education and a more equitable future as they recover from COVID-19.
CONTACT IN FO
Elena Rocha YMCA of the USA (202) 688-4750 | [email protected]
CEF’s FY 2022 BUDGET ANALYSIS 192
Child Care and Development Fund (CCDF) Child Care and Development Block Grant Act (CCDBG)Section 418, Social Security Act “When I got to America, I felt lost. How was I to make it? I didn’t have any means of transportation or any idea of how to take care of my son here. I was told that I had to be there when I put him on the bus and when he got off the bus, so that is what I was doing for the first 6 months, until I found the Y. When he started at the Y after school program he was a sad boy, but now he is a jolly happy boy. It has been such a blessing for me. He calls the Y his family, and I don’t worry about a thing because he is safe and happy at the Y.”
Grace is from Uganda and her son Blessed is in the After School Program at the MetroWest YMCA through assistance from the Child Care and Development Block Grant (CCDBG). Massachusetts Ys serve 330,000 children in early education and school age programs at over 250 sites throughout the state. These Ys administer $30 million in early education vouchers and contracts, 67 percent of which is funded by CCDBG.
DES CRIP TION
The Child Care and Development Fund (CCDF) is the primary source of federal funding assistance for child care and is a block grant to states. CCDF supports low- and moderate-income families by providing access to quality, affordable child care for children up to 12 years of age, including early childhood and afterschool programs. To qualify for child care assistance, families must be working or in school and must meet income eligibility guidelines set by states within broad parameters of federal law.
In 2014 Congress reauthorized CCDBG to improve the quality of care, improve the health and safety of children in care, increase access to child care assistance, improve stability for children in child care, and make child care policies more family and provider friendly. CCDF is funded through both discretionary (Child Care and Development Block Grant) and mandatory (Child Care Mandatory and Matching Funds) appropriations.
. F U N DING HIS TORY (in millions)*
FY 2019 FY 2020 FY 2021 FY 2022 PRESIDENT’s REQUEST $5,257.85 $5,826.00 $5,911.00 $7,377.00
*These figures represent the discretionary portion of CCDBG.
CEF’s FY 2022 BUDGET ANALYSIS 193
. IM PACT OF PR ES IDENT’S BU DGE T
The president’s FY 2022 budget includes a substantial increase in funding for CCDBG to help working families afford quality child care. This investment continues to build on the historic increases made since the FY 2018 budget. This boost in funding will help address the ongoing affordability crisis in child care by serving a greater number of eligible families waiting for access to affordable, quality care. Greater CCDBG funding will also help to build an industry that is more sustainable than it was before COVID-19. In FY 2018— the most recent year for which data are available — over 1.3 million children from about 813,000 low-income families received a monthly child care subsidy. The FY 2022 budget will serve an estimated 2.4 million children, providing access to quality early care and afterschool programs to more children. The increased investment expands parents’ choices and provides crucial services in communities with few child care providers. The additional funds will also help promote children’s healthy development and learning by supporting child care licensing, quality improvement systems to help programs meet higher standards, and training and education for child care workers.
PROGR A M N EED
The COVID-19 pandemic has had a significant impact on the child care sector, which was already operating on a razor-thin margin. As a result of COVID, providers have had to reduce enrollment, thereby reducing revenue while simultaneously experiencing higher operating costs. To support the sector, Congress allocated $3.5 billion for CCDBG in the CARES Act and another $10 billion in the CRRSA Act. These stimulus dollars support providers so that families can access care for their children while they support America’s recovery from the pandemic.
However, stimulus dollars do not address the fact that, even prior to the pandemic, demand for affordable, quality child care went unmet. Although funding for CCDBG has more than doubled in the last four years, less than two in six eligible children nationwide are served by CCDBG funds. States continue to maintain large backlogs and wait lists of families in need of child care assistance that would allow them to work or pursue training opportunities. When child care is unaffordable and inaccessible, it impacts participation in the workforce and affects the nation’s economy, specifically earnings, productivity, and revenue.
Quality affordable child care is out of reach for far too many of America’s families. Today, child care costs average an estimated $9,100-$9,600 annually nationwide. This is equivalent to in-state tuition at a public college in 33 states. This amount also accounts for more than 11 percent of the median household income for married parents, and 36 percent of household income for single parents. The annual cost of child care for families with two children exceeds annual mortgage payments for homeowners in 40 states and the District of Columbia, and the cost for families with two children in a child care center exceeds annual median rent payments in every state.
CONTACT IN FO
Elena Rocha YMCA of the USA 202-688-4750 | [email protected]
CEF’s FY 2022 BUDGET ANALYSIS 194
Preschool Development GrantsDepartment of Health and Human Services (Joint administration with Department of Education)Title IX, Section 9212, Elementary & Secondary Education Act (Every Student Succeeds Act) As a recipient of the 2020 Preschool Development Grant, the New York State Council on Children and Families, Early Childhood Advisory Council, New York State Office of Children and Family Services, New York State Education Department, New York State Office of Mental Health and other child-serving stakeholders will continue to partner with parents and providers for the next three years. Previous funding through the Preschool Development Grant supported these partners in conducting a statewide birth-to-five needs assessment and developing a strategic plan now being implemented. Current grant funds focus on parent choice and knowledge, professional development, program quality, data and evaluation, and systems coordination. The state plans include a breadth and depth of comprehensive activities from family engagement and access solutions to evidence-based mental health, career/workforce development, and other systemic strategies (see NYSB5 Renewal Projects 2020-2022 Reference Guide). The PDG grant gives the state the resources needed to improve access, enhance quality, and streamline services for all young children and their families residing in New York through coordinated evidence-based, data-driven solutions.
DES CRIP TION
The Preschool Development Grant Birth through Five (PDG B-5) program established under the Every Student Succeeds Act (ESSA) is managed by the Administration for Children and Families (ACF), Department of Health and Human Services, with joint administration from the Department of Education. Acknowledging the critical importance of the first five years of life, these grants evolved from the previous Preschool Development Grants to help states focus on increasing access, enhancing program coordination, and improving overall quality of early learning systems. Of the initial 46 grants, 23 renewal grants were funded in 2020 by ACF to implement strategic plans. Additionally, 6 new states and territories were awarded initial planning grants and were offered an opportunity to apply for renewal grants for FY 2021. However, 20 states that received initial funding were not awarded renewal grants to implement their strategic plans.
. F U N DING HIS TORY* (in millions)
FY 2019 FY 2020 FY 2021 FY 2022 PRESIDENT’s REQUEST $248.00 $275.00 $275.00 $450.00
* Funded under the Department of Health and Human Services. . IM PACT OF PR ES IDENT’S BU DGE T
Preschool Development Grant funding is essential to states’ ongoing progress in weaving together a fragmented system of services for young children during a critical time in their development. No other funding source is available to make sweeping changes at the state level in a system that desperately needs reform. In many states, lack of coordination creates confusion among families and providers or causes duplication of services. Both of these barriers decrease access to services. PDG specifically focuses on vulnerable children — including children with disabilities, children living in poverty, dual language learners, immigrant and refugee families, tribal and migrant families, children in the child welfare system, and homeless children — to promote equitable access for all families.
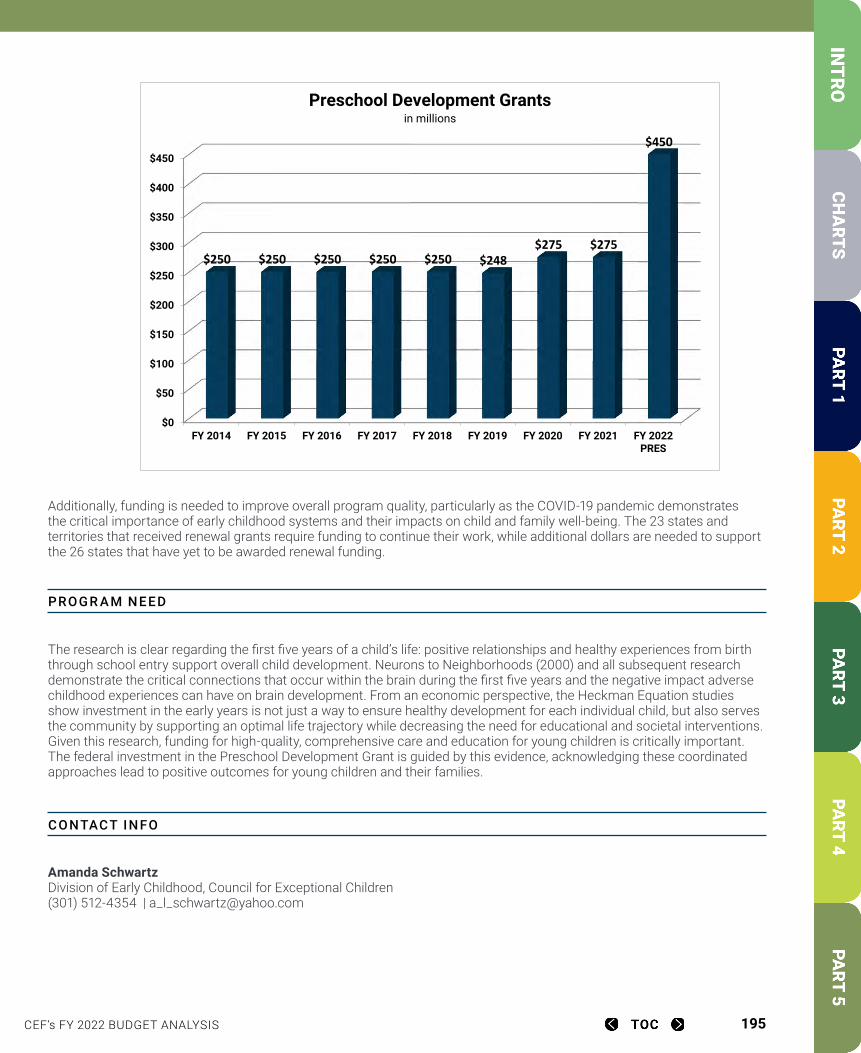
CEF’s FY 2022 BUDGET ANALYSIS 195
Additionally, funding is needed to improve overall program quality, particularly as the COVID-19 pandemic demonstrates the critical importance of early childhood systems and their impacts on child and family well-being. The 23 states and territories that received renewal grants require funding to continue their work, while additional dollars are needed to support the 26 states that have yet to be awarded renewal funding.
PROGR A M N EED
The research is clear regarding the first five years of a child’s life: positive relationships and healthy experiences from birth through school entry support overall child development. Neurons to Neighborhoods (2000) and all subsequent research demonstrate the critical connections that occur within the brain during the first five years and the negative impact adverse childhood experiences can have on brain development. From an economic perspective, the Heckman Equation studies show investment in the early years is not just a way to ensure healthy development for each individual child, but also serves the community by supporting an optimal life trajectory while decreasing the need for educational and societal interventions. Given this research, funding for high-quality, comprehensive care and education for young children is critically important. The federal investment in the Preschool Development Grant is guided by this evidence, acknowledging these coordinated approaches lead to positive outcomes for young children and their families.
CONTACT IN FO
Amanda Schwartz Division of Early Childhood, Council for Exceptional Children (301) 512-4354 | [email protected]
FY 2014 FY 2015 FY 2016 FY 2017 FY 2018 FY 2019 FY 2020 FY 2021 FY 2022 PRES250 250 250 250 250 248 275 275 450
$0
$50
$100
$150
$200
$250
$300
$350
$400
$450
FY 2014 FY 2015 FY 2016 FY 2017 FY 2018 FY 2019 FY 2020 FY 2021 FY 2022PRES
$250 $250 $250 $250 $250 $248$275 $275
$450
Preschool Development Grantsin millions
CEF’s FY 2022 BUDGET ANALYSIS 196
Child Nutrition ProgramsNational School Lunch Act and the Child Nutrition Act The YMCA of Western North Carolina serves as a sponsoring organization for two federally funded, state-administered nutrition programs: the Child and Adult Care Food Program (CACFP) and the Summer Food Service Program (SFSP). By participating in these programs, the Y is able to provide well-balanced, nutritious meals to the youth of Buncombe, McDowell, and Henderson Counties year round. Through the CACFP, the YMCA of WNC serves nutritious and free snacks at 28 afterschool care sites in Buncombe and McDowell Counties. The program also allows the organization to provide free lunches to anyone 18 and under on Saturdays from 11-1:00 PM at two sites. The SFSP ensures all children continue to receive nutritious meals when school is not in session. They served 47,837 free meals in summer 2020 to children enrolled in YMCA Summer Day Camps. The Y also partnered with Asheville City Schools to serve meals at two open sites during the summer. Through a partnership with the school district, the school nutrition program provides the nutritious meals, and the YMCA serves the meals and coordinates enriching and fun activities for children.
—Courtesy of the YMCA of Western North Carolina
DES CRIP TION
The National School Lunch, School Breakfast, Special Milk, Summer Food Service, and Child and Adult Care Food programs are mandatory accounts administered by the U.S. Department of Agriculture (USDA). The programs were last reauthorized in 2010 in the Healthy, Hunger Free Kids Act. These programs help ensure children have consistent access to nutritious meals throughout the year, critical for healthy development and academic success. The National School Lunch program provides nutritionally balanced, low-cost, or free lunches to children each school day in public and nonprofit private schools. During the past year Congress approved and the USDA implemented a wide range of flexibility waivers that have allowed schools and community-based providers to provide meals to families and children in need in communities where school has been virtual or a hybrid model.
The Special Supplemental Nutrition Program for Women, Infants, and Children (WIC) is a discretionary initiative providing grants to states for supplemental foods, health care referrals, and nutrition education for low-income pregnant and postpartum women and infants and children up to age five at nutritional risk. Particularly during the pandemic, increased demand from families in need has generated a call for additional funding.
. F U N DING HIS TORY (in millions)
FY 2019 FY 2020 FY 2021 FY 2022 PRESIDENT’s REQUEST Child Nutrition $23,140.78 $23,817.00 $25,402.00 $26,900.00WIC $ 6,075.00 $ 6,000.00 $ 6,000.00 $ 6,000.00

CEF’s FY 2022 BUDGET ANALYSIS 197
. IM PACT OF PR ES IDENT’S BU DGE T
The president’s FY 2022 budget for child nutrition supports mandatory subsidy payments for meals that meet nutrition standards for all school and child nutrition programs, including the National School Lunch, School Breakfast, Summer Food Service, Child and Adult Care Food, Fresh Fruit and Vegetable, and Special Milk Programs. The budget takes into account the impact of the pandemic and projects serving 5.24 billion lunches and snacks (an increase of 1.13 billion over the current estimate for 2021) and 2.59 billion breakfasts in schools, 2.1 billion meals in child and adult care centers including in afterschool programs, and 158 million meals through the Summer Food Service Program. With discretionary funds, the budget supports Farm to School initiatives at $23.2 million and also maintains the maximum level of Farm to School grants at $500,000, as provided in FY 2021 appropriations, to ensure grants are large enough to launch or expand Farm to School programming. The president’s FY 2022 budget includes a total of $6.0 billion for the Special Supplemental Nutrition Program for Women, Infants, and Children (WIC), inclusive of two new funding streams to meet expected needs: $200 million to support benefits should cost or participation increase and $100 million to support WIC technology systems. Building on increases provided by the American Rescue Plan Act in FY 2021, the budget would continue the provision of enhanced Cash Value Benefits through FY 2022 to ensure all participating women and children have access to the scientific-based recommended levels of fruits and vegetables, thereby improving health outcomes as well as program retention.
PROGR A M N EED
The National School Lunch Program and School Breakfast Program served roughly 22.6 million and 12.42 million children respectively in FY 2020. Maintaining and increasing participation in these programs is crucial, especially for low-income and food-insecure children who lack consistent access to healthy meals. Requirements and support for school food operators to fully implement healthier school nutrition standards in the School Lunch Program must also continue.
The Child and Adult Food Care Program (CACFP) provides nutritious meals and snacks for over 4.5 million children in day care and child care settings. CACFP would be improved by encouraging more child care providers to participate in the program through increased federal reimbursement to reduce paperwork, resulting in more meals provided and allowing for an additional daily healthy meal or snack for children in care.
The Summer Meals Program provides critical nutrition for students who receive meals during the school year. However, currently only about 14 percent of eligible children receive summer lunch for every 100 low-income children who rely on school lunch during the school year. Access could be increased in several ways, such as streamlining the summer meals program with the CACFP, adjusting area eligibility from 40 to 50 percent, or creation of public-private partnerships to fund transportation grants for children to access summer meals through mobile meal trucks or other means.. This past year also saw the creation of Pandemic-EBT (P-EBT), part of the U.S. government’s response to the COVID-19 pandemic. The Families First Coronavirus Response Act of 2020, as amended by the Continuing Appropriations Act, 2021 and Other Extensions Act, provides the Secretary of Agriculture authority to approve state agency plans to administer P-EBT. USDA has implemented Pandemic-EBT to provide nutrition assistance to hard-hit families across the country due to the pandemic. On January 22, in support of President Biden’s call to action on hunger, USDA announced the agency will increase the P-EBT benefit by approximately 15 percent, providing more money for low-income families and millions of children missing meals due to school and child care closures. Through this program, eligible school children receive temporary emergency nutrition benefits loaded on EBT cards used to purchase food. Children who would have received free or reduced-price meals under the National School Lunch Act if their schools were not closed or operating with reduced hours or attendance for at least 5 consecutive days are eligible to receive P-EBT benefits.
CONTACT IN FO
Erik Peterson Afterschool Alliance (202) 347-2030 ext. 1005 | [email protected]
CEF’s FY 2022 BUDGET ANALYSIS 198
Medicaid: Early and Periodic Screening, Diagnosis and Treatment ProgramsTitle XIX, Social Security Act Saint Paul Public Schools (SPPS) is the second largest school district in Minnesota with an enrollment of some 35,000 students at 65 schools with 15 percent of students qualifying for special education services. Seventy percent of St. Paul students qualify for free and reduced-price lunch. SPPS participates in third party reimbursement activities through the state’s Department of Human Services (DHS). Eligible health-related services on students’ individualized education programs (IEP) are reimbursed using a Local Collaborative Time Study methodology. Under the state Medicaid plan, schools can be reimbursed for IEP services such as speech and language therapy, occupational and physical therapy, nursing services, interpreter services, personal care assistant services, and transportation. However, reimbursement is only provided for evaluations done by mental health professionals (psychologists and licensed independent clinical social workers), since DHS currently requires all child mental health providers to utilize an arduous separate system for reimbursement, necessitating duplicative documentation and paperwork, as well as parental reviews and signatures every 90 days.
Nearly 17,000 students with emotional/behavior disabilities were served statewide in 2018-19, but school-based mental health services for only 734 students were reimbursed. Surrounding states provide reimbursements for mental health IEP services three to fifteen times greater than Minnesota. Similarly, reimbursements for eligible health services, such as nursing services, provided by Minnesota school districts are restricted under the state’s prepaid management care plans. Many services currently provided to Medicaid-eligible students by Minnesota school districts could be reimbursed if the state plan followed the range of services and procedures in the Centers for Medicare and Medicaid Services school-based Medicaid guidance.
DES CRIP TION
Medicaid programs work through state and local health agencies and other service providers to detect and treat eligible low-income children and adults for a broad range of health deficiencies, including speech, hearing, vision, and dental issues, as well as other physical impairments. Children comprise some 40 percent of all Medicaid recipients but account for less than 20 percent of Medicaid costs. Many schools participate in the Medicaid program in order to address child health problems that often have detrimental effects on their academic performance. Children with disabilities are the recipients of most medical services reimbursed to schools under Medicaid. The disproportionate costs of the pandemic among low-income populations, the increase in eligible beneficiaries, and the increase in the federal match funds is reflected in the continuing growth of the Medicaid program during the public health crisis.
. F U N DING HIS TORY (in billions)
FY 2019 FY 2020 FY 2021 FY 2022 PRESIDENT’s REQUEST $386.33 $383.86 $425.69* $489.99**
**Projected spending. * FY 2021 estimated.
.
CEF’s FY 2022 BUDGET ANALYSIS 199
IM PACT OF PR ES IDENT’S BU DGE T
The president’s FY 2022 budget projects $489.99 billion in federal Medicaid assistance payments. Another $5 billion in the children’s vaccine initiative continues in FY 2022. The budget estimates 29.9 million children receiving Medicaid services in the upcoming year, accounting for 38.7 percent of all individuals enrolled in the Medicaid program. The number of total Medicaid beneficiaries is expected to see a minimal rise in the upcoming year, with no increase in the number of children being served.
PROGR A M N EED
Medicaid services have become an essential component of “wraparound” services provided by school districts serving economically disadvantaged communities. Since more than one in five children in America has health coverage through Medicaid, any changes to the program significantly affect access to essential medical care for low-income children. Medicaid participation provides access to preventive, basic, acute, and specialized health services and prescription medications not otherwise available to low-income children and families. School health personnel are often among the few health professionals to whom low-income children have regular access, and cost-effective, school-based health services help reduce the need for more costly medical services later in life. Eligible students with disabilities are the primary recipients of Medicaid-supported services in schools, including physical, occupational, and speech and language therapies, audiology, and mental health and nursing services. Maintaining an effective school-based Medicaid program is critical to securing the health of the nation’s medically underserved children. The economic downturn resulting from the pandemic has increased the number of low-income individuals, including children, dependent on the Medicaid program for regular health services.
CONTACT IN FO
Jeff Simering Council of the Great City Schools(202) 393-2427 | [email protected]
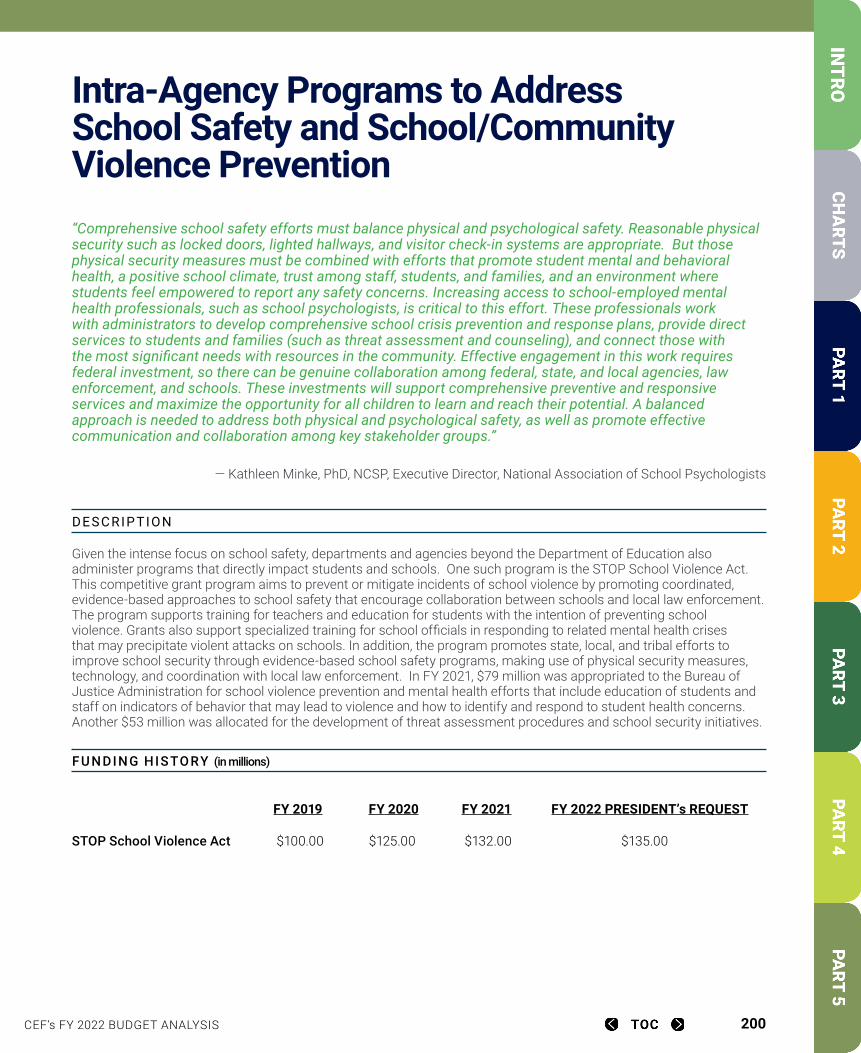
CEF’s FY 2022 BUDGET ANALYSIS 200
Intra-Agency Programs to Address School Safety and School/Community Violence Prevention “Comprehensive school safety efforts must balance physical and psychological safety. Reasonable physical security such as locked doors, lighted hallways, and visitor check-in systems are appropriate. But those physical security measures must be combined with efforts that promote student mental and behavioral health, a positive school climate, trust among staff, students, and families, and an environment where students feel empowered to report any safety concerns. Increasing access to school-employed mental health professionals, such as school psychologists, is critical to this effort. These professionals work with administrators to develop comprehensive school crisis prevention and response plans, provide direct services to students and families (such as threat assessment and counseling), and connect those with the most significant needs with resources in the community. Effective engagement in this work requires federal investment, so there can be genuine collaboration among federal, state, and local agencies, law enforcement, and schools. These investments will support comprehensive preventive and responsive services and maximize the opportunity for all children to learn and reach their potential. A balanced approach is needed to address both physical and psychological safety, as well as promote effective communication and collaboration among key stakeholder groups.”
— Kathleen Minke, PhD, NCSP, Executive Director, National Association of School Psychologists
DES CRIP TION
Given the intense focus on school safety, departments and agencies beyond the Department of Education also administer programs that directly impact students and schools. One such program is the STOP School Violence Act. This competitive grant program aims to prevent or mitigate incidents of school violence by promoting coordinated, evidence-based approaches to school safety that encourage collaboration between schools and local law enforcement. The program supports training for teachers and education for students with the intention of preventing school violence. Grants also support specialized training for school officials in responding to related mental health crises that may precipitate violent attacks on schools. In addition, the program promotes state, local, and tribal efforts to improve school security through evidence-based school safety programs, making use of physical security measures, technology, and coordination with local law enforcement. In FY 2021, $79 million was appropriated to the Bureau of Justice Administration for school violence prevention and mental health efforts that include education of students and staff on indicators of behavior that may lead to violence and how to identify and respond to student health concerns. Another $53 million was allocated for the development of threat assessment procedures and school security initiatives.
. F U N DING HIS TORY (in millions)
FY 2019 FY 2020 FY 2021 FY 2022 PRESIDENT’s REQUEST
STOP School Violence Act $100.00 $125.00 $132.00 $135.00

CEF’s FY 2022 BUDGET ANALYSIS 201
. IM PACT OF PR ES IDENT’S BU DGE T
The president’s FY 2022 budget includes a $3 million increase for STOP grants, with this increase allocated specifically for the portion of the grants operated by the Bureau of Justice Assistance. These grants support training for teachers and education for students with the intent to prevent school violence, as well as specialized training for school officials in responding to related mental health crises that may precipitate violent attacks on schools. These grants — combined with increases for other programs intended to improve school climate and increase access to school-employed mental health professionals (school psychologists, school counselors, school social workers) — can help advance comprehensive, positive school safety efforts that support the learning environment. The president’s budget freezes funding at the FY 2021 level for the portion of the STOP Grant operated by Community Oriented Policing Services. These funds cannot be used to hire School Resource Officers, but rather support coordination with and training for law enforcement, as well as physical security measures. This balanced approach prioritizes and recognizes the importance of comprehensive school safety efforts that address both physical and psychological safety..
PROGR A M N EED
Improving overall school and community safety requires innovative solutions and collaboration among schools, parents, educators, law enforcement, the community, and the juvenile justice system. Both community and school environments must be physically and psychologically safe to promote student learning and overall positive development. Historically, schools, communities, and law enforcement have operated in silos with little collaboration or coordination of services. Additionally, many school safety efforts have focused primarily on physical measures (e.g., metal detectors) and often have occurred in response to a tragedy. Effective school safety is a daily commitment requiring coordination and integration of existing systems. These systems must be designed to promote a positive, supportive school and community culture, reduce negative behaviors, support student mental and behavioral health, minimize the impact of crises when they occur, and keep students out of the juvenile justice system. Unfortunately, many schools and communities are not able to address safety comprehensively in those environments, due to inadequate financial resources and an insufficient number of school-employed professionals (e.g., school psychologists, school social workers, school counselors) to meet the wide range of student behavioral and mental health needs and coordinate with community services.
CONTACT IN FO
Kelly Vaillancourt Strobach National Association of School Psychologists(301) 657-0270 | [email protected]
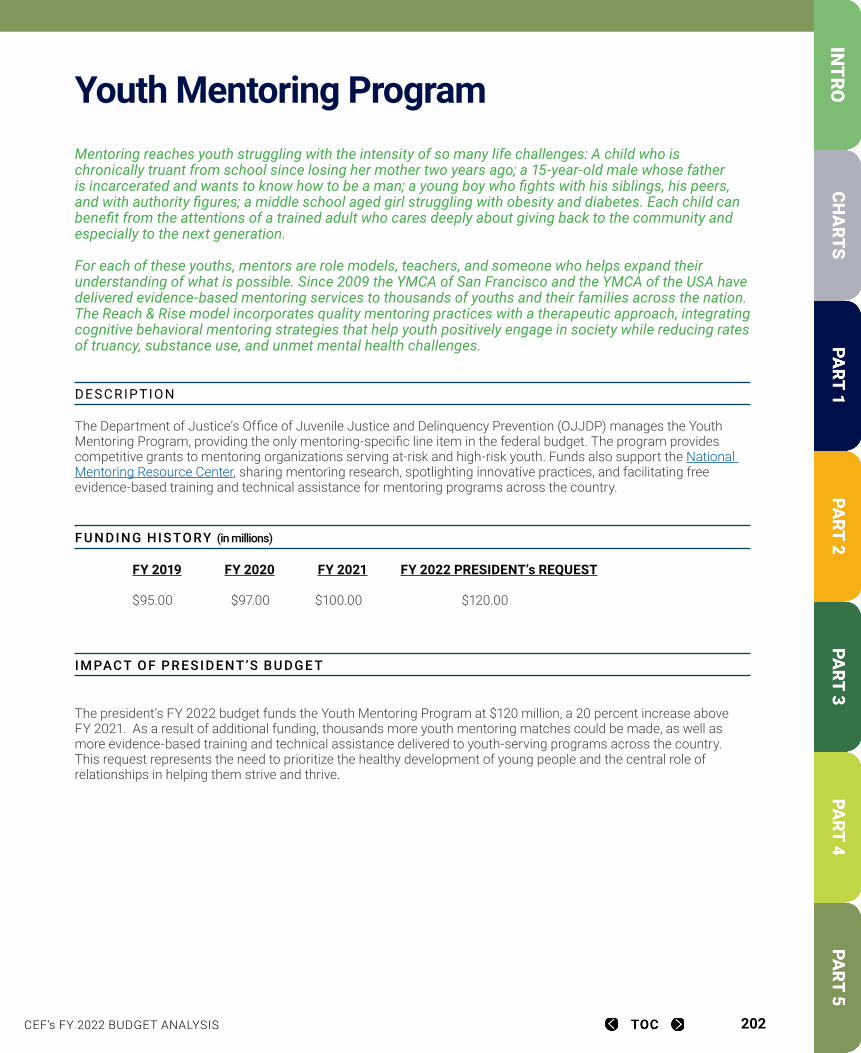
CEF’s FY 2022 BUDGET ANALYSIS 202
Youth Mentoring Program Mentoring reaches youth struggling with the intensity of so many life challenges: A child who is chronically truant from school since losing her mother two years ago; a 15-year-old male whose father is incarcerated and wants to know how to be a man; a young boy who fights with his siblings, his peers, and with authority figures; a middle school aged girl struggling with obesity and diabetes. Each child can benefit from the attentions of a trained adult who cares deeply about giving back to the community and especially to the next generation. For each of these youths, mentors are role models, teachers, and someone who helps expand their understanding of what is possible. Since 2009 the YMCA of San Francisco and the YMCA of the USA have delivered evidence-based mentoring services to thousands of youths and their families across the nation. The Reach & Rise model incorporates quality mentoring practices with a therapeutic approach, integrating cognitive behavioral mentoring strategies that help youth positively engage in society while reducing rates of truancy, substance use, and unmet mental health challenges.
DES CRIP TION
The Department of Justice’s Office of Juvenile Justice and Delinquency Prevention (OJJDP) manages the Youth Mentoring Program, providing the only mentoring-specific line item in the federal budget. The program provides competitive grants to mentoring organizations serving at-risk and high-risk youth. Funds also support the National Mentoring Resource Center, sharing mentoring research, spotlighting innovative practices, and facilitating free evidence-based training and technical assistance for mentoring programs across the country.
. F U N DING HIS TORY (in millions)
FY 2019 FY 2020 FY 2021 FY 2022 PRESIDENT’s REQUEST $95.00 $97.00 $100.00 $120.00
. IM PACT OF PR ES IDENT’S BU DGE T
The president’s FY 2022 budget funds the Youth Mentoring Program at $120 million, a 20 percent increase above FY 2021. As a result of additional funding, thousands more youth mentoring matches could be made, as well as more evidence-based training and technical assistance delivered to youth-serving programs across the country. This request represents the need to prioritize the healthy development of young people and the central role of relationships in helping them strive and thrive.
CEF’s FY 2022 BUDGET ANALYSIS 203
PROGR A M N EED
Potential is equally distributed; opportunity is not. A major driver of healthy development and opportunity often comes down to who is in your corner. Youth mentoring is an effective prevention and intervention strategy for students that can help decrease chronic absenteeism and youth violence and increase critical thinking, problem solving and other skills that support academic and workforce achievement and goal attainment. The OJJDP Youth Mentoring Program serves a critical and unmet need for strategically centering relationships in interventions, supports, and engagement of young people facing risks. A minimum of $120 million is needed to fund the Youth Mentoring Program in FY 2022 to support this work and increased costs and demand due to the pandemic. The current public health crisis has spotlighted young people facing mental health challenges, anxiety, and isolation, among many other complex issues. Effective, trained mentors can support and guide young people at times of crisis and success.
While mentoring is an effective evidence-based intervention and prevention strategy for young people, mentoring organizations across the nation still face barriers in providing high-quality mentoring services. Thousands of young people remain on wait lists at organizations due to limited resources and funding and the need for more mentors. Many mentoring organizations also lack the necessary training and technical assistance that would bolster their mentoring programs to better support young people with culturally-relevant practices and address the unique needs of youth experiencing adverse childhood experiences.
CONTACT IN FO
Abbie Evans MENTOR National(202) 997-4102 | [email protected]
Caden Fabbi MENTOR National(202) 688-4738 | [email protected]
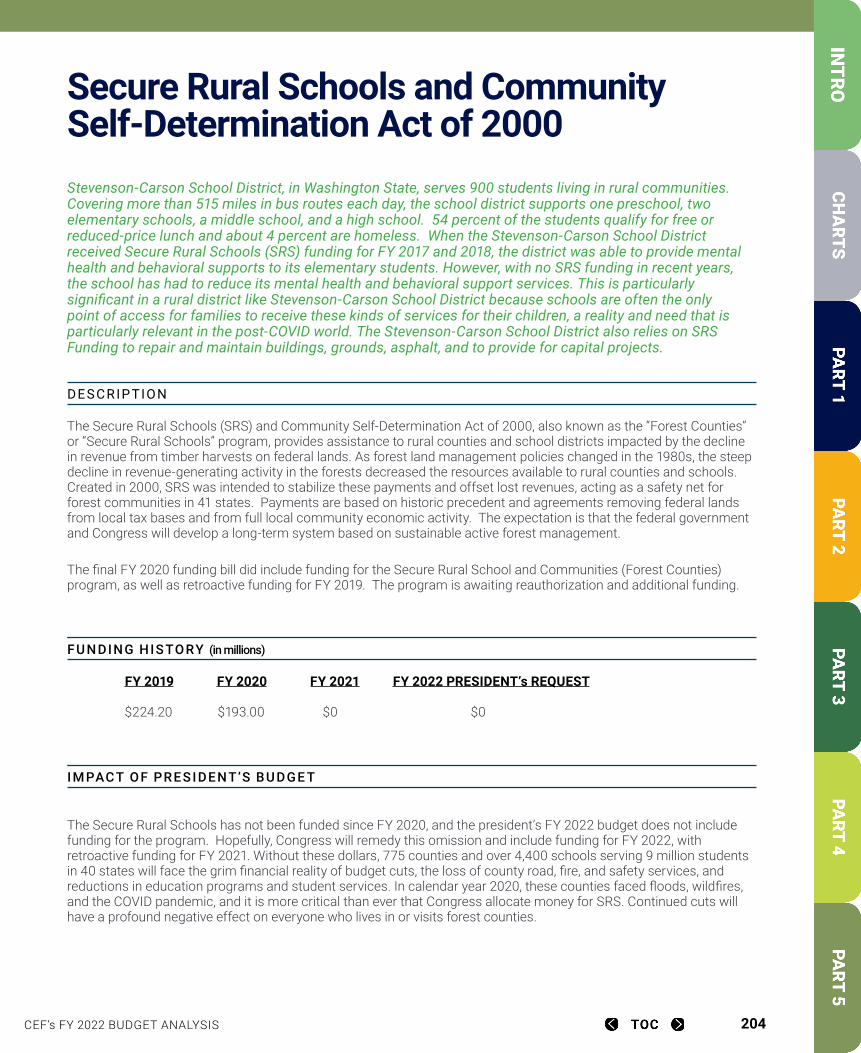
CEF’s FY 2022 BUDGET ANALYSIS 204
Secure Rural Schools and Community Self-Determination Act of 2000 Stevenson-Carson School District, in Washington State, serves 900 students living in rural communities. Covering more than 515 miles in bus routes each day, the school district supports one preschool, two elementary schools, a middle school, and a high school. 54 percent of the students qualify for free or reduced-price lunch and about 4 percent are homeless. When the Stevenson-Carson School District received Secure Rural Schools (SRS) funding for FY 2017 and 2018, the district was able to provide mental health and behavioral supports to its elementary students. However, with no SRS funding in recent years, the school has had to reduce its mental health and behavioral support services. This is particularly significant in a rural district like Stevenson-Carson School District because schools are often the only point of access for families to receive these kinds of services for their children, a reality and need that is particularly relevant in the post-COVID world. The Stevenson-Carson School District also relies on SRS Funding to repair and maintain buildings, grounds, asphalt, and to provide for capital projects.
DES CRIP TION
The Secure Rural Schools (SRS) and Community Self-Determination Act of 2000, also known as the “Forest Counties” or “Secure Rural Schools” program, provides assistance to rural counties and school districts impacted by the decline in revenue from timber harvests on federal lands. As forest land management policies changed in the 1980s, the steep decline in revenue-generating activity in the forests decreased the resources available to rural counties and schools. Created in 2000, SRS was intended to stabilize these payments and offset lost revenues, acting as a safety net for forest communities in 41 states. Payments are based on historic precedent and agreements removing federal lands from local tax bases and from full local community economic activity. The expectation is that the federal government and Congress will develop a long-term system based on sustainable active forest management.
The final FY 2020 funding bill did include funding for the Secure Rural School and Communities (Forest Counties) program, as well as retroactive funding for FY 2019. The program is awaiting reauthorization and additional funding.
. F U N DING HIS TORY (in millions)
FY 2019 FY 2020 FY 2021 FY 2022 PRESIDENT’s REQUEST $224.20 $193.00 $0 $0
. IM PACT OF PR ES IDENT’S BU DGE T
The Secure Rural Schools has not been funded since FY 2020, and the president’s FY 2022 budget does not include funding for the program. Hopefully, Congress will remedy this omission and include funding for FY 2022, with retroactive funding for FY 2021. Without these dollars, 775 counties and over 4,400 schools serving 9 million students in 40 states will face the grim financial reality of budget cuts, the loss of county road, fire, and safety services, and reductions in education programs and student services. In calendar year 2020, these counties faced floods, wildfires, and the COVID pandemic, and it is more critical than ever that Congress allocate money for SRS. Continued cuts will have a profound negative effect on everyone who lives in or visits forest counties.

CEF’s FY 2022 BUDGET ANALYSIS 205
PROGR A M N EED
Congress must reauthorize and fund the SRS program, continuing the historic national commitment to rural communities and school districts served by the SRS program. Without congressional action on forest management and SRS, forest counties and schools face the loss of irreplaceable educational, fire, police, road and bridge, and community services.
CONTACT IN FO
Noelle Ellerson Ng AASA: The School Superintendents Association(703) 875-0764 | [email protected]
CEF’s FY 2022 BUDGET ANALYSIS 206
AASA, the School Superintendents AssociationAccessLex InstituteAdvance CTEAfterschool AllianceAlliance for Excellent Education (All4ed)America’s Public Television Stations (APTS)American Alliance of Museums (AAM)American Association of Colleges for Teacher Education (AACTE)American Association of Community Colleges (AACC)American Association of State Colleges and Universities (AASCU)American Association of University Professors (AAUP)American Council on Education (ACE)American Counseling Association (ACA)American Educational Research Association (AERA)American Federation of School Administrators (AFSA)American Federation of State, County, and Municipal Employees (AFSCME)American Federation of Teachers (AFT)American Indian Higher Education Consortium (AIHEC)American Library Association (ALA)American Psychological Association Services, Inc.American School Counselor Association (ASCA)American Speech-Language-Hearing Association (ASHA)American Student Association of Community Colleges (ASACC) AnitaB.orgASCDAssociation for Career and Technical Education (ACTE)Association of American Publishers (AAP)Association of American Universities (AAU)Association of Community College Trustees (ACCT)Association of Educational Service Agencies (AESA)
Association of Jesuit Colleges and Universities (AJCU)Association of Latino Administrators and Superintendents (ALAS)Association of School Business Officials (ASBO)Bose Public Affairs GroupCalifornia Department of Education (CDE)California Small School District Association (SSDA)California State University (CSU)Center for Law and Social Policy (CLASP)Chiefs for ChangeConference of Educational Administrators of Schools and Programs for the Deaf (CEASD)Consortium for School Networking (COSN)Council for Exceptional Children (CEC)Council for Opportunity in Education (COE)Council of Administrators of Special Education (CASE)Council of Chief State School Officers (CCSSO)Council of the Great City Schools (CGCS)Education Counsel LLCEducation Reform Now (ERN)Federal Management Strategies (FMS)Georgetown UniversityHarvard UniversityHigher Education Consortium for Special Education (HECSE)Hispanic Association of Colleges and Universities (HACU)IBMKnowledge AllianceLearning Disabilities Association of America (LDA)Learning Policy InstituteLehigh UniversityLos Angeles Unified School District (LAUSD)Magnet Schools of America, Inc. (MSA)MENTOR - The National Mentoring Partnerships
2021 CEF Member Roster
CEF’s FY 2022 BUDGET ANALYSIS 207
MRM Associates, LLCNational Association for College Admission Counseling (NACAC)National Association for Music Education (NAfME)National Association of College Stores (NACS)National Association of Elementary School Principals (NAESP)National Association of Federally Impacted Schools (NAFIS)National Association of Graduate-Professional Students (NAGPS)National Association of Independent Colleges & Universities (NAICU)National Association of Private Special Education Centers (NAPSEC)National Association of School Psychologists (NASP)National Association of Secondary School Principals (NASSP)National Association of State Directors of Special Education (NASDSE)National Association of State Student Grant and Aid Programs (NASSGAP)National Association of Student Financial Aid Administrators (NASFAA)National Association Workforce Boards (NAWB)National Center for Learning Disabilities (NCLD)National Coalition for Literacy (NCL)National College Attainment Network (NCAN)National Council for Community and Education Partnerships (NCCEP)National Council of State Directors of Adult Education (NCSDAE)National Education Association (NEA)National HEP/CAMP AssociationNational Indian Education Association (NIEA) National PTANational Rural Education Association (NREA)National School Boards Association (NSBA)National Summer Learning Association (NSLA)
National Superintendents RoundtableNational Technical Institute for the Deaf (NTID)New AmericaNorthwestern UniversityPell AllianceRutgers UniversityScholarship AmericaService Employees International Union (SEIU)State Higher Education Executive Officers Association (SHEEO)Stride Policy SolutionsStudent Veterans of AmericaTeach for America (TFA)Texas A&M University SystemUNCF (United Negro College Fund, Inc.)University of CaliforniaUniversity of FloridaUniversity of Pennsylvania (UPenn)University of Southern California (USC)University of Wisconsin SystemUS Public Interest Research Group (PIRG)WestEDYMCA
2021 CEF Members Roster, continued
COMMITTEE FOR EDUCATION FUNDING
@edfunding
1800 M Street, NW
Suite 500 SouthWashington, DC 20036
202-327-8215 | [email protected] | www.cef.org