Communicator EXT User Manual V.1.41 - Electro Industries
854
-
Upload
khangminh22 -
Category
Documents
-
view
3 -
download
0
Transcript of Communicator EXT User Manual V.1.41 - Electro Industries

COMMUNICATOR EXT™

This page intentionally left blank.

Doc# E107707 iElectro Industries/GaugeTechThe Leader In Power Monitoring and Smart Grid SolutionsElectro Industries/GaugeTechThe Leader In Power Monitoring and Smart Grid Solutions
Communicator EXT 3.0 User Manual V.1.41
Published by:
Electro Industries/GaugeTech
1800 Shames Drive
Westbury, NY 11590
All rights reserved. No part of this publication may be reproduced or transmitted in
any form or by any means, electronic or mechanical, including photocopying, record-
ing, or information storage or retrieval systems or any future forms of duplication, for
any purpose other than the purchaser's use, without the expressed written permission
of Electro Industries/GaugeTech.
© 2013 Electro Industries/GaugeTech
Nexus® and Shark® are registered trademarks of Electro Industries/GaugeTech. The
distinctive shapes, styles and overall appearances of the Nexus® 1500 meter and all
Shark® meters are trademarks of Electro Industries/GaugeTech. Communicator EXTTM
is a trademark of Electro Industries/GaugeTech.
Microsoft®, Excel®, and Windows® are either registered trademarks or trademarks
of Microsoft Corporation in the United States and/or other countries.

Doc# E107707 iiElectro Industries/GaugeTechThe Leader In Power Monitoring and Smart Grid SolutionsElectro Industries/GaugeTechThe Leader In Power Monitoring and Smart Grid Solutions
This page intentionally left blank.

Doc# E107707 iiiElectro Industries/GaugeTechThe Leader In Power Monitoring and Smart Grid SolutionsElectro Industries/GaugeTechThe Leader In Power Monitoring and Smart Grid Solutions
Customer Service and Support
Customer support is available 9:00 am to 4:30 pm, Eastern Standard Time, Monday
through Friday. Please have the serial number and a detailed problem description
available. When returning any merchandise to EIG, a return materials authorization
number is required. For customer or technical assistance, phone 516-334-0870 or fax
516-338-4741.
Product Warranty
Electro Industries/GaugeTech warrants all products to be free from defects in material
and workmanship for a period of four years from the date of shipment. During the
warranty period, we will, at our option, either repair or replace any product that
proves to be defective.
To exercise this warranty, fax or call our customer-support department. You will
receive prompt assistance and return instructions.
This warranty does not apply to defects resulting from unauthorized modification or
misuse.
THIS WARRANTY IS IN LIEU OF ALL OTHER WARRANTIES, EXPRESSED
OR IMPLIED, INCLUDING ANY IMPLIED WARRANTY OF MERCHANTABIL-
ITY OR FITNESS FOR A PARTICULAR PURPOSE. ELECTRO INDUSTRIES/
GAUGETECH SHALL NOT BE LIABLE FOR ANY INDIRECT, SPECIAL OR
CONSEQUENTIAL DAMAGES ARISING FROM ANY AUTHORIZED OR
UNAUTHORIZED USE OF ANY ELECTRO INDUSTRIES/GAUGETECH
PRODUCT. LIABILITY SHALL BE LIMITED TO THE ORIGINAL COST OF
THE PRODUCT SOLD.
Disclaimer
The information presented in this publication has been carefully checked for
reliability; however, no responsibility is assumed for inaccuracies. The information
contained in this document is subject to change without notice.

Doc# E107707 ivElectro Industries/GaugeTechThe Leader In Power Monitoring and Smart Grid SolutionsElectro Industries/GaugeTechThe Leader In Power Monitoring and Smart Grid Solutions
Introduction to Communicator EXT
Communicator EXT for Windows® is an integral part of EIG’s line of power metering
systems. Use it to custom configure Shark® meters, Nexus® 1500 meters, Nexus®
1262/1272 meters, Nexus® 1252 meters, DM Series meters and Futura+ meters at
local or remote sites and retrieve data from them for analysis.
Data is available as Instantaneous Polled Readings, Logs, Waveform Captures, XY
Graphs and Circular Graphs. Other components of the EIG’s line of power metering
systems include the Nexus® External Displays and the Nexus® External Input/Output
Modules.
Following are the basic steps for using Communicator EXT:
1. Install Communicator EXT software on your computer: (Chapter 1).
2. Connect your computer to one or more EIG meters: (Chapter 2).
3. Configure the EIG meter(s): Chapter 3 (Nexus® 1250/1252 meter), Chapter 4
(Nexus ®1262/1272 meter), Chapter 5 (EIG Panel Meters, including the Shark®
Series meters, DM Series meters and the Futura+ meter), Chapter 19 (Nexus®
1500 meter), Chapter 20 (MP200 Metering system).
4. Retrieve and view data from the EIG meter(s): (Chapters 7, 8 and 10).
5. Use EIG Script and Scheduler Program for Automated Data Retrieval and Process-
ing (Chapter 15).
6. Understand and use Power Quality Compliance (Pursuant to EN50160 and IEC
61000-4-30 Standards): (Chapters 16 and 17).
NOTE: See the Table of Contents for additional topics.
Doc# E107707 vElectro Industries/GaugeTechThe Leader In Power Monitoring and Smart Grid SolutionsElectro Industries/GaugeTechThe Leader In Power Monitoring and Smart Grid Solutions
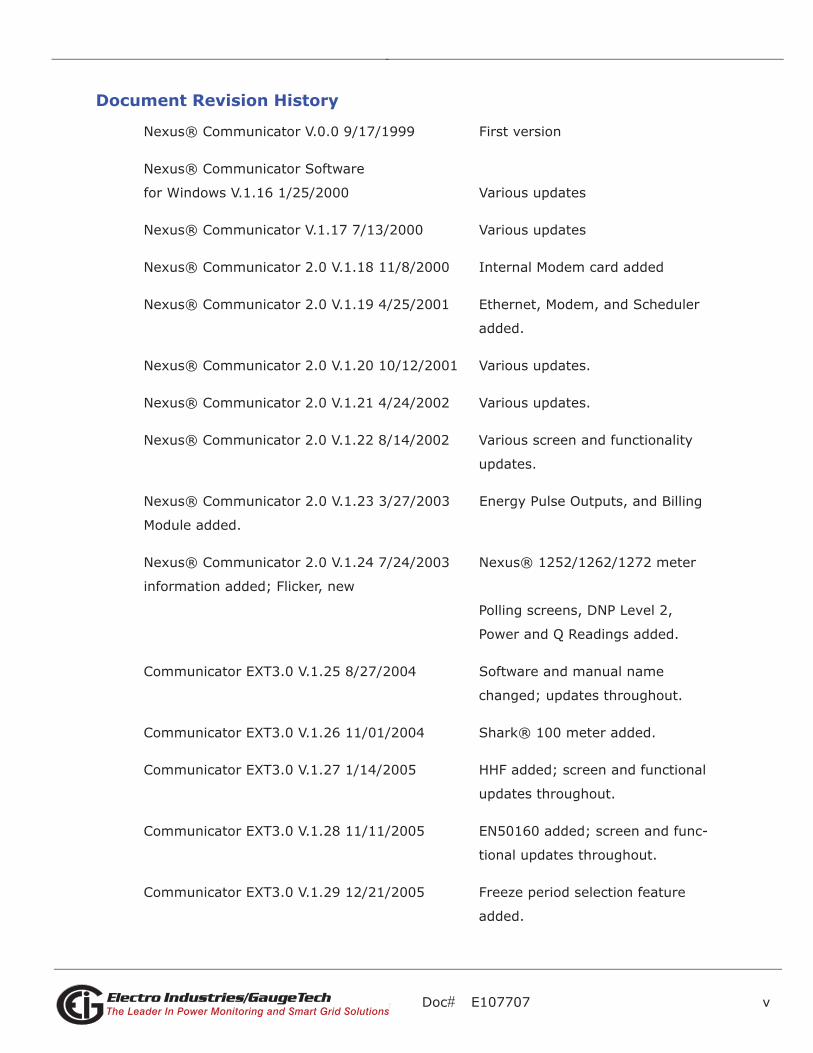
Document Revision History
Nexus® Communicator V.0.0 9/17/1999 First version
Nexus® Communicator Software
for Windows V.1.16 1/25/2000 Various updates
Nexus® Communicator V.1.17 7/13/2000 Various updates
Nexus® Communicator 2.0 V.1.18 11/8/2000 Internal Modem card added
Nexus® Communicator 2.0 V.1.19 4/25/2001 Ethernet, Modem, and Scheduler
added.
Nexus® Communicator 2.0 V.1.20 10/12/2001 Various updates.
Nexus® Communicator 2.0 V.1.21 4/24/2002 Various updates.
Nexus® Communicator 2.0 V.1.22 8/14/2002 Various screen and functionality
updates.
Nexus® Communicator 2.0 V.1.23 3/27/2003 Energy Pulse Outputs, and Billing
Module added.
Nexus® Communicator 2.0 V.1.24 7/24/2003 Nexus® 1252/1262/1272 meter
information added; Flicker, new
Polling screens, DNP Level 2,
Power and Q Readings added.
Communicator EXT3.0 V.1.25 8/27/2004 Software and manual name
changed; updates throughout.
Communicator EXT3.0 V.1.26 11/01/2004 Shark® 100 meter added.
Communicator EXT3.0 V.1.27 1/14/2005 HHF added; screen and functional
updates throughout.
Communicator EXT3.0 V.1.28 11/11/2005 EN50160 added; screen and func-
tional updates throughout.
Communicator EXT3.0 V.1.29 12/21/2005 Freeze period selection feature
added.

Doc# E107707 viElectro Industries/GaugeTechThe Leader In Power Monitoring and Smart Grid SolutionsElectro Industries/GaugeTechThe Leader In Power Monitoring and Smart Grid Solutions
Communicator EXT3.0 V.1.31 4/9/2007 Screen and functional updates
throughout.
Communicator EXT 3.0 V.1.32 8/31/2007 Shark® 200 meter added; updates
throughout.
Communicator EXT 3.0 V.1.33 12/20/2007 Updates throughout manual.
Communicator EXT 3.0 V.1.34 5/20/2008 Updates throughout manual.
Communicator EXT 3.0 V.1.35 8/11/2008 Updates throughout manual.
Communicator EXT 3.0 V.1.36 8/20/2008 Nexus® 1500 meter added.
Communicator EXT 3.0 V.1.37 9/15/2011 Enhanced functionality documented
for the Nexus® 1252/1272/1500
meters and the Shark® 200 meter;
Total Web Solutions added; exter-
nal digital inputs added.
Communicator EXT 3.0 V.1.38 3/15/2012 Updates throughout manual.
Communicator EXT 3.0 V.1.39 9/30/2012 Chapter 5: Shark® 200 meter
information updated for new
features; Shark® 50 and Shark®
100B meters added to chapter.
Communicator EXT 3.0 V.1.40 1/08/2013 Chapter 5: added settings for DNP over
Ethernet for the Network card.
Communicator EXT 3.0 V.1.41 3/4/2013 Chapter 20 added (MP200 Unit).

Doc# E107707 TOC - 1
Table of Contents
Electro Industries/GaugeTechThe Leader In Power Monitoring and Smart Grid SolutionsElectro Industries/GaugeTechThe Leader In Power Monitoring and Smart Grid Solutions
Table of ContentsChapter 1: Installing Communicator EXT
1.1: System Requirements 1-1
1.2: Installing Communicator EXT Software 1-1
1.3: Communicator EXT Basic Screen Elements 1-1
1.4: Help 1-6
1.5: Software License 1-7
1.6: Feature Comparison for Nexus® Models 1-9
1.7: Options 1-10
Chapter 2: Connecting to an EIG Meter
2.1: Overview 2-1
2.2: RS232, RS485 and Network Connections 2-2
2.3: RS232 and RS485 Modem Connections 2-4
2.4: RS485 Internal Modem Option Connection 2-8
2.5: Connecting to Multiple EIG Meters on an RS485 Bus 2-12
2.6: Internal Network Option Connection 2-16
2.7: Changing the Primary Device 2-16
2.8: Disconnecting from an EIG Meter(s) 2-17
2.9: Device Status 2-17
2.10: Merging Connection Databases 2-19
Chapter 3: Configuring the Nexus® 1250/1252 Meter
3.1: Overview 3-1
3.2: Retrieve and Send Device Profiles 3-2
Doc# E107707 TOC - 2
Table of Contents
Electro Industries/GaugeTechThe Leader In Power Monitoring and Smart Grid SolutionsElectro Industries/GaugeTechThe Leader In Power Monitoring and Smart Grid Solutions
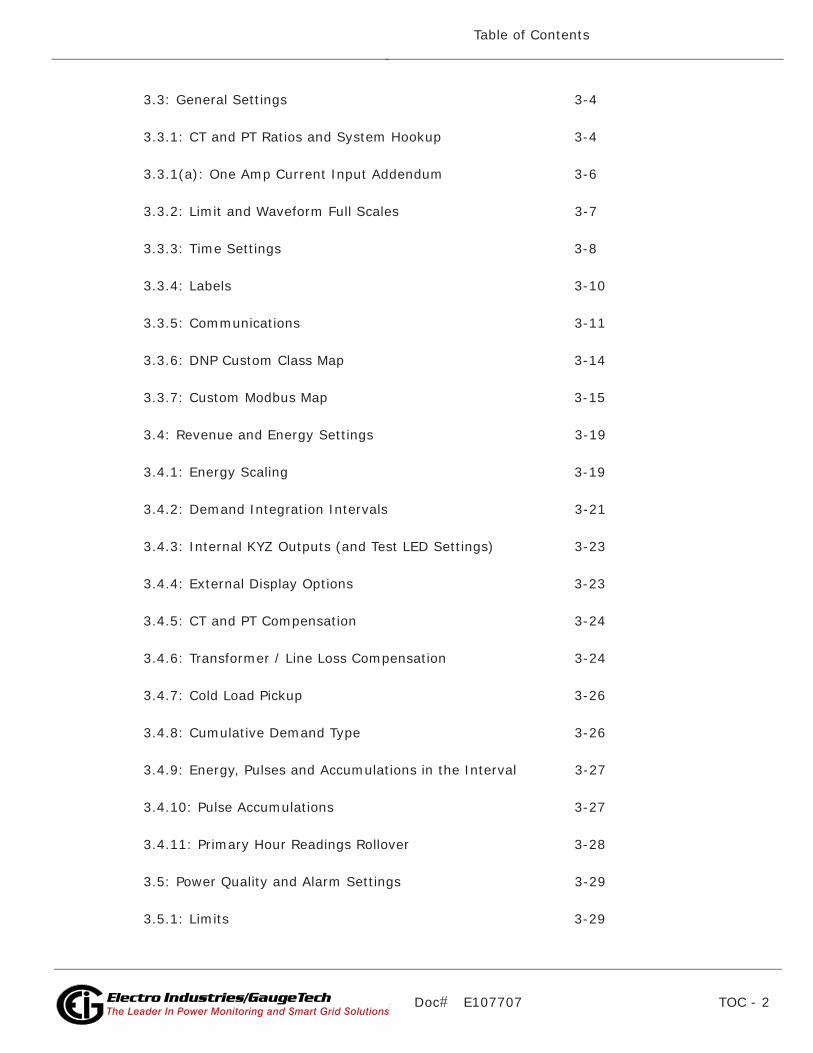
3.3: General Settings 3-4
3.3.1: CT and PT Ratios and System Hookup 3-4
3.3.1(a): One Amp Current Input Addendum 3-6
3.3.2: Limit and Waveform Full Scales 3-7
3.3.3: Time Settings 3-8
3.3.4: Labels 3-10
3.3.5: Communications 3-11
3.3.6: DNP Custom Class Map 3-14
3.3.7: Custom Modbus Map 3-15
3.4: Revenue and Energy Settings 3-19
3.4.1: Energy Scaling 3-19
3.4.2: Demand Integration Intervals 3-21
3.4.3: Internal KYZ Outputs (and Test LED Settings) 3-23
3.4.4: External Display Options 3-23
3.4.5: CT and PT Compensation 3-24
3.4.6: Transformer / Line Loss Compensation 3-24
3.4.7: Cold Load Pickup 3-26
3.4.8: Cumulative Demand Type 3-26
3.4.9: Energy, Pulses and Accumulations in the Interval 3-27
3.4.10: Pulse Accumulations 3-27
3.4.11: Primary Hour Readings Rollover 3-28
3.5: Power Quality and Alarm Settings 3-29
3.5.1: Limits 3-29

Doc# E107707 TOC - 3
Table of Contents
Electro Industries/GaugeTechThe Leader In Power Monitoring and Smart Grid SolutionsElectro Industries/GaugeTechThe Leader In Power Monitoring and Smart Grid Solutions
3.5.2: ElectroLogic Relay Control 3-33
3.5.3: PQ Thresholds (Waveform Recording) 3-34
3.5.4: EN50160/IEC61000-4-30 Flicker and Analysis 3-37
3.5.5: I Squared T and V Squared T Thresholds 3-37
3.5.6: High Speed Inputs 3-38
3.6: Trending Profile Settings 3-40
3.6.1: Programming the Trending Log Time Intervals 3-41
3.6.2: Programming the Trending Setup for Historical Logs 3-42
3.6.3: Pad Missing Records for Historical Logs 3-44
3.7: External I/O Devices 3-43
3.8: Set and Retrieve Device Time 3-46
3.9: Reset Device Information 3-46
3.10: Manual Waveform Capture 3-47
3.11: Clock Compensation 3-47
Chapter 4: Configuring the Nexus® 1262/1272 and 1260/1270 Meters
4.1: Overview 4-1
4.2: Retrieve and Send Device Profiles 4-2
4.3: General Settings 4-4
4.3.1: CT and PT Ratios and System Hookup 4-4
4.3.2: Limit and Waveform Full Scales 4-7
4.3.3: Time Settings 4-8
4.3.4: Labels 4-10
4.3.5: Communications 4-11

Doc# E107707 TOC - 4
Table of Contents
Electro Industries/GaugeTechThe Leader In Power Monitoring and Smart Grid SolutionsElectro Industries/GaugeTechThe Leader In Power Monitoring and Smart Grid Solutions
4.3.6: DNP Custom Class Map 4-16
4.3.7: Custom Modbus Map 4-18
4.4: Revenue and Energy Settings 4-22
4.4.1: Energy Scaling 4-22
4.4.2: Demand Integration Intervals (Demand Intervals) 4-24
4.4.3: Internal KYZ Outputs (and Test LED Settings) 4-26
4.4.4: Display Configuration 4-28
4.4.4.1: Using the Display Configurator 4-31
4.4.5: CT and PT Compensation 4-42
4.4.6: Transformer / Line Loss Compensation 4-42
4.4.7: Cold Load Pickup 4-44
4.4.8: Cumulative Demand Type 4-44
4.4.9: Energy, Pulses and Accumulations in the Interval 4-45
4.4.10: Pulse Accumulations 4-45
4.4.11: Primary Readings Rollover 4-46
4.5: Power Quality and Alarm Settings 4-47
4.5.1: Limits 4-47
4.5.2: ElectroLogic Relay Control 4-50
4.5.3: PQ Thresholds (Waveform Recording) 4-51
4.5.4: EN50160/IEC61000-4-30 Flicker 4-54
4.5.5: I Squared T and V Squared T Thresholds 4-54
4.5.6: High Speed Inputs 4-55
4.5.7: Operational Status Output 4-57

Doc# E107707 TOC - 5
Table of Contents
Electro Industries/GaugeTechThe Leader In Power Monitoring and Smart Grid SolutionsElectro Industries/GaugeTechThe Leader In Power Monitoring and Smart Grid Solutions
4.6: Trending Profile Settings and Load Profile Recording 4-57
4.6.1: Programming the Trending Log Time Intervals 4-58
4.6.2: Programming the Trending Setup 4-58
4.6.3: Pad Missing Records for Historical Logs 4-60
4.7: External I/O Devices 4-60
4.8: Set and Retrieve Device Time 4-62
4.9: Reset Device Information 4-63
4.10: Manual Waveform Capture 4-63
4.11: Setting Test Mode Preset Accumulators 4-64
4.12: Performing CT & PT Compensation 4-65
4.13: Clock Compensation 4-67
Chapter 5: Configuring EIG Panel Meters
5.1: Introduction 5-1
5.2: Shark® Series Configuration 5-1
5.2.1: Quick Connect 5-1
5.2.2: Connection Manager 5-3
5.2.3: Disconnecting 5-7
5.3: Configuring the Shark® Device Profile 5-8
5.3.1: Configuring the Shark® 100 Device Profile 5-8
5.3.1.1: Configuring Systems Settings Screen 5-9
5.3.1.1.1: Password Settings 5-9
5.3.1.1.2: V-Switch Key Upgrade 5-10
5.3.1.2: Configuring Communication Settings 5-12
Doc# E107707 TOC - 6
Table of Contents
Electro Industries/GaugeTechThe Leader In Power Monitoring and Smart Grid SolutionsElectro Industries/GaugeTechThe Leader In Power Monitoring and Smart Grid Solutions
5.3.1.3: Configuring Energy and Display 5-13
5.3.1.4: Configuring Scaling 5-15
5.3.1.5: Configuring Limits (V-Switch 4 Only) 5-17
5.3.2.: Configuring the Shark® 200 Device Profile 5-19
5.3.2.1: Selecting Settings 5-19
5.3.2.2: Performing Tasks 5-20
5.3.3: Configuring Settings 5-25
5.3.3.1: Configuring CT, PT Ratios and System Hookup 5-25
5.3.3.2: Configuring Time Settings 5-28
5.3.3.3: Configuring System Settings 5-29
5.3.3.4: Configuring Communication Settings 5-31
5.3.3.5: Setting Display Configuration 5-33
5.3.3.6: Configuring Energy, Power Scaling and Averaging 5-35
5.3.3.7: Configuring Transformer/Line Loss Compensation 5-39
5.3.3.8: Configuring Limits 5-40
5.3.3.9: Configuring Waveform/PQ (V-5 and Higher) 5-43
5.3.3.10: Configuring Historical Logs 5-44
5.3.3.11: Configuring Historical Log Sectors 5-47
5.3.3.12: Configuring Shark® 200 Option Cards 5-50
5.4: Using Shark® Polling and Tools Menus 5-66
5.4.1: Using Shark® Polling Menu 5-66
5.4.2: Using Shark® Tools Menu 5-67
5.5: Futura+ and DM Series Overview 5-75
Doc# E107707 TOC - 7
Table of Contents
Electro Industries/GaugeTechThe Leader In Power Monitoring and Smart Grid SolutionsElectro Industries/GaugeTechThe Leader In Power Monitoring and Smart Grid Solutions
5.5.1: Retrieve and Send Device Profiles 5-76
5.5.2: General 5-77
5.5.3: Programming Limits 5-80
5.5.4: Alarm Limits (Voltage) 5-81
5.5.5: Alarm Limits (Current) 5-81
5.5.6: Alarm Limits (Power) 5-82
5.5.7: Alarm Limits % THD 5-83
5.5.8: Instantaneous or Average Limits 5-83
5.5.9: KYZ Pulse Output 5-84
5.5.10: Response Delay 5-85
5.5.11: Random Access 5-86
5.5.12: Relay Logic/Control 5-86
5.5.13: Historical Log Profile 5-88
5.5.14: Waveform Log Profile 5-91
5.6: Real Time Poll 5-92
5.7: Tools 5-93
5.8: Set Futura+ Time 5-94
5.9: Retrieve Futura+ Time 5-94
5.10: Reset EI Device Information 5-94
5.11: Retrieve Device Status 5-94
5.12: Low Level Access 5-95
5.13: Futura+ Analog Output Programmer 5-95

Doc# E107707 TOC - 8
Table of Contents
Electro Industries/GaugeTechThe Leader In Power Monitoring and Smart Grid SolutionsElectro Industries/GaugeTechThe Leader In Power Monitoring and Smart Grid Solutions
Chapter 6: Total Web Solutions
6.1: Overview 6-1
6.2: System Components 6-1
6.3: Hardware Connection 6-3
6.4: Initial Configuration 6-3
6.5: Basic Configuration Details 6-3
6.5.1: DHCP 6-4
6.5.2: Gateway Settings 6-5
6.6: Advanced Features 6-6
6.6.1: Services and Security 6-6
6.6.2: Computer Name/DNS 6.7
6.6.3: GE EGD Protocol 6-8
6.6.4: WebAlarm/Email 6-9
6.6.5: FTP Client 6-10
6.6.6: INP102/INP202 Ethernet/Modem Combination 6-12
6.6.7: DNP for LAN/WAN 6-16
6.7: Customizing Screens 6-20
6.7.1: Configuring WebExplorer 6-21
6.7.2: Configuring WebXML 6.26
6.7.2.1: Configuration File 6-35
6.7.2.2: Order of Data Processing for Generic Modbus Device 6-36
6.7.3: Configuring WebReacher 6-36
6.7.4: Configuring WebMod 6-40

Doc# E107707 TOC - 9
Table of Contents
Electro Industries/GaugeTechThe Leader In Power Monitoring and Smart Grid SolutionsElectro Industries/GaugeTechThe Leader In Power Monitoring and Smart Grid Solutions
6.7.5: Configuring WebAlarm 6-41
6.7.6: Configure Alarm Polling Options: Enter values within
the double quotes. 6-43
6.8: FTP Server 6-45
6.9: Update Network Card from Webpage 6-45
6.10: Update Network Card via Software 6-47
6.11: WebXML Flow Chart 6-49
6.12: WebExplorer Flow Chart 6-50
6.13: WebAlarm Flow Chart 6-51
Chapter 7: Real Time Polling
7.1: Overview 7-1
7.2: Real Time Readings 7-2
7.2.1: Instantaneous Polling 7-2
7.2.2: Poll Max and Min Readings 7-3
7.2.3: Poll Reading Grid 7-4
7.2.4: Poll Multiple Devices 7-5
7.2.5: Poll External Analog Inputs 7-6
7.3: Revenue, Energy and Demand Readings 7-7
7.3.1: Power 7-7
7.3.2: Demand 7-8
7.3.3: Energy 7-10
7.3.4: Energy, Pulses and Accumulations in the Interval 7-12
7.3.5: Frozen Energy, Pulses and Accumulations in the Interval 7-14
7.3.6: Internal KYZ Output Accumulations 7-15
Doc# E107707 TOC - 10
Table of Contents
Electro Industries/GaugeTechThe Leader In Power Monitoring and Smart Grid SolutionsElectro Industries/GaugeTechThe Leader In Power Monitoring and Smart Grid Solutions
7.3.7: Total Average Power Factor 7-16
7.3.8: Time of Use Registers 7-17
7.3.9: Poll Pulse Accumulations 7-18
7.3.10: Previous Average Block 7-19
7.3.11: Previous Scaled Energy Block 7-20
7.3.12: Mean, Block Max/Min for Interval 1 and 2 7-21
7.4: Power Quality and Alarms 7-22
7.4.1: Phasors 7-22
7.4.2: Poll Harmonics 7-24
7.4.3: Flicker 7-25
7.4.4: Alarm Status 7-27
7.4.5: Nexus ElectroLogic Status 7-28
7.4.6: Poll Internal Inputs 7-29
7.4.7: Poll Digital Input Option Cards 7-30
7.4.8: Voltage and Current Unbalance 7-31
7.4.9: Symmetrical Components 7-32
7.5: Shark® Series Polling Screens 7-33
7.5.1: Poll Real Time Trends 7-33
7.5.2: Poll Max and Min Readings 7-34
7.5.3: Poll Power and Energy 7-34
7.5.4: Poll Internal Digital Inputs 7-35
7.5.5: Poll Limits 7-35
7.5.6: Poll Accumulations 7-36
Doc# E107707 TOC - 11
Table of Contents
Electro Industries/GaugeTechThe Leader In Power Monitoring and Smart Grid SolutionsElectro Industries/GaugeTechThe Leader In Power Monitoring and Smart Grid Solutions
7.6: RTU Polling Screen 7-37
Chapter 8: Viewing Logs
8.1: Overview 8-1
8.2: Programming and Running Logs 8-3
8.3: Retrieving Logs 8-4
8.4: Viewing Logs with Communicator EXT's Log Viewer 8-6
8.5: Viewing Historical Trends and Snapshots 8-9
8.6: Sort 8-10
8.7: Viewing Graphs 8-11
8.7.1: Advanced Graph 8-12
8.7.2: XY and Circular Graphs 8-18
8.8: Viewing the Limits Log 8-22
8.9: Viewing the Waveform Log 8-23
8.10: Viewing Waveform Graphs 8-24
8.10.1: Interharmonic Analysis 8-31
8.11: Viewing the Power Quality Log 8-34
8.12: Viewing the Power Quality Graph 8-34
8.13: Database Status 8-36
8.14: AiReports 8-37
8.15: PQDIF Converter 8-38
8.16: COMTRADE Converter 8-38
8.17: HHF Converter 8-40
8.17.1: Enable HHF Converter 8-40

Doc# E107707 TOC - 12
Table of Contents
Electro Industries/GaugeTechThe Leader In Power Monitoring and Smart Grid SolutionsElectro Industries/GaugeTechThe Leader In Power Monitoring and Smart Grid Solutions
8.17.2: HHF Options Settings 8-40
8.17.3: Set Up Nexus® Logs for Use with HHF Converter 8-41
8.17.4: Set Up MV-90 for Use with Nexus® HHF Files 8-42
8.17.5: Import an HHF File in MV-90 8-45
8.17.6: HHF Files 8-46
8.17.7: Troubleshooting the HHF Converter 8-47
8.18: Status Change Log (Inputs) 8-48
8.19: Control Output Log (Relays) 8-49
8.20: Flicker Log 8-51
8.21: Reset Log 8-51
8.22: System Event Log 8-51
8.23: EN50160/IEC61000-4-30 Log 8-51
8.24: Transient Log 8-52
8.25: Shark® 200 Logs 8-54
8.25.1: I/O Change Log 8-56
8.26: Archiving Logs 8-57
Chapter 9: Modem Dial In / Dial Out Function
9.1: Overview 9-1
9.2: Setting the Dial-In Connection 9-1
9.3: Setting the Dial-Out Connection 9-3
9.4: Modem Dial-Out Programming 9-4
9.5: Dial-In Settings 9-7
9.6: Filter Screen 9-9

Doc# E107707 TOC - 13
Table of Contents
Electro Industries/GaugeTechThe Leader In Power Monitoring and Smart Grid SolutionsElectro Industries/GaugeTechThe Leader In Power Monitoring and Smart Grid Solutions
9.7: Modem Monitor 9-10
9.8: Nexus® Alarm Server 9-11
Chapter 10: Nexus® Time of Use
10.1: General Procedure 10-1
10.2: Creating a TOU Calendar Profile 10-2
10.3: Update a TOU Calendar Profile 10-12
10.4: Multi Calendar Update 10-14
10.5: Using the TOU Perpetual Calendar 10-15
10.5.1: Exporting a Perpetual Calendar to a Nexus® TOU
Calendar File 10-27
10.6: Viewing TOU Accumulated Data 10-29
Chapter 11: Nexus® External I/O Modules
11.1: Overview 11-1
11.2: Outline of the Procedure for Installing I/O Modules 11-2
11.3: How to Use Multiple I/O Modules 11-3
11.4: Steps to Determine Power Needed 11-3
11.5: I/O Modules' Factory-Settings and VA Ratings 11-4
11.5.1: Additional Power Source for I/O Modules 11-5
11.6: Assign Addresses and Baud Rates to an
External I/O Module 11-6
11.7: Enter I/O Modules in the Nexus® Meter's Device Profile 11-7
11.8: Configure the Analog Output Module 11-9
11.9: Configure the Analog Input Module 11-11
11.10: Configure the KYZ Output Module 11-13

Doc# E107707 TOC - 14
Table of Contents
Electro Industries/GaugeTechThe Leader In Power Monitoring and Smart Grid SolutionsElectro Industries/GaugeTechThe Leader In Power Monitoring and Smart Grid Solutions
11.11: Configure the Digital Output Module 11-15
11.12: Configure the Relay Outputs 11-16
11.13: Configuring the Digital Input Module 11-17
11.14: Nexus® I/O Device Status 11-19
11.15: Query I/O Module-Locating an Unknown Address
and Baud Rate 11-20
11.16: Locator Utility-Through Nexus® Meter Method 11-21
11.17: Locator Utility-Stand Alone Method 11-23
11.18: Stand Alone Programmer 11-26
Chapter 12: Security
12.1: Overview 12-1
12.2: Password Overview 12-1
12.3: Enable Bi-level Passwords 12-2
12.4: Disable Bi-level Passwords 12-3
12.5: Change Bi-level Passwords 12-4
12.6: Logging On and Off With Bi-level Passwords 12-4
12.7: Using the Extended Passwords Feature 12-5
12.7.1: Setting Up the Extended Passwords Feature 12-6
12.7.2: Logging On/Off With Extended Passwords 12-7
12.7.3: Viewing Extended Passwords Status 12-8
12.8: Sealing Switch Overview 12-9
12.9: Enable Sealing Switch 12-9
12.10: Disable Sealing Switch 12-10
12.11: View Sealing Switch Status 12-11

Doc# E107707 TOC - 15
Table of Contents
Electro Industries/GaugeTechThe Leader In Power Monitoring and Smart Grid SolutionsElectro Industries/GaugeTechThe Leader In Power Monitoring and Smart Grid Solutions
Chapter 13: Flash Upgrading Nexus® and Shark® Meters
13.1: Flash Overview 13-1
13.2: Flash Upgrade a Nexus® 12xx Series Meter 13-2
13.3: Flash Upgrade the Communicator EXT and DSP Firmware 13-6
13.4: Flash Upgrade the Nexus® External Display 13-10
13.5: Flash Upgrade the Nexus® Internal Modem Card 13-15
13.6: Flash Upgrade the Nexus® Internal Network Option 13-18
13.7: Flash Upgrade the Network Option Card 13-21
13.8: Flash Upgrade a Shark® Meter 13-21
13.9: Flash Upgrade a Nexus® 1500 Meter 13-23
Chapter 14: Energy Billing Module
14.1: Overview 14-1
14.2: Basic Energy Management 14-2
14.3: Cost Allocation 14-5
14.4: System Configuration 14-5
14.5: Operation Overview 14-6
14.6: Hardware and Software Installation and Setup 14-7
14.7: Using the Energy Billing Module 14-7
14.8: Demand Graphs 14-8
14.9: Demand Statistics 14-10
14.10: Bill Verification 14-11
14.11: Notes 14-12

Doc# E107707 TOC - 16
Table of Contents
Electro Industries/GaugeTechThe Leader In Power Monitoring and Smart Grid SolutionsElectro Industries/GaugeTechThe Leader In Power Monitoring and Smart Grid Solutions
Chapter 15: EIG Script & Scheduler Program
15.1: Overview 15-1
15.2: Operational Overview 15-3
15.3: Scripts 15-5
15.4: Script Report 15-6
15.5: Set Up a Script 15-7
15.6: Devices 15-8
15.7: Add/Edit a Script Device 15-9
15.8: Script Commands 15-12
15.9: Add a Script Command 15-13
15.10: Edit a Script Command 15-14
15.11: Delete a Script Command 15-16
15.12: Add Scripts to the Scheduler 15-17
15.13: Edit Scheduler Scripts 15-19
15.14: Delete Scheduler Scripts 15-20
15.15: Status 15-21
15.16: Exit 15-23
Chapter 16: Configuring EN50160/IEC61000-4-30 Power Quality Settings
16.1:Overview 16-1
16.2: Issues Addressed by the Power Quality
Compliance Standards 16-1
16.2.1: Mains Interference 16-1
16.2.2: Power Quality and Network Disturbances 16-2
16.2.2.1: Voltage Dips 16-2

Doc# E107707 TOC - 17
Table of Contents
Electro Industries/GaugeTechThe Leader In Power Monitoring and Smart Grid SolutionsElectro Industries/GaugeTechThe Leader In Power Monitoring and Smart Grid Solutions
16.2.2.2: Flicker 16-3
16.2.2.3: Transients 16-3
16.2.2.4: Harmonics 16-3
16.2.2.5: Frequency 16-4
16.3: Permanent Monitoring Provides Valuable Data 16-4
16.4: Power Quality Monitoring 16-5
16.5: EN50160/IEC61000-4-30 Setting 16-5
16.6: Downloading the EN50160/IEC61000-4-30 Log
(Nexus® 12xx meters) 16-7
16.7: Downloading the EN50160/IEC61000-4-30 Log
for the Nexus® 1500 Meter 16-12
Chapter 17: EN50160/IEC61000-4-30 Flicker
17.1: Overview 17-1
17.2: Theory of Operation 17-1
17.3: Setup 17-3
17.4: Software - User Interface 17-4
17.5: Logging 17-7
17.6: Polling 17-7
17.7: Log Viewer 17-7
17.8: Performance Notes 17-8
Chapter 18: Customizing DNP V3.00 Configuration for Nexus® 1252,
1262 & 1272 Meters
18.1: Connecting to Communicator EXT 18-1
18.2: Binary Input (Object 1) 18-2

Doc# E107707 TOC - 18
Table of Contents
Electro Industries/GaugeTechThe Leader In Power Monitoring and Smart Grid SolutionsElectro Industries/GaugeTechThe Leader In Power Monitoring and Smart Grid Solutions
18.3: Analog Input (Object 30) 18-2
18.4: Binary Counter (Object 20) 18-5
18.5: Binary Output (Object 10) 18-6
18.6: Global Values 18-9
18.7: DNP Settings 18-9
Chapter 19: Nexus® 1500 Meter
19.1: Overview 19-1
19.2: Basic Configuration Steps 19-1
19.3: Retrieve and Send Device Profiles 19-2
19.4: Device Profile General Settings 19-5
19.4.1: CT and PT Ratios and System Hookup 19-5
19.4.2: Limit and Waveform Full Scales 19-7
19.4.3: Time Settings 19-10
19.4.4: Labels 19-13
19.4.5: Communications 19-14
19.4.6: DNP Custom Class Map 19-18
19.4.7: Custom Modbus Map 19-19
19.4.8: Configure Log Sizes 19-23
19.5: Revenue and Energy Settings 19-24
19.5.1: Energy Scaling 19-25
19.5.2: Demand Integration Intervals 19-29
19.5.3: Internal KYZ Outputs (and Test LED Settings) 19-33
19.5.4: External Display Options 19-36

Doc# E107707 TOC - 19
Table of Contents
Electro Industries/GaugeTechThe Leader In Power Monitoring and Smart Grid SolutionsElectro Industries/GaugeTechThe Leader In Power Monitoring and Smart Grid Solutions
19.5.5: CT and PT Compensation 19-36
19.5.6: Transformer / Line Loss Compensation 19-37
19.5.7: Cold Load Pickup 19-40
19.5.8: Cumulative Demand Type 19-41
19.5.9: Energy, Pulses and Accumulations in the Interval 19-42
19.5.10: Pulse Accumulations 19-43
19.6: Power Quality and Alarm Settings 19-44
19.6.1: Limits 19-45
19.6.2: Electrologic Relay Control 19-54
19.6.3: Relay Assignments 19-58
19.6.4: Digital Inputs 19-59
19.6.5: PQ Thresholds (Waveform Recording) 19-60
19.6.6: EN50160/IEC61000-4-30 Flicker 19-66
19.6.7: I Squared T and V Squared T Thresholds 19-70
19.6.8: TDD Maximum Demand Reference Values 19-71
19.6.9: High Speed Inputs 19-72
19.6.10: Operational Status Output 19-73
19.6.11: Short Term Maximum, Minimum and
Average Interval 19-74
19.7: Trending Profile Settings 19-75
19.7.1: Programming the Trending Log Time Intervals 19-75
19.7.2: Programming the Trending Setup 19-78
19.7.3: Pad Missing Records for Historical Logs 19-80
19.8: External I/O Modules 19-82

Doc# E107707 TOC - 20
Table of Contents
Electro Industries/GaugeTechThe Leader In Power Monitoring and Smart Grid SolutionsElectro Industries/GaugeTechThe Leader In Power Monitoring and Smart Grid Solutions
19.8.1: Configuring the Output Modules 19-82
19.8.2: RTU Setting 19-85
19.9: Edit LCD Programmable Settings 19-87
19.10: Set Device Time 19-88
19.11: Retrieve Device Time 19-89
19.12: Reset Device Information 19-90
19.13: Reset EN50160/IEC61000-4-30 Information 19-90
19.14: I/O Board Status 19-91
19.15: Relay Control 19-92
19.16: Performing CT & PT Compensation 19-93
19.17: Test Internal KYZ Status 19-96
Chapter 20: Configuring the MP200 Metering System 20-1
20.1: MP200 Metering System Configuration 20-1
20.1.1: Connect to the MP200 Unit 20-1
20.2: Using Connection Manager 20-6
20.3: Disconnecting from the MP200 Unit 20-11
20.4: Configuring the MP200 Metering System’s Device Profile 20-12
20.4.1: Configuring CT, PT Ratios and System Hookup 20-13
20.4.2: Configuring Time Settings 20-16
20.4.3: Configuring System Settings 20-17
20.4.4: Configuring Communications 20-20
20.4.5: Configuring Energy Settings 20-22
20.4.6: Configuring Limits 20-26

Doc# E107707 TOC - 21
Table of Contents
Electro Industries/GaugeTechThe Leader In Power Monitoring and Smart Grid SolutionsElectro Industries/GaugeTechThe Leader In Power Monitoring and Smart Grid Solutions
20.4.7: Configuring Historical Logs 20-30
20.4.8: Configuring Historical Log Sectors 20-34
20.4.9: Configuring Relay Assignments 20-36
20.4.10: Configuring Digital Input Settings 20-38
20.5: MP200 Metering System’s Tools Menu 20-40
20.6: MP200 Metering System’s Polling Screens 20-46
20.6.1: Instantaneous Polling 20-47
20.6.2: Poll Max and Min Readings 20-48
20.6.3: Short Term Max and Min Readings 20-50
20.6.4: Energy and Max Demands 20-51
20.6.5: Energy 20-52
20.6.6: Demand 20-53
20.6.7: Accumulations 20-54
20.6.8: Interval Energy 20-55
20.6.9: Phasors 20-56
20.6.10: Poll External Digital Inputs 20-59
20.6.11: Poll Limits 20-59
20.7: MP200 Metering System’s Logging Screens 20-60
20.7.1: MP200 Metering System Logs 20-60
20.7.2: Retrieving and Viewing Logs 20-60
20.7.3: Log Viewer Screens 20-65
Appendix A: Component Files (For Script & Scheduler) A -1

Doc# E107707 TOC - 22
Table of Contents
Electro Industries/GaugeTechThe Leader In Power Monitoring and Smart Grid SolutionsElectro Industries/GaugeTechThe Leader In Power Monitoring and Smart Grid Solutions
Appendix B: Transformer / Line Loss Compensation
Calculation Worksheets B -1
B.1: What is System Loss Compensation? B-1
B.1.1: EIG Loss Calculator Overview B-2
B.2: Loss Model B-3
B.3: Loss Triangles and Calculations B-4
B.4: System Losses B-5
B.4.1:Transmission Line Losses B-5
B.4.2: Substation Conductor Losses B-5
B.4.3: Total System Losses B-6
B.4.4: Meter Loss Coefficients B-6
B.4.5: Dynamic Compensation Calculations B-6
B.4.6: Transmission Line Charging Current B-6
B.5: Nexus® Meter Loss Compensation Settings B-8
B.5.1: Common Compensation Examples B-11
B.5.1.1: Example 1 B-12
B.5.1.2: Example 2 B-13
B.5.1.3: Example 3 B-14
B.5.1.4: Example 4 B-16
8.5.1.5: Loss Calculation References B-17
B.5.2: Four Quadrant Power Flow Conventions B-18
B.6: EIG Loss Compensation Calculator Instructions
and Example B-18
B.6.1: EIG Loss Compensation Calculator Instructions B-19

Doc# E107707 TOC - 23
Table of Contents
Electro Industries/GaugeTechThe Leader In Power Monitoring and Smart Grid SolutionsElectro Industries/GaugeTechThe Leader In Power Monitoring and Smart Grid Solutions
B.6.2: Example 1 Data - System Losses B-22
B.6.2.1: Example 1 Spreadsheet System Losses B-24
B.6.2.2: Example 1 Spreadsheet - Xmfr Loss B-25
B.6.2.3: Example 1 Spreadsheet - Line Loss B-26
B.6.2.4: Example 1 Spreadsheet - Substation Losses B-27
B.6.3: Example 2 Data - Transformer Losses B-28
B.6.3.1: Example 2 Spreadsheet - System Transformer Losses B-29
B.6.3.2: Example 2 Spreadsheet - Xmfr Loss B-30
B.6.3.3: Example 2 Spreadsheet - Line Loss B-31
B.6.3.4: Example 2 Spreadsheet - Substation Losses B-32
B.6.4: Example 3 - Transformer Losses Data B-33
B.6.4.1: Example 3 Spreadsheet - System Losses B-34
B.6.4.2: Example 3 Spreadsheet - Xmfr Loss B-35
B.6.4.3: Example 3 Spreadsheet - Line Loss B-36
B.6.4.4: Example 3 Spreadsheet - Substation Losses B-37
Appendix C: Communicator EXT Command Line
Arguments Version 1.11 C-1
C.1: Script Command Line Methods C-1
C.2: Application Command Line Methods C-1
Appendix D: DNP Custom Class Map Readings for
Nexus® 1250 Meters D-1
Appendix E: Ethernet Network Error Codes Reported by
Any Software that uses Ethernet (Including
Communicator EXT) E-1

Doc# E107707 TOC - 24
Table of Contents
Electro Industries/GaugeTechThe Leader In Power Monitoring and Smart Grid SolutionsElectro Industries/GaugeTechThe Leader In Power Monitoring and Smart Grid Solutions
Appendix F: Detailed Network Card Information F-1
F.1: Comparison of Network Cards F-1
F.2: GE EGD Details F-2
F.3: Troubleshooting the Network Connection F-8
F.4: Total Web Solutions MEGA Page F-9
F.5: Updating Network Firmware through Software:
Optional Procedure F-11
F.6: Nexus 1500 Meter Network Card Feature Support F-12
Appendix G: TFTP Server Program Setup G-1
Glossary Glossary-1
e Electro Industries/GaugeTech Doc # E107707 1-1
Chapter 1Installing Communicator EXT
1.1: System Requirements
•• IBM-PC Compatible, Pentium 200MHz or better•• Windows® OS versions: 2000, XP, 2003, Vista, 7.•• 32 MB RAM•• XVGA Card and Monitor with 1024x768 and 65k colors•• Available RS232 Serial Port
1.2: Installing Communicator EXT Software
1. Start Windows®. Insert the Communicator EXT CD into your computer’s CD drive.Communicator EXT can be used with the following EIG meters: all Nexus® meters, Shark® Seriesmeters, CPU 1000, DM Series meters.
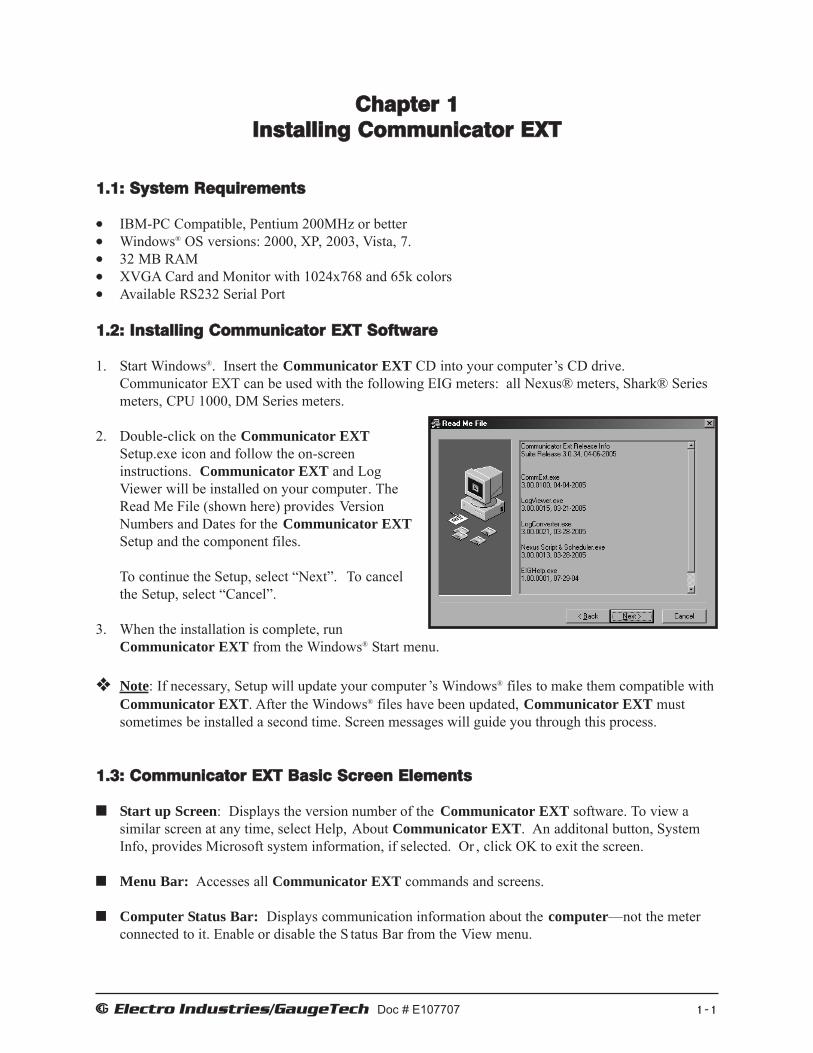
2. Double-click on the Communicator EXTSetup.exe icon and follow the on-screen instructions. Communicator EXT and Log Viewer will be installed on your computer. TheRead Me File (shown here) provides VersionNumbers and Dates for the Communicator EXTSetup and the component files.
To continue the Setup, select “Next”. To cancel the Setup, select “Cancel”.
3. When the installation is complete, runCommunicator EXT from the Windows® Start menu.
Note: If necessary, Setup will update your computer ’s Windows® files to make them compatible withCommunicator EXT. After the Windows® files have been updated, Communicator EXT mustsometimes be installed a second time. Screen messages will guide you through this process.
1.3: Communicator EXT Basic Screen Elements
Start up Screen: Displays the version number of the Communicator EXT software. To view a similar screen at any time, select Help, About Communicator EXT. An additonal button, SystemInfo, provides Microsoft system information, if selected. Or , click OK to exit the screen.
Menu Bar: Accesses all Communicator EXT commands and screens.
Computer Status Bar: Displays communication information about the computer—not the meterconnected to it. Enable or disable the S tatus Bar from the View menu.

e Electro Industries/GaugeTech Doc # E107707 1-2
Menu Bar Icons:Access to all Communicator EXT features.
Menu Bar
Tool Bar
Computer Status Bar
Start Up Screen displaysRelease Date and Version Number
Main Screen
Profile:Retrieves the Device Profile from the currently connected meter . Same as selecting Tools >Edit Current Device Profile. Use to configure the meter . See Chapters 3, 4, 5.
Retrieve Logs:Downloads logs from the currently connected meter to the computer . Same as selecting Logs>Retrieve Log(s) from Device. See Chapter 8.
Open Log:Opens a previously retrieved Device Log File. Same as selecting File>Open>EI Device LogFile. See Chapter 8.
Connection Manager:Establishes communication between the computer and multiple meters at local or remote sites.Same as selecting Connection>Connection Manager. See Chapter 2.

e Electro Industries/GaugeTech Doc # E107707 1-3
Connect:Establishes communication between the computer and one directly connected meter . Same asselecting Connection>Quick Connect. See Chapter 2.
Disconnect:Terminates the connection between the computer and the currently connected meter . Same asselecting Connection>Disconnect. See Chapter 2.
Polling:Displays instantaneous polling data from the currently connected meter . Same as selecting Real Time Poll>Instantaneous Polling. See Chapter 7.
Energy:Displays Power and Energy readings from the currently connected meter.
THD:Displays Magnitude and Angle readings for Volts and Current values. Spectrum presentsselected Magnitude in bar graph. Waveform combines Magnitudes and Angles in a graph.
Phasors:Displays three-phase phasor diagram and data from the currently connected meter . Same asselecting Real Time Poll>Phasors. See Chapter 7.
EN50160/IEC61000-4-30 Flicker:Displays Instantaneous, Short Term and Long Term Readings. Same as selecting Real Time Poll>Power Quality & Alarms>Flicker. See Chapter 17.
Log Status:Displays logging statistics for the currently connected meter . Same as selectingLogs>Statistics. See Chapter 8.
Device Status:Displays list of the currently connected meter. Same as selecting Tools>Device Status. SeeChapter 2.
Alarms:Displays the Limit Status Screen for currently connected meter. Same as selecting Real TimePoll>Power Quality & Alarms >Alarm Status. See Chapter 9.

e Electro Industries/GaugeTech Doc # E107707 1-4
•• Connection Status: displays either “Connected”, “Disconnected” or “Not Found”.
•• Communication Port: displays the computer port currently in use for the connection.
•• Baud Rate: displays the baud rate of the computer ’s communication port.
•• Device Address: displays the address of the connected device.
•• Device Name: displays the name of the connected device.
•• Communication Protocol: displays the communication protocol currently in use.
•• Date and Time: displays the computer’s current date and time.
•• Protection Status: displays whether the password protection feature is enabled or disabled.
Computer Status Bar - When using Serial Port or Modem Connection to the Meter.
Connection Status
Communication Port
Communication Port’s Baud Rate
Device Address
Device Name
Communication Protocol
Protection Status
Memo

e Electro Industries/GaugeTech Doc # E107707 1-5
Computer Status Bar - When using Network Connection to the meter.
•• Connection Status: displays either “Connected”, “Disconnected” or “Not Found”.
•• Communication Port: displays the computer port currently in use for the connection.
•• Network Protocol: displays the protocol for communication to the network.
•• Device Address: displays the address of the connected device.
•• Device Name: displays the name of the connected device.
•• Communication Protocol: displays the protocol used for communication to other devices.
•• Protection Status: displays whether the password protection feature is enabled or disabled.
•• Low Battery / Modem Battery Status: displays “Low Bat Nexus” on the Nexus® 1260/1270/1262/1272 meter when the meter requires a battery and if the Internal or Modem battery islow, dead or missing.
Connection Status
Communication Port
Network Protocol
Device Address
Device Name
Communication Protocol
Protection Status
Low Battery / Modem Battery Status(Only if Battery is Required)

e Electro Industries/GaugeTech Doc # E107707 1-6
1.4: Help
Help Menu:Displayed above, it provides the following sources of information:
Contents:Click on the Contents button to display the Index Page of the Help Files. To access Links to Topics, click on the Bookmarks tab and scroll through Chapters. Double-click on Chapter to view all topics in that chapter. Click on Topic to view Help on that topic.
Electro Industries Web Site: Link to Web Site.
Check for Software UpdatesClick on Software Updates. Communicator EXT will automatically search the Electro Industries website for updates for you. If the software does find updates, Communicator EXT will ask you if you would like to“Update Now?” You can click Yes or No.
WARNING: Average File Size is 20MEG. High Speed Internet access is recommended.
NOTE: This feature only works if you are connected to the Internet at the time you click Software Updates. This feature utilizes the Internet to provide the updates.
About Communicator EXT: Screen displays software version number and Microsoft ® systems information. It is similar to the S tart Up screen in section 1.3.

e Electro Industries/GaugeTech Doc # E107707 1-7
1.5: Software License
Communicator EXT V3.0 is shipped in Lite Mode. While the software is in Lite Mode, it can beinstalled on your computer and used with an Electro Industries meter . While in Lite Mode, somefeatures are disabled or limited. A list of those features appears below.
Installation is easy. Insert the disk into your computer . An installation screen will appear to walkyou through the simple process. Once installation is complete, you will have to restart your computer to finish the installation.
Enter Registration Number for Full AccessTo access all the features of the software, you must enter a Registration Number . The RegistrationNumber is a 20-digit number supplied to the licensee by EIG at the time software is purchased.
How software can be purchased: Call Sales at Electro Industries (516) 334-0870.Email [email protected] your Regional Sales Representative
How to Enter Registration Number:From the Help Menu, click Software License.
This screen appears.Type in the 20-digit Registration Number.After Registration Number is entered, clickApply or Cancel.
Lite Mode Disabled and Limited Features
1. No Device Address greater than “1” can be used and no Output Modules can be used.If you change the address to anything but “1”, you will not be able to communicate with the meter.
2. Some Log Viewer Features are disabled:Cannot view data from multiple devices.Cannot run multiple instances.Cannot print pages to a printer.
3. Script & Scheduler Features disabled:Cannot print pages to a printer.
4. Script & Scheduler Features Limited:Scheduler only runs one script.Each script only allows one device at Address 1.
NOTE: Refer to the next page to view the Communicator EXT Software License.

e Electro Industries/GaugeTech Doc # E107707 1-8
Single Site and Multi-Site License Agreement for Communicator EXT 3.0
Electro Industries/GaugeTech’s (“EIG”) Communicator EXT 3.0 Software Suite (“the software”) isavailable in both a single and a multi-site format. When purchasing a license to this software, the licensee can purchase a license with the following two options:
1. The Single Site license allows Communicator EXT to be installed on one computer only within a purchased single user or corporate entity.
2. Purchase of the Communicator EXT 3.0 software’s Multi-site license allows the purchaser to install the software on an unlimited number of computers, up to but not exceeding the corporate entity that purchased said software.
Purchasing this software constitutes only the sale of a license to use said software as above stated. AllIntellectual Property and publishing rights are retained by EIG. No entity shall have any right to resellsaid software without express written permission by the maker EIG. Software is licensed as is and assuch there are no warranties whether express or implied other than as to the physical CD ROMmedia. EIG is not responsible for any consequential damages as a result of use of this software. Alldisputes concerning this license are subject to jurisdiction in the Supreme Court in S tate of New Yorkand under New York Law.

E Electro Industries/Gauge Tech Doc# E107707 1-9
1.6: Feature Comparison for Nexus® Meter Models The Nexus® meter is available in a number of models, each with an array of features. The Table below lists the Nexus® meter models and the possible features for each model.
* With 512 K or higher memory. ** With 2 Meg or higher memory. *** With V-Switch™ key 2. **** The Nexus® 1500 meter has internal Ethernet standard. ***** The Nexus® 1500 meter has a separate log for In-rush Current: the Event Triggered log.
Nexus® Meter Model Number Feature 1252 1260 1270 1262 1272 1500
Transformer / Line Loss Compensation Yes Yes Yes Yes Yes Yes CT & PT Compensation Yes Yes Yes Yes *Historical Logs Yes Yes Yes Yes Yes Yes
**PQ & Waveform Logs Yes Yes Yes Yes
Pulse Accumulations Yes Yes Yes Yes Yes
Program External Output Modules Yes Yes Yes Yes Yes Yes
Programmable Onboard Display Yes Yes Yes Yes Yes
Test Mode Yes Yes Yes Yes
DNP Level 1 + Custom Class Map Yes Yes
DNP Level 2 + Custom Class Map Yes Yes Yes Yes
Internal KYZ Outputs Yes Yes Yes Yes Yes
Custom Modbus Map Level 2 1 1 2 2 2
INP2 Modem with Dial Out Option Yes Yes Yes Yes Yes
INP200 Ethernet Capability Yes Yes Yes Yes Yes Yes****
INP202 Combo Card Yes Yes
Flicker Yes Yes Yes
17V Internal Power for Output Modules To 12 VA
Scaled Energy Yes Yes Yes Yes
Programmable Energy Register Rollover Yes Yes
**Manual Waveform Capture Yes Yes Yes Yes
Power Quality Test (EN50160) Yes*** Yes
Measuring In-rush Current by Historical Log 2 Yes No*****
Second Ethernet Option Yes
Internal Relay Output Option Yes
Internal KYZ with dual RS485 Option Yes

e Electro Industries/GaugeTech Doc # E107707 1-10
Paths: View or change the paths thatCommunicator EXT uses to store any copied, exported or retrieved data. Either:
Highlight a directory path and click theGo to Selected Directory button. Aslong as the path is valid, a window forthe directory will open. If the path is notvalid, you will see a message telling youto browse for a valid directory path.Highlight a directory path and click theBrowse for Directory button to open aWindows Explorer window that willallow you to locate the directory pathyou want to use. When you have foundit, click OK to insert the path into theOptions screen.
Data Scan Mode: The number is the amount of time(in milliseconds) to wait, before performing anotherscan.
Tech Mode Settings: Enter Password to Enable Tech Mode. If a Password is not entered, Tech Mode will remain disabled.
1.7: Options
Select Options from the View menu. Click the tabs to show the following screens:
Log Retrieval: Click the first box on thisscreen to keep a log from being updated while itis being retrieved. Note underneath reads - Thissetting is not recommended.
Click the second box to Disable Backup of theretrieved log file.
Click the third box to Enable the software toPad missing records (from when meter is not inNormal Operation Mode and not recording)with value of 0 for each log retrieval process.

e Electro Industries/GaugeTech Doc # E107707 1-11
Energy Billing Module: Click the box on thisscreen to Enable the Energy Billing Module. TheEnergy Billing Module can help you manage yourLoad Profile (see Chapter 14).
Miscellaneous: Click the box on this screen toEnable the Kh/Ke Test Pulse Calculation screen.Set the Ethernet Packet Delay in milliseconds.Some systems may require a longer delay if they are slow.
Click Enable HHF Converter, if desired.Click the HHF Options button to view the follow-ing settings.
HHF Options:Log: Check Log 1 or 2
Scaling Value: An integer by which all input values are divided before being placed into theHHF file. When using Communicator EXT: 1 = WProgram accordingly.
HHF File Path: Root directory for all HHF files.A folder for each meter with converted files is cre-ated in this path and .hhf files for that meter areplaced in that folder. Default Directory for HHFFolders: CommExt/Retrieve logs/HHF files
Exit HHF Options Button: Return to Miscellaneaous screen.
Language: The default selection of CommunicatorEXT is English. To select another language, chooseone of the available options from the pull-downmenu.
Click Apply to execute the changes; click OK to return to the main Communicator EXT screen.

E Electro Industries/GaugeTech Doc#E107707 1-12
This page intentionally left blank.

e Electro Industries/GaugeTech Doc # E107707 2-1
Chapter 2Connecting to an EIG Meter
2.1: Overview
There are seven ways to connect to an EIG meter:
• RS232 Direct Connect (Section 2.2) (For Fiber Optic, Optical Port, IrDA connections)
• RS485 Direct Connect (Section 2.2)
• RS232 Modem Connect (Section 2.3)
• RS485 Modem Connect (Section 2.3)
• RS485 Internal Modem Option (Section 2.4)
• RS485 Internal Network Option - Optional Network Card (Section 2.6)
• USB Virtual Serial Comm Port (Nexus® 1500 meter - see Appendix A of the Nexus® 1500 MeterInstallation and Operation Manual for instructions.)
Direct Connections made through Communicator EXT must use either Modbus RTU or ModbusASCII protocol. Modbus RTU is recommended.
Modem Connections (Internal or External) made through Communicator EXT must use ModbusASCII only.
Network Connections made through Communicator EXT must use Modbus TCP.
Section 2.5 details connecting to multiple meters on an RS485 bus.
Consult the User Manual for your meter model for details on the hardware requirements of each configuration.
NOTE: The Nexus® 1252, 1262, 1272, and 1500 meters include customizable DNP V3.00 Level2. Except for DNP Level 2 and Waveforms, use 1262/1272 directions for 1260/1270 meters,unless otherwise noted.
NOTE: If you are using the Connection Manager to connect a PC to an EIG meter , you may wantto copy the Connection Manager Settings to other PCs. Simply copy the file Cnexcom.mdb fromComputer A to Computer B using the same directory for source and destination. See Section 2.10for instructions.
IMPORTANT! Make sure Communicator EXT is not running on the destination computerwhen replacing the file.
e Electro Industries/GaugeTech Doc # E107707 2-2
2.2: RS232, RS485 and Network Connections
Follow these instructions for a direct connection to one Nexus ® device. To connect to multiple EIGunits on an RS485 bus, see sections 2.4 and 2.5.
SERIAL CONNECTIONS1. Insert an RS232 cable into an available serial port on the computer (or a USB cable into a
computer’s USB port - Nexus® 1500 meter, only.) • RS232: Insert the opposite end of the cable into the meter ’s RS232 port (1252 - Port 1)
(1262/1272 - Optical Port). Set 1252 selector switch to RS232. See Chapter 5 of the Nexus®
1262/1272 Meter Installation and Operation Manual for details on the Optical Port connection. The Nexus® 1500 meter also has an optical port: see Chapter 19 for configuration.
• USB: Insert the opposite end of the USB cable into the Nexus ® 1500 meter’s USB port.NOTE: The Nexus® 1500 meter has a virtual Comm port that allows you to connect to themeter via a computer’s USB port. See Appendix A of the Nexus® 1500 Meter Installationand Operation Manual for detailed instructions.
• RS485: Insert the opposite end of the cable into the RS232 port of an RS232/RS485 converter, such as EIG’s Unicom 2500 (see the meter ’s Installation and Operation Manuals fordetails). Use an RS485 cable to connect the converter to any port on the Nexus ® 1252 meter. Ifyou use Port 1, set the selector switch to RS485. For Nexus ® 1262/1272 meters, use Port 1 orPort 4. For the Nexus® 1500 meter, use one of the two optional RS485 ports.
2. Click the Connect icon on the Icon bar or select Connect>Quick Connect. You will see the screenshown below. If you click the Network button, the screen changes to the one shown on the nextpage.
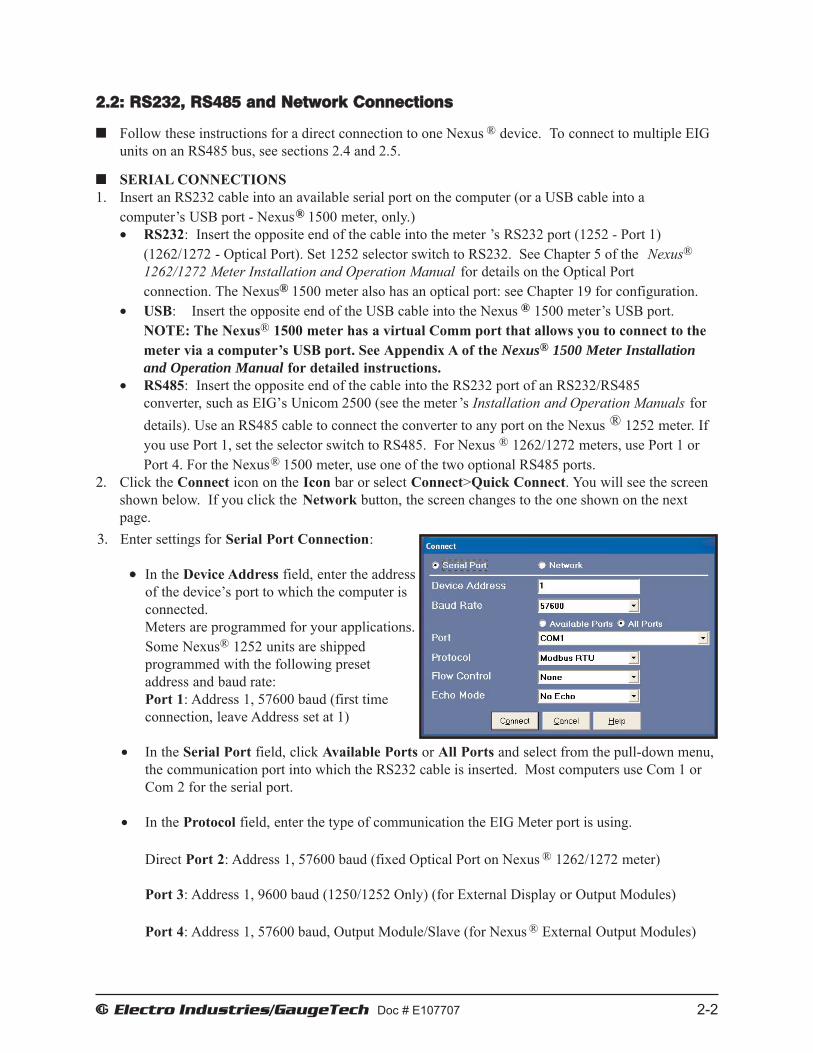
3. Enter settings for Serial Port Connection:
•• In the Device Address field, enter the addressof the device’s port to which the computer is connected. Meters are programmed for your applications.Some Nexus® 1252 units are shipped programmed with the following presetaddress and baud rate:Port 1: Address 1, 57600 baud (first time connection, leave Address set at 1)
• In the Serial Port field, click Available Ports or All Ports and select from the pull-down menu,the communication port into which the RS232 cable is inserted. Most computers use Com 1 orCom 2 for the serial port.
• In the Protocol field, enter the type of communication the EIG Meter port is using.
Direct Port 2: Address 1, 57600 baud (fixed Optical Port on Nexus ® 1262/1272 meter)
Port 3: Address 1, 9600 baud (1250/1252 Only) (for External Display or Output Modules)
Port 4: Address 1, 57600 baud, Output Module/Slave (for Nexus ® External Output Modules)
e Electro Industries/GaugeTech Doc # E107707 2-3
NOTE: You may use a connected Nexus® External Display to view the baud rate, address and communication protocol of each port. See your meter ’s Installation and Operation Manuals fordetails. See Chapter 3 (1252), Chapter 4 (1262/1272), Chapter 5 (Shark® Series), and Chapter 19(1500) for details of how to configure the meter ’s communication ports.
• In the Baud Rate field, enter a baud rate that matches the baud rate of the Nexus® device’s portto which your computer is connected. The port’s baud rate, address and protocol must alwaysmatch the baud rate, address and protocol of the computer . See Preset Addresses above.
• In the Protocol field, enter the type of communication the EIG Meter port is using. DirectConnections made through Communicator EXT must use either Modbus RTU. All Nexus®
meter port defaults are Modbus RTU and the meters are shipped set to Modbus RTU.• In the Flow Control field, enter None for a Nexus® meter.• In most cases, Echo Mode should be No Echo. If you are connecting to a meter with a Fiber
Optic card whose switch is set to “Echo On,” select Static Echo from the pull-down menu.Example: in the sample screen on the previous page, the computer's Com Port 1 has been set tooperate at 57600 baud, using Modbus RTU to communicate with a meter port located at address 1.The baud rate, address and protocol set for the computer ’s Com Port 1 match those of the meter port.
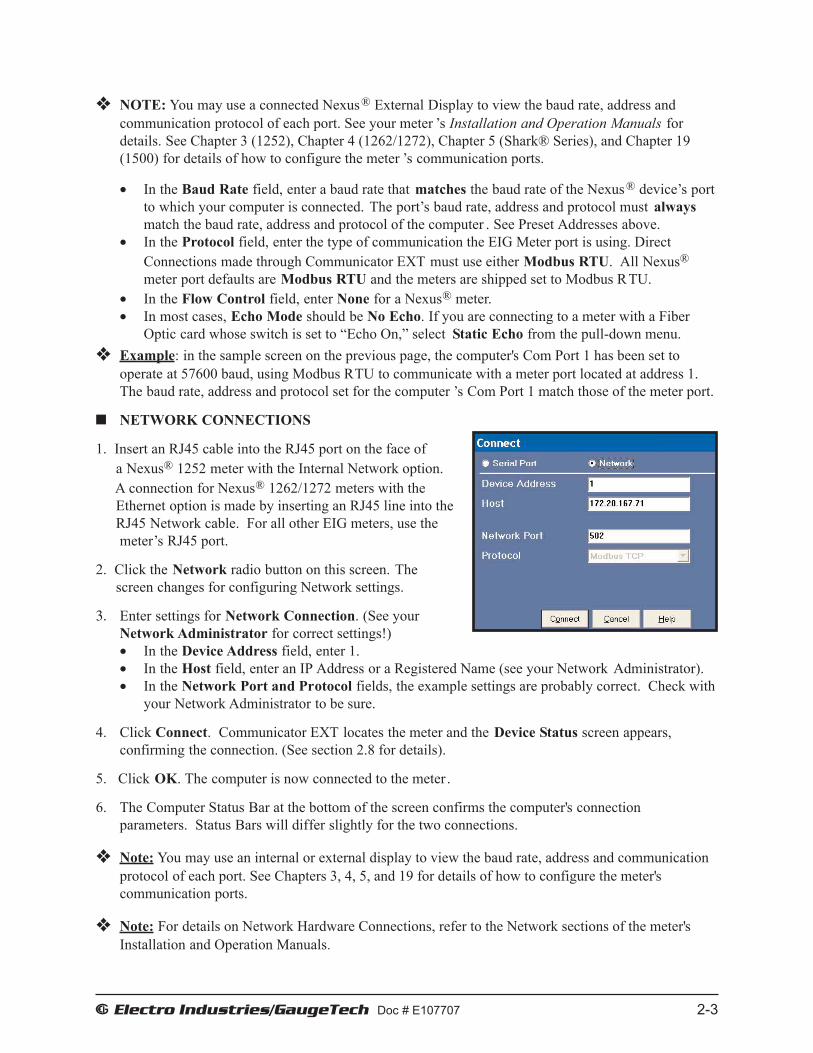
NETWORK CONNECTIONS
1. Insert an RJ45 cable into the RJ45 port on the face of a Nexus® 1252 meter with the Internal Network option.A connection for Nexus® 1262/1272 meters with theEthernet option is made by inserting an RJ45 line into theRJ45 Network cable. For all other EIG meters, use themeter’s RJ45 port.
2. Click the Network radio button on this screen. The screen changes for configuring Network settings.
3. Enter settings for Network Connection. (See yourNetwork Administrator for correct settings!)• In the Device Address field, enter 1.• In the Host field, enter an IP Address or a Registered Name (see your Network Administrator).• In the Network Port and Protocol fields, the example settings are probably correct. Check with
your Network Administrator to be sure.
4. Click Connect. Communicator EXT locates the meter and the Device Status screen appears, confirming the connection. (See section 2.8 for details).
5. Click OK. The computer is now connected to the meter .
6. The Computer Status Bar at the bottom of the screen confirms the computer's connectionparameters. Status Bars will differ slightly for the two connections.
Note: You may use an internal or external display to view the baud rate, address and communicationprotocol of each port. See Chapters 3, 4, 5, and 19 for details of how to configure the meter's communication ports.
Note: For details on Network Hardware Connections, refer to the Network sections of the meter'sInstallation and Operation Manuals.

e Electro Industries/GaugeTech Doc # E107707 2-4
2.3: RS232 and RS485 Modem Connections
MODEM CONNECTIONS REQUIRE MODBUS ASCII PROTOCOL.
1. The meter’s communication port that you will use for the modem connection must be configured to speak/listen to Modbus ASCII and operate at 9600 baud or match the speed of theremote modem. (Modbus RTU does not support modem communication. If you use Modbus R TUto communicate with a modem, it will fail or be unreliable.) To set the configuration, you must:
• First establish a direct RS232 or RS485 connection to the meter (see Section 2.2).
• After you have established a direct connection, refer to Chapters 3 (1252) and Chapter 4(1262/1272) for details on how to configure the Nexus ® meter’s communication ports. Set theport to Modbus ASCII at 9600 baud. (If you are connecting to multiple Nexus ® meters on a bus,you must also assign a unique address to each meter; see Section 2.5.)
2. Install the modem connected to the computer (the “originate modem”) and the modem connected tothe EIG Meter (the “remote modem”). See the Installation and Operation Manuals for the meter(s)in use for details on the hardware requirements. At the remote site:
• EIG recommends using RS485 communication with a Modem Manager . Set both the originateand the remote modem to operate at 9600 baud; enable Hardware Flow Control for both. If youare using a Modem Manager, you can set the baud rate for the meter higher (up to 38400).Generally, it will provide reliable communication.
• If you are using RS232 communication without a Modem Manager, set both modems to operate at 9600 baud; disable Flow Control for both.
3. Click on the Connection Manager icon, or select Connection, Connection Manager . The followingscreen appears: (To copy the Connection Manager Settings to other PCs, see Section 2-10.)
4. Select the “New Location” listing in the Locations Field.

e Electro Industries/GaugeTech Doc # E107707 2-5
5. Click the Edit button. The Location Editor screen appears, displaying the computer’scommunications settings:
• Enter a Location Name in the field at the top of the screen.
• In the Com Port field, enter the computer’s communication port that is connected to the computer’s modem (the originate modem).
• In the Baud Rate field, enter a baud rate for the computer ’s modem that will match the baudrate of the remote modem and the meter port.
• In the Flow Control field, select the originate modem’s configuration.
• Leave the Data Bits field at 8 for Modbus ASCII. Other protocols may require a dif ferentsetting.
• Leave the Parity field at None for Modbus ASCII. Other protocols may require a dif ferentsetting.
• Click the Use Modem box.
• Enter the phone number of the remote modem.
• Enter a setup string in the Setup String field, if the originate modem has been used for anotherprogram and needs to be reset.
• Use the Data Switch section to send any Data Switch Strings to the remote modem. The typical Data Switch String from Nexus® meter to the Substation Multiplexor to a PC: ,,%%%,,PTnnCheck with the manual of the device you are using to create the Data Switch String appropriatefor the device. Typical characters used at Electro Industries include:

e Electro Industries/GaugeTech Doc # E107707 2-6
, (pause one second)%%% (escape sequence or switch to command mode)PTnn (command) (number 01-16)Enter (<CR> ASCII character 13 )
6. Click the Add Serial or Add Net button in the Devices at Location section to add meters to thislocation.
7. Select the new device and click the Edit button to edit its location information. The Location DeviceEditor screen appears, displaying the meter ’s communications settings. To switch to a Networkconnection, click the Network button in the upper right corner.
•• In the Device Address field, enter the address assigned the meter port you will use for thisconnection. If you are connecting to multiple meters, each one should have a unique address; seesection 2.5.
• In the Name field, enter a unique name for the device at the location.
• IN THE PROTOCOL FIELD, SELECT MODBUS ASCII. Be sure the port has beenpreviously set to Modbus ASCII, as detailed in step 1.
• Leave the Device Type field set to the meter model, e.g. NEXUS ® (meter).
• Set the Comm Port.
• Click the Close button when all of the information has been entered.
8. • If you are connecting to multiple EIG Meters at this location, repeat the above process for allEIG Meters that are on the bus. Each EIG device MUST have a unique address.
• To remove devices, select the device and click Remove.
9. Click the Close button when you have finished adding or removing devices. The first ConnectionManager screen returns.

e Electro Industries/GaugeTech Doc # E107707 2-7
10. • To add additional locations, click the Add Button. • To Sort locations:
a. Use the pull-down menu to select a sort method: A-Z, Z-A, Newest-Oldest or Oldest-Newest.b. Click Sort By.
• To remove locations, select the location and click Remove.
11. Click once on the location you want to connect your computer to. • You can only connect to one location at a time. • To change to a different location, you must first disconnect from the current location by clicking
the Disconnect button or by selecting Disconnect from the Connection menu.
12. Click Connect. The computer begins dialing:
13. When Communicator EXT has located the EIG Meter(s) at the location, the Device Status screenappears, confirming the connection (see section 2.8 for details). The Computer Status Bar at the bottom of the screen confirms the computer ’s connection parameters.
If the connection fails, check that all cables are secure, that the RS232 cable is connected to the correct Com Port on the computer, and that the computer and the EIG device(s) are each set at 9600Baud Rate, and using Modbus ASCII.

e Electro Industries/GaugeTech Doc # E107707 2-8
2.4: RS485 Internal Modem Option Connection
INTERNAL MODEM OPTION CONNECTION REQUIRES MODBUS ASCII PROTOCOL.
Some Nexus® meters offer an Internal Modem Option, which eliminates all the modem hardwareand cable that used to be required for a modem connection. A modem connection is now as easy asplugging in a phone. Simply install the modem connected to the computer (the originate modem)and add a phone line. The meter must be configured to speak Modbus ASCII. (Modbus RTU doesnot support modem communication. If you use Modbus R TU to communicate with a modem, it willbe unreliable or fail.) The Internal Modem Option may operate at a programmable baud rate up to57600. We recommend a baud rate of 57600. To set the configuration, you must:
1. Install the modem connected to the computer (the “originate modem”). See the Installation andOperation Manual for the meter in use for details on the hardware requirements.
• Set the originate modem to operate at 57600 baud; enable Hardware Flow Control. See NOTEabout Baud Rate in Step 5 below.
2. At the remote site, just plug a phone line into the meter . The address will be 1. (If you are connecting to multiple Nexus® units on a bus, you must also assign a unique address, other than 1,to each unit; see section 2.5.)
3. Click on the Connection Manager icon, or select Connection>Connection Manager. The follow-ing screen appears: (To copy the Connection Manager Settings to other PCs, see NOTE on page 2-1.)
4. Select the “New Location” listing in the List of Locations field.
5. Click the Edit button. The Location Editor screen appears, displaying the computer’scommunications settings:

e Electro Industries/GaugeTech Doc # E107707 2-9
• Enter a Location Name in the field at the top of the screen.
• In the Com Port field, enter the computer’s communication port that is connected to the computer’s modem (the originate modem).
• In the Baud Rate field, enter 57600 (recommended baud rate for internal modem connections). NOTE: For modems prior to V.90, use a lower baud rate. Example: 38400 for a 33.6k modem, 19200 for a 14.4k modem.
• In the Flow Control field, select the originate modem’s configuration.
• Leave the Data Bits field at 8 for Modbus ASCII. Other protocols may require a dif ferentsetting.
• Leave the Parity field at None for Modbus ASCII. Other protocols may require a dif ferentsetting.
• Click the Use Modem box.
• Enter the Phone Number for the location of the Internal Modem Option Nexus ® meter.
• Enter a Setup String in the Setup String field, if required. For U.S. Robotics modems, the dataswitch string is: &F1 Or, check with the manual of the device you are using to create the DataSwitch String appropriate for the device.
6. Click the Add Serial button in the Devices at Location section to add up to 31 EIG units at thatlocation (32 total). Use Port 2 (1252) or Port 3 (1262/1272) of the Internal Modem Option Nexus® meter to add additional units. Each unit must speak Modbus ASCII and must be set to the same baud rate as theNexus® meter. NOTE: Additonal units DO NOT have to be Internal Modem units.

e Electro Industries/GaugeTech Doc # E107707 2-10
7. Select the new device and click the Edit button to edit its location information. The Location DeviceEditor screen appears, displaying the EIG unit’s communications settings.
•• In the Device Address field, enter the address assigned to the additional EIG unit. Again, eachunit MUST have a unique address other than 1; see section 2.5.
• In the Name field, enter a name for the device that will dif ferentiate it from any others at thatlocation.
• IN THE PROTOCOL FIELD, SELECT MODBUS ASCII.
• Leave the Device Type field set to the meter model, e.g. NEXUS ® (meter).
• Set the Comm Port.
• Click the Close button when all information is entered.
8. • If you are connecting to multiple EIG units at this location, repeat the above process for all EIGunits that are on the bus. Each EIG device MUST have a unique address.
• To remove devices, select the device and click Remove.
9. Click the Close button when you have finished adding or removing devices. The first ConnectionManager screen returns.

e Electro Industries/GaugeTech Doc # E107707 2-11
10. • To add additional locations, click the Add button. • To Sort locations:
a. Use the pull-down menu to select a sort method: A-Z, Z-A, Newest-Oldest or Oldest-Newest.b. Click Sort By.
• To remove locations, select the location and click Remove.
11. Click once on the location that you want to connect your computer to. • You may only connect to one location at a time. • To change to a different location, you must first disconnect from the current location by clicking
the Disconnect button or by selecting Disconnect from the Connection menu.
12. Click Connect. The computer begins dialing.
13. When Communicator EXT has located the EIG device(s) at that location, the Device S tatus screenappears, confirming the connection (see section 2.8 for details). The Computer Status Bar at the bottom of the screen confirms the computer ’s connection parameters.
If the connection fails, check that all cables are secure, that the RS485 cable is connected to theModem connection on the Modem unit, and that other EIG units are set at 57600 baud using ModbusASCII.
e Electro Industries/GaugeTech Doc # E107707 2-12
2.5: Connecting to Multiple EIG Meters on an RS485 Bus
1. Individually program a unique address, the same baud rate and the same communicationprotocol for each EIG meter that will be on the bus. Because an EIG device’ s ports operateindependently, you need only configure the address and baud rate of the port that will be connectedto the bus. To do this:
• First, connect directly to each EIG meter individually, as detailed in section 2.2;
• Configure the EIG meter communication port you will be using for the connection as shown inthe chapter for your meter model. Each device connected to a single port MUST be pro-grammed with a unique address. The single port must be programmed with the same baudrate and protocol as the EIG devices on the bus (Modbus RTU for direct connections; ModbusASCII for modem connections—see sections 2.2, 2.3 and 2.4 for details on connections).
2. Consult the Installation and Operation Manual for the EIG devices in use for the hardware requirements of an RS485 bus. You must link the port of one EIG meter to the port of the next meterthroughout the chain. The ports used must be those that were individually configured with a uniqueaddress in step 1 of this section.
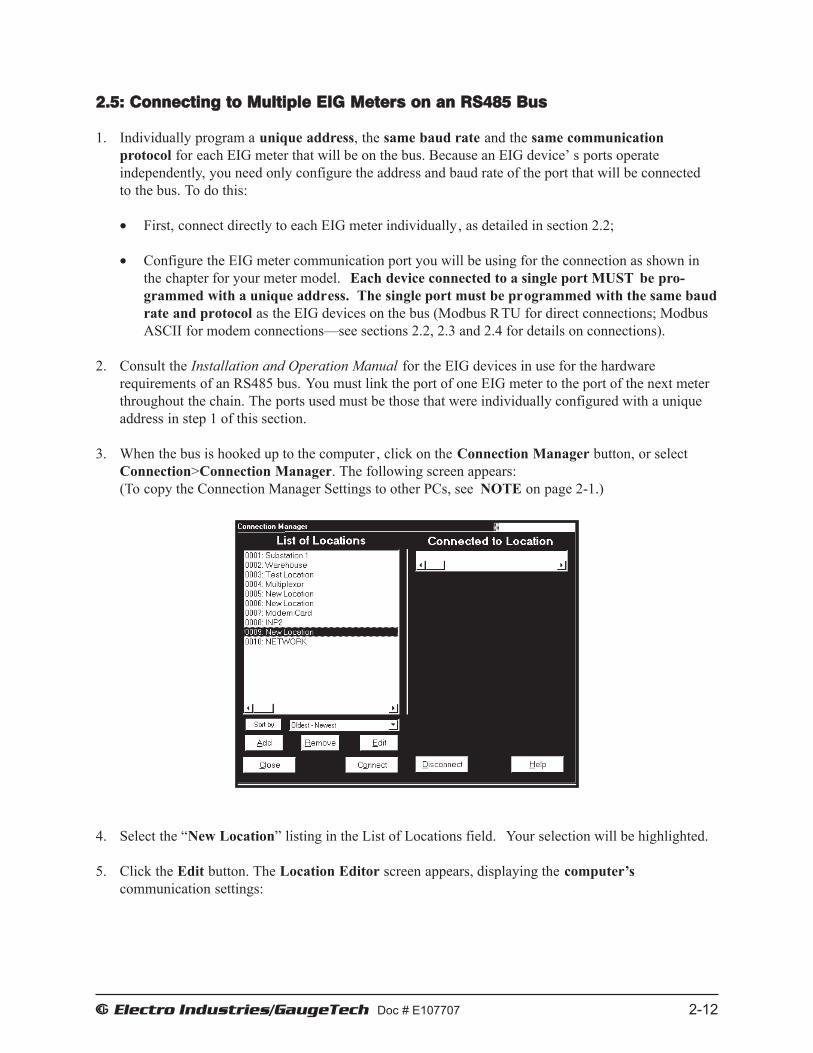
3. When the bus is hooked up to the computer , click on the Connection Manager button, or selectConnection>Connection Manager. The following screen appears:(To copy the Connection Manager Settings to other PCs, see NOTE on page 2-1.)
4. Select the “New Location” listing in the List of Locations field. Your selection will be highlighted.
5. Click the Edit button. The Location Editor screen appears, displaying the computer’scommunication settings:
e Electro Industries/GaugeTech Doc # E107707 2-13
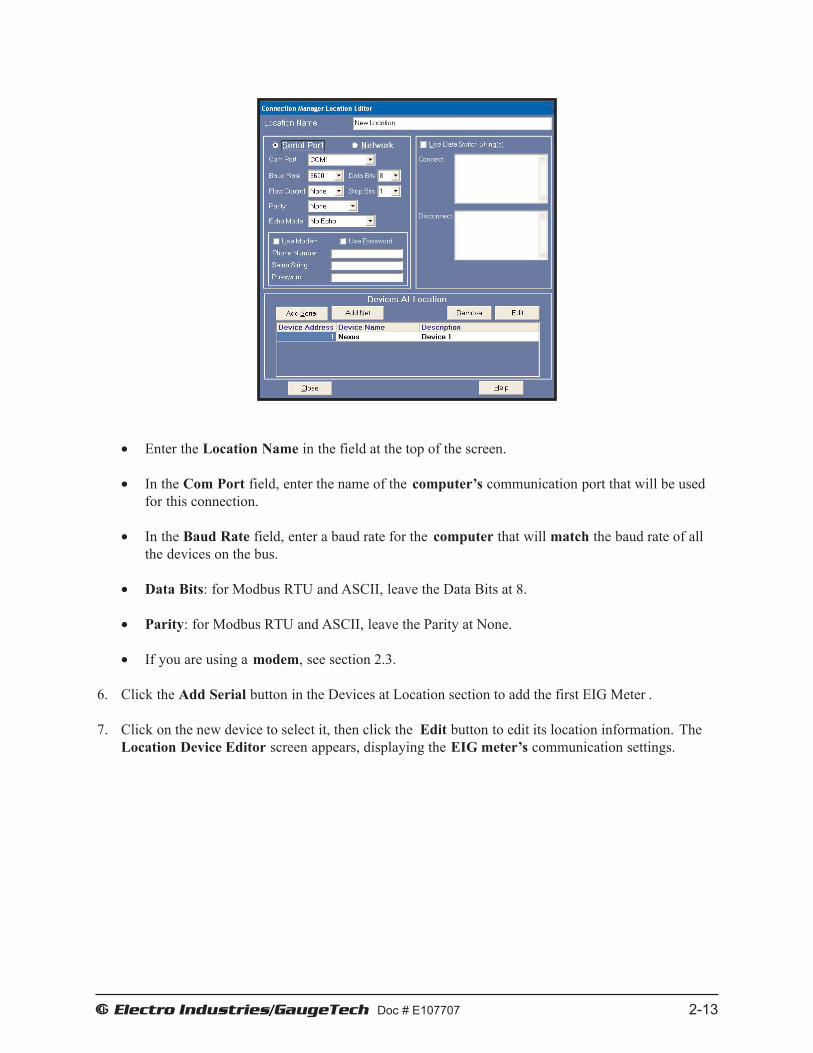
• Enter the Location Name in the field at the top of the screen.
• In the Com Port field, enter the name of the computer’s communication port that will be usedfor this connection.
• In the Baud Rate field, enter a baud rate for the computer that will match the baud rate of allthe devices on the bus.
• Data Bits: for Modbus RTU and ASCII, leave the Data Bits at 8.
• Parity: for Modbus RTU and ASCII, leave the Parity at None.
• If you are using a modem, see section 2.3.
6. Click the Add Serial button in the Devices at Location section to add the first EIG Meter .
7. Click on the new device to select it, then click the Edit button to edit its location information. TheLocation Device Editor screen appears, displaying the EIG meter’s communication settings.

e Electro Industries/GaugeTech Doc # E107707 2-14
•• In the Device Address field, enter the unique address assigned to the EIG Meter ’s communication port in Step 1.
• In the Name and Description fields, enter a name and brief description for the device that willdifferentiate it from others at the location.
• In the Protocol field, enter the protocol the EIG meter will be using (Modbus R TU for directconnections, Modbus ASCII for modem connections—see sections 2.2, 2.3 and 2.4 for details).All protocols across the bus must be the same.
• Leave the Device Type field set to the meter model, e.g. NEXUS ® (meter).
• Set the Comm Port.
• Click the Close button when the information is complete.
8. • Repeat this process for all the EIG meters that are on the bus, making sure each device has aunique address.
• To remove devices, select and click Remove.
9. Click the Close button when you have finished adding or removing devices. The first ConnectionManager screen returns.

e Electro Industries/GaugeTech Doc # E107707 2-15
10. • To add other locations, click the Add Button and follow the above procedure to edit them. • To Sort locations:
a. Use the pull-down menu to select a sort method: A-Z, Z-A, Newest-Oldest or Oldest-Newest. b. Click Sort By.
• To remove locations, select and click Remove.
11. Click once on the location that you want to connect your computer to. • You may only connect to one location at a time. • To change to a different location, you must disconnect from the current location by selecting it
and clicking Disconnect.
12. Click Connect. When the connection is made, the selected location appears in the Connected ToLocations section.
13. Click Close. The Device Status screen appears, confirming the connection (see section 2.8 fordetails). The Computer Status Bar at the bottom of the screen confirms the computer ’s connectionparameters.
14. See section 2.6 for information on viewing data from the dif ferent EIG meters included in the location.
If the connection fails, check that all cables are secure, that the RS232 cable is connected to the correct Com Port on the computer, and that the computer and the EIG device(s) are each set to thesame baud rate and protocol.

e Electro Industries/GaugeTech Doc # E107701 2-16
2.6: Internal Network Connection Option
The Nexus® meter offers an Internal Network option, allowing it to communicate over a Network.Connect the meter to a computer using Port 1 (Nexus ® 1252 meter) or Port 3 (Nexus® 1262/1272meter), configured for a network connection. Refer to Section 2.2 for instructions on performing adirect Network connection to a meter.
NOTES: • The Internal Network option operates internally at a fixed Baud Rate of 1 15200.• The meter must be configured to speak Modbus TCP, which is the common protocol for Modbus
communication over a Network.
2.7: Changing the Primary Device
One copy of Communicator EXT connected to multiple EIG Devices (Section 2.5) may only viewdata or edit Device Profiles from one device at a time—the Primary Device. (An exception is thePoll Multiple Devices screen; see Chapter 7 for details.)
To change the Primary Device:
1. Select Connection>Change Primary Device. You will see the screen shown below.
2. From the pull-down men, select the address of the device you want to designate as the PrimaryDevice.
3. Click OK.
4. The Device Status screen (reached by clicking the Device Status icon or by selectingTools>Retrieve Device Status) will now list the new Primary Device first. See section 2.9 fordetails on the Device Status screen.

e Electro Industries/GaugeTech Doc # E107707 2-17
2.8: Disconnecting from an EIG Meter
To disconnect from an EIG meter or a location, do one of the following:
• Click the Disconnect icon.
• Select Connection>Disconnect from the Title bar.
• Click the Connection Manager icon. Select the location from the List of Locations and click the Disconnect button.
• Select Connection>Connection Manager from the Title bar. Select the location from the List of Locations field and click the Disconnect button.
Note: When using a modem, it is important to disconnect from communicating so that the remotemodem receives a “hang up” command. Some modems may “freeze” when improperly disconnected.
2.9: Device Status
The Device Status screen displays information about the EIG devices connected to your computer. Below is an example of the Device Status screen for a Nexus® 1252 meter. The DeviceStatus screen you see depends on the meter model you are connected to. See the next page for theNexus® 1500 meter’s Device Status screen.
To open the Device Status screen, click the Device Status icon or select Tools>Retrieve DeviceStatus. The following fields are displayed in the screen shown above. Use the Scoll bars to view allof the fields.
• Device: The Primary device is listed first. See Section 2.5 for details.• Device Type: The meter model, e.g., Nexus 1252.• Boot: Version number of the EIG Initialization and Diagnostic Firmware. This firmware runs first
on power-up. This firmware is not field upgradeable.• Run-time: Version number of the Communicator EXT Operating Firmware. See Chapter 13 for
details on upgrading firmware.• DSP Boot: Version number of the DSP Initialization and Flash Reprogrammer. This firmware runs
first on power-up. This firmware is not field upgradeable.• DSP Run-time: Version number of the DSP operating firmware. See Chapter 13 for details on
upgrading firmware.• Com State: Health status of the communication processor.• DSP State: Health status of the DSP processor.• On Time: Date and time at which the EIG meter was last powered up.
Click and drag to expand field

e Electro Industries/GaugeTech Doc # E107707 2-18
• Serial Number: The device’s unique identification number.• NVRAM: Amount of NVRAM (nonvolatile RAM) available to the device. This memory is used
for logs.• Protection: Status of the Password protection function (see Chapter 12). Scroll to the right to find
this section of the Device Status Bar.• Xilinx DSP• Xilinx COM
You will see the Device Status screen shown above if you are connected to a Nexus ® 1500 meter. Use the scroll bars to view all of the fields. The displayed fields are:
• Device• Device type• Serial number• Comm Boot/Comm Run• DSP1 Boot/DSP1 Run• DSP2 Run• FPGA• DSP2 Run ID/DSP2 Run Type• V-Switch• Comm State• DSP1 State/DSP2 State• Protection• On time• CF Serial #• CF FAT Type• CF Model #• Comm Boot Variation Strings/Comm Run Variation Strings• DSP1 Boot Variation Strings/DSP1 Run Variation Strings• DSP2 Run Variation Strings• Current Class
Click OK to close the Device Status screen.

Electro Industries/GaugeTech Doc # E107707 2-19
2.10: Merging Connection Databases
This feature allows you to combine two sets of cnexcom databases.
1. Click Connection>Merge Connection Databases.
You will see the screen shown below. It allows you to selectthe two cnexcom databases to merge.
2. Click the Browse button next to each field to select the two databases. The Source cnexcomdatabase will be merged into the Destination cnexcom database.
3. Click the Merge button to proceed with the merge; Click OK to exit the screen.

Electro Industries/GaugeTech Doc # E107707 2-20
This page intentionally left blank.

E Electro Industries/GaugeTech DOC # E107707 3-1
Chapter 3 Configuring the Nexus®1250/1252 Meter
3.1: Overview
Communicator EXT enables you to configure a Nexus® 1250/1252 meter’s Programmable Settings, which are stored in the unit’s Device Profile. Click on the + in front of each group of settings to view the menu. To configure Nexus® 1260/70/1262/72 meters, see Chapter 4; to configure Nexus® 1500 meters, see Chapter 19; to configure Shark® Series and Futura+ meters, see Chapter 5.
Basic steps in configuring a Nexus® meter: 1. Retrieve the Nexus® meter’s Device Profile (Section 3.2). 2. Configure the Programmable Settings stored in the Device Profile (Sections 3.3 – 3.7). 3. Send the new Device Profile back to the Nexus® meter (Section 3.2). IMPORTANT!: If you click the Save, Load or Update buttons, you must have a unique Meter Destination Label so that the file is saved, loaded or updated to the intended device.
Also included in this chapter: • Setting and retrieving device time (Section 3.8) • Resetting Nexus® meter information (Section 3.9) • Manual Waveform Capture (Section 3.10)
NOTES: • Actual programming screens may vary depending on the options ordered with your meter. • The settings shown are Initial settings for the Nexus® 1252 meter, unless otherwise noted.
Most 1250 settings are similar to the 1252 settings. Refer to Section 1.6 for a comparison of Nexus® Model features.
• The Nexus® 1252 meter supports DNP Level 2. For details on DNP Level 2, see Chapter 18 of this manual or refer to DNP V3.00 Protocol Assignments for Nexus® 1252, 1262, and 1272 Meters.

E Electro Industries/GaugeTech DOC # E107707 3-2
3.2: Retrieve and Send Device Profiles
1. Click the Profile icon or select Tools>Edit Current Device Profile. Communicator EXT retrieves the programmable settings from the currently connected Nexus® meter. You will see the following screen as the settings are being retrieved.
2. After the settings have been retrieved, you will see
the Device Profile screen, shown on the right.
3. This screen contains all the programmable settings currently stored in the Nexus® meter you are
connected to. Click on the + in front of each
group to view the settings in that group.
4. Configure each of the programmable settings by clicking on the (+/-) icon and then double-clicking on the selected parameter. (See Sections 3.3–3.7 for details on editing each setting.)
5. After you have finished configuring any or all of the programmable settings, use the Buttons at the bottom of the screen to execute the following tasks:
• Click Update Device to implement Device Profile changes. This sends the new, edited
Device Profile to the Nexus® meter. You must update the Nexus® Device Profile for any changes to the programmable settings to take effect. When you click Update Device, the meter retrieves the Programmable Settings and then displays the screen shown on the next page. Click on any item you do not want to change when the new Device Profile is sent. Click Continue to update or click Cancel to cancel the update.
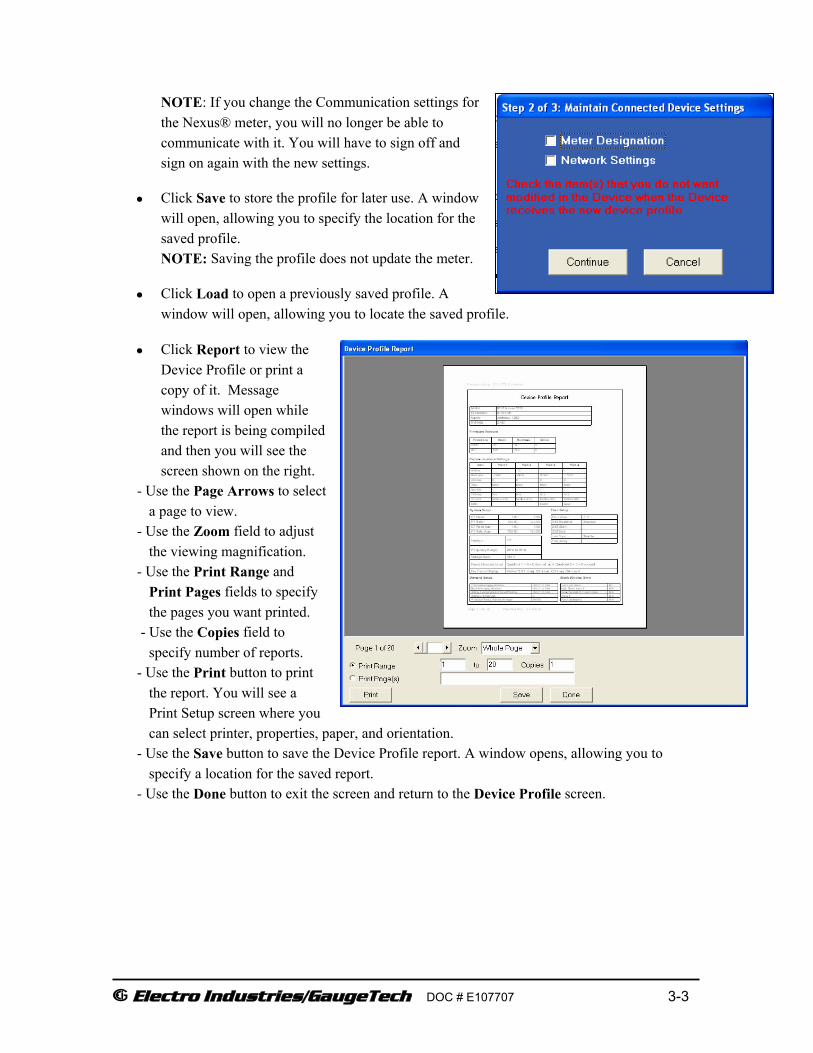
E Electro Industries/GaugeTech DOC # E107707 3-3
NOTE: If you change the Communication settings for the Nexus® meter, you will no longer be able to communicate with it. You will have to sign off and sign on again with the new settings.
• Click Save to store the profile for later use. A window will open, allowing you to specify the location for the saved profile. NOTE: Saving the profile does not update the meter.
• Click Load to open a previously saved profile. A window will open, allowing you to locate the saved profile.
• Click Report to view the Device Profile or print a copy of it. Message windows will open while the report is being compiled and then you will see the screen shown on the right.
- Use the Page Arrows to select a page to view.
- Use the Zoom field to adjust the viewing magnification.
- Use the Print Range and Print Pages fields to specify the pages you want printed.
- Use the Copies field to specify number of reports.
- Use the Print button to print the report. You will see a Print Setup screen where you can select printer, properties, paper, and orientation.
- Use the Save button to save the Device Profile report. A window opens, allowing you to specify a location for the saved report.
- Use the Done button to exit the screen and return to the Device Profile screen.

E Electro Industries/GaugeTech DOC # E107707 3-4
3.3: General Settings 1. From the Device Profile screen (see Section 3.2),
double-click on the General Settings line or click the + button next to it. All of the settings in the General Settings group are listed.
2. Click on the Programmable Setting you would
like to modify. The following sections explain the settings in the order in which they appear in the General Settings menu.
3.3.1: CT and PT Ratios and System Hookup 1. From the Device Profile screen (see Section 3.2),
click the + button next to General Settings, then click the + button next to CT, PT Ratios and System Hookup. You will see the submenu pictured on the right.
This screen displays the current Device Profile’s settings for CT, PT ratios and connection type. The values shown here are only an example.
2. Double-click on any of the settings. You will see the CT and PT Ratios screen.
3. Make changes to this screen according to the requirements of your application.
NOTE: When you change a PT or CT Ratio, Communicator EXT updates the corresponding Full Scale value entered in the Limit and Waveform Full Scales setting. When you click OK on this screen, Communicator EXT opens the Limit & Waveform Full Scales screen so that you can verify the settings (see Section 3.3.2).

E Electro Industries/GaugeTech DOC # E107707 3-5
Using the pull-down menu, choose the Hookup mode that matches the connection you have to the Nexus® meter. Choose from one of the following: Wye, Delta 3 CTs, Delta 2 CTs, 2.5 Element Wye, 4 Wire Delta. See the Nexus® 1250/1252 Meter Installation and Operation Manual for diagrams.
NOTE: Changes to the Operational Frequency Range do not change the Full Scale value for Frequency. Changes must be made in the Limits and Waveform Full Scales Setting screen. Like voltage and current, the nominal value should be used. For example, use 50 for 50Hz.
4. Click OK. You will see a screen that asks you to verify the Kh/Ke Ratio for the Test Pulse setting. Kh/Ke Ratio is Secondary Watthour constant over kWh (the energy).
NOTE: If the Ke screen does not appear, go to View>Options>Miscellaneous and click the checkbox to enable the Kh/Ke Test Pulse Calculation screen.
5. Click Yes to accept the Ke setting or click No to reject the setting. You can reenter values in the CT & PT Ratio screen to get the setting you want.
6 Click OK in the CT & PT Ratio screen. If changes have been made, a message window opens asking you to verify that the Limit Full
Scales are correct.
7. Click OK. The Limit and Waveform Full Scales screen opens (see Section 3.3.2).
8. To implement any changes, click the Update Device button to send a new profile to the meter.
NOTE: You will see a warning message that logs will be reset, and you will be given the opportunity to retrieve the logs before they are cleared. Resetting the logs prepares the meter for placement in a new installation or change of the meter’s transformers.
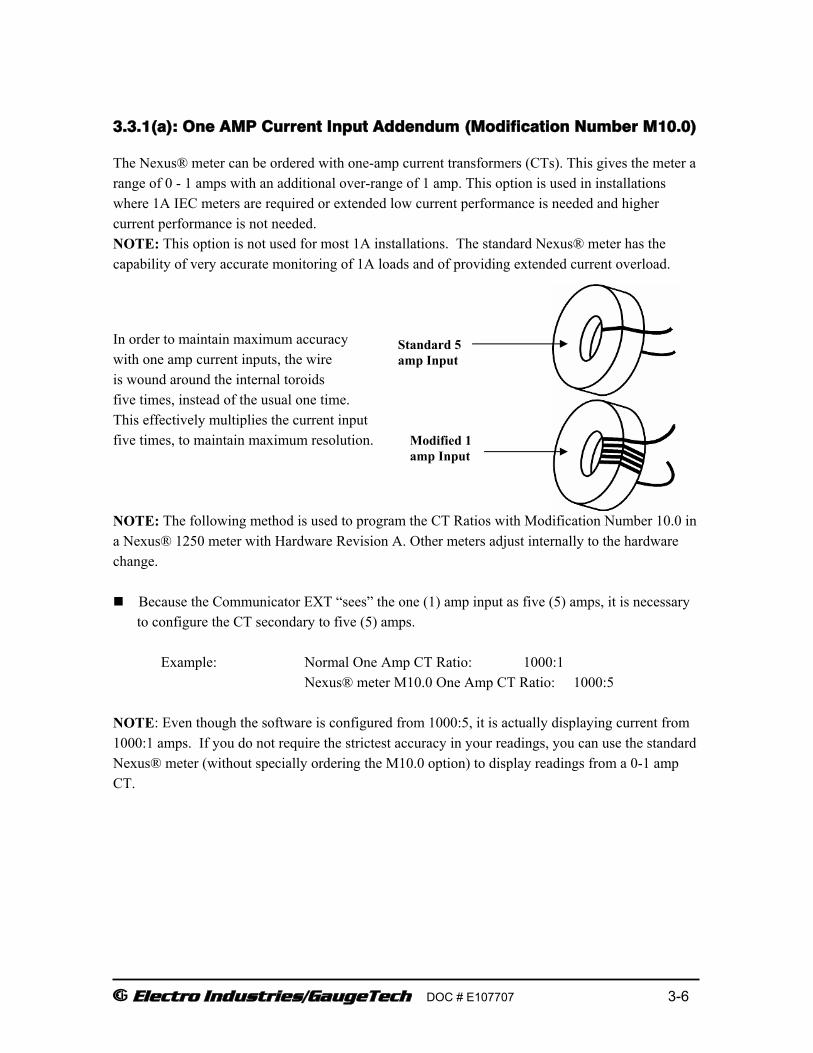
E Electro Industries/GaugeTech DOC # E107707 3-6
3.3.1(a): One AMP Current Input Addendum (Modification Number M10.0)
The Nexus® meter can be ordered with one-amp current transformers (CTs). This gives the meter a range of 0 - 1 amps with an additional over-range of 1 amp. This option is used in installations where 1A IEC meters are required or extended low current performance is needed and higher current performance is not needed. NOTE: This option is not used for most 1A installations. The standard Nexus® meter has the capability of very accurate monitoring of 1A loads and of providing extended current overload.
In order to maintain maximum accuracy with one amp current inputs, the wire is wound around the internal toroids five times, instead of the usual one time. This effectively multiplies the current input five times, to maintain maximum resolution. NOTE: The following method is used to program the CT Ratios with Modification Number 10.0 in a Nexus® 1250 meter with Hardware Revision A. Other meters adjust internally to the hardware change. Because the Communicator EXT “sees” the one (1) amp input as five (5) amps, it is necessary
to configure the CT secondary to five (5) amps. Example: Normal One Amp CT Ratio: 1000:1 Nexus® meter M10.0 One Amp CT Ratio: 1000:5 NOTE: Even though the software is configured from 1000:5, it is actually displaying current from 1000:1 amps. If you do not require the strictest accuracy in your readings, you can use the standard Nexus® meter (without specially ordering the M10.0 option) to display readings from a 0-1 amp CT.
Standard 5 amp Input
Modified 1 amp Input

E Electro Industries/GaugeTech DOC # E107707 3-7
3.3.2: Limit and Waveform Full Scales
All Limit and Waveform settings (see Sections 3.5.1 and 3.5.3, respectively) are based on a percentage of the Full Scale. Full Scales are based on the CT and PT ratios (see Section 3.3.1).
Set the CT and PT ratios first; Communicator EXT automatically recalculates the Full Scales every time the CT and PT ratios change and presents them for your verification.
1. From the Device Profile screen (see Section 3.2), click on the + button beside Limit and Waveform Full Scales or double-click on the Limit and Waveform Full Scales line. You will see the submenu shown on the right.
This screen displays the current Device Profile’s settings for the Limit and Waveform Full Scales. (The values shown here are only an example.)
NOTE: Frequency and Voltage values are nominal values. The Phase Power is computed using nominal voltage and rated maximum current. 2. Double-click any of the settings. You will see
the Limit and Waveform Full Scales screen.
3. Enter the Full Scale for each parameter:
• The Limits and Waveform settings (Sections 3.5.1 and 3.5.3, respectively) are based on a percentage of the Full Scales entered here.
• Communicator EXT automatically recalculates the Full Scales Voltages, Currents and Power every time the CT and PT ratios change. Frequency is not changed, even if the Range Selection is changed. Frequency must be changed on this screen.
• Power Phase is the amount of power per each phase.
• Power Total is the power of all phases combined.
4. When all changes are entered, click OK to return to the main Device Profile screen. For these changes to take effect, you must click the Update Device button. This sends the new profile to the meter.

E Electro Industries/GaugeTech DOC # E107707 3-8
3.3.3: Time Settings
To edit a Device Profile’s Time Settings: 1. From the Device Profile screen (see Section 3.2),
click on the + button next to General Settings, then double-click on the Time Settings line. You will see the submenu pictured on the right.
DST stands for Daylight Savings Time.
2. Double-click on any of the programmable settings; you will see
the Time Settings screen. 3. Make changes to this screen according to the
requirements of your application.
Zone Descriptor: A Zone Descriptor sets the Time Zone for the Nexus® meter.
0 = Greenwich Mean Time Consult the chart below to find the Zone Descriptor for your
Time Zone.
GMT Greenwich Mean Time Table (Dublin, London) -1.00 Azores +1.00 Brussels, Paris, Warsaw -2.00 Mid-Atlantic +2.00 Athens, Cairo, Helsinki -3.00 Buenos Aires, Georgetown +3.00 Baghdad, Kuwait, Moscow, Tehran -4.00 Atlantic Time (Canada), Santiago +4.00 Kabul, Baku -5.00 Eastern Time (USA and Canada), Lima +5.00 Karachi -6.00 Central Time (USA and Canada), Mexico City +6.00 Dhaka -7.00 Mountain Time (USA and Canada) +7.00 Bangkok, Hanoi, Jakarta -8.00 Pacific Time (USA and Canada), Tijuana +8.00 Beijing, Hong Kong, Singapore -9.00 Alaska +9.00 Osaka, Sapporo, Seoul -10.00 Hawaii +10.00 Brisbane, Melbourne, Guam, Hobart -11.00 Midway Island +11.00 Magadan, Solomon Islands -12.00 Eniwetok +12.00 Auckland, Fiji

E Electro Industries/GaugeTech DOC # E107707 3-9
Daylight Savings Information: Disabled: Disables an automatic adjustment for Daylight Savings Time.
Auto DST: Sets Daylight Savings Time automatically to the pre-2007 standard for the United States: the time changes automatically occur at 2:00 AM (your local time), on the first Sunday in April and the last Sunday in October. Auto DST U.S. EPA 2005: Sets Daylight Savings Time automatically to the 2007 standard for the United States: the time changes automatically occur at 2:00 AM (your local time), on the second Sunday in March and the first Sunday in November. User Defined: Allows you to set the Daylight Savings Time start and end times manually. Start: Set the Month, Day and Hour when the adjustment for Daylight Savings will begin. End: Set the month, day and hour when the adjustment for Daylight Savings will end.
Line Synchronization: Set Enable or Disable and Frequency.
The basic function of Line Synchronization is to adjust the real time clock to track the time based on the power line frequency. For this purpose, Phase A voltage only is used. Line Sync is disabled if a GPS signal is present.
How Time is Adjusted:
After the clock is synced to the line, the meter periodically checks the cumulative difference between the real time clock in seconds and the line cycle count. If the absolute difference between the two accumulations is more than 1 second or 60 (50) cycles, the clock is adjusted + / - 1 second accordingly.
4. To set the Nexus® meter’s on-board clock, use Set Device Time from the Tools Menu. 5. When all changes are entered, click OK to return to the main Device Profile screen. For these
changes to take effect, you must click the Update Device button. This sends the new profile to the meter.

E Electro Industries/GaugeTech DOC # E107707 3-10
3.3.4: Labels
Labels are user-defined names for the Nexus® meter, the Auxiliary Voltage terminal, and the I N Measured terminal. Also use this screen to select the Power Direction, and the Power Factor Display.
NOTE: It is important to label the Nexus® meter (under “Meter Designation”) with a unique name because that label will become the name of the file for any logs retrieved from that meter. Duplicate meter designations interfere with retrieved log databases. See Chapter 8 for details on logs.
1. From the Device Profile screen
(Section 3.2), click on the + button next to General Settings and double-click on the Labels line. You will see the submenu pictured on the right.
2. Double-click on any of the parameters;
you will see the Labels screen. 3. Enter labels in the appropriate fields.
• Meter Designation must be set for partial log retrieval.
• Power Factor Display selection determines the display of Quadrants in the Power Factor screen. Use the pull-down menu to make your selection.
4. When all changes are entered, click OK to return to the main Device Profile screen. For these
changes to take effect, you must click the Update Device button. This sends the new profile to the meter.
NOTE: For Meter Designations, you can use any character allowed by Windows Operating System for a file name.
• In English versions the following characters will not work: \ / : * ? “ < > | • For meters used internationally by multilingual users, it is recommended that you use only
alphanumeric characters allowed by your Operating System.
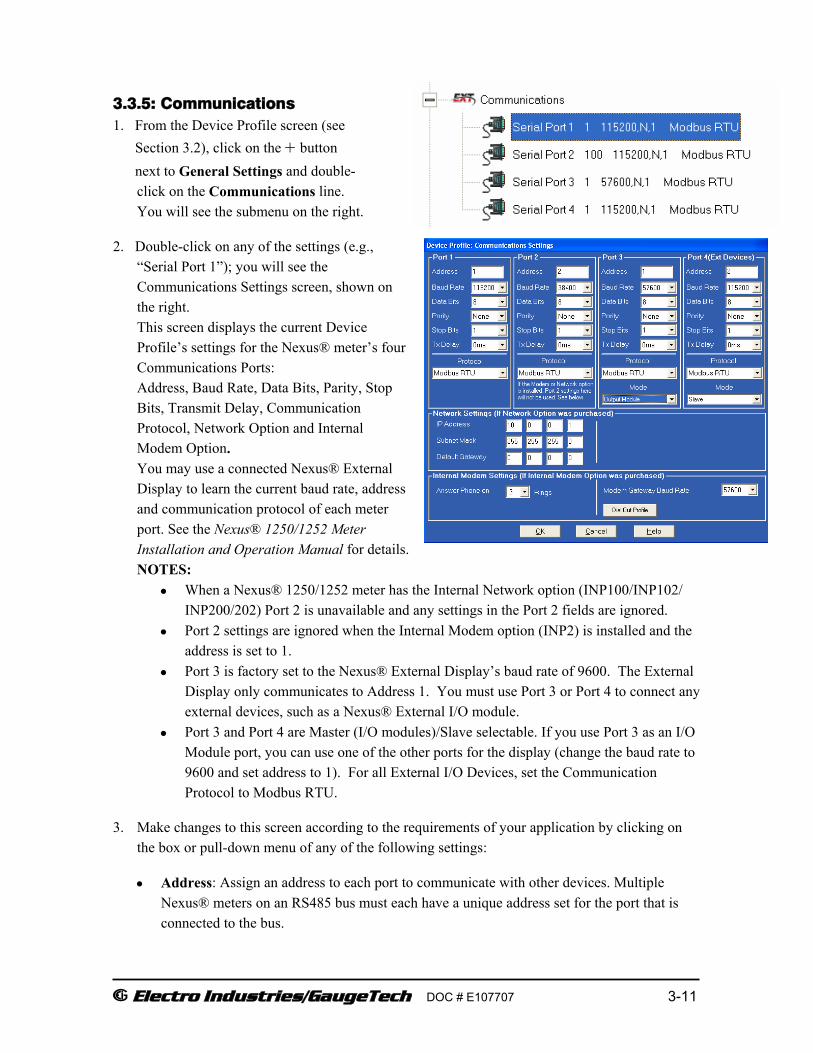
E Electro Industries/GaugeTech DOC # E107707 3-11
3.3.5: Communications 1. From the Device Profile screen (see Section 3.2), click on the + button next to General Settings and double-
click on the Communications line. You will see the submenu on the right.
2. Double-click on any of the settings (e.g., “Serial Port 1”); you will see the Communications Settings screen, shown on the right. This screen displays the current Device Profile’s settings for the Nexus® meter’s four Communications Ports: Address, Baud Rate, Data Bits, Parity, Stop Bits, Transmit Delay, Communication Protocol, Network Option and Internal Modem Option. You may use a connected Nexus® External Display to learn the current baud rate, address and communication protocol of each meter port. See the Nexus® 1250/1252 Meter Installation and Operation Manual for details. NOTES:
• When a Nexus® 1250/1252 meter has the Internal Network option (INP100/INP102/ INP200/202) Port 2 is unavailable and any settings in the Port 2 fields are ignored.
• Port 2 settings are ignored when the Internal Modem option (INP2) is installed and the address is set to 1.
• Port 3 is factory set to the Nexus® External Display’s baud rate of 9600. The External Display only communicates to Address 1. You must use Port 3 or Port 4 to connect any external devices, such as a Nexus® External I/O module.
• Port 3 and Port 4 are Master (I/O modules)/Slave selectable. If you use Port 3 as an I/O Module port, you can use one of the other ports for the display (change the baud rate to 9600 and set address to 1). For all External I/O Devices, set the Communication Protocol to Modbus RTU.
3. Make changes to this screen according to the requirements of your application by clicking on the box or pull-down menu of any of the following settings:
• Address: Assign an address to each port to communicate with other devices. Multiple Nexus® meters on an RS485 bus must each have a unique address set for the port that is connected to the bus.

E Electro Industries/GaugeTech DOC # E107707 3-12
• Baud Rate: The baud rate entered in this field must match the baud rate of the device that will be connected to the Nexus® meter at this port. Use 9600 for modem connections. From the pull-down menu, select 4800, 9600, 19200, 38400, 57600, or 115200.
• Data Bits: for Modbus RTU and ASCII, leave the Data Bits at 8. Other protocols may require a different setting. Use the pull-down menu to select from: 5, 6, 7 or 8.
• Parity: for Modbus RTU and ASCII, leave the Parity at None. Other protocols may require a different setting. Use the pull-down menu to select from: None, Even, Odd, Mark or Space.
• Stop Bits: for Modbus RTU and ASCII, leave the Stop Bits at 1. Other protocols may require a different setting. Use the pull-down menu to select from: 1, 1.5 or 2.
• TxDelay (Transmit Delay): leave the TxDelay at 0ms unless you are using equipment that requires a delay in the response time, such as a radio modem. Use the pull-down menu to select from: 0ms, 10ms, 20ms, 30ms, 40ms, 50ms, 60ms, or 70ms.
• Protocol: Direct Connections made through Communicator EXT must use either Modbus RTU or Modbus ASCII protocol (Modbus RTU is recommended). Modem Connections made through Communicator EXT must use Modbus ASCII only. Use the pull-down menu to select from: Modbus RTU, Modbus ASCII or DNP 3.0. See Chapter 2 for details.
• Mode (Port 3 or Port 4 only): If you are using I/O modules, set one of these ports in Master (I/O Modules) mode. Set the port to operate at 57600 baud. To change the setting, use the pull-down menu to select Slave or Master (I/O Modules). Make other changes for your application.
• Internal Network Option: If your Nexus® meter has the Internal Network Option, see your Network Administrator for the correct settings. Settings will vary from network to network.
Click the Advanced Settings button to see the Advanced Network Options Settings screen (shown on the right).
NOTE: The meter is shipped with initial settings, but you can fully configure the settings using these screens (see Chapter 6 for instructions).

E Electro Industries/GaugeTech DOC # E107707 3-13
• Internal Modem Option: If your Nexus® meter has this option: a. Set the number of Rings to Answer from the
pull-down menu. b. Set the Baud Rate to 57600, or to match
your system baud rate.
• Dial Out Profile: a. Click the Dial Out Profile button to access
the Modem Programming screen. Details on programming this screen and on the Modem Dial In/Dial Out Function are in located in Chapter 9.
b. Click Edit Gateway Port Devices button to access a screen (shown on the right) allowing you to enable up to 8 devices that are connected to the gateway and which you want to monitor.
c. Click on the Box next to the Device to be monitored. A Device Address will appear next to the enabled Device.
d. Change the Device Address, if needed, to any address except 1. Address 1 is always reserved for the Primary Device.
e. Click OK to return to the Modem Programming screen. 4. When all changes are entered, click OK to return to the main Device Profile screen. For these
changes to take effect, you must click the Update Device button. This sends the new profile to the meter.
NOTES: • In order to prevent communication problems, be careful when making changes in the
Communications Settings screen. For example, if you change the baud rate of the port connected to a computer, be sure to make the same change to the computer port’s baud rate. If you change a port’s address, be sure to update the address settings of any device that communicates with the port.
• The baud rate of the port used by the Nexus® External Display should always be set to 9600 and the address set to 1.
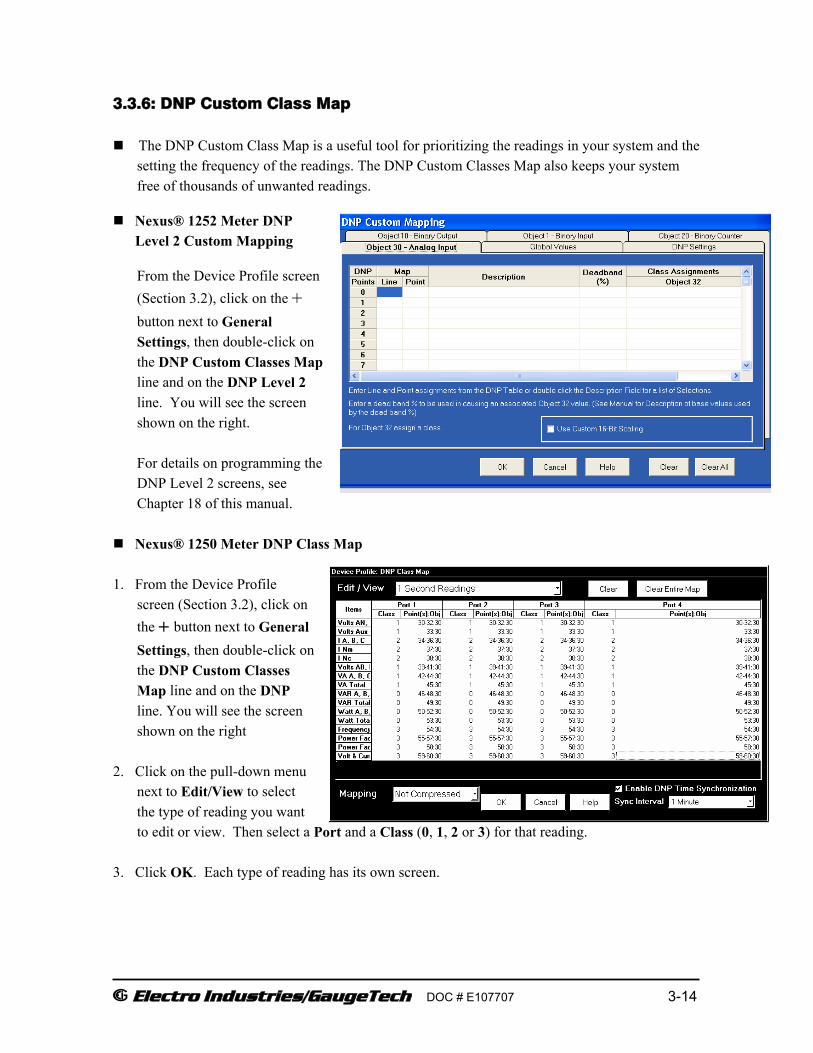
E Electro Industries/GaugeTech DOC # E107707 3-14
3.3.6: DNP Custom Class Map The DNP Custom Class Map is a useful tool for prioritizing the readings in your system and the
setting the frequency of the readings. The DNP Custom Classes Map also keeps your system free of thousands of unwanted readings.
Nexus® 1252 Meter DNP Level 2 Custom Mapping
From the Device Profile screen (Section 3.2), click on the + button next to General Settings, then double-click on the DNP Custom Classes Map line and on the DNP Level 2 line. You will see the screen shown on the right. For details on programming the DNP Level 2 screens, see Chapter 18 of this manual.
Nexus® 1250 Meter DNP Class Map
1. From the Device Profile
screen (Section 3.2), click on the + button next to General Settings, then double-click on the DNP Custom Classes Map line and on the DNP line. You will see the screen shown on the right
2. Click on the pull-down menu
next to Edit/View to select the type of reading you want to edit or view. Then select a Port and a Class (0, 1, 2 or 3) for that reading.
3. Click OK. Each type of reading has its own screen.

E Electro Industries/GaugeTech DOC # E107707 3-15
4. When you have entered any changes, click OK to return to the main Device Profile screen. For these changes to take effect, you must click the Update Device button. This sends the new profile to the meter.
Example: The screen on the previous page shows the selection of 1 Second Readings for Volts AN, BN, CN, Aux, AB, BC, CA, VA A, B, C and Total from all ports as a Class 1. Those readings will be collected by an RTU (or similar device) and displayed on your PC. Other readings will be displayed in other classes at other frequencies or not at all.
NOTE: For a list of available DNP Class Map readings for the Nexus® 1250 meter, see Appendix D. 3.3.7: Custom Modbus Map
The Custom Modbus Map for the Nexus® 1252 meter can position up to 256 Registers, or the equivalent of 2K - whichever is lower, to readily provide the functionality you want from your meter. In addition, you can customize selected values for Format Type, Scaling, Byte Order, Data Size, etc.
1. From the Device Profile screen (Section 3.2), click on the + button next to Custom Modbus Map or double-click on the Custom Modbus Map line. You will see the screen shown on the right.
• Data entry is straightforward. Each entry field is described in the following sections. • Note that not all selections appear on the screen at the same time. Use the Scroll bars to
view additional data/entry fields on the screen. • Certain entries (such as Format, Data Size, etc.) have different allowable selections
depending on the data point used. The pull-down menu adjusts to provide the appropriate selections for each data point.
NOTE: Refer to the Table of Modbus Map Readings on page 3-18.
E Electro Industries/GaugeTech DOC # E107707 3-16
Data Point Selection: there are two different ways to select a Data Point.
o Refer to the Modbus Map and find the associated Line and Point for the value you want. When you enter those values into the screen table, the software will complete the associated Group and Channel.
o Double-click the Group field. From the pull-down menus, select a Group and its associated Channel value. The software will complete the Map and Line values.
Number of Registers
This field is display only. The number in this field is computed by the software, based on the Data Size selected in the Data Size column.
Start Register This field is display only. Start Register numbers are assigned and adjusted by the software, to take into account previous entries and data sizes. The Start Register is the number of the first register to use in polling.
Format From the pull-down menu, select a type of Format for a value such as Signed Integer, Unsigned Integer, and 4 Byte IEEE Float.
Data Size From the pull-down menu, select the Number of Bytes you want to represent the Data Point: 2 or 4.
Unit If the polled value is viewed as an integer, the Unit field tells the software where to place the decimal point. Examples:
If you select .01, a polling value 1234 would be interpreted as 12.34. If you select 100, a polling value 1234 would be interpreted as 123400.
Pri/Sec The meter normally computes values in secondary units. Where applicable, you may select primary or secondary. If Primary is selected, the value is multiplied by the appropriate CT and/or PT values.
Sign/Abs Where appropriate, you may have the option of having the data point computed as a signed or absolute value.
Byte Order For most of the Data Points, you can select the polling order of the number of bytes selected by the Data Size field.

E Electro Industries/GaugeTech DOC # E107707 3-17
Example: For a four-byte Data Point, the bytes can be arranged in any order for polling.
Display/Modulo/Offset Depending on the Data Point, select one or more additional options with appropriate sub-selections.
• Display: For certain Data Points, interpretation and display options are offered. Example: For An Angle values, you can represent and display as 0 to 360 degrees or -180 to +180 degrees, etc. Selections appear in a pull-down menu for the associated point.
• Modulo: Certain values are cumulative and can roll over and start recounting from zero. For those values, where required, you can enter a point at which the rollover will occur.
• Offset: Where allowed, you can enter a value (offset) that will be added to the data point when it is computed.
Nexus® 1250 Meter Custom
Modbus Map: You will see the screen shown on the right if the connected device is a Nexus® 1250 meter.
1. Type in the Line and Point (see the
Custom Modbus Readings Table on the next page) for the reading you would like to view.
2. Click Enter. The Description
displays for the Item.

E Electro Industries/GaugeTech DOC # E107707 3-18
CUSTOM MODBUS READINGS Line Point Description
34 0 One Second Phase to Neutral Volts: Volts AN 34 1 One Second Phase to Neutral Volts: Volts BN 34 2 One Second Phase to Neutral Volts: Volts CN 35 0 One Second Auxiliary Volts: V Aux 36 0 One Second Current (A, B, C): IA 36 1 One Second Current (A, B, C): IB 36 2 One Second Current (A, B, C): IC 37 0 One Second Measured N Current: I Nm 38 0 One Second Calculated N Current: I Nc 39 0 One Second Phase to Phase Volts: Volts AB 39 1 One Second Phase to Phase Volts: Volts BC 39 2 One Second Phase to Phase Volts: Volts CA 40 0 One Second VA (A, B, C): VA A 40 1 One Second VA (A, B, C): VA B 40 2 One Second VA (A, B, C): VA C 41 0 One Second VA Total: VA Total 42 0 One Second VAR (A, B, C): VAR A 42 1 One Second VAR (A, B, C): VAR B 42 2 One Second VAR (A, B, C): VAR C 43 0 One Second VAR Total: VAR Total 44 0 One Second Watts (A, B, C): Watts A 44 1 One Second Watts (A, B, C): Watts B 44 2 One Second Watts (A, B, C): Watts C 45 0 One Second Watts Total: Watts Total 46 0 One Second Frequency: Frequency 47 0 One Second Power Factor (A, B, C): PF A 47 1 One Second Power Factor (A, B, C): PF B 47 2 One Second Power Factor (A, B, C): PF C 48 0 One Second Power Factor Total: PF Total 49 0 One Second Imbalance: Voltage 49 1 One Second Imbalance: Current 216 2 Block Window Average Watt 217 3 Maximum Block Window Positive Watt 217 4 Maximum Block Window Negative Watt 218 3 Minimum Block Window Positive Watt 218 4 Maximum Block Window Negative Watt 194 0 Phase A-N/Phase A-B Voltage THD 195 0 Phase B-N/Phase B-C Voltage THD 196 0 Phase C-N/Phase C-A Voltage THD 197 0 Phase A Current THD
198 0 Phase B Current THD
199 0 Phase A Current THD

E Electro Industries/GaugeTech DOC # E107707 3-19
3.4: Revenue and Energy Settings Revenue and Energy Settings are the second group
of settings in the Device Profile. 1. From the Device Profile screen (Section 3.2), click
on the + button next to Revenue and Energy Settings or double-click on the Revenue and Energy Settings line. All of the settings in the Revenue and Energy Settings Group are listed.
2. Click on the Programmable Setting you would like to
modify. The following sections explain the settings in the order in which they appear in the Revenue and Energy Settings menu.
3.4.1: Energy Scaling
From the Device Profile screen (Section 3.2), click on the + button next to Energy Scaling or double-click on the Energy Scaling line. You will see the Energy Scale Settings screen. • This screen has tabs that allow you to access other
screens for configuring the Energy Scaling option. • Click on the tabs to navigate between screens,
except for Global settings. Click on Global Settings to access that screen.
• Using the Energy Scale Settings screens you can select the Number of Digits, Decimal Point Placement and Energy Unit for displayed readings.
Energy : click on tabs to configure Watt Hour, VA Hour, VAR Hour (screen shown above).

E Electro Industries/GaugeTech DOC # E107707 3-20
Uncompensated Energy:
VA, Watt and VAR readings not adjusted by Transformer Loss Compensation
Test Mode Energy: click on tabs to configure Energy Readings while in Test Mode for Watt Hour, VA Hour, VAR Hour.
Pulse Accumulation and Aggregation: click on tabs to configure Accumulators, Aggregators.
I and V Squared T Readings I2T: Data will not accumulate until Current reaches programmed level. V2T: Data stops accumulating when Voltage falls below programmed level.

E Electro Industries/GaugeTech DOC # E107707 3-21
Q Hours +QH -QH
Global Settings Configure multiple variables on one screen.
2. When all changes are entered, click OK to return to the main Device Profile screen. Click the
Update Device button. This sends the new profile to the meter. 3.4.2: Demand Integration Intervals
See the Nexus® 1250/1252 Meter Installation and Operation Manual for details on Demand Integration.
1. From the Device Profile
screen (see Section 3.2), click on the + button next to Demand Integration Intervals or double-click on the Demand Integration Intervals line. You will see the sub-menu shown on the right.
2. Double-click on any of the settings. You will see the screen shown on the next page.

E Electro Industries/GaugeTech DOC # E107707 3-22
3. Click on the tabs at the top of the screen to navigate from one setting to another. Make changes to the settings according to the requirements of your application.
Following is a brief description of each setting and its function.
Thermal Averaging Time Interval Window (shown on the right): Set hours, minutes and seconds for a precise thermal window of demand data.
Block Averaging Time Interval Window: Set the length of the Block Interval used for Demand Calculations and other Interval-based functions.
NOTE: The Block Window Sync field
indicates whether the meter is being synchronized with pulses from a High Speed Input. This option is set in the Input Type field of the High Speed Inputs screen (see Section 3.5.6).
Rolling Averaging Sub-Interval Window:
Set hours, minutes and seconds for a sliding window, which will give you a precise rolling view of demand data.
Rolling Sub-Intervals: Set the number of rolling windows you would like to “string
together.”
Predictive Rolling Window Average: The meter gives you a precise (100% accurate) prediction of your demands.
4. When all changes are entered, click OK to return to the main Device Profile screen. For these
changes to take effect, you must click the Update Device button to send the new profile to the meter.

E Electro Industries/GaugeTech DOC # E107707 3-23
3.4.3: Internal KYZ Outputs (Heartbeat/Test LED Settings)
The Nexus® 1250/1252 meter has no Internal KYZ Outputs. The Internal KYZ Outputs settings allow you to assign a channel and determine other settings for the Heartbeat LED.
1. From the Device Profile screen (Section 3.2), double- click on the Internal KYZ line.
2. Using the pull-down menu next to HB LED (Heartbeat LED):
a. Assign a channel to the LED. b. Enter Watt Hour per Pulse, Pulse Width, Mode and Form for the HB LED. NOTE ON FORM: Form A = Transition; Form C = Pulse.
3. When all changes are entered, click OK to return to the main Device Profile screen. For these
changes to take effect, you must click the Update Device button. This sends the new profile to the meter.
3.4.4: External Display Options
Many utility companies want to read secondary volts and primary power readings. This setting configures the External Display to read either Primary or Secondary volts. All other readings will be in the Primary, regardless of this setting.
1. From the Device Profile screen (Section 3.2), double-click on the External Display Options
line. 2. Use the pull-down menu to select either Primary or Secondary units for voltage. 3. Click OK to return to the main Device Profile
screen. For any change to take effect, you must click on Update Device button. This sends the new profile to the meter.

E Electro Industries/GaugeTech DOC # E107707 3-24
3.4.5: CT and PT Compensation
1. From the Device Profile screen (see Section 3.2), click on the + button next to CT and PT Compensation or double-click on the CT and PT Compensation line.
2. Check the Enable box to enable CT and PT
Compensation; leave the box unchecked to disable it.
3. Click OK to close the screen and return to the main Device Profile screen. For any changes to take effect, you must click the Update Device button. This sends the new profile to the meter.
3.4.6: Transformer / Line Loss Compensation 1. From the Device Profile screen (see
Section 3.2), click on the + button next to Transformer/Line Loss Compensation or double-click on the Transformer/Line Loss Compensation line. You will see the sub-menu shown on the right.
2. This screen displays the current values for the meter’s Transformer Loss Compensation.
• %LWFE = Percent Loss of Watts due to Iron • %LVFE = Percent Loss of Vars due to Iron • %LWCU = Percent Loss of Watts due to Copper • %LVCU = Percent Loss of Vars due to Copper
3. Double-click on any of the loss values. You will see the screen shown on the right.
4. Click TLC Calculator to find the values to enter into the Percent Loss fields. The TLC Calculator button launches an Excel Spreadsheet that will do the calculations for you once the required data is entered. IMPORTANT! See Appendix B, which contains a copy of the Excel Spreadsheet with example numbers, and an explanation of Loss Compensation considerations.

E Electro Industries/GaugeTech DOC # E107707 3-25
WARNING! Communicator EXT will automatically launch the Excel Spreadsheet when you click on the TLC Calculator button. If you do not have Excel software installed on your computer, or if the spreadsheet file is not in the Communicator EXT directory, a Warning will be displayed instead of the worksheet. You can do your own calculations using the hardcopy Transformer Loss Compensation Worksheet shown in Appendix B.
EXCEL NOTE: For most Excel users, the spreadsheet will not run until permission is given to run the Macros contained in the sheet. Give permission by changing the Excel Security Setting from High to Medium: a. From the Excel toolbar, select Tools>Security>Options. b. On the Security Tab page, click the Macro Security button. c. Select Medium Security.
5. Enter the percent Loss of Watts and VARS for copper and iron in the appropriate fields.
6. Enable or Disable Transformer Loss Compensation with the first pull-down menu at the bottom of the screen:
• Disabled • Iron (Fe) Only • Copper (Cu) Only • Both Iron and Copper (Fe and Cu)
7. With the second pull-down menu, select from the following options:
• Add to Watts and Subtract from VAR. • Subtract from Watts and Add to VAR. • Add to Watts and VAR. • Subtract from Watts and VAR.
8. With the third pull-down menu, apply the loss based on the power flow direction by selecting one of the following options:
• Both +Watts and -Watts • -Watts only • +Watts only
WARNING! Do not use the last settings if you do not have the appropriate firmware (DSP firmware Version greater than 212). Check with Technical Support if you have a question concerning this.
9. When all settings are complete, click OK to return to the main Device Profile screen. For these changes to take effect, you must click the Update Device button. This sends the new profile to the meter.
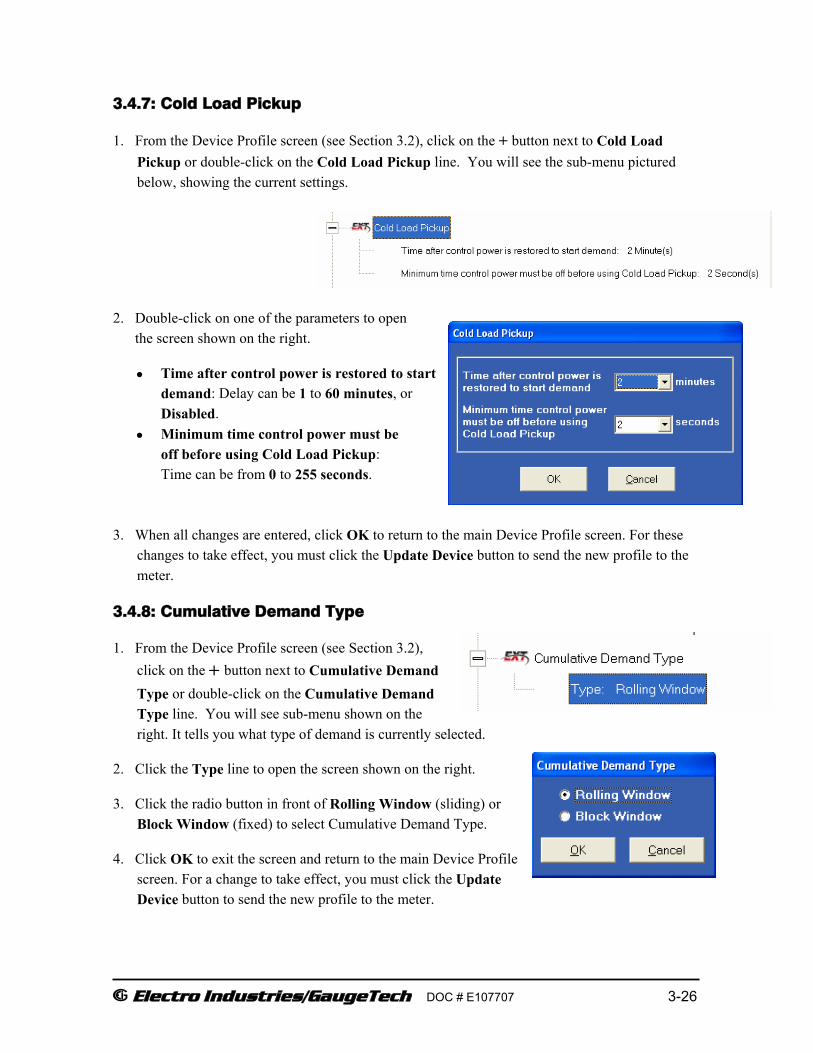
E Electro Industries/GaugeTech DOC # E107707 3-26
3.4.7: Cold Load Pickup
1. From the Device Profile screen (see Section 3.2), click on the + button next to Cold Load Pickup or double-click on the Cold Load Pickup line. You will see the sub-menu pictured below, showing the current settings.
2. Double-click on one of the parameters to open the screen shown on the right.
• Time after control power is restored to start demand: Delay can be 1 to 60 minutes, or Disabled.
• Minimum time control power must be off before using Cold Load Pickup: Time can be from 0 to 255 seconds. 3. When all changes are entered, click OK to return to the main Device Profile screen. For these
changes to take effect, you must click the Update Device button to send the new profile to the meter.
3.4.8: Cumulative Demand Type
1. From the Device Profile screen (see Section 3.2), click on the + button next to Cumulative Demand Type or double-click on the Cumulative Demand Type line. You will see sub-menu shown on the right. It tells you what type of demand is currently selected.
2. Click the Type line to open the screen shown on the right.
3. Click the radio button in front of Rolling Window (sliding) or Block Window (fixed) to select Cumulative Demand Type.
4. Click OK to exit the screen and return to the main Device Profile screen. For a change to take effect, you must click the Update Device button to send the new profile to the meter.

E Electro Industries/GaugeTech DOC # E107707 3-27
3.4.9: Energy, Pulses and Accumulations in the Interval 1. From the Device Profile screen (see Section 3.2), click on the + button next to Energy, Pulses
and Accumulations in the Interval or double-click on the Energy, Pulses and Accumulations in the Interval line. You will see the sub-menu shown below, on the right.
2. The current Interval setting is displayed. Click on the Interval setting to open the screen shown below, on the right.
3. Set the number of minutes for the Energy
Interval. 4. Click OK to close the window and return to
the main Device Profile screen. For any changes to take effect, you must click the Update Device button. This sends the new profile to the meter.
3.4.10: Pulse Accumulations
This section of the Device Profile displays a series of eight running totals available on the Nexus® 1250/1252 meter. Each total can be added to (or subtracted from) other totals. This allows you to set the high speed inputs located directly on the Nexus® meter to pulse accumulate.
NOTE: If you use these inputs for pulse accumulations, do not set them to record waveforms. If you do, you will record endless waveforms.
Purpose of Pulse Accumulations: Pulse Accumulators are used to accumulate pulse
information from external devices. These devices may be gas, water, or electricity meters; energy management systems; SCADA devices; or any pulse-generating device.
1. From the Device Profile screen (see Section 3.2), click on the + button next to Pulse Accumulations or double-click on the Pulse Accumulations line. You will see the screen shown on the next page.

E Electro Industries/GaugeTech DOC # E107707 3-28
2. Source is the particular input on the
Nexus® meter that will be accumulated. Enter the following information or use pull-down menus to select:
Units/Count: This is the scale factor that normalizes the pulses so that they can be aggregated. Pulses are stored in primary values.
Aggregator: This allows you to place the pulse register into a separate accumulation register that can aggregate, or add, values.
User Assigned Label: This window allows you to enter a label designation for the aggregator.
3. When all data has been entered, click OK to return to the main Device Profile screen. For these changes to take effect, you must click the Update Device button. This sends the new profile
to the meter. 3.4.11: Primary Hour Readings Rollover 1. From the Device Profile screen (see Section 3.2), click on the + button next to Primary Hour
Readings Rollover or double-click on the Primary Hour Readings Rollover line. NOTE: You will only see this option if your meter does not have Scaled Energy.
2. You will see the Accumulations Rollover screen. Enter
the number at which Rollover will occur. 3. Click OK to exit the screen and return to the main
Device Profile screen. For any change to take effect, you must click the Update Device button. This sends the new profile to the meter.

E Electro Industries/GaugeTech DOC # E107707 3-29
3.5: Power Quality and Alarm Settings
Power Quality and Alarm Settings are the third group of settings in the Device Profile.
1. From the Device Profile screen (see Section 3.2), click on the + button next to Power Quality and Alarm Settings or double-click on the Power Quality and Alarm Settings line. All of the settings in this group are listed.
2. Click on the Programmable Setting you
would like to modify. The following sections explain the settings in the order in which they appear in the Power Quality and Alarm Settings menu.
3.5.1: Limits
Limit settings are based on a percentage of the Full Scales (% of FS), which are set in the Limit and Waveform Full Scales setting of the Device Profile (Section 3.3.2). Full Scales are based on CT and PT ratios set in the CT, PT Ratios and System Hookup setting of the Device Profile (Section 3.3.1).
Before programming Limits, set the CT and PT ratios. Then, set the Limit and Waveform Full Scales. NOTE: The software automatically updates the Full Scale; however, you can set it separately from the CT and PT Ratios.
1. From the Device Profile screen (see Section 3.2), click on the
+ button next to Limits or double-click on the Limits line. You will see the sub-menu shown on the right.
This screen displays the current Device Profile’s Limits settings. Not all limits are shown in the figure: there are 32 Limit ID fields.
2. Double-click on any of the settings (Limit ID 01, for
example). You will see the Limits screen, shown on the next page.

E Electro Industries/GaugeTech DOC # E107707 3-30
NOTE: this screen can be expanded to show all of the limits. Click on the top or bottom of the screen to display sizing arrows ( ) you can drag to expand the screen.
Percentage of Full Scale settings: The limits are set in % of Full Scale (% of FS) so that when a user creates a profile, he can keep his settings. This is true, even though the CT and PT Ratios change when the meter (or a new meter) is placed in a different location. Changing the CT and PT Ratios will not affect the % of Full Scale limits previously set. This is useful when using large numbers at meters.
3. Make changes to this screen according to the requirements of your application: • To set the type of limit and the channel assigned to it:
a. Double-click in either the Assigned Item (type) or Limit ID (channel) column. You will see the window shown below.
b. Select Group and Sub-group, and then select the limit you want from the Selectable Item box.
c. Click OK. The limit you selected is now shown in the Limits screen. • To designate the limit as either Above or Below a percentage of the Full Scale, click once
in each Settings column and select the desired setting from the pull-down menu.
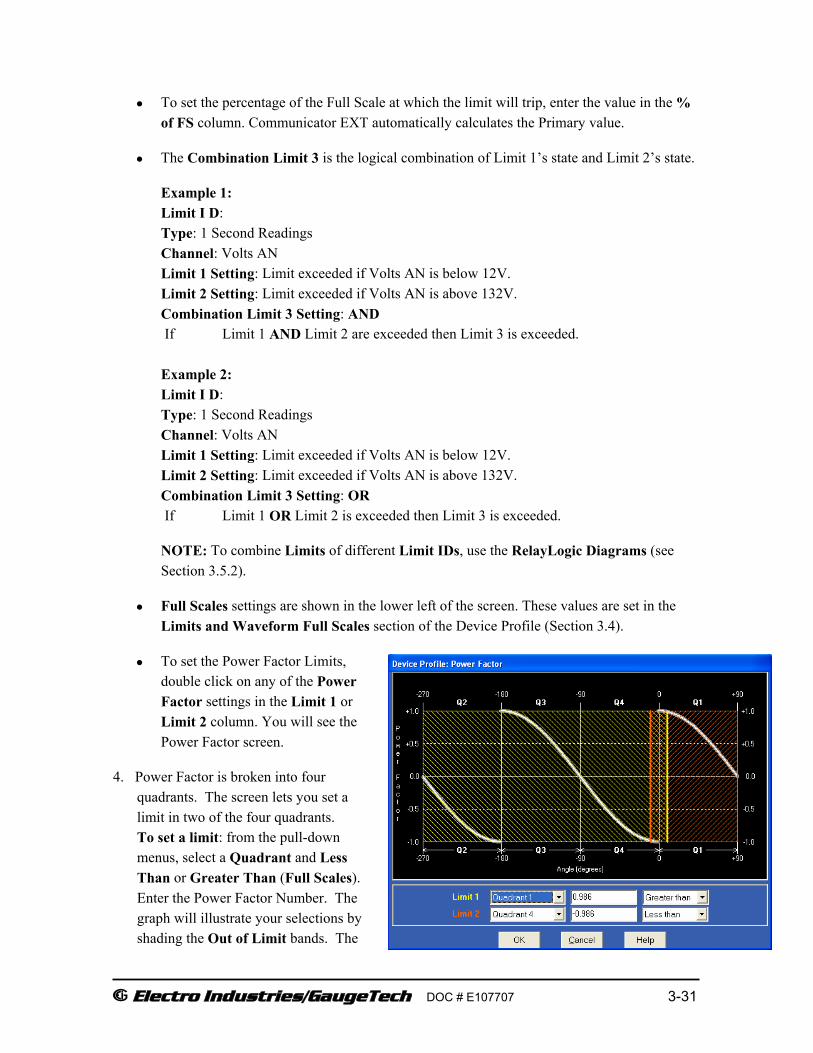
E Electro Industries/GaugeTech DOC # E107707 3-31
• To set the percentage of the Full Scale at which the limit will trip, enter the value in the % of FS column. Communicator EXT automatically calculates the Primary value.
• The Combination Limit 3 is the logical combination of Limit 1’s state and Limit 2’s state.
Example 1: Limit I D: Type: 1 Second Readings Channel: Volts AN Limit 1 Setting: Limit exceeded if Volts AN is below 12V. Limit 2 Setting: Limit exceeded if Volts AN is above 132V. Combination Limit 3 Setting: AND If Limit 1 AND Limit 2 are exceeded then Limit 3 is exceeded. Example 2: Limit I D: Type: 1 Second Readings Channel: Volts AN Limit 1 Setting: Limit exceeded if Volts AN is below 12V. Limit 2 Setting: Limit exceeded if Volts AN is above 132V. Combination Limit 3 Setting: OR If Limit 1 OR Limit 2 is exceeded then Limit 3 is exceeded.
NOTE: To combine Limits of different Limit IDs, use the RelayLogic Diagrams (see Section 3.5.2).
• Full Scales settings are shown in the lower left of the screen. These values are set in the Limits and Waveform Full Scales section of the Device Profile (Section 3.4).
• To set the Power Factor Limits, double click on any of the Power Factor settings in the Limit 1 or Limit 2 column. You will see the Power Factor screen.
4. Power Factor is broken into four quadrants. The screen lets you set a limit in two of the four quadrants. To set a limit: from the pull-down menus, select a Quadrant and Less Than or Greater Than (Full Scales). Enter the Power Factor Number. The graph will illustrate your selections by shading the Out of Limit bands. The

E Electro Industries/GaugeTech DOC # E107707 3-32
area of the graph not covered by shading is within Normal Operational Range. NOTE: Whether you see Method 1 Quadrants (Q1 +Lag, Q2 -Lag, Q3 -Lead, Q4 +Lead) or Method 2 Quadrants (Q1 +Lag, Q2 -Lead, Q3 +Lag, Q4 -Lead) depends on the setting in the Power Factor Display field of the Labels setting. See Section 3.3.4.
NOTE: This meter is a four-quadrant meter. Therefore, limits can be set for capacitive and inductive PF when generating or consuming power.
5. When all settings are complete, click OK to return to the main Device Profile screen. For these changes to take effect, you must click the Update Device button. This sends the new profile to the meter.
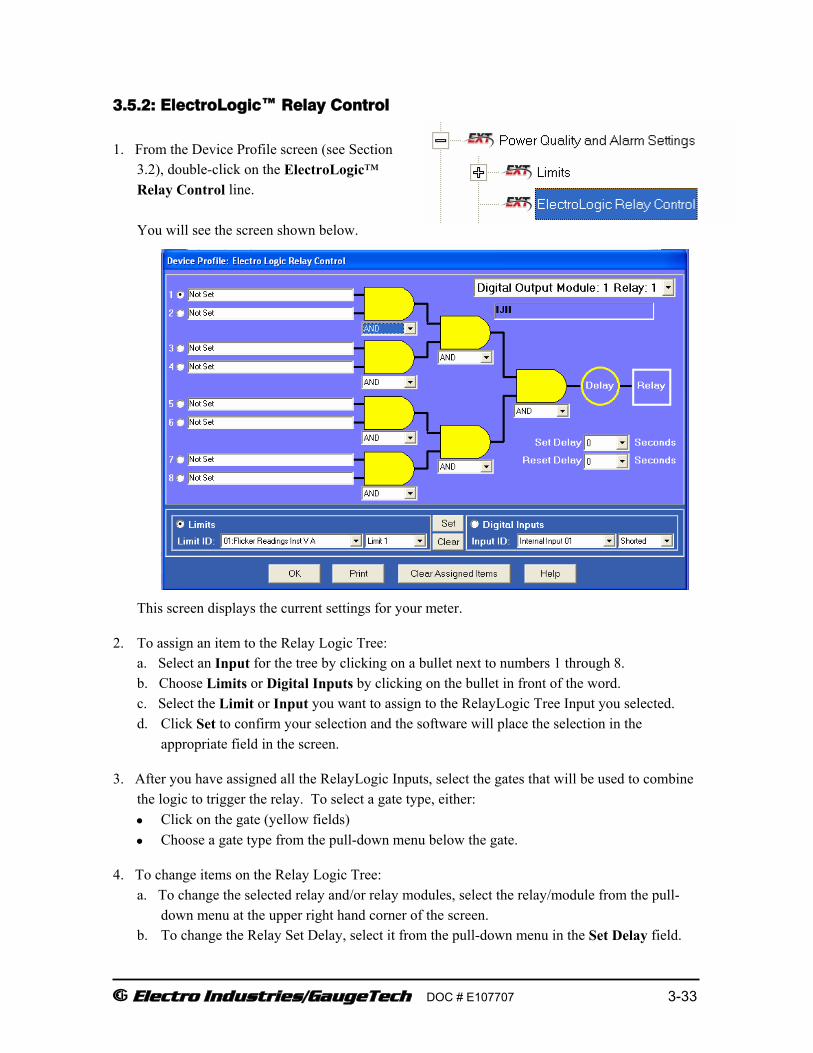
E Electro Industries/GaugeTech DOC # E107707 3-33
3.5.2: ElectroLogic™ Relay Control 1. From the Device Profile screen (see Section
3.2), double-click on the ElectroLogic™ Relay Control line.
You will see the screen shown below.
This screen displays the current settings for your meter.
2. To assign an item to the Relay Logic Tree: a. Select an Input for the tree by clicking on a bullet next to numbers 1 through 8. b. Choose Limits or Digital Inputs by clicking on the bullet in front of the word. c. Select the Limit or Input you want to assign to the RelayLogic Tree Input you selected. d. Click Set to confirm your selection and the software will place the selection in the
appropriate field in the screen.
3. After you have assigned all the RelayLogic Inputs, select the gates that will be used to combine the logic to trigger the relay. To select a gate type, either: • Click on the gate (yellow fields) • Choose a gate type from the pull-down menu below the gate.
4. To change items on the Relay Logic Tree: a. To change the selected relay and/or relay modules, select the relay/module from the pull-
down menu at the upper right hand corner of the screen. b. To change the Relay Set Delay, select it from the pull-down menu in the Set Delay field.

E Electro Industries/GaugeTech DOC # E107707 3-34
c. To change the Relay Reset Delay, select it from the pull-down menu in the Reset Delay field. d. To clear an item from the Relay Tree, click on that item and click the Clear button. e. To clear all items from the Relay Tree, click the Clear Assigned Items button.
5. When all settings are complete, click OK to return to the main Device Profile screen. For these changes to take effect, you must click the Update Device button. This sends the new profile to the meter.
NOTE: In order to use this screen, you must have purchased at least one External Relay Output module. For more details on I/O Modules, see Chapter 11 of this manual.
3.5.3: PQ Thresholds (Waveform Recording)
The Power Quality (PQ) and Waveform Thresholds setting determines at what point the Nexus® 1250/1252 meter will execute a waveform capture and/or record a power quality event. See Chapter 8 for instructions on viewing logs.
PQ and Waveform Thresholds are given as a percentage of the Full Scales (% of FS). Set the Full Scales in the Limits and Waveform Full Scales setting of the Device Profile (Section 3.3.2). Full Scales are based on the CT and PT ratios set in the CT, PT Ratios and System Hookup setting of the Device Profile (Section 3.3.1).
Before programming the PQ and Waveform Thresholds, set the CT and PT ratios and the Limits and Waveform Full Scales.
NOTE ON SAMPLING RATE: A higher sampling rate allows for transients to be monitored. Generally, the meter will be set to take 128 samples per cycle for this purpose. Lower sampling rates have advantages, however, because they allow you to record more cycles of information per event screen. Low sampling rates are better for long duration events, like motor starts or distribution faults. The meter enables you to tailor the recording for both these applications. For more information on Sampling Rate, see the chart on page 3-36.
1. From the Device Profile screen (see Section 3.2), double-click on the PQ Thresholds (Waveform Recording) line.
You will see the screen pictured on the right.

E Electro Industries/GaugeTech DOC # E107707 3-35
2. To set the threshold for a PQ event and waveform capture, enter the desired percentage of Full Scale in the Value(%) column of the Above Setpoint and Below Setpoint sections. Full Scales are shown in the lower right corner of the screen.
NOTE ON CBEMA: The CBEMA plotting is a power quality standard known worldwide for recording the amount of damage voltage transient conditions have done to the equipment being
monitored. The meter automatically records this information. For CBEMA purposes, program internal set points for voltage below 90% and above 110% of full scale (+/- 10% from the nominal voltage). These set points are defined by the ITI (CBEMA) specification. The ITI (CBEMA) Curve is published by Information Technology Industry Council (ITI).
You can set a recording with tighter voltage limits to trigger a waveform recording. However, CBEMA plotting will be based only on the limits internally set.
NOTE ON SETTING THE METER TO RECORD CURRENT FAULTS: The voltage set points are used to record voltage type events, such as voltage surges, sags and transients. The current settings are used to record faults on the line or in-rush currents from devices such as motors. Typically, to catch these events, set the limit to above 200% of full scale.
Waveform Clipping Threshold
• Nexus® 1250/1252 Meter 5 Amp Standard Hardware - 61.9437A Peak before
clipping. • Nexus® 1250/1252 Meter 1 Amp Hardware - 12.09A Peak before clipping.
High Speed Inputs: The High Speed Inputs field allows you to see which High Speed
Inputs are enabled for Waveform recording. IMPORTANT! You assign the High Speed Input to its trigger in the High Speed Inputs screen (see Section 3.5.7).
Samples per Cycle
To choose the Samples per Cycle to be recorded at 60 Hz, click on the Sampling Rate pull- down menu. Choose from 16, 32, 64, 128, 256 and 512 samples per cycle. The number of samples per cycle you choose will inversely affect the number of cycles per capture.
• If you select 256, a Capture Only pop-up screen will ask you to select Volts A, B, C or I A, B, C.
• If you select 512, a Capture Only pop-up screen will ask you to select one of the individual channels.
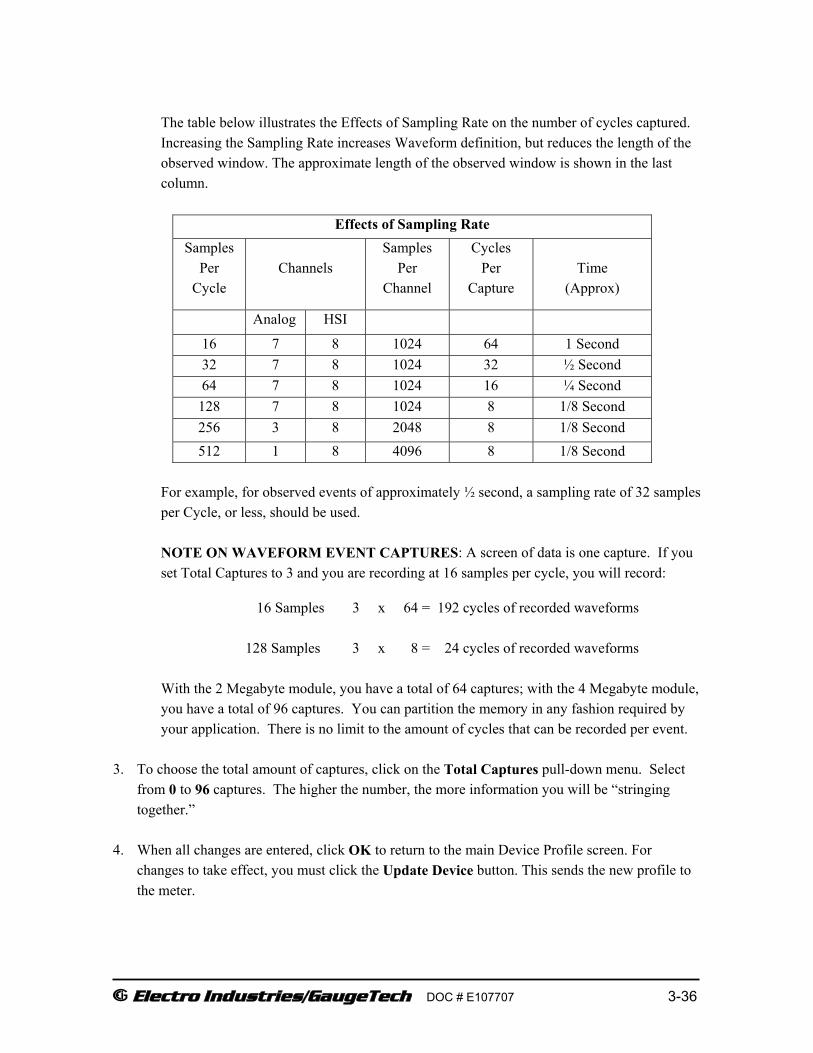
E Electro Industries/GaugeTech DOC # E107707 3-36
The table below illustrates the Effects of Sampling Rate on the number of cycles captured. Increasing the Sampling Rate increases Waveform definition, but reduces the length of the observed window. The approximate length of the observed window is shown in the last column.
Effects of Sampling Rate
Samples Per
Cycle
Channels
Samples Per
Channel
Cycles Per
Capture
Time
(Approx)
Analog HSI
16 7 8 1024 64 1 Second 32 7 8 1024 32 ½ Second 64 7 8 1024 16 ¼ Second
128 7 8 1024 8 1/8 Second 256 3 8 2048 8 1/8 Second 512 1 8 4096 8 1/8 Second
For example, for observed events of approximately ½ second, a sampling rate of 32 samples per Cycle, or less, should be used.
NOTE ON WAVEFORM EVENT CAPTURES: A screen of data is one capture. If you set Total Captures to 3 and you are recording at 16 samples per cycle, you will record:
16 Samples 3 x 64 = 192 cycles of recorded waveforms 128 Samples 3 x 8 = 24 cycles of recorded waveforms
With the 2 Megabyte module, you have a total of 64 captures; with the 4 Megabyte module, you have a total of 96 captures. You can partition the memory in any fashion required by your application. There is no limit to the amount of cycles that can be recorded per event.
3. To choose the total amount of captures, click on the Total Captures pull-down menu. Select
from 0 to 96 captures. The higher the number, the more information you will be “stringing together.”
4. When all changes are entered, click OK to return to the main Device Profile screen. For
changes to take effect, you must click the Update Device button. This sends the new profile to the meter.

E Electro Industries/GaugeTech DOC # E107707 3-37
3.5.4: EN50160/IEC61000-4-30 Flicker and Analysis
The EN50160/IEC61000-4-30 option that is available to you depends on your meter’s model and V-Switch™ level.
EN50160 Flicker evaluation is offered by the: • Nexus® 1250 meter • Nexus® 1252 meter’s base configuration model.
IEC61000-4-30 Analysis capability is offered by the: • Nexus® 1252 meter with V-Switch™ key 2 (V-2).
Refer to Chapter 16 for general information on EN50160/IEC61000-4-30 analysis, and instructions on setting the IEC610004-30 analysis function for a Nexus® 1252 meter with V- 2 (Section 16.6).
Refer to Chapter 17 for general information on Flicker, and instructions on setting the EN50160 Flicker function for a Nexus® 1250 meter or a 1252 meter with the base configuration (Section 17.3).
3.5.5: I Squared T and V Squared T Thresholds
With the I Squared T and V Squared T Thresholds screen, you can set the point at which Current and Voltage should accumulate.
1. From the Device Profile screen (Section
3.2), click on the + button next to I Squared T and V Squared T Thresholds or double-click on that line. You will see the sub-menu shown on the right, listing the current settings for the meter.
2. Double-click one of the settings to open the I Squared T and V Squared T Thresholds screen. 3. Enter the thresholds in the I Squared T and V Squared T fields. 4. Click OK to exit the screen and return to the main Device Profile screen. For any changes to take effect, you must click the Update Device button. This sends the new profile to the meter.
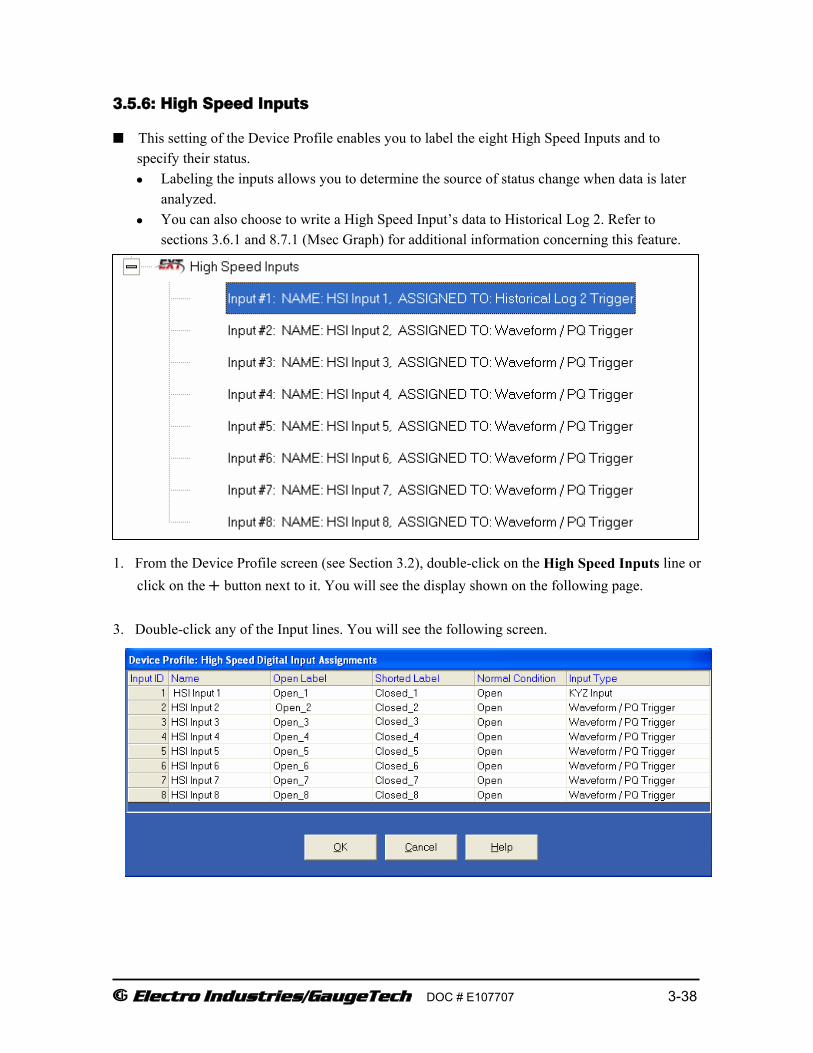
E Electro Industries/GaugeTech DOC # E107707 3-38
3.5.6: High Speed Inputs
This setting of the Device Profile enables you to label the eight High Speed Inputs and to specify their status. • Labeling the inputs allows you to determine the source of status change when data is later
analyzed. • You can also choose to write a High Speed Input’s data to Historical Log 2. Refer to
sections 3.6.1 and 8.7.1 (Msec Graph) for additional information concerning this feature.
1. From the Device Profile screen (see Section 3.2), double-click on the High Speed Inputs line or click on the + button next to it. You will see the display shown on the following page.
3. Double-click any of the Input lines. You will see the following screen.
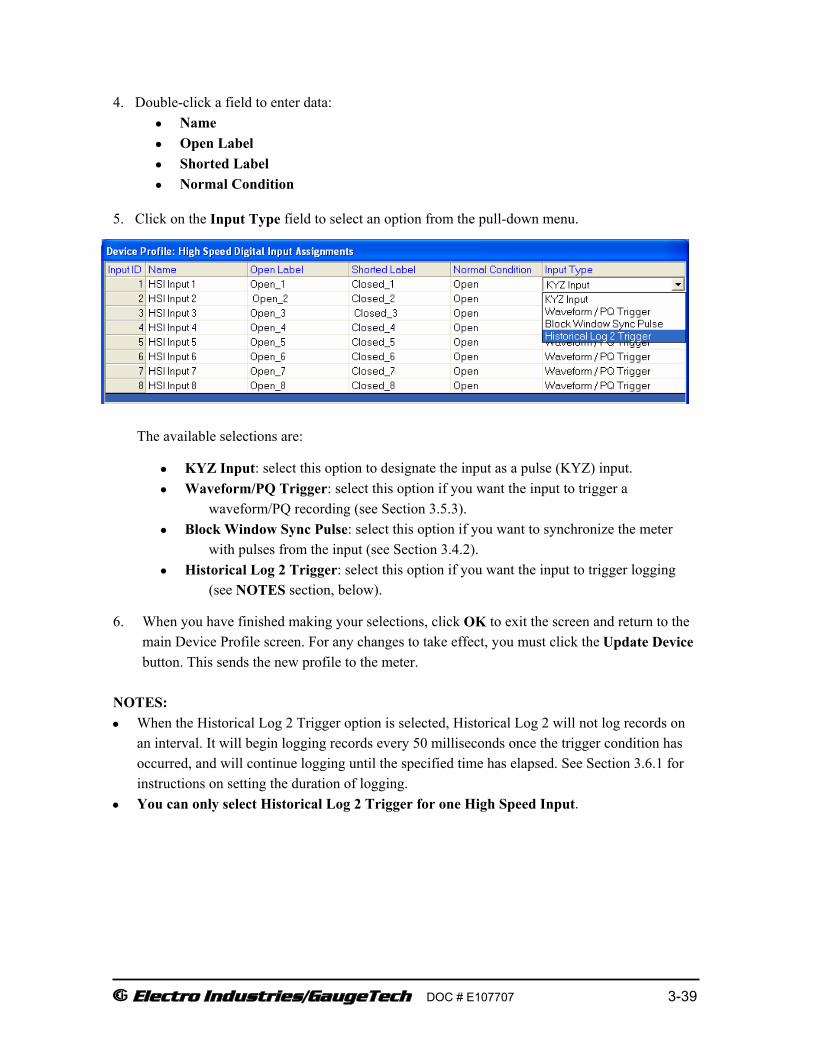
E Electro Industries/GaugeTech DOC # E107707 3-39
4. Double-click a field to enter data: • Name • Open Label • Shorted Label • Normal Condition
5. Click on the Input Type field to select an option from the pull-down menu.
The available selections are:
• KYZ Input: select this option to designate the input as a pulse (KYZ) input. • Waveform/PQ Trigger: select this option if you want the input to trigger a
waveform/PQ recording (see Section 3.5.3). • Block Window Sync Pulse: select this option if you want to synchronize the meter
with pulses from the input (see Section 3.4.2). • Historical Log 2 Trigger: select this option if you want the input to trigger logging
(see NOTES section, below).
6. When you have finished making your selections, click OK to exit the screen and return to the main Device Profile screen. For any changes to take effect, you must click the Update Device button. This sends the new profile to the meter. NOTES: • When the Historical Log 2 Trigger option is selected, Historical Log 2 will not log records on
an interval. It will begin logging records every 50 milliseconds once the trigger condition has occurred, and will continue logging until the specified time has elapsed. See Section 3.6.1 for instructions on setting the duration of logging.
• You can only select Historical Log 2 Trigger for one High Speed Input.

E Electro Industries/GaugeTech DOC # E107707 3-40
3.6: Trending Profile Settings
This setting of the Device Profile enables you to set the Trending Profiles for Historical logs.
1. From the Device Profile screen (see Section 3.2), click on the + button or double-click on the Trending Profile Settings line. You will see the sub-menu shown on the right.
2. Double-click on one of the Trending lines to access the programming screens.
NOTE ON LOAD PROFILE RECORDING: Load Profile Recording is a subset of the Nexus® meter’s more general Logging and Trending capability. The same screens are used for setup but Load Profile Recording only deals with Accumulated Values; Energy (Wh), Reactive Energy (VARh) and Apparent Power (VAh). Historically, Load Profile Recording referred to recording of Quadrant 1 Energy (Wh) because electromechanical meters only measured energy and were designed to prevent reverse rotation outside of Quadrant 1.
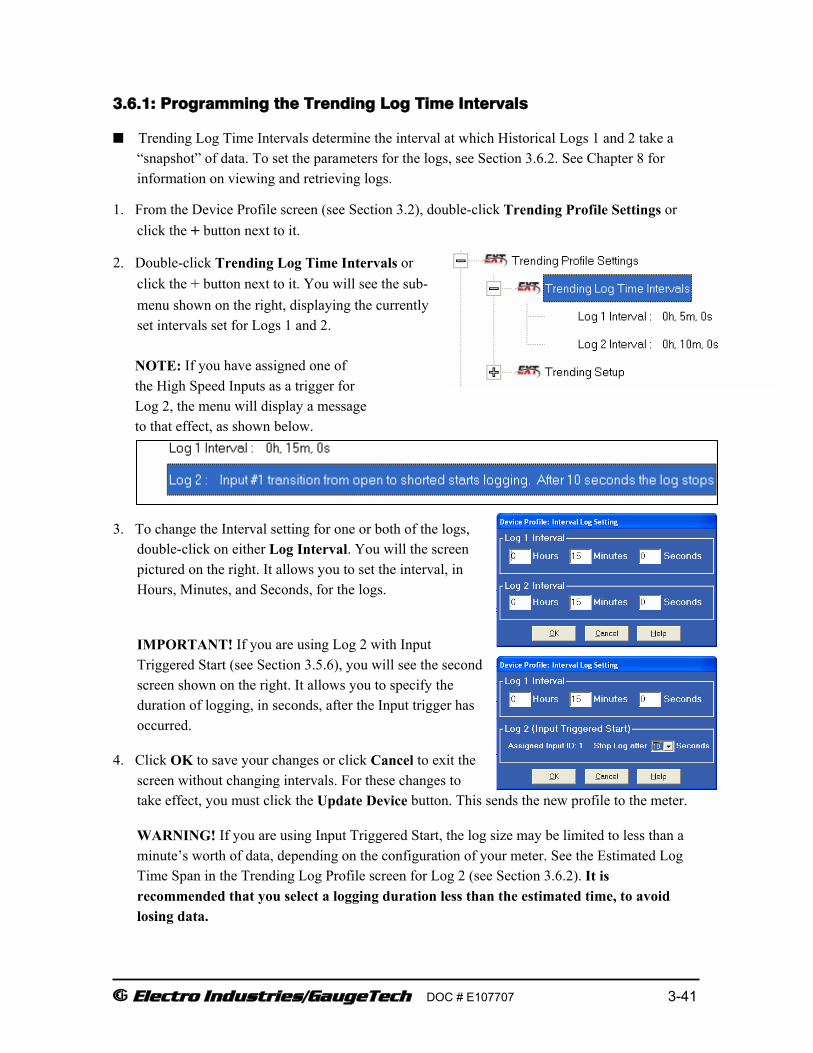
E Electro Industries/GaugeTech DOC # E107707 3-41
3.6.1: Programming the Trending Log Time Intervals
Trending Log Time Intervals determine the interval at which Historical Logs 1 and 2 take a “snapshot” of data. To set the parameters for the logs, see Section 3.6.2. See Chapter 8 for information on viewing and retrieving logs.
1. From the Device Profile screen (see Section 3.2), double-click Trending Profile Settings or click the + button next to it.
2. Double-click Trending Log Time Intervals or click the + button next to it. You will see the sub-menu shown on the right, displaying the currently set intervals set for Logs 1 and 2.
NOTE: If you have assigned one of the High Speed Inputs as a trigger for Log 2, the menu will display a message to that effect, as shown below.
3. To change the Interval setting for one or both of the logs, double-click on either Log Interval. You will the screen pictured on the right. It allows you to set the interval, in Hours, Minutes, and Seconds, for the logs.
IMPORTANT! If you are using Log 2 with Input Triggered Start (see Section 3.5.6), you will see the second screen shown on the right. It allows you to specify the duration of logging, in seconds, after the Input trigger has occurred.
4. Click OK to save your changes or click Cancel to exit the screen without changing intervals. For these changes to take effect, you must click the Update Device button. This sends the new profile to the meter.
WARNING! If you are using Input Triggered Start, the log size may be limited to less than a minute’s worth of data, depending on the configuration of your meter. See the Estimated Log Time Span in the Trending Log Profile screen for Log 2 (see Section 3.6.2). It is recommended that you select a logging duration less than the estimated time, to avoid losing data.

E Electro Industries/GaugeTech DOC # E107707 3-42
3.6.2: Programming the Trending Setup for Historical Logs 1 and 2
The Trending Setup controls the channel assignments for Historical Logs 1 and 2. To set the Time Intervals for these Logs, see Section 3.6.1. See Chapter 8 for instructions on retrieving logs.
1. From the Device Profile screen (see Section 3.2), click on
the + button next to Trending Setup or double-click on the Trending Setup line. You will see the sub-menu shown on the right.
2. Double-click on the Log whose settings you want to change. You will see the Trending Log
Profile screen for the log you selected. 3. Make changes to this screen according to the
requirements of your application. a. Group: Using the pull-down menu, select
the type of snapshot. The options are: Measured Values, Averages, Accumulators, Interval Accumulators, External Output Devices, TOU Cumulative Dmd.
b. Sub-Group: Using the pull-down menu, select a channel for the snapshot. The options you see depend on the Group you selected.
c. Sub-Group 2: With some selections, a second sub-group field will be shown underneath the first one.
d. Highlight items in the Selectable Items(s) box and click Add to include the selections in the Log. The items will be copied to the Selected Item(s) box. To remove an item from the log, highlight the item in the Selected Item(s) box and click Remove or double-click the item. The item will be removed from the Selected Item(s) box.
NOTES: • To select multiple items, hold Ctrl while highlighting the items. • To select a range of items, click the first item, hold Shift, and click the last item. • Move the cursor to the lower left corner of an item, or group of items, to view its size in bytes.
e. Click HHF if you want to convert files to HHF format for use with MV-90. See Section 8.17 for details.
f. Click Check HHF if you want to check if current settings are compatible with the HHF Converter.

E Electro Industries/GaugeTech DOC # E107707 3-43
g. The Total bytes used and Bytes remaining fields display the memory status for that particular log. The meter assumes 256 bytes of memory for each file. Total memory is determined at time of purchase.
h. The Estimated Log Timespan field displays the length of the time between the first and last records in the log when it is full.
i. The Total Records field displays the total number of records that will be in the log when it is full.
4. When all changes have been entered, click OK to return to the main Device Profile screen. For these changes to take effect, you must click the Update Device button. This sends the new profile to the meter.

E Electro Industries/GaugeTech DOC # E107707 3-44
3.6.3: Pad Missing Records for Historical Logs
If the meter is not in normal operation, it will not record any data for Logs 1 and 2. For example, during firmware updates or loss of power, data will not be saved. Some applications may require that data logs contain those missing records.
To remedy this problem, enable the Pad Missing Records for Historical Logs feature.
1. Click View>Options. You will see the Options screen. 2. Click the Log Retrieval tab. You will see the screen pictured below, on the right. 3. Check the box next to the Pad Device option
by clicking on it, and enter the number of days in the Days field. NOTE: If the box is already checked, this feature is already functional. You can change the number of days, or click the box to un-select this feature.
4. Click OK to save your selection and exit the screen.
3.7: External I/O Modules
This setting of the Device Profile allows you to configure settings for the Nexus® External I/O Modules, a variety of Input and Output Modules that can be used with the Nexus® 1250/1252 meter.
1. From the Device Profile screen (see Section 3.2), double-click on the External I/O Modules
line. You will see the screen pictured on the next page.

E Electro Industries/GaugeTech DOC # E107707 3-45
2. Click in the Type column and use the pull-down menu to select the specific module you want to
add.
3. Click in the Assigned Address field and select a unique address for each module from the pull-down menu.
4. Use the Edit buttons to configure each module. 5. Click in the Port field to select port 3 or 4 for the module.
NOTE: Log/Limit ID is a display only field. It shows the ID that Communicator EXT generates to identify this module in the Log Viewer and Limits functions.
6. Click OK to return to the main Device Profile screen. For these changes to take effect, you
must click the Update Device button. This sends the new profile to the meter. For more details on the External I/O Modules, refer to the Nexus® 1250/1252 Meter Installation and Operation Manual and Chapter 11 of this manual.

E Electro Industries/GaugeTech DOC # E107707 3-46
3.8: Set and Retrieve Device Time
The meter uses its on-board clock for time-stamping any logs it is recording.
To set the meter’s clock:
1. Select Tools>Set Device Time. You will see the Set Device On-Board Clock screen. • To synchronize the meter and your
computer, leave the Use PC Time box checked. • To set the date and time independently from the
PC, deselect the Use PC Time box and enter the time and date settings.
2. Click the Send button to update the meter’s time settings and exit the screen or click Cancel to exit the screen without making any changes.
To retrieve the meter’s current time and date settings:
1. Select Tools> Retrieve Device Time. You will see the screen pictured on the right. Date and running time display in the LEDs. • If IRIG-B is enabled for your meter, IRIG-B is
displayed next to the time. • If IRIG-B is not enabled and Line Sync is enabled, LINE SYNC is displayed next to the
time.
2. Click OK to exit the screen. 3.9: Reset Device Information
1. Select Tools>Reset Device Information. You will see the Reset Device Parameters screen.
2. Click on the tabs to navigate between screens.
3. Click on the box beside the value(s) you would like to reset.
4. Click OK to process your selection and exit the screen or click Cancel to exit the screen without making any selections.
6/29/2006 Thursday

E Electro Industries/GaugeTech DOC # E107707 3-47
For each box you select, a message window opens, telling you the Reset is complete. Click OK to close the message window.
NOTE: You can restrict this feature through Password Protection by enabling the Password feature of the meter. (See Chapter 12 for details). 3.10: Manual Waveform Capture 1. Click Tools>Manual Waveform Capture. You will see the Waveform Log Statistics screen.
2. Click the Trigger Now button to create a waveform. Communicator EXT creates a Waveform
in the meter’s memory. The value in the Records field will increase by 1. 3. Click OK to exit the screen.
NOTE: For instructions on retrieving and viewing the Waveform logs, refer to sections 8.3, 8.9, and 8.10.
3.11: Clock Compensation 1. Click Tools>Clock Compensation. You will see the screen shown below. Use this screen to
adjust the meter's clock to compensate for it being faster or slower.
2. Click the checkbox to enable compensation.

E Electro Industries/GaugeTech DOC # E107707 3-48
3. Enter the number of seconds per month you want the clock adjusted and click the Faster or Slower radio button.
4. Click Update to save your settings or Exit to close the screen without saving any changes.
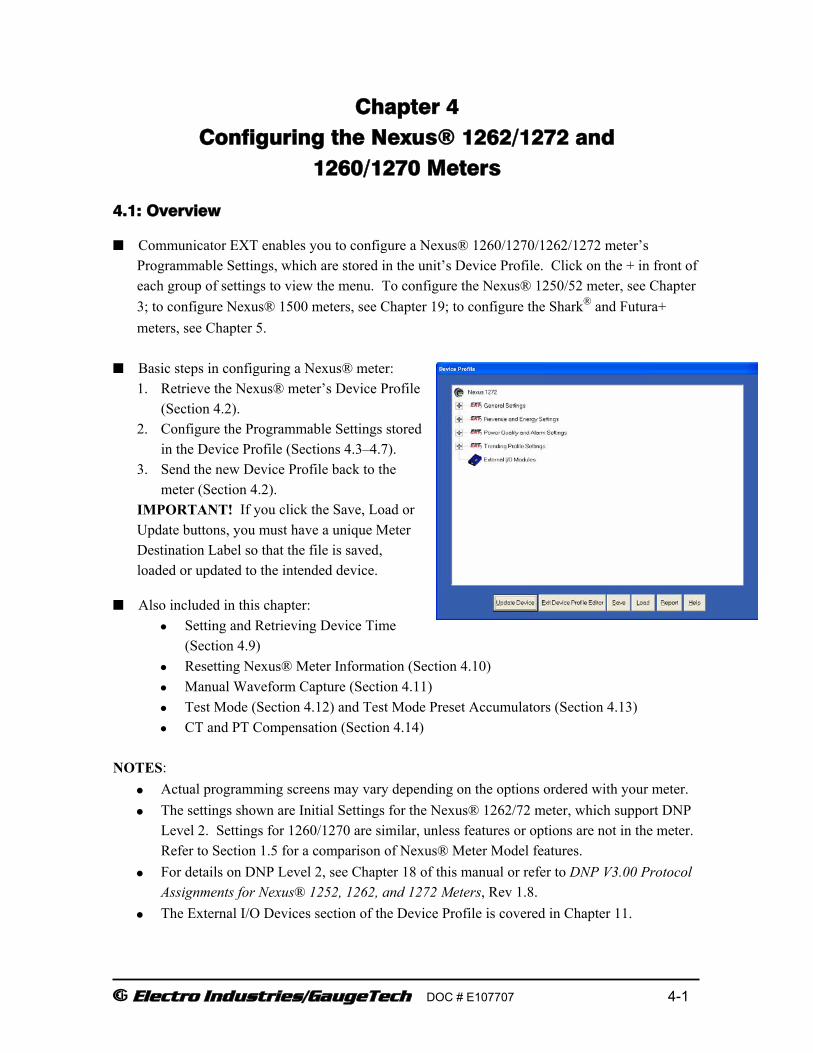
E Electro Industries/GaugeTech DOC # E107707 4-1
Chapter 4 Configuring the Nexus® 1262/1272 and
1260/1270 Meters
4.1: Overview
Communicator EXT enables you to configure a Nexus® 1260/1270/1262/1272 meter’s Programmable Settings, which are stored in the unit’s Device Profile. Click on the + in front of each group of settings to view the menu. To configure the Nexus® 1250/52 meter, see Chapter 3; to configure Nexus® 1500 meters, see Chapter 19; to configure the Shark® and Futura+ meters, see Chapter 5.
Basic steps in configuring a Nexus® meter:
1. Retrieve the Nexus® meter’s Device Profile (Section 4.2).
2. Configure the Programmable Settings stored in the Device Profile (Sections 4.3–4.7).
3. Send the new Device Profile back to the meter (Section 4.2).
IMPORTANT! If you click the Save, Load or Update buttons, you must have a unique Meter Destination Label so that the file is saved, loaded or updated to the intended device.
Also included in this chapter: • Setting and Retrieving Device Time
(Section 4.9) • Resetting Nexus® Meter Information (Section 4.10) • Manual Waveform Capture (Section 4.11) • Test Mode (Section 4.12) and Test Mode Preset Accumulators (Section 4.13) • CT and PT Compensation (Section 4.14)
NOTES:
• Actual programming screens may vary depending on the options ordered with your meter. • The settings shown are Initial Settings for the Nexus® 1262/72 meter, which support DNP
Level 2. Settings for 1260/1270 are similar, unless features or options are not in the meter. Refer to Section 1.5 for a comparison of Nexus® Meter Model features.
• For details on DNP Level 2, see Chapter 18 of this manual or refer to DNP V3.00 Protocol Assignments for Nexus® 1252, 1262, and 1272 Meters, Rev 1.8.
• The External I/O Devices section of the Device Profile is covered in Chapter 11.

E Electro Industries/GaugeTech DOC # E107707 4-2
4.2: Retrieve and Send Device Profiles
1. Click on the Profile button, or select Tools> Edit Current Device Profile. Communicator EXT retrieves the programmable settings from the currently connected Nexus® meter. You will see the following screen as the settings are being retrieved.
2. After the settings have been retrieved, you will see the Device Profile screen, shown below. 3. This screen contains all the
programmable settings currently stored in the meter you are connected to. Click
on the + in front of each group to view
the settings in that group. 4. Configure each of the programmable
settings by clicking on the (+/-) icon and then double-clicking on the selected parameter. (See Sections 4.3–4.7 for details on editing each setting.)
4. After you have finished configuring any
or all of the programmable settings, use the Buttons at the bottom of the screen to execute the following tasks:
• Click Update Device to implement Device Profile changes. This sends the new, edited
Device Profile to the Nexus® meter. You must update the Nexus® meter’s Device Profile for any changes to the programmable settings to take effect. When you click Update Device, the meter retrieves the Programmable Settings and then displays the screen shown on the next page.
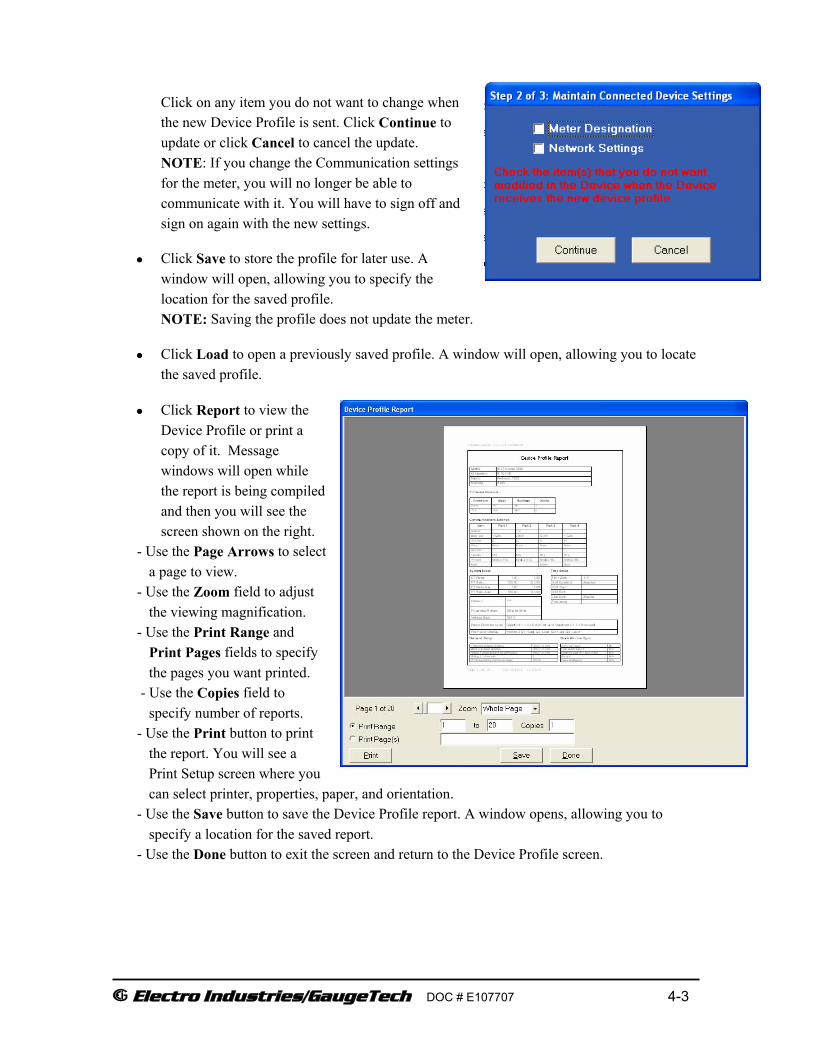
E Electro Industries/GaugeTech DOC # E107707 4-3
Click on any item you do not want to change when the new Device Profile is sent. Click Continue to update or click Cancel to cancel the update. NOTE: If you change the Communication settings for the meter, you will no longer be able to communicate with it. You will have to sign off and sign on again with the new settings.
• Click Save to store the profile for later use. A window will open, allowing you to specify the location for the saved profile. NOTE: Saving the profile does not update the meter.
• Click Load to open a previously saved profile. A window will open, allowing you to locate the saved profile.
• Click Report to view the Device Profile or print a copy of it. Message windows will open while the report is being compiled and then you will see the screen shown on the right.
- Use the Page Arrows to select a page to view.
- Use the Zoom field to adjust the viewing magnification.
- Use the Print Range and Print Pages fields to specify the pages you want printed.
- Use the Copies field to specify number of reports.
- Use the Print button to print the report. You will see a Print Setup screen where you can select printer, properties, paper, and orientation.
- Use the Save button to save the Device Profile report. A window opens, allowing you to specify a location for the saved report.
- Use the Done button to exit the screen and return to the Device Profile screen.

E Electro Industries/GaugeTech DOC # E107707 4-4
4.3: General Settings 1. From the Device Profile screen (see Section 4.2),
double-click on the General Settings line or click on the + button next to it. All of the settings in the General Settings group are listed.
2. Click on the Programmable Setting you would like to modify. The following sections explain the settings in the order in which they appear in the General Settings menu.
4.3.1: CT and PT Ratios and System Hookup 1. From the Device Profile screen (see Section 4.2),
click the + button next to General Settings, then
click the + button next to CT, PT Ratios and
System Hookup. You will see the submenu pictured on the right.
This screen displays the current Device Profile’s settings for CT, PT ratios and connection type. (The values shown here are only an example.)
2. Double-click on any of the settings. You will see the CT and PT Ratios screen.
3. Make changes to this screen according to the requirements of your application.
NOTE: When you change a PT or CT Ratio, Communicator EXT updates the corresponding Full Scale value entered in the Limit and Waveform Full Scales setting. When you click OK on this screen, Communicator EXT opens the Limit & Waveform Full Scales screen so that you can verify the settings (see Section 4.3.2).

E Electro Industries/GaugeTech DOC # E107707 4-5
Using the pull-down menu, choose the Hookup mode that matches the connection you have to the Nexus® meter. Choose from one of the following: Wye, Delta 3 CTs, Delta 2 CTs, 2.5 Element Wye, 4 Wire Delta. See the Nexus® 1260/1270 Meter or 1262/1272 Meter Installation and Operation Manual for diagrams.
NOTE: Changes to the Operational Frequency Range do not change the Full Scale value for Frequency. Changes must be made in the Limits and Waveform Full Scales Setting screen. Like voltage and current, the nominal value should be used. For example, use 50 for 50Hz.
4. Click OK. You will see a screen that asks you to verify the Kh/Ke Ratio for the Test Pulse setting. Kh/Ke Ratio is Secondary Watthour constant over kWh (the energy).
NOTE: If the Ke screen does not appear, go to View>Options>Miscellaneous and click the checkbox to enable the Kh/Ke Test Pulse Calculation screen.
5. Click Yes to accept the Ke setting or click No to reject the setting. You can reenter values in the CT & PT Ratio screen to get the setting you want.

E Electro Industries/GaugeTech DOC # E107707 4-6
6 Click OK in the CT & PT Ratio screen. If changes have been made, a message window opens asking you to verify that the Limit Full
Scales are correct.
7. Click OK. The Limit and Waveform Full Scales screen opens (see Section 4.3.2).
8. To implement any changes, click the Update Device button to send a new profile to the meter. NOTE: You will see a warning message that logs will be reset, and you will be given the opportunity to retrieve the logs before they are cleared. Resetting the logs prepares the meter for placement in a new installation or change of the meter Transformers.

E Electro Industries/GaugeTech DOC # E107707 4-7
4.3.2: Limit and Waveform Full Scales
All Limit and Waveform settings (see Sections 4.5.1 and 4.5.3, respectively) are based on a percentage of the Full Scale. Full Scales are based on the CT and PT ratios (see Section 4.3.1).
Set the CT and PT ratios first; Communicator EXT automatically recalculates the Full Scales every time the CT and PT ratios change and presents them for your verification.
1. From the Device Profile screen (see Section 4.2), click on the + button beside Limit and Waveform Full Scales or double-click on the Limit and Waveform Full Scales line. You will see the submenu shown on the right.
This screen displays the current Device Profile’s settings for the Limit and Waveform Full Scales. The values shown here are only an example.
NOTE: Frequency and Voltage values are nominal values. The Phase Power is computed using nominal voltage and rated maximum current. 2. Double-click any of the settings. You will see
the Limit and Waveform Full Scales screen.
3. Enter the Full Scale for each parameter:
• The Limits and Waveform settings (Sections 4.5.1 and 4.5.3, respectively) are based on a percentage of the Full Scales entered here.
• Communicator EXT automatically recalculates the Full Scales Voltages, Currents and Power every time the CT and PT ratios change. Frequency is not changed, even if the Operational Frequency Range is changed. Frequency must be changed on this screen.
• Power Phase is the amount of power per each phase.
• Power Total is the power of all phases combined. 4. When all changes are entered, click OK to return to the main Device Profile screen. For these
changes to take effect, you must click the Update Device button. This sends the new profile to the meter.

E Electro Industries/GaugeTech DOC # E107707 4-8
4.3.3: Time Settings
To edit a Device Profile’s Time Settings: 1. From the Device Profile screen (see Section 4.2),
click on the + button next to General Settings, then double-click on the Time Settings line. You will see the submenu pictured on the right.
DST stands for Daylight Savings Time.
2. Double-click on any of the programmable settings; you will see
the Time Settings screen. 3. Make changes to this screen according to the
requirements of your application.
Zone Descriptor: A Zone Descriptor sets the Time Zone for the meter.
0 = Greenwich Mean Time Consult the chart below to find the Zone Descriptor for your
Time Zone.
GMT Greenwich Mean Time Table (Dublin, London) -1.00 Azores +1.00 Brussels, Paris, Warsaw -2.00 Mid-Atlantic +2.00 Athens, Cairo, Helsinki -3.00 Buenos Aires, Georgetown +3.00 Baghdad, Kuwait, Moscow, Tehran -4.00 Atlantic Time (Canada), Santiago +4.00 Kabul, Baku -5.00 Eastern Time (USA and Canada), Lima +5.00 Karachi -6.00 Central Time (USA and Canada), Mexico City +6.00 Dhaka -7.00 Mountain Time (USA and Canada) +7.00 Bangkok, Hanoi, Jakarta -8.00 Pacific Time (USA and Canada), Tijuana +8.00 Beijing, Hong Kong, Singapore -9.00 Alaska +9.00 Osaka, Sapporo, Seoul -10.00 Hawaii +10.00 Brisbane, Melbourne, Guam, Hobart -11.00 Midway Island +11.00 Magadan, Solomon Islands -12.00 Eniwetok +12.00 Auckland, Fiji

E Electro Industries/GaugeTech DOC # E107707 4-9
Daylight Savings Information: Disabled: Disables an automatic adjustment for Daylight Savings Time.
Auto DST: Sets Daylight Savings Time automatically to the pre-2007 standard for the United States: the time changes automatically occur at 2:00 AM (your local time), on the first Sunday in April and the last Sunday in October. Auto DST U.S. EPA 2005: Sets Daylight Savings Time automatically to the 2007 standard for the United States: the time changes automatically occur at 2:00 AM (your local time), on the second Sunday in March and the first Sunday in November. NOTE: This option is not available for the Nexus® 1260 and 1270 meters. User Defined: Allows you to set the Daylight Savings Time start and end times manually. Start: Set the Month, Day and Hour when the adjustment for Daylight Savings will begin. End: Set the month, day and hour when the adjustment for Daylight Savings will end.
Line Synchronization: Set Enable or Disable and Frequency.
The basic function of Line Synchronization is to adjust the real time clock to track the time based on the power line frequency. For this purpose, Phase A voltage only is used. Line Sync is disabled if a GPS signal is present.
How Time is Adjusted:
After the clock is synced to the line, the meter periodically checks the cumulative difference between the real time clock in seconds and the line cycle count. If the absolute difference between the two accumulations is more than 1 second or 60 (50) cycles, the clock is adjusted + / - 1 second accordingly.
4. To set the meter’s on-board clock, use Set Device Time from the Tools Menu. 5. When all changes are entered, click OK to return to the main Device Profile screen. For these
changes to take effect, you must click the Update Device button. This sends the new profile to the meter.

E Electro Industries/GaugeTech DOC # E107707 4-10
4.3.4: Labels
Labels are user-defined names for the Nexus® meter, the Auxiliary Voltage terminal, and the I N Measured terminal. Also use this screen to select the Power Direction, and the Power Factor Display.
IMPORTANT!: It is necessary to label the meter (under “Meter Designation”) with a unique name because that label will become the name of the file for any logs retrieved from that meter. Duplicate Meter Designations interfere with retrieved log databases. See Chapter 8 for details on logs.
1. From the Device Profile screen
(Section 4.2), click on the + button next to General Settings and double-click on the Labels line. You will see the submenu pictured on the right.
2. Double-click on any of the parameters; you will see the Labels screen. 3. Enter labels in the appropriate fields.
• Meter Designation must be set for partial log retrieval.
• Power Factor Display selection determines the display of Quadrants in the Power Factor screen. Use the pull-down menu to make your selection.
4. When all changes are entered, click OK to
return to the main Device Profile screen. For these changes to take effect, you must click the Update Device button. This sends the new profile to the meter.
NOTE: For Meter Designations, you can use any character allowed by Windows Operating System for a file name.
• In English versions the following characters will not work: \ / : * ? “ < > | • For meters used internationally by multilingual users, it is recommended that you use only
alphanumeric characters allowed by your Operating System.

E Electro Industries/GaugeTech DOC # E107707 4-11
4.3.5: Communications
1. From the Device Profile screen (see Section 4.2), click on the + button next to General Settings and double-
click on the Communications line. You will see the submenu shown on the right.
2. Double-click on any of the settings (e.g., “Serial Port
1”); you will see the Communications Settings screen, shown on the right. This screen displays the current Device Profile’s settings for the Nexus® meter’s Communications Ports: Address, Baud Rate, Data Bits, Parity, Stop Bits, Transmit Delay, and Communication Protocol. You may use the onboard display or one of the Nexus® External Displays to learn the current baud rate, address and communication protocol of each meter port. See the Nexus® 1260/1270 or 1262/1272 Meter Installation and Operation Manual for details.
NOTE: The Optical Port settings cannot be changed. Ports 1 and 4 are the meter’s RS485 ports; they are used for RS485 communication with a variety of devices.
3. Make changes to this screen according to the requirements of your application by clicking on the box or pull-down menu of any of the following settings:
• Address: Assign an address to each port to communicate with other devices. Multiple Nexus® meters on an RS485 bus must each have a unique address set for the port that is connected to the bus.
• Baud Rate: The baud rate entered in this field must match the baud rate of the device that
will be connected to the Nexus® meter at this port. Use 9600 for modem connections. From the pull-down menu, select 4800, 9600, 19200, 38400, 57600, or 115200.
• Data Bits: for Modbus RTU and ASCII, leave the Data Bits at 8. Other protocols may require a different setting. Use the pull-down menu to select from: 5, 6, 7 or 8.

E Electro Industries/GaugeTech DOC # E107707 4-12
• Parity: for Modbus RTU and ASCII, leave the Parity at None. Other protocols may require a different setting. Use the pull-down menu to select from: None, Even, Odd, Mark or Space.
• Stop Bits: for Modbus RTU and ASCII, leave the Stop Bits at 1. Other protocols may require a different setting. Use the pull-down menu to select from: 1, 1.5 or 2.
• TxDelay (Transmit Delay): leave the TxDelay at 0ms unless you are using equipment that requires a delay in the response time, such as a radio modem. Use the pull-down menu to select from: 0ms, 10ms, 20ms, 30ms, 40ms, 50ms, 60ms, or 70ms.
• Protocol: Direct Connections made through Communicator EXT must use either Modbus RTU or Modbus ASCII protocol (Modbus RTU is recommended). Modem Connections made through Communicator EXT must use Modbus ASCII only. Use the pull-down menu to select from: Modbus RTU, Modbus ASCII or DNP 3.0. See Chapter 2 for details.
• Mode (Port 4 only): If you are using Output modules, set this port to Master (I/O modules) mode. Set the port to operate at 57600 baud.
• Internal Network Option: If your meter has the Internal Network Option (INP100/INP200), see your Network Administrator for the correct settings to enter into the Network Settings fields. Settings will vary from network to network. If your meter has the INP100/INP200/
INP102/INP202 Option (10/100BaseT and Combo Card), you will see the Advanced Settings button: click it to access the Advanced Network Option Settings screen, shown on the right.
NOTES: The meter is shipped with initial settings, but you can fully configure the settings using these screens (see Chapter 6 for additional information). The tabs at the top of the screen let you navigate between settings. Depending on your meter’s configuration, you may not need to program all of the settings shown here.
The first tab is Services & Security, shown above. Click the options to enable them for the Network option, e.g., to enable the Web server, click the box next to that option.
Click any of the other tabs to configure more options:
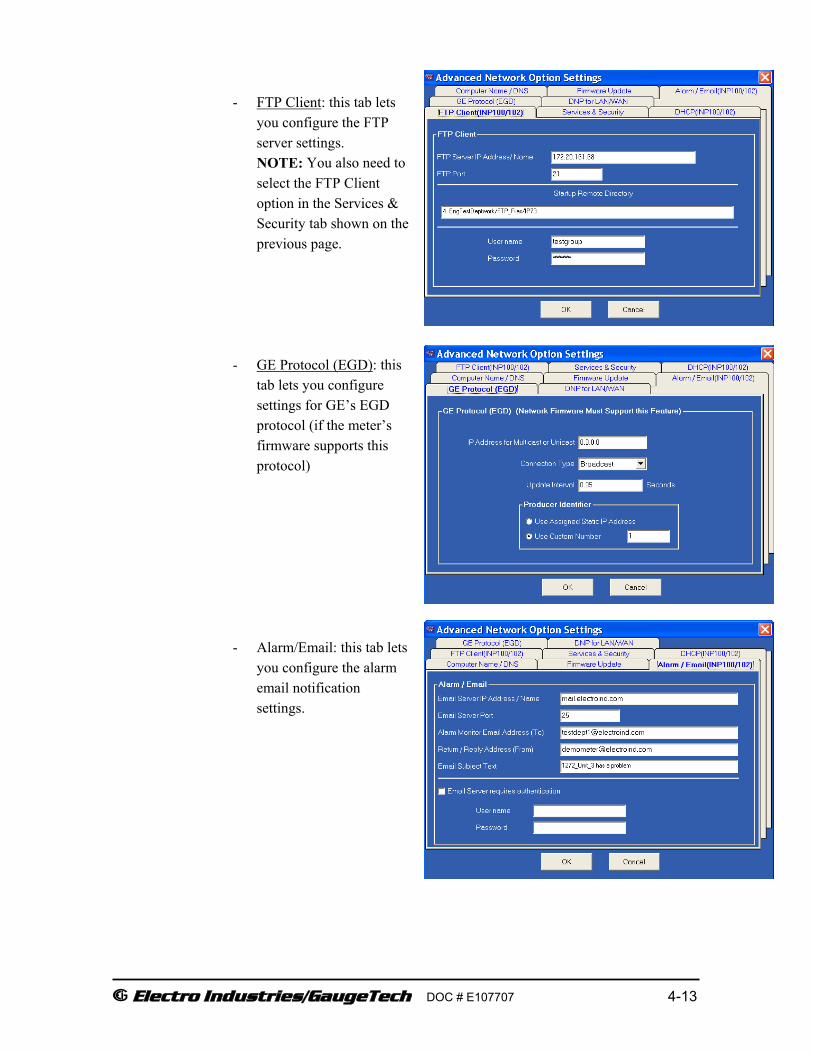
E Electro Industries/GaugeTech DOC # E107707 4-13
- FTP Client: this tab lets you configure the FTP server settings. NOTE: You also need to select the FTP Client option in the Services & Security tab shown on the previous page.
- GE Protocol (EGD): this tab lets you configure settings for GE’s EGD protocol (if the meter’s firmware supports this protocol)
- Alarm/Email: this tab lets you configure the alarm email notification settings.

E Electro Industries/GaugeTech DOC # E107707 4-14
- Computer Name/DNS: this tab lets you set up set a computer name, DNS server(s), and the Modbus TCP server.
- DHCP: this tab lets you enable DHCP (in which a DHCP server automatically assigns an IP address to the Network option).
- Firmware Update: this tab lets you update the Network card’s firmware by specifying the update file and its location.

E Electro Industries/GaugeTech DOC # E107707 4-15
- DNP for LAN/WAN: this tab lets you configure the settings for DNP3 LAN/WAN (DNP over the Ethernet).
Click OK to save your settings and close the Advanced Network Option Settings screen.
• Internal Modem Settings: If your meter has this option, set the number of Rings to Answer from the pull-down menu. Set the Baud Rate to 57600, or to match your system’s baud rate. Click Dial-Out Profile to access the Modem Programming screen, shown on the right. See Chapter 9 for instructions on programming this screen, editing the Gateway port devices, and
using the Modem Dial In/Dial Out Function.
4. When all changes are entered, click OK to return to
the main Device Profile screen. For these changes to take effect, you must click the Update Device button. This sends the new profile to the meter.
NOTES: • In order to prevent communications problems, be careful when making changes in the
Communications Settings screen. For example, if you change the baud rate of the port connected to a computer, be sure to make the same change to the computer port’s baud rate. If you change a port’s address, be sure to update the address settings of any device that communicates with the port.
• The baud rate of the port used by the Nexus® External Display should always be set to 9600 and the address set to 1.

E Electro Industries/GaugeTech DOC # E107707 4-16
4.3.6: DNP Custom Class Map The DNP Custom Class Map is a useful tool for prioritizing the readings in your system and the
frequency of the readings. The DNP Custom Classes Map also keeps your system free of thousands of unwanted readings.
Nexus® 1262/1272 Meter DNP Level 2 Custom Mapping
From the Device Profile screen (Section 4.2), click on the + button next to General Settings, then double-click on the DNP Custom Classes Map line and on the DNP Level 2 line. You will see the screen shown on the right. DNP Level 2 is supported by the Nexus® 1262/1272 meters. For details on programming the DNP Level 2 screens, see Chapter 18 of this manual.
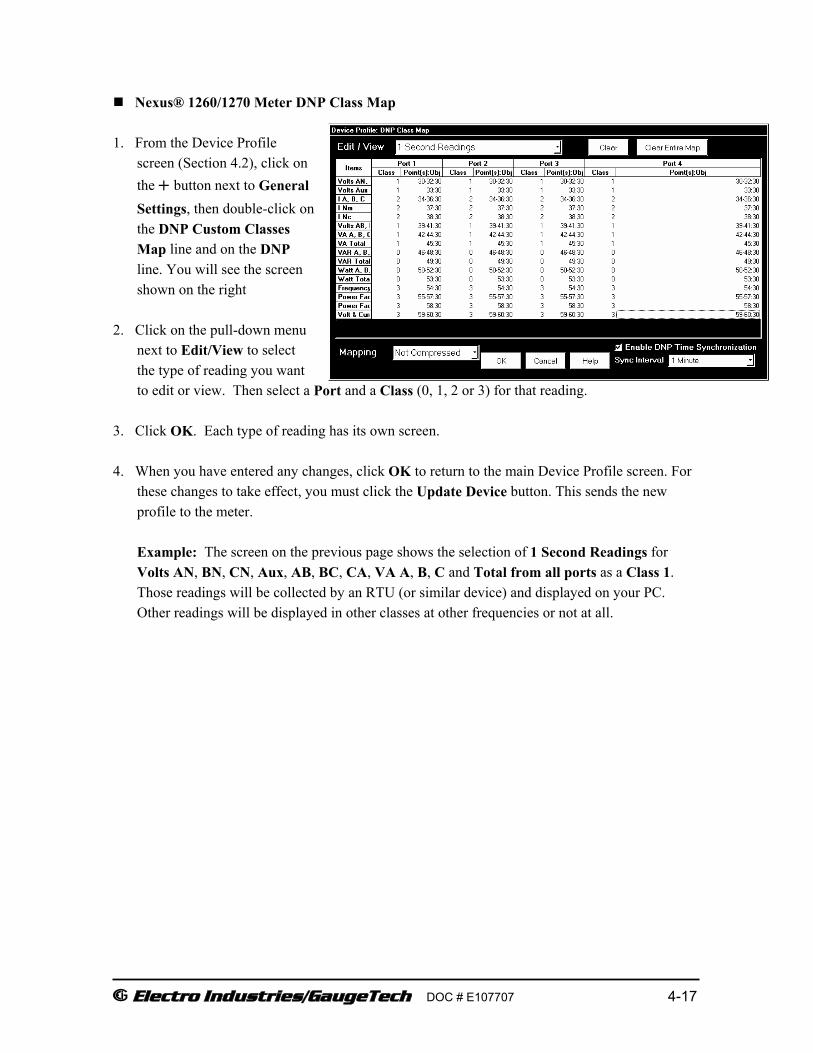
E Electro Industries/GaugeTech DOC # E107707 4-17
Nexus® 1260/1270 Meter DNP Class Map 1. From the Device Profile
screen (Section 4.2), click on the + button next to General Settings, then double-click on the DNP Custom Classes Map line and on the DNP line. You will see the screen shown on the right
2. Click on the pull-down menu
next to Edit/View to select the type of reading you want to edit or view. Then select a Port and a Class (0, 1, 2 or 3) for that reading.
3. Click OK. Each type of reading has its own screen. 4. When you have entered any changes, click OK to return to the main Device Profile screen. For
these changes to take effect, you must click the Update Device button. This sends the new profile to the meter.
Example: The screen on the previous page shows the selection of 1 Second Readings for Volts AN, BN, CN, Aux, AB, BC, CA, VA A, B, C and Total from all ports as a Class 1. Those readings will be collected by an RTU (or similar device) and displayed on your PC. Other readings will be displayed in other classes at other frequencies or not at all.

E Electro Industries/GaugeTech DOC # E107707 4-18
4.3.7: Custom Modbus Map
The Custom Modbus Map for the Nexus® 1262/1272 meter can position up to 256 Registers (or the equivalent of 2K, whichever is lower) to readily provide the functionality you want from your meter. In addition, you can customize selected values for Format Type, Scaling, Byte Order, Data Size, etc.
1. From the Device Profile screen (Section 4.2), click on the + button next to Custom Modbus Map or double-click on the Custom Modbus Map line. You will see the screen shown on the right.
Data entry is straightforward. Each entry field is described below. Note that not all selections appear on the screen at the same time. Use the Scroll bars to view additional data/entry fields on the screen. Certain entries (such as Format, Data Size, etc.) have different allowable selections depending on the data point used. The pull-down menu adjusts to provide the appropriate selections for each data point.
NOTE: Refer to the Table of Modbus Map Readings on page 4-18.
Data Point Selection: there are two different ways to select a Data Point. o Refer to the Modbus Map and find the associated Line and Point for the value you
want. When you enter those values into the screen table, the software will complete the associated Group and Channel.
o Double-click the Group field. From the pull-down menus, select a Group and its associated Channel value. The software will complete the Map and Line values.
Number of Registers
This field is display only. The number in this field is computed by the software, based on the Data Size selected in the Data Size column.
Start Register This field is display only. Start Register numbers are assigned and adjusted by the software, to take into account previous entries and data sizes. The Start Register is the number of the first register to use in polling.
E Electro Industries/GaugeTech DOC # E107707 4-19
Format From the pull-down menu, select a type of Format for a value such as Signed Integer, Unsigned Integer, and 4 Byte IEEE Float.
Data Size From the pull-down menu, select the Number of Bytes you want to represent the Data Point: 2 or 4.
Unit If the polled value is viewed as an integer, the Unit field tells the software where to place the decimal point. Examples:
If you select .01, a polling value 1234 would be interpreted as 12.34. If you select 100, a polling value 1234 would be interpreted as 123400.
Pri/Sec The meter normally computes values in secondary units. Where applicable, you may select primary or secondary. If Primary is selected, the value is multiplied by the appropriate CT and/or PT values.
Sign/Abs Where appropriate, you may have the option of having the data point computed as a signed or absolute value.
Byte Order For most of the Data Points, the user can select the polling order of the number of bytes selected by the Data Size field. Example: For a four-byte Data Point, the bytes can be arranged in any order for polling.
Display/Modulo/Offset Depending on the Data Point, select one or more additional options with appropriate sub-selections. Display: For certain Data Points, interpretation and display options are offered.
Example: For An Angle values, you can represent and display as 0 to 360 degrees or -180 to +180 degrees, etc. Selections appear in a pull-down menu for the associated point. Modulo: Certain values are cumulative and can roll over and start recounting from zero. For those values, where required, you can enter a point at which the rollover will occur. Offset: Where allowed, you can enter a value (offset) that will be added to the data point when it is computed.

E Electro Industries/GaugeTech DOC # E107707 4-20
Nexus® 1260/1270 Meter Custom Modbus Map: You will see the screen shown on the right if the connected device is a Nexus® 1260 or 1270 meter.
1. Type in the Line and Point (see the
Custom Modbus Readings Table on the next page) for the reading you would like to view.
2. Click Enter. The Description
displays for the Item.

E Electro Industries/GaugeTech DOC # E107707 4-21
CUSTOM MODBUS READINGS Line Point Description
34 0 One Second Phase to Neutral Volts: Volts AN 34 1 One Second Phase to Neutral Volts: Volts BN 34 2 One Second Phase to Neutral Volts: Volts CN 35 0 One Second Auxiliary Volts: V Aux 36 0 One Second Current (A, B, C): IA 36 1 One Second Current (A, B, C): IB 36 2 One Second Current (A, B, C): IC 37 0 One Second Measured N Current: I Nm 38 0 One Second Calculated N Current: I Nc 39 0 One Second Phase to Phase Volts: Volts AB 39 1 One Second Phase to Phase Volts: Volts BC 39 2 One Second Phase to Phase Volts: Volts CA 40 0 One Second VA (A, B, C): VA A 40 1 One Second VA (A, B, C): VA B 40 2 One Second VA (A, B, C): VA C 41 0 One Second VA Total: VA Total 42 0 One Second VAR (A, B, C): VAR A 42 1 One Second VAR (A, B, C): VAR B 42 2 One Second VAR (A, B, C): VAR C 43 0 One Second VAR Total: VAR Total 44 0 One Second Watts (A, B, C): Watts A 44 1 One Second Watts (A, B, C): Watts B 44 2 One Second Watts (A, B, C): Watts C 45 0 One Second Watts Total: Watts Total 46 0 One Second Frequency: Frequency 47 0 One Second Power Factor (A, B, C): PF A 47 1 One Second Power Factor (A, B, C): PF B 47 2 One Second Power Factor (A, B, C): PF C 48 0 One Second Power Factor Total: PF Total 49 0 One Second Imbalance: Voltage 49 1 One Second Imbalance: Current 216 2 Block Window Average Watt 217 3 Maximum Block Window Positive Watt 217 4 Maximum Block Window Negative Watt 218 3 Minimum Block Window Positive Watt 218 4 Maximum Block Window Negative Watt 194 0 Phase A-N/Phase A-B Voltage THD 195 0 Phase B-N/Phase B-C Voltage THD 196 0 Phase C-N/Phase C-A Voltage THD 197 0 Phase A Current THD 198 0 Phase B Current THD 199 0 Phase A Current THD

E Electro Industries/GaugeTech DOC # E107707 4-22
4.4: Revenue and Energy Settings
Revenue and Energy Settings are the second group of settings in the Device Profile. 1. From the Device Profile screen (Section 4.2), click
on the + button next to Revenue and Energy Settings or double-click on the Revenue and Energy Settings line. All of the settings in the Revenue and Energy Settings Group are listed. You will only see the Energy Scaling option if your meter has Scaled Energy. (The Device Status screen will also indicate whether your meter has the Energy Scaling feature. You can view this information by expanding the Device Type field. See Section 2.9 for instructions.)
2. Click on the Programmable Setting you would like
to modify. The following sections explain the settings in the order in which they appear in the Revenue and Energy Settings menu.
4.4.1: Energy Scaling
From the Device Profile screen (Section 4.2), click on the + button next to Energy Scaling or double-click on the Energy Scaling line. You will see the Energy Scale Settings screen. • This screen has tabs that allow you to
access other screens for configuring the Energy Scaling option.
• Click on the tabs to navigate between screens, except for Global settings. Click on Global Settings to access that screen.
• Using the Energy Scale Settings screens you can select the Number of Digits, Decimal Point Placement and Energy Unit for displayed readings.
Energy : click on tabs to configure Watt Hour, VA Hour, VAR Hour. (screen shown above)

E Electro Industries/GaugeTech DOC # E107707 4-23
Uncompensated Energy:
VA, Watt and VAR readings not adjusted by Transformer Loss Compensation
Test Mode Energy: click on tabs to configure Energy Readings while in Test Mode for Watt Hour, VA Hour, VAR Hour.
Pulse Accumulation and Aggregation: click on tabs to configure Accumulators, Aggregators.
I and V Squared T Readings I2T: Data will not accumulate until Current reaches programmed level. V2T: Data stops accumulating when Voltage falls below programmed level.

E Electro Industries/GaugeTech DOC # E107707 4-24
Q Hours +QH -QH
Global Settings Configure multiple variables on one screen.
2. When all changes are entered, click OK to return to the main Device Profile screen. Click the
Update Device button. This sends the new profile to the meter. 4.4.2: Demand Integration Intervals
See the Installation and Operation Manual for your meter for details on Demand Integration. 1. From the Device Profile
screen (see Section 4.2), click on the + button next to Demand Integration Intervals or double-click on the Demand Integration Intervals line. You will see the sub-menu shown on the right.
2. Double-click on any of the settings. You will see the screen shown on the next page.

E Electro Industries/GaugeTech DOC # E107707 4-25
3. Click on the tabs at the top of the screen to navigate from one setting to another. Make changes to the settings according to the requirements of your application.
Following is a brief description of each setting and its function.
Thermal Averaging Time Interval Window (shown on the right): Set hours, minutes and seconds for a precise thermal window of demand data.
Block Averaging Time Interval Window: Set the length of the Block Interval used for Demand Calculations and other Interval-based functions.
NOTE: The Block Window Sync field
indicates whether the meter is being synchronized with pulses from a High Speed Input. This option is set in the Input Type field of the High Speed Inputs screen (see Section 4.5.6).
Rolling Averaging Sub-Interval Window:
Set hours, minutes and seconds for a sliding window, which will give you a precise rolling view of demand data.
Rolling Sub-Intervals: Set the number of rolling windows you would like to “string
together.”
Predictive Rolling Window Average: The meter gives you a precise (100% accurate) prediction of your demands.
4. When all changes are entered, click OK to return to the main Device Profile screen. For these
changes to take effect, you must click the Update Device button to send the new profile to the meter.

E Electro Industries/GaugeTech DOC # E107707 4-26
4.4.3: Internal KYZ Outputs (and Test LED Settings)
The Internal KYZ Outputs Settings allow you to assign channels to the KYZ Outputs and to the Test LED. The Channel Selection sets the type of pulse that will be generated. For example, the Test LED can generate Energy Pulses for conventional testing or Reactive (VARh) Pulses for complex testing and approvals. The settings also allow you to determine the frequency and the duration of the pulse for each output and for the Test LED.
1. From the Device Profile screen (see Section 4.2), click on the + button next to Internal KYZ
Settings or double-click on the Internal KYZ Settings line. You will see the screen shown below.
2. Click on the arrow of the pull-down menu next to KYZ Output you would like to assign a channel. Make changes to Watt Hour per Pulse, Pulse Width, Mode and Form for each output and for the Test LED. NOTE: Form A = Pulse; Form C = Transition.
3. When all changes are entered, click OK to return to the main Device Profile screen. For these changes to take effect, you must click on the Update Device button. This sends the new profile to the Nexus® meter. NOTE: If your Nexus® 1262/1272 meter is equipped with the KYZ Output Option, the KYZ Output Settings will be shown on the screen. If not, only the Test LED fields will appear on the screen.

E Electro Industries/GaugeTech DOC # E107707 4-27
CONSIDERATIONS ON SETTING KYZ OUTPUTS: KYZ Pulses are produced at a rate proportional to the rate of energy accumulation, a feature that makes them useful for accuracy testing. Decreasing the value of the Watt Hour per Pulse field increases the pulse rate, improving the moment-to-moment precision of the output. The increased pulse rate means that the pulses are of shorter duration. Most equipment for detecting and counting pulses have a minimum detection time, so pulses that occur too rapidly might not be detected and counted. The value in the Pulse Width field is used to force the meter to generate minimum width pulses in situations where proportional width pulses would occur too quickly to be measured. A Pulse Width setting that does not match appropriately with the input level and Watt Hour per Pulse setting will result in output that, in the short term, will not verify correctly. For proper operation of this feature, the Pulse Width should be set to a value that is longer than the detection time required by the monitoring equipment, and shorter than the pulse period that the inputs and Watt Hour per Pulse setting would produce. The formula for the second quantity is: 3600 x Watt Hour per Pulse
Total Power Some example cases are shown in the Table below. For proper operation the Pulse Width should be set to a value that is less than the computed value of Seconds per Pulse.
Voltage PN PP V V
Current A W
Total Power Wh/Pulse Wh
Pulses/Hour Pulses
Seconds/Pulse Sec
69.28 120.00 1 207.85 1.8000000 115.47 31.18 69.28 120.00 1 207.85 0.2078461 1000.00 3.60
69.28 120.00 5 1039.23 1.8000000 577.35 6.24 69.28 120.00 5 1039.23 1.0392305 1000.00 3.60
120.00 207.85 1 360.00 1.8000000 200.00 18.00 120.00 207.85 1 360.00 0.3600000 1000.00 3.60 120.00 207.85 5 1800.00 1.8000000 1000.00 3.60 277.13 480.00 1 831.38 1.8000000 461.88 7.79 277.13 480.00 1 831.38 0.8313844 1000.00 3.60 277.13 480.00 5 4156.92 1.8000000 2309.40 1.56 277.13 480.00 5 4156.92 4.15629219 1000.00 3.60

E Electro Industries/GaugeTech DOC # E107707 4-28
4.4.4: Display Configuration
1. From the Device Profile screen (see Section 4.2), click on the + button next to Display Configuration or double-click on the Display Configuration line. You will see the screen shown below.
Click tabs at the top of the screens to access the Programmable Settings. NOTE: 1262/1272 meters with Display Run Time Firmware version 100 or higher have additional programming options: see Section 4.4.1 for instructions. The Firmware versions are shown on the bottom portion of the Device Display Programmable Settings screen - see the screen on the right.
Meter Display Mode Names: (screen shown above; this screen is used by all firmware versions) a. Enter a Label for each of the three View Modes.
b. Enter a Description for each View Mode using the Line 1 and 2 Description windows.
Screen Assignments: (see Section 4.1.1 if your meter’s Display Run Time firmware version is 100 or higher)
Your Label for each View Mode appears at the top of each column.
Enter up to 16 screens for
each View Mode by double-clicking on one of the 48 settings on the screen.

E Electro Industries/GaugeTech DOC # E107707 4-29
You will see the screen shown on the right. Select Group and Item from the pull-down menus, and click OK to return to the Screen
Assignments screen.
NOTE: If you select Time of Use as the Group, the screen changes to allow an Item selection and additional selections for TOU Period and TOU Register. See the screen on the right.
Power and Energy Display: (this screen is
used by all firmware versions) For Primary Power (right side of screen), set
Digits and Decimal Point.
These settings apply to VA-hours, Watt-hours (+/-), VAR-hours (+/-) and VAR-hours (quadrants) in the meter.
Previews appear at the bottom of the screen.
NOTE: Care should be taken to match the Primary Power values on the display with those in the historical logs, since these values are stored in the meter.
The Primary Energy fields are used to modify the display, only. They are not stored in the meter. Select a value for the Multiply by Constant field, located in the Energy Display box, from the pull-down menu. This value is used to modify the display.
For example: if the multiple you select is 100 and the value is 7835, 78.35 will be displayed. If you want the Multiply by Constant to be
applied to Demand as well as energy, click the checkbox next to the Apply to the Demand Registers as Well field.
Miscellaneous: (this screen is used by all
firmware versions) Set Screen Settings, Optical Port and User
Inactivity Time Outs. The Screen Settings replace Adjustments Mode in the default profile.

E Electro Industries/GaugeTech DOC # E107707 4-30
Screen Settings: Back Light Level (brightness), Back Light Time (when Back Light shuts off), Contrast, Scroll Stop, Phasor Rotation and Cumulative Demand.
Cumulative Demand Settings: Regular: Running Total Continuous: Running Total + Current Max/Min.
Optical Port: Set Baud Rate and Optical Receive (Non-Inverted or Inverted). Inverted Operation is used with the Smart Coupler or A7Z optical readers.
User Inactivity Time Outs: (number of minutes since last user action when Mode reverts to
View Mode 1). Settings are: 5 - 60 minutes. Leave Test Mode After _ Minutes: Reverts with or without energy accumulation. Leave View Mode 2 or 3 After _ Minutes: Reverts automatically. Use Buttons for Functions below:
Update Display: Must click to update the display. After settings update, View Mode 1 is displayed.
Retrieve from Display: Click to retrieve the existing settings. Cancel: Cancel any new settings and return to main Communicator EXT screen. Save: Save new settings to a file. Load: Load saved settings from a file. Click Update Display to send new display settings and return to the main Communicator EXT
screen.
NOTE: See your meter’s Installation and Operation Manual for further details.

E Electro Industries/GaugeTech DOC # E107707 4-31
4.4.4.1: Using the Display Configurator
The Nexus 1272 meter with appropriate firmware (User Programmable LCD Display Run Time Firmware version 100, LCD Display Boot version 30, Base meter’s COM run Time 624; or higher) gives you the Display Configurator. This feature lets you customize the meter’s LCD screens to display any measured readings. The Display Configurator features the same three View Modes as the base programmable display but has memory for up to 75 screens, distributed however you want among the three View Modes. IMPORTANT! You will use the Nexus 1272 meter’s Modbus map to identify the data you want to display in a customized Display screen. The Modbus map for the Nexus 1272 meter is contained in the Modus Protocol and Register Map for Nexus 1252/1262/1272 Meters. You can download this manual from the Downloads page of Electro Industries’ website: www.electroind.com/dl_page.html. To access the Display Configurator’s programming screen:
1. Connect to the meter through Communicator EXT.
2. Click the Profile Icon to open
the Device Profile screen.
3. Click the plus sign (+) next to
Revenue and Energy Settings. 4. Double-click Display
Configuration. You will see the screen show on the right.
The first tab is Meter Display Mode Names, which allows you to assign Labels and Descriptions for the three Display modes. NOTE: This tab is the same as for the base programmable display. See Section 4.4.4 for instructions on using all of the tabs except the Screen Assignments tab. 5. Click the Screen Assignments tab. You will see the screen shown on the next page.

E Electro Industries/GaugeTech DOC # E107707 4-32
6. Using the buttons on the bottom of the screen you can: • Retrieve display settings from the connected 1272 meter by clicking Retrieve from
Display. • Update the connected 1272 meter’s display settings by clicking Update Display.
The meter will reboot, and you will get a message on the PC screen: Device LCD Display Programmable Settings Updated.
• Save any changes you have made to display settings by clicking Save • Load a previously saved LCD Display file by clicking Load and select the file you
want to load into this screen (it is a .nds2 file). • Return to the previous screen without saving any changes by clicking Cancel. • View online instructions for using this screen by clicking Help.
The leftmost column lists all of the Available display screens. Before you’ve used the
Display Configurator, you will only see the pre-programmed display screens in the list. Once you have created customized screens, you will see those in the list as well.
The other three columns list the display screens that are assigned to each of the three View Modes. Use the scroll bars to display all of the items in the columns.
Display screens that are available for assignment to View Modes
View Mode Columns
Buttons that let you: Create custom Display screens, Edit Display screens, or Remove Display screens from the available screens list
Buttons that let you: change the order of Display screens in a View Mode, or Remove Display screens from a View Mode
Right-click on a screen to assign it to a View Mode or to copy it

E Electro Industries/GaugeTech DOC # E107707 4-33
a. To assign one of the screens to a View Mode or to create a new screen based on it, click on the screen in the list and right-click. You will see the pop-up menu shown on the right.
o To add the screen to one of the modes, or to all modes, click on that item in the menu.
o To create a new screen based on the screen, click on the last item in the menu.
b. To change the position of screens in one
of the View modes, or to remove the screen from the mode, click on the screen in the View Mode column and then either: • Click on a screen and then click Move Up or Move Down to change the position of
the screen within that View Mode. The position of the screens determines the scrolling order in the LCD Display.
• Click on a screen and then click Remove to remove the screen from that View Mode.
c. To create a custom Display screen, click Create in the Available Screens column.
Continue to “Creating a custom Display screen,” on the next page. NOTE: to Edit a custom screen, click on the screen in the Available Screens list and then click Edit. Then use the instructions in “Creating a custom Display screen” to modify the screen. d. To edit a predefined screen, click on the screen in the Available Screens column list and
then click Edit. Continue to “Editing a Pre-defined Display screen,” on page 3-37. e. To create a new screen based on an existing screen, highlight the screen in the
Available Screens column list, right-click and select Create New Screen Based on Selected Screen. If you are making a custom screen, follow the instructions in “Creating a custom Display screen,” on the next page. If you are just changing the screen number or label, follow the instructions in “Editing a Pre-defined Display screen,” on page 3-37.
f. To remove a screen from the list of available screens, click on the screen in the
Available Screens column list and then click Remove. The screen will no longer be displayed in the list of available screens, and cannot be assigned to any View Mode. It will also be removed from any View Modes it has already been assigned to.

E Electro Industries/GaugeTech DOC # E107707 4-34
Creating a Custom Display Screen
After you click the Create button in the Available screens list, you will see the LCD Screen Selection screen, shown below.
1. Click the User defined button in the Screen Type box. The screen changes to allow you to set up the new Display screen. See the figure on the next page.
Click to create a Custom Screen
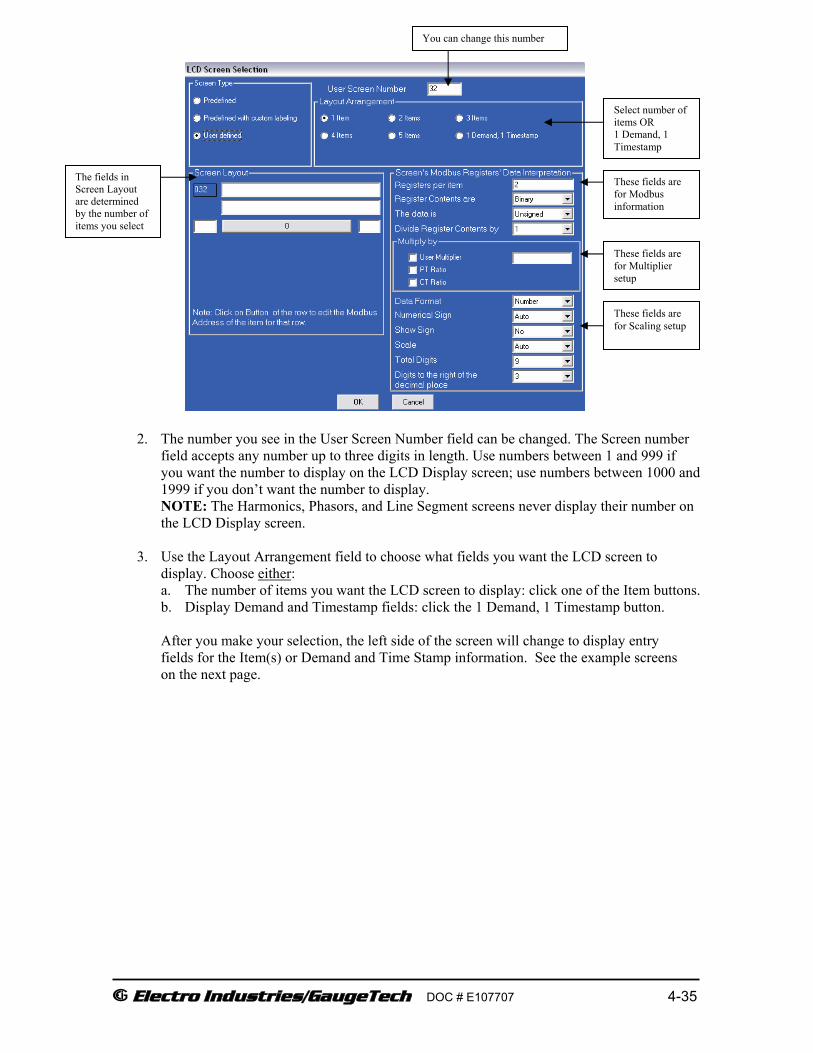
E Electro Industries/GaugeTech DOC # E107707 4-35
2. The number you see in the User Screen Number field can be changed. The Screen number
field accepts any number up to three digits in length. Use numbers between 1 and 999 if you want the number to display on the LCD Display screen; use numbers between 1000 and 1999 if you don’t want the number to display. NOTE: The Harmonics, Phasors, and Line Segment screens never display their number on the LCD Display screen.
3. Use the Layout Arrangement field to choose what fields you want the LCD screen to display. Choose either: a. The number of items you want the LCD screen to display: click one of the Item buttons. b. Display Demand and Timestamp fields: click the 1 Demand, 1 Timestamp button.
After you make your selection, the left side of the screen will change to display entry fields for the Item(s) or Demand and Time Stamp information. See the example screens on the next page.
Select number of items OR 1 Demand, 1 Timestamp
You can change this number
The fields in Screen Layout are determined by the number of items you select
These fields are for Modbus information
These fields are for Multiplier setup
These fields are for Scaling setup

E Electro Industries/GaugeTech DOC # E107707 4-36
Custom Screen with Three Item Fields
Custom Screen with Demand and Timestamp Fields
Display screen Label fields
Item Entry Fields: click here to enter the Modbus Register containing the item
The information for these fields comes from the Nexus 1272 Modbus Map
Display Screen Label fields
Demand Field
Timestamp
Status Field (Does not display on the LCD screen)
This is where you can specify a multiplier for your data
See the figure above for explanation of these fields
These fields let you specify Scaling and data display

E Electro Industries/GaugeTech DOC # E107707 4-37
• The top field in the Screen Layout section is for the Display screen label (Title). Depending on the number of items you’ve selected, you will have between 0 to 2 lines for a screen label: - If you have selected 1-3 items or 1 Demand, 1 Timestamp, you will have two entry
lines. - If you have selected 4 items you will have one entry line. - If you have selected 5 items, you will not have any entry fields for a Display screen
label (there won’t be room on the screen for a label).
• The Item entry fields allow you to specify the data you want to display on the LCD screen. You can also enter a prefix (optional) for each line item and a suffix (optional) for all of the items on the display screen.
Example: a screen containing phase to phase voltages might have a single title (Volts P-P), 3 lines of data with prefixes (Vab, Vbc, Vca), and the same suffix (MV) on all 3 lines
• The 1 Demand, 1 Timestamp entry fields allow you to specify the demand, the timestamp, and an optional status register. The status register is not displayed on the LCD screen.
4. To enter an item: a. Click on the Item label box. Fields
open underneath the item, which allow you to enter the starting value of the Modbus Register containing the data for the item. Use the Decimal value of the register. See the screen on the right. Refer to the Nexus 1252/1262/1272 Meter Modbus Manual for the 1272 meter’s Modbus Register Map. The manual can be downloaded from the Downloads page of EIG’s website: www.electroind.com/dl_page.html.
IMPORTANT! All of the data items you select must be the same Modbus type, for example F3. The Modbus type is listed in the Modbus map. See the Example below. Example: To select 1 Cycle Phase A-N voltage, find the starting register for the field in the Modbus manual. See the figure below:
Decimal starting register is 00094
Modbus type is F5
Item you are selecting
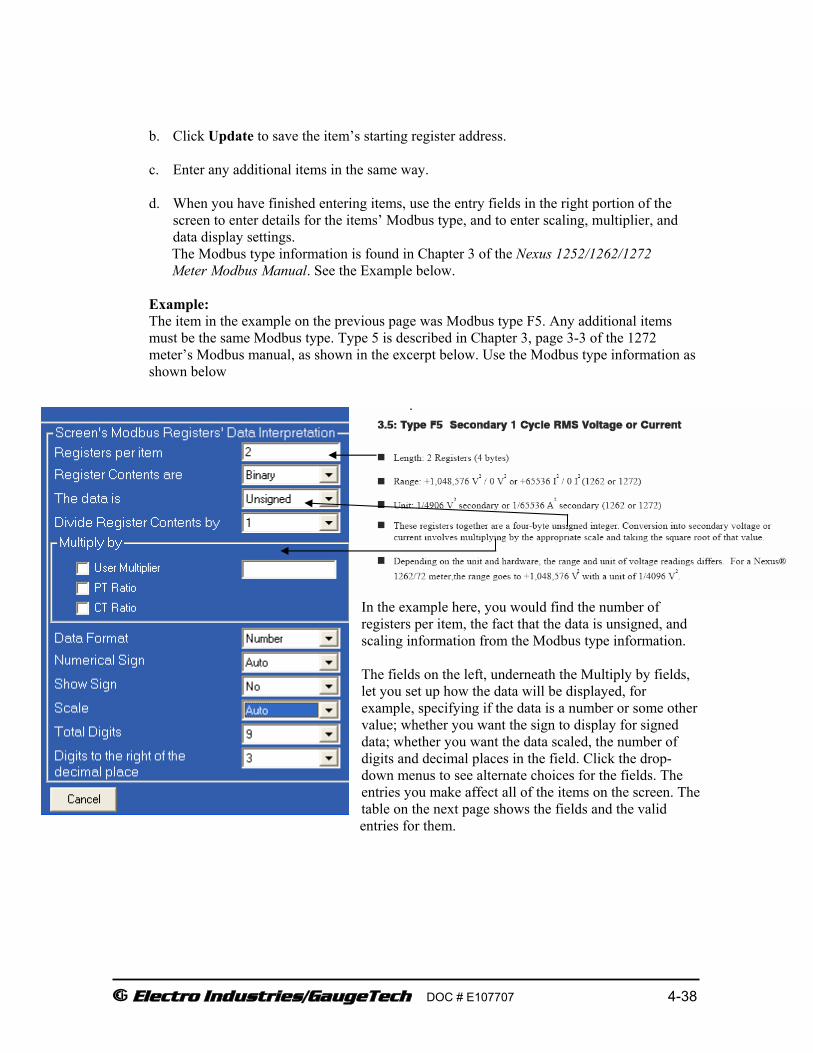
E Electro Industries/GaugeTech DOC # E107707 4-38
b. Click Update to save the item’s starting register address.
c. Enter any additional items in the same way.
d. When you have finished entering items, use the entry fields in the right portion of the screen to enter details for the items’ Modbus type, and to enter scaling, multiplier, and data display settings.
The Modbus type information is found in Chapter 3 of the Nexus 1252/1262/1272 Meter Modbus Manual. See the Example below.
Example: The item in the example on the previous page was Modbus type F5. Any additional items must be the same Modbus type. Type 5 is described in Chapter 3, page 3-3 of the 1272 meter’s Modbus manual, as shown in the excerpt below. Use the Modbus type information as shown below
. In the example here, you would find the number of registers per item, the fact that the data is unsigned, and scaling information from the Modbus type information. The fields on the left, underneath the Multiply by fields, let you set up how the data will be displayed, for example, specifying if the data is a number or some other value; whether you want the sign to display for signed data; whether you want the data scaled, the number of digits and decimal places in the field. Click the drop-down menus to see alternate choices for the fields. The entries you make affect all of the items on the screen. The table on the next page shows the fields and the valid
entries for them.

E Electro Industries/GaugeTech DOC # E107707 4-39
5. Once you have finished your entries, click OK to return to the Screen Assignments tab.
The new screen will be listed in the leftmost column. Click on it and then right-click to assign it to one or all of the View Modes.
6. When you have finished programming the LCD Display, click:
• Save to save the LCD Programmable Settings to a .nds2 file. • Upload to upload the LCD Programmable Settings to the
connected 1272 meter. • Cancel to exit the screen WITHOUT SAVING ANY
CHANGES.
Entry fields Possible entries Registers per item
1 - 8
Register contents
Binary, BCD, Text, Scaled Energy
Data Signed, Unsigned
Divide contents by
1, 100, 65536
Multiply by User multiplier (enter in blank field), PT Ratio, CT Ratio
Data format Number, Text, Power factor, Time, Date, Time & Date, Status indicator
Numerical sign
Auto, Forced negative, Forced positive
Show sign No, Yes
Scale Auto, None, kilo (k), Mega (M), Giga (G)
Total digits 1-10
Digits to the right of the decimal place
1-8

E Electro Industries/GaugeTech DOC # E107707 4-40
Editing a Pre-defined Display Screen You have the following options for editing pre-defined screens:
• You can edit the screen number. • You can also edit the screen label (title). • You can create a new screen based on the pre-defined screen, but you will still only
be able to change the screen number and/or label. NOTE: Some of the pre-defined screens cannot be customized as described above. The table below lists these pre-defined screens and tells what can be changed on them.
1. When you click Edit after
selecting a pre-defined screen in the Available screens list (or right-click to select “Create a new screen based on selected screen”) you will see the LCD Screen Selection screen. See the example screen on the right.
Predefined LCD Screen Number (Default Value)
Description Editing Options
18 Phasors None 20 VAR, PF, & Frequency Title 21 – 26 Harmonics Title 60 Segment check None 64 Optical Port Settings Title 65 Comm Ports Title 66 Nexus Status Title 67 Firmware Versions Title 68 Nexus Info Title 76 – 77 Rolling/Block Demand Title 80 – 89 TOU Energy Title 90 – 93 TOU Demand Title 94 – 95 TOU +/- VARh Title

E Electro Industries/GaugeTech DOC # E107707 4-41
2. The button at the top of the screen will reflect the type of screen you are editing or copying: either Predefined or Predefined with custom labeling.
• You can only change the screen number for a predefined screen (see example screen on the previous page), but if you are creating a new screen based on a predefined screen, you can select the predefined with custom labeling button to change the title as well as the number of the screen. Refer to the table on the previous page for editing limitations.
• For a predefined screen with custom labeling, you can change the screen number and also the screen label. See the example screen below. Refer to the table on the previous page for editing limitations.
NOTES: • The Screen number field is a three digit numeric field. Use numbers between 1 and 999
to display the number on the LCD Display screen; use numbers between 1000 and 1999 to not display the number on the LCD display screen.
• The Harmonics, Phasors, and Line Segment screens never display their number on the LCD Display screen.
• Depending on the predefined screen, you will have between 0 - 3 lines for screen label entry. Screen labels can be up to 16 characters per line.
•
Below is an example of a Predefined with custom labeling screen.
3. After you have made your entries, click OK. You will return to the previous screen (Screen
Assignments tab). 4. When you have finished programming the LCD Display, click:
• Save to save the LCD Programmable Settings to a .nds2 file. • Upload to upload the LCD Programmable Settings to the connected 1272 meter. • Cancel to exit the screen WITHOUT SAVING ANY CHANGES.
You can change the screen number here.
You can enter a screen label here.
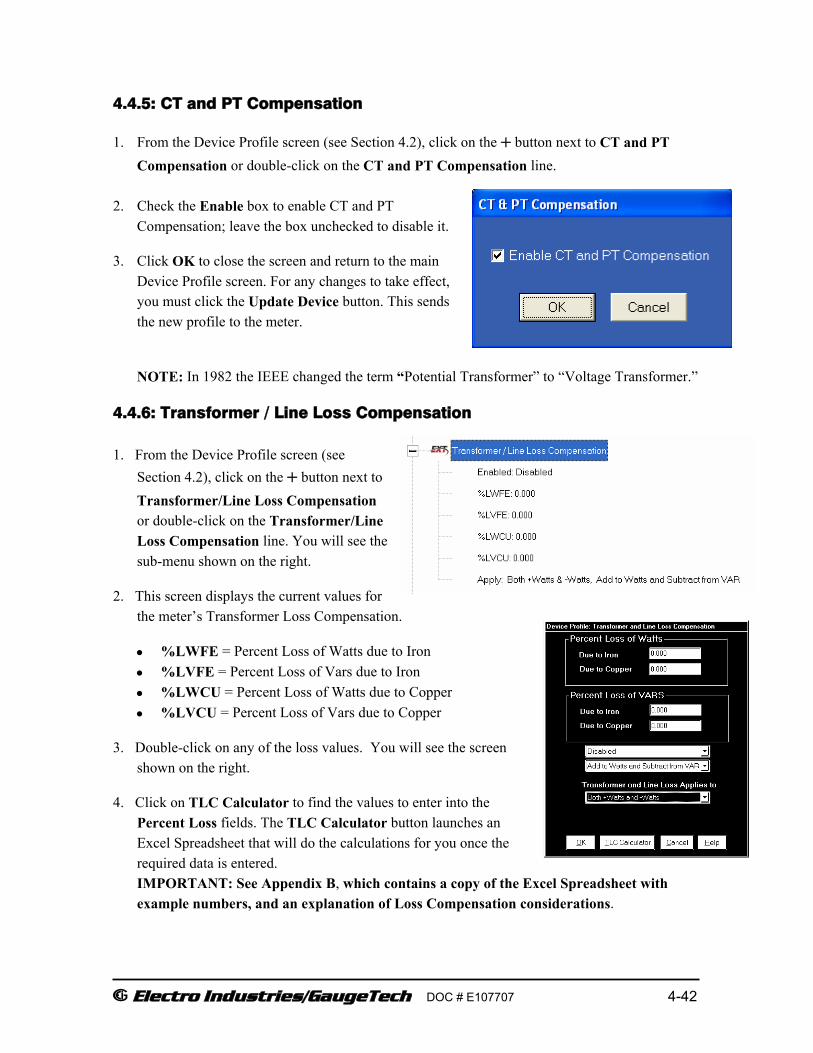
E Electro Industries/GaugeTech DOC # E107707 4-42
4.4.5: CT and PT Compensation
1. From the Device Profile screen (see Section 4.2), click on the + button next to CT and PT Compensation or double-click on the CT and PT Compensation line.
2. Check the Enable box to enable CT and PT
Compensation; leave the box unchecked to disable it.
3. Click OK to close the screen and return to the main Device Profile screen. For any changes to take effect, you must click the Update Device button. This sends the new profile to the meter.
NOTE: In 1982 the IEEE changed the term “Potential Transformer” to “Voltage Transformer.”
4.4.6: Transformer / Line Loss Compensation 1. From the Device Profile screen (see
Section 4.2), click on the + button next to Transformer/Line Loss Compensation or double-click on the Transformer/Line Loss Compensation line. You will see the sub-menu shown on the right.
2. This screen displays the current values for the meter’s Transformer Loss Compensation.
• %LWFE = Percent Loss of Watts due to Iron • %LVFE = Percent Loss of Vars due to Iron • %LWCU = Percent Loss of Watts due to Copper • %LVCU = Percent Loss of Vars due to Copper
3. Double-click on any of the loss values. You will see the screen shown on the right.
4. Click on TLC Calculator to find the values to enter into the Percent Loss fields. The TLC Calculator button launches an Excel Spreadsheet that will do the calculations for you once the required data is entered. IMPORTANT: See Appendix B, which contains a copy of the Excel Spreadsheet with example numbers, and an explanation of Loss Compensation considerations.

E Electro Industries/GaugeTech DOC # E107707 4-43
WARNING! Communicator EXT will automatically launch the Excel Spreadsheet when you click on the TLC Calculator button. If you do not have Excel software installed on your computer, or if the spreadsheet file is not in the Communicator EXT directory, a Warning will be displayed instead of the worksheet. You can do your own calculations using the hardcopy Transformer Loss Compensation Worksheet shown in Appendix B.
EXCEL NOTE: For most Excel users, the spreadsheet will not run until permission is given to run the Macros contained in the sheet. Give permission by changing the Excel Security Setting from High to Medium: a. From the Excel toolbar, select Tools>Security>Options. b. On the Security Tab page, click the Macro Security button. c. Select Medium Security.
5. Enter the percent Loss of Watts and VARS for copper and iron in the appropriate fields.
6. Enable or Disable Transformer Loss Compensation with the first pull-down menu at the bottom of the screen:
• Disabled • Iron (Fe) Only • Copper (Cu) Only • Both Iron and Copper (Fe and Cu)
7. With the second pull-down menu, select from the following options:
• Add to Watts and Subtract from VAR. • Subtract from Watts and Add to VAR. • Add to Watts and VAR. • Subtract from Watts and VAR.
8. With the third pull-down menu, apply the loss based on the power flow direction by selecting one of the following options:
• Both +Watts and -Watts • -Watts only • +Watts only
WARNING! Do not use the last settings if you do not have the appropriate firmware (DSP firmware Version greater than 212). Check with Technical Support if you have a question concerning this.
9. When all settings are complete, click OK to return to the main Device Profile screen. For these changes to take effect, you must click the Update Device button. This sends the new profile to the meter.

E Electro Industries/GaugeTech DOC # E107707 4-44
4.4.7: Cold Load Pickup
1. From the Device Profile screen (see Section 4.2), click on the + button next to Cold Load Pickup or double-click on the Cold Load Pickup line. You will see the sub-menu pictured below, showing the current settings for Cold Load Pickup.
2. Double-click on one of the parameters to open the screen shown on the right.
• Time after control power is restored to start demand: Delay can be 1 to 60 minutes, or Disabled.
• Minimum time control power must be off before using Cold Load Pickup: Time can be from 0 to 255 seconds. 3. When all changes are entered, click OK to return to the main Device Profile screen. For these
changes to take effect, you must click the Update Device button to send the new profile to the meter.
4.4.8: Cumulative Demand Type
1. From the Device Profile screen (see Section 4.2), click on the + button next to Cumulative Demand Type or double-click on the Cumulative Demand Type line. You will see sub-menu shown on the right. It tells you what type of demand is currently selected.
2. Click the Type line to open the screen shown on the right.
3. Click the radio button in front of Rolling Window (sliding) or Block Window (fixed) to select Cumulative Demand Type.
4. Click OK to exit the screen and return to the main Device Profile screen. For a change to take effect, you must click the Update Device button to send the new profile to the meter.

E Electro Industries/GaugeTech DOC # E107707 4-45
4.4.9: Energy, Pulses and Accumulations in the Interval 1. From the Device Profile screen (see Section 4.2), click on the + button next to Energy, Pulses
and Accumulations in the Interval or double-click on the Energy, Pulses and Accumulations in the Interval line. You will see the sub-menu shown below, on the right.
2. The current Interval setting is displayed. Click on the Interval setting to open the menu shown below, on the right.
3. Set the number of minutes for the Energy
Interval. 4. Click OK to close the window and return
to the main Device Profile screen. For any changes to take effect, you must click the Update Device button. This sends the new profile to the meter.
4.4.10: Pulse Accumulations This section of the Device Profile displays a series of eight running totals available on the
Nexus® 1262/1272 meter. Each total can be added to (or subtracted from) other totals. This allows you to set the high speed inputs located directly on the meter to pulse accumulate.
NOTE: If you use these inputs for pulse accumulations, do not set them to record waveforms. If you do, you will record endless waveforms.
Purpose of Pulse Accumulations: Pulse Accumulators are used to accumulate pulse information from external devices. These devices may be gas, water, or electricity meters; energy management systems; SCADA devices; or any pulse-generating device.
1. From the Device Profile screen (see Section 4.2), click on the + button next to Pulse Accumulations or double-click on the Pulse Accumulations line. You will see the screen shown on the next page.

E Electro Industries/GaugeTech DOC # E107707 4-46
2. Source is the particular input on the Nexus® meter that will be accumulated. Enter the following information or use the pull-down menus to select:
• Units/Count: This is the scale factor that normalizes the pulses so that they can be aggregated. Pulses are stored in primary values.
• Aggregator: This allows you to place the pulse register into a separate accumulation register that can aggregate (add), or net (subtract), values.
• User Assigned Label: This window allows you to enter a label designation for the source.
3. When all data has been entered, click OK to return to the main Device Profile screen. For these changes to take effect, you must click the Update Device button. This sends the new
profile to the meter 4.4.11: Primary Hour Readings Rollover 1. From the Device Profile screen (see Section 4.2), click on the + button next to Primary Hour
Readings Rollover or double-click on the Primary Hour Readings Rollover line. NOTE: You will only see this option if your meter does not have Scaled Energy.
2. You will see the Accumulations Rollover screen. Enter
the number at which Rollover will occur. 3. Click OK to exit the screen and return to the main
Device Profile screen. For any change to take effect, you must click the Update Device button. This sends the new profile to the meter.

E Electro Industries/GaugeTech DOC # E107707 4-47
4.5: Power Quality and Alarm Settings
Power Quality and Alarm Settings are the third group of settings in the Device Profile.
1. From the Device Profile screen (see Section 4.2), click on the + button next to Power Quality and Alarm Settings or double-click on the Power Quality and Alarm Settings line. All of the settings in this group are listed.
NOTE: You will only see the Operational Status Output setting if you are connected to a Nexus® 1270/1272 meter.
2. Click on the Programmable Setting you would like to modify. The following sections explain
the settings in the order in which they appear in the Power Quality and Alarm Settings menu. 4.5.1: Limits
Limit settings are based on a percentage of the Full Scales (% of FS), which are set in the Limit and Waveform Full Scales setting of the Device Profile (Section 4.3.2). Full Scales are based on CT and PT ratios set in the CT, PT Ratios and System Hookup setting of the Device Profile (Section 4.3.1).
Before programming Limits, set the CT and PT ratios. Then, set the Limit and Waveform Full Scales. NOTE: The software automatically updates the Full Scale; however, you can set it separately from the CT and PT Ratios.
1. From the Device Profile screen (see Section 4.2), click on the
+ button next to Limits or double-click on the Limits line. You will see the sub-menu shown on the right.
This screen displays the current Device Profile’s Limits settings. Not all limits are shown in the figure: there are 32 Limit ID fields.
2. Double-click on any of the settings (Limit ID 01, for
example). You will see the Limits screen, shown on the next page.

E Electro Industries/GaugeTech DOC # E107707 4-48
NOTE: this screen can be expanded to show all of the limits. Click on the top or bottom of the screen to display sizing arrows ( ) you can drag to expand the screen.
Percentage of Full Scale settings: The limits are set in % of Full Scale (% of FS) so that when a user creates a profile, he can keep his settings. This is true, even though the CT and PT Ratios change when the meter (or a new meter) is placed in a different location. Changing the CT and PT Ratios will not affect the % of Full Scale limits previously set. This is useful when using large numbers at meters.
3. Make changes to this screen according to the requirements of your application:
• To set the type of limit and the channel assigned to it, double-click in either the Type or Channel column. From the pop-up menu, choose the desired settings and click OK.
• To designate the limit as either Above or Below a percentage of the Full Scale, click once in each Settings column and select the desired setting from the pull-down menu.
• To set the percentage of the Full Scale at which the limit will trip, enter the value in the % of FS column. Communicator EXT automatically calculates the Primary value.
• The Combination Limit 3 is the logical combination of Limit 1’s state and Limit 2’s state. Example 1: Limit ID: Type: 1 Second Readings Channel: Volts AN Limit 1 Setting: Limit exceeded if Volts AN is below 12V. Limit 2 Setting: Limit exceeded if Volts AN is above 132V. Combination Limit 3 Setting: AND If Limit 1 AND Limit 2 are exceeded then Limit 3 is exceeded.

E Electro Industries/GaugeTech DOC # E107707 4-49
Example 2: Limit ID: Type: 1 Second Readings Channel: Volts AN Limit 1 Setting: Limit exceeded if Volts AN is below 12V. Limit 2 Setting: Limit exceeded if Volts AN is above 132V. Combination Limit 3 Setting: OR If Limit 1 OR Limit 2 is exceeded then Limit 3 is exceeded.
NOTE: To combine Limits of different Limit IDs, use the RelayLogic Diagrams (see Section 4.5.2).
• Full Scales settings are shown in the lower left of the screen. These values are set in the
Limits and Waveform Full Scales section of the Device Profile (Section 4.4).
• To set the Power Factor Limits, double click on any of the Power Factor settings in the Limit 1 or Limit 2 columns. You will see the Power Factor screen.
4. Power Factor is broken into four
quadrants. The screen lets you set a limit in two of the four quadrants. To set a limit: from the pull-down menus, select a Quadrant and Less Than or Greater Than (Full Scales). Enter the Power Factor Number. The graph will illustrate your selections by shading the Out of Limit bands. The area of the graph not covered by shading is within Normal Operational Range. NOTE: Whether you see Method 1 Quadrants (Q1 +Lag, Q2 -Lag, Q3 -Lead, Q4 +Lead) or Method 2 Quadrants (Q1 +Lag, Q2 -Lead, Q3 +Lag, Q4 -Lead) depends on the setting in the Power Factor Display field of the Labels setting. See Section 4.3.4.
NOTE: This meter is a four-quadrant meter. Therefore, limits can be set for capacitive and inductive PF when generating or consuming power.
5. When all settings are complete, click OK to return to the main Device Profile screen. For these
changes to take effect, you must click the Update Device button. This sends the new profile to the meter.

E Electro Industries/GaugeTech DOC # E107707 4-50
4.5.2: ElectroLogic™ Relay Control 1. From the Device Profile screen (see Section
4.2), double-click on the ElectroLogic™ Relay Control line.
You will see the screen shown below.
This screen displays the current settings for your meter.
2. To assign an item to the RelayLogic Tree: a. Select an Input for the tree by clicking on a bullet next to numbers 1 through 8. b. Choose Limits or Digital Inputs by clicking on the bullet in front of the word. c. Select the Limit or Input you want to assign to the RelayLogic Tree Input you selected. d. Press Set to confirm your selection and the software will place the selection in the
appropriate field in the screen.
3. After you have assigned all the RelayLogic Inputs, select the gates that will be used to combine the logic to trigger the relay. To select a gate type, either: • Click on the gate (yellow fields) • Choose a gate type from the pull-down menu below the gate.
4. To change items on the RelayLogic Tree, use the following steps: a. To change the selected relay and/or relay modules, select the relay/module from the pull-
down menu at the upper right hand corner of the screen.

E Electro Industries/GaugeTech DOC # E107707 4-51
b. To change the Relay Set Delay, select it from the pull-down menu in the Set Delay field. c. To change the Relay Reset Delay, select it from the pull-down menu in the Reset Delay field. d. To clear an item from the Relay Tree, click on that item and click the Clear button. e. To clear all items from the Relay Tree, click the Clear Assigned Items button.
5. When all settings are complete, click OK to return to the main Device Profile screen. For these changes to take effect, you must click the Update Device button. This sends the new profile to the meter.
NOTE: In order to use this screen, you must have purchased at least one External Relay Output module. For more details on External Output Modules, see Chapter 11 of this manual.
4.5.3: PQ Thresholds (Waveform Recording)
The Power Quality (PQ) and Waveform Thresholds setting determines at what point the Nexus® 1270 and 1272 meter will execute a waveform capture and/or record a power quality event. (The Nexus® 1260 and 1262 meters do not support Waveform Thresholds.) See Chapter 8 for instructions on viewing logs.
PQ and Waveform Thresholds are given as a percentage of the Full Scales (% of FS). Set the Full Scales in the Limits and Waveform Full Scales setting of the Device Profile (Section 4.3.2). Full Scales are based on the CT and PT ratios set in the CT, PT Ratios and System Hookup setting of the Device Profile (Section 4.3.1).
Before programming the PQ and Waveform Thresholds, set the CT and PT ratios and the Limits and Waveform Full Scales.
NOTE ON SAMPLING RATE: A higher sampling rate allows for transients to be monitored. Generally, the meter will be set to take 128 samples per cycle for this purpose. Lower sampling rates have advantages, however, because they allow you to record more cycles of information per event screen. Low sampling rates are better for long duration events, like motor starts or distribution faults. The meter enables you to tailor the recording for both these applications. For more information on Sampling Rate, see the table on page on page 4-53.
1. From the Device Profile screen (see Section 4.2), double-click on the PQ Thresholds (Waveform Recording) line. You will see the screen pictured on the right.

E Electro Industries/GaugeTech DOC # E107707 4-52
2. To set the threshold for a PQ event and waveform capture, enter the desired percentage of Full Scale in the Value(%) column of the Above Setpoint and Below Setpoint sections. Full Scales are shown in the lower right corner of the screen.
NOTE ON CBEMA: The CBEMA plotting is a power quality standard known worldwide for recording the amount of damage voltage transient conditions have done to the equipment being
monitored. The meter automatically records this information. For CBEMA purposes, program internal set points for voltage below 90% and above 110% of full scale (+/- 10% from the nominal voltage). These set points are defined by the ITI (CBEMA) specification. The ITI (CBEMA) Curve is published by Information Technology Industry Council (ITI).
You can set a recording with tighter voltage limits to trigger a waveform recording. However, CBEMA plotting will be based only on the limits internally set.
NOTE ON SETTING THE METER TO RECORD CURRENT FAULTS: The voltage set points are used to record voltage type events, such as voltage surges, sags and transients. The current settings are used to record faults on the line or in-rush currents from devices such as motors. Typically, to catch these events, set the limit to above 200% of full scale.
Waveform Clipping Threshold
• Nexus® 1272 Meter Standard Hardware - 91.0924A Peak before clipping.
High Speed Inputs:. The High Speed Inputs field allows you to see which High Speed Inputs are enabled for Waveform recording. IMPORTANT! You assign the High Speed Input to its trigger in the High Speed Inputs screen (see Section 4.5.6).
Samples per Cycle
To choose the Samples per Cycle to be recorded at 60 Hz, click on the Sampling Rate pull- down menu. Choose from 16, 32, 64, 128, 256 and 512 samples per cycle. The number of samples per cycle you choose will inversely affect the number of cycles per capture.
• If you select 256, a Capture Only pop-up screen will ask you to select Volts A, B, C or I A, B, C.
• If you select 512, a Capture Only pop-up screen will ask you to select one of the individual channels.

E Electro Industries/GaugeTech DOC # E107707 4-53
The table below illustrates the effects of sampling rate on the number of cycles captured. Increasing the Sampling Rate increases Waveform definition, but reduces the length of the observed window. The approximate length of the observed window is shown in the last column.
Effects of Sampling Rate Samples
Per Cycle
Channels
Samples Per
Channel
Cycles Per
Capture
Time
(Approx)
Analog HSI
16 7 8 1024 64 1 Second 32 7 8 1024 32 ½ Second 64 7 8 1024 16 ¼ Second
128 7 8 1024 8 1/8 Second 256 3 8 2048 8 1/8 Second 512 1 8 4096 8 1/8 Second
For example, for observed events of approximately ½ second, a sampling rate of 32 samples per Cycle, or less, should be used.
NOTE ON WAVEFORM EVENT CAPTURES: A screen of data is one capture. If you set Total Captures to 3 and you are recording at 16 samples per cycle, you will record:
16 Samples 3 x 64 = 192 cycles of recorded waveforms 128 Samples 3 x 8 = 24 cycles of recorded waveforms
With the 2 Megabyte module, you have a total of 64 captures; with the 4 Megabyte module, you have a total of 96 captures. You can partition the memory in any fashion required by your application. There is no limitation on the amount of cycles that can be recorded per event.
3. To choose the total amount of captures, click on the Total Captures pull-down menu. Select
from 0 to 96 captures. The higher the number, the more information you will be “stringing together.”
4. When all changes are entered, click OK to return to the main Device Profile screen. For
changes to take effect, you must click the Update Device button. This sends the new profile to the meter.

E Electro Industries/GaugeTech DOC # E107707 4-54
4.5.4: EN50160/IEC61000-4-30 Flicker
With the EN50160/IEC610004-3- Flicker screen, you can set the test times for the Flicker function.
1. From the Device Profile screen (Section 4.2), double-click on the EN50160/IEC61000-4-30 Flicker line.
2. From the pull-down menus, select:
• Frequency • Short Term Test
Time • Long Term Test
Time. 4. When all changes have been
entered, click OK to return to the main Device Profile screen. For these changes to take effect, you must click the Update Device button. This sends the new profile to the Nexus® meter.
NOTE: Flicker is discussed in detail in Chapter 16 of this manual. 4.5.5: I Squared T and V Squared T Thresholds With the I Squared T and V Squared T Thresholds screen, you can set the point at which
Current and Voltage should accumulate. 1. From the Device Profile screen (Section
4.2), click on the + button next to I Squared T and V Squared T Thresholds or double-click on that line. You will see the sub-menu shown on the right, showing the current settings for the meter.
2. Double-click one of the settings to open the I Squared T and V Squared T Thresholds screen, shown on the next page.

E Electro Industries/GaugeTech DOC # E107707 4-55
3. Enter the thresholds in the I Squared T and V Squared T fields. 4. Click OK to exit the screen and return to the main Device Profile screen. For any changes to take effect, you must click the Update Device button. This sends the new profile to the meter. 4.5.6: High Speed Inputs
This setting of the Device Profile enables you to label the eight High Speed Inputs and to specify their status. Labeling the inputs allows you to determine the source of status change when data is later analyzed.
1. From the Device Profile screen (see Section 4.2), double-click on the High Speed Inputs line or click on the + button next to it. You will see the following display.

E Electro Industries/GaugeTech DOC # E107707 4-56
3. Double-click any of the Input lines. You will see the following screen.
4. Double-click a field to enter data:
• Name • Open Label • Shorted Label • Normal Condition
5. Click on the Input Type field to select an option from the pull-down menu.
The available selections are:
• KYZ Input: select this option to designate the input as a pulse (KYZ) input. • Waveform/PQ Trigger: select this option if you want the input to trigger a
waveform/PQ recording (see Section 4.5.3). • Block Window Sync Pulse: select this option if you want to synchronize the meter
with pulses from the input (see Section 4.4.2).
6. When you have finished making your selections, click OK to exit the screen and return to the main Device Profile screen. For any changes to take effect, you must click the Update Device button. This sends the new profile to the meter.
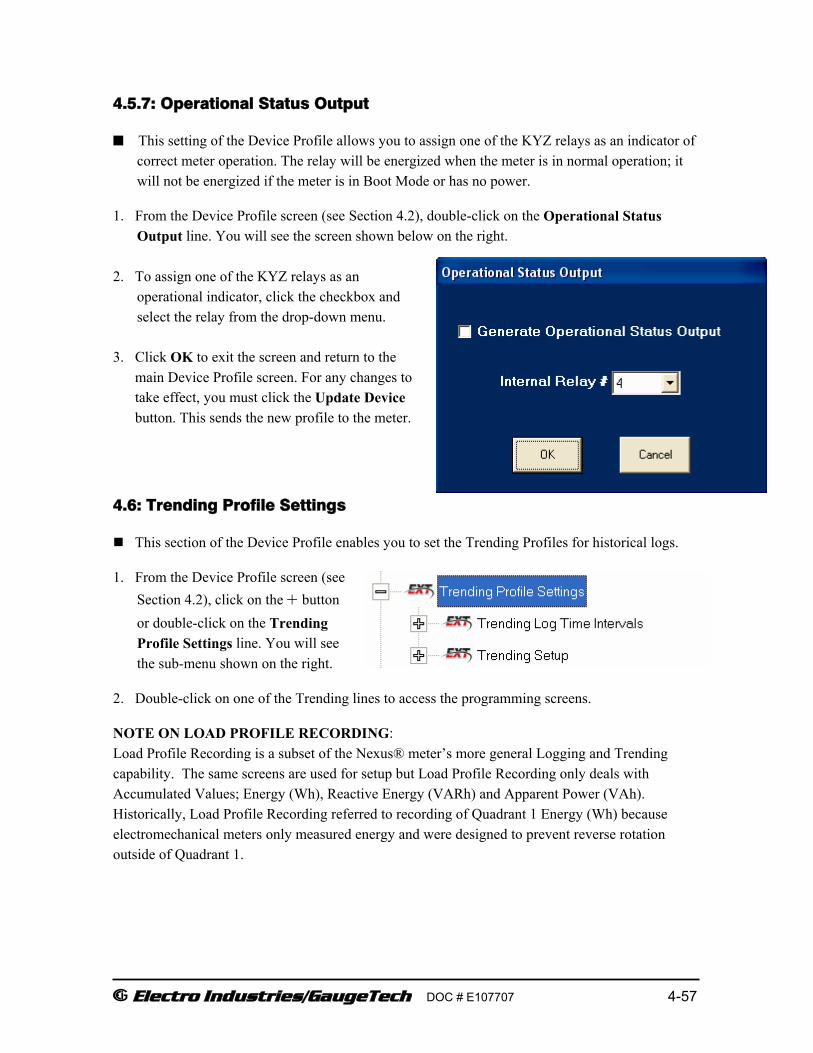
E Electro Industries/GaugeTech DOC # E107707 4-57
4.5.7: Operational Status Output
This setting of the Device Profile allows you to assign one of the KYZ relays as an indicator of correct meter operation. The relay will be energized when the meter is in normal operation; it will not be energized if the meter is in Boot Mode or has no power.
1. From the Device Profile screen (see Section 4.2), double-click on the Operational Status Output line. You will see the screen shown below on the right.
2. To assign one of the KYZ relays as an
operational indicator, click the checkbox and select the relay from the drop-down menu.
3. Click OK to exit the screen and return to the main Device Profile screen. For any changes to take effect, you must click the Update Device button. This sends the new profile to the meter. 4.6: Trending Profile Settings
This section of the Device Profile enables you to set the Trending Profiles for historical logs.
1. From the Device Profile screen (see Section 4.2), click on the + button or double-click on the Trending Profile Settings line. You will see the sub-menu shown on the right.
2. Double-click on one of the Trending lines to access the programming screens.
NOTE ON LOAD PROFILE RECORDING: Load Profile Recording is a subset of the Nexus® meter’s more general Logging and Trending capability. The same screens are used for setup but Load Profile Recording only deals with Accumulated Values; Energy (Wh), Reactive Energy (VARh) and Apparent Power (VAh). Historically, Load Profile Recording referred to recording of Quadrant 1 Energy (Wh) because electromechanical meters only measured energy and were designed to prevent reverse rotation outside of Quadrant 1.

E Electro Industries/GaugeTech DOC # E107707 4-58
4.6.1: Programming the Trending Log Time Intervals
Trending Log Time Intervals determine the interval at which Historical Logs 1 and 2 take a “snapshot” of data. To set the parameters for the logs, see Section 4.6.2. See Chapter 8 for information on viewing and retrieving logs.
1. From the Device Profile screen (see Section 4.2), double-click Trending Profile Settings or click the + button next to it.
2. Double-click Trending Log Time Intervals or click the + button next to it. You will see the sub-menu shown below, on the right.
The intervals set for Logs 1 and 2 are shown. To change an interval, double-click on the line.
3. Double-click on either Log Interval. You will the screen pictured on the right. It allows you to set the interval for the logs.
4. Click OK to save your changes or click Cancel to exit the screen without changing intervals. For these changes to take effect, you must click the Update Device button. This sends the new profile to the meter.
4.6.2: Programming the Trending Setup for Historical Logs 1 and 2
The Trending Setup controls the channel assignments for Historical Logs 1 and 2. To set the Time Intervals for these Logs, see Section 4.6.1. See Chapter 8 for instructions on retrieving logs.
1. From the Device Profile screen (see Section 4.2), click on
the + button next to Trending Setup or double-click on the Trending Setup line. You will see the sub-menu shown on the right.
2. Double-click on the Log whose settings you want to change. You will see the Trending Log
Profile screen for the log you selected.
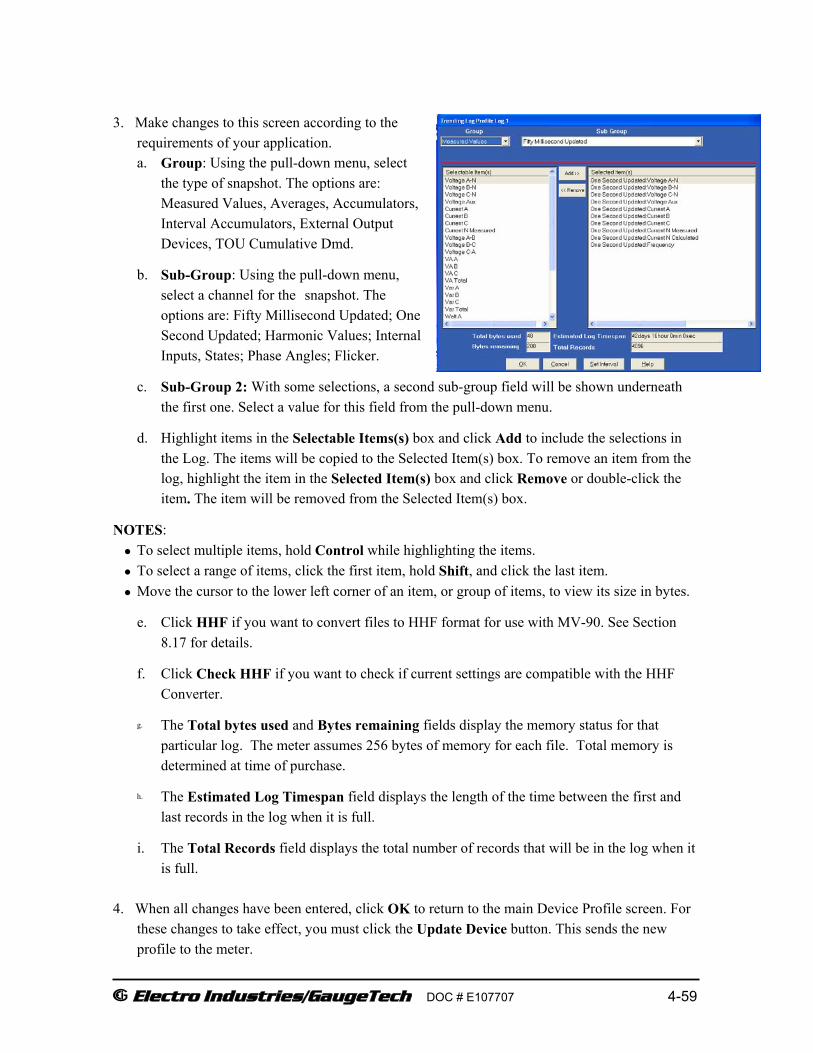
E Electro Industries/GaugeTech DOC # E107707 4-59
3. Make changes to this screen according to the
requirements of your application. a. Group: Using the pull-down menu, select
the type of snapshot. The options are: Measured Values, Averages, Accumulators, Interval Accumulators, External Output Devices, TOU Cumulative Dmd.
b. Sub-Group: Using the pull-down menu, select a channel for the snapshot. The options are: Fifty Millisecond Updated; One Second Updated; Harmonic Values; Internal Inputs, States; Phase Angles; Flicker.
c. Sub-Group 2: With some selections, a second sub-group field will be shown underneath the first one. Select a value for this field from the pull-down menu.
d. Highlight items in the Selectable Items(s) box and click Add to include the selections in the Log. The items will be copied to the Selected Item(s) box. To remove an item from the log, highlight the item in the Selected Item(s) box and click Remove or double-click the item. The item will be removed from the Selected Item(s) box.
NOTES: • To select multiple items, hold Control while highlighting the items. • To select a range of items, click the first item, hold Shift, and click the last item. • Move the cursor to the lower left corner of an item, or group of items, to view its size in bytes.
e. Click HHF if you want to convert files to HHF format for use with MV-90. See Section 8.17 for details.
f. Click Check HHF if you want to check if current settings are compatible with the HHF Converter.
g. The Total bytes used and Bytes remaining fields display the memory status for that particular log. The meter assumes 256 bytes of memory for each file. Total memory is determined at time of purchase.
h. The Estimated Log Timespan field displays the length of the time between the first and last records in the log when it is full.
i. The Total Records field displays the total number of records that will be in the log when it is full.
4. When all changes have been entered, click OK to return to the main Device Profile screen. For
these changes to take effect, you must click the Update Device button. This sends the new profile to the meter.

E Electro Industries/GaugeTech DOC # E107707 4-60
4.6.3: Pad Missing Records for Historical Logs
If the meter is not in normal operation, it will not record any data for Logs 1 and 2. For example, during firmware updates or loss of power, data will not be saved. Some applications may require that data logs contain those missing records.
To remedy this problem, enable the Pad Missing Records for Historical Logs feature.
1. Click View>Options. You will see the Options screen. 2. Click the Log Retrieval tab. You will see the screen pictured on the right. 3. Check the box next to the Pad Device option by
clicking on it, and enter the number of days in the Days field. NOTE: If the box is already checked, this feature is already functional. You can change the number of days, or click the box to un-select this feature.
4. Click OK to save your selection and exit the screen.
4.7: External I/O Modules
This setting of the Device Profile allows you to set up the Nexus® I/O Devices, a variety of Input and Output Modules that can be used with the meter.
1. From the Device Profile screen (see Section 4.2), double-click on the External I/O Modules
line. You will see the screen pictured on the next page.
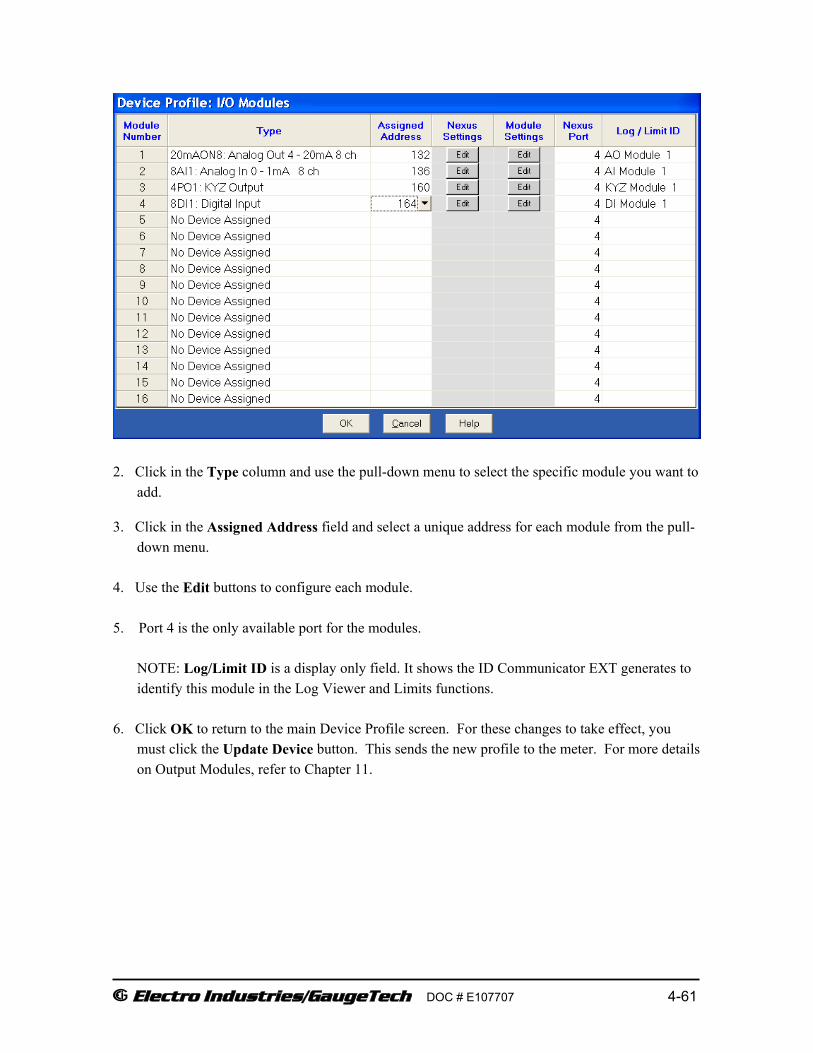
E Electro Industries/GaugeTech DOC # E107707 4-61
2. Click in the Type column and use the pull-down menu to select the specific module you want to
add.
3. Click in the Assigned Address field and select a unique address for each module from the pull-down menu.
4. Use the Edit buttons to configure each module. 5. Port 4 is the only available port for the modules.
NOTE: Log/Limit ID is a display only field. It shows the ID Communicator EXT generates to identify this module in the Log Viewer and Limits functions.
6. Click OK to return to the main Device Profile screen. For these changes to take effect, you
must click the Update Device button. This sends the new profile to the meter. For more details on Output Modules, refer to Chapter 11.

E Electro Industries/GaugeTech DOC # E107707 4-62
4.8: Set and Retrieve Device Time
The meter uses its on-board clock for time-stamping any logs it is recording. To set the meter’s clock: 1. Select Tools>Set Device Time. You will see the Set Device
On-Board Clock screen.
• To synchronize the meter and your computer, leave the Use PC Time box checked.
• To set the date and time independently from the PC, deselect the Use PC Time box and enter the time and date settings. 2. Click the Send button to update the meter’s time settings and exit the screen. Click Cancel to
exit the screen without making any changes. To retrieve the meter’s current time and date settings: 1. Select Tools> Retrieve Device Time. You will see the screen pictured on the right. Date and
running time display in the LEDs. • If IRIG-B is enabled for your meter, IRIG-B is
displayed next to the time. • If Line Sync is enabled for your meter, LINE
SYNC is displayed next to the time. • If Daylight Savings Time is active, DST is
displayed next to the time. • If Cold Load Pickup is active, Active Cold
Load is displayed next to the time. 2. Click OK to exit the screen.

E Electro Industries/GaugeTech DOC # E107707 4-63
4.9: Reset Device Information
1. Select Tools>Reset Device Information. You will see the Reset Device Parameters screen.
2. Click on the tabs to navigate between screens.
3. Click on the box beside the value(s) you would like to reset.
NOTE: If your meter has Scaled Energy, the Reset Cumulative Demand Registers selection appears on the second tab. If your meter does not have Scaled Energy, you will not see that option.
4. Click OK to process your selection and exit the screen. Click Cancel to exit the screen without
making any selections.
For each box you select, a message window opens, telling you the Reset is complete. Click OK to close the message window.
NOTE: You can restrict this feature through Password Protection by enabling the Password feature of the meter (see Chapter 12 for details). 4.10: Manual Waveform Capture 1. Click Tools>Manual Waveform Capture. You will see the Waveform Log Statistics screen.
2. Click the Trigger Now button to create a waveform. Communicator EXT creates a Waveform
in the meter’s memory. The value in the Records field will increase by 1. 3. Click OK to exit the screen.
NOTE: For instructions on retrieving and viewing the Waveform logs, refer to Sections 8.3, 8.9, and 8.10.

E Electro Industries/GaugeTech DOC # E107707 4-64
4.11: Setting Test Mode Preset Accumulators
Use the Test Mode Preset screens in the following situations:
• A meter in Test Mode is out of service and not monitoring accumulations. You can use the Test Mode Preset screen to enter a new value that adjusts for those not monitored while the meter is in Test Mode.
• You are replacing an old meter that has accumulations with a new meter that has no accumulations. You can use the Test Mode Preset screen to set the new meter with the accumulation values from the old meter.
Setting Test Mode Preset Accumulators for the Nexus® 1262/1272 Meter
1. From the Menu bar select Tools> Test Mode>Preset Accumulators. You will see the screen shown on the right.
2. Click the tabs to navigate between the Test Mode Preset screens. There are screens for: Primary Energy,
Secondary Energy, Primary Energy (Quadrants), Secondary Energy (Quadrants), Internal Input Accumulators, KYZ Output Accumulators, I & V Squared T Accumulators, Cumulative Demand (Secondary), Uncompensated Energy and Q Hours.
Each screen has a Current Value, New Value and Preset Box for each of its accumulators. A new meter will have zeros for Current Values.
3. Click the Preset Box next to any value(s) you want to set and click Set.

E Electro Industries/GaugeTech DOC # E107707 4-65
Setting Test Mode Preset Accumulators for the Nexus® 1260/1270 Meter
Follow the instructions for Setting Test Mode Preset Accumulators for the Nexus® 1262/1272 meter, on the previous page.
The Test Mode Preset screens for the 1260/1270 are the same as those for the 1262/1272, except that there are fewer screens, and they each have an Accumulations Rollover field at the bottom. NOTES: • Programmed (Accumulations) Rollover is
set in the Device Profile (see Section 4.4.11). If you try to enter a value greater than the Rollover value, the software will not allow it.
• The Nexus® 1260/1270 meter must be manually placed in Test Mode (by pushing the Test Mode button on the unit) before clicking the Set button.
4.12: Performing CT and PT Compensation
The CT and PT Compensation feature allows you to remove an error caused by the CTs (external to unit) and PTs that are connected to the unit. 1. Make sure that CT and PT Compensation is enabled for your meter. (See Section 4.4.5 for instructions.) 2. Click Tools>CT & PT Compensation> Calibration Table Status.
4. Click First Time CT & PT Comp Selection.
5. Click Preload CT & PT Comp with initial values.
6. Click OK.

E Electro Industries/GaugeTech DOC # E107707 4-66
7. Click Tools>CT & PT Compensation>View Calibration Tables.
8. Click Copy Factory Table to CT & PT Comp Table.
9. Click OK. CT & PT Compensation is now enabled and ready for corrections. Collect data to determine the required correction(s). 10. To compensate CTs & PTs, click Tools> CT & PT Compensation>Compensate CTs & PTs.
11. You will see the screen shown on the right.
• Click the Step tabs to see additional screens (shown below).
• Follow screen instructions to make your corrections.
12. Click OK to save any changes.

E Electro Industries/GaugeTech DOC # E107707 4-67
4.13: Clock Compensation 1. Click Tools>Clock Compensation. You will see the screen shown below. Use this screen to
adjust the meter's clock to compensate for it being faster or slower.
2. Click the checkbox to enable compensation. 3. Enter the number of seconds per month you want the clock adjusted and click the Faster or
Slower radio button. 4. Click Update to save your settings or Exit to close the screen without saving any changes.

E Electro Industries/GaugeTech DOC # E107707 4-68
This page intentionally left blank.

Doc# E107707 5 - 1
5: Configuring EIG Panel Meters
Electro Industries/GaugeTechThe Leader In Power Monitoring and Smart Grid SolutionsElectro Industries/GaugeTechThe Leader In Power Monitoring and Smart Grid Solutions
5: Configure EIG Panel Meters
5.1: Introduction
Use Communicator EXT Software to configure the EIG panel meters, which include the
Shark® Series meters, the Futura+ meter and the DM Series meters. The Shark®
Series meters are explained in Sections 5.2 - 5.4; the Futura+ and DM Series meters
are explained in Section 5.5. To configure the Nexus® 1250/52 meter, see Chapter 3;
to configure the Nexus® 1260/1270 or 1262/1272 meter, see Chapter 4; to configure
the Nexus® 1500 meter, see Chapter 19.
NOTE: If you cannot connect to your meter, make sure your communication settings
match those shown in the connection instructions for your meter.
5.2: SHARK® Series Configuration
You configure the Shark® 50, 100, 100B, 100S, 200, and 200S meters using either
the meter Face Buttons (Menu, Enter, Down and Right) or Communicator EXT soft-
ware. Depending on the meter model, you connect to the meter for software configu-
ration, using either the IrDA port (Com 1) on the face of the meter, the RS485 port
(Com 2) on the back panel of the meter, or the Ethernet connection of the meter. (The
communication port options available for your meter model are detailed in its Installa-
tion and Operation Manual.) Once Communicator EXT 3.0 software has been installed
on your computer and a wired or wireless connection has been established, you can
begin to communicate with the meter. The Transducer Only models (Shark® 100T/
100BT/200T) do not have faceplate buttons or IrDA, so they must be programmed
using one of the other Com port options. Note that the Shark® 50 meter does not
have an IrDA interface.
5.2.1: Quick Connect
Quick Connect is the easiest way to connect via Communicator EXT to the meter.
From the Communicator EXT Main screen, click Connection>Quick Connect or click
the Connect icon. You will see the Connect
screen, shown on the next page.
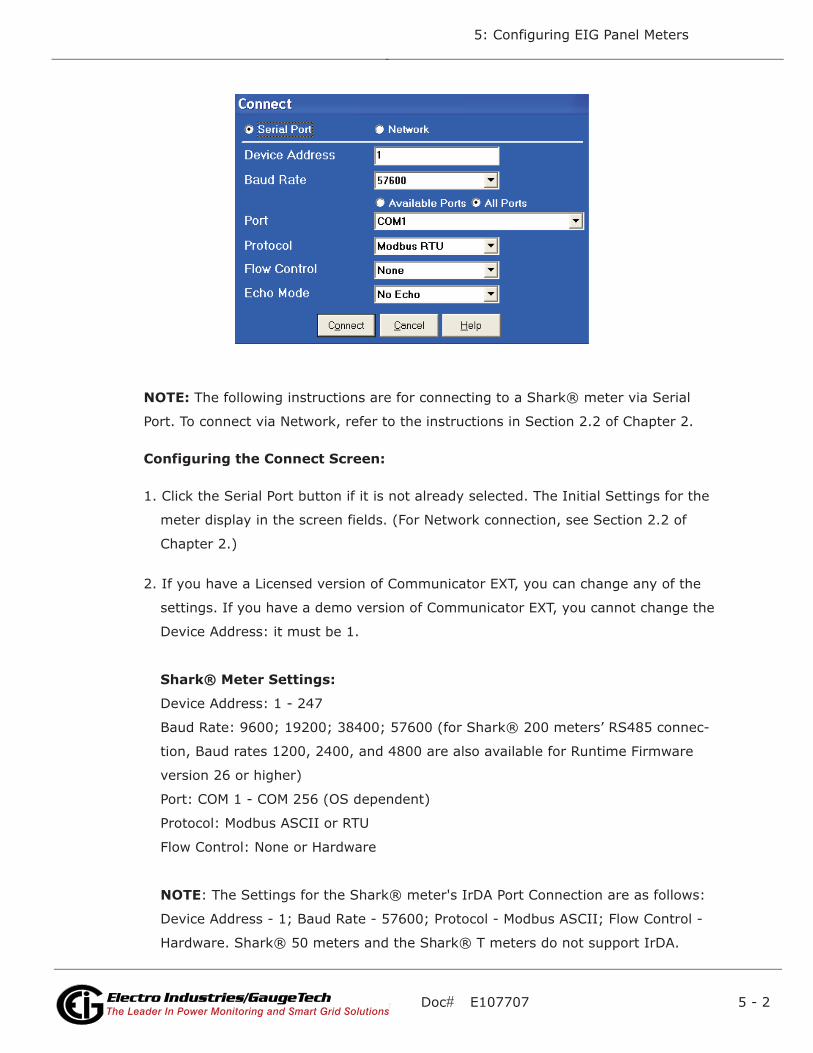
Doc# E107707 5 - 2
5: Configuring EIG Panel Meters
Electro Industries/GaugeTechThe Leader In Power Monitoring and Smart Grid SolutionsElectro Industries/GaugeTechThe Leader In Power Monitoring and Smart Grid Solutions
NOTE: The following instructions are for connecting to a Shark® meter via Serial
Port. To connect via Network, refer to the instructions in Section 2.2 of Chapter 2.
Configuring the Connect Screen:
1. Click the Serial Port button if it is not already selected. The Initial Settings for the
meter display in the screen fields. (For Network connection, see Section 2.2 of
Chapter 2.)
2. If you have a Licensed version of Communicator EXT, you can change any of the
settings. If you have a demo version of Communicator EXT, you cannot change the
Device Address: it must be 1.
Shark® Meter Settings:
Device Address: 1 - 247
Baud Rate: 9600; 19200; 38400; 57600 (for Shark® 200 meters’ RS485 connec-
tion, Baud rates 1200, 2400, and 4800 are also available for Runtime Firmware
version 26 or higher)
Port: COM 1 - COM 256 (OS dependent)
Protocol: Modbus ASCII or RTU
Flow Control: None or Hardware
NOTE: The Settings for the Shark® meter's IrDA Port Connection are as follows:
Device Address - 1; Baud Rate - 57600; Protocol - Modbus ASCII; Flow Control -
Hardware. Shark® 50 meters and the Shark® T meters do not support IrDA.

Doc# E107707 5 - 3
5: Configuring EIG Panel Meters
Electro Industries/GaugeTechThe Leader In Power Monitoring and Smart Grid SolutionsElectro Industries/GaugeTechThe Leader In Power Monitoring and Smart Grid Solutions
3. Click Connect to connect to your meter. When a connection is established, you will
see the Device Status screen, listing the Currently Connected Devices. See the
screen shown below.
4. Click OK. You will see the Communicator EXT Main screen.
5.2.2: Connection Manager
Use Connection Manager to add or remove connection locations and/or devices at
locations.
1. From the Communicator EXT Main screen, click Connection>Connection
Manager or click on the Connect Mgr icon. You will see the Connection Manager
screen, shown on the next page.

Doc# E107707 5 - 4
5: Configuring EIG Panel Meters
Electro Industries/GaugeTechThe Leader In Power Monitoring and Smart Grid SolutionsElectro Industries/GaugeTechThe Leader In Power Monitoring and Smart Grid Solutions
List of Locations:
On the left side of the Connection Manager screen is a List of Locations. These are the
locations of one or more meters to which you can connect. You can add a location
and/or a device; edit a location and/or device; or remove a location and/or device.
To Add a Location:
a. Click on a New Location.
b. Click Add. You will see the Connection
Manager Location Editor screen. On
this screen, you program the Commu-
nication settings for each New Loca-
tion.
c. Type a Name for the New Location.
d. Click Serial Port or Network.
e. Enter Communications Settings:
Com Port: COM 1 - 99
Baud Rate: 1200 - 115200
Flow Control: None or Hardware

Doc# E107707 5 - 5
5: Configuring EIG Panel Meters
Electro Industries/GaugeTechThe Leader In Power Monitoring and Smart Grid SolutionsElectro Industries/GaugeTechThe Leader In Power Monitoring and Smart Grid Solutions
Data Bits: 8 (or 7)
Parity: None (Even, Odd)
To Add a Device:
Click Add Serial (to add a Serial Port Connected Device) or Add Net (to add a Net-
work Connected Device) in the Devices at Location box. You can add up to 255
Devices (Serial Port and/or Network connected) at one Location.
NOTES:
• All devices must have the same connection parameters: Baud, Parity and Flow
Control.
• Having multiple devices slows down polling.
To Edit a Device:
a. Select the Device from the Devices at Location box. (Scroll down to find all
devices.)
b. Click Edit. You will see the Connection Manager Location Device Editor screen,
which you use to program the Device Properties for each device at a Location.
If the Device has a Serial Port Device Connection, you will see the example
screen on the left. If the Device has a Network Device Connection, you will see
the example screen on the right. Click the Network or Serial buttons at the top
of the screen to switch connection screens.
Doc# E107707 5 - 6
5: Configuring EIG Panel Meters
Electro Industries/GaugeTechThe Leader In Power Monitoring and Smart Grid SolutionsElectro Industries/GaugeTechThe Leader In Power Monitoring and Smart Grid Solutions
i. Enter Device Properties:
Address: 1 - 247 (Unique Address)
Name: Device Name
Description: (Type and Number, for example)
Protocol: Modbus RTU or ASCII (Modbus TCP, EI Protocol for devices
other than a Shark® meter)
Device Type: Shark® meter (Others: Nexus®, Nexus® External Output
Module, Futura+,DMMS)
Comm Port: 1 or 2 (Serial Port Only)
IP Address:100.10.10.10 (for example) (Network Only)
Port Number:502 (Default) (Network Only)
ii. Click Close to save settings and return to the Connection Manager Loca-
tion Editor screen.
To Remove a Device:
Select the Device from the Devices at Location box and click Remove.
f. Click Close to return to the Connection Manager screen.
To Edit a Location:
a. Select a Location from the List of Locations box.
b. Click Edit. The Connection Manager Location Editor screen appears, displaying
the current settings for the location.
c. Make any changes to settings and/or devices at the location.
d. Click Close to exit the screen.
To Remove a Location:
a. Select a Location from the List of Locations box.
b. Click Remove.
c. Click Yes in the Confirmation window that happens.
To Sort the List of Locations:

Doc# E107707 5 - 7
5: Configuring EIG Panel Meters
Electro Industries/GaugeTechThe Leader In Power Monitoring and Smart Grid SolutionsElectro Industries/GaugeTechThe Leader In Power Monitoring and Smart Grid Solutions
a. Select a sort method (A-Z, Z-A, Newest-Oldest or Oldest-Newest) from the pull-
down menu.
b. Click Sort By.
To Connect to a Location:
a. Select the Location you want to connect to from the List of Locations box.
NOTE: You may only connect to one location at a time. To change to a different
location, you must disconnect from the current location by selecting it and
clicking Disconnect.
b. Click Connect. When the connection is made, the selected location appears in
the Connected To Location field at the top of the screen.
c. Click Close. The Device Status screen opens, confirming the connection. The
Computer Status Bar at the bottom of the screen also confirms the computer's
connection parameters.
NOTE: If the connection fails, a popup screen will alert you. Check that all
cables are secure, that the RS232 cable is connected to the correct COM Port on
the computer and that the computer is set to use the same baud rate and proto-
col as the EIG meter to which the computer is connected.
5.2.3: Disconnecting
To disconnect from a Shark® meter or from a location, do one of the following:
• From the Communicator EXT Main screen, click the Disconnect icon.
• From the Communicator EXT Main screen, select Connection>Disconnect.
• From the Connection Manager screen, select the location from the Connected to
Location field and click Disconnect.
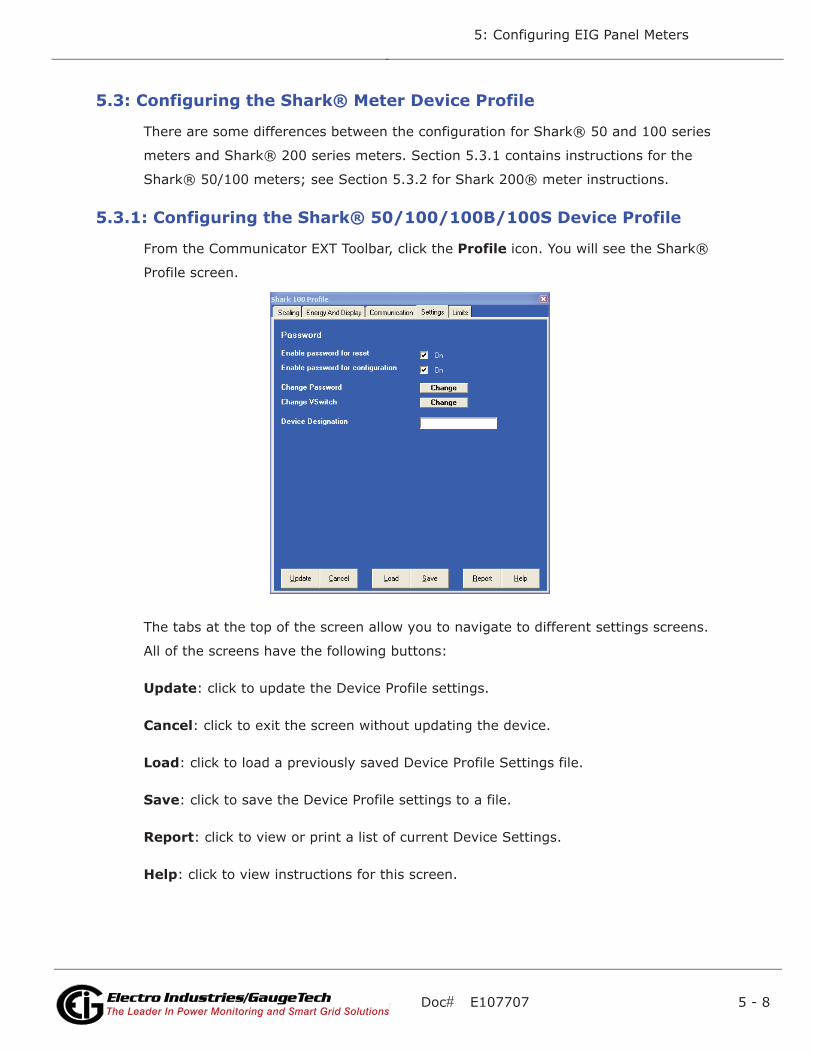
Doc# E107707 5 - 8
5: Configuring EIG Panel Meters
Electro Industries/GaugeTechThe Leader In Power Monitoring and Smart Grid SolutionsElectro Industries/GaugeTechThe Leader In Power Monitoring and Smart Grid Solutions
5.3: Configuring the Shark® Meter Device Profile
There are some differences between the configuration for Shark® 50 and 100 series
meters and Shark® 200 series meters. Section 5.3.1 contains instructions for the
Shark® 50/100 meters; see Section 5.3.2 for Shark 200® meter instructions.
5.3.1: Configuring the Shark® 50/100/100B/100S Device Profile
From the Communicator EXT Toolbar, click the Profile icon. You will see the Shark®
Profile screen.
The tabs at the top of the screen allow you to navigate to different settings screens.
All of the screens have the following buttons:
Update: click to update the Device Profile settings.
Cancel: click to exit the screen without updating the device.
Load: click to load a previously saved Device Profile Settings file.
Save: click to save the Device Profile settings to a file.
Report: click to view or print a list of current Device Settings.
Help: click to view instructions for this screen.

Doc# E107707 5 - 9
5: Configuring EIG Panel Meters
Electro Industries/GaugeTechThe Leader In Power Monitoring and Smart Grid SolutionsElectro Industries/GaugeTechThe Leader In Power Monitoring and Smart Grid Solutions
5.3.1.1: Configuring (Systems) Settings Screen
Click the Settings tab from the Shark® Profile screen to display the Settings screen
(see the example screen on the previous page). From this screen, you can do the fol-
lowing:
• Enable or Disable Password for Reset and/or Configuration: click the checkbox next
to the option. Enabling Password protection prevents unauthorized tampering with
devices.
IMPORTANT! You must set up a password before enabling Password Protection.
Click the Change button next to Change Password if you have not already set up a
password.
• Change the Password (see Section 5.3.1.2) or V-Switch™ key (see Section
5.3.1.3): click Change next to the option you want to change.
• Change the Device Designation: input a new designation into this field.
5.3.1.1.1: Password Settings
When you click the Change button next to Change Password in the Settings screen,
you will see the Enter the New Password screen.
1. Type in the new password (0 - 9999).
2. Retype the password.
3. Click Change. The new password is saved and the meter restarts.
Once you create a password, you enable or disable the password for Reset (Reset
Max/Min Energy Settings) or Configuration (Device Profile) in the Settings screen (see
Section 5.3.1.1).

Doc# E107707 5 - 10
5: Configuring EIG Panel Meters
Electro Industries/GaugeTechThe Leader In Power Monitoring and Smart Grid SolutionsElectro Industries/GaugeTechThe Leader In Power Monitoring and Smart Grid Solutions
When a user attempts to make a change that is under Password protection, Commu-
nicator EXT opens a screen asking for the password. (See the example screen below.)
If the correct Password is not entered, the change doesn’t take place.
5.3.1.1.2: V-Switch™ Key Upgrade
The Shark® Series meter is equipped with V-Switch™ key technology. The V-Switch™
key is a virtual firmware-based switch that allows you to enable meter features
through communication. This means you can upgrade the meter to a "higher" model
after installation without removing it from service.
Consult you meter’s Installation and Operation manual for the available V-Switch™
keys for your meter model.
To change the V-Switch™ key:
1. Install Communicator EXT 3.0 on your PC.
2. Power up your meter.
3. Set up the Shark® meter to communicate with your computer.
4. Log on to Communicator EXT 3.0 software.
5. Click the Profile icon.
6. Click the Settings tab.

Doc# E107707 5 - 11
5: Configuring EIG Panel Meters
Electro Industries/GaugeTechThe Leader In Power Monitoring and Smart Grid SolutionsElectro Industries/GaugeTechThe Leader In Power Monitoring and Smart Grid Solutions
7. Click the Change button next to Change VSwitch™. You will see the screen shown
below.
8. Enter the code provided by EIG.
9. Click Update. The V-Switch™ key is changed and the Shark® meter restarts.
NOTE: V-Switch™ keys are based on the serial number of the ordered meter. To
purchase a key, you need to provide EIG with the following information:
1. Serial Number(s) of the meter(s) that you want to upgrade.
2. Desired V-Switch™ key.
3. A Credit Card or Purchase Order Number.
Contact EIG's inside sales staff with the above information at [email protected] to
receive the Upgrade key.

Doc# E107707 5 - 12
5: Configuring EIG Panel Meters
Electro Industries/GaugeTechThe Leader In Power Monitoring and Smart Grid SolutionsElectro Industries/GaugeTechThe Leader In Power Monitoring and Smart Grid Solutions
5.3.1.2: Configuring Communication Settings
Click the Communication tab from the Shark® Profile screen. You will see the screen
shown below. Use this screen to enter communication settings for the meter's two
ports: the IrDA Port (COM 1) and optional RS485 Port (COM 2).
IMPORTANT! The settings on this screen are the current communication settings. Be
careful when making changes as they may affect your ability to communicate with the
Shark® meter.
The screen fields and acceptable entries are as follows:
COM 1 (IrDA) (Not available for the Shark® 50 or Transducer Only models)
Response Delay: 0 - 750 (50msec increments)
COM 2 (RS485) (Not available for the Shark® 100B or Shark® 50 base model, or a
Shark® 100 with the Ethernet option)
Address:1 - 247
Protocol: Modbus RTU, ASCII or DNP
Baud Rate: 9600 - 57600
Response Delay: 0 - 750 (50msec increments)

Doc# E107707 5 - 13
5: Configuring EIG Panel Meters
Electro Industries/GaugeTechThe Leader In Power Monitoring and Smart Grid SolutionsElectro Industries/GaugeTechThe Leader In Power Monitoring and Smart Grid Solutions
NOTE: Response Delay is the delay the Shark® meter should use before responding
to queries. If your connecting device requires a delay before receiving information,
use response delay to program the time to wait before the meter starts responding to
queries.
5.3.1.3: Configuring Energy and Display
Click the Energy and Display tab from the Shark® meter's Profile screen. You will see
the screen shown below. This screen displays the current settings for Power and
Energy Format, Demand Averaging, Auto Scrolling and Display Configuration.
The screen fields and acceptable entries are as follows:
Power and Energy Format
Power Scale: Unit, kilo (k), Mega (M), Auto
Energy Digits: 5, 6, 7, 8
Decimal Places: 0 - 6
Energy Scale: Unit, kilo (k), Mega (M)
Example: Shows an example of selected settings.
Power Direction: View as Load or View as Generator
Doc# E107707 5 - 14
5: Configuring EIG Panel Meters
Electro Industries/GaugeTechThe Leader In Power Monitoring and Smart Grid SolutionsElectro Industries/GaugeTechThe Leader In Power Monitoring and Smart Grid Solutions
NOTES:
• The Energy Digits, Scale and Decimal Places settings determine how energy values
are displayed.
• If invalid values are entered, you will see the following warning message:
"Warning: Current CT, PT and Energy Settings may cause invalid energy accumula-
tor values." Once you correct the values and click Recalculate this message goes
away.
• If you are changing the energy digits, decimal places, or energy scale, we recom-
mend you first reset the Energy Accumulators, in order to prevent erroneous
counts. See Section 5.4.2 for instructions on resetting the Shark® meter’s Energy
Accumulators.
Demand Averaging
Average Method: Block or Rolling
Interval: 5, 15, 30 or 60 Minutes
Subinterval: 1, 2, 3 or 4
NOTE: Block Average cannot have a Subinterval.
Auto Scroll Display -
Click the checkbox to turn auto-scrolling On and Off. Auto-scrolling controls the dis-
play of selected parameters on the meter's faceplate. Refer to the Shark® 100 and
100T Meter Installation and Operations Manual for more information.
Display Configuration -
Check the boxes of the Readings you want displayed on the faceplate of the meter.
You must select at least one reading.
NOTE: This setting can be ignored for the Shark®100T/100BT transducer, since it
doesn't have a display.

Doc# E107707 5 - 15
5: Configuring EIG Panel Meters
Electro Industries/GaugeTechThe Leader In Power Monitoring and Smart Grid SolutionsElectro Industries/GaugeTechThe Leader In Power Monitoring and Smart Grid Solutions
5.3.1.4: Configuring Scaling
Click the Scaling tab from the Shark® 100 Profile screen. You will see the screen
shown below. This screen displays the current settings for CT and PT ratios and sys-
tem wiring.
The screen fields and acceptable entries are as follows:
CT Ratios -
CT Numerator (Primary): 1 - 9999
CT Denominator (Secondary): 5 or 1 Amp
NOTE: This field is display only.
CT Multiplier (Scaling): 1, 10 or 100
CT Fullscale: Display only. Click Recalculate if you have made changes to the above
fields.
PT Ratios -
PT Numerator (Primary): 1 - 9999
PT Denominator (Secondary): 40 - 600
PT Multiplier (Scaling): 1, 10, 100, or 1000

Doc# E107707 5 - 16
5: Configuring EIG Panel Meters
Electro Industries/GaugeTechThe Leader In Power Monitoring and Smart Grid SolutionsElectro Industries/GaugeTechThe Leader In Power Monitoring and Smart Grid Solutions
PT Fullscale: Display only. Click Recalculate if you have made changes to the above
fields.
NOTE: If invalid values are entered, you will see the following warning message -
Warning: Current CT, PT and Energy Settings may cause invalid energy accumulator
values.
Once you correct the values and click Recalculate this message goes away.
System Wiring -
3 Element Wye; 2.5 Element Wye; Delta with 2 CTs
Phases Displayed -
A; AB; ABC
Example CT Settings:
200/5 Amps:Set the Ct-n value for 200, Ct-Mult value for 1.
800/5 Amps:Set the Ct-n value for 800, Ct-Mult value for 1.
2,000/5 Amps:Set the Ct-n value for 2000, Ct-Mult value for 1.
10,000/5 Amps:Set the Ct-n value for 1000, Ct-Mult value for 1.
Example PT Settings:
277/277 Volts:Pt-n value is 277, Pt-d value is 277, Pt-Mult value is 1.
14,400/120 Volts:Pt-n value is 1440, Pt-d value is 120, Pt-Mult value is 10.
138,000/69 Volts:Pt-n value is 1380, Pt-d value is 69, Pt-Mult value is 100.
345,000/115 Volts:Pt-n value is 3450, Pt-d value is 115, Pt-Mult value is 100.
345,000/69 Volts:Pt-n value is 345, Pt-d value is 69, Pt-Mult value is 1000.
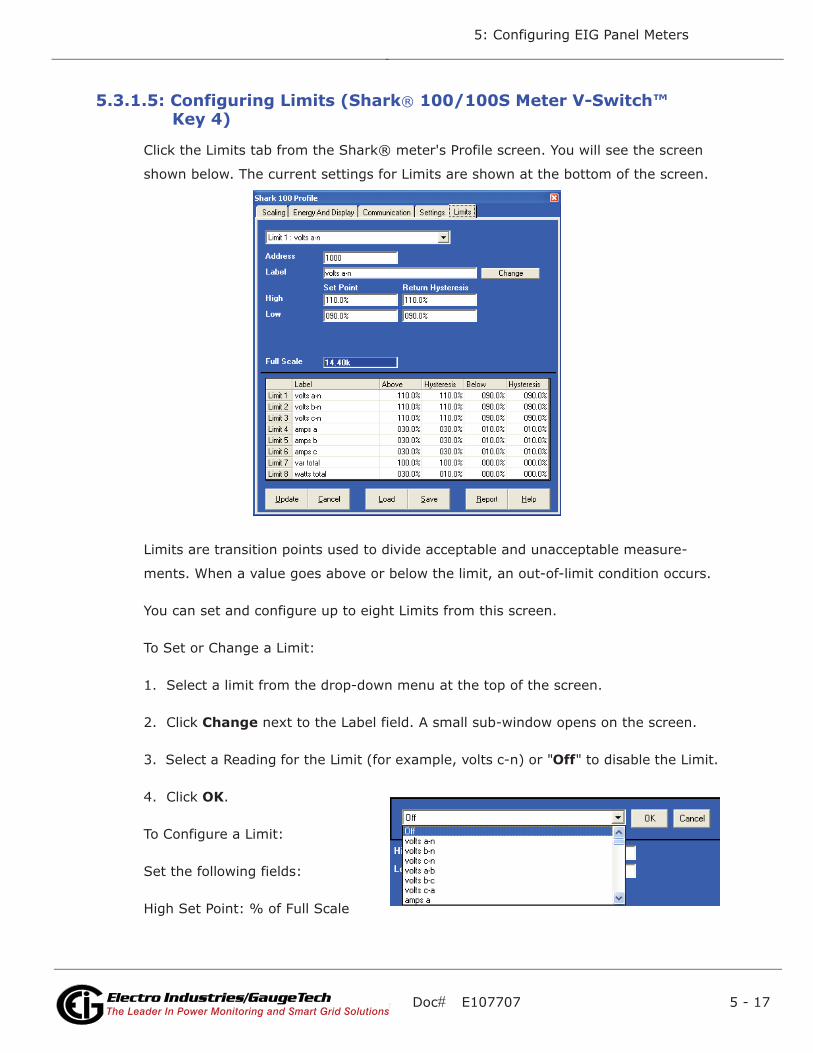
Doc# E107707 5 - 17
5: Configuring EIG Panel Meters
Electro Industries/GaugeTechThe Leader In Power Monitoring and Smart Grid SolutionsElectro Industries/GaugeTechThe Leader In Power Monitoring and Smart Grid Solutions
5.3.1.5: Configuring Limits (Shark® 100/100S Meter V-Switch™ Key 4)
Click the Limits tab from the Shark® meter's Profile screen. You will see the screen
shown below. The current settings for Limits are shown at the bottom of the screen.
Limits are transition points used to divide acceptable and unacceptable measure-
ments. When a value goes above or below the limit, an out-of-limit condition occurs.
You can set and configure up to eight Limits from this screen.
To Set or Change a Limit:
1. Select a limit from the drop-down menu at the top of the screen.
2. Click Change next to the Label field. A small sub-window opens on the screen.
3. Select a Reading for the Limit (for example, volts c-n) or "Off" to disable the Limit.
4. Click OK.
To Configure a Limit:
Set the following fields:
High Set Point: % of Full Scale

Doc# E107707 5 - 18
5: Configuring EIG Panel Meters
Electro Industries/GaugeTechThe Leader In Power Monitoring and Smart Grid SolutionsElectro Industries/GaugeTechThe Leader In Power Monitoring and Smart Grid Solutions
Example:
100% of 120V Full Scale = 120V
90% of 120V Full Scale = 108V
Return Hysteresis (the point at which the Limit's status changes from out of limit to
within limit):
Example:
High Set Point = 110%
(Out of Limit above 132V)
Return Hysteresis = 105%
(Stay Out of Limit until below 126V)
Low Set Point:% of Full Scale
Return Hysteresis (the point at which the Limit's status changes from out of limit to
within limit):
NOTE: If the High (Above) Return Hysteresis is greater than the High (Above) Set
Point, the Above Limit is Disabled; if the Low (Below) Return Hysteresis is less than
the Low (Below) Set Point, the Below Limit is Disabled. You may want to use this fea-
ture to disable either Above or Below Limit conditions for a reading.
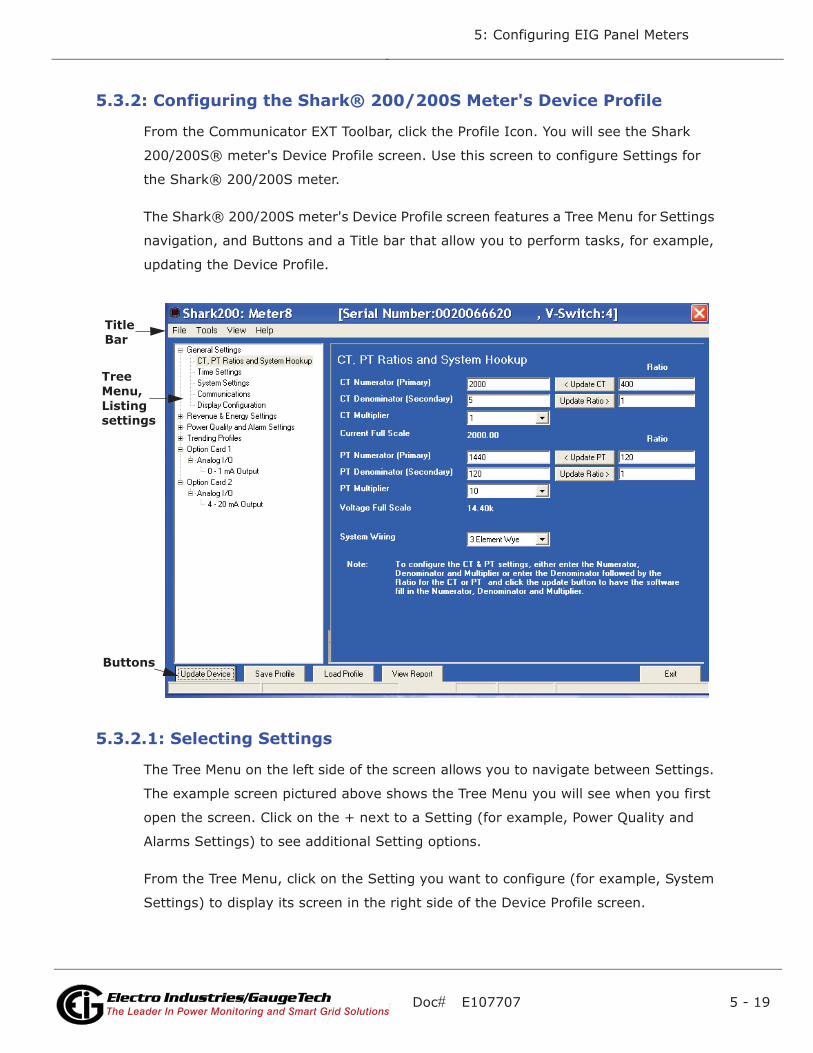
Doc# E107707 5 - 19
5: Configuring EIG Panel Meters
Electro Industries/GaugeTechThe Leader In Power Monitoring and Smart Grid SolutionsElectro Industries/GaugeTechThe Leader In Power Monitoring and Smart Grid Solutions
5.3.2: Configuring the Shark® 200/200S Meter's Device Profile
From the Communicator EXT Toolbar, click the Profile Icon. You will see the Shark
200/200S® meter's Device Profile screen. Use this screen to configure Settings for
the Shark® 200/200S meter.
The Shark® 200/200S meter's Device Profile screen features a Tree Menu for Settings
navigation, and Buttons and a Title bar that allow you to perform tasks, for example,
updating the Device Profile.
5.3.2.1: Selecting Settings
The Tree Menu on the left side of the screen allows you to navigate between Settings.
The example screen pictured above shows the Tree Menu you will see when you first
open the screen. Click on the + next to a Setting (for example, Power Quality and
Alarms Settings) to see additional Setting options.
From the Tree Menu, click on the Setting you want to configure (for example, System
Settings) to display its screen in the right side of the Device Profile screen.
Title Bar
Tree Menu, Listing settings
Buttons
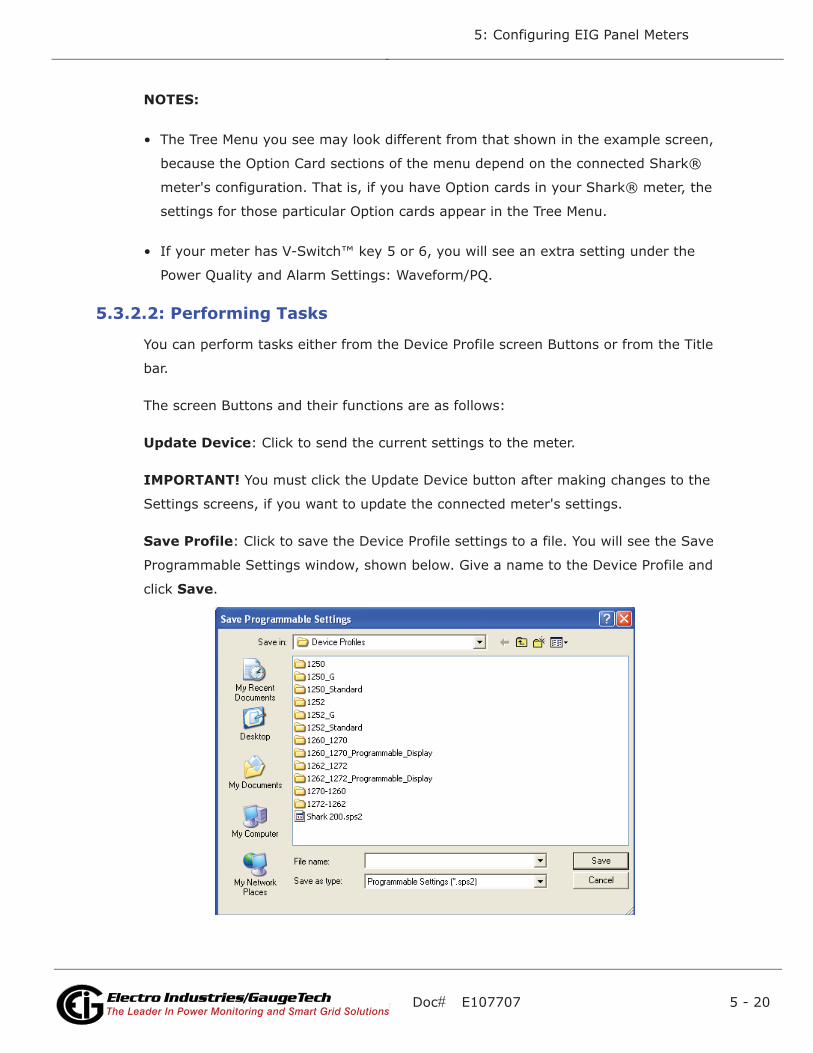
Doc# E107707 5 - 20
5: Configuring EIG Panel Meters
Electro Industries/GaugeTechThe Leader In Power Monitoring and Smart Grid SolutionsElectro Industries/GaugeTechThe Leader In Power Monitoring and Smart Grid Solutions
NOTES:
• The Tree Menu you see may look different from that shown in the example screen,
because the Option Card sections of the menu depend on the connected Shark®
meter's configuration. That is, if you have Option cards in your Shark® meter, the
settings for those particular Option cards appear in the Tree Menu.
• If your meter has V-Switch™ key 5 or 6, you will see an extra setting under the
Power Quality and Alarm Settings: Waveform/PQ.
5.3.2.2: Performing Tasks
You can perform tasks either from the Device Profile screen Buttons or from the Title
bar.
The screen Buttons and their functions are as follows:
Update Device: Click to send the current settings to the meter.
IMPORTANT! You must click the Update Device button after making changes to the
Settings screens, if you want to update the connected meter's settings.
Save Profile: Click to save the Device Profile settings to a file. You will see the Save
Programmable Settings window, shown below. Give a name to the Device Profile and
click Save.

Doc# E107707 5 - 21
5: Configuring EIG Panel Meters
Electro Industries/GaugeTechThe Leader In Power Monitoring and Smart Grid SolutionsElectro Industries/GaugeTechThe Leader In Power Monitoring and Smart Grid Solutions
Load Profile: Click to load a previously saved Device Profile Settings file. You will see
the Load Programmable Settings window, shown below. Select the saved Device Pro-
file you want and click Open. The settings from that file will now appear in the Set-
tings Screens; for example, the CT and PT Ratios will be those from the saved Device
Profile, rather than from the currently connected meter.
View Report: Click to open a Notepad window containing the Shark® 200 meter's
Device Profile settings in a text file. See the example window, shown below.

Doc# E107707 5 - 22
5: Configuring EIG Panel Meters
Electro Industries/GaugeTechThe Leader In Power Monitoring and Smart Grid SolutionsElectro Industries/GaugeTechThe Leader In Power Monitoring and Smart Grid Solutions
• Print the text file by selecting File>Print from the Notepad Title Bar.
• Save the text file by selecting File>Save from the Notepad Title Bar.
Exit: Click to leave the Device Profile Editor.
Three items in the Title Bar - File, Tools, View - open menus that allow you to per-
form functions. These menus and functions are described below.
NOTE: When you click Help from the Title bar a pdf file of this manual opens, with
instructions for the Device Profile Setting that is active at the current time. For exam-
ple, if you are on the Display Configuration screen and you click User Manual, the
instructions for setting Display Configuration are shown.
• Click File from the Title Bar to see the menu shown on the
right. The File menu lets you perform functions that can also
be performed using the screen Buttons, described on the
previous page: Save Profile, Load Profile, Report, and Exit
Profile Editor.
• Click Tools from the Title bar to see the menu shown on the
right. The Tools menu allows you to:
- Update Device: Functions the same as the Update Device button. See
page 5-20 for instructions.
- Verify Profile: Click to perform a verification of
the current Device Profile settings. You will see a
window like the one shown on the next page.
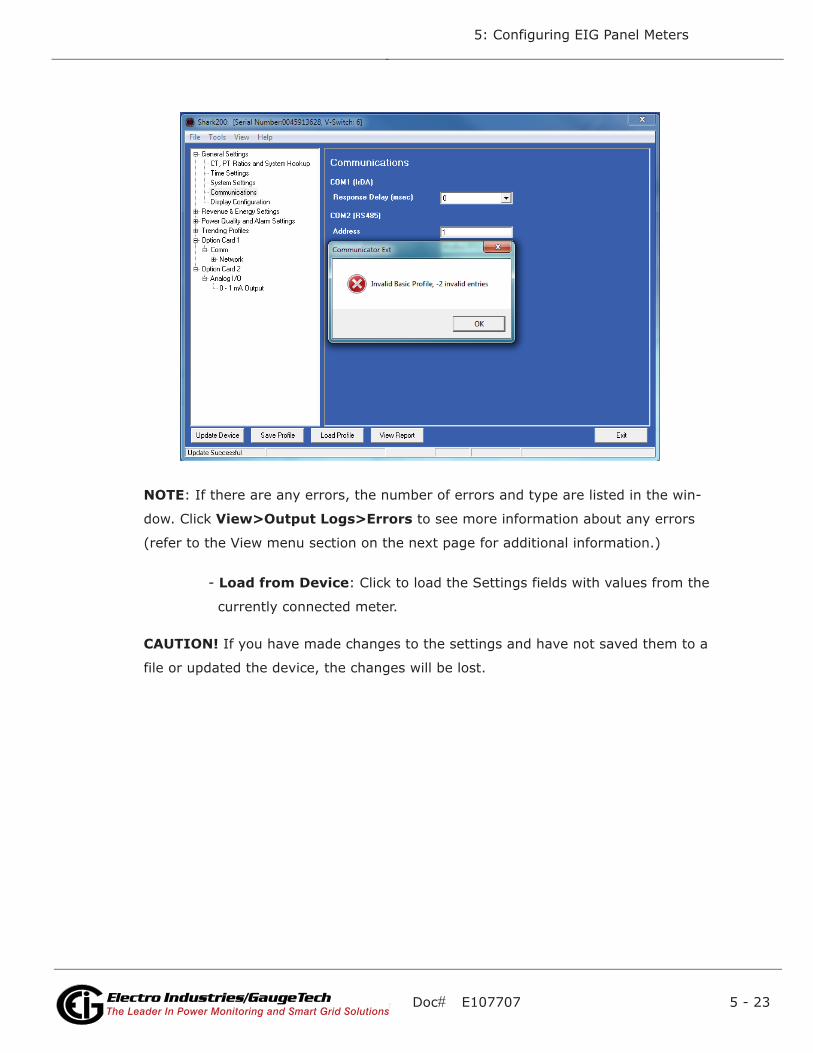
Doc# E107707 5 - 23
5: Configuring EIG Panel Meters
Electro Industries/GaugeTechThe Leader In Power Monitoring and Smart Grid SolutionsElectro Industries/GaugeTechThe Leader In Power Monitoring and Smart Grid Solutions
NOTE: If there are any errors, the number of errors and type are listed in the win-
dow. Click View>Output Logs>Errors to see more information about any errors
(refer to the View menu section on the next page for additional information.)
- Load from Device: Click to load the Settings fields with values from the
currently connected meter.
CAUTION! If you have made changes to the settings and have not saved them to a
file or updated the device, the changes will be lost.

Doc# E107707 5 - 24
5: Configuring EIG Panel Meters
Electro Industries/GaugeTechThe Leader In Power Monitoring and Smart Grid SolutionsElectro Industries/GaugeTechThe Leader In Power Monitoring and Smart Grid Solutions
• Click View from the Title bar to see
the menu shown on the right. The
View menu allows you to:
- View Output Logs/
Errors: View the Errors Log.
- View Last Update Information: View Update information for this Device
Profile.
Viewing Errors Output Log:
Click Output Logs>Errors from the View menu to open a display on the bottom of
the screen, detailing any errors, the time they occurred, the location of the error, and
a description of the error. See the screen example below. The detailed screen also
appears if there are errors and you try to update the Device Profile.
You can resize the display by clicking and dragging on the line above the Errors dis-
play. Click View Output Log>Errors a second time to remove the Errors display
from the screen.

Doc# E107707 5 - 25
5: Configuring EIG Panel Meters
Electro Industries/GaugeTechThe Leader In Power Monitoring and Smart Grid SolutionsElectro Industries/GaugeTechThe Leader In Power Monitoring and Smart Grid Solutions
Viewing Last Update Information:
Click Last Update Information from the View menu to open a window displaying
the time and date of the last update, and the total number of updates, for this Device
Profile.
Click OK to close the window.
5.3.3: Configuring Settings
The following sections contain detailed instructions for configuring the Shark® 200/
200S meter's Device Profile settings. All of the settings are reached from the Tree
Menu of the Device Profile screen. See Section 5.3.2.1 for information on the Tree
Menu.
5.3.3.1: Configuring CT, PT Ratios and System Hookup
Use this setting to configure Current Transformer and Potential Transformer ratios and
to select the System Hookup.
Functional Overview of CT and PT Ratios:
Current and Potential Transformers are used mainly for the following reasons:
• To insulate, and as a result isolate, the meter from high-voltage circuits.
• To change the primary voltage and current to standard values and sizes that the
meter can measure.
The CT and PT transformers deliver fractions of the primary voltage and current to the
meter. With properly set ratios and multipliers, the readings of the meter can be used
to determine the energy, voltage, current, or power of the system.

Doc# E107707 5 - 26
5: Configuring EIG Panel Meters
Electro Industries/GaugeTechThe Leader In Power Monitoring and Smart Grid SolutionsElectro Industries/GaugeTechThe Leader In Power Monitoring and Smart Grid Solutions
From the Tree Menu, click General Settings>CT, PT, Ratios and System Hookup.
IMPORTANT! You have two options for entering the CT and PT settings. You can
either enter CT/PT Numerator, Denominator, and Multiplier manually (see instructions
below), or you can enter the Ratios for CT/PT Numerator and Denominator and click
the Update CT/Update PT buttons to let the software calculate the Numerator,
Denominator, and Multiplier for you. You can then empty the Ratio fields and click the
Update Ratio buttons to confirm the calculated settings: you will see the same ratios
you initially entered.
For manual entry:
CT Ratios
CT Numerator (Primary): 1 - 9999
CT Denominator (Secondary): 5 or 1 Amp
NOTE: This field is display only.
Either CT Multiplier (Scaling): 1, 10 or 100
OR Ratio: the ratio to be applied, and click Update CT
Current Full Scale: Display only.
Doc# E107707 5 - 27
5: Configuring EIG Panel Meters
Electro Industries/GaugeTechThe Leader In Power Monitoring and Smart Grid SolutionsElectro Industries/GaugeTechThe Leader In Power Monitoring and Smart Grid Solutions
PT Ratios
PT Numerator (Primary): 1 - 9999
PT Denominator (Secondary): 40 - 600
PT Multiplier (Scaling): 1, 10, 100, or 1000
Voltage Full Scale: Display only.
System Wiring
3 Element Wye; 2.5 Element Wye; 2 CT Delta
Example Settings:
For a CT of 2000/5A, set the following CT Ratios in the entry fields:
CT Numerator (Primary) 2000
CT Denominator (Secondary) 5
CT Multiplier 1
The Current Full Scale field will read 2000.
NOTE: You can obtain the same Current Full Scale by entering a CT Numerator of 200
and a CT Multiplier of 10.
For a system that has 14400V primary with a 120V secondary line to neutral (PT Ratio
of 120:1), set the following PT Ratios in the entry fields:
PT Numerator (Primary) 1440
PT Denominator (Secondary) 120
PT Multiplier 10
The Voltage Full Scale field will read 14.4k.
Use the box at the bottom of the screen to enter the minimum voltage threshold,
which is a percentage of the voltage full scale. Enter a percentage between 0 and 12.7
in the % entry field. The minimum primary voltage based on the percentage you
entered is displayed at the bottom of the screen.
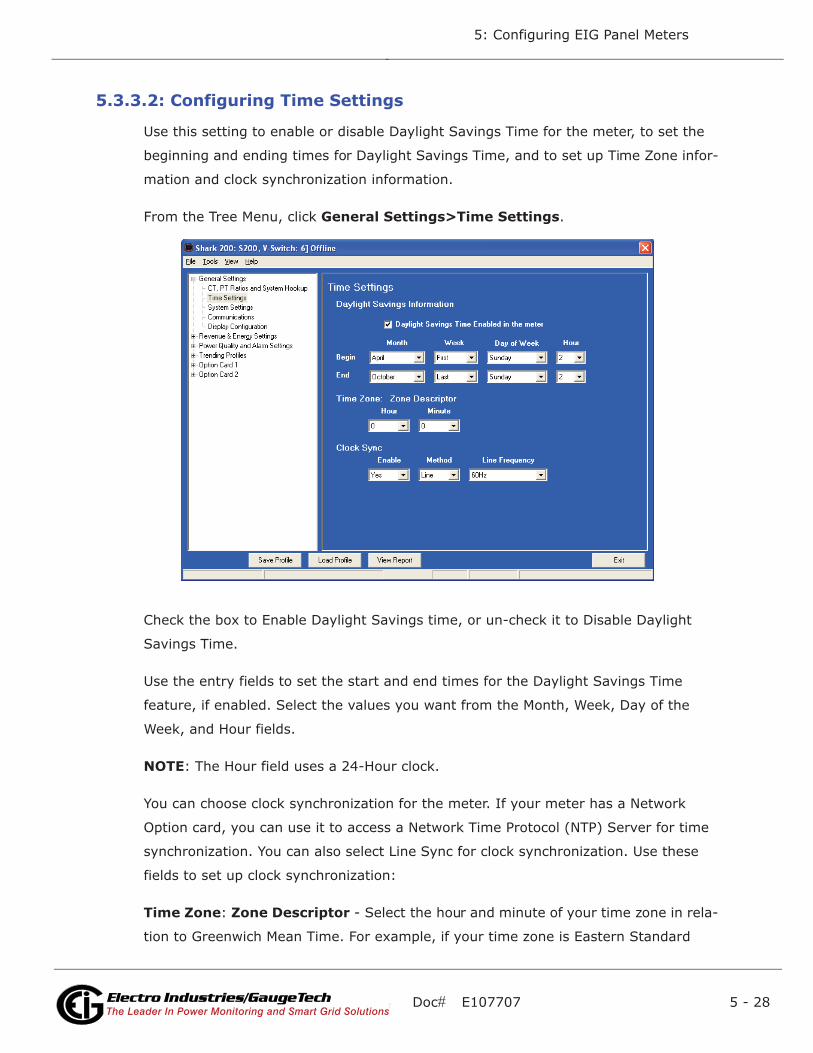
Doc# E107707 5 - 28
5: Configuring EIG Panel Meters
Electro Industries/GaugeTechThe Leader In Power Monitoring and Smart Grid SolutionsElectro Industries/GaugeTechThe Leader In Power Monitoring and Smart Grid Solutions
5.3.3.2: Configuring Time Settings
Use this setting to enable or disable Daylight Savings Time for the meter, to set the
beginning and ending times for Daylight Savings Time, and to set up Time Zone infor-
mation and clock synchronization information.
From the Tree Menu, click General Settings>Time Settings.
Check the box to Enable Daylight Savings time, or un-check it to Disable Daylight
Savings Time.
Use the entry fields to set the start and end times for the Daylight Savings Time
feature, if enabled. Select the values you want from the Month, Week, Day of the
Week, and Hour fields.
NOTE: The Hour field uses a 24-Hour clock.
You can choose clock synchronization for the meter. If your meter has a Network
Option card, you can use it to access a Network Time Protocol (NTP) Server for time
synchronization. You can also select Line Sync for clock synchronization. Use these
fields to set up clock synchronization:
Time Zone: Zone Descriptor - Select the hour and minute of your time zone in rela-
tion to Greenwich Mean Time. For example, if your time zone is Eastern Standard

Doc# E107707 5 - 29
5: Configuring EIG Panel Meters
Electro Industries/GaugeTechThe Leader In Power Monitoring and Smart Grid SolutionsElectro Industries/GaugeTechThe Leader In Power Monitoring and Smart Grid Solutions
time, you would select -5 from the pull-down Hour menu and leave the Minutes field
at 0.
Clock Sync: To enable clock synchronization, select:
• Yes from the Enable pull-down menu
• Line (line synchronization) or NTP from the Method pull-down menu
• For line synchronization, select 50Hz or 60Hz from the Line Frequency pull-down
menu; for NTP select either Option Card in Slot 1 or Option Card in Slot 2 from
the Interface pull-down menu.
IMPORTANT! You also need to set up the NTP server information for the Network
card. See “Configuring a Network Card” in Section 5.3.3.12.
5.3.3.3: Configuring System Settings
From the Tree Menu, click General Settings>System Settings.
From this screen, you can do the following:
• Enable or Disable Password for Resetting and/or Configuration: click the radio
button next to Yes or No. Enabling Password protection prevents unauthorized
tampering with devices.

Doc# E107707 5 - 30
5: Configuring EIG Panel Meters
Electro Industries/GaugeTechThe Leader In Power Monitoring and Smart Grid SolutionsElectro Industries/GaugeTechThe Leader In Power Monitoring and Smart Grid Solutions
IMPORTANT! You must set up a password before enabling Password Protection. Click
the Change button next to Change Password if you have not already set up a
password.
• Change the Password: click the Change button.
• Change the Device Designation: input a new designation into this field.
When you click the Change button next to Change Password in the Settings screen,
you will see the Enter the New Password screen.
1. Type in the new password (0 -9999).
2. Retype the password.
3. Click Change. The new password is saved and the meter restarts.
NOTE: If Password Protection has already been enabled for configuration and you
attempt to change the password, you will see the Enter Password screen (shown on
the right) after you click Change. Enter the old password and click OK to proceed
with the password change.
You can enable or disable a Password for Resetting (Reset Max/Min Energy Settings,
Energy Accumulators, and the Individual Logs) and Configuration (Device Profile) in
the Systems Settings screen (see previous page).
NOTE: If you enable a Password for Resetting, you must also enable it for Configura-
tion.
IMPORTANT! You must set up a password before enabling Password Protection. Click
the Change button next to Change Password if you have not already set up a pass-
word and follow the above instructions.

Doc# E107707 5 - 31
5: Configuring EIG Panel Meters
Electro Industries/GaugeTechThe Leader In Power Monitoring and Smart Grid SolutionsElectro Industries/GaugeTechThe Leader In Power Monitoring and Smart Grid Solutions
When anyone attempts to make a change that is under Password protection,
Communicator EXT opens a screen asking for the password. (See the example screen
below.) If the correct Password is not entered, the change doesn’t take place.
5.3.3.4: Configuring Communication Settings
Use this screen to enter communication settings for the meter's two on-board ports:
the IrDA Port (COM 1) and RS485 Port (COM 2).
IMPORTANT! The settings on this screen are the current settings for communication.
Any changes you make may affect communication between the Shark® meter and
your PC.
From the Tree Menu, click General Settings>Communications.
The screen fields and acceptable entries are as follows:
COM 1 (IrDA)

Doc# E107707 5 - 32
5: Configuring EIG Panel Meters
Electro Industries/GaugeTechThe Leader In Power Monitoring and Smart Grid SolutionsElectro Industries/GaugeTechThe Leader In Power Monitoring and Smart Grid Solutions
Response Delay: 0 - 750 (50msec increments)
COM 2 (RS-485)
Address:1 - 247
Protocol:Modbus RTU, Modbus ASCII or DNP 3.0
Baud Rate: 1200, 2400, 4800, 9600, 19200, 38400, 57600 (For the Baud Rates below
9600 your meter must have Runtime Firmware version 26 or higher.)
Response Delay: 0 - 750 (50 msec increments)
NOTE: Response Delay is the delay the meter should use before responding to que-
ries. If your connecting device requires a delay before receiving information, use
response delay to program the time to wait before the meter starts responding to
queries.
Parity: Odd, Even, or None (For Parity setting your meter must have Runtime Firm-
ware version 26 or higher.)
DNP Options for Voltage, Current, and Power:
These fields allow you to choose Primary or Secondary units for DNP, and to set
custom scaling if you choose Primary. The Scaling fields appear after you click the
Primary radio button (see screen above).
Scaling is used with Primary readings so that you can ensure that your readings will
not go beyond the DNP range before they reach Full Scale. The valid range for DNP
Object 30 is -32768 to +32767. If the scaling you enter will cause the values to fall
outside the DNP range, the values will be shown in bold or red in the DNP Value at Full
Scale fields.
Click the Optimal Scaling button to have the software choose a divisor for voltage,
current, and power, that will not result in an over/under-range.
NOTE: You must set the DNP polling software to multiply by the divisor amount
before showing the final value.

Doc# E107707 5 - 33
5: Configuring EIG Panel Meters
Electro Industries/GaugeTechThe Leader In Power Monitoring and Smart Grid SolutionsElectro Industries/GaugeTechThe Leader In Power Monitoring and Smart Grid Solutions
5.3.3.5: Setting Display Configuration
Use this screen to set the display of the Shark® 200/200S meter's faceplate. Refer to
the meter’s Installation and Operation Manual for additional information on the face-
plate.
From the Tree Menu, click General Settings>Display Configuration.
The screen fields and acceptable entries are as follows:
Phases Displayed: A; A and B; A, B, and C. This field determines which phases dis-
play on the faceplate. For example, if you select A and B, only those two phases will
be displayed on the faceplate.
Auto Scroll Display: Yes or No. This field enables/disables the scrolling of selected
readings on the faceplate. If enabled, the readings scroll every 5 seconds.
Enable on Face Plate of Display: Check the boxes of the Readings you want dis-
played on the faceplate of the meter. You must select at least one reading.
Power Direction: View as Load or View as Generator
Flip Power Factor Sign: Yes or No.

Doc# E107707 5 - 34
5: Configuring EIG Panel Meters
Electro Industries/GaugeTechThe Leader In Power Monitoring and Smart Grid SolutionsElectro Industries/GaugeTechThe Leader In Power Monitoring and Smart Grid Solutions
Current (I) Display Autoscale: On to apply scaling to the current display or Off (No
decimal places).
Display Voltage in Secondary: Yes or No.
Load Bar Custom Configuration: To enter scaling for the Load Bar, click the Load
Bar Custom Configuration checkbox. Fields display on the screen that allow you to
enter a Scaling factor for the display. See the figure below
Enter the scaling factor you want in the Current Scale field. This field is multiplied by
the CT Multiplier set in the CT, PT Ratios, and System Hookup screen (see Section
5.3.3.1) to arrive at the Primary Full Scale. Make sure you set the CT multiplier cor-
rectly.
Enable Fixed Scale for Voltage Display: To enter a scaling factor for the Voltage
display, click the checkbox next to Enable Fixed Scale for Voltage Display. The screen
changes - see the figure below.
Select the scaling you want to use from the pull-down menu. The options are: 0,
100.0kV, 10.00kV, 0r 0kV.

Doc# E107707 5 - 35
5: Configuring EIG Panel Meters
Electro Industries/GaugeTechThe Leader In Power Monitoring and Smart Grid SolutionsElectro Industries/GaugeTechThe Leader In Power Monitoring and Smart Grid Solutions
5.3.3.6: Configuring Energy, Power Scaling, and Averaging
Use this setting to configure:
• The display and storage of Energy data in the meter
• The display of Power data in the meter and the method of VA computation
• The interval over which Average values are computed.
Functional Overview of Energy Settings, VA Computation, and Averaging:
• Energy Scaling
Energy Setting includes:
Digits (the number of digits in the reading)
Decimals (the number of decimal places in the reading)
Energy Scale: the scale of the reading - unit; kilo (number times 1000); Mega
(number times 1 million).
Energy settings allow you to balance the resolution (or accuracy) of the energy
stored, with the interval over which energy rollover occurs. For example, the
maximum resolution for a k scale reading is: 99999.999k.
To calculate the speed at which the energy will rollover, you must know the Energy
Full Scale, which is computed from the CT and PT Full Scale values (see Section
5.3.3.1). The formula for calculating Energy Full Scale is:
Wye system: CT Full Scale x PT Full Scale x 3
Delta system: CT Full Scale x PT Full Scale x 3 x
For example, for a CT Full Scale of 2000, PT Full Scale of 14400, Wye system:
2000 x 14400 x 3=86400000
In this example, the energy will increment at 86400000 Watts per hour, or 24000
Watts per second.
This value allows you to determine the number of digits, decimal places, and
energy scale you want to configure for the Energy settings, when you take into
account the rollover time.
3

Doc# E107707 5 - 36
5: Configuring EIG Panel Meters
Electro Industries/GaugeTechThe Leader In Power Monitoring and Smart Grid SolutionsElectro Industries/GaugeTechThe Leader In Power Monitoring and Smart Grid Solutions
To determine the number of hours before rollover, use this formula:
[Max Resolution]/[Full Scale] = #Hours, where Max Resolution = maximum digits
and decimals for the Energy scale in use.
Using the example from above, with an energy scale of Mega, the formula would
be:
99999.999 M/86.4 M = 1157.4074 hours or about 48 days until rollover.
NOTE: To increase the number of days until rollover, you can increase the number
of digits (to 8), decrease the number of decimal places (to 0), or increase the
Energy Scale (to M).
• Apparent Power (VA) Computation:
There are two optional methods of VA Computation:
Arithmetic Sum - the formula for this calculation is:
Vector Sum - the formula for this calculation is:
• Demand Averaging
Demand is the average rate of energy use over time. The Shark® 200 meter
supports two types of demand averaging: Block demand and Rolling demand.
Block demand records the average demand for time intervals that you define (
usually 5, 15 or 30 minutes).
Rolling demand functions like multiple, overlapping Block demand. You define the
subintervals at which an average of demand is calculated. An example of Rolling
demand would be a 15-minute Demand block using 5-minute subintervals, thus
providing a new demand reading every 5 minutes, based on the last 15 minutes.
VA VA VA VAT a b c= + +
VA W VART T T= +2 2

Doc# E107707 5 - 37
5: Configuring EIG Panel Meters
Electro Industries/GaugeTechThe Leader In Power Monitoring and Smart Grid SolutionsElectro Industries/GaugeTechThe Leader In Power Monitoring and Smart Grid Solutions
From the Tree Menu, click Revenue & Energy Settings> Energy, Power Scaling,
and Averaging.
The screen fields and acceptable entries are as follows:
Energy Settings
Energy Digits: 5; 6; 7; 8
Energy Decimal Places: 0 - 6
Energy Scale: unit; kilo (K); Mega (M)
For example: a reading for Digits: 8; Decimals: 3; Scale: K would be formatted:
00123.456k
NOTES:
• Your selection in the Energy Settings fields determines the precision of energy
stored for display and polling. Refer to the Functional Overview at the beginning of
this section for more information.
• If you are changing the energy settings, we recommend you first reset the Energy
Accumulators, in order to prevent erroneous counts. See Section 5.4.2 for instruc-
tions on resetting the Shark® 200/200S meter's Energy Accumulators.
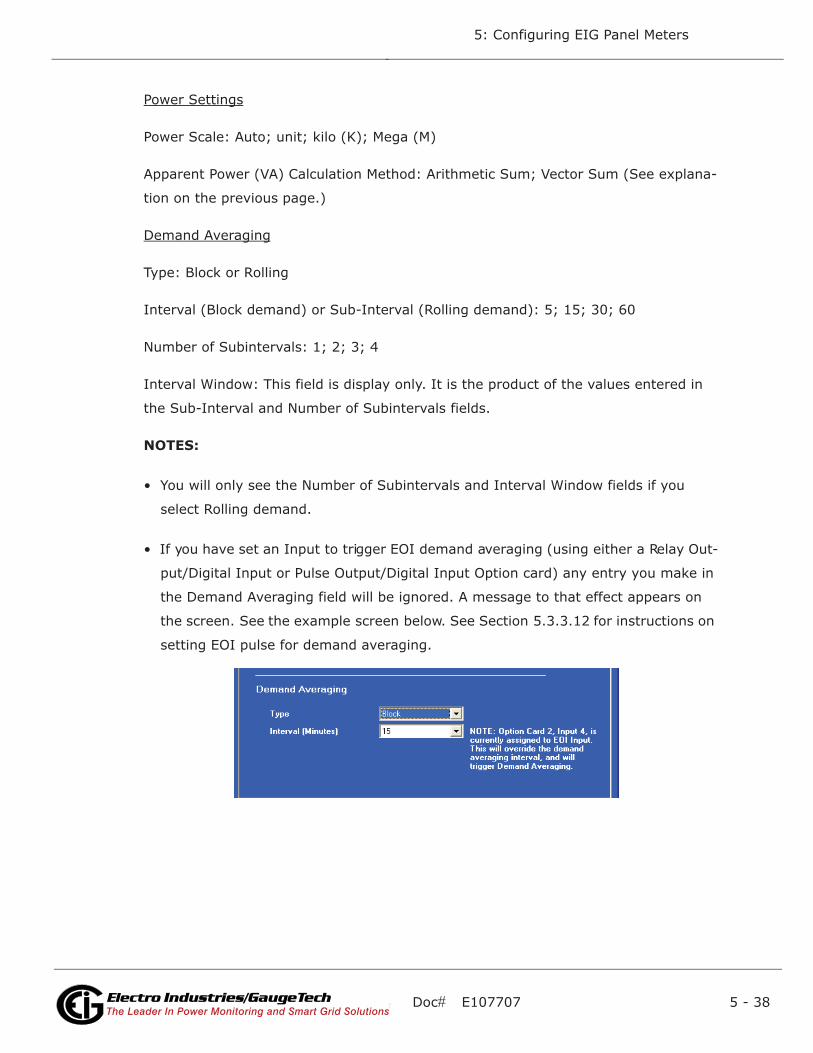
Doc# E107707 5 - 38
5: Configuring EIG Panel Meters
Electro Industries/GaugeTechThe Leader In Power Monitoring and Smart Grid SolutionsElectro Industries/GaugeTechThe Leader In Power Monitoring and Smart Grid Solutions
Power Settings
Power Scale: Auto; unit; kilo (K); Mega (M)
Apparent Power (VA) Calculation Method: Arithmetic Sum; Vector Sum (See explana-
tion on the previous page.)
Demand Averaging
Type: Block or Rolling
Interval (Block demand) or Sub-Interval (Rolling demand): 5; 15; 30; 60
Number of Subintervals: 1; 2; 3; 4
Interval Window: This field is display only. It is the product of the values entered in
the Sub-Interval and Number of Subintervals fields.
NOTES:
• You will only see the Number of Subintervals and Interval Window fields if you
select Rolling demand.
• If you have set an Input to trigger EOI demand averaging (using either a Relay Out-
put/Digital Input or Pulse Output/Digital Input Option card) any entry you make in
the Demand Averaging field will be ignored. A message to that effect appears on
the screen. See the example screen below. See Section 5.3.3.12 for instructions on
setting EOI pulse for demand averaging.

Doc# E107707 5 - 39
5: Configuring EIG Panel Meters
Electro Industries/GaugeTechThe Leader In Power Monitoring and Smart Grid SolutionsElectro Industries/GaugeTechThe Leader In Power Monitoring and Smart Grid Solutions
5.3.3.7: Transformer/Line Loss Compensation
Transformer/Line Loss Compensation allows you to add or subtract losses to meter
registration.
From the Tree Menu, click Revenue & Energy Settings>Transformer/Line Loss
Compensation.
This screen displays the current values for the meter's Transformer Loss Compensa-
tion. The screen fields and acceptable entries are as follows
• Percent Loss of Watts due to Iron and Copper/Positive Watts and Negative Watts
• Percent Loss of VARS due to Iron and Copper/Positive and Negative Watts
• Drop-down menu #1. Choose from: Disabled, Fe Only, Cu Only, Both Fe and Cu.
• Drop-down menu #2. Choose from: Add to Watts and VAR; Add to Watts and Sub-
tract from VAR; Subtract from Watts and Add to VAR; Add to Watts and VAR; Sub-
tract from Watts and VAR.
1. Click TLC Calculator to find the values to enter into the Percent Loss fields. The
TLC Calculator button launches an Excel Spreadsheet that makes the calculations
for you once you enter the required data.

Doc# E107707 5 - 40
5: Configuring EIG Panel Meters
Electro Industries/GaugeTechThe Leader In Power Monitoring and Smart Grid SolutionsElectro Industries/GaugeTechThe Leader In Power Monitoring and Smart Grid Solutions
IMPORTANT! See Appendix B, which contains a copy of the Excel Spreadsheet
with example numbers, and an explanation of Loss Compensation considerations.
WARNING! Communicator EXT automatically launches the Excel Spreadsheet when
you click the TLC Calculator button. If you do not have Excel software installed on
your computer, or if the spreadsheet file is not in the Communicator EXT directory, a
Warning message is displayed instead of the worksheet. You can make your own cal-
culations using the hardcopy Transformer Loss Compensation Worksheet shown in
Appendix B.
EXCEL NOTE: For most Excel users, the spreadsheet does not run until you give the
application permission to run the Macros contained in the sheet. You give permission
by changing the Excel Security Setting from High to Medium, as follows:
a. From the Excel toolbar, click Tools>Security>Options.
b. On the Security Tab page, click the Macro Security button.
c. Select Medium Security.
4. Enter the percent Loss of Watts and VARS for copper and iron in the appropriate
fields.
5.3.3.8: Configuring Limits
Use this screen to assign Limits for the Shark® 200/200S meter.
Functional Overview for Limits:
Limits are transition points used to divide acceptable and unacceptable measure-
ments. When a value goes above or below the limit, an out-of-limit condition occurs.
You can set and configure up to eight Limits for the Shark® 200 meter.
Once they are configured, you can view the out-of-Limits (or Alarm) conditions in the
Limits Log (see Sections 8.8 and 8.26) or Limits Polling screen (see Section 7.7.5).
You can also use Limits to trigger relays.
You can assign the eight limits to readings from three groups of parameters:

Doc# E107707 5 - 41
5: Configuring EIG Panel Meters
Electro Industries/GaugeTechThe Leader In Power Monitoring and Smart Grid SolutionsElectro Industries/GaugeTechThe Leader In Power Monitoring and Smart Grid Solutions
• Readings (Instantaneous Voltage; Instantaneous Current; Total and Per Phase
Power and Power Factor; Frequency; Neutral Current; Symmetrical Components
and Voltage Imbalances)
• Demand (Current; Per Phase, Total Power and Power Factor)
• THD (For Voltage and Current)
From the Tree Menu, click Power Quality and Alarm Settings>Limits. The current
settings for Limits are shown in the screen.
The bottom of the screen shows the Full Scale values for:
• Voltage
• Current
• Frequency
• Power
• Power Total
• Power Factor
• THD
To Set or Change a Limit
1. Select a limit by double-clicking on the Assigned Channel field.

Doc# E107707 5 - 42
5: Configuring EIG Panel Meters
Electro Industries/GaugeTechThe Leader In Power Monitoring and Smart Grid SolutionsElectro Industries/GaugeTechThe Leader In Power Monitoring and Smart Grid Solutions
2. You will see the screen shown below.
3. Select a Group and an Item for the Limit.4. Click OK. The Limit you selected will now appear in the Limits screen.
To Configure a LimitFrom the Limits screen, double-click on the following fields to set their values:
• Above and Below Set Point:% of Full Scale (the point at which the reading goes
out of limit: see figure below)
For example:
100% of 120V Full Scale = 120V
90% of 120V Full Scale = 108V
• Above and Below Return Hysteresis (the point at which the limit’s status
changes from out of limit to within limit: see figure below)
For example:
Above Set Point = 110%Below Set Point = 90%
(Out of Limit above 132V)(Out of Limit below 108V)
Above Return Hysteresis = 105%Below Return Hysteresis = 95%
(Stay Out of Limit until below 126V) (Stay Out of Limit until above 114V)
NOTES:
• The Primary fields are display only. They show what the set point and return Hys-
teresis value are for each limit.

Doc# E107707 5 - 43
5: Configuring EIG Panel Meters
Electro Industries/GaugeTechThe Leader In Power Monitoring and Smart Grid SolutionsElectro Industries/GaugeTechThe Leader In Power Monitoring and Smart Grid Solutions
• If the Above Return Hysteresis is greater than the Above Set Point, the Above Limit
is Disabled; if the Below Return Hysteresis is less than the Below Set Point, the
Below Limit is Disabled. You may want to use this feature to disable either the
Above Limit or Below Limit condition for a reading.
• If you are entering negative limits, be aware that the negative value affects the way
the above and below limits function, since negative numbers are processed as
signed values.
5.3.3.9: Configuring Waveform/PQ (Shark® 200 Meter V-Switch™ Key 5 and higher)
This setting determines at what point the meter executes a waveform capture and/or
records a power quality event. See Chapter 8 for instructions on viewing Waveform
and PQ logs. See Section 5.3.3.10 for instructions on configuring the log sectors for
the Shark® 200 meter.
NOTE: PQ and Waveform Thresholds are given as a percentage of the Full Scales (%
Full Scale fields). Full Scales are based on the CT and PT Ratios set in the CT, PT
Ratios and System Hookup setting. Before programming the Waveform/PQ Thresh-
olds, set the CT and PT ratios. See Section 5.3.1.1 for instructions.
From the Tree Menu, click Power Quality and Alarm Settings>Waveform/PQ.
The current settings, if any, are shown in the screen.

Doc# E107707 5 - 44
5: Configuring EIG Panel Meters
Electro Industries/GaugeTechThe Leader In Power Monitoring and Smart Grid SolutionsElectro Industries/GaugeTechThe Leader In Power Monitoring and Smart Grid Solutions
1. Set the Surge and Sag Setpoints (in percent of Full Scale), for Voltage, and the
Surge Setpoint for Current. When you enter the percentage for a reading, the pri-
mary value is displayed in the Primary field. The bottom of the screen displays the
Full Scales for Voltage and Current.
2. Click the checkbox under PQ to enable PQ recording when the programmed thresh-
old is exceeded.
3. Click the checkbox under Waveform to enable Waveform recording when the pro-
grammed threshold is exceeded.
4. Select the sampling rate from the Capture Sample Rate pull-down menu. The
options are:
• For V-Switch™ key 5: 32, 64
• For V-Switch™ key 6: 32, 64, 128, 256, 512.
5. From the Pre-trigger pull-down menu, select the number of cycles of waveform
data prior to the triggering event, that you want to be included in the waveform
capture. The options are 2 to 63.
5.3.3.10: Configuring Historical Logs
Use this setting to select the parameters to be stored in each of the Shark® 200/
200S meter's three Historical Logs. For additional information on logs, see Chapter 8.
Functional Overview of Historical Logs:
Having three historical logs affords you the flexibility of programming each log with
unique parameters. For example, you might program Historical Log 1 to record Power
Quality parameters (for example, THD), Log 2 to record Demand parameters, and Log
3 to record Energy parameters.
Historical Log parameters can be selected from eleven groups:
• Measured Values (Instantaneous Voltage; Instantaneous Current; Total and Per
Phase Power and Power Factor; Frequency; Neutral Current; Symmetrical Compo-
nents and Voltage Unbalances)
• Demand (Current; Per Phase, Total Power and Power Factor)

Doc# E107707 5 - 45
5: Configuring EIG Panel Meters
Electro Industries/GaugeTechThe Leader In Power Monitoring and Smart Grid SolutionsElectro Industries/GaugeTechThe Leader In Power Monitoring and Smart Grid Solutions
• Maximums (Maximum values for all of the readings listed above, including THD
voltage and currents)
• Minimums (Minimum values for all of the readings listed above, including THD volt-
age and currents)
• Energy (Watt-hours, VA-hours, VAR-hours, Energy in the Interval)
• Accumulators (Input and Output Accumulator values)
• Short Term Min (Min value within the Demand Interval)
• Short Term Max (Max value within the Demand Interval)
• Uncompensated ((Watt-hours, VA-hours, VAR-hours)
• THD (For voltage and current)
• Harmonic Magnitudes (For voltage and current up to the 40th order)
From the Tree Menu, click Trending Profiles>Historical Log Profile (1-3).
This screen allows you to select items to be stored in the historical log you selected.
The Group field determines the items that are available for selection.
Doc# E107707 5 - 46
5: Configuring EIG Panel Meters
Electro Industries/GaugeTechThe Leader In Power Monitoring and Smart Grid SolutionsElectro Industries/GaugeTechThe Leader In Power Monitoring and Smart Grid Solutions
1. Select a Group. The possible selections are: Measured Values, Demand, Maxi-
mums, Minimums, Energy, Energy in the Interval, Accumulators, Short Term Min,
Short Term Max, Uncompensated, THD, Harmonic Magnitudes, and Rollover Coun-
ters. (See the "Configuring a Relay Output/Digital Input Card" and "Configuring a
Pulse Output/Digital Input Card" parts of Section 5.3.3 for information on Accumu-
lators).
NOTE: If you select Harmonic Magnitudes, another field opens on the screen allowing
you to select one of the following for Harmonic Magnitude: Volts A; Volts B; Volts C; I
A; I B; I C.
2. Select items for your log:
a. Highlight the item(s) you want in the Selectable Items box.
b. Click Add. The item(s) are added to the Selected Items box.
c. To remove item(s), highlight them in the Selected Items box and click Remove.
3. Set the Logging Interval (Minutes). The available choices are: 1, 3, 5, 10, 15, 30,
60, EOI (End of Interval) Pulse. The Logging Interval determines when the meter
takes a snapshot.
IMPORTANT! If you are trending Energy in the Interval, the Logging interval must
be the same as the Demand interval.
NOTES:
• Only one Option Card input or output can be set to trigger an EOI pulse.
• The maximum rate for EOI Pulse used to trigger a log is once per minute.
• When you choose EOI Pulse, the meter takes a snapshot on the End of Interval
Pulse condition, rather than on a time interval. Below are two examples of using
EOI Pulse for log recording.
Examples of EOI Pulse Recording:
• A Relay Option Card is installed in your meter and set to trigger on a state change.
You can use EOI pulse to take a snapshot upon that state change.

Doc# E107707 5 - 47
5: Configuring EIG Panel Meters
Electro Industries/GaugeTechThe Leader In Power Monitoring and Smart Grid SolutionsElectro Industries/GaugeTechThe Leader In Power Monitoring and Smart Grid Solutions
• A Shark® 200 meter is connected on each side of a load. You want to take a snap-
shot of both sides of the load at the same time. You can do this by connecting a
Relay card in each of the Shark® 200/200S meters to a device that will trigger
them. Then set the EOI pulse to take a snapshot when the devices are triggered.
See the "Configuring a Relay Output/Digital Input Card" and "Configuring a Pulse
Output/Digital Input Card" parts of Section 5.3.3.12 for additional information.
NOTE: There are two display fields at the bottom of the Historical Log Profile screen.
They show the Total Bytes Used and the Bytes Remaining for this historical log. These
fields are updated as you make selections on the screen. The total number of bytes
available per log record is approximately 234.
5.3.3.11: Configuring Historical Log Sectors
• For V-Switch™ keys 2 and above, use this setting to increase or decrease the
amount of records each of the Shark® 200/200S meter's three Historical logs can
store, and the duration each log can run, before becoming filled.
• For V-Switch™ keys 5 and 6 (Shark® 200 meter), use this setting to set the alloca-
tion for the Waveform and Power Quality (PQ) logs.
From the Tree Menu, click Trending Profiles>Historical Log Sectors.
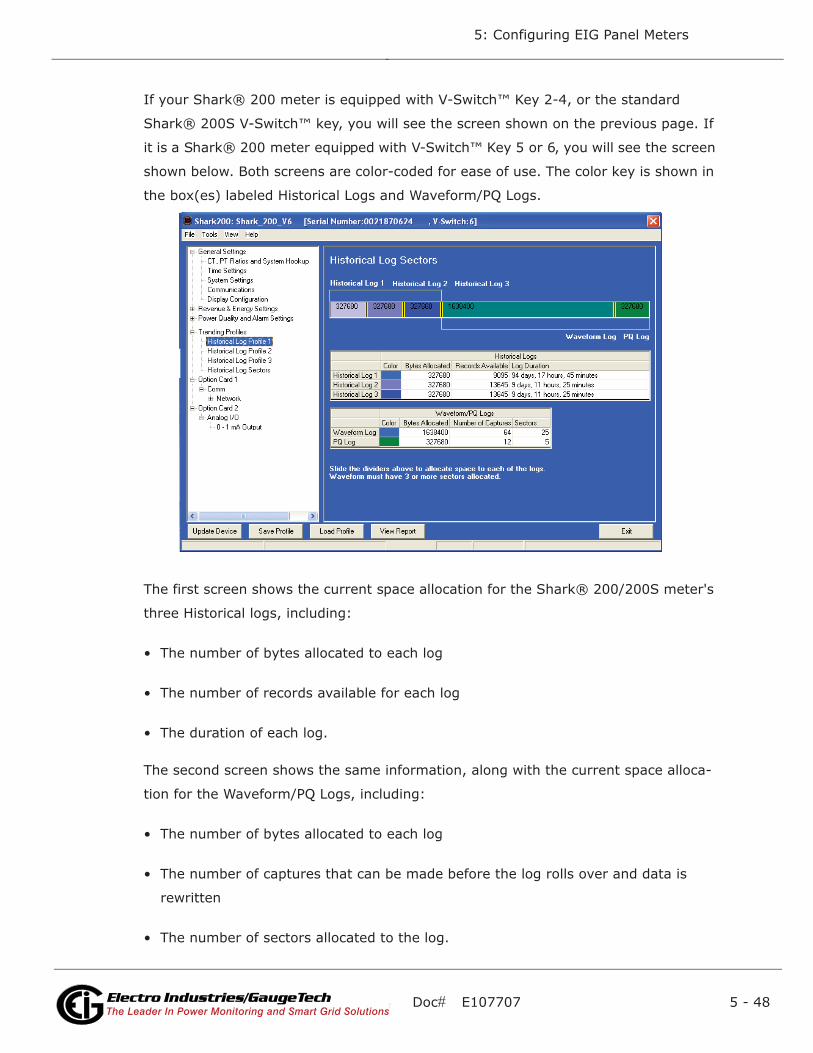
Doc# E107707 5 - 48
5: Configuring EIG Panel Meters
Electro Industries/GaugeTechThe Leader In Power Monitoring and Smart Grid SolutionsElectro Industries/GaugeTechThe Leader In Power Monitoring and Smart Grid Solutions
If your Shark® 200 meter is equipped with V-Switch™ Key 2-4, or the standard
Shark® 200S V-Switch™ key, you will see the screen shown on the previous page. If
it is a Shark® 200 meter equipped with V-Switch™ Key 5 or 6, you will see the screen
shown below. Both screens are color-coded for ease of use. The color key is shown in
the box(es) labeled Historical Logs and Waveform/PQ Logs.
The first screen shows the current space allocation for the Shark® 200/200S meter's
three Historical logs, including:
• The number of bytes allocated to each log
• The number of records available for each log
• The duration of each log.
The second screen shows the same information, along with the current space alloca-
tion for the Waveform/PQ Logs, including:
• The number of bytes allocated to each log
• The number of captures that can be made before the log rolls over and data is
rewritten
• The number of sectors allocated to the log.

Doc# E107707 5 - 49
5: Configuring EIG Panel Meters
Electro Industries/GaugeTechThe Leader In Power Monitoring and Smart Grid SolutionsElectro Industries/GaugeTechThe Leader In Power Monitoring and Smart Grid Solutions
To change the current allocation for a log:
1. Click on one of the double yellow lines dividing the individual logs.
2. You will see a line with arrows on each side. Drag the line in either direction to
increase or decrease the log allocation. The display fields for the logs will reflect
any changes you make to the allocation.
NOTES:
• The Waveform log must have at least 3 sectors allocated to it.
• When EOI Pulse is set as the Logging Interval for a Historical log (see previous
section, 5.3.3.9), the Log Duration field for that log will be blank.
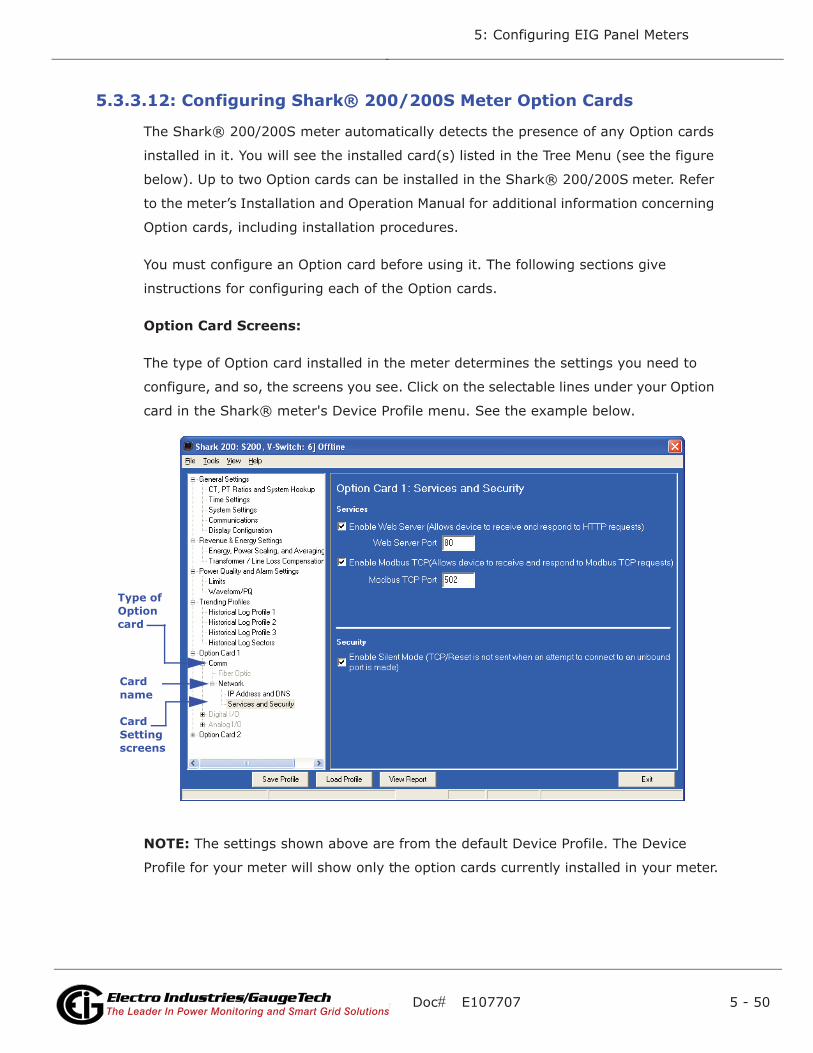
Doc# E107707 5 - 50
5: Configuring EIG Panel Meters
Electro Industries/GaugeTechThe Leader In Power Monitoring and Smart Grid SolutionsElectro Industries/GaugeTechThe Leader In Power Monitoring and Smart Grid Solutions
5.3.3.12: Configuring Shark® 200/200S Meter Option Cards
The Shark® 200/200S meter automatically detects the presence of any Option cards
installed in it. You will see the installed card(s) listed in the Tree Menu (see the figure
below). Up to two Option cards can be installed in the Shark® 200/200S meter. Refer
to the meter’s Installation and Operation Manual for additional information concerning
Option cards, including installation procedures.
You must configure an Option card before using it. The following sections give
instructions for configuring each of the Option cards.
Option Card Screens:
The type of Option card installed in the meter determines the settings you need to
configure, and so, the screens you see. Click on the selectable lines under your Option
card in the Shark® meter's Device Profile menu. See the example below.
NOTE: The settings shown above are from the default Device Profile. The Device
Profile for your meter will show only the option cards currently installed in your meter.
Type of Option card
Card name Card Setting screens

Doc# E107707 5 - 51
5: Configuring EIG Panel Meters
Electro Industries/GaugeTechThe Leader In Power Monitoring and Smart Grid SolutionsElectro Industries/GaugeTechThe Leader In Power Monitoring and Smart Grid Solutions
Configuring a Fiber Optic Card:
The Fiber Optic Option Card is a Communication card that provides a standard, serial
communication port over a fiber optic application. For technical specifications and
hardware installation, refer to the meter’s Installation and Operation Manual.
Example:
An example use of the optional Fiber Optic card is in a daisy chain topology, using the
Echo switch on the Fiber Optic Card to allow messages to bypass the unit.
Click Fiber Optic.
The screen fields and acceptable entries are as follows:
Address: 1-247
Protocol: Modbus RTU; Modbus ASCII; DNP subset 2; DNP subset 3
Baud Rate: 9600; 19200; 38400; 57600
Data Bits: 5; 6; 7; 8
Parity: None, Odd, Even

Doc# E107707 5 - 52
5: Configuring EIG Panel Meters
Electro Industries/GaugeTechThe Leader In Power Monitoring and Smart Grid SolutionsElectro Industries/GaugeTechThe Leader In Power Monitoring and Smart Grid Solutions
Stop Bits: 1 or 2
Response Delay (msec): the suggested delay is 50 msec, but you can increase the
delay, if necessary.
Mode: Half Duplex, Full Duplex
Configuring a Relay Output/Digital Input Card:
The Relay Output/Digital Input Option Card has:
• Two relay contact outputs for load switching
• Two wet/dry contact sensing digital inputs.
Accumulators in the Communicator EXT software count the transitions of the Inputs
and Outputs. For technical specifications and hardware installation, refer to the
meter’s Installation and Operation Manual.
NOTE: When installing a Relay Output/Digital Input card, we recommend you reset
the accumulators for the card, in order to prevent erroneous counts. See Section
5.4.2 for instructions on using the Reset Shark® Information screen to reset card
accumulators.
Example:
An example use of the optional Relay Card is in monitoring the status of circuit break-
ers or relays in your electrical system. The two status inputs could be used to monitor
two circuit breakers, and the two relay outputs could be used to sound an alarm upon
the occurrence of a programmed out of limit condition.

Doc# E107707 5 - 53
5: Configuring EIG Panel Meters
Electro Industries/GaugeTechThe Leader In Power Monitoring and Smart Grid SolutionsElectro Industries/GaugeTechThe Leader In Power Monitoring and Smart Grid Solutions
Click Relay Assignments to set the limits/alarm conditions and logging options for
the card's Relay Outputs.
From the Relay Assignments screen, you can:
• Configure up to 8 limits for each of the two Relay Outputs.
• Set a Delay and Reset Delay for the Outputs.
• Choose to log Status Changes for each Relay Output.
• Assign each Output an Output Label, Open Label, and Closed Label, which are used
when viewing the Relay Status Log.
• Assign an Accumulation Compression Factor for each output.
IMPORTANT! First use the Limits screen to set up the limits you want to assign to an
Output. See Section 5.3.3.7 for instructions.
The available Limits appear in the Limit ID column.
To Assign a Limit to an Output Relay:
1. Select the Alarm trigger from the pull-down menu next to the Limit ID. The options
are: Above Limit (the Output is triggered when the Above Limit condition occurs)

Doc# E107707 5 - 54
5: Configuring EIG Panel Meters
Electro Industries/GaugeTechThe Leader In Power Monitoring and Smart Grid SolutionsElectro Industries/GaugeTechThe Leader In Power Monitoring and Smart Grid Solutions
and Below Limit (the Output is triggered when the Below Limit condition occurs).
You can assign the limit to one or both (or neither) of the Relay Outputs.
NOTE: A Relay operates when any one assigned Limit is tripped, and stays in the
Set condition as long as one Limit is in the Alarm state.
2. You can enter Set Delay and/or Reset Delay. These values are the delay before the
Output is changed: Set is when the common is shorted to Normal Open (this is the
Set Condition).
3. Check the box next to Log Status Change for if you want to log output status
changes for either or both Relay. See Chapter 8, Section 8.26.1 for information on
the I/O Change Log.
4. The current Output Labels are displayed in the screen. These labels are used for
Logging. To change the Output labels, click in the Labels field you want to change,
and enter a new label. The fields that can be changed are:
• Output Label - Label ID
• Open Label - Open state ID
• Closed Label - Closed state ID
5. You can specify an Accumulation Compression Factor. The Compression Factor is
used to adjust how high an accumulator will go before rolling over. Because of this,
it is useful in delaying rollover. For example, if you select a Compression Factor of
10, each time 10 Pulse/State changes occur, the accumulator count increments by
1. The available Compression Factors are: 1, 10, 100, 1000, 10000, and 100000.
The default Compression Factor is 1.
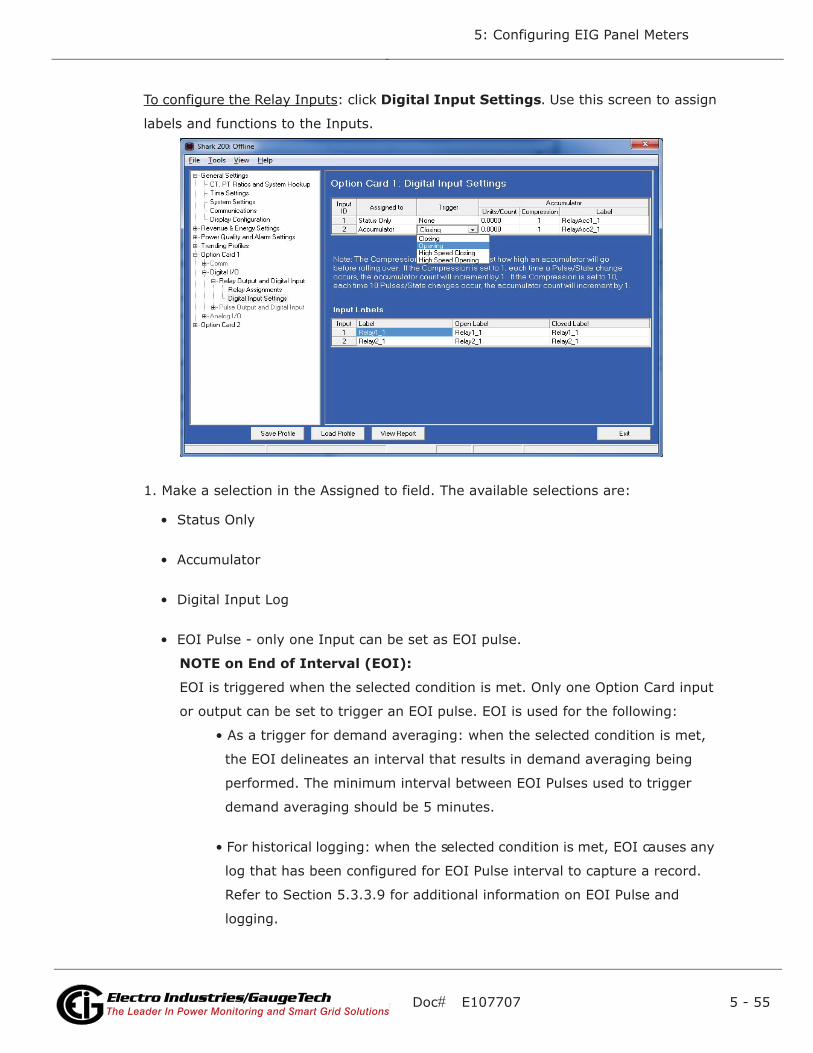
Doc# E107707 5 - 55
5: Configuring EIG Panel Meters
Electro Industries/GaugeTechThe Leader In Power Monitoring and Smart Grid SolutionsElectro Industries/GaugeTechThe Leader In Power Monitoring and Smart Grid Solutions
To configure the Relay Inputs: click Digital Input Settings. Use this screen to assign
labels and functions to the Inputs.
1. Make a selection in the Assigned to field. The available selections are:
• Status Only
• Accumulator
• Digital Input Log
• EOI Pulse - only one Input can be set as EOI pulse.
NOTE on End of Interval (EOI):
EOI is triggered when the selected condition is met. Only one Option Card input
or output can be set to trigger an EOI pulse. EOI is used for the following:
• As a trigger for demand averaging: when the selected condition is met,
the EOI delineates an interval that results in demand averaging being
performed. The minimum interval between EOI Pulses used to trigger
demand averaging should be 5 minutes.
• For historical logging: when the selected condition is met, EOI causes any
log that has been configured for EOI Pulse interval to capture a record.
Refer to Section 5.3.3.9 for additional information on EOI Pulse and
logging.

Doc# E107707 5 - 56
5: Configuring EIG Panel Meters
Electro Industries/GaugeTechThe Leader In Power Monitoring and Smart Grid SolutionsElectro Industries/GaugeTechThe Leader In Power Monitoring and Smart Grid Solutions
2. Select Trigger from the pull-down menu. The Trigger you select depends on your
Assigned to selection:
• For Status Only, select None.
• For Accumulator, select from Closing, Opening, High Speed Closing or High
Speed Opening.
NOTE: Only one accumulator can be assigned to a High Speed Trigger.
• For Digital Input Log, select Change.
• For EOI Pulse, select from Closing, Opening, or Change.
3. Enter Units/Count. The Units/Count is the output ratio from the device that is being
input into the Shark® 200 meter. For example, if you have a KYZ module that is
outputting a pulse every 1.8 kWh, with the input set to Accumulator, Increment on
Contact Opening, you would set the Units/Count to be the value of the KYZ; in this
case either 1.8 or a ratio of that number.
4. Enter Compression. The Compression Factor is used to adjust how high an accumu-
lator will go before rolling over. For example, if you select a Compression Factor of
10, each time 10 Pulse/State changes occur, the accumulator count increments by
1. The available Compression Factors are: 1, 10, 100, 1000, 10000, and 100000.
The default Compression Factor is 1.
5. Enter a Label for the Accumulator.
6. The current Input Labels are displayed in the screen. To change the Input Labels,
click in the Labels field you want to change, and enter a new label. The fields that
can be changed are:
• Input Label - Input ID
• Open Label - Open state ID
• Closed Label - Closed state ID
Configuring a Pulse Output/Digital Input Card:
The Pulse Output/Digital Input Option Card has:

Doc# E107707 5 - 57
5: Configuring EIG Panel Meters
Electro Industries/GaugeTechThe Leader In Power Monitoring and Smart Grid SolutionsElectro Industries/GaugeTechThe Leader In Power Monitoring and Smart Grid Solutions
• Four Pulse Outputs via solid state contacts
• Four wet/dry contact sensing digital inputs.
Accumulators in the Communicator EXT software count the pulses of Inputs and Out-
puts. For technical specifications and hardware installation, refer to the meter’s
Installation and Operation Manual.
NOTE: When installing a Pulse Output/Digital Input card, we recommend you reset
the accumulators for the card, in order to prevent erroneous counts. See Section
5.4.2 for instructions on using the Reset Shark® Information screen to reset card
accumulators.
Example:
An example use of the Pulse Output/Digital Input Card is in a sub-metering applica-
tion where a pulse output is needed. The Input Accumulator allows you to count the
pulses from another device, for example, a KYZ module or another meter. The Output
Accumulators allow you to count the pulses being output by the card.
The Pulse Output and Digital Input Card has two screens for configuration: the Pulse
Output Settings screen and the Digital Input Settings screen.
1. Click Pulse Output Settings.

Doc# E107707 5 - 58
5: Configuring EIG Panel Meters
Electro Industries/GaugeTechThe Leader In Power Monitoring and Smart Grid SolutionsElectro Industries/GaugeTechThe Leader In Power Monitoring and Smart Grid Solutions
2. You can set up to four Output IDs for your Card. Each Output has a Label, an
Assigned Channel, and a Unit/Count. Double-click an Assigned Channel field to add
or edit an Output ID. You will see the window shown below.
3. Select the Counter Type. The available selections are:
• Energy, All Phases
• End of Interval Event - this counter is triggered by a Demand Averaging Interval
• Energy, Phase A
• Energy, Phase B
• Energy, Phase C
• None.
NOTE: If you select one of the Energy Counter Types, you will see the Energy
Counter field. The available selections are: Total Watt Hour; Positive Watt Hour;
Negative Watt Hour; Total VAR Hour; Positive VAR Hour; Negative VAR Hour; VA
Hour; Received Watt Hour; Delivered Watt Hour; Inductive VAR Hour; Capacitive
VAR Hour.
4. Click OK. The Counter Type you selected displays in the Assigned Channel field of
the Pulse Output Settings screen.
5. When you select the Assigned Channel, a value is entered for it in the Units/Count
field. You can edit this field by double-clicking in it. The Units/Count is determined
by the Secondary (the readings in the meter).
6. The current Output Labels are displayed on the screen. To change the Output
labels, click in the Labels field you want to change, and enter a new label.

Doc# E107707 5 - 59
5: Configuring EIG Panel Meters
Electro Industries/GaugeTechThe Leader In Power Monitoring and Smart Grid SolutionsElectro Industries/GaugeTechThe Leader In Power Monitoring and Smart Grid Solutions
7. Click Digital Input Settings.Use this screen to assign labels and functions to the
Inputs
8. Make a selection in the Assigned to field. The available selections are:
• Status Only
• Accumulator
• Digital Input Log
• EOI Pulse - only one Input can be set as EOI pulse.
NOTE on End of Interval (EOI):
EOI is triggered when the selected condition is met. Only one Option Card input
or output can be set to trigger an EOI pulse. EOI is used for the following:
• As a trigger for demand averaging: when the selected condition is met,
the EOI delineates an interval that results in demand averaging being
performed. The minimum interval between EOI Pulses used to trigger
demand averaging should be 5 minutes.
• For historical logging: when the selected condition is met, EOI causes any
log that has been configured for EOI Pulse interval to capture a record.
Refer to Section 5.3.3.9 for additional information on EOI Pulse and log-
ging.
Doc# E107707 5 - 60
5: Configuring EIG Panel Meters
Electro Industries/GaugeTechThe Leader In Power Monitoring and Smart Grid SolutionsElectro Industries/GaugeTechThe Leader In Power Monitoring and Smart Grid Solutions
9. Select Trigger from the pull-down menu. The Trigger you select depends on your
Assigned to selection:
• For Status Only, select None.
• For Accumulator, select from Closing, Opening, High Speed Closing or High
Speed Opening.
NOTE: Only one accumulator can be assigned to a High Speed Trigger.
• For Digital Input Log, select Change.
• For EOI Pulse, select from Closing, Opening, or Change.
10. Enter Units/Count. The Units/Count is the output ratio from the device that is
being input into the Shark® 200 meter. For example, if you have a KYZ module
that is outputting a pulse every 1.8 kWh, with the input set to Accumulator, Incre-
ment on Contact Opening, you would set the Units/Count to be the value of the
KYZ; in this case either 1.8 or a ratio of that number.
11.Enter Compression. The Compression Factor is used to adjust how high an accu-
mulator will go before rolling over. For example, if you select a Compression Factor
of 10, each time 10 Pulse/State changes occur, the accumulator count increments
by 1. The available Compression Factors are: 1, 10, 100, 1000, 10000, and
100000. The default Compression Factor is 1.
12.Enter a Label for the Accumulator.
13. The current Input Labels are displayed in the screen. To change the Input Labels,
click in the Labels field you want to change, and enter a new label. The fields that
can be changed are:
• Input Label - Input ID
• Open Label - Open state ID
• Closed Label - Closed state ID

Doc# E107707 5 - 61
5: Configuring EIG Panel Meters
Electro Industries/GaugeTechThe Leader In Power Monitoring and Smart Grid SolutionsElectro Industries/GaugeTechThe Leader In Power Monitoring and Smart Grid Solutions
Configuring a 0-1 mA Output Card:
The 0-1mA Output Option Card is an analog communication card, which transmits a
standard, bidirectional 0-1 milliamp signal. For technical specifications and hardware
installation, refer to the meter’s Installation and Operation Manual.
Example:
An example use of the optional 0-1mA Output Card is in enabling the Shark® 200
meter to communicate with an RTU.
1. Click 0-1 mA Output.
You can set up to four Output IDs for your Output Card.
2. Double-click an Assigned Channel field to add or edit an Output ID. You will see the
window shown below.
3. Select Group for your Output Channel. The available selections are as follows:
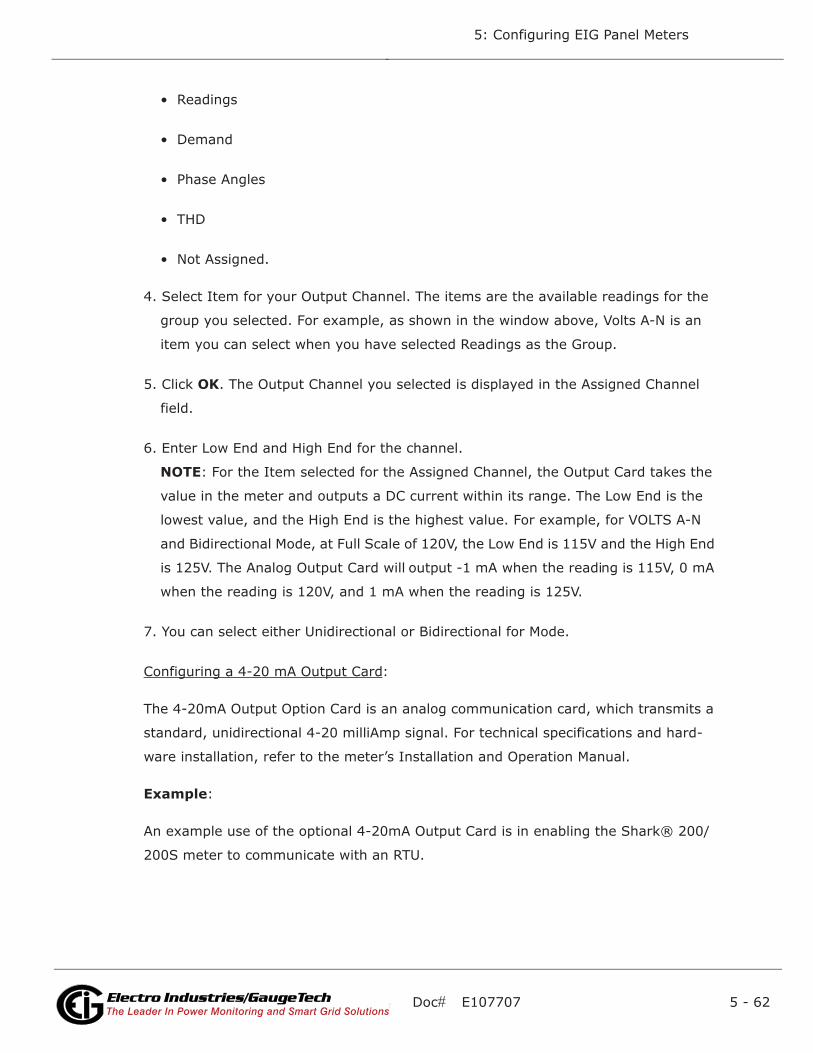
Doc# E107707 5 - 62
5: Configuring EIG Panel Meters
Electro Industries/GaugeTechThe Leader In Power Monitoring and Smart Grid SolutionsElectro Industries/GaugeTechThe Leader In Power Monitoring and Smart Grid Solutions
• Readings
• Demand
• Phase Angles
• THD
• Not Assigned.
4. Select Item for your Output Channel. The items are the available readings for the
group you selected. For example, as shown in the window above, Volts A-N is an
item you can select when you have selected Readings as the Group.
5. Click OK. The Output Channel you selected is displayed in the Assigned Channel
field.
6. Enter Low End and High End for the channel.
NOTE: For the Item selected for the Assigned Channel, the Output Card takes the
value in the meter and outputs a DC current within its range. The Low End is the
lowest value, and the High End is the highest value. For example, for VOLTS A-N
and Bidirectional Mode, at Full Scale of 120V, the Low End is 115V and the High End
is 125V. The Analog Output Card will output -1 mA when the reading is 115V, 0 mA
when the reading is 120V, and 1 mA when the reading is 125V.
7. You can select either Unidirectional or Bidirectional for Mode.
Configuring a 4-20 mA Output Card:
The 4-20mA Output Option Card is an analog communication card, which transmits a
standard, unidirectional 4-20 milliAmp signal. For technical specifications and hard-
ware installation, refer to the meter’s Installation and Operation Manual.
Example:
An example use of the optional 4-20mA Output Card is in enabling the Shark® 200/
200S meter to communicate with an RTU.
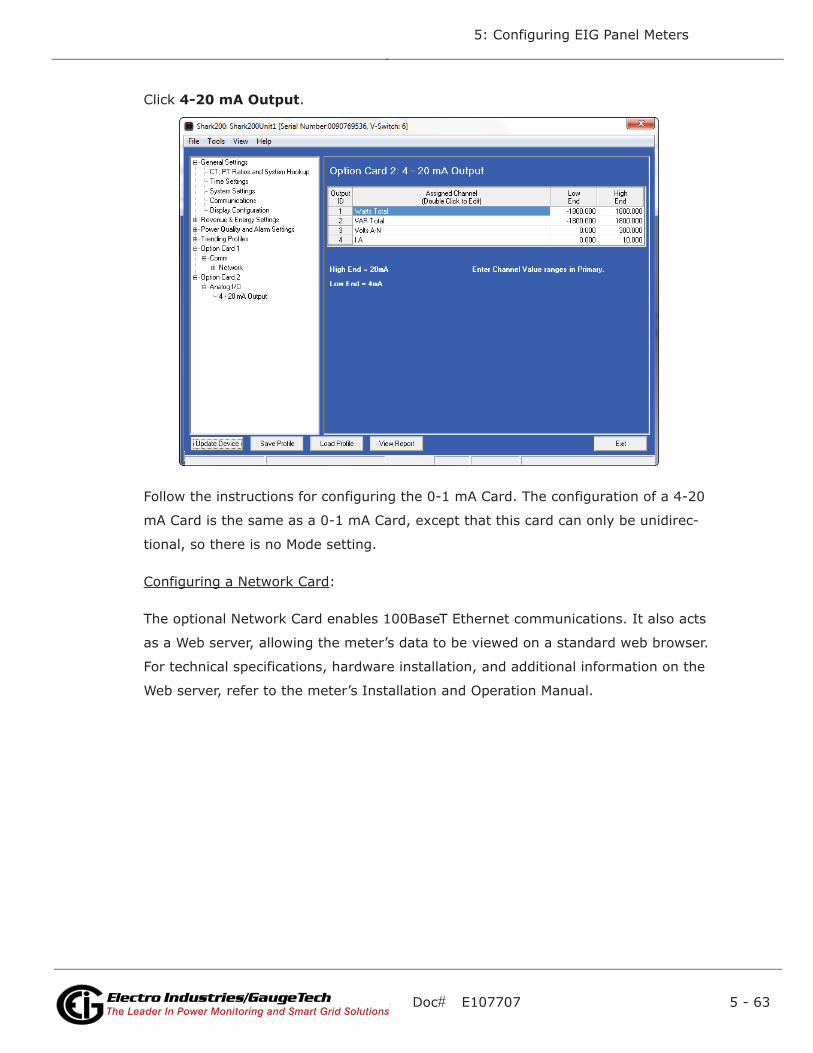
Doc# E107707 5 - 63
5: Configuring EIG Panel Meters
Electro Industries/GaugeTechThe Leader In Power Monitoring and Smart Grid SolutionsElectro Industries/GaugeTechThe Leader In Power Monitoring and Smart Grid Solutions
Click 4-20 mA Output.
Follow the instructions for configuring the 0-1 mA Card. The configuration of a 4-20
mA Card is the same as a 0-1 mA Card, except that this card can only be unidirec-
tional, so there is no Mode setting.
Configuring a Network Card:
The optional Network Card enables 100BaseT Ethernet communications. It also acts
as a Web server, allowing the meter’s data to be viewed on a standard web browser.
For technical specifications, hardware installation, and additional information on the
Web server, refer to the meter’s Installation and Operation Manual.

Doc# E107707 5 - 64
5: Configuring EIG Panel Meters
Electro Industries/GaugeTechThe Leader In Power Monitoring and Smart Grid SolutionsElectro Industries/GaugeTechThe Leader In Power Monitoring and Smart Grid Solutions
1. Click Network>IP Address and DNS. You will see the screen shown below. It
allows you to configure the IP Address, DNS, and Network Time Protocol Server for
the card.
2. Enter the following information:
• Computer Name: Either click the DHCP box to enable a DHCP server to assign
the IP address for your network card or enter the following for the network card:
• IP Address
• Subnet Mask
• Default Gateway
• Domain Name Server Address(es)
• URL address of a Network Time Protocol server if you are using one.
NOTE: The Network Time Protocol server is used for clock synchronization. It
can be either a device with a real-time clock that is networked with your meter,
or an NTP server on the Internet.
IMPORTANT! You must also enable Clock Synchronization in the Time Settings
screen (see Section 5.3.3.2).

Doc# E107707 5 - 65
5: Configuring EIG Panel Meters
Electro Industries/GaugeTechThe Leader In Power Monitoring and Smart Grid SolutionsElectro Industries/GaugeTechThe Leader In Power Monitoring and Smart Grid Solutions
3. Click Network>Services & Security. You will see the screen shown below.
This screen allows you to disable certain features of the meter’s Ethernet connection,
for security purposes.
The HTTP Web Server can be disabled, or its default port can be changed. Also, the
Modbus TCP server can be shut down, or its default port can be changed. If the port
entered is “0,” the standard port is used: 80 for Web Server and 502 for Modbus TCP
Server.
When the Security feature “Silent Mode” is enabled, the meter will totally ignore
incoming connections, in such a way that not even TCP/IP Reset packets will be sent.
When “Silent Mode” is disabled, the meter follows standard TCP/IP procedures for
incoming connections to unused ports. This feature is useful in preventing hacking
(attempted security intrusions).
NOTES:
• If you do not know this information, contact your Systems Administrator.
• See Chapter 13 for instructions on updating the Network card's firmware.

Doc# E107707 5 - 66
5: Configuring EIG Panel Meters
Electro Industries/GaugeTechThe Leader In Power Monitoring and Smart Grid SolutionsElectro Industries/GaugeTechThe Leader In Power Monitoring and Smart Grid Solutions
4. Click DNP Support if you want to set up DNP over Ethernet for the Network Card. You will see
the screen shown below.
This screen lets you set up a DNP Server gateway for the Network Option card. This
gateway enables DNP 3.0 protocol communication over Ethernet, for the meter.
5. Make the following settings:
• Enable DNP Support: by default the DNP server support is disabled. Check the
box to enable it. Once it is enabled, the other parameters can be entered.
• DNP Server Port: this is the TCP/IP port where the meter’s Network card unit will
be listening for incoming connections via the DNP protocol. Valid numbers are
from 1 to 65536. We recommend that you set a value over 1000, because most
of the lower numbers are reserved, or are already allocated to other popular ser-
vices. If you set a port number of less than 10, the network card will set the port
to its default, which is 20000.
• DNP Device Address: this is the meter’s configured address; currently, this set-
ting should be 1.
• IP Address Start/End: this setting implements Internet security by letting you
specify a range of IP addresses that are authorized to connect to the DNP port.

Doc# E107707 5 - 67
5: Configuring EIG Panel Meters
Electro Industries/GaugeTechThe Leader In Power Monitoring and Smart Grid SolutionsElectro Industries/GaugeTechThe Leader In Power Monitoring and Smart Grid Solutions
Any requester with an IP address outside of this range will be rejected. Enter the
range in the start and end fields. To disable the IP range restriction, write
0.0.0.0 in the start field and 255.255.255.255 in the end field.
• IP Port Start/End: you can also use this setting to implement Internet security by
through specifying a range of authorized port addresses. Any requester originat-
ing the connection from a port outside of this range will be rejected. Enter the
range in the start and end fields (valid port ranges are from1 to 65536) . To dis-
able the port range restriction, use 0 in either the start or the end field.
NOTE: You can configure settings for an Option card when you are not connected to a
meter. Click Option Card 1 or 2 from the Shark® 200/200S meter's Device Profile
screen. The drop-down menu on the displayed screen allows you to select your Option
card. The available selections are: Fiber Optic, Network, Digital Relay, Pulse Output,
Analog Output (0-1mA), Analog Output (4-20mA), None. Click Apply. The Option card
you chose is now listed in the menu. Refer to the instructions for configuring the card,
earlier in Section 5.3.3.12.0.
5.4: Using the Shark® Meter's Polling and Tools Menus
You can access additional Shark options from the Polling and Tools menus in the
Communicator EXT Title Bar.
5.4.1: Using the Shark® Meter's Polling Menu
The Polling Menu for the Shark® meter is similar to that of the other EIG meters.
There are fewer screens for the Shark® Series meters, though the Shark® 200/200S
meter has some screens that the Shark® 50/100/100B/100S meter does not.
Unavailable screens may appear on the menu grayed out (and un-selectable).
Additionally, the Shark® Series meters have some unique Polling screens not used by
other EIG meters. See Chapter 7 for details of the Shark® Meter's Polling screens.
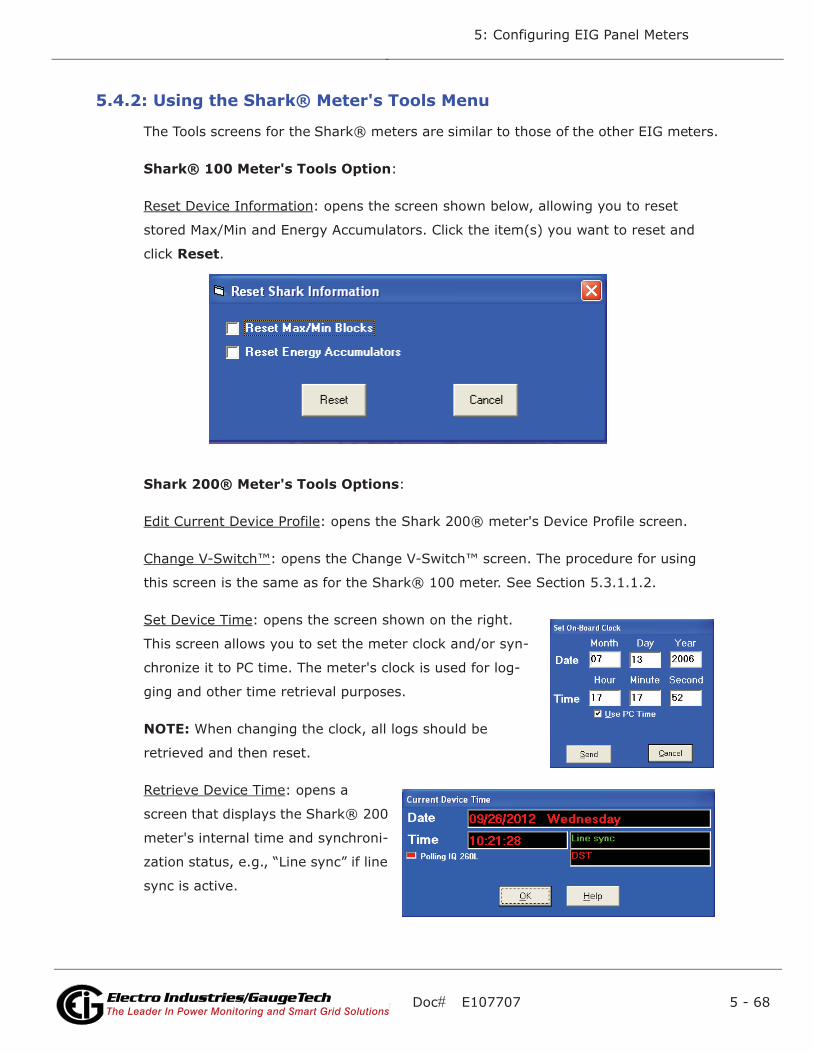
Doc# E107707 5 - 68
5: Configuring EIG Panel Meters
Electro Industries/GaugeTechThe Leader In Power Monitoring and Smart Grid SolutionsElectro Industries/GaugeTechThe Leader In Power Monitoring and Smart Grid Solutions
5.4.2: Using the Shark® Meter's Tools Menu
The Tools screens for the Shark® meters are similar to those of the other EIG meters.
Shark® 100 Meter's Tools Option:
Reset Device Information: opens the screen shown below, allowing you to reset
stored Max/Min and Energy Accumulators. Click the item(s) you want to reset and
click Reset.
Shark 200® Meter's Tools Options:
Edit Current Device Profile: opens the Shark 200® meter's Device Profile screen.
Change V-Switch™: opens the Change V-Switch™ screen. The procedure for using
this screen is the same as for the Shark® 100 meter. See Section 5.3.1.1.2.
Set Device Time: opens the screen shown on the right.
This screen allows you to set the meter clock and/or syn-
chronize it to PC time. The meter's clock is used for log-
ging and other time retrieval purposes.
NOTE: When changing the clock, all logs should be
retrieved and then reset.
Retrieve Device Time: opens a
screen that displays the Shark® 200
meter's internal time and synchroni-
zation status, e.g., “Line sync” if line
sync is active.

Doc# E107707 5 - 69
5: Configuring EIG Panel Meters
Electro Industries/GaugeTechThe Leader In Power Monitoring and Smart Grid SolutionsElectro Industries/GaugeTechThe Leader In Power Monitoring and Smart Grid Solutions
Reset Device Information: opens the screen shown below. Select the items you want
to reset and click Reset.
NOTES:
• You can reset Max/Min Blocks, Energy Accumulators, each of the Logs, and Option
Card Accumulators.
• The screen shown above is for a Shark® 200 meter with V-Switch™ key 6. If your
meter has a lower V-Switch™ key you won’t see all of these options.
• When installing a Pulse Output/Digital Input card or a Relay Output/Digital Input
Card, we recommend you reset the accumulators for the card, in order to prevent
erroneous counts.
• This feature requires a Password if Password for Reset is enabled. See Section
5.3.3.3.
Retrieve Device Status: opens the Device Status screen. See Section 5.2.1.

Doc# E107707 5 - 70
5: Configuring EIG Panel Meters
Electro Industries/GaugeTechThe Leader In Power Monitoring and Smart Grid SolutionsElectro Industries/GaugeTechThe Leader In Power Monitoring and Smart Grid Solutions
Option Card Information: opens the screen shown below. It displays information
about any Option cards installed in the Shark® 200 meter: Type, Sub Type, Card
Name, Serial Number, and Version.
Relay Control: opens the screen shown below. This screen allows you to manually set
the state of each of the installed Relay Output/Digital Input Option cards.
The screen displays the current Relay state. To change the state:
1. Select the desired state in the Select New State field.
2. Click the checkbox next to the Relays you want to change to that state.
3. Click Apply. If this feature is Password Protected, the Enter Password screen
opens.
4. Click OK to close the screen.

Doc# E107707 5 - 71
5: Configuring EIG Panel Meters
Electro Industries/GaugeTechThe Leader In Power Monitoring and Smart Grid SolutionsElectro Industries/GaugeTechThe Leader In Power Monitoring and Smart Grid Solutions
NOTES:
• A Relay cannot be manually controlled if a Limit has been assigned to it. See
"Configuring a Relay Output/Digital Input Card" in Section 5.3.3.12.
• If the Relay State field is "State is Unknown," verify that the Relay configuration is
correct. You may also see this message after you have performed a Reset. Select a
New State for the Relay and click Apply.
Flash Me: opens a screen that allows you to update the Shark® 200 meter's firm-
ware. See Section 13.7 for detailed instructions.
Flash Network Card: brings you to a webpage that lets you update the Network card’s
firmware. See Chapter 13 for instructions.
Manual Waveform Capture: opens the screen shown below.
This screen gives you information on the Waveform log. To trigger a waveform cap-
ture, click Trigger Manual Capture.

Doc# E107707 5 - 72
5: Configuring EIG Panel Meters
Electro Industries/GaugeTechThe Leader In Power Monitoring and Smart Grid SolutionsElectro Industries/GaugeTechThe Leader In Power Monitoring and Smart Grid Solutions
CT & PT Compensation>View CT & PT Compensation Factors: opens the screen shown
below.
CT/PT compensation is used to correct for errors caused by the current transformers
(CTs) (external to the meter) and Potential/Voltage transformers (PTs) connected to
the meter. Use this screen to set compensation factors (Input fields), save them to a
file (Save to File button), write them to the meter (Write Factors to Device but-
ton), read them from the meter (Read Factors from Device button), load from a file
(Load from File button), and enable compensation (Enabled checkbox).
NOTES:
• PT compensation is not being applied to symmetrical components.
• For 2.5 Element Wye and 2 CT Delta hookup, set the B phase PT factor to 0.

Doc# E107707 5 - 73
5: Configuring EIG Panel Meters
Electro Industries/GaugeTechThe Leader In Power Monitoring and Smart Grid SolutionsElectro Industries/GaugeTechThe Leader In Power Monitoring and Smart Grid Solutions
The entry fields and acceptable entries are as follows:
Enabled: click to enable CT and PT Compensation.
Percent of error values in voltage reading due to PT: you can enter 4 values per
phase for 4 voltage levels 69V, 120V, 230V, and 480V. The allowable range is -15 to
+15. For example, if a reading is 1% higher than expected, enter -1 to adjust it.
Percent of error in current reading due to CT: you can enter 4 values per phase
for 4 current levels 0.25A, 0.5A, 1A, and 5A. The allowable range is -15 to +15. For
example, if a reading is 1% higher than expected, enter -1 to adjust it.
Frequency: enter your system’s frequency. The allowable range is between 45 and
65 Hz.
Phase Compensation Correction Factors: Angle, % Deviation and Counts (time
advance or delay in phase shift in term of counts) where 1 count =1.2 microseconds
change. You can enter 4 values per phase for 4 current levels 0.25A, 0.5A, 1A, and
5A.
NOTES:
• The allowable range for counts is -50 to +50.
• Each positive count adds 1.2 microseconds of time delay to the phase compensa-
tion.
• Each negative count adds 1.2 microseconds of time advance to the phase compen-
sation.
Click the buttons on the bottom of the screen to perform the following actions:
• Load from file: click to select a file containing the CT and PT Compensation factors
you want to use.
• Save to file: click to save the current entries to a file.
• Write Factors to device: click to load the current entries to a device.
• Read Factors from Device: click to download the CT and PT compensation factors
from a device to the screen’s entry fields.
Click OK to close the screen.
Formulas and example settings:
Voltage Compensation
Vcomp= Vcalc * PTcf
PTcf=1+ (0.01*Ve)
where Ve is the % error due to the PT at that voltage level
For example, if Vcalc = 100V; and % error @ 100V is 5%.
Then:
PTcf = 1+(0.01*5) = 1.05
Vcomp = 100* 1.05 = 105
Current Compensation
Icomp= Icalc * CTcf
CTcf=1+0.01*Ie
where Ie is the % error due to CT at that current level
For example, if Icalc = 5A; and % error @ 5A is 5%.
Then:
CTcf = 1+0.01*0.5 = 1.05
Icomp = 5* 1.05 = 5.25A
Network Card Status: opens a screen that displays the location of an installed Net-
work Card (Option Card 1 or Option Card 2), its current status, and information about
its settings. Click Close to exit the screen.

5.5: Futura+ and DM Series Overview
Communicator EXT Software enables you to configure the Futura+ and DM Series Meters’programmable settings, which are stored in the unit’s Device Setup. To access this screen, click onProfile button of the Communicator EXT Software main screen or Tools, Edit Current DeviceProfile. The following screen will appear. To move from screen to screen, click on the tabs at thetop of each folder. Click on the Tool Bar at the bottom of the screen to perform tasks. Note: If you cannot make a connection, make sure your communication settings match thosebelow.
Selections you make on these screens will not take effect until you click the Update Button to sendthe settings to the Futura+ (after you have already connected to the Futura+). If you click the Save,Open or Update buttons, you MUST have a unique Meter Destination Label so that the file is saved,loaded or updated to the intended device. Warning: It is possible to make mistakes here that canonly be rectified by reprogramming the Futura+ through the optional P34 display.
SPECIAL NOTES REGARDING FUTURA+:
1. Futura+ Polling screens are similar to those of the Nexus® 1252 meter but may contain slightly less data.
2. For details on DNP, refer to Futura and DMMS DNP V3.00 Protocol Rev 1.12.3. For details on the Script and Scheduler, refer to Chapter 15 of this manual.
eElectro Industries/GaugeTech Doc # E107707 5-75

5.5.1: Retrieve and Send Device Profiles
Click on the Edit Profile button, or select Tools, Edit Current Device Profile. Communicator EXTretrieves the programmable settings from the currently connected Futura+ Monitor. The followingscreen appears:
A dialogue box appears to confirm that the profile was retrieved successfully. Automatically, theDevice Setup screens appear:
This group of screens contains all the programmable settings currently stored in the connectedFutura+ Monitor. Configure each of the programmable settings by clicking on the appropriate button, selecting from a pull-down menu or entering the proper data. A detail of each screen follows. To move from screen to screen, click on the tabs at the top of each folder. Click on theTool Bar at the bottom of the screen to perform tasks.
eElectro Industries/GaugeTech Doc # E107707 5-76

After you have finished configuring any or all of the programmable settings, you may either:
• Implement the changes by clicking on the Update button. This sends the new, edited DeviceProfile to the Futura+ Monitor. YOU MUST UPDATE THE METER'S DEVICE PROFILE FORANY OF THE PROGRAMMABLE SETTINGS TO TAKE EFFECT.
• Store the profile for later use by clicking on the Save button. A dialogue box will ask whereyou would like to save the profile.
• Open a previously saved profile by clicking on the Open button. A dialogue box will ask forthe location of the saved profile.
• Print or save a copy of the profile by clicking on the Print Report button.
NOTE: If you change the Com settings for the meter, you will not be able to communicate withit. You will have to sign off and sign on again with the new settings.
5.5.2: General
Communications
Address: The Futura+ can be programmed with a unique four-digit address (0001 through 9999).Futura+ monitors are shipped with address 0001 and a baud rate of 9600, unless otherwise specified.To change the Futura+’s address, establish a connection (using the current address) and upload thenew address to the device. In a Modbus RTU or ASCII system, valid addresses are limited to 0001through 0247.
Baud Rate: From the pull-down menu, select the device baud rate (1200, 2400, 4800, 9600, 19200or 38400).
System
Toggle the following options on and off by selecting Yes or No. If you select Yes:
• Blank Leading Zero: Leading zeros will appear as blanks (on the Futura’s display).
• Reset Protection: A password must be entered (through the keypad) before it will be possible touse the keypad to reset maximum/minimum and hour readings. (This password will not effectsoftware resets.)
• Open Delta: If you are using an open-delta connection (between the meter and the PTs andCTs), check Yes to disable the phase-to-neutral readings on the Futura+ display. (For moreinformation, see the Futura+ Installation and Operation Manual.)
eElectro Industries/GaugeTech Doc # E107707 5-7
• Detect Phase Reversal: If a phase reversal is detected, the Limit 1 (LM1) light on the Futura+’soptional display will blink. If you select Yes, you can then use the Current Set Points screen tolink the occurrence of a phase reversal to the tripping of a relay output.
• Input Flip: This will change the contact-sensing status from N.O. (normally open) to N.C. (normally closed).
Device Firmware
Each power monitor has two types of firmware:
• COMM: The version of the connected power monitor’s communications firmware (CPU1000V4.0 250, for example).
• DSP: The version of the connected power monitor’s digital signal processing firmware (CPU196 V2.8, for example).
Full Scales
The Futura+ uses a scaling factor to convert secondary mesurements to primary readings. To set fullscales, you must know the PT and CT ratios relative to the full-scale secondary values of 120V (or75V or 300V) and 5A.
For a table of full- scale settings for typical voltages, see Appendix 3. For more detailed information, refer to the Futura+ Installation and Operation Manual.
If the PT ratio is 4:1, the CT ratio is 100:1 and the Futura+ is calibrated for 1200V and 5A:
eElectro Industries/GaugeTech Doc # E107707 5-78
SETTING
YES
NO
N.O. N.C.
OFF ON
ON OFF
(PT Ratio) (V)=Full-Scale V (CT Ratio) (A)=Full-Scale A
(4/1) (120V)=480V=0480V (100/1) (5)=500A=0500A
Programming Full Scales for Voltage, Current and Power
• Because the Futura+ bases its power calculation on the full scales of the voltage and current, youmay need to adjust the resolution (decimal point placement) of the power.
• For example, if the PT=480/120, the CT=500/5 and there are three phases:
(PT) (CT) (number of phases) = power(480) (500) (3) = 720 kilowatts = 0720kW (full scale)Therefore, you would select XXXX kW
• Resolution: 2000 Counts
Where the load is normally very low, increase the watt resolution by moving the decimalpoint to the left.
If the FSW is too small a value for a megawatt meter, move the decimal point(1.440MW = 1440kW): Change X.XXX MW to XXXX kW.
If the FSW is too large a value for a kilowatt meter (the range is 0000 to 2000 with the decimal point omitted), change it to a megawatt meter (43200kW = 043.2MW).)NOTE: The labels on your Futura+’s display should reflect the selected scales.
FSW (full-scale wattage) is the product of FSV (full-scale voltage), FSA (full-scale amperage) and the number of phases:
FSW= (FSV) (FSA) (number of phases).
Communication Protocols
• Main Port: Side Download Port
This port only supports EI Protocol, which is used by all EIG software.
The maximum baud rate is 38400.
The interfaces to this port are clearly labeled J2-1 (RS-232) or J2-2 (RS-485).Both access the same port; only one can be used at a time.
This port handles downloading, uploading and programming.
• Polling Port: Top Port
The Top Port (Polling Port) is an option for the Futura+. For this port to function, the monitor must also be equipped with the appropriate RS-232 or RS-485 communications interface.
e Electro Industries/GaugeTech Doc # E107707 5-79

Select from the following protocols:
DNP 3.0
EI Protocol: Used by all EIG software, such as Futura+ Communicator and Power System Supervisor.
Modbus (ASCII): Modicon ASCII protocol.
Modbus (RTU): Modicon binary protocol.
Maximum baud rate is 9600. If the baud rate of the main port is set at 9600 or greater, the baud rate of the top port will default to 9600.
In a Futura+, this port handles only real time polling. With either Modbus protocol, some programming functions can be handled.
Port Control (for Main and Top Ports): For either port, select Printing and Communication orCommunication Only.
• Communication Only: Prevents (accidental) meter keypad input from interfering with communications.
• Printing and Communication: Used for troubleshooting.
Averaging Window Interval: This is the four-digit interval (in seconds) over which average readings are to be calculated for volts, amps and power functions.
5.5.3: Programming Limits
Use the Limit Settings screens to program the limits and establish links between the limits and relays. Each set point can be linked to any combination or relays (1 through 3) on your Futura+.
NOTE: If your Futura+ is set up to generate KYZ pulses, the linked relays will not respond to exceeded set points .
Limits (or set points) are divided into four groups (voltage, current, power and THD). All limits (all four groups) can be set to be triggered by either instantaneous or average readings.
Exit: Click Exit to save changes and return to the General EIG screen.
WARNING: Make sure that full scales are set for the device (in the EIG Programmer) before you establish limits; limits are dependent on full scales. If you change a full scale after you set up limits, the results may be unpredictable. The labels and decimal point placement on the set-point screens will reflect your full scale settings.
e Electro Industries/GaugeTech Doc # E107707 5-80

5.5.4: Alarm Limits (Voltage)
• This screen consists of six voltage phase-to-neutral limits (two limits each for Van, Vbn andVcn) and six voltage phase-to-phase limits (two limits each for Vab, Vbc, Vca).
• For each limit, specify whether it is above or below, and optionally select any combination of trigger relays (1, 2 and 3).
5.5.5: Alarm Limits (Current)
e Electro Industries/GaugeTech Doc # E107707 5-81

• This screen consists of eight current limits (two limits each for Amps A, Amps B, Amps C and Amps N) and one phase-imbalance limit.
• For each current limit, specify whether it is above or below, and optionally select any combination of trigger relays (1, 2 and 3). You can also have a phase reversal trigger a relay (see section 5.5.2).
5.5.6: Alarm Limits (Power)
• This screen consists of two limits each for Watt (MWatt), VAR (MVAR), VA (MVA), Power Factor (PF) and Frequency (Freq).
• For each limit, specify whether it is above or below and, optionally select any combination oftrigger relays (1, 2 and 3).
e Electro Industries/GaugeTech Doc # E107707 5-82

5.5.7: Alarm Limits % THD
• This screen consists of six limits for voltage (two each for Volts A, B and C) and six for Current (two each for I A, B and C)
• For each limit, specify whether it is above or below and, optionally select any combination oftrigger relays (1, 2 and 3).
5.5.8: Instantaneous or Average Limits
• This screen allows the user to choose Limits Triggered On: Instantaneous Readings or Average Readings. Click Update to update the Futura+; click Exit to exit this screen.
e Electro Industries/GaugeTech Doc # E107707 5-83

5.5.9: KYZ Pulse Output
• Use this screen to set or change the KYZ output settings of a Futura+ that has been equipped with the optional KYZ Module and has been set for KYZ. Once you have connected to the Futura+ device, on the menu bar select Tools, EIG Programmer and click the KYZ Output tab. You can then set the pulse scale and map the function for each channel. Save changes by clicking Save. Click Exit to return to the main screen.
NOTE: The Futura+ will not be programmed with these settings until you update the programming to it by clicking Update. Updating can be done after all settings on all tabs arecomplete; Futura+ will remember all the changes.
Pulse Scale
The Pulse Scale represents the magnitude of each transition of the KYZ relay. Select the number ofhours each KYZ pulse will represent for the three pulse outputs: One KYZ Pulse for every (enternumber) kilowatt-hour, kVAR-hour or kVA-hour.
Example:Scaling: One KYZ pulse for every 20 kilowatt-hoursKYZ Output 1: Mapped to Kilowatt-hourKYZ Output 2: Mapped to - Kilowatt-hourKYZ Output 3: Mapped to kVA-hour
If, over the course of an hour, +kilowatt-hours increased by 400, -kilowatt-hours increased by 20 andkVA-hours increased by 1200, during that hour: Output 1 would have pulsed 20 times (400/20),Output 2 would have pulsed once (20/20) and Output 3 would have pulsed 60 times (1200/20).
NOTE: A pulse is one change of state: from N.O. (normally open) to N.C. (normally closed) or from N.C. to N.O.
e Electro Industries/GaugeTech Doc # E107707 5-84
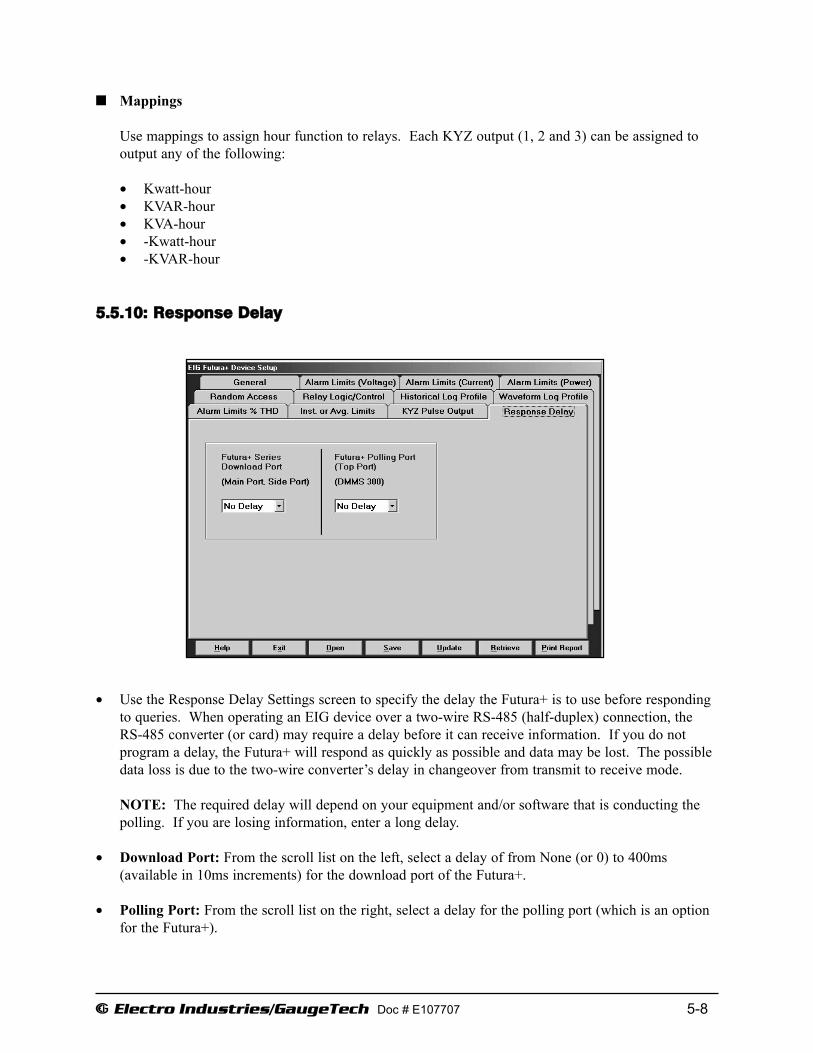
Mappings
Use mappings to assign hour function to relays. Each KYZ output (1, 2 and 3) can be assigned tooutput any of the following:
• Kwatt-hour• KVAR-hour• KVA-hour• -Kwatt-hour• -KVAR-hour
5.5.10: Response Delay
• Use the Response Delay Settings screen to specify the delay the Futura+ is to use before respondingto queries. When operating an EIG device over a two-wire RS-485 (half-duplex) connection, theRS-485 converter (or card) may require a delay before it can receive information. If you do not program a delay, the Futura+ will respond as quickly as possible and data may be lost. The possibledata loss is due to the two-wire converter’s delay in changeover from transmit to receive mode.
NOTE: The required delay will depend on your equipment and/or software that is conducting thepolling. If you are losing information, enter a long delay.
• Download Port: From the scroll list on the left, select a delay of from None (or 0) to 400ms (available in 10ms increments) for the download port of the Futura+.
• Polling Port: From the scroll list on the right, select a delay for the polling port (which is an optionfor the Futura+).
e Electro Industries/GaugeTech Doc # E107707 5-8

5.5.11: Random Access
• Random Access is not required for normal operation and is designed to be used ONLYwith the direction and supervision of an EIG engineer or technician.
Inappropriate use of this feature, which makes otherwise inaccessible areas of the programming block available, may disable communications or render a meter inoperable.
5.5.12: Relay Logic / Control
e Electro Industries/GaugeTech Doc # E107707 5-86

E Electro Industries/GaugeTech Doc#E107707 5-87
Use the Relay Logic / Control Settings screen to set or change the characteristics of relays. Each of the Futura’s three relays (1, 2 and 3) can be programmed individually.
Delay (in seconds): Set: Delay before setting (energizing) the relay when the linked limit is exceeded. Reset: Delay before resetting (de-energizing) the relay when the linked limit is no longer being exceeded.
Computer Control: Use this Yes/No toggle to enable or disable the control of relays through the software.
Logic Control: Use the AND/OR toggle for logic control.
AND: For the relay to set, all limits linked to this relay must be exceeded.
OR: For the relay to set, at least one limit linked to relay must be exceeded.
Hysteresis: This Enabled/Disabled toggle uses two limits to determine whether the relay will be turned on or off. When hysteresis is enabled (and two limits are set), the relay will not be turned on until the value of the parameter exceeds the higher limit. The relay will not be turned off until the value of the parameter falls below the lower limit.
Logic Type: This is a Negative/Positive toggle.
Positive: Relay Reset Position: Continuity between the common and N.C. (Normally Closed) pins. Relay Set Position: Continuity between the common and N.O. (Normally Open) pins. Negative: Relay Reset Position: Continuity between the common and N.O. (Normally Open) pins. Relay Set Position: Continuity between the common and N.C. (Normally Closed) pins. Exit: Click Exit to return to the main screen.

5.5.13: Historical Log Profile
• An Historical Log is used to track any parameter over time. (See the Futura+ Installation andOperation Manual for information about storage capacity.)
• An Historical Log is a collection of time-stamped records. Each record contains up to 55 dataitems, which are recorded at a specified interval and stamped with the time of the recording.The following criteria determine when a record will be made (in other words, when a snapshotwill be taken):
The user-specified interval.A parameter’s exceeding of a limit or a return to within limits.The capture of a waveform.An I/O event( the change of state of a relay or input).
The Historical Profile
An Historical Profile is used to specify the readings a Futura+ device is to record and the intervals atwhich they are to be recorded. In this profile, you can also stipulate which channels’ exceeded limitsare to cause a recording of data (regardless of specified interval).
• In order for data to be stored and retrieved, a valid profile must be stored in the Futura+ device. (See Creating an Historical Profile.)
• The Futura+ can be programmed to store average as well as instantaneous values in its historicallog.
e Electro Industries/GaugeTech Doc # E107707 5-88
• In addition to storing data at a user-specified interval, the Futura+ can also take snapshots when a limit is exceeded and when the value returns to within the limit. So, if snapshots are scheduled to be taken at fifteen-minute intervals and a dip or surge occurs during the interim (the voltage drops five minutes after a scheduled recording was made), the Futura+ will also take a snapshot when the voltage drops below your set limit and when it returns to within limits.
NOTE: For the snapshots discussed above to be taken, you must also have your limits set to trip(see sections 5.5.2 to 5.5.8).
• A Futura+ stores up to 101,171 pieces of historical data in its mass memory. For example, if your historical profile has ten values logged every fifteen minutes, it would take from three months to nearly a year (depending on its memory option) to fill the Futura+ device’s memory.
Creating an Historical Profile
• In the Historical Profile screen, use the check boxes next to the channel name to specify the recording (the taking of a snapshot) of instantaneous and/or average readings.
• In the Exceeded Limit column, check the box next to a channel name to have a snapshotstored when the channel’s limit is exceeded.
• Enable or disable the recording of hour counters, Instantaneous THD and Limit THD.
• Specify the recording interval (in seconds) and enable or disable Sync Time.
Without Sync Time, the first recording will occur immediately and recordings will continue to be made at the specified interval.
With Sync Time:
The first recording will be made immediately.
Subsequent recordings will be made starting at the next point in time that the end of an interval would have been reached, had recording started at the top of the current hour (based on the meter’s clock).
Recordings will continue to be made at the specified interval until the end of the hour. The start of each new hour will trigger a recording and restart the interval counter.
Example:If it is now 06:04 and the interval is 0900 seconds (or 15 minutes), recordings will be made at 06:04 (immediately), 06:15 (the first end of an interval, had recording started at06:00), 06:30 and 06:45. Recordings will start on the hour at 07:00 and continue with 07:15, 07:30, 07:45, etc.
e Electro Industries/GaugeTech Doc # E107707 5-89

• Once you’ve specified all your choices, click Save.
• In a waveform profile, you can select a link to an historical recording if a particular limit is exceeded (see Waveform Profile).
Editing an Historical Profile
• In the Historical Profile screen, use the check boxes next to the channel name to specify the recording (the taking of a snapshot) of instantaneous and/or average readings.
• In the Exceeded Limit column, check the box next to a channel name to have a snapshotstored when the channel’s limit is exceeded (You may find it expedient to make use of the Check All or Uncheck All buttons).
• Enable or disable the recording of hour counters, Instantaneous THD and Limit THD.
• Specify the recording interval (in seconds) and enable or disable Sync Time.
Updating (Sending) an Historical Profile to a Futura+
• Use the Update button on any of the Device Profile screens to update the Futura+.
• Updating the Futura+ can be done at one time for all changes made to the Device Profile.After you have made any changes to any or all of the Device Profile screens, click the Update button. Futura+ will remember all your selections.
e Electro Industries/GaugeTech Doc # E107707 5-90
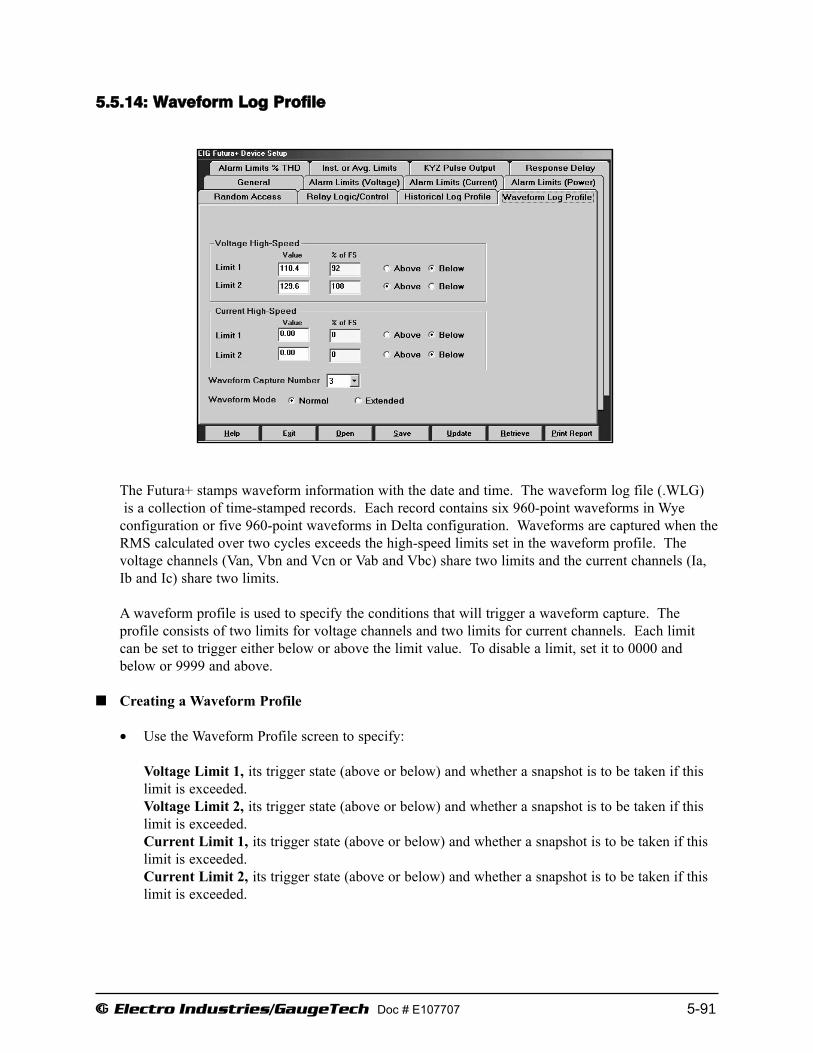
e Electro Industries/GaugeTech Doc # E107707 5-91
5.5.14: Waveform Log Profile
The Futura+ stamps waveform information with the date and time. The waveform log file (.WLG)is a collection of time-stamped records. Each record contains six 960-point waveforms in Wye
configuration or five 960-point waveforms in Delta configuration. Waveforms are captured when theRMS calculated over two cycles exceeds the high-speed limits set in the waveform profile. The voltage channels (Van, Vbn and Vcn or Vab and Vbc) share two limits and the current channels (Ia,Ib and Ic) share two limits.
A waveform profile is used to specify the conditions that will trigger a waveform capture. The profile consists of two limits for voltage channels and two limits for current channels. Each limitcan be set to trigger either below or above the limit value. To disable a limit, set it to 0000 andbelow or 9999 and above.
Creating a Waveform Profile
• Use the Waveform Profile screen to specify:
Voltage Limit 1, its trigger state (above or below) and whether a snapshot is to be taken if thislimit is exceeded.Voltage Limit 2, its trigger state (above or below) and whether a snapshot is to be taken if thislimit is exceeded.Current Limit 1, its trigger state (above or below) and whether a snapshot is to be taken if thislimit is exceeded.Current Limit 2, its trigger state (above or below) and whether a snapshot is to be taken if thislimit is exceeded.

The waveform capture number (the number of waveforms that will be stored, depending on thewaveform mode).
In Normal Mode, this specifies the maximum number of consecutive waveforms that will be captured while a given limit is being exceeded. Fewer waveforms will be captured if the limit does not remain exceeded.
In Extended Mode, this specifies the absolute number of consecutive waveforms that will be captured when a given limit is exceeded. This number of captures is guaranteed, even if the limit does not remain exceeded.
The waveform mode:
In Normal Mode, waveforms will be captured for an exceeded limit only until either:
The limit is no longer exceeded.
The number of captures specified in the waveform capture number have been made.
In Extended Mode, waveforms will be captured for an exceeded limit until the number of captures specified in the waveform capture number have been made.
5.6: Real Time Poll
• After connecting to the Futura+ device, on the menu bar, select Real Time Poll button. A menu of screens allows the user to select one of the following polling screens:
Instantaneous PollingPoll Max and Min ReadingsPoll Power ReadingsPoll HarmonicsPoll Internal InputsPoll Limit Status
The individual screens are readings that result from the settings in the Device Profile which were discussed in the earlier sections of this chapter. The screens are very similar to the Nexus®1252 and 1262/1272 meter screens. Occasionally, the Futura+ screens will have slightly fewer readings.
For directions on how to utilize the data on the screens, see Chapter 7 of this manual.
e Electro Industries/GaugeTech Doc # E107707 5-92

5.7: Tools
• After connecting to the Futura+ device, on the menu bar, select Tools. A menu of the following tools will appear:
Edit Current Device Profile (covered in earlier sections of this chapter)Set Futura+ TimeRetrieve Futura+ TimeReset EI Device InformationRetrieve Device StatusLow Level AccessFutura+ Analog Output Programmer
Each of these Tools will be described in the following sections, with the exception of Edit Current Device Profile, which was described in detail in section 5.5 of this chapter.
5.8: Set Futura+ Time
• After connecting to the Futura+ device, on the menu bar, select Tools and click Set Futura+ Time.
• Set the Month, Day, Year, Hour Minute and Second or click Use PC Time.
• Click Send to send the new settings to the Futura+ or click Cancel.
e Electro Industries/GaugeTech Doc # E107707 5-93

5.9: Retrieve Futura+ Time
• After connecting to the Futura+ device, on the menu bar, select Tools and click Retrieve Futura+Time. The following screen will appear. Click OK to return to the main screen. To adjust Futura+ Time, see section 5.8.
5.10: Reset EI Device Information
• After connecting to the Futura+ device, on the menu bar, select Tools and click Reset EI Device Information. The following screen will appear.
• Select the parameters that you want to reset. Click OK. A screen will appear that confirms the reset. Click OK to return to the main screen.
5.11: Retrieve Device Status
• After connecting to the Futura+ device, on the menu bar, select Tools and click Retrieve Device Status. The following screen will appear.
e Electro Industries/GaugeTech Doc # E107707 5-94
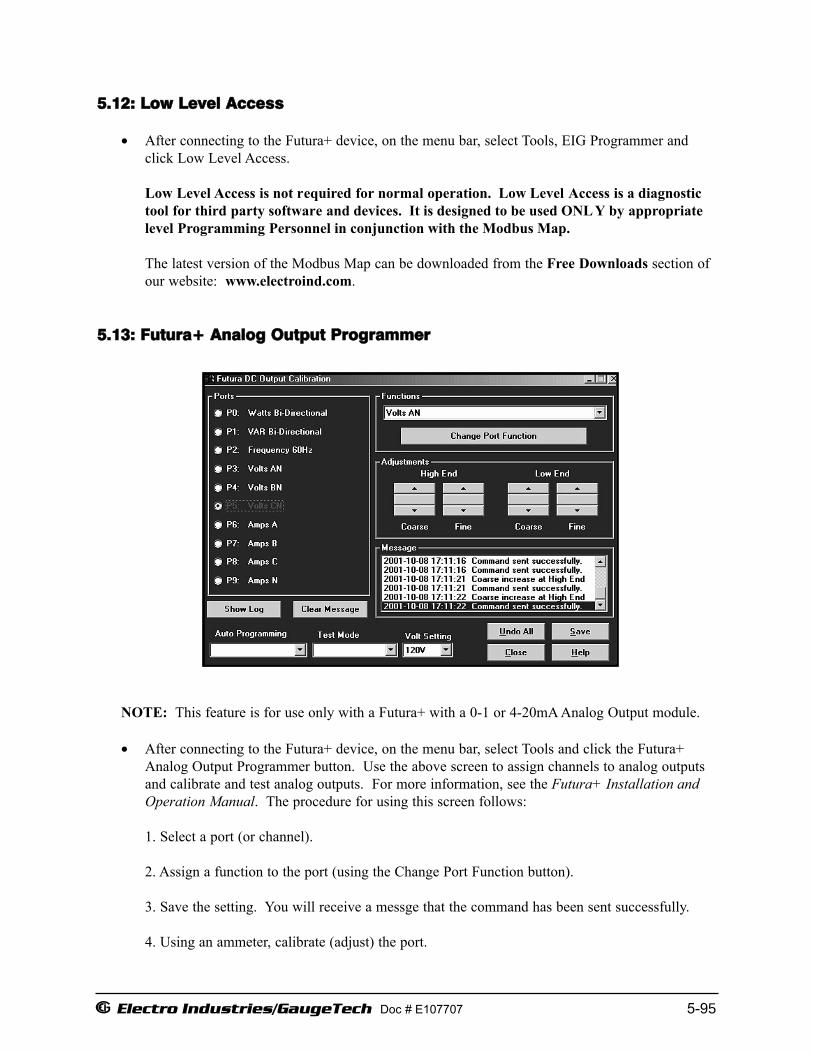
5.12: Low Level Access
• After connecting to the Futura+ device, on the menu bar, select Tools, EIG Programmer and click Low Level Access.
Low Level Access is not required for normal operation. Low Level Access is a diagnostic tool for third party software and devices. It is designed to be used ONL Y by appropriate level Programming Personnel in conjunction with the Modbus Map.
The latest version of the Modbus Map can be downloaded from the Free Downloads section of our website: www.electroind.com.
5.13: Futura+ Analog Output Programmer
NOTE: This feature is for use only with a Futura+ with a 0-1 or 4-20mA Analog Output module.
• After connecting to the Futura+ device, on the menu bar, select Tools and click the Futura+ Analog Output Programmer button. Use the above screen to assign channels to analog outputs and calibrate and test analog outputs. For more information, see the Futura+ Installation and Operation Manual. The procedure for using this screen follows:
1. Select a port (or channel).
2. Assign a function to the port (using the Change Port Function button).
3. Save the setting. You will receive a messge that the command has been sent successfully.
4. Using an ammeter, calibrate (adjust) the port.
e Electro Industries/GaugeTech Doc # E107707 5-95

5. Verify the calibration (an external portable DC ammeter must be correctly connected to the port to view the results).
A. Select a port to test.B. Select the test type from the Test Mode List Box. This selection will be used by all
ports until another test mode is selected. In other words, if you select Low-End Output, all channels will output the low end of the scale.
Low End Output (-1 or 4mA)Bidirectional, -1mA (Ports 0 through 2)Unidirectional, omA (Ports 3 through 9)
Midpoint Output (0 or 12mA)Bidirectional, 0mA (Ports 0 through 2)Bidirectional, .5mA (Ports 3 through 9)
High-End Output (1 or 20mA)
WARNING! The Futura+ will not leave Test Mode until you terminate it by selecting anotheroption (Save or Port) or exiting.
Ports and Functions
• The function assigned to each port is indicated on the left side of the screen. To alter the function of a port:
1. Select a Port (P0 though P9).
2. Select a function (Volts AN, BN, CN, AB, BC, or CA; Amps A, B, C or N, Watts Unidirectional or Bidirectional, VAR Unidirectional or Bidirectional; VA; Power Factor or Frequency 60 Hz or 50 Hz).
3. Click a Change Port Function button.
NOTE: Only one frequency (either 50 or 60Hz) can be assigned at any given time.
NOTE: Be sure to assign the Power Factor and Frequency functions to Bidirectional ports(Ports 0 through 2).
Adjustments (Calibration)
• High End (Coarse and Fine) and Low End (Coarse and Fine) adjustments are usually done on a bench using a calibrated DC ammeter.
• The Adjustment buttons are arranged in two sets (high and low end) of Up and Down arrows.
High End = 1mA (or 20mA).Low End = 0mA (Unidirectional), -1mA (Bidirectional) or 4mA.
e Electro Industries/GaugeTech Doc # E107707 5-96
• Each set of Adjustment buttons has Coarse and Fine Adjustments.
Click Up to increase the adjustment or Down to decrease it.Alternatively, us the PgUp/PgDn and Up and Down arrows on the keyboard to make these adjustments.
• Once you have made an adjustment, you will receive the message:
“Coarse (or Fine) increase (or decrease) at High (or Low) End Command sent successfully.”
NOTE: Once you have finished calibrating the port, be sure to save the settings.
Auto Program
WARNING! Before you use this function, please contact EIG for more information.
From the list box, select 10 channels (1 or 20mA) to recalibrate the Futura+ to factory values.
Volt Setting (Back Module)
Match this setting to the label on the DSP (power) module connected to the Futura+. From the listbox, select 75V (Suffix L), 120V (Suffix 120) or 300V (Suffix G).
Editing and Saving Calibration Settings
• Undo All: If you have made changes to this screen but have not yet sent the changes to the Futura+ (by clicking Save), click Undo All to revert to the previously saved settings.
• Save: Click Save to update the Futura+ with the new settings and sdjustments. Once you receive the message “Command sent successfully,” click Exit.
• Exit: Click Exit to leave the Output Calibration screen. When you are prompted to save any changes before you exit, click OK. (If you neglected to save the new settings, click Cancel. When you’re back in the EIG Device Programmer screen, click Save.)
e Electro Industries/GaugeTech Doc # E107707 5-97

E Electro Industries/Gauge Tech Doc# E107707 5-98
This page intentionally left blank.

Doc# E107707 6 - 1
6: Total Web Solutions
Electro Industries/GaugeTechThe Leader In Power Monitoring and Smart Grid SolutionsElectro Industries/GaugeTechThe Leader In Power Monitoring and Smart Grid Solutions
6: Total Web Solutions
6.1: Overview
Electro Industries/GaugeTech’s Total Web SolutionsTM (TWSTM) is a fully customizable
Web server, providing access to real-time data via Internet Explorer. TWS has an open
design that allows you to communicate with devices through a variety of open proto-
cols. The system incorporates highly programmable network cards with built-in mem-
ory that are installed in meters with the 10/100BaseT Option. The Network cards can
be programmed to perform an extensive array of monitoring functions.
NOTE: A Nexus® meter with the INP10 Option does not support Total Web
SolutionsTM. The other Network cards - INP100/INP102/INP200/INP202/INP100S offer
various TWSTM options. Not all of the components are available with all of the Network
cards. Refer to Appendix F for more information.
6.2: System Components
TWSTM is made up of the following components. For flow charts of the components,
see sections 6.11-6.13. For the available components for each of the Network cards,
refer to the comparison charts in Appendix F.
• WebExplorerTM: This component utilizes your Web browser to provide you with
direct access to all power data. Using your browser, you can access any data file.
And, because it looks like a standard HTML webpage to an IT department, the data
transmits through corporate firewalls. This fully configurable component allows you
to customize your own SCADA quality webpages, graphics and configurations via an
FTP Server and/or FTP Client. The main Default webpage is shown on the next
page. This is just an example, because the webpages for your data may be
changed or created to your specifications and needs. To access the meter through
the Web, just type the IP address of the Network card into your browser’s address
bar.
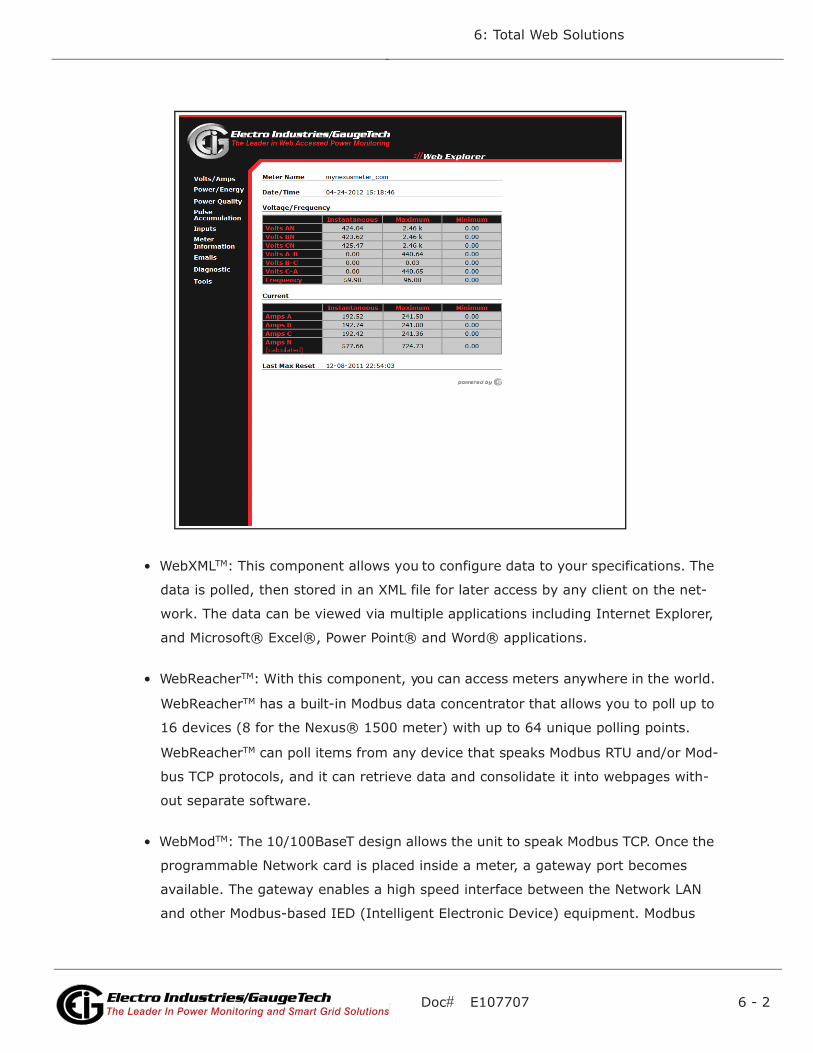
Doc# E107707 6 - 2
6: Total Web Solutions
Electro Industries/GaugeTechThe Leader In Power Monitoring and Smart Grid SolutionsElectro Industries/GaugeTechThe Leader In Power Monitoring and Smart Grid Solutions
• WebXMLTM: This component allows you to configure data to your specifications. The
data is polled, then stored in an XML file for later access by any client on the net-
work. The data can be viewed via multiple applications including Internet Explorer,
and Microsoft® Excel®, Power Point® and Word® applications.
• WebReacherTM: With this component, you can access meters anywhere in the world.
WebReacherTM has a built-in Modbus data concentrator that allows you to poll up to
16 devices (8 for the Nexus® 1500 meter) with up to 64 unique polling points.
WebReacherTM can poll items from any device that speaks Modbus RTU and/or Mod-
bus TCP protocols, and it can retrieve data and consolidate it into webpages with-
out separate software.
• WebModTM: The 10/100BaseT design allows the unit to speak Modbus TCP. Once the
programmable Network card is placed inside a meter, a gateway port becomes
available. The gateway enables a high speed interface between the Network LAN
and other Modbus-based IED (Intelligent Electronic Device) equipment. Modbus

Doc# E107707 6 - 3
6: Total Web Solutions
Electro Industries/GaugeTechThe Leader In Power Monitoring and Smart Grid SolutionsElectro Industries/GaugeTechThe Leader In Power Monitoring and Smart Grid Solutions
TCP is an industry-proven open protocol that can be easily integrated with any
other software or hardware.
• WebAlarmTM: With this component, Real Time email alerts are sent via the Internet
to up to 9 recipients simultaneously for any combination of event notifications.
Email format can be Short Format or Long Format: Short Format is for cellphones
with text messaging service; Long Format provides detailed alarm conditions for
any devices with full email support (computers, PDAs, cell-phones).
6.3: Hardware Connection
The 10/100BaseT Network cards installed in an EIG meter give it the ability to connect
to a network through an Ethernet LAN or the Internet via Modbus TCP, HTTP, SMTP,
FTP and/or DHCP. The 10/100BaseT Network cards can auto detect the cable type,
and work with either straight or crossover cable. Refer to your meter’s Installation
and Operation manual for connection details.
6.4: Initial Configuration
Connect to the meter through a Network connection, as shown in Chapter 2. The
Factory set IP address for the Network cards except that of the second Nexus® 1500
meter Network card, is 10.0.0.1; the Factory set IP address for the Nexus® 1500
meter’s second Network card is 10.0.1.1. If the IP address has been changed and you
do not know the new address, connect to the meter’s serial port and program the Net-
work card parameters in the Communications settings of the Device Profile. See
Chapter 3 (1250/1252), Chapter 4(1262/1272), Chapter 5 (Shark® 200), and Chap-
ter 19 (1500) for details.
6.5: Basic Configuration Details
Setting up the 10/100BaseT Option consists of configuring the Web connection and
the Advanced Network Card screens so that you can access the data you need from
the Web. Once the initial configuration is set, you will not need software, unless you
want to make changes to the configuration. With the basic setup, you will be able to
access the TWS default screens, which display a variety of Real Time Readings. You
also have the option of customizing your screens (see Section 6.7). In order for the
Web to access the data from a meter, the meter must have an IP address. An IP
address is a number (typically written as four numbers separated by periods, i.e.
1.3.5.7) which uniquely identifies a computer that uses the Internet. An IP address
can be assigned by using a DHCP Server or it can be entered manually.

Doc# E107707 6 - 4
6: Total Web Solutions
Electro Industries/GaugeTechThe Leader In Power Monitoring and Smart Grid SolutionsElectro Industries/GaugeTechThe Leader In Power Monitoring and Smart Grid Solutions
NOTE: For manual IP address setting, see Communications Setting instructions in
Chapter 3 (1250/1252), Chapter 4 (1262/1272), Chapter 5 (Shark® 200) and Chap-
ter 19 (1500).
6.5.1: DHCP (Not available in all meters - see Appendix F)
DHCP (Dynamic Host Configuration Protocol) was created by IETF (Internet Engineer-
ing Task Force) to enable individual computers on an IP network to extract their con-
figurations from a server (the “DHCP Server”) or servers, that have no exact
information about the individual computers until they request the information. The
DHCP Server “leases” the IP address to the DHCP Client for a period of time from 15
minutes to a year. More information can be found in the Internet RFCs (Request for
Comments) regarding available servers and technical details.
NOTE: In DHCP Mode, if a NACK message is received from the DHCP server, the Net-
work card stops all Ethernet activities immediately and starts a new DHCP process.
1. From the Communicator EXT Main screen
a. Click the Device Profile icon.
b. Click General Settings>Communications.
c. Click on one of the Ports to open the Communications Settings screen.
d. Click Advanced Settings.
e. Click DHCP tab. You will see the screen shown below.

Doc# E107707 6 - 5
6: Total Web Solutions
Electro Industries/GaugeTechThe Leader In Power Monitoring and Smart Grid SolutionsElectro Industries/GaugeTechThe Leader In Power Monitoring and Smart Grid Solutions
f. Click Enable DHCP.
2. Access a working DHCP Server. DHCP Servers automatically assign an IP address
and Subnet Mask. Some DHCP Servers, allow you to assign a Default Gateway IP
(DHCP Option #3), DNS IP (DHCP Option #6) and SMTP Server IP (DHCP Option
#69) to the meter. If your DHCP Server does not let you assign parameters other
than the IP address, enter those values manually. See Section 6.6 for instructions.
3. Click OK to close this screen.
6.5.2: Gateway Settings
Follow these steps to configure the Ethernet Gateway. Port 2 is the Gateway port for
the Nexus® 1250/1252/1500 meters; Port 3 is the Gateway port for the Nexus®
1262/1272 meters. If your meter has the INP102/202 Combo card, the Gateway and
Modem share the Gateway port.
1. From the Communicator EXT Main screen:
a. Click the Device Profile icon.
b. Click General Settings>Communications. You will see the Communications Set-
tings screen. The Ethernet Gateway information is entered in the section below
the Advanced Settings button. See the screen shown below.
GatewaySettings

Doc# E107707 6 - 6
6: Total Web Solutions
Electro Industries/GaugeTechThe Leader In Power Monitoring and Smart Grid SolutionsElectro Industries/GaugeTechThe Leader In Power Monitoring and Smart Grid Solutions
2. Select Baud Rate from the pull-down menu. Make sure any devices using this Gate-
way have the same Baud Rate.
3. Enter a number in the Delay field. This number will be multiplied by 15 milliseconds
to arrive at the Delay time that will be applied to the gateway.
NOTE: You only need to enter a Delay time if the device you are connecting to
needs additional response time, i.e., is a slower device like a radio modem.
4. Click OK to save the settings.
6.6: Advanced Features
NOTE: Not all of these features are available for all meters. See Appendix F.
1. From the Communicator EXT Main screen:
a. Click the Device Profile icon.
b. Click General Settings>Communications.
c. Click the Advanced Settings button. You will see the Advanced Network Settings
Options screen. The following sections provide information about each of the
settings, available by clicking the tabs at the top of the screen.
6.6.1: Services & Security
1. Click the Services tab.

Doc# E107707 6 - 7
6: Total Web Solutions
Electro Industries/GaugeTechThe Leader In Power Monitoring and Smart Grid SolutionsElectro Industries/GaugeTechThe Leader In Power Monitoring and Smart Grid Solutions
2. Check the boxes in front of the listed Services to Enable the features you want.
NOTES:
• The Nexus® 1500 meter does not use Sleep mode.
• Block Password is only available for Nexus® 12xx meters.
• Network card security is a different than meter security. See Chapter 12 for
details on meter security.
3. Click OK to save your settings or continue to the next section.
6.6.2: Computer Name/DNS
1. Click the Computer Name/DNS tab.
2. Enter the Computer Name (optional). This allows you to access the meter by name,
if there is a DNS Server working in conjunction with the DHCP Server. See your
network administrator and the servers’ User manuals for further details. The
Default Computer Name is EIGNET_XXXXXX where the X’s are the last 3 octets of
the MAC address.
3. Enter the IP addresses for Domain Name Servers 1 and 2.
4. Click OK to save your settings or continue to the next section.

Doc# E107707 6 - 8
6: Total Web Solutions
Electro Industries/GaugeTechThe Leader In Power Monitoring and Smart Grid SolutionsElectro Industries/GaugeTechThe Leader In Power Monitoring and Smart Grid Solutions
6.6.3: GE Protocol (EGD)- See Appendix F for Detailed Information
NOTE: For the Nexus® 1500 meter, only Network Card 1 supports GE EGD.
1. Click the Services tab. Click the checkbox next to GE EGD Data Port Server.
2. Click the GE Protocol (EGD)tab.
3. The settings you make in this screen support your use of GE’s EGD Protocol:
• Enter the IP address
• Select Connection type
• Enter Update interval
• Select the Product identifier
4. Click OK to save your settings or continue to the next section.

Doc# E107707 6 - 9
6: Total Web Solutions
Electro Industries/GaugeTechThe Leader In Power Monitoring and Smart Grid SolutionsElectro Industries/GaugeTechThe Leader In Power Monitoring and Smart Grid Solutions
6.6.4: WebAlarmTM/Email (Not available in all meters - see Appendix F)
This feature enables email when an alarm condition occurs. Settings for one email are
configured in the Alarm/Email tab of the Advanced Network Card settings. An addi-
tional 8 email addresses can be configured in the poll_profile.xml file (Nexus® 12xx
or Shark® meters) or pprofile.xml file in the directory \C\TWS\ (Nexus® 1500
meter).
NOTE: For the Nexus® 1500 meter, when both Network cards are installed, email can
be sent from either card. Generally, the email is sent out on the first network card
that has a working path to the gateway IP.
Example 1:
Network card 1: IP=192.168.0.2, mask=255.255.255.0, gateway=192.168.0.1
Network card 2: IP=192.168.0.3, mask=255.255.255.0, gateway=192.168.0.1
Email will be sent out on Network card 1.
Example 2:
Network card 1: IP=192.168.0.5, mask=255.255.255.0, gateway=0.0.0.0
Network card 2: IP=192.168.0.3, mask=255.255.255.0, gateway=192.168.0.1
Email will be sent out on Network card 2.
1. Click the Services tab. Enable/Disable the sending of email by clicking Alarm Gen-
erated Email. The Initial Setting if Off, indicated by the empty check box.
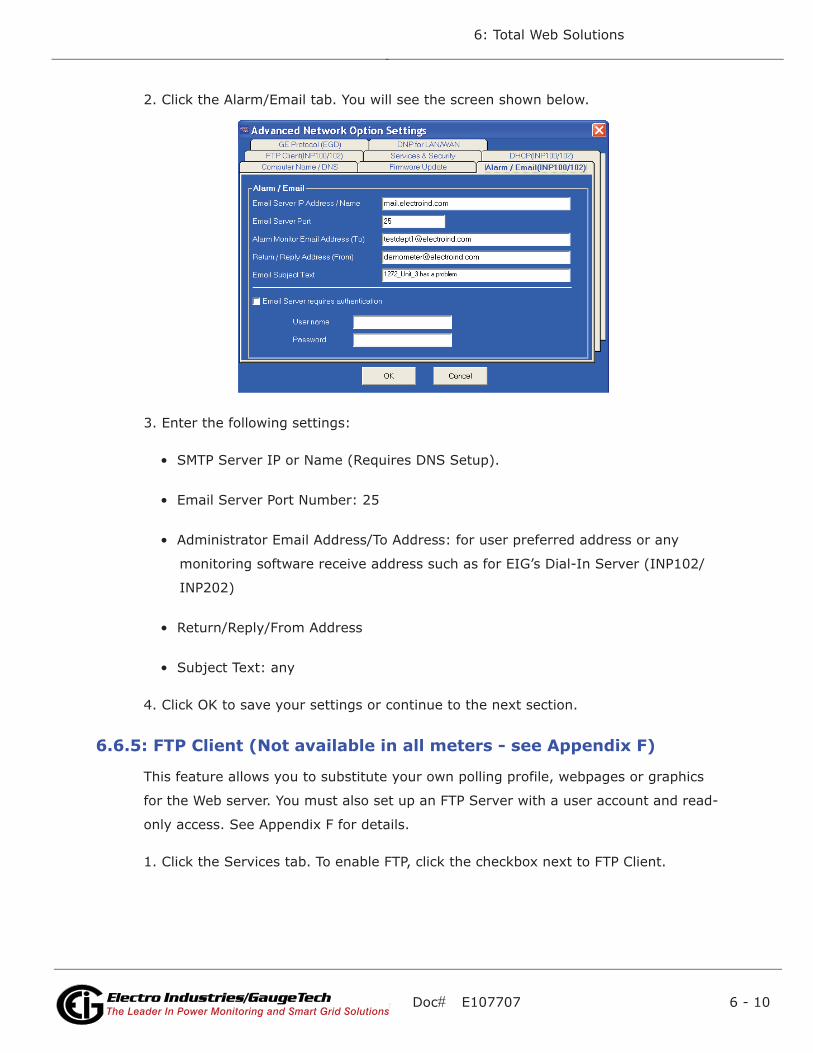
Doc# E107707 6 - 10
6: Total Web Solutions
Electro Industries/GaugeTechThe Leader In Power Monitoring and Smart Grid SolutionsElectro Industries/GaugeTechThe Leader In Power Monitoring and Smart Grid Solutions
2. Click the Alarm/Email tab. You will see the screen shown below.
3. Enter the following settings:
• SMTP Server IP or Name (Requires DNS Setup).
• Email Server Port Number: 25
• Administrator Email Address/To Address: for user preferred address or any
monitoring software receive address such as for EIG’s Dial-In Server (INP102/
INP202)
• Return/Reply/From Address
• Subject Text: any
4. Click OK to save your settings or continue to the next section.
6.6.5: FTP Client (Not available in all meters - see Appendix F)
This feature allows you to substitute your own polling profile, webpages or graphics
for the Web server. You must also set up an FTP Server with a user account and read-
only access. See Appendix F for details.
1. Click the Services tab. To enable FTP, click the checkbox next to FTP Client.
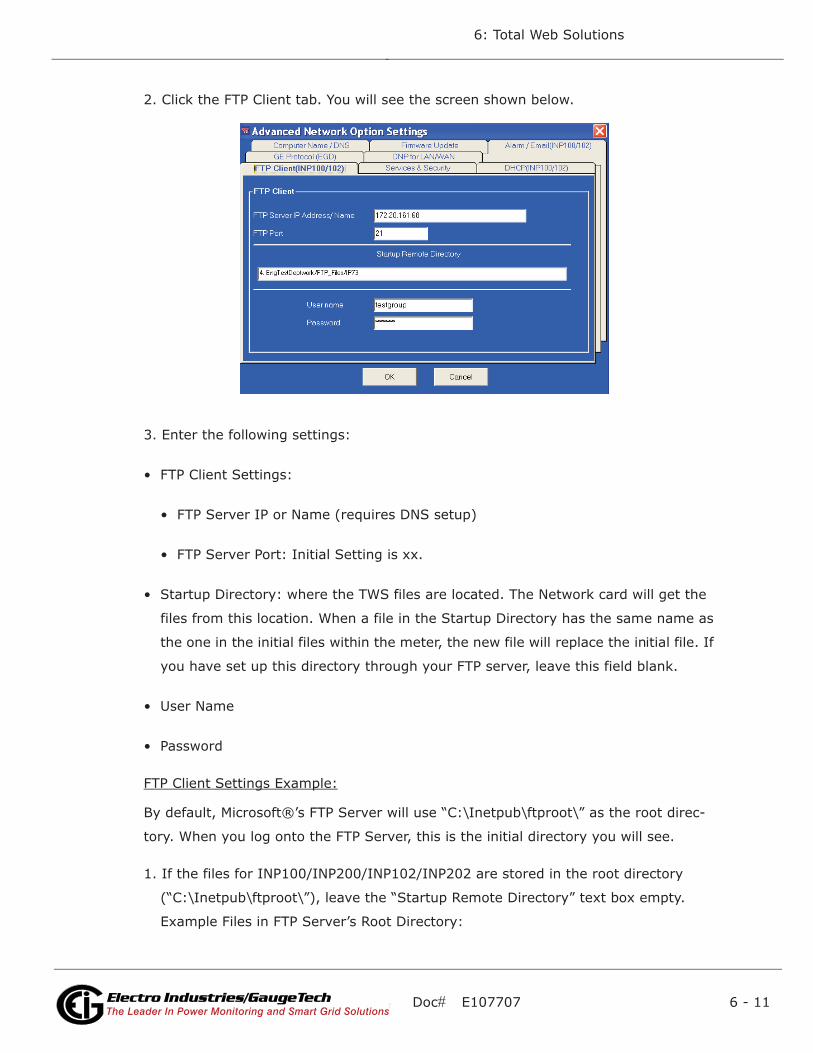
Doc# E107707 6 - 11
6: Total Web Solutions
Electro Industries/GaugeTechThe Leader In Power Monitoring and Smart Grid SolutionsElectro Industries/GaugeTechThe Leader In Power Monitoring and Smart Grid Solutions
2. Click the FTP Client tab. You will see the screen shown below.
3. Enter the following settings:
• FTP Client Settings:
• FTP Server IP or Name (requires DNS setup)
• FTP Server Port: Initial Setting is xx.
• Startup Directory: where the TWS files are located. The Network card will get the
files from this location. When a file in the Startup Directory has the same name as
the one in the initial files within the meter, the new file will replace the initial file. If
you have set up this directory through your FTP server, leave this field blank.
• User Name
• Password
FTP Client Settings Example:
By default, Microsoft®’s FTP Server will use “C:\Inetpub\ftproot\” as the root direc-
tory. When you log onto the FTP Server, this is the initial directory you will see.
1. If the files for INP100/INP200/INP102/INP202 are stored in the root directory
(“C:\Inetpub\ftproot\”), leave the “Startup Remote Directory” text box empty.
Example Files in FTP Server’s Root Directory:
Doc# E107707 6 - 12
6: Total Web Solutions
Electro Industries/GaugeTechThe Leader In Power Monitoring and Smart Grid SolutionsElectro Industries/GaugeTechThe Leader In Power Monitoring and Smart Grid Solutions
• ”C:\Inetpub\ftproot\index.htm”
• ”C:\Inetpub\ftproot\poll_profile.xml”
• ”C:\Inetpub\ftproot\logo.gif”
When INP100/INP200/INP102/INP202 starts up, it will check to see what files are in
the server’s directory and will download all of them.
2. If the files for INP100/INP200/INP102/INP202 are stored in a subdirectory in the
root directory, such as “C:\Inetpub\ftproot\nexus_meters\feeder_12345\”, put
“nexus_meters/feeder_12345” in the “Startup Remote Directory” text box. Note
the different “/” between directory names. When INP100/INP200/INP102/INP202
starts up, it will check for all files in the server’s directory (“nexus_meters/
feeder_12345”) and download all files found there. If there is another subdirectory
inside this directory that is not listed in the server’s directory as above, such as
“C:\Inetpub\ftp-root\ nexus_meters \feeder_12345\info\”, INP100/INP200/
INP102/INP202 will not locate that subdirectory and no files will be downloaded
from that subdirectory to INP100/INP200/INP102/INP202. This may cause an error
during the file downloading process and the system may not enter its normal oper-
ating mode until the subdirectory is removed from the server.
3. The user should always check the FTP server to ensure it is configured properly. To
do this, open the IE browser window and enter the correct address in the URL win-
dow. The standard format is: “ftp://[username]:[password]@[ip_address]”.
Example:
“ftp://john:[email protected]” where John is the user name and 1a2b3c is the
password.
4. Click OK to save your settings or continue to the next section.
6.6.6: INP102/INP202 Ethernet/Modem Combination
INP102/INP202 is an extension of INP100/INP200. It has all the features of an
INP100/INP200, plus a built-in modem.The communication protocol supported by the
modem is Modbus ASCII; the communication protocol supported by the RS485 Ether-
net/Modem gateway port is Modbus RTU. The INP102/INP202 converts all Modbus
ASCII incoming modem requests to Modbus RTU for internal and gateway communi-
cation, then it converts all response Modbus RTU messages into Modbus ASCII proto-
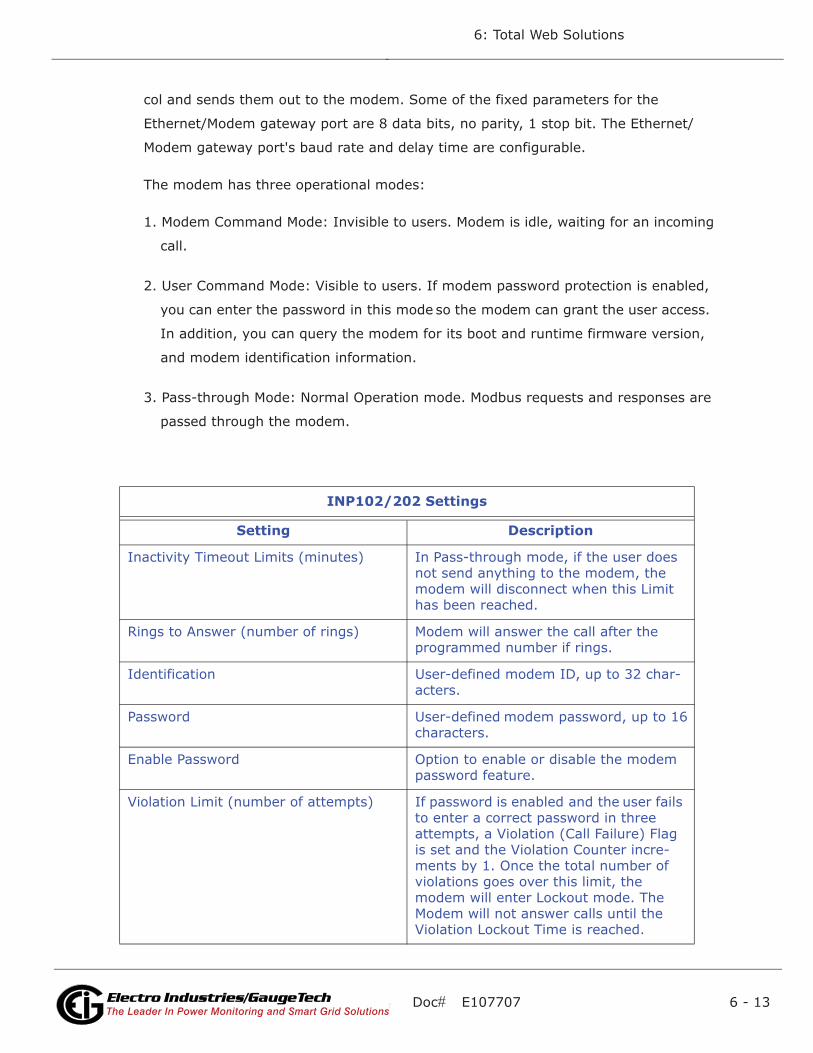
Doc# E107707 6 - 13
6: Total Web Solutions
Electro Industries/GaugeTechThe Leader In Power Monitoring and Smart Grid SolutionsElectro Industries/GaugeTechThe Leader In Power Monitoring and Smart Grid Solutions
col and sends them out to the modem. Some of the fixed parameters for the
Ethernet/Modem gateway port are 8 data bits, no parity, 1 stop bit. The Ethernet/
Modem gateway port's baud rate and delay time are configurable.
The modem has three operational modes:
1. Modem Command Mode: Invisible to users. Modem is idle, waiting for an incoming
call.
2. User Command Mode: Visible to users. If modem password protection is enabled,
you can enter the password in this mode so the modem can grant the user access.
In addition, you can query the modem for its boot and runtime firmware version,
and modem identification information.
3. Pass-through Mode: Normal Operation mode. Modbus requests and responses are
passed through the modem.
INP102/202 Settings
Setting Description
Inactivity Timeout Limits (minutes) In Pass-through mode, if the user does not send anything to the modem, the modem will disconnect when this Limit has been reached.
Rings to Answer (number of rings) Modem will answer the call after the programmed number if rings.
Identification User-defined modem ID, up to 32 char-acters.
Password User-defined modem password, up to 16 characters.
Enable Password Option to enable or disable the modem password feature.
Violation Limit (number of attempts) If password is enabled and the user fails to enter a correct password in three attempts, a Violation (Call Failure) Flag is set and the Violation Counter incre-ments by 1. Once the total number of violations goes over this limit, themodem will enter Lockout mode. The Modem will not answer calls until the Violation Lockout Time is reached.
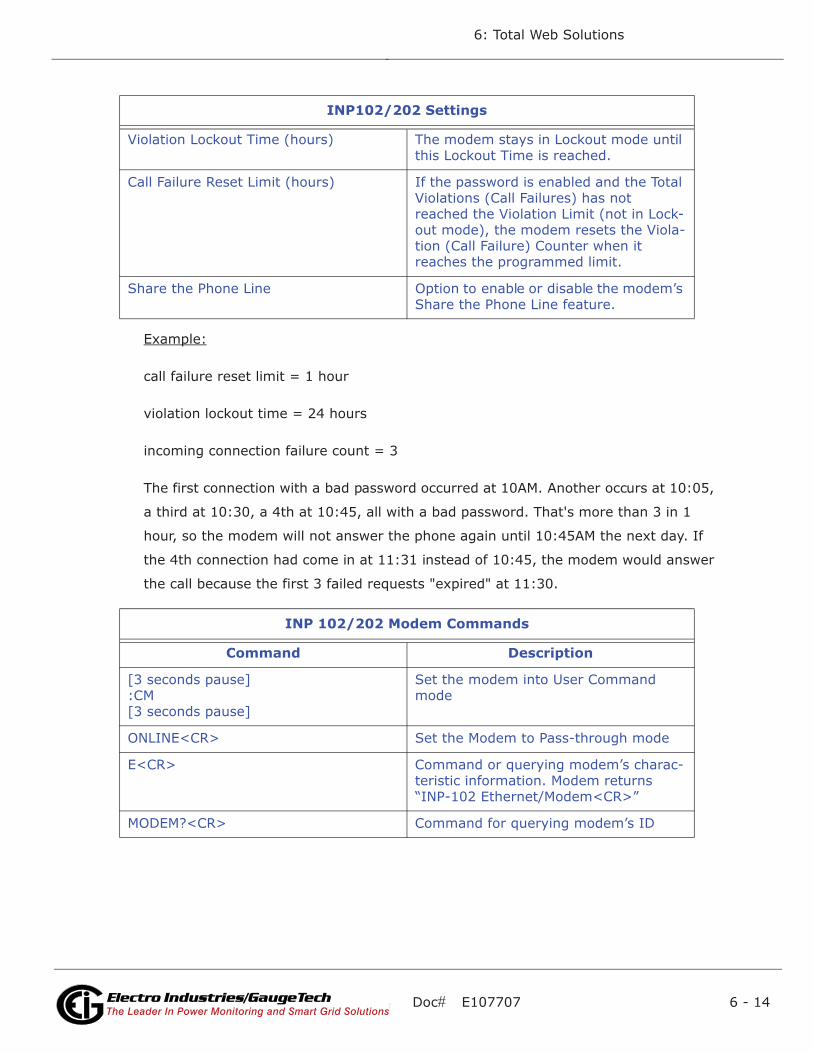
Doc# E107707 6 - 14
6: Total Web Solutions
Electro Industries/GaugeTechThe Leader In Power Monitoring and Smart Grid SolutionsElectro Industries/GaugeTechThe Leader In Power Monitoring and Smart Grid Solutions
Example:
call failure reset limit = 1 hour
violation lockout time = 24 hours
incoming connection failure count = 3
The first connection with a bad password occurred at 10AM. Another occurs at 10:05,
a third at 10:30, a 4th at 10:45, all with a bad password. That's more than 3 in 1
hour, so the modem will not answer the phone again until 10:45AM the next day. If
the 4th connection had come in at 11:31 instead of 10:45, the modem would answer
the call because the first 3 failed requests "expired" at 11:30.
Violation Lockout Time (hours) The modem stays in Lockout mode until this Lockout Time is reached.
Call Failure Reset Limit (hours) If the password is enabled and the Total Violations (Call Failures) has not reached the Violation Limit (not in Lock-out mode), the modem resets the Viola-tion (Call Failure) Counter when it reaches the programmed limit.
Share the Phone Line Option to enable or disable the modem’s Share the Phone Line feature.
INP 102/202 Modem Commands
Command Description
[3 seconds pause]:CM[3 seconds pause]
Set the modem into User Command mode
ONLINE<CR> Set the Modem to Pass-through mode
E<CR> Command or querying modem’s charac-teristic information. Modem returns“INP-102 Ethernet/Modem<CR>”
MODEM?<CR> Command for querying modem’s ID
INP102/202 Settings
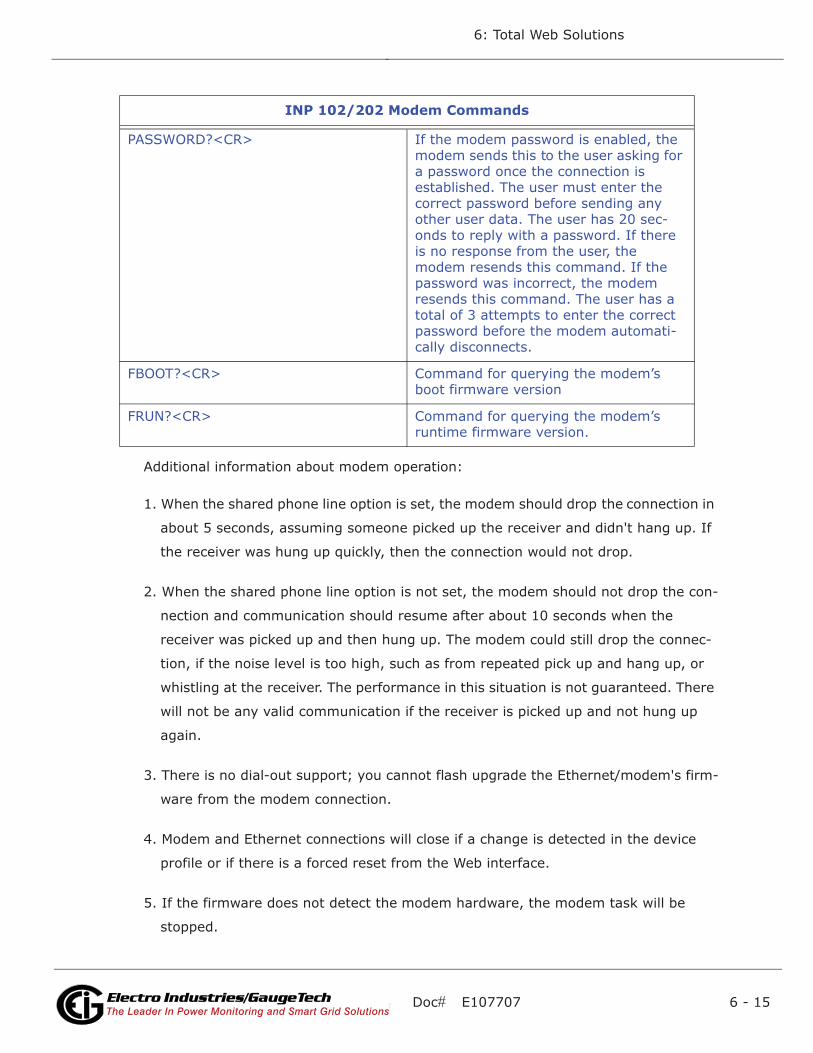
Doc# E107707 6 - 15
6: Total Web Solutions
Electro Industries/GaugeTechThe Leader In Power Monitoring and Smart Grid SolutionsElectro Industries/GaugeTechThe Leader In Power Monitoring and Smart Grid Solutions
Additional information about modem operation:
1. When the shared phone line option is set, the modem should drop the connection in
about 5 seconds, assuming someone picked up the receiver and didn't hang up. If
the receiver was hung up quickly, then the connection would not drop.
2. When the shared phone line option is not set, the modem should not drop the con-
nection and communication should resume after about 10 seconds when the
receiver was picked up and then hung up. The modem could still drop the connec-
tion, if the noise level is too high, such as from repeated pick up and hang up, or
whistling at the receiver. The performance in this situation is not guaranteed. There
will not be any valid communication if the receiver is picked up and not hung up
again.
3. There is no dial-out support; you cannot flash upgrade the Ethernet/modem's firm-
ware from the modem connection.
4. Modem and Ethernet connections will close if a change is detected in the device
profile or if there is a forced reset from the Web interface.
5. If the firmware does not detect the modem hardware, the modem task will be
stopped.
PASSWORD?<CR> If the modem password is enabled, the modem sends this to the user asking for a password once the connection is established. The user must enter the correct password before sending any other user data. The user has 20 sec-onds to reply with a password. If there is no response from the user, the modem resends this command. If the password was incorrect, the modem resends this command. The user has a total of 3 attempts to enter the correct password before the modem automati-cally disconnects.
FBOOT?<CR> Command for querying the modem’s boot firmware version
FRUN?<CR> Command for querying the modem’s runtime firmware version.
INP 102/202 Modem Commands
Doc# E107707 6 - 16
6: Total Web Solutions
Electro Industries/GaugeTechThe Leader In Power Monitoring and Smart Grid SolutionsElectro Industries/GaugeTechThe Leader In Power Monitoring and Smart Grid Solutions
6. A modem status/diagnostic webpage can be found at/diag_modem.htm.
6.6.7: DNP for LAN/WAN
The original DNP 3.0 was designed for serial point-to-point communication (e.g.
RS232) with limited support for half duplex serial networks (e.g. RS485). In order for
devices to exchange DNP messages in a local (LAN) and/or wide area network (WAN),
one must either augment the protocol to support a network environment or use an
existing network transport mechanism. DNP 3.0 LAN/WAN was specifically defined for
transporting DNP traffic on the Internet Protocol Suite.
EIG's DNP 3.0 LAN/WAN implementation was based on the specifications described in
DNP3 Specification, Volume 7, Networking, according to the Version 2.0 Draft E of
March 12, 2004. The official DNP 3.0 specifications can be found at www.dnp.org.

Doc# E107707 6 - 17
6: Total Web Solutions
Electro Industries/GaugeTechThe Leader In Power Monitoring and Smart Grid SolutionsElectro Industries/GaugeTechThe Leader In Power Monitoring and Smart Grid Solutions
DNP Parameters (Settings in BOLD are default for Standard Mode)
Name Settings Notes
DNP over TCP EnabledDisabled
If set to Enabled, network Card will receive DNP over TCP requests.
DNP over TCP listen on port 20000(User Defined)
TCP listening port
DNP over UDP EnabledDisabled
If set to Enabled, Network Card will receive DNP over UDP requests.
DNP over UDP listen on port 20000(User Defined)
UDP listening port
UDP respond to Client Port(UserDefined)
If set to Client Port, UDP response will be sent to the UDP Request Port. Otherwise, UDP Response will be sent to a User Defined Port Number. Default is fixed at 20000.
UDP addressing UnicastBroadcastUnicast &Broadcast
If set to Unicast & Broadcast, all UDP requests are accepted.If set to Unicast, Network Card will check to see if the UDP Destination address matches the meter’s IP address.If set to Broadcast, Network Card will check to see if the UDP Destination address is 255.255.255.255.If no match, the UDP connection is refused.
Validate source IPs ValidationDisabled1 IP Address2 to 4 IPAddresses
If set to Disabled, Network Card will not perform Val-idation on any incoming IP Addresses.If set to 1 to 4, Network Card will perform Validations on every IP address defined by user.
Validate source ports NoYes
If set to No, Network Card will not perform Valida-tions on incoming TCP and UDP Ports for a given IP address.
IP addresses (User Defined)
Up to 4 IP addresses to Validate.
Subnet mask (User Defined)
Masking bits applied to IP address. When defined properly, user can specify Validation on a single IP address, or a range of IP addresses.
TCP ports, start and end (User Defined)
TCP Port Range to be validated.
UDP ports, start and end (User Defined)
UDP Port Range to be validated.

Doc# E107707 6 - 18
6: Total Web Solutions
Electro Industries/GaugeTechThe Leader In Power Monitoring and Smart Grid SolutionsElectro Industries/GaugeTechThe Leader In Power Monitoring and Smart Grid Solutions
EIG's DNP 3.0 LAN/WAN feature is available for Nexus® meters with INP100/INP102/
INP200/INP202 Network Cards. To use this feature, you must configure the Nexus®
meter's DNP Custom Classes Map in the meter's Device Profile.
See chapters 3 (1250/1252), 4 (1262/1272), and 19 (1500) of this manual for config-
uration screens and details.
1. Click the DNP for LAN/WAN tab. You will see the screen shown below.
• Mode of operations (at top of screen):
• Disabled: Feature is disabled, no DNP 3.0 LAN/WAN communication will be
accepted.
• Standard: Feature is enabled. Most communication parameters are fixed, except
the port number to which the UDP packets respond. Security features are not
available.
• Manual: Feature is enabled. All communication parameters are configurable.
Security features are available.
• For meters other than the Nexus® 1500, a single DNP Over TCP connection and a
single DNP Over UDP connection is available when enabled; the 1500 has two DNP
over TCP connections and one DNP over UDP connection. While DNP Over TCP con-
nections may be closed at the decision of the Network Card, the master Nexus®
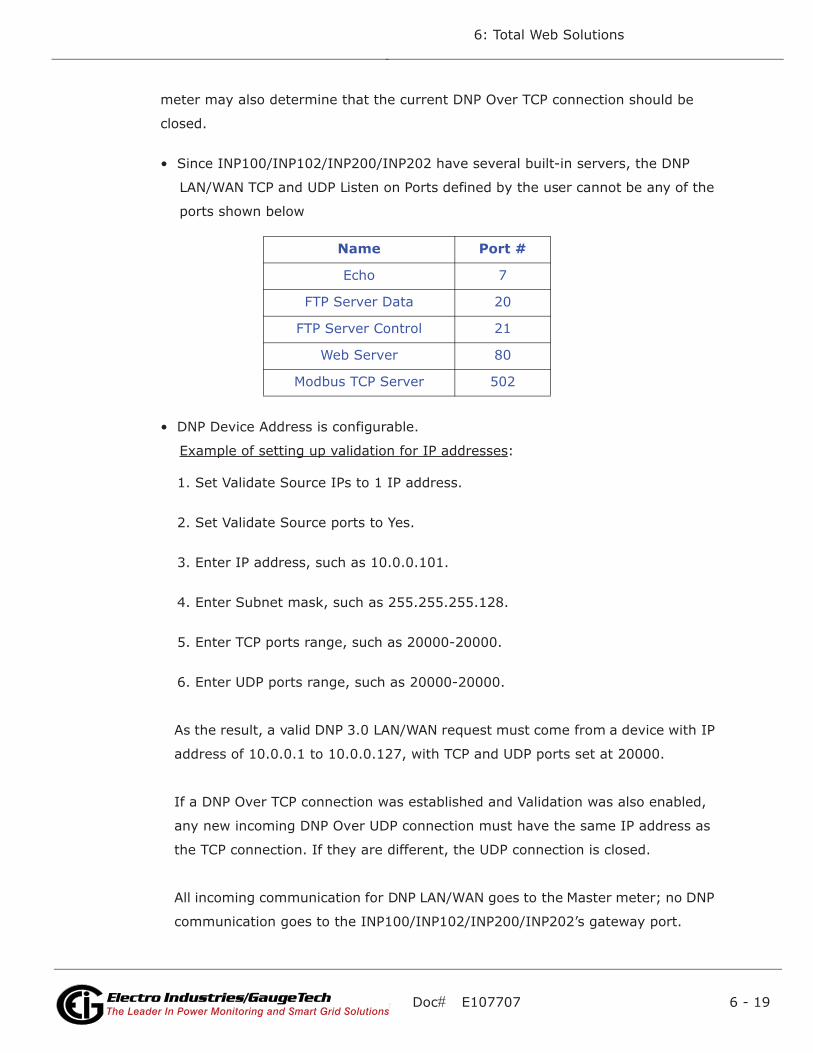
Doc# E107707 6 - 19
6: Total Web Solutions
Electro Industries/GaugeTechThe Leader In Power Monitoring and Smart Grid SolutionsElectro Industries/GaugeTechThe Leader In Power Monitoring and Smart Grid Solutions
meter may also determine that the current DNP Over TCP connection should be
closed.
• Since INP100/INP102/INP200/INP202 have several built-in servers, the DNP
LAN/WAN TCP and UDP Listen on Ports defined by the user cannot be any of the
ports shown below
• DNP Device Address is configurable.
Example of setting up validation for IP addresses:
1. Set Validate Source IPs to 1 IP address.
2. Set Validate Source ports to Yes.
3. Enter IP address, such as 10.0.0.101.
4. Enter Subnet mask, such as 255.255.255.128.
5. Enter TCP ports range, such as 20000-20000.
6. Enter UDP ports range, such as 20000-20000.
As the result, a valid DNP 3.0 LAN/WAN request must come from a device with IP
address of 10.0.0.1 to 10.0.0.127, with TCP and UDP ports set at 20000.
If a DNP Over TCP connection was established and Validation was also enabled,
any new incoming DNP Over UDP connection must have the same IP address as
the TCP connection. If they are different, the UDP connection is closed.
All incoming communication for DNP LAN/WAN goes to the Master meter; no DNP
communication goes to the INP100/INP102/INP200/INP202’s gateway port.
Name Port #
Echo 7
FTP Server Data 20
FTP Server Control 21
Web Server 80
Modbus TCP Server 502

Doc# E107707 6 - 20
6: Total Web Solutions
Electro Industries/GaugeTechThe Leader In Power Monitoring and Smart Grid SolutionsElectro Industries/GaugeTechThe Leader In Power Monitoring and Smart Grid Solutions
2. Click OK to save your settings.
6.7: Customizing Screens
6.7.1: Configuring WebExplorerTM
All polled data for the Nexus® 12xx and the Shark® 200 meters is stored in an XML
file, poll_data.xml. All polled data for the Nexus® 1500 meter is stored in an XML file
called pdata.xml. Each polled item is located in its DEVICE_x section as it is pro-
grammed in the poll_profile.xml file. The standard data format for each device is:
<DEV_NAME> <DEV_TYPE>
up to 64 <items>, each with its D_UID, D_LABEL and D_VALUE.
This XML file can be viewed directly in your browser (click View>Source). To display it
on a customized webpage, you must set up your browser to run Java Script. (Config-
uring XML is detailed in Section 6.6.2.)
NOTES:
• Auto Refresh Rate is set in the Set Timeout ()Function. See the Java Script example
for Internet Explorer, below.
• Java Script code or implementation methods may vary for other types of web
browsers. The webpage files currently support 4 type of browers: IE, FireFox,
Safari, and Chrome. You can view the code in each file once it is downloaded from
the meter to your PC.
Example of the data file:
<?xml version=”1.0” encoding=”UTF-8”?>
<!--Electro Industries/GaugeTech embedded network server polled data-->
<EIG_DATA>
<EIG_SYSTEM>
</EIG_SYSTEM>
<DEVICE_1>
<DEV_NAME>Nexus Demo 1</DEV_NAME>
<DEV_TYPE>Nexus 1250</DEV_TYPE>

Doc# E107707 6 - 21
6: Total Web Solutions
Electro Industries/GaugeTechThe Leader In Power Monitoring and Smart Grid SolutionsElectro Industries/GaugeTechThe Leader In Power Monitoring and Smart Grid Solutions
<item D_UID=”1_1” D_LABEL=”Inst Van” D_VALUE=”+122.46”></item>
</DEVICE_1>
<DEVICE_2>
<DEV_NAME>N/A</DEV_NAME>
<DEV_TYPE></DEV_TYPE>
<item D_UID=”2_1” D_LABEL=”Inst Watt” D_VALUE=”+0.08 k”></item>
</DEVICE_2>
</EIG_DATA>
Displaying a value in an HTM file: (Use Java Script in the Web browser.)
1. Define a unique name for a value to be displayed, such as data_name. Insert
<span id=”data_name”></span> in the HTM file where it will be displayed.
2. Create a Java Script code inside the HTM file (Auto Screen Refresh is set at 5000ms
in the Set Timeout ()Function); see Example below:
Example:
<Script language=Javascript>
<!--var disp_value;
var timerID;
var tmp_name;
var xmlDoc=new ActiveXObject(“MSXML.DomDocument”);
xmlDoc.async=true;
xmlDoc.onreadyststechange=do_get_data;
function do_get_xml()
{
xmlDoc.load(“poll_data.xml”);

Doc# E107707 6 - 22
6: Total Web Solutions
Electro Industries/GaugeTechThe Leader In Power Monitoring and Smart Grid SolutionsElectro Industries/GaugeTechThe Leader In Power Monitoring and Smart Grid Solutions
{
function do_get_data()
{
if (xmlDoc.readyState == 4)
{
if (xmlDoc.documentElement == null)
{
timerID = setTimeout(“do_get_xml();”,5000);
}
else
{
disp_value =
xmlDoc.documentElement.selectSingleNode
(“//item[@D_UID=’1_1’]”).
getAttribute(“D_VALUE”);
data_name.innerHTML = disp_value;
timerID = setTimeout(“do_get_xml();”,5000);
}
}
}
//--></SCRIPT>
NOTE: Inside the <body> of the HTML file, add the following:
Load=”do_get_xml()”

Doc# E107707 6 - 23
6: Total Web Solutions
Electro Industries/GaugeTechThe Leader In Power Monitoring and Smart Grid SolutionsElectro Industries/GaugeTechThe Leader In Power Monitoring and Smart Grid Solutions
Server Side Include Functions
These functions will send data directly to the browser as part of a requested docu-
ment.
Example of using Server Side Include Functions:
1. In HTM file, add the following to the first line of that file
<!-- ** THIS FILE DOES CONTAIN REALTIME DATA ** -->
Without that line, any server side include functions will not be processed by the
Web server.
2. Inside the HTM file where you want the info displayed, add
<!--#exec cgi=”/[server_side_include_function_name]”-->
where [server_side_function_name] can be one of the function names.
3. To display stored email #1’s date/time, add the following to your HTML file at the
location where you want the data displayed:
<!--#exec cgi=”/ssi_show_email_date_time 1”-->
GENERAL FUNCTIONS
Server Side Include Function Name Parameter Description
get_ip.fn Show Local IP address
DIAGNOSTIC FUNCTIONS
Server Side Include Function Name Parameter Description
ssi_diag_cpu Show CPU info
ssi_diag_ethernet_hardware Show ethernet hardware info
ssi_diag_firmware Show firmware info
ssi_diag_ftp_server Show FTP server info
ssi_diag_imported_files Show FTP Client/Imported files status
ssi_diag_memory Show memory info
ssi_diag_modbus_com Show all Modbus communi-cation info
ssi_diag_modbus_tcp_server Show Modbus TCP server info

Doc# E107707 6 - 24
6: Total Web Solutions
Electro Industries/GaugeTechThe Leader In Power Monitoring and Smart Grid SolutionsElectro Industries/GaugeTechThe Leader In Power Monitoring and Smart Grid Solutions
NOTE: “1” =oldest; “10” = newest.
ssi_diag_modem Show internal modem (INP102) status
ssi_diag_system Show system info, such as start time
ssi_diag_web_server Show Web server info
stats.fn Show ethernet communica-tion status
STORED EMAIL FUNCTIONS
Server Side Include Function Name Parameter Description
ssi_show_email_date_time 1 to 10 Show stored email’s date/time
ssi_show_email_subject 1 to 10 Show stored email’s subject text
ssi_show_email_from 1 to 10 Show stored email’s from text
ssi_show_email_to 1 to 10 Show stored email’s to text
ssi_show_email_cc 1 to 10 Show stored email’s cc text
ssi_show_email_device_name 1 to 10 Show stored email’s device name text
ssi_show_email_contact_person 1 to 10 Show stored email’s contact person name
ssi_show_email_contact_phone 1 to 10 Show stored email’s contact person’s phone number
ssi_show_email_alarm_ids 1 to 10 Show stored email’s alarm IDs
ssi_show_email_alarm_names 1 to 10 Show stored email’s alarm names
ssi_show_email_alarm_details 1 to 10 Show stored email’s alarm details
ssi_show_email_send_status 1 to 10 Show stored email’s send status
DIAGNOSTIC FUNCTIONS
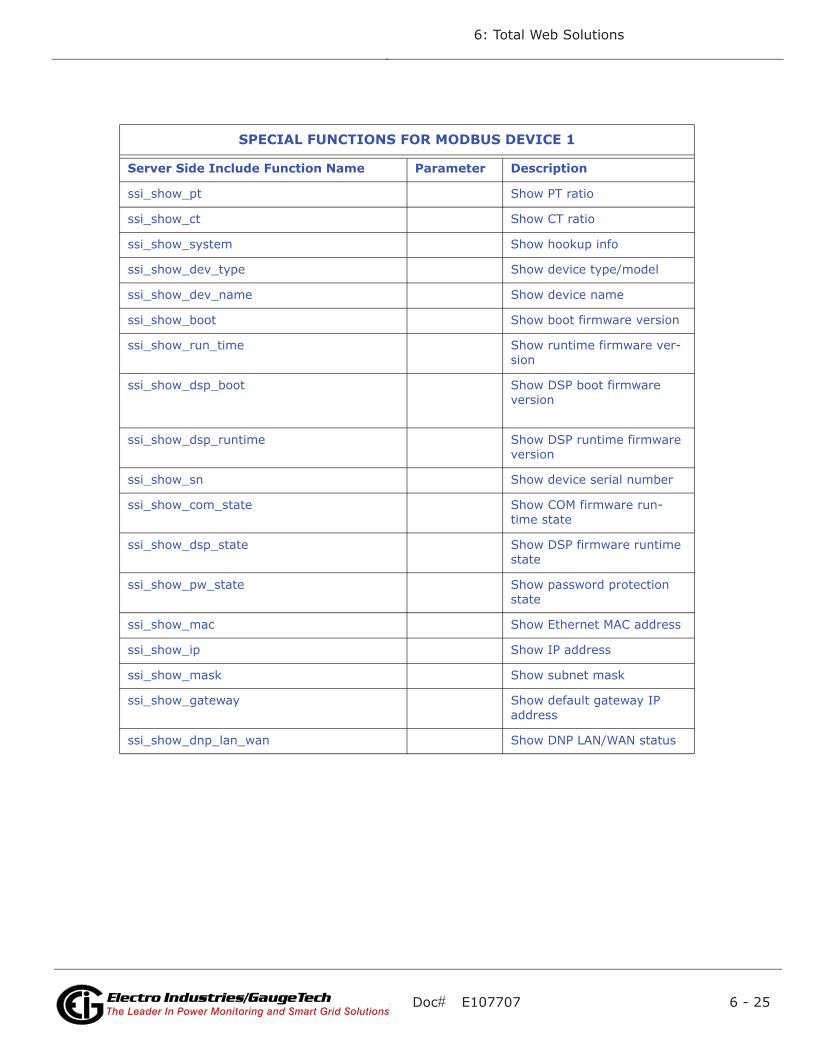
Doc# E107707 6 - 25
6: Total Web Solutions
Electro Industries/GaugeTechThe Leader In Power Monitoring and Smart Grid SolutionsElectro Industries/GaugeTechThe Leader In Power Monitoring and Smart Grid Solutions
SPECIAL FUNCTIONS FOR MODBUS DEVICE 1
Server Side Include Function Name Parameter Description
ssi_show_pt Show PT ratio
ssi_show_ct Show CT ratio
ssi_show_system Show hookup info
ssi_show_dev_type Show device type/model
ssi_show_dev_name Show device name
ssi_show_boot Show boot firmware version
ssi_show_run_time Show runtime firmware ver-sion
ssi_show_dsp_boot Show DSP boot firmware version
ssi_show_dsp_runtime Show DSP runtime firmware version
ssi_show_sn Show device serial number
ssi_show_com_state Show COM firmware run-time state
ssi_show_dsp_state Show DSP firmware runtime state
ssi_show_pw_state Show password protection state
ssi_show_mac Show Ethernet MAC address
ssi_show_ip Show IP address
ssi_show_mask Show subnet mask
ssi_show_gateway Show default gateway IP address
ssi_show_dnp_lan_wan Show DNP LAN/WAN status

Doc# E107707 6 - 26
6: Total Web Solutions
Electro Industries/GaugeTechThe Leader In Power Monitoring and Smart Grid SolutionsElectro Industries/GaugeTechThe Leader In Power Monitoring and Smart Grid Solutions
6.7.2: Configuring WebXMLTM
The term XML stands for Extensible Markup Language. XML is a markup language
similar to HTML which is used to describe data. HTML displays the data. XML does not
replace HTML; it complements HTML. An XML document is information wrapped in
XML tags. A piece of software has to be written to send, receive or display the docu-
ment.
IMPORTANT! You must follow the “Rules” of XML, listed below:
1. The first line of the document, the XML declaration, defines the XML version and
the characters used in the document.
2. All XML elements must have a closing tag.
3. XML tags are case sensitive.
4. All XML elements must be properly nested.
5. All XML documents must have a root tag (first tag in an XML document).
6. Attribute values must always be quoted.
7. Comment syntax is similar to HTML. <!-- This is a comment -->
Example of Root Tag and Elements:
The first tag in an XML document is the root tag. All XML documents must contain a
single tag pair to define the root element. All other elements must be nested within
the root element.
All elements can have sub-elements (children). Sub-elements must be correctly
nested within their parent elements as shown below:
<root>
<child>
<subchild>.....</subchild>
</child>
</root>

Doc# E107707 6 - 27
6: Total Web Solutions
Electro Industries/GaugeTechThe Leader In Power Monitoring and Smart Grid SolutionsElectro Industries/GaugeTechThe Leader In Power Monitoring and Smart Grid Solutions
Example of Attributes:
<data id=”1” value=”123”></data>
Poll_profile.xml: File configured to poll parameters of each device:
NOTE: The Nexus® 1500 meter uses pprofile.xml.
Root tags: <EIG_POLL_DATA> and </EIG_POLL_DATA>
System elements: <EIG_SYSTEM> and </EIG_SYSTEM>
Contains system parameters and email addresses
General attribute:
<item DATA_POLL_DELAY=”400”
ALARM_POLL_DELAY=”1000”
SYSTEM_COMM_TIMEOUT=”1000”
ALARM_CONTACT_PHONE=””
ALARM_CONTACT_PERSON=”Administrator”

Doc# E107707 6 - 28
6: Total Web Solutions
Electro Industries/GaugeTechThe Leader In Power Monitoring and Smart Grid SolutionsElectro Industries/GaugeTechThe Leader In Power Monitoring and Smart Grid Solutions
></item>
Email Attributes:
<item EMAIL_1=””FORMAT_1=”long”
EMAIL_2=””FORMAT_2=”long”
EMAIL_3=””FORMAT_3=”long”
EMAIL_4=””FORMAT_4=”short”
EMAIL_5=””FORMAT_5=”short”
EMAIL_6=””FORMAT_6=”short”
EMAIL_7=””FORMAT_7=”short”
EMAIL_8=””FORMAT_8=”short”
></item>
SYSTEM ATTRIBUTES
Attributes Description Settings
DATA_POLL_DELAY Poll delay between each Modbuspoll, in milliseconds
Min=500Max=65536Default=500
SYSTEM_COMM_TIMEOUT System communication timeout, inmilliseconds
Min=500Max=32000Default=500
ALARM_POLL_DELAY Poll delay between each Modbuspoll for each device’s alarm polling,in milliseconds
Min= 1000Max=65535Default=1000
ALARM_CONTACT_PHONE Alarm contact phone number Max size=10 digits
ALARM_CONTACT_PERSON Alarm contact person name Max size=64 characters
EMAIL ATTRIBUTES
Attributes Description Settings
EMAIL_X Email address, X is from 1 to 8 Max size = 64 characters
FORMAT_Y Email format, Y is from 1 to 8 Strings ‘long’ or ‘short’
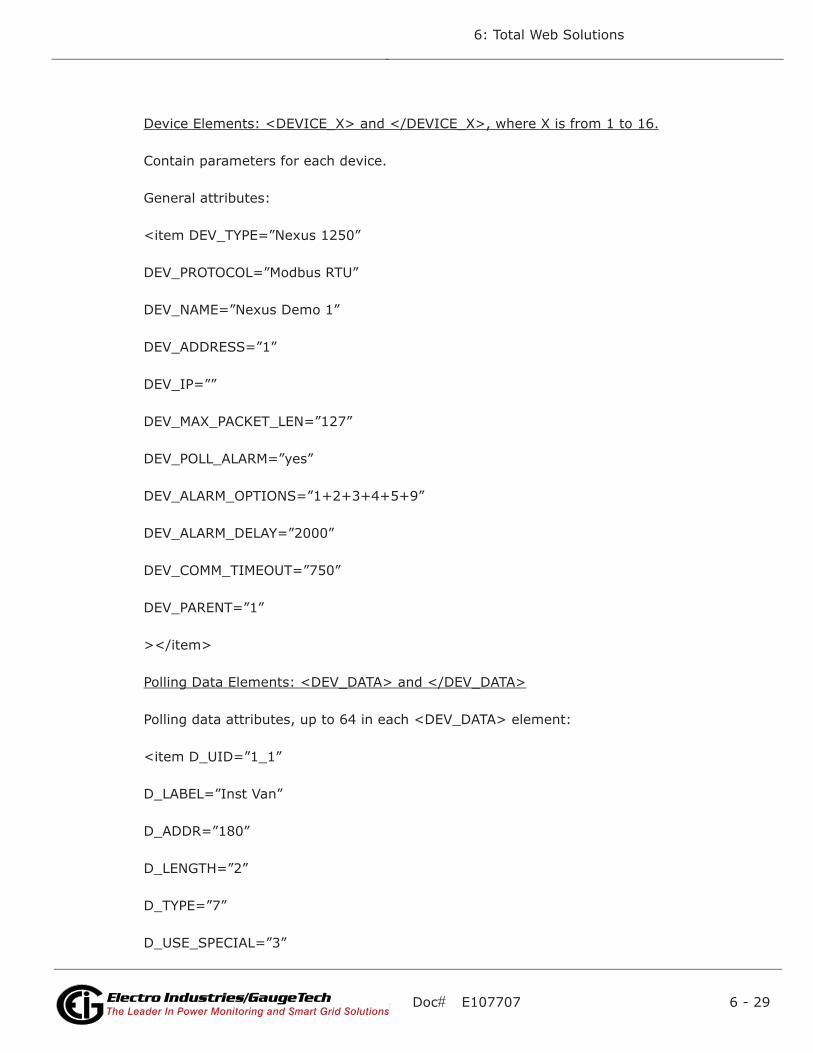
Doc# E107707 6 - 29
6: Total Web Solutions
Electro Industries/GaugeTechThe Leader In Power Monitoring and Smart Grid SolutionsElectro Industries/GaugeTechThe Leader In Power Monitoring and Smart Grid Solutions
Device Elements: <DEVICE_X> and </DEVICE_X>, where X is from 1 to 16.
Contain parameters for each device.
General attributes:
<item DEV_TYPE=”Nexus 1250”
DEV_PROTOCOL=”Modbus RTU”
DEV_NAME=”Nexus Demo 1”
DEV_ADDRESS=”1”
DEV_IP=””
DEV_MAX_PACKET_LEN=”127”
DEV_POLL_ALARM=”yes”
DEV_ALARM_OPTIONS=”1+2+3+4+5+9”
DEV_ALARM_DELAY=”2000”
DEV_COMM_TIMEOUT=”750”
DEV_PARENT=”1”
></item>
Polling Data Elements: <DEV_DATA> and </DEV_DATA>
Polling data attributes, up to 64 in each <DEV_DATA> element:
<item D_UID=”1_1”
D_LABEL=”Inst Van”
D_ADDR=”180”
D_LENGTH=”2”
D_TYPE=”7”
D_USE_SPECIAL=”3”

Doc# E107707 6 - 30
6: Total Web Solutions
Electro Industries/GaugeTechThe Leader In Power Monitoring and Smart Grid SolutionsElectro Industries/GaugeTechThe Leader In Power Monitoring and Smart Grid Solutions
D_VALUMODE=”Primary”
></item>
SYSTEM ATTRIBUTES
Device Element Description Settings
DEV_TYPE Supported device name Generic ModbusNexus 1250Nexus 1252Nexus 1260Nexus 1262Nexus 1270Nexus 1272Nexus 1500[~DEVICE_TYPE_LABEL] = Autodetect device’s type (Nexus®devices only)
DEV_PROTOCOL Protocol name Modbus RTUModbus TCP
DEV_NAME User assigned device name Max = 32 characters[~DEVICE_LABEL] = Use thename stored inside the device (Nexus® devices only)
DEV_ADDRESS Device address Modbus protocol = 1 to 247
DEV_IP IP address for Modbus TCP devices xxx.xxx.xxx.xxx
DEV_MAX_PACKET_LEN Max modbus registers for a device’sresponse buffer
Nexus® = 127Futura & DMMS = 50
DEV_POLL_ALARM Enable or disable device alarm pollfunction
Yes = EnableNo = Disable
DEV_ALARM_OPTIONS Alarm poll options 1 = Limits changed2 = Inputs changed3 = Waveform captured4 = PQ (CBEMA) event captured5 = Control output changed9 = Communication failure
DEV_ALARM_DELAY Delay time for reporting alarmcondition (in milliseconds) for limitand input type alarms
Min = 0Max = 300000Default = 0
DEV_COMM_TIMEOUT Device communication timeout(in milliseconds)
Min = 500Max = 32000Default = 500
DEV_DATA_FORMAT Data format 0 to 0.000000
DEV_PARENT Parent device ID (see NOTES) Value from 1 to 16

Doc# E107707 6 - 31
6: Total Web Solutions
Electro Industries/GaugeTechThe Leader In Power Monitoring and Smart Grid SolutionsElectro Industries/GaugeTechThe Leader In Power Monitoring and Smart Grid Solutions
NOTES:
• Parent device ID (DEV_PARENT), for polling expansion beyond the 64 items per
device limitation. If set, it will use the parent device’s communication settings.
• In a Nexus® 1500 meter with factory set LCD configuration, some data displayed
on the LCD screens is configured in the pprofile.xml file, which is also used for con-
figuring the data displayed in the webpages. For this reason, modifying the ppro-
DEV_MODBUS_REG_BASE Device’s modbus register base iseither:
0 based integer value or1 based integer value (default)
DEV_TCP_PORT Remote Modbus TCP device’s portnumber
Default setting = 502
SYSTEM ATTRIBUTES

Doc# E107707 6 - 32
6: Total Web Solutions
Electro Industries/GaugeTechThe Leader In Power Monitoring and Smart Grid SolutionsElectro Industries/GaugeTechThe Leader In Power Monitoring and Smart Grid Solutions
file.xml file may affect the LCD's data presentation.
DATA ELEMENT ATTRIBUTES
Attribute Description Settings
D_UID User assigned device polling dataunique ID
Max = 16 characters
D_LABEL User assigned data label Max = 32 characters
D_ADDR Modbus register address 0 or 1 based integer value
D_LENGTH Number of Modbus registers
D_TYPE Data type For Nexus® Devices, use FxCommunication Data For-matsFor Generic Modbus Device Type, seeNOTE below for values
D_CHANNEL Channel ID for I/O type values Nexus® devices only
D_SHOW_KM A Format value with k or M auto = auto show k or Mk = fixed to kM = fixed to M
D_USE_SPECIAL Special functions See NOTE*
D_NA_VAL If a numerical value is set here anda real polled value matched with thisnumber, a ‘***’ string will be storedin the xml data file.
Numerical Value for ‘***’(Nexus® devices only)
D_VALUEMODE Value mode RawPrimarySecondaryValue (for Generic Modbus Device Type)Interpreted. See NOTE**
D_FUNCTION_CODE Modbus protocol function code 1, 2, 3 (default), 4
D_BYTE_ORDER Data byte order for Generic Modbusdevice. (Settings if source is 0x12345678)
0 MSR, MSB 0x1234, 0x5678: MS regfirst, MS byte first (default)1 MSR, LSB 0x3412, 0x7856, MS regfirst, LS byte first2 LSR, MSB 0x5678, 0x1234, LS regfirst, MS byte first3 LSR, LSB 0x7856, 0x3412, LS regfirst, LS byte first
D_SPECIAL Generic multiplier value for GenericModbus device; applied whenD_USE_SPECIAL is set to 6
1 = Default

Doc# E107707 6 - 33
6: Total Web Solutions
Electro Industries/GaugeTechThe Leader In Power Monitoring and Smart Grid SolutionsElectro Industries/GaugeTechThe Leader In Power Monitoring and Smart Grid Solutions
NOTE: Values for Generic Modbus D_TYPE:
1 = ASCII string
2 = 1 byte, signed high byte of the Modbus Register
3 = 1 byte, signed low byte of the Modbus Register
4 = 1 byte, unsigned high byte of the Modbus Register
5 = 1 byte, unsigned low byte of the Modbus Register
6 = 2 bytes, signed integer
7 = 2 bytes, unsigned integer
8 = 4 bytes, signed long integer
9 = 4 bytes, unsigned long integer
D_TAG_SPECIAL Cross linked multiplier ID forGeneric Modbus device
Setting is any unique D_UID’s settingwithin polling profile
D_MASKING_TYPE Data masking type for GenericModbus device
0 = do nothing (default)1 = NOT2 = OR3 = AND4 = NOR5 = NAND6 = XOR7 = XNOR
D_MASKING_VALUE Data masking value for GenericModbus device; setting is hexASCII string for up to 8 bytes of data
0x0=defaultExample of a 3 byte value: 0xAB12CD
D_CFG_FILE Configuration file name for GenericModbus device
Case sensitive file name up to 128 characters; the file must be available at system start up using FTP download
D_VALUE Value processed by Total WebSolutions and stored inpoll_data.xml file***
D_REF Reference info or value for polleditem; stored in poll_data.xml file*** Data source is the configuration file
DATA ELEMENT ATTRIBUTES

Doc# E107707 6 - 34
6: Total Web Solutions
Electro Industries/GaugeTechThe Leader In Power Monitoring and Smart Grid SolutionsElectro Industries/GaugeTechThe Leader In Power Monitoring and Smart Grid Solutions
10 = 8 bytes, signed long long integer
11 = 8 bytes, unsigned long long integer
12 = 4 bytes, IEEE float
13 = 1 digit, 8 bits representation
14 = 1 digit, 4 bits representation (aka Packed BCD)
15.= 1 byte, signed
16 = 1 byte, unsigned
17 = 8 bytes, IEEE float
NOTE*: Parameters for D_USE_SPECIAL:
0 = do not multiply any number
1 = multiply by CT ratio (mainly used for current values)
2 = multiply by CT Aux ratio
3 = multiply by PT ratio (mainly used for voltage values)
4 = multiply by PT Aux ratio
5 = multiply by CT and PT ratio (mainly used for power, energy values)
6 = multiply by the value in D_SPECIAL (generic modbus device only)
NOTE**: If D_VALUEMODE is set to Interpreted, when used with Nexus® Input Val-
ues, the result will be a user-defined name in the meter’s Device Profile instead of a
value of 0 or 1.
NOTE***: Nexus® 12xx and Shark 200® meters’ Network cards use poll_data.xml;
the Nexus® 1500 meter uses pdata.xml.
Poll_data.xml/pdata.xml
Root tag: <EIG_DATA> and </EIG_DATA>
One (1) system element: <EIG_SYSTEM> and </EIG_SYSTEM>

Doc# E107707 6 - 35
6: Total Web Solutions
Electro Industries/GaugeTechThe Leader In Power Monitoring and Smart Grid SolutionsElectro Industries/GaugeTechThe Leader In Power Monitoring and Smart Grid Solutions
Sixteen (16) device elements: <DEVICE_X> and </DEVICE_X>, where X is from 1 to
16.
In each of the 16 device elements: Device info elements: card copies data from
poll_profile.xml/pprofile.xml.
<DEV_NAME> and </DEV_NAME>
<DEV_TYPE> and </DEV_TYPE>
Up to 64 polling data attributes: card copies data from poll_profile.xml/pprofile.xml.
<item D_UID=”1_1”
D_LABEL=”Inst Van”
D_VALUE=”+126.06” (Data value).
></item>
6.7.2.1: Configuration File (for Generic Modbus Device)
The purpose of the configuration file is to allow the user to set what real value or
information could be available in the poll_data.xml/pdata.xml file. Each configuration
file allows the user to set up 8 interpreted values or strings. The configuration file’s
format is XML.
Below is an example xml file with three values:
<?xml version=”1.0” encoding=”UTF-8” ?>
<EIG_CONFIGURATION>
<item CFG_COMPARE_TYPE=”Value” CFG_VALUE=”0” CFG_REF=”Disabled” />
<item CFG_COMPARE_TYPE=”Value” CFG_VALUE=”128” CFG_REF=”Enabled” />
<item CFG_COMPARE_TYPE=”String” CFG_VALUE=”107 Nexus 1250”
CFG_REF=”Nexus 1250 Meter” />
</EIG_CONGFIGURATION>
The root tags are <EIG_CONFIGURATION> and </EIG_CONFIGURATION> with up to
8 items between the root tags.
Doc# E107707 6 - 36
6: Total Web Solutions
Electro Industries/GaugeTechThe Leader In Power Monitoring and Smart Grid SolutionsElectro Industries/GaugeTechThe Leader In Power Monitoring and Smart Grid Solutions
CFG_COMPARE_TYPE settings are “Value” for numeric comparison or “String” for text
comparison.
CFG_VALUE can be a numeric value or text string (up to 256 characters) to be used
for comparison.
CFG_REF is any interpreted value or text string when the comparison returned a
match (up to 256 characters for a text string).
D_REF is the corresponding value in the poll_data.xml/pdata.xml file.
6.7.2.2: Order of Data Processing for Generic Modbus Device
The steps in data processing are as follows:
1. Set byte order
2. Apply bit masking
3. Apply multiplying factor
4. Apply interpreted values from generic file(s)
6.7.3: Configuring WebReacherTM
Through the configuration of poll_profile.xml, you can poll up to 16 individual devices
or up to 1024 unique items via Modbus RTU protocol or Modbus TCP protocol.
NOTE: The Nexus® 1500 meter supports Modbus TCP and a maximum of 8 devices.
To set up WebReacherTM for the Nexus® 1500 meter so that it can use Modbus RTU,
you must have the optional RS485 port and follow these steps:
1. In the Communications Settings screen of the Device Profile, set the 2nd RS485
port to RTU Master mode and Modbus RTU protocol.
2. In the meter’s device profile set up RTU master polling (see Chapter 19 for instruc-
tions).
3. Configure pprofile.xml with a new device allocation, using Modbus RTU and device
address 1, to poll data from the main meter, for the polling items set up in the
meter's RTU master configuration.

Doc# E107707 6 - 37
6: Total Web Solutions
Electro Industries/GaugeTechThe Leader In Power Monitoring and Smart Grid SolutionsElectro Industries/GaugeTechThe Leader In Power Monitoring and Smart Grid Solutions
Devices supported: any device that supports Modbus RTU or Modbus TCP protocol
(with at least one available socket).
Devices supported for Advanced Features:
Nexus® 1250/1252, 1262, 1272, 1500, CPU1000, DMMS300/350/425 (Use Generic
Modbus device settings for CPU1000 and DMMS meters.)
System set up:
NOTE: The instructions below are slightly different for the Nexus® 1500 meter. The
Nexus® 1500 meter does not use the Poll_data.xml file. It’s Web data is stored in:
\I\pdata.xml; for Web access http://[IP]/I/pdata.xml. All user configurable webpage
files are physically located in the directory \C\TWS\, including the Web server's
index.htm file. All files can be accessed as http://[IP]/C/TWS/[file_name.ext]. The
meter's Web server automatically loads the \C\TWS\index.htm file into the Web
server's root as the default webpage file, http://[IP]/index.htm. Be sure to set the
reference link in index.htm properly.
Set DATA_POLL_DELAY in milliseconds; the system will pause between each Modbus
poll.
Set SYSTEM_COMM_TIMEOUT in milliseconds.
Example:
<EIG_POLL_DATA>
<EIG_SYSTEM>
<item DATA_POLL_DELAY=”400”SYSTEM_COMM_TIMEOUT=”500”
></Item>
</EIG_SYSTEM>
</EIG_POLL_DATA>
Device Set up: within the boundary of <DEVICE_X> and </DEVICE_X>
1. Assign a device type, DEV_TYPE.
2. Assign a protocol, DEV_PROTOCOL

Doc# E107707 6 - 38
6: Total Web Solutions
Electro Industries/GaugeTechThe Leader In Power Monitoring and Smart Grid SolutionsElectro Industries/GaugeTechThe Leader In Power Monitoring and Smart Grid Solutions
3. Assign user defined device name, DEV_NAME (should be unique in a system).
4. Assign Modbus device address, DEV_ADDRESS.
5. If protocol is Modbus TCP, assign the remote device’s IP address and the TCP port
number: DEV_IP and DEV_TCP_PORT.
6. Set max Modbus packet length in number of registers, DEV_MAX_PACKET_LEN.
7. Set device’s communication timeout in milliseconds, DEV_COMM_TIMEOUT. The
timeout value should be longer for devices that speak Modbus TCP than for devices
that speak Modbus RTU, depending on network traffic.
8. Set device’s data display format, DEV_DATA_FORMAT, from 0 to 0.000000.
9. You can expand the polling item limitation of 64 items per device by setting a
device as a child device of a parent device.
For Example, in <DEVICE_X> section, if you set it to be the parent device,
DEV_PARENT must be X or 0. Then for <DEVICE_Y> section, if you set the device
to be a child device of X, set DEV_PARENT to X. Other parameters can be omitted.
Example:
<EIG_POLL_DATA>
<DEVICE_1>
<item DEV_TYPE=”Nexus 1250”
DEV_PROTOCOL=”ModbusRTU”
DEV_NAME=”Nexus Demo 1”
DEV_ADDRESS=”1”
DEV_IP=””
DEV_TCP_PORT=””
DEV_MAX_PACKET_LEN=”127”
DEV_COMM_TIMEOUT=”750”

Doc# E107707 6 - 39
6: Total Web Solutions
Electro Industries/GaugeTechThe Leader In Power Monitoring and Smart Grid SolutionsElectro Industries/GaugeTechThe Leader In Power Monitoring and Smart Grid Solutions
DEV_DATA_FORMAT=”0.00”
DEV_PARENT=”1”
></item>
</DEVICE_1>
</EIG_POLL_DATA>
Polling Item Set up:
In each DEVICE_X, DEV_DATA section, you can have up to 64 items. Any extra items
will be ignored.
1. Set a unique ID, D_UID, so any program can easily access this item.
2. Set a data label, D_LABEL, optional.
3. Set Modbus register in decimal, 1 based, D_ADDR.
4. Set how many Modbus registers, D_LENGTH. Note: Each register is 2 bytes long.
5. Set data type, D_TYPE. (See your meter’s Modbus Protocol Register Map Manual.)
6. Set special operations, such as multiplying PT or CT ratio, D_USE_SPECIAL.
7. Set value mode, D_VALUEMODE as primary, secondary or raw value.
8. Set display units, D_SHOW_KM, optional.
9. Set a N/A value, D_NA_VAL, optional.
Example:
<EIG_POLL_DATA>
<DEVICE_1>
<DEV_DATA>
<item D_UID=”1_1”
D_LABEL=”Inst Van”

Doc# E107707 6 - 40
6: Total Web Solutions
Electro Industries/GaugeTechThe Leader In Power Monitoring and Smart Grid SolutionsElectro Industries/GaugeTechThe Leader In Power Monitoring and Smart Grid Solutions
D_ADDR=”180”
D_LENGTH=”2”
D_TYPE=”7”
D_USE_SPECIAL=”3”
D_VALUEMODE=”Primary”
></item>
[...up to 64 items...]
</DEV_DATA>
</DEVICE_1>
</EIG_POLL_DATA>
6.7.4: Configuring WebModTM
WebMODTM allows the network to interface with Modbus-based EIDs. WebMODTM
supports 12 Modbus TCP sockets (12 simultaneous connections).
NOTE: The Nexus® 1500 meter supports 8 Modbus TCP sockets.
The Modbus Port Number is 502. The Modbus Port Number is set on the Location
Editor screen and Devices are added to the Network on this screen.
NOTE: If your system is firewalled, you must ask your network administrator to grant
communication access on TCP/IP Port 502.
Modbus TCP Format: [6-byte Header] [Modbus RTU message without checksum]
Header detail:
[2 Bytes - Sequences/Transactions ID] [2 Bytes - 0s] [2 Bytes - Length, Number of
Bytes following]
Example:
Request:
01 03 00 00 00 06 01 03 00 00 00 02

Doc# E107707 6 - 41
6: Total Web Solutions
Electro Industries/GaugeTechThe Leader In Power Monitoring and Smart Grid SolutionsElectro Industries/GaugeTechThe Leader In Power Monitoring and Smart Grid Solutions
Transaction #259, 6 Bytes long, Modbus RTU Request for Address 01, Function Code
03 (read holding registers), Start at Register 0 for 2 registers.
Response:
01 03 00 00 00 07 01 03 04 xx xx xx xx
Transaction #259, 7 Bytes long, Modbus RTU Response for Address 01, Function Code
03, 4 Bytes long data.
It will not support multiple Modbus requests and responses in a single Modbus TCP
packet. ForINP100/INP200 and INP102/INP202 Options, all requests with Modbus
Address 01 will transmit to the meter itself. All other requests with Modbus Addresses
other than 01 will transmit to the RS485 Gateway Port.
6.7.5: Configuring WebAlarmTM
To enable WebAlarmTM, see the instructions in Section 6.5.5. Through Communicator
EXTTM software you can configure one email address, which is stored in the meter for
single user or administrative use. Eight additional addresses can be programmed in
the poll_profile.xml/pprofile.xml file (see Section 6.6.2).
To configure additional email recipients:
Edit the poll_profile.xml/pprofile.xml file saved in the FTP Server (see Section 6.6.5).
From EMAIL_1 to EMAIL_8, enter the email address within the double quotes
From FORMAT_1 to FORMAT_8, enter the format name as either “short” or “long”
within the double quotes. A section of a poll_profile.xml/pprofile.xml file is shown
below without values entered.
<EIG_POLL_DATA>
<EIG_SYSTEM>
<item EMAIL_1=””FORMAT_1=””
EMAIL_2=””FORMAT_2=””
EMAIL_3=””FORMAT_3=””
EMAIL_4=””FORMAT_4=””
EMAIL_5=””FORMAT_5=””
Doc# E107707 6 - 42
6: Total Web Solutions
Electro Industries/GaugeTechThe Leader In Power Monitoring and Smart Grid SolutionsElectro Industries/GaugeTechThe Leader In Power Monitoring and Smart Grid Solutions
EMAIL_6=””FORMAT_6=””
EMAIL_7=””FORMAT_7=””
EMAIL_8=””FORMAT_8=””
></item>
</EIG_SYSTEM>
</EIG_POLL_DATA>
Short Format:
For all handheld mobile devices with text messaging service capable of receiving up to
160 characters. Character number includes sender address, subject and body plus
additional separator characters. This format is defined by EIG - the user cannot mod-
ify it.
Example of the Short Format:
[64 characters of sender’s email address]##[32 characters of Meter ID]
#Alarm[10digit operator’s phone number]
IDs1+2+3+4+5+6+7+8+9+10+11+12+13+14+15+16
Long Format:
For all handheld mobile devices and PC users who can receive regular email. This
includes detailed alarm information.
Example of Long Format:
Device Name: Nexus Demo 1
Contact Person: Administrator
Contact Phone: 1234567890
Alarm IDs: 1+2+3+4
Alarm Names:
(1) Limits changed

Doc# E107707 6 - 43
6: Total Web Solutions
Electro Industries/GaugeTechThe Leader In Power Monitoring and Smart Grid SolutionsElectro Industries/GaugeTechThe Leader In Power Monitoring and Smart Grid Solutions
(2) Inputs changed
(3) Waveform captured
(4) PQ (CBEMA) event captured
Alarm Details:
Limits:
(4) 1s IA, Below Limit 2, Combination=OR, value = +0.38
(5) 1s IB, Below Limit 2, Combination=OR, value = +0.38
(6) 1s IC, Below Limit 2, Combination=OR, value = +0.38
Inputs:
(1) HSI Input 1 BK101 Off
(3) HSI Input 3 Closed
(4) HSI Input 4 Closed
6.7.6: Configure Alarm Polling Options: Enter values within the double quotes.
To enable the polling for a device, set DEV_POLL_ALARM to “Yes”; to disable it, set
“No”.
Alarm polling options: 1 to 9 (See table on the next page.)
The default is sending alarm emails for all options, 1 to 9.
You can configure the polling profile to have any combination of options.
Edit the poll_profile.xml. Set up the alarm polling options by concatenating the
options IDs, such as: “1+2+3+4+5+9”.
Set the alarm delay for limits in Milliseconds (a value of 1000 = 1 second). If a limit
condition occurs for 1 second or more, an alarm email is sent.
<EIG_POLL_DATA>
<DEVICE_x>
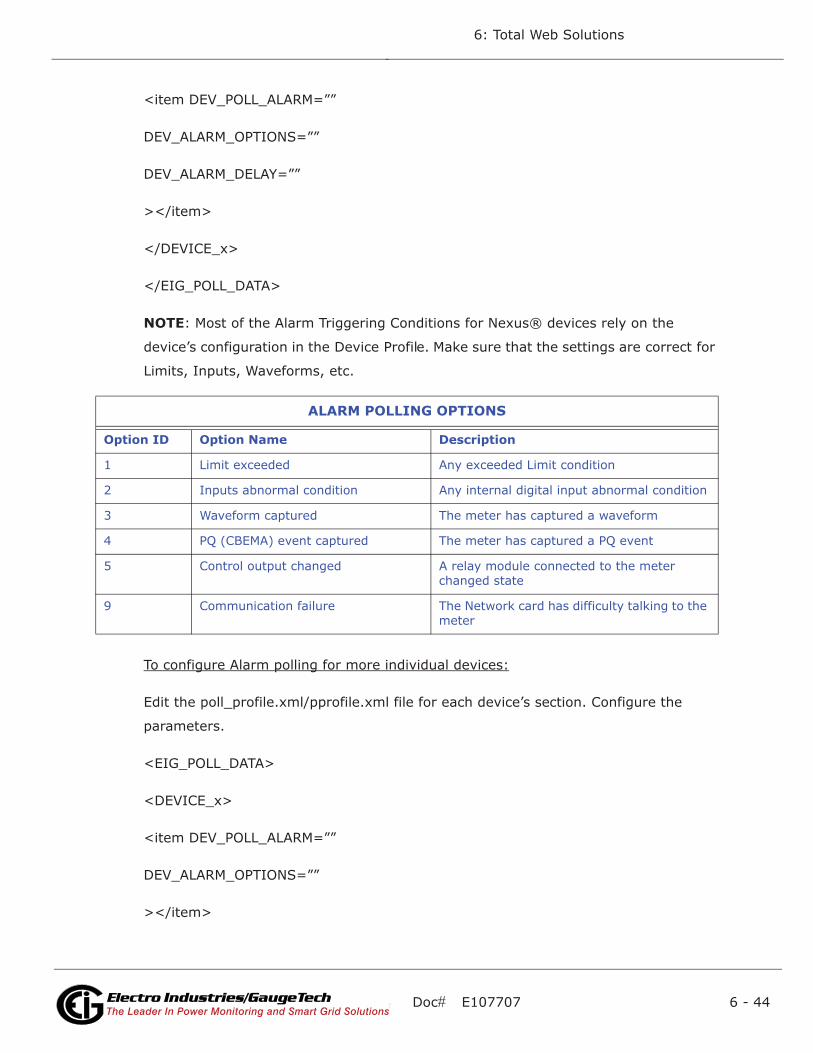
Doc# E107707 6 - 44
6: Total Web Solutions
Electro Industries/GaugeTechThe Leader In Power Monitoring and Smart Grid SolutionsElectro Industries/GaugeTechThe Leader In Power Monitoring and Smart Grid Solutions
<item DEV_POLL_ALARM=””
DEV_ALARM_OPTIONS=””
DEV_ALARM_DELAY=””
></item>
</DEVICE_x>
</EIG_POLL_DATA>
NOTE: Most of the Alarm Triggering Conditions for Nexus® devices rely on the
device’s configuration in the Device Profile. Make sure that the settings are correct for
Limits, Inputs, Waveforms, etc.
To configure Alarm polling for more individual devices:
Edit the poll_profile.xml/pprofile.xml file for each device’s section. Configure the
parameters.
<EIG_POLL_DATA>
<DEVICE_x>
<item DEV_POLL_ALARM=””
DEV_ALARM_OPTIONS=””
></item>
ALARM POLLING OPTIONS
Option ID Option Name Description
1 Limit exceeded Any exceeded Limit condition
2 Inputs abnormal condition Any internal digital input abnormal condition
3 Waveform captured The meter has captured a waveform
4 PQ (CBEMA) event captured The meter has captured a PQ event
5 Control output changed A relay module connected to the meter changed state
9 Communication failure The Network card has difficulty talking to the meter
Doc# E107707 6 - 45
6: Total Web Solutions
Electro Industries/GaugeTechThe Leader In Power Monitoring and Smart Grid SolutionsElectro Industries/GaugeTechThe Leader In Power Monitoring and Smart Grid Solutions
</DEVICE_x>
</EIG_POLL_DATA>
A common problem is described below:
If you entered a name for the SMTP Server instead of an IP address, make sure your
DNS Server is working and you have either set a DSP IP inside the meter or your DNS
can supply a DNS IP. If it cannot resolve the name to an IP translation, no email will
be sent.
Regarding stored emails:
You can access the stored_emails.htm page from any internet browser. The last 10
emails sent will be stored in the RAM on a FIFO basis (First In, First Out) and will be
displayed in descending order. The page will be cleared after a complete system
restart.
6.8: FTP Server - See Appendix F for Details
A built-in FTP Server is available for a meter equipped with INP100/INP200. It has a
3-user limit, so no more than three users can connect to the FTP Server simultane-
ously. The FTP Server logon User Name and Password are stored in the INP100/
INP200 card, not in the meter’s programmable settings.
The Initial FTP Server User Name and Password are: eignet and inp100, except for
the Nexus® 1500 meter which has anonymous as the initial setting for both user
name and password. The FTP Server’s quota is 4 Megabytes of RAM.
6.9: Update Network Card Firmware from Webpage (in Runtime Mode)
Network Card Firmware can be updated through the Web. Follow these steps:
1. Start your browser. Type the meter’s IP address in the browser’s URL address bar.
The Main WebExplorer screen is displayed (see page 6-2).

Doc# E107707 6 - 46
6: Total Web Solutions
Electro Industries/GaugeTechThe Leader In Power Monitoring and Smart Grid SolutionsElectro Industries/GaugeTechThe Leader In Power Monitoring and Smart Grid Solutions
2. Click Tools>Firmware Upgrade or, add /update1.htm to the end of the URL.The
Enter Network Password screen opens, prompting you for a User Name and Pass-
word. See the example screen shown below.
3. Enter User Name and Password.
Initial User Name = eignet (anonymous for Nexus® 1500 meter)
Initial Password = inp100 (anonymous for Nexus® 1500 meter)
4. Click OK. The Update Run-Time Firmware screen opens- see the screen shown
below.
5. Click the Browse button to select the correct Run-time firmware file.

Doc# E107707 6 - 47
6: Total Web Solutions
Electro Industries/GaugeTechThe Leader In Power Monitoring and Smart Grid SolutionsElectro Industries/GaugeTechThe Leader In Power Monitoring and Smart Grid Solutions
6. Click Update Run-Time Firmware. The update process can take several minutes.
Make sure that during the process you do not close the Update Run-Time Firmware
screen (or update1.htm browser window). During the update process, the INP100/
INP200 Update Run-Time Firmware Status screen opens. It displays the current
status of the update.
7. When you get the message that the update was successful, restart the connected
meter, in one of the following ways:
a. Click Reset or Restart, which take you to reset_ethernet.htm.
OR
b. Power down and then power up the connected meter.
6.10: Update Network Card Runtime Firmware via Software
Follow these steps to update Network Card firmware through Communicator EXT.
1. From the Communicator EXT Main screen, click Tools>Flash Me in the Title bar. The
screen you see depends on the meter you are configuring. If it is a Nexus® 12xx or
a Shark® 100 meter, you will see a screen with radio buttons. For a Nexus® 12xx
meter, select the Internal Network radio button and click Next; for a Shark® 100
meter, select the radio button and click Next. You will see a Flash screen. If you are
configuring a Nexus® 1500 meter you will see the Flash screen right away.
Nexus®12xx meters
Nexus®1500 meters
Shark® 100 meter

Doc# E107707 6 - 48
6: Total Web Solutions
Electro Industries/GaugeTechThe Leader In Power Monitoring and Smart Grid SolutionsElectro Industries/GaugeTechThe Leader In Power Monitoring and Smart Grid Solutions
2. Click Select or Browse (depending on the screen you see) to find the Firmware file.
3. For the Nexus® 1500 meter, if password protection is disabled, enter anonymous
in both the User Name and Password fields.
4. Click Next, Start, or Flash (depending on the screen you see) to begin the Flash
Update process.
5. For other than the Nexus® 1500 meter, if password protection is enabled, you will
see a screen asking for user name and password. Enter Username: eignet and
Password: inp100.
6. The screen displays messages while the firmware is loading. When you see the
message “Run-time firmware updated to flash successfully,” click Reset Device.
7. Click Close to exit the screen.
NOTE: The Shark® 200 meter’s network card can only be updated via its webpage.
See the Shark® 200/200T Installation and Operation Manual for details.
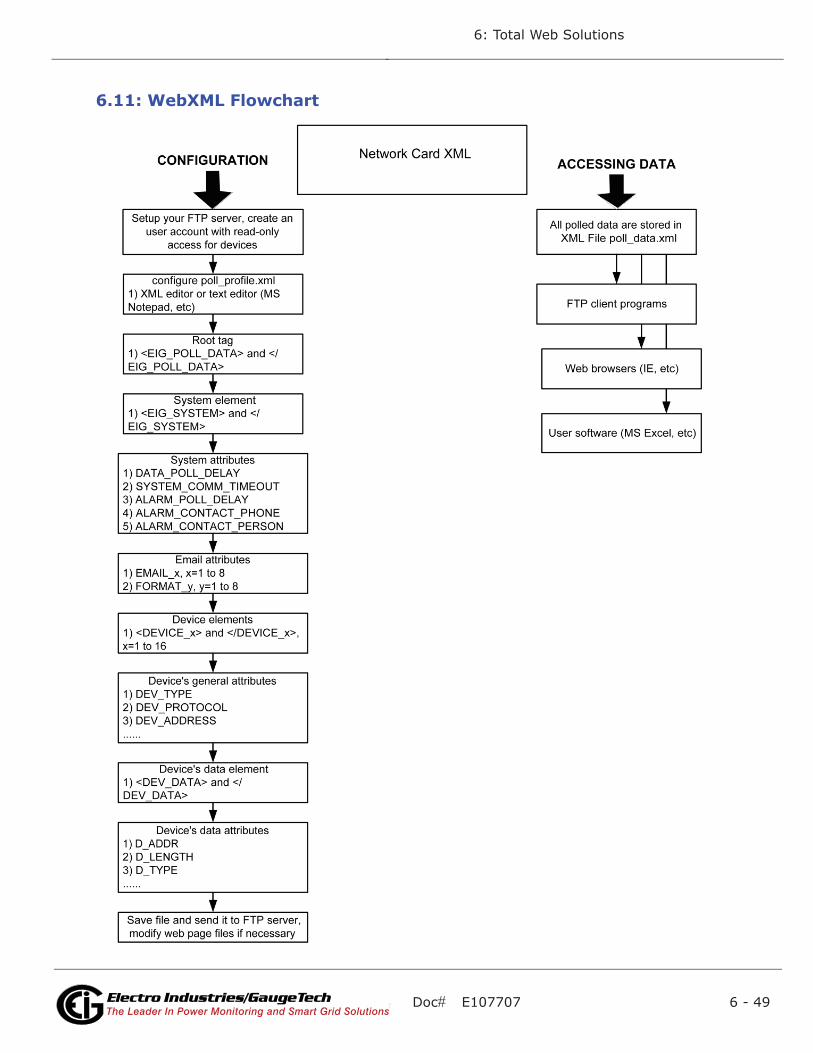
Doc# E107707 6 - 49
6: Total Web Solutions
Electro Industries/GaugeTechThe Leader In Power Monitoring and Smart Grid SolutionsElectro Industries/GaugeTechThe Leader In Power Monitoring and Smart Grid Solutions
6.11: WebXML Flowchart

Doc# E107707 6 - 50
6: Total Web Solutions
Electro Industries/GaugeTechThe Leader In Power Monitoring and Smart Grid SolutionsElectro Industries/GaugeTechThe Leader In Power Monitoring and Smart Grid Solutions
6.12: WebExplorer Flowchart

Doc# E107707 6 - 51
6: Total Web Solutions
Electro Industries/GaugeTechThe Leader In Power Monitoring and Smart Grid SolutionsElectro Industries/GaugeTechThe Leader In Power Monitoring and Smart Grid Solutions
6.13: WebAlarm Flowchart

Doc# E107707 6 - 52
6: Total Web Solutions
Electro Industries/GaugeTechThe Leader In Power Monitoring and Smart Grid SolutionsElectro Industries/GaugeTechThe Leader In Power Monitoring and Smart Grid Solutions
This page intentionally left blank.
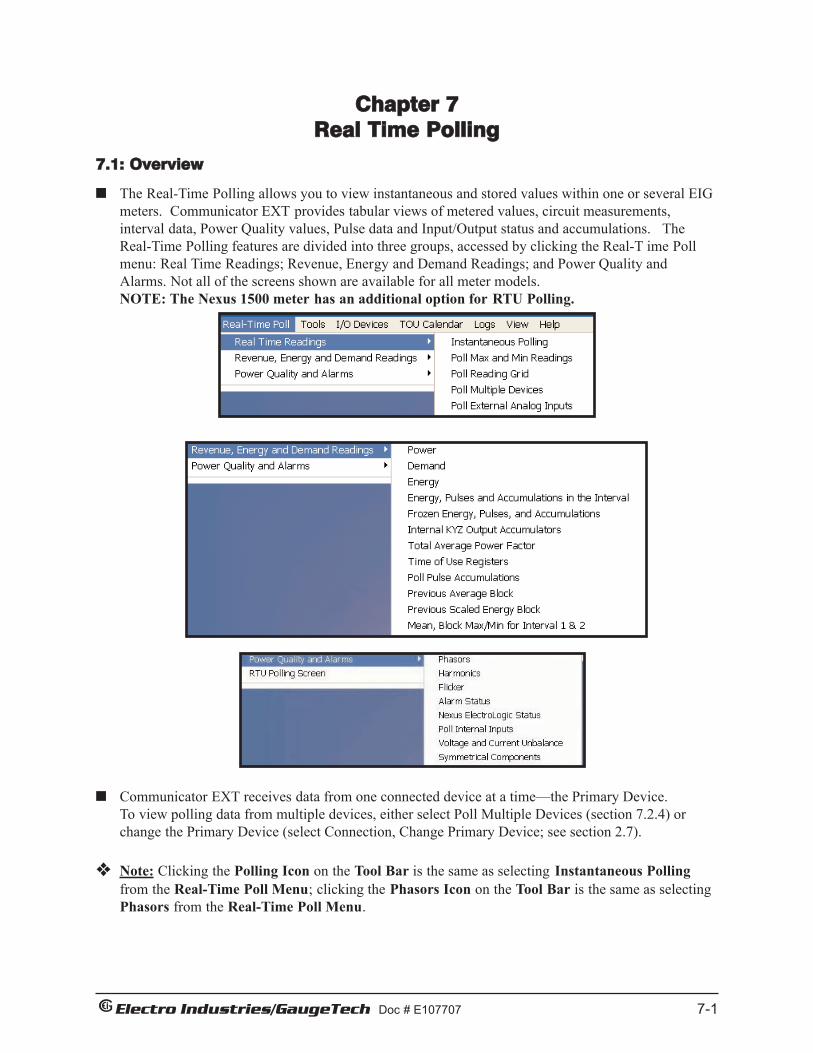
Chapter 7Real Time Polling
7.1: Overview
The Real-Time Polling allows you to view instantaneous and stored values within one or several EIGmeters. Communicator EXT provides tabular views of metered values, circuit measurements,interval data, Power Quality values, Pulse data and Input/Output status and accumulations. TheReal-Time Polling features are divided into three groups, accessed by clicking the Real-T ime Pollmenu: Real Time Readings; Revenue, Energy and Demand Readings; and Power Quality andAlarms. Not all of the screens shown are available for all meter models. NOTE: The Nexus 1500 meter has an additional option for RTU Polling.
Communicator EXT receives data from one connected device at a time—the Primary Device. To view polling data from multiple devices, either select Poll Multiple Devices (section 7.2.4) orchange the Primary Device (select Connection, Change Primary Device; see section 2.7).
Note: Clicking the Polling Icon on the Tool Bar is the same as selecting Instantaneous Pollingfrom the Real-Time Poll Menu; clicking the Phasors Icon on the Tool Bar is the same as selectingPhasors from the Real-Time Poll Menu.
Electro Industries/GaugeTech Doc # E107707 7-1

7.2: Real Time Readings
7.2.1: Instantaneous Polling
To view instantaneous polling data for the primary device, either select Instantaneous Polling fromthe Real-Time Poll>Real Time Readings menu, or click the Polling button on the Tool Bar.
If you are connected to a Nexus® device, you will see the screen shown below. If you are connectedto a Shark® device, you will see a similar screen, but it will not display the “AUX” or “Nm” readings; and it will display an “-Average” reading for Reactive Power.
The graphic representation on the right side of the screen is determined by the option selected fromthe pull-down menu at the bottom of the screen (Volts A, B, C; Current A, B, C). Select eitherspectrum or waveform view by clicking on the Spectrum/Waveform button.
• Click the radio button in the lower right corner to select either 1 Second or 0.1 Second measurements for all data. NOTE: You will not see this option if you are connected to a Shark® device.
• Click Print to send a copy of the screen to a printer .
• Click Help to view instructions for this screen.
• Click OK to return to the main Communicator EXT screen.
Electro Industries/GaugeTech Doc # E107707 7-2

7.2.2: Poll Max and Min Readings
To view the Maximum and Minimum readings for the currently connected device, select Poll Maxand Min Readings from the Real-Time Poll>Real Time Readings menu. You will see the screenshown below.
Note: The Max/Min is the Max/Min of the Thermal Average in the profile.
Scroll left/right and up/down to access all data.
Note: To adjust the column width, position the cursor on a line between columns at the top of thescreen. When the cursor changes to a left/right arrow, hold down the left mouse button and dragthe column border left or right. Release the button when the column is at the desired width.
• Click Pause to temporarily stop the screen update and enable the Copy button. Click Resume to continue the Real Time update.
• Click Print to send the data to a printer.
• To copy the data into another program, click Pause to enable the Copy button; then click Copy.Paste into your new document.
• Click OK to return to the main Communicator EXT screen.
To reset the Max/Min and Demand Readings, see Chapters 3 (Nexus 125x Series), 4 (Nexus1262/1272 meters), 5 (Shark® and Futura+ meters), and 19 (Nexus 1500 meter).
e Electro Industries/GaugeTech Doc # E107707 7-3
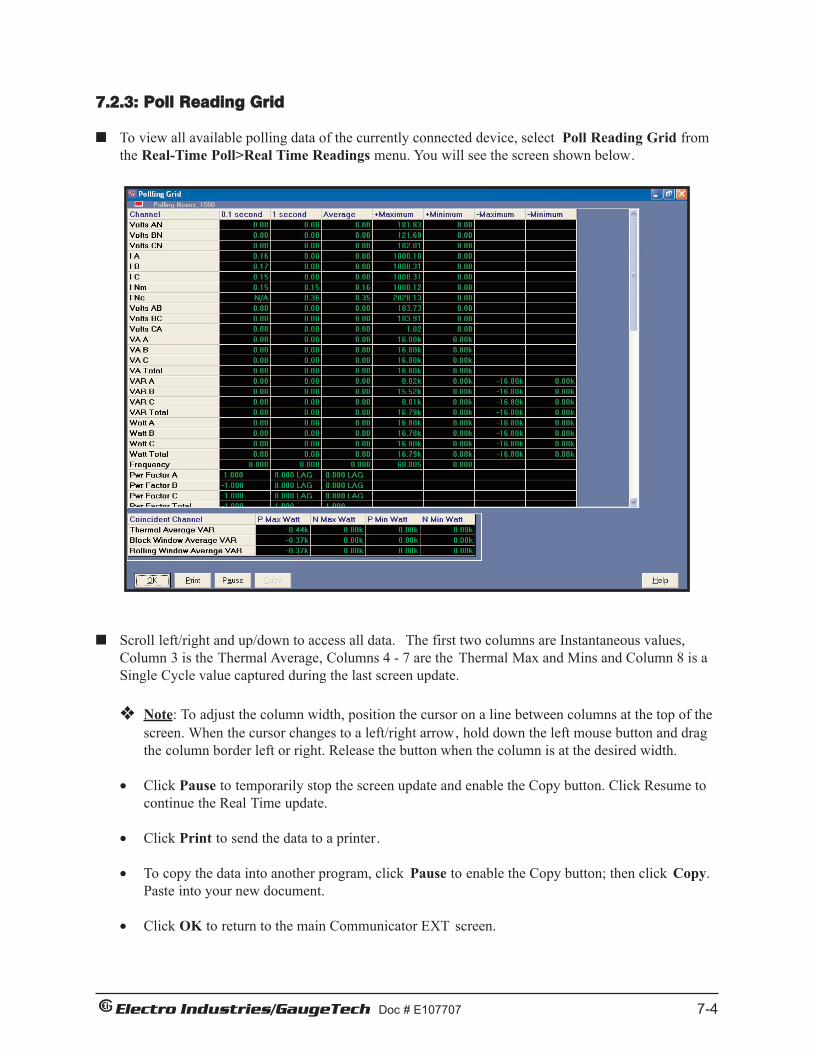
7.2.3: Poll Reading Grid
To view all available polling data of the currently connected device, select Poll Reading Grid fromthe Real-Time Poll>Real Time Readings menu. You will see the screen shown below.
Scroll left/right and up/down to access all data. The first two columns are Instantaneous values,Column 3 is the Thermal Average, Columns 4 - 7 are the Thermal Max and Mins and Column 8 is aSingle Cycle value captured during the last screen update.
Note: To adjust the column width, position the cursor on a line between columns at the top of thescreen. When the cursor changes to a left/right arrow, hold down the left mouse button and dragthe column border left or right. Release the button when the column is at the desired width.
• Click Pause to temporarily stop the screen update and enable the Copy button. Click Resume to continue the Real Time update.
• Click Print to send the data to a printer.
• To copy the data into another program, click Pause to enable the Copy button; then click Copy.Paste into your new document.
• Click OK to return to the main Communicator EXT screen.
Electro Industries/GaugeTech Doc # E107707 7-4

7.2.4: Poll Multiple Devices
To view polled data from multiple devices connected to your computer , select Poll Multiple Devicesfrom the Real-Time Poll>Real Time Readings menu. You will see the screen shown below.
Click on the tabs to access the following readings (see previous page for details on measurements):
0.1 Seconds: Volts AN, BN, CN, Aux, IA, B, C, Nm, Volts AB, BC, CA, VA A, B, C, Total, VAR A,B, C, Total, Watt A, B, C, Total, Freq, Power Factor A, B, C, Total, VAN Aux, Update Time. 1 Second: Volts AN, BN, CN, Aux, IA, B, C, Nm, Nc, Volts AB, BC, CA, VA A, B, C, Total, VARA, B, C, Total, Watt A, B, C, Total, Freq, Power Factor A, B, C, Total, Imb V, I, Update Time. Average: Volts AN, BN, CN, Aux, IA, B, C, Nm, Nc, Volts AB, BC, CA, VA A, B, C, Total, VARA, B, C, Total, Watt A, B, C, Total, Freq, Power Factor A, B, C, Total, Imb V, I, Update Time. Maximum, Minimum: Volts AN, BN, CN, Aux, IA, B, C, Nm, Nc, Volts AB, BC, CA, VA A, B, C,Total, P VAR A, B, C, Total, N VAR A, B, C, Total, P Watt A, B, C, Total, N Watt A, B, C, Total,Update Time.Hour Readings: Quad (1+4) Watthour, Quad 1 VAhour, Quad 1 VARhour, Quad 4 VAhour, Quad 4VARhour, Quad (2+3) Watthour, Quad 2 VAhour, Quad 2 VARhour, Quad 3 VAhour, Quad 3VARhour.Device Time and Accumulations: Date and Time, Internal Temperature.Accumulations: I SquaredTA, TB, TC, V Squared TA, TB, TC.
• Use the scroll bar at the bottom of the screen to access all the values.
• Click OK to return to the main Communicator EXT screen.
Electro Industries/GaugeTech Doc # E107707 7-5

Electro Industries/GaugeTech Doc # E107707 7-6
7.2.5: Poll External Analog Inputs
To view readings from any external Analog Input modules connected to your computer, select Poll External Analog Inputs from the Real-Time Poll>Real Time Readings menu. You will see the screen shown below.
Click Copy to copy the screen data to the clipboard. From there you can paste it into another program, such as Excel.
Click OK to return to the main Communicator EXT screen.
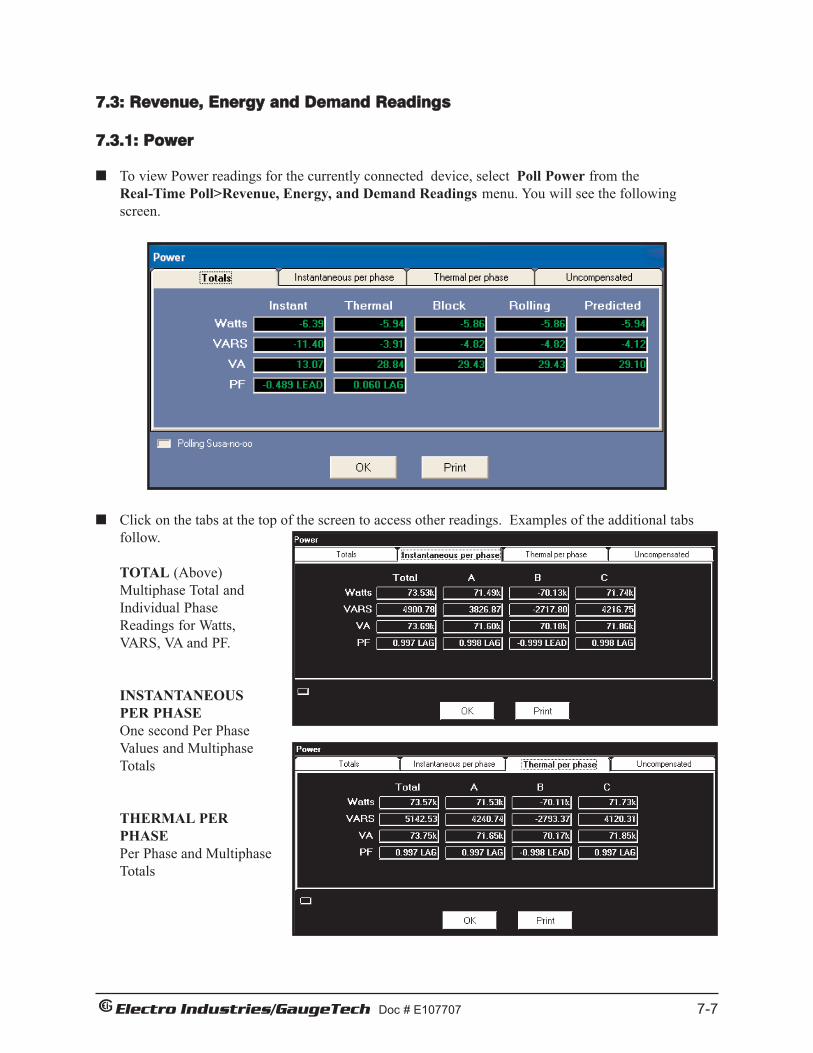
7.3: Revenue, Energy and Demand Readings
7.3.1: Power
To view Power readings for the currently connected device, select Poll Power from the Real-Time Poll>Revenue, Energy, and Demand Readings menu. You will see the followingscreen.
Click on the tabs at the top of the screen to access other readings. Examples of the additional tabsfollow.
TOTAL (Above)Multiphase Total andIndividual Phase Readings for Watts, VARS, VA and PF.
INSTANTANEOUSPER PHASEOne second Per Phase Values and Multiphase Totals
THERMAL PER PHASEPer Phase and MultiphaseTotals
Electro Industries/GaugeTech Doc # E107707 7-7

UNCOMPENSATEDMetered Values without Line and LossCompensation andMultipliers. Includes Interval andRolling Demand.
• Click Print to send a copy of the screen to a printer .• Click OK to return to the main Communicator EXT screen.
7.3.2: Demand
To view Demand data for the currently connected device, select Demand from the Real-TimePoll>Revenue, Energy, and Demand Readings menu. You will see the screen shown below.
Click on the tabs at the top ofthe screen to access other readings. Examples of the additional tabs follow.
PeakPeak Demand Readings for Watts, VARS, VA and PF.(Peak or Maximum Demand isthe largest Average Value forthe selected demand interval.)
Thermal DemandThermal or Exponential Demand is used to emulate the operation of electro-mechanical Thermal Demandmeters. This measurementresponds like lagged thermal heating effects in electrical equipment.
Electro Industries/GaugeTech Doc # E107707 7-8

Thermal Average VARSThe exponential average VARs. Exponentialaverages are used because they discount older values and respond more like the thermal effects.
Thermal Average VAThe exponential average VA. Exponentialaverages are used because they discount older values and respond more like the thermal effects.
Block Window Average (or Average Demand)Max and Min Watts, VARS and VAreadings with Time Stamp.Click on tabs to access readings.
Rolling Window Average(or Average Rolling Demand)Max and Min Watts, VARS and VA readings with Time Stamp.Click on tabs to access readings.
Electro Industries/GaugeTech Doc # E107707 7-9
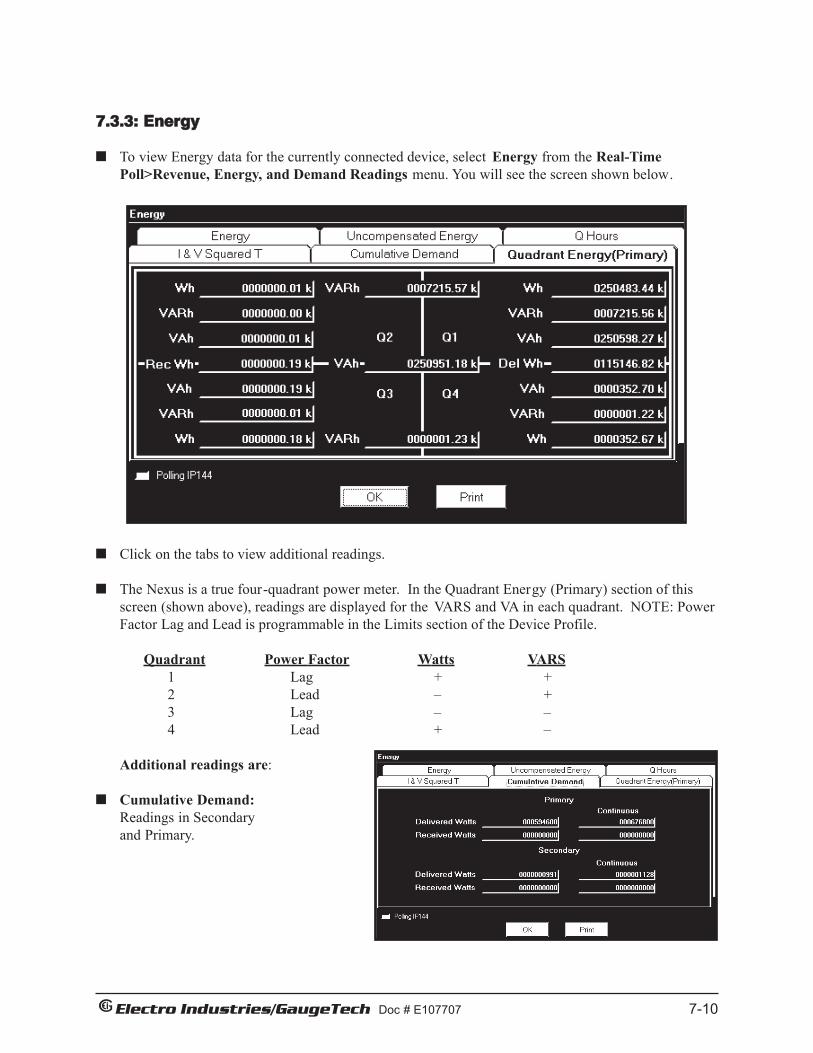
7.3.3: Energy
To view Energy data for the currently connected device, select Energy from the Real-TimePoll>Revenue, Energy, and Demand Readings menu. You will see the screen shown below.
Click on the tabs to view additional readings.
The Nexus is a true four-quadrant power meter. In the Quadrant Energy (Primary) section of thisscreen (shown above), readings are displayed for the VARS and VA in each quadrant. NOTE: PowerFactor Lag and Lead is programmable in the Limits section of the Device Profile.
Quadrant Power Factor Watts VARS1 Lag + +2 Lead – +3 Lag – –4 Lead + –
Additional readings are:
Cumulative Demand:Readings in Secondary and Primary.
Electro Industries/GaugeTech Doc # E107707 7-10

I & V Squared TPositive Readings for Phases A, B and C.
Q Hours:Plus and Minus Readings in Secondary and Primary.
NOTE: The Q Hour reading lags the Watt hour reading by 600. A Q Hour meter measures power between 1500 and2700, which are quadrants 2 and 3. Q is one of the values used in calculatingquadergy (VAR hours).
Uncompensated Energy:Plus and Minus Watt, VAR and VA Readings in Secondary and Primary.
Energy (Secondary):Plus and Minus Watt, VAR and VA Readings.
• Click Print to send the data to a printer.
• Click OK to return to the main Communicator EXT screen.
Electro Industries/GaugeTech Doc # E107707 7-11

Electro Industries/GaugeTech Doc # E107707 7-12
7.3.4: Energy, Pulse and Accumulations in the Interval
To view the Energy, Pulse & Accumulations in the Interval of the currently connected device, selectEnergy, Pulse & Accumulations in the Interval from the Real-Time Poll>Revenue, Energy, andDemand Readings menu. You will see the screen shown below.
These screens are Read Only. They display the readings from the Interval set on several screens:
Demand Integration Intervals (Chapters 3, 4, 19)Primary Current & Voltage Thresholds
Interval in minutes (15 = Initial setting)
Internal KYZ Outputs (Chapters 3, 4, 19)
I & V Squared T
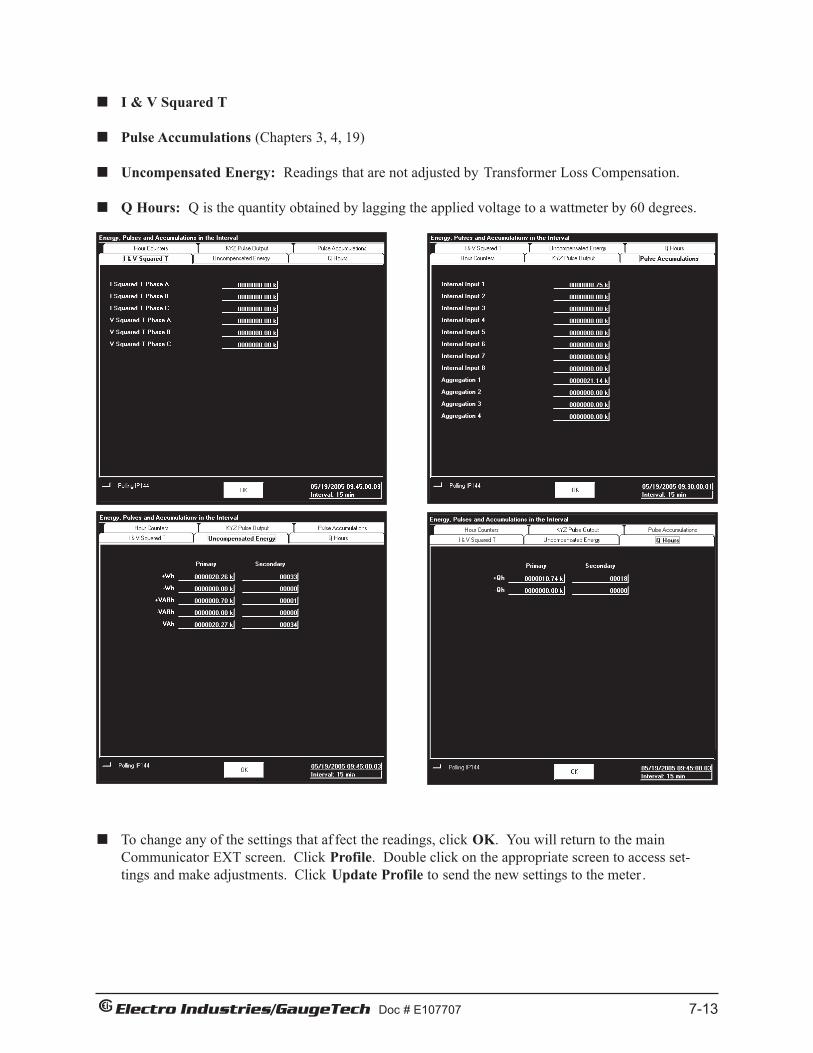
I & V Squared T
Pulse Accumulations (Chapters 3, 4, 19)
Uncompensated Energy: Readings that are not adjusted by Transformer Loss Compensation.
Q Hours: Q is the quantity obtained by lagging the applied voltage to a wattmeter by 60 degrees.
To change any of the settings that af fect the readings, click OK. You will return to the mainCommunicator EXT screen. Click Profile. Double click on the appropriate screen to access set-tings and make adjustments. Click Update Profile to send the new settings to the meter .
Electro Industries/GaugeTech Doc # E107707 7-13
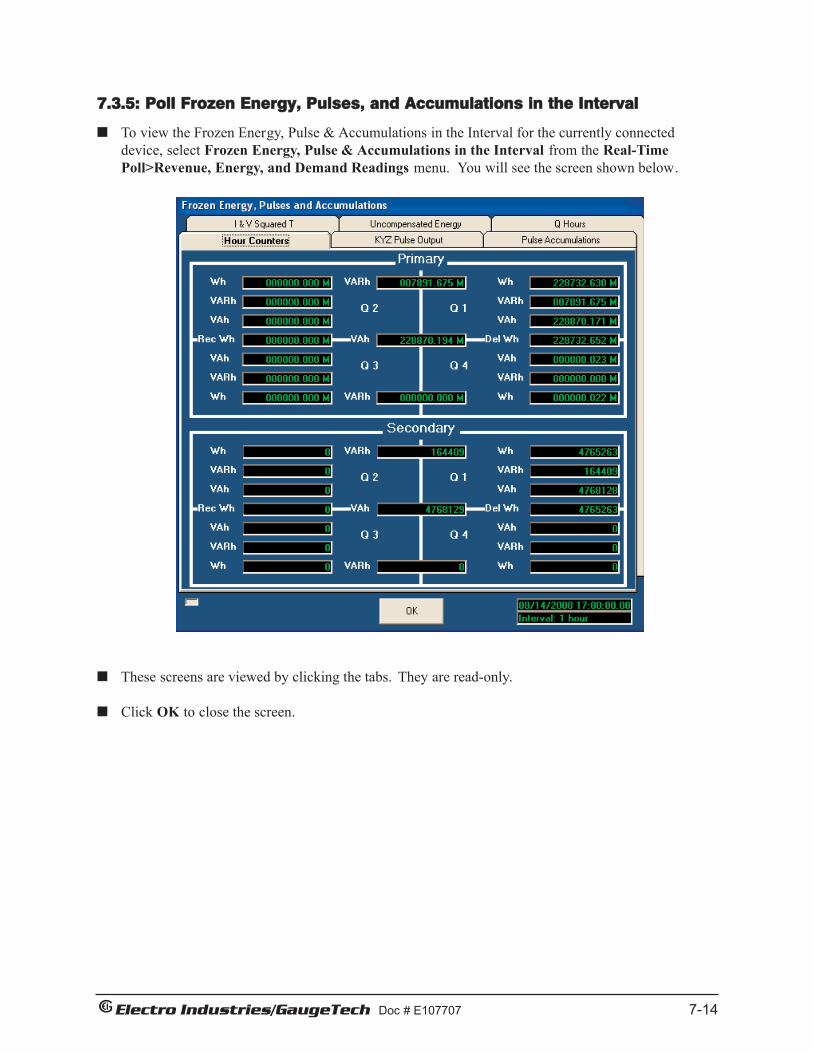
Electro Industries/GaugeTech Doc # E107707 7-14
7.3.5: Poll Frozen Energy, Pulses, and Accumulations in the Interval
To view the Frozen Energy, Pulse & Accumulations in the Interval for the currently connecteddevice, select Frozen Energy, Pulse & Accumulations in the Interval from the Real-TimePoll>Revenue, Energy, and Demand Readings menu. You will see the screen shown below.
These screens are viewed by clicking the tabs. They are read-only.
Click OK to close the screen.

7.3.6: Internal KYZ Output Accumulations
To view the Internal KYZ Output Accumulations of the currently connected device, select InternalKYZ Output Accumulations from the Real-Time Poll>Revenue, Energy, and Demand Readingsmenu. You will see the screen shown below.
This screen is Read Only. It displays the readings from the KYZ Output Relays.
Refer to Chapters 3, 4, and 19 for instructions on configuring the Internal KYZ Outputs.
To change any of the settings that ef fect the readings, click OK. You will return to the mainCommunicator EXT screen. Click Profile. Double-click on the appropriate screen to access settings and make adjustments.
Click OK to exit this screen and return to the main Communicator EXT screen.
Electro Industries/GaugeTech Doc # E107707 7-15

7.3.7: Total Average Power Factor
To view Total Average Power Factor from the device connected to your computer , select TotalAverage Power Factor from the Real-Time Poll>Revenue, Energy, and Demand Readingsmenu. You will see the screen shown below.
This is a Read Only screen. Readings are based on Power Factor settings from the Device Profile ofthe connected device. To make changes on this screen, click OK and return to the mainCommunicator EXT screen. In the meter ’s Device Profile, make changes to Maximum andMinimum Power settings.
• Click OK to return to the main Communicator EXT screen.
Electro Industries/GaugeTech Doc # E107707 7-16
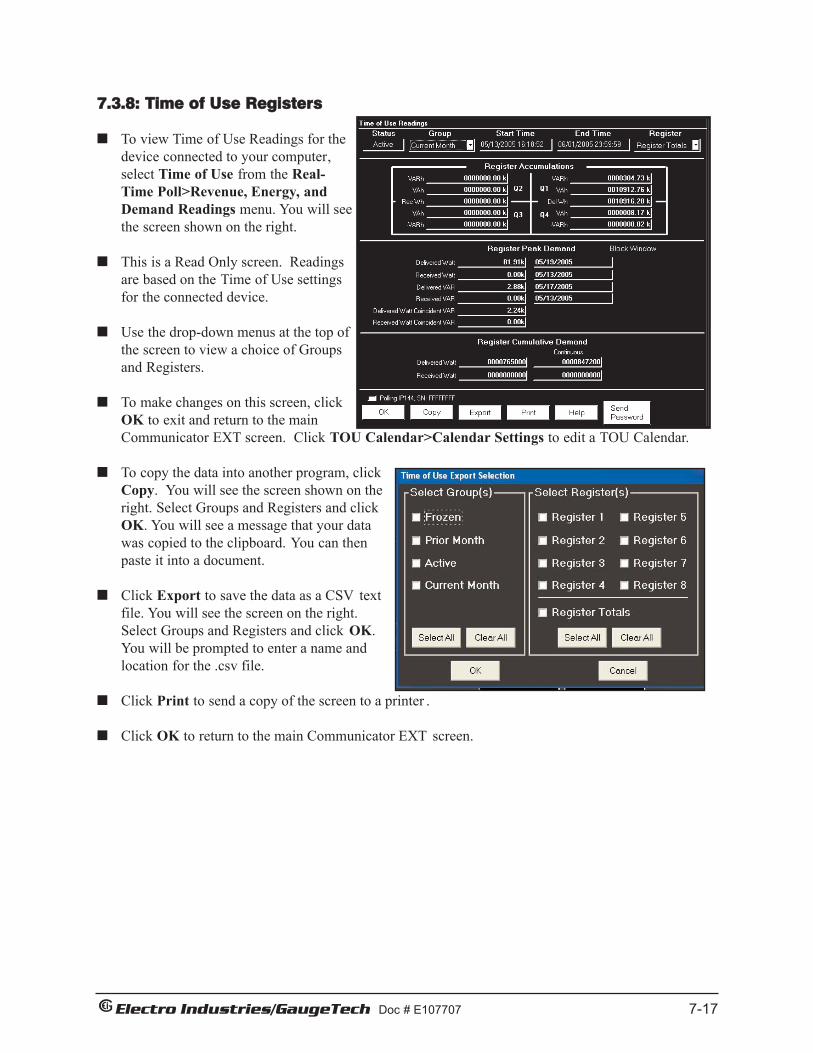
Electro Industries/GaugeTech Doc # E107707 7-17
7.3.8: Time of Use Registers
To view Time of Use Readings for thedevice connected to your computer,select Time of Use from the Real-Time Poll>Revenue, Energy, andDemand Readings menu. You will seethe screen shown on the right.
This is a Read Only screen. Readingsare based on the Time of Use settingsfor the connected device.
Use the drop-down menus at the top ofthe screen to view a choice of Groupsand Registers.
To make changes on this screen, clickOK to exit and return to the mainCommunicator EXT screen. Click TOU Calendar>Calendar Settings to edit a TOU Calendar.
To copy the data into another program, clickCopy. You will see the screen shown on theright. Select Groups and Registers and clickOK. You will see a message that your datawas copied to the clipboard. You can thenpaste it into a document.
Click Export to save the data as a CSV textfile. You will see the screen on the right.Select Groups and Registers and click OK.You will be prompted to enter a name andlocation for the .csv file.
Click Print to send a copy of the screen to a printer .
Click OK to return to the main Communicator EXT screen.

7.3.9: Poll Pulse Accumulations
To view the Pulse Accumulations readings for the currently connected device, select Poll PulseAccumulations from the Real-Time Poll>Revenue, Energy, and Demand Readings menu. Youwill see the screen shown below.
This screen displays the scaled Pulse Accumulations from the Nexus meter’s eight internal digitalinputs. It also displays the Fixed Window Average and Max Demand for the eight PulseAccumulations. At the bottom of the screen, you will also find four Totalizers, which are combi-nations of the eight internal inputs and the Nexus™ meter ’s watt-hour counter.
This screen is the result of configuring the Pulse Accumulations settings in the Device Profile. SeeChapter 3.4.10, 4.4.10, and 19.5.9 for details on settings and to edit settings. The Nexus meter canbe programmed to accumulate and aggregate pulses from any pulse generating device.
• Click OK to return to the main Communicator EXT screen.
• Click Print to print this screen.
• Click Export to save a text file of the Input Readings. Your computer will ask you to name the file and choose a “save in” location.
• Click OK or Cancel to return to the main Communicator EXT screen.
Electro Industries/GaugeTech Doc # E107707 7-18
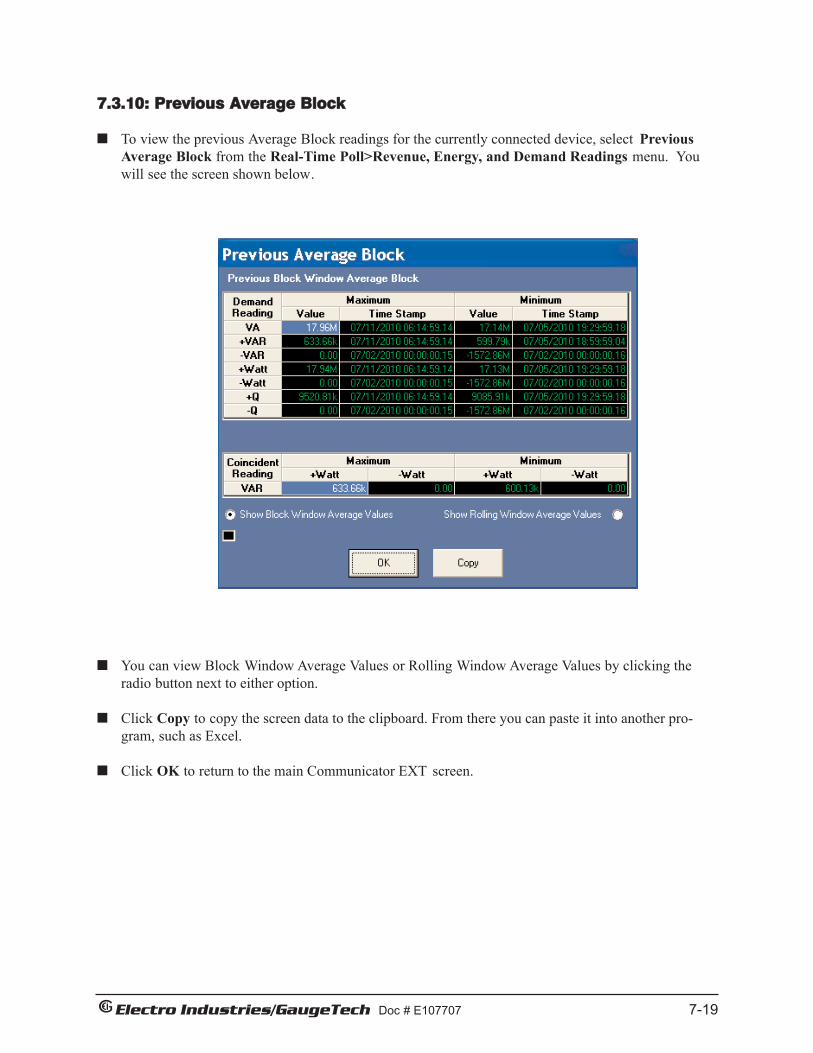
Electro Industries/GaugeTech Doc # E107707 7-19
7.3.10: Previous Average Block
To view the previous Average Block readings for the currently connected device, select PreviousAverage Block from the Real-Time Poll>Revenue, Energy, and Demand Readings menu. Youwill see the screen shown below.
You can view Block Window Average Values or Rolling Window Average Values by clicking theradio button next to either option.
Click Copy to copy the screen data to the clipboard. From there you can paste it into another pro-gram, such as Excel.
Click OK to return to the main Communicator EXT screen.

Electro Industries/GaugeTech Doc # E107707 7-20
7.3.11: Previous Scaled Energy Block
To view the previous Scaled Energy Block Breadings for the currently connected device, selectPrevious Scaled Energy Block from the Real-Time Poll>Revenue, Energy, and DemandReadings menu. You will see the screen shown below.
Click OK to return to the main Communicator EXT screen.

Electro Industries/GaugeTech Doc # E107707 7-21
7.3.12: Mean, Block Max/Min for Interval 1 and 2
To view the previous Means and Block Max/Min readings for Interval 1 and 2 for the currently con-nected device, select Mean, Block Max/Min for Interval 1 and 2 from the Real-TimePoll>Revenue, Energy, and Demand Readings menu. You will see the screen shown below.
Click Copy to copy the screen data to the clipboard. From there you can paste it into another pro-gram, such as Excel.
Click OK to return to the main Communicator EXT screen.

E Electro Industries/GaugeTech DOC # E107707 7-22
7.4: Power Quality and Alarms 7.4.1: Phasors
The Phasors screen displays the phase relationships of the currently connected device. The Frequency, Configuration, and Form (Nexus 1262/1272, only) appear at the top of the screen.
Select Phasors from the Real-Time Poll>Power Quality and Alarms menu, or click the Phasors icon on the Icon bar. You will see the screen shown below.
If you have an auxiliary voltage reading (i.e. generator and bus where the VAux is the generator), Aux box and the VAux Phasor are displayed. The VAux Phasor is referenced to VA phase.

E Electro Industries/GaugeTech DOC # E107707 7-23
To adjust the Phasor display, click Options at the bottom of the screen. You will see one of the screens shown below, depending on which EIG device you are connected to.
• Click the checkbox next to Display Voltage Phase To Phase Readings When In Wye Configuration, if you want to include that reading in the graph.
NOTE: This option is only available for Nexus meters. • In the Display Angles Increasing and Phasor Rotation boxes, select either Clockwise
or Counter Clockwise. • From the pull-down menu at the bottom of the screen, select Vectors, Triangles or
Vectors and Triangles to change the graphic representation of the data.
Click OK to save your selections and return to the main Phasors screen.
Use the Buttons at the bottom of the screen to complete the following tasks:
• Click Copy to save a copy of the screen to the clipboard. • Click Print to send a copy of the graph to a printer.
• Click Help to view instructions for this screen.
• Click OK to return to the main Communicator EXT screen.

E Electro Industries/GaugeTech DOC # E107707 7-24
7.4.2: Poll Harmonics
To view Harmonic Magnitudes for the currently connected device, select Poll Harmonics from the Real-Time Poll>Power Quality and Alarms menu. You will see the screen shown below.
NOTE: You will only see the TDD and KFactor fields when you are viewing Harmonic Magnitudes for Current.
To change the presentation format, click on the Values, Spectrum or Waveform buttons. The screen above is in Values mode. The screen to the right is in Spectrum Mode. The screen on the next page is in Waveform Mode.
To change the channel, use the pull-down menu beneath the Spectrum radio button. Select from Volts A, B, C or Current (I) A, B, C.

E Electro Industries/GaugeTech DOC # E107707 7-25
Use the scroll bar at the right side of the screen to access all of the values.
• Click Print to send the data to a printer.
• Click Copy to send the contents of the screen to the clipboard. You can then copy it into another program.
• Click OK to return to the main
Communicator EXT screen. 7.4.3: Flicker
To view Flicker data for the currently connected device, select Flicker from the Real-Time Poll>Power Quality and Alarms menu. You will see the screen shown below.
• To view Short Term or Long Term Flicker data, click on the tabs at the top of the screen. You will see the screens shown on the next page.
• Use the Flicker Monitoring buttons to Start or Stop Flicker monitoring or to Reset
the meter’s Flicker monitoring.
• Click Print to send the data to a printer.
• Click OK to return to the main Communicator EXT screen.

E Electro Industries/GaugeTech DOC # E107707 7-26

E Electro Industries/GaugeTech DOC # E107707 7-27
7.4.4: Alarm (Limit) Status
To view Alarm (Limit) Status data for the currently connected device, select Alarm Status from the Real-Time Poll>Power Quality and Alarms menu. You will see the screen shown below.
This screen displays the status of the Limits set in the connected meter’s Device Profile (see chapters 3, 4, and 19 for instructions). To change any of the settings: 1. Click OK to return to the main Communicator EXT screen. 2. Click the Profile icon. 3. Double-click on Limits and any of the settings to access the programming screen.
Click Print to send the data to a printer.
Click OK to return to the main Communicator EXT screen. NOTE: To adjust the column width, position the cursor on a line between columns at the top of the screen. When the cursor changes to a left/right arrow, hold down the left mouse button and drag the column border left or right. Release the button when the column is at the desired width.

Electro Industries/GaugeTech Doc # E107707 7-28
7.4.5: Nexus Electrologic Status
To view the status of Relay Control for the currently connected device, select Nexus ElecroLogicStatus from the Real-Time Poll>Power Quality and Alarms menu. You will see the screen shownbelow.
Click the drop-down menu to choose the Relay you want to view .
Click Print to send a screen capture to the connected printer .
Click OK to return to the main Communicator EXT screen.

7.4.6: Poll Internal Digital Inputs
To view data for the Internal High Speed Inputs of the currently connected device, select PollInternal Inputs from the Real-Time Poll>Power Quality and Alarms Menu. The Internal DigitalInputs screen appears.
To make changes to the settings for the meter’sHigh Speed Inputs:
1. Click OK to return to the main Communicator EXT screen.
2. Click Profile.
3. Follow the instructions for programming the meter’s High Speed Inputs in Chapters 3, 4, and 19.
Electro Industries/GaugeTech Doc # E107707 7-29

E Electro Industries/GaugeTech DOC # E107707 7-30
7.4.7: Poll Digital Input Option Cards (Nexus® 1500 meter)
If you have a Nexus® 1500 meter with a Digital Input Option card, you will see Poll Digital Input Option Cards in the Real-Time Poll>Poll Power Quality and Alarms menu. Click this option to see the screen shown below.
1. This screen allows you to view State and transition data for the inputs.
2. To reset the counters, select the counters you want to reset from the pull-down menu and click Reset.
3. Click OK to close the screen and return to the main Communicator EXT screen; click Copy to copy the data to the Clipboard.
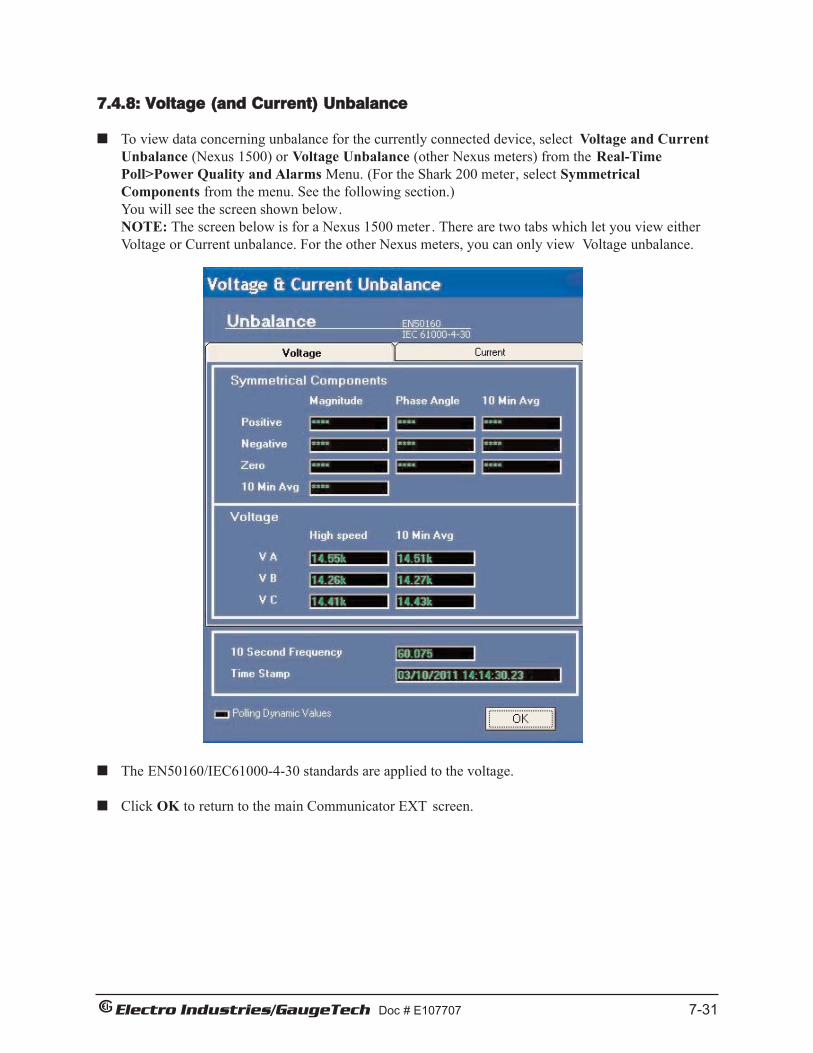
Electro Industries/GaugeTech Doc # E107707 7-31
7.4.8: Voltage (and Current) Unbalance
To view data concerning unbalance for the currently connected device, select Voltage and CurrentUnbalance (Nexus 1500) or Voltage Unbalance (other Nexus meters) from the Real-TimePoll>Power Quality and Alarms Menu. (For the Shark 200 meter, select SymmetricalComponents from the menu. See the following section.) You will see the screen shown below.NOTE: The screen below is for a Nexus 1500 meter . There are two tabs which let you view eitherVoltage or Current unbalance. For the other Nexus meters, you can only view Voltage unbalance.
The EN50160/IEC61000-4-30 standards are applied to the voltage.
Click OK to return to the main Communicator EXT screen.

Electro Industries/GaugeTech Doc # E107707 7-32
7.4.9: Symmetrical Components
To view Symmetrical Components data for the currently connected device, select SymmetricalComponents from the Real-Time Poll>Power Quality and Alarms Menu. You will see the screenshown below.
You can view the symmetrical components for Voltage or Current by clicking the radio button nextto either option.NOTE: If you are connected to a Shark 200 meter , you will see a slightly dif ferent screen, whichalso displays Cuurent unbalance and zero sequence and negative sequence Voltage unbalance.
The drop-down menus allow you to select Scaling and the direction of the displayed angles.
Click OK to return to the main Communicator EXT screen.

E Electro Industries/GaugeTech DOC # E107707 7-33
7.5: Shark® Series Polling Screens
Some of the Shark® Series Polling screens are the same as those for the Nexus® meters. See earlier sections of this chapter for information on the following screens: Instantaneous Polling (Section 7.2.1), Phasors (Section 7.4.1), Harmonics (Section 7.4.2), and Symmetrical Components (Section 7.4.8). The following sections show additional Polling screens for the Shark® Series meters. Some screens may differ, depending on whether you are connected to a Shark® 100 or 200 meter, and some are unique to the Shark® 200 meter. The example screens are taken from a Shark® 200 meter.
7.5.1: Poll Real Time Trends
1. Click Real-Time Poll>Real Time Trends. This screen allows you to view trending for the selected parameters.
2. To view parameters on the graph: a. Click the check box(es) next to the value(s) you want to display. b. The Poll Interval can be changed. Set this value to 0 to poll as quickly as possible. (When ‘0’ has been entered, the field displays ‘****.’) c. To create a .csv (Comma Separated Value Excel file) containing a log of the polling values, enter a value greater than 0 in the AutoStore Interval field. The software will store in its directory all polling values (regardless of the selections on the screen) in the .csv file on the interval (in seconds) entered in the AutoStore Interval field. NOTE: For manual storage, click the Store button at the bottom of the screen. d. Either: • Use the Min and Max Y Values fields to specify the Y Range for the graph; or • Check the Auto Scale box to let the software calculate the best Y Range values for the graph.
NOTE: If your desktop is very small, the screen will be divided in half. Click View Graph to see the Graph portion of the screen; click View Settings to see the Settings portion of the screen.
3. Click Start to begin polling; click Stop to stop polling. Other options are as follows: • Click Store to perform a manual store of the current polling values in a .csv file. • Click Copy to copy the graph to the Clipboard. • Click Print: to print the screen. • Click Cancel: to return to the main Communicator EXT screen.

E Electro Industries/GaugeTech DOC # E107707 7-34
7.5.2: Poll Max and Min Readings (Shark® 200 meter)
Click Real-Time Poll>Real Time Readings>Poll Max and Min Readings. This screen displays the maximum and minimum values and the time of their occurrence for all of the meter’s Real-Time readings. Use the scroll bar to view readings not displayed on the screen. 1. Click Copy to copy the readings to the
clipboard. You can then paste them into another document, for example, an Excel file.
2. Click OK to close the screen. 7.5.3: Poll Power and Energy Click Real-Time Poll>Revenue, Energy and Demand Readings>Power and Energy. This screen displays the power and energy for Total Power and all three phases.
NOTE: If you are connected to a Shark® 100 meter, you will only see Total readings.
1. For the Shark® 200 meter, click the tabs at the top to select the view you want: • Total • Phase A • Phase B • Phase C
2. Click Print to print the readings. 3. Click OK to close the screen.

E Electro Industries/GaugeTech DOC # E107707 7-35
7.5.4: Poll Internal Digital Inputs (Shark® 200 meter)
Click Real-Time Poll>Power Quality and Alarms>Poll Internal Digital Inputs. This screen displays the status (Open or Closed) of the Digital Inputs of any installed Relay Output/Digital Input or Pulse Output/Digital Input Option card.
Click Close to close the screen.
7.5.5: Poll Limits
Click Real-Time Poll>Power Quality and Alarms>Limits. This screen displays the current status of any Limits programmed in the Device Profile. NOTE: See Section 5.3.3.7 for additional information on Limits and configuring them for the Shark® 200 meter.
1. The displayed fields are: • Limit ID – the identification of the limit. • Label - the item the Limit is set for. • Value – the current reading for this item. • Status/Limit1/Limit2 – whether the current reading is “In” or “Out” for the Above (Limit
1) and Below (Limit 2) Setpoints. • Limit 1/Setting/Point/Hysteresis – Above: the point above which the reading goes out of
limit (Setpoint) and the point at which it returns to within limit (Hysteresis). • Limit 2/Setting/Point/Hysteresis – Below: the point below which the reading goes out of
limit (Setpoint) and the point at which it returns to within limit (Hysteresis).
2. Click Print to print the screen.
3. Click OK to close the screen.
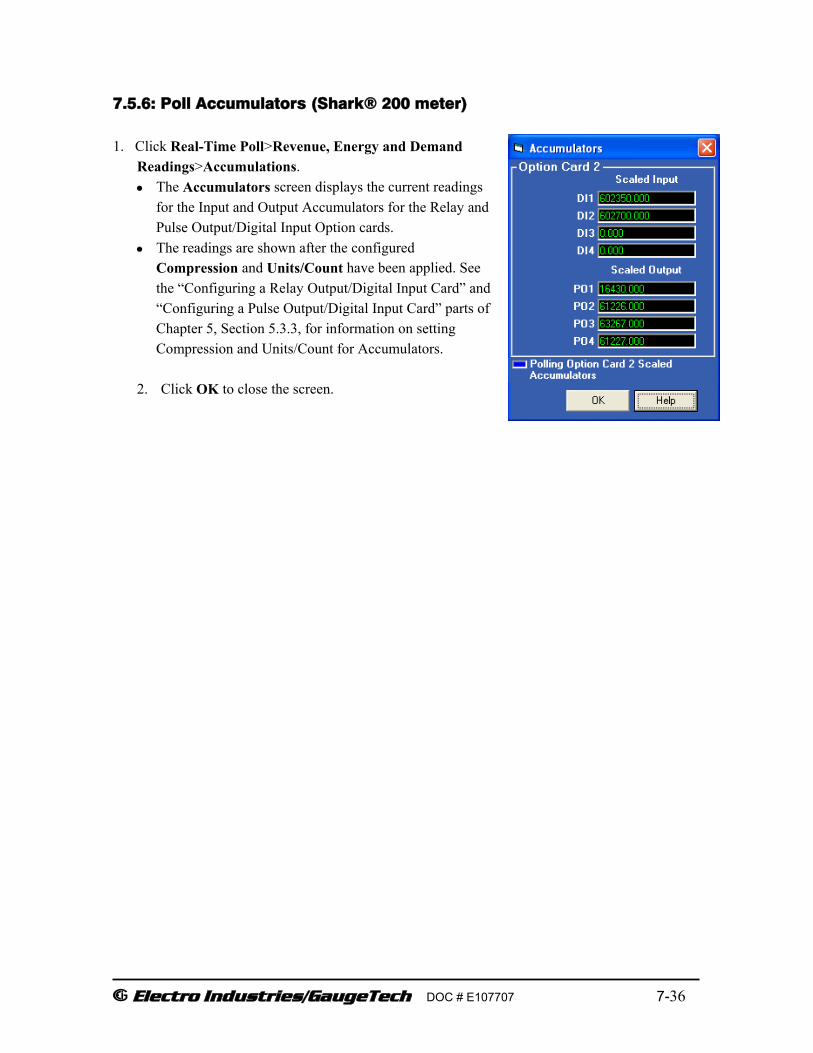
E Electro Industries/GaugeTech DOC # E107707 7-36
7.5.6: Poll Accumulators (Shark® 200 meter)
1. Click Real-Time Poll>Revenue, Energy and Demand Readings>Accumulations. • The Accumulators screen displays the current readings
for the Input and Output Accumulators for the Relay and Pulse Output/Digital Input Option cards.
• The readings are shown after the configured Compression and Units/Count have been applied. See the “Configuring a Relay Output/Digital Input Card” and “Configuring a Pulse Output/Digital Input Card” parts of Chapter 5, Section 5.3.3, for information on setting Compression and Units/Count for Accumulators.
2. Click OK to close the screen.

E Electro Industries/GaugeTech DOC # E107707 7-37
7.6: RTU Polling Screen The Nexus 1500 meter has an additional polling screen that shows RTU status, when Port 2 is set as an RTU Master (see Section 19-18).
1. Click Real-Time Poll>RTU Polling Screen. You will see the screen shown below.
2. Click Show Details to see more information. See the screen below.

E Electro Industries/GaugeTech DOC # E107707 7-38
3. Click the pull-down menus next to Decimal Places and Register Format to choose viewing options.
4. Click Reset Error Counters if you want to perform that reset.
5. Click OK to close the RTU Polling screen and return to the Communicator EXT Main
screen.

Chapter 8Viewing Logs
8.1: Overview
Following is a list of available logs for EIG meters. (Not all of the logs are available for every meter-model.)
• Historical Trends Logs: Nexus® 12xx meters - 2 Historical Logs; Futura+- 1 HistoricalLog; Shark® 200 meter- 3 Historical Logs; Nexus® 1500 meter - 8 Historical Logs)These logs are collections of time-stamped records (or “snapshots”) used to track any parameterover time. Each record or snapshot can contain multiple data items, which are recorded atspecific intervals and stamped with the time of recording. The following programmable criteriadetermine when the meter will take a snapshot:
—The user-specified time interval—A parameter’s exceeding of a limit or a return to within limits—The capture of a waveform—An I/O event (a change in a relay or High-speed input)
NOTE: A Nexus® 1252 meter with V-Switch™ key 2 can use Historical Log 2 for EN50160logging.
• Limits Log The Limits Log retrieves independent out-of-limit information, creating a sequence of events forany occurrence.
• Event-Triggered Waveform Log The Event-Triggered Waveform Log records a waveform when a user-programmable value goesout of limit and when the value returns to normal. All information is time-stamped to the nearest1msec. A new feature for interharmonic analysis observes further frequencies.
• Power Quality (CBEMA) LogThis log records magnitude and duration of voltage and current surges and sags for every powerquality (PQ) event. The associated waveform is also recorded.
• Status Change (Input) Log This log displays the input change status for a selected meter file and time range.
• Control Output (Relay) Log This log displays the relay change status for a selected meter file and time range.
• AiReportsAiReports 2.0 is an optional power quality analysis software package used in conjunction withthe meter logs. It provides a comprehensive report on the status of the equipment being moni-tored; it uses artificial intelligence to diagnose PQ events and provide the possible cause of theevent.
• System Events Log This log records when firmware was changed, when logs were retrieved and the duration of theretrieval. The System Event Log provides data for security and anti-tampering.
e Electro Industries/GaugeTech Doc # E107707 8-1

e Electro Industries/GaugeTech Doc # E107707 8-2
• Flicker LogThe log records Flicker information for a selected meter and time range.
• Reset LogThis log is generated by the connected device when Device Profile or meter is reset.
• Transient Log/EN50160 IEC61000-4-30 Log - Nexus® 1500 meterThe Transient log lets you view voltage transients and the EN50160/IEC61000-4-30 log generates a report.
• I/O Change Log - Shark® 200 meter: See Section 8.25.1.for information.
The following is the general sequence for working with all logs:
1. Program parameters specific to each log in the meter’s Device Profile (Section 8.2). Logs runautomatically.
2. Retrieve the logs manually from the meter (Section 8.3); or retrieve logs automatically using theNexus® Script & Scheduler Program. See Chapter 15 for further details.
3. View and analyze log data with Communicator EXT’s Log Viewer (Sections 8.5–8.24, 8.26).
4. Diagnose PQ Events from meter logs, create comprehensive report, transmit, modify, print orexport file with optional AiReports software (Section 8.14).
Free Space Calculation Feature: The Log Converter automatically checks your computer and calculates the amount of free space on your hard drive. This calculation is performed to insureenough hard drive space for the Log Converter to operate. Above are the parameters for the calculations and the actual calculation performed by the meter.
NOTE: Min%ofFreeSpace and MinFreeSpace Values are set in the LogConverter.ini file.
CALCULATION:
Min%THDS x THDS = CalMinFSIf CalMinFS < MinSetFS then CalMinFS = MinSetFSIf CalMinFS <= THDFS then OKIf CalMinFS > THDFS then Need More Space on your HD
FREE SPACE CALCULATION PARAMETERS
ITEM DESCRIPTION MINIMUM VALUETHDS
THDFS
MIN%THDS
MinSetFSCalMinFS
Total Hard Disk SpaceTotal Hard Disk Free Space
Minimum % of Free Space of Total Space(Min%ofFreeSpace)
1(After 3/19/2002)
Minimum Free Space (MinFreeSpace) 50MCalculated Minimum Free Space

e Electro Industries/GaugeTech DOC # E107707 8-3
8.2: Programming and Running Transient Logs
1. Program the following parameters specific to each type of log in the meter's Device Profile. See Chapter 3 (1252), Chapter 4 (1262/1272), Chapter 5 (Shark®, Futura+), Chapter 19 (1500) for details. Limit and Waveform Full Scales Limits Trending Setup Trending Log Time Intervals Power Quality and Waveform Thresholds Labels - YOU MUST LABEL THE METER
NOTE: Anytime you update the Device Profile, a pop-up screen will ask if you would like to reset the logs. Resetting the logs is recommended if you make changes to the CT&PT Ratios, Limits, or Limit Full Scales.
2. You do not need to start the logs - the meter is always recording. 3. To confirm the parameters and track the progress of the logs, select Statistics from the Log
menu (or click on the Log Status icon). You will see the Log Statistics screen. Below is an example of this screen from a Nexus® 1500 meter.
NOTE: See Section 8.25 for instructions on viewing the Shark® 200 meter's Log Statistics screen.

e Electro Industries/GaugeTech DOC # E107707 8-4
8.3: Retrieving Logs Follow these stapes to retrieve logs from the meter and convert them for viewing and analysis. NOTE: See Section 8.26 for instructions on retrieving logs from the Shark® 200 meter. 1. Click the Retrieve Logs icon, or select Logs>Retrieve Log(s) from Device. you will see a
screen that lets you select the logs to retrieve. Below is an example screen from the Nexus® 1500 meter.
2. Click the checkbox of the logs you want to retrieve from the meter, or double-click on the log in
the screen if you doesn't have a checkbox. Communicator EXT will retrieve only those logs with a check or a "Yes" in the retrieve column (depending on the type of screen you see).
3. Click Start. Communicator EXT begins to retrieve the logs. You will see a screen showing
progress. If you are connected to a Nexus® 12xx Series meter, you will a screen like the one shown below.

If you are connected to a Nexus® 1500 meter, you will see the screen shown shown on the right as the logs are being retrieved.• Click Details to display retrieval
information on the bottom of this screen.• Click Cancel to cancel log retrieval.
5. After Communicator EXT has retrieved the log(s) it converts the data. The Log Converter application runs automatically.
6. Communicator EXT then runs Log Viewer: See sections 8.4–8.24, and 8.26 for information on usingLog Viewer.
Note: Retrieve logs as often as you want. Each time you retrieve a log file, Communicator EXTappends only the newest records and captures to the existing database. These “partial downloads”,such as the example above, are listed in Log Viewer’s Database Status screen (see Section 8.13).Snapshots, or partial downloads, must be a time frame within the database dates. Otherwise, there isno data from which to retrieve the snapshot.
e Electro Industries/GaugeTech Doc # E107707 8-5
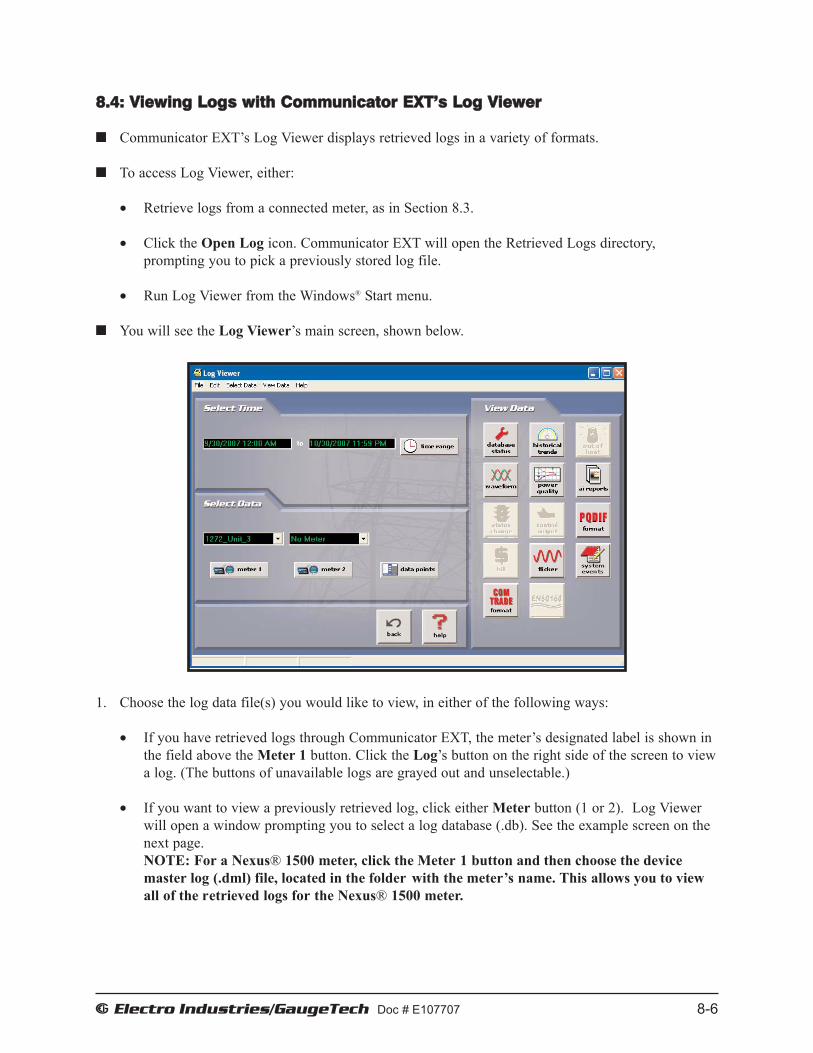
8.4: Viewing Logs with Communicator EXT’s Log Viewer
Communicator EXT’s Log Viewer displays retrieved logs in a variety of formats.
To access Log Viewer, either:
• Retrieve logs from a connected meter, as in Section 8.3.
• Click the Open Log icon. Communicator EXT will open the Retrieved Logs directory, prompting you to pick a previously stored log file.
• Run Log Viewer from the Windows® Start menu.
You will see the Log Viewer’s main screen, shown below.
1. Choose the log data file(s) you would like to view, in either of the following ways:
• If you have retrieved logs through Communicator EXT, the meter’s designated label is shown inthe field above the Meter 1 button. Click the Log’s button on the right side of the screen to viewa log. (The buttons of unavailable logs are grayed out and unselectable.)
• If you want to view a previously retrieved log, click either Meter button (1 or 2). Log Viewerwill open a window prompting you to select a log database (.db). See the example screen on thenext page.NOTE: For a Nexus® 1500 meter, click the Meter 1 button and then choose the devicemaster log (.dml) file, located in the folder with the meter’s name. This allows you to viewall of the retrieved logs for the Nexus® 1500 meter.
e Electro Industries/GaugeTech Doc # E107707 8-6

2. Select the file you want and click Open.NOTES: • You may choose a different log file (.db) for Meter 1 and for Meter 2. • If you select a .dml file for the Nexus® 1500 meter, you can only see the retrieved logs for that
meter: you cannot select a second meter.
3. Select what log data points you would like to view by clicking on the Data Points button in theSelect Data section. You will see the screen shown below.
• The available Data Points vary with the type of log and the parameters set for it. From theAvailable Data Points column, click on the data points you want to include when viewing the logfile. To select multiple points, hold down the Ctrl key while clicking. To select a sequence ofpoints, hold down the Shift key while clicking.
• Click the Add button to move the Data Points to the Selected Data Points column.
• Click the Restore button to return the selection to its previous setting.
4. When you have made your selection, click OK to return to Log Viewer’s main screen.
e Electro Industries/GaugeTech Doc # E107707 8-7
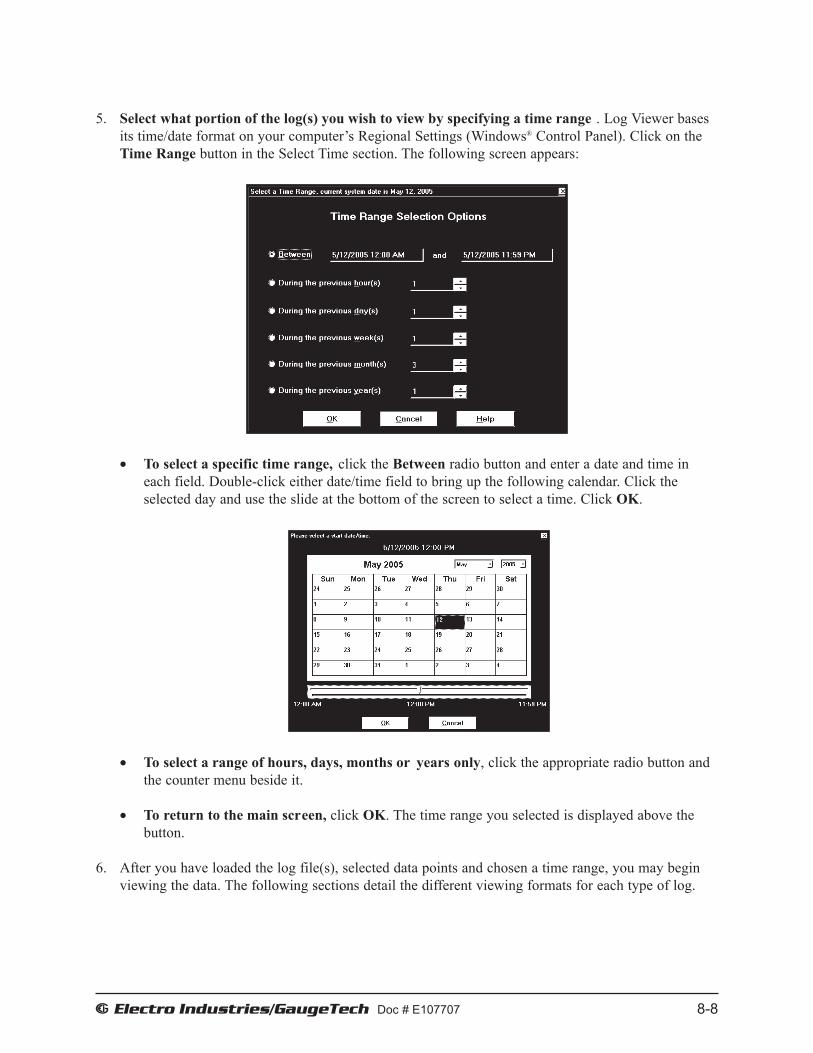
5. Select what portion of the log(s) you wish to view by specifying a time range . Log Viewer basesits time/date format on your computer’s Regional Settings (Windows® Control Panel). Click on theTime Range button in the Select Time section. The following screen appears:
• To select a specific time range, click the Between radio button and enter a date and time ineach field. Double-click either date/time field to bring up the following calendar. Click theselected day and use the slide at the bottom of the screen to select a time. Click OK.
• To select a range of hours, days, months or years only, click the appropriate radio button andthe counter menu beside it.
• To return to the main screen, click OK. The time range you selected is displayed above thebutton.
6. After you have loaded the log file(s), selected data points and chosen a time range, you may beginviewing the data. The following sections detail the different viewing formats for each type of log.
e Electro Industries/GaugeTech Doc # E107707 8-8

8.5: Viewing Historical Trends and Snapshots
From Log Viewer’s main screen, click on the Historical Trends button or View Data>Snapshots.Log Viewer will display Snapshot Information for the selected log file(s) based on the time rangeand data points specified in the Select Data and Time Range windows of the main screen (Section8.4).
• The name of the log file (“Feeder 1” in this example) and the type of data point are listed in thetop row.
• The viewer can move columns, so that the most important data is most accessible. Right-clickon the column title and drag it to the desired location on the table. Repeat as desired to customize the table.
• To save the data to your clipboard, right-click with the cursor positioned anywhere in table.
• To sort the data by record type in either ascending or descending order, click on the Sort buttonand use the pull-down menu to make your selection.
See the Section 8.8 for details on viewing Snapshot Graphs.
e Electro Industries/GaugeTech Doc # E107707 8-9
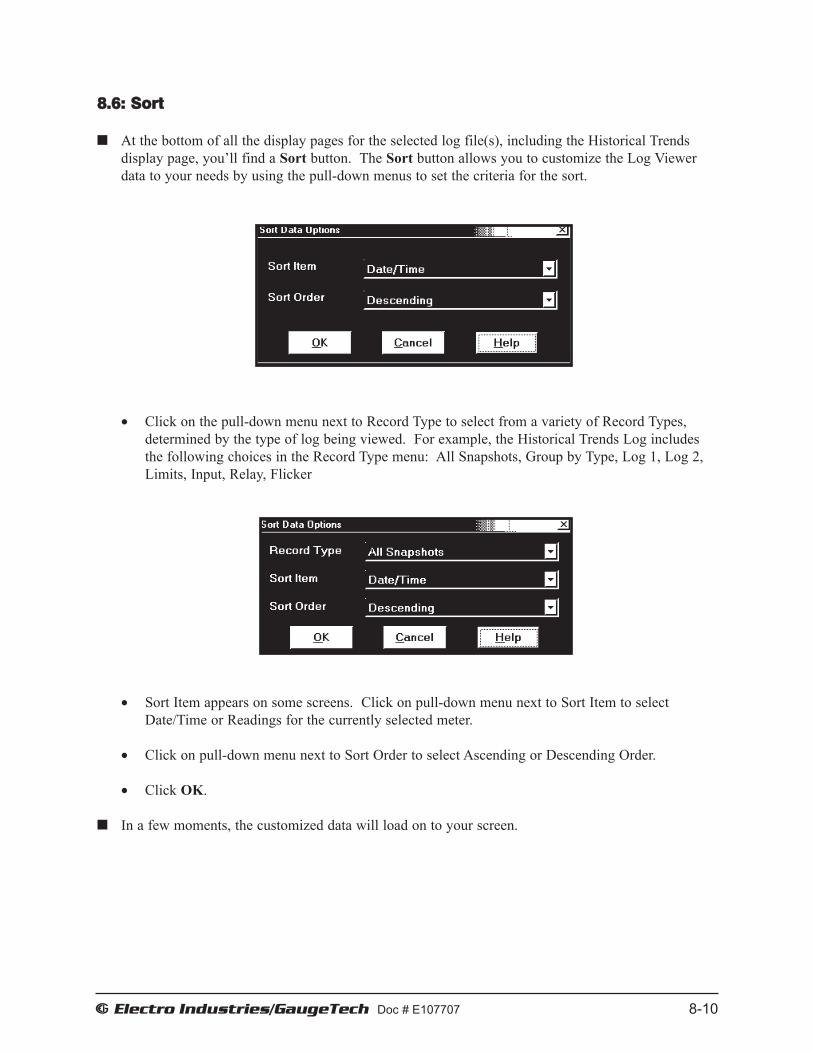
e Electro Industries/GaugeTech Doc # E107707 8-10
8.6: Sort
At the bottom of all the display pages for the selected log file(s), including the Historical Trends display page, you’ll find a Sort button. The Sort button allows you to customize the Log Viewerdata to your needs by using the pull-down menus to set the criteria for the sort.
• Click on the pull-down menu next to Record Type to select from a variety of Record Types, determined by the type of log being viewed. For example, the Historical Trends Log includes the following choices in the Record Type menu: All Snapshots, Group by Type, Log 1, Log 2, Limits, Input, Relay, Flicker
• Sort Item appears on some screens. Click on pull-down menu next to Sort Item to select Date/Time or Readings for the currently selected meter.
• Click on pull-down menu next to Sort Order to select Ascending or Descending Order.
• Click OK.
In a few moments, the customized data will load on to your screen.

E Electro Industries/GaugeTech DOC # E107707 8-11
8.7: Viewing Graphs
1. Click Graph from the EIG Log Viewer screen.
2. Select the parameters you want to graph from the Available Items list and click the Add button to add them to the Graph Items list. You can select up to six parameters. If you want to remove a parameter from the Graph Items list, highlight it and click the Remove button.
NOTE: Holding down the Ctrl key allows you to add or remove multiple items.
3. Click either:
• Advanced Graph • XY Graph • Circular Graph

E Electro Industries/GaugeTech DOC # E107707 8-12
8.7.1: Advanced Graph
The Advanced Graph enables you to view Historical log data for up to six data points. The features of this graph allow you to analyze the data quickly and efficiently. It gives you the capability to zero in on particular ranges of data, view bar, line, or point graphs, view information about individual data points, and customize the presentation of your data in a variety of ways. You can also print graphs from this screen. If you are using a Historical log for Input Triggered Logging and want to view the data, use the Millisecond option of this graph. The next page shows a figure of the Advanced Graph, with captions describing its features.
Advanced Graph Showing Data Points

E Electro Industries/GaugeTech DOC # E107707 8-13
Choose Graph Colors
Choose Data Range
Change Point Drawing Tool
Zoom Buttons
Advanced Graph – Showing Features
Current Graph Tab
Time Range of Current Graph
Displayed Date
Displayed Increments of Date
Main Graph
Preview Window
Displayed Channels
Y Axis Range
Create Millisecond View Graph
Close the Current View
Print the Current View
View Data Set Info
Display Data PointsAnd Info Marker Tool Zoom Extents –
View All
X Axis Range

E Electro Industries/GaugeTech DOC # E107707 8-14
Features of the Advanced Graph: • The upper portion of the Advanced Graph serves as a Preview window – it shows the entire
range of data. The Preview window can be used to “zero in” on the data you want to view. • The Main Graph displays selected data. • The top of the Main Graph lists the data points you are looking at and the colors of their pens. • The Set button (also available from View>Data
Set in the Title bar), displays the Max and Min values over the entire data range and the time stamps. Select a channel from the drop-down menu.
• The Pts button (also available from
View>Data Points in the Title bar), gives you a crosshair you use to view the time and value of any point in the Main Graph. Move the crosshair with your mouse and the time and value will display in the upper left corner of the Main Graph.
• Clicking on a data point in the Main
Graph gives you the Channel, Value, and Time Stamp for that data point.
Time and Value at the Crosshair’s Mark Click on a point to
display the point’s information

E Electro Industries/GaugeTech DOC # E107707 8-15
• Use the Msec button to view data generated with an interval of milliseconds.
o You can select specific channels if you do not want to see all of the data points. o You can select a start time and date. o You can enter the duration of the millisecond view in the Duration field.
Click the Generate button to generate the millisecond graph. The Millisecond Graph is created in front of the Main Graph. A tab for the Millisecond Graph will appear next to the Main Graph 1 tab at the bottom of the screen. See the figure on the next page.
Duration Of the MillisecondView
Select Channels to Display
Start Date for Millisecond View
Click to Generate Graph

E Electro Industries/GaugeTech DOC # E107707 8-16
NOTES: o You can create multiple
Millisecond Graphs. Use the tabs to navigate between the Main Graph and any Millisecond Graphs. NOTE: You must return to the Main Graph before creating a new Millisecond Graph.
o The Close button in the Title bar closes the currently active Millisecond Graph.
o When you are using the Millisecond Graph it is recommended that you determine the start time of the first value and the duration by clicking on the Main Graph. Then use those values in the Millisecond screen entry fields, described previously.
• Click the Color button in the Title bar to change background and pen color for the graphs.
The currently used colors are displayed. If you click on one of the color squares, a screen opens that allows you to select colors to use for the graph’s back color, grid color, text color, or parameters.
Click Define Custom Colors if you want to use a use a color not shown. When you have selected the color you want, click the OK button. Click Cancel to close the Color window without selecting a new color.

E Electro Industries/GaugeTech DOC # E107707 8-17
• Click the Print button in the Title bar to print the currently active graph on your default printer.
Navigating the Advanced Graph:
• Click on a point in the Preview window to center the Main Graph display on that point. A red box appears in the preview window that shows where the Main Graph display appears in the total range of data. You can left click and drag on the Preview window to select a range of data to view in the Main Graph.
• The Preview window has buttons on the right that allow you to shift its display up and down, and zoom buttons on the left that allow you to zoom in and out on the Y axis (the X axis cannot change).
• Right click and drag in the body of the Main Graph to move the X and Y axes. • Use the Left click + Ctrl button in the Main Graph to zoom out (can also use the Zoom
Out icons in the Title bar) • Use the Left click + Shift button in the Main Graph to zoom in (can also use the Zoom In
icons in the Title bar) • Zoom In and Zoom Out -X and Y buttons on Title bar allow you to zoom in and out on
the axes • The All button allows you to view all the data at once.
Advanced Navigation Features:
• Start Time and End Time fields at the bottom of the Main Graph show the range of the data shown. You can change the start and end times and click Set Date Range to change the display.
• Click the Range button in the Title bar (or Click View>Range Select). The Vertical Ranges window allows you to change the Maximum and Minimum Range for the Y Axis (Vertical). Use the Interval Gap to specify the maximum distance between plotted points over which the graph draws a line. If you don’t want data points connected with a line, make the Interval Gap smaller.

E Electro Industries/GaugeTech DOC # E107707 8-18
• To view two sets of data with different ranges at the same time:
1. Click Options>Reorder Sets from the Title bar.
2. Select the points you want to display using the right axis’s range and click the Regraph button. The rest of the data will display using the left axis’s range.
3. To view both sets of data at the same time, use the Vertical Ranges window (shown above) to set the right axis’s range.
• To view sets of data with intervals of less than a second: 1. Click Tools>Search for Data
Captures. 2. Click Next to move the Main Graph
display to the next data capture. You can select a single channel from the drop-down menu next to Focus on Data Set. This is only useful if data point times do not overlap, since data points will be displayed on the same graph. The Start At fields allow you to set a start point for data captures.
8.7.2: XY and Circular Graphs 1. To display Trending or Demand data as either an XY or Circular graph, click on the XY button
or the Circular Graph button from the Select Parameters to Graph screen (see Section 8.7).
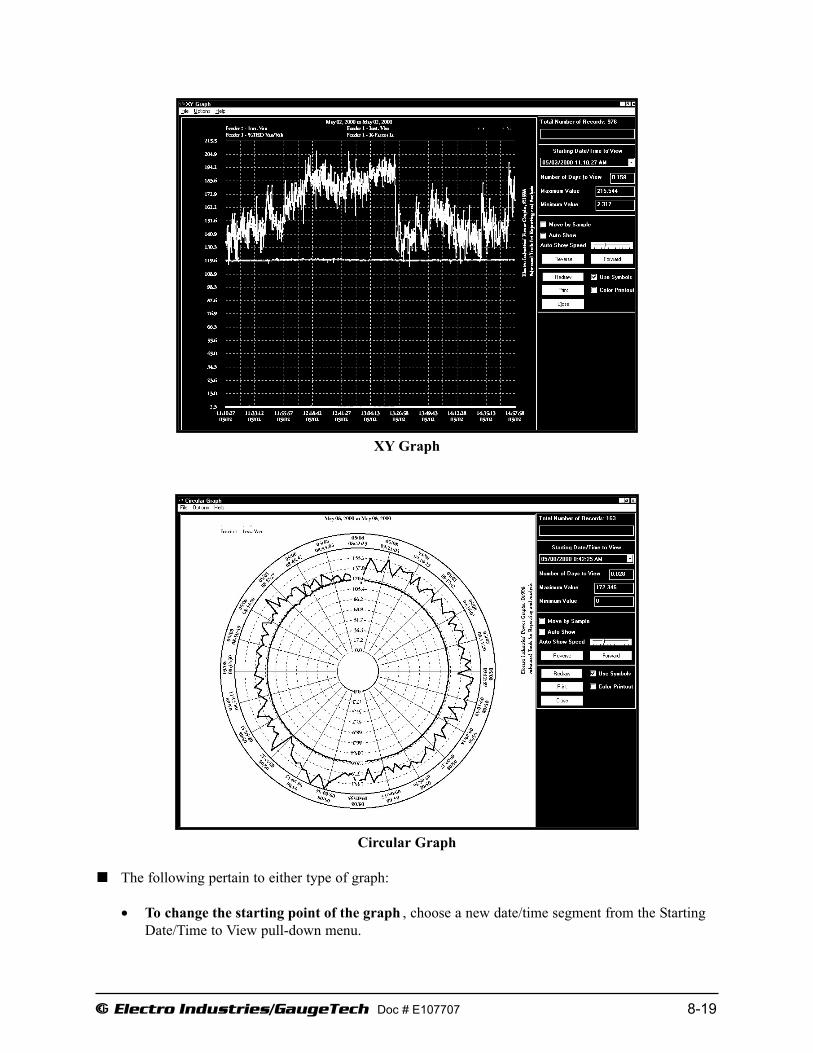
XY Graph
Circular Graph
The following pertain to either type of graph:
• To change the starting point of the graph , choose a new date/time segment from the StartingDate/Time to View pull-down menu.
e Electro Industries/GaugeTech Doc # E107707 8-19

• To change the amount of time represented on the graph, enter a value in the Number of Daysto View field and press enter or click on the Redraw button.
• To change the scale of the graph , enter a value in the Minimum Value and Maximum Valuefields and press enter or the Redraw button.
• To view one sample at a time , click in the Move by Sample box; then click on the Forward orReverse buttons each time you would like to view the next (or previous) sample.
• To view a continuous, sample-by-sample rendering of the graph, click the Move by Samplebox and the Auto Show box. Select a speed by sliding the Auto Show Speed bar left or right;click on the Forward or Reverse button to determine the direction of the Auto Show. To stopAuto Show, deselect the Auto Show box.
• To print the graph on a color printer, check the Color Printout box and click Print.
• To print the graph on a black-and-white printer, click the Use Symbols box and click Print.
• To copy the graph data to the computer ’s clipboard, select Copy from the File menu. Pastethe data into a spread sheet, such as Excel.
• To export the graph’s data, select Export Data from the File menu.
• To change the graph’s color assignments, select Select Colors from the Options menu. The following screen appears:
The small squares under the Color heading represent the color currently assigned to eachcomponent of the graph. To make adjustments to an Item’s color, click the radio button beside itand create a new color by moving the red, green and blue sliders. Create black by moving allsliders down, white by moving all sliders up.
e Electro Industries/GaugeTech Doc # E107707 8-20
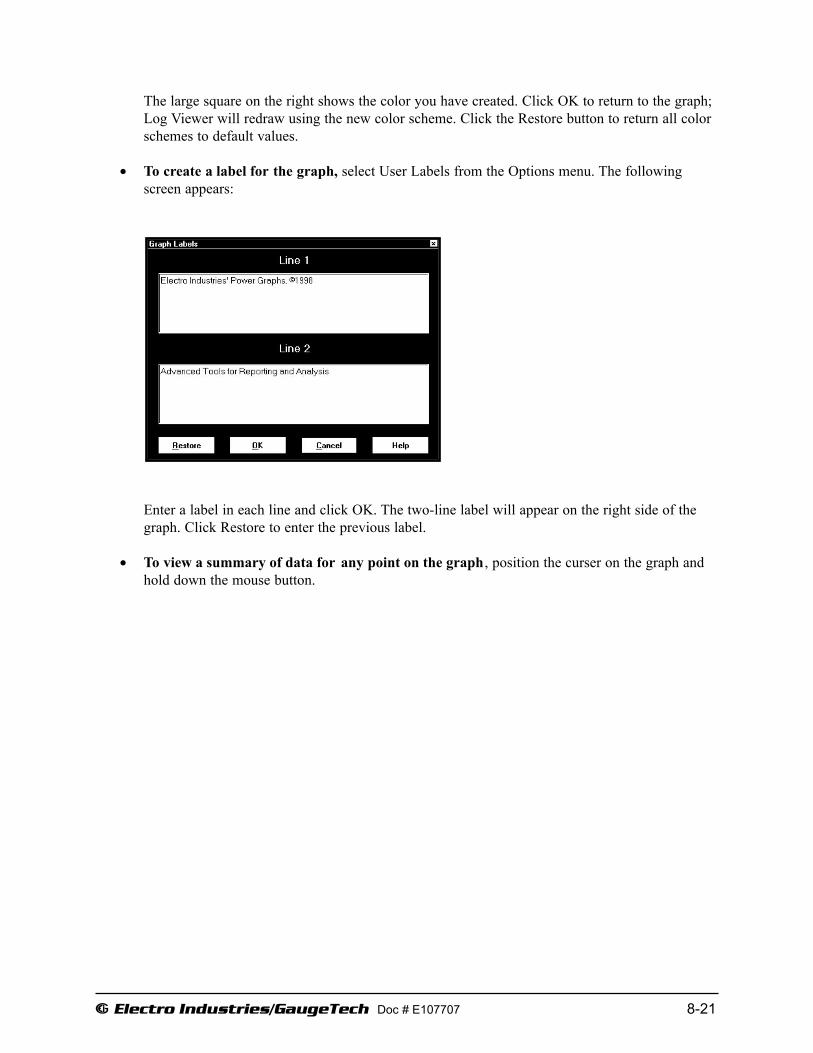
The large square on the right shows the color you have created. Click OK to return to the graph;Log Viewer will redraw using the new color scheme. Click the Restore button to return all colorschemes to default values.
• To create a label for the graph, select User Labels from the Options menu. The followingscreen appears:
Enter a label in each line and click OK. The two-line label will appear on the right side of thegraph. Click Restore to enter the previous label.
• To view a summary of data for any point on the graph, position the curser on the graph andhold down the mouse button.
e Electro Industries/GaugeTech Doc # E107707 8-21

8.8: Viewing the Limits Log
From Log Viewer’s main screen click on the Limits button or View Data, Limits. Log Viewer displays limit information for the selected log file(s) based on the time range specified in the SelectTime Range section of its main screen (see Section 8.4).
• Click the Show Snapshots box on the left side of the screen to display the limits snapshotinformation.
• To copy the data to the computer’s clipboard, right-click with the cursor positioned anywhere inthe table.
• To sort the data by record type in either ascending or descending order, click on the Sort buttonand use the pull-down menus to make your selection.
e Electro Industries/GaugeTech Doc # E107707 8-22

8.9: Viewing the Waveform Log
From Log Viewer’s main screen (section 8.4), click on the Waveform button or View Data,Waveform. Log Viewer will display waveform information for the selected log file(s) based on thetime range specified in the Select Time Range section of its main screen.
NOTE:Futura+ Waveform Time Precision is 1 second.
• To save the data to your clipboard, right-click anywhere in table.
• To view the Waveform Settings, click on a waveform record and then click the ShowWaveform Settings box on the left side of the screen.
• To adjust the column widths , position the cursor between columns at the top of the screen.When the cursor changes to a left/right arrow, hold down the left mouse button and drag the column border left or right. Release the button when the column is at the desired width.
• To sort the data by record type in either ascending or descending order, click on the Sortbutton and use the pull-down menus to make your selection.
• To view the waveform graphs , see the following section.
e Electro Industries/GaugeTech Doc # E107707 8-23

8.10: Viewing Waveform Graphs
To view any waveform in the main Waveform Log screen (Section 8.9), click on the desired recordand then click the Graph button (or double-click on the desired record).
• To change the Waveform Display Settings, click the Options button in the upper left corner of the screen. You will see the Waveform Display Settings screen, shown below.
NOTE: For Futura+ models, you must select the correct “Futura+ Freq(Hz)” for your system. This is located in line item 7 in the Waveform Display Settings screen. If an incorrect system frequency is selected, erroneous timestamps will be displayed on the X-axis.
e Electro Industries/GaugeTech Doc # E107707 8-24

Configurable options include:1. Start Up Mode: Classic, Overlay or Overlay (group)2. Overlay Mode: Overlay or Group3. Plotting Method: Line, Point or Line and Point (Line and Point is slower than the
other two options.)4. Colors: Background, Foreground, Subsets (User can reverse the colors.)5. Point Sizes for Each Subset: Small, Medium, Large or Micro6. Line Types for Each Subset: Pull-down menu offers Dashed, Dot, Dash Dot, Dash
Dot Dot, Medium Solid, Thick Solid, Medium Thin Solid, Medium Thick Solid, Extra Thick Solid.
7. Item Point Types for Each Subset: Pull-down menu offers Plus, Cross, Solid Circle, Square, Solid Square, Diamond, Solid Diamond, Upward Triangle, Solid Upward Triangle, Downward Triangle, Solid Downward Triangle, Dash or Pixel.
• To include the Iaux in the graph , click the Iaux On button; click the Iaux Off button toremove its display. Double click on the Iaux graph for a closer view.
•• To include the High Speed Inputs in the graph , click the Inputs On button. Double click onthe Inputs graph for a closer view. Each input is listed on the Y axis followed by a 1 or 0—a 1denotes that the input is open; a 0 denotes that the input is closed. Click Inputs Off to remove
their display.
• To Print the graph, click the Print Graph button.
• To Export an image from the screen, click the Export Picture button.
• To Export the data only , click the Export Data button.
• To view the previous or next waveform record, click the Previous or Next buttons.
• To Zoom In on a portion of the graph, click and drag to form a box; then, double click.
• To Zoom Out, click the Zoom Out button.
• To view the Waveform Properties, click Waveform Properties button. The following screenappears:
e Electro Industries/GaugeTech Doc # E107707 8-25
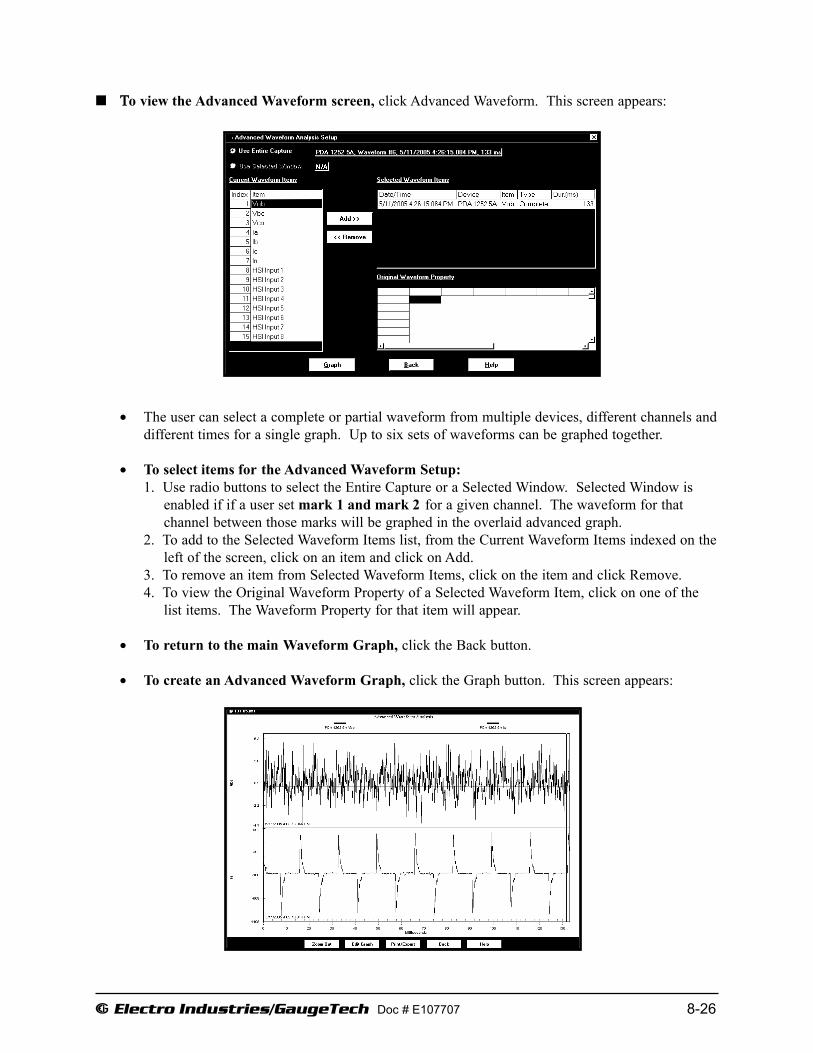
ΤΤo view the Advanced Waveform screen, click Advanced Waveform. This screen appears:
• The user can select a complete or partial waveform from multiple devices, different channels and different times for a single graph. Up to six sets of waveforms can be graphed together.
• To select items for the Advanced Waveform Setup:1. Use radio buttons to select the Entire Capture or a Selected Window. Selected Window is
enabled if if a user set mark 1 and mark 2 for a given channel. The waveform for that channel between those marks will be graphed in the overlaid advanced graph.
2. To add to the Selected Waveform Items list, from the Current Waveform Items indexed on theleft of the screen, click on an item and click on Add.
3. To remove an item from Selected Waveform Items, click on the item and click Remove.4. To view the Original Waveform Property of a Selected Waveform Item, click on one of the
list items. The Waveform Property for that item will appear.
• To return to the main Waveform Graph, click the Back button.
• To create an Advanced Waveform Graph, click the Graph button. This screen appears:
e Electro Industries/GaugeTech Doc # E107707 8-26
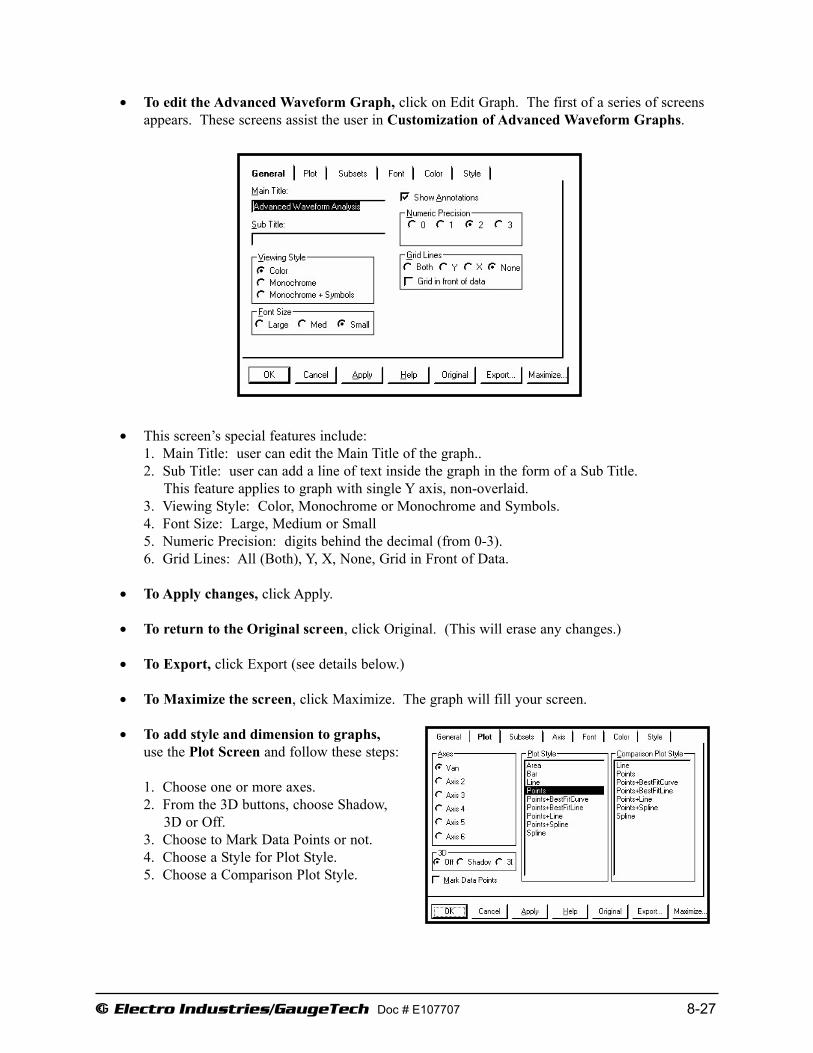
• To edit the Advanced Waveform Graph, click on Edit Graph. The first of a series of screens appears. These screens assist the user in Customization of Advanced Waveform Graphs.
• This screen’s special features include:1. Main Title: user can edit the Main Title of the graph..2. Sub Title: user can add a line of text inside the graph in the form of a Sub Title.
This feature applies to graph with single Y axis, non-overlaid.3. Viewing Style: Color, Monochrome or Monochrome and Symbols.4. Font Size: Large, Medium or Small5. Numeric Precision: digits behind the decimal (from 0-3).6. Grid Lines: All (Both), Y, X, None, Grid in Front of Data.
• To Apply changes, click Apply.
• To return to the Original screen, click Original. (This will erase any changes.)
• To Export, click Export (see details below.)
• To Maximize the screen, click Maximize. The graph will fill your screen.
• To add style and dimension to graphs,use the Plot Screen and follow these steps:
1. Choose one or more axes.2. From the 3D buttons, choose Shadow,
3D or Off.3. Choose to Mark Data Points or not.4. Choose a Style for Plot Style.5. Choose a Comparison Plot Style.
e Electro Industries/GaugeTech Doc # E107707 8-27
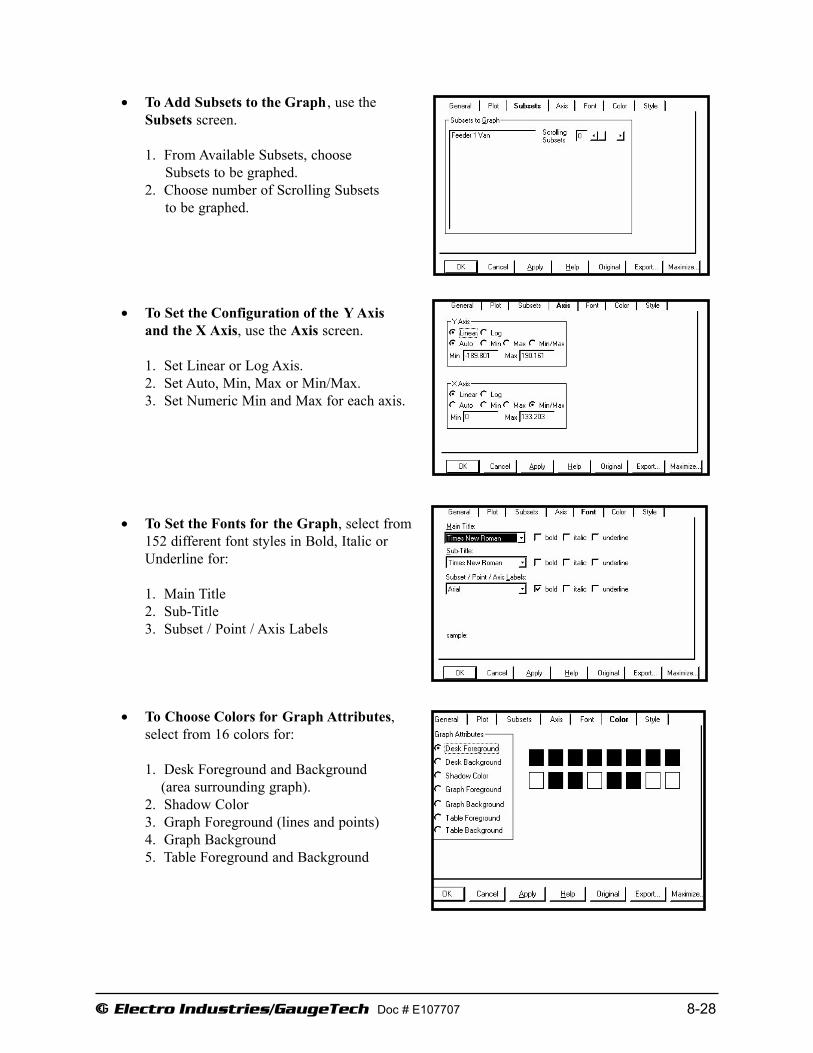
e Electro Industries/GaugeTech Doc # E107707 8-28
• To Add Subsets to the Graph , use the Subsets screen.
1. From Available Subsets, choose Subsets to be graphed.
2. Choose number of Scrolling Subsets to be graphed.
• To Set the Configuration of the Y Axis and the X Axis, use the Axis screen.
1. Set Linear or Log Axis.2. Set Auto, Min, Max or Min/Max.3. Set Numeric Min and Max for each axis.
• To Set the Fonts for the Graph, select from 152 different font styles in Bold, Italic or Underline for:
1. Main Title2. Sub-Title3. Subset / Point / Axis Labels
• To Choose Colors for Graph Attributes, select from 16 colors for:
1. Desk Foreground and Background (area surrounding graph).
2. Shadow Color3. Graph Foreground (lines and points)4. Graph Background5. Table Foreground and Background
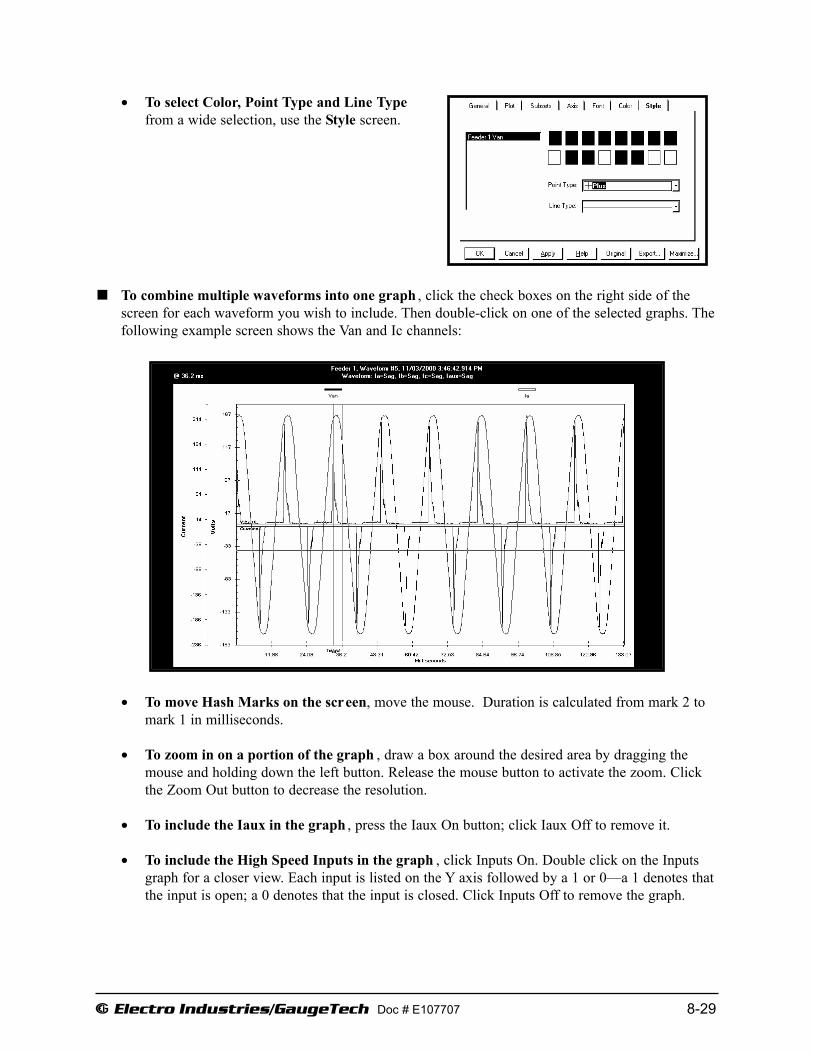
e Electro Industries/GaugeTech Doc # E107707 8-29
• To select Color, Point Type and Line Typefrom a wide selection, use the Style screen.
To combine multiple waveforms into one graph , click the check boxes on the right side of thescreen for each waveform you wish to include. Then double-click on one of the selected graphs. Thefollowing example screen shows the Van and Ic channels:
• To move Hash Marks on the screen, move the mouse. Duration is calculated from mark 2 to mark 1 in milliseconds.
• To zoom in on a portion of the graph , draw a box around the desired area by dragging themouse and holding down the left button. Release the mouse button to activate the zoom. Clickthe Zoom Out button to decrease the resolution.
• To include the Iaux in the graph , press the Iaux On button; click Iaux Off to remove it.
• To include the High Speed Inputs in the graph , click Inputs On. Double click on the Inputsgraph for a closer view. Each input is listed on the Y axis followed by a 1 or 0—a 1 denotes thatthe input is open; a 0 denotes that the input is closed. Click Inputs Off to remove the graph.

• To Print the graph, click the Print Graph button.
• To Export an image from the screen, click the Export Picture button.
• To Export the data only , click the Export Data button.
To view a detailed graph of one Item , double-click on the desired Item.
• To view details for this waveform, click on the Waveform Details On button. The followingscreen appears:
• To return to the previous graph, click Back or click Waveform Details Off.
• To Zoom In on a portion of the graph , draw a box around the desired area by dragging themouse and holding down the left button. Release the mouse button to active the zoom.
• To Zoom Out on a portion of the graph , click the Zoom Out button to decrease the resolution.
e Electro Industries/GaugeTech Doc # E107707 8-30
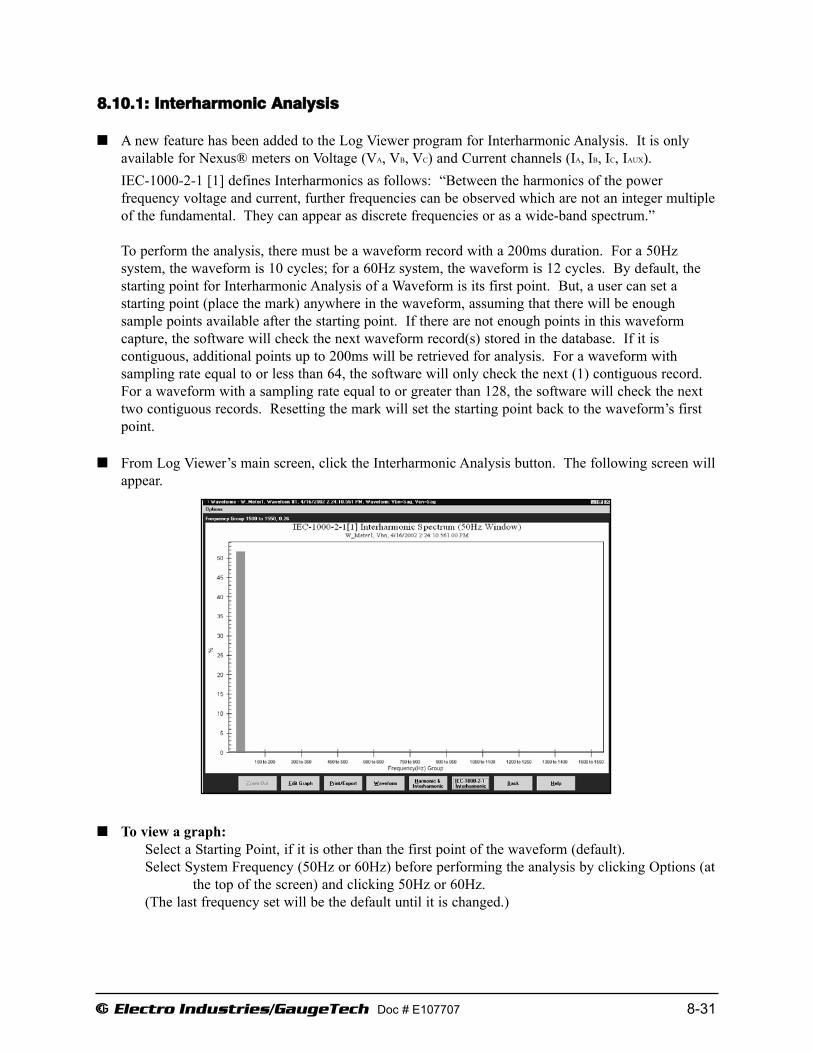
8.10.1: Interharmonic Analysis
A new feature has been added to the Log Viewer program for Interharmonic Analysis. It is onlyavailable for Nexus® meters on Voltage (VA, VB, VC) and Current channels (IA, IB, IC, IAUX). IEC-1000-2-1 [1] defines Interharmonics as follows: “Between the harmonics of the power frequency voltage and current, further frequencies can be observed which are not an integer multipleof the fundamental. They can appear as discrete frequencies or as a wide-band spectrum.”
To perform the analysis, there must be a waveform record with a 200ms duration. For a 50Hz system, the waveform is 10 cycles; for a 60Hz system, the waveform is 12 cycles. By default, thestarting point for Interharmonic Analysis of a Waveform is its first point. But, a user can set a starting point (place the mark) anywhere in the waveform, assuming that there will be enough sample points available after the starting point. If there are not enough points in this waveform capture, the software will check the next waveform record(s) stored in the database. If it is contiguous, additional points up to 200ms will be retrieved for analysis. For a waveform with sampling rate equal to or less than 64, the software will only check the next (1) contiguous record.For a waveform with a sampling rate equal to or greater than 128, the software will check the nexttwo contiguous records. Resetting the mark will set the starting point back to the waveform’s firstpoint.
From Log Viewer’s main screen, click the Interharmonic Analysis button. The following screen willappear.
To view a graph:Select a Starting Point, if it is other than the first point of the waveform (default).Select System Frequency (50Hz or 60Hz) before performing the analysis by clicking Options (at
the top of the screen) and clicking 50Hz or 60Hz. (The last frequency set will be the default until it is changed.)
e Electro Industries/GaugeTech Doc # E107707 8-31

e Electro Industries/GaugeTech Doc # E107707 8-32
Three graphs will be displayed:
The 200ms Waveform (10 cycles or 12 cycles)
Normalized Harmonic Spectrum of the Waveform

Interharmonic Spectrum with Grouped Frequencies
Measurement: IEC 61000-4-7 ([ref] First Edition) establishes a well disciplined measurementmethod for harmonics which utilizes 10 (50Hz systems) or 12 cycle (60Hz systems) sample windows upon which to perform the Fourier transform. The result is a spectrum with 5Hz resolution for both 50Hz and 60Hz systems. The standard further defines ways of combining individual 5 Hz bins to produce various groupings and components for referenced limits and guidelines.
The IEC Measurement Method defines interharmonic groups. These indices are the RMS values ofthe interharmonic components between adjacent harmonic components. The frequency bins directlyadjacent to the harmonic bins are omitted. This relationship is defined by the following equation:
(50Hz systems)
(60Hz systems)
e Electro Industries/GaugeTech Doc # E107707 8-33
∑=
+=
10
2
2
12
2
iinIH xx
∑=
+=
8
2
2
10
2
iinIH xx

8.11: Viewing the Power Quality Log
From Log Viewer’s main screen, click on the PQ button or View Data, Power Quality. Log Viewerwill display power quality information for the selected log file(s) based on the time range specifiedin the Select Time Range section of its main screen (see section 8.4).
• To save the data to your clipboard, right-click with the cursor positioned anywhere in table.
• To view waveform information associated with a r ecord or a range of records, click on therecord(s) and then click the Show Waveform Settings box on the left side of the screen.
• To view the PQ/Waveform Settings, click on the record(s) and then click the PQ/WaveformSettings box.
• To view a waveform, double-click on the waveform record. See section 8.10 for details onviewing waveforms.
• To adjust the column widths , position the cursor between columns at the top of the screen.When the cursor changes to a left/right arrow, hold down the left mouse button and drag the column border left or right. Release the button when the column is at the desired width.
8.12: Viewing the Power Quality Graph
To view a graph of any PQ r ecord, click on the desired record and then click the Graph button.The following screen appears. Use the pull-down menu on the lower right of the screen to access a3D graph and a Histogram of the record.
e Electro Industries/GaugeTech Doc # E107707 8-34

Power Quality Graph
Power Quality Graph in 3D
NOTE: Use Scroll Bars on the side and bottom of the screen to adjust the view.
e Electro Industries/GaugeTech Doc # E107707 8-35
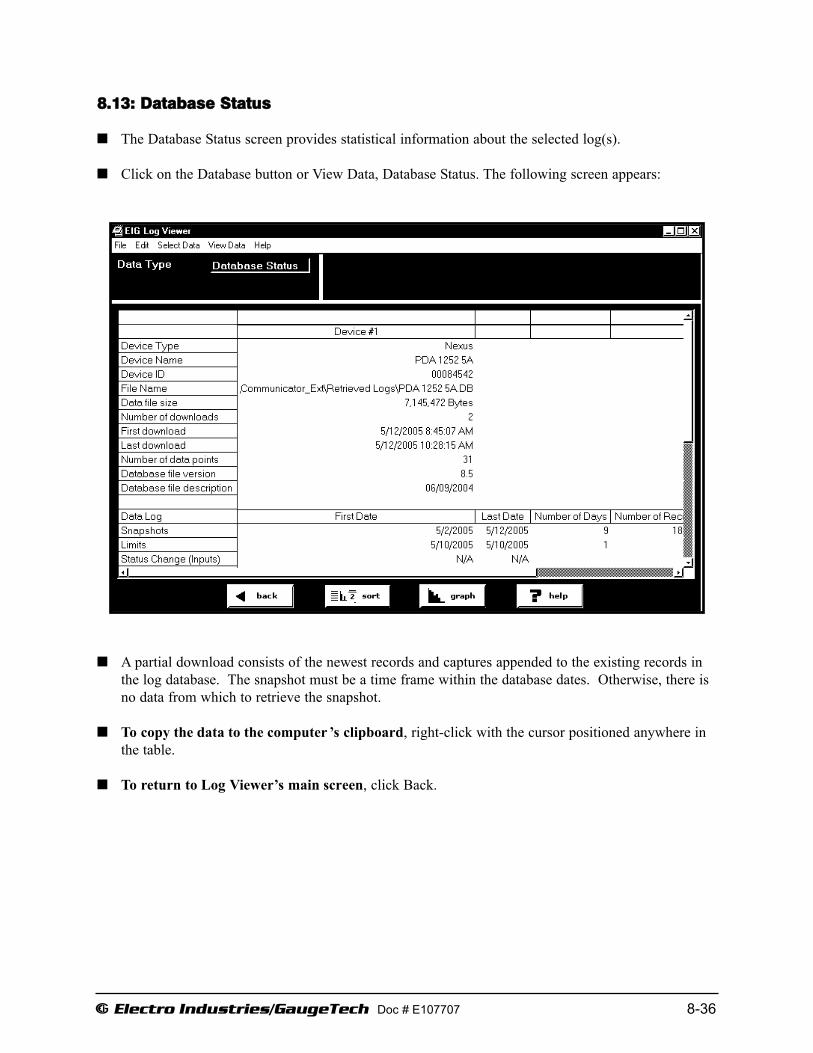
8.13: Database Status
The Database Status screen provides statistical information about the selected log(s).
Click on the Database button or View Data, Database Status. The following screen appears:
A partial download consists of the newest records and captures appended to the existing records inthe log database. The snapshot must be a time frame within the database dates. Otherwise, there isno data from which to retrieve the snapshot.
To copy the data to the computer ’s clipboard, right-click with the cursor positioned anywhere inthe table.
To return to Log Viewer’s main screen, click Back.
e Electro Industries/GaugeTech Doc # E107707 8-36

e Electro Industries/GaugeTech Doc # E107707 8-37
8.14: AiReports
AiReports 2.0 is an optional power quality analysis software package used in conjunction withCommunicator EXT Logs. It provides a comprehensive report on the status of the equipment beingmonitored and it uses artificial intelligence to diagnose PQ events and pr ovide the possiblecause of the event. The screen below is an example of one of the screens.
AiReports 2.0 must be installed on your computer for the view button to be enabled. Otherwise, thebutton will be disabled.
To view the AiReport: From the EIG Log Viewer, you must select a meter database file for Meter 1and set a Time Range. Click on the AiReports button and the report will be generated.
Once the detailed report is generated, you can transmit it to a colleague, modify the report with yourfavorite word processing software, print it and/or export the file using PDF format.
Reasons for Incomplete Analysis:• AiReports for Communicator EXT analyzes the voltage waveform records in the meter
database file. If the file does not contain any voltage waveform records, AiReports will not run.
• AiReports will not perform a valid analysis on a waveform record if it was converted by the LogConverter program with a version of v1.0.11 (June 26, 2000) or older.

e Electro Industries/GaugeTech Doc # E107707 8-38
8.15: PQDIF Converter
The latest release of AiReports includes a new useful feature, PQDIF Converter. Power QualityData Interchange Format (PQDIF) is a tagged, compressible binary file format which offers a platform-neutral, flexible means of exchanging power quality data between instruments and datamanagement and analysis software. PQDIF is currently under adoption by EPRI as the standard fileformat for power quality data and under consideration by IEEE as its standard file format.
Using the PQDIF Export Feature with Log Viewer.
• System Requirements: Installation of AiReports with NEXAIPWR.DII file version 2.1.0.8 or higher. PQDIF Viewer Program optional.
• Meters Supported: Electro Industries' Nexus® Series.
• Operation:1. Use the Meter 1 button, select a DB file with waveform data.2. Select a Time Range.3. Press the “PQDIF Format” button.4. Select a PQDIF file name (*.PQD) to which you will export data. 5. Click OK. PQDIF exports the waveform data and converts it to PQDIF format.
8.16: COMTRADE Converter
The latest release of AiReports includes a new useful feature, COMTRADE Converter. CommonFormat for Transient Data Exchange (COMTRADE) is a standard that defines a format for the filescontaining transient waveform and event data collected from power systems or power system models. The format is intended to provide an easily interpretable form for use in exchanging data.As such, it does not make use of the economies available from data encoding and compression thatproprietary formats depend upon for competitive advantage. The standard is for files stored on physical media, such as digital hard drives and diskettes. It is not a standard for transferring datafiles over communication networks. This standard defines a common format for the data files andexchange medium needed for the interchange of various types of fault, test and simulation data.
The COMTRADE Converter carefully adheres to COMTRADE specification IEC 60255-24 (2001).
File types and operations:COMTRADE converter will generate the following types of files.
filename.cfgfilename.datfilename.inffilename.d##filename_*.cfgfilename_*.datfilename_*.inffilename_*.d##

The term 'filename' represents the user specified file name. The symbol '##' represents a value from '00' through '99'. The symbol '*' is the number of 1 or above for each additional waveform record. File type 'cfg' is for Configuration. File type 'dat' is for Data. File type 'inf' is for Information.
The software requires user to enter a unique filename each time the COMTRADE converter runs.Upon COMTRADE Converter startup, it will scan all files with the filename provided by the user ata location associated with COMTRADE (file types listed above). If it finds any file that alreadyexists, the software will issue a warning message and no conversion will take place. NOTE: The software will not overwrite an existing file; it will only convert to a new filename.
Using the COMTRADE Converter Feature with Log Viewer.
• System Requirements: Installation of AiReports with NEXAIPWR.DII file version 2.1.2.8 or higher. COMTRADE Viewer Program is optional.
• Meters Supported: Electro Industries' Nexus® Series.
• Log Viewer Operation:1. Use the Meter 1 button, select a DB file with Nexus® meter waveform data.2. Select a Time Range.3. Press the "COMTRADE format" button.4. Enter a unique file name (file extension is not need) to which you will export data.5. Click OK.
COMTRADE Converter exports the waveform data and converts it to COMTRADE format files.
e Electro Industries/GaugeTech Doc # E107707 8-39

8.17: HHF Converter
The HHF Converter converts downloaded Historical Logs from Nexus® Series Meters to HHF formatfor use with Itron’s MV-90 Meter Reading System. The HHF Adapter converts data as it is down-loaded to a meter. It cannot retroactively convert data that has already been stored in the Communi-cator database. This limitation is due to the method MV-90 uses to retrieve HHF format files.
The HHF Converter is a standalone executable application module that is called from Communi-cator EXT when a log is downloaded from the meter and HHF is enabled. This process is automaticonce HHF is enabled. This application intercepts the data being downloaded and simultaneouslyconverts the data to HHF format.
8.17.1: Enable HHF Converter
From the View menu, click Options > Miscellaneous
The Miscellaneous screen appears.
Click Enable HHF ConverterHHF is now Enabled.
Click HHF OptionsHHF Options screen appears.
8.17.2: HHF Options Settings
Select Historical Log
Check Log 1 or 2.
Type in Scaling Value: An integer bywhich all input values are divided beforebeing placed into the HHF files. Values must be rescaled when loadedinto MV-90.NOTE on Scaling: If Input Values exceed 1,000,000, a Scaling Value must be used to bring the values below1,000,000. This is due to the limitations of the HHF File Format.
HHF File Path: Root directory for all HHF files. A folder for each meter with converted files iscreated in this path and .hhf files for that meter are placed in that folder. Default Directory for HHFFolders: InstallDir/CommEXT/Retrieve logs/HHF files NOTE: See section 8.17.5 for HHF details.
Exit HHF Options: Click to return to the Miscellaneous screen. On Misc screen, click Apply to save changes. Click OK to close.
e Electro Industries/GaugeTech Doc # E107707 8-40

8.17.3: Set Up Nexus® Meter Logs for Use with HHF Converter
1. In Communicator EXT, open the Device Profile for the currently connected Nexus® meter.
2. Click on Trending Profile Settings > Trending Setup > Log 1 (or Log 2).The Trending Log Profile screen appears.
3. Click the “<HHF>”button in the center of the screen.
The HHF button automatically sets up a default Historical Log and settings for the log.
The HHF changes include the following:
a. All items are removed.
b. Four items are added: Q1+4 Interval Primary, Q2+3 Interval Primary, Q1+2 Interval Primary, Q3+4 Interval Primary
c. The Interval between Records is set at 15 minutes.
d. The Accumulation Interval is set at 15 minutes.
4. Click OK to go back to the Device Profile screen.
5. Click Update Device to save the settings to the meter.A “Resetting Logs” Warning appears. Click OK. The meter is updated.
NOTE: These settings can be changed. However, the following must be kept in mind:1. Only Intervalled Energy Items can be used.2. The Record Interval and the Accumulation Interval MUST be the same. If they are not,
the .hhf file created may be corrupt. These intervals are set in the Device Profile.Record Interval is set in the Trending Log Time Interval (Sections 3.6.1, 4.6.1, 19.7.1).Accumulation Interval is set in Energy, Pulses and Accumulations in the Interval
(Sections 3.4.9, 4.4.9, 19.5.8). 3. There can be a maximum of 16 items.
e Electro Industries/GaugeTech Doc # E107707 8-41

8.17.4: Set Up MV-990 for Use with Nexus® HHF Files
Set up MV-90 with the following steps:
1. Open MV-90 and go to the MV-90 menu.
2. In System-Control > System Parameters > Operations > Data Retrieval > Portable Readers, click Enable Edit.
Change the value of “Retrieval/Import Key” to “Device ID” andclick Save.
3. Go to Operations > UOM Codes > Descriptions. Verify that Code 1 is kWh/kW and Code 3 is kVARh/kVAR. These are the default MV-90 Mappings.Exit System Parameters.
4. Back at the MV-90 menu, go to Databases > Master File > Maintenance.
5. Click on Edit > New Customer.
The “Add Customer, Recorder & Channels” screen appears.
On this series of screens, you will create a New Master File Entry.
Enter the Customer, Recorder and Device ID.NOTE: The Device ID must match the Meter Name of the Nexus® device being used.
6. Set the Number of Channels to 4. Click OK.The next screen appears.
Electro Industries/GaugeTech Doc # E107707 8-42

7. On this screen,Enter CustomerInformation (Shaded Line)
Click the SAVE button to continue to the next screen.
On this screen,Enter Recorder (Device)Information.
If the meter has its Daylight Savings Time Option turned on, make sure the DST Option is checked in the Recorder Information.
DST Option: More tab > Device Follows DST.
Electro Industries/GaugeTech Doc # E107707 8-43

8. Enter Channel Information on the first tab.
Enter Multipliers & Readings Informationon the second tab.
For Channel 1: On the Channel tab, set the Unit of Measure to 1 and on the Multipliers & Readings tab, set Meter & Pulse Multiplier to 0.0001 (kWh). Fill out any other relevant information.
For Channel 2:On the Channel tab, set the Unit of Measure to 1 and on the Multipliers & Readings tab, set Meter & Pulse Multiplier to 0.0001 (kWh). Fill out any other relevantinformation.
For Channel 3: On the Channel tab, set the Unit of Measure to 3 and on the Multipliers & Readings tab, set Meter & Pulse Multiplier to 0.0001 (kVARh). Fill out any other relevant information.
For Channel 4:On the Channel tab, set the Unit of Measure to 3 and on the Multipliers & Readings tab, set Meter & Pulse Multiplier to 0.0001 (kVARh). Fill out any other relevant information.
Electro Industries/GaugeTech Doc # E107707 8-44

8.17.5: Import an HHF File in MV-990
Use the following steps to import a file:
1. Open MV-90 and go to the MV-90 menu. In MV-90’s Menu Mode, go to Retrieve-Data > Import Reader File.
The “Reader File Import” screen appears.
2. On the “Reader File Import” screen, browse for an .hhf file to import.
3. Verify that Device ID and Read Time are correct.
4. Click “Schedule”
or “Run Now.”
“Run Now”(Icon of man running) imports the file now; “Schedule” (Calendar) imports it later.
When a file is imported,a Report is generated (overview of data and success of importing).See MV-90 Documentationto locate report.
5. The .hhf file importtask should show up in the Task List box. If it doesn’t, click the “Scan for Tasks” button.
6. The “Time In” box lists when the task was loaded. The “Time Due” box lists when the task is scheduled to run.
7. When an .hhf file is imported, it is added to the database for that client. This data can be viewed in many ways. See MV-90 Documentation for details.
Electro Industries/GaugeTech Doc # E107707 8-45
Browse button

e Electro Industries/GaugeTech Doc # E107707 8-46
NOTE: MV-90 is based on a DOS Program. File names must not contain spaces (including folder names). All “spaces” should be represented by “_” (underscore). Folder names cannot be longer than 8 spaces. When setting up MV-90, make sure that all paths follow these limitations.
The Progress Window that is displayed while converting the logs. This window is always displayed. The window is composed of two parts:
Progress Bar: A bar which displays the percentage complete in graphical (bar) and text (%) format.
Text: Output which specifies the actions being taken by the converter, including errorsencountered.
8.17.6: HHF Files
Naming Convention: All .hhf files are named using the following template:<meter name>”_”<year>“-”<month>“-”<day>“_”<hour>“-”<minute>“_”<format><# in sequence>
“.hhf”NOTE: The Date (year, month and day) is the date of the oldest record in the log.
Log File: Contains a list of actions taken by the converter in the process of converting the Nexus® meter's file into .hhf format that may cause irregularities in the data. Additionally, it contains any errorsthat were encountered while converting. For example: Data that cannot be represented in .hhf format is found in this file. Shown here is a typical example of Retrieved Log Files.
[HHF file list][Conversion action list][Error list]
Conversion Action List: List of all the conflicts with the HHF format that occurred in the Nexus® meter's file and the action taken to convert the files.
-Trim <Time><Reason>: Value discarded from the .hhf file. “Time” is the time stamp of the value discarded and “Reason” is one of the following:
-Invalid Interval: Timestamp falls off the even time intervals. Value timestamps are rounded and overlaps are deleted.
-Invalid Time: Timestamp either lies before the given beginning of the log or after the given end of the log. The record containing the timestamp has been removed from the list.
-Pad <Time start>”-”<Time end><Reason>: The values for the interval before “Time start” are repeated until “Time end”. “Reason” can be:
-Missing Interval: Original log missing values to make a continuous log. Values are added to maintain proper timestamps.
e Electro Industries/GaugeTech Doc # E107707 8-47
Error List: List of all errors encountered during conversion.
-Error in file <File Name> “at” <Position>: Parsing error while extracting data from the input file. Position is the number of bytes from the beginning of the file to where the error occurred. This error most often occurs when an invalid log record type is included in the input.
-Value out of range <Timestamp> <Channel> <Value>: The given channel’s value in the interval given by timestamp is outside of the range HHF can represent.
-File not found <File Name>: The given input file (with path) does not exist.
-File overwritten <File Name>: One of the created files in the path has the same name as an existing file. The old file has been overwritten.
-File collision <File Name>: One of the created files in the path has the same name as an existing file and that file cannot be deleted. The new file was not created.
-Invalid file <File Name>: The given input file is not a valid .nbl file.
-Invalid data type <Data Type>: One of the channels contains data that HHF cannot represent.
-Path not found <Path Name>, Created: The given path was not found and the folder structure was created.
8.17.7: Troubleshooting the HHF Converter For your information, this is a short list of occasional problems with the probable solution.
Problem: Program quits while trying to create the HHF file.Solution: This can be caused by too many values that are too large for the HHF file to hold. Try alarger scaling value.
Problem: Program quits right after opening; no file is created.Solution: This is most often caused by an item in the historical log that the converter does not recognize. Only Intervalled Energies are valid values for the converter. Remove all invalid itemsfrom the log. Make sure that the correct log is selected in the HHF Options.
Problem: MV-90 will not load the file.Solution: This can be caused by giving MV-90 a file or path that contains ‘ ‘ (spaces). Make surethat all files and paths leading to the HHF file contain no spaces.
Problem: MV-90 downloaded and converted log, but values are either incorrect or nonexistent.Solution: This can be caused by downloading both logs and the wrong log is converted. Make surethat the correct log is selected in the HHF Options.
Problem: Log is OK, convert is OK, but when loaded into MV-90, it is rejected.Solution: There may be too many errors in the historical log, including poweroff gaps, flashing, etc.MV-90 expects no gaps in the data in the .hhf file and tries to verify the integrity of the data. If data must be loaded, despite gaps, make sure Verification Feature in MV-90 is OFF.

e Electro Industries/GaugeTech Doc #: E107707 8-48
8.18: Status Change Log (Inputs)
The Status Change Log (Input Log) displays the input change status for a selected meter file and time range.
To view the Status Change Log: From the EIG Log Viewer, you must select a Meter Database File and set a Time Range. Then, click the Status Change Log button or View Data, Status Change (Inputs). The above screen will appear.
• Usually, if a record being displayed in the grid box has a start date/time and an end date/time, the state being displayed is out of normal state.
• If a record does not show the start time/date or the end date/time, this means that at the time of the log conversion by the Log Converter it could not find the start or end record. This situation can be caused by log roll over and/or other interruptions. Without a start or end record, this willnot be a complete record and no duration will be calculated.
NOTE: Module Index 0 refers to HSI Internal Meter Inputs.

e Electro Industries/GaugeTech Doc #: E107707 8-49
8.19: Control Output Log (Relays)
The Control Output Log (Relay Log) displays the relay change status for a selected meter file and time range.
To view the Control Output Log: From the EIG Log Viewer, you must select a Meter Database File and set a Time Range. Then, click on the Control Output Log button or View Data, Control Output (Relays). The above screen appears.
There are three stages in the relay process:Stage 1 = TriggerStage 2 = CommandStage 3 = Acknowledgement
Stage 1: the change relay state process starts.Stage 2: a meter responds to the change relay request and sends out the change relay command
to the relay device.Stage 3: the meter gets a response back from the relay device.
A complete record should have all three stages’ date/time stamp. The Start State is the relay state at the time of the Trigger. The End State is the relay state at Stage 3 or the Acknowledgement Stage.
Reasons for Incomplete Records:• At the time of the log conversion process, if the Log Converter cannot find the Stage 1 record
(which can be caused by log roll over), the Trigger date/time and the Start State will not be displayed.

e Electro Industries/GaugeTech Doc #: E107707 8-50
• At the time of log conversion, if the Log Converter cannot find the Stage 1 record, the Inputs, Gates and the Relay Start State will not be displayed.
• If the Log Converter program cannot find the Stage 2 record, the Command date/time will not be displayed.
• If the Log Converter cannot find the Stage 3 record, the Acknowledgement date/time and End State will not be displayed and the appropriate duration will not be calculated.
• If any one stage is missing, the appropriate duration will not be calculated.
To view the ElectroLogic Graph, click on an event and click on the Graph button. The following screen will appear:
Key Functions for the ElectroLogic Graph:
• Page Up = Previous Relay Record• Page Down = Next Relay Record• Home = Current Relay Start State• End = Current Relay End State

e Electro Industries/GaugeTech Doc #: E107707 8-51
8.20: Flicker Log
From the Log Viewer’s main screen (Section 8.4), click on the Flicker button or View Data, Flicker. Log Viewer displays Flicker information for a selected meter and time range specified in the Select Time Range section of its main screen (see Section 8.4).
• Click the Show Flicker Max/Min box on the left side of the screen to display Max/Min information.
• Parameters available for Graphs are: PST Va, Vb, Vc and PLT Va, Vb, Vc.
• To copy data to the computer’s clipboard, right-click with the cursor positioned anywhere in the table.
• To sort the data by record type in either ascending or descending order, click on the Sort button and use the pull-down menus to make your selection.
8.21: Reset Log
The Reset Log is generated by the connected device when any part of the Device Profile or the meter itself is Reset. This log is generated automatically and is stored in the meter.
8.22: System Event Log
The System Event Log records and time-stamps a variety of events, including the following:
Download started or ended for System Events, Historical Logs, Flicker Log; Run Time is active, started or stopped; Firmware was changed.
The buttons at the bottom of the screen can be used to Return to the previous screen (Back), Sort by Ascending or Descending order or create a Graph.
To create a Graph, click on one or more events and click the Graph button. Graphs are detailed in sections 8.7 and 8.10.
8.23: EN50160/IEC61000-4-30
For instructions on logging and viewing EN5160/IEC61000-4-30 data, see Chapter 16 of this manual.

e Electro Industries/GaugeTech DOC # E107707 8-52
8.24: Transient Log
1. From the Log Viewer’s main screen (see Section 8.4), click the Waveform button. You will see the screen shown on the right. It lists both Waveform and Transient events. (The transient events say “Positive Transient” or “Negative Transient” in the Waveform Trigger field.)
The buttons at the bottom of the screen allow you to:
Return to the previous screen (Back) Sort by Ascending or Descending order Access the User Manual (Help) View a transient Graph.
2. To view a Graph, either click on one of the transient records and click Graph, or double-click one of the transient records. Graphs are detailed in sections 8.7 and 8.10. Refer to those sections for additional information.
3. You will see the screen shown on the right. The dashed lines mark the transients. Text next to the dashed lines indicates which transient is positive and which is negative.
4. Double-click on any of the channels
to see a detailed view.

e Electro Industries/GaugeTech DOC # E107707 8-53
5. Right click to see the menu shown on the right. Use Set Mark
1 and Set Mark 2 to see the duration of an event. You can also use this menu to zoom, export data, reverse the color of the screen, and perform other functions. (Some of these functions can also be accomplished using the buttons on the bottom of the screen.)
6. Click the Back button to return to the previous screen. NOTE: Refer to Sections 8.7, 8.9, and 8.10 for additional information and instructions.
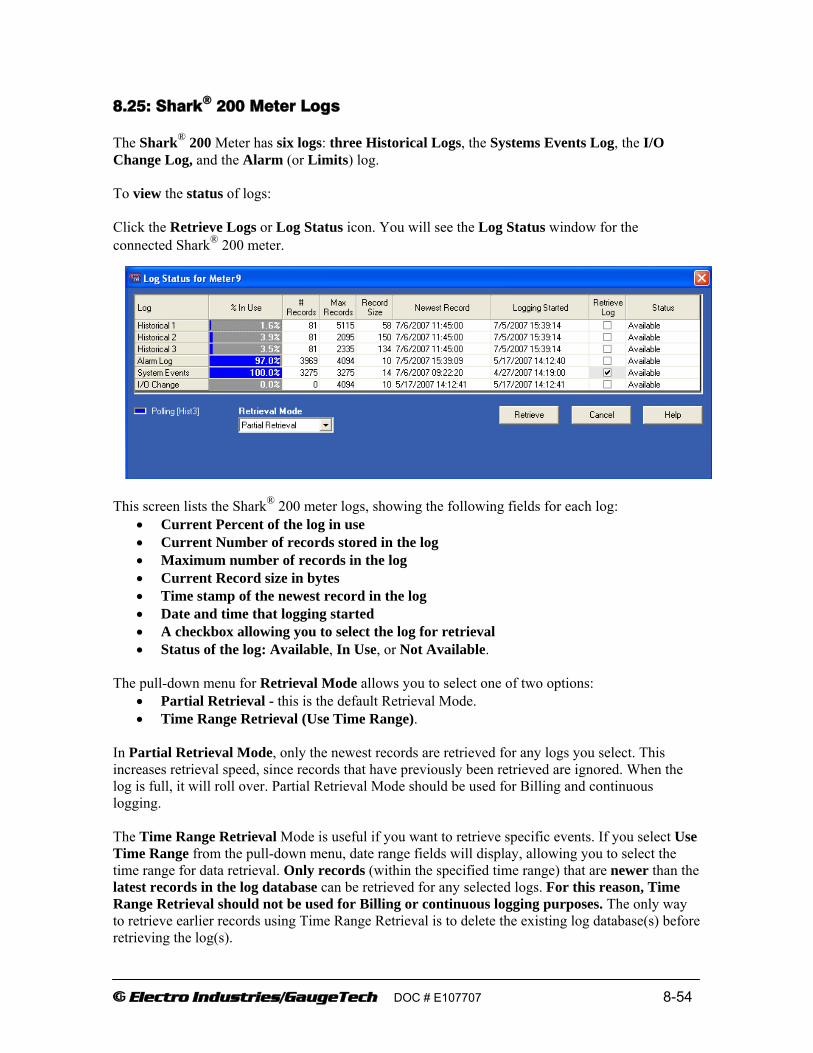
e Electro Industries/GaugeTech DOC # E107707 8-54
8.25: Shark® 200 Meter Logs The Shark® 200 Meter has six logs: three Historical Logs, the Systems Events Log, the I/O Change Log, and the Alarm (or Limits) log. To view the status of logs: Click the Retrieve Logs or Log Status icon. You will see the Log Status window for the connected Shark® 200 meter.
This screen lists the Shark® 200 meter logs, showing the following fields for each log:
Current Percent of the log in use Current Number of records stored in the log Maximum number of records in the log Current Record size in bytes Time stamp of the newest record in the log Date and time that logging started A checkbox allowing you to select the log for retrieval Status of the log: Available, In Use, or Not Available.
The pull-down menu for Retrieval Mode allows you to select one of two options:
Partial Retrieval - this is the default Retrieval Mode. Time Range Retrieval (Use Time Range).
In Partial Retrieval Mode, only the newest records are retrieved for any logs you select. This increases retrieval speed, since records that have previously been retrieved are ignored. When the log is full, it will roll over. Partial Retrieval Mode should be used for Billing and continuous logging. The Time Range Retrieval Mode is useful if you want to retrieve specific events. If you select Use Time Range from the pull-down menu, date range fields will display, allowing you to select the time range for data retrieval. Only records (within the specified time range) that are newer than the latest records in the log database can be retrieved for any selected logs. For this reason, Time Range Retrieval should not be used for Billing or continuous logging purposes. The only way to retrieve earlier records using Time Range Retrieval is to delete the existing log database(s) before retrieving the log(s).

e Electro Industries/GaugeTech DOC # E107707 8-55
To retrieve logs: 1. Click the checkbox next to any logs you want to retrieve.
NOTE: The System Events log is always retrieved when logs are retrieved: that box is always checked.
2. Click Retrieve. You will see the screen shown below.
The screen shows the percent retrieved for each log, the time elapsed since retrieval began, and any messages.
2. After the logs have been retrieved, you will see the screen shown below.
3. The Log Converter screen shows you the Mode, Start time, and Status of Log Conversion. 1. The Log Viewer will open next. NOTES: Only one person at a time can download a log. If someone else is downloading a log, it will
be unavailable until the download is complete. For instructions on programming the historical logs, refer to Section 5.3.2.8. For instructions on allocating the historical logs, refer to Section 5.3.2.9. Viewing the three Historical Logs, the Systems Events Log, and the Limits Log is the
same for Shark® 200 meter as for the Nexus™ meters. Refer to Section 8.4 for instructions on using the Log Viewer and the subsequent sections for instructions on the individual logs.

e Electro Industries/GaugeTech DOC # E107707 8-56
8.25.1: I/O Change Log The Shark® 200 meter has a unique Log, the I/O Change Log, which records when an Input or Output changes on a Digital I/O Option card. Refer to Section 5.3.3 for instructions on configuring Option cards for this log. To view the I/O Change Log, click the Status Change button of the Log Viewer. NOTE: See Section 8.4 for additional instructions on using Log Viewer. You will see the screen shown below. The I/O Change log shows you all state changes for Inputs and Outputs, which have been enabled in the Device Profile. Refer to the “Configuring a Relay Output/Digital Input Card” and “Configuring a KYZ Output and Digital Input Card” sections of Chapter 5 for additional information.
Click to view the I/O Change Log

e Electro Industries/GaugeTech DOC # E107707 8-57
For each state shown, the log displays: Start date and time End date and time Duration in milliseconds Device Name: name of the meter Module Name: name of the Option Card Input Name: ID of the Input State: 1 (Open); 0 (Closed) State Name: the state and the ID number of the Input
Use the scroll bars to view parts of the log not shown on the screen.
8.26: Archiving Logs This feature allows you to create an archived copy of a saved log database file. You may want
to archive your files on a regular basis, as they get unwieldy through size. Use this feature to create an archived copy and delete the working file, so that you can have an empty database file for the next logging period.
1. Click Logs>Log Database>Archive.
You will see the screen shown below.
2. Click the top Select button. A window opens, allowing you to select a retrieved log for archiving. Once you select the log, the above screen displays the selected log and its path in the Source Filename field and the log’s file name in the Destination Filename field. NOTE: The Destination filename can be changed.

e Electro Industries/GaugeTech DOC # E107707 8-58
3. Click the bottom Select button. A window opens, allowing you to select a location for the archived file. Once you select the location, the above screen displays it in the Destination Directory field.
4. Click the Start button to start the archiving process; click Cancel to exit the screen without
archiving. You will see a message window when the file has been archived.

e Electro Industries/GaugeTech Doc # E107707 9-1
9.1: Overview
If your Nexus® meter has the Internal Modem Option, use Communicator EXT to configure the follow-ing settings for the Modem Dial-In/Dial-Out Function:
Modem Dial-Out Programming (Section 9.4)Dial-In Programming (Section 9.5)Disable Email / Page Generation (Section 9.6)Modem Monitor (Section 9.7)Alarm Server (Section 9.8)
9.2: Setting the Dial-IIn Connection
Install the modem connected to the computer (the "originate modem"). See the your meter’s Installationand Operation Manual for details on hardware requirements.
1. From the Communicator EXT Main screen, click the Connect Mgr icon or select Connection> Connection Manager. You will see the screen shown below.
2. Click the Add button to add a “New Location”; then click the Edit button.You will see the screen shown on the next page.
Chapter 9Modem Dial-IIn / Dial-OOut Function

3. Configure the Location Editor screen as follows:a. Type in new Location Name.b. Select a Com Port Number.c. Set Baud Rate to 38400.d. Enable hardware Flow Control.e. Data Bits: 8.f. Parity: Noneg. Click Use Modem.h. Enter Phone Number or Setup String.i. If you want to control access, click Use
Password and then enter a Password.j. In the Devices at Location section,click Add
Serial, then select the new Device and clickEdit. You will see the screen shown below, on the right.
4. Configure Location Device Editor screen as follows:a. Address will be 1 for the Primary Device; something
other than 1 if it is not the Primary Device. b. Type in Name.c. Type in Description.d. Select Modbus ASCII from pull-down menu.e. Device Type is Nexus® 1200 Series.f. Click Close. You will return to the Location Editor
screen.
5. Click once on the device you want to connect to your computer and then click Connect. The computer begins dialing. When Communicator EXT locates the Nexus® monitor at that location:
The Device Status screen appears to confirm the connection.
The Computer Status Bar at the bottom of the screen confirms the computer's connection parameters.
NOTE: Troubleshooting the connection - check the following: Confirm that all cables are secure. Confirm that the RS232 cable is connected to the correct Com Port on the PC. Confirm that the PC and the meter’s ports have the same Baud Rate and are both set to Modbus ASCII.
6. Communicator EXT will search for a Modem. If you do not get a “Modem Found” message, check your computer configuration or External Modem setup.
e Electro Industries/GaugeTech Doc # E107707 9-2

9.3: Setting the Dial-OOut Connection
1. From Communicator EXT’s Main screen, click the Profile icon. Communicator EXT retrieves the programmable settings for the currently selected, connected Nexus® meter. You will see a screen showing the retrieval progress.
2. Once the settings are retrieved, the Device Profile menu is displayed. Click on the (+/-) icon next toCommunications, and then double-click on one of the displayed ports. You will see the screen shown below if you are connected to a Nexus® 1250/1252 meter:
NOTE: The screen for the Nexus® 1262/1272 meter shows only Ports 1 and 4 (see Chapter 4 for an example).
3. Configure the Internal Modem Settings as follows:
a. Answer the Phone on 2 Rings.b. Baud Rate = 38400.
4. Click the Dial-Out Profile button to configure the Dial-Out feature of the Internal Modem. Section 9.4 containsinstructions for configuring the Dial-Out settings.
5. When you have completed your modem settings: Click OK to save your settings andreturn to the Device Profile menu.
Click Cancel to cancel any changes and return to the Device Profilemenu.
6. Click Update Device to send your settings to the meter.
e Electro Industries/GaugeTech Doc # E107707 9-3
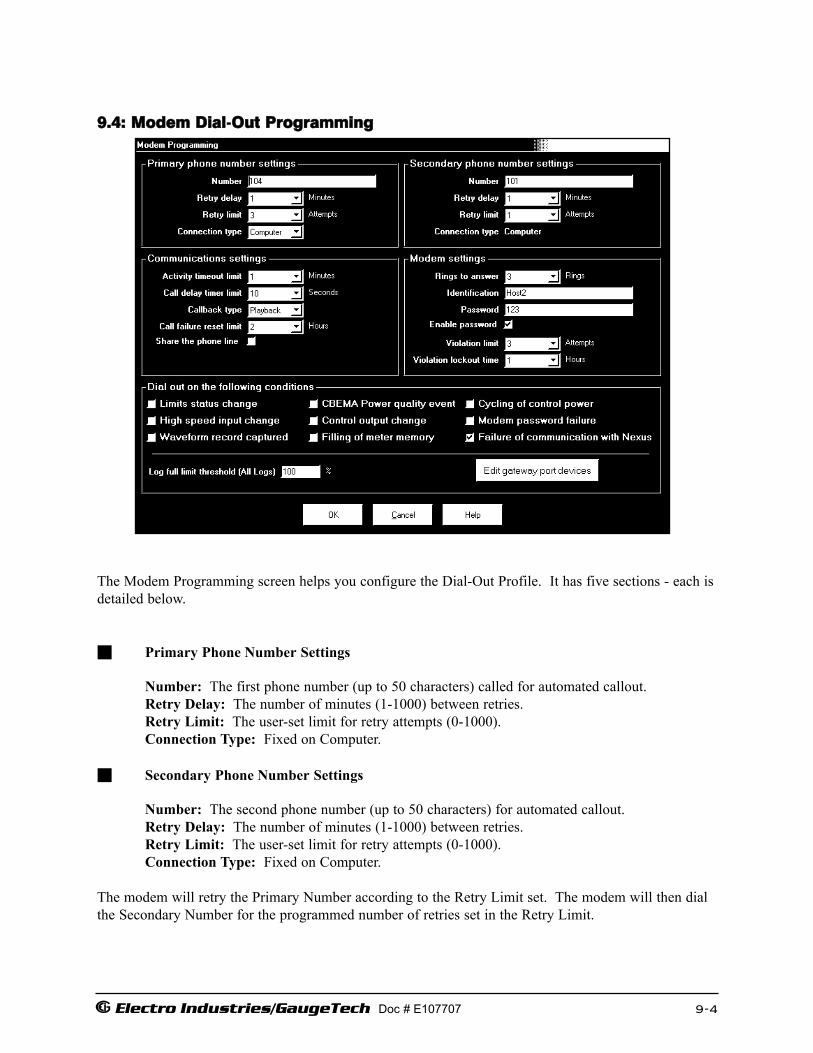
9.4: Modem Dial-OOut Programming
The Modem Programming screen helps you configure the Dial-Out Profile. It has five sections - each isdetailed below.
Primary Phone Number Settings
Number: The first phone number (up to 50 characters) called for automated callout.Retry Delay: The number of minutes (1-1000) between retries.Retry Limit: The user-set limit for retry attempts (0-1000).Connection Type: Fixed on Computer.
Secondary Phone Number Settings
Number: The second phone number (up to 50 characters) for automated callout.Retry Delay: The number of minutes (1-1000) between retries.Retry Limit: The user-set limit for retry attempts (0-1000).Connection Type: Fixed on Computer.
The modem will retry the Primary Number according to the Retry Limit set. The modem will then dialthe Secondary Number for the programmed number of retries set in the Retry Limit.
e Electro Industries/GaugeTech Doc # E107707 9-4

Communication Settings
Activity Timeout Limit: User-set value that is the number of minutes of inactivity (nocommunication activity) that is allowed on an open modem connection before the modem terminates the connection (1-30 minutes).Call Delay Timer Limit: User-set variable that defines the number of seconds the modem waits before processing a callback event (0-240 seconds). This setting applies to calls caused byLimit or Input Status conditions.Callback Type: There are two types of callback.
Playback: The Modem waits 500ms after connection and plays back the Modem ID string displayed (if programmed) and the reason for the call.
NOTE: You can override Playback mode by turning Playback off. You will not be able to override the setting to Playback mode if the Modem ID string is blank (“-----”).
Standard: When performing a callback, once connection is established the modem waits to be queried by the PC it has called.
Call Failure Reset Limit: User-set value for the number of hours the modem locks out incoming calls if the Incoming Connection Failure Limit is reached (1-50 hours).Share the Phone Line: If checked, the modem monitors phone line voltage during all calls. If the phone line voltage drops by more than 30% during a call (indicating that someone else has taken another phone off the hook) the modem disconnects and returns to normal polling operation. If not checked, the modem does not watch for line voltage deviations.
Modem Settings
Rings to Answer: User-set value for the number of Rings (0-9) before the modem goes off the hook and attempts to answer an incoming call.
Zero = Never Answers. Ring is a Voltage Change.Identification: Up to 32 Western Alphabet Characters (16 Asian Characters).Password: Up to 10 alphanumeric characters (user-set) in addition to passwords that restrict access to certain levels of the Nexus® meter. If the password is not entered correctly, the modem asks you to enter the password again (up to three times) and disconnects after the third incorrect attempt. Enable Password: If checked, a Password must be entered.Violation Limit: User-set value for number of times the modem allows unsuccessful connection attempts (unable to supply correct password in three attempts) before locking-up to incoming calls (1-10). The Modem disconnects from the incoming call and does not accept incoming calls for a period of time equal to the Violation Lockout Time.Violation Lockout Time: User-set time limit for the number of hours (1-32) the Modemwill be inaccessible. The Violation Lockout provides a level of security against bad passwords.
Dial-Out on the Following Conditions:
Limits Status Change High Speed Input Change Waveform Record Captured CBEMA Power Quality EventControl Output ChangeFilling of Meter Memory
e Electro Industries/GaugeTech Doc # E107707 9-5

Cycling of Control PowerModem Password FailureFailure of Communication with the Nexus® meter
Log Full Limit Threshold (Covers All Logs): Percent that a log is full before a call is triggered.
Edit Gateway Port Devices
The Edit Gateway Port Devices button at the bottom of the screen is used to enable up to 8 devices that are connected via the gateway and are to be monitored. When you click the Edit Gateway Port Devices button, you will see the screen shown below.
a. Click the Enable Device box next to the Device to be monitored. A Device address will be displayed next to the Enabled Device.
b. Change the Device Address, if needed, to any address except 1. Address number 1 is always reserved for the Primary Device.
c. Click either: OK to save changes and return to the ModemProgramming screen.
Cancel on either screen to cancel changes andreturn to the previous screen.
When your Dial-Out settings are complete, click OK to return to themain Device Profile menu. For these changes to take effect, youmust click the Update Device button to send the new settings to themeter.
e Electro Industries/GaugeTech Doc # E107707 9-6
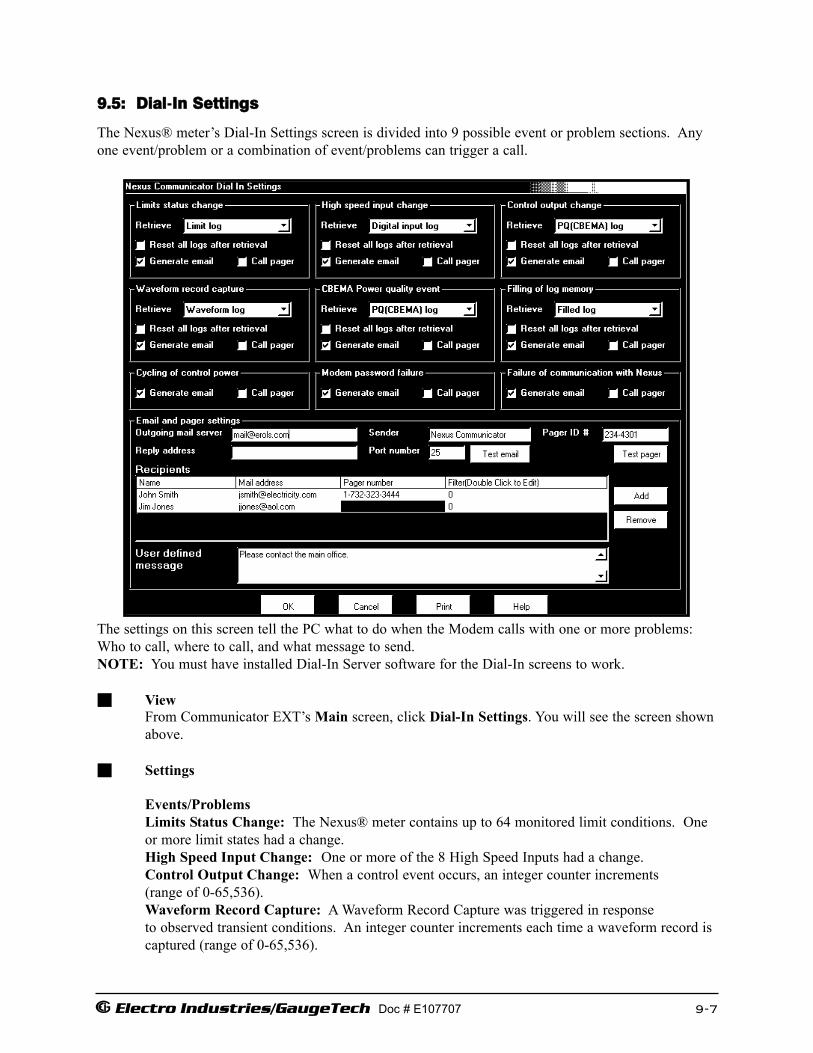
9.5: Dial-IIn Settings
The Nexus® meter’s Dial-In Settings screen is divided into 9 possible event or problem sections. Anyone event/problem or a combination of event/problems can trigger a call.
The settings on this screen tell the PC what to do when the Modem calls with one or more problems:Who to call, where to call, and what message to send. NOTE: You must have installed Dial-In Server software for the Dial-In screens to work.
ViewFrom Communicator EXT’s Main screen, click Dial-In Settings. You will see the screen shownabove.
Settings
Events/ProblemsLimits Status Change: The Nexus® meter contains up to 64 monitored limit conditions. One or more limit states had a change. High Speed Input Change: One or more of the 8 High Speed Inputs had a change.Control Output Change: When a control event occurs, an integer counter increments(range of 0-65,536).Waveform Record Capture: A Waveform Record Capture was triggered in responseto observed transient conditions. An integer counter increments each time a waveform record is captured (range of 0-65,536).
e Electro Industries/GaugeTech Doc # E107707 9-7
CBEMA Power Quality Event: The meter captures CBEMA event records in response toobserved transient conditions. The counter has a range of 0-65,536.Filling of Log Memory: When any one log reaches or exceeds the user-set downloadlevel, the modem calls to report a log fill condition and perform an automated download of allstored data. Cycling of Control Power: (1270 Only) If control power voltage is low, the modem initiates a callback.Modem Password Failure: When the Password Limit is reached, the modem initiates a callback with no delay (because there is no opportunity for the condition to reset). If the phone line is available, the modem attempts a reporting call; if the phone line is unavailable, the modem continues polling.Failure of Communication with Nexus® meter: If the meter fails to the modem within the allotted time, the modem initiates a callback with no delay (because there is no opportunity for the condition to reset). If the phone line is available, the modem attempts a reporting call; if the phone line is unavailable, the modem continues polling.
Event/Problem SettingsRetrieve: For those events that trigger log retrieval, six of the screens have drop-downmenus for you to select the logs to be retrieved.Reset All Logs after Retrieval: Check those sections that apply. NOTE: In order to use the Reset function, you must select “All Logs” from the drop-downmenu next to the word “Retrieve.”Generate Email: Send an email message to the designated recipient.Call Pager: Call the designated recipient's pager number.
NOTE: Selecting “All Logs” from multiple events sections does not cause duplication in log retrieval.
Email and Pager Settings
Outgoing Mail Server: Enter name of Valid Email Server that does not require password and user name to send mail (POP3 type).Sender: Communicator EXTPager ID#: User-set numeric value used to identify this meter when a numeric page is issued(up to 5 digits, 00000 to 99999).Reply Address: None or Email Address to let recipient know where to send replies.Port Number: 25 is normal for email servers.Test Email: Sends a Test Message to a recipient to test the email settings (uses email of the first recipient only).Test Pager: Sends a Test Message to a recipient to test the paging (uses the number for first recipient only).Recipients: List Name, Email Address and Pager Number.Filter: Double-click and the Edit screen will appear. Click in front ofmessage(s) you want to exclude from highlighted recipient.Add: Click to Add a Recipient.Remove: Click to Remove a Recipient.User Defined Message: Type in a message for the highlighted recipient.
e Electro Industries/GaugeTech Doc # E107707 9-8

Buttons
OK: To Save Settings and return to Communicator EXT’s Main screen.Cancel: To Exit the screen without saving the settings.Print: To Print the screen.
9.6: Filter Screen
The Filter screen allows you to exclude a highlighted recipient from receiving one or more messages.
View
From the View menu on the Toolbar, click Dial-In Settings.You will see the Dial-In Settings screen.Double-click Filter (in the Recipients section)You will see the Filter screen, shown above.
Operation
This screen disables email and/or page generation for one or more particular items to the high-lighted recipient when one or more of the following items is checked:
Limits Status ChangeHigh Speed Input ChangeWaveform Record CaptureCBEMA Power Quality EventControl Output ChangeFilling of Log MemoryCycling of Control PowerPassword Failure on a Call Coming into the ModemFailure of Communications Channel with Nexus® meter
e Electro Industries/GaugeTech Doc # E107707 9-9

9.7: Modem Monitor
The Modem Monitor, as the name implies, checks the PC for connected modems and monitors availablemodems for incoming calls. The Status line coaches you in setting up the modem and keeps youinformed of the status of the available modems.
Start Up
To start the Modem Monitor screen, click Start>Programs>Electro Industries>Modem Monitor icon. After the screen appears, press Start to allow the Modem Monitor to monitor available modems. After a search for modems, the software will continue to locate the modems that were found for a “Call Back.”
OperationThe main screen lists the available modems with the Ports to which they are connected and their Status. When an incoming call is detected, the Modem Monitor starts Communicator EXT, which answers the call and processes it.
Command Line Switches/S: Autostart Modem Monitoring when program is started./M: Minimize program when started. Program will appear as icon in the system tray on your
computer screen.
NOTE: When program is minimized, it appears as an icon in the system tray. Click on this icon torestore the program to a normal sized window.
Example Command Line SwitchesNexusmonitor.exe /S:Nexusmonitor.exe /M:Nexusmonitor.exe /S: /M:
NOTE: Spaces are required between the components.
Buttons
Click Stop to disconnect the Modem Monitor.Click Start to connect the Modem Monitor.
e Electro Industries/GaugeTech Doc # E107707 9-10
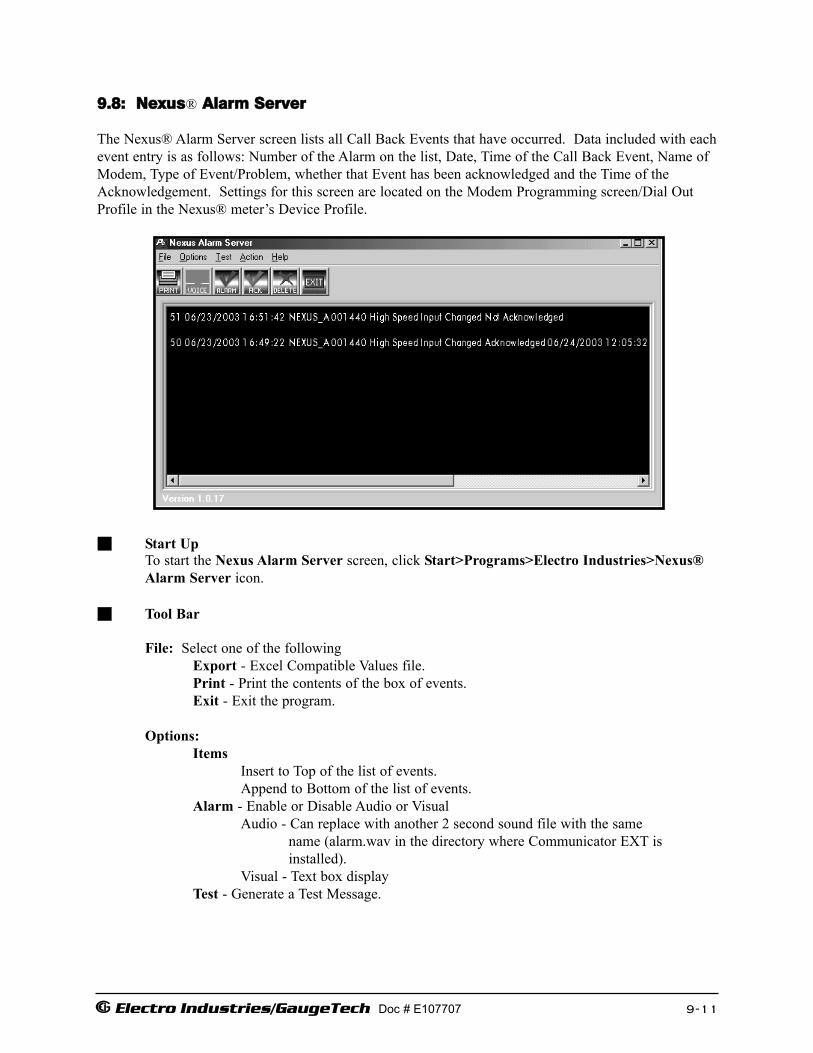
9.8: Nexus® Alarm Server
The Nexus® Alarm Server screen lists all Call Back Events that have occurred. Data included with eachevent entry is as follows: Number of the Alarm on the list, Date, Time of the Call Back Event, Name ofModem, Type of Event/Problem, whether that Event has been acknowledged and the Time of theAcknowledgement. Settings for this screen are located on the Modem Programming screen/Dial OutProfile in the Nexus® meter’s Device Profile.
Start UpTo start the Nexus Alarm Server screen, click Start>Programs>Electro Industries>Nexus®Alarm Server icon.
Tool Bar
File: Select one of the followingExport - Excel Compatible Values file.Print - Print the contents of the box of events.Exit - Exit the program.
Options:Items
Insert to Top of the list of events. Append to Bottom of the list of events.
Alarm - Enable or Disable Audio or VisualAudio - Can replace with another 2 second sound file with the same
name (alarm.wav in the directory where Communicator EXT is installed).
Visual - Text box displayTest - Generate a Test Message.
e Electro Industries/GaugeTech Doc # E107707 9-11

ActionSilence Alarm - Turn Noisemaker and/or Alarm Message off (not mute).Acknowledge Item - Red to Green color change.Acknowledge All - Red to Green color change.Remove All - Erase All Alarms.
Icons
Print: Click to select Setup Options.Voice: Microsoft Speech Properties.Alarm Silencer: To stop audio and/or visual alarm until next entry arrives.Acknowledge EventDelete Entry in Server BoxExit
e Electro Industries/GaugeTech Doc # E107707 9-12
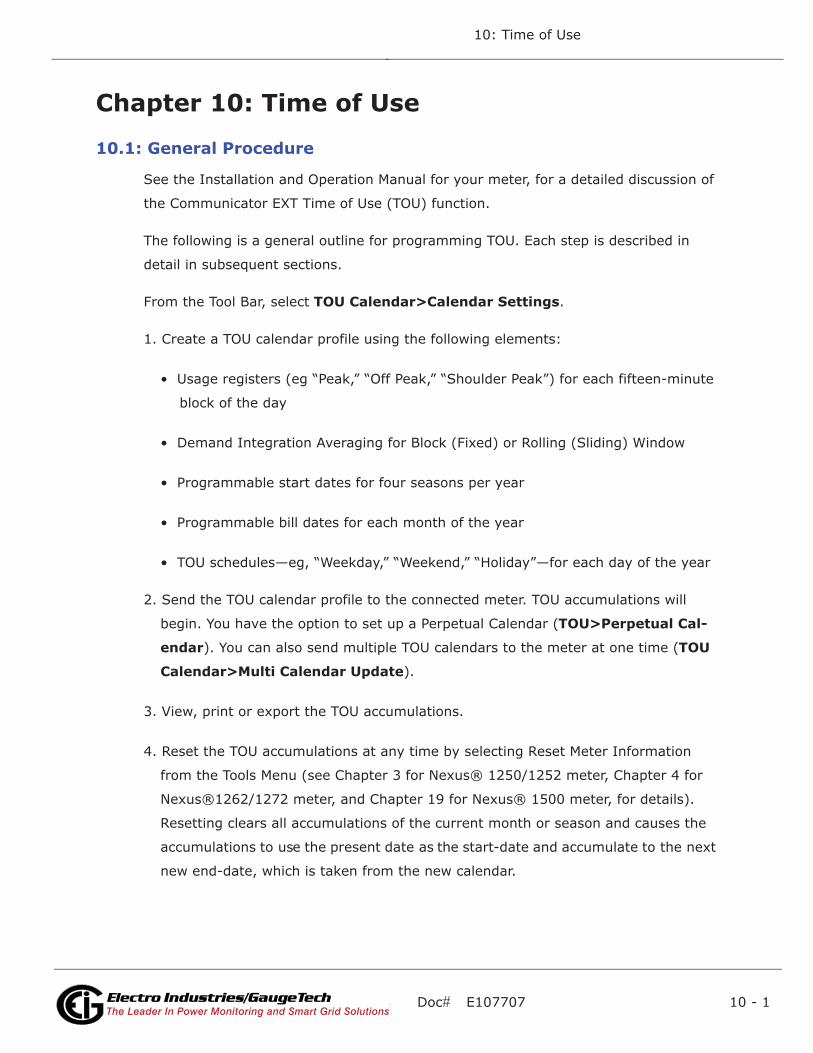
Doc# E107707 10 - 1
10: Time of Use
Electro Industries/GaugeTechThe Leader In Power Monitoring and Smart Grid SolutionsElectro Industries/GaugeTechThe Leader In Power Monitoring and Smart Grid Solutions
Chapter 10: Time of Use
10.1: General Procedure
See the Installation and Operation Manual for your meter, for a detailed discussion of
the Communicator EXT Time of Use (TOU) function.
The following is a general outline for programming TOU. Each step is described in
detail in subsequent sections.
From the Tool Bar, select TOU Calendar>Calendar Settings.
1. Create a TOU calendar profile using the following elements:
• Usage registers (eg “Peak,” “Off Peak,” “Shoulder Peak”) for each fifteen-minute
block of the day
• Demand Integration Averaging for Block (Fixed) or Rolling (Sliding) Window
• Programmable start dates for four seasons per year
• Programmable bill dates for each month of the year
• TOU schedules—eg, “Weekday,” “Weekend,” “Holiday”—for each day of the year
2. Send the TOU calendar profile to the connected meter. TOU accumulations will
begin. You have the option to set up a Perpetual Calendar (TOU>Perpetual Cal-
endar). You can also send multiple TOU calendars to the meter at one time (TOU
Calendar>Multi Calendar Update).
3. View, print or export the TOU accumulations.
4. Reset the TOU accumulations at any time by selecting Reset Meter Information
from the Tools Menu (see Chapter 3 for Nexus® 1250/1252 meter, Chapter 4 for
Nexus®1262/1272 meter, and Chapter 19 for Nexus® 1500 meter, for details).
Resetting clears all accumulations of the current month or season and causes the
accumulations to use the present date as the start-date and accumulate to the next
new end-date, which is taken from the new calendar.

Doc# E107707 10 - 2
10: Time of Use
Electro Industries/GaugeTechThe Leader In Power Monitoring and Smart Grid SolutionsElectro Industries/GaugeTechThe Leader In Power Monitoring and Smart Grid Solutions
NOTES:
• To use Daylight Savings Time, you must enable it in the meter’s Device Profile Time
Settings screen. (See sections 3.3.3, 4.3.3, and 19.4.3 for instructions.)
• If GPS Time (IRIG-B) is connected, you must set the appropriate time zone. Date
and time settings (except year) are overridden by GPS Time.
NOTE: An IRIG-B signal-generating device connected to the GPS satellite system
will synchronize meters located at different geographic locations. See the Installa-
tion and Operation Manual for your meter, for installation instructions.
10.2: Creating a TOU Calendar Profile
The TOU calendar profile sets the parameters for TOU data accumulation. You may
store up to twenty calendars in the Nexus® meter and an unlimited amount on your
computer. To create a new calendar, follow the steps listed below. To edit an existing
calendar, see Section 10.3.
1. From the TOU Calendar menu, select Calendar Settings. You will see the screen
shown below.
2. From the pull-down menu, choose the year for which you would like to create a
TOU usage structure.

Doc# E107707 10 - 3
10: Time of Use
Electro Industries/GaugeTechThe Leader In Power Monitoring and Smart Grid SolutionsElectro Industries/GaugeTechThe Leader In Power Monitoring and Smart Grid Solutions
3. Click New Calendar. You will see the screen shown below.
4. Click TOU Registers. You will see the screen shown below.
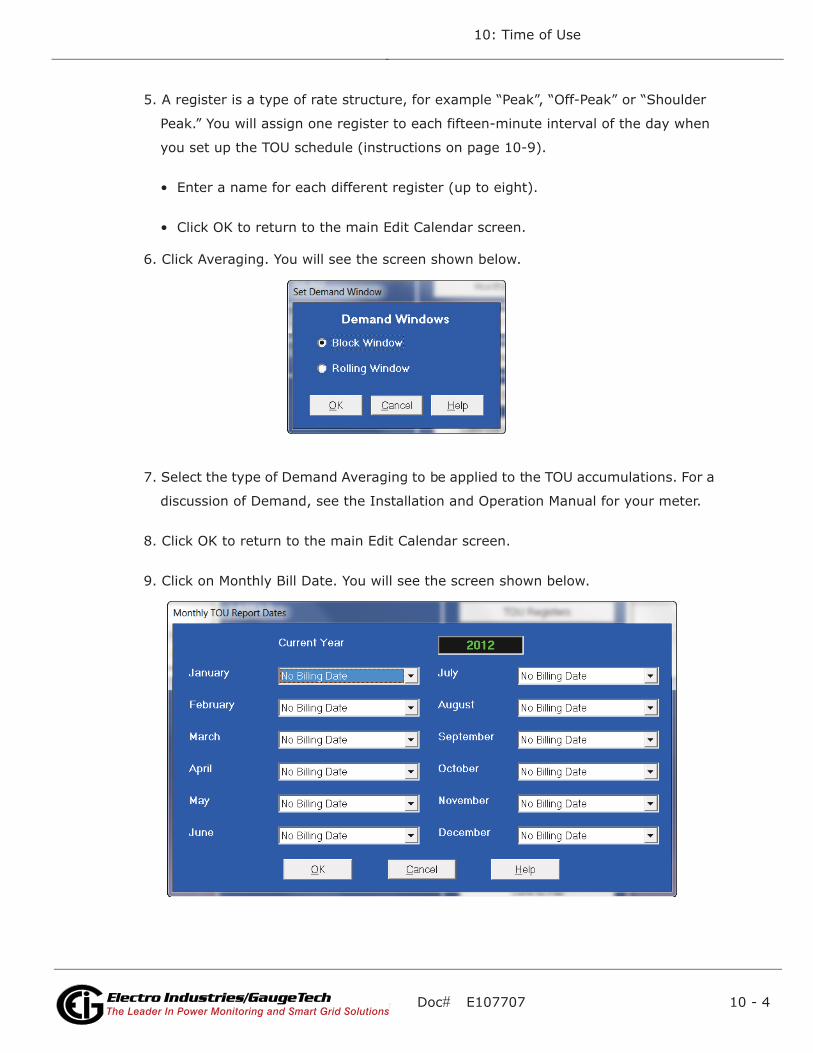
Doc# E107707 10 - 4
10: Time of Use
Electro Industries/GaugeTechThe Leader In Power Monitoring and Smart Grid SolutionsElectro Industries/GaugeTechThe Leader In Power Monitoring and Smart Grid Solutions
5. A register is a type of rate structure, for example “Peak”, “Off-Peak” or “Shoulder
Peak.” You will assign one register to each fifteen-minute interval of the day when
you set up the TOU schedule (instructions on page 10-9).
• Enter a name for each different register (up to eight).
• Click OK to return to the main Edit Calendar screen.
6. Click Averaging. You will see the screen shown below.
7. Select the type of Demand Averaging to be applied to the TOU accumulations. For a
discussion of Demand, see the Installation and Operation Manual for your meter.
8. Click OK to return to the main Edit Calendar screen.
9. Click on Monthly Bill Date. You will see the screen shown below.
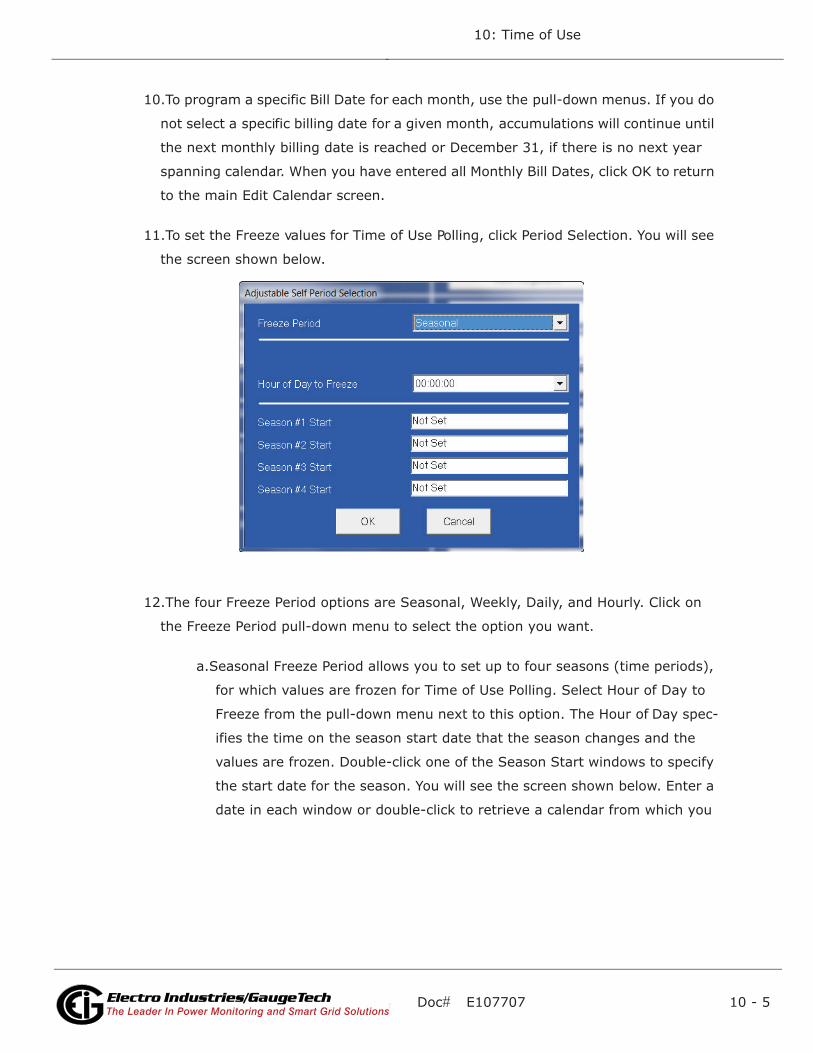
Doc# E107707 10 - 5
10: Time of Use
Electro Industries/GaugeTechThe Leader In Power Monitoring and Smart Grid SolutionsElectro Industries/GaugeTechThe Leader In Power Monitoring and Smart Grid Solutions
10.To program a specific Bill Date for each month, use the pull-down menus. If you do
not select a specific billing date for a given month, accumulations will continue until
the next monthly billing date is reached or December 31, if there is no next year
spanning calendar. When you have entered all Monthly Bill Dates, click OK to return
to the main Edit Calendar screen.
11.To set the Freeze values for Time of Use Polling, click Period Selection. You will see
the screen shown below.
12.The four Freeze Period options are Seasonal, Weekly, Daily, and Hourly. Click on
the Freeze Period pull-down menu to select the option you want.
a.Seasonal Freeze Period allows you to set up to four seasons (time periods),
for which values are frozen for Time of Use Polling. Select Hour of Day to
Freeze from the pull-down menu next to this option. The Hour of Day spec-
ifies the time on the season start date that the season changes and the
values are frozen. Double-click one of the Season Start windows to specify
the start date for the season. You will see the screen shown below. Enter a
date in each window or double-click to retrieve a calendar from which you

Doc# E107707 10 - 6
10: Time of Use
Electro Industries/GaugeTechThe Leader In Power Monitoring and Smart Grid SolutionsElectro Industries/GaugeTechThe Leader In Power Monitoring and Smart Grid Solutions
can choose a Month and Day. Click OK to return to the Adjustable Self
Period Selection screen.
NOTE: The date format you use here should be the same as the date format set for
your computer. To change or view your computer’s date settings, click on the Win-
dows® Start Menu and select Settings>Control Panel>Regional Settings. Click on the
Date tab.
•When all selections are made, click OK to return to the main Edit
Calendar screen.
•Click Cancel to exit the screen without saving any changes.
b. Weekly Freeze Period allows you to set the hour for which values are frozen
for Time of Use Polling each week. Select the Day of Week to Freeze and
Hour to Freeze from the pull-down menus next to these options, in the
Adjustable Self Period Selection screen.
•Click OK to save your selections and return to the main Edit Calendar
screen.
•Click Cancel to exit the screen without saving any changes.
c. Daily Freeze Period allows you to set the hour for which values are frozen
for Time of Use Polling each day. Select Hour of Day to Freeze from the
pull-down menu next to this option, in the Adjustable Self Period Selection
screen.

Doc# E107707 10 - 7
10: Time of Use
Electro Industries/GaugeTechThe Leader In Power Monitoring and Smart Grid SolutionsElectro Industries/GaugeTechThe Leader In Power Monitoring and Smart Grid Solutions
•Click OK to save your selections and return to the main Edit Calendar
screen.
•Click Cancel to exit the screen without saving any changes.
c. Hourly Freeze Period freezes the values for Time of Use Polling each hour.
13.Click OK in the Adjustable Self Period Selection screen to save your selection and
return to the main Edit Calendar screen; click Cancel to exit the screen without
saving any changes.
14.Click Method in the Register Accumulation section of the window. You will see the
screen shown below.
15.Click the radio button for the type of Accumulations you require and click OK.

Doc# E107707 10 - 8
10: Time of Use
Electro Industries/GaugeTechThe Leader In Power Monitoring and Smart Grid SolutionsElectro Industries/GaugeTechThe Leader In Power Monitoring and Smart Grid Solutions
16.Click TOU Schedules. You will see the screen shown below.
• The first column lists each fifteen-minute block of a 24-hour day.
• The Individual Registers defined in Step 5 will be applied to each fifteen-minute
block.
• A schedule is the type of accumulation structure you will apply to individual days.
You may program up to 16 different schedules.
17.Double-click on one of the Schedule Headings—for example: “Schedule_1”. You
will see the following screen.
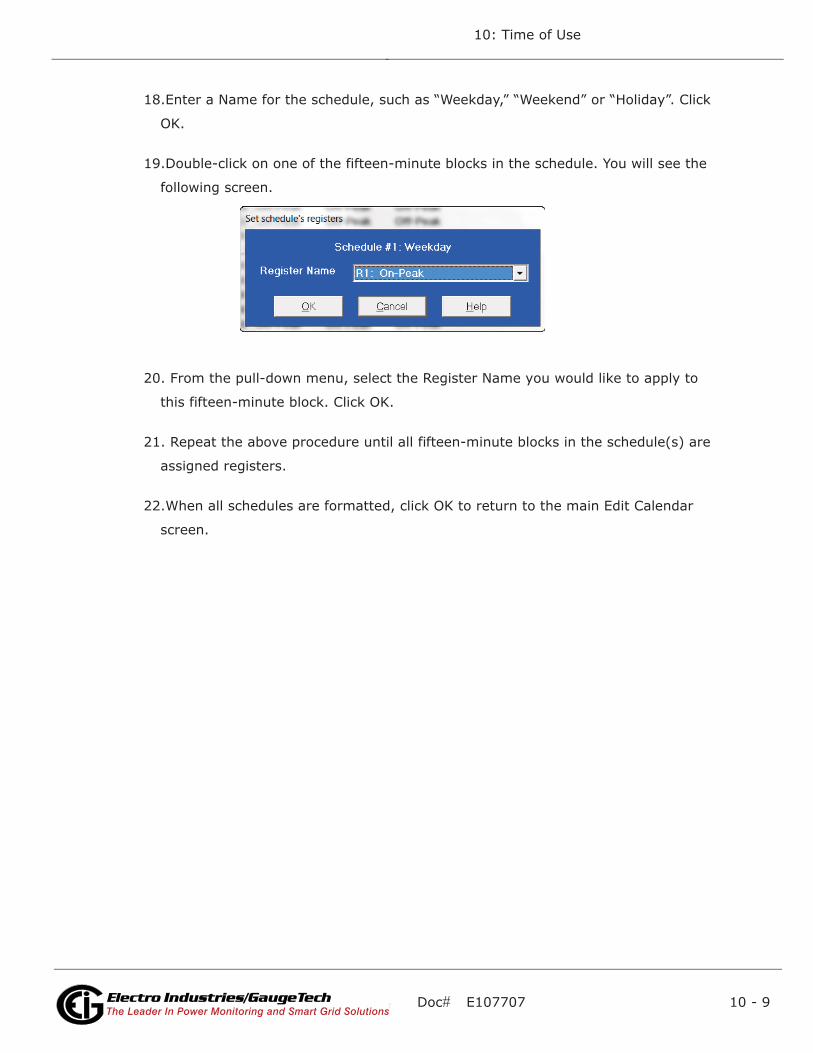
Doc# E107707 10 - 9
10: Time of Use
Electro Industries/GaugeTechThe Leader In Power Monitoring and Smart Grid SolutionsElectro Industries/GaugeTechThe Leader In Power Monitoring and Smart Grid Solutions
18.Enter a Name for the schedule, such as “Weekday,” “Weekend” or “Holiday”. Click
OK.
19.Double-click on one of the fifteen-minute blocks in the schedule. You will see the
following screen.
20. From the pull-down menu, select the Register Name you would like to apply to
this fifteen-minute block. Click OK.
21. Repeat the above procedure until all fifteen-minute blocks in the schedule(s) are
assigned registers.
22.When all schedules are formatted, click OK to return to the main Edit Calendar
screen.

Doc# E107707 10 - 10
10: Time of Use
Electro Industries/GaugeTechThe Leader In Power Monitoring and Smart Grid SolutionsElectro Industries/GaugeTechThe Leader In Power Monitoring and Smart Grid Solutions
23.Click Calendar Assignments. You will see the screen shown below.
24.The schedules created in steps 16–21 are shown beneath the calendar. Each
schedule is color-coded. Assign a schedule to each day by clicking on the day. You
will see the screen shown below.
25. From the pull-down menu, select the Schedule you would like to apply to this day.
26. Click OK to return to the calendar.

Doc# E107707 10 - 11
10: Time of Use
Electro Industries/GaugeTechThe Leader In Power Monitoring and Smart Grid SolutionsElectro Industries/GaugeTechThe Leader In Power Monitoring and Smart Grid Solutions
27. To apply a Schedule to a Range of Dates or to selected days of the week, click
Multi Date. You will see the screen shown below.
NOTE: With the Multi Date button, you can quickly program a whole year (For
Example, 2012) by selecting, for instance, all the weekdays (Mon - Fri) and in the
Date Range type 01/01/12 to 12/31/12. Do the same for the weekend days. Fill in
holidays and vacations for each month.
28.Enter a Time Range; select the type of Schedule and, if desired, choose a Day of
the Week. Click OK.
29.Use the color-coded key below the calendar to review which Schedules have been
applied to the month. Click Next Month and repeat the process for the year.
30.When the calendar settings are complete, click OK to return to the main Edit Cal-
endar screen.
31.You may now:
• Click Save to File to send the calendar to the computer for future use. See Sec-
tion 10.3 for instructions on editing a previously saved calendar. You will see a
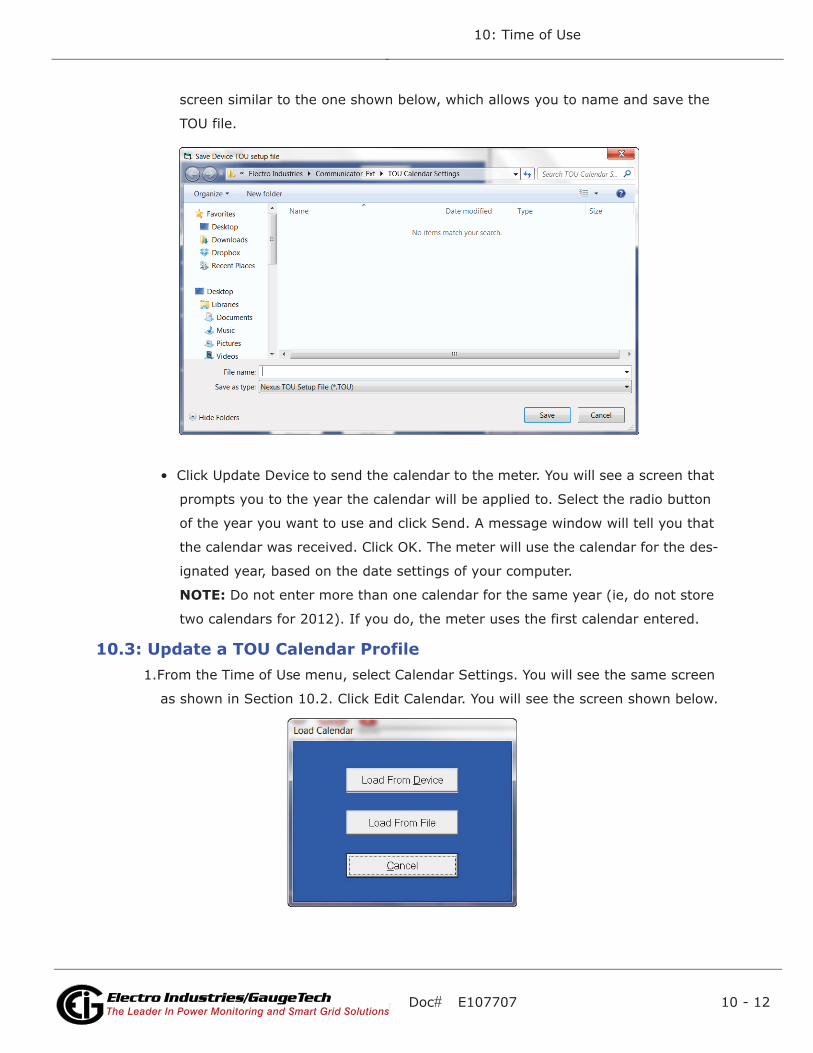
Doc# E107707 10 - 12
10: Time of Use
Electro Industries/GaugeTechThe Leader In Power Monitoring and Smart Grid SolutionsElectro Industries/GaugeTechThe Leader In Power Monitoring and Smart Grid Solutions
screen similar to the one shown below, which allows you to name and save the
TOU file.
• Click Update Device to send the calendar to the meter. You will see a screen that
prompts you to the year the calendar will be applied to. Select the radio button
of the year you want to use and click Send. A message window will tell you that
the calendar was received. Click OK. The meter will use the calendar for the des-
ignated year, based on the date settings of your computer.
NOTE: Do not enter more than one calendar for the same year (ie, do not store
two calendars for 2012). If you do, the meter uses the first calendar entered.
10.3: Update a TOU Calendar Profile1.From the Time of Use menu, select Calendar Settings. You will see the same screen
as shown in Section 10.2. Click Edit Calendar. You will see the screen shown below.

Doc# E107707 10 - 13
10: Time of Use
Electro Industries/GaugeTechThe Leader In Power Monitoring and Smart Grid SolutionsElectro Industries/GaugeTechThe Leader In Power Monitoring and Smart Grid Solutions
• To edit a calendar saved on the computer’s hard drive, click Load From File. Com-
municator EXT will ask you to locate the calendar. After the calendar has loaded,
see Section 10.2 for details on programming the calendar.
• To edit one of the calendars stored in the meter, click Load from Device. You will
see the following screen.
2. Select the calendar year you would like to edit and click Retrieve. After the calendar
has been retrieved, see Section 10.2 for details on editing the calendar.

Doc# E107707 10 - 14
10: Time of Use
Electro Industries/GaugeTechThe Leader In Power Monitoring and Smart Grid SolutionsElectro Industries/GaugeTechThe Leader In Power Monitoring and Smart Grid Solutions
10.4: Multi Calendar Update
Use this feature to send multiple TOU calendars to the meter at one time.
1. From the TOU Calendar menu, select Multi Calendar Update. You will see the screen
shown below.
2. You can select up to 20 calendars, using the tabs at the top of the screen.
• To upload a calendar, click Select to select it from the Calendar Settings direc-
tory.
• If your calendar(s) are saved in a different directory, click Select Directory and
locate the files.
• If a calendar is not loading correctly, you can increase the Inter Calendar Delay
time to give the meter more time to process the data. If you are not having a
problem, leave this field as is.
3. Click Update to send the calendars to the meter; select Abort to cancel the update;
select Close to close the window.
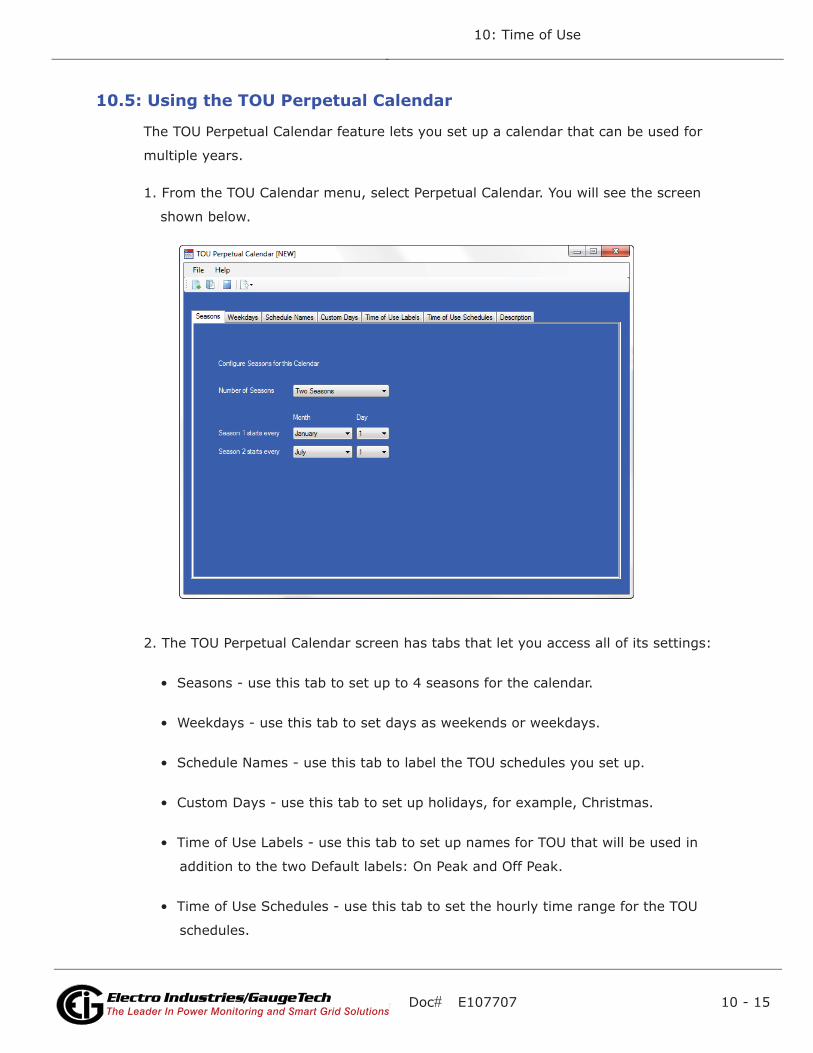
Doc# E107707 10 - 15
10: Time of Use
Electro Industries/GaugeTechThe Leader In Power Monitoring and Smart Grid SolutionsElectro Industries/GaugeTechThe Leader In Power Monitoring and Smart Grid Solutions
10.5: Using the TOU Perpetual Calendar
The TOU Perpetual Calendar feature lets you set up a calendar that can be used for
multiple years.
1. From the TOU Calendar menu, select Perpetual Calendar. You will see the screen
shown below.
2. The TOU Perpetual Calendar screen has tabs that let you access all of its settings:
• Seasons - use this tab to set up to 4 seasons for the calendar.
• Weekdays - use this tab to set days as weekends or weekdays.
• Schedule Names - use this tab to label the TOU schedules you set up.
• Custom Days - use this tab to set up holidays, for example, Christmas.
• Time of Use Labels - use this tab to set up names for TOU that will be used in
addition to the two Default labels: On Peak and Off Peak.
• Time of Use Schedules - use this tab to set the hourly time range for the TOU
schedules.

Doc# E107707 10 - 16
10: Time of Use
Electro Industries/GaugeTechThe Leader In Power Monitoring and Smart Grid SolutionsElectro Industries/GaugeTechThe Leader In Power Monitoring and Smart Grid Solutions
• Description - use this tab to enter any descriptive information about the Perpet-
ual Calendar.
3. The first tab is the Seasons tab (see previous page). The default setting is two sea-
sons. Click in the pull-down menu to select between one and four seasons. Depend-
ing on what you select, you will see one to four fields that let you select the start
date for the seasons. Select the month and day for the season start date from the
pull-down menus.
4. Click the Weekdays tab - you will see the screen shown below.
You can change a day of the week to a weekend or weekday by clicking on one of
the radio buttons next to it. The default values are Monday - Friday as weekdays,
and Saturday and Sunday as weekends.

Doc# E107707 10 - 17
10: Time of Use
Electro Industries/GaugeTechThe Leader In Power Monitoring and Smart Grid SolutionsElectro Industries/GaugeTechThe Leader In Power Monitoring and Smart Grid Solutions
5. Click the Schedule Names tab - you will see the screen shown below.
The default Schedule names are Weekday, Weekend, and Holiday.
• To add a new schedule name, click the Add a Name button. You will see
an empty line where you can add the new name. After you enter a name,
press Enter or click anywhere in the screen. A number will appear next to
the new Schedule name.
• To edit an existing name, click on the name and click the Edit Selected
Name button. You can then change the name. After you change the
name, press Enter or click anywhere in the screen.
• To remove a name you added, click on the name and click the Remove
Selected Name button. Note that you won’t be able to remove the default
Schedule names.
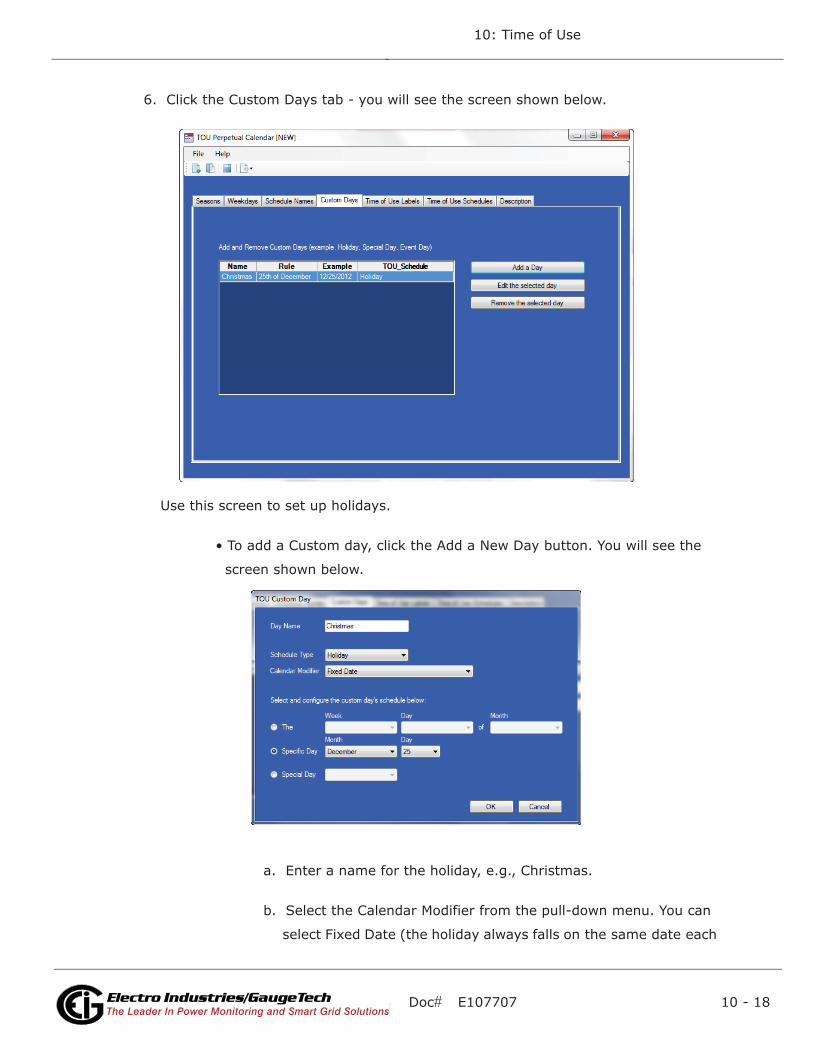
Doc# E107707 10 - 18
10: Time of Use
Electro Industries/GaugeTechThe Leader In Power Monitoring and Smart Grid SolutionsElectro Industries/GaugeTechThe Leader In Power Monitoring and Smart Grid Solutions
6. Click the Custom Days tab - you will see the screen shown below.
Use this screen to set up holidays.
• To add a Custom day, click the Add a New Day button. You will see the
screen shown below.
a. Enter a name for the holiday, e.g., Christmas.
b. Select the Calendar Modifier from the pull-down menu. You can
select Fixed Date (the holiday always falls on the same date each

Doc# E107707 10 - 19
10: Time of Use
Electro Industries/GaugeTechThe Leader In Power Monitoring and Smart Grid SolutionsElectro Industries/GaugeTechThe Leader In Power Monitoring and Smart Grid Solutions
year), Occurs on the Next Day (the holiday always occurs on the
day after), Spans to the Next Day (it is a two-day holiday),
Weekday Only - Nearest Weekday (if the date falls on a weekend,
the holiday moves to the nearest weekday), Weekday Only -
Nearest Weekday After (if the date falls on a weekend, the holi-
day moves to the nearest weekday after the set date), and
Weekday Only - Nearest Weekday Prior (if the date falls on a
weekend, the holiday moves to the nearest weekday before the
set date).
c. Configure the custom day’s date. You can select Week, Day, of
Month (for example, the First Monday of September for U.S.
Labor Day); a specific day (for example December 25th for
Christmas), or Special Day (Easter).
d. Click OK to save the custom day’s settings.
• To edit a Custom day, click on the date in the list and click the Edit the
Selected Day button. You will see the screen shown on the previous page.
Change the settings as you want and click OK.
• To remove a Custom day, click on the date in the list and click the
Remove the Selected Day button.

Doc# E107707 10 - 20
10: Time of Use
Electro Industries/GaugeTechThe Leader In Power Monitoring and Smart Grid SolutionsElectro Industries/GaugeTechThe Leader In Power Monitoring and Smart Grid Solutions
7. Click the Time of Use Labels tab - you will see the screen shown below.
The default TOU labels are On Peak and Off Peak.
• To add a new Time of Use label, click the Add a Label button. You will see
an empty line where you can add the new label. After you enter a label,
press Enter or click anywhere in the screen. A number will appear next to
the new Time of Use label.
• To edit an existing Time of Use label, click on the label and click the Edit
the Selected Label button. You can then change the label. After you
change the label, press Enter or click anywhere in the screen.
• To remove a Time of Use label you added, click on the label and click the
Remove the Selected Label button. Note that you won’t be able to remove
the default TOU labels.

Doc# E107707 10 - 21
10: Time of Use
Electro Industries/GaugeTechThe Leader In Power Monitoring and Smart Grid SolutionsElectro Industries/GaugeTechThe Leader In Power Monitoring and Smart Grid Solutions
8. Click the Time of Use Schedules tab - you will see the screen shown below.
Use this screen to set the time range for the existing Schedules. The Schedules
consist of the default Schedules - Weekday, Weekend, and Holiday, and any Sched-
ules you created using the Schedule Names tab. There is one default time range
with a Start Time of 00:00 and an End time of 24:00 for the Off Peak TOU label.
• To add a time range to a schedule, select the Schedule from the pull-
down menu and click the Add a Time Range button. You will see the
screen shown below.
Select the start time and the TOU label from the pull-down menus and
click OK. The End time will be updated automatically (see the example on
the next page).

Doc# E107707 10 - 22
10: Time of Use
Electro Industries/GaugeTechThe Leader In Power Monitoring and Smart Grid SolutionsElectro Industries/GaugeTechThe Leader In Power Monitoring and Smart Grid Solutions
• To edit a Schedule’s time range, select the Schedule from the pull-down
list, click on the Register name (TOU label) in the list and click the Edit a
Selected Time Range button. You will see the TOU Time Range screen
shown on the previous page. Change the settings as you want and click
OK.
• To remove a Schedule’s time range, select the Schedule from the pull-
down list, click on the Register name (TOU label) in the list and click the
Remove a Selected Time Range button.
Example of Time Range Setting
Let’s say you are setting up the Weekday Schedule’s Off Peak and On
Peak Time Range. The first Off Peak range is already set in the default
setting. But it is set for the whole day - 00:00 Start Time and 24:00 End
Time. So the first step is to set the beginning time for the On Peak range.
Once you do that, the End Time for the first Off Peak period will be
adjusted accordingly.
1. From the TOU Schedules tab screen, select Weekday from the Sched-
ule Name pull-down menu and click the Add a Time Range button.
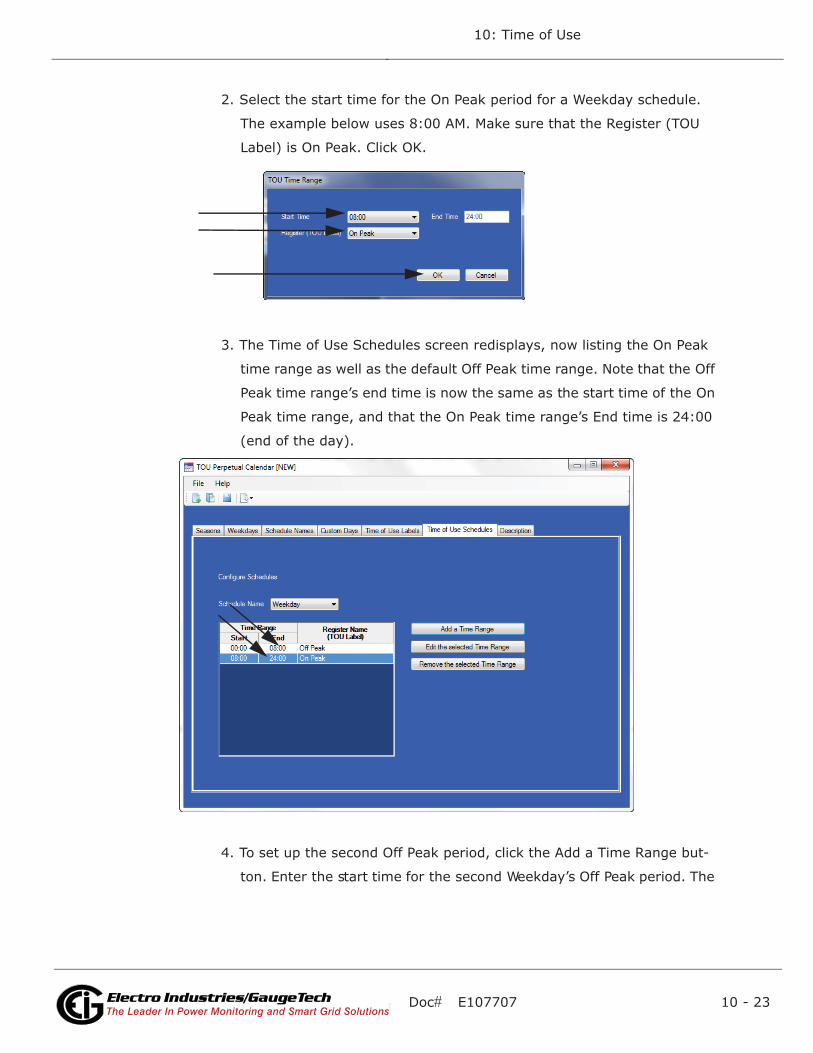
Doc# E107707 10 - 23
10: Time of Use
Electro Industries/GaugeTechThe Leader In Power Monitoring and Smart Grid SolutionsElectro Industries/GaugeTechThe Leader In Power Monitoring and Smart Grid Solutions
2. Select the start time for the On Peak period for a Weekday schedule.
The example below uses 8:00 AM. Make sure that the Register (TOU
Label) is On Peak. Click OK.
3. The Time of Use Schedules screen redisplays, now listing the On Peak
time range as well as the default Off Peak time range. Note that the Off
Peak time range’s end time is now the same as the start time of the On
Peak time range, and that the On Peak time range’s End time is 24:00
(end of the day).
4. To set up the second Off Peak period, click the Add a Time Range but-
ton. Enter the start time for the second Weekday’s Off Peak period. The
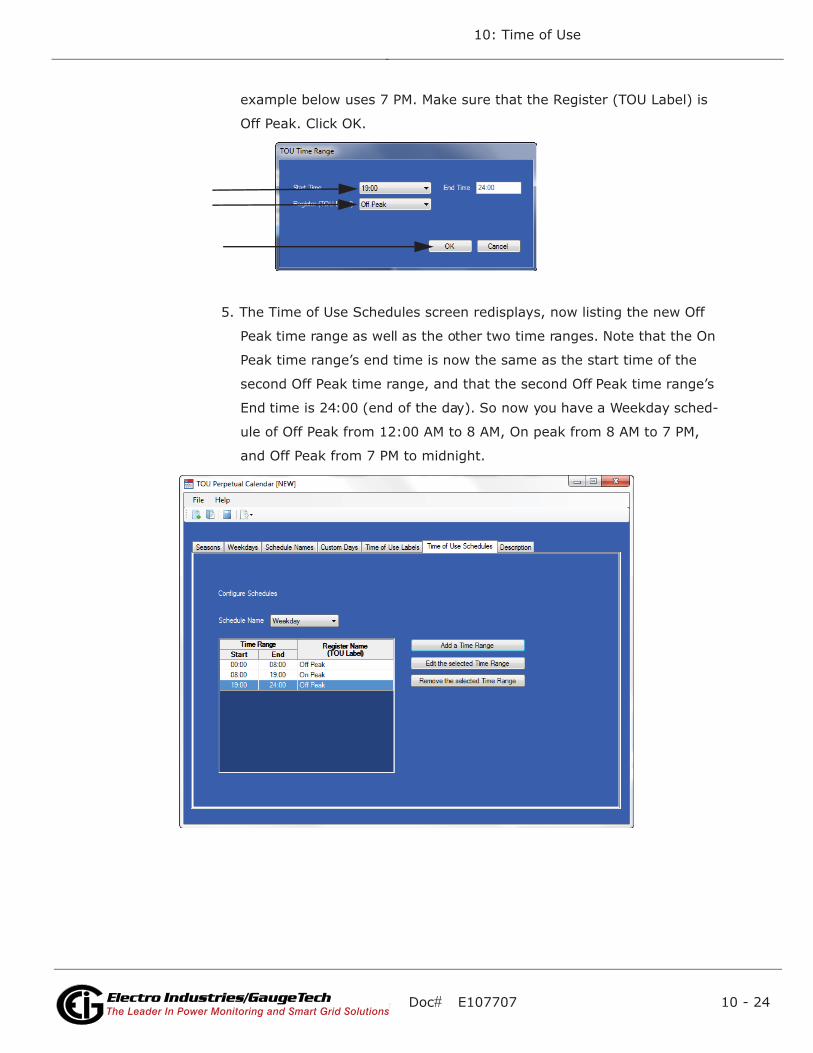
Doc# E107707 10 - 24
10: Time of Use
Electro Industries/GaugeTechThe Leader In Power Monitoring and Smart Grid SolutionsElectro Industries/GaugeTechThe Leader In Power Monitoring and Smart Grid Solutions
example below uses 7 PM. Make sure that the Register (TOU Label) is
Off Peak. Click OK.
5. The Time of Use Schedules screen redisplays, now listing the new Off
Peak time range as well as the other two time ranges. Note that the On
Peak time range’s end time is now the same as the start time of the
second Off Peak time range, and that the second Off Peak time range’s
End time is 24:00 (end of the day). So now you have a Weekday sched-
ule of Off Peak from 12:00 AM to 8 AM, On peak from 8 AM to 7 PM,
and Off Peak from 7 PM to midnight.

Doc# E107707 10 - 25
10: Time of Use
Electro Industries/GaugeTechThe Leader In Power Monitoring and Smart Grid SolutionsElectro Industries/GaugeTechThe Leader In Power Monitoring and Smart Grid Solutions
9. Click the Description tab. You will see the screen shown below.
You can enter a description or notes for the Perpetual Calendar.
10. To save the Perpetual Calendar Click the Save icon at the top of the screen or click
File>Save Profile or File>Save Profile As.
11. You also have the following options:
• To create a new Perpetual Calendar, click the New icon or click File>New
Profile.
• To open a previously saved Perpetual Calendar, click the Open icon or
click File>Open Profile.
Save
New
Open
Export

Doc# E107707 10 - 26
10: Time of Use
Electro Industries/GaugeTechThe Leader In Power Monitoring and Smart Grid SolutionsElectro Industries/GaugeTechThe Leader In Power Monitoring and Smart Grid Solutions
• To export the Perpetual Calendar, click the Export icon or click
File>Export>Nexus TOU Calendar File. See the instructions in Section
10.5.1.
• To view a report, click File>View a Report. If you haven’t yet saved the
Perpetual Calendar, you will be prompted to do so. Then the Calendar
report will open in a text window. See the example report below.
12. To exit the Perpetual Calendar setup, click File>Exit or click the X in the
screen’s Title Bar.
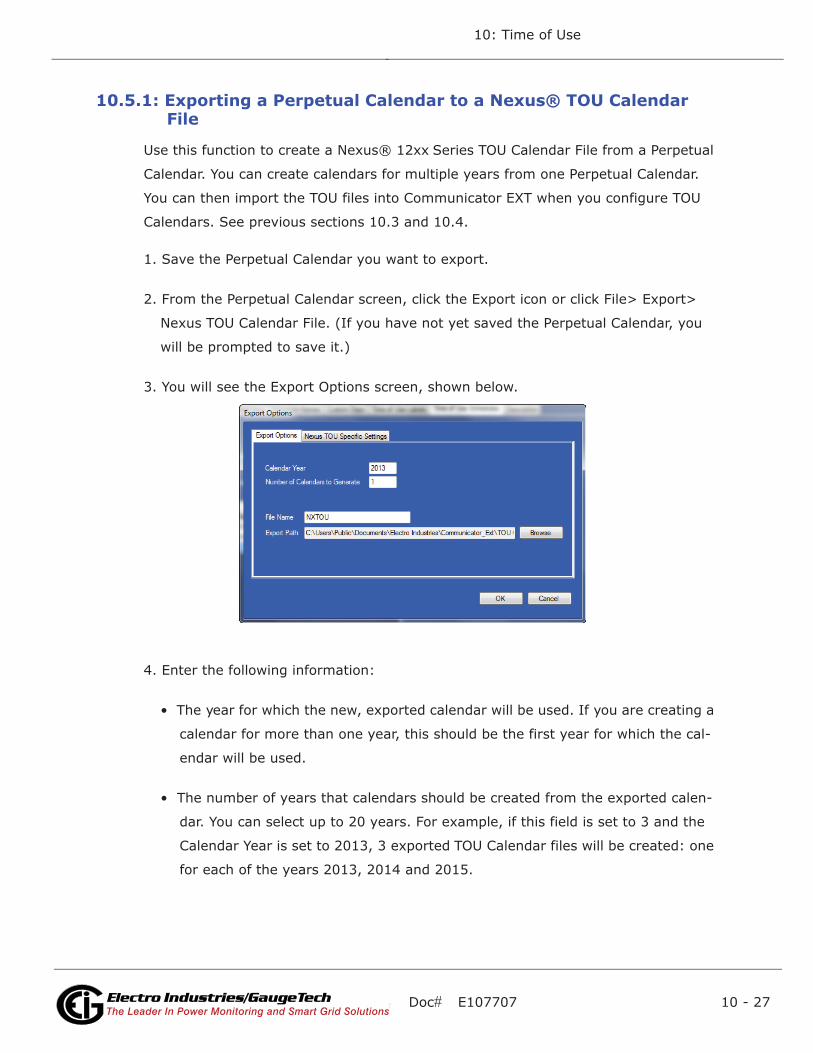
Doc# E107707 10 - 27
10: Time of Use
Electro Industries/GaugeTechThe Leader In Power Monitoring and Smart Grid SolutionsElectro Industries/GaugeTechThe Leader In Power Monitoring and Smart Grid Solutions
10.5.1: Exporting a Perpetual Calendar to a Nexus® TOU Calendar File
Use this function to create a Nexus® 12xx Series TOU Calendar File from a Perpetual
Calendar. You can create calendars for multiple years from one Perpetual Calendar.
You can then import the TOU files into Communicator EXT when you configure TOU
Calendars. See previous sections 10.3 and 10.4.
1. Save the Perpetual Calendar you want to export.
2. From the Perpetual Calendar screen, click the Export icon or click File> Export>
Nexus TOU Calendar File. (If you have not yet saved the Perpetual Calendar, you
will be prompted to save it.)
3. You will see the Export Options screen, shown below.
4. Enter the following information:
• The year for which the new, exported calendar will be used. If you are creating a
calendar for more than one year, this should be the first year for which the cal-
endar will be used.
• The number of years that calendars should be created from the exported calen-
dar. You can select up to 20 years. For example, if this field is set to 3 and the
Calendar Year is set to 2013, 3 exported TOU Calendar files will be created: one
for each of the years 2013, 2014 and 2015.

Doc# E107707 10 - 28
10: Time of Use
Electro Industries/GaugeTechThe Leader In Power Monitoring and Smart Grid SolutionsElectro Industries/GaugeTechThe Leader In Power Monitoring and Smart Grid Solutions
• The File Name and Export Path. These fields are used to specify the base file-
name of the exported file and the location where the exported file(s) will be
saved.
• The calendar year is added to the end of the file name you enter. For
example, if the filename is NXTOU, the exported file for year 2013 will be
named “NXTOU2013.TOU.”
• You can click the Browse button to select another location to save the
calendar file, other than the default location listed on the screen.
5. Use the Nexus TOU Specific Settings tab to configure the Demand Averaging Win-
dow and/or the Register Accumulation Method for the exported file(s).
• Select the Demand Average Window method: Block Window or Rolling Window.
• Select the Register Accumulation method: “Accumulations in Registers starts at
0 when new period starts” or “Accumulations in Registers continues where Prior
Month and Frozen Registers left off.”
6. Click OK to save your Export settings.

Doc# E107707 10 - 29
10: Time of Use
Electro Industries/GaugeTechThe Leader In Power Monitoring and Smart Grid SolutionsElectro Industries/GaugeTechThe Leader In Power Monitoring and Smart Grid Solutions
10.6: Viewing TOU Accumulated Data1. From the Real Time Poll menu select Revenue, Energy and Demand Readings >
Time of Use Registers. You will see the screen shown below.
2. From the Group pull-down menu, select the month or season accumulations you
would like to view.
3. From the Register pull-down menu, select the individual register accumulation (or
the total of all registers) you would like to view for the selected month or season.

Doc# E107707 10 - 30
10: Time of Use
Electro Industries/GaugeTechThe Leader In Power Monitoring and Smart Grid SolutionsElectro Industries/GaugeTechThe Leader In Power Monitoring and Smart Grid Solutions
• The Nexus® meters are true four-quadrant power meters. They display the VARs
and VA for each quadrant, as illustrated below:
4. Print or Export the data by clicking the appropriate button at the bottom of the
screen.
5. Click OK to close this screen and return to the main Communicator EXT screen.
Quadrant PowerFactor Watt VAR
1 Lag + +
2 Lead - +
3 Lag - -
4 Lead + -
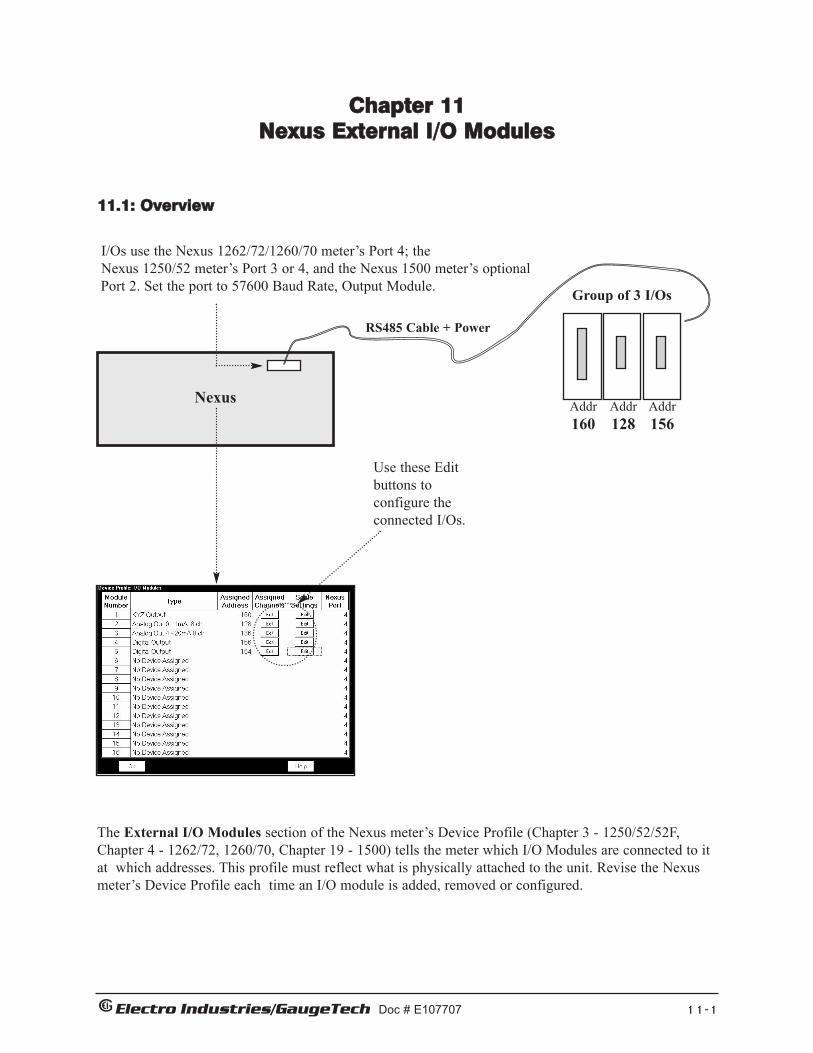
Chapter 11Nexus External I/O Modules
11.1: Overview
Electro Industries/GaugeTech Doc # E107707 11-1
Nexus
I/Os use the Nexus 1262/72/1260/70 meter’s Port 4; theNexus 1250/52 meter’s Port 3 or 4, and the Nexus 1500 meter’s optional
Port 2. Set the port to 57600 Baud Rate, Output Module.
RS485 Cable + Power
Addr160
Addr128
Addr156
Group of 3 I/Os
The External I/O Modules section of the Nexus meter’s Device Profile (Chapter 3 - 1250/52/52F,Chapter 4 - 1262/72, 1260/70, Chapter 19 - 1500) tells the meter which I/O Modules are connected to itat which addresses. This profile must reflect what is physically attached to the unit. Revise the Nexusmeter’s Device Profile each time an I/O module is added, removed or configured.
Use these Editbuttons toconfigure theconnected I/Os.

11.2: Outline of the Procedure for Installing I/O Modules
The steps below are detailed in subsequent sections of this chapter.
1. Review I/O hardware details in your meter’s Installation and Operation Manual.
2. IMPORTANT! Before connecting any I/Os to the Nexus meter, you must be sure each one has itsown unique address. All I/Os are shipped with a pre-set address and a baud rate of 57600. SeeSection 11.5 for a list of factory-set addresses and baud rates. To assign or change I/O addresses, seeSection 11.6.
3. Write down the name and unique address of each I/O you will be using. (You will need to know theaddresses for the Nexus meter’s Device Profile.)
4. Connect the I/O or group of I/Os to the Nexus 1250/52 meter’s Port 3 or 4 the Nexus 1262/72/1260/70 meter’s Port 4, or the Nexus 1500 meter’s Port 2. IMPORTANT! You must use the correct port. Be sure ports are set to operate at the same baud rateas the I/O modules. The ports must also be configured as Output Modules. See Chapters 3 (Nexus1250/52/52F) 4 (Nexus 1262/72/1260/70), and 19 (Nexus 1500) for port configuration instructions.
5. Retrieve the Nexus meter’s Device Profile. In the External I/O Modules section, enter the name ofeach I/O and its unique address. Use the Edit buttons to configure the I/Os. Each I/O connected tothe unit must be included in the Device Profile. Update the Device Profile to record the changes. SeeSection 11.7. NOTE: Updating the Device Profile will reset all logs.
This chapter also covers the following I/O utilities:
• Nexus I/O Device Status (Section 11.14): lists all registered I/Os currently in use.
• Query I/O Module (Section 11.15): locates an I/O’s address and baud rate.
• Locator Utility (Section 11.16–17): locates an I/O’s address and baud rate without using thereset button.
• Stand Alone Programmer (Section 11.18): allows you to configure all I/O parameters directlyfrom a computer, not through a Nexus Meter.
Electro Industries/GaugeTech Doc # E107707 11-2

11.3: How to Use Multiple I/O Modules
Each type of I/O module is shipped with a factory-set address (see Section 11.5). If you plan to usemore than one I/O module of the same type (such as three KYZ modules), you must change theaddress of each module individually before connecting the group to the Nexus meter. See Section 11.6 for instructions on changing a module’s address and baud rate.
Each I/O module in a group must have its own unique address. Each module must be set to operateat the same baud rate as the port it is connected to (57600 is recommended).
If you do not know an I/O module’s address or baud rate, use the Query I/O function detailed in Section 11.14. This function works only on Port 4.
To connect multiple I/Os together, attach the male RS485 port of one module to the female RS485port of another. Secure by tightening built-in fasteners. Attach mounting brackets to the outsidemodules. Use the steps in Section 11.4 to determine if you must use a separate power source (forexample, EIG PSIO) to supply added power to the group.
To connect a group of I/Os to the Nexus meter, connect an RS485 cable to the group’s availablefemale RS485 port. Connect the other end of the cable to the Nexus meter’s I/O port.
You may combine different types of I/O modules together in a group.
After all modules have been assigned a unique address and connected to the meter, you must enterthem in the Nexus meter’s Device Profile. See Section 11.7.
11.4: Steps to Determine Power Needed
• The Nexus 1250/1252 meter’s available power for all ports combined is 12VA.Nexus 1262/72/1260/70 do NOT supply power for I/O Modules; a power supply is required.
• Refer to the table in the Section 11.5 to determine the VA Ratings for I/O modules and displays. • Add the VA Ratings for all I/Os and Displays in use and compare Available Power to Power
Needed.
See your meter’s Installation and Operation Manual for details.
Electro Industries/GaugeTech Doc # E107707 11-3

11.5: I/O Modules’ Factory Settings and VA Ratings
All I/Os are shipped pre-programmed with addresses and a baud rate of 57600. The table belowdetails the factory-set address for each module and the VA Ratings for I/O modules and Nexus displays. Refer to the Section 11.4 for the steps to determine if you must use an additional powersource with the Nexus 1250/52. The Nexus 1262/72/1260/70 and the Nexus 1500 do NOT supplypower to I/O Modules; a power supply, such as the PSIO, is required. See Section 11.5.1.
To temporarily reset an I/O module to address 247 and 57600 baud (program defaults), press andhold the Reset button for 3 seconds. The module will remain in Reset mode for 30 seconds.
Electro Industries/GaugeTech Doc # E107707 11-4
I/O MODULES’ FACTORY SETTINGS and VA RATINGS
MODELNUMBER
1mAON4
MODULE ADDRESS VA RATING
1mAON8
0-1mA, 4 Analog Outputs 128
0-1mA, 8 Analog Outputs 128
20mAON4 4-20mA, 4 Analog Outputs 132
20mAON8 4-20mA, 8 Analog Outputs 132
8AI1 0-1mA, 8 Analog Inputs 136
8AI2 0-20mA, 8 Analog Inputs 140
8AI3 0-5 VDC, 8 Analog Inputs 144
8AI4 0-10 VDC, 8 Analog Inputs 148
4RO1 4 Latching Relay Outputs 156
4PO1 4 KYZ Pulse Outputs 160
8DI1 8 Status Inputs (Wet/Dry) 164
2.7 VA
3.2 VA
5.0 VA
8.5 VA
2.3 VA
2.3 VA
2.3 VA
2.3 VA
2.7 VA
2.7 VA
1.0 VA
NEXUS DISPLAYS’ VA RATINGS
P40N, P41N, P43N Nexus LED Display 6.0Watts
P60N Nexus Touch Screen Display Approx.4.5Watts
P40N+ Nexus LED Display Approx. 3.0Watts
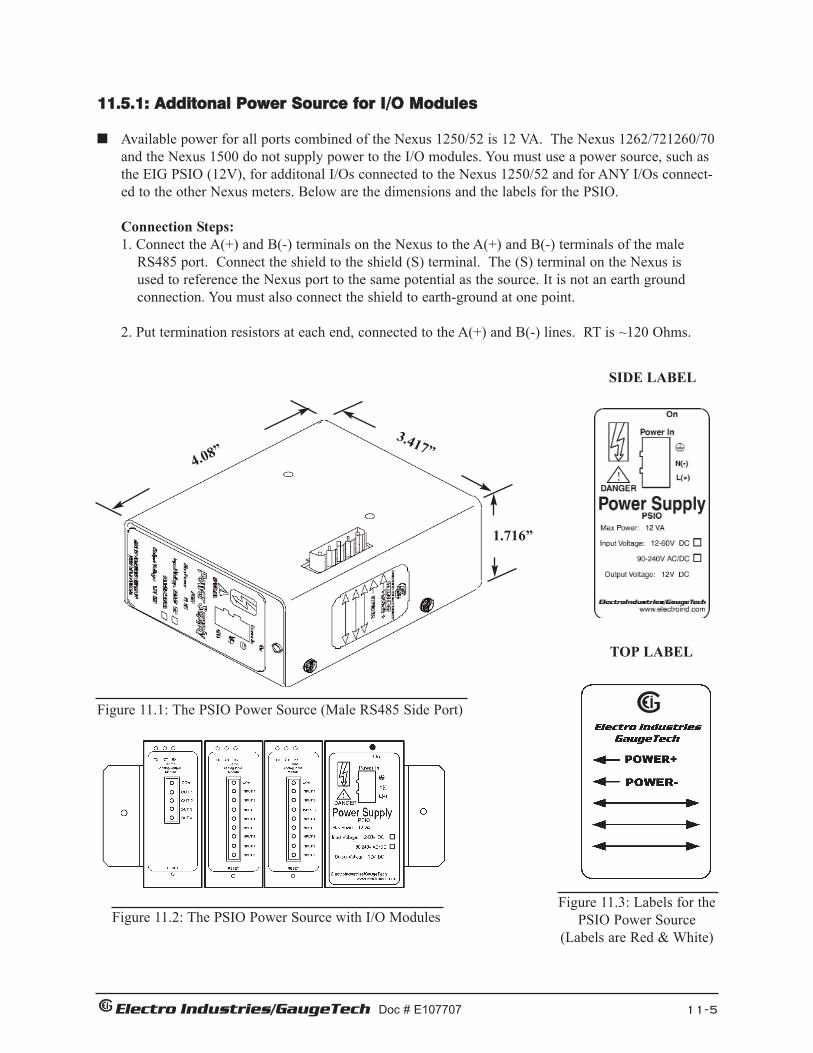
11.5.1: Additonal Power Source for I/O Modules
Available power for all ports combined of the Nexus 1250/52 is 12 VA. The Nexus 1262/721260/70and the Nexus 1500 do not supply power to the I/O modules. You must use a power source, such asthe EIG PSIO (12V), for additonal I/Os connected to the Nexus 1250/52 and for ANY I/Os connect-ed to the other Nexus meters. Below are the dimensions and the labels for the PSIO.
Connection Steps:1. Connect the A(+) and B(-) terminals on the Nexus to the A(+) and B(-) terminals of the male
RS485 port. Connect the shield to the shield (S) terminal. The (S) terminal on the Nexus isused to reference the Nexus port to the same potential as the source. It is not an earth ground connection. You must also connect the shield to earth-ground at one point.
2. Put termination resistors at each end, connected to the A(+) and B(-) lines. RT is ~120 Ohms.
Electro Industries/GaugeTech Doc # E107707 11-5
SIDE LABEL
TOP LABEL
Figure 11.1: The PSIO Power Source (Male RS485 Side Port)
Figure 11.2: The PSIO Power Source with I/O ModulesFigure 11.3: Labels for the
PSIO Power Source (Labels are Red & White)
4.08”3.417”
1.716”

11.6: Assign Addresses and Baud Rates to an I/O Module
Note: The utility described below requires the I/O to be connected to the Nexus 1250/52 Meter atPort 3 or 4, Nexus 1262/72/1260/70 at Port 4, and Nexus 1500 at Port 2. To configure an I/Omodule by connecting it directly to your computer, use the Stand Alone Programmer utility: seeSection 11.17.
You must know the current address and baud rate of the I/O you want to change. See Section 11.5for a list of factory-settings, if the I/O is new, or use the Query I/O function (Section 11.14) (Port 4only), if the address and/or baud rate has been changed or is no longer known. When you have deter-mined the current address and baud rate, proceed with the steps listed below.
1. Make sure the Nexus meter’s Port is configured to communicate with the I/O module at the samebaud rate (57600 recommended). Set the Port to Output Module mode. See Chapter 3 (1250/52),Chapter 4 (1262/72/1260/70), or Chapter 19 (1500) for details on configuring the meter’s communi-cation ports.
2. Connect the I/O to the meter’s port.
Note: You may connect a group of I/Os to the Nexus meter to make address/baud rate changes onlyif each I/O already has a unique address. If the I/Os have the same address—such as three new KYZmodules—you must connect and change their addresses individually. See Section 11.3 for details onusing multiple I/O modules.
3. Select I/O Devices>Change I/O Module Address/Baud Rate. You will see the screen shownbelow.:
4. From the pull-down menus, enter the module’s current address and baud rate. Then enter the addressand baud rate you would like to assign. Enter an address from 1 to 247, being sure that the address isnot already assigned to any other I/O you will be using.
5. Click Make Change. A confirmation screen appears after the module has been updated. Repeat theprocedure for all I/Os in the group.
6. Write down the module’s new address and baud rate.
7. Proceed to Section 11.7 to enter the I/O in the meter’s Device Profile and configure all other I/Oparameters.
Electro Industries/GaugeTech Doc # E107707 11-6

11.7: Enter I/O Modules into the Nexus Meter’s Device Profile
The Nexus meter uses a Master/Slave polling architecture when communicating with the I/O modules; therefore you must enter all I/Os in the Nexus meter’s Device Profile. This procedure tellsthe unit what types of modules are connected to it, what parameters you have set for them and atwhat address they may be found.
1. Write down the name and unique address of each I/O you plan to use. Be sure all baud rates matchthat of the port you will be connecting to (57600 is recommended). Be sure all addresses are unique.See Section 11.6 for instructons on assigning addresses and baud rates.
2. Connect the I/O module(s) to the meter’s port see your meter’s Installation and Operation Manualsfor hardware/installation details. Be sure the port is operating at 57600 baud and is in Output Modulemode.
3. Click the Profile icon (or select Edit Current Device Profile from the Tools Menu) to retrieve themeter’s Device Profile.
4. When Communicator EXT has retrieved the Device Profile from the Nexus meter, double clickExternal I/O Modules in the Device Profile screen. You will see the screen shown below
5. Click in the Type column and use the pull-down menu to select the specific I/O you wish to enter.You may enter up to 16 modules.
6. Enter each module’s unique address. If you have not assigned a unique address to each module, seeSection 11.6. Each module’s address must be unique, otherwise communication will not function properly.
Electro Industries/GaugeTech Doc # E107707 11-7
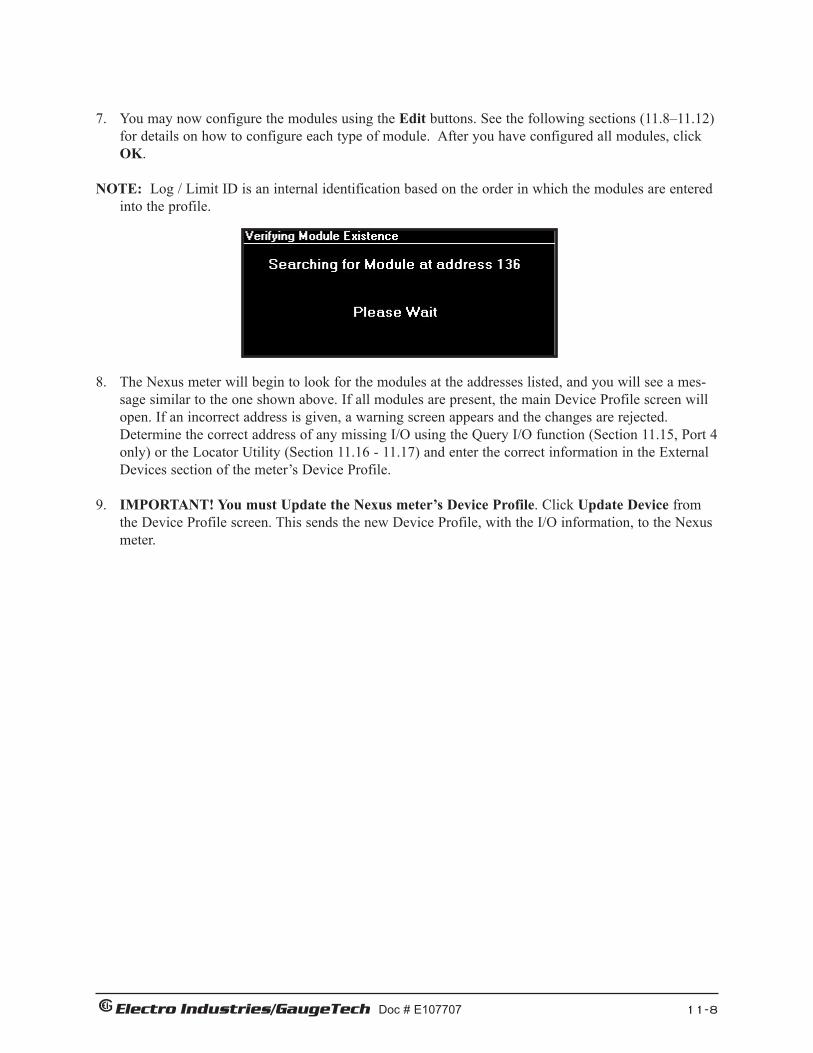
7. You may now configure the modules using the Edit buttons. See the following sections (11.8–11.12)for details on how to configure each type of module. After you have configured all modules, clickOK.
NOTE: Log / Limit ID is an internal identification based on the order in which the modules are enteredinto the profile.
8. The Nexus meter will begin to look for the modules at the addresses listed, and you will see a mes-sage similar to the one shown above. If all modules are present, the main Device Profile screen willopen. If an incorrect address is given, a warning screen appears and the changes are rejected.Determine the correct address of any missing I/O using the Query I/O function (Section 11.15, Port 4only) or the Locator Utility (Section 11.16 - 11.17) and enter the correct information in the ExternalDevices section of the meter’s Device Profile.
9. IMPORTANT! You must Update the Nexus meter’s Device Profile. Click Update Device fromthe Device Profile screen. This sends the new Device Profile, with the I/O information, to the Nexusmeter.
Electro Industries/GaugeTech Doc # E107707 11-8

11.8: Configure the Analog Output Module
1. Be sure each module has a unique address and is connected to the meter’s I/O port, at the same baudrate as the port (57600 recommended); see Section 11.6.
2. Retrieve the External Devices section of the Device Profile from the meter (see Section 11.7).
3. After you have entered the type of Analog Output Module in the Type column and its address in theassigned address column, click the Edit button in the Nexus Settings column. You will see the screenshown below.
4. From the pull-down menus, select the type of reading and the channel to which it will be applied.
5. The module reads a 4-byte value per channel. You must select 4 of the 8 bytes to be read by themodule. Use the pull-down menu to choose 4 of the 8 bytes.
6. Click OK when all channels are set. You will return to the previous screen..
7. Click the Edit button in the Module Settings column. Communicator EXT retrieves the settings fromthe I/O module. You will see the screen shown on the next page.
Electro Industries/GaugeTech Doc # E107707 11-9

8. For each channel, enter the scale setting according to the needs of your application. The scale HighValue refers to the high end of the module; the scale Low Value refers to the low end of the module.For example, if you have a 4–20mA module, the scale High Value determines what 20mA equals.The scale Low Value determines what 4mA equals. (See note below on How to Set Scale Values.)
• To change the I/O’s Transmit Delay, you must use the Stand Alone Programmer, Section 11.18.
9. When you have entered the scale settings, click Update. Communicator EXT will send the new scalesettings to the module and then reset it.
10. IMPORTANT! Be sure to send the updated Device Profile to the Nexus meter after you havefinished configuring all I/Os by click ing the Update Device button in the Device Profile screen.
Note on How to Set Scale Values: Enter values for volts, current and power in secondary. All othervalues should be set in primary.
Electro Industries/GaugeTech Doc # E107707 11-10

Electro Industries/GaugeTech Doc # E107707 11-11
11.9: Configure the Analog Input Module
The Analog Input Module can measure any type of reading, once it is converted to an electrical signal(within limits of the I/O Module). Below is an example of a reading and its conversion to a value:
Following are the steps to configure the Analog Input Module:
1. Be sure each module has a unique address and is connected to the meter’s I/O port at the same baudrate as the port (See Section 11.6).
2. Retrieve the External Devices section of the Device Profile from the Nexus meter (Section 11.7).
3. After you have entered the type of Analog Input Module in the Type column and its address in theAssigned Address column, click on the Nexus Settings Edit button. The following screen opens.
CONVERSION TO VALUE
READING SIGNAL VALUE
100o
50o
0
50o
110o
1mA
0.5mA
0.0mA
-0.5mA
-1mA
100%
50%
0%
-50%
-100%

4. Enter label and scaling factor for each input. The Value columns will appear in either milliamps orVolts, depending on the type of input chosen in the Device Profile.
5. Click OK when done.
6. Click the Module Settings Edit button and the following screen opens, reflecting the settings forAddress, Baud Rate and Transmission Delay.
Electro Industries/GaugeTech Doc # E107707 11-12
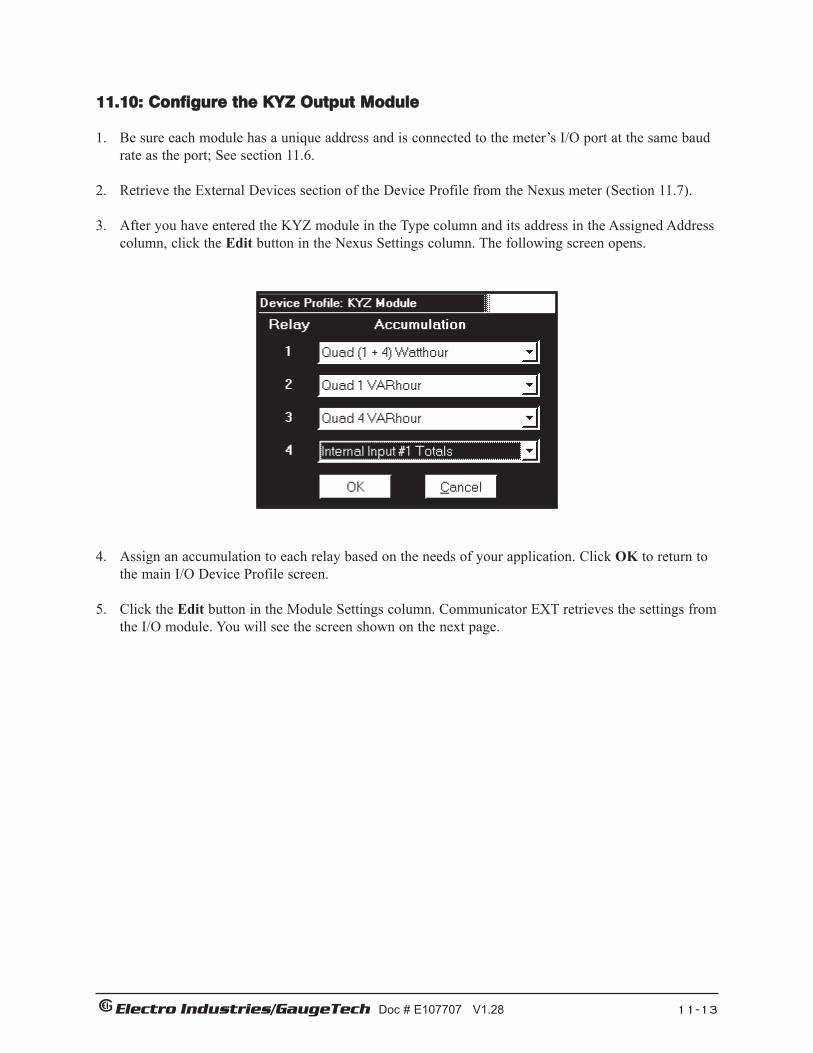
11.10: Configure the KYZ Output Module
1. Be sure each module has a unique address and is connected to the meter’s I/O port at the same baudrate as the port; See section 11.6.
2. Retrieve the External Devices section of the Device Profile from the Nexus meter (Section 11.7).
3. After you have entered the KYZ module in the Type column and its address in the Assigned Addresscolumn, click the Edit button in the Nexus Settings column. The following screen opens.
4. Assign an accumulation to each relay based on the needs of your application. Click OK to return tothe main I/O Device Profile screen.
5. Click the Edit button in the Module Settings column. Communicator EXT retrieves the settings fromthe I/O module. You will see the screen shown on the next page.
Electro Industries/GaugeTech Doc # E107707 V1.28 11-13

6. For each output, enter the Watt per Pulse and the Minimum Pulse Width in milliseconds. Leave theroll over at the default value of sixteen 9s. This value matches the Roll Over of the Nexus meter. Itis important that the roll over of the module match the roll over of the device to which it isconnected. Change the roll over only if you are using the module with a device other than a Nexusmeter or if you are using the module as a stand-alone unit.
• To change the I/O’s Transmit Delay you must use the Stand Alone Programmer, Section 11.18.
7. When you have entered the scale settings, click Update. Communicator EXT will send the new scalesettings to the module and then reset it.
8. IMPORTANT! Be sure to send the updated Device Profile to the Nexus meter after you havefinished configuring all I/Os by click ing the Update Device button in the Device Profile screen.
Electro Industries/GaugeTech Doc # E107707 11-14

11.11: Configure the Digital Output Module
1. Be sure each module has a unique address and is connected to the meter’s I/O port at the same baudrate as the port; see Section 11.6.
2. Retrieve the External Devices section of the Device Profile from the Nexus meter (see Section 11.7).
3. After you have entered the Digital Output module in the Type column and its address in theAssigned Address column, click the Edit button in the Nexus Settings column. You will see thescreen shown below.
4. Enter label and Common Shorted to N.C. or N.O. for each output. Click Lock to Manual Control,if desired.
5. Click OK when done.
6. Click the Edit button in the Module Settings column. The screen shwon below will open, reflectingthe settings for Address, Baud Rate and Transmission Delay.
Electro Industries/GaugeTech Doc # E107707 11-15
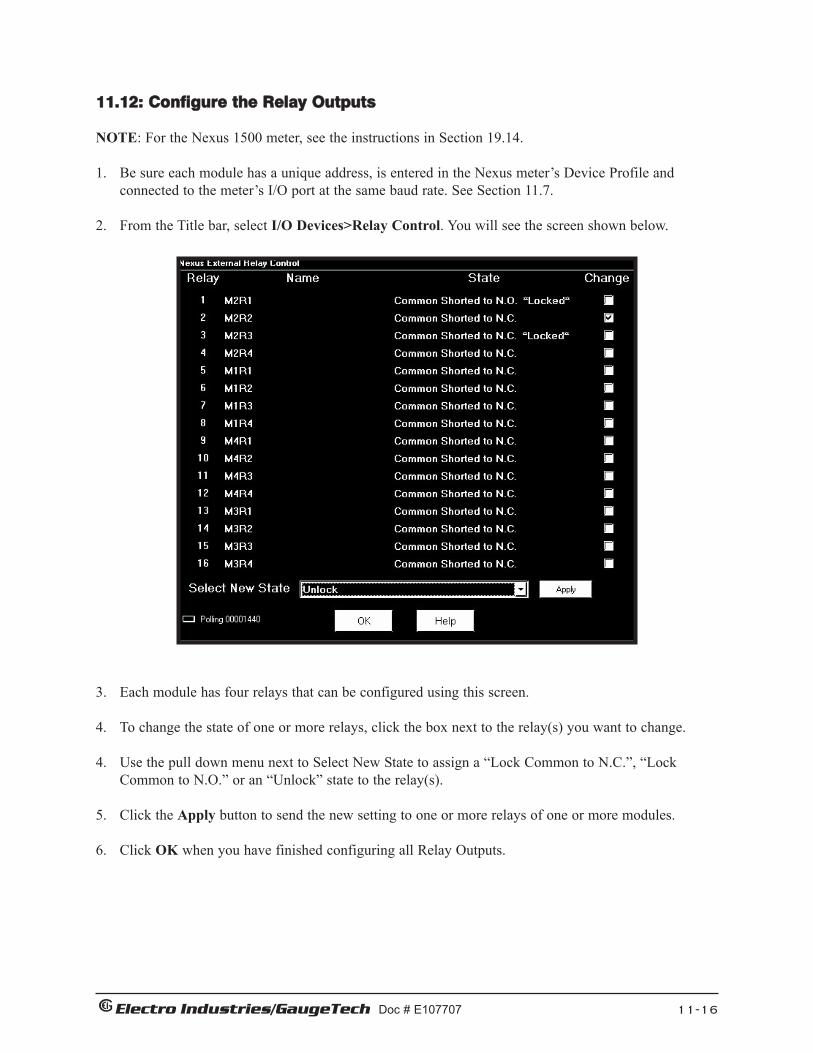
11.12: Configure the Relay Outputs
NOTE: For the Nexus 1500 meter, see the instructions in Section 19.14.
1. Be sure each module has a unique address, is entered in the Nexus meter’s Device Profile and connected to the meter’s I/O port at the same baud rate. See Section 11.7.
2. From the Title bar, select I/O Devices>Relay Control. You will see the screen shown below.
3. Each module has four relays that can be configured using this screen.
4. To change the state of one or more relays, click the box next to the relay(s) you want to change.
4. Use the pull down menu next to Select New State to assign a “Lock Common to N.C.”, “LockCommon to N.O.” or an “Unlock” state to the relay(s).
5. Click the Apply button to send the new setting to one or more relays of one or more modules.
6. Click OK when you have finished configuring all Relay Outputs.
Electro Industries/GaugeTech Doc # E107707 11-16
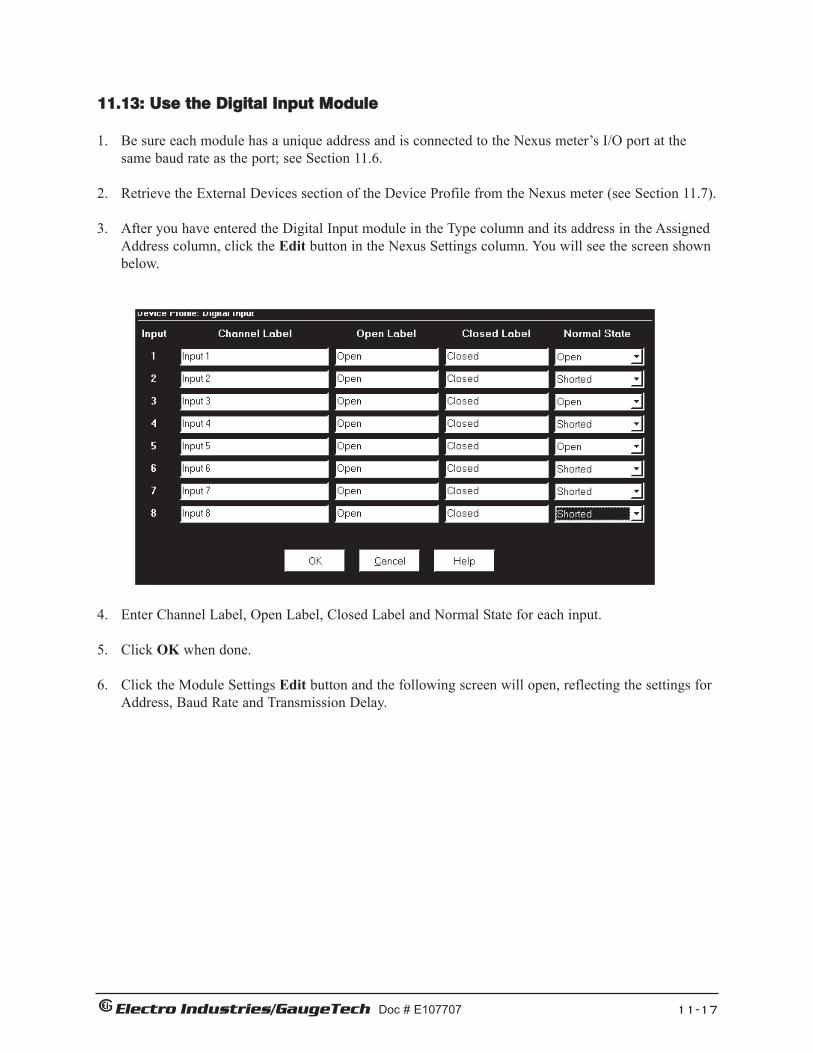
11.13: Use the Digital Input Module
1. Be sure each module has a unique address and is connected to the Nexus meter’s I/O port at thesame baud rate as the port; see Section 11.6.
2. Retrieve the External Devices section of the Device Profile from the Nexus meter (see Section 11.7).
3. After you have entered the Digital Input module in the Type column and its address in the AssignedAddress column, click the Edit button in the Nexus Settings column. You will see the screen shownbelow.
4. Enter Channel Label, Open Label, Closed Label and Normal State for each input.
5. Click OK when done.
6. Click the Module Settings Edit button and the following screen will open, reflecting the settings forAddress, Baud Rate and Transmission Delay.
Electro Industries/GaugeTech Doc # E107707 11-17

NOTE: If you are using a Digital Input module with a Nexus meter, you only need to enter the mod-ule in the Nexus Meter’s Device Profile (Section 11.7) and configure the screen above; you do notneed to configure the module further unless you want to change the roll over. The module’s roll overshould always match the roll over of the device to which the module is connected. The DigitalInput’s default roll over parameters are set for use with a Nexus meter; therefore they do not need tobe changed.
• To change the I/O’s Transmit Delay, you must use the Stand Alone Programmer, Section 11.18.
4. Assign a roll over to each relay based on the needs of your application. If the module is connectedto a Nexus meter, you do not need to change the roll over from the default.
5. Click Update to send the new roll over settings to the module.
6. IMPORTANT! Be sure to send the updated Device Profile to the Nexus meter after you have fin-ished configuring all I/Os by click ing the Update Device button in the Device Profile screen.
Electro Industries/GaugeTech Doc # E107707 11-18
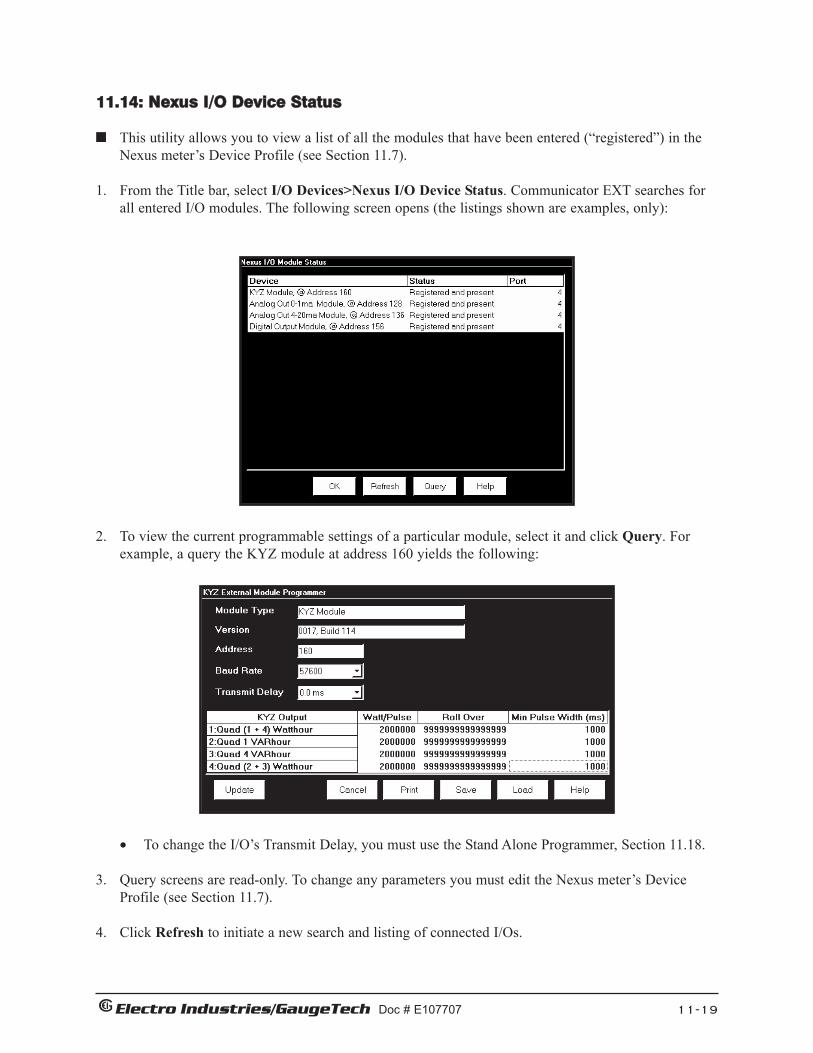
11.14: Nexus I/O Device Status
This utility allows you to view a list of all the modules that have been entered (“registered”) in theNexus meter’s Device Profile (see Section 11.7).
1. From the Title bar, select I/O Devices>Nexus I/O Device Status. Communicator EXT searches forall entered I/O modules. The following screen opens (the listings shown are examples, only):
2. To view the current programmable settings of a particular module, select it and click Query. Forexample, a query the KYZ module at address 160 yields the following:
• To change the I/O’s Transmit Delay, you must use the Stand Alone Programmer, Section 11.18.
3. Query screens are read-only. To change any parameters you must edit the Nexus meter’s DeviceProfile (see Section 11.7).
4. Click Refresh to initiate a new search and listing of connected I/Os.
Electro Industries/GaugeTech Doc # E107707 11-19

11.15: Query I/O—Locating an Unknown Address and Baud Rate
NOTES: This utility requires you to press the I/O module’s Reset button. If you are off-site, or cannot accessthe Reset button, use the Locator Utility described in Section 11.16–17.This procedure works only with Port 4.
1. From the Title bar, select I/O Devices>Query I/O. You will see the scree shown below.
it
2. Click Continue. You will see the screen shown below.
3. Use an instrument with a fine point to depress the I/O module’s Reset button. Hold it in for at leastthree seconds. This resets the I/O module to address 247 at 57600 baud for thirty seconds, allowingCommunicator EXT to retrieve the stored address and baud rate.
4. Click OK. The Nexus meter will begin looking for the device at the temporary address of 247. Whenthe I/O’s programmable information is located, the following screen opens:
5. Write down the address and baud rate.
Electro Industries/GaugeTech Doc # E107707 11-20
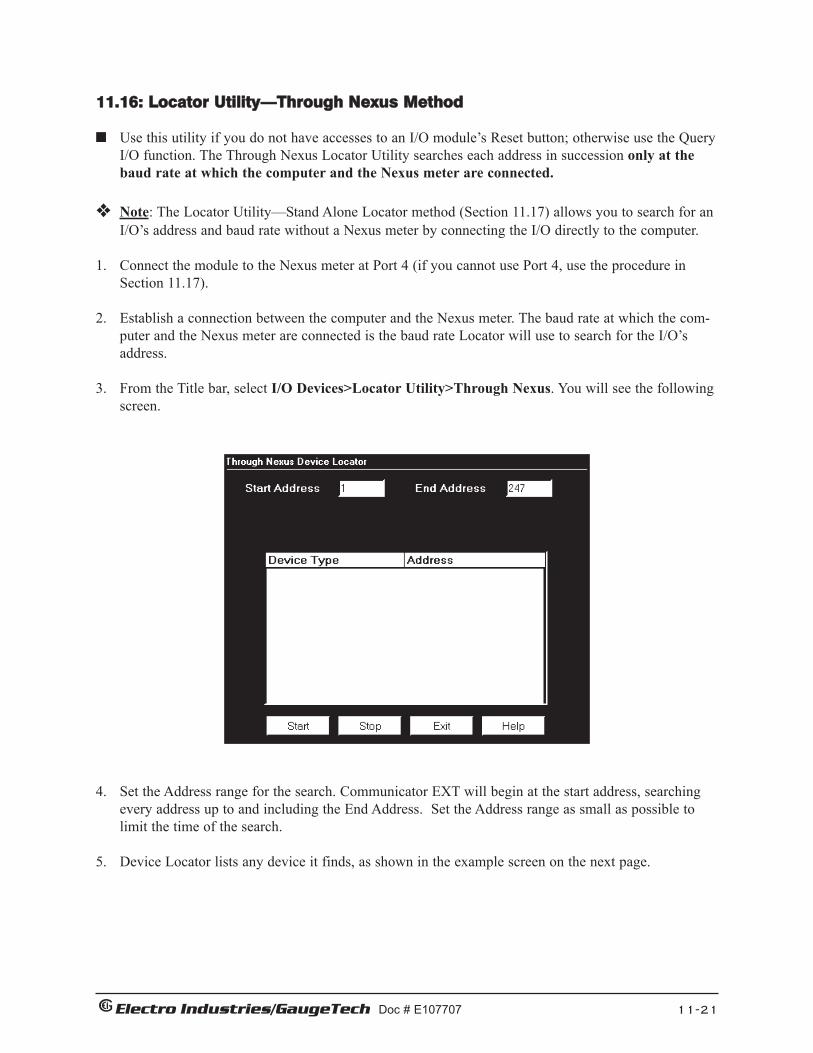
11.16: Locator Utility—Through Nexus Method
Use this utility if you do not have accesses to an I/O module’s Reset button; otherwise use the QueryI/O function. The Through Nexus Locator Utility searches each address in succession only at thebaud rate at which the computer and the Nexus meter are connected.
Note: The Locator Utility—Stand Alone Locator method (Section 11.17) allows you to search for anI/O’s address and baud rate without a Nexus meter by connecting the I/O directly to the computer.
1. Connect the module to the Nexus meter at Port 4 (if you cannot use Port 4, use the procedure inSection 11.17).
2. Establish a connection between the computer and the Nexus meter. The baud rate at which the com-puter and the Nexus meter are connected is the baud rate Locator will use to search for the I/O’saddress.
3. From the Title bar, select I/O Devices>Locator Utility>Through Nexus. You will see the followingscreen.
4. Set the Address range for the search. Communicator EXT will begin at the start address, searchingevery address up to and including the End Address. Set the Address range as small as possible tolimit the time of the search.
5. Device Locator lists any device it finds, as shown in the example screen on the next page.
Electro Industries/GaugeTech Doc # E107707 11-21
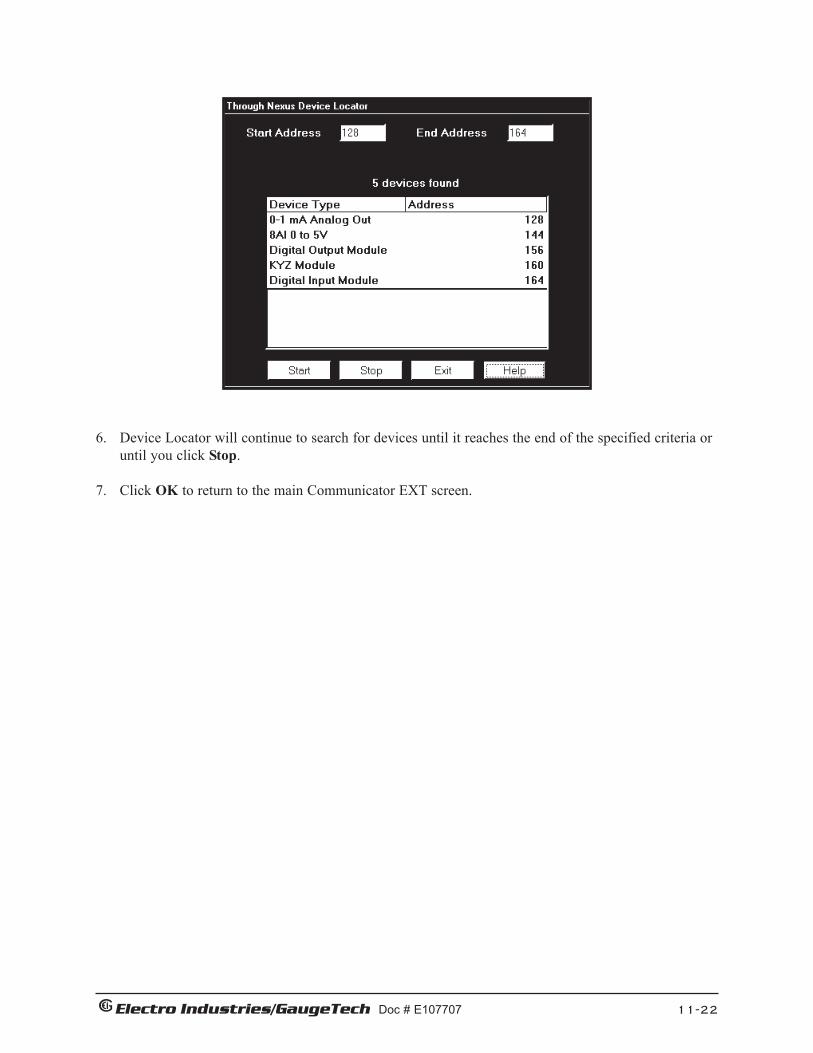
6. Device Locator will continue to search for devices until it reaches the end of the specified criteria oruntil you click Stop.
7. Click OK to return to the main Communicator EXT screen.
Electro Industries/GaugeTech Doc # E107707 11-22

11.17: Locator Utility—Stand Alone Method
The Stand Alone Locator utility searches for any I/O device connected directly to your computer (itis not for use with remote connections). The search criteria is a programmable range of baud ratesand addresses. When a device is found, Locator displays its name, baud rate and address.
To make a Stand Alone connection you will need the following:
• RS232 Cable
• EIG’s Unicom 2500 (or similar RS232/RS485 converter)
• An RS485 cable with power wires separated from communication wires; see diagram below.
• A 15–20V DC at 50–200 mA power source for the I/O module, such as EIG model PSIO; youmay also use any port on a Nexus 1250/52 meter as a power source.
1. Wire the Unicom, I/O module and computer as shown:
2. Use an RS232 cable to connect the Unicom 2500 and your computer:
• Set the Unicom to operate at 57600 baud.
• Set the Unicom to DCE and HD.
3. Click on the Communicator EXT Connect icon on the tool bar, or select Connect>Quick Connectfrom the Title bar. You will see the screen shown on the next page.
Electro Industries/GaugeTech Doc # E107707 11-23

4 This screen displays your computer’s communications settings.
•• Leave the Device Address field at 1.
• In the Baud Rate field enter 57600 (or the baud rate to which the RS-232/RS-485 converter isset).
• In the Serial Port field enter the computer’s communication port into which the RS-232 cable isinserted.
• Leave the Protocol field set at Modbus RTU.
5.. Click Connect. Communicator EXT will be unable to locate the device; after a few seconds a NoDevice Found At This Location dialogue box will appear: click OK.
6. From the Title bar, select I/O Devices>Locator Utility>Stand Alone. The following screen opens.
Electro Industries/GaugeTech Doc # E107707 11-24

7. Set the Address and baud rate ranges for the search. Communicator EXT will begin at the startaddress and baud rate, searching every address up to and including the End Address; then it willbegin the same address search at the next baud rate in the range.
NOTE: If you include all baud rates, the Device Locator will take about 12 hours to complete thesearch. If you know the baud rate of the device (Nexus meters are normally 115200, I/O’s are57600), just look in that baud rate. The search will take minutes instead of hours.
8. Click Start. The Device Locator begins searching for devices within the specified baud rate andaddress range.
9. The Device Locator will continue to search for devices until it reaches the end of the specified criteria or until you click Stop. Write down the address and baud rate.
10. Click Exit to return to the main Communicator EXT screen.
Electro Industries/GaugeTech Doc # E107707 11-25

11.18: Stand Alone Programmer
The Stand Alone programmer allows you to configure all parameters of an I/O module or group ofI/O modules by connecting the I/O(s) directly to the computer.
NOTE: If you plan to connect the module(s) to a Nexus meter in the future, you must still enter them inthe External Devices section of the Nexus meter’s Device Profile. See Section 11.7.
To use the Stand Alone Programmer, you will need the following:
• RS232 Cable
• EIG’s Unicom 2500 (or similar RS232/RS485 converter)
• An RS485 cable with power wires separated from communication wires; see diagram below.
• A 15–20V DC at 50–200 mA power source for the I/O module, such as EIG model PSIO; youmay also use any port on a Nexus 1250/52 meter as a power source (12VA max combined).
1. Wire the Unicom, I/O module(s) and computer as shown:
2. Use an RS232 cable to connect the Unicom 2500 and your computer:
• Set the Unicom to operate at 57600.• Set the Unicom to DCE and HD.
Electro Industries/GaugeTech Doc # E107707 11-26

3. Click the Connect icon on the Icon bar, or select Connect>Quick Connect.from the Title bar. Thefollowing screen opens.
• This screen displays your computer’s communications settings.
•• In the Device Address field, enter the current address of one of the I/O modules in the group. Ifyou do not know the address, use the Stand Alone Locator utility (Section 11.17).
• In the Baud Rate field, enter a baud rate that matches the baud rate of the I/O(s)—57600recommended. If you do not know the baud rate, use the Stand Alone Locator utility (Section11.17).
• In the Serial Port field, enter the computer’s communication port into which the RS232 cable isinserted.
• Leave the Protocol field set to Modbus RTU.
4.. Click Connect. Communicator EXT searches for a module at the specified baud rate and address.
5. When it has located the I/O(s), the following screen appears (see NOTE below):
NOTE: Communicator EXT will find a group of I/Os, if they have been added together on theConnection Manager screen.
Electro Industries/GaugeTech Doc # E107707 11-27
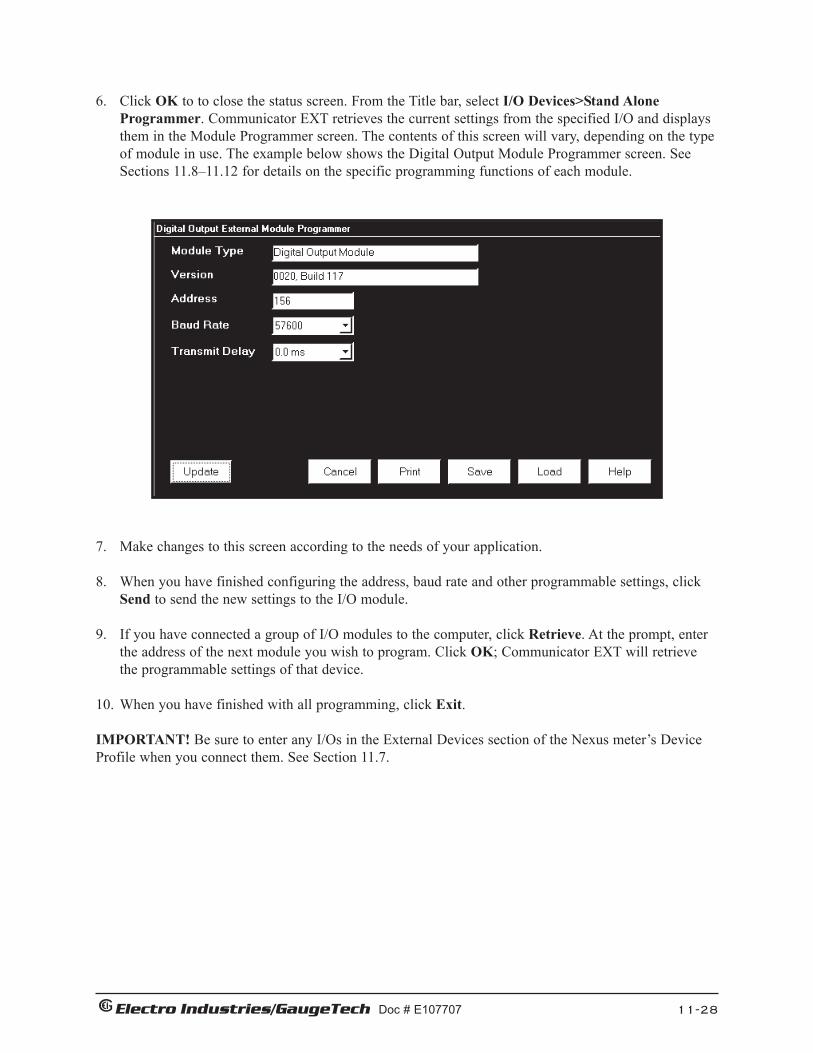
6. Click OK to to close the status screen. From the Title bar, select I/O Devices>Stand AloneProgrammer. Communicator EXT retrieves the current settings from the specified I/O and displaysthem in the Module Programmer screen. The contents of this screen will vary, depending on the typeof module in use. The example below shows the Digital Output Module Programmer screen. SeeSections 11.8–11.12 for details on the specific programming functions of each module.
7. Make changes to this screen according to the needs of your application.
8. When you have finished configuring the address, baud rate and other programmable settings, clickSend to send the new settings to the I/O module.
9. If you have connected a group of I/O modules to the computer, click Retrieve. At the prompt, enterthe address of the next module you wish to program. Click OK; Communicator EXT will retrievethe programmable settings of that device.
10. When you have finished with all programming, click Exit.
IMPORTANT! Be sure to enter any I/Os in the External Devices section of the Nexus meter’s DeviceProfile when you connect them. See Section 11.7.
Electro Industries/GaugeTech Doc # E107707 11-28

e Electro Industries/GaugeTech Doc # E107707 12-1
Chapter 12 Security
12.1: Overview
Your Nexus® meter gives you access to two security functions: Password Protection and Sealing Switch.
12.2: Password Overview NOTE: The use of the Password feature is recommended only if there are security issues and
only if you have a secure place in which to save the password. If you have forgotten your meter’s password, you cannot call the factory for help. There is no “back door.” If you lose or forget your password, you must send the unit back to the factory.
If you are not using this meter for primary revenue metering or for protective functions, you do not need to put a password protection scheme in the unit. If you do, make sure you archive the meter location and associated passwords carefully!
Communicator EXT’s password feature protects the following from unauthorized use:
• Changes to an EIG Meter’s Device profile • Setting device date and time • Resetting Device information (Max/Min/Demand, Hour Counters, Logs and Time-of-
Use) • Test Mode entry from software • Flash upgrades • Flicker start and stop • Pulse test • CT and PT Compensation • Relay control and I/O Utilities • Time-of-Use accumulations and changes to the Time-of-Use calendar settings • Retrieval of trending and Power Quality logs (Extended Passwords only)
There are two options for Password control:
• Bi-level passwords (all Nexus® meters) o Level 1 accesses Time-of-Use Accumulations only - these are Billing functions. o Level 2 accesses all password-protected functions. The Level 2 Password also
allows a user to enable or disable the password function. NOTES CONCERNING BI-LEVEL PASSWORDS: • When the password feature is enabled, Communicator EXT asks for the
appropriate password each time a user attempts to perform a protected operation.
• The Bi-level password feature is on a two-minute timer: after exiting from a password-protected area, the user has two minutes to access another protected area without re-entering the password. If more than two-minutes elapse, Communicator EXT asks for the appropriate
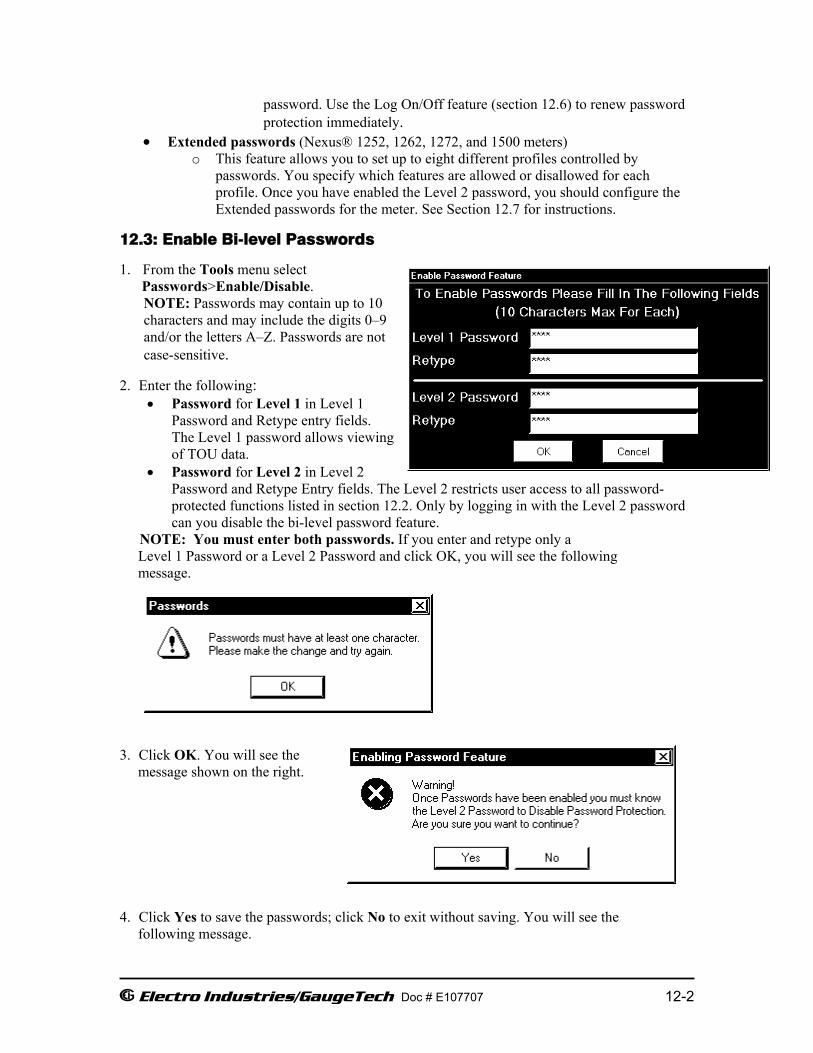
e Electro Industries/GaugeTech Doc # E107707 12-2
password. Use the Log On/Off feature (section 12.6) to renew password protection immediately.
• Extended passwords (Nexus® 1252, 1262, 1272, and 1500 meters) o This feature allows you to set up to eight different profiles controlled by
passwords. You specify which features are allowed or disallowed for each profile. Once you have enabled the Level 2 password, you should configure the Extended passwords for the meter. See Section 12.7 for instructions.
12.3: Enable Bi-level Passwords 1. From the Tools menu select Passwords>Enable/Disable.
NOTE: Passwords may contain up to 10 characters and may include the digits 0–9 and/or the letters A–Z. Passwords are not case-sensitive.
2. Enter the following:
• Password for Level 1 in Level 1 Password and Retype entry fields. The Level 1 password allows viewing of TOU data.
• Password for Level 2 in Level 2 Password and Retype Entry fields. The Level 2 restricts user access to all password-protected functions listed in section 12.2. Only by logging in with the Level 2 password can you disable the bi-level password feature.
NOTE: You must enter both passwords. If you enter and retype only a Level 1 Password or a Level 2 Password and click OK, you will see the following message.
3. Click OK. You will see the message shown on the right. 4. Click Yes to save the passwords; click No to exit without saving. You will see the following message.

e Electro Industries/GaugeTech Doc # E107707 12-3
5. Click OK. The Bi-level Password function is now enabled. The computer status bar at the bottom of the screen now reads PW: Enabled. NOTES:
• Enable the computer status bar from the View menu. • You can also check Password Status from the Tools menu: click
Tools>Passwords>Status. • Once you have enabled the Level 2 Password, you should configure the Extended
passwords for the meter. See Section 12.7 for instructions (Nexus® 1252, 1262, 1272, and 1500 devices).
12.4: Disable Bi – level Passwords NOTE: To disable the password function, you must use the Level 2 Password. 1. From the Tools menu select Passwords>Enable/Disable. 2. Enter the Level 2 Password and click OK. You will see the message shown below.
3. Click OK. The Bi-level Password function is now disabled. The status bar at the bottom of your screen now reads: PW: Disabled.

e Electro Industries/GaugeTech Doc # E107707 12-4
12.5: Change Bi-level Passwords 1. If you are going to use Passwords, it
is a good idea to change them from time to time. From the Tools menu select Passwords>Change.
2. Enter the password you want to
change in the Current Password field. You can enter either the Level 1 or Level 2 password.
3. Enter the new password in the New Password field and the Retype New Password field. 4. Click OK. You will see a Confirmation message, like the one pictured below. Click Yes to
change the password; click No to exit without changing the password.
12.6: Logging On and Off With Bi-level Passwords
When Bi-level passwords are enabled, you may Log On using either password level to gain access to protected areas. The two-minute timer described in the Notes section of 12.2 is active. You may use Log Off to end your password session and renew password protection immediately (rather than waiting for the two-minute timer to expire).
To Log On: 1. Select Tools>Passwords>Log On. 2. Enter a Level 1 or 2 Password and click OK.
To Log Off: 1. Select Tools>Passwords>Log Off. You will see the following message.
2. Click OK.

e Electro Industries/GaugeTech Doc # E107707 12-5
12.7: Using the Extended Passwords Feature (Nexus® 1252/62/72, and 1500 Meters) The Extended Passwords feature is not the default setting of your meter. To use this feature, you must first set up the Bi-level Password feature (see Section 12.3). Next, you must enable and configure the Extended Passwords feature (see the following section, 12.7.1.) The Extended Passwords feature allows you to set up to eight access profiles, each controlled by a password. The profiles are used to allow/disallow access to the following functions:
• Read TOU Calendars/Data – allows the user to view the time of Use Calendars and Registers.
• External Device Access – allows the user to access and program external devices. • Modify Preset Energy – allows the user to access the preset energy capability. • Modify CT/PT Compensation – allows the user to change the CT/PT compensation
tables. • Modify Date/Time – allows the user to set a new date and or time. • Modify TOU Calendars – allows the user to modify existing calendars and upload new
calendars. • Update Firmware – allows the user to change the existing firmware in the meter. • Modify Programmable Settings – allows the user to change existing programmable
settings and program them to the meter. • Retrieve PQ Logs – allows the user to retrieve the Power Quality logs: PQ, Waveform,
Alarm, and Flicker. • Retrieve Historical Logs – allows the user to retrieve non-PQ logs: Historical and
Digital. • Reset Demand – allows the user to reset the Demand Registers. • Reset PQ Logs – allows the user to rest the Power Quality logs: PQ, Waveform, Alarm,
and Flicker. • Reset Logs – allows the user to reset the non-PQ logs: Historical and Digital. • Reset Energy – allows the user to reset the Energy Accumulators. • External Relay Control – allows the user to manually fire the External Relays. • Manual Waveform Capture – allows the user to send the Manual Waveform Capture
command. • Other – allows the user to use the Flicker function and any other Level 2 function that is
not defined above.

e Electro Industries/GaugeTech Doc # E107707 12-6
12.7.1: Setting Up the Extended Passwords Feature
NOTE: Only a user signed on with a Level 2 Password will be able to access this function (see sections 12.2 and 12.3).
1. Click Tools>Passwords>Extended Passwords. 2. The top portion of the screen allows you
to Enable or Disable the Extended Password function: select the Enabled or Disabled radio button.
3. Click the arrow in the User Level field to select the password profile you want to set up. You can set up to eight profiles: each profile can have a different selection of features and capabilities.
4. Click any of the features on the right of
the screen to enable them for the profile. • Click Check All to select all of the features. • Click Uncheck All to de-select all of the features. NOTES:
• The Administrator user level is non-configurable. It has all of the features enabled for it. It is the only profile that can set up the other profile levels.
5. Click: • Update to save your changes. • Cancel to exit the screen without saving any changes. • Report to create a .csv file listing the password profiles and their enabled features
(passwords are not printed in the report). You can open the report in Excel.
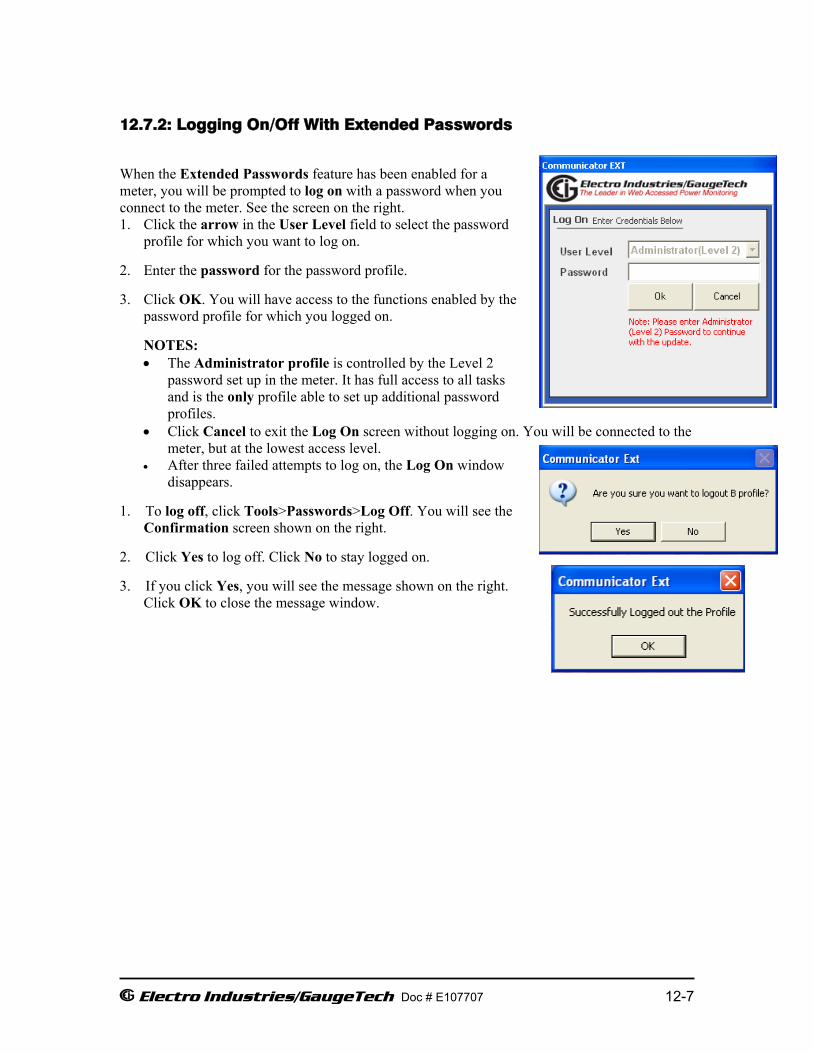
e Electro Industries/GaugeTech Doc # E107707 12-7
12.7.2: Logging On/Off With Extended Passwords When the Extended Passwords feature has been enabled for a meter, you will be prompted to log on with a password when you connect to the meter. See the screen on the right. 1. Click the arrow in the User Level field to select the password
profile for which you want to log on. 2. Enter the password for the password profile. 3. Click OK. You will have access to the functions enabled by the
password profile for which you logged on. NOTES: • The Administrator profile is controlled by the Level 2
password set up in the meter. It has full access to all tasks and is the only profile able to set up additional password profiles.
• Click Cancel to exit the Log On screen without logging on. You will be connected to the meter, but at the lowest access level.
• After three failed attempts to log on, the Log On window disappears.
1. To log off, click Tools>Passwords>Log Off. You will see the
Confirmation screen shown on the right. 2. Click Yes to log off. Click No to stay logged on. 3. If you click Yes, you will see the message shown on the right.
Click OK to close the message window.
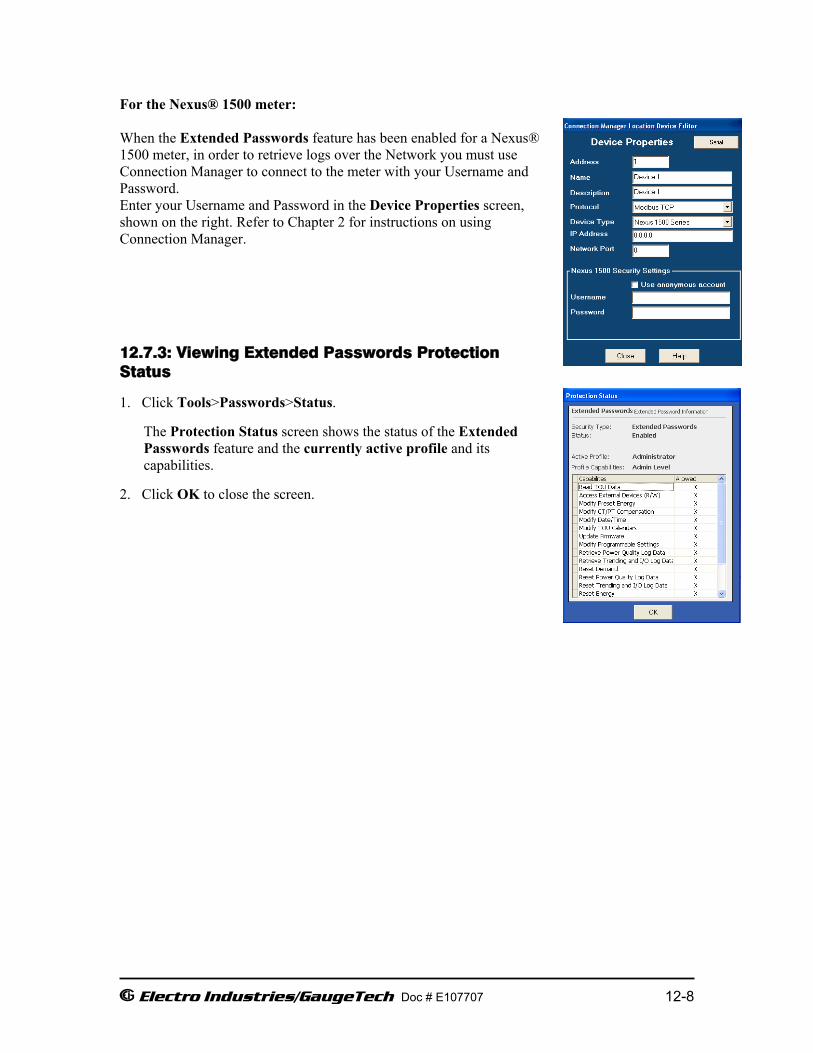
e Electro Industries/GaugeTech Doc # E107707 12-8
For the Nexus® 1500 meter: When the Extended Passwords feature has been enabled for a Nexus® 1500 meter, in order to retrieve logs over the Network you must use Connection Manager to connect to the meter with your Username and Password. Enter your Username and Password in the Device Properties screen, shown on the right. Refer to Chapter 2 for instructions on using Connection Manager. 12.7.3: Viewing Extended Passwords Protection Status
1. Click Tools>Passwords>Status.
The Protection Status screen shows the status of the Extended Passwords feature and the currently active profile and its capabilities.
2. Click OK to close the screen.

12.8: Sealing Switch Overview
The Sealing Switch lets you set additional restriction to functions on the meter. The Sealing Switch is enabled through the Tools menu. Once enabled, the switch must be activated at the meter. You activatethe switch by pressing and holding the button (Nexus® 1250/1252/1500 meter) or by pressing both the Reset Switch and Test Button at the same time (Nexus® 1262/1272 meter) when performing a restricted function.
NOTES: For the Nexus® 1262/1272 meter, you must remove the front cover to access the Test button. Once you have pressed the two buttons for a few seconds, a message appears on the display telling you that the Sealing Switch is enabled. You have 30 minutes to implement changes. If you want to set the Sealing Switch before the 30 minutes is up, press the two buttons again.
For the Nexus® 1500 meter, you must open the revenue lock on the bottom of the meter, and then press the Sealing Switch located behind the revenue lock door.
12.9: Enable Sealing Switch
1. From the Tools Menu, select Sealing Switch> Enable/Disable.
2. You will see the Sealing Switch Confirmation screen.
NOTE: The question this screen asks depends on the current status of the Sealing Switch. If theSwitch is already enabled, you will be asked to confirm disabling the switch.
3. Click Yes to enable the Sealing Switch.
4. The Protection Status screen appears, showing Password and Sealing Switch status. Click OK.
e Electro Industries/GaugeTech Doc # E107707 12-9
ResetSwitch
TestButton
Nexus®1262/1272 MeterWithout Cover
RevenueLock
Location
Nexus®1500 Meter

12.10: Disable Sealing Switch
1. From the Tools Menu, select Sealing Switch>Enable/Disable.
2. You will see the Sealing Switch Confirmation screen.
NOTE: The question this screen asks depends on the current status of the Sealing Switch. If theSwitch is already disabled, you will be asked to confirm enabling the switch.
3. Click Yes to Disable the Sealing Switch.
4. The Protection Status screen appears, showing Password and Sealing Switch status. Click OK.
e Electro Industries/GaugeTech Doc #E107707 12-10

12.11: View Sealing Switch Status
1. From the Tools Menu, select Sealing Switch>Status.
2. You will see the Protection Status screen (shown below), tellingyou if Password and Sealing Switch are enabled or disabled.
3. Click OK to close the Protection Status screen.
e Electro Industries/GaugeTech Doc #E107707 12-11

E Electro Industries/GaugeTech Doc#E107707 12-12
This page intentionally left blank.

Chapter 13Flash Upgrading Nexus® and Shark® Meters
13.1: Flash Overview
The Flash command allows you to upgrade the following firmware components:
• Nexus® Communication Processor (“Nexus® Comm”): This processing chip performs all tasksrelated to communication and storing data.
• Nexus® Digital Signal Processor (“Nexus® DSP’): This processing chip performs all tasks related to data calculation.
• LED Display: This processing chip is installed in the Nexus® External LED Display.
• Internal Modem Card: This optional card is installed in the Nexus® meter and enables it to actas meter and modem in one device. This card must be upgraded in addition to upgrading theNexus® Comm and DSP. (Refer to Section 13.5.)
• Internal Network Option: This option allows a Nexus® meter to communicate with multiplePC’s concurrently. This card must be upgraded in addition to upgrading the Nexus® Comm andDSP. (Refer to Section 13.6.)
• Network Option card: This option gives a Nexus® or Shark® 200 meter 100BaseT Ethernetcapability.
There are 3 ways to learn what firmware versions are currently installed in your meter:
• Click the Device Status icon (or select Tools>Retrieve Device Status). The “Run-time” fieldshows the current Comm firmware version number; the “DSP Run-time” field shows the currentDSP firmware version number.
• Click the Profile icon to retrieve the current Device Profile from the connected meter. ClickReport. The Comm and DSP firmware are listed in the Runtime column.
• If you have a Nexus® External Display connected to the meter, see the Installation andOperation Manual for your meter for details on using it to access firmware version numbers.
To flash upgrade, you must have the most recent upgrade file from Electro Industries.
Flash upgrading erases the existing firmware and replaces it with the new version.
WARNINGS!• Flash Upgrading should only be done with the pr oper firmware. Otherwise, data may be
lost. • Backup your stored data prior to installing new flash programming into your unit.
e Electro Industries/GaugeTech Doc # E107707 13-1
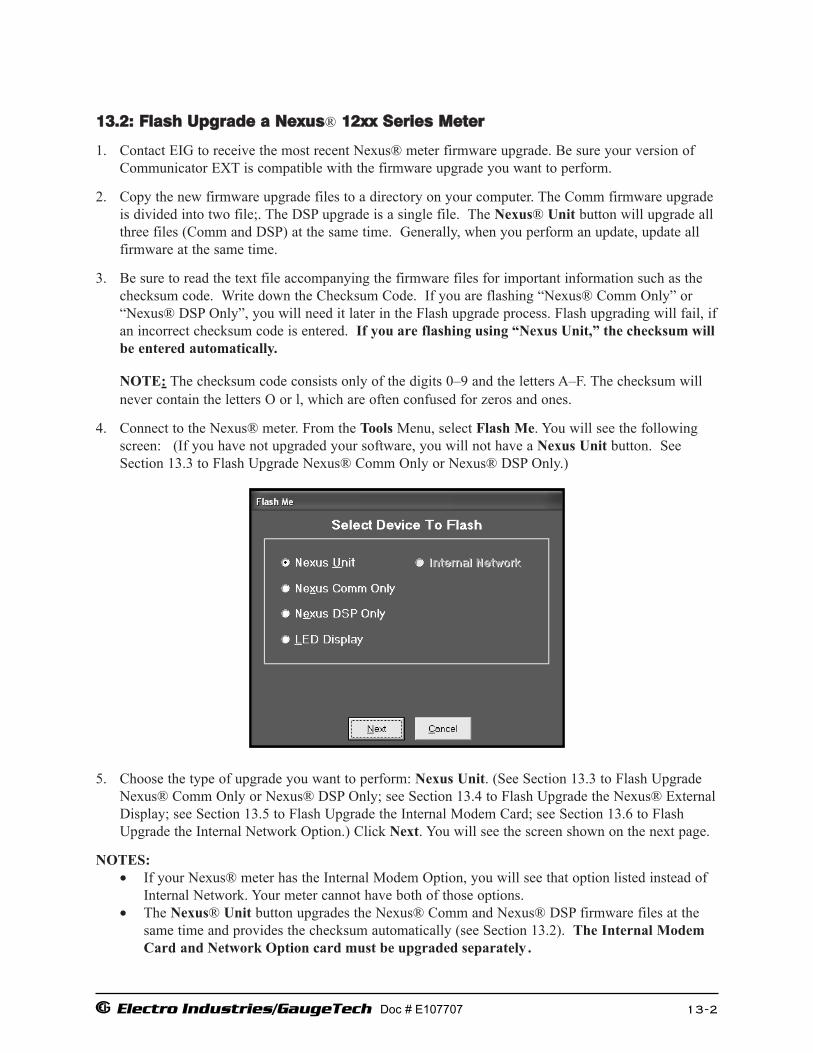
13.2: Flash Upgrade a Nexus® 12xx Series Meter
1. Contact EIG to receive the most recent Nexus® meter firmware upgrade. Be sure your version ofCommunicator EXT is compatible with the firmware upgrade you want to perform.
2. Copy the new firmware upgrade files to a directory on your computer. The Comm firmware upgradeis divided into two file;. The DSP upgrade is a single file. The Nexus® Unit button will upgrade allthree files (Comm and DSP) at the same time. Generally, when you perform an update, update allfirmware at the same time.
3. Be sure to read the text file accompanying the firmware files for important information such as thechecksum code. Write down the Checksum Code. If you are flashing “Nexus® Comm Only” or“Nexus® DSP Only”, you will need it later in the Flash upgrade process. Flash upgrading will fail, ifan incorrect checksum code is entered. If you are flashing using “Nexus Unit,” the checksum willbe entered automatically.
NOTE: The checksum code consists only of the digits 0–9 and the letters A–F. The checksum willnever contain the letters O or l, which are often confused for zeros and ones.
4. Connect to the Nexus® meter. From the Tools Menu, select Flash Me. You will see the followingscreen: (If you have not upgraded your software, you will not have a Nexus Unit button. SeeSection 13.3 to Flash Upgrade Nexus® Comm Only or Nexus® DSP Only.)
5. Choose the type of upgrade you want to perform: Nexus Unit. (See Section 13.3 to Flash UpgradeNexus® Comm Only or Nexus® DSP Only; see Section 13.4 to Flash Upgrade the Nexus® ExternalDisplay; see Section 13.5 to Flash Upgrade the Internal Modem Card; see Section 13.6 to FlashUpgrade the Internal Network Option.) Click Next. You will see the screen shown on the next page.
NOTES:• If your Nexus® meter has the Internal Modem Option, you will see that option listed instead of
Internal Network. Your meter cannot have both of those options.• The Nexus® Unit button upgrades the Nexus® Comm and Nexus® DSP firmware files at the
same time and provides the checksum automatically (see Section 13.2). The Internal Modem Card and Network Option card must be upgraded separately .
e Electro Industries/GaugeTech Doc # E107707 13-2
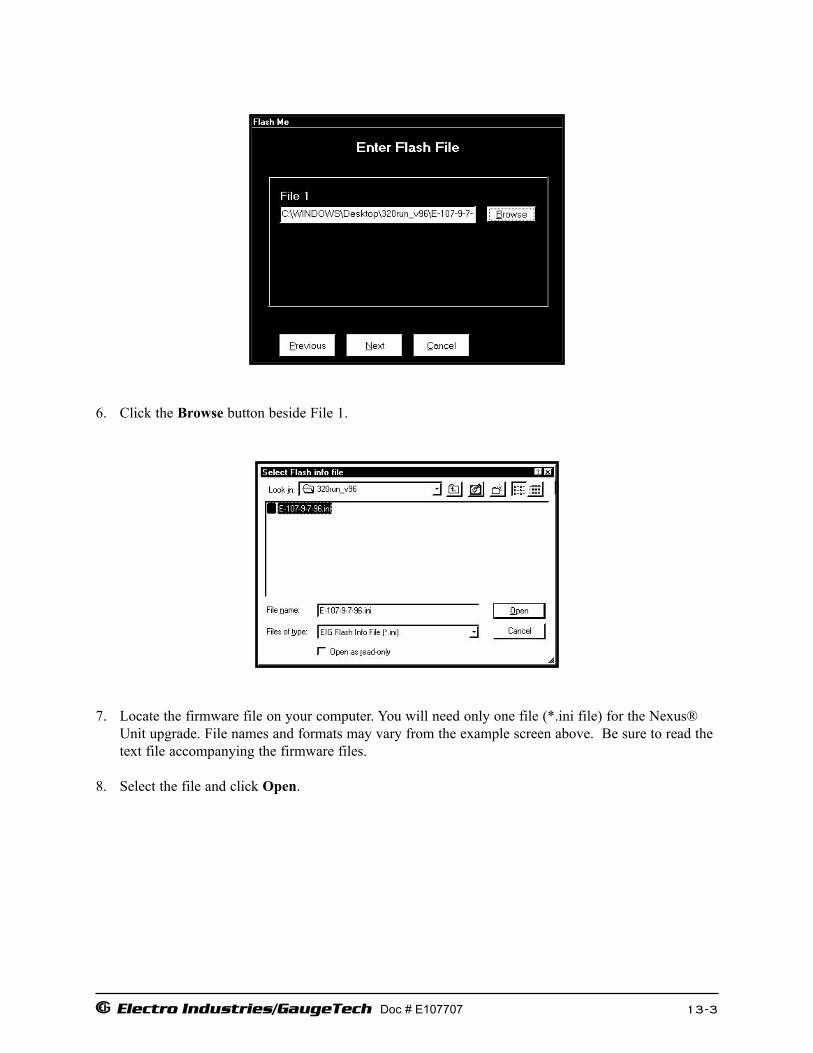
6. Click the Browse button beside File 1.
7. Locate the firmware file on your computer. You will need only one file (*.ini file) for the Nexus®Unit upgrade. File names and formats may vary from the example screen above. Be sure to read thetext file accompanying the firmware files.
8. Select the file and click Open.
e Electro Industries/GaugeTech Doc # E107707 13-3

9. When the files have been entered, click Next. The following screen appears only if you are not connected to a meter. Skip to step 11 if you do not see this screen.
10. To connect to the meter you want to upgrade:
• Enter the Address of the Nexus® meter you want to Flash upgrade.
• Enter the Baud Rate of the Nexus® meter port your computer is connected to.
• In the Serial Port field enter the COM port of the computer you are using.
• Click Next.
NOTE: If you want to Flash upgrade using a modem, make the modem connection first; then,enter the Flash sequence mode.
e Electro Industries/GaugeTech Doc # E107707 13-4

11. Click Start to begin the upgrade. A final warning screen appears; click Yes.
12. Flash upgrading begins. The following screen displays the progress of the upgrade:
13. When the Flash upgrade is complete, the Cancel button changes to OK. Click OK.
NOTE: To upgrade additional Nexus® meters, click Previous and return to the CommunicationsParameters screen. Repeat the steps as needed, entering a unique address for each meter you areupgrading.
e Electro Industries/GaugeTech Doc # E107707 13-5

13.3: Flash Upgrade the Nexus® Comm and Nexus® DSP Firmware
1. Contact EIG to receive the most recent Nexus® firmware upgrade file. Be sure your version ofCommunicator EXT software is compatible with the firmware upgrade you want to perform.
2. Copy the new firmware upgrade files to a directory on your computer. The Nexus® Comm upgradeis divided into two files. The DSP upgrade is a single file. (The Nexus Unit button will upgrade allthree files at the same time. Generally, when you perform an upgrade, it is best to upgrade allfirmware at the same time. See Section 13.2 for instructions.)
3. Be sure to read the text file accompanying the firmware files for important information such as thechecksum code. Write down the Checksum Code. If you ar e flashing “Nexus Comm Only” or“Nexus DSP Only”, you will need it later in the Flash upgrade process. Flash upgrading willfail if an incorrect checksum code is entered.
NOTE: The checksum code consists only of the digits 0–9 and the letters A–F. The checksum willnever contain the letters O or l, which are often confused for zeros and ones.
4. Connect to the Nexus® meter. From the Tools Menu, select Flash Me. You will see the followingscreen. (If you have not upgraded your software, you will not have a Nexus® Unit button).
5. Choose the type of upgrade you want to perform: Nexus® Comm or Nexus® DSP. (See Section13.2 for instructions on using the Nexus® Unit button; see Section 13.4 to Flash Upgrade theNexus® External Display; see Section 13.5 to Flash Upgrade the Internal Modem Card; see Section13.6 to Flash Upgrade the Internal Network Option.) Click Next. You will see the screen shown onthe next page.
e Electro Industries/GaugeTech Doc # E107707 13-6

6. Click the Browse button beside File 1.
7. Locate the firmware files on your computer. File names and formats may vary from the examplescreen above; be sure to read the text file accompanying the firmware files.
8. Select the file and click Open. If you are upgrading:
• Nexus® Comm firmware, repeat the process for File 2.
• Nexus® DSP firmware requires only one file.
The example screen on the next page shows two files entered for a Nexus® Comm upgrade.
e Electro Industries/GaugeTech Doc # E107707 13-7

9. When the files have been entered, click Next. The following screen appears only if you are not connected to a meter. Skip to step 11 if you do not see this screen.
10. To connect to the meter you want to upgrade:
• Enter the Address of the Nexus® meter you want to Flash upgrade.
• Enter the Baud Rate of the Nexus® meter port your computer is connected to.
• In the Serial Port field enter the COM port of the computer you are using.
• Click Next.
e Electro Industries/GaugeTech Doc # E107707 13-8

11. Click Start to begin the upgrade. A final warning screen appears; click Yes. This screen appears:
12. Enter the checksum code from the text file accompanying the firmware files. If you do not enterthe correct checksum code, the flash upgrade will fail.
13. Click OK. Flash upgrading begins. The following screen displays the progress of the upgrade:
14. When the Flash upgrade is complete, the Cancel button changes to OK. Click OK.
NOTE: To upgrade additional Nexus® meters, click Previous and return to the CommunicationsParameters screen. Repeat the steps as needed, entering a unique address for each unit.
e Electro Industries/GaugeTech Doc # E107707 13-9

13.4: Flash Upgrade the Nexus® External Display
Flash upgrading the Nexus® External Display takes approximately 15 minutes.
1. Contact EIG to receive the most recent Nexus® External Display firmware upgrade. Be sure your version of Communicator EXT software is compatible with the firmware upgrade you want to perform.
2. Copy the new firmware upgrade file to a directory on your computer. Be sure to read the accompanying text file for important information, such as the checksum code. Write down theChecksum Code; you will need it later in the Flash upgrade process. Flash upgrading will fail,if an incorrect checksum code is entered.
NOTE: The checksum code consists only of the digits 0–9 and the letters A–F. The checksum willnever contain the letters O or l, which are often confused for zeros and ones.
3. Make sure the External Display is connected to a Nexus® meter port operating at 9600 baud. SeeChapters 3 and 4 for details on configuring the Nexus® meter’s communication ports.
4. Connect to the Nexus® meter. From the Tools Menu, select Flash Me. You will see the screenshown below.
5. Click the LED Display button.
6. Click Next. You will see the screen shown on the next page.
e Electro Industries/GaugeTech Doc # E107707 13-10
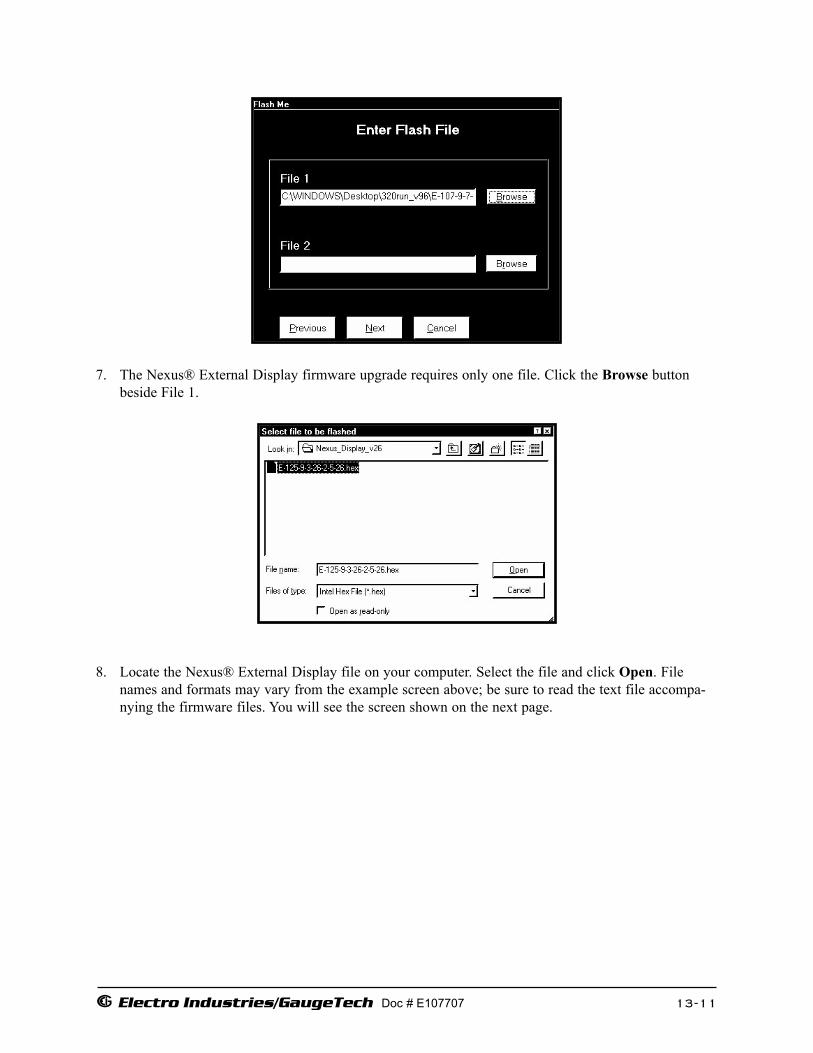
7. The Nexus® External Display firmware upgrade requires only one file. Click the Browse buttonbeside File 1.
8. Locate the Nexus® External Display file on your computer. Select the file and click Open. Filenames and formats may vary from the example screen above; be sure to read the text file accompa-nying the firmware files. You will see the screen shown on the next page.
e Electro Industries/GaugeTech Doc # E107707 13-11

9. When the files have been entered, click Next. The following screen appears only if you are not connected to a meter. Skip to step 11 if you do not see this screen.
10. To connect to the meter you want to upgrade:
• Enter the Address of the Nexus® meter whose Display you want to Flash upgrade.
• Enter the Baud Rate of the Nexus® meter port your computer is connected to.
• In the Serial Port field enter the COM port of the computer you are using.
• Click Next.
e Electro Industries/GaugeTech Doc # E107707 13-12

11. Click Start to begin the upgrade process. A final warning screen appears; click Yes. The followingscreen appears:
11. From the pull-down menus, select Through Nexus® (meter) and the port to which the ExternalDisplay is connected. Click OK. In a moment the following screen appears:
12. Enter the checksum code from the text file accompanying the firmware upgrade file. If you do notenter the correct checksum code, the flash upgrade will fail. Click OK. Flash upgrading begins.The following screen displays the progress of the upgrade:
e Electro Industries/GaugeTech Doc # E107707 13-13

13. When the Flash upgrade is complete, the Cancel button changes to OK. Click OK.
NOTE: To upgrade additional Nexus® External Displays, click Previous and return to the Communications Parameters screen. Repeat the steps as needed, entering a unique address for each unit.
e Electro Industries/GaugeTech Doc # E107707 13-14

13.5: Flash Upgrade the Internal Modem Card
1. Contact EIG to receive the most recent Internal Modem Option Flash firmware upgrade. This FlashUpgrade affects only the Internal Modem Card within the Nexus® meter. This Flash Upgrade doesnot upgrade the Nexus® meter. To upgrade the Nexus® meter, refer to Sections 13.2 and 13.3; toupgrade the External Display for the meter. refer to Section 13.4.
2. Copy the new firmware upgrade file to a directory on your computer. The Internal Modem firmwareupgrade is a single file.
3. Be sure to read the text file accompanying the firmware files for important information such as thechecksum code. Write down the Checksum Code. You will need to verify it later in the FlashUpgrade process.
NOTE:The checksum code consists only of the digits 0–9 and the letters A–F. The checksum willnever contain the letters O or l, which are often confused for zeros and ones.
4. Connect to the Nexus® meter. From the Tools Menu, select Flash Me. You will see the screenshown below.
Select Internal Modem and click Next.
5. If the Password Feature is Enabled, you will see the following screen.
. Enter your Level 2 Password and click OK. You will see the screen shown on the next page.
e Electro Industries/GaugeTech Doc # E107707 13-15

6. Click Enter Command Mode. In the Status fields, the words “Entering Command Mode” and “Sending Escape Sequence” will appear. Then, “In Command Mode” appears on the screen.
7. Click Program Flash. The following screen appears:
NOTE: In this example screen, the hex file is in a file on the desktop. The hex file may be stored any-where in your system, on disk or CD. This screen browses your system to find the file.
e Electro Industries/GaugeTech Doc # E107707 13-16

Locate the firmware file on your computer. You will need only one file (*.hex file) for the Internal Modem Upgrade. File names and formats may vary from the example screen above. Be sure to read the text accompanying the firmware files.
Select the file name and click Open.
The program automatically uploads the data. Lines 1 and 2 of the Status fields display the progressof the upgrade. When the Flash Upgrade is complete, the Status field will say “Flash has beenProgrammed” and the Checksum verification window appears, as shown below.
8. Click Yes. If you click No, the Flash will fail.
9. Click Exit to exit the program and return to the main Communicator EXT screen.
e Electro Industries/GaugeTech Doc # E107707 13-17
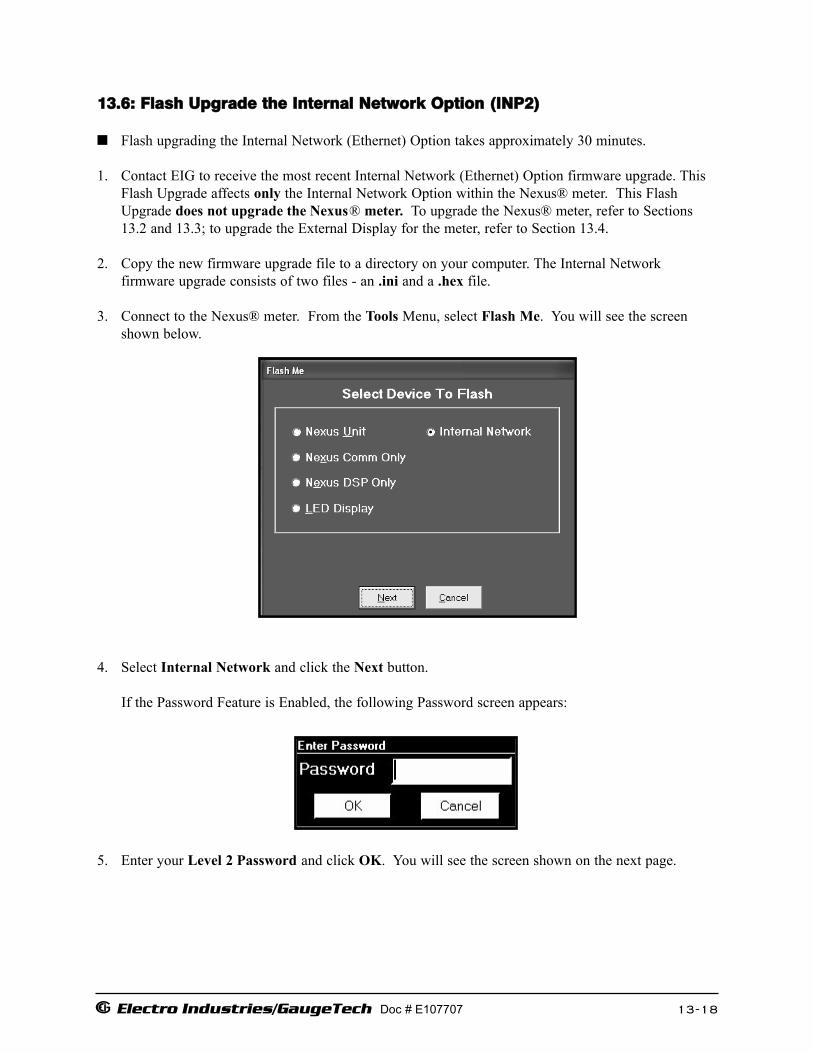
e Electro Industries/GaugeTech Doc # E107707 13-18
13.6: Flash Upgrade the Internal Network Option (INP2)
Flash upgrading the Internal Network (Ethernet) Option takes approximately 30 minutes.
1. Contact EIG to receive the most recent Internal Network (Ethernet) Option firmware upgrade. ThisFlash Upgrade affects only the Internal Network Option within the Nexus® meter. This FlashUpgrade does not upgrade the Nexus® meter. To upgrade the Nexus® meter, refer to Sections13.2 and 13.3; to upgrade the External Display for the meter, refer to Section 13.4.
2. Copy the new firmware upgrade file to a directory on your computer. The Internal Networkfirmware upgrade consists of two files - an .ini and a .hex file.
3. Connect to the Nexus® meter. From the Tools Menu, select Flash Me. You will see the screenshown below.
4. Select Internal Network and click the Next button.
If the Password Feature is Enabled, the following Password screen appears:
5. Enter your Level 2 Password and click OK. You will see the screen shown on the next page.

e Electro Industries/GaugeTech Doc # E107707 13-19
6. Click Enter Command Mode. After a moment “In Command Mode” appears on the screen.
7. Click Program Flash. The following screen appears:
NOTE: In this example, the *.ini file is in a file on the desktop. The *.ini file may be stored in yoursystem, on disk or on CD. Use the “Look In:” window at the top of the screen to browse your system.
Locate the firmware file on your computer. You will need two files (*.ini and .hex files) for the Internal Network Upgrade. Both files must be in the same dir ectory. File names and formats may vary from the example screen above. Be sure to read the text accompanying the firmware files.
7. Select the file name and click Open. A warning screen will appear.
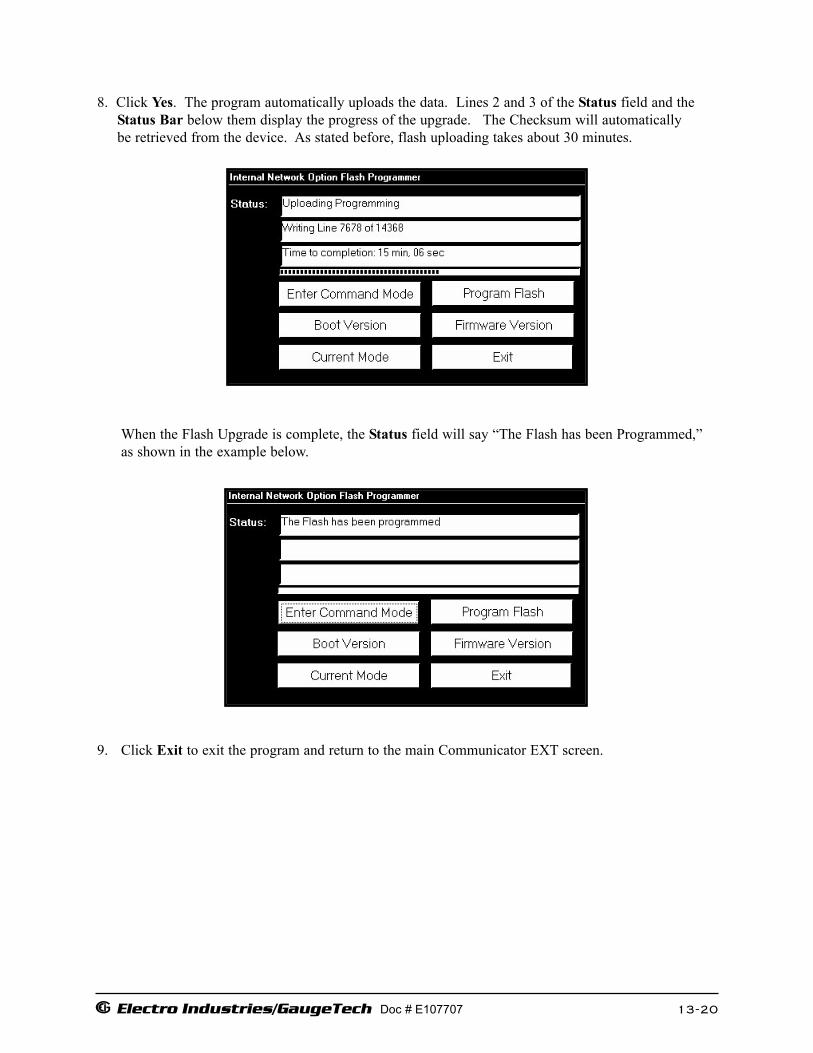
e Electro Industries/GaugeTech Doc # E107707 13-20
8. Click Yes. The program automatically uploads the data. Lines 2 and 3 of the Status field and the Status Bar below them display the progress of the upgrade. The Checksum will automatically be retrieved from the device. As stated before, flash uploading takes about 30 minutes.
When the Flash Upgrade is complete, the Status field will say “The Flash has been Programmed,”as shown in the example below.
9. Click Exit to exit the program and return to the main Communicator EXT screen.

E Electro Industries/GaugeTech DOC # E107707 13-21
13.7: Flash Upgrade the Network Option Card Follow this procedure to upgrade the 100BaseT Ethernet Network Card’s firmware in runtime. 1. Click Tools>Flash Network Card. You will
see the screen shown on the right. 2. Follow this procedure:
a. Enter the upgrade filename or click Select to browse for it.
b. Enter Network Card Username and Password; e.g. “eignet” and “inp200.”
c. Press Start. 3. Check the firmware version by clicking Get Firmware Info. 4. Once you have confirmed that the firmware version is correct, click Reset Device. 5. Click Close to return to the Communicator EXT Main screen. 13.8: Flash Upgrade a Shark® Meter NOTE: The examples in this section show the Shark®
200 meter, but the upgrade process is the same for the Shark® 100 meter.
1. Click Tools>Flash Me. You will see the screen shown
on the right. 2. Click Next. You will see the screen shown on the next
page.
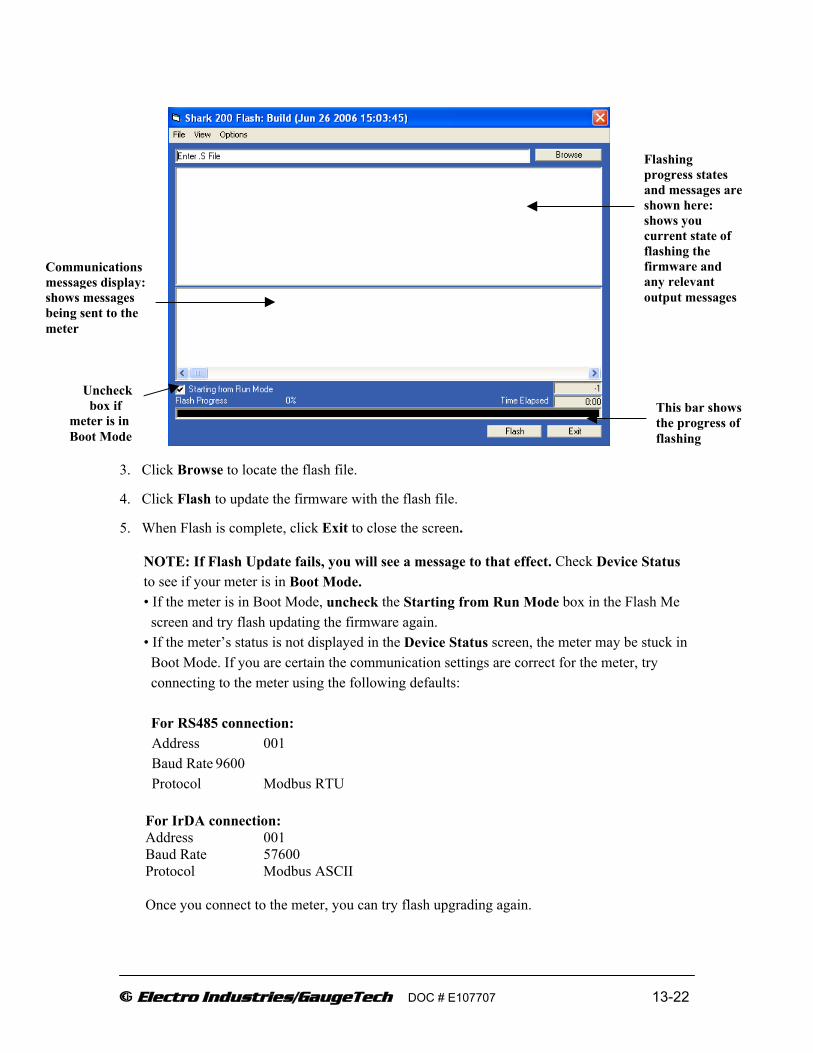
E Electro Industries/GaugeTech DOC # E107707 13-22
3. Click Browse to locate the flash file. 4. Click Flash to update the firmware with the flash file. 5. When Flash is complete, click Exit to close the screen.
NOTE: If Flash Update fails, you will see a message to that effect. Check Device Status to see if your meter is in Boot Mode. • If the meter is in Boot Mode, uncheck the Starting from Run Mode box in the Flash Me screen and try flash updating the firmware again. • If the meter’s status is not displayed in the Device Status screen, the meter may be stuck in Boot Mode. If you are certain the communication settings are correct for the meter, try connecting to the meter using the following defaults: For RS485 connection:
Address 001 Baud Rate 9600 Protocol Modbus RTU
For IrDA connection: Address 001 Baud Rate 57600 Protocol Modbus ASCII Once you connect to the meter, you can try flash upgrading again.
This bar shows the progress of flashing
Uncheck box if meter is in Boot Mode
Flashing progress states and messages are shown here: shows you current state of flashing the firmware and any relevant output messages
Communications messages display: shows messages being sent to the meter
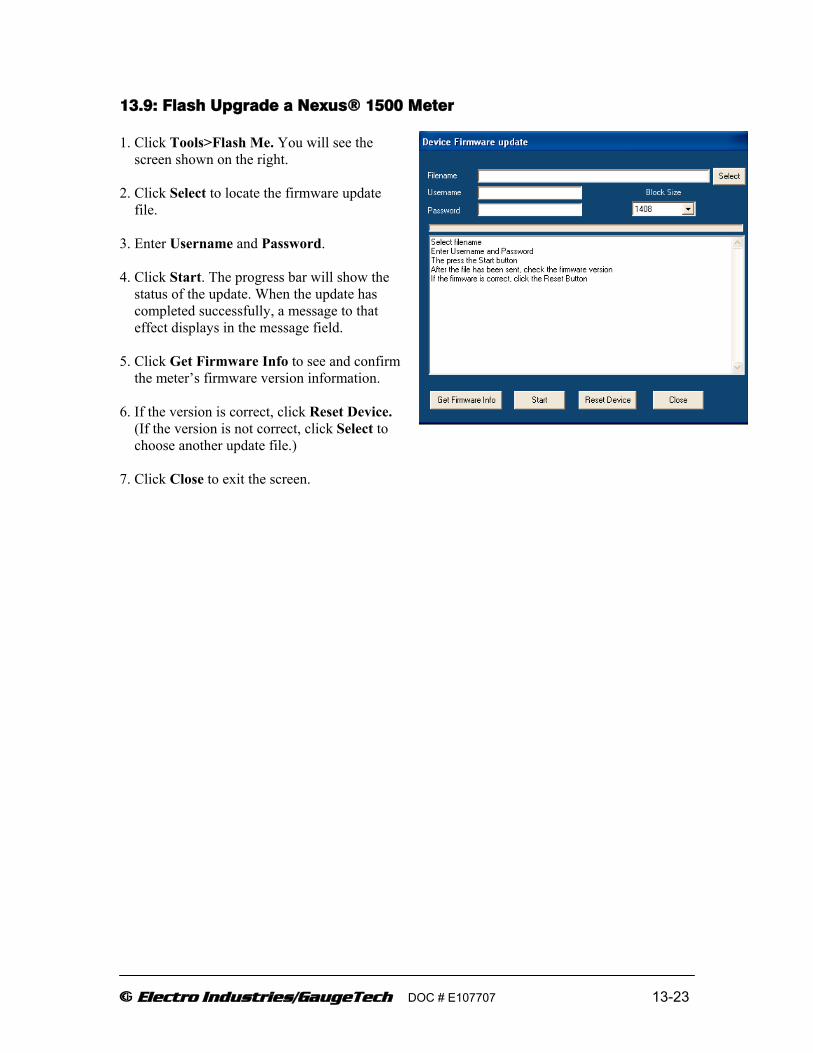
E Electro Industries/GaugeTech DOC # E107707 13-23
13.9: Flash Upgrade a Nexus® 1500 Meter 1. Click Tools>Flash Me. You will see the screen shown on the right. 2. Click Select to locate the firmware update file. 3. Enter Username and Password. 4. Click Start. The progress bar will show the status of the update. When the update has completed successfully, a message to that effect displays in the message field. 5. Click Get Firmware Info to see and confirm the meter’s firmware version information. 6. If the version is correct, click Reset Device. (If the version is not correct, click Select to choose another update file.) 7. Click Close to exit the screen.

E Electro Industries/GaugeTech Doc#E107707 13-24
This page intentionally left blank.

e Electro Industries/GaugeTech Doc # E107707 14-1
Chapter 14Energy Billing Module
14.1: Overview
Managing Your Load Profile:
Your monthly electric bill is comprised of your total energy usage (kWh) plus your maximum demand (kW) during the billing period. Maximum demand, a.k.a. peak demand, can represent 30% to 60% of your total energy cost. Managing your load profile is the key to reducing your costs;reducing your peak demand without changing your total usage lowers your costs.
The optimal load profile would be flat, with minimum demand at constant usage. But, a flat load profile is not possible in industrial and commercial environments because of the variation and number of loads in the system. However, there are steps you can take to control those variations and ultimately reduce costs. The steps are listed below:
•• Collect historical and real time energy data.•• Use graphical tools to calculate and analyze the data.•• Control loads and shift demands.•• Calculate savings and results.
The Energy Billing Module detailed in this chapter gives you a tool to use with the Nexus® 1250/ 1252, 1260/70, 1270/72, and 1500 meters to collect data and analyze it. With a few clicks, you can collect historical and real time power usage data so that you can make changes necessary to reduce costs.
Fig. 14.1: Example Screen for the Energy Billing Module

e Electro Industries/GaugeTech Doc # E107707 14-2
The Energy Billing Module Graph Screen, as shown in the example screen above, displays a Demand Graph, a Graph Profile by Day and a Graph of kWh Usage by Day for the Date Range selected.
14.2: Basic Energy Management
To understand how to manage your power usage, you must understand billing determinants and theterminology of energy management. Below are Basic Energy Terms followed by an EnergyManagement Example.
Basic Energy TermsKilowatt hour (kWh) Measurement for energy equal to the amount of work
done by 1,000 watts for one hour.
Kilovolt-ampere-reactive hour (kVARh) Measurement similar to kWh that reflects current drawnby a customer that produces no useful work, but takes up space on the electrical distribution system.
Megawatt-hour (MWh) 1,000 kWh.
Energy (Active and Reactive) The total consumption that is measured in Kilowatt hours (kWh) and Kilovolt-ampere-reactive hours (kVARh).
Interval Type An interval is composed of N subintervals (1<=N<=10).The data collected in the previous N subintervals is used in the demand calculation.
Demand Rate at which electric energy is delivered to a system, usually expressed in kW or MW. There are two methods for calculating demand: (1) Block window and (2) Rolling (or sliding) window.
Load Factor An indicator of the quality of the load profile (0 to 1) for a certain period in the electrical system.
Block Demand Demand calculations performed over a fixed period (interval) of time. When that time period lapses, the next interval starts where the previous interval ended.
Rolling (Sliding) Demand Window Demand calculations performed over a fixed period (interval) of time that is made up of (n) subintervals (n=>2). When one subinterval elapses, the demand value is computed by adding the most recently completed subinterval data to the demand interval and subtracting the oldest subinterval data from the demand interval.

e Electro Industries/GaugeTech Doc # E107707 14-3
Thermal Demand Emulation of a Thermal Demand Meter that provides anexponentially time-lagged demand where, given a constant load, the indication reads 90% of the actual demand in 15 minutes.
Power Factor An indicator of the quality of the power (-1 to +1) at a certain point in the electrical system.
Time of Day or Time of Use Rates vary at different times of the day (on-peak and off-peak) for Energy and Demand.
Off-Peak Designated periods of low system demand (usually non-business hours) when electricity is generally less expensive.
On-Peak Designated periods of high system demand when electricity is generally more expensive.
Shoulder Designated periods between off-peak and on-peak.
Real Time Pricing The instantaneous pricing of electricity based on the cost of the electricity available for use at the time the electricity is demanded by the customer. Rates are downloaded over the phone or Internet. This is a customized plan.
Aggregation The combined total energy use of customers/ units/ costcenters for billing purposes.
Energy Management ExampleA light manufacturer operates on two shifts. The typical electricity cost is about $150,000 per year.Before the installation of any energy management equipment and software, the facility was paying,in a typical summer month, $12,000 for electricity.
56,000 kWh (Off-Peak) $2,400120,000 kWh (On-Peak) $5,500480 kW (Peak Demand) $4,100Total Bill $12,000

e Electro Industries/GaugeTech Doc # E107707 14-4
Figure 14.2: Energy Management Example - Before
With the Energy Billing Module, plant management is able to optimize the loads. Essential loadsare monitored and turned on or off in sequence. Simple steps are taken without jeopardizing the integrity of the manufacturing process. Savings in energy costs = 4% (see Figure 2).
56,000 kWh (Off-Peak) $2,400120,000 kWh (On-Peak) $5,500480 kW (Peak Demand) $3,600Total Bill $11,500
Figure 14.3: Energy Management Example - After
Further savings can be realized by doing the following:
•• Shift non-essential loads to off-peak hours.•• Flatten the demand curve wherever possible.•• Identify equipment and process problems.•• Negotiate with your utility based on peak demand.•• Source the best utility for your needs.
e Electro Industries/GaugeTech Doc # E107707 14-5
14.3: Cost Allocation
In addition to the cost savings steps listed above, further steps can be taken using Cost Allocation.By submetering , one of your primary fixed costs, electricity, becomes a variable cost that can beaccurately allocated.
Cost Allocation Steps:
•• Determine cost centers.•• Use submeters to monitor usage at each cost center.•• Assign accountability and offer incentives for departments within a facility to reduce
their own energy usage.•• Determine equipment and system efficiency within cost centers.•• Make sure Tenant Billing accurately reflects usage.
Cost Allocation System:
•• One computer at primary facility.•• A number of low cost, high quality meters to monitor usage at each cost center.•• A simple network connecting the meters to the computer. •• Energy Billing Module.
14.4: System Configuration
The basic Energy Billing Module System (EBM) consists of the following components:
HardwareA dedicated Energy Billing Module PC or LaptopA Unicom RS-232/485 ConverterAt least one Energy Billing Module meter
SoftwareCommunicator EXT Software (meter programming and communication)Energy Billing Module with MS-Excel Macros
NOTES: •• MS Excel (‘97 or later) must be installed on the computer. •• Make sure the latest MS Office Service Pack for your version of MS Office is installed before
using the EBM application.
Setup Requirements for Nexus® meter1. Communicator EXT Software2. EIG Log Converter Software3. EIG_EBM.EBM-DB (template database file)4. Nexus® meter Log 2, logging interval greater than 0 seconds, less than and equal to 900 seconds
and will have an integer number of records during a 15 minute period.
Example: If Log 2 interval is set at x and 900 modulo with interval x is at 0, then setting is OK.5. Nexus® Meter Log 2, Log Block Window Avg Watt (Modbus Register 0A35-0A36).6. Nexus® Meter Block Window Avg interval set at 15 minutes.7. EIG’s EBM Excel worksheet.
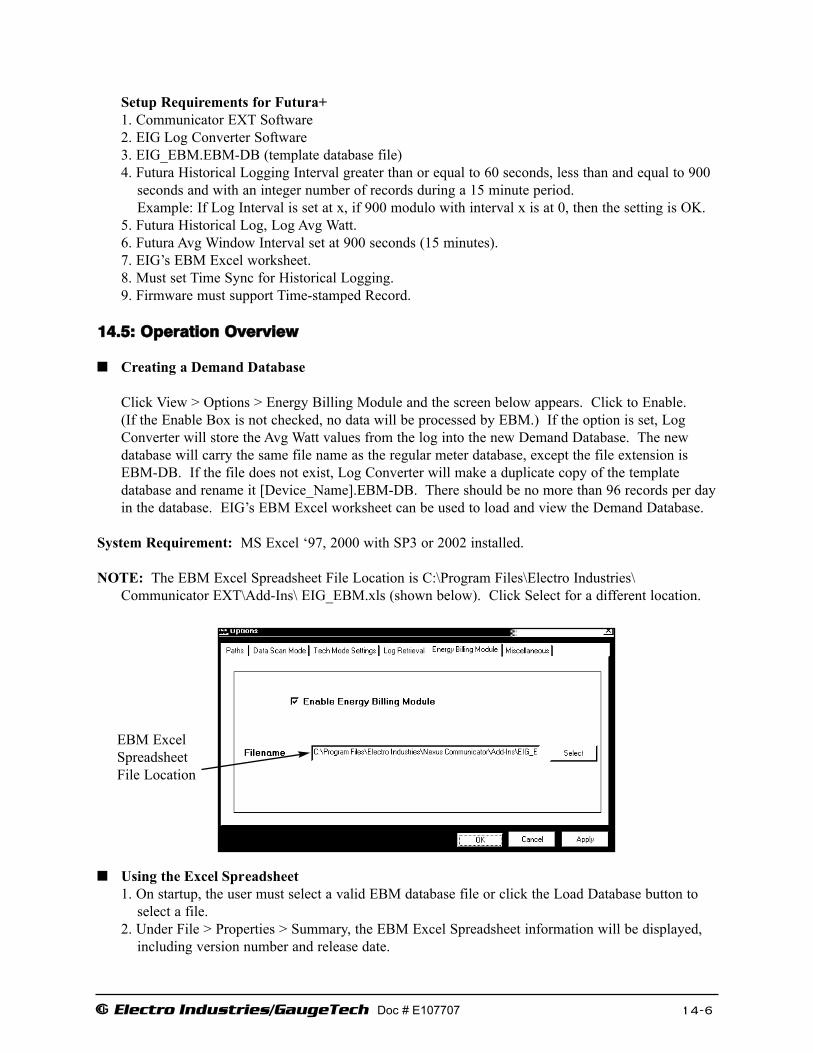
e Electro Industries/GaugeTech Doc # E107707 14-6
Setup Requirements for Futura+1. Communicator EXT Software2. EIG Log Converter Software3. EIG_EBM.EBM-DB (template database file)4. Futura Historical Logging Interval greater than or equal to 60 seconds, less than and equal to 900
seconds and with an integer number of records during a 15 minute period.Example: If Log Interval is set at x, if 900 modulo with interval x is at 0, then the setting is OK.
5. Futura Historical Log, Log Avg Watt.6. Futura Avg Window Interval set at 900 seconds (15 minutes).7. EIG’s EBM Excel worksheet.8. Must set Time Sync for Historical Logging.9. Firmware must support Time-stamped Record.
14.5: Operation Overview
Creating a Demand Database
Click View > Options > Energy Billing Module and the screen below appears. Click to Enable. (If the Enable Box is not checked, no data will be processed by EBM.) If the option is set, LogConverter will store the Avg Watt values from the log into the new Demand Database. The newdatabase will carry the same file name as the regular meter database, except the file extension isEBM-DB. If the file does not exist, Log Converter will make a duplicate copy of the template database and rename it [Device_Name].EBM-DB. There should be no more than 96 records per dayin the database. EIG’s EBM Excel worksheet can be used to load and view the Demand Database.
System Requirement: MS Excel ‘97, 2000 with SP3 or 2002 installed.
NOTE: The EBM Excel Spreadsheet File Location is C:\Program Files\Electro Industries\Communicator EXT\Add-Ins\ EIG_EBM.xls (shown below). Click Select for a different location.
Using the Excel Spreadsheet1. On startup, the user must select a valid EBM database file or click the Load Database button to
select a file.2. Under File > Properties > Summary, the EBM Excel Spreadsheet information will be displayed,
including version number and release date.
EBM ExcelSpreadsheetFile Location

e Electro Industries/GaugeTech Doc # E107707 14-7
14.6: Hardware and Software Installation and Setup
Hardware Installation:
The typical Hardware Installation for the Energy Billing Module System is an RS-485 loop.However, the network that connects the hardware can be simple or complicated. See SetupRequirements in Section 14.4.
Software Installation:
The software required for the system, Communicator EXT, enables the user to program the meterand to communicate to the computer. Communicator EXT software is installed in the meter at thefactory. The Energy Billing Module is also installed at the factory. The user may only be requiredto update the software at some time in the future, when new features are added to the software. Theinitial installation is done for you.
Note: MS Excel ‘97, 2000 with SP3, 2002, 2003, 2010 Software must be installed on your computer for theEnergy Billing Module to work.
14.7: Using the Energy Billing Module
The Energy Billing Module software is an MS-Excel based graphical user interface for viewing,tracking, comparing and analyzing real time electrical energy data. It is a productivity tool that provides the energy information you need so you can monitor and control your loads to reduce overall energy cost.
The Energy Billing Module is a Visual Basic macro that runs inside MS Excel. The module containsthree worksheets:
•• Demand GraphsGraphical presentations of demand and energy usage information.
•• Demand StatisticsStatistical data and analysis on demand and energy.
•• Bill VerificationCalculate and verify your electrical utility cost based on a utility rate structure.

e Electro Industries/GaugeTech Doc # E107707 14-8
Start Up
First, make sure that your meter is connected to the PC.
To start the Energy Billing Module, simply go to the bottom left corner of your Windows mainscreen and click through the following:•• Start > Programs > Electro Industries > Log Viewer - the Log Viewer screen appears.
•• Click $Bill buttonMS Excel will start automatically. A message box will appear to ask if you want to enable the macros.
•• Click on Enable Macros. Your screen will display the Demand Graphs screen.
14.8: Demand Graphs
First, make sure that the CAM Logger is running at the bottom of your screen.
Available Energy Data will be shown above the Demand Graph, indicating the start and end dates ofthe data. If you just installed the system, “No Data Available” will appear in this section.
Select Date RangeTo view the graphs, enter your start and end dates in the Start Date and End Date fields. Ranges arelimited to days only. For example, if you want to view data from January 1, 2004 3:00pm toFebruary 23, 2004 6:00am, enter “1/1/2004” in the Start Date field and “2/24,2004” in End Datefield.
Note: Make sure the dates are with the range of the Available Energy Data start and end dates.Otherwise, the graphs will not be correct.
Select ParametersA list of Energy Billing Module meters will be displayed in the pull-down menu in this section.Select a meter from which you want to retrieve data.
Refresh GraphClick on Refresh graph to start retrieving graphs for the dates and parameters selected.
Warning! DO NOT click anywhere on the spreadsheet while the system is in Calculation Mode!

e Electro Industries/GaugeTech Doc # E107707 14-9
Demand GraphThis graph shows the Demand History. Demand data is collected every 15 minutes from the EnergyBilling Module meter.
Profile by Day Graph (upper right)This graph shows the Daily Peak Demand for the period you selected.
kWh Usage by Day Graph (lower right)This graph shows the Aggregated Daily Usage (kWh) for the period you selected.
Generic load information is displayed at the bottom of the screen.

e Electro Industries/GaugeTech Doc # E107707 14-10
14.9: Demand Statistics
The Demand Statistics screen displays statistical energy data for the time period you selected.
Click the Demand Statistics tab in the Demand Graph screen. The Demand Statistics screenappears.
Select ParametersEnter a Start Date, End Date and Select a meter. Peak Time Range is your Utility Time Structuresetup.Example:Your utility has the following setup:
On-Peak: 7:00am - 6:00pm.Off-Peak: 6:00pm - 7:00am.
To retrieve statistics for that setup:
1. Select the following:Select On-Peak from 7:00 to 18:00 in Range 1 and N/A’s in Range 2.Since no Mid-Peak is given, select Mid-Peak from 6:00 to 6:00 in Range 1 and 18:00 to
18:00 in Range 2.Select Off-Peak from 18:00 to 0:00 in Range 1 and from 0:00 to 7:00 in Range 2.

e Electro Industries/GaugeTech Doc # E107707 14-11
2. Click on Refresh Data to get statistical results. Data will appear for each time period and for each day.
Warning! DO NOT click anywhere on the spreadsheet while the system is in Calculation Mode!
14.10: Bill Verification
The Bill Verification screen calculates and displays cost analysis results for a billing period youselected.
Click the Bill Verification tab in the Demand Graph screen. The Bill Verification screen appears.

e Electro Industries/GaugeTech Doc # E107707 14-12
Select ParametersIn the Select Data Range field, enter a Start Date and an End Date.In the Select Parameters field, select a meter from which to calculate data.In the Peak Time Range fields, enter the peak time structure (or make changes).In the Rate Structure Table, enter your rate structure in the white spaces in the table. Leave a space
empty if it does not apply.
Rate Structure TableThis generic rate structure table is set up based on utility rates for small and medium industrial andcommercial facilities. This model has charges for Distribution, Generation, Transmission and somemiscellaneous items. It also allows 1 to 2 tiers in rate structure.
Example of tiered rate structures:A company used 5,000 kWh with a 400 kW peak demand during a billing period.
Single Tier Rate Structure: Utility charges a flat usage rate of 4 cents per kWh and a flat demandrate of 2 cents per kW.
Double Tier Rate Structure: Utility charges a usage rate of 4 cents per kWh for the 1st 2000 kWhand a lower usage rate of 3 cents per kWh for the remaining 3000 kWh. Demand rate is 2 cents perkW for the 1st 300kW and 1 cent per kW for the remaining 100kW.
Double check the data entered in the table and click on “Calculate”.
Warning! DO NOT click anywhere on the spreadsheet while the system is in Calculation Mode!
14.11: Notes
Excel 2002: The Excel Spreadsheet used in the EBM is designed for use with Excel ‘97. When using this module with Excel 2002, the first time a file is opened it takes several minutes for the file to be converted into the updated format. Save the file immediately after the load is completed. After theinitial conversion, the file will open more quickly.
When using Excel 2000 with SP3 or 2002, check that a level of security is in place. Click on thefollowing:
Tools > Macro > Security

e Electro Industries/GaugeTech Doc # E107707 14-13
The following screen appears:
Click Medium > OK.
Trouble Shooting:If you are experiencing a problem executing this module, you may be missing the DAO component.To add the DAO component to your system, do the following:
Click Tools > Macro > Visual Basic Editor.
The Visual Basic Editor screen appears.
Click Tools > References > VBA Project.The following screen appears.
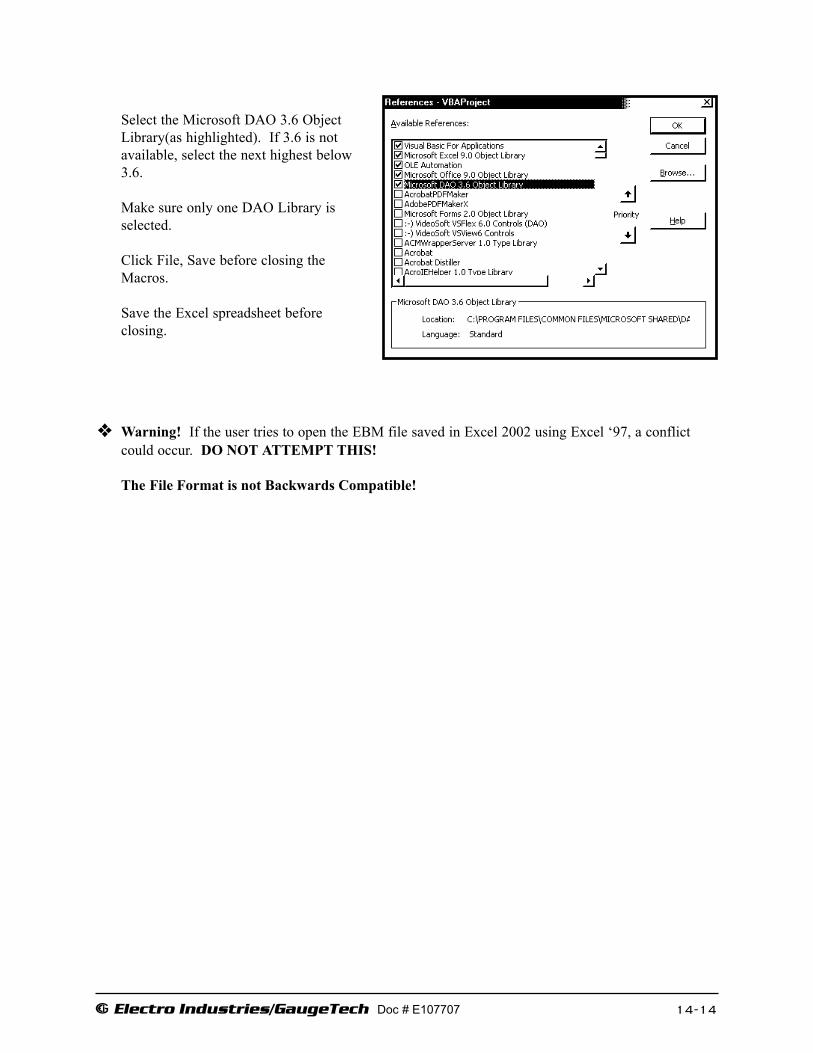
e Electro Industries/GaugeTech Doc # E107707 14-14
Select the Microsoft DAO 3.6 ObjectLibrary(as highlighted). If 3.6 is not available, select the next highest below 3.6.
Make sure only one DAO Library is selected.
Click File, Save before closing the Macros.
Save the Excel spreadsheet before closing.
Warning! If the user tries to open the EBM file saved in Excel 2002 using Excel ‘97, a conflictcould occur. DO NOT ATTEMPT THIS!
The File Format is not Backwards Compatible!
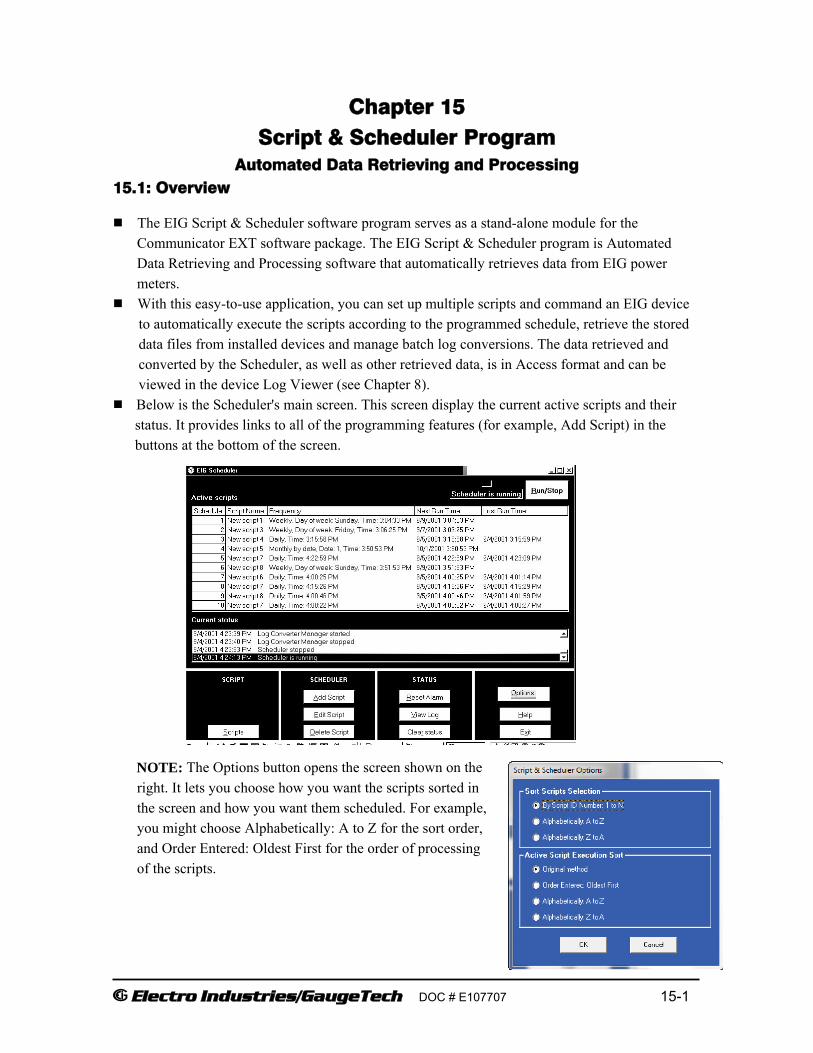
E Electro Industries/GaugeTech DOC # E107707 15-1
Chapter 15 Script & Scheduler Program
Automated Data Retrieving and Processing 15.1: Overview
The EIG Script & Scheduler software program serves as a stand-alone module for the Communicator EXT software package. The EIG Script & Scheduler program is Automated Data Retrieving and Processing software that automatically retrieves data from EIG power meters.
With this easy-to-use application, you can set up multiple scripts and command an EIG device to automatically execute the scripts according to the programmed schedule, retrieve the stored data files from installed devices and manage batch log conversions. The data retrieved and converted by the Scheduler, as well as other retrieved data, is in Access format and can be viewed in the device Log Viewer (see Chapter 8). Below is the Scheduler's main screen. This screen display the current active scripts and their status. It provides links to all of the programming features (for example, Add Script) in the buttons at the bottom of the screen.
NOTE: The Options button opens the screen shown on the
right. It lets you choose how you want the scripts sorted in the screen and how you want them scheduled. For example, you might choose Alphabetically: A to Z for the sort order, and Order Entered: Oldest First for the order of processing of the scripts.
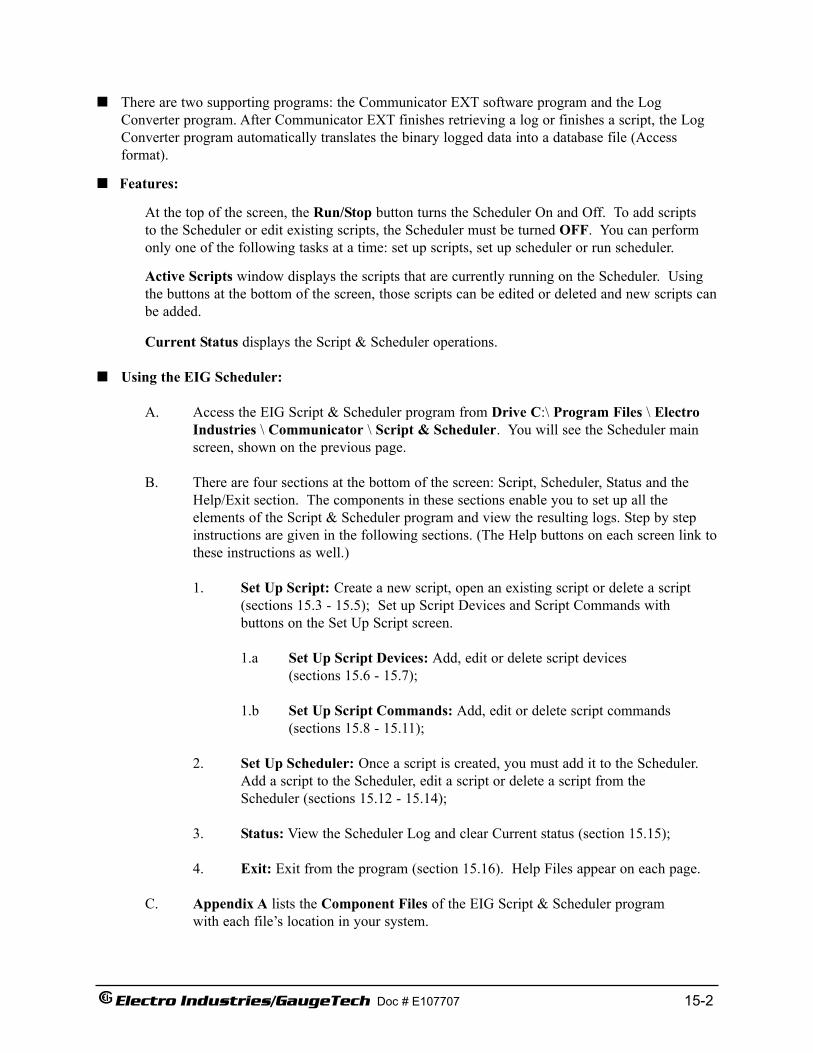
There are two supporting programs: the Communicator EXT software program and the LogConverter program. After Communicator EXT finishes retrieving a log or finishes a script, the LogConverter program automatically translates the binary logged data into a database file (Access format).
Features:
At the top of the screen, the Run/Stop button turns the Scheduler On and Off. To add scriptsto the Scheduler or edit existing scripts, the Scheduler must be turned OFF. You can perform only one of the following tasks at a time: set up scripts, set up scheduler or run scheduler.
Active Scripts window displays the scripts that are currently running on the Scheduler. Using the buttons at the bottom of the screen, those scripts can be edited or deleted and new scripts canbe added.
Current Status displays the Script & Scheduler operations.
Using the EIG Scheduler:
A. Access the EIG Script & Scheduler program from Drive C:\ Program Files \ ElectroIndustries \ Communicator \ Script & Scheduler. You will see the Scheduler main screen, shown on the previous page.
B. There are four sections at the bottom of the screen: Script, Scheduler, Status and the Help/Exit section. The components in these sections enable you to set up all the elements of the Script & Scheduler program and view the resulting logs. Step by step instructions are given in the following sections. (The Help buttons on each screen link tothese instructions as well.)
1. Set Up Script: Create a new script, open an existing script or delete a script (sections 15.3 - 15.5); Set up Script Devices and Script Commands with buttons on the Set Up Script screen.
1.a Set Up Script Devices: Add, edit or delete script devices (sections 15.6 - 15.7);
1.b Set Up Script Commands: Add, edit or delete script commands(sections 15.8 - 15.11);
2. Set Up Scheduler: Once a script is created, you must add it to the Scheduler. Add a script to the Scheduler, edit a script or delete a script from the Scheduler (sections 15.12 - 15.14);
3. Status: View the Scheduler Log and clear Current status (section 15.15);
4. Exit: Exit from the program (section 15.16). Help Files appear on each page.
C. Appendix A lists the Component Files of the EIG Script & Scheduler program with each file’s location in your system.
Electro Industries/GaugeTech Doc # E107707 15-2
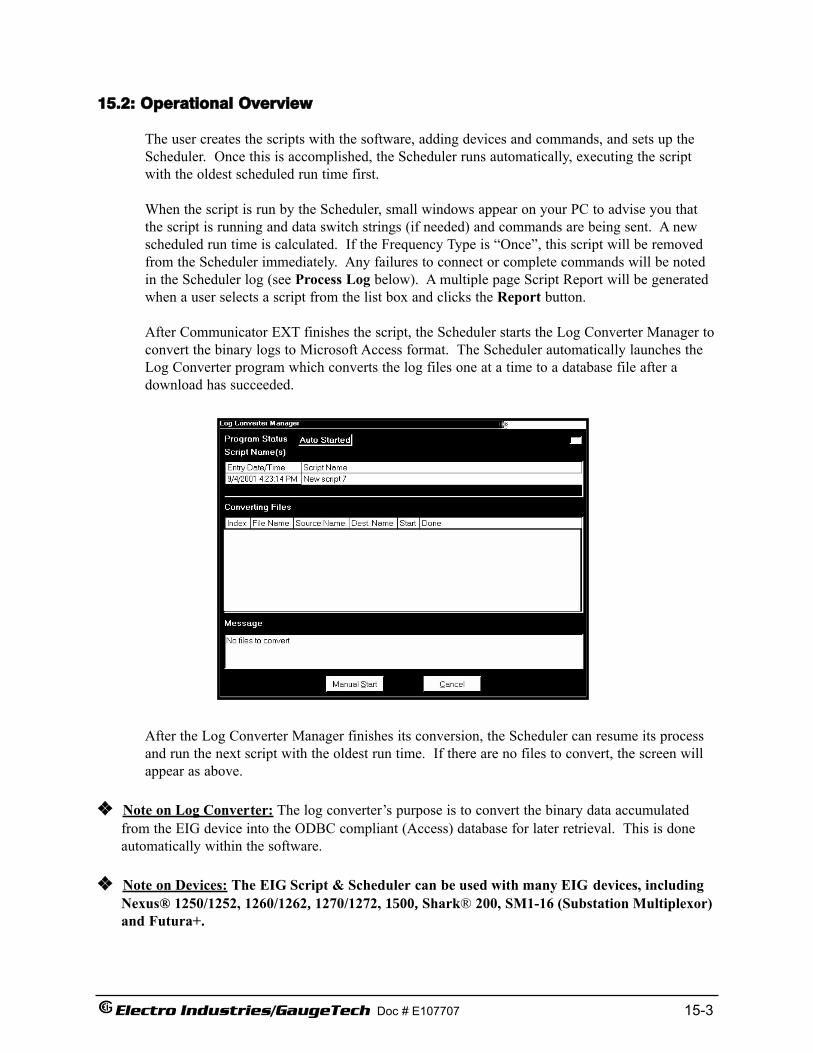
15.2: Operational Overview
The user creates the scripts with the software, adding devices and commands, and sets up the Scheduler. Once this is accomplished, the Scheduler runs automatically, executing the script with the oldest scheduled run time first.
When the script is run by the Scheduler, small windows appear on your PC to advise you that the script is running and data switch strings (if needed) and commands are being sent. A new scheduled run time is calculated. If the Frequency Type is “Once”, this script will be removed from the Scheduler immediately. Any failures to connect or complete commands will be noted in the Scheduler log (see Process Log below). A multiple page Script Report will be generated when a user selects a script from the list box and clicks the Report button.
After Communicator EXT finishes the script, the Scheduler starts the Log Converter Manager to convert the binary logs to Microsoft Access format. The Scheduler automatically launches the Log Converter program which converts the log files one at a time to a database file after a download has succeeded.
After the Log Converter Manager finishes its conversion, the Scheduler can resume its process and run the next script with the oldest run time. If there are no files to convert, the screen will appear as above.
Note on Log Converter: The log converter’s purpose is to convert the binary data accumulated from the EIG device into the ODBC compliant (Access) database for later retrieval. This is done automatically within the software.
Note on Devices: The EIG Script & Scheduler can be used with many EIG devices, including Nexus® 1250/1252, 1260/1262, 1270/1272, 1500, Shark® 200, SM1-16 (Substation Multiplexor) and Futura+.
Electro Industries/GaugeTech Doc # E107707 15-3

The Scheduler Log can be viewed by clicking View Log on the main Scheduler screen. Thescript logs produced by the Scheduler can be found in Drive C:\ Program Files\ Electro Industries\Communicator\ Retrieve\ Logs. The files produced by the Log Converter program can be accessed in Drive C:\ Program Files\ Electro Industries\ Communicator EXT in a default subdirectory.
EIG Script and Scheduler has a new Process Log, which is in Html format and carries the .Html extension. The Process Log consists of three top level files that work together to signalan error and provide links to detailed script logs and detailed log converter logs.Following are the files that make up the Process Log:
NexusSchedulerLog - Main.Html: Software generated top layer file with frame set linked to NexusSchedulerLog - Detail.Html and NexusSchedulerRun-TimeLog.Html.
NexusSchedulerLog - Detail.Html: Software generated blank frame file.
NexusSchedulerRun - TimeLog.Html: Software generated schedule process log with hypertext link to detailed script logs and detailed Log Converter logs.
If any type of error occurs during the execution of a scheduled script, NexusSchedulerRun-Time Log.Html will have an entry in red with the appropriate hypertext link to its detailed logs. The Reset Alarm button will also create a visual alarm (red background color) and a continuous beep (until the user clears it), if an error occurs. To clear the contents of a current Nexus SchedulerRun-TimeLog.Html file, the user deletes that file from its location. NOTE: It is strongly recommended that the user back up that file before deleting it.
For a list of all the component files of the EIG Script & Scheduler Program and their defaultlocations, see Appendix A.
Default locations can be changed but, you must also change the associated pr ograms so theyknow where to find the files.
To change default locations:
From Communicator EXT, click View>Options. The default locations are listed in the Paths screen.
Scheduler Auto Run and Hide on Windows Start-up:
The Scheduler runs automatically whenever Windows starts up, if desired. The program will hide the main screen and add an icon to the system tray (lower right hand corner of your screen) and will run unattended. To open the main screen, click on the icon in the system tray. The following are the procedures to set up Auto Run and/or Hide:
1. Create a shortcut for this program and place it in the Windows' Startup folder.2. Add the following to the command line: /auto /hide.
After the Windows operating system has restarted, this program will automatically start.
Electro Industries/GaugeTech Doc # E107707 15-4
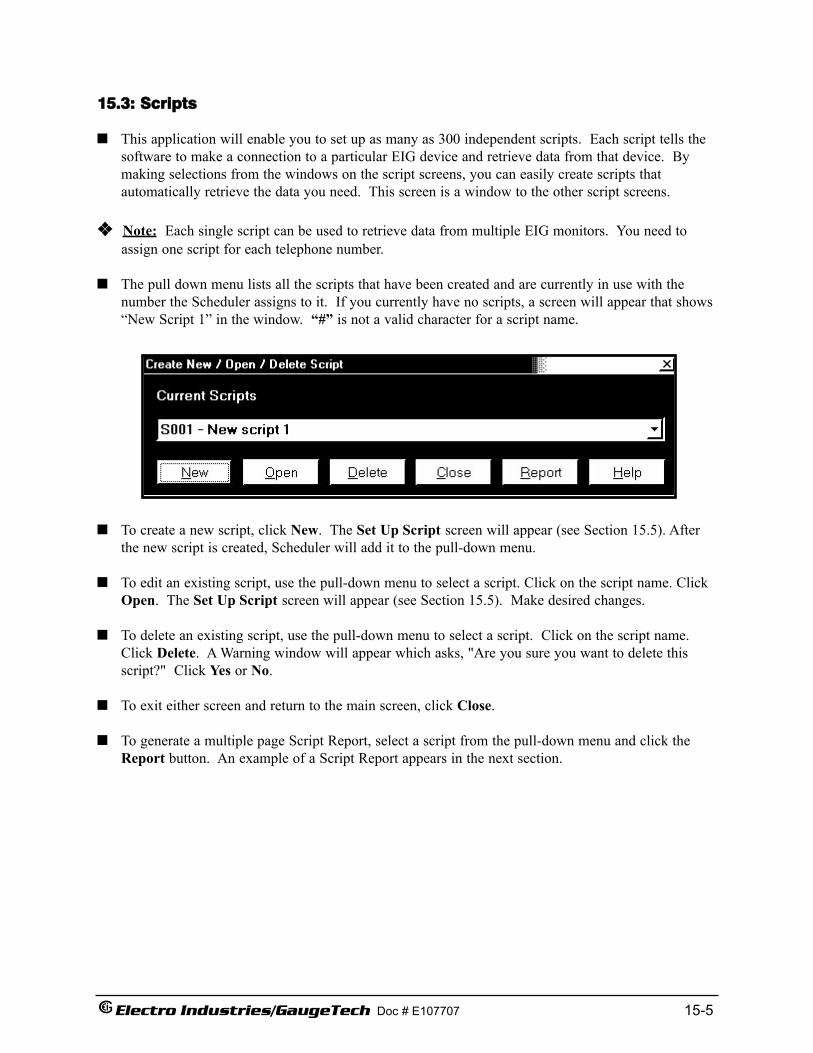
15.3: Scripts
This application will enable you to set up as many as 300 independent scripts. Each script tells thesoftware to make a connection to a particular EIG device and retrieve data from that device. Bymaking selections from the windows on the script screens, you can easily create scripts that automatically retrieve the data you need. This screen is a window to the other script screens.
Note: Each single script can be used to retrieve data from multiple EIG monitors. You need toassign one script for each telephone number.
The pull down menu lists all the scripts that have been created and are currently in use with the number the Scheduler assigns to it. If you currently have no scripts, a screen will appear that shows“New Script 1” in the window. “#” is not a valid character for a script name.
To create a new script, click New. The Set Up Script screen will appear (see Section 15.5). Afterthe new script is created, Scheduler will add it to the pull-down menu.
To edit an existing script, use the pull-down menu to select a script. Click on the script name. ClickOpen. The Set Up Script screen will appear (see Section 15.5). Make desired changes.
To delete an existing script, use the pull-down menu to select a script. Click on the script name.Click Delete. A Warning window will appear which asks, "Are you sure you want to delete thisscript?" Click Yes or No.
To exit either screen and return to the main screen, click Close.
To generate a multiple page Script Report, select a script from the pull-down menu and click theReport button. An example of a Script Report appears in the next section.
Electro Industries/GaugeTech Doc # E107707 15-5

Electro Industries/GaugeTech Doc # E107707 15-6
The Script Report provides the detail of a particular script. For scripts that have many devicesand/or many commands, the report may be quite lengthy.
Features:
Print: To print all or part of the report, type the page numbers and click on Print.
Save: To save the report to a particular file, click on Save.
Cancel: To exit the report and return to the main screen, click Cancel.
Scroll Bar: To move from page to page in the report, click the Back or Forward Arrows.
Zoom: Use the pull-down menu to select from a variety of magnifications (from Thumbnail to400%). The screen capture above shows a Zoom of 100%.
15.4: Script Report

15.5: Set Up a Script
Enter a name for the script in the Script Name field. Each script must have a unique name.If the script is not named, a default name is assigned by the software. Most users assign the name of the substation where the device is located as the name. (“#” is not a valid character for a script.)
To select a Connection Type, use the pull-down menu to select either Remote - Dial Up or Direct -Single COM Port. The Script Connection Properties are disabled until you enter this selection. Ifthe script connection type is not set, Communicator EXT program will treat it as an empty script.
From the pull-down menu, select the Number of Retries (the number of times the software will tryto connect) from 0 to 5. In some situations, connecting lines are shared by other programs or telephones. The retries enable the software to try to connect more than once (over a period of a fewseconds). If the retries fail, the log will automatically note the date, time and script name for which the connection was not completed. The script will fail.
Connection Type: Direct - Single COM Port
Using the pull-down menus, enter the following selections:
Comm Port Select from Com 1 to Com 99. (See note on the next page).Baud Rate Select 1200, 2400, 4800, 9600, 19200, 38400, 57600 or 115200.Flow Control Select None or Hardware.Data Bits Select 7 or 8.Parity Select None, Even or Odd.Echo Mode No Echo or Static Echo: For Shark® 200 devices, if you are setting up a Fiber
Optic Card that is configured with Echo on, select Static Echo for this field.
Electro Industries/GaugeTech Doc # E107707 15-7

Connection Type: Remote - Dial Up
Two additional screens will appear. Enter the following selections:
Phone Number Type in Phone Number.Setup String Type in Data Strings, if needed.
New Connection Type: Ethernet.
To add, edit or delete devices, click Devices button.
To add, edit or delete commands, click Commands button.
To exit the screen and return to the main screen, click Close.
Note on choosing a port: The script opens and closes a PC communication port, creates a log and creates a database for the script. When you run the Scheduler, if the port your script is using is already open (i.e. being used by a different program), the script's command will fail.
15.6: Devices
This screen lists the current devices for a particular script. Columns shown include: the device’snumber or identification, the device’s unique address, the device type and the device’s unique name.
You can enter up to 256 devices for each script. The Add, Edit and Delete buttons on this screenfacilitate the adding of new devices and the editing and deleting of current devices.
You must set up an address, protocol, device type and a unique name for each device. Optionalsettings for each device are passwords for a Nexus® or Shark® device and data switch strings forEIG's Substation Multiplexor. When Communicator EXT retrieves a log from an EIG device and it
Electro Industries/GaugeTech Doc # E107707 15-8

does not have a predefined name, it will use the device name assigned here as the file name for theretrieved log file. If you already named your device, you do not have to assign it a name in this section. We recommend that you keep both names the same.
To add a device, click Add. The Edit Script Device screen will appear.
To edit a device, select a device from the list by clicking on it. Then, click Edit. The Edit ScriptDevice screen will appear.
To delete a device, select a device from the list by clicking on it. Then, click Delete. A windowwill appear that asks, "Are you sure you want to delete this device?" Click Yes or No.
If you click Edit or Delete before you select a device, a window will appear that says, "Please selecta device." Click OK. Select a device and follow the above steps.
Click Close to return to the Set Up Script screen.
15.7: Add/Edit a Script Device
Use this screen to add new devices to a script or edit settings for existing devices. You can enter upto 256 devices for each script.
You must set up an address, protocol, device type and a unique name for each device.
NOTE: When Communicator EXT retrieves a log from an EIG device and it does not have a prede-fined name, it will use the device name assigned here as the file name for the retrieved log. If youhave a name already designated for the Nexus® or Shark® meter, the device name shown here willnot be used; the Futura Device will use the name shown here.
Optional settings for each device are passwords for a Nexus®
or Shark® device and data switchstrings for EIG's Substation Multiplexor.
Electro Industries/GaugeTech Doc # E107707 15-9

Add/Edit a Nexus® or Shark® Device:
1. Enter a unique Device Name.
2. Click Archive Options to specify when logs for the device should be archived. You will see the screen shown on the right.
a. Click the checkbox(es) to specify archiving based on log size and/or database age.
b. Select the size and/or database age from the pull-down menus for these fields.
c. Select AND or OR from the pull-down menu in the centerof the screen, to further specify when archiving will take place.
For example: to create a log archive for a device when thelog size has reached 100 MegaBytes and when the log database is 30 days old, your screen should have the settings shown here.
3. Under Device Information, type in a unique Address, and select Protocol and (device) Type from the pull-down menu.
4. Enter Level 1 and Level 2 Passwords (optional).
5. Click OK or Cancel to return to the Devices for Scripts screen.
NOTES: The device you choose will determine what data is required for this screen. Passwords are not required. Data Switch Strings will probably not be necesssary. Data Switch Strings tell Communicator EXT
how to connect to and disconnect when a data switch is present. It already knows how to connect toa single device.
Add a Data Switch (Substation Multiplexor) or Multiple Devices
NOTE: For Help with hardware connections for the Substation Multiplexor, refer to the SM1-16 (Substation Multiplexor) User Manual.
1. Follow instructions 1-4 above.
2. Type in Data Switch Strings to Connect and to Disconnect, if needed.
You can enter up to 255 characters for each data switch string. Special characters are “&” forline feed and “|” for carriage return.
Sample data switch strings:
a) Connect string to Port 2 of an SM1-16 device (Electro Industries’ Data Switch)Format: <CR><CR>,,%%%,,PT02<CR>,,Actual string: ||,,%%%,,PT02|,,
Electro Industries/GaugeTech Doc # E107707 15-10

b) Switch a connection from Port 2 to Port 1 of an SM1-16 deviceFormat: <CR><CR>,,%%%,,,,PT02<CR>,,<CR>,,%%%,,,,PT01<CR>,,<CR>Actual string: ||,,%%%,,,,PT02|,,|,,%%%,,,,PT01|,,|
c) Disconnect stringFormat: ,,%%%,,Actual string: ,,%%%,,
NOTE: For further Help with setting data switch strings, refer to the SM1-16 (Substation Multiplexor) User Manual.
3. Click OK or Cancel to return to the Devices for Scripts screen.
Electro Industries/GaugeTech Doc # E107707 15-11

15.8: Script Commands
This screen lists all the current commands for a particular script. You can enter up to 1000 commands for each script and each command is assigned to a selected device for that script. Eachdevice is listed by Index Number, Type, Name and Address and the Command Description followsthe device information.
You cannot set up multiple retrieve commands for a single device. But, you can have up to 256devices for each script.
The sequence of the commands listed on the scr een must be valid. To move a command recordto a different sequence, click on the command, then click the Up or Down buttons to move it.The new sequence will be saved to the database when the window is closed.
Note: If the sequence is not correct, you may clear the device’s log before retrieving it.
To add a command, click Add. The Edit Script Command screen will appear.
To edit a command, select a command by clicking on it. Click Edit. The Edit Script Commandscreen will appear.
To delete a command, select a command by clicking on it. Click Delete. A Warning window willappear which asks, "Are you sure you want to delete this command?" Click Yes or No.
To exit the screen, click Close.
Electro Industries/GaugeTech Doc # E107707 15-12

15.9: Add a Script Command
This screen enables you to add or edit a script command. This section will discuss adding a script,Section 15.10 will discuss editing a script command.
Add a script commandUse the pull-down menu to select a Device. The device you choose in this window willdetermine the choices available for the other screens:
Use the pull-down menu to select the Number of Retries (from 0 to 5). This is the number oftimes the software will attempt to connect.
Use the pull-down menu to select a Primary Command.
Type in or click to select the Secondary Command(s).
NOTE: When you add a NexusTM or Shark® device, the Primary Command will be "Retrieve"and the Secondary Commands will be a selection of logs.
Click OK.
Add a Futura+ Device script command
If you have a Futura+ Device connected to the EIG Script & Scheduler, the above screen will appear slightly different. The process is the same as for a NexusTM or Shark® device.
Electro Industries/GaugeTech Doc # E107707 15-13

15.10: Edit a Script Command
Select a command that you would like to edit, by clicking on it. If you click the Edit button beforeyou select a command to edit, a window will appear to remind you to select a command.
Click OK. Select a command.
Click Edit. The command you choose willdetermine the screen that appears.
Edit a Script command
If you selected a Script command to edit, the following window will appear:
Electro Industries/GaugeTech Doc # E107707 15-14

When you edit a Nexus® or Shark® device, the Primary Command will be “Retrieve” and theSecondary Commands will be a selection of logs. Using the windows available, select or deselectthe item(s) you would like to change. Make the change(s).
Click OK.
Editing a Data Switch or System Device Command
If you select a Data Switch or System Device Command to edit, the following screen will appear:
If you edit a Data Switch or System Device Command, the Primary Command will be "Send Switch String" and the Secondary Commands will request a System Data Switch String. Atool-tip screen will display special characters to be used in the Data Switch Strings: “&” = line feed, “|” = carriage return. Select or deselect to make changes. Click OK.
Editing a Futura+ Device Command
If you have a Futura+ Device connected to the EIG Script & Scheduler, the above screen will appear slightly different. The editing process is the same as for a Nexus® or Shark® device.
Electro Industries/GaugeTech Doc # E107707 15-15

15.11: Delete a Script Command
Select a command you would like to delete by clicking on it.
Select a command. Click the Delete button.
A warning window will appear.
Click Yes or No.
Click Close to return to the mainscript screen.
A warning window will appear. Click Yesor No to return to the Set Up Script screen.
Click Close to return to the main Schedulerscreen.
Electro Industries/GaugeTech Doc # E107707 15-16

15.12: Add Scripts to the Scheduler
Once you have created the scripts, they have to be added to the Scheduler. From there, theScheduler sends the scripts to Communicator EXT to be executed. It is at this stage that you set thetime and interval for the automatic data retrieval. First, Stop the Scheduler.
On the main Scheduler screen, click the Add Script in the Scheduler section of the screen. The following screen will appear:
Electro Industries/GaugeTech Doc # E107707 15-17
To add a script to the Scheduler, select an Available Script from the pull-down menu. By changingthe Frequency, you can create additional versions of the script and add the updated version(s) to theScheduler.
In the Schedule section of the screen, use the pull-down menu to select the desired Frequency.
Select from: Yearly, Once, Interval, Daily, Weekly, Monthly by Date, Monthly by Day or Last Day of the Month.
Based on the desired frequency, the screen will change to offer the following selections: Month,Date, Day and/or Time (if appropriate). Following are sample windows of those that will appear:
Use the pull-down menus to makeselections.
Type in desired time.
Click OK to add to the Scheduler. Or, click Cancel.
If you click OK, the new scripts will immediately be added to the Scheduler and you will return tothe main Scheduler screen. Repeat steps to add additional scripts to the Scheduler.
Electro Industries/GaugeTech Doc # E107707 15-18
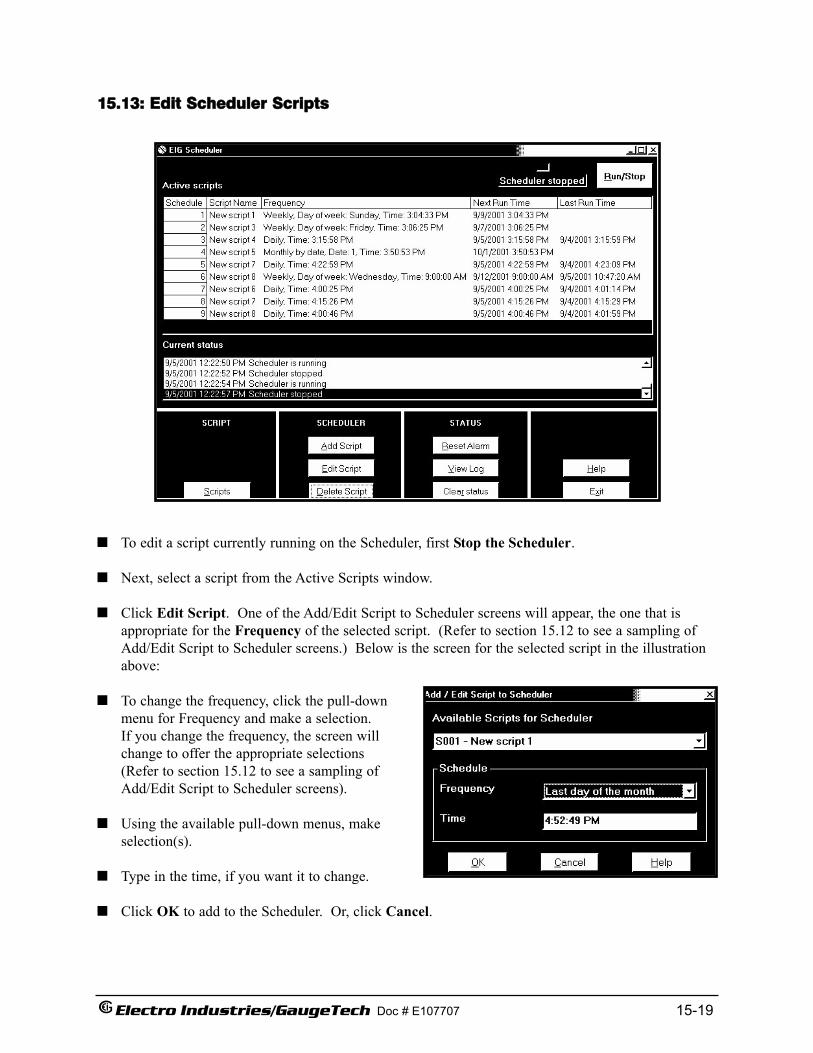
15.13: Edit Scheduler Scripts
To edit a script currently running on the Scheduler, first Stop the Scheduler.
Next, select a script from the Active Scripts window.
Click Edit Script. One of the Add/Edit Script to Scheduler screens will appear, the one that isappropriate for the Frequency of the selected script. (Refer to section 15.12 to see a sampling of Add/Edit Script to Scheduler screens.) Below is the screen for the selected script in the illustrationabove:
To change the frequency, click the pull-downmenu for Frequency and make a selection. If you change the frequency, the screen willchange to offer the appropriate selections (Refer to section 15.12 to see a sampling ofAdd/Edit Script to Scheduler screens).
Using the available pull-down menus, make selection(s).
Type in the time, if you want it to change.
Click OK to add to the Scheduler. Or, click Cancel.
Electro Industries/GaugeTech Doc # E107707 15-19

15.14: Delete Scheduler Scripts
To delete a script that is currently running on the Scheduler, first Stop the Scheduler.
Next, select a script from the Active Scripts window by clicking on it.
Click Delete Script. A Warning window will appear: Click Yes.
The script will be deleted immediately from the Active Scripts window and you will returnto the main Scheduler screen.
Electro Industries/GaugeTech Doc # E107707 15-20

15.15: Status
The Current Status window on the Scheduler screen displays entries in the Scheduler Log. It showsthe date, time in minutes and seconds and the status or action performed. The Scheduler Logrecords all the activities for the EIG Script & Scheduler program.
To view the entire Scheduler Log, click the View Log button. The following screen will appear:
Electro Industries/GaugeTech Doc # E107707 15-21

Scroll down to find a particular date, time or action.
To clear the Current Status window, click the Clear Status button. The screen will be cleared as follows:
Note: Individual logs for each script can be found by the name of the script in Drive C:\ Program Files \ Electro Industries \ Communicator EXT \ Script Logs.
Electro Industries/GaugeTech Doc # E107707 15-22

15.16: Exit
How to Exit
The best way to Exit the EIG Script & Scheduler software program is to click the Exit button onthe main Scheduler screen.
First, you must Stop the Scheduler. If you are on a screen other than the main Scheduler screen,click the Close button until you return to the main Scheduler screen.
Click Close.
Click Exit.
A Warning window will appear:
Click Yes to Exit; Click No to remain onthe screen.
Note: You can also minimize the program, if you want the Scheduler to continue to run but notappear on your PC, by clicking the Minimize button in the upper right hand corner of the screen.The icon will appear at the bottom of your screen. To restore the Scheduler to view on your screen,click the icon at the bottom of your screen.
Electro Industries/GaugeTech Doc # E107707 15-23

E Electro Industries/GaugeTech Doc#E107707 15-24
This page intentionally left blank.

E Electro Industries/GaugeTech DOC # E107707 16-1
Chapter 16 Configuring EN50160 and IEC 61000-4-30
Power Quality Settings
16.1: Overview
EN50160 is the European Standard approved by CENELEC (European Committee for Electrotechnical Standardization). This standard and other standards, such as IEC 61000-4-30, define the properties of the power supply as delivered to the user in normal operating conditions. The properties are defined in terms of continuity of supply and characteristics of voltage (symmetry, frequency, magnitude, waveform, Flicker). These standards define the main characteristics of the voltage at the customer’s supply terminals in public voltage electricity distribution systems. They do not describe the typical situation for a customer connected to a public supply network.
The term “Flicker,” for example, is defined by EN50160/IEC61000-4-30 and refers to the human eye’s perception of luminance differences in light sources. Flicker is discussed in the Rapid Voltage Changes section.
In recent years, power quality has become a very important issue. Competitive markets require constant attention to customer satisfaction. Increasing use of non-linear and pulsed loads can cause mains interference. And, many electronically controlled devices that we use to “run” our countries, businesses, and homes require quality supply voltage. For these reasons, it is important to collect reliable power quality data for electricity suppliers and customers alike. Following are the ten Power Quality measurements that comprise analysis as per the EN50160/IEC61000-4-30 standards (depending on the meter model, the measurement label may differ, as shown in the table below):
Nexus® 12** Meters Nexus® 1500 Meter Frequency Fluctuations Power Frequency Low Speed Voltage Fluctuations Supply Voltage Variations Fast Voltage Fluctuations Flicker Supply Voltage Unbalance Harmonic Magnitude %THD Voltage Dip Short Interruption Supply Voltage Long Interruption Supply Voltage 16.2: Issues Addressed by the Power Quality Compliance Standards
The following sections describe the Power Quality standards for compliance. 16.2.1: Mains Interference The increased use of power electronics and other devices puts a strain on the network. Because of this, electricity suppliers need detailed data on the quality of their network. New, advanced measuring and testing systems are used to record voltage quality at various points, convert the

E Electro Industries/GaugeTech DOC # E107707 16-2
data and add it to a central database. By correlating the applicable fluctuations and studying the time of events, the cause for a disturbance can be confined and ultimately eliminated. For a number of reasons, power quality has become an important issue: 1. Mains interference feedback can be caused by increased use of non-linear and pulsed loads.
2. An ever-widening number of electronic devices are very sensitive to mains pollution. A certain quality of supply voltage is required for them to operate properly.
3. With deregulation a global reality, a good relationship between supplier and
customer is essential. Permanent monitoring of voltage quality in networks is one key to maintaining quality control, which helps to sustain relationships.
16.2.2: Power Quality and Network Disturbances The Quality of an electric power supply is determined by examining two aspects of Power Quality: 1. Reliability of the energy supply 2. Quality of the voltage (similarity of the waveform of the supplied voltage to an
ideal sinusoidal voltage) Divergences from the ideal come in many shapes and sizes. In the next sections, we will discuss Network Disturbances in detail. 16.2.2.1: Voltage Dips The Voltage Level determines the Voltage Quality. When the voltage drops to a low level, a voltage dip occurs. If the voltage drops to zero, a power failure occurs. The depth and duration of the dip determine the severity. A dip is a sudden drop of the voltage to a level below 90% of the nominal voltage, followed by an increase to a level above 90% within a period of 10ms to 60s. Most dips in medium or high voltage networks have durations of less than 0.2s. Short dips can cause serious problems, such as failure of equipment and machine control systems. Short dips can also cause sudden torque change in motors, which causes damage. Faults in the insulation of medium and high voltage networks are the primary cause of most dips. Other possible causes of dips are branches of trees in contact with lines, ice, frost, snow and thunderstorms. During most dips, all customers in the network are affected to the same degree. Customers themselves can cause many dips. The start-up of big machines or capacitor banks can cause voltage dips, and short circuits can cause losses when there is insufficient short-circuit capacity.

E Electro Industries/GaugeTech DOC # E107707 16-3
16.2.2.2: Flicker The term “Flicker”, defined in IEC 61000-4-15, applies to luminescent variations of light sources as perceived by the human eye. Since each human eye is different, this perception varies with each person. Flickers are caused by voltage fluctuations, which are created by pulsed or changing loads. Microwave equipment, arc furnaces and laser printers are often responsible for flickers. To determine the standard, Flicker measurement was performed through observation of groups of people, and statistical operations were applied to the observations. The range of analysis is from 0.01 to 33Hz. Sensitivity of the human brain correlates with the frequency of the sensation. To make sure that most people do not perceive flickers, the Plt (Long Term Flicker) value must be below 1.00. This value is obtained with the following equation:
3
31
N
stii
ltPN
P
Where Psti (i = 1, 2, 3, …) are consecutive readings of the short-term severity Pst. NOTE: For more details on Flicker, refer to Chapter 17 of this manual. 16.2.2.3: Transients A transient over-voltage is a short duration oscillatory or non-oscillatory over-voltage, usually highly damped and with a duration of a few milliseconds or less. Transients are generally incidental and are considered single short term events. Switching capacitor banks on, switching inductive loads off, and lightning that affects power lines are the primary causes of transients. However, regular transients can occur when loads controlled by power electronics are switched on and off. Modern switching technology can be applied to minimize regular transients. 16.2.2.4: Harmonics Harmonic voltage is defined as a sinusoidal voltage with a frequency equal to an integer multiple of the fundamental frequency of the supply voltage. Harmonic voltages can be evaluated: Individually by their relative amplitude (Uh) related to the fundamental voltage (U1), where h
is the order of the harmonic. Globally, for example by the total harmonic distortion factor (THD), which is the sum of all
harmonics (all frequency contents), calculated using the following equation:
40
2
2h
h
THD u
Supply voltage harmonics are usually caused by customers’ non-linear loads connected to all

E Electro Industries/GaugeTech DOC # E107707 16-4
voltage levels of the supply system. Harmonic currents flowing through the system impedance create harmonic voltages. In office and residential buildings, harmonics are usually caused by energy-efficient lamps, TVs and PCs. These devices in large numbers can produce high harmonic content in low voltage networks. Fast Fourier transformation is used to measure harmonics. This method generates a spectrum of a signal yielding a frequency-domain representation. EN50160 defines the values for harmonics and THD in percentages of the nominal voltage Un. 16.2.2.5: Frequency The supply voltage nominal frequency ( Ufn ) is 50Hz or 60Hz. Under normal operating conditions, the 10-second average value of the fundamental frequency in a distributive mains must be in the following ranges: Ufn 1% For mains with connection to an interlinking mains during
95% of one week. Ufn 4% / -6% For mains with connection to an interlinking mains during
100% of one week. Ufn 2% For stand-alone mains during 95% of one week. Ufn 15% For stand-alone mains during 100% of one week. In today’s interconnected grids, frequency fluctuations are very small. 16.3: Permanent Monitoring Provides Valuable Data The types of data provided by permanent monitoring are listed below. This data is invaluable to the successful operation of electricity suppliers. Types and levels of disturbances in the network Overview and detailed analysis of voltage quality in the network
Time-stamped recordings of disturbances
Through analysis of the data provided, causes of a disturbance can be determined, events clarified and associated problems or trends discovered.
Preventive maintenance may also be facilitated by the data. Indicators may predict disturbances early enough to avoid the event altogether.

E Electro Industries/GaugeTech DOC # E107707 16-5
16.4: Power Quality Monitoring EN50160 has standardized the voltage quality of electricity supplied by public distribution systems since 1994. Amendments have been added to the standard to reflect changes in technology. Other standards, such as IEC 61000-3-6 and 61000-3-7, set the standard for distortions across medium and high voltage networks. With this standard in hand, customers have new rights regarding the quality of supply. For example, if the voltage quality at the point of common coupling does not conform to the standard, according to EN50160 the customer has the right to complain. As a result, there has been a shift towards partnership between the electricity supplier and customer. The quality of the electricity should be constantly monitored at the point of common coupling and throughout the network to the benefit of both partners. And, since disturbances caused by one customer can affect others indirectly linked to them in the network, the continuous monitoring will benefit all customers. 16.5: EN50160/IEC61000-4-30 Meter Setting (Not enabled in all meters) Configure your meter’s logs for use with the Power Quality Compliance Standards:
1. From the Device Profile of the Communicator EXT software, double-click Power Quality and Alarm Settings>EN50160/IEC61000-4-30. Depending on your current setting, you will see one of the screens shown below. (See Chapter 19 for the Nexus® 1500 meter's EN50160/IEC61000-4-30 instructions.)
2. If enabled in the meter, Historical Log 2 can be used to record the results of IEC61000- 4-30 testing. You will see the display on the left if IEC610004-30 reporting has not been selected for the meter; you will see the screen on the right if it has already been selected. • To set up IEC61000-4-30 recording, click Auto-Configure. Historical Log 2 will now be used for IEC61000-4-30 recording, only. • If IEC61000-4-30 recording is already active and you want to disable it, click Enable Log 2. This will disable the IEC61000-4-30 recording in Historical Log 2. You can then configure Historical Log 2 normally.

E Electro Industries/GaugeTech DOC # E107707 16-6
NOTE: It takes a week for the meter to collect all the necessary IEC61000-4-30 data. 3. Make the following selections: a. FVF: select the number of Fast Voltage Fluctuations that are acceptable per day. b. Sync Connection: select YES for a system with a synchronous connection to another system, NO if there is no such synchronous connection. c. Select your Frequency (50 Hz or 60Hz). d. Nominal Voltage (in Secondary): Enter the value for the Nominal voltage in Secondary that you want to use in the analysis; for example, 120 V for a 60 Hz frequency, or 230 V for a 50 Hz frequency. e. Short Term Test Time: Select the time in minutes for the PST - short-term test. The available range is from 1-10 minutes. f. Long Term Test Time: Select the time in minutes for the LST - long-term test. The available range is 10-240 minutes, in multiples of 10 (10, 20, 30, etc.). 4. Click OK. 5. Click Update Device to send the new settings to the meter and return to the Main Communicator EXT screen.

E Electro Industries/GaugeTech DOC # E107707 16-7
16.6: Downloading the EN50160/IEC61000-4-30 Log (For Nexus® 12xx meters: see Section 16.7 for Nexus® 1500 Meter's Instructions and Report Sample)
NOTE: Data must be accumulated for a full week before this log can be downloaded.
1. From the Communicator EXT toolbar, click Logs>Retrieve Logs from Device(s) or click the Retrieve Logs icon. You will see a screen like the one shown on the right.
2. Double-click on the No to the right of EN50160/IEC61000-4-30.
3. You will see a pop-up window
displaying the message: “Updated Related Logs (PQ and Historical Log 2).” Click OK.
4. The No changes to a Yes next to the Historical Log 2, Waveform/PQ, and EN50160 / IEC61000-4-30 logs. Click Start to begin retrieving the logs. Communicator EXT retrieves the selected logs and automatically creates a database for you. Pop-ups confirm the retrieval and conversion.
5. The Log Viewer opens. (See Chapter 8, Section 8.4 for additional information on using the Log Viewer.)
6. Select the Time Range and Data points on the main Log Viewer page. 7. Click the EN50160/IEC61000-4-30 button. 8. A list of all weeks collected for this meter is displayed. Information provided includes:
Start/End Time of Week Device Name Nominal Frequency / Voltage Pass / Fail Value for each component in the log.
Select a week from those displayed. 9. Click the Graph button at the bottom of the screen. The EN50160/IEC61000-4-30 Report
Viewer is displayed, detailing all of the EN50160/IEC61000-4-30 data for the meter. A sample of the report is shown on the following pages.

E Electro Industries/GaugeTech DOC # E107707 16-8

E Electro Industries/GaugeTech DOC # E107707 16-9
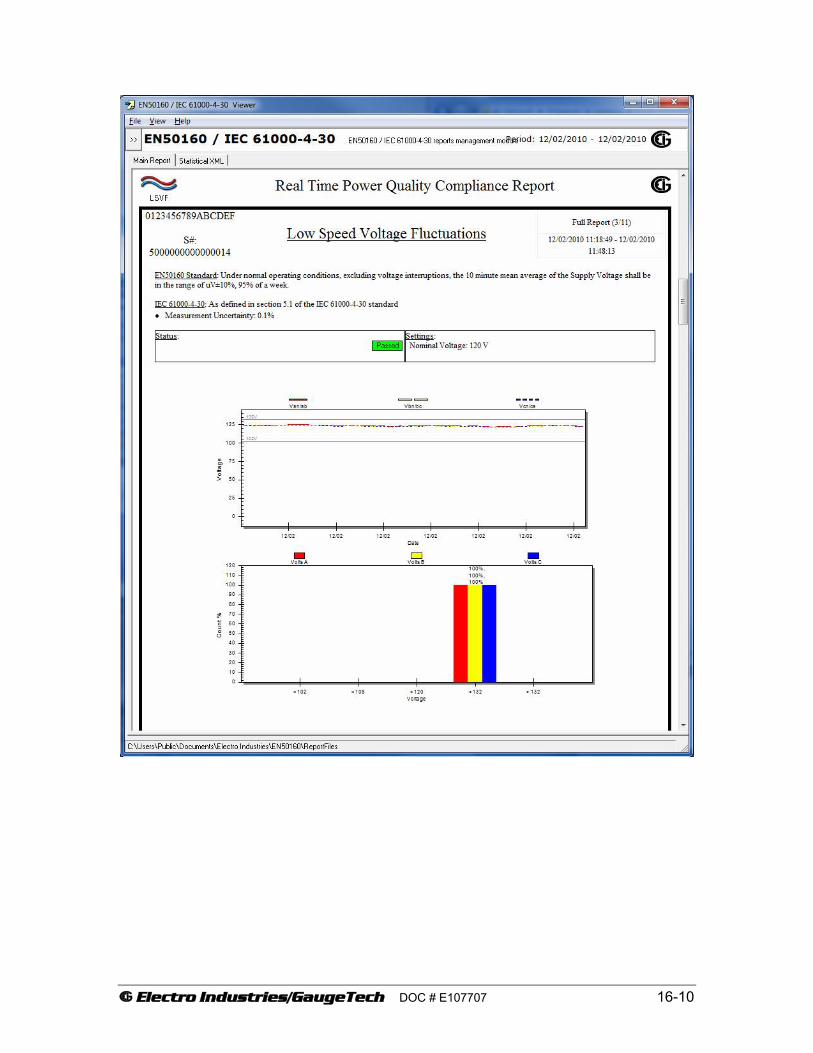
E Electro Industries/GaugeTech DOC # E107707 16-10

E Electro Industries/GaugeTech DOC # E107707 16-11

E Electro Industries/GaugeTech DOC # E107707 16-12
16.7: EN50160/IEC61000-4-30 Log/Report for the Nexus® 1500 Meter Follow these instructions to generate an EN50160/IEC61000-4-30 report for the Nexus®
1500 meter. The meter uses one of the historical logs to store the EN50160/IEC61000-4-30 data. See Chapter 19 for instructions on setting up an historical log for EN50160/IEC61000-4-30 programming.
1. Click the Retrieve Logs icon. The Log Statistics screen opens, listing the available logs. 2. Click the "Select" checkbox next to EN50160/IEC61000-4-30 in the Log Statistics screen.
Then click Start. 3. You will see a message window while the log is being retrieved and then the Log Viewer will
open. Click the EN50160 IEC61000-4-30 Report button. You will see a screen like the one shown below.
4. Use the scroll bars to view all of the data on the screen. To create the EN50160/IEC61000-4-
30 report, click the Graph button at the bottom of the screen. A sample report is shown on the following pages.

E Electro Industries/GaugeTech DOC # E107707 16-13
This page intentionally left blank.

Real Time Power Quality Compliance Report
EN50160 Individual Report Summary
Power Frequency (x.1) Pass
Supply Voltage Variations (x.3.x) Pass
Rapid Voltage Changes (x.4.1) Pass
Flicker (x.4.2) Pass
Supply Voltage Dips (x.5) Pass
Short Interruption of Supply Voltage (x.6) Pass
Long Interruption of Supply Voltage (x.7) Pass
Temporary power frequency overvoltage (x.8) Pass
Supply Voltage Unbalance (x.10) Fail
Harmonic Voltage (x.11) Fail
Mains Signaling Voltage (x.13) Pass
IP112 Weekly report for
Sun, 14 Oct 2012 00:00:00 -0500 to Sat, 20 Oct 2012 23:59:59 -0500
Meter Name0000000028202519Serial
60HzNominal Frequency120vNominal Voltage (Un) 1/15

Real Time Power Quality Compliance Report
EN50160 Report Details
Meter Type Nexus 1500
Meter Name IP112
Serial Number 0000000028202519
Runtime Firmware 3.0000
Profile CRC 0x7E97
Profile Update Time 8/2/2012 3:27:29 PM
Hookup Wye
Nominal Frequency 60Hz
Supply Type Medium Voltage
Synchronous Connection No
Nominal Voltage 120v
Voltage Phase to Neutral Full Scale 14400.000
Voltage Phase to Phase Full Scale 24939.999
Mains Signaling Threshold 100.00
Phase AE Over-voltage Threshold 120.00
Phase BE Over-voltage Threshold 120.00
Phase CE Over-voltage Threshold 120.00
Allowed Long Interruptions in a Year 0
Rapid Voltage Change Source 10/12 cycles updated RMS
Unbalance Upper Limit 2%
Voltage A Dip Concern 10%
Voltage B Dip Concern 10%
Voltage C Dip Concern 10%
Source Data Version 1
Report Type Weekly
Report Date Range 10/14/2012 to 10/20/2012
IP112 Weekly report for
Sun, 14 Oct 2012 00:00:00 -0500 to Sat, 20 Oct 2012 23:59:59 -0500
Meter Name0000000028202519Serial
60HzNominal Frequency120vNominal Voltage (Un) 2/15

Real Time Power Quality Compliance Report
Section x.1 Power Frequency (Not Synchronized) PassUnder normal operating conditions for a non-synchronized system, the mean value of the fundamental frequency measured over 10 seconds shall be within ±2% of the nominal frequency for 95% of a week, and within ±15% for 100% of the year. This report gives the results over the course of the specified period.
Results Summary
Zone Required Ac tual Result
±2% 95% 100.00% Passed
±15% 100% 100.00% Passed
IP112 Weekly report for
Sun, 14 Oct 2012 00:00:00 -0500 to Sat, 20 Oct 2012 23:59:59 -0500
Meter Name0000000028202519Serial
60HzNominal Frequency120vNominal Voltage (Un) 3/15

Real Time Power Quality Compliance Report
Section x.3.x Supply Voltage Variations PassSupply voltage shall vary no more than ±10% of Un for 95% of the week. Situations like those arising from faults or voltage interruptions, the circumstances of which are beyond the reasonable control of the parties, are excluded.
Results Summary
Zone Required Volts A Volts B Volts C
±10% 95% 100.00% 100.00% 100.00%
IP112 Weekly report for
Sun, 14 Oct 2012 00:00:00 -0500 to Sat, 20 Oct 2012 23:59:59 -0500
Meter Name0000000028202519Serial
60HzNominal Frequency120vNominal Voltage (Un) 4/15

Real Time Power Quality Compliance Report
Section x.4.1 Rapid Voltage Changes PassA rapid voltage change of the supply voltage is mainly caused either by load changes in network users' installations, or by switching in the system. Under normal operating conditions, a rapid voltage change generally does not exceed ±4% Un, but a change of up to ±6% Un with a short duration might occur some times per day in some circumstances. Note: A negative voltage change resulting in a voltage less than 90% Un is considered a supply voltage dip. Note: The results displayed for ±6% Un are over the course of the week, and do not represent a single day. 7 ±6% changes are allowed in one week.
Results SummaryZone Required Volts A Volts B Volts C
±4% 100.00% 100.00% 100.00%
±6% 7 0 0 0
> ±6% 0 0 0 0
IP112 Weekly report for
Sun, 14 Oct 2012 00:00:00 -0500 to Sat, 20 Oct 2012 23:59:59 -0500
Meter Name0000000028202519Serial
60HzNominal Frequency120vNominal Voltage (Un) 5/15

Real Time Power Quality Compliance Report
Section x.4.2 Flicker PassFlicker is the impression of unsteadiness of visual sensation induced by a light stimulus whose luminance or spectral distribution fluctuates with time. Under normal operating conditions, during a period of one week, the long term flicker (PLT) severity caused by voltage fluctuations should be <= 1 for 95% of the time.
Results SummaryZone Required Volts A Volts B Volts C
<= 1 95% 100.00% 100.00% 100.00%
> 1 0.00% 0.00% 0.00%
IP112 Weekly report for
Sun, 14 Oct 2012 00:00:00 -0500 to Sat, 20 Oct 2012 23:59:59 -0500
Meter Name0000000028202519Serial
60HzNominal Frequency120vNominal Voltage (Un) 6/15

Real Time Power Quality Compliance Report
Section x.5 Supply Voltage Dips PassA Supply Voltage Dip is a sudden reduction of the supply voltage to a value between 90% and 1% of the declared voltage Uc, followed by a recovery after a short period of time.
Under normal operating conditions, the expected number of voltage dips in a year may be from a few tens up to one thousand. The majority of voltage dips have a duration less then 1s and a retained voltage greater then 10%. However, voltage dips with greater depth and duration can occur infrequently.
Results Summary
Zone Volts A Volts B Volts C
1% to 10% 0 0 0
10% to 15% 0 0 0
15% to 20% 0 0 0
20% to 30% 0 0 0
30% to 40% 0 0 0
40% to 50% 0 0 0
50% to 60% 0 0 0
60% to 70% 0 0 0
70% to 85% 0 0 0
85% to 90% 0 0 0
IP112 Weekly report for
Sun, 14 Oct 2012 00:00:00 -0500 to Sat, 20 Oct 2012 23:59:59 -0500
Meter Name0000000028202519Serial
60HzNominal Frequency120vNominal Voltage (Un) 7/15

Real Time Power Quality Compliance Report
Section x.6 Short Interruption of Supply Voltage Pass An Interruption of Supply Voltage is a condition in which the voltage at the supply terminals is lower than 1% of the declared voltage Uc. A Short Interruption is defined as an event which lasts for less than 3 minutes. Under normal operating conditions, the annual occurence of short interruptions ranges from a few tens to several hundreds. The duration of approximately 70% of the Short Interruptions may be less than one second.
Results SummaryZone Required Volts A Volts B Volts C
< 1sec 0 0 0
1sec to 3min 0 0 0
IP112 Weekly report for
Sun, 14 Oct 2012 00:00:00 -0500 to Sat, 20 Oct 2012 23:59:59 -0500
Meter Name0000000028202519Serial
60HzNominal Frequency120vNominal Voltage (Un) 8/15

Real Time Power Quality Compliance Report
Section x.7 Long Interruption of Supply Voltage Pass An Interruption of Supply Voltage is a condition in which the voltage at the supply terminals is lower than 1% of the declared voltage Uc. A Long Interruption is defined as an event which lasts for more than 3 minutes. Under normal operating conditions, the annual occurence of long interruptions ranges from 10 to 50, depending on the area. This location is allowed up to 0 long interruptions per year.
Results Summary
Zone Required Volts A Volts B Volts C
> 3min 0 0 0 0
IP112 Weekly report for
Sun, 14 Oct 2012 00:00:00 -0500 to Sat, 20 Oct 2012 23:59:59 -0500
Meter Name0000000028202519Serial
60HzNominal Frequency120vNominal Voltage (Un) 9/15

Real Time Power Quality Compliance Report
Section x.8 Temporary Power Frequency Overvoltage Pass A temporary power frequency overvoltage generally appears during a fault in the public distribution network, or in a network user's installation, and disappears when the fault is cleared. Under these conditions, the overvoltage may reach the value of the phase-to-phase voltage, due to a shift of the neutral point of the three-phase voltage system, the actual value depending upon the degree of load unbalance, and the remaining impedance between the faulty conductor and earth.
The expected value of an overvoltage event in a Medium Voltage system depends on the earthing of the system. In systems with a solidly or impedance earthed neutral, the overvoltage shall not generally exceed 170% Uc. In an isolated or resonant earthed system, the overvoltage shall not generally exceed 200% Uc
Results SummaryZone Required Vne Vae Vbe Vc e
< 1sec 0 0 0 0
1sec to 5sec 0 0 0 0
> 5sec 0% 0 0 0 0
IP112 Weekly report for
Sun, 14 Oct 2012 00:00:00 -0500 to Sat, 20 Oct 2012 23:59:59 -0500
Meter Name0000000028202519Serial
60HzNominal Frequency120vNominal Voltage (Un) 10/15
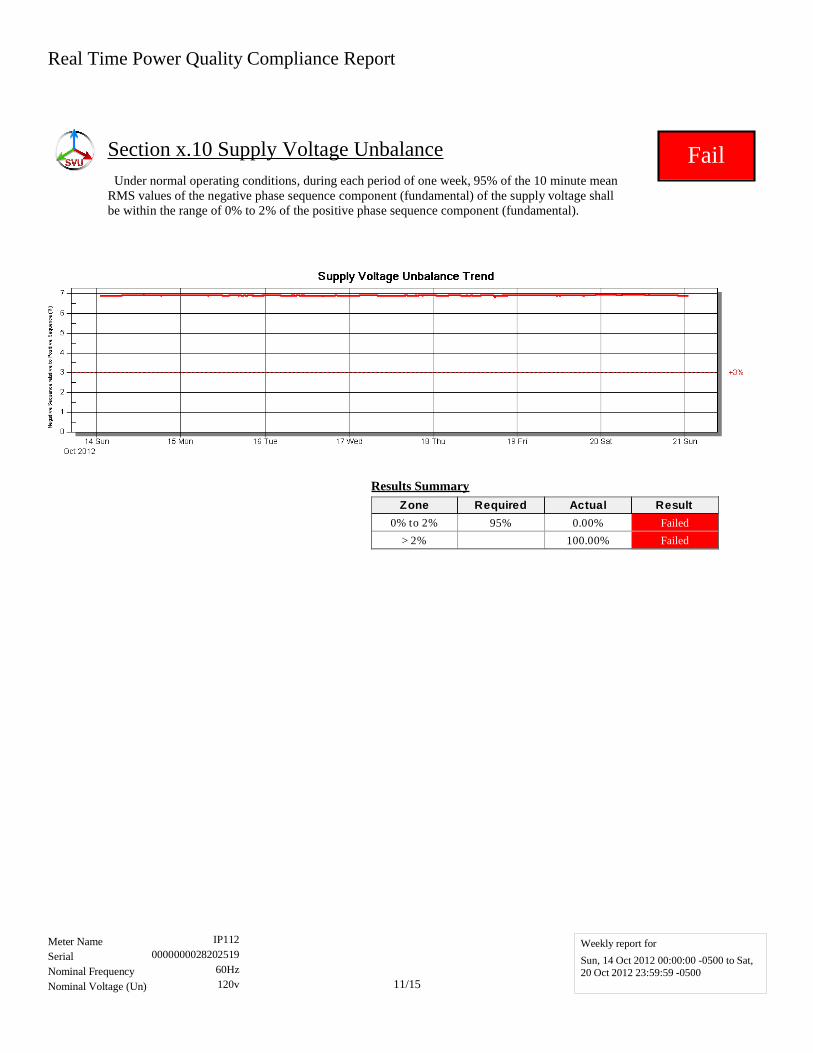
Real Time Power Quality Compliance Report
Section x.10 Supply Voltage Unbalance Fail Under normal operating conditions, during each period of one week, 95% of the 10 minute mean RMS values of the negative phase sequence component (fundamental) of the supply voltage shall be within the range of 0% to 2% of the positive phase sequence component (fundamental).
Results Summary
Zone Required Ac tual Result
0% to 2% 95% 0.00% Failed
> 2% 100.00% Failed
IP112 Weekly report for
Sun, 14 Oct 2012 00:00:00 -0500 to Sat, 20 Oct 2012 23:59:59 -0500
Meter Name0000000028202519Serial
60HzNominal Frequency120vNominal Voltage (Un) 11/15

Real Time Power Quality Compliance Report
Section x.11 Harmonic Voltage FailUnder normal operating conditions, during each period of one week, 95% of the 10 min mean RMS values of each individual harmonic voltage shall be less than or equal to the limit value given in the results table. Additionally, the THD of the supply voltage (including all harmonics up to the 40th order) shall be less than or equal to 8%.
Volts A Harmonic Summary
Zone Required Limit % Out
THD 0% 8% 0.00%
2nd <= 5% 2% 0.00%
3rd <= 5% 5% 0.00%
4th <= 5% 1% 0.00%
5th <= 5% 6% 0.00%
6th <= 5% 0.5% 0.00%
7th <= 5% 5% 0.00%
8th <= 5% 0.5% 0.00%
9th <= 5% 1.5% 0.00%
10th <= 5% 0.5% 0.00%
11th <= 5% 3.5% 0.00%
12th <= 5% 0.5% 0.00%
13th <= 5% 3% 0.00%
14th <= 5% 0.5% 0.00%
15th <= 5% 0.5% 0.00%
16th <= 5% 0.5% 0.00%
17th <= 5% 2% 0.00%
18th <= 5% 0.5% 0.00%
19th <= 5% 1.5% 0.00%
20th <= 5% 0.5% 0.00%
21st <= 5% 0.5% 0.00%
22nd <= 5% 0.5% 0.00%
23rd <= 5% 1.5% 0.00%
24th <= 5% 0.5% 0.00%
25th <= 5% 1.5% 0.00%
IP112 Weekly report for
Sun, 14 Oct 2012 00:00:00 -0500 to Sat, 20 Oct 2012 23:59:59 -0500
Meter Name0000000028202519Serial
60HzNominal Frequency120vNominal Voltage (Un) 12/15
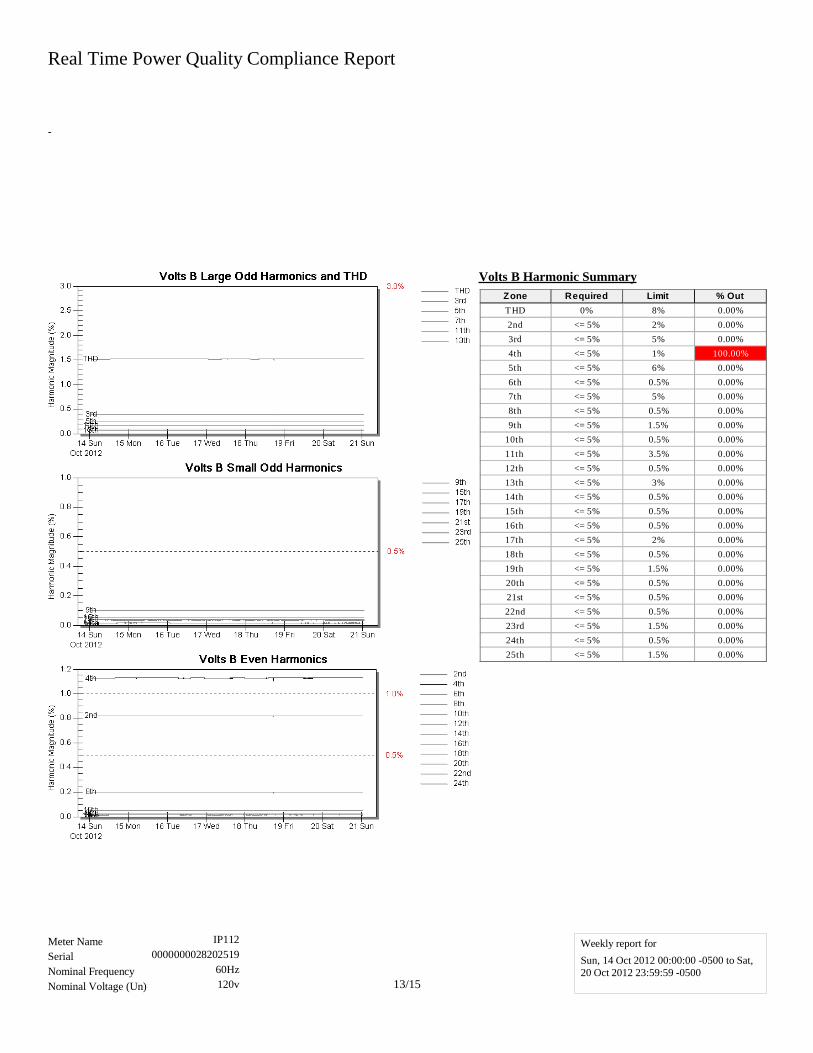
Real Time Power Quality Compliance Report
-
Volts B Harmonic Summary
Zone Required Limit % Out
THD 0% 8% 0.00%
2nd <= 5% 2% 0.00%
3rd <= 5% 5% 0.00%
4th <= 5% 1% 100.00%
5th <= 5% 6% 0.00%
6th <= 5% 0.5% 0.00%
7th <= 5% 5% 0.00%
8th <= 5% 0.5% 0.00%
9th <= 5% 1.5% 0.00%
10th <= 5% 0.5% 0.00%
11th <= 5% 3.5% 0.00%
12th <= 5% 0.5% 0.00%
13th <= 5% 3% 0.00%
14th <= 5% 0.5% 0.00%
15th <= 5% 0.5% 0.00%
16th <= 5% 0.5% 0.00%
17th <= 5% 2% 0.00%
18th <= 5% 0.5% 0.00%
19th <= 5% 1.5% 0.00%
20th <= 5% 0.5% 0.00%
21st <= 5% 0.5% 0.00%
22nd <= 5% 0.5% 0.00%
23rd <= 5% 1.5% 0.00%
24th <= 5% 0.5% 0.00%
25th <= 5% 1.5% 0.00%
IP112 Weekly report for
Sun, 14 Oct 2012 00:00:00 -0500 to Sat, 20 Oct 2012 23:59:59 -0500
Meter Name0000000028202519Serial
60HzNominal Frequency120vNominal Voltage (Un) 13/15

Real Time Power Quality Compliance Report
-
Volts C Harmonic Summary
Zone Required Limit % Out
THD 0% 8% 0.00%
2nd <= 5% 2% 0.00%
3rd <= 5% 5% 0.00%
4th <= 5% 1% 0.00%
5th <= 5% 6% 0.00%
6th <= 5% 0.5% 0.00%
7th <= 5% 5% 0.00%
8th <= 5% 0.5% 0.00%
9th <= 5% 1.5% 0.00%
10th <= 5% 0.5% 0.00%
11th <= 5% 3.5% 0.00%
12th <= 5% 0.5% 0.00%
13th <= 5% 3% 0.00%
14th <= 5% 0.5% 0.00%
15th <= 5% 0.5% 0.00%
16th <= 5% 0.5% 0.00%
17th <= 5% 2% 0.00%
18th <= 5% 0.5% 0.00%
19th <= 5% 1.5% 0.00%
20th <= 5% 0.5% 0.00%
21st <= 5% 0.5% 0.00%
22nd <= 5% 0.5% 0.00%
23rd <= 5% 1.5% 0.00%
24th <= 5% 0.5% 0.00%
25th <= 5% 1.5% 0.00%
IP112 Weekly report for
Sun, 14 Oct 2012 00:00:00 -0500 to Sat, 20 Oct 2012 23:59:59 -0500
Meter Name0000000028202519Serial
60HzNominal Frequency120vNominal Voltage (Un) 14/15
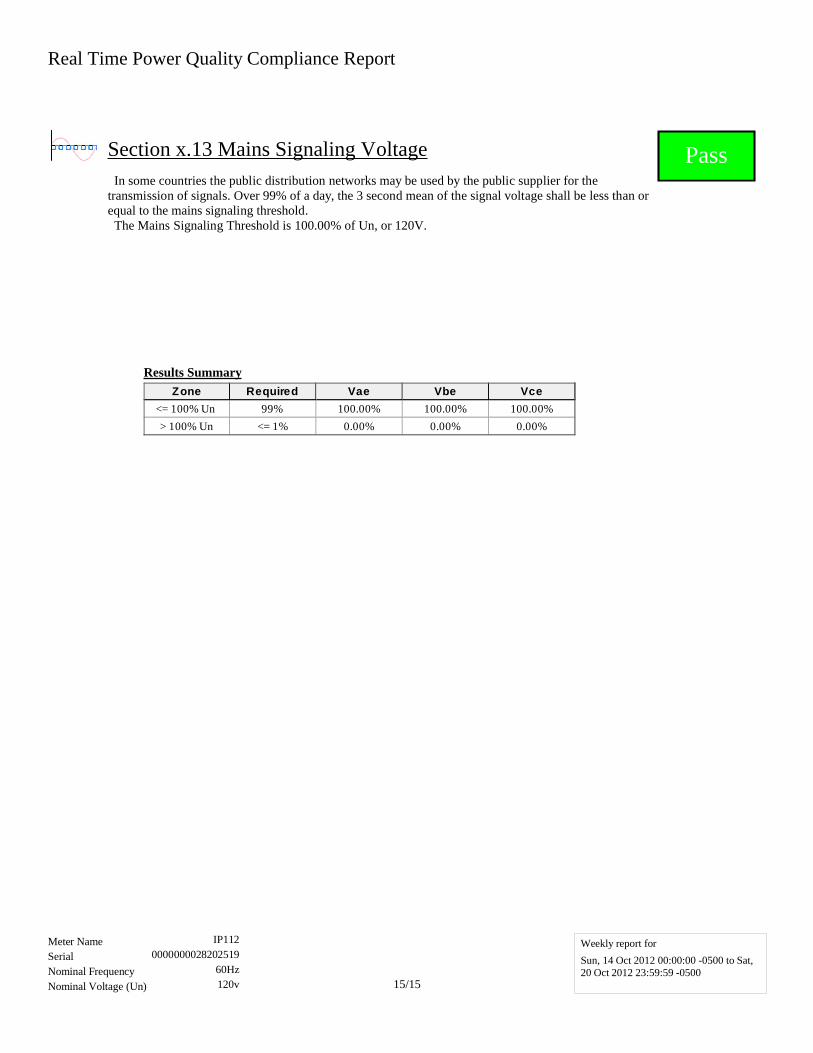
Real Time Power Quality Compliance Report
Section x.13 Mains Signaling Voltage Pass In some countries the public distribution networks may be used by the public supplier for the transmission of signals. Over 99% of a day, the 3 second mean of the signal voltage shall be less than or equal to the mains signaling threshold. The Mains Signaling Threshold is 100.00% of Un, or 120V.
Results Summary
Zone Required Vae Vbe Vce
<= 100% Un 99% 100.00% 100.00% 100.00%
> 100% Un <= 1% 0.00% 0.00% 0.00%
IP112 Weekly report for
Sun, 14 Oct 2012 00:00:00 -0500 to Sat, 20 Oct 2012 23:59:59 -0500
Meter Name0000000028202519Serial
60HzNominal Frequency120vNominal Voltage (Un) 15/15

Chapter 17EN50160/IEC61000-44-115 Flicker
17.1: Overview
Flicker is one of the standards of EN50160/IEC61000-4-30 discussed in Chapter 16, specifically insections 16.2.2.2 and 16.8.4. Flicker is the sensation that is experienced by the human visual systemwhen it is subjected to changes occurring in the illumination intensity of light sources. The primaryeffects of Flicker are headaches, irritability and sometimes epilepsy . IEC 61000-4-15, IEC61000-4-30 and former IEC 868 describe the methods used to determine Flicker severity . This phenomenonis strictly related to the sensitivity and the reaction of individuals. It can only be studied on a statis-tical basis by setting up experiments among lar ge groups of people.
17.2: Theory of Operation
Flicker can be caused by voltage variations which are caused by variable loads, such as arc furnaces,laser printers and microwave ovens. In order to model the eye brain change, which is a complex physiological process, the signal from the power network has to be processed while conforming withFigure 17.1 below.
• Block 1 consists of scaling circuitry and an automatic gain control function that normalizes inputvoltages to Blocks 2, 3 and 4. For the specified 50 Hz operation, the voltage standard is 230 VRMS.
• Block 2 recovers the voltage fluctuation by squaring the input voltage scaled to the referencelevel. This simulates the behavior of a lamp.
• Block 3 is composed of a cascade of two filters and a measuring range selector . In this implementation, a log classifier covers the full scale in use so the gain selection is automatic andnot shown here. The first filter eliminates the DC component and the double mains frequencycomponents of the demodulated output.
The configuration consists of a .05 Hz Low High Pass filter and a 6 Pole Butterworth Low Passfilter located at 35 Hz. The second filter is a weighting filter that simulates the response of thehuman visual system to sinusoidal voltage fluctuations of a coiled filament, gas-filled lamp (60W - 230 V). The filter implementation of this function is as specified in IEC 61000-4-15.
• Block 4 is composed of a squaring multiplier and a Low Pass filter . The Human FlickerSensation via lamp, eye and brain is simulated by the combined non-linear response of Blocks 2,3 and 4.
• Block 5 performs an online statistical cumulative probability analysis of the flicker level. Block5 allows direct calculation of the evaluation parameters Pst and Plt.
Flicker is computed using the three phase-to-neutral voltages in WYE configurations and the threephase-to-phase voltages when in DELTA. Evaluation occurs in the following forms: Instantaneous,Short Term or Long Term. Each form is detailed on the next page:
e Electro Industries/GaugeTech Doc # E107707 17-1

• Instantaneous Flicker EvaluationAn output of 1.00 from Block 4 corresponds to the Reference Human Flicker PerceptibilityThreshold for 50% of the population. This value is measured in Perceptibility Units (PU) and islabeled Pinst. This ia a real time value and it is continuously updated.
• Short Term Flicker EvaluationAn output of 1.00 from Block 5 (corresponding to the Pst value) corresponds to the conventionalthreshold of irritability per IEC 1000-3-3. In order to evaluate flicker severity , two parametershave been defined: one for the short term called Pst (defined in this section) and one for the longterm called Plt (defined in the next section).
The standard measurement time for Pst is 10 minutes. Pst is derived from the time at level statistics obtained from the level classifier in Block 5 of the flicker meter . The following formula is used:
Where the percentiles P(0.1), P(1), P(3), P(10), P(50) are the flicker levels exceeded for 0.1, 1, 2,20 and 50% of the time during the observation period. The suffix S in the formula indicates thatthe smoothed value should be used. The smoothed values are obtained using the following formulas:
P(1s) = (P(.7) + P(1) + P(1.5))/3P(3s) = (P(2.2) + P(3) + P(4))/3P(10s) = (P(6) + P(8) + P(10) + P(13) + P(17))/5P(50s) = (P(30) + P(50) + P(80))/3
The .3-second memory time constant in the flicker meter ensures that P(0.1) cannot changeabruptly and no smoothing is needed for this percentile.
• Long Term Flicker EvaluationThe 10-minute period on which the short-term flicker severity is based is suitable for short dutycycle disturbances. For flicker sources with long and variable duty cycles (e.g. arc furnaces) it isnecessary to provide criteria for long-term assessment. For this purpose, the long-term Plt isderived from the short-term values over an appropriate period. By definition, this is 12 short-term values of 10 minutes each over a period of 2 hours. The following formula is used:
Where Psti (i = 1, 2, 3, ...) are consecutive readings of the short-term severity P st.
SummaryFlicker = Changes in the illumination of light sources due to cyclical voltage variations.Pinst = Instantaneous flicker values in Perceptibility Units (PU).Pst = Value based on 10-minute analysis.Plt = Value based on 12 Pst values.
e Electro Industries/GaugeTech Doc # E107707 17-2
ssssst PPPPPP 5010311.0 08.028.00657.00525.00314.0 ++++=
3 1
3
N
PP
N
isti
lt
∑==

Measurement Procedure1. Original Signal with amplitude variations.2. Square demodulator.3. Weighted filter.4. Low pass filter 1
storder.
5. Statistical computing.
Data available
Pst, Pst Max, Pst Min values for long term recordingPlt, Plt Max, Plt Min values for long term recording
Figure 17.1: Simulation of Eye Brain Response
17.3: Setup
You must set up several parameters to properly configure Flicker .
1. Using Communicator EXT, from the Device Profile menu select Power Quality and Alarm Settings>EN50160/IEC61000-4-30 Flicker. You will see a screen like the one shown below .
e Electro Industries/GaugeTech Doc # E107707 17-3
Block 1 Block 2 Block 3
VoltageDetectorand GainControl
InputVoltageAdaptor
SquareLaw
Demodulator
High PassFilter(DC
Removal)
LowPass Filter
(CarrierRemoval
WeightingFilter
SquaringMultiplier
1stOrderSlidingMeanFilter
A/DConverterSampling
Rate>50Hz
Minimum64 level
Classifier
OutputInterface
Programming of short andlong observation periods
Block 4 Block 5
Simulation Of Eye Brain Response
Output RecordingInstantaneous Flicker in
Perceptibility Units(Pinst)
Output and Data DisplayPst Max/Min PstPlt Max/Min Plt
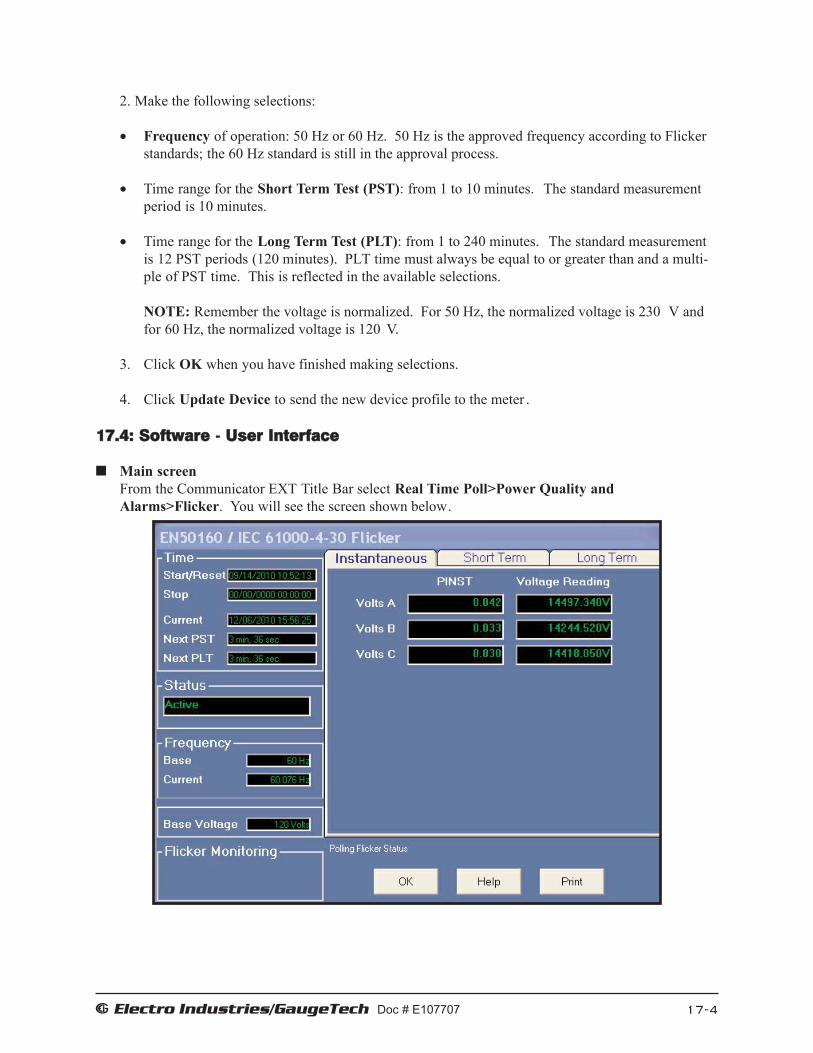
2. Make the following selections:
• Frequency of operation: 50 Hz or 60 Hz. 50 Hz is the approved frequency according to Flicker standards; the 60 Hz standard is still in the approval process.
• Time range for the Short Term Test (PST): from 1 to 10 minutes. The standard measurementperiod is 10 minutes.
• Time range for the Long Term Test (PLT): from 1 to 240 minutes. The standard measurementis 12 PST periods (120 minutes). PLT time must always be equal to or greater than and a multi-ple of PST time. This is reflected in the available selections.
NOTE: Remember the voltage is normalized. For 50 Hz, the normalized voltage is 230 V andfor 60 Hz, the normalized voltage is 120 V.
3. Click OK when you have finished making selections.
4. Click Update Device to send the new device profile to the meter .
17.4: Software - User Interface
Main screenFrom the Communicator EXT Title Bar select Real Time Poll>Power Quality andAlarms>Flicker. You will see the screen shown below.
e Electro Industries/GaugeTech Doc # E107707 17-4

This section describes the Main Screen functions. The available values (Instantaneous, Short Term,Long Term) will be described in the following sections.
TimeStart/Reset is the time when Flicker was started or reset. A Reset of Flicker causes the Max/Min
values to be cleared and restarts the Flicker Pst and Plt timers. A Start of Flicker is also equivalent to a Reset in that the PST and PLT are restarted and the Max/Min Values are cleared.
Stop corresponds to the time when Flicker is turned of f.Current is the current clock time.Next Pst is the countdown time to when the next Pst value is available.Next Plt is the countdown time to when the next Plt value is available.
StatusIndicates the current status. Active = On. Stopped = Off.
FrequencyBase is the current operating frequency selected by the user (50 or 60 Hz).Current is the real time frequency measurement of the applied voltage.Base Voltage is the normalized voltage for the selected frequency (230 V for 50 Hz or 120 V for 60 Hz).
Flicker MonitoringClicking on Stop causes Flicker to stop being processed and freezes all the current values. S top
Time is recorded and the current Max/Min Values are cleared Clicking on Start starts Flicker processing. Start Time is recorded.
NOTE: The Nexus® 1500 meter’s screen does not have a Stop or Start button.Clicking on Reset causes the Max/Min values to be cleared and restarts the Flicker Pst and Plt
timers.Click OK to exit the Flicker screen.Click Help for more information on this topic.
Instantaneous ReadingsRefer to the Instantaneous section of the Main screen above. If you are on the Short or Long Termscreens, click on the Instantaneous tab to display the Instantaneous screen. The PU values, Pinst forVoltage Inputs Va, Vb and Vc are displayed here and are continuously updated. The correspondingCurrent Voltage values for each channel are displayed for reference.
Short Term ReadingsClick on the Short Term tab to access the screen containing three groups of Pst readings. You willsee the screen shown on the next page.
Pst Readings Displayed• Current Pst values for Va, Vb and Vc and the time of computation.• Current Pst Max values for Va, Vb and Vc since the last reset and the time of the last reset.• Current Pst Min values for Va, Vb and Vc since the last reset and the time of the last reset.
e Electro Industries/GaugeTech Doc # E107707 17-5

Long Term ReadingsClick on the Long Term tab to access the Plt readings. You will see the screen shown on the nextpage.
Plt Readings Displayed• Current Plt values for Va, Vb and Vc and the time of computation.• Current Plt Max values for Va, Vb and Vc since the last reset and the time of the last reset.• Current Plt Min values for Va, Vb and Vc since the last reset and the time of the last reset.
e Electro Industries/GaugeTech Doc # E107707 17-6

17.5: Logging
The meter is capable of logging Flicker values in an independent log. When Flicker is on, entriesare made into the log in accordance with the times that associated values occur . Pst, Pst Max, PstMin, Plt, Plt Max, Plt Min, S tart/Reset and Stop times are all recorded. All values can be down-loaded to the Log Viewer where they are available for graphing or export to another program, suchas Excel. All Flicker values are predefined and cannot be changed.
17.6: Polling
The Pinst, Pst, Pst Max, Pst Min, Plt, Plt Max, Plt Min values are all capable of being polledthrough the Communications Port. Refer to the meter ’s Modbus and DNP Mappings for registerassignments and data definitions.
17.7: Log Viewer
From the Communicator EXT Log Viewer screen, using the menus at the top of the Log Viewerscreen, select a meter, time ranges and values to access. Select Flicker .
The values and the associated time stamps (when the values occurred) are displayed in a grid box.Use the buttons at the bottom of the screen to create a graph or export the data to another program.Max and Min values are only displayed; they cannot be graphed. But, Max and Min values areavailable for export.
Graphed values include Pst and Plt Va, Vb and Vc.Displayed values include Pst and Plt Max and Min for Va, Vb and Vc.
e Electro Industries/GaugeTech Doc # E107707 17-7

17.8: Performance Notes
Pst and Plt average time are synchronized to the clock (e.g. for a 10 minute average, the times willoccur at 0, 10, 20, etc.). The actual time of the first average can be less than the selected period toallow for initial clock synchronization.
If the wrong frequency is chosen (e.g. 50Hz selection for a system operating at 60Hz), Flicker willstill operate but the values computed will not be valid. Select carefully .
User settings are stored. If Flicker is on and power is removed from the meter , Flicker will still beon when power returns. This can cause data gaps in the logged data.
The Max and Min values are stored and are not lost if the unit is powered down.
Flicker meets the requirements of IEC 61000-4-15, EN61000, and former IEC 868. Refer to those specifications for more details, if needed.
Operation is at 230V for 50Hz and 120V for 60Hz as per specification. If the input voltage is different, the system will normalize it to 230V or 120V for computational purposes.
e Electro Industries/GaugeTech Doc # E107707 17-8

Chapter 18
Customizing DNP V3.0 Configuration for Nexus® 1252/1262/1272 and 1500 Meters
E Electro Industries/GaugeTech DOC # E107707 18-1
A Nexus® 1252/1262/1272 or 1500 meter can measure more than 3000 DNP Static Points, but not all points can be polled at the same time. In order for the meter to have the appropriate data, you should customize the DNP Point Map via Communicator EXT. Up to 250 points of Event Data can be created in the Nexus® meter. Refer to DNP V3.00 Level 2 Protocol Assignments for Nexus® 1252, 1262 & 1272 Meters for more details. Refer to chapters 3 and 4 of this manual for details on configuring DNP 3.0 for Nexus® 1250, 1260 and 1270 meters. 18.1: Connecting to Communicator EXT
1. Open Communicator EXT software by double-clicking its icon or by selecting Start>All
Programs>Electro Industries>Communicator EXT. 2. Connect to the meter in one of the following ways:
• Click on Quick Connect, check the settings and click Connect • Click on Connection Manager, select a location and click Connect.
NOTE: See Chapter 2 of this manual for complete connection instructions.
3. When a connection is made, the Status Bar opens. Click OK. 4. Click the Profile icon. A pop-up window tells you that data is being retrieved, and then the Device Profile
screen opens.
5. Click General Settings> DNP Custom Classes Map > DNP Level 2. You will see the DNP Custom Mapping screen. Click on the tabs at the top of the screen to move between the following Settings screens.
18.2: Binary Input (Object 1)

E Electro Industries/GaugeTech DOC # E107707 18-2
A Nexus® meter can use up to 64 Binary Input Points. Values available for Binary Input use can be found in the DNP Object Mapping. Only Class 0 is used when polling Binary Input (Object 1) Data. Class 1, 2 or 3 is used when polling Binary Input Change (Object 2) Data.
Line, Point, Description Double-click on the box under Description to Add, Delete or Modify DNP Points to the screen above. A pull-down window will appear. Choose a Type (of reading) and a Channel and click OK. The corresponding numbers for the selected reading and channel will appear in the Line and Point columns. Line and Point Numbers for a Binary Input value can also be found in the DNP Object Mapping (Chapter 7 of the DNP V3.00 Level 2 Protocol Assignments for Nexus® 1252, 1262 & 1272 Meters). For example, 1 Cycle High Speed Input Delta and Current State has Line Number 16 and Point Number 0 in the DNP Object Mapping. Write those numbers into the Object 1 – Binary Input window of the Communicator EXT. When the Line and Point Numbers are written, the software fills in the description on the screen. Repeat for each desired Binary Input Point. Update the device. The Nexus® meter will scan those points every second. Object 2 Any DNP Static Point can be configured to create a DNP Event Points. Class Assignments on the Object 2 screen are used to configure Binary Input Change Event Points. In order to create Event Data, Object 2 Points must be assigned to Class 1, 2 or 3. Each point can have a different Class Assignment.
• The Clear All Button clears all assigned items on all the tabs. • The Clear Button clears only the items on the current tab view.
18.3: Analog Input (Object 30)
A Nexus® meter can use up to 64 Analog Input points. Values available for Analog Input use can be found in the DNP Object Mapping. Only Class 0 is used when polling Analog Input (Object 30) Data. Class 1, 2 or 3 is used when polling Analog Change Event (Object 32) Data.
Line, Point, Description Double-click on the box under Description. A pull-down window will appear. Choose a Type (of reading) and a Channel and click OK. The corresponding numbers for the selected reading and channel will appear in the Line and Point columns. Line and Point Numbers can also be found in the DNP Object Mapping (Chapter 7 of the DNP V3.00 Level 2 Protocol Assignments for Nexus 1252, 1262 & 1272 Meters).
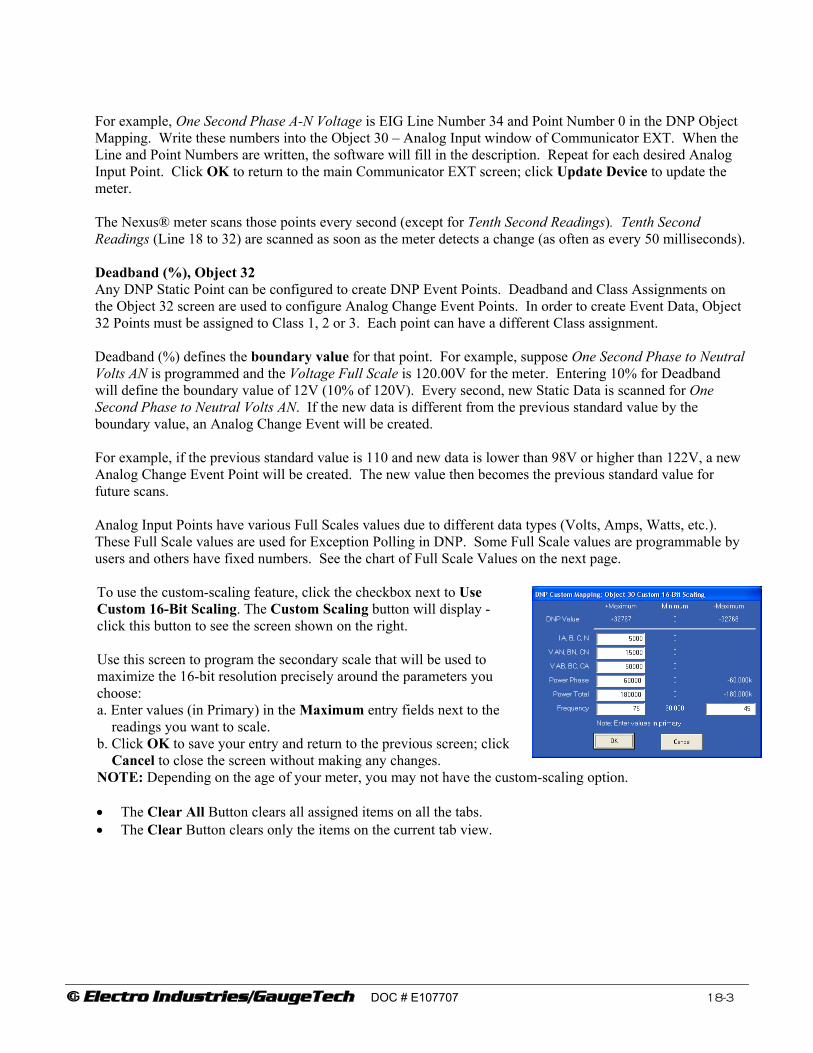
E Electro Industries/GaugeTech DOC # E107707 18-3
For example, One Second Phase A-N Voltage is EIG Line Number 34 and Point Number 0 in the DNP Object Mapping. Write these numbers into the Object 30 – Analog Input window of Communicator EXT. When the Line and Point Numbers are written, the software will fill in the description. Repeat for each desired Analog Input Point. Click OK to return to the main Communicator EXT screen; click Update Device to update the meter. The Nexus® meter scans those points every second (except for Tenth Second Readings). Tenth Second Readings (Line 18 to 32) are scanned as soon as the meter detects a change (as often as every 50 milliseconds). Deadband (%), Object 32 Any DNP Static Point can be configured to create DNP Event Points. Deadband and Class Assignments on the Object 32 screen are used to configure Analog Change Event Points. In order to create Event Data, Object 32 Points must be assigned to Class 1, 2 or 3. Each point can have a different Class assignment. Deadband (%) defines the boundary value for that point. For example, suppose One Second Phase to Neutral Volts AN is programmed and the Voltage Full Scale is 120.00V for the meter. Entering 10% for Deadband will define the boundary value of 12V (10% of 120V). Every second, new Static Data is scanned for One Second Phase to Neutral Volts AN. If the new data is different from the previous standard value by the boundary value, an Analog Change Event will be created. For example, if the previous standard value is 110 and new data is lower than 98V or higher than 122V, a new Analog Change Event Point will be created. The new value then becomes the previous standard value for future scans. Analog Input Points have various Full Scales values due to different data types (Volts, Amps, Watts, etc.). These Full Scale values are used for Exception Polling in DNP. Some Full Scale values are programmable by users and others have fixed numbers. See the chart of Full Scale Values on the next page. To use the custom-scaling feature, click the checkbox next to Use Custom 16-Bit Scaling. The Custom Scaling button will display - click this button to see the screen shown on the right. Use this screen to program the secondary scale that will be used to maximize the 16-bit resolution precisely around the parameters you choose: a. Enter values (in Primary) in the Maximum entry fields next to the readings you want to scale. b. Click OK to save your entry and return to the previous screen; click Cancel to close the screen without making any changes. NOTE: Depending on the age of your meter, you may not have the custom-scaling option. • The Clear All Button clears all assigned items on all the tabs. • The Clear Button clears only the items on the current tab view.

E Electro Industries/GaugeTech DOC # E107707 18-4
Full Scale values are 4-byte integer numbers. The units are as follows:
Analog Input Full Scale Unit
I A, B, C, Nc Programmable 1/65536 Amps
I Nm Programmable 1/65536 Amps
V AN, BN, CN Programmable 1/65536 Volts
V AB, BC, CA Programmable 1/65536 Volts
V Aux Programmable 1/65536 Volts
Power Phase Programmable 1/65536 Watts
Power Total Programmable 1/65536 Watts
Frequency Programmable 1/65536 Hz
Power Factor 4000 0.001 PF
Angles 18000 0.001 PF
Percent 10000 0.01 %
K-Factor 500 0.01
TOU Ratio N/A N/A
Temperature 10000 0.01
Flicker 65536 0.0001
In Interval 1000 1000
Day of Week 6 1
Sequence 1 1
Status 100 1
Avg Select 100 1
Delay 100 1
Log Index 100 1
Countdown 100 1 For example, in order to find out if there is new log data, use a Log Index Number. One of the Log Index Numbers (Last Index) will increase when a new log is created. In Object 30, Program Last Log Record Index: Waveform Log (Line 499, Point 7). Input Deadband 1.00% and assign a Class. The exception data will be created when the Index Number increases by one.

E Electro Industries/GaugeTech DOC # E107707 18-5
18.4: Binary Counter (Object 20)
A Nexus® meter can use up to 8 Binary Counter Points. Values available for Binary Counter use can be found in the DNP Object Mapping. Only Class 0 is used when polling Binary Counter (Object 20) Data and Frozen Counter (Object 21) Data. Class 1, 2 or 3 is used when polling Counter Event (Object 22) Data and Frozen Counter Event (Object 23) Data.
Line, Point, Description Double-click on the box under Description to Add, Delete or Modify DNP Points. A pull-down window appears. Choose a Type (of reading) and a Channel and click OK. The corresponding numbers for the selected data and channel will appear in the Line and Point columns. Line and Point Numbers can also be found in the DNP Object Mapping (Chapter 7 of DNP V3.00 Level 2 Protocol Assignments for Nexus 1252, 1262 & 1272 Meters). For example, VA hour has Line Number 133 and Point Number 0 in the DNP Object Mapping. Write those numbers into the Object 20- Binary Counter window of Communicator EXT. When the Line and Point Numbers are written, the software fills in the description on the screen. Repeat for each desired Binary Counter Point. Update the device. The Nexus® meter scans those points every second. Scaling A Nexus® meter can measure its Binary Counter value using up to a 16-digit number (0 to 9,999,999,999,999,999). DNP Binary Counter Points use up to 32 bits. That means that the range is 0 to 4,294,967,295 (0x0FFFFFFFF). This maximum number is only a 10-digit number. In order to deal with a 16-digit number, Scaling is necessary. Scaling is used to select a unit in powers of 10: 1 = x10, 2 = x100 and so on. The Scaling value can be 0 to 15. For example, if the value inside the meter is 3,000,000 and a Scaling value of 2 (x100) is used, the Binary Counter value will be reported as 30000. The actual value is 30000x100 = 3,000,000.

E Electro Industries/GaugeTech DOC # E107707 18-6
Delta, Object 22 Any DNP Static Point can be configured to create DNP Event Points. Delta and Class Assignments on the Object 22 screen are used to configure Counter Change Event Points. In order to create Event Data, Object 22 must be assigned to Class 1, 2 or 3. Each point can have a different Class Assignment. The Delta value defines the boundary value for that point. For example, suppose VA hour is programmed and the Delta is 5. That represents 5 increments from the returned 32-bit Binary Counter value. Every second, new Static Data is scanned for VA hour. If new data is different from the previous standard value by the Delta value, the Counter Change Event Data will be created. That means, if the previous standard polled value is 50000 VA hour and if the VA hour reading increases to 50005, it will create a Counter Change Event Point for VA hour and 50005 VA hour will become the previous standard value for the next Static Data. The Scaling setting for a point also applies to the Delta value. If Delta is 5 and Scaling is 2, this indicates a 500-count change in the internal representation. Object 23 Frozen Analog Event (Object 23) will be created if Object 23 is assigned to Class 1, 2 or 3.
Click OK to save the new settings.
• The Clear All Button clears all assigned items on all the tabs. • The Clear Button clears only the items on the current tab view.
18.5: Binary Output (Object 10)
Class 0 is used when polling Binary Output (Object 10) Data. External Relay Output Modules can be attached to the Nexus® 1252/1262/1272 meter. Up to 4 Relay Output Modules can be attached and each Relay Module has 4 Relay Outputs.

E Electro Industries/GaugeTech DOC # E107707 18-7
To enable control of a Relay by DNP, check its box. If unchecked, the relay will not be controlled by DNP. The Master in DNP protocol can control 16 relays. In order to do that, each relay box should be checked and the Nexus® meter should be updated with this profile. Check the box for the Reset Enable you want to control through DNP.
The Master not only controls relays but also can do various resets. Relay Status and Reset Status can be polled using Object 10. For Controlling Relays and performing Resets, Object 12 is used. Each box should be checked in order for the Master to do the reset.
Example 1 - The Master can control Relay 1 by sending this message (Meter Address 1, Master Address 10):
05 64 18 C4 01 00 0A 00 6C 1A C0 C0 05 06 01 17 01 00 03 01 01 00 00 00 00 00 3B EF 00 00 00 FF FF
Example 2 – The Master can control Relay 2 by sending this message: 05 64 18 C4 01 00 0A 00 6C 1A C0 C1 05 0C 01 17 01 01 03 01 01 00 00 00 00 00 E2 5F 00 00 00 FF FF Example 3 – The Master can do a Log Reset by sending this message: 05 04 18 C4 01 00 0A 00 6C 1A
C0
C2 05 0C 01 17 01 10 03 01 01 00 00 00 00 00 C5 1B 00 00 00 FF FF

E Electro Industries/GaugeTech DOC # E107707 18-8
Example 4 – The Master can do an Energy Reset by sending this message: 05 04 18 C4 01 00 0A 00 6C 1A
C0 C3 05 0C 01 17 01 13 03 01 01 00 00 00 00 00 E7 5B 00 00 00 FF FF
NOTE: The preceding examples use Function 5 (Direct Operate Relay) and Qualifier 0x17. Click OK to save the new settings.
• The Clear All Button clears all assigned items on all the tabs. • The Clear Button clears only the items on the current tab view.
The Point Numbers for Relays and Resets are as follows:
Points Assignment
0 Relay 1 1 Relay 2 2 Relay 3 3 Relay 4 4 Relay 5 5 Relay 6 6 Relay 7 7 Relay 8 8 Relay 9 9 Relay 10
10 Relay 11 11 Relay 12 12 Relay 13 13 Relay 14 14 Relay 15 15 Relay 16 16 Log Reset 17 Reset of Maximum Thermal Average 18 Reset of Minimum Thermal Average 19 Energy Reset 20 Reset Time of Use Current Frozen Register and Current Month 21 Manual Waveform Capture 22 Reset Internal Input Accumulations and Aggregations 23 Reset Unit to Boot Mode – Default Communication Settings
NOTE: Point 23 is a temporary switch to Boot in Modbus Protocol. This switch times out.
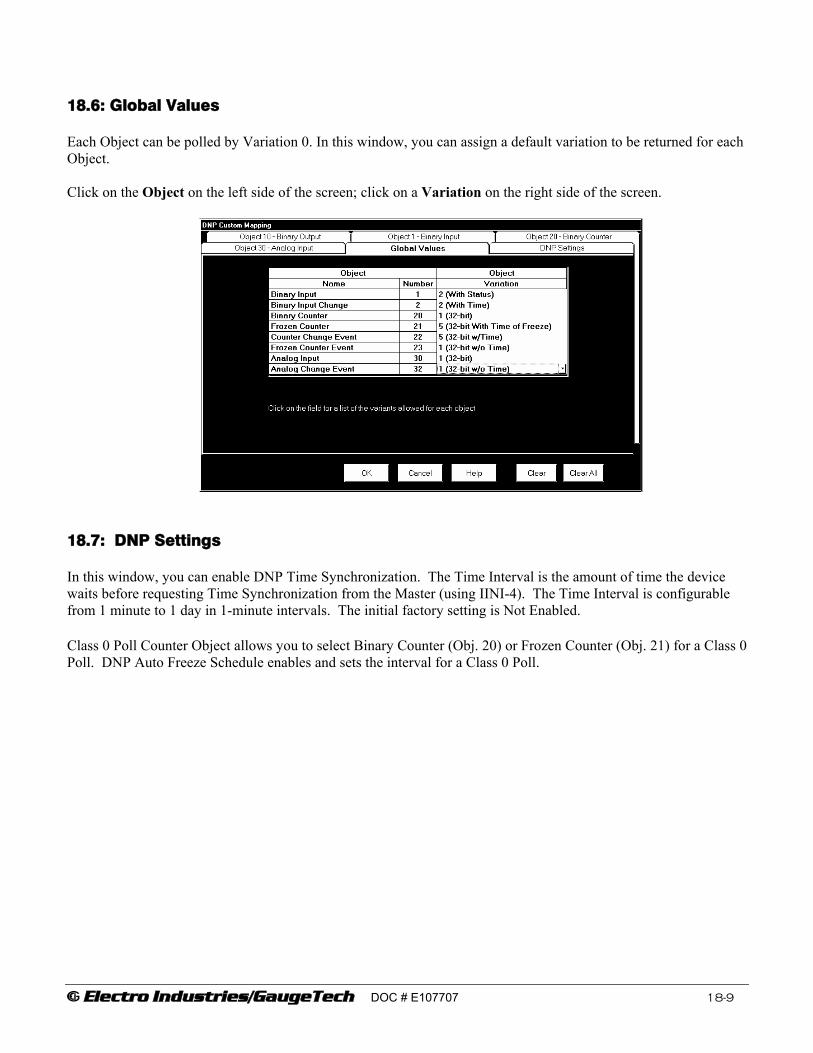
E Electro Industries/GaugeTech DOC # E107707 18-9
18.6: Global Values
Each Object can be polled by Variation 0. In this window, you can assign a default variation to be returned for each Object. Click on the Object on the left side of the screen; click on a Variation on the right side of the screen.
18.7: DNP Settings
In this window, you can enable DNP Time Synchronization. The Time Interval is the amount of time the device waits before requesting Time Synchronization from the Master (using IINI-4). The Time Interval is configurable from 1 minute to 1 day in 1-minute intervals. The initial factory setting is Not Enabled. Class 0 Poll Counter Object allows you to select Binary Counter (Obj. 20) or Frozen Counter (Obj. 21) for a Class 0 Poll. DNP Auto Freeze Schedule enables and sets the interval for a Class 0 Poll.

E Electro Industries/GaugeTech DOC # E107707 18-10
Click OK to save the new settings.
• The Clear All Button clears all assigned items on all the tabs. • The Clear Button clears only the items on the current tab view.
Doc# E107707 19 - 1
19: Nexus® 1500 Meter
Electro Industries/GaugeTechThe Leader In Power Monitoring and Smart Grid SolutionsElectro Industries/GaugeTechThe Leader In Power Monitoring and Smart Grid Solutions
19: Nexus® 1500 Meter
19.1: Overview
Communicator EXT enables you to configure a Nexus® 1500 meter's programmable
settings, which are stored in the unit's Device Profile. See Chapter 2 for instructions
on connecting to a meter with Communicator EXT.
NOTE: The Nexus® 1500 meter requires the installation of Microsoft®.Net
Framework® 2.0 for Log Retrieval. This software is included in the Communicator EXT
installation CD.
19.2: Basic Configuration Steps
1. Retrieve the Nexus® 1500 meter's Device Profile (Section 19.3).
2. Configure the programmable settings stored in the Device Profile (Sections 19.4-
19.9).
3. Send the new Device Profile back to the meter (Section 19.3).
NOTE: If you click the Save, Load or Update buttons, you must have a unique Meter
Destination label so that the file is saved, loaded or updated to the intended device.

Doc# E107707 19 - 2
19: Nexus® 1500 Meter
Electro Industries/GaugeTechThe Leader In Power Monitoring and Smart Grid SolutionsElectro Industries/GaugeTechThe Leader In Power Monitoring and Smart Grid Solutions
19.3: Retrieve and Send Device Profiles
1. From the Communicator EXT Main screen, click the Profile icon, or select Tools>
Edit Current Device Profile. Communicator EXT retrieves the programmable
settings from the currently connected Nexus® 1500 meter. You will see the
Nexus® 1500 Device Profile screen.
2. Click on the + in front of each group of settings to view the submenu of settings for
the group. Click on the submenu items to view/change the current settings for the
meter. (See Sections 19.4-19.8 for details on editing each setting.)
3. After you finish configuring any or all of the programmable settings, use the But-
tons at the bottom of the screen to execute the following tasks:
• Click Update Device to implement Device Profile changes. This sends the new,
edited Device Profile to the meter. You must update the Nexus® 1500
meter's Device Profile for any changes to the programmable settings to
take effect. When you click Update Device, the meter retrieves the
programmable settings and then displays the following screen.
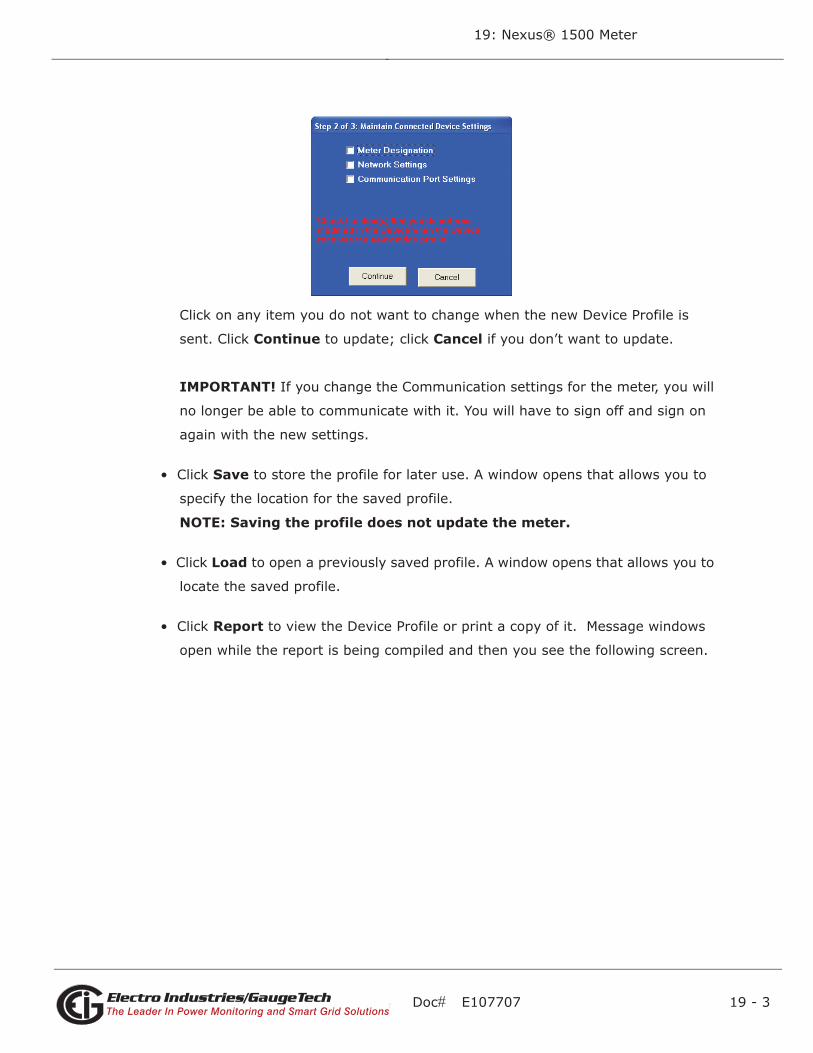
Doc# E107707 19 - 3
19: Nexus® 1500 Meter
Electro Industries/GaugeTechThe Leader In Power Monitoring and Smart Grid SolutionsElectro Industries/GaugeTechThe Leader In Power Monitoring and Smart Grid Solutions
Click on any item you do not want to change when the new Device Profile is
sent. Click Continue to update; click Cancel if you don’t want to update.
IMPORTANT! If you change the Communication settings for the meter, you will
no longer be able to communicate with it. You will have to sign off and sign on
again with the new settings.
• Click Save to store the profile for later use. A window opens that allows you to
specify the location for the saved profile.
NOTE: Saving the profile does not update the meter.
• Click Load to open a previously saved profile. A window opens that allows you to
locate the saved profile.
• Click Report to view the Device Profile or print a copy of it. Message windows
open while the report is being compiled and then you see the following screen.
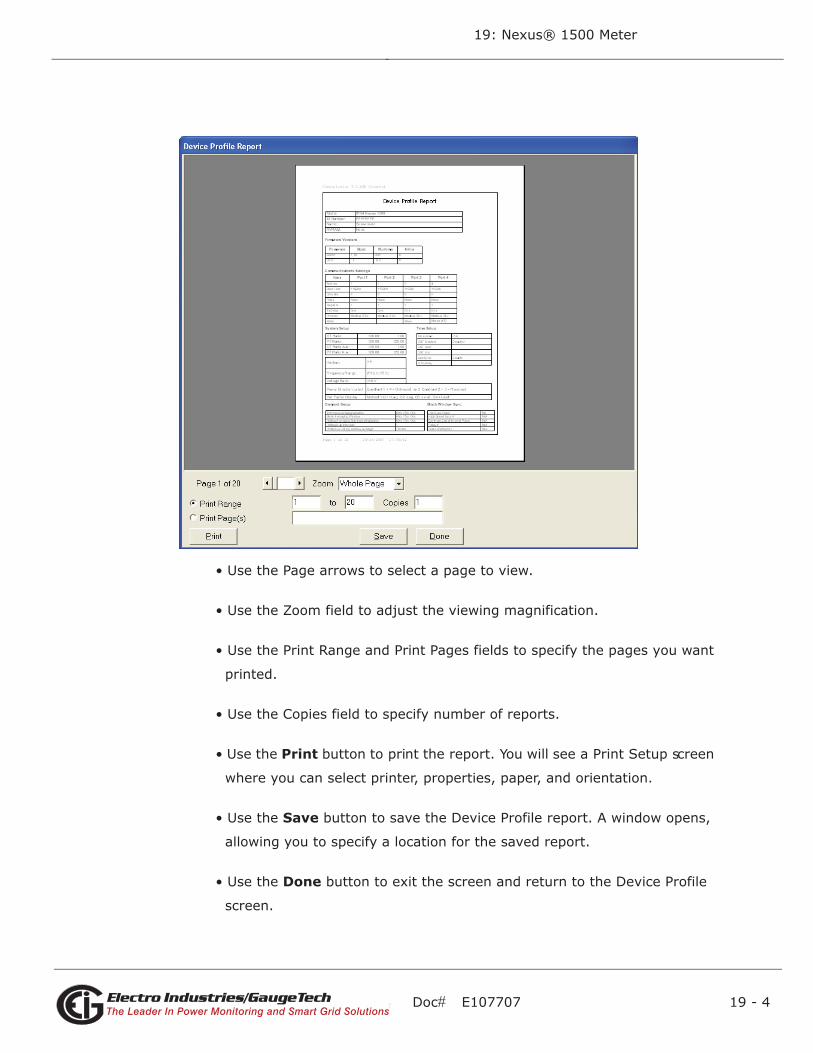
Doc# E107707 19 - 4
19: Nexus® 1500 Meter
Electro Industries/GaugeTechThe Leader In Power Monitoring and Smart Grid SolutionsElectro Industries/GaugeTechThe Leader In Power Monitoring and Smart Grid Solutions
• Use the Page arrows to select a page to view.
• Use the Zoom field to adjust the viewing magnification.
• Use the Print Range and Print Pages fields to specify the pages you want
printed.
• Use the Copies field to specify number of reports.
• Use the Print button to print the report. You will see a Print Setup screen
where you can select printer, properties, paper, and orientation.
• Use the Save button to save the Device Profile report. A window opens,
allowing you to specify a location for the saved report.
• Use the Done button to exit the screen and return to the Device Profile
screen.

Doc# E107707 19 - 5
19: Nexus® 1500 Meter
Electro Industries/GaugeTechThe Leader In Power Monitoring and Smart Grid SolutionsElectro Industries/GaugeTechThe Leader In Power Monitoring and Smart Grid Solutions
19.4: Device Profile General Settings
1. From the Device Profile screen (see Section 19.3), double-click on the General
Settings line or click on the + button next to it. All of the settings in the General
Settings group are listed.
2. Click on the programmable setting you want to modify. The following sections
explain the settings in the order in which they appear in the General Settings
menu, shown below.
19.4.1: CT and PT Ratios and System Hookup
1. From the Device Profile screen (see Section 19.3), click the + button next to Gen-
eral Settings, then click the + button next to CT, PT Ratios and System Hookup.
You will see the submenu shown below.
This submenu displays the current Device Profile's settings for CT, PT ratios,
connection type, and Operational Frequency range. The values shown here are the
default meter settings.

Doc# E107707 19 - 6
19: Nexus® 1500 Meter
Electro Industries/GaugeTechThe Leader In Power Monitoring and Smart Grid SolutionsElectro Industries/GaugeTechThe Leader In Power Monitoring and Smart Grid Solutions
2. Double-click on any of the settings. You will see the CT and PT Ratios screen.
3. Make changes to this screen according to your application requirements.
NOTE: When you change a PT or CT Ratio, Communicator EXT updates the
corresponding Full Scale value entered in the Limit and Waveform Full Scales
setting. When you click OK on this screen, Communicator EXT opens the Limit &
Waveform Full Scales screen so that you can verify the settings (see Section
19.4.2).
• Enter Primary and Secondary Current, Voltage, and VAux.
• Using the pull-down menu, choose the Hookup mode that matches the connec-
tion you have to the Nexus® 1500 meter. Choose from the following:
• Wye
• Delta 3 CTs
• Delta 2 CTs
• 2.5 Element Wye

Doc# E107707 19 - 7
19: Nexus® 1500 Meter
Electro Industries/GaugeTechThe Leader In Power Monitoring and Smart Grid SolutionsElectro Industries/GaugeTechThe Leader In Power Monitoring and Smart Grid Solutions
• 4 Wire Delta.
NOTE: See the Nexus® 1500 Meter Installation and Operation Manual for
connection diagrams.
• The Operational Frequency Range for the meter is 45Hz to 69Hz: this field is
display only.
4. Click OK. If changes have been made, a message window opens asking you to
verify that the Limit Full Scales are correct.
5. Click OK. The Limit and Waveform Full Scales screen opens (see Section 19.4.2).
6. To implement any changes, click the Update Device button to send the new
profile to the meter.
NOTE: You will see a warning message that logs will be reset, and you will be given
the opportunity to retrieve the logs before they are cleared. Resetting the logs
prepares the meter for placement in a new installation or change of the meter
Transformers.
19.4.2: Limit and Waveform Full Scales
All Limit and Waveform settings (see Sections 19.6.1 and 19.6.4, respectively) are
based on a percentage of the Full Scale. Full Scales are based on the CT and PT ratios
(see Section 19.4.1).
Set the CT and PT ratios first; Communicator EXT automatically recalculates the Full
Scales every time the CT and PT ratios change and presents them for your
verification.
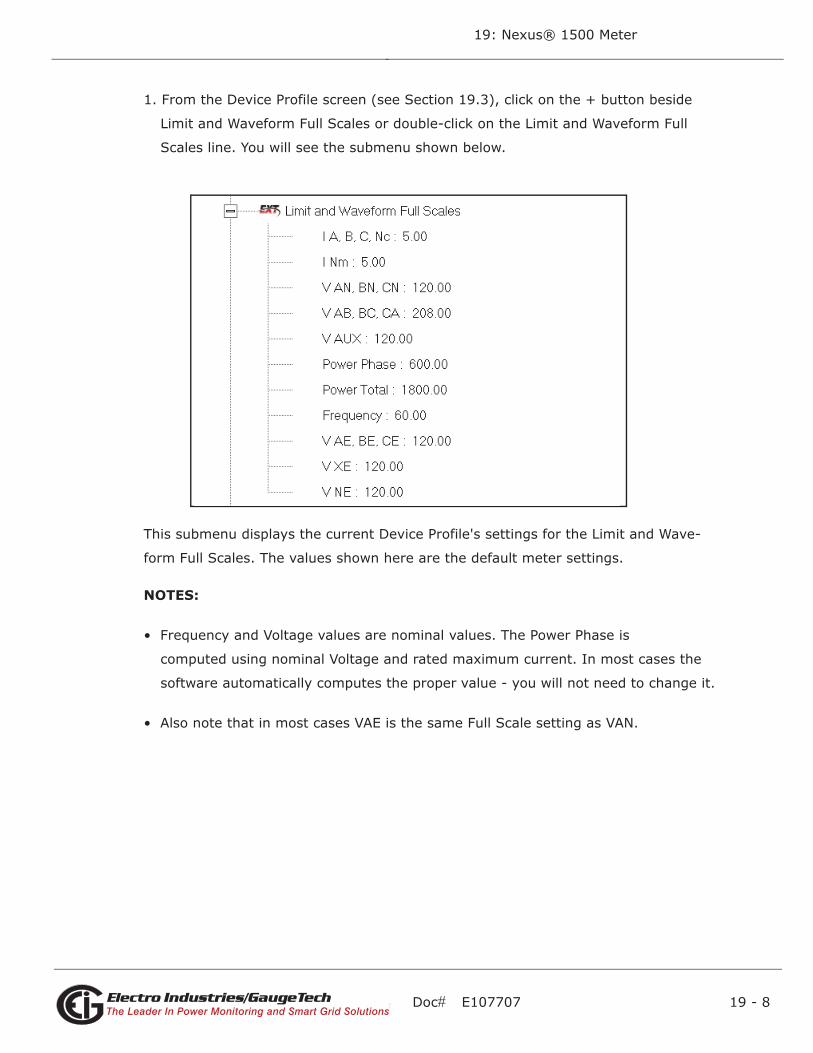
Doc# E107707 19 - 8
19: Nexus® 1500 Meter
Electro Industries/GaugeTechThe Leader In Power Monitoring and Smart Grid SolutionsElectro Industries/GaugeTechThe Leader In Power Monitoring and Smart Grid Solutions
1. From the Device Profile screen (see Section 19.3), click on the + button beside
Limit and Waveform Full Scales or double-click on the Limit and Waveform Full
Scales line. You will see the submenu shown below.
This submenu displays the current Device Profile's settings for the Limit and Wave-
form Full Scales. The values shown here are the default meter settings.
NOTES:
• Frequency and Voltage values are nominal values. The Power Phase is
computed using nominal Voltage and rated maximum current. In most cases the
software automatically computes the proper value - you will not need to change it.
• Also note that in most cases VAE is the same Full Scale setting as VAN.

Doc# E107707 19 - 9
19: Nexus® 1500 Meter
Electro Industries/GaugeTechThe Leader In Power Monitoring and Smart Grid SolutionsElectro Industries/GaugeTechThe Leader In Power Monitoring and Smart Grid Solutions
2. Double-click any of the settings. You will see the Limit and Waveform Full Scales
screen.
3. Enter the Full Scale for each parameter.
NOTES:
• The Limits and Waveform settings (Sections 19.6.1 and 19.6.4, respectively) are
based on a percentage of the Full Scales entered here.
• Communicator EXT automatically recalculates the Full Scale Voltages, currents
and power every time the CT and PT ratios change. However, frequency is not
changed, even if the operational frequency range is changed. Frequency can
only be changed on this screen.
• Power Phase is the amount of power per each phase; Power Total is the power of
all phases combined.
4. When all changes are entered, click OK to return to the main Device Profile screen.
For any changes to take effect, you must click the Update Device button to send
the new profile to the meter.

Doc# E107707 19 - 10
19: Nexus® 1500 Meter
Electro Industries/GaugeTechThe Leader In Power Monitoring and Smart Grid SolutionsElectro Industries/GaugeTechThe Leader In Power Monitoring and Smart Grid Solutions
19.4.3: Time Settings
To edit a Device Profile's Time settings:
1. From the Device Profile screen (see Section 19.3), click on the + button next to
General Settings, then double-click on the Time Settings line. You will see the
submenu shown below.
NOTE: DST stands for Daylight Savings Time.
2. Double-click on any of the programmable settings; you will see the Time Settings
screen.
3. Make changes to this screen according to your application requirements.

Doc# E107707 19 - 11
19: Nexus® 1500 Meter
Electro Industries/GaugeTechThe Leader In Power Monitoring and Smart Grid SolutionsElectro Industries/GaugeTechThe Leader In Power Monitoring and Smart Grid Solutions
• Zone Descriptor: A Zone Descriptor sets the time zone for the meter. 0 = Green-
wich Mean Time. Consult the chart below to find the Zone Descriptor for your
time zone.
• Daylight Savings Information:
• Disabled: Disables an automatic adjustment for Daylight Savings Time.
• Auto DST: Sets Daylight Savings Time automatically to the pre-2007
standard for the United States: the time changes automatically occur at
2:00 AM (your local time), on the first Sunday in April and the last Sun-
day in October.
• Auto DST U.S. EPA 2005: Sets Daylight Savings Time automatically to
the 2007 standard for the United States: the time changes automatically
occur at 2:00 AM (your local time), on the second Sunday in March and
the first Sunday in November.
GMT Greenwich Mean Time Table (Dublin, London)
-1.00 Azores +1.00 Brussels, Paris, Warsaw
-2.00 Mid-Atlantic +2.00 Athens, Cairo, Helsinki
-3.00 Buenos Aires, Georgetown +3.00 Baghdad, Kuwait, Moscow, Tehran
-4.00 Atlantic Time (Canada), Santiago +4.00 Kabul, Baku
-5.00 Eastern Time (USA and Canada), Lima
+5.00 Karachi
-6.00 Central Time (USA and Canada), Mexico City
+6.00 Dhaka
-7.00 Mountain Time (USA and Canada)
+7.00 Bangkok, Hanoi, Jakarta
-8.00 Pacific Time (USA and Canada), Tijuana
+8.00 Beijing, Hong Kong, Singapore
-9.00 Alaska +9.00 Osaka, Sapporo, Seoul
-10.00 Hawaii +10.00 Brisbane, Melbourne, Guam, Hobart
-11.00 Midway Island +11.00 Magadan, Solomon Islands
-12.00 Eniwetok +12.00 Auckland, Fiji

Doc# E107707 19 - 12
19: Nexus® 1500 Meter
Electro Industries/GaugeTechThe Leader In Power Monitoring and Smart Grid SolutionsElectro Industries/GaugeTechThe Leader In Power Monitoring and Smart Grid Solutions
• User Defined: Allows you to set the Daylight Savings Time start and end
times manually. Fields open that let you set the beginning and ending
dates for Daylight Savings Time.
• Line Synchronization: set Enable or Disable and Frequency. The basic function of
Line Frequency Clock Synchronization is to adjust the real time clock to track the
time based on the power line frequency. For this purpose, Phase A voltage only
is used. Line Sync is disabled if a GPS signal is present. If line synchronization is
disabled, the unit defaults to its internal crystal for a time synchronizing refer-
ence. If a GPS signal is present, the unit synchronizes to that signal and doesn’t
rely on the internal signal unless the GPS signal is lost.
How Time is Adjusted
After the clock is synced to the line, the meter periodically checks the
cumulative difference between the real time clock in seconds and the line cycle
count. If the absolute difference between the two accumulations is more than 1
second or 60 (50) cycles, the clock is adjusted + / - 1 second accordingly.
4. To set the meter's on-board clock, use Set Device Time from the Tools Menu (see
Section 19.9).
5. When all changes are entered, click OK to return to the main Device Profile screen.
For any changes to take effect, you must click the Update Device button to send
the new profile to the meter.

Doc# E107707 19 - 13
19: Nexus® 1500 Meter
Electro Industries/GaugeTechThe Leader In Power Monitoring and Smart Grid SolutionsElectro Industries/GaugeTechThe Leader In Power Monitoring and Smart Grid Solutions
19.4.4: Labels
Labels are user-defined names for the Nexus® 1500 meter, the Auxiliary Voltage
terminal, and the I N Measured terminal. You also use the Labels screen to select the
power direction, and the power factor display.
NOTE: It is important to label the meter (under "Meter Designation") with a unique
name because that label becomes the file name of any logs retrieved from that
meter. Duplicate meter designations interfere with retrieved log databases. See Chap-
ter 8 for more details on logs.
1. From the Device Profile screen (Section 19.3), click on the + button next to
General Settings and double-click on the Labels line. You will see the submenu
shown below.
2. Double-click on any of the parameters; you will see the Labels screen.

Doc# E107707 19 - 14
19: Nexus® 1500 Meter
Electro Industries/GaugeTechThe Leader In Power Monitoring and Smart Grid SolutionsElectro Industries/GaugeTechThe Leader In Power Monitoring and Smart Grid Solutions
3. Enter labels in the appropriate fields.
NOTES:
• Meter Designation must be set for partial log retrieval. You can use any character
allowed by the Windows© operating system.
• In English versions the following characters don’t work:
\ / : * ? " < > |
• For meters used internationally by multilingual users, we recommend you
use only alphanumeric characters allowed by your operating system.
• The Power Factor Display selection determines the display of Quadrants in the
Power Factor screen. Use the pull-down menu to make your selection.
4. When all changes are entered, click OK to return to the main Device Profile screen.
For any changes to take effect, you must click the Update Device button to send
the new profile to the meter.
19.4.5: Communications
1. From the Device Profile screen (see Section 19.3), click on the + button next to
General Settings and double-click on the Communications line. You will see the
submenu shown below.
2. Double-click on any of the settings (e.g., "Optical Port 1"); you will see the
Communications Settings screen.
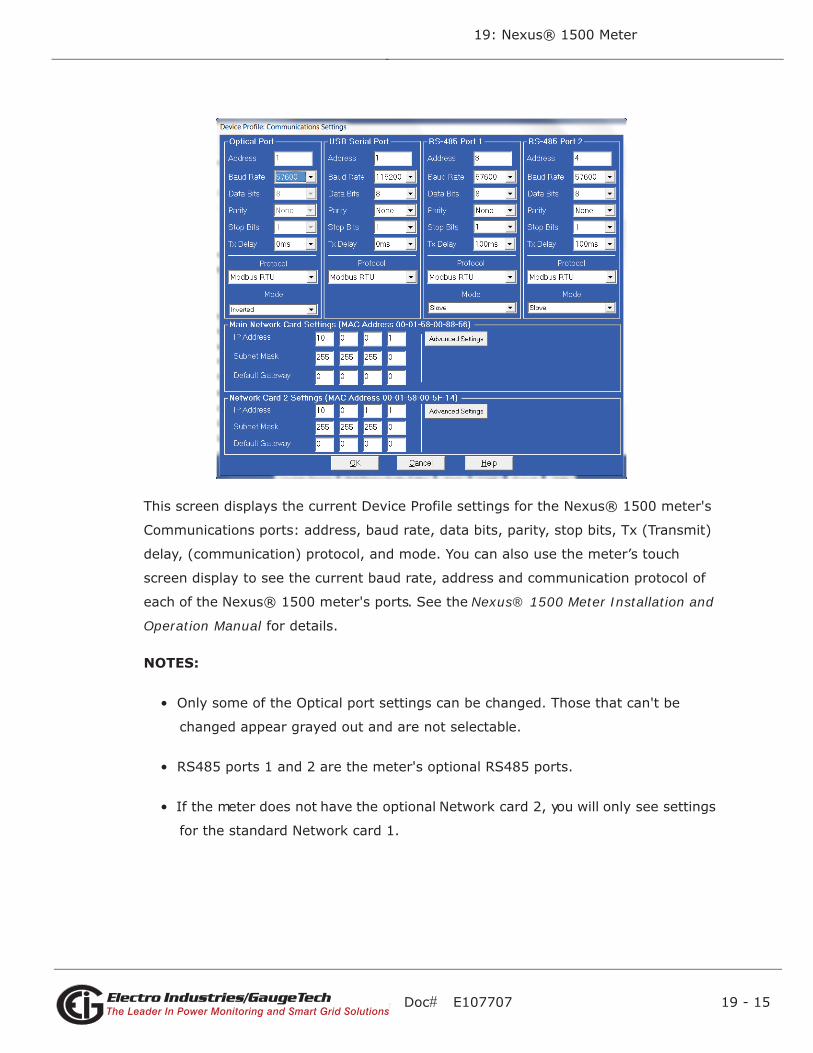
Doc# E107707 19 - 15
19: Nexus® 1500 Meter
Electro Industries/GaugeTechThe Leader In Power Monitoring and Smart Grid SolutionsElectro Industries/GaugeTechThe Leader In Power Monitoring and Smart Grid Solutions
This screen displays the current Device Profile settings for the Nexus® 1500 meter's
Communications ports: address, baud rate, data bits, parity, stop bits, Tx (Transmit)
delay, (communication) protocol, and mode. You can also use the meter’s touch
screen display to see the current baud rate, address and communication protocol of
each of the Nexus® 1500 meter's ports. See the Nexus® 1500 Meter Installation and
Operation Manual for details.
NOTES:
• Only some of the Optical port settings can be changed. Those that can't be
changed appear grayed out and are not selectable.
• RS485 ports 1 and 2 are the meter's optional RS485 ports.
• If the meter does not have the optional Network card 2, you will only see settings
for the standard Network card 1.

Doc# E107707 19 - 16
19: Nexus® 1500 Meter
Electro Industries/GaugeTechThe Leader In Power Monitoring and Smart Grid SolutionsElectro Industries/GaugeTechThe Leader In Power Monitoring and Smart Grid Solutions
3. Make changes to this screen according to your application requirements by clicking
on the box or pull-down menu of any of the following settings:
• Address: assign an address to each port to communicate with other devices.
Multiple Nexus® meters on an RS485 bus must each have a unique address set
for the port that is connected to the bus.
• Baud Rate: from the pull-down menu, select 1200, 2400, 4800, 9600, 19200,
38400, 57600, or 115200. The baud rate entered in this field must match the
baud rate of the device connected to the Nexus® 1500 meter at this port. Use
9600 for modem connections.
• Data Bits: use the pull-down menu to select from: 5, 6, 7 or 8. For Modbus RTU
and ASCII, leave the data bits at 8.
• Parity: use the pull-down menu to select from: None, Even, Odd, Mark or Space.
For Modbus RTU and ASCII, leave the parity at None.
• Stop Bits: use the pull-down menu to select from: 1, 1.5 or 2. For Modbus RTU
and ASCII, leave the stop bits at 1.
• TxDelay (Transmit Delay): use the pull-down menu to select from: 0ms, 10ms,
20ms, 30ms, 40ms, 50ms, 60ms, or 70ms. Leave the Tx delay at 50ms for
RS485 communication.
• Protocol: use the pull-down menu to select from Modbus RTU and Modbus
ASCII. Direct connections made through Communicator EXT must use either
Modbus RTU or Modbus ASCII protocol (we recommend Modbus RTU). Modem
connections made through Communicator EXT must use Modbus ASCII only. See
Chapter 2 for details.
• Mode field selections depend on the port:
• Optical port - select the Receiving mode, either Inverted (for use with
the Smart Coupler or A7Z Optical Probes) or Non-inverted.
• Port 2 - depending on how you will be using this RS485 port select either
Slave, Master (I/O Modules), RTU Master, or Ethernet Gateway.
i. Slave: This mode is used when the port will be polled by a Master device.

Doc# E107707 19 - 17
19: Nexus® 1500 Meter
Electro Industries/GaugeTechThe Leader In Power Monitoring and Smart Grid SolutionsElectro Industries/GaugeTechThe Leader In Power Monitoring and Smart Grid Solutions
ii.Master (I/O Modules): This mode is used when the port will be polling I/
O modules.
iii.RTU Master: This mode is used when the port will be used to poll other
(slave) devices.
iv.Ethernet Gateway: This mode is used when the port will be used by
other devices to access an Ethernet network.
• For Network Card Settings, enter:
• IP Address
• Subnet Mask
• Default Gateway
NOTES:
• Click the Advanced Settings button to open a screen that lets you set
Network card features. See Chapter 6 for details.
• See your Network Administrator for the correct settings.
5. When all communication settings are entered, click OK to return to the main
Device Profile screen. For any changes to take effect, you must click the Update
Device button to send the new profile to the meter.
IMPORTANT! In order to prevent communications problems, be careful when making
changes in the Communications Settings screen. For example, if you change the baud
rate of the port connected to a computer, be sure to make the same change to the
computer port's baud rate.

Doc# E107707 19 - 18
19: Nexus® 1500 Meter
Electro Industries/GaugeTechThe Leader In Power Monitoring and Smart Grid SolutionsElectro Industries/GaugeTechThe Leader In Power Monitoring and Smart Grid Solutions
19.4.6: DNP Custom Class Map
The DNP Custom Class Map is a useful tool for prioritizing the readings in your system
and setting the frequency of the readings. The DNP Custom Class Map also keeps your
system free of thousands of unwanted readings.
From the Device Profile screen (Section 19.3), click on the + button next to
General Settings, then double-click on the DNP Custom Classes Map line and on the
DNP Level 2 line. You will see the screen shown below.
For details on programming the DNP Level 2 settings, see Chapter 18.
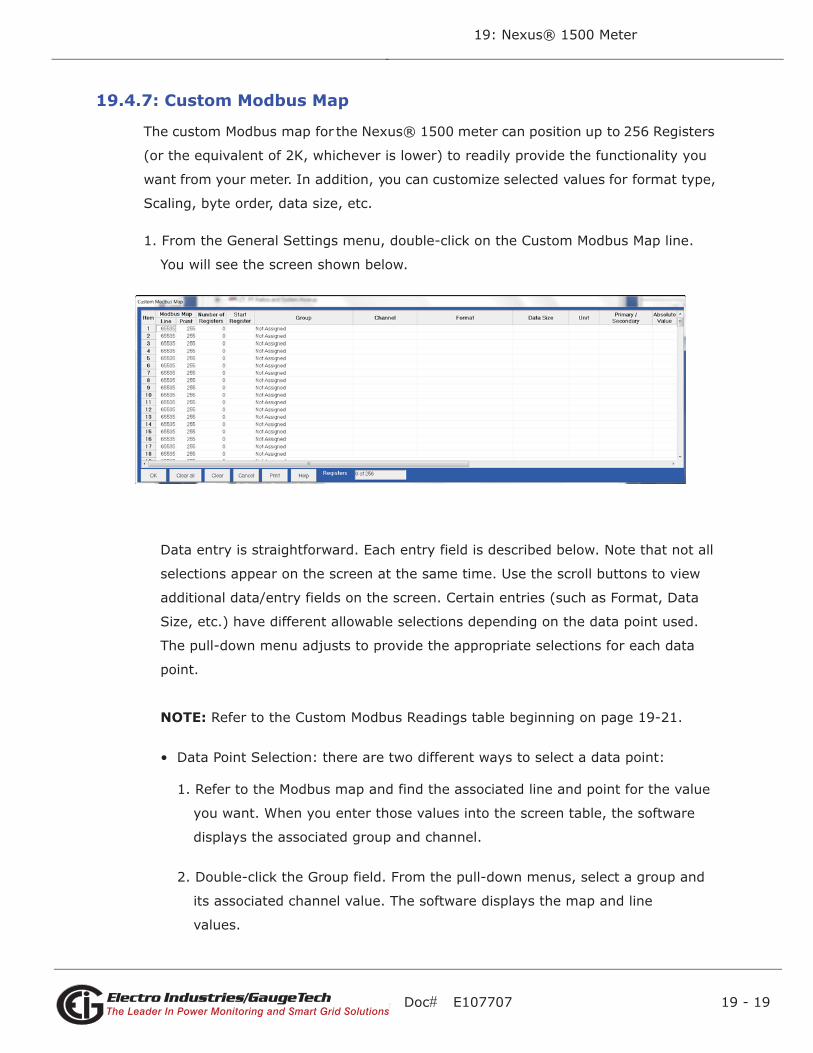
Doc# E107707 19 - 19
19: Nexus® 1500 Meter
Electro Industries/GaugeTechThe Leader In Power Monitoring and Smart Grid SolutionsElectro Industries/GaugeTechThe Leader In Power Monitoring and Smart Grid Solutions
19.4.7: Custom Modbus Map
The custom Modbus map for the Nexus® 1500 meter can position up to 256 Registers
(or the equivalent of 2K, whichever is lower) to readily provide the functionality you
want from your meter. In addition, you can customize selected values for format type,
Scaling, byte order, data size, etc.
1. From the General Settings menu, double-click on the Custom Modbus Map line.
You will see the screen shown below.
Data entry is straightforward. Each entry field is described below. Note that not all
selections appear on the screen at the same time. Use the scroll buttons to view
additional data/entry fields on the screen. Certain entries (such as Format, Data
Size, etc.) have different allowable selections depending on the data point used.
The pull-down menu adjusts to provide the appropriate selections for each data
point.
NOTE: Refer to the Custom Modbus Readings table beginning on page 19-21.
• Data Point Selection: there are two different ways to select a data point:
1. Refer to the Modbus map and find the associated line and point for the value
you want. When you enter those values into the screen table, the software
displays the associated group and channel.
2. Double-click the Group field. From the pull-down menus, select a group and
its associated channel value. The software displays the map and line
values.

Doc# E107707 19 - 20
19: Nexus® 1500 Meter
Electro Industries/GaugeTechThe Leader In Power Monitoring and Smart Grid SolutionsElectro Industries/GaugeTechThe Leader In Power Monitoring and Smart Grid Solutions
• Number of Registers: this field is display only. The software computes the
number in this field based on the data size selected in the Data Size column.
• Start Register: this field is display only. The software assigns and adjusts Start
register numbers to take into account previous entries and data sizes. The Start
register is the number of the first register used in polling.
• Format: from the pull-down menu, select a format type for a value, such as
Signed Integer, Unsigned Integer, and 4 Byte IEEE Float.
• Data Size: from the pull-down menu, select the number of bytes you want to
represent the data point: 2 or 4.
• Unit: if the polled value is viewed as an integer, the Unit field tells the software
where to place the decimal point.
Examples
• If you select .01, a polling value 1234 is interpreted as 12.34.
• If you select 100, a polling value 1234 is interpreted as 123400.
• Primary/Secondary: the meter normally computes values in secondary units.
Where applicable, you may select primary or secondary. If Primary is selected,
the value is multiplied by the appropriate CT and/or PT values.
• Absolute Value: where appropriate, you may have the option of having the data
point computed as a signed or absolute value. Select either:
• No: to have the data point computed as a signed value.
• Yes: to have the data point computed as an absolute value.
• Byte Order: for most of the data points, you can select the polling order of the
number of bytes selected by the Data Size field.
Example: For a four-byte data point, the bytes can be arranged in any order for
polling.
• Display/Modulo/Offset: depending on the data point, select one or more
additional options with appropriate sub-selections.
• Display: for certain data points, interpretation and display options are
offered.

Doc# E107707 19 - 21
19: Nexus® 1500 Meter
Electro Industries/GaugeTechThe Leader In Power Monitoring and Smart Grid SolutionsElectro Industries/GaugeTechThe Leader In Power Monitoring and Smart Grid Solutions
Example: For “An Angle” values, you can represent and display as 0 to
360 degrees or -180 to +180 degrees, etc. Selections appear in a pull-
down menu for the associated point.
• Modulo: Certain values are cumulative and can roll over and start
recounting from zero. For those values, where required, you can enter a
point at which the rollover will occur.
• Offset: Where allowed, you can enter a value (offset) that will be added
to the data point when it is computed.
3. When all changes are entered, click OK to return to the main Device Profile screen.
For any changes to take effect, you must click the Update Device button to send
the new profile to the meter.
CUSTOM MODBUS READINGS
Line Point Description
34 0 One Second Phase to Neutral Volts: Volts AN
34 1 One Second Phase to Neutral Volts: Volts BN
34 2 One Second Phase to Neutral Volts: Volts CN
35 0 One Second Auxiliary Volts: V Aux
36 0 One Second Current (A, B, C): IA
36 1 One Second Current (A, B, C): IB
36 2 One Second Current (A, B, C): IC
37 0 One Second Measured N Current: I Nm
38 0 One Second Calculated N Current: I Nc
39 0 One Second Phase to Phase Volts: Volts AB
39 1 One Second Phase to Phase Volts: Volts BC
39 2 One Second Phase to Phase Volts: Volts CA
40 0 One Second VA (A, B, C): VA A
40 1 One Second VA (A, B, C): VA B
40 2 One Second VA (A, B, C): VA C
41 0 One Second VA Total: VA Total
42 0 One Second VAR (A, B, C): VAR A
42 1 One Second VAR (A, B, C): VAR B

Doc# E107707 19 - 22
19: Nexus® 1500 Meter
Electro Industries/GaugeTechThe Leader In Power Monitoring and Smart Grid SolutionsElectro Industries/GaugeTechThe Leader In Power Monitoring and Smart Grid Solutions
42 2 One Second VAR (A, B, C): VAR C
43 0 One Second VAR Total: VAR Total
44 0 One Second Watts (A, B, C): Watts A
44 1 One Second Watts (A, B, C): Watts B
44 2 One Second Watts (A, B, C): Watts C
45 0 One Second Watts Total: Watts Total
46 0 One Second Frequency: Frequency
47 0 One Second Power Factor (A, B, C): PF A
47 1 One Second Power Factor (A, B, C): PF B
47 2 One Second Power Factor (A, B, C): PF C
48 0 One Second Power Factor Total: PF Total
49 0 One Second Imbalance: Voltage
49 1 One Second Imbalance: Current
216 2 Block Window Average Watt
217 3 Maximum Block Window Positive Watt
217 4 Maximum Block Window Negative Watt
218 3 Minimum Block Window Positive Watt
218 4 Maximum Block Window Negative Watt
194 0 Phase A-N/Phase A-B Voltage THD
195 0 Phase B-N/Phase B-C Voltage THD
196 0 Phase C-N/Phase C-A Voltage THD
197 0 Phase A Current THD
198 0 Phase B Current THD
199 0 Phase A Current THD
CUSTOM MODBUS READINGS

Doc# E107707 19 - 23
19: Nexus® 1500 Meter
Electro Industries/GaugeTechThe Leader In Power Monitoring and Smart Grid SolutionsElectro Industries/GaugeTechThe Leader In Power Monitoring and Smart Grid Solutions
19.4.8: Configure Log Sizes
The Configure Log Sizes setting allows you to set the size (amount of memory) of the
logs are using.
1. From the General Settings menu, double-click on the Configure Log Sizes line. You
will see the screen shown below.
This screen lists the logs and the assigned blocks/memory/total percent of log
memory/ for each, along with the approximate time span and approximate number
of records based on the log’s size; the bottom of the screen lists the remaining
blocks/memory.
2. Click in the Blocks field of any log that you want to configure and enter the amount
of blocks you want that log to use: 1 Block = 1 MegaByte of memory.
3. Click OK to save your changes and exit the screen. For any changes to take effect,
you must click the Update Device button to send the new profile to the meter.
NOTE: The amount of memory available for logging depends on the meter's V-
Switch™ key:
• V-1: 128 MegaBytes total memory for logging
• V-2 and V-3: 1 GigaByte total memory for logging
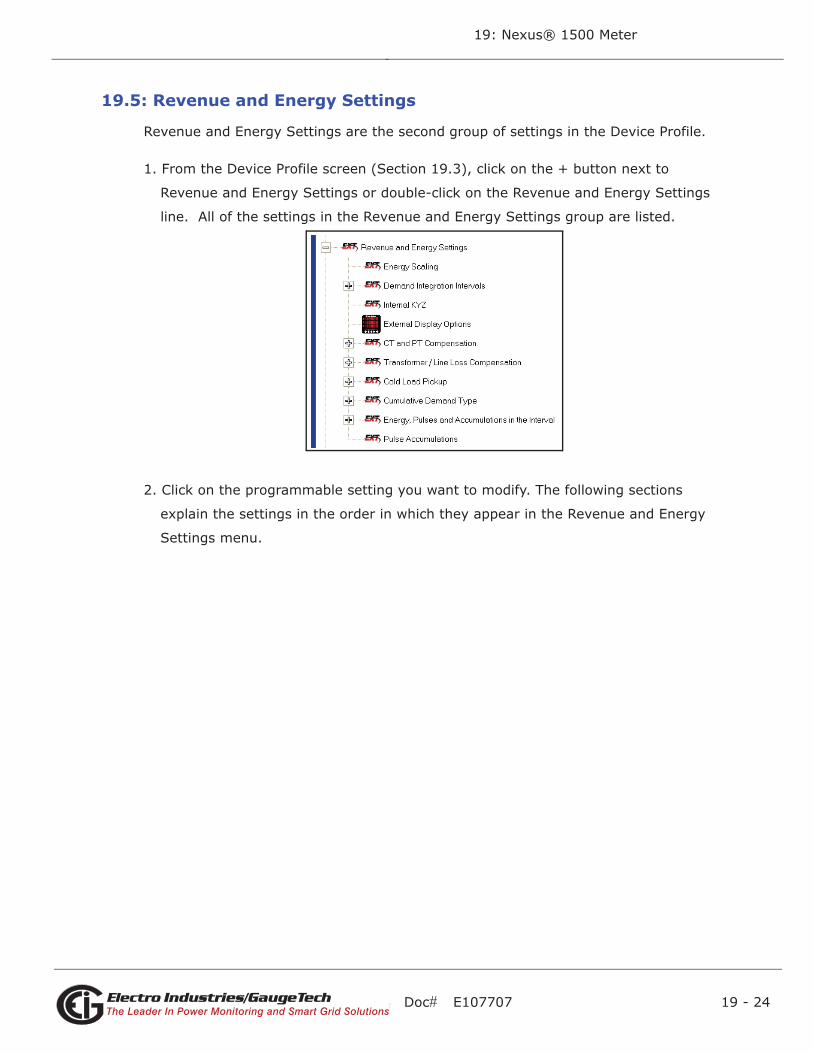
Doc# E107707 19 - 24
19: Nexus® 1500 Meter
Electro Industries/GaugeTechThe Leader In Power Monitoring and Smart Grid SolutionsElectro Industries/GaugeTechThe Leader In Power Monitoring and Smart Grid Solutions
19.5: Revenue and Energy Settings
Revenue and Energy Settings are the second group of settings in the Device Profile.
1. From the Device Profile screen (Section 19.3), click on the + button next to
Revenue and Energy Settings or double-click on the Revenue and Energy Settings
line. All of the settings in the Revenue and Energy Settings group are listed.
2. Click on the programmable setting you want to modify. The following sections
explain the settings in the order in which they appear in the Revenue and Energy
Settings menu.

Doc# E107707 19 - 25
19: Nexus® 1500 Meter
Electro Industries/GaugeTechThe Leader In Power Monitoring and Smart Grid SolutionsElectro Industries/GaugeTechThe Leader In Power Monitoring and Smart Grid Solutions
19.5.1: Energy Scaling
1. From the Revenue and Energy Settings menu, click on the + button next to Energy
Scaling or double-click on the Energy Scaling line. You will see the Energy Scale
Settings screen.
This screen has multiple tabs that allow you to access all of the Energy Scaling
options. Using the Energy Scale Settings screens you can select the number of
digits, decimal point placement and Energy unit for displayed readings.
NOTE: You click on the tabs to navigate between screens, except for Global
settings - you click on the Global Settings button to access that screen.
Global Settings
2.Click the Global Settings button to see the screen shown above. This screen lets you
set the scale for all of the Energy Readings.

Doc# E107707 19 - 26
19: Nexus® 1500 Meter
Electro Industries/GaugeTechThe Leader In Power Monitoring and Smart Grid SolutionsElectro Industries/GaugeTechThe Leader In Power Monitoring and Smart Grid Solutions
a. Click in the Digits field and select the number of digits for the value from the
pull-down menu. You can choose between 2 and 9 digits.
b. Click in the Decimal Places field and select the number of decimal places for the
value from the pull-down menu. You can choose between 0 and 7 decimal
places, depending on the number of digits you selected. For example, if you
chose 3 digits, you can only choose up to 2 decimal places.
c. Click in the Units field to select the unit of measurement for the value. You can
select k or M.
NOTE: The example field changes as you make selections, to show you how the
value would appear with the settings you made.
3. When all changes are entered, click Apply to return to the main Energy Scale
Settings screen. You can now use the tabs to modify the scale for specific readings.
For example, you might have set the scale for the Internal Input Accumulators as 5
digits, 2 decimal places, and M unit, but you may want one of the accumulators to
have a different scale. You would click the Pulse Accumulations and Aggregations
tab and change the scale for that accumulator. The following sections show the tab
screens where you can make individual scaling changes. You set the Digits, Deci-
mals, and Units fields in the same way as in the Global Settings screen.
Energy
Click on tabs to configure specific Watt Hour, VA Hour, and VAR Hour read-
ings (screen shown on previous page).

Doc# E107707 19 - 27
19: Nexus® 1500 Meter
Electro Industries/GaugeTechThe Leader In Power Monitoring and Smart Grid SolutionsElectro Industries/GaugeTechThe Leader In Power Monitoring and Smart Grid Solutions
Uncompensated Energy
Configure specific VA, Watt and VAR readings not adjusted by Transformer Loss
Compensation
Pulse Accumulations and Aggregation
Click on tabs to configure specific accumulators and aggregators.

Doc# E107707 19 - 28
19: Nexus® 1500 Meter
Electro Industries/GaugeTechThe Leader In Power Monitoring and Smart Grid SolutionsElectro Industries/GaugeTechThe Leader In Power Monitoring and Smart Grid Solutions
I and V Squared T Readings
Configure specific I2T readings (data will not accumulate until current reaches the
programmed level) and V2T readings (data stops accumulating when Voltage falls
below the programmed level).
Q Hours
Configure +QH and -QH.

Doc# E107707 19 - 29
19: Nexus® 1500 Meter
Electro Industries/GaugeTechThe Leader In Power Monitoring and Smart Grid SolutionsElectro Industries/GaugeTechThe Leader In Power Monitoring and Smart Grid Solutions
4. When you are done, click OK to return to the main Device Profile screen. For these
changes to take effect, you must click the Update Device button to send the new
profile to the meter.
19.5.2: Demand Integration Intervals
See the Nexus® 1500 Meter Installation and Operation Manual for details on Demand
intervals.
1. From the Revenue and Energy Settings menu, click on the + button next to
Demand Integration Intervals or double-click on the Demand Integration Intervals
line. You will see the submenu shown below.
2. Double-click on any of the settings. You will see the screen shown below.

Doc# E107707 19 - 30
19: Nexus® 1500 Meter
Electro Industries/GaugeTechThe Leader In Power Monitoring and Smart Grid SolutionsElectro Industries/GaugeTechThe Leader In Power Monitoring and Smart Grid Solutions
3. Click on the tabs at the top of the screen to navigate from one setting to another.
Make changes to the settings according to your application requirements. Following
is a brief description of each setting and its function:
• Thermal Averaging (shown on previous page): use to set hours, minutes and
seconds for a precise thermal window of demand data.
NOTE: The Max/Min Thermal Average Block Interval fields are used if you want
to track the maximum and minimum Demand in more than one interval, e.g.,
the Max and Min Demand in a 10 minute and a 15 minute interval.
• Block Averaging Time: use to set the length of the block interval used for
Demand calculations and other interval-based functions. Also used to set End of
Interval pulse.
1. Use the Hours, Minutes, and Seconds fields to set the length of the Block
Interval.
2. If you want to generate a pulse at the end of the set interval, click the box
next to the Generate End of Interval Pulse field and select the number of the
internal relay (1-4) you want to use and the pulse width (600 - 635 millisec-
onds).
NOTE: The Block Window Sync field indicates whether the meter is being
synchronized with pulses from a High Speed input. This option is set in the
Input Type field of the High Speed Inputs screen (see Section 19.6.8).
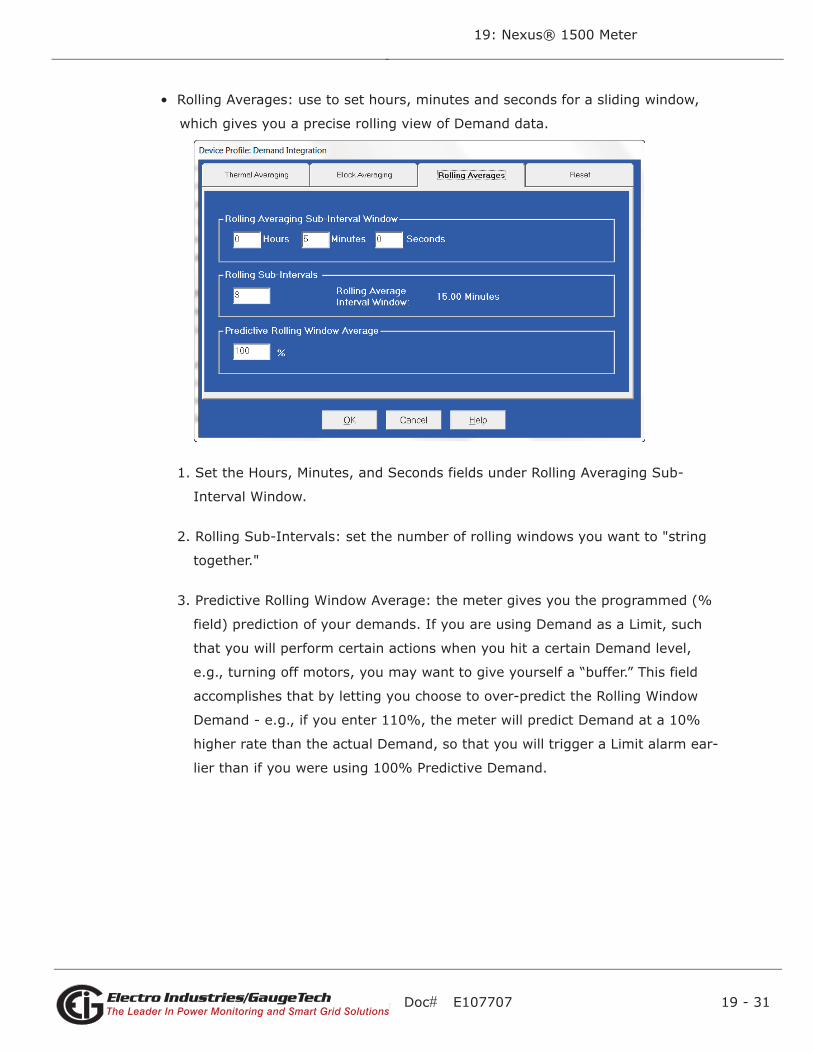
Doc# E107707 19 - 31
19: Nexus® 1500 Meter
Electro Industries/GaugeTechThe Leader In Power Monitoring and Smart Grid SolutionsElectro Industries/GaugeTechThe Leader In Power Monitoring and Smart Grid Solutions
• Rolling Averages: use to set hours, minutes and seconds for a sliding window,
which gives you a precise rolling view of Demand data.
1. Set the Hours, Minutes, and Seconds fields under Rolling Averaging Sub-
Interval Window.
2. Rolling Sub-Intervals: set the number of rolling windows you want to "string
together."
3. Predictive Rolling Window Average: the meter gives you the programmed (%
field) prediction of your demands. If you are using Demand as a Limit, such
that you will perform certain actions when you hit a certain Demand level,
e.g., turning off motors, you may want to give yourself a “buffer.” This field
accomplishes that by letting you choose to over-predict the Rolling Window
Demand - e.g., if you enter 110%, the meter will predict Demand at a 10%
higher rate than the actual Demand, so that you will trigger a Limit alarm ear-
lier than if you were using 100% Predictive Demand.

Doc# E107707 19 - 32
19: Nexus® 1500 Meter
Electro Industries/GaugeTechThe Leader In Power Monitoring and Smart Grid SolutionsElectro Industries/GaugeTechThe Leader In Power Monitoring and Smart Grid Solutions
• Reset: Allows you to specify a Time of Use read whenever Maximum Demand is
reset.
• Check the box to perform the TOU read.
• Leave the box unchecked if you don't want to perform a TOU read.
3. When all changes are entered, click OK to return to the main Device Profile screen.
For these changes to take effect, you must click the Update Device button to send
the new profile to the meter.
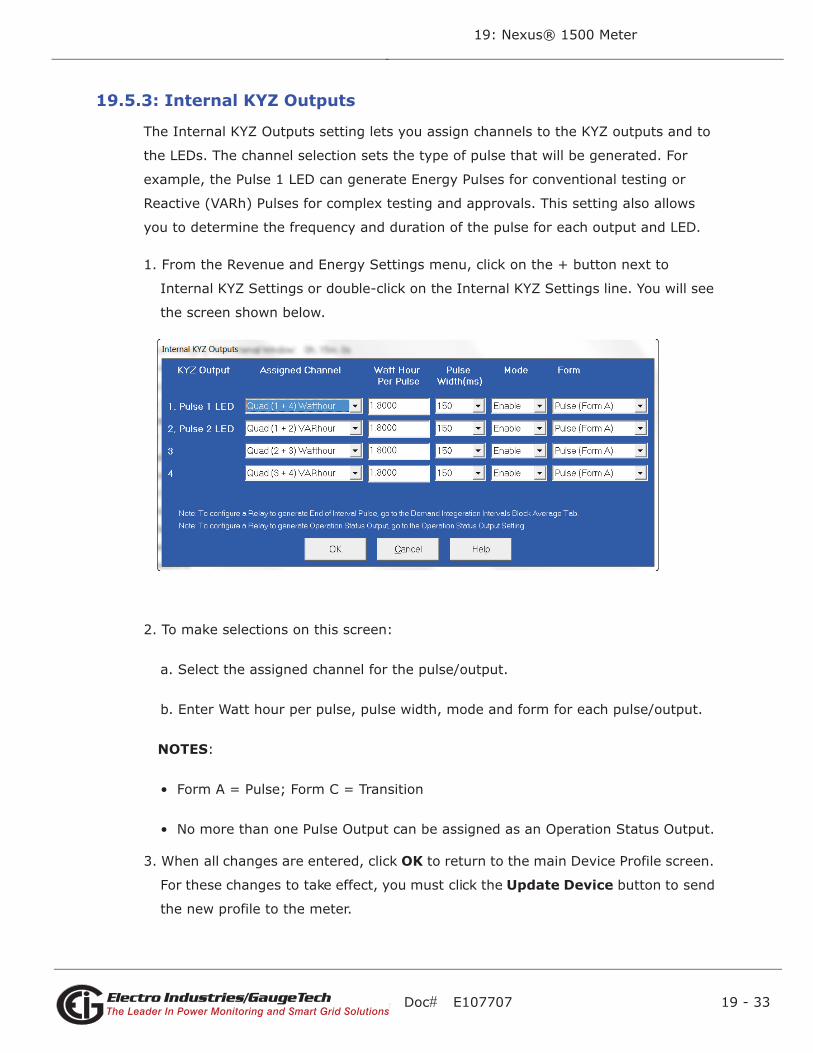
Doc# E107707 19 - 33
19: Nexus® 1500 Meter
Electro Industries/GaugeTechThe Leader In Power Monitoring and Smart Grid SolutionsElectro Industries/GaugeTechThe Leader In Power Monitoring and Smart Grid Solutions
19.5.3: Internal KYZ Outputs
The Internal KYZ Outputs setting lets you assign channels to the KYZ outputs and to
the LEDs. The channel selection sets the type of pulse that will be generated. For
example, the Pulse 1 LED can generate Energy Pulses for conventional testing or
Reactive (VARh) Pulses for complex testing and approvals. This setting also allows
you to determine the frequency and duration of the pulse for each output and LED.
1. From the Revenue and Energy Settings menu, click on the + button next to
Internal KYZ Settings or double-click on the Internal KYZ Settings line. You will see
the screen shown below.
2. To make selections on this screen:
a. Select the assigned channel for the pulse/output.
b. Enter Watt hour per pulse, pulse width, mode and form for each pulse/output.
NOTES:
• Form A = Pulse; Form C = Transition
• No more than one Pulse Output can be assigned as an Operation Status Output.
3. When all changes are entered, click OK to return to the main Device Profile screen.
For these changes to take effect, you must click the Update Device button to send
the new profile to the meter.

Doc# E107707 19 - 34
19: Nexus® 1500 Meter
Electro Industries/GaugeTechThe Leader In Power Monitoring and Smart Grid SolutionsElectro Industries/GaugeTechThe Leader In Power Monitoring and Smart Grid Solutions
Considerations on Setting KYZ Outputs
KYZ Pulses are produced at a rate proportional to the rate of energy accumulation, a
feature that makes them useful for accuracy testing. Decreasing the value of the Watt
Hour per Pulse field increases the pulse rate, improving the moment-to-moment
precision of the output. The increased pulse rate means that the pulses are of shorter
duration. Most equipment for detecting and counting pulses has a minimum detection
time, so pulses that occur too rapidly might not be detected and counted.
The value in the Pulse Width field is used to force the meter to generate minimum
width pulses in situations where proportional width pulses would occur too quickly to
be measured. A pulse width setting that does not match appropriately with the input
level and Watt hour per pulse setting will result in output that, in the short term, will
not verify correctly.
For proper operation of this feature, the pulse width should be set to a value that is
longer than the detection time required by the monitoring equipment, and shorter
than the pulse period that the inputs and Watt hour per pulse setting would produce.
The formula for the second quantity is:
3600 x -
Watt hr per pulseTotal Power

Doc# E107707 19 - 35
19: Nexus® 1500 Meter
Electro Industries/GaugeTechThe Leader In Power Monitoring and Smart Grid SolutionsElectro Industries/GaugeTechThe Leader In Power Monitoring and Smart Grid Solutions
Some example cases are shown in the table below. For proper operation the pulse
width should be set to a value that is less than the computed value of seconds per
pulse.
VoltagePN PP
V V
Current
A W
Total Power Wh/Pulse
Wh
Pulses/Hour
Pulses
Seconds/Pulse
Seconds
69.28 120.00 1 207.85 1.8000000 115.47 31.18
69.28 120.00 1 207.85 0.2078461 1000.00 3.60
69.28 120.00 5 1039.23 1.8000000 577.35 6.24
69.28 120.00 5 1039.23 1.0392305 1000.00 3.60
120.00 207.85 1 360.00 1.8000000 200.00 18.00
120.00 207.85 1 360.00 0.3600000 1000.00 3.60
120.00 207.85 5 1800.00 1.8000000 1000.00 3.60
277.13 480.00 1 831.38 1.8000000 461.88 7.79
277.13 480.00 1 831.38 0.8313844 1000.00 3.60
277.13 480.00 5 4156.92 1.8000000 2309.40 1.56
277.13 480.00 5 4156.92 4.15629219 1000.00 3.60

Doc# E107707 19 - 36
19: Nexus® 1500 Meter
Electro Industries/GaugeTechThe Leader In Power Monitoring and Smart Grid SolutionsElectro Industries/GaugeTechThe Leader In Power Monitoring and Smart Grid Solutions
19.5.4: External Display Options
Many utility companies want to read secondary Volts and primary power readings.
This setting configures a P40N/P40N+ external display to read either primary or sec-
ondary Volts. All other readings will be in the primary, regardless of this setting.
1. From the Revenue and Energy Settings menu, double-click on the External Display
Options line. You will see the screen below.
2. Use the pull-down menu to select either primary or secondary units for Voltage.
3. Click OK to return to the main Device Profile screen. For these changes to take
effect, you must click the Update Device button to send the new profile to the
meter.
19.5.5: CT and PT Compensation
1. From the Revenue and Energy Settings menu, click on the + button next to CT and
PT Compensation or double-click on the CT and PT Compensation line.
2. Check the Enable box to enable CT and PT Compensation; leave the box unchecked
to disable it.
3. Click OK to close the screen and return to the main Device Profile screen. For these
changes to take effect, you must click the Update Device button to send the new
profile to the meter.

Doc# E107707 19 - 37
19: Nexus® 1500 Meter
Electro Industries/GaugeTechThe Leader In Power Monitoring and Smart Grid SolutionsElectro Industries/GaugeTechThe Leader In Power Monitoring and Smart Grid Solutions
NOTE: In 1982 the IEEE changed the term "Potential Transformer" to "Voltage
Transformer."
19.5.6: Transformer / Line Loss Compensation
1. From the Revenue and Energy Settings menu, click on the + button next to
Transformer/Line Loss Compensation or double-click on the Transformer/Line Loss
Compensation line. You will see the submenu shown below.
2. The menu displays the current values for the meter's Transformer Loss Compensa-
tion.
• %LWFE = percent loss of Watts due to iron
• %LVFE = percent loss of Vars due to iron
• %LWCU = percent loss of Watts due to copper
• %LVCU = percent loss of Vars due to copper

Doc# E107707 19 - 38
19: Nexus® 1500 Meter
Electro Industries/GaugeTechThe Leader In Power Monitoring and Smart Grid SolutionsElectro Industries/GaugeTechThe Leader In Power Monitoring and Smart Grid Solutions
3. Double-click on any of the loss values. You will see the screen shown below.
4. Click on TLC Calculator to find the values to enter into the Percent Loss fields. The
TLC Calculator button launches an Excel Spreadsheet that performs the calculations
for you once the required data is entered.
IMPORTANT! See Appendix B, which contains a copy of the Excel Spreadsheet
with example numbers, and an explanation of Loss Compensation considerations.
IMPORTANT! Communicator EXT automatically launches the Excel Spreadsheet
when you click the TLC Calculator button. If you do not have Excel software
installed on your computer, or if the spreadsheet file is not in the Communicator
EXT directory, a Warning is displayed instead of the worksheet. You can do your
own calculations using the hardcopy Transformer Loss Compensation Worksheet
shown in Appendix B.
NOTE on Excel: For most Excel users, the spreadsheet will not run until
permission is given to run the Macros contained in the sheet. Give permission by
changing the Excel Security Setting from High to Medium:
a. From the Excel toolbar, select Tools>Security>Options.
b. On the Security Tab page, click the Macro Security button.

Doc# E107707 19 - 39
19: Nexus® 1500 Meter
Electro Industries/GaugeTechThe Leader In Power Monitoring and Smart Grid SolutionsElectro Industries/GaugeTechThe Leader In Power Monitoring and Smart Grid Solutions
c. Select Medium Security.
5. Enter the percent loss of Watts and VARS for copper and iron in the appropriate
fields.
6. Enable or Disable Transformer Loss Compensation with the first pull-down menu at
the bottom of the screen. The optional selections are:
• Disabled
• Iron (Fe) Only
• Copper (Cu) Only
• Both Iron and Copper (Fe and Cu)
7. With the second pull-down menu, select from the following options:
• Add to Watts and Subtract from VAR
• Subtract from Watts and Add to VAR
• Add to Watts and VAR
• Subtract from Watts and VAR
8. With the third pull-down menu, apply the loss based on the power flow direction by
selecting one of the following options:
• Both +Watts and -Watts
• -Watts only
• +Watts only
3. When all settings are complete, click OK to return to the main Device Profile
screen. For any changes to take effect, you must click the Update Device button
to send the new profile to the meter.
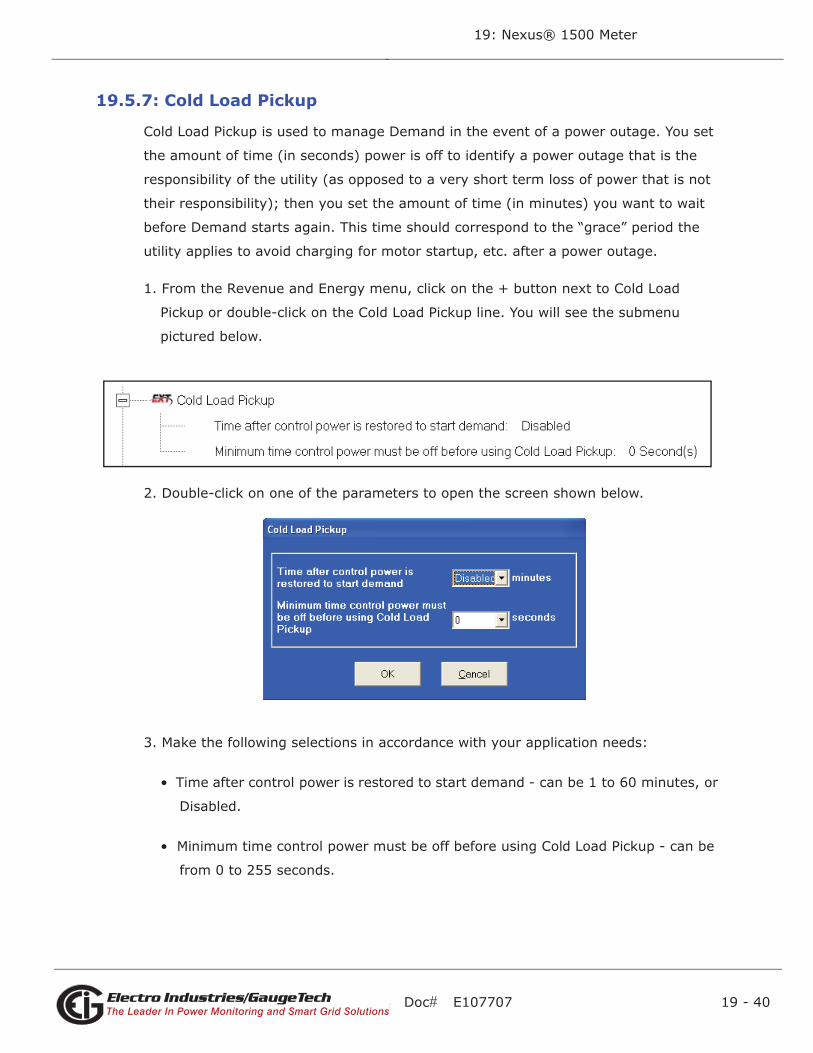
Doc# E107707 19 - 40
19: Nexus® 1500 Meter
Electro Industries/GaugeTechThe Leader In Power Monitoring and Smart Grid SolutionsElectro Industries/GaugeTechThe Leader In Power Monitoring and Smart Grid Solutions
19.5.7: Cold Load Pickup
Cold Load Pickup is used to manage Demand in the event of a power outage. You set
the amount of time (in seconds) power is off to identify a power outage that is the
responsibility of the utility (as opposed to a very short term loss of power that is not
their responsibility); then you set the amount of time (in minutes) you want to wait
before Demand starts again. This time should correspond to the “grace” period the
utility applies to avoid charging for motor startup, etc. after a power outage.
1. From the Revenue and Energy menu, click on the + button next to Cold Load
Pickup or double-click on the Cold Load Pickup line. You will see the submenu
pictured below.
2. Double-click on one of the parameters to open the screen shown below.
3. Make the following selections in accordance with your application needs:
• Time after control power is restored to start demand - can be 1 to 60 minutes, or
Disabled.
• Minimum time control power must be off before using Cold Load Pickup - can be
from 0 to 255 seconds.

Doc# E107707 19 - 41
19: Nexus® 1500 Meter
Electro Industries/GaugeTechThe Leader In Power Monitoring and Smart Grid SolutionsElectro Industries/GaugeTechThe Leader In Power Monitoring and Smart Grid Solutions
4. When all changes are entered, click OK to return to the main Device Profile screen.
For these changes to take effect, you must click the Update Device button to send
the new profile to the meter.
19.5.8: Cumulative Demand Type
Cumulative Demand is a counter of Max Demand that the meter keeps. It can help
you determine if there has been tampering with the meter, i.e., unauthorized reset-
ting of Demand. Whenever Demand is reset, the current Max Demand is added to the
Cumulative Demand. By analyzing the data in the counter you can see if the Demand
is being reset more often than intended. You can choose to use either Block Window
or Rolling Window Demand to use for the Cumulative Demand.
1. From the Revenue and Energy Settings menu, click on the + button next to
Cumulative Demand Type or double-click on the Cumulative Demand Type line.
You will see the submenu shown below. It tells you the type of Demand currently
selected.
2. Click the Type line to open the screen shown below.
3. Click the radio button in front of Rolling Window (sliding) or Block Window (fixed)
to select cumulative Demand type.
4. Click OK to exit the screen and return to the main Device Profile screen. For a
change to take effect, you must click the Update Device button to send the new
profile to the meter.

Doc# E107707 19 - 42
19: Nexus® 1500 Meter
Electro Industries/GaugeTechThe Leader In Power Monitoring and Smart Grid SolutionsElectro Industries/GaugeTechThe Leader In Power Monitoring and Smart Grid Solutions
19.5.9: Energy, Pulses and Accumulations in the Interval
This setting is used to specify a smaller window for energy accumulation that operates
within the regular energy accumulations. It is like the trip odometer of a car, as
opposed to the car’s total mileage odometer. The trip odometer tells you how many
miles you drove on a trip, while the total odometer tells you how many miles the car
has been driven in total. The Interval setting you make creates the sub-accumulation
field within the general Energy accumulation. An advantage of this setting is that the
sub-accumulation takes up less space and is processed more quickly then the larger
accumulation.
1. From the Revenue and Energy Settings menu, click on the + button next to Energy,
Pulses and Accumulations in the Interval or double-click on the Energy, Pulses and
Accumulations in the Interval line. You will see the submenu shown below.
2. The current Interval setting is displayed. Click on the Interval setting to open the
screen shown below.
3. Set the number of minutes for the Energy interval.
3. Click OK to close the window and return to the main Device Profile screen. For any
change to take effect, you must click the Update Device button to send the new
profile to the meter.

Doc# E107707 19 - 43
19: Nexus® 1500 Meter
Electro Industries/GaugeTechThe Leader In Power Monitoring and Smart Grid SolutionsElectro Industries/GaugeTechThe Leader In Power Monitoring and Smart Grid Solutions
19.5.10: Pulse Accumulations
Pulse accumulators are used to aggregate pulse information from external devices.
These devices may be gas, water, or electricity meters; energy management systems;
SCADA devices; or any pulse-generating device.
This section of the Device Profile displays a series of eight running totals available on
the Nexus® 1500 meter. Each total can be added to (or subtracted from) other totals.
This allows you to set the High Speed inputs located directly on the meter to accumu-
late pulses.
NOTE: If you use these inputs for pulse accumulations, do not set them to record
waveforms - if you do, you will record endless waveforms.
1. From the Revenue and Energy Settings menu, click on the + button next to Pulse
Accumulations or double-click on the Pulse Accumulations line. You will see the
screen shown below.
2. High Speed inputs 1-8 are listed in order under Source. Enter the following
information or use the pull-down menus to select:
• Units/Count - this is the scale factor that normalizes the pulses so that they can
be aggregated. Pulses are stored in primary values.
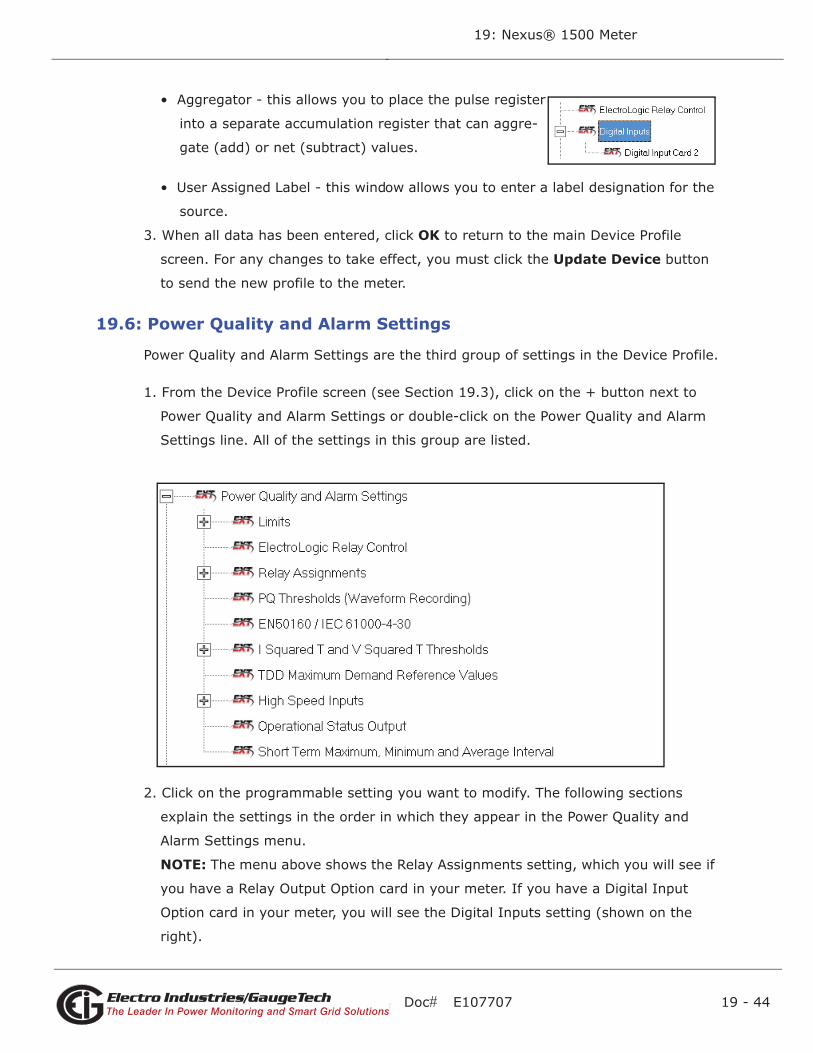
Doc# E107707 19 - 44
19: Nexus® 1500 Meter
Electro Industries/GaugeTechThe Leader In Power Monitoring and Smart Grid SolutionsElectro Industries/GaugeTechThe Leader In Power Monitoring and Smart Grid Solutions
• Aggregator - this allows you to place the pulse register
into a separate accumulation register that can aggre-
gate (add) or net (subtract) values.
• User Assigned Label - this window allows you to enter a label designation for the
source.
3. When all data has been entered, click OK to return to the main Device Profile
screen. For any changes to take effect, you must click the Update Device button
to send the new profile to the meter.
19.6: Power Quality and Alarm Settings
Power Quality and Alarm Settings are the third group of settings in the Device Profile.
1. From the Device Profile screen (see Section 19.3), click on the + button next to
Power Quality and Alarm Settings or double-click on the Power Quality and Alarm
Settings line. All of the settings in this group are listed.
2. Click on the programmable setting you want to modify. The following sections
explain the settings in the order in which they appear in the Power Quality and
Alarm Settings menu.
NOTE: The menu above shows the Relay Assignments setting, which you will see if
you have a Relay Output Option card in your meter. If you have a Digital Input
Option card in your meter, you will see the Digital Inputs setting (shown on the
right).

Doc# E107707 19 - 45
19: Nexus® 1500 Meter
Electro Industries/GaugeTechThe Leader In Power Monitoring and Smart Grid SolutionsElectro Industries/GaugeTechThe Leader In Power Monitoring and Smart Grid Solutions
19.6.1: Limits
Limits are threshold settings that can be set by a user to trigger a record in a log
when an alarm condition is met. Utilizing the limits, the user can then control a relay
or send a warning email on that alarm.
Limit settings are based on a percentage of the Full Scale (% of FS), which is set in
the Limit and Waveform Full Scales setting (Section 19.4.2). Full Scale is based on CT
and PT ratios set in the CT, PT Ratios and System Hookup setting (Section 19.4.1).
Limits are based on a percent of Full Scale settings so that the same settings can be
used no matter what the CT and PT Ratio needed.
Before programming limits, set the CT and PT ratios. Then, set the Limit and Wave-
form Full Scales if you want to change to automatic configuration. In most cases the
software will configure the Full Scale optimally.
NOTE: The software automatically updates the Full Scale; however, you can set it
separately from the CT and PT Ratios.
1. From the Power Quality and Alarm Settings menu, click on the + button next to
Limits or double-click on the Limits line. You will see the submenu below.
This submenu displays the current Device Profile Limit settings. Not all limits are
shown in the figure: there are 32 Limit ID fields.

Doc# E107707 19 - 46
19: Nexus® 1500 Meter
Electro Industries/GaugeTechThe Leader In Power Monitoring and Smart Grid SolutionsElectro Industries/GaugeTechThe Leader In Power Monitoring and Smart Grid Solutions
2. Double-click on any of the settings (Limit ID 01, for example). You will see the
Limits screen, shown below.
• This screen can be expanded to show all of the limits. Click on the top or
bottom of the screen to display sizing arrows you can click on and drag to
expand the screen.
• Percentage of Full Scale settings (% of FS): The limits are set in % of Full Scale
so that when you create a profile, you can keep your settings. This is true, even
though the CT and PT ratios change when the meter (or a new meter) is placed
in a different location. Changing the CT and PT ratios does not affect the % of
Full Scale limits previously set. This is useful when you are using large numbers
of meters.
3. Make changes to this screen according to your application requirements.

Doc# E107707 19 - 47
19: Nexus® 1500 Meter
Electro Industries/GaugeTechThe Leader In Power Monitoring and Smart Grid SolutionsElectro Industries/GaugeTechThe Leader In Power Monitoring and Smart Grid Solutions
• To set the type of limit and the channel assigned to it, double-click in either
the Limit ID or Assigned Item column. You will see the screen shown below.
From the pop-up menus, choose the desired settings and click OK. Following is a
list of the available Groups, Sub Groups, and Items.
Group: Measured Values
Sub Group: High Speed Updated
Item: Voltage A-N
Voltage B-N
Voltage C-N
Voltage Aux
Current A
Current B
Current C
Current N Measured
Voltage A-B
Voltage B-C
Voltage C-A
VA A
VA B
VA C
VA Total
VAR A
VAR B
VAR C
VAR Total
Watt A
Watt B
Watt C
Doc# E107707 19 - 48
19: Nexus® 1500 Meter
Electro Industries/GaugeTechThe Leader In Power Monitoring and Smart Grid SolutionsElectro Industries/GaugeTechThe Leader In Power Monitoring and Smart Grid Solutions
Watt Total
Frequency
Power Factor A
Power Factor B
Power Factor C
Power Factor Total
Volts A-Aux Phase Angle
Sub Group: One second updated
Item: Voltage A-N
Voltage B-N
Voltage C-N
Voltage Aux
Current A
Current B
Current C
Current N Measured
Current N Calculated
Voltage A-B
Voltage B-C
Voltage C-A
VA A
VA B
VA C
VA Total
VAR A
VAR B
VAR C
VAR Total
Watt A
Watt B
Watt C
Watt Total
Frequency
Power Factor A
Power Factor B
Power Factor C

Doc# E107707 19 - 49
19: Nexus® 1500 Meter
Electro Industries/GaugeTechThe Leader In Power Monitoring and Smart Grid SolutionsElectro Industries/GaugeTechThe Leader In Power Monitoring and Smart Grid Solutions
Power Factor Total
Voltage Imbalance
Current Imbalance
Uncompensated VA A
Uncompensated VA B
Uncompensated VA C
Uncompensated VA Total
Uncompensated VAR A
Uncompensated VAR B
Uncompensated VAR C
Uncompensated VAR Total
Uncompensated Watt A
Uncompensated Watt B
Uncompensated Watt C
Uncompensated Watt Total
THD Volts A
THD Volts B
THD Volts C
THD Current A
THD Current B
THD Current C
K Factor Current A
K Factor Current B
K Factor Current C
Internal Temperature
TDD Volts A
TDD Volts B
TDD Volts C
TDD Current A
TDD Current B
TDD Current C
Sub Group: Harmonic Values
Item: 0 - 127th Harmonic on selectable Harmonic Magnitude
(Voltage Phases A, B, and C; Current Phases A, B, and C)
Sub Group: Internal Inputs, States
Item: Internal Inputs 1-8

Doc# E107707 19 - 50
19: Nexus® 1500 Meter
Electro Industries/GaugeTechThe Leader In Power Monitoring and Smart Grid SolutionsElectro Industries/GaugeTechThe Leader In Power Monitoring and Smart Grid Solutions
Sub Group: Phase Angles
Item: Phase A-N Voltage
Phase B-N Voltage
Phase C-N Voltage
Phase A Current
Phase B Current
Phase C Current
Phase A-B Voltage
Phase B-C Voltage
Phase C-A Voltage
Volts A-Aux Phase Angle
Voltage Phase Sequence
Sub Group: Flicker
Item: Flicker: PInst Volts A
Flicker: PInst Volts B
Flicker: PInst Volts C
Flicker: PST Volts A
Flicker: PST Volts B
Flicker: PST Volts C
Flicker: PLT Volts A
Flicker: PLT Volts B
Flicker: PLT Volts C
Group: Averages
Sub Group: Thermal Average
Item: Voltage A-N
Voltage B-N
Voltage C-N
Voltage Aux
Current A
Current B
Current C
Current N Measured
Current N Calculated
Voltage A-B
Voltage B-C
Voltage C-A

Doc# E107707 19 - 51
19: Nexus® 1500 Meter
Electro Industries/GaugeTechThe Leader In Power Monitoring and Smart Grid SolutionsElectro Industries/GaugeTechThe Leader In Power Monitoring and Smart Grid Solutions
VA A
VA B
VA C
VA Total
VAR A
VAR B
VAR C
VAR Total
Watt A
Watt B
Watt C
Watt Total
Frequency
Power Factor A
Power Factor B
Power Factor C
Power Factor Total
Voltage Imbalance
Current Imbalance
Sub Group: Block Window Average
Item: VA
VAR
Watt
Sub Group: Pulse Accumulation/Aggregation Block Window Average
Item: Internal Inputs #1 - #8
Aggregators #1 - #4
Sub Group: Rolling Window Average
Item: Predictive VA
Predictive VAR
Predictive Watt
VA
VAR
Watt
Sub Group: Voltage and Current Means
Item: Volts PN
Current P

Doc# E107707 19 - 52
19: Nexus® 1500 Meter
Electro Industries/GaugeTechThe Leader In Power Monitoring and Smart Grid SolutionsElectro Industries/GaugeTechThe Leader In Power Monitoring and Smart Grid Solutions
Volts PP
Group: External I/O Devices
Sub Group: Analog Input Modules
Item: Module 1: Analog Input 1 - Analog Input 8
Module 2: Analog Input 1 - Analog Input 8
Module 3: Analog Input 1 - Analog Input 8
Module 4: Analog Input 1 - Analog Input 8
• To designate the limit as either above or below a percentage of the Full Scale,
click once in each Settings column and select the desired setting from the pull-
down menu.
• To set the percentage of the Full Scale that will trip the limit, enter the value in
the % of FS column. Communicator EXT automatically calculates the Primary
value.
• Combination Limit 3 is the logical combination of Limit 1's state and Limit 2's
state.
Example 1
Limit I D
Type: 1 Second Readings
Channel: Volts AN
Limit 1 Setting: Limit exceeded if Volts AN is below 12V.
Limit 2 Setting: Limit exceeded if Volts AN is above 132V.
Combination Limit 3 Setting: AND - If Limit 1 AND Limit 2 are exceeded then
Limit 3 is exceeded.
Example 2
Limit I D
Type: 1 Second Readings
Channel: Volts AN
Limit 1 Setting: Limit exceeded if Volts AN is below 12V.
Limit 2 Setting: Limit exceeded if Volts AN is above 132V.
Combination Limit 3 Setting: OR - If Limit 1 OR Limit 2 is exceeded then Limit 3
is exceeded.

Doc# E107707 19 - 53
19: Nexus® 1500 Meter
Electro Industries/GaugeTechThe Leader In Power Monitoring and Smart Grid SolutionsElectro Industries/GaugeTechThe Leader In Power Monitoring and Smart Grid Solutions
• Full Scales settings are shown in the lower left of the screen. These values are
set in the Limits and Waveform Full Scales section of the Device Profile (Section
19.4.2).
4. Power Factor is broken into four quadrants. This screen lets you set a limit in two
of the four quadrants.
• To set the power factor limits, double click on any of the power factor settings in
the Limit 1 or Limit 2 columns. You will see the Power Factor screen.
• To set a limit: from the pull-down menus, select a quadrant and Less Than or
Greater Than (Full Scales). Enter the power factor number. The graph will
illustrate your selections by shading the out of limit bands. The area of the
graph not covered by shading is within normal operational range.
NOTE: Whether you see method 1 Quadrants (Q1 +Lag, Q2 -Lag, Q3 -Lead,
Q4 +Lead) or method 2 Quadrants (Q1 +Lag, Q2 -Lead, Q3 +Lag, Q4 -Lead)
depends on the setting in the Power Factor Display field of the Labels setting
(see Section 19.4.4).
NOTE: The Nexus® 1500 device is a four-quadrant meter. Therefore, limits can be
set for capacitive and inductive PF when generating or consuming power.

Doc# E107707 19 - 54
19: Nexus® 1500 Meter
Electro Industries/GaugeTechThe Leader In Power Monitoring and Smart Grid SolutionsElectro Industries/GaugeTechThe Leader In Power Monitoring and Smart Grid Solutions
3. When all settings are complete, click OK to return to the main Device Profile
screen. For any changes to take effect, you must click the Update Device button
to send the new profile to the meter.
19.6.2: ElectrologicTM Relay Control
1. From the Power Quality and Alarm Settings menu, double-click on the Electro-
Logic™ Relay Control line. You will see the screen shown below.
ElectroLogicTM Relay Control lets you set up a logic tree to control the meter’s
optional relays. Each relay can be programmed individually. The end result of the
logic tree is to set, or not set, a relay, with an optional programmed Set Delay and/
or Reset Delay. The initial inputs to the logic tree are chosen from among the 32
Limits and 40 Digital Inputs (both internal and external inputs). The gates, in
several stages, perform logical combinations (AND, OR, etc) on pairs of inputs
(either initial inputs or the outputs of earlier gates), and in combination produce an
ultimate "true" or "false" state to drive the relay open or closed.
For example, one of the gates is AND. For data to pass an AND gate, both pieces of
data must be “true.” For a Limit to be true, the data must be in the Out-of-Limit
condition on either Limit 1, Limit 2, or both (you decide which). For a Digital Input
to be true, it must be in the condition you specify - either Open or Shorted.

Doc# E107707 19 - 55
19: Nexus® 1500 Meter
Electro Industries/GaugeTechThe Leader In Power Monitoring and Smart Grid SolutionsElectro Industries/GaugeTechThe Leader In Power Monitoring and Smart Grid Solutions
The gates used in ElectroLogicTM Relay Control are used as follows:
OR: If either or both of the two conditions are true, the gate is passed
AND: If both of the conditions are true, the gate is passed
Hysteresis: For Limits only, the if the Limit is within the programmed hysteresis
value, the gate is passed
XOR: If either of the two conditions are true, but not both, the gate is passed
NOR: If either of the two conditions are true, the gate is not passed
NAND: If both of the two conditions are true, the gate is not passed
NHysteresis: For limits only, if the Limit is within the programmed hysteresis value,
the gate is not passed
NXOR: If either of the two conditions are true, but not both, the gate is not passed
NOTE: See Example settings on page 19-57.
2. To assign an item to the Relay Logic tree:
a. Select the relay card/module from the pull-down menu in the upper right of the
screen.
b. Select an input for the tree by clicking on a radio button next to numbers 1
through 8.
c. Choose Limits or Digital Inputs by clicking on the radio button in front of the
word.
d. From the pull-down menus, select the limit (Limit ID) or input (Input ID) you
want to assign to this Relay Logic tree input (step b).
• For a limit, use the second pull-down menu to select Limit 1, Limit 2, or
Combination.
• For an input, use the second pull-down menu to select Shorted or Open.
e. Press Set to confirm your selection. The software places the selection in the
appropriate field in the screen.
3. After you assign all the Relay Logic inputs, select the gates that will be used to
combine the logic to trigger the relay. To select a gate type, either:
• Click on the gate (yellow fields).

Doc# E107707 19 - 56
19: Nexus® 1500 Meter
Electro Industries/GaugeTechThe Leader In Power Monitoring and Smart Grid SolutionsElectro Industries/GaugeTechThe Leader In Power Monitoring and Smart Grid Solutions
• Choose a gate type from the pull-down menu below the gate.
4. If you want, select Set Delay and Reset Delay from the pull-sown menus. You can
choose between 0 and 255 seconds. Use these fields if you want to program a delay
before the relay is set, or before it is reset.
5. To change items on the Relay Logic tree, use the following steps:
• To change the selected relay and/or relay modules, select the relay/module from
the pull-down menu at the upper right hand corner of the screen.
• To change the Set delay, select it from the pull-down menu in the Set Delay field.
• To change the Reset delay, select it from the pull-down menu in the Reset Delay
field.
• To clear an item from the Relay tree, click on that item and click the Clear
button.
• To clear all items from the Relay Tree, click the Clear Assigned Items button.
6. When all settings are complete, click OK to return to the main Device Profile
screen. For any changes to take effect, you must click the Update Device
button to send the new profile to the meter.
NOTE: In order to use this screen, you must have purchased at least one Relay
Option card or one External Relay Output module. For more details on external Output
modules, see Chapter 11.

Doc# E107707 19 - 57
19: Nexus® 1500 Meter
Electro Industries/GaugeTechThe Leader In Power Monitoring and Smart Grid SolutionsElectro Industries/GaugeTechThe Leader In Power Monitoring and Smart Grid Solutions
Example of an ElectroLogicTM Relay Logic Tree:
Inputs 1 through 8 are set to High Speed Volts AN Limit 1, High Speed Amps A Limit
1, High Speed Volts BN Limit 1, High Speed Amps B Limit 1, High Speed Volts CN
Limit 1, High Speed Amps C Limit 1, Not Set and Not Set. The four first gates are AND
gates, and the remaining three gates are OR gates.
Each first level gate looks at the state of the two limits, and the result is "true" if and
only if both the inputs (Voltage Limit and Current Limit) are "true" (Out-of-Limit Con-
dition). The second and third level gates look at the state of the earlier gates, and
their results are "true" if either one (or both) of the previous gates are "true". The end
result is a relay that is energized if one or more of the three phases (A, B, and/or C) is
currently Out-of-Limit on both its voltage and current Limit 1 tests.
bItems 1-8
Gates 1-4Gates 5 and 6 Final Gate

Doc# E107707 19 - 58
19: Nexus® 1500 Meter
Electro Industries/GaugeTechThe Leader In Power Monitoring and Smart Grid SolutionsElectro Industries/GaugeTechThe Leader In Power Monitoring and Smart Grid Solutions
19.6.3: Relay Assignments (Relay Output Option Card)
This setting allows you to label relays and their states and to set manual control of
relays.
1. From the Power Quality and Alarm Settings menu, click on the + button next to
Relay Assignments or double-click on the Relay Assignments line. You will see the
submenu shown below (the number of Relay Out cards you see depends on your
meter’s configuration).
2. Click the Relay card you want to configure. You will see the screen shown below.
3. You can enter a label for the:
• Relay, which can be used to describe what the relay is used for, attached
to, its function, or its purpose
• Common shorted to N.C condition, which can be used to describe the
condition or state when the relay’s common connection is shorted to the
N.C. connection
• Common shorted to N.O. condition, which can be used to describe the
condition or state when the relay’s common connection is shorted to the
N.O. connection

Doc# E107707 19 - 59
19: Nexus® 1500 Meter
Electro Industries/GaugeTechThe Leader In Power Monitoring and Smart Grid SolutionsElectro Industries/GaugeTechThe Leader In Power Monitoring and Smart Grid Solutions
4. If you want to set any of the relays so that they can only be controlled manually,
click the Lock to Manual Control checkbox. Then use the Relay Control feature (see
Section 19.15) to manually change the state of the relay.
5. When all settings are complete, click OK to return to the main Device Profile
screen. For any changes to take effect, you must click the Update Device
button to send the new profile to the meter.
19.6.4: Digital Inputs (Digital Inputs Option Card)
This setting allows you to configure the Digital Inputs Option card(s).
1. From the Power Quality and Alarm Settings menu, click on the + button next to
Digital Inputs or double-click on the Digital Inputs line. You will see the submenu
shown below (the number of Digital Input cards you see depends on your meter’s
configuration).
2. Click the Digital Input card you want to configure. You will see the screen shown
below.

Doc# E107707 19 - 60
19: Nexus® 1500 Meter
Electro Industries/GaugeTechThe Leader In Power Monitoring and Smart Grid SolutionsElectro Industries/GaugeTechThe Leader In Power Monitoring and Smart Grid Solutions
3. For each of the 16 inputs, you can enter a label for the:
• Channel, which can be used to describe its function or its purpose
• Open condition
• Closed condition
4. For each of the inputs, select the Normal state from the pull-down menu.
5. When all settings are complete, click OK to return to the main Device Profile
screen. For any changes to take effect, you must click the Update Device
button to send the new profile to the meter.
19.6.5: PQ Thresholds (Waveform Recording)
The Power Quality (PQ) and Waveform Thresholds setting determines at what point
the Nexus® 1500 meter executes a waveform capture and/or records a power
quality event.
See Chapter 8 for instructions on viewing Waveform and PQ logs.
PQ and Waveform Thresholds are given as a percentage of the Full Scales (% of FS)
or a sliding reference voltage. Set the Full Scales in the Limits and Waveform Full
Scales setting of the Device Profile (see Section 19.4.2). Full Scales are based on the
CT and PT ratios set in the CT, PT Ratios and System Hookup setting of the Device
Profile (see Section 19.4.1).
Before programming the PQ and Waveform Thresholds, set the CT and PT ratios and
the Limits and Waveform Full Scales.
Note on Sampling Rate: A higher sampling rate allows for transients to be
monitored. Generally, the meter is set to take 1024 samples per cycle for this pur-
pose. Lower sampling rates have advantages, however, because they allow you to
record more cycles of information per event screen. Therefore, low sampling rates are
better for long duration events, like motor starts or distribution faults. The meter
enables you to tailor its recording for both these applications. For more information on
sampling rate, see the table on page 19-65.

Doc# E107707 19 - 61
19: Nexus® 1500 Meter
Electro Industries/GaugeTechThe Leader In Power Monitoring and Smart Grid SolutionsElectro Industries/GaugeTechThe Leader In Power Monitoring and Smart Grid Solutions
1. From the Power Quality and Alarm Settings menu, double-click on the PQ
Thresholds (Waveform Recording) line. You will see the screen shown below.
This screen allows you to set the Voltage RMS triggers, the current RMS triggers,
and the Voltage transients triggers for waveform recording. It also allows you to set
the Voltage interruption settings for IEC61000-4-30 recording. Use the tabs at the
top of the screen to navigate between the Voltage, current, and Voltage transient
and interruption settings.
NOTES:
• The Waveform clipping threshold for the Nexus® 1500 meter is 66.7A RMS
on the secondary side of all channels.
• The High Speed Inputs field allows you to see which High Speed input is enabled
for Waveform recording. You assign the High Speed input to its trigger in the
High Speed Inputs screen (see Section 19.6.10).
• Voltage and current Full Scale values are shown in the lower left corner of the
screen.

Doc# E107707 19 - 62
19: Nexus® 1500 Meter
Electro Industries/GaugeTechThe Leader In Power Monitoring and Smart Grid SolutionsElectro Industries/GaugeTechThe Leader In Power Monitoring and Smart Grid Solutions
2. The Voltage setpoints are used to record voltage type events, such as voltage
surges and sags. To set the Voltage RMS triggers for a PQ event and waveform
capture (Voltage RMS Triggers tab):
a. Select either Fixed RMS or USR (radio buttons).
NOTE on USR Setting: The USR setting lets you configure waveform capture
thresholds based on sliding reference voltage rather than Full Scale.
The formula used is as follows:
Usrn = 0,9967 x Usr (n-1) + 0, 0033 x U(10/12)rms
where
Usrn is the present value of the sliding reference voltage;
Usr (n-1) is the previous value of the sliding reference voltage; and
U(10/12)rms is the most recent 10/12-cycle r.m.s.value.
When the measurement is started, the initial value of the sliding reference voltage is
set to the programmed input voltage. The sliding reference voltage is computed every
10/12-cycles. If a 10/12-cycle is flagged as being out-of-limits, that voltage is not
used - the previous sliding reference voltage is used instead.
b. If you select Fixed RMS:
i. Enter the desired percentage of Full Scale in the Value(%) column of the
Above setpoints and Below setpoints sections. After you make an entry,
the Primary field (display only) adjusts accordingly.
ii.Enter the desired percentage for Return Hysteresis for the Above and
Below setpoints. After you make an entry, the Primary field (display only)
adjusts accordingly.
iii.Click the box(es) to enable Waveform Recording (Waveform Enable box)
and/or PQ Recording (PQ Enable box).
c. If you select USR:
i. Enter the desired percentage of the sliding reference voltage in the
Value(%) column of the Above setpoints and Below setpoints sections.

Doc# E107707 19 - 63
19: Nexus® 1500 Meter
Electro Industries/GaugeTechThe Leader In Power Monitoring and Smart Grid SolutionsElectro Industries/GaugeTechThe Leader In Power Monitoring and Smart Grid Solutions
ii.Click the box(es) to enable Waveform Recording (Waveform Enable box)
and/or PQ Recording (PQ Enable box).
3. To set the current RMS triggers for a PQ event and waveform capture (Current RMS
Triggers tab):
a. Enter the desired percentage of Full Scale in the Value(%) column of the Above
setpoints and Below setpoints sections. After you make an entry, the Primary
field (display only) adjusts accordingly.
b. Enter the desired percentage for Return Hysteresis for the Above and Below
setpoints. After you make an entry, the Primary field (display only) adjusts
accordingly. Hysteresis is the value that must be met for the Out-of-Limit condi-
tion to be considered within Limits.
c. Click the box(es) to enable Waveform Recording (Enable box) and/or PQ Record-
ing (PQ Enable box).
NOTE: The current set points are used to record faults on the line or in-rush
currents from devices such as motors. Typically, to catch these events, set the
limit to above 200% of Full Scale. As a general rule you do not want to set 1.
any below current thresholds because that will trigger waveforms when the cur-
rent drops or, 2. any above current thresholds within possible current load.
Either of these settings will constantly trigger waveforms.
4. To set the Voltage transients trigger for a waveform capture and Voltage
interruptions trigger for IEC61000-4-30 recording (Voltage Transients and
Interruptions tab):
a. Enter the desired percentage of Full Scale in the Value(%) column of the voltage
Transients Above setpoints section (there are no Below setpoints for Voltage
transients). After you make an entry, the Primary field (display only) adjusts
accordingly.
b. Click the box(es) to enable PQ event recording (Enable box) and/or Waveform
(Trigger Waveform on Transient box).
c. Enter the desired percentage of Full Scale in the Value (%) field and in the
Return Hysteresis field in the IEC61000-4-30 Voltage Interruptions section.
After you make an entry, the Primary field (display only) adjusts accordingly.

Doc# E107707 19 - 64
19: Nexus® 1500 Meter
Electro Industries/GaugeTechThe Leader In Power Monitoring and Smart Grid SolutionsElectro Industries/GaugeTechThe Leader In Power Monitoring and Smart Grid Solutions
5. Select the number of samples per cycle to be recorded from the Sampling Rate
field's pull- down menu. Choose from 16, 32, 64, 128, 256, 512 or 1024 samples
per cycle. The number of samples per cycle you choose above 128 samples per
cycle affects the number of cycles per capture.
The following table shows the effects of Sampling Rate on the number of cycles
captured. Increasing the Sampling Rate increases Waveform resolution, but for
higher sampling rates reduces the length of the observed window. The approximate
length of the observed window is shown in the last column.
NOTES:
• The table shows sampling data for 60 Hz systems.
• The table shows values for one waveform capture window. If you have
more than one waveform capture window, the maximum time per
capture increases.

Doc# E107707 19 - 65
19: Nexus® 1500 Meter
Electro Industries/GaugeTechThe Leader In Power Monitoring and Smart Grid SolutionsElectro Industries/GaugeTechThe Leader In Power Monitoring and Smart Grid Solutions
* Each Window contains the number of cycles listed but multiple windows are
supported so that the total number of cycles captured is only limited by the memory
allocated.
6. You can select Frequency - either 60Hz or 50Hz - from the pull-down menu.
7. From the Pre-Trigger Cycles and Post-Trigger Cycles fields' pull-down menus, select
the number of cycles you want to record before and/or after the triggered
recording. The maximum total number of pre- and post-trigger cycles is one less
than the maximum number of cycles per capture. See the table above for the
maximum cycles per capture for each sampling rate.
8. You can select total waveform capture windows per event, if the sampling rate is
less than 1024. With a sampling rate less than 1024, you can set between 1 and
65536 windows per event. If the sampling rate is 1024 only 1 window per event is
captured.
NOTE: When you select more than one window per event, the Post-Trigger Cycles
field cannot be changed. It will be fixed as the maximum number of cycles per
capture minus the number of pre-trigger cycles. See the table above for the
maximum cycles per capture for each sampling rate.
Note on CBEMA (PQ Recording): CBEMA plotting is a power quality
standard known worldwide for recording the amount of damage Voltage transient
conditions have done to the equipment being monitored. The meter automatically
records this information. For CBEMA purposes, program internal set points for Volt-
age below 90% and above 110% of Full Scale (+/- 10% from the nominal
Nexus 1500 Sampling Rate Chart (at 60Hz)
Samples per Cycle Channels Samples per
Channel
Cycles per Channel per
Window*
Time (appro.)
Analog pts Digital Inputs16 6 8 2880 180 3 sec32 6 8 5760 180 3 sec64 6 8 11520 180 3 sec128 6 8 23040 180 3 sec256 6 8 30720 120 2 sec512 6 8 30720 60 1 sec1024 6 8 40960 40 0.6 sec

Doc# E107707 19 - 66
19: Nexus® 1500 Meter
Electro Industries/GaugeTechThe Leader In Power Monitoring and Smart Grid SolutionsElectro Industries/GaugeTechThe Leader In Power Monitoring and Smart Grid Solutions
Voltage). These set points are defined by the ITI (CBEMA) specification. The ITI
(CBEMA) Curve is published by Information Technology Industry Council (ITI) and
is available online.
You can set a recording with tighter Voltage limits to trigger a waveform recording.
However, CBEMA plotting is based only on the limits internally set.
9. When all changes are entered, click OK to return to the main Device Profile screen.
For any changes to take effect, you must click the Update Device button to send
the new profile to the meter.
19.6.6: EN50160/IEC61000-4-30 Flicker
The Nexus® 1500 meter can record flicker values in two independent logs. When
flicker is enabled, entries are made into the logs when the associated values occur.
Pst, Pst Max, Pst Min, Plt, Plt Max, Plt Min, start/reset and stop times are all recorded.
All values can be downloaded to the Log Viewer where they are available for graphing
or export to another program, such as Excel. Refer to Chapter 8 for
additional information on viewing logs.
NOTE: The meter is calculating its Flicker based upon the EN61000-4-15 standard
which is referenced in the EN61000-4-30 standard. The accuracy requirements for
this instrument are within the Class A standards for Flicker measurements.
You must set up several parameters to properly configure flicker logging.
1. From the Power Quality and Alarm Settings menu, double-click on the EN50160/
IEC61000-4-30 line. Depending on your current setting, you will see one of the
following screens.

Doc# E107707 19 - 67
19: Nexus® 1500 Meter
Electro Industries/GaugeTechThe Leader In Power Monitoring and Smart Grid SolutionsElectro Industries/GaugeTechThe Leader In Power Monitoring and Smart Grid Solutions

Doc# E107707 19 - 68
19: Nexus® 1500 Meter
Electro Industries/GaugeTechThe Leader In Power Monitoring and Smart Grid SolutionsElectro Industries/GaugeTechThe Leader In Power Monitoring and Smart Grid Solutions
2. The Nexus® 1500 meter can use Historical logs 7 and 8 to record the results of
flicker testing: you will see the first screen if EN50160/IEC61000-4-30 logging has
not been selected for the meter; you will see the second screen if it has already
been selected.
• If you see the first screen, click Auto-Configure. Historical logs 7 and 8
will now be used for EN50160/IEC61000-4-30 logging, only.
NOTE: It takes a week for the meter to collect all the necessary data for
the analysis.
NOTE: If EN50160/IEC61000-4-30 recording is already active and you
want to disable it, click Enable Logs 7 and 8. This will disable the
EN50160/IEC61000-4-30 logging in Historical logs 7 and 8.
IMPORTANT! The EN50160/IEC61000-4-30 log will no longer be correct.
3. Make the following selections/entries:
a. IEC 61000-4-30 Class A:
• Enter the nominal Voltage in secondary (range from 40V to 600V).
• Select the frequency (50 or 60Hz).
b. IEC 61000 4-30 Flicker:
• Select the short term test time (1-10 minutes, in minute increments).
• Select the long term test time (10-240 minutes, in ten minute
increments).
c. EN 50160:
• Select the number of allowed rapid Voltage changes per day (1- 50).
• Select the synchronous connection status (Yes or No: yes for a system
with a synchronous connection to another system, no if there is no such
synchronous connection).
Doc# E107707 19 - 69
19: Nexus® 1500 Meter
Electro Industries/GaugeTechThe Leader In Power Monitoring and Smart Grid SolutionsElectro Industries/GaugeTechThe Leader In Power Monitoring and Smart Grid Solutions
• Select the number of allowed long interruptions (0-100).
• Select how often RMS is updated for rapid Voltage data source (1 cycle or
10/12 cycles).
• Select the upper limit for the supply Voltage unbalance (less than or
equal to 2% or 3%).
• Select the Voltage dip concern threshold (greater than or equal to 10%-
85%).
• Select the first day of the week (Sunday or Monday).
• Enter the Mains signalling threshold.
• Enter the Mains signalling Interharmonic frequency.
d. Phase Conductors to Earth Thresholds in percentage of Full Scale:
• Enter the value for A-E, B-E, and C-E.
• Enter the value for N-E.
5. When all changes are entered, click OK to return to the main Device Profile screen.
For any changes to take effect, you must click the Update Device button to send
the new profile to the meter.

Doc# E107707 19 - 70
19: Nexus® 1500 Meter
Electro Industries/GaugeTechThe Leader In Power Monitoring and Smart Grid SolutionsElectro Industries/GaugeTechThe Leader In Power Monitoring and Smart Grid Solutions
19.6.7: I Squared T and V Squared T Thresholds
With the I Squared T and V Squared T Thresholds screen, you can set the point at
which the meter accumulates current and Voltage. This feature is used to calculate
wear on circuit breaker contacts.
1. From the Power Quality and Alarm Settings menu, click on the + button next to I
Squared T and V Squared T Thresholds or double-click on that line. You will see the
submenu shown below, which shows the current settings for the meter.
2. Double-click one of the settings to open the I Squared T and V Squared T
Thresholds screen, shown below.
3. Enter the thresholds in the I Squared T and V Squared T fields.
4. Click OK to exit the screen and return to the main Device Profile screen. For any
changes to take effect, you must click the Update Device button to send the new
profile to the meter.

Doc# E107707 19 - 71
19: Nexus® 1500 Meter
Electro Industries/GaugeTechThe Leader In Power Monitoring and Smart Grid SolutionsElectro Industries/GaugeTechThe Leader In Power Monitoring and Smart Grid Solutions
19.6.8: TDD Maximum Demand Reference Values
This setting of the Device Profile allows you to set the maximum value for voltage and
current, which is used when the meter calculates TDD (Total Demand Distortion). TDD
and THD (Total Harmonic Distortion) are both indices used to measure harmonics.
TDD is defined in the IEEE 519 Standard, “Recommended Practices and Requirements
for Harmonic Control in Electrical Power Systems” as “the total root-sum-square har-
monic current distortion in percent of the maximum load current.” It gives a better
indication of the impact of distortion on Demand than THD which analyzes the har-
monic distortion relative to the fundamental, without consideration of load.
1. From the Power Quality and Alarm Settings menu, double-click on the TDD
Maximum Demand Reference Values. You will see the screen below.
2. Enter the maximum values for voltage and current.
3. Click OK to exit the screen and return to the main Device Profile screen. For any
changes to take effect, you must click the Update Device button to send the new
profile to the meter.

Doc# E107707 19 - 72
19: Nexus® 1500 Meter
Electro Industries/GaugeTechThe Leader In Power Monitoring and Smart Grid SolutionsElectro Industries/GaugeTechThe Leader In Power Monitoring and Smart Grid Solutions
19.6.9: High Speed Inputs
This setting of the Device Profile enables you to label the eight High Speed inputs and
to specify their status. Labeling the inputs allows you to determine the source of
status change when data is later analyzed.
1. From the Power Quality and Alarm Settings menu, double-click on the High Speed
Inputs line or click on the + button next to it. You will see the submenu shown
below.
2. Double-click any of the Input lines. You will see the screen below.
3. Double-click a field to enter the following:
• Name
• Open Label
• Shorted Label
• Normal Condition
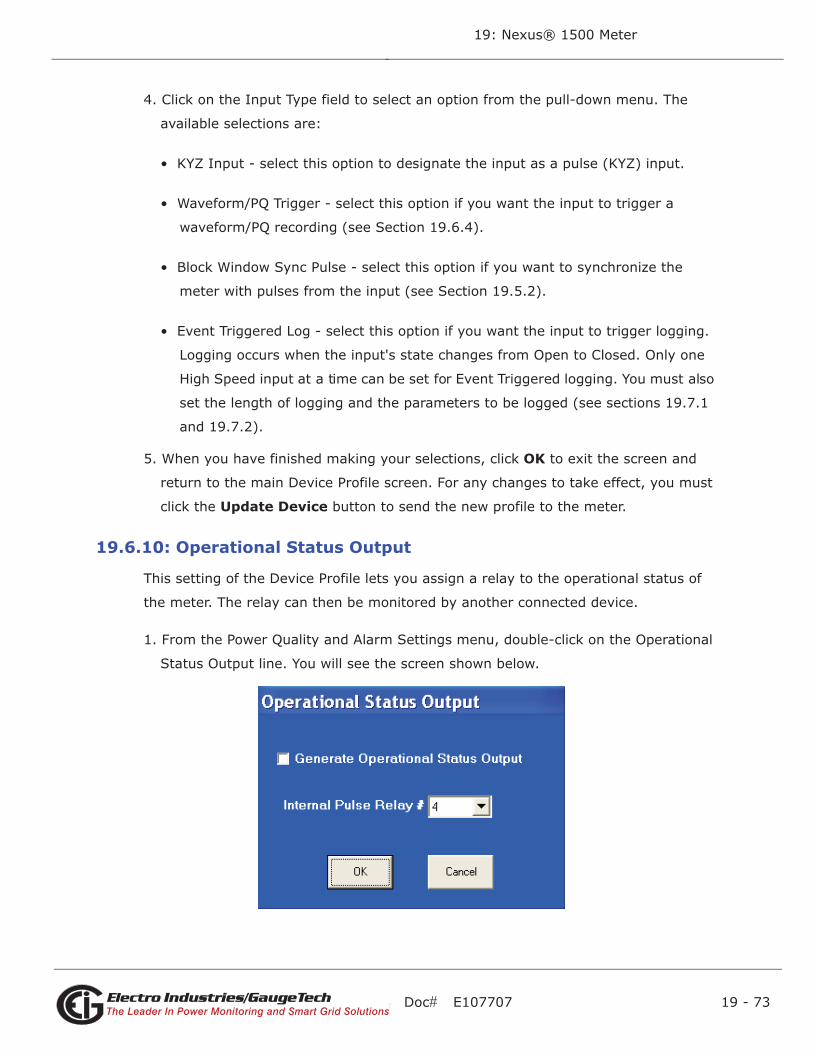
Doc# E107707 19 - 73
19: Nexus® 1500 Meter
Electro Industries/GaugeTechThe Leader In Power Monitoring and Smart Grid SolutionsElectro Industries/GaugeTechThe Leader In Power Monitoring and Smart Grid Solutions
4. Click on the Input Type field to select an option from the pull-down menu. The
available selections are:
• KYZ Input - select this option to designate the input as a pulse (KYZ) input.
• Waveform/PQ Trigger - select this option if you want the input to trigger a
waveform/PQ recording (see Section 19.6.4).
• Block Window Sync Pulse - select this option if you want to synchronize the
meter with pulses from the input (see Section 19.5.2).
• Event Triggered Log - select this option if you want the input to trigger logging.
Logging occurs when the input's state changes from Open to Closed. Only one
High Speed input at a time can be set for Event Triggered logging. You must also
set the length of logging and the parameters to be logged (see sections 19.7.1
and 19.7.2).
5. When you have finished making your selections, click OK to exit the screen and
return to the main Device Profile screen. For any changes to take effect, you must
click the Update Device button to send the new profile to the meter.
19.6.10: Operational Status Output
This setting of the Device Profile lets you assign a relay to the operational status of
the meter. The relay can then be monitored by another connected device.
1. From the Power Quality and Alarm Settings menu, double-click on the Operational
Status Output line. You will see the screen shown below.

Doc# E107707 19 - 74
19: Nexus® 1500 Meter
Electro Industries/GaugeTechThe Leader In Power Monitoring and Smart Grid SolutionsElectro Industries/GaugeTechThe Leader In Power Monitoring and Smart Grid Solutions
2. Select the relay you want to assign from the pull-down menu and click the check-
box.
3. When you finish making your selections, click OK to exit the screen and return to
the main Device Profile screen. For any changes to take effect, you must click the
Update Device button to send the new profile to the meter.
19.6.11: Short Term Maximum, Minimum and Average Interval
This setting of the Device Profile lets you assign a Voltage reading type and Historical
log (Trending log) for the maximum, minimum, and average readings in the interval.
1. From the Power Quality and Alarm Settings menu, double-click on the Short Term
Maximum, Minimum and Average Interval line. You will see the screen shown
below.
2. From the pull-down menus, select:
• Voltage reading type - can be 1 cycle updated, 10/12 cycle updated, 3 second
updated or 10 minute updated.
• Trending log - can be Historical logs 3 - 8. The interval programmed for each log
(see Section 19.7.1) is also displayed.
3. When you finish making your selections, click OK to exit the screen and return to
the main Device Profile screen. For any changes to take effect, you must click the
Update Device button to send the new profile to the meter.

Doc# E107707 19 - 75
19: Nexus® 1500 Meter
Electro Industries/GaugeTechThe Leader In Power Monitoring and Smart Grid SolutionsElectro Industries/GaugeTechThe Leader In Power Monitoring and Smart Grid Solutions
19.7: Trending Profile Settings
This section of the Device Profile enables you to configure parameters for the Nexus®
1500 meter's eight historical logs and the Event Triggered log.
1. From the Device Profile screen (see Section 19.3), click on the + button next to
Trending Profile Settings or double-click on the Trending Profile Settings line. You
will see the menu shown below.
2. Double-click on one of the Trending lines to access the programming screens.
NOTE on Load Profile Recording: Load Profile recording is a subset of the Nexus®
meter's more general logging and trending capability. The same screens are used for
setup, but Load Profile recording only deals with accumulated values; Energy (Wh),
reactive Energy (VARh) and apparent power (VAh).
Historically, Load Profile recording referred to recording of quadrant 1 Energy (Wh)
because electromechanical meters only measured energy and were designed to
prevent reverse rotation outside of quadrant 1.
19.7.1: Programming the Trending Log Time Intervals
The Trending Log Time Intervals setting determines the interval at which the
Historical logs take a "snapshot" of data, and the length of time logging continues for
the Event Triggered log (see Section 19.6.9 for information on setting the Event
Triggered log). To set the parameters for the logs, see Section 19.7.2. See Chapter 8
for information on viewing and retrieving logs.

Doc# E107707 19 - 76
19: Nexus® 1500 Meter
Electro Industries/GaugeTechThe Leader In Power Monitoring and Smart Grid SolutionsElectro Industries/GaugeTechThe Leader In Power Monitoring and Smart Grid Solutions
1. From the Trending Profile Settings menu, double-click Trending Log Time Intervals
or click the + button next to it. You will see the submenu shown below. The
submenu shows both the intervals set for logs 1 through 8, and the length of
logging for any Event Triggered log.
• To change the interval for a Historical log, double-click on one of the log
numbers.
• To change logging time for an Event Triggered log, double-click on the Event
Triggered log.
NOTE: You can also access the Interval setting screens from the Trending Setup
screens (see Section 19.7.2).
2. Depending on your selection, follow instructions in step a or b.
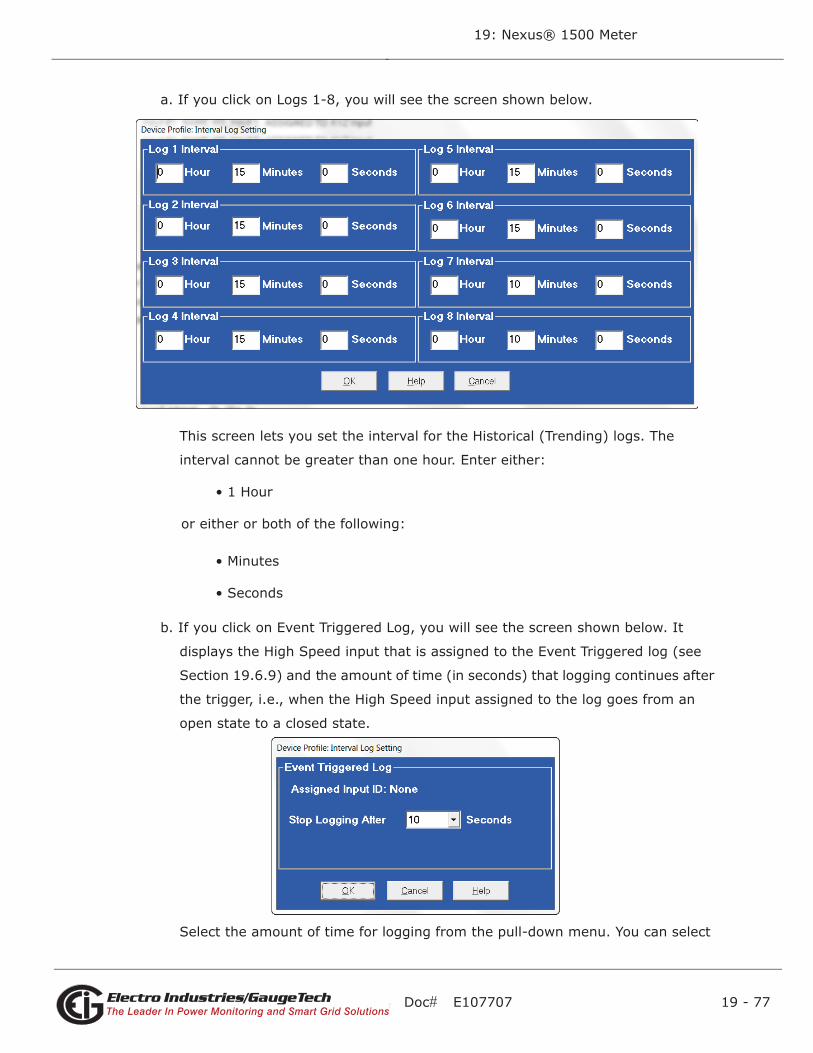
Doc# E107707 19 - 77
19: Nexus® 1500 Meter
Electro Industries/GaugeTechThe Leader In Power Monitoring and Smart Grid SolutionsElectro Industries/GaugeTechThe Leader In Power Monitoring and Smart Grid Solutions
a. If you click on Logs 1-8, you will see the screen shown below.
This screen lets you set the interval for the Historical (Trending) logs. The
interval cannot be greater than one hour. Enter either:
• 1 Hour
or either or both of the following:
• Minutes
• Seconds
b. If you click on Event Triggered Log, you will see the screen shown below. It
displays the High Speed input that is assigned to the Event Triggered log (see
Section 19.6.9) and the amount of time (in seconds) that logging continues after
the trigger, i.e., when the High Speed input assigned to the log goes from an
open state to a closed state.
Select the amount of time for logging from the pull-down menu. You can select

Doc# E107707 19 - 78
19: Nexus® 1500 Meter
Electro Industries/GaugeTechThe Leader In Power Monitoring and Smart Grid SolutionsElectro Industries/GaugeTechThe Leader In Power Monitoring and Smart Grid Solutions
from 1 to 60 seconds.
NOTE: You enable the Event Triggered log in the High Speed Inputs setting (see
Section 19.6.9).
3. Click OK to save your changes. For any changes to take effect, you must click the
Update Device button to send the new profile to the meter.
19.7.2: Programming the Trending Setup
The Trending Setup controls the channel assignments for Historical logs 1 - 8 and the
Event Triggered log. See Chapter 8 for instructions on retrieving logs.
1. From the Trending Profile Settings menu, click on the + button next to Trending
Setup or double-click on the Trending Setup line. You will see the submenu shown
below.
2. Double-click on the log whose settings you want to configure. You will see the
Trending Log Profile screen for the log you selected. An example screen is shown on
the next page.

Doc# E107707 19 - 79
19: Nexus® 1500 Meter
Electro Industries/GaugeTechThe Leader In Power Monitoring and Smart Grid SolutionsElectro Industries/GaugeTechThe Leader In Power Monitoring and Smart Grid Solutions
3. Make changes to this screen according to your application requirements. The
screen fields are:
• Group - using the pull-down menu, select the type of snapshot. The options are:
Measured Values, Averages, Accumulators, Interval Accumulators, Option Cards,
RTU Master Items, and TOU Cumulative Dmd.
• Sub-Group - using the pull-down menu, select a channel for the snapshot. The
options you see depend on the Group you selected.
• Sub-Group 2 - with some selections, a second sub-group field will be shown
underneath the first one.
• Highlight items in the Selectable Items(s) box and click Add to include the
selections in the Log. The items are copied to the Selected Item(s) box. To
remove an item from the log, highlight the item in the Selected Item(s) box and
click Remove or double-click the item. The item is removed from the Selected
Item(s) box.
NOTES:
•To select multiple items, hold Ctrl while highlighting the items.

Doc# E107707 19 - 80
19: Nexus® 1500 Meter
Electro Industries/GaugeTechThe Leader In Power Monitoring and Smart Grid SolutionsElectro Industries/GaugeTechThe Leader In Power Monitoring and Smart Grid Solutions
•To select a range of items, click the first item, hold Shift, and click the last
item
•Move the cursor to the lower left corner of an item, or group of items, to
view its size in bytes.
• The Total Bytes Used and Bytes Remaining fields display the memory status for
the log. The meter assumes 256 bytes of memory for each file. Total memory is
determined at time of purchase.
• Click Set Interval to open the Interval Log Setting screen (see Section 19.7.1).
4. When all changes have been entered, click OK to return to the main Device Profile
screen. For any changes to take effect, you must click the Update Device button
to send the new profile to the meter.
19.7.3: Pad Missing Records for Historical Logs
If the meter is not in normal operation, it does not record any data for Historical logs
1 - 8. For example, during firmware updates or loss of power, data is not saved. Some
applications may require that data logs contain those missing records. To remedy this
problem, enable the Pad Missing Records for Historical Logs feature. Once enabled,
the meter upon power up after a power down condition, will look at all the intervals
that are missing and pad with zeroes those intervals in the historical log.
1. From the Communicator EXT Title bar, click View>Options. You will see the
Options screen.

Doc# E107707 19 - 81
19: Nexus® 1500 Meter
Electro Industries/GaugeTechThe Leader In Power Monitoring and Smart Grid SolutionsElectro Industries/GaugeTechThe Leader In Power Monitoring and Smart Grid Solutions
2. Click the Log Retrieval tab. You will see the screen pictured below.
3. Check the box next to the Pad Device option by clicking on it, and enter the number
of days in the Days field.
NOTE: If the box is already checked, this feature is already functional. You can
change the number of days, or click the box to disable this feature.
4. Click OK to save your selection and exit the screen.

Doc# E107707 19 - 82
19: Nexus® 1500 Meter
Electro Industries/GaugeTechThe Leader In Power Monitoring and Smart Grid SolutionsElectro Industries/GaugeTechThe Leader In Power Monitoring and Smart Grid Solutions
19.8: External I/O Modules
This setting of the Device Profile allows you to set up the meter’s optional external
Input/Output modules (see Chapter 11 for more information on the I/O modules) and
RTU Master settings.
19.8.1: Configuring the Input/Output Modules
1. From the Device Profile screen (see Section 19.3), double-click on the External I/O
Modules icon. You will see the screen shown below.
2. Click in the Type column and use the pull-down menu to select the specific module
you want to add. The Assigned Address, Nexus settings®, and Module settings you
can make depend on the module you are configuring. The modules and settings are
as follows:
Module AssignedAddress* Nexus® Setting** Module Setting
4PO1 - KYZ Output 160* Click to Edit Relay Accumula-tions
Click to enter Transmit Delay and configure KYZ outputs’ Watt/pulse, rollover and minimum pulse width.
20mAON4 132* Click to Assign Items to and configure the Analog Outputs
Click to enter Transmit Delay and configure Channel set-tings

Doc# E107707 19 - 83
19: Nexus® 1500 Meter
Electro Industries/GaugeTechThe Leader In Power Monitoring and Smart Grid SolutionsElectro Industries/GaugeTechThe Leader In Power Monitoring and Smart Grid Solutions
* The Assigned address on this screen is the address the meter uses to identify the
I/O module. The default is the factory set address, which you can change by click-
ing in the field and choosing a new address from the pull-down menu. This address
is not the actual I/O module address. You set that from the I/O Devices menu; see
Chapter 11 for instructions.
**When you click in this field you see an Edit button. Click the button to open a
screen that lets you edit that module. See the example screens below.
4PO1 Screen
Click on the pull-down menu to select accumulation configuration for each of the 4
relays (Disabled, Quad (1+4) Watthr, Quad (2+3) Watthr, Quad (1+2) VARhr, Quad
(3+4) VARhr, Quad (1+2+3+4) VAhr, Quad 1 Watthr, Quad 2 Watthr, Quad 3
Watthr, Quad4 Watthr, Quad 1 VARhr, Quad 2, VARhr, Quad 3 VARhr, Quad 4 VARhr,
Quad 1 VAhr, Quad 2 VAhr, Quad 3 VAhr, Quad 4 VAhr, +Qh Total, -Qh Total, Inter-
nal Input (#1-8) Totals, Accumulation (#1-4) Totals, External Digital Input Modules
(1-4) Inputs (#1-8), I Squared T (A, B, C), V Squared T (A,B,C).
20mAON8 132* Click to Assign Items to and configure the Analog Outputs
Click to enter Transmit Delay and configure Channel set-tings
1mAON4 128* Click to Assign Items to and configure the Analog Outputs
Click to enter Transmit Delay and configure Channel set-tings
1mAON8 128* Click to Assign Items to and configure the Analog Outputs
Click to enter Transmit Delay and configure Channel set-tings
4RO1 - Digital Output 156* Click to configure Relays Click to enter Transmit Delay
Module AssignedAddress* Nexus® Setting** Module Setting

Doc# E107707 19 - 84
19: Nexus® 1500 Meter
Electro Industries/GaugeTechThe Leader In Power Monitoring and Smart Grid SolutionsElectro Industries/GaugeTechThe Leader In Power Monitoring and Smart Grid Solutions
20mAON4 Screen
Click in Output channels 1-4 to assign them to a parameter. The other Analog Out-
put Modules - 20mAON8, 1mAON4, and 1mAON8 have similar setting screens,
except for the number of channels you can program.
4RO1 Screen
Click in the Relay fields 1-4 to enter relay label, common shorted to N.C., common
shorted to N.O., and check the box to lock the relay to manual control (leave the
box unchecked to allow other than manual control).
NOTE: Log/Limit ID is a display only field. It shows the ID that Communicator EXT
generates to identify this module in the Log Viewer and Limits functions.
3. Click OK to return to the main Device Profile screen. For any changes to take
effect, you must click the Update Device button to send the new profile to the
meter.

Doc# E107707 19 - 85
19: Nexus® 1500 Meter
Electro Industries/GaugeTechThe Leader In Power Monitoring and Smart Grid SolutionsElectro Industries/GaugeTechThe Leader In Power Monitoring and Smart Grid Solutions
19.8.2: RTU Settings
This section of the Device Profile enables you to configure RTU Master settings.
1. From the Device Profile screen (see Section 19.3), click on the + button next to the
External I/O Modules line. You will see the menu shown below.
2. Double-click on RTU Settings. You will see the screen shown below.
Use this screen to configure the settings when Port 2 is set as an RTU Master (see
Section 19.4.5).
3. The first view you see is the Group Main tab (shown above). This screen lets you
set up the RTU Master groups, i.e. the devices the Nexus® 1500 meter is polling.
You can enter up to 16 groups. You have the following options:

Doc# E107707 19 - 86
19: Nexus® 1500 Meter
Electro Industries/GaugeTechThe Leader In Power Monitoring and Smart Grid SolutionsElectro Industries/GaugeTechThe Leader In Power Monitoring and Smart Grid Solutions
• Click Add to add a Master group. Fill in the Description, Device Address, Starting
Register, and Number of Registers; click Save to save your entries.
• Click on a group and click Edit to change data for the group; click Save to save
your changes.
• Click on a group and click Remove to delete the group.
• Click on a group and click Up or Down to change the position of the group.
4. Click the Group Details tab to set up the readings for the devices. See the example
screen shown below.
You have the following options:
• Click Add to add a reading to the group. Fill in the Data Type, Size in Bytes, Byte
Order, Multiplier Information, and Slave Starting Register (the Master Starting
Register is read-only); click Save to save your entries.
NOTE: The readings in the group must have consecutive register numbers. If
necessary you can break the readings into two or more groups.

Doc# E107707 19 - 87
19: Nexus® 1500 Meter
Electro Industries/GaugeTechThe Leader In Power Monitoring and Smart Grid SolutionsElectro Industries/GaugeTechThe Leader In Power Monitoring and Smart Grid Solutions
• Click on a reading and click Edit to change data for the reading; click Save to
save your changes.
• Click on a reading and click Remove to delete the reading from the group.
• Click on the Selected Group pull-down menu to select and display details for
another group.
5. Click OK to return to the main Device Profile screen. For any changes to take
effect, you must click the Update Device button to send the new profile to the
meter.
NOTE: For more details on I/O Modules, see Chapter 11.
19.9: Edit LCD Programmable Settings
This setting lets you configure options for the meter's touch-screen display.
1. From the Communicator EXT Title bar, select Tools>Edit LCD Programmable
Settings. You will see the screen shown below.
2. Use the pull-down menus to select the date and time format you want to display on
the LCD.
3. Click the Update button to implement your selections and exit the screen; click
Cancel to exit the screen without making any changes.

Doc# E107707 19 - 88
19: Nexus® 1500 Meter
Electro Industries/GaugeTechThe Leader In Power Monitoring and Smart Grid SolutionsElectro Industries/GaugeTechThe Leader In Power Monitoring and Smart Grid Solutions
19.10: Set Device Time
The meter uses its on-board clock for time stamping any logs it is recording. To set
the meter's clock:
1. From the Communicator EXT Title bar, select Tools>Set Device Time. You will see
the screen shown below.
2. Complete either of the following actions:
• To synchronize the meter and your computer, leave the Use PC Time box
checked.
• To set the date and time independently from the PC, deselect the Use PC Time
box and enter the time and date settings.
3. Click the Send button to update the meter's time settings and exit the screen; click
Cancel to exit the screen without making any changes.

Doc# E107707 19 - 89
19: Nexus® 1500 Meter
Electro Industries/GaugeTechThe Leader In Power Monitoring and Smart Grid SolutionsElectro Industries/GaugeTechThe Leader In Power Monitoring and Smart Grid Solutions
19.11: Retrieve Device Time
To retrieve the meter's current time and date settings:
1. From the Communicator EXT Title bar, select Tools> Retrieve Device Time. You
will see the screen shown below. Date and running time display in the LEDs.
• If IRIG-B is enabled for your meter, IRIG-B is displayed next to the time.
• If Line Frequency Clock Synchronization is enabled for your meter, LINE SYNC is
displayed next to the time.
• If Daylight Savings Time is active, DST is displayed next to the time.
• If Cold Load Pickup is active, Active Cold Load is displayed next to the time.
2. Click OK to exit the screen.
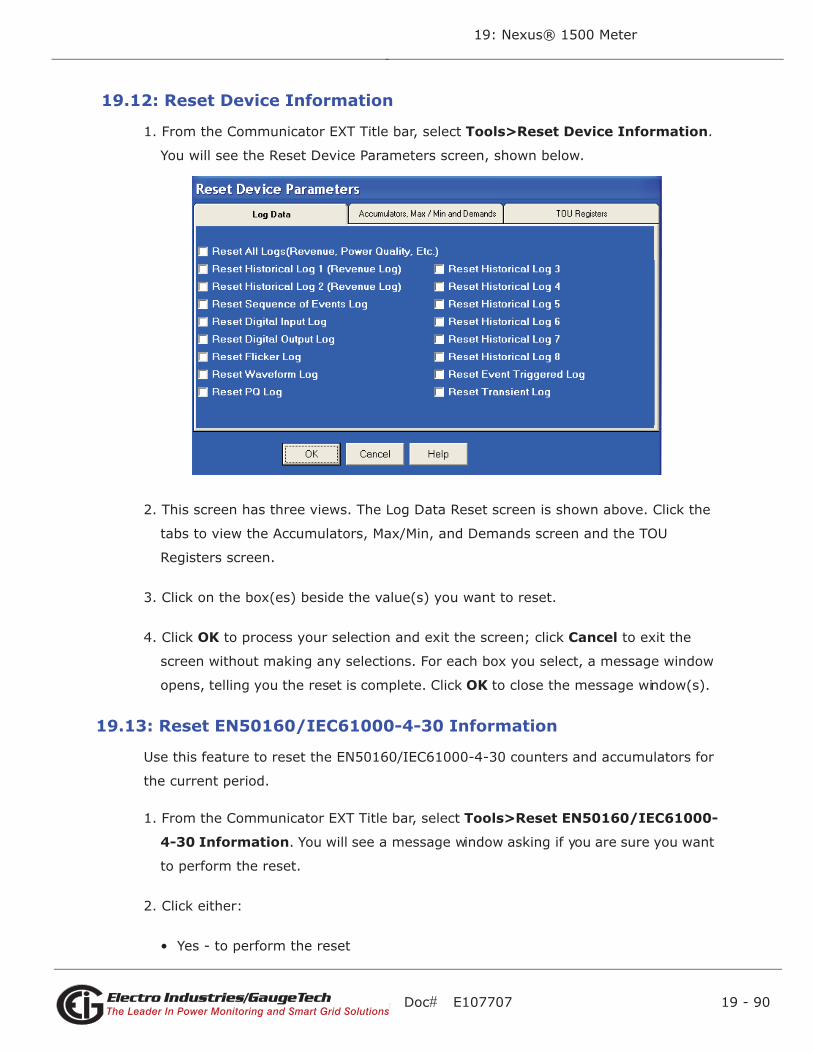
Doc# E107707 19 - 90
19: Nexus® 1500 Meter
Electro Industries/GaugeTechThe Leader In Power Monitoring and Smart Grid SolutionsElectro Industries/GaugeTechThe Leader In Power Monitoring and Smart Grid Solutions
19.12: Reset Device Information
1. From the Communicator EXT Title bar, select Tools>Reset Device Information.
You will see the Reset Device Parameters screen, shown below.
2. This screen has three views. The Log Data Reset screen is shown above. Click the
tabs to view the Accumulators, Max/Min, and Demands screen and the TOU
Registers screen.
3. Click on the box(es) beside the value(s) you want to reset.
4. Click OK to process your selection and exit the screen; click Cancel to exit the
screen without making any selections. For each box you select, a message window
opens, telling you the reset is complete. Click OK to close the message window(s).
19.13: Reset EN50160/IEC61000-4-30 Information
Use this feature to reset the EN50160/IEC61000-4-30 counters and accumulators for
the current period.
1. From the Communicator EXT Title bar, select Tools>Reset EN50160/IEC61000-
4-30 Information. You will see a message window asking if you are sure you want
to perform the reset.
2. Click either:
• Yes - to perform the reset

Doc# E107707 19 - 91
19: Nexus® 1500 Meter
Electro Industries/GaugeTechThe Leader In Power Monitoring and Smart Grid SolutionsElectro Industries/GaugeTechThe Leader In Power Monitoring and Smart Grid Solutions
• No - to close the message window without resetting the information.
19.14: I/O Board Status
Use the I/O Board Status feature to view information for the I/O Boards installed in
the Nexus® 1500 meter.
1. From the Communicator EXT Title bar, select Tools>I/O Board Status. You will
see the screen shown below.
All installed I/O Boards are listed, along with the following information for the
board:
• Location ID
• Hardware Name
• Serial Number
• Slot Mask
• Hardware Version
• Firmware Version
• Required PPC Run Version
• Board Status
• Test Status
• Test Error
• Test Location

Doc# E107707 19 - 92
19: Nexus® 1500 Meter
Electro Industries/GaugeTechThe Leader In Power Monitoring and Smart Grid SolutionsElectro Industries/GaugeTechThe Leader In Power Monitoring and Smart Grid Solutions
• Test Operator
• Test Date/Time
2. Click Refresh to update the display with the most current information; click OK to
close the screen.
19.15: Relay Control
This feature allows you to manually change the state of an installed relay.
1. From the Communicator EXT Title bar, select Tools>Relay Control. You will see
the screen shown below. It lists all of the relays currently installed in the meter, and
their current state.
2. To manually change a relay’s state:
a. Click in the Change box to the right of the relay.

Doc# E107707 19 - 93
19: Nexus® 1500 Meter
Electro Industries/GaugeTechThe Leader In Power Monitoring and Smart Grid SolutionsElectro Industries/GaugeTechThe Leader In Power Monitoring and Smart Grid Solutions
b. Select the new state from the pull-down box at the bottom of the screen and
click the Apply button.
3. When you are done, click OK to close the Relay Control screen.
19.16: Performing CT and PT Compensation
The CT and PT Compensation feature allows you to remove an error caused by the
CTs (external to unit) and PTs that are connected to the unit.
Make sure that CT and PT Compensation is enabled for your meter (see Section
19.5.5).
1. From the Communicator EXT Title bar, select Tools>CT & PT Compensation>
Calibration Table Status. You will see the screen shown below.
2. Click First Time CT & PT Comp Selection.
3. Click Preload CT & PT Comp with initial values.
4. Click OK.
5. Click Tools>CT & PT Compensation>View Calibration Tables. You will see the
screen shown on the next page.

Doc# E107707 19 - 94
19: Nexus® 1500 Meter
Electro Industries/GaugeTechThe Leader In Power Monitoring and Smart Grid SolutionsElectro Industries/GaugeTechThe Leader In Power Monitoring and Smart Grid Solutions
6. Click Copy Factory Table to CT & PT Comp Table.
7. Click OK. CT & PT Compensation is now enabled and ready for corrections. Collect
data to determine the required correction(s).
8. To perform compensation, click Tools> CT & PT Compensation>Compensate
CTs & PTs. You will see the screen shown below.
• Click the Step tabs to see additional screens, shown on the next page.

Doc# E107707 19 - 95
19: Nexus® 1500 Meter
Electro Industries/GaugeTechThe Leader In Power Monitoring and Smart Grid SolutionsElectro Industries/GaugeTechThe Leader In Power Monitoring and Smart Grid Solutions
• Follow screen instructions to make your corrections.
9. Click OK to save any changes; click Print to print the information.

Doc# E107707 19 - 96
19: Nexus® 1500 Meter
Electro Industries/GaugeTechThe Leader In Power Monitoring and Smart Grid SolutionsElectro Industries/GaugeTechThe Leader In Power Monitoring and Smart Grid Solutions
19.17: Internal KYZ Pulse Test
Use the Internal KYZ Pulse Test feature to test the meter's KYZ pulses.
1. Click Tools>Internal KYZ Pulse Test. You will see the message window shown
below.
2. Click Yes to use the new testing method (this is the correct method for the Nexus®
1500 meter); you will see the screen shown below.
3. Click Start. You will see a red circle as each KYZ pulse is being tested.
• To speed the test pulses, click Faster.
• To slow down the test pulses, click Slower.
4. Click Stop to end the KYZ pulse testing.
5. Click Close to close the screen.
NOTE: The test pulses are not added to any KYZ pulse accumulators.

Doc# E107707 19 - 97
19: Nexus® 1500 Meter
Electro Industries/GaugeTechThe Leader In Power Monitoring and Smart Grid SolutionsElectro Industries/GaugeTechThe Leader In Power Monitoring and Smart Grid Solutions
NOTE: Other chapters in this manual have information regarding the Nexus® 1500
meter:
Chapter 2 - meter connection instructions
Chapter 6 - information on the Web server (Total Web Solutions)
Chapter 7 - information on Nexus® 1500 meter Polling screens
Chapter 8 - information on Nexus® 1500 meter Logging screens
Chapter 10 - Time of Use information
Chapter 11 - external I/O module information
Chapter 12 - password information
Chapter 13 - firmware Flash upgrading information
Chapter 14 - Energy Billing Module information
Chapter 15 - EIG Script and Scheduler information
Chapters 16 and 17 - EN50160/IEC61000 Flicker information
Chapter 18 - DNP V.3.0 information
Appendix F - information on the Network cards
Also see other Appendices and the Glossary for related information.

Doc# E107707 19 - 98
19: Nexus® 1500 Meter
Electro Industries/GaugeTechThe Leader In Power Monitoring and Smart Grid SolutionsElectro Industries/GaugeTechThe Leader In Power Monitoring and Smart Grid Solutions
This page intentionally left blank.

Doc# E107707 20 - 1
20: Configuring the MP200 Metering System
Electro Industries/GaugeTechThe Leader In Power Monitoring and Smart Grid SolutionsElectro Industries/GaugeTechThe Leader In Power Monitoring and Smart Grid Solutions
20: Configuring the MP200 Metering System
20.1: MP200 Metering System Configuration
You can connect to the MP200 unit for software configuration, using either of the
RS485 ports (Com 1 or Com 3), the Ethernet/WiFi port if your MP200 unit has that
option (Com 1) or the USB port (Com 2). The communication port options available
for your MP200 unit model are detailed in its Installation and Operation Manual.) Once
Communicator EXT 3.0 software has been installed on your computer and a wired or
wireless connection has been established, you can begin to communicate with the
MP200 metering system.
NOTE: To set Com 1 as either RS485 or Ethernet/WiFi (if your MP200 unit has that
option), use the Com 1 switch. See the figure below.
20.1.1: Connect to the MP200 Unit1. From the Communicator EXT Main screen, click the Connect icon.
WiFi Antenna
Com 1 SwitchRJ45EthernetRS485 Port (Com 3)
USB Port (Com 2)
RS485(Com 1)
Connect Icon

Doc# E107707 20 - 2
20: Configuring the MP200 Metering System
Electro Industries/GaugeTechThe Leader In Power Monitoring and Smart Grid SolutionsElectro Industries/GaugeTechThe Leader In Power Monitoring and Smart Grid Solutions
2. The Connect screen opens, showing the Default settings. Example settings for
connecting to the MP200 unit using the RS485, Ethernet, or USB ports are shown in
the screens below. For specifics of Ethernet configuration, see Chapter 8 in the
MP200 Metering System Installation and Operation Manual.
RS485connection
USB connection
Ethernetconnection

Doc# E107707 20 - 3
20: Configuring the MP200 Metering System
Electro Industries/GaugeTechThe Leader In Power Monitoring and Smart Grid SolutionsElectro Industries/GaugeTechThe Leader In Power Monitoring and Smart Grid Solutions
NOTE: If you have a Licensed version of Communicator EXT, you can change any of
the settings. If you have a demo version of Communicator EXT, you cannot change
the Device Address: it must be 1. See Section 20.4.4 for more information on the
Com port settings.
3. You will see the Device Status screen, confirming connection to your MP200 unit.
The fields on the right of the screen give you information about the connected
MP200 unit:
• Boot: the version of the Boot firmware the meter currently has.
• Run: the version of the Runtime firmware the meter currently has.
• State: information about the meter, e.g., shown above Run Mode, Logging
Enabled, Battery OK means that the meter is running, logging is enabled for the
meter, and the meter battery has sufficient operating power.
• V-Switch: the number of the V-SwitchTM key currently installed in the meter.
• On Time: the date and time the meter was last powered on.
Click OK to close the Device Status screen.

Doc# E107707 20 - 4
20: Configuring the MP200 Metering System
Electro Industries/GaugeTechThe Leader In Power Monitoring and Smart Grid SolutionsElectro Industries/GaugeTechThe Leader In Power Monitoring and Smart Grid Solutions
4. Click the Profile icon in the Title Bar.
5. You will see the MP200 Metering System’s Device Profile screen. The menu on the
left side of the screen lets you navigate between Settings screens (see screens on
next page).
NOTE: The settings you see on the first screen depend on your MP200 unit’s
circuit configuration.
Profile Icon

Doc# E107707 20 - 5
20: Configuring the MP200 Metering System
Electro Industries/GaugeTechThe Leader In Power Monitoring and Smart Grid SolutionsElectro Industries/GaugeTechThe Leader In Power Monitoring and Smart Grid Solutions
6. Section 20.4 gives you instructions for configuring the device profile settings.
Tree Menu
MP200 Unit with Three Phase Configuration - MP200-Y
MP200 Unit with Single Phase Configuration - MP200-S

Doc# E107707 20 - 6
20: Configuring the MP200 Metering System
Electro Industries/GaugeTechThe Leader In Power Monitoring and Smart Grid SolutionsElectro Industries/GaugeTechThe Leader In Power Monitoring and Smart Grid Solutions
20.2: Using Connection Manager
Use Connection Manager to add or remove connection locations and/or devices at
locations.
1. From the Communicator EXT Main screen, click Connection>Connection
Manager or click on the Connect Mgr icon. You will see the Connection Manager
screen, shown below.
List of Locations:
On the left side of the Connection Manager screen is a List of Locations. These are the
locations of one or more devices to which you can connect. You can add a location
and/or a device; edit a location and/or device; or remove a location and/or device.

Doc# E107707 20 - 7
20: Configuring the MP200 Metering System
Electro Industries/GaugeTechThe Leader In Power Monitoring and Smart Grid SolutionsElectro Industries/GaugeTechThe Leader In Power Monitoring and Smart Grid Solutions
To Add a Location:
a. Click Add. You will see the screen below. Use this screen to program the commu-
nication settings for each New Location.
b. Type a Name for the New Location.
c. Click Serial Port or Network.
d. Enter Communications Settings:
Com Port: COM 1 - 99
Baud Rate: 1200 - 115200
Flow Control: None or Hardware
Data Bits: 8 (or 7)
Parity: None (Even, Odd)
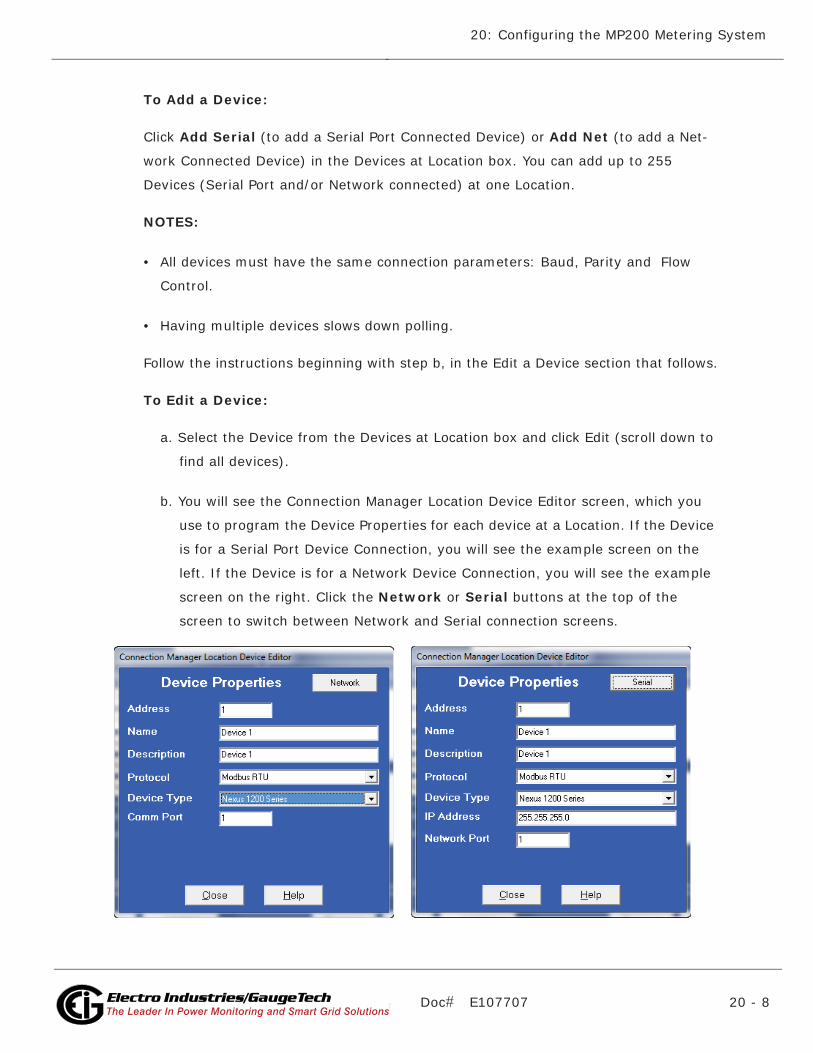
Doc# E107707 20 - 8
20: Configuring the MP200 Metering System
Electro Industries/GaugeTechThe Leader In Power Monitoring and Smart Grid SolutionsElectro Industries/GaugeTechThe Leader In Power Monitoring and Smart Grid Solutions
To Add a Device:
Click Add Serial (to add a Serial Port Connected Device) or Add Net (to add a Net-
work Connected Device) in the Devices at Location box. You can add up to 255
Devices (Serial Port and/or Network connected) at one Location.
NOTES:
• All devices must have the same connection parameters: Baud, Parity and Flow
Control.
• Having multiple devices slows down polling.
Follow the instructions beginning with step b, in the Edit a Device section that follows.
To Edit a Device:
a. Select the Device from the Devices at Location box and click Edit (scroll down to
find all devices).
b. You will see the Connection Manager Location Device Editor screen, which you
use to program the Device Properties for each device at a Location. If the Device
is for a Serial Port Device Connection, you will see the example screen on the
left. If the Device is for a Network Device Connection, you will see the example
screen on the right. Click the Network or Serial buttons at the top of the
screen to switch between Network and Serial connection screens.
Doc# E107707 20 - 9
20: Configuring the MP200 Metering System
Electro Industries/GaugeTechThe Leader In Power Monitoring and Smart Grid SolutionsElectro Industries/GaugeTechThe Leader In Power Monitoring and Smart Grid Solutions
i. Enter Device Properties:
Address: 1 - 247 (Unique Address)
Name: Device Name
Description: (Device Type and Number, for example)
Protocol: (Modbus RTU, Modbus ASCII Modbus TCP, EI Protocol)
Device Type: (Shark, Nexus 1200 Series, Nexus® External I/Modules,
Futura+ CPU1000, DMMS XXXX, Nexus 1500 Series, MP200)
Comm Port: 1 or 2 (Serial Port Only)
IP Address:100.10.10.10 (for example) (Network Only)
Port Number:502 (Default) (Network Only)
ii. Click Close to save settings and return to the Connection Manager Loca-
tion Editor screen.
To Remove a Device:
Select the Device from the Devices at Location box and click Remove.
a. Click Close to return to the Connection Manager screen.
To Edit a Location:
a. Select a Location from the List of Locations box.
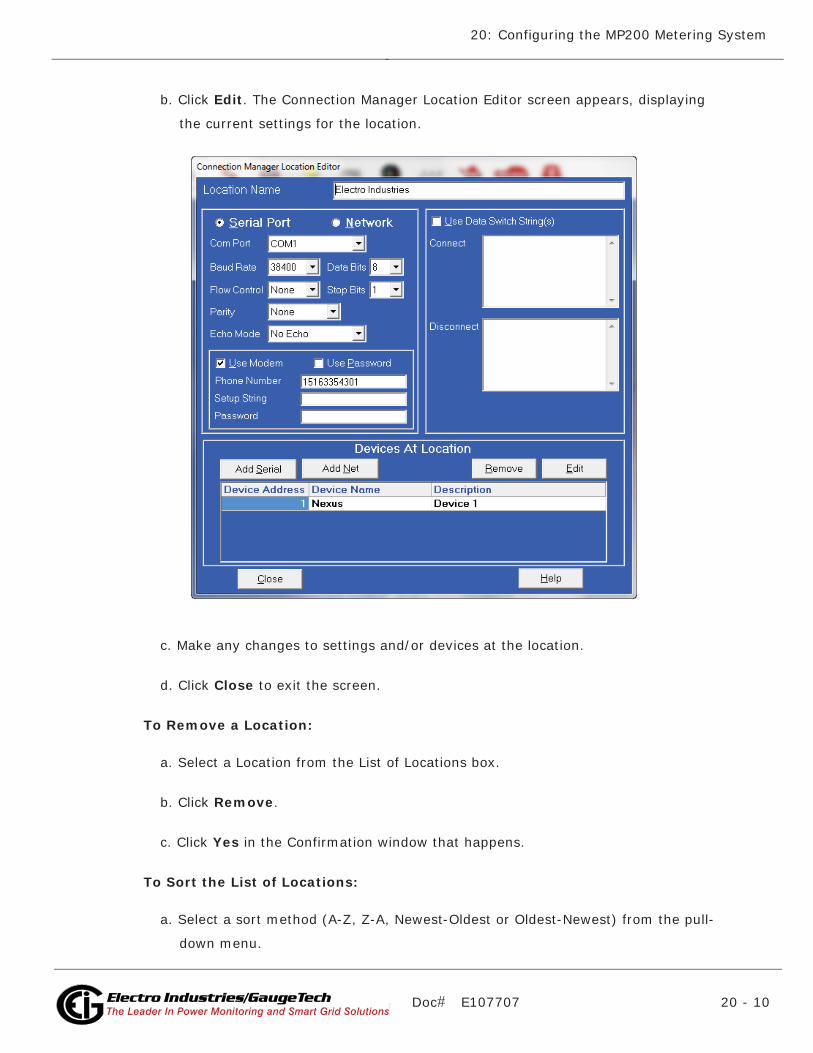
Doc# E107707 20 - 10
20: Configuring the MP200 Metering System
Electro Industries/GaugeTechThe Leader In Power Monitoring and Smart Grid SolutionsElectro Industries/GaugeTechThe Leader In Power Monitoring and Smart Grid Solutions
b. Click Edit. The Connection Manager Location Editor screen appears, displaying
the current settings for the location.
c. Make any changes to settings and/or devices at the location.
d. Click Close to exit the screen.
To Remove a Location:
a. Select a Location from the List of Locations box.
b. Click Remove.
c. Click Yes in the Confirmation window that happens.
To Sort the List of Locations:
a. Select a sort method (A-Z, Z-A, Newest-Oldest or Oldest-Newest) from the pull-
down menu.
Doc# E107707 20 - 11
20: Configuring the MP200 Metering System
Electro Industries/GaugeTechThe Leader In Power Monitoring and Smart Grid SolutionsElectro Industries/GaugeTechThe Leader In Power Monitoring and Smart Grid Solutions
b. Click Sort By.
To Connect to a Location:
a. Select the Location you want to connect to from the List of Locations box.
NOTE: You may only connect to one location at a time. To change to a different
location, you must disconnect from the current location by selecting it and
clicking Disconnect.
b. Click Connect. When the connection is made, the selected location appears in
the Connected To Location field at the top of the screen.
c. Click Close. The Device Status screen opens, confirming the connection. The
Computer Status Bar at the bottom of the screen also confirms the computer's
connection parameters.
NOTE: If the connection fails, a popup screen will alert you. Check that all
cables are secure, that the cable is connected to the correct COM Port on the
computer and that the computer is set to use the same baud rate and protocol
as the Com port of the device to which the computer is connected.
20.3: Disconnecting from the MP200 Unit
To disconnect from an MP200 unit or from a location, do one of the following:
• From the Communicator EXT Main screen, click the Disconnect icon.
• From the Communicator EXT Main screen, select Connection>Disconnect.
• From the Connection Manager screen, select the location from the Connected to
Location field and click Disconnect.

Doc# E107707 20 - 12
20: Configuring the MP200 Metering System
Electro Industries/GaugeTechThe Leader In Power Monitoring and Smart Grid SolutionsElectro Industries/GaugeTechThe Leader In Power Monitoring and Smart Grid Solutions
20.4: Configuring the MP200 Metering System’s Device Profile
The example Device Profile screen shown above is for an MP200 unit with the three-
phase circuit configuration. The Device Profile screen has the following buttons on the
bottom:
Update Device: click to update the Device Profile settings.
IMPORTANT! If you make changes to the Device Profile you MUST click this
button to send the changes to the connected device.
Load Profile: click to load a previously saved Device Profile Settings file.
Save Profile: click to save the Device Profile settings to a file. You may want to do
this is you will be making the same settings for multiple devices.
View Report: click to view or print a list of current Device Settings.

Doc# E107707 20 - 13
20: Configuring the MP200 Metering System
Electro Industries/GaugeTechThe Leader In Power Monitoring and Smart Grid SolutionsElectro Industries/GaugeTechThe Leader In Power Monitoring and Smart Grid Solutions
Exit: click to close the Device Profile screen. You will see a Confirmation window -
click Yes to exit, click No to keep the screen open.
NOTE: It is important that you either save the Device Profile settings in a file or
update the connected device before you exit the screen - if you don’t do this, any
changed settings are lost.
The following sections provide instructions for configuring the MP200 unit’s settings.
20.4.1: Configuring CT, PT Ratios and System Hookup
The first screen you see when you open the Device Profile is the CT, PT Ratios and
System Hookup screen. Use this setting to configure Current Transformer and Poten-
tial Transformer ratios and to select the System Hookup.
Functional Overview of CT and PT Ratios:
Current and Potential Transformers are used mainly for the following reasons:
• To insulate, and as a result isolate, the meter from high-voltage circuits.
• To change the primary voltage and current to standard values and sizes that the
meter can measure.
The CT and PT transformers deliver fractions of the primary voltage and current to the
meter. With properly set ratios and multipliers, the readings of the meter can be used
to determine the energy, voltage, current, or power of the system.
Depending on your MP200 unit’s circuit configuration you will see one of the screens
shown on the next page. (To return to this screen from a different Device Profile
screen, click General Settings>Configuring CT, PT Ratios and System Hookup from the
Tree menu.)

Doc# E107707 20 - 14
20: Configuring the MP200 Metering System
Electro Industries/GaugeTechThe Leader In Power Monitoring and Smart Grid SolutionsElectro Industries/GaugeTechThe Leader In Power Monitoring and Smart Grid Solutions
Screen for Three Phase Circuit Configuration
Screen for Single Phase Circuit Configuration

Doc# E107707 20 - 15
20: Configuring the MP200 Metering System
Electro Industries/GaugeTechThe Leader In Power Monitoring and Smart Grid SolutionsElectro Industries/GaugeTechThe Leader In Power Monitoring and Smart Grid Solutions
Make the following settings:
PT Ratios
PT Numerator (Primary): 1 - 99999999
PT Denominator (Secondary): 40 - 65535
System Wiring
3 Element Wye; Single Phase
CT Ratios
CT Numerator (Primary): 1 - 65535
CT Denominator (Secondary): 5 or 1 Amp, depending on the MP200 unit’s ordered
option. This field is display only - it cannot be changed.
Example Settings:
For a system that has 14400V primary with a 120V secondary line to neutral (PT Ratio
of 120:1), set the following PT Ratios in the entry fields:
PT Numerator (Primary): 14400
PT Denominator (Secondary): 120
For a CT of 2000/5A, set the following:
CT Numerator (Primary): 2000

Doc# E107707 20 - 16
20: Configuring the MP200 Metering System
Electro Industries/GaugeTechThe Leader In Power Monitoring and Smart Grid SolutionsElectro Industries/GaugeTechThe Leader In Power Monitoring and Smart Grid Solutions
20.4.2: Configuring Time Settings
Use the Time Settings screen to select Daylight Savings Time for the meter and to set
the beginning and ending date and time for Daylight Savings Time. If you enable Day-
light Savings Time, the MP200 unit will use this information to adjust its clock accord-
ingly, on the dates and time entered. For example if you set Daylight Savings Time to
begin on the second Sunday in March at 2 am, and end on the first Sunday in October
at 2 am, the unit’s clock will advance from 2 am to 3 am on the second Sunday in
March, and move from 2 am back to 1 am on the first Sunday in October.
1. From the Tree Menu, click General Settings>Time Settings.
2. Check the box to Enable Daylight Savings time, or un-check it to Disable Daylight
Savings Time.
3. Click the USA Daylight Savings button to fill the entry fields with the US DST begin-
ning and ending times or use the entry fields to manually set the start and end
times for the Daylight Savings Time feature, if enabled.
NOTE: The Hour field uses a 24-Hour clock.

Doc# E107707 20 - 17
20: Configuring the MP200 Metering System
Electro Industries/GaugeTechThe Leader In Power Monitoring and Smart Grid SolutionsElectro Industries/GaugeTechThe Leader In Power Monitoring and Smart Grid Solutions
20.4.3: Configuring System Settings
1. From the Tree menu, click General Settings>System Settings. The screen you see
depends on whether your MP200 unit has a three phase or a single phase configu-
ration. The top screen below is for a three phase configuration; the bottom screen
is for a single phase configuration.

Doc# E107707 20 - 18
20: Configuring the MP200 Metering System
Electro Industries/GaugeTechThe Leader In Power Monitoring and Smart Grid SolutionsElectro Industries/GaugeTechThe Leader In Power Monitoring and Smart Grid Solutions
2. From this screen, you can do the following:
• Enable or disable password for Resetting (reset max/min Energy settings, Energy
accumulators (three phase configuration only), and the individual logs) and/or
Configuration (Device profile): click the radio button next to Yes or No.
NOTES:
• If you enable a password for reset, you must also enable it for configuration.
• The MP200 unit’s default is password disabled.
• Enabling Password protection prevents unauthorized tampering with devices.
When a user attempts to make a change that is under Password protection,
Communicator EXTTM software opens a screen asking for the password. If the
correct password is not entered, the change does not take place.
IMPORTANT! You must set up a password before enabling Password protection.
Click the Change Password button if you have not already set up a password. You
will see the Enter the New Password screen, shown below.
1. Type in the new password (0 - 9999).
2. Retype the password.
3. Click Change. The new password is saved and the MP200 unit restarts.
NOTE: If Password protection has already been enabled for configuration and
you attempt to change the password, you will see the Enter Password screen

Doc# E107707 20 - 19
20: Configuring the MP200 Metering System
Electro Industries/GaugeTechThe Leader In Power Monitoring and Smart Grid SolutionsElectro Industries/GaugeTechThe Leader In Power Monitoring and Smart Grid Solutions
after you click Change. Enter the old password and click OK to proceed with
the password change.
• Change the MP200 unit’s identification label: input a new label for the MP200
metering system into the CPU Identifier field.
• Enter a name for the eight meters in a three phase circuit configuration, or the 24
meters in a single phase circuit configuration. These names are used to identify the
meters in logging and polling screens and are also used in the naming of the log
files.
For example, if you have a shopping mall with 8 stores, each having a three phase
system that is attached to the MP200-Y, you can name the meters Store 1 - Store
8, to identify each meter with its store. Then when you look at the polling screens
or logging screens, you can easily identify each store’s data, without needing to
check the circuit configuration.

Doc# E107707 20 - 20
20: Configuring the MP200 Metering System
Electro Industries/GaugeTechThe Leader In Power Monitoring and Smart Grid SolutionsElectro Industries/GaugeTechThe Leader In Power Monitoring and Smart Grid Solutions
20.4.4: Configuring Communications
1. From the Tree menu, click General Settings>Communications to display the screen
shown below. Use this screen to enter communication settings for the MP200 unit's
communications ports.
2. Valid Communication Settings are as follows:
COM 1: RS485/ Ethernet/WIFI (optional)
Address: 1-247
Baud Rate: 9600, 19200, 38400, 57600 (For WiFi/Ethernet, only 57600)
Protocol: Modbus RTU/ASCII (For WiFi/Ethernet, only Modbus RTU)
Response Delay: 0-750ms
Parity: Odd, Even or None
Doc# E107707 20 - 21
20: Configuring the MP200 Metering System
Electro Industries/GaugeTechThe Leader In Power Monitoring and Smart Grid SolutionsElectro Industries/GaugeTechThe Leader In Power Monitoring and Smart Grid Solutions
COM 2: USB port
Protocol: MODBUS ASCII
Baud Rate: 57600
Address: 1
NOTE: The USB port settings are fixed, i.e., they cannot be changed.
COM 3: RS485
Address: 1-247
Protocol: Modbus RTU/ASCII
Baud Rate: 9600, 19200, 38400, 57600
Response Delay: 0-750ms
NOTE: Click the (1)Default to Ethernet or (2)Default to Display button to set either
the (1)Ethernet settings for COM1 or (2)Display settings for COM3, to their default
values.

Doc# E107707 20 - 22
20: Configuring the MP200 Metering System
Electro Industries/GaugeTechThe Leader In Power Monitoring and Smart Grid SolutionsElectro Industries/GaugeTechThe Leader In Power Monitoring and Smart Grid Solutions
20.4.5: Configuring Energy Settings
Use this setting to configure:
• The display and storage of Energy data in the meter
• The display of Power data in the meter and the method of VA computation
• The interval over which Average values are computed
Functional Overview of Energy Settings, VA Computation, and Averaging:
• Energy Setting
Energy Setting includes:
Digits (the number of digits in the reading)
Decimals (the number of decimal places in the reading)
Energy Scale: the scale of the reading - unit; kilo (number times 1000); Mega
(number times 1 million).
Energy settings allow you to balance the resolution (or accuracy) of the energy
stored, with the interval over which energy rollover occurs. For example, the
maximum resolution for a k scale reading is: 99999.999k.
To calculate the speed at which the energy will rollover, you must know the Energy
Full Scale, which is computed from the CT and PT Full Scale values (see Section
20.4.1). The formula for calculating Energy Full Scale is:
Wye system: CT Full Scale x PT Full Scale x 3
For example, for a CT Full Scale of 2000, PT Full Scale of 14400, Wye system:
2000 x 14400 x 3=86400000
In this example, the energy will increment at 86400000 Watts per hour, or 24000
Watts per second.
This value allows you to determine the number of digits, decimal places, and
energy scale you want to configure for the Energy settings, when you take into
account the rollover time.
To determine the number of hours before rollover, use this formula:

Doc# E107707 20 - 23
20: Configuring the MP200 Metering System
Electro Industries/GaugeTechThe Leader In Power Monitoring and Smart Grid SolutionsElectro Industries/GaugeTechThe Leader In Power Monitoring and Smart Grid Solutions
[Max Resolution]/[Full Scale] = #Hours, where Max Resolution = maximum digits
and decimals for the Energy scale in use.
Using the example from above, with an energy scale of Mega, the formula would
be:
99999.999 M/86.4 M = 1157.4074 hours or about 48 days until rollover.
NOTE: To increase the number of days until rollover, you can increase the number
of digits (to 8), decrease the number of decimal places (to 0), or increase the
Energy Scale (to M).
• Apparent Power (VA) Computation:
There are two optional methods of VA Computation:
Arithmetic Sum - the formula for this calculation is:
Vector Sum - the formula for this calculation is:
• Demand Averaging
Demand is the average rate of energy use over time. The Shark® 200 meter
supports two types of demand averaging: Block demand and Rolling demand.
Block demand records the average demand for time intervals that you define (
usually 5, 15 or 30 minutes).
Rolling demand functions like multiple, overlapping Block demand. You define the
subintervals at which an average of demand is calculated. An example of Rolling
demand would be a 15-minute Demand block using 5-minute subintervals, thus
providing a new demand reading every 5 minutes, based on the last 15 minutes.
VA VA VA VAT a b c= + +
VA W VART T T= +2 2
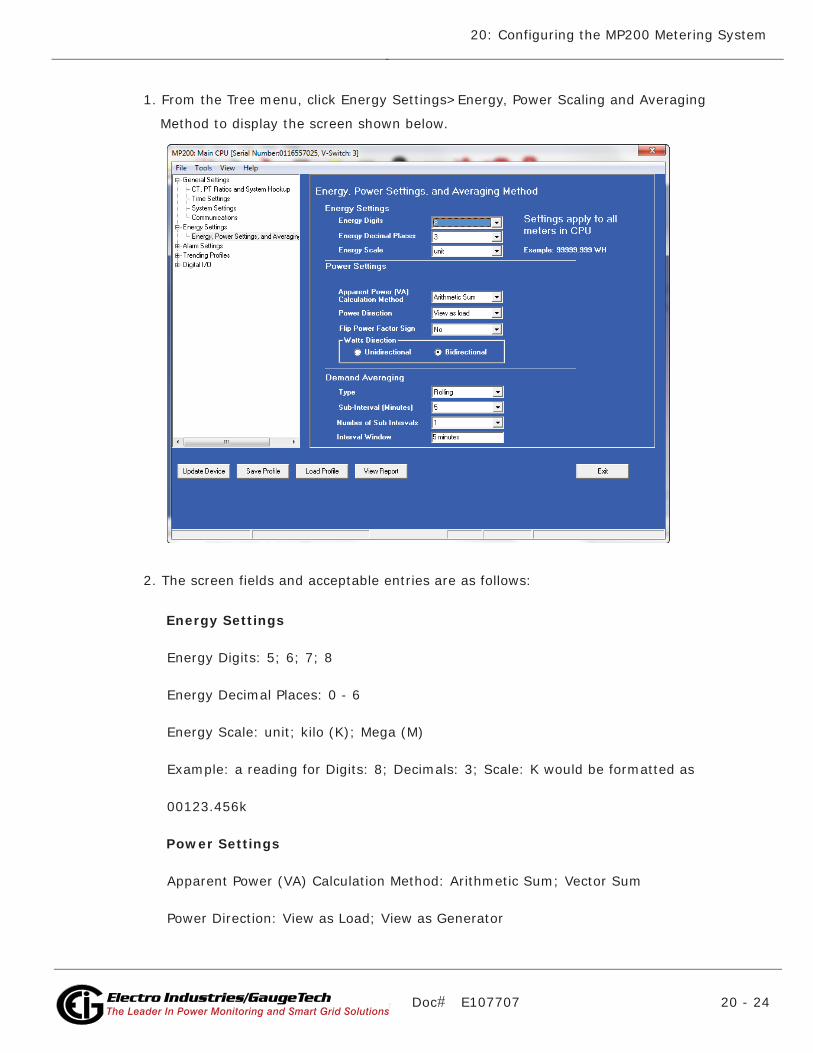
Doc# E107707 20 - 24
20: Configuring the MP200 Metering System
Electro Industries/GaugeTechThe Leader In Power Monitoring and Smart Grid SolutionsElectro Industries/GaugeTechThe Leader In Power Monitoring and Smart Grid Solutions
1. From the Tree menu, click Energy Settings>Energy, Power Scaling and Averaging
Method to display the screen shown below.
2. The screen fields and acceptable entries are as follows:
Energy Settings
Energy Digits: 5; 6; 7; 8
Energy Decimal Places: 0 - 6
Energy Scale: unit; kilo (K); Mega (M)
Example: a reading for Digits: 8; Decimals: 3; Scale: K would be formatted as
00123.456k
Power Settings
Apparent Power (VA) Calculation Method: Arithmetic Sum; Vector Sum
Power Direction: View as Load; View as Generator

Doc# E107707 20 - 25
20: Configuring the MP200 Metering System
Electro Industries/GaugeTechThe Leader In Power Monitoring and Smart Grid SolutionsElectro Industries/GaugeTechThe Leader In Power Monitoring and Smart Grid Solutions
Flip Power Factor Sign: No; Yes
Watts Direction: Unidirectional; Bidirectional
Demand Averaging
Type: Block or Rolling
Interval (Block demand) or Sub-Interval (Rolling demand) in minutes: 5; 15; 30;
60
Number of Subintervals: 1; 2; 3; 4
Interval Window: This field is display only. It is the product of the values entered in
the Sub-Interval and Number of Subintervals fields.
NOTE: You will only see the Number of Subintervals and Interval Window fields if
you select Rolling Demand.

Doc# E107707 20 - 26
20: Configuring the MP200 Metering System
Electro Industries/GaugeTechThe Leader In Power Monitoring and Smart Grid SolutionsElectro Industries/GaugeTechThe Leader In Power Monitoring and Smart Grid Solutions
20.4.6: Configuring Limits
Limits are transition points used to divide acceptable and unacceptable measure-
ments. When a value goes above or below the limit an out-of-limit condition occurs.
Once they are configured, you can view the out-of-Limits (or Alarm) conditions in the
Limits log or Limits polling screen. You can also use Limits to trigger relays.
1. From the Tree menu, click Power Quality & Alarm Settings>Limits to display the
screen shown below.
The current settings for Limits are shown in the screen. You can set and configure up
to eight Limits for the MP200 unit.
To set up a Limit:
1. Select a Limit by double-clicking on the Assigned Channel field.

Doc# E107707 20 - 27
20: Configuring the MP200 Metering System
Electro Industries/GaugeTechThe Leader In Power Monitoring and Smart Grid SolutionsElectro Industries/GaugeTechThe Leader In Power Monitoring and Smart Grid Solutions
2. You will see the screen shown below.
This screen lets you configure the limits. The settings you can make depend on
your MP200 unit’s configuration:
• For a three phase configuration, you can set up limits from the Readings group’s
items for all meters or any individual meter (select from the Meter pull-down
menu).
The items you can select for Readings limits for All Meters are: Phase to Neutral
voltage, Phase to Phase Voltage, and Frequency.
The items you can select for Reading limits for individual meters are: Current
phases A, B, and C, Total Watts, Total VAR, Total VA, Total PF, Current Neutral,
Watts per Phase, VAR per Phase, VA per Phase, and PF per Phase.
The Demand group (select from the Group pull-down menu) can only have limits
set for individual meters (not All Meters).
The items you can select for Demand limits are: Current phases A, B, and C, Total
+Watts, Total +VAR, Total -Watts, Total -VAR, Total VA, Total +PF, Total -PF,
+Watts per Phase, -Watts per Phase, +VAR per Phase, -VAR per Phase, VA per
Phase, + PF per Phase, and -PF per Phase.
• For a single phase configuration, you can set up limits from the Readings group’s
items for All meters or any individual meter (select from the Meter pull-down
menu).
The Items you can select for Readings limits for All Meters are: Voltage and Fre-
quency.
Select All Meters or Individual Meter Select Readings or Demand
Select Item to use for Limit

Doc# E107707 20 - 28
20: Configuring the MP200 Metering System
Electro Industries/GaugeTechThe Leader In Power Monitoring and Smart Grid SolutionsElectro Industries/GaugeTechThe Leader In Power Monitoring and Smart Grid Solutions
The items you can select for Reading limits for individual meters are: Current,
Watts, VAR, VA, and PF.
The Demand group (select from the Group pull-down menu) can only have limits
set for individual meters (not All Meters).
The items you can select for Demand limits are: Current, +Watts, +VAR, -Watts,
-VAR, VA, +PF, and -PF.
Click OK. The limit item you selected is displayed in the Limit field.
3. To configure a Limit, double-click on the field to set the following values:
• Above and Below Setpoint: % of Full Scale (the point at which the reading
goes out of limit)
Examples:
100% of 120V Full Scale = 120V
90% of 120V Full Scale = 108V

Doc# E107707 20 - 29
20: Configuring the MP200 Metering System
Electro Industries/GaugeTechThe Leader In Power Monitoring and Smart Grid SolutionsElectro Industries/GaugeTechThe Leader In Power Monitoring and Smart Grid Solutions
• Above and Below Return Hysteresis: the point at which the reading goes
back within limit (see figure below)
Examples:
Above Setpoint = 110%; Below Setpoint = 90%
(Out of Limit above 132V);(Out of Limit below 108V)
Above Return Hysteresis = 105%; Below Return Hysteresis = 95%
(Stay out of Limit until below 126V)(Stay out of Limit until above 114V)
Primary Fields: These fields are display only. They show what the setpoint and
return hysteresis value are for each limit.
NOTES:
• If you are entering negative Limits, be aware that the negative value affects the
way the above and below Limits function, since negative numbers are processed as
signed values.
• If the Above Return Hysteresis is greater than the Above Setpoint, the Above Limit
is Disabled; if the Below Return Hysteresis is less than the Below Setpoint, the
Below Limit is Disabled. You may want to use this feature to disable either Above or
Below Limit conditions for a reading.
TIME
Above Limit condition
Below Limit condition
Above Limit Trigger point
Return point from Above Limit condition
Below Limit Trigger point
Return point from Below Limit condition
HYSTERESIS
HYSTERESIS
- MEASURED VALUE(if applicable)
+ MEASURED VALUE
0

Doc# E107707 20 - 30
20: Configuring the MP200 Metering System
Electro Industries/GaugeTechThe Leader In Power Monitoring and Smart Grid SolutionsElectro Industries/GaugeTechThe Leader In Power Monitoring and Smart Grid Solutions
20.4.7: Configuring Historical Logs
From the Tree Menu, click Trending Profiles>Historical Log Profile 1-3, depending on
your MP200 unit’s circuit configuration, to display a screen that lets you select the log-
ging interval for the historical log you selected. Historical logs 1 and 2 are used for the
three phase configuration; Historical logs 1 and 3 are used for the single phase con-
figuration.
NOTE: All of the MP200 unit’s Historical logs are pre-configured to log specific read-
ings. Historical Log 1 logs Voltage and Frequency readings, Historical log 2 logs
Energy in the Interval for the 8 three phase circuit, and Historical log 3 logs Energy in
the Interval for each phase of the 24 single phase circuits.
Sample screens for the three Historical logs follow.
(Log 1 for a Three Phase Configuration)
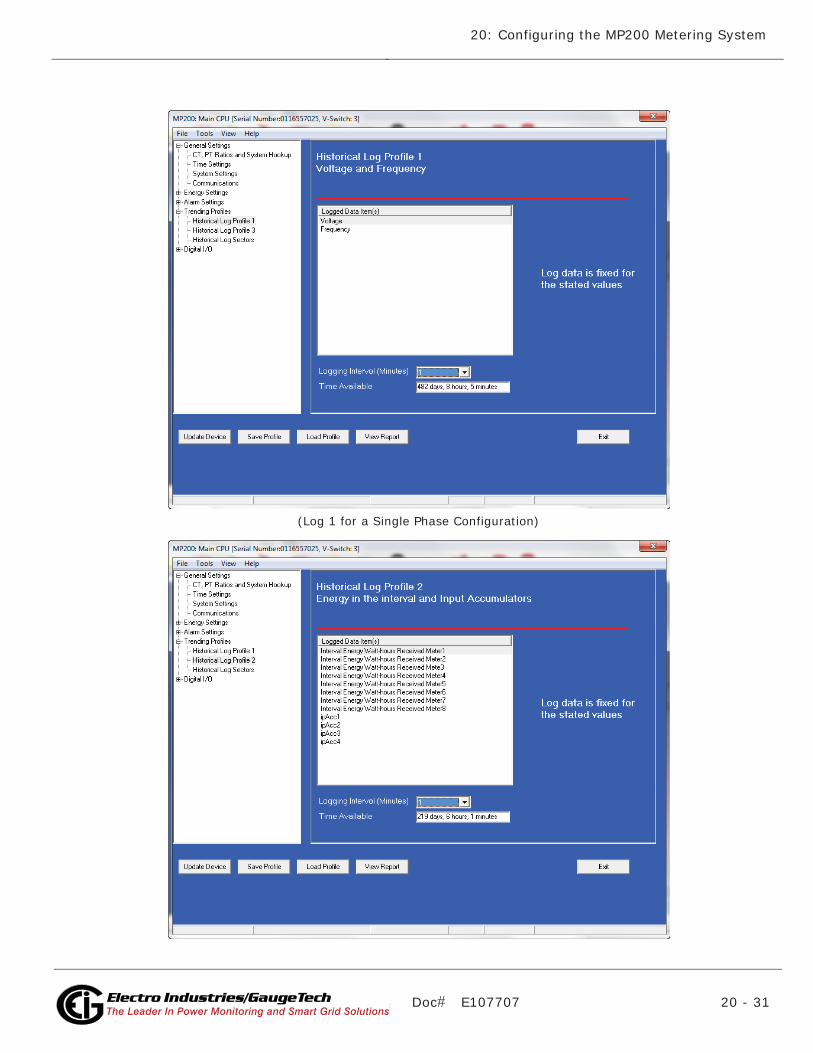
Doc# E107707 20 - 31
20: Configuring the MP200 Metering System
Electro Industries/GaugeTechThe Leader In Power Monitoring and Smart Grid SolutionsElectro Industries/GaugeTechThe Leader In Power Monitoring and Smart Grid Solutions
(Log 1 for a Single Phase Configuration)

Doc# E107707 20 - 32
20: Configuring the MP200 Metering System
Electro Industries/GaugeTechThe Leader In Power Monitoring and Smart Grid SolutionsElectro Industries/GaugeTechThe Leader In Power Monitoring and Smart Grid Solutions
The only change you can make on any of the Historical Log Profile screens is to set the
Logging Interval. The available choices are: 1, 3, 5, 10, 15, 30, or 60 minutes, or EOI
(End of Interval) Pulse. The Logging Interval determines when the MP200 unit takes a
snapshot of the data values being trended.
IMPORTANT! If you are trending Energy in the Interval (Historical logs 2 and 3), the
Logging interval must be the same as the Demand interval.
NOTES:
• Only one I/O Card input or output can be set to trigger an EOI pulse.
• The maximum rate for EOI Pulse used to trigger a log is once per minute.
• When you choose EOI Pulse, the MP200 unit takes a snapshot on the End of Inter-
val Pulse condition, rather than on a time interval. Following are two examples of
using EOI Pulse for log recording.

Doc# E107707 20 - 33
20: Configuring the MP200 Metering System
Electro Industries/GaugeTechThe Leader In Power Monitoring and Smart Grid SolutionsElectro Industries/GaugeTechThe Leader In Power Monitoring and Smart Grid Solutions
Examples of EOI Pulse Recording:
• The Relay Output/Digital Input card installed in your MP200 unit is set to trigger on
a state change. You can use EOI pulse to take a snapshot upon that state change.
• An MP200 unit is connected on each side of a load. You want to take a snapshot of
both sides of the load at the same time. You can do this by connecting the Relay
Output/Digital Input card in each of the MP200 units to a device that will trigger
them. Then set the EOI pulse to take a snapshot when the devices are triggered.
See Section 20.4.9 for additional information.
NOTE: There are three display fields at the bottom of the Historical Log Profile screen.
They show the Time Remaining, the Total Bytes Used, and the Bytes Remaining for
this historical log. These fields are updated as you make selections on the screen.
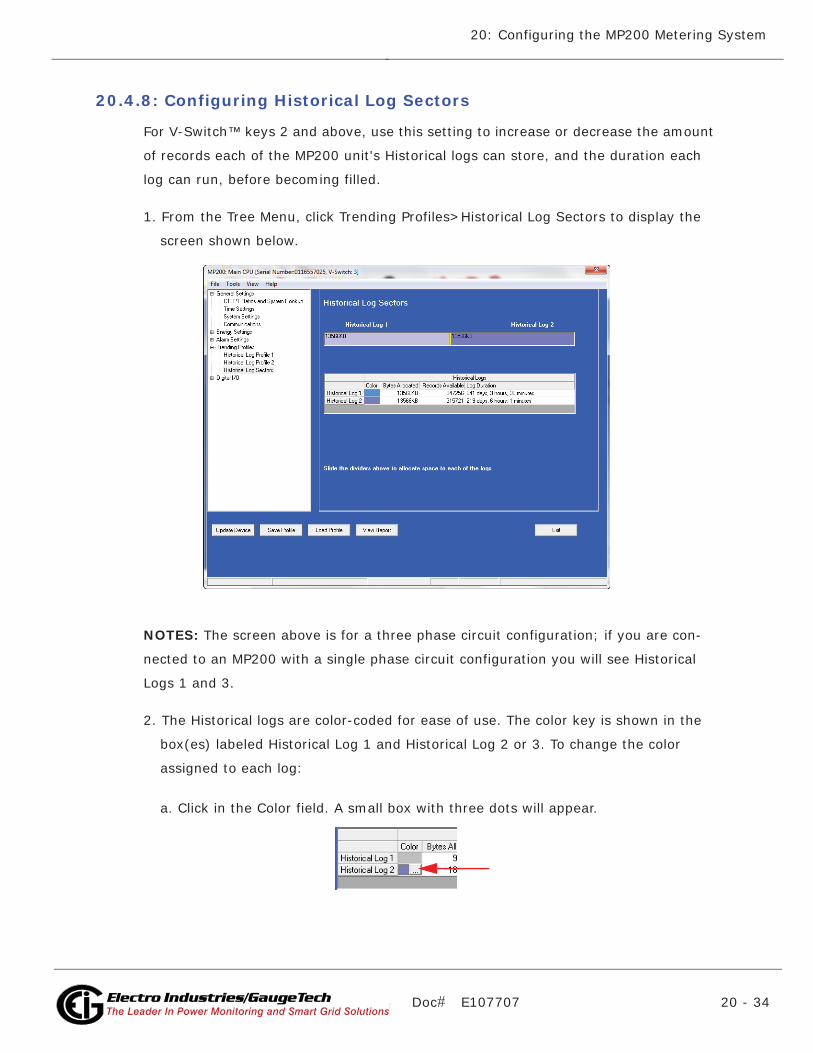
Doc# E107707 20 - 34
20: Configuring the MP200 Metering System
Electro Industries/GaugeTechThe Leader In Power Monitoring and Smart Grid SolutionsElectro Industries/GaugeTechThe Leader In Power Monitoring and Smart Grid Solutions
20.4.8: Configuring Historical Log Sectors
For V-Switch™ keys 2 and above, use this setting to increase or decrease the amount
of records each of the MP200 unit's Historical logs can store, and the duration each
log can run, before becoming filled.
1. From the Tree Menu, click Trending Profiles>Historical Log Sectors to display the
screen shown below.
NOTES: The screen above is for a three phase circuit configuration; if you are con-
nected to an MP200 with a single phase circuit configuration you will see Historical
Logs 1 and 3.
2. The Historical logs are color-coded for ease of use. The color key is shown in the
box(es) labeled Historical Log 1 and Historical Log 2 or 3. To change the color
assigned to each log:
a. Click in the Color field. A small box with three dots will appear.

Doc# E107707 20 - 35
20: Configuring the MP200 Metering System
Electro Industries/GaugeTechThe Leader In Power Monitoring and Smart Grid SolutionsElectro Industries/GaugeTechThe Leader In Power Monitoring and Smart Grid Solutions
b. Click in the box to open a screen that lets you choose an alternate color.
c. Click on the color you want and then click OK to select the new color and close
the color selection screen. The new color will now be used for the Historical log.
See the example below.
3. The screen shows the current space allocation for the MP200 unit's Historical logs,
including:
• The number of bytes allocated to each log
• The number of records available for each log
• The duration of each log
4. To change the current allocation for a log:
a. Click on the double yellow line dividing the logs.

Doc# E107707 20 - 36
20: Configuring the MP200 Metering System
Electro Industries/GaugeTechThe Leader In Power Monitoring and Smart Grid SolutionsElectro Industries/GaugeTechThe Leader In Power Monitoring and Smart Grid Solutions
b. You will see a line with arrows on each side. Drag the line in either direction to
increase or decrease the log allocation. The display fields for the logs will reflect
any changes you make to the allocation.
NOTE: When EOI Pulse is set as the Logging Interval for a Historical log (see previous
section, 20.4.7), the Log Duration field for that log will be blank.
20.4.9: Configuring Relay Assignments
The MP200 unit has an embedded Relay Output/Digital Input card. Accumulators in
the Communicator EXTTM software count the transitions of the Inputs and Outputs. For
technical specifications and hardware installation, refer to the MP200 Metering Sys-
tem’s Installation and Operation Manual.
An example use of the Relay Card is in monitoring the status of circuit breakers or
relays in your electrical system. The two status inputs could be used to monitor two
circuit breakers, and the two relay outputs could be used to sound an alarm upon the
occurrence of a programmed out of limit condition.
1. From the Tree menu, click Option Card>Digital I/O>Relay Output and Digital
Input>Relay Relay Assignments to open the screen shown below.

Doc# E107707 20 - 37
20: Configuring the MP200 Metering System
Electro Industries/GaugeTechThe Leader In Power Monitoring and Smart Grid SolutionsElectro Industries/GaugeTechThe Leader In Power Monitoring and Smart Grid Solutions
From the Relay Assignments screen, you can:
• Configure up to 8 limits for each of the two Relay Outputs.
• Set a Delay and Reset Delay for the Outputs.
• Choose to log Status Changes for each Relay Output.
• Assign each Output an Output Label, Open Label, and Closed Label, which are used
when viewing the Relay Status Log.
• Assign an Accumulation Compression Factor for each output.
IMPORTANT! First use the Limits screen to set up the limits you want to assign to an
Output. See Section 20.4.6 for instructions.
The available Limits appear in the Limit ID column.
To Assign a Limit to an Output Relay:
1. Select the Alarm trigger from the pull-down menu next to the Limit ID. The options
are: Above Limit (the Output is triggered when the Above Limit condition occurs)
and Below Limit (the Output is triggered when the Below Limit condition occurs).
You can assign the limit to one or both (or neither) of the Relay Outputs.
NOTE: A Relay operates when any one assigned Limit is tripped, and stays in the
Set condition as long as one Limit is in the Alarm state.
2. You can enter Set Delay and/or Reset Delay. These values are the delay before the
Output is changed: Set is when the common is shorted to Normal Open (this is the
Set Condition).
3. Check the box next to Log Status Change for if you want to log output status
changes for either or both Relay. See Chapter 8, Section 8.26.1 for information on
the I/O Change Log.
4. The current Output Labels are displayed in the screen. These labels are used for
Logging. To change the Output labels, click in the Labels field you want to change,
and enter a new label. The fields that can be changed are:
• Output Label - Label ID

Doc# E107707 20 - 38
20: Configuring the MP200 Metering System
Electro Industries/GaugeTechThe Leader In Power Monitoring and Smart Grid SolutionsElectro Industries/GaugeTechThe Leader In Power Monitoring and Smart Grid Solutions
• Open Label - Open state ID
• Closed Label - Closed state ID
5. You can specify an Accumulation Compression Factor. The Compression Factor is
used to adjust how high an accumulator will go before rolling over. Because of this,
it is useful in delaying rollover. For example, if you select a Compression Factor of
10, each time 10 Pulse/State changes occur, the accumulator count increments by
1. The available Compression Factors are: 1, 10, 100, 1000, 10000, and 100000.
The default Compression Factor is 1.
20.4.10: Configuring Digital Input Settings
1. From the Tree menu, click Option Card>Digital I/O>Relay Output and Digital
Input>Digital Input Settings. Use this screen to assign labels and functions to the
Relay Output/Digital Input card’s Inputs.
2. Make a selection in the Assigned to field. The available selections are:
• Status Only

Doc# E107707 20 - 39
20: Configuring the MP200 Metering System
Electro Industries/GaugeTechThe Leader In Power Monitoring and Smart Grid SolutionsElectro Industries/GaugeTechThe Leader In Power Monitoring and Smart Grid Solutions
• Accumulator
• Digital Input Log
• EOI Pulse - only one Input can be set as EOI pulse.
NOTE on End of Interval (EOI):
EOI is triggered when the selected condition is met. Only one I/O card’s input or
output can be set to trigger an EOI pulse. EOI is used for the following:
• As a trigger for demand averaging: when the selected condition is met,
the EOI delineates an interval that results in demand averaging being
performed. The minimum interval between EOI Pulses used to trigger
demand averaging should be 5 minutes.
• For historical logging: when the selected condition is met, EOI causes any
log that has been configured for EOI Pulse interval to capture a record.
Refer to Section 20.4.7 for additional information on EOI Pulse and
logging.
3. Select Trigger from the pull-down menu. The Trigger options depend on your
Assigned to selection:
• For Status Only, select None.
• For Accumulator, select from Closing or Opening.
• For Digital Input Log, select Change.
• For EOI Pulse, select from Closing, Opening, or Change.
4. Use the Scaling Factor fields as follows:
a. Enter Multiplier. The Multiplier is the output ratio from the device that is
being input into the MP200 unit. For example, if you have a KYZ module
that is outputting a pulse every 1.8 kWh, with the input set to Accumulator,
Increment on Contact Opening, you would set the Multiplier to be the value
of the KYZ; in this case either 1.8 or a ratio of that number.
b. Enter Divider. The Divider is used to adjust how high an accumulator will go
before rolling over. For example, if you select a Divider of 10, each time 10
Pulse/State changes occur, the accumulator count increments by 1. The

Doc# E107707 20 - 40
20: Configuring the MP200 Metering System
Electro Industries/GaugeTechThe Leader In Power Monitoring and Smart Grid SolutionsElectro Industries/GaugeTechThe Leader In Power Monitoring and Smart Grid Solutions
available Dividers are: 1, 10, 100, 1000, 10000, and 100000. The default
Divider is 1.
c. The Result field is display only. It shows the result of the Multiplier entry
divided by the Divider entry. For example, Multiplier=4.000; Divider=0.01;
Result will be 4/0.01 = x 400. The Result factor is multiplied by the num-
ber of pulses to give you the total accumulated value.
5. Enter a Label for the Accumulator.
6. The current Input Labels are displayed in the screen. To change the Input Labels,
click in the Labels field you want to change, and enter a new label. The fields that
can be changed are:
• Input Label - Input ID
• Open Label - Open state ID
• Closed Label - Closed state ID
20.5: MP200 Metering System Tools Menu
The Tools screens for the MP200 metering system are similar to those of the other EIG
devices. They are accessed from the Tools menu in the Communicator EXT software’s
Title Bar.
Edit Current Device Profile: opens the MP200 metering system's Device Profile screen.

Doc# E107707 20 - 41
20: Configuring the MP200 Metering System
Electro Industries/GaugeTechThe Leader In Power Monitoring and Smart Grid SolutionsElectro Industries/GaugeTechThe Leader In Power Monitoring and Smart Grid Solutions
Change V-Switch: opens the Change V-Switch™ screen.
The MP200 metering system is equipped with V-Switch™ key technology. The V-
Switch™ key is a virtual firmware-based switch that allows you to enable features
through communication. This means you can upgrade the MP200 unit to a “higher”
model after installation without removing it from service.
Consult the MP200 Metering System’s Installation and Operation manual for its avail-
able V-Switch™ keys.
1. When you click Change V-Switch, you will see the screen shown below.
2. Enter the code provided by EIG.
3. Click Update. The V-Switch™ key is changed and the MP200 unit restarts.
NOTE: V-Switch™ keys are based on the serial number of the ordered device. To
purchase a key, you need to provide EIG with the following information:
1. Serial Number(s) of the device(s) that you want to upgrade.
2. Desired V-Switch™ key.
3. A Credit Card or Purchase Order Number.
Contact EIG's inside sales staff with the above information at [email protected] to
receive the Upgrade key.

Doc# E107707 20 - 42
20: Configuring the MP200 Metering System
Electro Industries/GaugeTechThe Leader In Power Monitoring and Smart Grid SolutionsElectro Industries/GaugeTechThe Leader In Power Monitoring and Smart Grid Solutions
Set Device Time: opens the screen shown on the right.
This screen allows you to set the MP200 unit’s clock
and/or synchronize it to PC time. The MP200 unit's
clock is used for logging and other time retrieval
purposes.
1. To set the device time, do one of the following:
• To use PC time, click the checkbox.
• To set the MP200 units time, enter the time and date information.
2. Click Send to send the time to the MP200 unit.
NOTE: When changing the clock, all logs should be retrieved and then reset.
Retrieve Device Time: opens a
screen that displays the MP200 unit's
internal time.

Doc# E107707 20 - 43
20: Configuring the MP200 Metering System
Electro Industries/GaugeTechThe Leader In Power Monitoring and Smart Grid SolutionsElectro Industries/GaugeTechThe Leader In Power Monitoring and Smart Grid Solutions
Reset Device Information: depending on your MP200 unit’s circuit configuration,
opens one of the screens shown below.Click the item(s) you want to reset and click
Reset.
NOTES:
• You can perform a reset for all of the meters or individual meters.
• This feature requires a Password if “Password for Resetting” is enabled. See Section
20.4.3.
Retrieve Device Status: opens the Device Status screen. See Section 20.1.1.
Three Phase Meter Configuration
Single Phase Meter Configuration
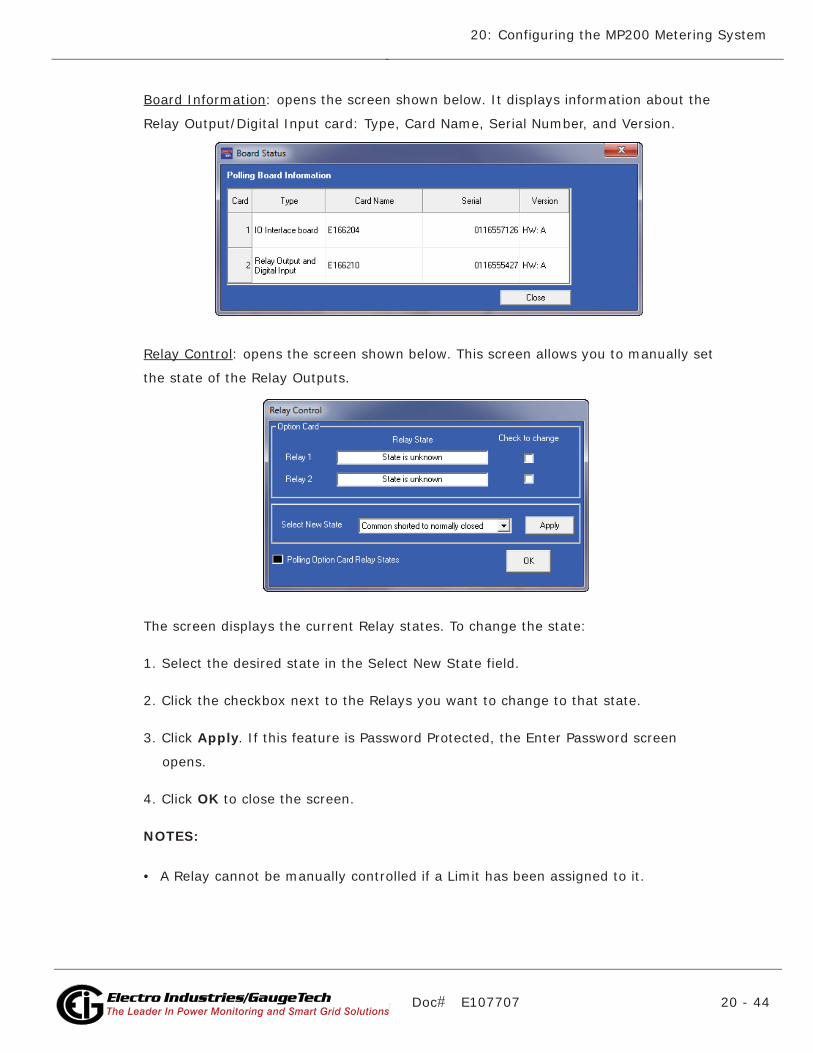
Doc# E107707 20 - 44
20: Configuring the MP200 Metering System
Electro Industries/GaugeTechThe Leader In Power Monitoring and Smart Grid SolutionsElectro Industries/GaugeTechThe Leader In Power Monitoring and Smart Grid Solutions
Board Information: opens the screen shown below. It displays information about the
Relay Output/Digital Input card: Type, Card Name, Serial Number, and Version.
Relay Control: opens the screen shown below. This screen allows you to manually set
the state of the Relay Outputs.
The screen displays the current Relay states. To change the state:
1. Select the desired state in the Select New State field.
2. Click the checkbox next to the Relays you want to change to that state.
3. Click Apply. If this feature is Password Protected, the Enter Password screen
opens.
4. Click OK to close the screen.
NOTES:
• A Relay cannot be manually controlled if a Limit has been assigned to it.

Doc# E107707 20 - 45
20: Configuring the MP200 Metering System
Electro Industries/GaugeTechThe Leader In Power Monitoring and Smart Grid SolutionsElectro Industries/GaugeTechThe Leader In Power Monitoring and Smart Grid Solutions
• If the Relay State field is “State is Unknown,” verify that the Relay configuration is
correct. You may also see this message after you have performed a Reset. Select a
New State for the Relay and click Apply.
Firmware Update: opens a screen that allows you to update the MP200 unit's firm-
ware.
1. Click Browse to locate the firmware file you want to upload.
2. Click Flash to begin the firmware upgrade.
See Chapter 13 for general information regarding Flash upgrading of firmware.

Doc# E107707 20 - 46
20: Configuring the MP200 Metering System
Electro Industries/GaugeTechThe Leader In Power Monitoring and Smart Grid SolutionsElectro Industries/GaugeTechThe Leader In Power Monitoring and Smart Grid Solutions
20.6: MP200 Metering System Polling Screens
The Polling screens for the MP200 metering system are accessed from the Real-Time
Poll menus in the Title Bar.
The buttons on the Polling screens perform the following functions:
• OK: click to close the screen.
• Print: click to send the polling screen to the printer.
• Pause: click to stop instantaneous polling.
• Resume: click to resume instantaneous polling which has been paused.
• Copy: click to copy the polling screen to the clipboard - from there you can paste it
into another application.
• Help: click to open the Communicator EXTTM application’s User Manual.

Doc# E107707 20 - 47
20: Configuring the MP200 Metering System
Electro Industries/GaugeTechThe Leader In Power Monitoring and Smart Grid SolutionsElectro Industries/GaugeTechThe Leader In Power Monitoring and Smart Grid Solutions
20.6.1: Instantaneous Polling
Click Real-Time Poll>Real Time Readings>Instantaneous Polling. Depending on your
circuit configuration, you’ll see one of the screens shown below.
For the three phase configuration, click on the tabs to see additional readings. Click
Pause to stop the polling and Resume to start it again.
Single Phase Configuration
Three Phase Configuration

Doc# E107707 20 - 48
20: Configuring the MP200 Metering System
Electro Industries/GaugeTechThe Leader In Power Monitoring and Smart Grid SolutionsElectro Industries/GaugeTechThe Leader In Power Monitoring and Smart Grid Solutions
20.6.2: Poll Max and Min Readings
Click Real-Time Poll>Real Time Readings>Poll Max and Min Readings. Depending on
your circuit configuration, you’ll see one of the following screens.
Three Phase Configuration

Doc# E107707 20 - 49
20: Configuring the MP200 Metering System
Electro Industries/GaugeTechThe Leader In Power Monitoring and Smart Grid SolutionsElectro Industries/GaugeTechThe Leader In Power Monitoring and Smart Grid Solutions
Click the tabs to see additional readings.
Single Phase Configuration

Doc# E107707 20 - 50
20: Configuring the MP200 Metering System
Electro Industries/GaugeTechThe Leader In Power Monitoring and Smart Grid SolutionsElectro Industries/GaugeTechThe Leader In Power Monitoring and Smart Grid Solutions
20.6.3: Short Term Max & Min Readings
Click Real-Time Poll>Real Time Readings>Short Term Max & Min Readings. Depending
on your circuit configuration, you’ll see one of the screens shown below.
Three Phase Configuration
Single Phase Configuration
Scroll to see additional readings
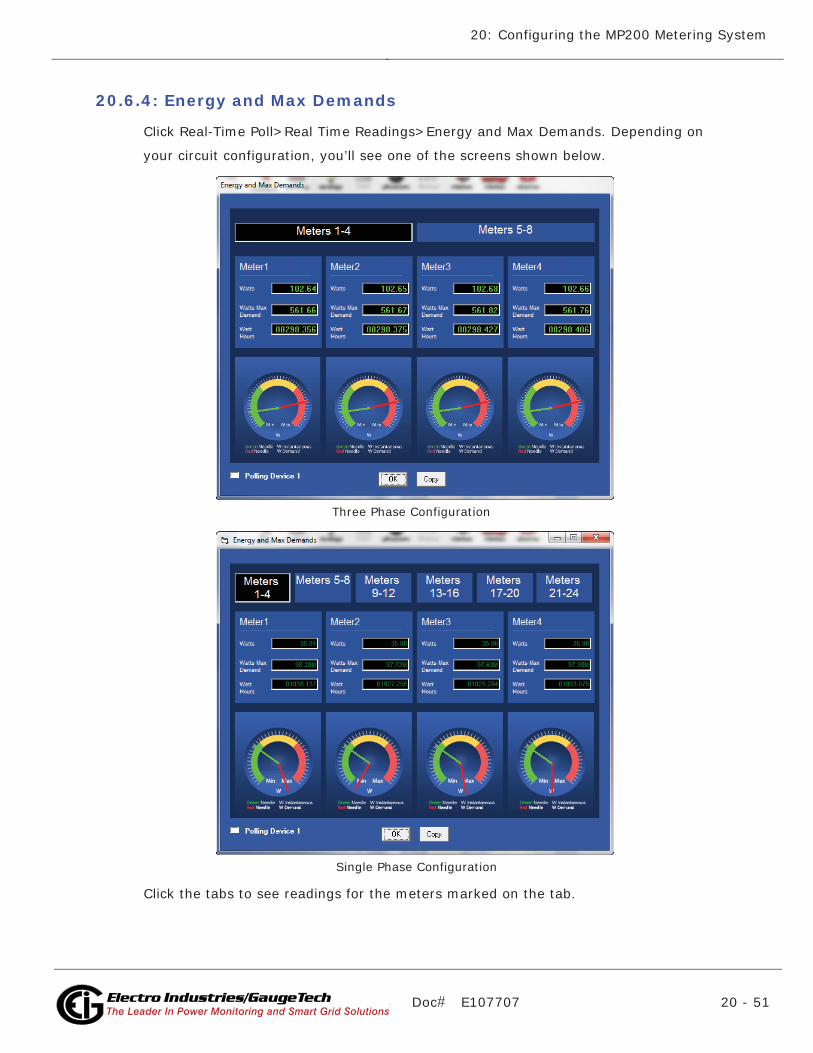
Doc# E107707 20 - 51
20: Configuring the MP200 Metering System
Electro Industries/GaugeTechThe Leader In Power Monitoring and Smart Grid SolutionsElectro Industries/GaugeTechThe Leader In Power Monitoring and Smart Grid Solutions
20.6.4: Energy and Max Demands
Click Real-Time Poll>Real Time Readings>Energy and Max Demands. Depending on
your circuit configuration, you’ll see one of the screens shown below.
Click the tabs to see readings for the meters marked on the tab.
Three Phase Configuration
Single Phase Configuration

Doc# E107707 20 - 52
20: Configuring the MP200 Metering System
Electro Industries/GaugeTechThe Leader In Power Monitoring and Smart Grid SolutionsElectro Industries/GaugeTechThe Leader In Power Monitoring and Smart Grid Solutions
20.6.5: Energy
Click Real-Time Poll>Revenue, Energy and Demand Readings>Energy. Depending on
your circuit configuration, you’ll see one of the screens shown below.
For the three phase configuration, click on the tabs to see additional readings. Click
Pause to stop the polling and Resume to start it again.
Three Phase Configuration
Single Phase Configuration

Doc# E107707 20 - 53
20: Configuring the MP200 Metering System
Electro Industries/GaugeTechThe Leader In Power Monitoring and Smart Grid SolutionsElectro Industries/GaugeTechThe Leader In Power Monitoring and Smart Grid Solutions
20.6.6: Demand
Click Real-Time Poll>Revenue, Energy and Demand Readings>Demand. Depending on
your circuit configuration, you’ll see one of the screens shown below.
Click the tabs to see additional readings.
Three Phase Configuration
Single Phase Configuration
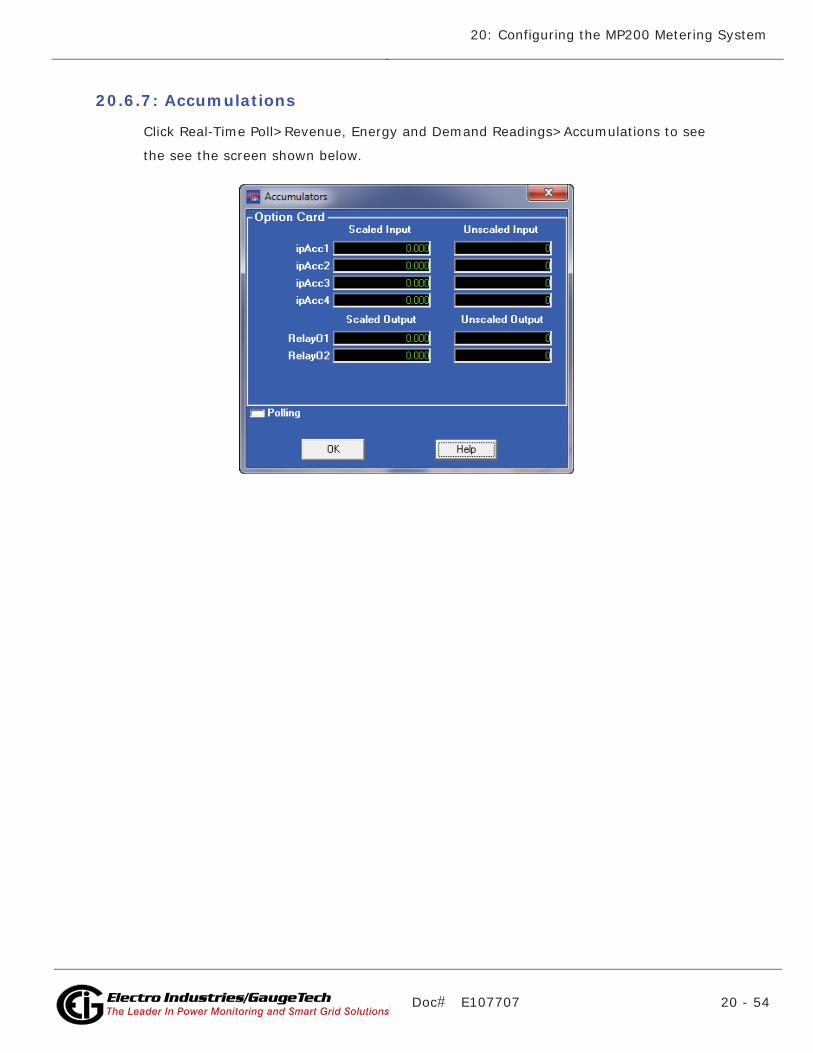
Doc# E107707 20 - 54
20: Configuring the MP200 Metering System
Electro Industries/GaugeTechThe Leader In Power Monitoring and Smart Grid SolutionsElectro Industries/GaugeTechThe Leader In Power Monitoring and Smart Grid Solutions
20.6.7: Accumulations
Click Real-Time Poll>Revenue, Energy and Demand Readings>Accumulations to see
the see the screen shown below.
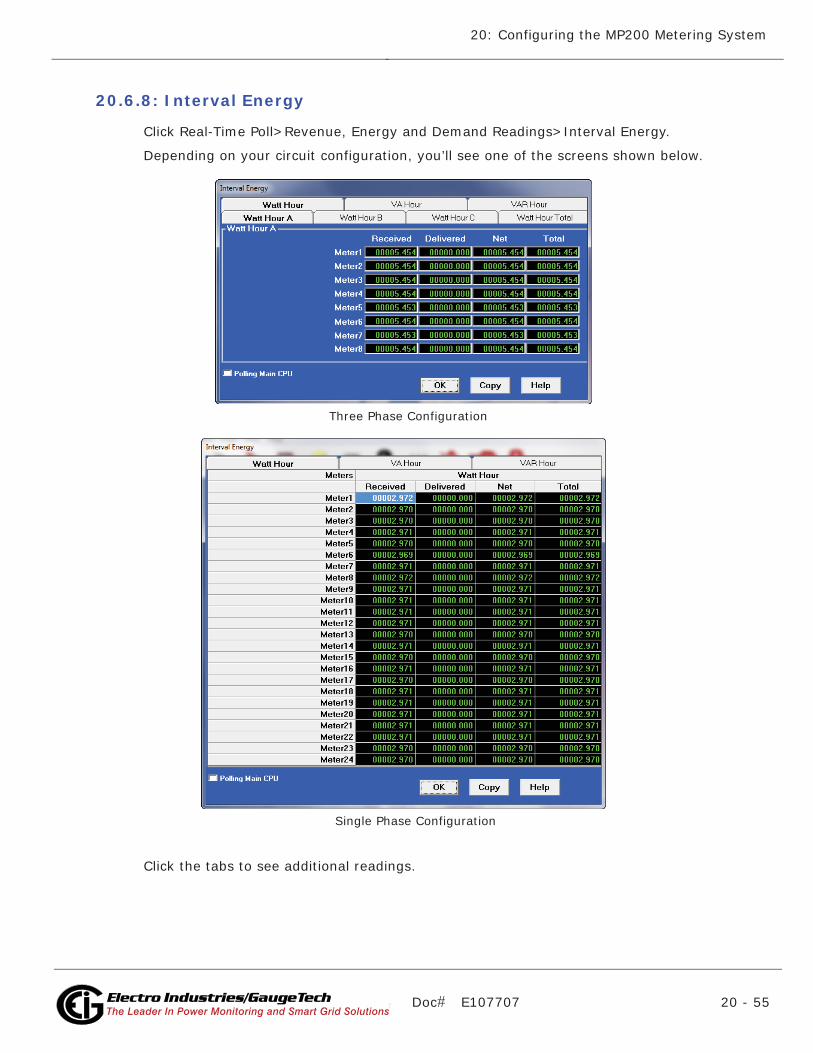
Doc# E107707 20 - 55
20: Configuring the MP200 Metering System
Electro Industries/GaugeTechThe Leader In Power Monitoring and Smart Grid SolutionsElectro Industries/GaugeTechThe Leader In Power Monitoring and Smart Grid Solutions
20.6.8: Interval Energy
Click Real-Time Poll>Revenue, Energy and Demand Readings>Interval Energy.
Depending on your circuit configuration, you’ll see one of the screens shown below.
Click the tabs to see additional readings.
Three Phase Configuration
Single Phase Configuration

Doc# E107707 20 - 56
20: Configuring the MP200 Metering System
Electro Industries/GaugeTechThe Leader In Power Monitoring and Smart Grid SolutionsElectro Industries/GaugeTechThe Leader In Power Monitoring and Smart Grid Solutions
20.6.9: Phasors
Click Real-Time Poll>Power Quality and Alarms>Phasors. Depending on your circuit
configuration, you’ll see one of the following screens.
Three Phase Configuration

Doc# E107707 20 - 57
20: Configuring the MP200 Metering System
Electro Industries/GaugeTechThe Leader In Power Monitoring and Smart Grid SolutionsElectro Industries/GaugeTechThe Leader In Power Monitoring and Smart Grid Solutions
• From the pull-down menu, select the meter who’s phasor readings you want to see.
• Click Pause to stop polling and click Resume to start it again.
Single Phase Configuration
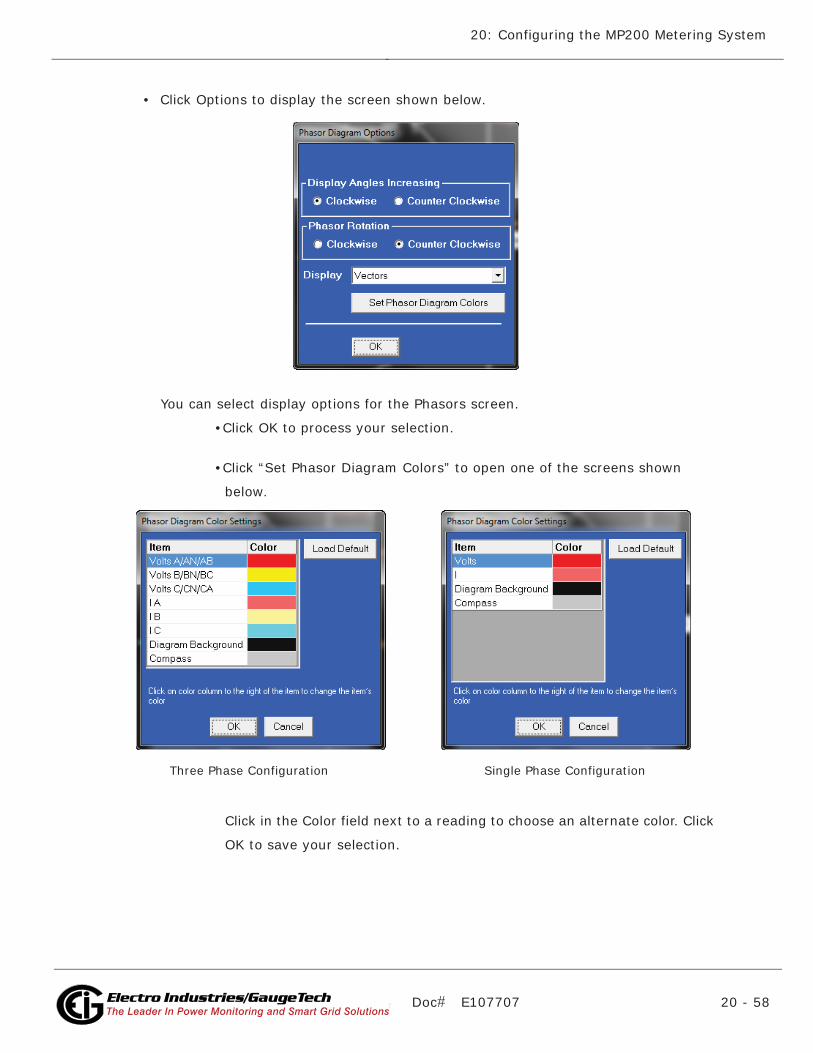
Doc# E107707 20 - 58
20: Configuring the MP200 Metering System
Electro Industries/GaugeTechThe Leader In Power Monitoring and Smart Grid SolutionsElectro Industries/GaugeTechThe Leader In Power Monitoring and Smart Grid Solutions
• Click Options to display the screen shown below.
You can select display options for the Phasors screen.
•Click OK to process your selection.
•Click “Set Phasor Diagram Colors” to open one of the screens shown
below.
Click in the Color field next to a reading to choose an alternate color. Click
OK to save your selection.
Three Phase Configuration Single Phase Configuration
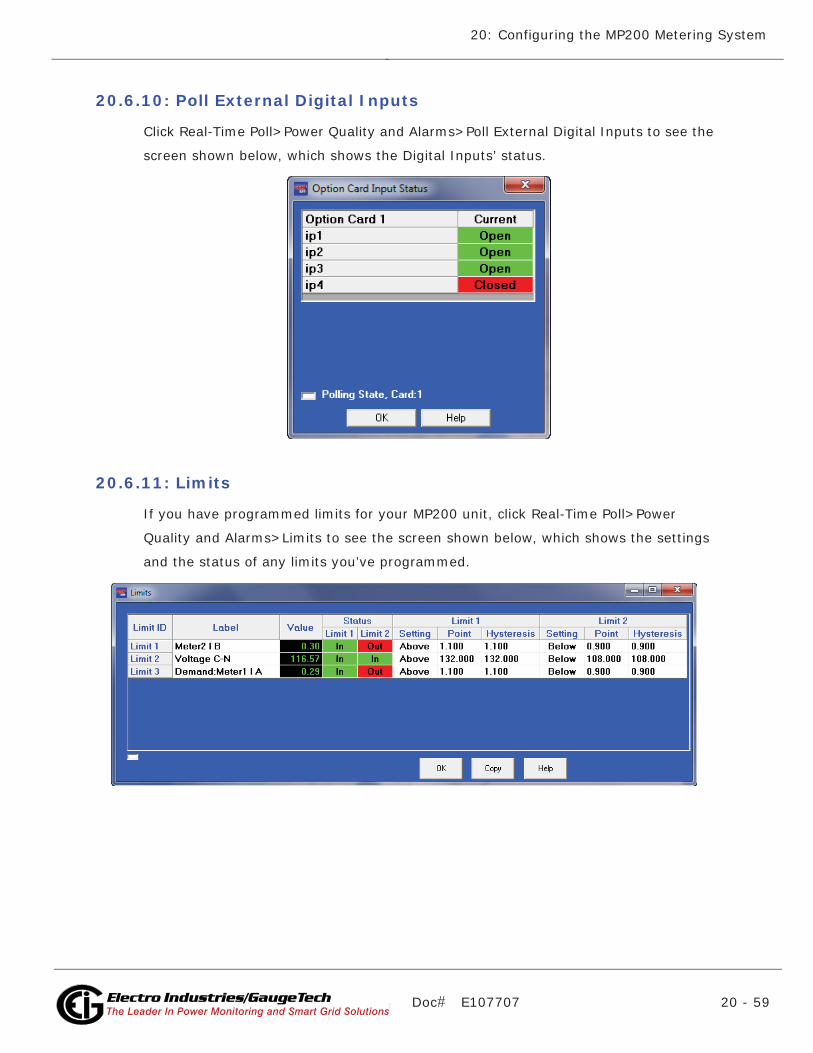
Doc# E107707 20 - 59
20: Configuring the MP200 Metering System
Electro Industries/GaugeTechThe Leader In Power Monitoring and Smart Grid SolutionsElectro Industries/GaugeTechThe Leader In Power Monitoring and Smart Grid Solutions
20.6.10: Poll External Digital Inputs
Click Real-Time Poll>Power Quality and Alarms>Poll External Digital Inputs to see the
screen shown below, which shows the Digital Inputs’ status.
20.6.11: Limits
If you have programmed limits for your MP200 unit, click Real-Time Poll>Power
Quality and Alarms>Limits to see the screen shown below, which shows the settings
and the status of any limits you’ve programmed.

Doc# E107707 20 - 60
20: Configuring the MP200 Metering System
Electro Industries/GaugeTechThe Leader In Power Monitoring and Smart Grid SolutionsElectro Industries/GaugeTechThe Leader In Power Monitoring and Smart Grid Solutions
20.7: MP200 Metering System Logging Screens
If your MP200 unit has V-SwitchTM keys 2 or 3, it has memory for logging - 2 MB for
basic logging with V2 and 32MB of logging with V3. See the MP200 Metering System
Installation and Operation Manual for information on the V-SwitchTM keys and logging.
Follow the instructions in Sections 20.4.7 and 20.4.8 to setup logging for your MP200
unit with V2 or V3. Logging is automatic once it is set up.
20.7.1: MP200 Metering System Logs
If your MP200 unit has memory for logging, it will have two Historical logs and a Sys-
tem Events log. If you have set limits, there will be an Alarms log; there will be an
I/O Change log.
20.7.2: Retrieving and Viewing Logs
To retrieve your MP200 unit’s logs, follow these steps.
1. From the Title Bar, click either Logs>Retrieve Log(s) from Device or the Retrieve
Logs icon.
2. The screen shown on the next page opens. It displays the logs, and their status.
Click the Retrieve checkbox for any log you want to retrieve, which has the status
of “Available.”
NOTE: The screen shown is for an MP200-Y unit; if you are connected to an MP200-
S unit you will see Historical logs 1 and 3.

Doc# E107707 20 - 61
20: Configuring the MP200 Metering System
Electro Industries/GaugeTechThe Leader In Power Monitoring and Smart Grid SolutionsElectro Industries/GaugeTechThe Leader In Power Monitoring and Smart Grid Solutions
NOTE: The System Events log is always retrieved whenever a log is retrieved.
3. After you have selected your logs, click Retrieve. You will see progress messages as
the logs are being retrieved.
When retrieval is done, the Log Viewer screen opens.

Doc# E107707 20 - 62
20: Configuring the MP200 Metering System
Electro Industries/GaugeTechThe Leader In Power Monitoring and Smart Grid SolutionsElectro Industries/GaugeTechThe Leader In Power Monitoring and Smart Grid Solutions
The Log Viewer application lets you easily see the retrieved log data.
NOTE: You can also open the Log Viewer by selecting the Open Log icon from the
Title Bar. Once you select a retrieved log, the Log Viewer will open.
• The icons on the right side of the screen under “View Data” represent the avail-
able logs, e.g., the Historical Trends icon represents the Historical logs.

Doc# E107707 20 - 63
20: Configuring the MP200 Metering System
Electro Industries/GaugeTechThe Leader In Power Monitoring and Smart Grid SolutionsElectro Industries/GaugeTechThe Leader In Power Monitoring and Smart Grid Solutions
• Click the Time Range button to select the starting and ending date and time
range for the log data. You will see the screen shown below.
Click in the fields to choose the time and date range and then click OK.
• The Meter 1 and Meter 2 buttons let you select the downloaded meter logs you
will view. Meter 1 will default as the MP200 unit you just retrieved logs from.
Click the Meter 1 and/or Meter 2 button to select the retrieved log file to use.
Click on the log you want to use to display it in the File Name box and click the
Open button.

Doc# E107707 20 - 64
20: Configuring the MP200 Metering System
Electro Industries/GaugeTechThe Leader In Power Monitoring and Smart Grid SolutionsElectro Industries/GaugeTechThe Leader In Power Monitoring and Smart Grid Solutions
4. Click the Data Points button to select the data you want to see on the trending
chart. See the example screen shown below.
NOTE: The data points shown in the box on the left are the data points from the
two historical logs that your MP200 unit has.
Click on the data points in the box on the left and click Add to move them to the
box on the right. The number of available data points is shown on the top of the
screen - it is updated as you select data points. When you have selected the data
points you want to view on the trending charts, click OK.
5. From the Log Viewer screen, click on one of the Report types. The following sec-
tions show samples of the different screens.
NOTE: See Chapter 8 for additional information on logging and the XY Graph, Cir-
cular Chart, and Advanced Graph screens available for viewing historical log data.

Doc# E107707 20 - 65
20: Configuring the MP200 Metering System
Electro Industries/GaugeTechThe Leader In Power Monitoring and Smart Grid SolutionsElectro Industries/GaugeTechThe Leader In Power Monitoring and Smart Grid Solutions
20.7.3: Log Viewer Screens
When you have made your selections as shown in the previous section, and selected
one of the Log buttons, you will see a message screen as the data points are being
processed. Then you will see the data screen for your log.
• Click the Sort button to open the window shown below, which lets you change the
presentation of the data. Make your selection and press OK.
• Click the Back button to return to the main Log Viewer screen.
• The historical trending screen has graphing options accessible through the Graph
button. For detailed explanations of the graphs, see Chapter 8.
Example log data screens are shown on the next few pages.

Doc# E107707 20 - 66
20: Configuring the MP200 Metering System
Electro Industries/GaugeTechThe Leader In Power Monitoring and Smart Grid SolutionsElectro Industries/GaugeTechThe Leader In Power Monitoring and Smart Grid Solutions
Status Change Log Example
System Events Log Example

Doc# E107707 20 - 67
20: Configuring the MP200 Metering System
Electro Industries/GaugeTechThe Leader In Power Monitoring and Smart Grid SolutionsElectro Industries/GaugeTechThe Leader In Power Monitoring and Smart Grid Solutions
Database Status Example
Limits Log Example

Doc# E107707 20 - 68
20: Configuring the MP200 Metering System
Electro Industries/GaugeTechThe Leader In Power Monitoring and Smart Grid SolutionsElectro Industries/GaugeTechThe Leader In Power Monitoring and Smart Grid Solutions
NOTE: The Historical Trending Log has a graphing option. Click the Graph button to
display a screen that lets you choose data points to display, and the type of graph you
want to see: Circular Graph, XY Graph or Advanced Graph. See Section 8.7 for
detailed information on, and instructions for using, these graphs.
Historical Trending Log Example
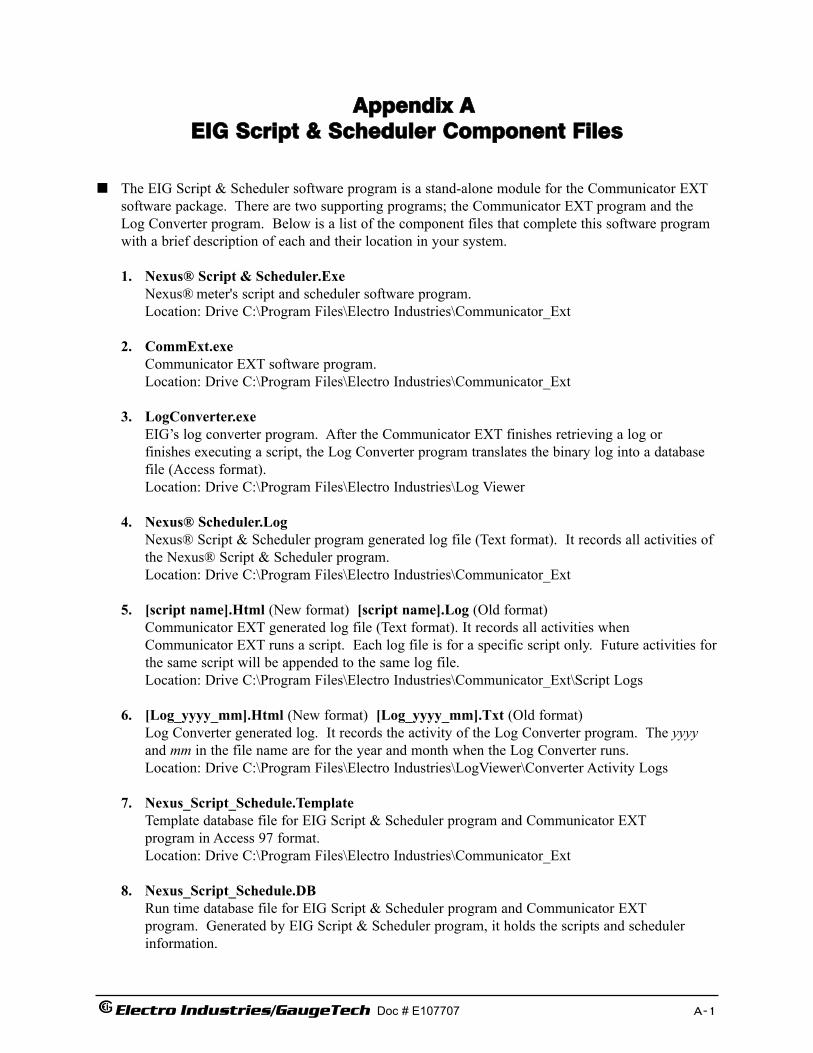
Electro Industries/GaugeTech Doc # E107707 A-1
Appendix A EIG Script & Scheduler Component Files
The EIG Script & Scheduler software program is a stand-alone module for the Communicator EXTsoftware package. There are two supporting programs; the Communicator EXT program and theLog Converter program. Below is a list of the component files that complete this software programwith a brief description of each and their location in your system.
1. Nexus® Script & Scheduler.ExeNexus® meter's script and scheduler software program.Location: Drive C:\Program Files\Electro Industries\Communicator_Ext
2. CommExt.exeCommunicator EXT software program.Location: Drive C:\Program Files\Electro Industries\Communicator_Ext
3. LogConverter.exeEIG’s log converter program. After the Communicator EXT finishes retrieving a log or finishes executing a script, the Log Converter program translates the binary log into a database file (Access format).Location: Drive C:\Program Files\Electro Industries\Log Viewer
4. Nexus® Scheduler.LogNexus® Script & Scheduler program generated log file (Text format). It records all activities of the Nexus® Script & Scheduler program.Location: Drive C:\Program Files\Electro Industries\Communicator_Ext
5. [script name].Html (New format) [script name].Log (Old format)Communicator EXT generated log file (Text format). It records all activities whenCommunicator EXT runs a script. Each log file is for a specific script only. Future activities for
the same script will be appended to the same log file.Location: Drive C:\Program Files\Electro Industries\Communicator_Ext\Script Logs
6. [Log_yyyy_mm].Html (New format) [Log_yyyy_mm].Txt (Old format)Log Converter generated log. It records the activity of the Log Converter program. The yyyyand mm in the file name are for the year and month when the Log Converter runs.Location: Drive C:\Program Files\Electro Industries\LogViewer\Converter Activity Logs
7. Nexus_Script_Schedule.TemplateTemplate database file for EIG Script & Scheduler program and Communicator EXTprogram in Access 97 format.Location: Drive C:\Program Files\Electro Industries\Communicator_Ext
8. Nexus_Script_Schedule.DBRun time database file for EIG Script & Scheduler program and Communicator EXTprogram. Generated by EIG Script & Scheduler program, it holds the scripts and scheduler information.

Electro Industries/GaugeTech Doc # E107707 A-2
Location: Drive C:\Program Files\Electro Industries\Communicator_Ext\Scripts
9. NexusScriptDLFiles.TemplateTemplate database file for Communicator EXT and EIG Script & Scheduler program in Access 97 format.Location: Drive C:\Program Files\Electro Industries\Communicator_Ext
10. NexusScriptDLFiles.DBRun time database for Communicator EXT and EIG Script & Scheduler program. Generated by Communicator EXT program, it holds the retrieved log files’ locations and the addresses for the converted logs. If all processes are done, the EIG Script & Scheduler program will delete this file.Location: Drive C:\Program Files\Electro Industries\Communicator_Ext\Scripts
11. NexusSchedulerLog - Main.HtmlSoftware generated top layer file with frame set linked to Nexus Scheduler Log - Detail.Html and Nexus Scheduler Run-Time Log.Html.
12. NexusSchedulerLog - Detail.HtmlSoftware generated blank frame file.
13. NexusSchedulerRun-TimeLog.HtmlSoftware generated schedule process log with hypertext link to detailed script logs and detailed Log Converter logs.

e Electro Industries/GaugeTech Doc # E107707 B-1
Appendix BTransformer / Line Loss Compensation
B.1: What is System Loss Compensation?
System Loss Compensation is a metering technique that adds or subtracts losses to meter registration. This technique is used because it is often much less expensive and safer to meter thelow voltage side of a Power Transformer than the contractual billing point.
System Loss Compensation also provides a method for moving the billing point from a boundarypoint on a transmission line back to a practical metering point.
System Loss Compensation adjusts for losses between the billing point and the metering point.These losses are lumped into Transmission Line Losses, Power Transformer Losses and SubstationConductor Losses. The EIG Loss Calculator allows for the use of any or all of these elements at ameter installation.
e Electro Industries/GaugeTech Doc # E107707 B-2
B.1.1: EIG Loss Calculator Overview
The EIG Loss Calculator is simple to use and can easily be adapted for your requirements. It comprisesa complete model that handles loss compensation from meter to distribution line, covering PowerTransformer losses, Substation Conductor losses, Transmission Line losses, and optionally, adjust-ments for Transmission Line Charging effects. It produces a printable document of the installation,with technical description that can be used with both customers and reviewing agencies.
To use the calculator, you plug data into Excel Spreadsheet cells, which have been color-coded forease of use. In addition, the calculator contains:
Instructions for its use Technical descriptions of calculations performed Equations expressed in typical metering abbreviations “Mouse over” notes on Key Cells, explaining their function.
The current version of the EIG Loss Calculator contains the following enhancements: Substation Conductor losses Optional adjustment for Transmission Line Charging effects Programmable Meter Nominal Current (see explanation in Section B.2) Enhanced color coding of data and page tabs Improved instructions and technical descriptions.

e Electro Industries/GaugeTech Doc # E107707 B-3
B.2: Loss Model
The model used is a typical Loss Model used in Electricity Metering. The primary source for thismodel is the "Handbook for Electricity Metering". However, if your business uses a different model,the Spreadsheet can be easily modified to use your model.
The elements and assumptions used in the model are described in the following sections.

e Electro Industries/GaugeTech Doc # E107707 B-4
B.3: Loss Triangles and Calculations
The Loss Triangles are developed from the Simplified Transformer High Side Model. Loss valuesnot supplied by the Manufacturer are calculated by solving the Load and No-Load Loss triangles.
No-Load Calculations:
No-Load Watts (NLW) are given by the manufacturer’s data.No-Load VA is defined as:
NLVA = No-Load VA%Ix = % Exciting CurrentNLV = No-Load VARsNLVC = Compensated No-Load VARs
Then, No-Load VARs (NLVC) can be calculated as:
Full Load Calculations:
Full Load Watts (FLW) are given by the manufacturer’s data.Full Load VA is defined as:
FLVA = Full Load VA%Z = % ImpedanceFLV = Full Load VARsNLVC = Compensated No Load VARs
Then, No-Load VARs (NLVC) can be calculated as:
NOTE: All calculations are done on a single element basis averaging the Total number or using theper element number entered in the spreadsheet. It is assumed that Total numbers are the sum of thethree (3) actual element values provided by the Transformer Manufacturer.
% xNLVA I kVAR= •
2 2NLV NLVA NLW= −
%FLVA Z kVAR= •
2 2FLV FLVA FLW= −

e Electro Industries/GaugeTech Doc # E107707 B-5
B.4: System LossesB.4.1: Transmission Line Losses
Transmission Line Losses are made up of series resistance, series capacitance and shunt capacitance.
Total Line Length = 3 x Line Length
Line Current is calculated at rated kVA.Ip = Primary Current
Then,Line Loss Wattswhere R is the resistance in ohms/unit of length
Line Loss VARswhere X is effective series inductive reactance in ohms/unit of length
B.4.2: Substation Conductor Losses
Substation Losses are calculated at secondary current of the Power Transformer Bank at Rated kVA.
Total Conductor Length = 3 x Conductor Length
Rated secondary current
Conductor Loss Wattswhere R is the Resistance in ohms/unit of length
Conductor Loss VARswhere X is effective series inductive reactance in ohms/unit of length
= Apparent Power or Power in Circuit (voltage x current)
3pL N
kVARIV −
=•
2pLLW I R TLL= • •
2pLLW I X TLL= • •
3rL N
kVARIV −
=•
2rCLW I R TLL= • •
2rCLV I X TLL= • •
2rI

e Electro Industries/GaugeTech Doc # E107707 B-6
B.4.3: Total System Losses
Transformer, Transmission Line and Substation Conductor Losses are combined to compute TotalSystem Losses. The EIG Loss Calculator does not require that all pieces of the model be used to calculate System Losses.
Losses are then shifted to the Primary of the Instrument Transformers using the CompensationCalculation Assumptions:
LWFE = Core Loss Watts LVFe = Core Loss VARs LWCu = Copper Loss Watts LVCu= Copper Loss VARs
B.4.4: Meter Loss Coefficients
Losses are scaled by the meter rating to compute Meter Loss Coefficients.
Meter VA Rating where:TA= Test AmpsCTR= CT RatioVTR= VT (PT) RatioVAm = VA (apparent power) in meter
circuit
%LWFE= LWFE/VAm % No-Load Loss Watts%LVFE= LVFE/VAm % No-Load Loss VARs
%LWCu= LWCu/VAm % Full Load Loss Watts%LVCu=LVCu/VAm % Full Load Loss VARs
B.4.5: Dynamic Compensation Calculations
The Nexus® meter dynamically computes system losses instantaneously usng the Meter LossCoefficients and the assumed voltage and current relationships for Watts and VARs.
1. No-Load Loss Watts are proportional to V Squared.2. Load Loss Watts are proportional to I Squared.3. No-Load Loss VARs are proportional to V to the 4th power.4. Load Loss VARs are proportional to I Squared.
Demand, Energy, TOU and Load Profile values are compensated instantaneously.
B.4.6: Transmission Line Charging Current
Capacitive effects are not part of the basic EEI/IMO transmission line loss model but can be signifi-cant when large energy transfers occur. Capacitive Reactance per unit of length is the only additional input required. The unit of measureis megohm-miles or megohm-kilometers.
3VAm Vm TA CTR VTR= • • • •

e Electro Industries/GaugeTech Doc # E107707 B-7
So,
in ohms
then, calculate charging current
in amps
so,
The 3 is included because 3 lines are assumed. NOTE: the sign of Capacitive Losses is negative.
Since both the Inductive and Capacitive Losses are quadrature components they can be added asscalars.
Then,Total kvars Losses = Reactive Losses + Capacitive Losses
NOTE: Adding the Capacitive Losses always reduces total kvar losses because of the negativesign on the capacitive losses.
The EIG Loss Calculator makes these adjustments for Line Charging on the Line Loss Page ofthe Excel Spreadsheet. This adjustment is optional and not typically used in most metering applica-tions. However, Transmission Engineers do use these adjustment on Medium Length Lines (10 to50 miles ) when the meter is upstream of net energy flow.

e Electro Industries/Gauge Tech Doc# E107707 B - 8
B.5: Nexus® Meter Loss Compensation Settings All real and reactive energy measurements in Nexus® meters, unless otherwise labeled, are compensated for losses once Loss Compensation is enabled in the Device Profile. Follow this procedure: 1. From the main Communicator EXT screen, click the Profile icon in the Icon bar to open the
Device Profile menu. 2. From the Device Profile menu, select Revenue and Energy Settings/Transformer and Line
Loss Compensation. When you double-click one of the settings lines, you will see the Transformer and Line Loss Compensation screen, shown below.
NOTES: • The initial Loss Compensation setting for Nexus® meters is Disabled. You must change
this setting to “Fe Only”, “Cu Only” or “Both Fe and Cu” in order to activate Loss Compensation for the meter.
• Transformer, Line, and Substation Loss Setting are part of the meter’s profile that you set up using Communicator EXT software. First, the Loss Coefficients for Watts and VArs are calculated using the EIG Loss Calculator Excel Spreadsheet and then they are entered into the “Percent Loss of Watts” and “Percent Loss of VArs” fields in the Transformer and Line Loss Compensation screen.
• See Section B.5.2, “Four Quadrant Power Flow Conventions,” to see what is meant by (+) and (-) Power Flow in this section.
Loss Compensation is Currently Disabled

e Electro Industries/Gauge Tech Doc# E107707 B - 9
3. Use the Transformer and Line Loss screen to set the following options:
• Enable Loss Compensation: Use the first pull-down menu to select one of the following settings:
Label Action Disabled No loss compensation Fe Only No Load or Core Losses Only Enabled Cu Only Full Load or I2r Losses Only Enabled Both Fe and Cu Both Full and No Load Losses Enabled
• Set the algebraic relationship of Loss Watts and VArs to the metered quantities. This setting is used to adjust for meter location and Tariff Requirements. Use the second pull-down menu to select one of the following settings:
Label Action Add Watts and subtract VArs Transformer Loss Watts added to meter
reading and Transformer VArs subtracted from meter reading.
Subtract Watts and add VArs Transformer Loss Watts subtracted from
meter reading and Transformer VArs added from meter reading.
Add to Watts and VArs Transformer Loss Watts added to meter reading and Transformer VArs added to meter reading. This setting is typical for
meters located on Load Side of Power Transformer when the billing point is on the Supply Side.
Subtract from Watts and VArs Transformer Loss Watts subtracted from
meter reading and Transformer VArs subtracted from meter reading. This setting is typical for meters located on the Supply Side of the Power Transformer when the Billing Point is on the Load Side.

e Electro Industries/Gauge Tech Doc# E107707 B - 10
• Select the Quadrants of Operation for Loss Compensation. This selection is
used to adjust for placement of the meter with respect to the Power Transformer. Use the third pull-down menu to select one of the following settings:
Label Action
Both +Watts and – Watts Losses added to both Delivered and Received Energy
(-) Watts Only Losses added to Received Watts Only
(Quadrants 2 and 3) (+) Watts Only Losses added to Delivered Watts Only
(Quadrants 1 and 4) NOTES:
• How Watts and VArs are handled algebraically is dependant upon your previous selection in the second pull-down menu.
• The determination of what is labeled “Delivered” and what is labeled “Received” is made in the meter’s Device Profile Labels screen. For instructions, refer to the chapter of this manual that explains how to program the Device Profile settings for your meter model.

e Electro Industries/Gauge Tech Doc# E107707 B - 11
B.5.1: Common Compensation Examples: NOTE: For Revenue Metering, how compensation is handled is usually dictated by the Metering Tariff and that should be your primary guide. These examples may or may not agree with your company’s practice and the applicable Tariff at a metering point. They are simply intended to present examples of how Loss Compensation can be used.
Figure B.1 - IMO Loss Diagram

e Electro Industries/Gauge Tech Doc# E107707 B - 12
B.5.1.1: Application Example #1: Substation Instrumentation or SCADA Metering Objective: Monitor Net Energy and VAr flow
In this application, the meter will not see the real (Watts) and reactive energy (VArs) delivered by the Electrical Distribution System used to charge and energize the Power Transformer that it would have seen if it was placed at the metering point so these losses must be added to the meter readings. Assumptions:
1. We want to compensate the meter reading to add both No Load (Fe) and Full Load (Cu) loses from the Power Transformer. From the Transformer and Line Loss Compensation screen’s first pull-down menu, select: Both Fe and Cu
2. We also want to add both estimated Watts and VArs to the meter readings. From the Transformer and Line Loss Compensation screen’s second pull-down menu, select: Add to Watts and VAr
3. With the meter on the low voltage side of the Power Transformer only Delivered Energy needs to be compensated for losses, Received energy is properly metered because the Power Transformer is energized from the Primary side. From the Transformer and Line Loss Compensation screen’s third pull-down menu, select: +Watts

e Electro Industries/Gauge Tech Doc# E107707 B - 13
B.5.1.2: Application Example #2: Generation Instrumentation or SCADA Metering Objective: Monitor Net Energy and VAr flow In this application, the meter will see the real (Watts) and reactive energy (VArs) delivered by the Generator that is used to charge and energize the Power Transformer. However, the billing point is on the Load side of the Power Transformer and the losses should not be added to the meter readings. So to compensate the meter, we must subtract the metered losses.
Assumptions: 1. We want to compensate the meter reading by subtracting both No Load (Fe) and Full
Load (Cu) loses from the Power Transformer. From the Transformer and Line Loss Compensation screen’s first pull-down menu, select: Both Fe and Cu
2. We also want to subtract both estimated Loss Watts and Loss VArs from the meter readings. From the Transformer and Line Loss Compensation screen’s second pull-down menu, select: Subtract from Watts and VArs
3. With the meter on the Generator side of the Power Transformer only Energy flowing to the Transmission Line needs to be compensated for losses because the Power Transformer is energized from the Generator Side. From the Transformer and Line Loss Compensation screen’s third pull-down menu, select: +Watts
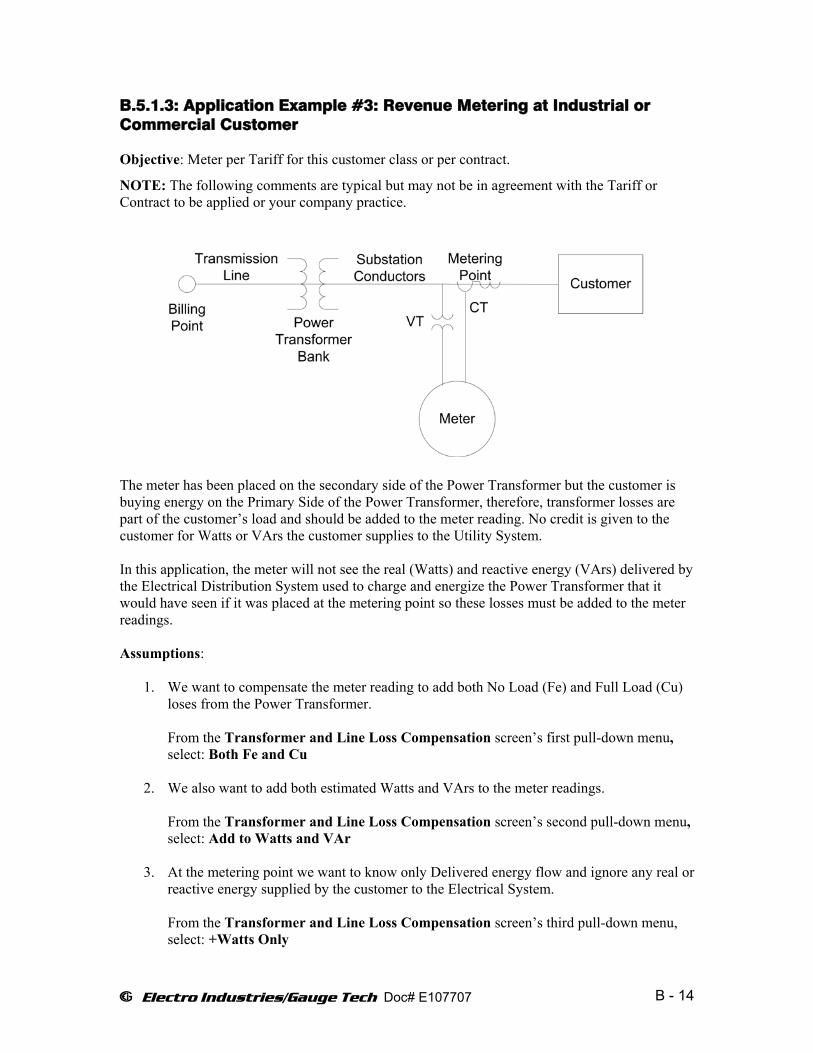
e Electro Industries/Gauge Tech Doc# E107707 B - 14
B.5.1.3: Application Example #3: Revenue Metering at Industrial or Commercial Customer Objective: Meter per Tariff for this customer class or per contract.
NOTE: The following comments are typical but may not be in agreement with the Tariff or Contract to be applied or your company practice.
The meter has been placed on the secondary side of the Power Transformer but the customer is buying energy on the Primary Side of the Power Transformer, therefore, transformer losses are part of the customer’s load and should be added to the meter reading. No credit is given to the customer for Watts or VArs the customer supplies to the Utility System. In this application, the meter will not see the real (Watts) and reactive energy (VArs) delivered by the Electrical Distribution System used to charge and energize the Power Transformer that it would have seen if it was placed at the metering point so these losses must be added to the meter readings. Assumptions:
1. We want to compensate the meter reading to add both No Load (Fe) and Full Load (Cu) loses from the Power Transformer. From the Transformer and Line Loss Compensation screen’s first pull-down menu, select: Both Fe and Cu
2. We also want to add both estimated Watts and VArs to the meter readings. From the Transformer and Line Loss Compensation screen’s second pull-down menu, select: Add to Watts and VAr
3. At the metering point we want to know only Delivered energy flow and ignore any real or reactive energy supplied by the customer to the Electrical System. From the Transformer and Line Loss Compensation screen’s third pull-down menu, select: +Watts Only

e Electro Industries/Gauge Tech Doc# E107707 B - 15
In this example we also need to consider the meter’s displayed quantities. The Nexus® meter is a true Four Quadrant Meter but Tariff Requirements in this case ignore Watts and VARs that the customer sends to Distribution System. NOTE: See Section B.5.2, “Four Quadrant Power Flow Conventions,” for a graphic display of the terms used. For more information on display options see the User Manual for the Nexus® meter model you are using, but all Nexus® meters can display and log Four Quadrant Metering Quantities. In this example the quantities used for Revenue Metering would be: 1. Q1 – Delivered Watts 2. Q1 – Lagging VArs All of the other quantities are still available in the meter but only these will typically be used for billing purposes and displayed for the customer.

e Electro Industries/Gauge Tech Doc# E107707 B - 16
B.5.1.4: Application Example #4: Revenue Metering at Industrial Cogeneration Objectives:
Measure Delivered and Received Watts and all VArs supplied to the customer; no credit is given to the customer for VArs the customer supplies to the Utility System. Meter per Tariff for this customer class or per contract.
NOTE: The following comments are typical but may not be in agreement with the Tariff or Contract to be applied or your company practice.
The meter has been placed on the secondary side of the Power Transformer but the customer is buying energy on the Primary Side of the Power Transformer, therefore, transformer losses are part of the customer’s load and should be added to the meter reading. No credit is given to the customer for VArs the customer supplies to the Utility System, but Watts supplied by the customer are used to offset the energy the customer buys. In this application, the meter will not see the real (Watts) and reactive energy (VArs) delivered by the Electrical Distribution System used to charge and energize the Power Transformer that it would have seen if it was placed at the metering point, so these losses must be added to the meter readings. NOTE: Losses are typically subtracted instead of added when the meter is placed on the Supply side of the Power Transformer instead of the more typical Load side installation. Assumptions:
1. We want to compensate the meter reading to add both No Load (Fe) and Full Load (Cu) loses from the Power Transformer. From the Transformer and Line Loss Compensation screen’s first pull-down menu, select: Both Fe and Cu

e Electro Industries/Gauge Tech Doc# E107707 B - 17
2. We also want to add both estimated Watts and VArs to the meters readings From the Transformer and Line Loss Compensation screen’s second pull-down menu, select: Add to Watts and VAr
3. At the metering point we want to know only Delivered energy flow and ignore any real or
reactive energy supplied by the customer to the Electrical System. From the Transformer and Line Loss Compensation screen’s third pull-down menu, select: Both +Watts and – Watts
To obtain the Tariff Quantities we need to look at 4 Quadrant Data. The following metered values would typically be used:
1. Q1 + Q4 - Delivered Watts/Watthours – this is energy delivered to the load. 2. Q2 + Q3 - Received Watts/Watthours – this is energy received from the load. 3. Q1 + Q2 - Lagging VArs – these are typically referred to as Supplied or Delivered VARs
- An alterative would be to measure QHours if that is part of the Tariff. NOTE: QHours are not typically used with Electronic Meters.
NOTE: Typically, VArs would not be used for billing except if a Power Factor Penalty condition exists. To determine if PF is outside of Tariff Requirements, we would typically set the Power Factor Limit as a Device Profile Limit in Communicator EXT and Log Power Factor. This would provide documentation of when and how badly the Metered Load dropped below the required minimum Power Factor.
B.5.1.5: Loss Calculation References For more information, consult the following documents: MDP_STD_005 - IMO Site Specific Loss Adjustments EEI Handbook for Electricity Metering MDP_PRO_0011 IMO Market Manual 3: Metering, Part 3.5 Site Specific Loss Adjustments

e Electro Industries/Gauge Tech Doc# E107707 B - 18
B.5.2: Four Quadrant Power Flow Conventions
NOTE: The Terms “Export/Import” and “Delivered/Received” are equivalent and use the Utility Power Grid as their reference. So, “Delivered or Export” refers to Energy Flow from the Power Grid to the Load The Delivered and Received conventions shown are the default setting for Nexus® meters. However, these setting can be changed in the meter’s Device Profile Labels screen. For instructions, refer to the chapter of this manual that explains how to program the Device Profile settings for your meter model. B.6: EIG Loss Compensation Calculator Instructions and Examples If you have MS Excel installed on your computer, click the TLC Calculator button on the
Transformer and Line Loss Compensation screen (see Section B.5).
The following pages contain Loss Compensation Calculator instructions and several copies of the MS Excel Spreadsheet with example numbers to assist you.

e Electro Industries/GaugeTech Doc # E107707 B-19
B.6.1: EIG Loss Compensation Calculator Instructions
For 3 stator meters with 3 PTs and 3 CTs.
This model has been tested by Electro Industries/GaugeTech and has been demonstrated toprovide answers consistent with the Loss Model pr esented in the EEI Handbook for ElectricityMetering, 10th Edition. However, Electro Industries/GaugeTech assumes no liability associated with its use.
Information in Red Text is for Advanced Users who need to modify the model to meet theirbusiness requirements.
NOTE: Actual and PDF versions of Loss Compensation Calculator pages are in COLOR.
Before You BeginNOTE: When you open the spreadsheet, you will see an Excel Security warning. This warningis a standard Excel feature to notify you that the spreadsheet contains Macros. Macros are used inthis spreadsheet to facilitate the clearing of data from it. Select “Enable Macros.” With Macros enabled, data can be cleared from all of the sheet’s cells (Clear Entry Cells All) orfrom one sheet’s cells (Clear Entry Cells).using the buttons at the top of the spreadsheet.
Start1. Begin data entry on Transformer Loss Calculation Sheet (Xmfr Loss).
NOTE: Make sure that unwanted data is not left in the spr eadhseet from a previous use.
2. Data is entered in Yellow cells only:. do not change data in other cells. You can use the exampleslater on in this chapter to verify proper operation of the model.
Transformer Loss Calculation3. Enter Transformer Manufacturer Supplied or Measured Data for Transformer Bank.
Typical values are often used.
The model assumes there are three power transformers. Transformer data may be entered as Total or per element values. Total values are the sum of the values for all three transformers. Calculations are made on a per element basis using either Total values divided by 3 or per elect
values.
4. Enter configuration of transformer secondary - Wye or Delta.
Value CommentNo Load Loss Watts Core or Iron LossesLoad Loss Watts Copper or I squared r Losses% Exciting Current% ImpedenceTransformer kVA Rating Rating of whole bank in kVARated Primary L_L Volts Primary Line to Line Voltage RatingV Secondary Side of Xmfr Line-Line Secondary Line-Line Voltage

e Electro Industries/GaugeTech Doc # E107707 B-20
5. Enter Instrument Transformer Information
Example Data:
Enter primary and secondary values for voltage and current ITs. The model calculates CTR, VTR,and TF. The Model assumes 3 CTs and 3 VTs (PTs) are used.
6. The meter rating should not be changed unless you are using a special version of the meter and theInstruction Book instructs you to change these values.
7. Select Nominal Metered Current (the red box). The EEI/IMO Model uses TA for NominalCurrent. You can find the TA on the meter nameplate; the TA for Nexus® meters is 2.5A. 2.5 is the value most typically entered into this box on the spreadsheet. However, many ElectricCompanies use 1/2 of Class Current (10A) or Class Current for Nominal Current. This is a carry-over from Rates written before Class 20 meters became the standard class for Transformer RatedMeter, and has been carried forward as part of the Rate Structure. The selection of NominalMetered Current is very important because all losses will be scaled against this nominal value. Leave 2.5 as the Nominal Current unless your company practice differs.If you are not using Transmission Line or Substation Conductor Losses, the values shown inRed on the Total Losses Sheet should be entered into the Communicator EXT Software whenprogramming the EIG meter.
Note: If you see values for Transmission Line or Substation Conductor Losses, go to those sheetsand clear data from yellow cells.
If you are using Transmission Line or Substation Conductor Losses, continue with instructions.
Transmission Line Losses
8. Entry of transmission Line Data is optional. If the data entries are left at zero then no addition lossesare added to the Total Losses.
This is easily verified by checking the loss summary on the System Losses Sheet.The Total System Losses will show zero contribution from Line and Substation Losses.
9. Enter per unit ohmic values, resistance per unit and conductive reactance per unit.
10. Enter the length of a single conductor. The model assumes 3 conductors and calculates TotalConductor Length.
11. Enter the per unit label. Typically Miles (Mile) or Kilometers (KM).This value does not affect the model calculations but is carried for clarity.
12. Line Losses will now be reflected in Total System Losses.If you are not using Substation Conductor Losses, the values now shown in Red on the TotalLosses Sheet should be entered into the Communicator EXT Software when programming theEIG meter.
Primary SecondaryVoltage Xmfr 7200 120Current Xmfr 500 5
Instrument Transformers

e Electro Industries/GaugeTech Doc # E107707 B-21
Note: If you see values for Substation Conductor Losses go to that sheet; clear data from yellowcells.
If you are using Substation Conductor Losses, continue with instructions.
Substation Conductor Losses
13. Entry of Substation Conductor Data is optional. If the data entries are left at zero, then no additional losses are added to the Total Losses.
This is easily verified by checking the loss summary on the System Losses Sheet.The Total System Losses will show zero contribution from Substation Losses.
14. Enter per unit ohmic values, resistance per unit and conductive reactance per unit.
15. Enter the length of a single conductor. The model assumes 3 conductors and calculates Total Conductor Length.
16. Enter the per unit label. Typically Feet (FT) or Meters (M).This value does not affect the model calculations but is carried for clarity.
17. Substation Conductor Losses will now be reflected in Total System Losses.
The values now shown in Red on the Total Losses Sheet should be entered into theCommunicator EXT Software when programming the EIG meter.
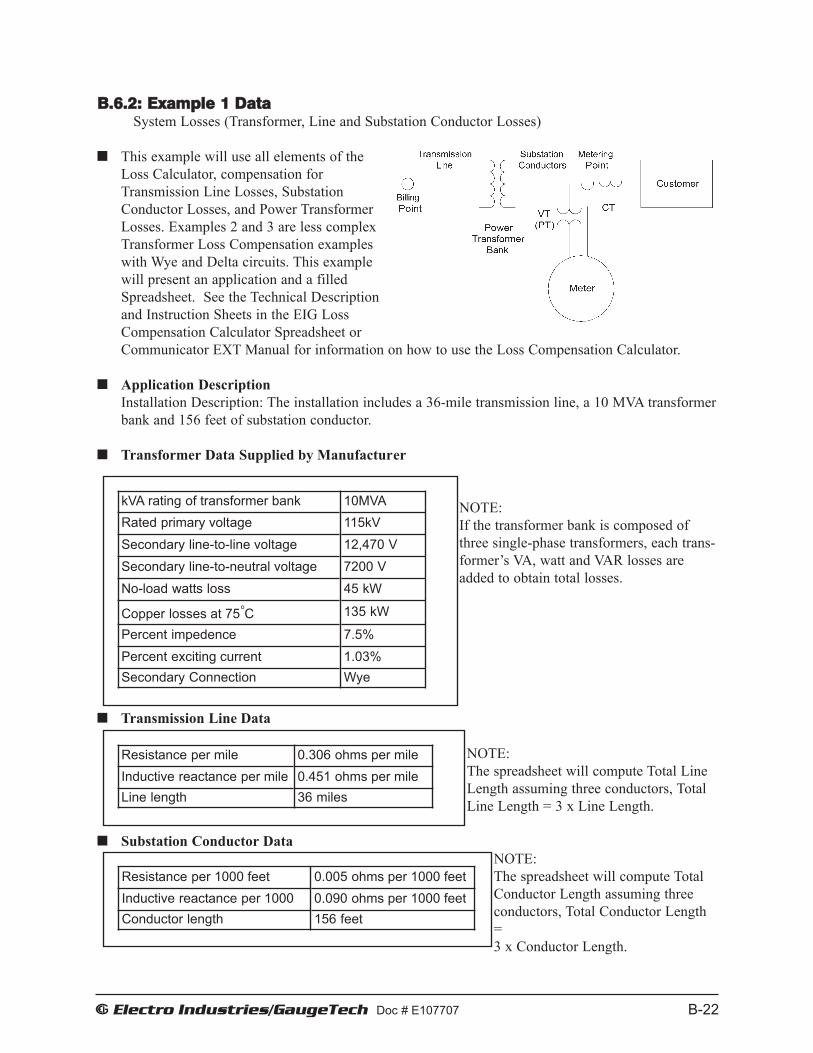
e Electro Industries/GaugeTech Doc # E107707 B-22
B.6.2: Example 1 DataSystem Losses (Transformer, Line and Substation Conductor Losses)
This example will use all elements of theLoss Calculator, compensation forTransmission Line Losses, Substation Conductor Losses, and Power TransformerLosses. Examples 2 and 3 are less complexTransformer Loss Compensation examples with Wye and Delta circuits. This examplewill present an application and a filledSpreadsheet. See the Technical Descriptionand Instruction Sheets in the EIG LossCompensation Calculator Spreadsheet orCommunicator EXT Manual for information on how to use the Loss Compensation Calculator.
Application DescriptionInstallation Description: The installation includes a 36-mile transmission line, a 10 MVA transformerbank and 156 feet of substation conductor.
Transformer Data Supplied by Manufacturer
NOTE:If the transformer bank is composed ofthree single-phase transformers, each trans-former’s VA, watt and VAR losses areadded to obtain total losses.
Transmission Line Data
NOTE:The spreadsheet will compute Total LineLength assuming three conductors, TotalLine Length = 3 x Line Length.
Substation Conductor DataNOTE:The spreadsheet will compute TotalConductor Length assuming three conductors, Total Conductor Length= 3 x Conductor Length.
kVA rating of transformer bank 10MVARated primary voltage 115kVSecondary line-to-line voltage 12,470 VSecondary line-to-neutral voltage 7200 VNo-load watts loss 45 kW
Copper losses at 75oC 135 kW
Percent impedence 7.5%Percent exciting current 1.03%Secondary Connection Wye
Resistance per mile 0.306 ohms per mileInductive reactance per mile 0.451 ohms per mileLine length 36 miles
Resistance per 1000 feet 0.005 ohms per 1000 feetInductive reactance per 1000 0.090 ohms per 1000 feetConductor length 156 feet

e Electro Industries/GaugeTech Doc # E107707 B-23
Metering Data
The model assumes a three-phase, 4-wire meter installation with 3 Voltage Transformers and 3Current Transformers. This is not a limitation because all EIG Transformer Rated Meters are 3 stator4-wire meters. The model should not be used with other meter types.
Voltage Transformer Ratio, VTR 7200/120 = 60/1
Current Transformer Ratio, CTR 500/5 = 100/1
Meter Voltage Rating, Vm 120V
Meter Test Amps, TA, Inom 2.5A

e Electro Industries/GaugeTech Doc # E107707 B-24
B.6.2.1: Example 1 Spreadsheet - System LossesCopy of the System Losses Summary for Example 1 with Example Numbers
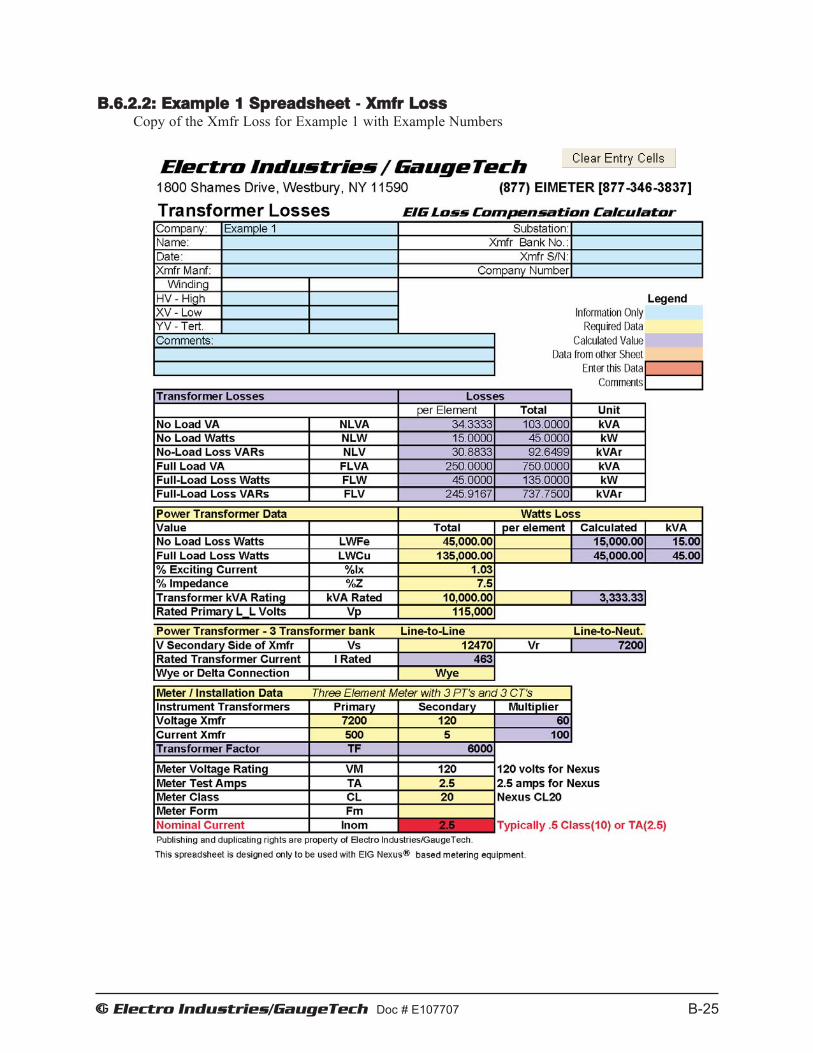
e Electro Industries/GaugeTech Doc # E107707 B-25
B.6.2.2: Example 1 Spreadsheet - Xmfr LossCopy of the Xmfr Loss for Example 1 with Example Numbers

e Electro Industries/GaugeTech Doc # E107707 B-26
B.6.2.3: Example 1 Spreadsheet - Line LossCopy of the Line Loss for Example 1 with Example Numbers

e Electro Industries/GaugeTech Doc # E107707 B-27
B.6.2.4: Example 1 Spreadsheet - Substation LossesCopy of the Substation Losses for Example 1 with Example Numbers

e Electro Industries/GaugeTech Doc # E107707 B-28
B.6.3: Example 2 - Transformer Losses DataTransformer Losses - Delta Connected - for Example 2 with Example Numbers
This example will present an application and a filled Spreadsheet.
See the Technical Description andInstruction Sheets in the EIG LossCompensation Calculator Spreadsheet or the Communicator EXT SoftwareManual for information on how to use the Loss Compensation Calculator.
Application Description
Installation Description: The installation includes three 115 kV, 3.333 MVA single phase powertransformers with a Delta connected secondary.
Transformer Data Supplied by Manufacturer
NOTE:If the transformer bank is composed of threesingle-phase transformers, each transformer'sVA, watt, and VAR losses are added to obtaintotal losses.
Metering Data
The model assumes a three-phase, 4-wire meter installation with 3 Voltage Transformers and 3Current Transformers. This is not a limitation because all EIG Transformer Rated Meters are 3 stator4-wire meters. The model should not be used with other meter types.
kVA rating of transformer bank 9999 kVARated primary voltage 115 kVSecondary line-to-line voltage 2520 V
No-load watts loss 28680 W
Copper Losses at 75oC 56027 W
Percent Impedence 8.1%Percent exciting current 0.183%Secondary Connection Delta
Current Transformer Ratio, CTR 3000/5 = 600/1Voltage Transformer Ratio, VTR 2400/120 = 20/1Meter voltage rating, Vm 120 VMeter test amps, TA, Inom 2.5 A

e Electro Industries/GaugeTech Doc # E107707 B-29
B.6.3.1: Example 2 Spreadsheet - System Transformer Losses Transformer Losses - Delta Connected - for Example 2 with Example Numbers

e Electro Industries/GaugeTech Doc # E107707 B-30
B.6.3.2: Example 2 Spreadsheet - Xmfr LossCopy of the Xmfr Loss for Example 2 with Example Numbers

e Electro Industries/GaugeTech Doc # E107707 B-31
B.6.3.3: Example 2 Spreadsheet - Line LossCopy of the Line Loss for Example 2 with Example Numbers
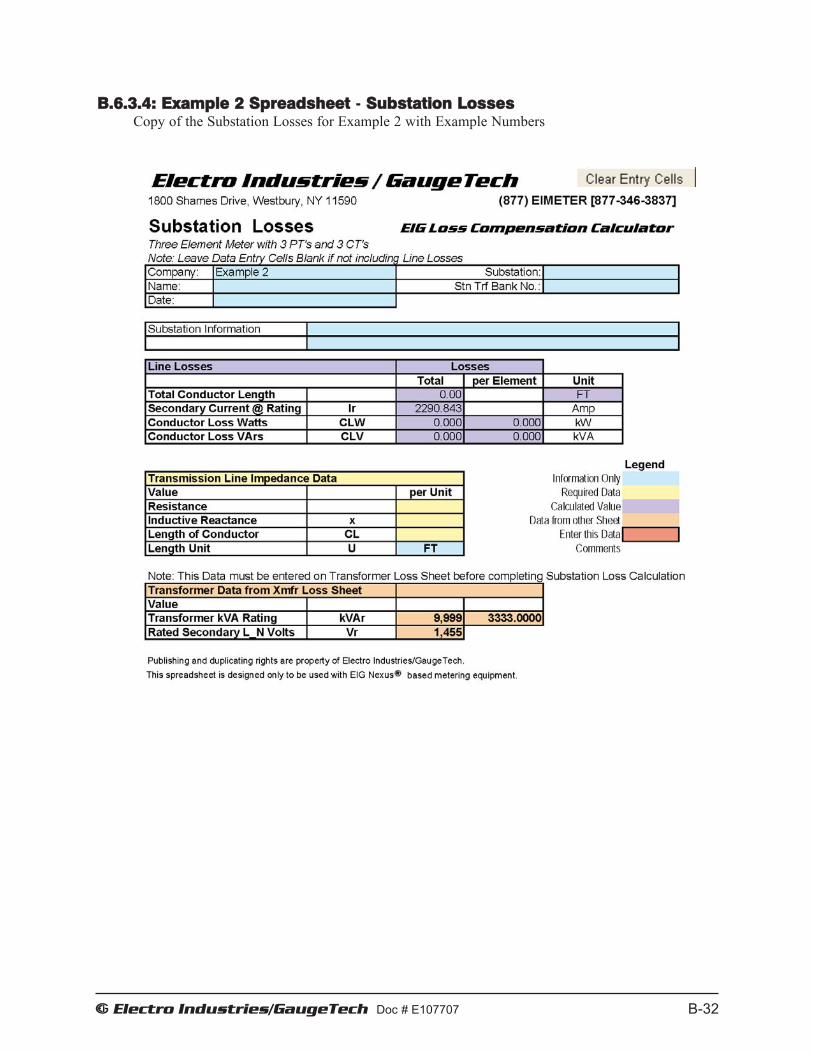
e Electro Industries/GaugeTech Doc # E107707 B-32
B.6.3.4: Example 2 Spreadsheet - Substation LossesCopy of the Substation Losses for Example 2 with Example Numbers

e Electro Industries/GaugeTech Doc # E107707 B-33
B.6.4: Example 3 - Transformer Losses DataTransformer Losses - Wye Connected - for Example 3 with Example Numbers
This example presents an application and a filled Spreadsheet.
See the Technical Description and InstructionSheets in the EIG Loss Compensation CalculatorSpreadsheet or the Communicator EXT SoftwareManual for information on how to use the Loss Compensation Calculator.
Application Description
Installation Description: The installation includes a 138 kV,16.8 MVA transformer bank with a Wyeconnected secondary.
Transformer Data Supplied by Manufacturer
Metering Data
The model assumes a three-phase, 4-wire meter installation with 3 Voltage Transformers and 3Current Transformers. This is not a limitation because all EIG Transformer Rated Meters are 3 stator4-wire meters. The model should not be used with other meter types.
kVA rating of transformer bank 16800 kVARated primary voltage 138 kVSecondary line-to-line voltage 13090 VSecondary line-to-neutral voltage 7558 VNo-load watts loss 15400 W
Copper Losses at 75oC 69200 W
Percent impedence 9.78%Percent exciting current 0.133%Secondary Connection Wye
Current Transformer Ratio, CTR 1500/5 = 300/1Voltage Transformer Ratio, VTR 7200/120 = 60/1Meter Voltage Rating, Vm 120 VMeter Test Amps, TA, Inom 5 A
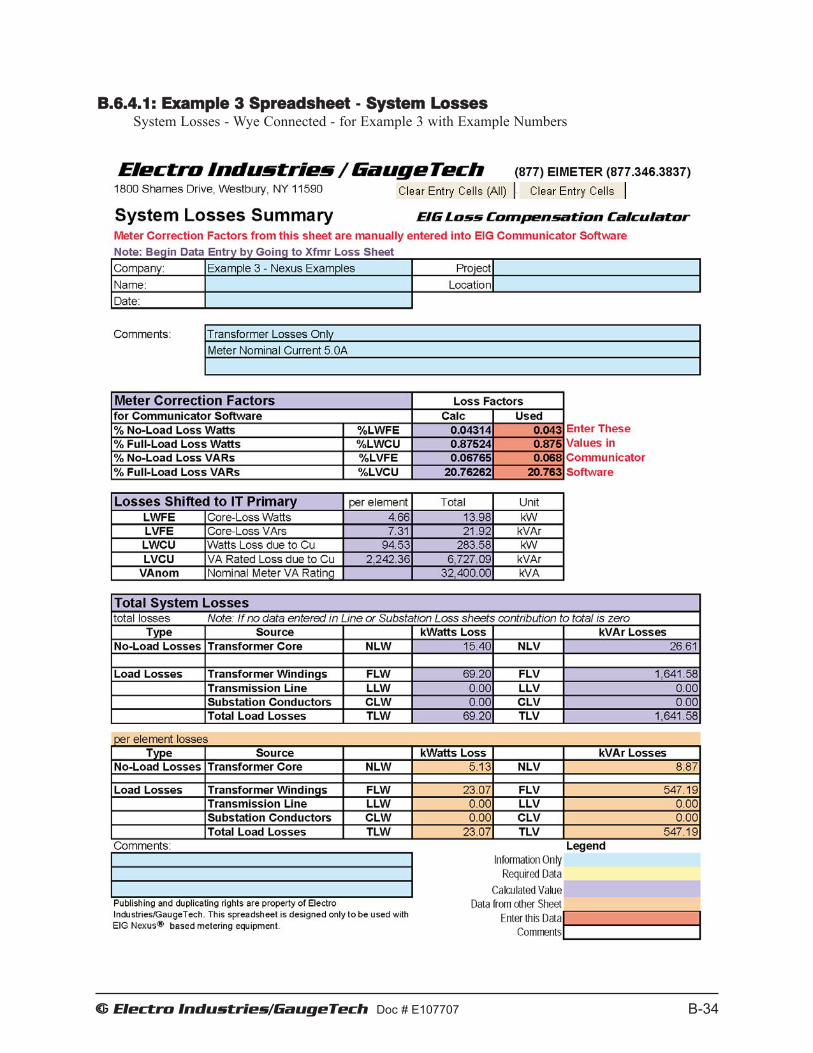
e Electro Industries/GaugeTech Doc # E107707 B-34
B.6.4.1: Example 3 Spreadsheet - System LossesSystem Losses - Wye Connected - for Example 3 with Example Numbers
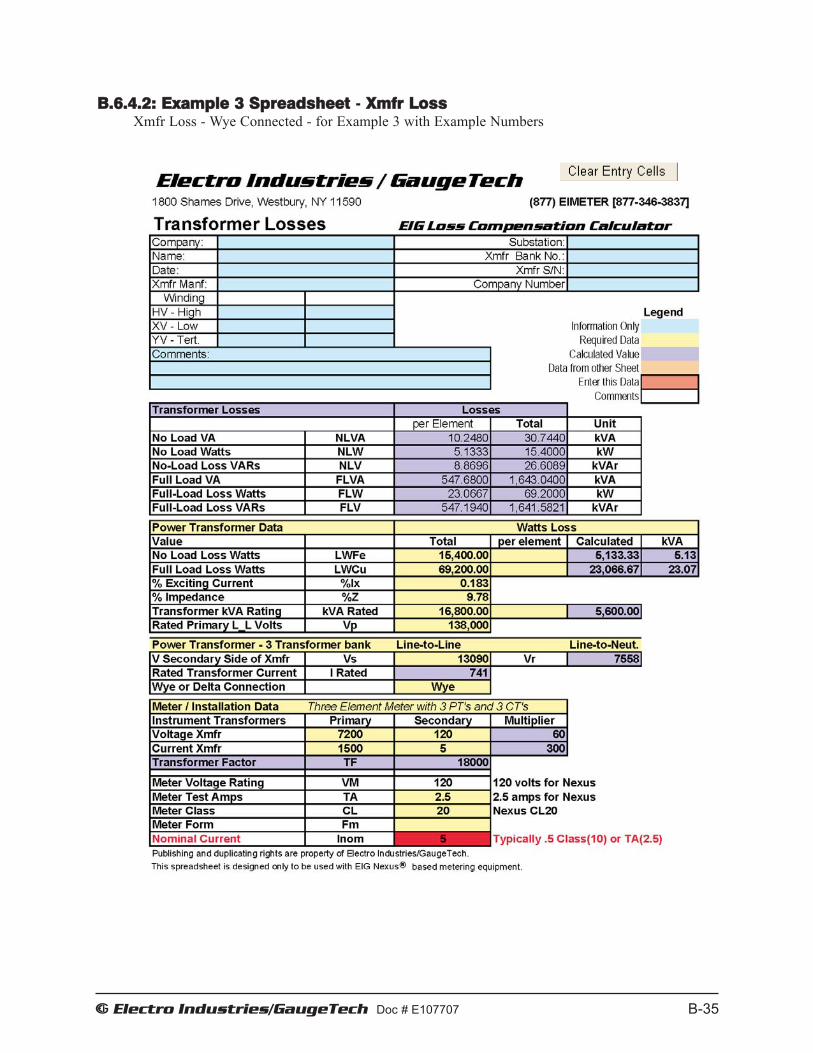
e Electro Industries/GaugeTech Doc # E107707 B-35
B.6.4.2: Example 3 Spreadsheet - Xmfr LossXmfr Loss - Wye Connected - for Example 3 with Example Numbers

e Electro Industries/GaugeTech Doc # E107707 B-36
B.6.4.3: Example 3 Spreadsheet - Line LossLine Loss - Wye Connected - for Example 3 with Example Numbers

e Electro Industries/GaugeTech Doc # E107707 B-37
B.6.4.4: Example 3 Spreadsheet - Substation LossesSubstation Losses - Wye Connected - for Example 3 with Example Numbers

e Electro Industries/GaugeTech Doc # E107707 B-38
This page intentionally left blank.

E Electro Industries/Gauge Tech Doc # E107707 C-1
Appendix C Communicator EXT Command Line Arguments
Version 1.14 Current 1-10-2007 C.1: Script Command Line Methods Tells Communicator EXT to perform a task corresponding to the Script ID Number. /snnnn Script ID Number
• Example: CommExt /s1234 (/s Script ID Number) uc: Start Log Converter 0 Do not start log converter 1 Start log converter If left out of command line, Start Log Converter is assumed.
• Example: CommExt with Script 1234 will Start Log Converter if Log Retrieval is in the script.
CommExt /s1234 uc:1 C.2: Application Command Line Methods Tells Communicator EXT to make a connection and display a particular application screen. /c (additional arguments with a space between each argument)
• Example 1: Nexus® device with address 2 on network with IP address 135.15.173.79 using Modbus TCP Start on device status screen. CommExt /c cm:1 ad:2 pr:3 ip:135.15.173.12 np:502
• Example 2: Nexus® device with address 2 at remote location with Phone Number 555-545-5110 using Modbus ASCII Start on device status screen.
CommExt /c cm:0 ad:2 pr:1 cp:3 BR:3 um:1 pn:555-545-5110 cm: Connect Mode
0 Serial Port 1 Network If left out of command line, Serial Port is assumed.

E Electro Industries/Gauge Tech Doc # E107707 C-2
ec: Echo Mode 0 Off 1 On (When the Shark® meter's Fiber Optic Option Card’s switch is set to Echo On) If left out of command line, defaults to 0. Used when selected connection mode is Serial Port, with a Fiber Optic Option Card in a Shark meter.
ad: Address 1 - 247 If left out of command line, Address 1 is assumed. nm: Network Mode
0 One IP Address for n Devices If left out of command line, 0 is assumed.
pr: Protocol 0 Modbus RTU
1 Modbus ASCII 2 DNP 3.0 (Not Supported)
3 Modbus TCP 4 EI Protocol If left out of command line, Modbus RTU is assumed. ip: IP Address or Host Name xxx.xxx.xxx.xxx or 1 - 16 Alphanumeric characters with no spaces. If left out of command line, error is assumed. np: Network Port 502 Open Modbus (Modbus TCP) If left out of command line, Port 502 is assumed. cp: Com Port
1 - 98 If left out of command line, Com Port 1 is assumed.
br: Baud Rate 0 1200 1 2400 2 4800 3 9600 4 19200 5 38400 6 57600 7 115200 If left out of command line, Baud Rate of 9600 is assumed. um: Use Modem 0 No 1 Yes If left out, No modem is selected.

E Electro Industries/Gauge Tech Doc # E107707 C-3
pn: Phone Number Use No Spaces. User-defined Phone Number of the Remote Modem. ms: Modem Setup String User-defined Setup String (if the originate modem has been used for another program and needs to be reset). dc: Data Switch Connect String for Modem User-defined Data Switch String to connect to Remote Modem. Check with the device’s manual to create the Data Switch String appropriate for the device. Typical characters used with Communicator EXT software are: , (pause one second) %%% (escape sequence or switch to command mode) PTnn (command) (number 01-16) Enter (<CR> ASCII character 13) dd: Data Switch Disconnect String for Modem User-defined.
ss: Start screen 0 Device Status 1 Phasors Diagram (Nexus® meters Only) 2 Instantaneous Polling 3 Poll All (Nexus® meters Only) 4 Poll Max/Min 5 Poll Power Readings (Use 19 to 22 for Nexus® meters) 6 Poll Harmonics 7 Poll Internal Inputs 8 Poll Multiple Devices (Nexus® meters Only) 9 Poll Pulse Accumulations (Nexus® meters Only) 10 Poll Limit Status 11 Poll Time of Use Readings (Nexus® meters Only) 12 Poll Nexus® External Digital Inputs (Nexus® meters Only) 13 Poll Nexus® External Analog Inputs (Nexus® meters Only) 14 Poll Nexus® ElectroLogic Status (Nexus® meters Only) 15 Poll Relay Control 16 Poll Readings with DDE Service (Nexus® meters Only) 17 Poll Log Statistics 18 Log Retrieval Screen 19 Poll Power and Demand (Nexus® meters Only) 20 Poll Energy (Nexus® meters Only) 21 Poll Power Only (Communicator EXT Only, Nexus® meters Only)
22 Poll Demand Only (Communicator EXT Only, Nexus® meters Only)
23 Poll Nexus® meter Time 24 Poll Shark® meter Volts and Current (Shark® 100 meter) 25 Poll Shark® meter Power and Energy (Shark® 100 meter)
26 Poll Shark® meter Phasor Diagram (Shark® 100 meter) 30 Device Status (Shark® 200 meter) 31 Phasor Diagram (Shark® 200 meter) 32 Instantaneous Polling (Shark® 200 meter)

E Electro Industries/Gauge Tech Doc # E107707 C-4
33 Poll Max/Min (Shark® 200 meter) 34 Poll Power and Energy (Shark® 200 meter) 35 THD/Harmonics (Shark® 200 meter) 36 Average Demand (Shark® 200 meter) 37 Option Card Accumulators (Shark® 200 meter) 39 Option Card Digital Input Status (Shark® 200 meter) 40 Limits Status Screen (Shark® 200 meter) 41 Symmetrical Components (Shark® 200 meter) 42 Real Time Trends (Shark® 200 meter) 43 Shark Time (Shark® 200 meter) 44 Relay Control (Shark® 200 meter) 45 Option Card Status (Shark® 200 meter) 46 Device Information (Shark® 200 meter) 47 Device Profile (Shark® 200 meter) 48 Log Status/Retrieval (Shark 200)
NOTES: • If the number is undefined, i.e. less than 0 or greater than 48, Communicator EXT will automatically shut down. • If left out of command line, Start screen is Device Status.
dn: Device Name Must use period as placeholder for a space. ln: Location Name Must use period as placeholder for a space. vm: View Mode 0 Normal 1 Hide Main Window and Exit Program upon closing of Start Screen. Communicator EXT acts as a plug-in for integrating with third party software. If left out, Normal is the View Mode. am: Answer Modem 0 No 1 Open Port. Wait for Modem to ring and attempt to answer Modem if ringing. If left out, software does not answer Modem. dr: Dial Out Receive Call 0 No 1 After software successfully answers the call, it looks for a reason of call code. Based on the code, Software performs automated functions. Upon completion of all functions, software places the Remote Modem into command mode, sends an acknowledgment and hangs up. Software closes the Communications Port and exits software. mp: Modem Password Must use period as placeholder for a space.
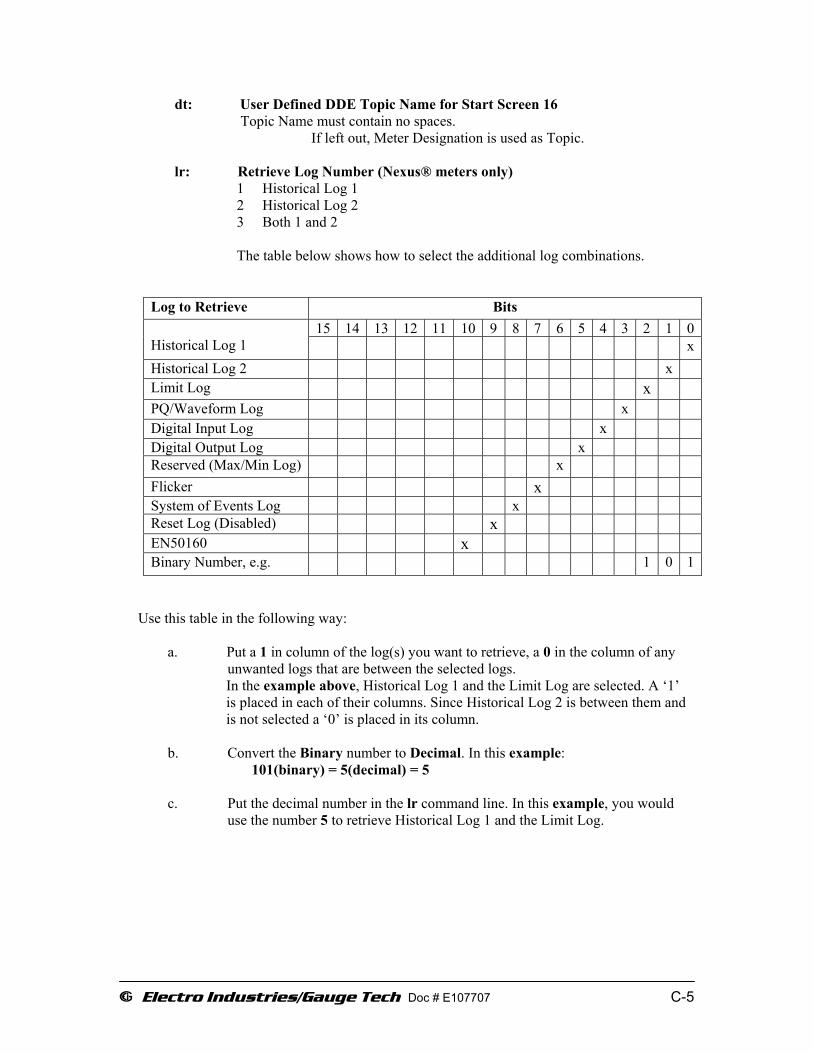
E Electro Industries/Gauge Tech Doc # E107707 C-5
dt: User Defined DDE Topic Name for Start Screen 16 Topic Name must contain no spaces. If left out, Meter Designation is used as Topic. lr: Retrieve Log Number (Nexus® meters only) 1 Historical Log 1 2 Historical Log 2 3 Both 1 and 2 The table below shows how to select the additional log combinations.
Log to Retrieve Bits 15 14 13 12 11 10 9 8 7 6 5 4 3 2 1 0
Historical Log 1 xHistorical Log 2 x Limit Log x PQ/Waveform Log x Digital Input Log x Digital Output Log x Reserved (Max/Min Log) x Flicker x System of Events Log x Reset Log (Disabled) x EN50160 x Binary Number, e.g. 1 0 1
Use this table in the following way:
a. Put a 1 in column of the log(s) you want to retrieve, a 0 in the column of any unwanted logs that are between the selected logs.
In the example above, Historical Log 1 and the Limit Log are selected. A ‘1’ is placed in each of their columns. Since Historical Log 2 is between them and is not selected a ‘0’ is placed in its column. b. Convert the Binary number to Decimal. In this example: 101(binary) = 5(decimal) = 5 c. Put the decimal number in the lr command line. In this example, you would
use the number 5 to retrieve Historical Log 1 and the Limit Log.

E Electro Industries/GaugeTech Doc#E107707 C-6
This page intentionally left blank.

Electro Industries/GaugeTech Doc # E107707 D-1
Appendix DDNP Custom Class Map Readings
D.1: Available DNP Class Map Readings for the Nexus® 1250 meter:
1 Second ReadingsThermal ReadingsAccumulationsMaximum ReadingsMinimum ReadingsBlock Window AverageRolling Window AverageTHD and K-FactorPhase Angles and Voltage Sequence0.1 Second ReadingsHarmonic MagnitudesHarmonic PhasesExternal Analog InputsTime of UseBinary StatesAction BlockTime StampsEnergy and Pulses in the IntervalFlickerMiscellaneous

E Electro Industries/GaugeTech Doc#E107707 D-Nexus 1500 Meter Network Card Featu2
This page intentionally left blank.

Doc# E107707 E - 1
E: Ethernet Network Error Codes
Electro Industries/GaugeTechThe Leader In Power Monitoring and Smart Grid SolutionsElectro Industries/GaugeTechThe Leader In Power Monitoring and Smart Grid Solutions
E: Ethernet Network Error Codes
E.1: Network Error Codes Reported by Any Software That Uses Ethernet (Including Communicator EXTTM Software)
Error# 10004: "Interrupted system call."
Error# 10009: "Bad file number."
Error# 10013: "Permission Denied."
Error# 10014: "Bad Address."
Error# 10022: "Invalid Argument."
Error# 10024: "Too many open files."
Error# 10035: "Operation would block."
Error# 10036: "Operation now in progress."
Error# 10037: "Operation already in progress."
Error# 10038: "Socket operation on nonsocket."
Error# 10039: "Destination address required."
Error# 10040: "Message too long."
Error# 10041: "Protocol wrong type for socket."
Error# 10042: "Protocol not available."
Error# 10043: "Protocol not supported."
Error# 10044: "Socket type not supported."
Error# 10045: "Operation not supported on socket."
Error# 10046: "Protocol family not supported."
Error# 10047: "Address family not supported by protocol family."
Error# 10048: "Address already in use."
Error# 10049: "Can't assign requested address."

Doc# E107707 E - 2
E: Ethernet Network Error Codes
Electro Industries/GaugeTechThe Leader In Power Monitoring and Smart Grid SolutionsElectro Industries/GaugeTechThe Leader In Power Monitoring and Smart Grid Solutions
Error# 10050: "Network is down."
Error# 10051: "Network is unreachable."
Error# 10052: "Network dropped connection."
Error# 10053: "Software caused connection abort."
Error# 10054: "Connection reset by peer."
Error# 10055: "No buffer space available."
Error# 10056: "Socket is already connected."
Error# 10057: "Socket is not connected."
Error# 10058: "Can't send after socket shutdown."
Error# 10059: "Too many references: can't splice."
Error# 10060: "Connection timed out."
Error# 10061: "Connection refused."
Error# 10062: "Too many levels of symbolic links."
Error# 10063: "File name too long."
Error# 10064: "Host is down."
Error# 10065: "No route to host."
Error# 10066: "Directory not empty."
Error# 10067: "Too many processes."
Error# 10068: "Too many users."
Error# 10069: "Disk quota exceeded."
Error# 10070: "Stale NFS file handle."
Error# 10071: "Too many levels of remote in path."
Error# 10091: "Network subsystem is unusable."

Doc# E107707 E - 3
E: Ethernet Network Error Codes
Electro Industries/GaugeTechThe Leader In Power Monitoring and Smart Grid SolutionsElectro Industries/GaugeTechThe Leader In Power Monitoring and Smart Grid Solutions
Error# 10092: "Winsock DLL cannot support this application."
Error# 10093: "Winsock not initialized."
Error# 10101: "Disconnect."
Error# 11001: "Host not found."
Error# 11002: "Nonauthoritative host not found."
Error# 11003: "Nonrecoverable error."
Error# 11004: "Valid name, no data record of requested type."

Doc# E107707 E - 4
E: Ethernet Network Error Codes
Electro Industries/GaugeTechThe Leader In Power Monitoring and Smart Grid SolutionsElectro Industries/GaugeTechThe Leader In Power Monitoring and Smart Grid Solutions
This page intentionally left blank.

Doc# E107707 F - 1
F: Detailed Network Card Information
Electro Industries/GaugeTechThe Leader In Power Monitoring and Smart Grid SolutionsElectro Industries/GaugeTechThe Leader In Power Monitoring and Smart Grid Solutions
F: Detailed Network Card Information
F.1: Comparison of Network Cards
EIG TWS Features in Runtime Firmware
Meter Nexus® 12xx Shark® 200
Network card INP100/102/200/202 INP100S
Runtime Firmware Version of Network card
WebExplorer (Web Server) v1.x.x, v3.x.x v1.x, v3.x
WebXML v1.x.x, v3.x.x v1.x, v3.x Read access to data file only. No configura-tion.
WebReacher (FTP client) v1.x.x, v3.x.x N/A
WebMod (Modbus TCP) v1.x.x, v2.x.x, v3.x.x v1.x, v2.x, v3.x
WebAlarm (alarm/email) v1.x.x, v3.x.x N/A
DHCP v1.x.x, v3.x.x v1.x, v3.x
Modbus LDA Access forfirmware update (alterna-tive to TFTP in boot and Web in runtime)
v1.x.48+, v2.x.x, v3.x.x v2.x.x, v3.x.x
Ethernet Gateway port v1.x.x, v3.x.x N/A
Modem v1.x.x, v2.x.x, v3.x.x N/A
DNP LAN/WAN (requires meter firmware support)
v1.x.x, v2.x.x, v3.x.x N/A
GE EGD protocol (only inspecific versions, M66 andM67)
v1.x.x, v2.x.x, v3.x.x N/A
Firmware update via WebServer
v1.x.x, v3.x.x v1.x, v3.x
Sleep Mode (only active under certain conditions)
v1.x.x, v2.x.x, v3.x.x N/A
Cable auto detect v1.x.x, v2.x.x, v3.x.x v1.x, v2.x, v3.x
Accept Debug commands from meter's UART ports
v1.x.x, v2.x.x, v3.x.x N/A. Only sends back a fixed set of network param-eters, such as IP, MAC address, status, etc.
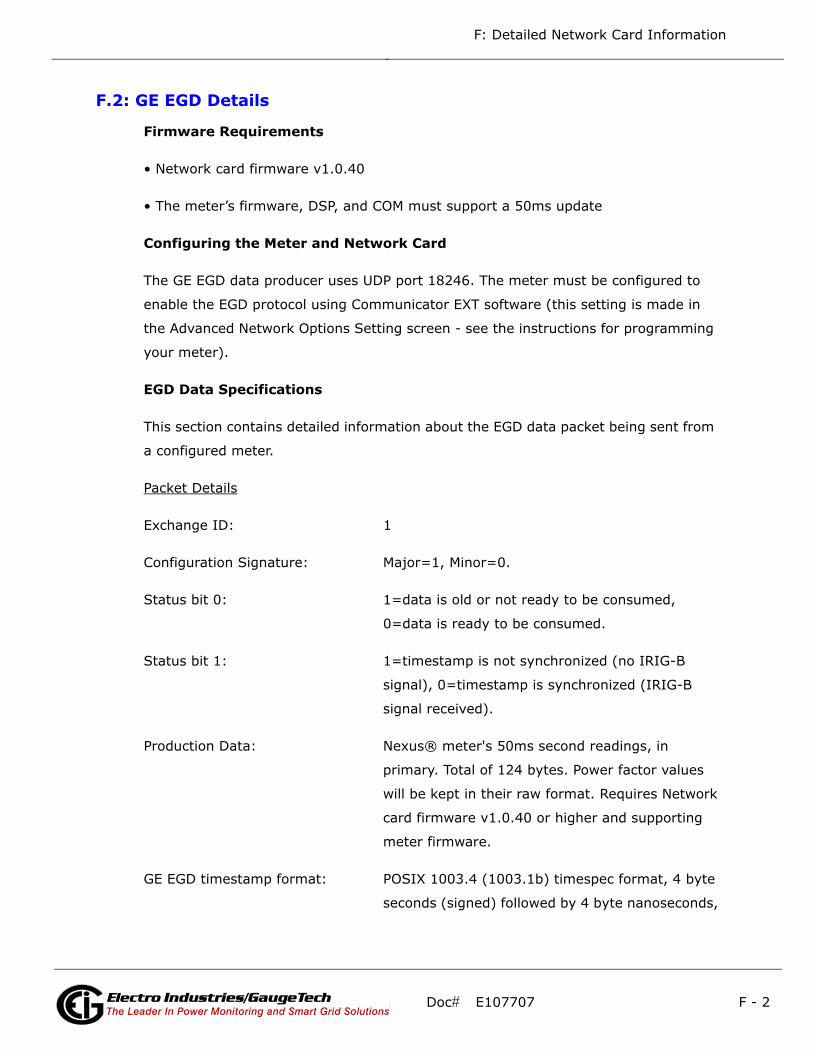
Doc# E107707 F - 2
F: Detailed Network Card Information
Electro Industries/GaugeTechThe Leader In Power Monitoring and Smart Grid SolutionsElectro Industries/GaugeTechThe Leader In Power Monitoring and Smart Grid Solutions
F.2: GE EGD Details
Firmware Requirements
• Network card firmware v1.0.40
• The meter’s firmware, DSP, and COM must support a 50ms update
Configuring the Meter and Network Card
The GE EGD data producer uses UDP port 18246. The meter must be configured to
enable the EGD protocol using Communicator EXT software (this setting is made in
the Advanced Network Options Setting screen - see the instructions for programming
your meter).
EGD Data Specifications
This section contains detailed information about the EGD data packet being sent from
a configured meter.
Packet Details
Exchange ID: 1
Configuration Signature: Major=1, Minor=0.
Status bit 0: 1=data is old or not ready to be consumed,
0=data is ready to be consumed.
Status bit 1: 1=timestamp is not synchronized (no IRIG-B
signal), 0=timestamp is synchronized (IRIG-B
signal received).
Production Data: Nexus® meter's 50ms second readings, in
primary. Total of 124 bytes. Power factor values
will be kept in their raw format. Requires Network
card firmware v1.0.40 or higher and supporting
meter firmware.
GE EGD timestamp format: POSIX 1003.4 (1003.1b) timespec format, 4 byte
seconds (signed) followed by 4 byte nanoseconds,

Doc# E107707 F - 3
F: Detailed Network Card Information
Electro Industries/GaugeTechThe Leader In Power Monitoring and Smart Grid SolutionsElectro Industries/GaugeTechThe Leader In Power Monitoring and Smart Grid Solutions
signed seconds from 01/01/1970, max year is
2038.
Index Name Type Note
1 Timestamp 8 bytes EIG's date/time for-mat, see note below
2 Van 4 byte float Little-endian
3 Vbn 4 byte float Little-endian
4 Vcn 4 byte float Little-endian
5 Vaux 4 byte float Little-endian
6 Ia 4 byte float Little-endian
7 Ib 4 byte float Little-endian
8 Ic 4 byte float Little-endian
9 In-measured 4 byte float Little-endian
10 Vab 4 byte float Little-endian
11 Vbc 4 byte float Little-endian
12 Vca 4 byte float Little-endian
13 VA-a 4 byte float Little-endian
14 VA-b 4 byte float Little-endian
15 VA-c 4 byte float Little-endian
16 VA 4 byte float Little-endian
17 VAR-a 4 byte float Little-endian
18 VAR-b 4 byte float Little-endian
19 VAR-c 4 byte float Little-endian
20 VAR 4 byte float Little-endian
21 W-a 4 byte float Little-endian
22 W-b 4 byte float Little-endian
23 W-c 4 byte float Little-endian
24 W 4 byte float Little-endian
25 Freq 4 byte float Little-endian
26 PF-a 4 byte float Little-endian
27 PF-b 4 byte float Little-endian
28 PF-c 4 byte float Little-endian

Doc# E107707 F - 4
F: Detailed Network Card Information
Electro Industries/GaugeTechThe Leader In Power Monitoring and Smart Grid SolutionsElectro Industries/GaugeTechThe Leader In Power Monitoring and Smart Grid Solutions
NOTE: See your meter’s Modbus Protocol & Register Map for complete detail on spe-
cial data formats.
EIG's Time Stamp Format
Length: 4 Modbus Registers (8 bytes)
Each Modbus register contains two bytes. Each byte contains a binary number repre-
senting up to two digits representing a segment of date and time. The units for each
byte are:
• Century
• Year
• Month
• Date
• Hour
• Minute
• Second
• 10 Millisecond
Hour is in 24-hour format, i.e., 00H = 0 = 12 AM, 01H = 1 = 1 AM, …, 0BH= 11 = 11
AM, 0CH = 12 =12 PM, 0DH = 13 = 1 PM, …, 17H = 23 = 11 PM.
Example:
Registers 00081 – 00084, On Time, might contain the following data:
June 25, 1999 9:19:48.86 AM
29 PF 4 byte float Little-endian
30 Van-Vaux Phase Angle
4 byte float Little-endian
Index Name Type Note

Doc# E107707 F - 5
F: Detailed Network Card Information
Electro Industries/GaugeTechThe Leader In Power Monitoring and Smart Grid SolutionsElectro Industries/GaugeTechThe Leader In Power Monitoring and Smart Grid Solutions
In bytes: 13 63 06 19 09 13 30 56 (lower order byte to higher order byte in UDP
packet)
Century: 19 = 13H
Year: 99 = 63H
Month: 6 = 06H
Date: 25 = 19H
Hour: 9 = 09H
Minute: 19 = 13H
Second: 48 = 30H
Millisecond: 86 = 56H, 86*10=860ms
NOTE: Regarding bit-masking and limit on the values, you have to apply bit-masking
to each byte and set a maximum valid value for date/time reconstruction.
• Byte 1: And 63, Max=63
• Byte 2: And 127, Max=99
• Byte 3: And 15, Max=12
• Byte 4: And 31, Max=31
• Byte 5: And 31, Max=24
• Byte 6: And 63, Max=59
• Byte 7: And 63, Max=59
• Byte 8: And 127, Max=99
NOTE: With the support of DSP/DSP 1 firmware, the meter can provide an advanced
warning indicator prior to performing a RefCal (Reference Calibration). The indicator
flag is set in the MSB of the EIG timestamp's century byte during the final 3 seconds
before a RefCal. End user software can use this indicator to avoid generating unneces-
sary error warnings.

Doc# E107707 F - 6
F: Detailed Network Card Information
Electro Industries/GaugeTechThe Leader In Power Monitoring and Smart Grid SolutionsElectro Industries/GaugeTechThe Leader In Power Monitoring and Smart Grid Solutions
Power Factor Format
0.000 to 3.999 (raw)
PF values in Nexus® meters have two types of representation, which can be defined
by the user in the meter's device profile. The values can be in either EIG or Edison
format.
EIG format
Quadrants Nexus® PF raw value Interpreted PF value
1 0 to 1 0 to 1
4 > 1 to 2 <1 to 0
3 > 2 to 3 <0 to -1
2 > 3 to 4 > -1 to 0
Edison format:
Quadrants Nexus® PF raw value Interpreted PF value
1 0 to 1 0 to 1
4 > 1 to 2 > -1 to 0
3 > 2 to 3 > 0 to 1
2 > 3 to 4 > -1 to 0
Phase Angle Format: +/-180 degrees
EGD Data Protocol Data Unit (PDU) Descriptions
Data Production
The Data Production PDU supports the production of Global Ethernet Data. This
packet contains the user data being produced and sent to the consuming node(s).
This message is unacknowledged, that is, it is transmitted by the producing node at
the configured rate without waiting for a response from the consuming nodes. Receiv-
ing nodes that detect an encoding error in a received Data Production PDU will discard
the PDU and take no action on its contents. The format of the Data Production PDU is

Doc# E107707 F - 7
F: Detailed Network Card Information
Electro Industries/GaugeTechThe Leader In Power Monitoring and Smart Grid SolutionsElectro Industries/GaugeTechThe Leader In Power Monitoring and Smart Grid Solutions
shown in the table below.
The table below contains additional information about these fields.
0 PDU Type (13) PVN=1 Request ID
4 Producer ID
8 Exchange ID
12 Timestamp
16
20 Status
Reserved
24 Configuration Signature Reserved
28 Reserved
32 Production Data (up to 1400 bytes)
PDU field Size (Bytes) Description
PVN 1 Must be set to 1 for com-patibility with older proto-col versions.
Request ID 2 2 byte unsigned integer which is incremented each time a data sample is pro-duced
Producer ID 4 Producer identifier
Exchange ID 4 Exchange identifier
Timestamp 8 The time stamp value should correspond as closely as practical to when the data sample wascaptured
Production Status 2 Bit mask indicating the validity of the data sample produced:Bit 0: Set if there is pro-duction error or invalid(old) dataBit 1: Set if timestamp is not synchronized on pro-ducer node

Doc# E107707 F - 8
F: Detailed Network Card Information
Electro Industries/GaugeTechThe Leader In Power Monitoring and Smart Grid SolutionsElectro Industries/GaugeTechThe Leader In Power Monitoring and Smart Grid Solutions
EGD Data Verification
You can verify the data sent through EGD by polling the meter’s Modbus Registers 119
to 175.
F.3: Troubleshooting the Network Connection
NOTE: If the connection fails, check the connection with the Master meter first. Once
that connection is established, check the connections with the Slave devices.
Suggested checkpoints are as follows:
Master Meter
1. Check cables.
2. Check IP Address, Subnet Mask and Default Gateway settings.
3. Check that the Address is 1.
4. Check that Modbus TCP was selected in Device Properties.
Slave Devices
1. Check all the above except #3.
2. Check that the Address is unique and not set to 1.
3. Check that the Baud Rate settings for the Ethernet Gateway (Port 2) and the
Devices are the same.
General
Try “Pinging” to a known good network device, such as another computer, to verify
that your computer is connected properly to the network.
Configuration Signature 2 2 byte integer indicating relative version of the user data contained in the sam-ple
Production Data up to 1400 User data sample match-ing configuration specified in Configuration Signature
PDU field Size (Bytes) Description
Doc# E107707 F - 9
F: Detailed Network Card Information
Electro Industries/GaugeTechThe Leader In Power Monitoring and Smart Grid SolutionsElectro Industries/GaugeTechThe Leader In Power Monitoring and Smart Grid Solutions
1. From the Start menu, type Run, then cmd to open the command.exe window.
2. Type ping and the IP address, for example, Ping 10.0.0.1
F.4: Total Web Solutions (TWS) MEGA PAGE
Displaying Data from Multiple INP100/102 Units on One Web Page
Using the TWS components WebExplorer and WebReacher, you can design a single
webpage that displays data from multiple meters with INP100/102 Network Options.
To accomplish this, you should have a basic understanding of TWS. Refer to Chapter 6
of this manual for set up and utilization.
You should modify the Java Script Code on the webpages in use and also make a
change to the Internet Explorer browser setting, as detailed below.
1. Using the default files supplied by the INP100/102 Network Options as templates,
the user should modify the Java Script code for all webpages using the sample
below. This sample portion of Java Script code is for demonstration purpose only.
You must insert your own code where needed.
<script language=Javascript>
// insert your own code here
// Define multiple XMLDOM Documents objects
var xmlDoc_Nexus_1 = new ActiveXObject(“MSXML.DomDocument”);
var xmlDoc_Nexus_2 = new ActiveXObject(“MSXML.DomDocument”);
xmlDoc_Nexus_1.async = true;
xmlDoc_Nexus_1.onreadystagechange = do_get_data_Nexus_1;
xmlDoc_Nexus_2.async = true;
xmlDoc_Nexus_2.onreadystatechange = do_get_data_Nexus_2;
// function name ‘start_process’should be placed in web page’s <body> tag
// such as ‘<body onLoad=”start_process()”>’
function start_process()

Doc# E107707 F - 10
F: Detailed Network Card Information
Electro Industries/GaugeTechThe Leader In Power Monitoring and Smart Grid SolutionsElectro Industries/GaugeTechThe Leader In Power Monitoring and Smart Grid Solutions
{
do_get_xml_Nexus_1();
do_get_xml_Nexus_2();
}
// Load each poll_data.xml file from different locations into an XMLDOM Document
objects function
do_get_xml_Nexus_1()
{
xmlDoc_Nexus_1.load(“http://192.168.1.2/poll_data.xm l”);
}
function do_get_xml_Nexus_2()
{
xmlDoc_Nexus_2.load(“http://192.168.7.8/poll_data.xml”);
}
// functions to read, parse and display data from each XMLfile
function do_get_data_Nexus_1()
{
// insert your own code here
}
function do_get_data_Nexus_2()
{
// insert your own code here
}
// insert your own code here</script>
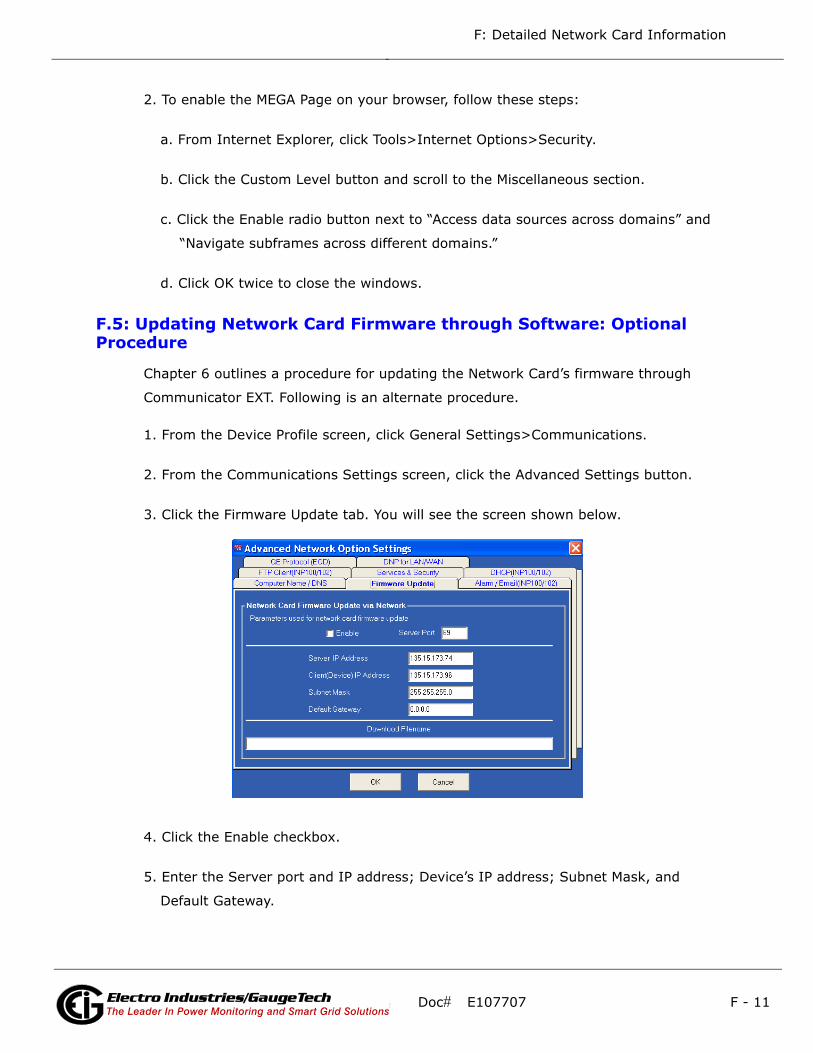
Doc# E107707 F - 11
F: Detailed Network Card Information
Electro Industries/GaugeTechThe Leader In Power Monitoring and Smart Grid SolutionsElectro Industries/GaugeTechThe Leader In Power Monitoring and Smart Grid Solutions
2. To enable the MEGA Page on your browser, follow these steps:
a. From Internet Explorer, click Tools>Internet Options>Security.
b. Click the Custom Level button and scroll to the Miscellaneous section.
c. Click the Enable radio button next to “Access data sources across domains” and
“Navigate subframes across different domains.”
d. Click OK twice to close the windows.
F.5: Updating Network Card Firmware through Software: Optional Procedure
Chapter 6 outlines a procedure for updating the Network Card’s firmware through
Communicator EXT. Following is an alternate procedure.
1. From the Device Profile screen, click General Settings>Communications.
2. From the Communications Settings screen, click the Advanced Settings button.
3. Click the Firmware Update tab. You will see the screen shown below.
4. Click the Enable checkbox.
5. Enter the Server port and IP address; Device’s IP address; Subnet Mask, and
Default Gateway.

Doc# E107707 F - 12
F: Detailed Network Card Information
Electro Industries/GaugeTechThe Leader In Power Monitoring and Smart Grid SolutionsElectro Industries/GaugeTechThe Leader In Power Monitoring and Smart Grid Solutions
6. In the Download Filename field, enter the path of the Firmware update file. For
example: C:Electro Industries\Updates\Firmware\V.1.2.3.0.
7. Click OK to save your settings.
F.6: Nexus® 1500 Meter Network Card Feature Support
Features Network 1 Network 2
Setting Feature Support Setting Feature Support
IP/Mask/Gate-way
Board level Yes Board level Yes
Modbus TCP Server
Meter level Yes Meter level Yes
Modbus TCP Cli-ent
TBD TBD TBD TBD
Web Server Meter level Yes Meter level Yes
FTP Server Meter level Yes Meter level Yes
DNP LAN/WAN Board level Yes Board level Yes
Alarm Email Meter level Yes Meter level Yes
GE EGD Meter level Yes No No
PING N/A Yes N/A Yes
High Perfor-mance Data Export
Meter Level Yes No No
DNS Meter Level Yes Meter Level Yes
IEC 61850 TBD TBD TBD TBD

Electro Industries/GaugeTech Doc # E107707 G-1
Appendix GTFTP Server Program Setup
A free shareware TFTP (Trivial File Transfer Protocol) server program known as tftpd32 is provided to customers to be used to update firmware for the INP-100 Ethernet card. The program files are located on the software installation CD.
NOTE: tftpd32 must be running to update the firmware.
Setup requirements:1. Windows Operating System2. A working Ethernet card with a valid IP Address3. Winzip software (only if Windows OS does not open the zip file automatically)
Setup procedures: 1. In your PC’s hard disk, create a folder with a name.
Example: C:\Program Files\TFTPD32.2. Locate the Zipped tftpd32 program files on the CD. Then, use the Winzip program to extract
all compressed files into the folder you have created in S tep 1.3. In your PC’s hard drive, create a folder with a name to be used as the root directory for TFTP
Server. Example: C:\Program Files\TFTPD32\TFTP_files.
4. To start running the program, double click on tftpd32.exe.
Configuring tftpd32:1. Start the TFTPD32 program (Step 4 above). The following screen appears:
2. Click the Settings button. The Tftpd32: Settings screen appears.
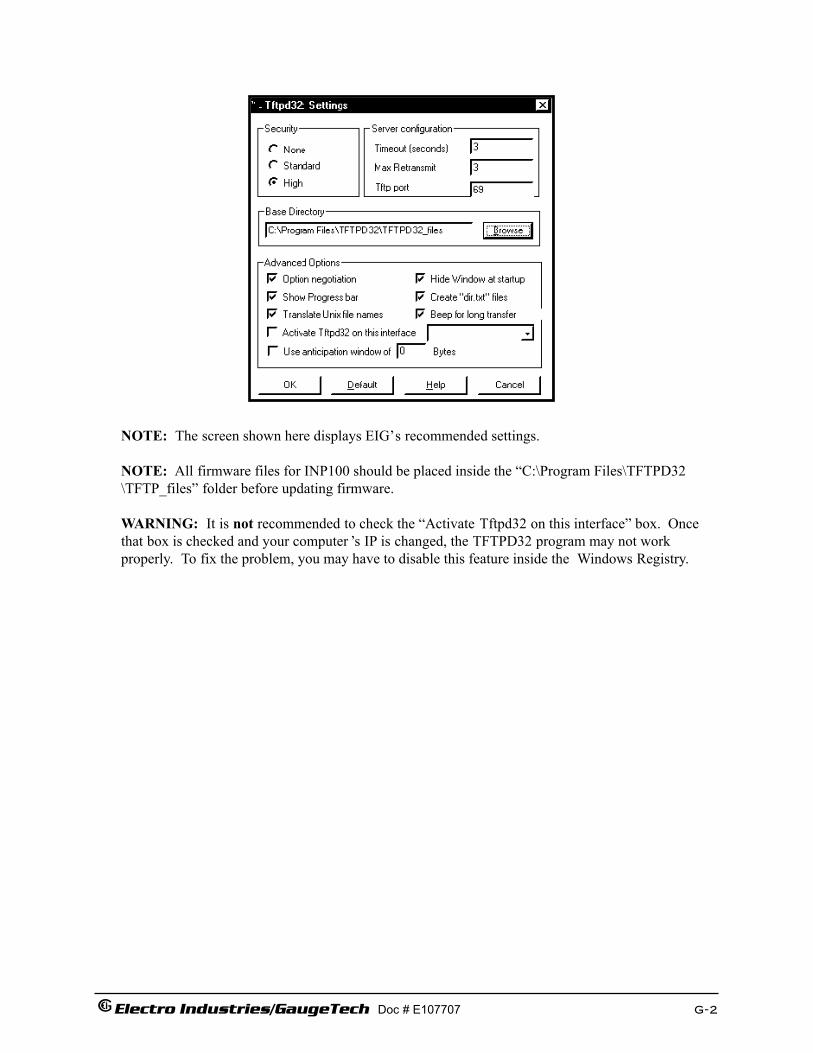
Electro Industries/GaugeTech Doc # E107707 G-2
NOTE: The screen shown here displays EIG’s recommended settings.
NOTE: All firmware files for INP100 should be placed inside the “C:\Program Files\TFTPD32\TFTP_files” folder before updating firmware.
WARNING: It is not recommended to check the “Activate Tftpd32 on this interface” box. Oncethat box is checked and your computer ’s IP is changed, the TFTPD32 program may not work properly. To fix the problem, you may have to disable this feature inside the Windows Registry.

e Electro Industries/Gauge Tech Doc # E107707 Glossary-1
Glossary
0.1 Second Values: These values are the RMS values of the indicated quantity as calculated after approximately 50 milliseconds (3 cycles) of sampling.
1 Second Values: These values are the RMS values of the indicated quantity as calculated after one second (60 cycles) of sampling.
Alarm: An event or condition in a meter that can cause a trigger or call-back to occur.
Annunciator: A short label that identifies particular quantities or values displayed, for examplekWh.
Average (Current): When applied to current values (amps) the average is a calculated value that corresponds to the thermal average over a specified time interval. The interval is specified by the user in the meter profile. The interval is typically 15 minutes.So, Average Amps is the thermal average of amps over the previous 15-minute interval. The thermal average rises to 90% of the actual value in each time interval. For example, if a constant 100amp load is applied, the thermal average will indicate 90 amps after one time interval, 99 amps after two time intervals and 99.9 amps after three time intervals.
Average (Input Pulse When applied to Input Pulse Accumulations, the “Average” refers to the block Accumulations): (fixed) window average value of the input pulses.
Average (Power): When applied to power values (watts, VARs, VA), the average is a calculated value that corresponds to the thermal average over a specified time interval. Theinterval is specified by the user in the meter profile. The interval is typically 15 minutes. So, the Average Watts is the thermal average of watts over the previous 15-minute interval. The thermal average rises to 90% of the actual value in each time interval. For example, if a constant 100kW load is applied, the thermal average will indicate 90kW after one time interval, 99kW after two time intervals and 99.9kW after three time intervals.
Bit: A unit of computer information equivalent to the result of a choice between two alternatives (Yes/No, On/Off, for example).Or, the physical representation of a bit by an electrical pulse whose presence or absence indicates data.
Binary: Relating to a system of numbers having 2 as its base (digits 0 and 1).
Block Window Avg: The Block (Fixed) Window Average is the average power calculated over a (Power) user-set time interval, typically 15 minutes. This calculated average corresponds
to the demand calculations performed by most electric utilities in monitoring user power demand. (See Rolling Window Average.)

e Electro Industries/Gauge Tech Doc # E107707 Glossary-2
Byte: A group of 8 binary digits processed as a unit by a computer (or device) and used especially to represent an alphanumeric character.
CBEMA Curve: A voltage quality curve established originally by the Computer Business Equipment Manufacturers Association. The CBEMA Curve defines voltage disturbances that could cause malfunction or damage in microprocessor devices.The curve is characterized by voltage magnitude and the duration which the voltage is outside of tolerance. (See ITIC Curve.)
Channel: The storage of a single value in each interval in a load profile.
Cold Load Pickup This value is the delay from the time control power is restored to the time whenthe user wants to resume demand accumulation.
CRC Field: Cyclic Redundancy Check Field (Modbus communication) is an error checksum calculation that enables a Slave device to determine if a request packet from a Master device has been corrupted during transmission. If the calculated value does not match the value in the request packet, the Slave ignores the request.
CT (Current) Ratio: A Current Transformer Ratio is used to scale the value of the current from a secondary value up to the primary side of an instrument tranformer.
Cumulative Demand: The sum of the previous billing period maximum demand readings at the time of billing period reset. The maximum demand for the most recent billing periodis added to the previously accumulated total of the maximum demands.
Demand: The average value of power or a similar quantity over a specified period of time.
Demand Interval: A specified time over which demand is calculated.
Display: User-configurable visual indication of data in a meter.
DNP 3.0: A robust, non-proprietary protocol based on existing open standards. DNP 3.0 is used to operate between various systems in electric and other utility industries and SCADA networks. Nexus® 1250 meter supports Level 1; Nexus® 1252 meter supports Level 2.
EEPROM: Nonvolatile memory. Electrically Erasable Programmable Read Only Memory that retains its data during a power outage without need for a battery. Also refers to meter’s FLASH memory.
Energy Register: Programmable record that monitors any energy quantity. Example: Watthours, VARhours, VAhours.
Ethernet: A type of LAN network connection that connects two or more devices on a common communications backbone. An Ethernet LAN consists of at least one hub device (the network backbone) with multiple devices connected to it in a star configuration. The most common versions of Ethernet in use are 10BaseT

e Electro Industries/Gauge Tech Doc # E107707 Glossary-3
and 100BaseT as defined in IEEE 802.3 standards. However, several other versions of Ethernet are also available.
Exception Response: Error Code (Modbus communication) transmitted in a packet from the Slave to the Master if the Slave has encountered an invalid command or other problem.
Flicker: Flicker is the sensation that is experienced by the human visual system when it is subjected to changes occurring in the illumination intensity of light sources.IEC 61000-4-15 and former IEC 868 describe the methods used to determine flicker severity.
Form: Wiring and Hookup configuration for the Nexus® 1262/1272 meter.
Harmonics: Measuring values of the fundamental current and voltage and percent of the fundamental.
Heartbeat Pulse: Energy indicator on the face of the Nexus® 1250/1252 meter; pulses are generated per the programmed Ke value.
I2T Threshold: Data will not accumulate until current reaches programmed level.
Infrared Test Pulse: Energy indicator located on the upper left side of the face of the Nexus® 1262 /1272 meter; pulses are generated per the programmed Ke value.
Integer: Any of the natural numbers, the negatives of those numbers or zero.
Internal Modem: An optional modem within the meter’s enclosure that connects to the RJ-11 telephone connector.
Invalid Register: In the Nexus® meter Modbus Map there are gaps between Registers. For example, the next Register after 08320 is 34817. Any unmapped Register stores no information and is said to be invalid.
ITIC Curve: An updated version of the CBEMA Curve that reflects further study into the performance of microprocessor devices. The curve consists of a series of steps but still defines combinations of voltage magnitude and duration that will cause malfunction or damage.
Ke: kWh per pulse; i.e. the energy.
kWh: kilowatt hours; kW x demand interval in hours.
KYZ Output: Output where the rate of changes between 1 and 0 reflects the magnitude of a metered quantity.
LCD: Liquid Crystal Display.
LED: Light Emitting Diode.

e Electro Industries/Gauge Tech Doc # E107707 Glossary-4
Master Device: In Modbus communication, a Master Device initiates and controls all information transfer in the form of a Request Packet to a Slave Device. The Slave reponds to each request.
Maximum Demand: The largest demand calculated during any interval over a billing period.
Modbus ASCII: Alternate version of the Modbus protocol that utilizes a different data transfer format. This version is not dependent upon strict timing, as is the RTU version. This is the best choice for telecommunications applications (via modems).
Modbus RTU: The most common form of Modbus protocol. Modbus RTU is an open protocolspoken by many field devices to enable devices from multiple vendors to communicate in a common language. Data is transmitted in a timed binary format, providing increased throughput and therefore, increased performance.
Network: A communications connection between two or more devices to enable those devices to send and receive data to one another. In most applications, the network will be either a serial type or a LAN type.
NVRAM: Nonvolatile Random Access Memory is able to keep the stored values in memory even during the loss of circuit or control power. High speed NVRAM is used in the Nexus® meter to gather measured information and to insure that no information is lost.
Optical Port: A port that facilitates infrared communication with a (1260/1262 & 1270/1272) meter. Using an ANSI C12.13 Type II magnetic optical communications coupler and an RS-232 cable from the coupler to a PC, the meter can be programmed with Communicator EXT software.
Packet: A short fixed-length section of data that is transmitted as a unit. Example: a serial string of 8-bit bytes.
Percent (%) THD: Percent Total Harmonic Distortion. (See THD.)
Protocol: A language that will be spoken between two or more devices connected on a network.
PT Ratio: Potential Transformer Ratio used to scale the value of the voltage to the primary side of an instrument transformer. Also referred to as VT Ratio.
Pulse: The closing and opening of the circuit of a two-wire pulse system or the alternate closing and opening of one side and then the other of a three-wire system (which is equal to two pulses).
Q Readings: Q is the quantity obtained by lagging the applied voltage to a wattmeter by 60 degrees. Values are displayed on the Uncompensated Power and Q Readings screen.
e Electro Industries/Gauge Tech Doc # E107707 Glossary-5
Quadrant: Watt and VAR flow is typically represented usng an X-Y coordinate system. (Programmable The four corners of the X-Y plane are referred to as quadrants. Most power Values and Factors applications label the right hand corner as the first quadrant and number the on the Nexus® Meter) remaining quadrants in a counter-clockwise rotation. Following are the
positions of the quadrants: 1st - upper right, 2nd - upper left, 3rd - lower left and 4th - lower right. Power flow is generally positive in quadrants 1 and 4. VAR flow is positive in quadrants 1 and 2. The most common load conditions are: Quadrant 1 - power flow positive, VAR flow positive, inductive load, lagging or positive power factor; Quadrant 2 - power flow negative, VAR flow positive, capacitive load, leading or negative power factor.
Register: An entry or record that stores a small amount of data.
Register Rollover: A point at which a Register reaches its maximum value and rolls over to zero.
Reset: Logs are cleared or new (or default) values are sent to counters or timers.
Rolling Window The Rolling (Sliding) Window Average is the average power calculated over a Average (Power): user-set time interval that is derived from a specified number of sub-intervals,
each of a specified time. For example, the average is calculated over a 15-minute interval by calculating the sum of the average of three consecutive 5-minute intervals. This demand calculation methodology has been adopted by several utilities to prevent customer manipulation of kW demand by simply spreading peak demand across two intervals.
RS232: A type of serial network connection that connects two devices to enable communication between devices. An RS-232 connection connects only two points. Distance between devices is typically limited to fairly short runs. Current standards recommend a maximum of 50 feet but some users have had success with runs up to 100 feet. Communications speed is typically in the range of 1200 bits per second to 57,600 bits per second. RS-232 connectioncan be accomplished using Port 1 of the Nexus® 1250/1252 meter or the Optical Port on the face of the Nexus® 1260/1270 meter.
RS485: A type of serial network connection that connects two or more devices to enable communication between the devices. An RS-485 connection will allow multi-drop communication from one to many points. Distance between devices is typically limited to around 2,000 to 3,000 wire feet. Communications speed is typically in the range of 120 bits per second to 115,000 bits per second.
Sag: A voltage quality event during which the RMS voltage is lower than normal for a period of time, typically from 1/2 cycle to 1 minute.
Secondary Rated: Any Register or pulse output that does not use any CT or VT Ratio.
Serial Port: The type of port used to directly interface with a PC.
Slave Device: In Modbus communication, a Slave Device only receives a Request Packet from a Master Device and responds to the request. A Slave Device cannot initiate communication.

e Electro Industries/Gauge Tech Doc # E107707 Glossary-6
Swell: A voltage quality event during which the RMS voltage is higher than normal for a period of time, typically from 1/2 cycle to 1 minute.
TDD: The Total Demand Distortion of the current waveform. The ratio of the root-sum-square value of the harmonic current to the maximum demand load current.(See equation below.) NOTE: The TDD displayed in the Harmonics screen is calculated by Communicator EXT software, using the Max Average Demand.
THD: Total Harmonic Distortion is the combined effect of all harmonics measured in avoltage or current. The THD number is expressed as a percent of the fundamental. For example, a 3% THD indicates that the magnitude of all harmonic distortion measured equals 3% of the magnitude of the fundamental 60Hz quantity. The %THD displayed is calculated by your Nexus® meter.
Time Stamp: A stored representation of the time of an event. Time Stamp can include year, month, day, hour, minute and second and Daylight Savings Time indication.
TOU: Time of Use.
Uncompensated Power: VA, Watt and VAR readings not adjusted by Transformer Loss Compensation.
V2T Threshold: Data will stop accumulating when voltage falls below programmed level.
Voltage Imbalance: The ratio of the voltage on a phase to the average voltage on all phases.
Voltage Quality Event: An instance of abnormal voltage on a phase. The events the meter will track include sags, swells, interruptions and imbalances.
VT Ratio: The Voltage Transformer Ratio is used to scale the value of the voltage to the primary side of an instrument transformer. Also referred to as PT Ratio.
Voltage, Vab: Vab, Vbc, Vca are all Phase-to-Phase voltage measurements. These voltages aremeasured between the three phase voltage inputs to the meter.
Voltage, Van: Van, Vbn, Vcn are all Phase-to-Neutral voltages applied to the monitor. These voltages are measured between the phase voltage inputs and Vn input to the meter. Technologically, these voltages can be “measured” even when the meter is in a Delta configuration and there is no connection to the Vn input. However,in this configuration, these voltages have limited meaning and are typically not reported.
Voltage, Vaux This is the fourth voltage input measured from between the Vaux and Vref inputs. This input can be scaled to any value. However, the actual input voltage to the meter should be of the same magnitude as the voltages applied to the Va, Vb and Vc terminals.
I L