annotated bibliography of commercially important prawns and ...
Upload
khangminh22Category
view
1download
0
Fibre laser joining of highly dissimilar materials: Commercially pure Tiand PET hybrid joint for medical device applications
Chan, C-W., & Smith, G. C. (2016). Fibre laser joining of highly dissimilar materials: Commercially pure Ti andPET hybrid joint for medical device applications. Materials & Design, 103, 278-292.https://doi.org/10.1016/j.matdes.2016.04.086
Published in:Materials & Design
Document Version:Peer reviewed version
Queen's University Belfast - Research Portal:Link to publication record in Queen's University Belfast Research Portal
Publisher rights© 2016 Elsevier Ltd. This manuscript version is made available under the CC-BY-NC-ND 4.0 license http://creativecommons.org/licenses/by-nc-nd/4.0/ which permits distribution and reproduction for non-commercial purposes, provided the author and source are cited.
General rightsCopyright for the publications made accessible via the Queen's University Belfast Research Portal is retained by the author(s) and / or othercopyright owners and it is a condition of accessing these publications that users recognise and abide by the legal requirements associatedwith these rights.
Take down policyThe Research Portal is Queen's institutional repository that provides access to Queen's research output. Every effort has been made toensure that content in the Research Portal does not infringe any person's rights, or applicable UK laws. If you discover content in theResearch Portal that you believe breaches copyright or violates any law, please contact [email protected].
Download date:22. Apr. 2022
Fibre Laser Joining of Highly Dissimilar Materials: Commercially Pure Ti and PET Hybrid Joint for Medical Device Applications
Chi-Wai Chana*, Graham C. Smithb
aSchool of Mechanical and Aerospace Engineering, Queen's University Belfast, BT9 5AH, UK bDepartment of Natural Sciences, University of Chester, Thornton Science Park, Chester CH2 4NU, UK
Abstract
Laser transmission joining (LTJ) is growing in importance, and has the potential to become a niche technique for the fabrication of hybrid plastic-metal joints for medical device applications. The possibility of directly joining plastics to metals by LTJ has been demonstrated by a number of recent studies. However, a reliable and quantitative method for defining the contact area between the plastic and metal, facilitating calculation of the mechanical shear stress of the hybrid joints, is still lacking. A new method, based on image analysis using ImageJ, is proposed here to quantify the contact area at the joint interface. The effect of discolouration on the mechanical performance of the hybrid joints is also reported for the first time. Biocompatible polyethylene terephthalate (PET) and commercially pure titanium (Ti) were selected as materials for laser joining using a 200 W CW fibre laser system. The effect of laser power, scanning speed and stand-off distance between the nozzle tip and top surface of the plastic were studied and analysed by Taguchi L9 orthogonal array and ANOVA respectively. The surface morphology, structure and elemental composition on the PET and Ti surfaces after shearing/peeling apart were characterized by SEM, EDX, XRD and XPS.
Keywords: Dissimilar materials joining, plastics to metal joining, laser joining, medical devices, PET, commercially pure Ti, contact area
Corresponding Author: [email protected]
1. Introduction
Because of improved access to healthcare facilities and consequently increased life expectancy, the demand for medical implant devices has increased significantly in the past two decades. One of the biggest obstacles hindering the development of innovative medical devices is the ability to join dissimilar materials. Difficulties arise due to chemical incompatibility and different physical characteristics, for example melting point, coefficient of thermal expansion, thermal diffusivity, etc. The joining of dissimilar materials for medical device applications has recently been the subject of much recent research. In particular, successful implementation of hybrid plastic-metal joints would allow complementary structural and non-structural needs of medical devices to be realised in a single customized solution [1] with the plastic parts offering flexibility and the metal parts providing the mechanical strength. Traditionally, joining of plastic to metal parts in medical devices has been achieved by using medical adhesives, such as polyurethanes, silicones, and epoxies. For example, pacemakers, defibrillators and neurological stimulators are designed using silicone adhesive to seal the joint between the polyurethane connector module and the titanium can [2, 3]. However, there are a number of drawbacks associated with the use of adhesives, such as slow processing time, lack of long term stability and design flexibility, as well as a high tendency to produce leachable/extractable products. Consequently, there is an urgent demand for a fast, safe, flexible, reliable and adhesive-free method to directly join the plastic component to the metal body.
Laser transmission joining (LTJ) is growing in importance, and has the potential to become a niche technique in the fabrication of hybrid plastic-metal joints for medical device applications. Key advantages of laser transmission joining over the traditional adhesive method include a clean and non-contact process, fast joining cycles (usually less than few seconds), highly flexible and automated, the absence of particulate generation, and no vibration of the parts during joining. Successful laser joining of metals to plastics has been demonstrated for a range of material combinations. Examples include CFRP-zinc coated steel [4], CFRP-SS304 [5], HDPE-SS304 [6], PA6-SS304 [1], PA66-SS304 [7], PET-A5052 [8, 9], PET-AZ91D [10], PET-Cu [9], PET-SS304 [9, 11-12], PET-SS316L [13], PET-Ti [14, 15], PMMA-SS304 [16] and PI-Ti [17]. Katayama et al. [11] applied continuous wave (CW) diode laser to join SS304 and PET and reported that high strength plastics and metal joints can be fabricated by laser heating due to the formation of mechanical, physical and chemical bonds (e.g. Cr-O) between the plastics and metal surfaces. Cenigaonaindia et al. [1] used a high power CW diode laser to join SS304 and PA6. They reported that good quality joints can be obtained by carefully optimising the process parameters, such as laser power, processing speed, joining trajectory, and clamping pressure. Process monitoring and control systems were used in their study to inspect the joint quality during the joining process. Fortunato et al. [7] applied CW diode laser to fabricate joints between SS304 and a group of PA materials, e.g. PA66, glass fibre reinforced PA 66 and carbon fibre reinforced PA66, while Tillmann et al. [12] used CW Nd:YAG laser to join SS304 and PET. They both claimed that joint strength can be controlled by optimising the laser power and processing speed. Hussein et al. [16] used pulsed Nd:YAG laser to join SS304 with PMMA, and reported that joint strength and bead width increased as a function of thermal input. Chen et al. [14] used pulsed Nd:YAG laser to join Ti and PET, and concluded that the degradation of PET can be minimized by properly controlling the waveform of laser, i.e., ramped up/down. Wang et al. [13] used CW diode laser to join SS316L with PET. They employed response surface methodology (RSM) to establish mathematical relationships between different process parameters (i.e., laser power, joining speed and stand-off distance) and joint strength. Mian et al. [17] applied CW diode, Nd:YAG and fibre lasers to join the Ti with PI. They developed a FEA model to predict the joint strength and the predicted values were in good agreement with the experimental results. Jung et al. [4-5] performed laser direct joining between carbon fiber reinforced plastics (CFRPs) and zinc-coated steel or SS304 using continuous wave (CW) diode laser. Their results indicated that the high strength of the CFRP-zinc-coated steel/stainless steel joint arose from the chemical bonds between the CFRP and metal outermost surfaces, i.e., ionic bonds between zinc oxide and carbon [4] as well as between melted plastic and Cr-Fe oxide film [5]. Wang et al. [15] investigated the joint

performance between Ti and PET made by CW diode laser. They reported that the formation of Ti-C like chemical bonds at the joint interface was responsible for the high joint strength. Cheon et al. [6] studied laser direct joining between SS304 and HDPE using CW fiber laser. They quantified the relationships among the joint strength, expansion pressure, gas fragment composition and molecular structure. Their findings also showed that the joint strength was highly correlated with the polymer structure. Farazila et al. [8, 9] used pulsed Nd:YAG laser to join PET with a variety of metallic materials, e.g., A5052, SS304 and Cu. They found that the shear strength of the joints was directly proportional to the laser heat input and pulse duration, and also related to the bubble size. Similar findings were reported by Wahba et al. [10]. They utilized high power CW diode laser to join AZ91D with PET, and found that the joint strength was correlated with the bubble size. i.e., small bubbles favoured the formation of high strength joints.
A significant problem concerning the LTJ technique between plastics and metal is that there is no quantitative method to measure the bond area and thus, its relationships with the laser processing parameters are still undefined. Currently, joint strength is typically defined as breakdown force per unit processed length, but this is not an accurate representation of the joint strength. Further, the assessment of the quality and strength of the hybrid joint is typically limited to the bubble characteristics, such as size, quantity and distribution and morphology. Discolouration, which is one of the most critical problems that arise during high temperature processing of plastics, has not been considered as an indicator for assessing the joint quality and strength. To tackle these issues, a new measurement method is proposed to quantitatively determine the bond area between the plastics and metal parts, and based on this, to calculate the breakdown force per unit contact area. The effect of discoloration on the joint strength is also analysed and evaluated. The effects of the laser parameters, namely laser power, scanning speed and stand-off distance on the joint morphology are studied by the Taguchi method. The surface morphology, structure and chemical composition of the material surfaces after the shear test have also been characterized. The material combination in the present study was commercially pure titanium (Ti) and polyethylene terephthalate (PET). Pure Ti is one of the most common biomaterials as it has excellent biocompatibility which does not promote any adverse reactions and is tolerated well by the human tissues [18]. PET is a highly biocompatible, biostable, and nondegradable polymer which possesses desirable mechanical features for biomaterial applications [19]. Further, PET is known to have very high transparency (~90%) to the laser in the near-infrared region [11, 14], which is a crucial property determining the amount of laser energy input to the metal substrate.

2. Methodology and Experimental Details
2.1. Materials preparation
The materials were an annealed pure titanium foil (purity: 99.6+%, 300 mm x 300 mm x 0.5 mm) and an amorphous polyethylene terephthalate (PET) sheet (300 mm x 300 mm x 1 mm) purchased from GoodFellow, Cambridge Ltd., UK. They were cut into 50 mm x 15 mm in size. The Ti surface was ground with a series of sandpapers from 120 grits to 400 grits to remove any pre-existed surface oxides and to ensure consistent surface roughness, i.e., Ra value of 0.38 ± 0.07 µm (from five measurements). The Ti surface was ground for 5 min by each grit scale of sandpaper following the standard metallurgical procedure. Before the laser joining experiment, both the Ti (after grinding) and PET (as-received) samples were cleaned and degreased ultrasonically in methanol for 10 min, rinsed in distilled water for another 10 min, and dried thoroughly in a cold air stream.
2.2. Joining mechanisms between PET and Ti
The formation of stable bonds between metal and plastics by laser transmission joining technique was first reported by Katayama and Kawahito [11]. In this technique, the plastic, which is transparent to laser beam, was positioned on the metal substrate and a clamping force applied to hold the materials together. The transmitted laser energy through the plastic heats the underlying metal which then heats up the contacting surface of the plastic, causing it to decompose. Thermal decomposition of the heated plastic surface generates solid, liquid and gaseous products at the plastic-metal interface. The gaseous products form bubbles, and expansion of these bubbles creates a high local pressure which forces the molten plastics liquid products to the metal surface. After re-solidification, stable bonds between the plastics and metal interface are formed by mechanical interlocking, chemical reactions and Van Der Waals’ interaction. The schematic diagram to illustrate the laser joining process is shown in Fig. 1.
2.3. Laser experimental Setup
The laser transmission joining process in the present study was performed in an argon (Ar) shielding environment using a SPI continuous wave (CW) 200W fiber laser (MLS-4030, Microlasersystems B.V., the Netherlands). The wavelength of the fibre laser was 1064 nm. Laser joining was carried out by positioning the two sheet samples in a lap joint configuration with the PET on top of the Ti. They were held together by a tailor-made clamping jig comprising of a bottom plate (60 mm x 30 mm x 8 mm) and two cover plates (30 mm x 28 mm x 5 mm) with four M3 screws attached to each cover plate. The screws were placed around the perimeter of the samples. This clamping jig worked by setting the two samples level using additional pieces of material inserted into opposite sides, with each additional piece of material having the same thickness as that of the sample. Clamping pressure was applied by tightening the eight screws to give a clamping pressure of approximately 1.1 MPa. After assembly, the gap exposed to the laser beam was 4 mm. The overlapping area between the PET and Ti was controlled to be 20 mm in length. The central position of the overlapped area was irradiated by laser in a transverse direction, and the laser-processed length was 10 mm. Fig. 2. shows the schematic diagrams of the joining jig assembly and the location of laser beam relative to the sample surface. Fig. 3. shows the geometry and dimension of the Ti-PET hybrid joint after laser joining. Ar gas was used to cool down the PET surface and minimize the effect of oxygen from surrounding air. It was delivered through the central gas jet of 2 mm in diameter with the gas flow rate of 30 L/min.
In the laser experimentation, all metal surfaces were ground sequentially with a series of sandpapers. The resulting groove marks left on the metal surfaces can increase the surface area/roughness for mechanical interlocking between the plastics and metal. The experimental parameter design was based on the Taguchi L9 orthogonal array in which the laser process parameters, namely laser power (P), scanning speed (S) and stand-off distance (D), were varied at three levels (as shown in Table 1). Three replicates were performed for every processing condition. The laser spot diameter at different
stand-off distances were experimentally measured. A short laser pulse was shot to a laser burn paper, leaving a burn mark onto the paper. Three burn marks were made at every stand-off distance. The spatial distribution of the burn marks was acquired using an image processing program: ImageJ (downloaded from the NIH website: http://rsb.info.nih.gov/ij). The full width half maximum (FWHM) of the spots and the diameter at the 1/e2 level (about 87 % of the intensity) were measured directly from the spatial distribution.
The design objective was to minimize the non-contact area (NCA), defined as the interface area occupied by bubbles. The NCA was converted into the signal to noise (S/N) ratio (smaller-the-better) by equation 1. The results were analysed by ANOVA to determine which of the laser parameters affected the output characteristic significantly. The measurements of NCA were repeated three times. The proposed method to measure the NCA is described in the following sub-sections.
𝑆/𝑁 = −10 log [1
𝑟∑ 𝑦𝑖
2𝑟𝑖=1 ] (1)
where r is the number of measurements and y is the measured value from each measurement
The effects of the laser process parameters on the design objective were analysed by using the software: Minitab 17. The hybrid joint samples obtained from each experimental trial in the L9 Taguchi experiment were designated with the labels “A” to “J” (as shown in Table 2), and they will be referred to as “Joint A” to “Joint J” hereafter.
2.4. Mechanical shear test
The mechanical shear strength (F) was determined using a Lloyd LRX tensile testing machine with a load cell of 500 N. The transverse speed of the shear tests was controlled at 0.5 mm/min. The shear stress (τ) was calculated by using equation 4 as described in the following section.
2.5. Measurement of the bond area between plastics and metal
The proposed method, the total joint area (TJA) between the PET and Ti surfaces was divided into the contact area (CA) and non-contact area (NCA). The NCA was the interface area occupied by bubbles, whilst the CA was sub-divided into zones with and without discoloration, namely the clean zone (CZ) and the discolored zone (DZ) respectively. The relationships between the newly defined parameters: TJA, CA, NCA, CZ and DZ are given by the following two equations:
TJA = CA + NCA (2)
CA = CZ + DZ (3)
The measurements of different areas and zones were done by ImageJ. ImageJ is a freeware widely used in biology for measuring the area of cells based on the colour contrast of different features [20]. The TJA was measured by manually identifying the joint boundary between the plastic and metal substrate in ImageJ. Extra attention was needed to determine the NCA because of its similar colour to that of other areas/zones. To provide an accurate and quantitative estimation, the NCA was firstly identified by using a non-contact laser profilometer (3-D Surface Profiler; Micromeasure 2; Polytec Ltd; UK) to capture the topographical features on the contacting surface of plastics. The results, in the form of a 2D surface profile image in Fig. 4 (a), were then analysed by using ImageJ. In Fig. 4 (a), the interface areas adjacent to the bubbles (NCA) were represented by colours ranging from orange to blue depending on their height values, i.e. the colour bar that indicated the height of bubbles were displayed on the 2D profile image in Fig. 4 (a). Addition of the area of the coloured regions occupied by the bubbles using ImageJ gave the amount of NCA. With NCA and TJA known, CA was then calculated by equation 2.
It is important to note that the bubbles which can be measured by this method were limited to those with height between 60 and 225 µm. Such values were determined from the height scale marked with
black colour in the colour bar (in Fig. 4 (b)), i.e. the NCA and its corresponding height scale in the colour bar were highlighted in black colour (in the Fig. 4 (b)) after the measurement by ImageJ. The colours associated with the shallow bubbles (height < 60 µm) were very similar to the CA, and thus, they could not be recognized in ImageJ. To overcome this, the shallow bubbles that were easily distinguishable by eye but not recognized in the 2D surface profile by ImageJ, were manually selected in ImageJ and their occupied area was included in the calculation of the NCA. Further, the DZ was easily recognizable and measured in ImageJ due to its distinctive colour contrast. The CZ was then calculated by using equation 3, with the amount of CA and DZ known. The overlapping area between the NCA and DZ were classified as NCA as there was no contact between the plastics and metal in that area. An example of measuring the DZ by ImageJ is given in Fig. 5.
In summary, the proposed method is described by the following steps: First, the laser joint morphology was captured by an optical microscope and exported as a high resolution micrograph (see example in Fig. 5 (a)). The total joint area (TJA) was directly measured from the optical micrograph by manually selecting the boundary line between plastics and metal using ImageJ software. Second, the surface topographical features at the joint interface were captured by a non-contact laser profilometer and the results were exported as a 2-D surface profile image (see example in Figure 4 (a)). The non-contact area (NCA) was directly measured from the 2-D surface profile image by ImageJ (see example in Figure 4 (b)). Since the values of TJA and NCA were known, the contact area (CA) can be calculated by equation 2. Finally, the discoloured zone (DZ) was directly measured from the optical micrograph by ImageJ (see example in Figure 5 (b)). Since the values of CA and DZ were known from the previous steps, the clean zone (CZ) can be determined by equation 3.
The shear stress (τ) of the hybrid joints is quantitatively determined by the following equation:
τ = F/CA (4)
To evaluate the effect of discoloration on the shear stress, a new parameter called the concentration of the discolored zone (CDZ) is defined, and it is determined by the following equation:
CDZ = DZ/CA x 100% (5)
2.6. Surface morphology, structure and elemental composition characterisation
The surface morphology of the hybrid joints in the as-welded conditions were captured by optical microscopy. The surface morphology and elemental composition of the PET and Ti surfaces after the mechanical shear test was characterized by scanning-electron microscopy (SEM; LEO 1455VP, Zeiss) equipped with energy dispersive x-ray (EDX) system for elemental mapping and line scan profile analysis on the surfaces.
X-ray diffraction patterns were acquired using a Bruker D8 Advance diffractometer with Cu Kα radiation, Ni Kβ filter, fixed illumination area to confine the data acquisition to either “on” or
“off” the laser track area, fixed detector slits, and a linear array detector.
X-ray photoelectron spectroscopy (XPS) was performed to identify the chemical species present on the PET and Ti outermost surfaces. The hybrid joint was carefully peeled apart and immediately inserted into the vacuum system of the XPS instrument to minimize the effect of environmental contamination due to air exposure. Spectra were acquired using a bespoke system fitted with a Specs GmbH Focus 500 monochromated Al Kα X-ray source, a Specs GmbH Phoibos 150 mm mean radius hemispherical analyser with 9-channeltron detection, and a Specs GmbH FG20 charge neutralising electron gun. The survey and narrow scans were acquired over the binding energy range between 0 and 1100 eV using a pass energy of 50 eV and the high resolution scans were made over individual photoelectron lines using a pass energy of 15 eV. Data processing and curve fitting were carried out using CasaXPS software v2.3.16.

3. Results and Discussions
3.1. Results of the L9 Taguchi experiment
Table 3 shows the results of the measured NCA and the corresponding calculated S/N ratio for each experimental run in the Taguchi L9 orthogonal array. The means of the calculated S/N ratios for different laser parameters are graphically illustrated in Fig. 6 in which the highest S/N ratio in each plot corresponds to the smaller variance of the output characteristic around the desired value [21]. Consequently, the highest point in each plot indicated the recommended level for each laser parameter. The results in Fig. 6 suggest that the hybrid joints with fewer bubbles (or lower NCA) can be obtained by using the following combination of laser parameters: lowest power (level 1), highest scanning speed (level 3) and longest stand off distance (level 3). Table 4 shows the results of ANOVA. In the ANOVA analysis, F-test was used to see which laser parameters have significant effect on the output characteristic, i.e. the change in the level of parameter was significant when the F ratio was larger than 4 [22]. Percentage contribution (P) indicated the degree of influence of each parameter on the output characteristic, i.e. the higher the percentage contribution, the higher the influence. It can be observed from Table 4 that the change in the level of the three laser parameters affected the NCA significantly as their F-ratios were higher than 4. Among the three laser parameters, laser power was the most significant factor to influence the amount of NCA present at the joint interface, followed by the scanning speed and standoff distance, i.e. laser power accounted for 50.6 % of the percentage contribution whilst scanning speed and standoff distance accounted for 26.2 % and 20.8 % respectively. The percent contribution of error was found to be small, i.e. 2.4 %, indicating that no important factors were omitted or significant measurement error was involved.
Table 5 provides the measurement results of different zones/areas as well as the mechanical performance of the hybrid joints. Among the results shown in Table 5, it is noteworthy to discuss the effect of laser parameters on the surface discolouration and to what extent it influenced the mechanical performance of the hybrid joints. This is because discolouration has often been considered as an undesirable characteristic of plastics occurring at high temperature processing. It can be observed in Table 5 that laser power was critical to cause the occurrence of surface discolouration. When increasing the laser power to 50 W or above, regardless of the scanning speed and stand-off distance, a high concentration of discolored zone (CDZ) appeared. With further investigation to the effect of surface discoloration on the shear stress, it is found that the shear stress of the joints tended to decrease with increasing CDZ. Considering the hybrid joints in the 40-W category, the CDZ increasing from 0.3 % (Joint C) to 73.5 % (Joint A) caused a five-fold decrease of shear stress, i.e. 3.2 MPa to 0.6 MPa. In addition, when looking at the whole set of experimental data, the joints with high CDZ (> 30 %) tended to have weaker mechanical performance, i.e. the shear stress was scattered between 0.7 and 2.3 MPa which were about 22 % and 72 % of that of the Joint C respectively. This, in turn, indicated that surface discolouration was detrimental to the mechanical performance of the hybrid joints. It should be minimized or avoided in the laser joining process.
3.2. Effects of laser energy input on the morphology of the hybrid joints
PET will undergo thermal degradation at high temperature, namely above 300 °C, leading to changes of material properties via pyrolysis (or thermolysis) process. In the pyrolysis reaction, three phases namely solid (or residual coke), liquid hydrocarbons (or tar), and volatile gaseous products are produced, and they are immiscible. Previous literature [23, 24] has reported that the gaseous products increase with increasing temperature. At 500 oC, the weight percentages of solid, liquid and gas phases of PET after the pyrolysis reaction are about 8 %, 32 % and 60 % respectively [25]. In laser direct joining between the PET and Ti, the evolution of gaseous products from the heated PET is believed to be the major source of bubbles formed in the PET-Ti interface. It is reasonable to suppose that the amount of such gaseous products will directly affect the bubble characteristics, such as size, quantity and distribution, which are the important factors to determine the amount of NCA between the PET and

Ti surfaces. High quantity of bubbles or/and large-sized bubbles have been reported to reduce the joint strength due to the increased amount of NCA [26]. Further, porosity in the PET can also weaken the mechanical strength of the plastics.
Based on the discussion above, the temperature at the PET and Ti interface must be carefully controlled. First, it should be sufficiently high enough to activate the pyrolysis reaction of the plastic, and thus, generate an appropriate amount of gaseous products to form bubbles with desirable features, preferably small-sized, small in quantity and finely distributed, at the joint interface. Second, the temperature should not exceed the point above which excessive gaseous products were generated, otherwise this may lead to the formation of undesirable bubbles, such as large-sized, large in quantity and randomly distributed. The temperature at the plastic-metal interface depends on the laser energy input, which is the product of power density (laser power/laser spot area) and interaction time between the laser and metal surface (laser spot diameter/scanning speed) [27], [28]. Essentially, the higher the laser energy input to the metal surface, the higher the temperature at the plastic-metal interface. Higher laser energy input can be achieved by higher power density and longer interaction time. Table 6 shows the power density and interaction time for each processing condition in the Taguchi experiment. It is particular to note that the variation of interaction time among different processing conditions was small, i.e., ranging from 0.1 s to 0.3 s, whereas the power density was varying in a wide range from 1990 W/cm2 to 15600 W/cm2. Consequently, it is reasonable to claim that the distinct changes in the morphological characteristics of the hybrid joints were attributed more to the power density than the interaction time.
When comparing the morphology of the PET-Ti joints in the 40 W category (i.e., all with similar interaction time of 0.1 s), it is found that a good quality joint as indicated by a clean surface and small-sized bubbles (see Joint C in Fig. 7) can be produced by lower power density (i.e., 1990 W/cm2). As seen in Fig.7., the small-sized bubbles were interconnected to form a networked structure, and the distribution of such interconnected bubbles was predominantly centralized along the laser-irradiated area on the metal surface. With further increase of power density (i.e., 3540 W/cm2), some discoloration and large-sized bubbles started to appear coupled with the presence of small-sized bubbles (see the Joint B in Fig. 7). The small-sized bubbles were found to be distributed at the front of the laser-irradiated area, while the large-sized bubbles appeared beyond the middle point of the laser-irradiated area and were interconnected to form a networked structure (see the Joint B in Fig. 7). However, the networked structure became more irregular in form when compared with that of the Joint C. When increasing the power density to a high level (i.e., 10400 W/cm2), significant discoloration and a high portion of non-contact area covered by interconnected, large-sized bubbles was observed (see the Joint A in Fig. 7). Large-sized bubbles and discoloration can be found from the remains of the hybrid joints (Joint D to Joint I) in the Taguchi experiment. These findings indicated that heating the metal surface with excessive laser power density (> 1990 W/cm2) can cause discoloration to the plastics counterpart and bring dramatic changes to the bubble features at the joint interface, i.e., appearance of large-sized bubbles and irregular networked structure.
3.4. SEM, EDX, XRD and XPS analyses of the joint surfaces
To understand the possible chemical reactions taken place between the PET and Ti during the laser joining process, SEM imaging, EDX compositional analysis, XRD and surface analysis by XPS were conducted on the Ti and PET surfaces exposed after separating the components of the joint.
The SEM micrograph and EDX mapping results of the PET surface are given in Fig. 8. The results show that a small amount of Ti residue (white colour particles in Fig. 8) adhered to the PET surface after testing. Fig. 9 shows the SEM micrograph and the results of EDX line scan profile analysis (profile along the yellow line) of the Ti surface after the shear test. It is clear from Fig. 9 that a substantial amount of PET residue material remained on the Ti surface after separation of the two components of the joint. Using backscattered electron detection where brightness depends to a great extent on local
atomic number, a dark residue was found on the laser-irradiated area with some branches of lighter grey material extending from the sides of the dark residue. The EDX line scan results show that the elements in the dark residue were predominately carbon (C) with small amount of Ti, whilst the light grey residue contained a higher amount of Ti but a small amount of C. The oxygen trace (O) was found to closely follow the C, though at a lower intensity. The above findings suggested that there were chemical reactions between the PET and Ti resulting in a high proportion of carbon-containing residue on the Ti surface.
XRD data were acquired to investigate the possibility of a change in structure of the PET from amorphous to crystalline as a consequence of the laser joining process. Data from the PET surface on and off the laser track are shown in Fig. 10. Off the laser track, the material is amorphous (as specified by the supplier) and the data shows the typical broad scattering features at approximately 20 – 25o and 40 – 45o seen from amorphous carbon blacks and similar materials [29]. The data show no significant change in form when acquired from the laser track area, indicating no evidence for an amorphous to crystalline phase change in the material retained on the PET side of the joint. Similar measurements were made from the Ti side of the joint, but no PET was detectable by XRD due to the small amounts of material present and the low X-ray scattering cross-section for organics.
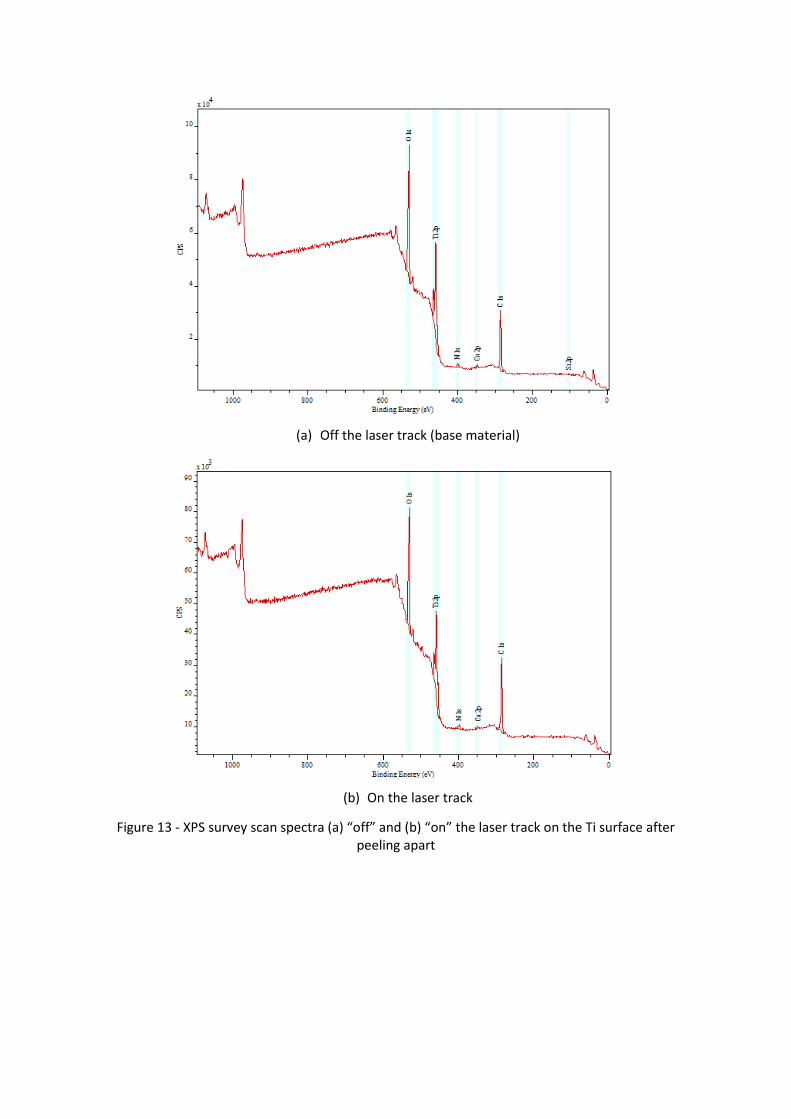
The joint surfaces were analysed by XPS to gain an insight into the nature of the surface chemistry at the locus of failure of the joint. The outermost surfaces “on” and “off” the laser track on the PET and Ti after peeling apart the hybrid joint (produced by the same parameter setting as with the Joint B) were analysed. The XPS survey and narrow scans on the laser-track of the PET surface are given in Fig. 11 and Fig. 12 respectively, with the corresponding data for the Ti surface given in Fig. 13 and Fig. 14. The elemental composition data are summarised in Table 7.
On and off the laser track, the composition data and the high resolution C 1s and O 1s spectra from the PET surface are in very good agreement with PET reference data [30], with the addition of small amounts of Si and N due to environmental contamination. The results from the PET surface on the laser track show very little difference to those away from the laser track, except for the presence of a small amount of Ti (in agreement with the SEM-EDX data) and some small differences in the low-level surface contamination species. The narrow scan C 1s and O 1s spectra showed no significant differences between “on” and “off” the laser-track on the PET surface, i.e. the exposed PET surface after peeling the joint apart was very similar to the PET from the untreated area.
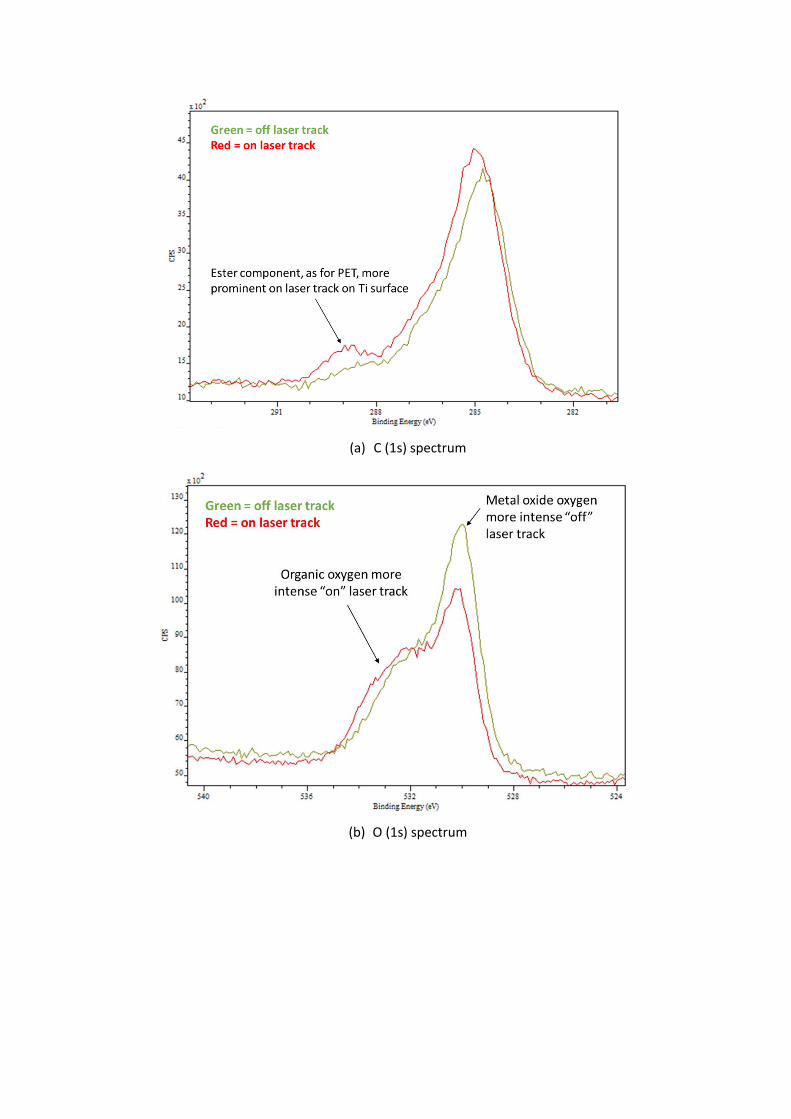
XPS data from the Ti surface showed (1) lower O and Ti and (2) higher C on the laser track area than away from this area. On the track, the C 1s spectrum looked rather like a low-resolution version of the PET spectrum, whereas away from the track the C 1s was similar to general hydrocarbon contamination often seen on air-exposed oxide surfaces and with the ester component relatively lower in intensity than on the track. Note that if Ti-C bonds had been present at the outer surface analysed, these would have been visible as a further component in the C 1s spectrum at approximately 282.0 eV binding energy, but were not detected here. The O 1s spectrum on the laser track showed a greater organic (carbon-bonded) component and a lower metal oxide component than the O 1s spectrum away from the track. The Ti 2p spectra showed a lower contribution to the overall intensity from the TiO2 component. The Ti 2p spectrum for “on” the laser track in Fig. 14(c) is shown curve fitted to 2p3/2 and 2p1/2 components corresponding to metallic Ti 2p3/2 at approximately 454 eV, non-specific TixOy (e.g. Ti2O3) bonding at approximately 456 eV, and TiO2 at 458.5 eV. These results indicate retention of some bonded PET on the Ti surface on peeling apart the laser-joined Ti-PET interface, and some partial removal of TiO2 from the Ti surface.
The fibre laser used in the experimentation has a Gaussian energy distribution (TEM00). The laser beam diameter is normally measured as the diameter of a circle containing 1/e2 or about 87 % of the intensity. The energy input inside the area of laser beam diameter is much higher than that outside the beam diameter, and this gives rise to two temperature regions: (1) a higher temperature region

within the diameter of the beam, and (2) a lower temperature region outside this diameter. PET pyrolysis is temperature dependent, with lower temperature producing liquid hydrocarbons and higher temperature producing more gaseous products [24]. This is consistent with evidence seen in the SEM data for the formation of bubbles around the laser-irradiated area. The SEM-EDX data show that the dark residue on the laser-irradiated area contained a high proportion of carbon and is therefore likely to be the residual coke of PET after undergoing intense decomposition at higher temperature. The light grey residue contained a higher proportion of Ti and is believed to be the product of chemical reactions between the liquid hydrocarbons and Ti at lower temperature. Further, small amount of oxygen (O) was identified from both the dark and light grey residues (in Fig. 9) which suggest the formation of titanium oxides between PET and Ti. The XPS data, with its higher surface sensitivity, shows that the locus of failure of the joint passed through relatively unmodified PET and that there was a residual oxide film on the Ti surface and also, most likely, on the exposed joint area too. Although the SEM-EDX clearly revealed the presence of high levels of carbon in the bond area, no evidence for Ti-C bonds was seen in the XPS. This is consistent with failure of the bond through unmodified PET, with the carbon-rich material seen by SEM-EDX remaining buried below the XPS information depth. Amorphous PET has a relatively low glass transition temperature of 67 oC, but no evidence for crystalline PET was seen on the PET side of the failed joint, also consistent with failure through relatively unmodified material.Taking all these data into account, a model of the bond and its failure is shown in Fig. 15.
4. Conclusions
The possibility of directly joining amorphous PET sheet to commercially pure Ti foil using CW fibre laser was investigated in this work. Taguchi parameter study, image analysis to quantify the contact area at the joint interface, mechanical shear test, surface morphology and elemental composition as well as chemical analysis on the PET and Ti surfaces were carried out. The following conclusions were reached:
1) In the Taguchi parameter study, laser power is found to be the most significant parameter to control the amount of non-contact area (NCA) or the area occupied by bubbles at the joint interface, followed by scanning speed and stand-off distance.
2) A high concentration of discoloration (>30 %) was found to be detrimental to the mechanical performance of the hybrid joints.
3) SEM-EDX, XRD and XPS data were used to construct a model for the structure of the bond and its locus of failure in which failure was through relatively unmodified PET, and strong bonds were found in a region containing pyrolysed PET, Ti and oxidation products.
4) Acknowledgments
The work described in this paper was supported by research grants from the Queen's University Belfast (Start-up Research Fund: D8201MAS), United Kingdom. Mr Blake Pattison was acknowledged for his efforts on the laser joining experiments and mechanical shear tests.

References
[1] A. Cenigaonaindia, F. Liebana, A. lamikiz, Z. Echegoyen, "Novel strategies for laser joining of polyamide and AISI 304," Physics Procedia, vol. 39, pp. 92-99, 2012.
[2] K. M. Becker, J.J. Whyte, Clinical Evaluation of Medical Devices: Principles and Case Studies, New Jersey: Humana Press, 2006.
[3] Y. Zhou, M.D. Breyen, Joining and assembly of medical materials and devices, Oxford: Woodhead, 2013.
[4] K.W. Jung, Y. Kawahito, M. Takahashi, S. Katayama, "laser direct joining of carbon fiber reinforced plastic to zinc-coated steel," Materials and Design, vol. 47, pp. 179-188, 2013.
[5] K.W. Jung, Y. Kawahito, S. Katayama, "Laser direct joining of carbon fibre reinforced plastic to stainless steel," Science and Technology of Welding and Joining, vol. 16, pp. 676-680, 2011.
[6] J. Cheon, S.J. na, "Relation of joint strength and polymer molecular structure in laser assisted metal and polymer joining," Science and Technology of Welding and Joining, vol. 19, pp. 631-637, 2014.
[7] A. Fortunato, G. Cuccolini, A. Ascari, L. Orazi, G. Campana, G. Tani , "Hybrid metal-plastic joining by means of laser," International journal of Material Forming, vol. 3, pp. 1131-1134, 2010.
[8] F. Yusof, M. Yukio, M. Yoshiharu, M.H.A. Shukor, "Effect of anodizing on pulsed Nd:YAG laser joining of polyethylene terephthalate (PET) and aluminium alloy (A5052)," Materials and Design, vol. 37, pp. 410-415, 2012.
[9] Y. Farazila, Y. Miyashita, W. Hua, Y. Mutoh, Y. Otsuka, "YAG laser spot welding of PET and metallic materials," Journal of Laser Micro/Naanoengineering, vol. 6, pp. 69-74, 2011.
[10] M. Wahba, Y. Kawahito, S. Katayama, "Laser direct joining of AZ91D thixomolded Mg alloy and amorphous polyethylene terephthalate," Journal of Materials Processing Technology , vol. 211, pp. 1166-1174, 2011.
[11] S. Katayama, Y. Kawahito, "Laser direct joining of metal and plastic," Scipta Materialia, vol. 59, pp. 1247-1250, 2008.
[12] W. Tillmann, A. Elrefaey, L. Wojarski, "Toward process optimization in laser welding of metal to polymer," Materials Science & Engineering Technology, vol. 41, pp. 879-883, 2010.
[13] X. Wang, X. Song, M. Jiang, P. Li, Y. Hu, K. Wang, H. Liu, "Modeling and optimization of laser transmission joining process between PET and 316L stainless steel using response surface methodology," Optics & Laser Technology, vol. 44, pp. 656-663, 2012.
[14] Y. Chen, Z. Guo, H. Lian, "Nd:YAG laser welding between Ti and PET using pulse shaping," Advanced Materials Reserach, Vols. 706-708, pp. 158-162, 2013.
[15] X. Wang, P. Li, Z. Xu, X. Song, H. Liu, "Laser transmission joint between PET and titanium for biomedical application," Journal of Materials Processing Technology, vol. 210, pp. 1767-1771, 2010.
[16] F.I. Hussein, E. Akman, B.G. Oztoprak, M. Gunes, O. Gundogdu, E. Kacar, K.I. Hajim, A. Demir, "Evaluation PMMA joining to stainless steel 304 using pulsed Nd:YAG laser," Optics & Laser Technology, vol. 49, pp. 143-152, 2013.
[17] A. Mian, G. Newaz, L. Vendra, N. Rahman, D.G. Georgiev, G. Auner, R. Witte, H. Herfurth, "Laser bonded microoints between titanium and polyimide for applications in medical implants," Journal of Materials Science, vol. 16, pp. 229-237, 2005.
[18] C. Oldani, A. Dominguez, "Titanium as a Biomaterial for implants," in In Recent Advances in Arthroplasty, Rijeka, InTech, 2012, pp. 149-162.
[19] B. Veleirinho, D.S. Coelho, P.F. Dias, M. Maraschin, R. Pinto, E. Cargnin-Ferreira, A. Peixoto, J.A. Souza, R.M. Ribeiro-do-Valle, J.A. Lopes-da-Silva, "Foregin Body Reaction Associated with PET and PET/Chitosan Electrospun Nanofibrous Abdominal Meshes," PLoS, vol. 9, no. 4, p. e95293, 2014.
[20] C.A. Schneider, W.S. Rasband, K.W. Eliceiri, "NIH Image to ImageJ: 25 years of image analysis," Nature Methods, vol. 9, pp. 671-675, 2012.
[21] N. M., G. H. and S. G., "Application of Taguchi method in the optimization of cutting parameters for surface roughness in turning," Materials and Design, vol. 28, p. 1379–1385, 2007.
[22] Y. W.H. and T. Y.S. , "Design optimization of cutting parameters for turning operations based on the Taguchi method," Journal of Materials Processing Technology, vol. 84 , p. 122–129, 1998.
[23] M. Dziecioi, J. Trzeszczynski, "Volatile products of poly(ethylene terephthalate) thermal degradation in nitrogen atmosphere," Journal of Applied Polymer Science, vol. 77, no. 9, pp. 1894-1901, 2000.
[24] I. Cit, A. Smag, T. Yumak, S. Ucar, Z. Misirlioglu, M. Canel, "Comparative pyrolysis of polyolefins (PP and LDPE) and PET," Polymer Bulletin, vol. 64, no. 8, pp. 817-834, 2010.
[25] S.M. FakhrHoseini, M. Dastanian, "Predicting Pyrolysis Products of PE, PP, and PET using NRTL Activity Coefficient Model," Journal of Chemistry, vol. 2013, pp. 1-5, 2013.
[26] K.F. Tamrin, Y. Nukman, S.S. Zakariyah, "Laser lap joining of dissimilar materials: a review of factors affecting joint strength," Materials and Manufacturing Processes, vol. 28, pp. 857-871, 2013.
[27] W.J. Suder & S.W. Willaims, “Investigation of the effects of basic laser material interaction parameters in laser welding ,” Journal of Laser Applications, vol 24, 032009, 2012
[28] M. Hashemzadeh, W. Suder, S. Williams, J. Powell, A.F.H. Kaplan, K.T. Voisey, “The application of specific point energy analysis to laser cutting with 1 µm laser radiation, vol. 56, pp 909-918,2014
[29] A.V. Rajan, S. Sampath and A.K. Shukla, “An in-situ carbon-grafted alkaline iron electrode for iron-based accumulators,” Energy & Environmental Science, vol 7 pp 1110-1116, 2014.
[30] G. Beamson and D. Briggs, “High resolution XPS of organic polymers: The Scienta ESCA300 database,” John Wiley & Sons, Chichester, 1992.
Table Captions
Table 1 – The laser process parameters in the Taguchi L9 experiment
Table 2 – The Taguchi L9 orthogonal array
Table 3 – Results for the non-contact area (NCA) and its corresponding calculated S/N ratio
Table 4 – Results of the ANOVA analysis
Table 5 – Summary of all measurement and calculation results from the Taguchi L9 experiment
Table 6 – Power density and interaction time for each processing condition in the Taguchi experiment Table 7 – XPS elemental composition data (atomic %) “on” and “off” the laser-track on the PET and Ti surfaces after peeling apart.
Figure Captions
Figure 1 – Schematic diagram to illustrate the laser joining process of PET (plastics) to Ti (metal)
Figure 2 – Schematic of joining rig assembly
Figure 3 – Geometry of the Ti-PET hybrid joint after laser joining
Figure 4 – 2D surface profile picture of the hybrid joint B (a) before and (b) after image analysis by
ImageJ
Figure 5 – Example (hybrid joint B) to show the ImageJ measurement on the discoloured zone (DZ)
Figure 6 – Means of the calculated S/N ratios for different laser parameters
Figure 7 – Optical micrographs showing the surface morphology for the hybrid joints A, B and C
Figure 8 – EDX mapping analysis on the PET surface (Joint B) after the mechanical shear test
Figure 9 – EDX line scan analysis across the plastics residue on the metal surface (Joint B) after the
mechanical shear test
Figure 10 – XRD data from area on and off the laser track area of the exposed PET surface after testing
Figure 11 – XPS survey scan spectrum on the laser-track on the PET surface after peeling apart
Figure 12 – XPS narrow scan spectra for C1s (top) and O1s (bottom) on the laser track on the PET
surface after peeling apart
Figure 13 – XPS survey scan spectra (a) “off” and (b) “on” the laser track on the Ti surface after
peeling apart
Figure 14 – XPS narrow scan spectra for (a) C 1s, (b) O 1s and (c) Ti 2p “off” and “on” the laser track on
the Ti surface after peeling apart
Figure 15 – Schematic diagram showing the hypothetical structure of the PET-Ti LTJ bond before and
after peeling apart.

Table 1 – The laser process parameters in the Taguchi L9 experiment
Laser Process Parameters Level 1 Level 2 Level 3
Laser Power (P) 40 W 50 W 60 W Scanning Speed (S) 15 mm/s 20 mm/s 25 mm/s Stand-off Distance (D) 15 mm
(13 mm away from the focused spot)
20 mm (18 mm away from the focused spot)
25 mm (23 mm away from the focused spot)
Table 2 – The Taguchi L9 orthogonal array
Experimental Trial
Laser Power (W)
Scanning Speed (mm/s)
Stand-off Distance (mm)
Label for the Hybrid Joint
1 1 1 1 A 2 1 2 2 B 3 1 3 3 C 4 2 1 2 D 5 2 2 3 E 6 2 3 1 F 7 3 1 3 G 8 3 2 1 H 9 3 3 2 I
Table 3 – Results for the non-contact area (NCA) and its corresponding calculated S/N ratio
Experimental Trial
Laser Power (W)
Scanning Speed (mm/s)
Stand-off Distance (mm)
Measured Non- Contact Area, NCA
(mm^2)
Calculated S/N Ratio
(Smaller- the-better)
1 40 5 15 45.74 -33.21
2 40 10 20 13.53 -22.64
3 40 15 25 6.57 -16.35
4 50 5 20 69.16 -36.80
5 50 10 25 24.05 -27.63
6 50 15 15 41.16 -32.29
7 60 5 25 58.18 -35.30
8 60 10 15 56.30 -35.01
9 60 15 20 53.16 -34.51
Table 4 – Results of the ANOVA analysis
Laser Parameters DF Seq SS Adj SS Adj MS F Percent Contribution, P
Laser Power (W) 2 192.325 192.325 96.163 21.08 50.63%
Scanning Speed (mm/s) 2 99.617 99.617 49.808 10.92 26.22%
Stand-off Distance (mm) 2 78.821 78.821 39.411 8.64 20.75%
Residual Error 2 9.125 9.125 4.562 2.40%
Total 8 379.888

Table 5 – Summary of all measurement and calculation results from the Taguchi L9 experiment
Hybrid Joints
by Taguchi
L9 Experiment
Measured Total Joint Area, TJA
(mm2)
measured directly
by ImageJ
Measured Non-
Contact Area, NCA
(mm2)
measured by laser profile-
meter and ImageJ
Measured Discoloured
Zone, DZ (mm2)
measured
directly by ImageJ
Calculated Contact Area, CA
(mm2)
calculated by eq. (2)
Calculated Clean
Zone, CZ (mm2)
calculated by eq. (3)
Calculated Concentration
of Discoloured Zone, CDZ
(%)
calculated by eq. (5)
Measured Load (N)
measured by tensile machine
Calculated Shear Stress (MPa)
calculated by eq. (4)
A 99.2 45.7 39.3 53.4 14.2 73.5% 33.6 0.6
B 46.6 13.5 7.0 33.1 26.1 21.0% 101.3 3.1
C 33.6 6.6 0.1 27.0 27.0 0.3% 87.6 3.2
D 131.9 69.2 20.6 62.7 42.1 32.8% 40.7 0.7
E 118.9 24.1 40.9 94.8 53.9 43.1% 119.3 1.3
F 103.0 41.2 43.2 61.9 18.7 69.8% 98.8 1.6
G 127.9 58.2 23.1 69.7 46.6 33.2% 137.3 2.0
H 115.1 56.3 21.8 58.8 37.0 37.0% 73.6 1.3
I 112.0 53.2 23.7 58.8 35.1 40.4% 136.5 2.3
Table 6 - Power density and interaction time for each processing condition in the Taguchi
experiment
Experimental
Trial
Laser Power
(W)
Scanning
Speed (mm/s)
Stand-off
Distance (mm)
Measured
Laser Spot
Diameter (mm)
Calculated
Power Density
(W/cm2)
Calculated
Interaction
Time (s)
1 40 5 15 0.7 10400 0.14
2 40 10 20 1.2 3540 0.12
3 40 15 25 1.6 1990 0.11
4 50 5 20 1.2 4420 0.24
5 50 10 25 1.6 2490 0.16
6 50 15 15 0.7 13000 0.05
7 60 5 25 1.6 2990 0.32
8 60 10 15 0.7 15600 0.07
9 60 15 20 1.2 5310 0.08
Table 7 – XPS elemental composition data (atomic %) “on” and “off” the laser-track on the PET and
Ti surfaces after peeling apart.
Element and line PET surface Ti surface
On laser track Off laser track On laser track Off laser track
Ti 2p 0.3 - 12.1 14.6
O 1s 30.8 30.1 40.0 42.4
C 1s 68.7 68.7 45.5 39.5
Si 2p 0.2 0.2 - 0.4
S 2p 0.1 - - -
N 1s - 1.1 2.0 2.6
Ca 2p - - 0.5 0.5

Figure 1 – Schematic diagram to illustrate the laser joining process of PET (plastics) to Ti (metal)

Figure 2 – Schematic of joining rig assembly
Figure 3 – Geometry of the Ti-PET hybrid joint after laser joining
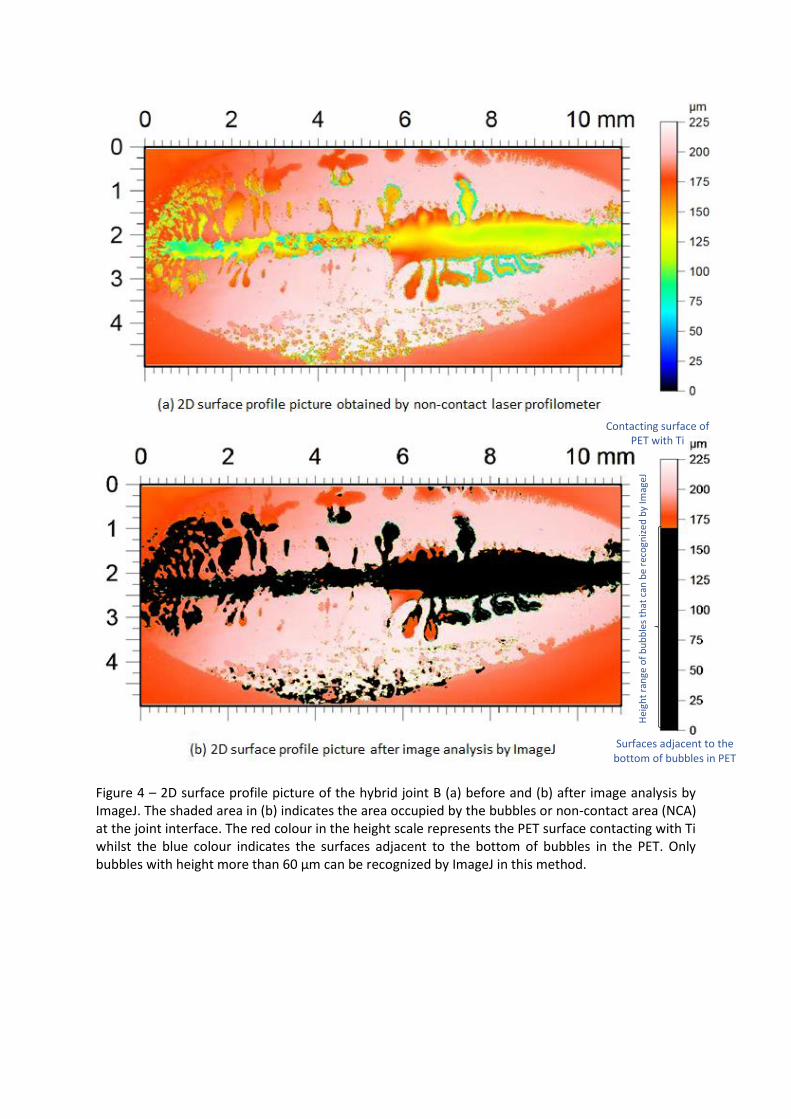
Figure 4 – 2D surface profile picture of the hybrid joint B (a) before and (b) after image analysis by ImageJ. The shaded area in (b) indicates the area occupied by the bubbles or non-contact area (NCA) at the joint interface. The red colour in the height scale represents the PET surface contacting with Ti whilst the blue colour indicates the surfaces adjacent to the bottom of bubbles in the PET. Only bubbles with height more than 60 µm can be recognized by ImageJ in this method.
Contacting surface of PET with Ti
Surfaces adjacent to the bottom of bubbles in PET

Figure 5 – Example (hybrid joint B) to show the ImageJ measurement on the discoloured zone (DZ). Different zones and areas are labelled in (a). The shaded area in (b) indicates the amount of DZ on the contacting surface of PET. The overlapping area between the non-contact area (NCA) and DZ is classified as NCA because there is no contact between the plastics and metal in that area.
Discoloured Zone (DZ)
Clean Zone (CZ)
Non-contact Area (NCA)
Total Joint Area (TJA)
Discoloured Zone (DZ)
Overlapping area between DZ and NCA

Figure 6 – Means of the calculated S/N ratios for different laser parameters. The highest point in each plot indicates the recommended level for obtaining the hybrid joints with less non-contact area
(NCA)
Figure 7 – Optical micrographs showing the surface morphology for the hybrid joints A, B and C
1mm 1mm 1mm
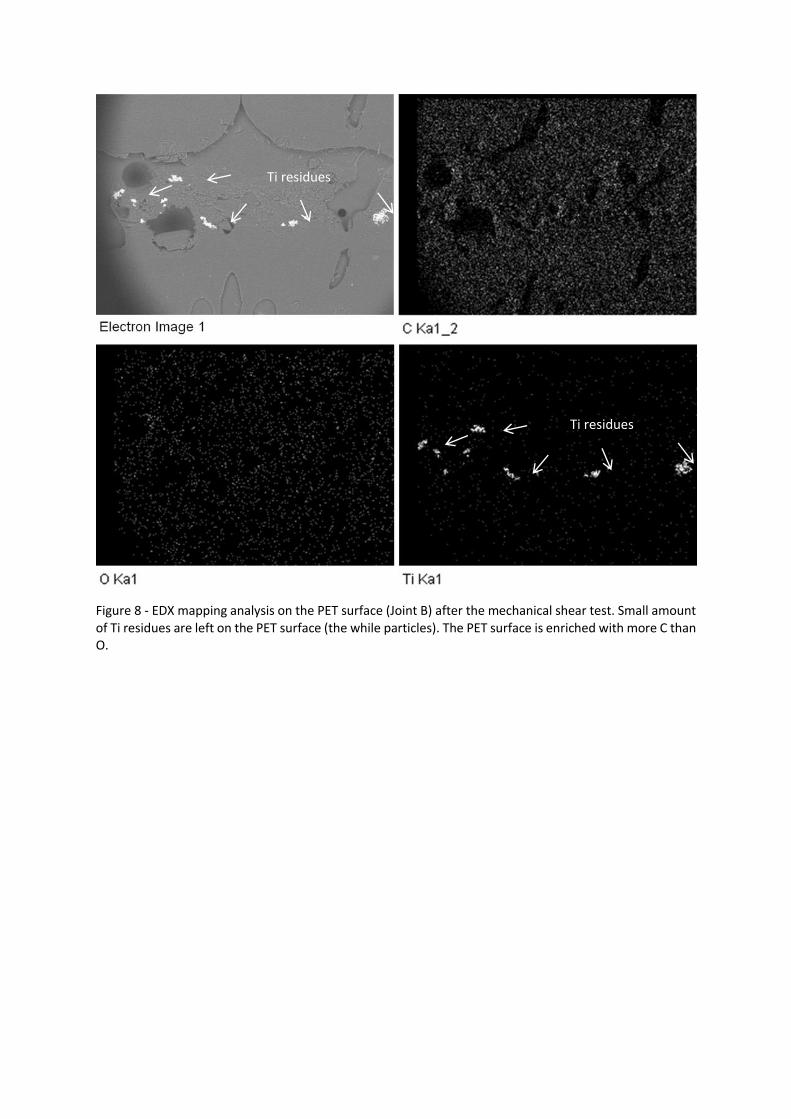
Figure 8 - EDX mapping analysis on the PET surface (Joint B) after the mechanical shear test. Small amount of Ti residues are left on the PET surface (the while particles). The PET surface is enriched with more C than O.
Ti residues
Ti residues

Figure 9 - EDX line scan analysis across the plastics residue on the metal surface (Joint B) after the mechanical shear test. The red, green and blue lines/shaded areas represent the carbon, oxygen and titanium contents on the metal surface respectively. The chemical compositions for the dark and light coloured residues were highlighted in the two dashed boxes: region 1 and 2. Higher amount of carbon and oxygen, and smaller amount of Ti are found from these two regions.
Region 1
Region 2
Region 1 Region 1 Region 1
Region 2 Region 2
Region 2
Red profile line: C content Green profile line: O content Blue profile line: Ti content

Figure 10 – XRD data from area on and off the laser track area of the exposed PET surface after testing.
Figure 11 – XPS survey scan spectrum on the laser-track on the PET surface after peeling apart

(a) C (1s) spectrum
(b) O (1s) spectrum
Figure 12 – XPS narrow scan spectra for C1s (top) and O1s (bottom) on the laser track on the PET surface after peeling apart
(a) Off the laser track (base material)
(b) On the laser track
Figure 13 - XPS survey scan spectra (a) “off” and (b) “on” the laser track on the Ti surface after peeling apart
(a) C (1s) spectrum
(b) O (1s) spectrum
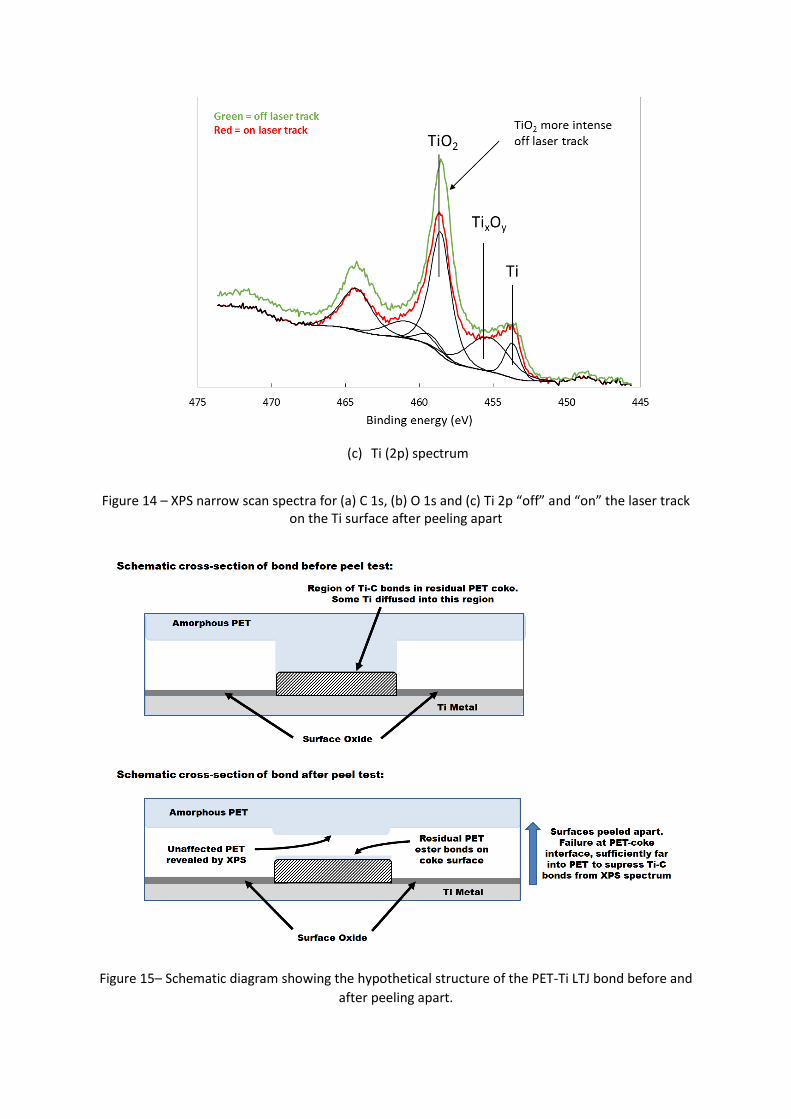
(c) Ti (2p) spectrum
Figure 14 – XPS narrow scan spectra for (a) C 1s, (b) O 1s and (c) Ti 2p “off” and “on” the laser track on the Ti surface after peeling apart
Figure 15– Schematic diagram showing the hypothetical structure of the PET-Ti LTJ bond before and
after peeling apart.
Copyright © 2022 FDOKUMEN