Combining Simulation and Virtualization through Dynamic Sampling
12
Combining Simulation and Virtualization through Dynamic Sampling Ayose Falc´ on Paolo Faraboschi Daniel Ortega Hewlett-Packard Laboratories Advanced Architecture Lab — Barcelona Research Office {ayose.falcon, paolo.faraboschi, daniel.ortega}@hp.com Abstract The high speed and faithfulness of state–of–the–art Vir- tual Machines (VMs) make them the ideal front-end for a system simulation framework. However, VMs only emulate the functional behavior and just provide the minimal tim- ing for the system to run correctly. In a simulation frame- work supporting the exploration of different configurations, a timing backend is still necessary to accurately determine the performance of the simulated target. As it has been extensively researched, sampling is an ex- cellent approach for fast timing simulation. However, ex- isting sampling mechanisms require capturing information for every instruction and memory access. Hence, coupling a standard sampling technique to a VM implies disabling most of the “tricks” used by a VM to accelerate execution, such as the caching and linking of dynamically compiled code. Without code caching, the performance of a VM is severely impacted. In this paper we present a novel dynamic sampling mech- anism that overcomes this problem and enables the use of VMs for timing simulation. By making use of the internal information collected by the VM during functional simula- tion, we can quickly assess important characteristics of the simulated applications (such as phase changes), and acti- vate or deactivate the timing simulation accordingly. This allows us to run unmodified OS and applications over em- ulated hardware at near-native speed, yet providing a way to insert timing measurements that yield a final accuracy similar to state–of–the–art sampling methods. 1. Introduction Simulators are widely used to assess the value of new proposals in Computer Architecture. Simulation allows re- searchers to create a virtual system in which new hardware components can be shaped, and architectural structures can SimNow and AMD Opteron are trademarks of Advanced Micro Devices, Inc. be combined to create new functional units, caches, or en- tire microprocessor systems. There are two components in a typical computer simu- lation: functional and timing simulation. Functional sim- ulation is necessary to verify correctness. It emulates the behavior of a real machine running a particular OS and models common devices like disks, video, or network inter- faces. Timing simulation is used to assess the performance. It models the operation latency of devices emulated by the functional simulator and assures that events generated by these devices are simulated in a correct time ordering. More recently, power simulation has also become im- portant, especially when analyzing datacenter-level energy costs. As with timing simulation, a functional simulation is in charge of providing events from CPU and devices, to which we can apply a power model to estimate the overall system consumption. Trace-driven simulators decrease total simulation time by reducing the functional simulation overhead. They em- ploy a functional simulator to execute the target application once, save a trace of interesting events, and then repeatedly use the stored event trace with different timing models to es- timate performance (or power). A severe limitation of trace- driven simulation is the impossibility to provide timing- dependent feedback to the application behavior. For this reason, trace-driven approaches that work for uniprocessor single-threaded application domain are less appropriate for complete system simulation. In many cases, the behavior of a system directly depends on the simulated time of the different events. For example, many multithreaded libraries use active wait loops because of the performance advan- tage in short waits. Network protocols may re-send packets depending on the congestion of the system. In these, and many others, scenarios feedback is fundamental for an ac- curate system simulation. Execution-driven simulators directly couple the execu- tion of a functional simulator with the timing models. How- ever, traditional execution-driven simulation is several or- ders of magnitude slower than native hardware execution, due to the overhead caused by applying timing simula-
-
Upload
independent -
Category
Documents
-
view
2 -
download
0
Transcript of Combining Simulation and Virtualization through Dynamic Sampling

Combining Simulation and Virtualization through Dynamic Sampling
Ayose Falcon Paolo Faraboschi Daniel Ortega
Hewlett-Packard LaboratoriesAdvanced Architecture Lab mdash Barcelona Research Officeayosefalcon paolofaraboschi danielortegahpcom
Abstract
The high speed and faithfulness of statendashofndashthendashart Vir-tual Machines (VMs) make them the ideal front-end for asystem simulation framework However VMs only emulatethe functional behavior and just provide the minimal tim-ing for the system to run correctly In a simulation frame-work supporting the exploration of different configurationsa timing backend is still necessary to accurately determinethe performance of the simulated target
As it has been extensively researched sampling is an ex-cellent approach for fast timing simulation However ex-isting sampling mechanisms require capturing informationfor every instruction and memory access Hence couplinga standard sampling technique to a VM implies disablingmost of the ldquotricksrdquo used by a VM to accelerate executionsuch as the caching and linking of dynamically compiledcode Without code caching the performance of a VM isseverely impacted
In this paper we present a novel dynamic sampling mech-anism that overcomes this problem and enables the use ofVMs for timing simulation By making use of the internalinformation collected by the VM during functional simula-tion we can quickly assess important characteristics of thesimulated applications (such as phase changes) and acti-vate or deactivate the timing simulation accordingly Thisallows us to run unmodified OS and applications over em-ulated hardware at near-native speed yet providing a wayto insert timing measurements that yield a final accuracysimilar to statendashofndashthendashart sampling methods
1 Introduction
Simulators are widely used to assess the value of newproposals in Computer Architecture Simulation allows re-searchers to create a virtual system in which new hardwarecomponents can be shaped and architectural structures can
SimNow and AMD Opteron are trademarks of Advanced Micro Devices Inc
be combined to create new functional units caches or en-tire microprocessor systems
There are two components in a typical computer simu-lation functional and timing simulationFunctional sim-ulation is necessary to verify correctness It emulates thebehavior of a real machine running a particular OS andmodels common devices like disks video or network inter-facesTiming simulationis used to assess the performanceIt models the operation latency of devices emulated by thefunctional simulator and assures that events generated bythese devices are simulated in a correct time ordering
More recently power simulation has also become im-portant especially when analyzing datacenter-level energycosts As with timing simulation a functional simulationis in charge of providing events from CPU and devices towhich we can apply a power model to estimate the overallsystem consumption
Trace-driven simulators decrease total simulation timeby reducing the functional simulation overhead They em-ploy a functional simulator to execute the target applicationonce save a trace of interesting events and then repeatedlyuse the stored event trace with different timing models to es-timate performance (or power) A severe limitation of trace-driven simulation is the impossibility to provide timing-dependent feedback to the application behavior For thisreason trace-driven approaches that work for uniprocessorsingle-threaded application domain are less appropriate forcomplete system simulation In many cases the behaviorof a system directly depends on the simulated time of thedifferent events For example many multithreaded librariesuse active wait loops because of the performance advan-tage in short waits Network protocols may re-send packetsdepending on the congestion of the system In these andmany others scenarios feedback is fundamental for an ac-curate system simulation
Execution-driven simulators directly couple the execu-tion of a functional simulator with the timing models How-ever traditional execution-driven simulation is severalor-ders of magnitude slower than native hardware executiondue to the overhead caused by applying timing simula-
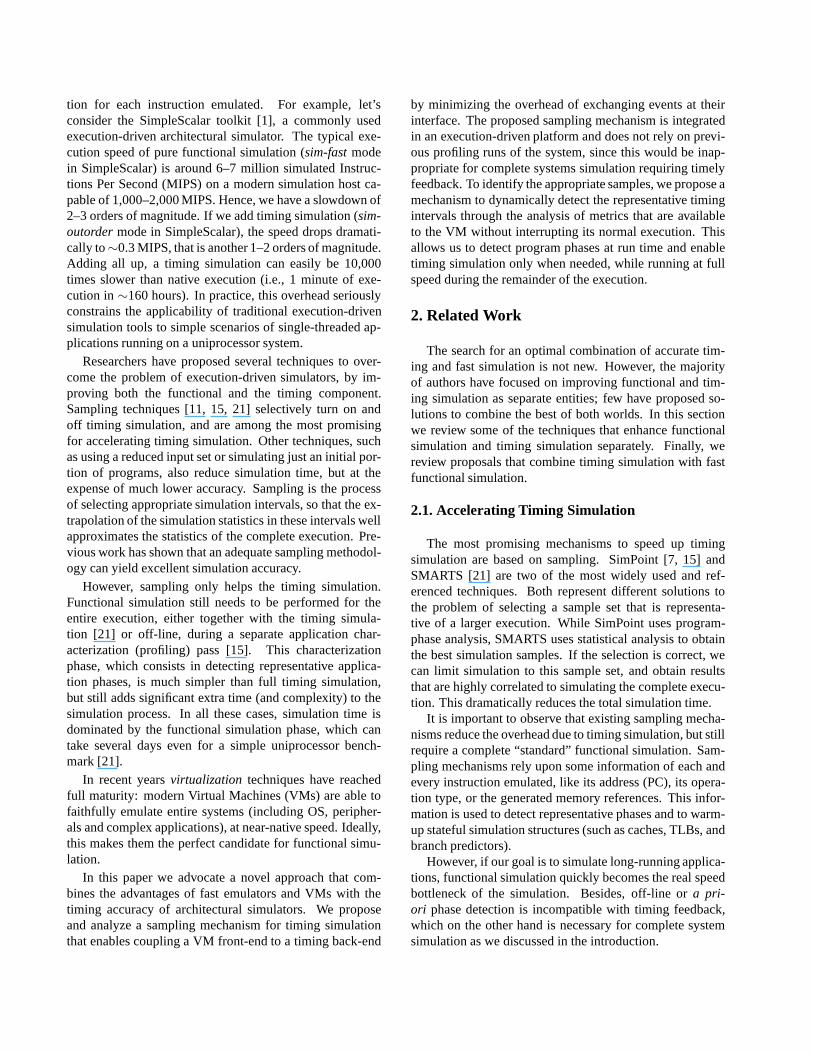
tion for each instruction emulated For example letrsquosconsider the SimpleScalar toolkit [1] a commonly usedexecution-driven architectural simulator The typical exe-cution speed of pure functional simulation (sim-fastmodein SimpleScalar) is around 6ndash7 million simulated Instruc-tions Per Second (MIPS) on a modern simulation host ca-pable of 1000ndash2000 MIPS Hence we have a slowdown of2ndash3 orders of magnitude If we add timing simulation (sim-outordermode in SimpleScalar) the speed drops dramati-cally tosim03 MIPS that is another 1ndash2 orders of magnitudeAdding all up a timing simulation can easily be 10000times slower than native execution (ie 1 minute of exe-cution insim160 hours) In practice this overhead seriouslyconstrains the applicability of traditional execution-drivensimulation tools to simple scenarios of single-threaded ap-plications running on a uniprocessor system
Researchers have proposed several techniques to over-come the problem of execution-driven simulators by im-proving both the functional and the timing componentSampling techniques [11 15 21] selectively turn on andoff timing simulation and are among the most promisingfor accelerating timing simulation Other techniques suchas using a reduced input set or simulating just an initial por-tion of programs also reduce simulation time but at theexpense of much lower accuracy Sampling is the processof selecting appropriate simulation intervals so that theex-trapolation of the simulation statistics in these intervals wellapproximates the statistics of the complete execution Pre-vious work has shown that an adequate sampling methodol-ogy can yield excellent simulation accuracy
However sampling only helps the timing simulationFunctional simulation still needs to be performed for theentire execution either together with the timing simula-tion [21] or off-line during a separate application char-acterization (profiling) pass [15] This characterizationphase which consists in detecting representative applica-tion phases is much simpler than full timing simulationbut still adds significant extra time (and complexity) to thesimulation process In all these cases simulation time isdominated by the functional simulation phase which cantake several days even for a simple uniprocessor bench-mark [21]
In recent yearsvirtualization techniques have reachedfull maturity modern Virtual Machines (VMs) are able tofaithfully emulate entire systems (including OS peripher-als and complex applications) at near-native speed Ideallythis makes them the perfect candidate for functional simu-lation
In this paper we advocate a novel approach that com-bines the advantages of fast emulators and VMs with thetiming accuracy of architectural simulators We proposeand analyze a sampling mechanism for timing simulationthat enables coupling a VM front-end to a timing back-end
by minimizing the overhead of exchanging events at theirinterface The proposed sampling mechanism is integratedin an execution-driven platform and does not rely on previ-ous profiling runs of the system since this would be inap-propriate for complete systems simulation requiring timelyfeedback To identify the appropriate samples we propose amechanism to dynamically detect the representative timingintervals through the analysis of metrics that are availableto the VM without interrupting its normal execution Thisallows us to detect program phases at run time and enabletiming simulation only when needed while running at fullspeed during the remainder of the execution
2 Related Work
The search for an optimal combination of accurate tim-ing and fast simulation is not new However the majorityof authors have focused on improving functional and tim-ing simulation as separate entities few have proposed so-lutions to combine the best of both worlds In this sectionwe review some of the techniques that enhance functionalsimulation and timing simulation separately Finally wereview proposals that combine timing simulation with fastfunctional simulation
21 Accelerating Timing Simulation
The most promising mechanisms to speed up timingsimulation are based on sampling SimPoint [7 15] andSMARTS [21] are two of the most widely used and ref-erenced techniques Both represent different solutions tothe problem of selecting a sample set that is representa-tive of a larger execution While SimPoint uses program-phase analysis SMARTS uses statistical analysis to obtainthe best simulation samples If the selection is correct wecan limit simulation to this sample set and obtain resultsthat are highly correlated to simulating the complete execu-tion This dramatically reduces the total simulation time
It is important to observe that existing sampling mecha-nisms reduce the overhead due to timing simulation but stillrequire a complete ldquostandardrdquo functional simulation Sam-pling mechanisms rely upon some information of each andevery instruction emulated like its address (PC) its opera-tion type or the generated memory references This infor-mation is used to detect representative phases and to warm-up stateful simulation structures (such as caches TLBs andbranch predictors)
However if our goal is to simulate long-running applica-tions functional simulation quickly becomes the real speedbottleneck of the simulation Besides off-line ora pri-ori phase detection is incompatible with timing feedbackwhich on the other hand is necessary for complete systemsimulation as we discussed in the introduction
ArchitecturalSimulators
(eg SimpleScalar
SMTsim)
103 ndash 105
Acc
urac
y
Full timing and (micro)arch details
InterpretedEmulators
(eg Bochs SIMICS)
Native12 ndash 152 ndash 1010 ndash 100
Fast Emulators
(eg QEMU SimNowtrade)
Virtual Machines
(eg VMware Virtual PC)
Speed (slowdown)
Full functional memory andsystem details simple timing
No system details no memory paths
Native virtualization direct execution
bull Accurate functionalitybull Minimal timing
bull Minimal functionalitybull Accurate timing
Figure 1 Accuracy vs Speed of some exist-ing simulation technologies
Architectural simulators like SimpleScalar [1] (and itsderivatives) SMTSim [17] or Simics [13] employ a verysimple technique for functional simulation They normallyemployinterpretedtechniques to fetch decode and executethe instructions of the target (simulated) system and trans-late their functionality into the host ISA The overhead ofthe interpreter loop is significant and is what primarily con-tributes to limit the functional speed of an architectural sim-ulator This adds a severe performance penalty in the globalsimulation process and minimizes the benefits obtained byimproving timing simulation
22 Accelerating Functional Simulation
Several approaches have been proposed to reduce thefunctional simulation overhead in simulators that use in-terpretation By periodically storing checkpoints of func-tional state of previous functional simulation some propos-als transform part of the execution-driven simulation intotrace-driven simulation [18 19] The overhead of functionalsimulation is effectively reduced but at the expense of cre-ating and storing checkpointing data What is worse is thatcheckpointing techniques as any other off-line techniquealso inhibits timing feedback
Virtualization techniques open new possibilities forspeeding up functional simulation Figure 1 shows how sev-eral virtualization emulators and VM technologies relate toone another with respect to timing accuracy and executionspeed Other taxonomies for VMs mdashaccording to severalcriteriamdash have been proposed [16 20] which are perfectlycompatible with the classification provided in this paper
Fast emulators and VMs make use of dynamic compi-lation techniques code caching and linking of code frag-ments in the code cache to accelerate performance at theexpense of system observability These techniques dynam-ically translate sequences of target instructions into func-
tionally equivalent sequences of instructions of the hostGenerated code can be optionally optimized to further im-prove its performance through the use of techniques suchas basic block chaining elimination of dead code relaxedcondition flags check and many others HPrsquos Dynamo sys-tem [2] is a precursor of many of these techniques and werefer the readers to it for a deeper analysis of dynamic com-pilation techniques Other available systems that we areaware that employ dynamic compilation techniques includeAMDrsquos SimNowTM [4] and QEMU [6]
To further improve on dynamic compilation techniquesVMs provide a total abstraction of the underlying physicalsystem A typical VM only interprets kernel mode codewhile user mode code is directly executed by the guest ma-chine (note that full virtualization requires the same ISAin the guest and the host) No modification is required inthe guest OS or application and they are unaware of thevirtualized environment so they execute on the VM just asthey would on a physical system Examples of systems thatsupport full virtualization are VMware [14] and thekqemumodule of QEMU [5]
Finallyparavirtualizationis a novel approach to achiev-ing high-performance virtualization on non-virtualizablehardware In paravirtualization the guest OS is ported toan idealized hardware layer which abstracts away all hard-ware interfaces Absent upcoming hardware in processorparavirtualization requires modifications in the guest OSsothat all sensitive operations (such as page table updates orDMA operations) are replaced by explicit calls into the vir-tualizer API Xen [3] is currently one of the most advancedparavirtualization layers
Regarding execution speed it is clear that interpretationof instructions is the slowest component of functional sim-ulation Dynamic compilation accelerates interpretationbyremoving the fetch-decode-translate overhead but compro-mises the observability of the system In other words ina VM it is much more difficult to extract the instruction-level (or memory-access level) information needed to feeda timing simulator Interrupting native execution in the codecache to extract statistics is a very expensive operation thatrequires two context switches and several hundred of cyclesof overhead so it unfeasible to do so at the granularity ofindividual instructions
23 Accelerating Both Functional and Timing
We are only aware of few simulation packages that at-tempt combining fast functional simulation and timing
PTLsim [23] combines timing simulation with directhost execution to speed up functional simulation in periodsin which timing is not activated During direct executionperiods instructions from the simulated program are exe-cuted using native instructions from the host system rather
than emulating the operation of each instruction PTLsimdoes not provide a methodology for fast timing simulationbut simply employs direct execution as a way to skip theinitialization part of a benchmark
PTLsimX [23] leverages Xen [3] in an attempt to simu-late complete systems The use of paravirtualization allowsthe simulator to run at the highest privilege level provid-ing a virtual processor to the target OS At this level boththe targetrsquos operating system and user level instructions aremodeled by the simulator and it can communicate with Xento provide IO when needed by the target OS PTLsimXdoes not however provide a methodology to combine fasttiming simulation
DirectSMARTS [8] combines SMARTS sampling withfast functional simulation It leverages thedirect exe-cution mode(emulation mode with binary translation) ofRSIM [10] to perform the warming of simulated structures(caches branch predictor) During emulation the tool col-lects a profile of cache accesses and branch outcomes Be-fore each simulation interval the collected profile is usedtowarm-up stateful simulated structures Although DirectS-MARTS is faster than regular SMARTS it still requirescollecting information during functional simulation Thisclearly limits further improvements and inhibits the use ofmore aggressive virtualization techniques
3 Combining VMs and Timing
In this section we describe the different parts of our sim-ulation environment as well as the benchmarks and param-eters used for calculating results
31 The Functional Simulator
We use AMDrsquos SimNowTM simulator [4] as the func-tional simulation component of our system The SimNowsimulator is a fast full-system emulator using dynamic com-pilation and caching techniques which supports bootingan unmodified OS and execute complex applications overit The SimNow simulator implements the x86 and x86-64 instruction sets including system devices and supportsunmodified execution of Windows or Linux targets Infull-speed mode the SimNow simulatorrsquos performance isaround 100ndash200 MIPS (ie approximately a 10x slowdownwith respect to native execution)
Our extensions enable AMDrsquos SimNow simulator toswitch between full-speed functional mode and sampled-mode In sampled-mode AMDrsquos SimNow simulator pro-duces a stream of events which we can feed to our timingmodules to produce the performance estimation Duringtiming simulation we can also feed timing information backto the SimNow software to affect the application behavior
a fundamental requirement for full-system modeling In ad-dition to CPU events the SimNow simulator also supportsgenerating IO events for peripherals such as block devicesor network interfaces
In this paper for the purpose of comparing to otherpublished mechanisms we have selected a simple testset (uniprocessor single-threaded SPEC benchmarks) dis-abled the timing feedback and limited the interface to gen-erate CPU events (instruction and memory) Although de-vice events and timing feedback would be necessary forcomplex system applications they have minimal effect onthe benchmark set we use in this paper
As we described before the cost of producing theseevents is significant In our measurements it causes a10xndash20x slowdown with respect to full speed so the use ofsampling is mandatory However with an appropriate sam-pling schedule we can reduce the event-generation over-head to that its effect is minimal to overall simulation time
32 The Timing Simulator
The SimNow simulatorrsquos functional mode subsumes afixed instruction per cycle (IPC) model In order to predictthe timing behaviour of the complex microarchitecture thatwe want to model we have to couple an external timingsimulator with AMDrsquos SimNow software
For this purpose in this paper we have adoptedPTLsim [23] as our timing simulator PTLsim is a sim-ulator for microarchitectures of x86 and x86-64 instruc-tion sets modeling a modern speculative out-of-order su-perscalar processor core its cache hierarchy and support-ing hardware As we are only interested in the microarchi-tecture simulation we have adopted the classic version ofPTLsim (with no SMTSMP model and no integration withXen hypervisor [22]) and have disabled its direct executionmode The resulting version of PTLsim is a normal timingsimulator which behaves similarly to existing microarchi-tecture simulators like SimpleScalar or SMTsim but witha more precise modeling of the internal x86x86-64 out-of-order core We have also modified PTLsimrsquos front-end tointerface directly with the SimNow simulator for the streamof instructions and data memory accesses
33 Simulation Parameters and Benchmarks
Table 1 gives the simulation parameters we use to con-figure PTLsim This configuration roughly corresponds to a3-issue machine with microarchitecture parameters similarto one of the cores of an AMD OpteronTM 280 processor
In our experiments we simulate the whole SPECCPU2000 benchmark suite using the reference inputBenchmarks are simulated until completion or until theyreach 240 billion instructions whatever occurs first Table 2
FetchIssueRetire Width 3 instructionsBranch Mispred Penalty 9 processor cyclesFetch Queue Size 18 instructionsInstruction window size 192 instructionsLoadStore buffer sizes 48 load 32 storeFunctional units 4 int 2 mem 4 fpBranch Prediction 16K-entry gshare 32K-entry
BTB 16-entry RASL1 Instruction Cache 64KB 2-way 64B line sizeL1 Data Cache 64KB 2-way 64B line sizeL2 Unified Cache 1MB 4-way 128B line sizeL2 Unified Cache Hit Lat 16 processor cyclesL1 Instruction TLB 40 entries full-associativeL1 Data TLB 40 entries full-associativeL2 Unified TLB 512 entries 4-wayTLB pagesize 4KBMemory Latency 190 processor cycles
Table 1 Timing simulator parameters
shows the reference input used (2nd column) and the num-ber of instructions executed per benchmark (3rd column)
The SimNow simulator guest runs a 64-bit Ubuntu Linuxwith kernel 2615 The simulation host is a farm of HP Pro-liant BL25p server blades with two 26GHz AMD Opteronprocessors running 64-bit Debian Linux The SPEC bench-marks have been compiled directly in the simulator VMwith gccg77 version 40 with lsquondashO3rsquo optimization levelThe simulated execution of the benchmarks is at maximum(guest) OS priority to minimize the impact of other sys-tem processes The simulation results are deterministic andreproducible In order to evaluate just the execution ofeach SPEC benchmark we restore a snapshot of the VMtaken when the machine is idle (except for standard OShousekeeping tasks) and directly invoke the execution of thebenchmark from a Linux shell The timing simulation be-gins just after the execution command is typed in the OSconsole
To simulate SimPoint we interface with AMDrsquos SimNowsoftware to collect a profile of basic block frequency (Ba-sic Block Vectors [15]) This profile is then used by theSimPoint 32 tool [7] to calculate the best simulation pointsof each SPEC benchmark Following the indications byHamerly et al [9] we have chosen a configuration for Sim-Point aimed at reducing accuracy error while maintaininga high speed 300 clusters of 1M instructions each Thelast column in Table 2 shows the number of simpoints perbenchmark as calculated by SimPoint 32 Notice how theresulting number of simpoints varies from benchmark tobenchmark depending on the variability of its basic blockfrequency For a maximum of 300 clusters benchmarkshave an average of 1246 simpoints
For SMARTS we have used the configuration reportedby Wunderlich et al [21] which assumes that each func-
SPEC Ref Instruc SimPointsbenchmark input (billions) K=300
gzip graphic 70 131vpr place 93 89gcc 166i 29 166mcf inpin 48 86crafty craftyin 141 123parser refin 240 153eon cook 73 110perlbmk diffmail 32 181gap refin 195 120vortex lendian1raw 112 91bzip2 source 85 113twolf refin 240 132wupwise wupwisein 240 28swim swimin 226 135mgrid mgridin 240 124applu appluin 240 128mesa mesain 240 81galgel galgelin 240 134art c756helin 56 169equake inpin 112 168facerec refin 240 147ammp ammp-refin 240 153lucas lucas2in 240 44fma3d fma3din 240 104sixtrack fort3 240 235apsi apsiin 240 94
Table 2 Benchmark characteristics
tional warming interval is 97K instructions in length fol-lowed by a detailed warming of 2K instructions and a fulldetailed simulation of 1K instructions This configurationproduces the best accuracy results for the SPEC benchmarksuite
For SimPoint and Dynamic Sampling each simulationinterval is preceded by a warming period of 1 million in-structions
4 Dynamic Sampling
In the process of emulating a complete system a VMperforms many different tasks and keeps track of severalstatistics These statistics not only serve as a debugging aidfor the VM developers but can also be used as an aid tothe emulation itself because they highly correlate with therun-time behavior of the emulated system
Note that in the dynamic compilation domain this prop-erty has been observed and exploited before For exam-ple HPrsquos Dynamo [2] used its fragment cache (akacodecache or translation cache) hit rate as a metric to detectphase changes in the emulated code A higher miss rate oc-curs when the emulated code changes and Dynamo usedthis heuristic to force a fragment cache flush Flushing
whenever this happened proved to be much more efficientthan a fine grain management of the code cache employingcomplex replacement policies
Our dynamic sampling mechanism stands on similarprinciples but with another objective We are not tryingto improve functional simulation or dynamically optimizecode but rather our goal is to determine representative sam-ples of emulated guest code to speed up timing simulationwhile maintaining high accuracy
41 Using Virtualization Statistics to Perform Dy-namic Sampling
AMDrsquos SimNow simulator maintains a series of inter-nal statistics collected during the emulation of the systemThese statistics measure elements of the emulated system aswell as the behavior of its internal structures The statisticsrelated to the characteristics of the emulated code are sim-ilar to those collected by microprocessors hardware coun-ters For example the SimNow simulator maintains thenumber of executed instructions memory accesses excep-tions bytes read or written to or from a device This data isinherent to the emulated software and at the time is also aclear indicator of the behavior of the running applicationsThe correlation of changes in code locality with overall per-formance is a property that other researchers have alreadyestablished by running experiments along similar lines ofreasoning [12]
In addition similar to what Dynamo does with its codecache the SimNow simulator also keeps track of statisticsof its internal structures such as the translation cache andthe software TLB (necessary for efficient implementation ofemulated virtual memory) Intuitively one can imagine thatthis second class of statistics could also be useful to detectphase changes of the emulated code Our results show thatthis is indeed the case
Among the internal statistics of our functional simula-tor in this paper we have chosen three categories in orderto show the validity of our dynamic sampling These cate-gories are the following
bull Code cache invalidations Every time some piece ofcode is evicted from the translation cache a counteris incremented A high number of invalidations in ashort period of time indicates a significant change inthe code that is being emulated such as a new pro-gram being executed or a major change of phase in therunning program
bull Code exceptions Software exceptions which includesystem calls virtual memory page misses and manymore are good indicators of a change in the behaviourof the emulated code
Dynamic Instructions (M)
IPCExceptions
Figure 2 Example of correlation betweenVM internal statistic and application perfor-mance
bull IO operations AMDrsquos SimNow simulator like anyother system VM has to emulate the access to all thedevices of the virtual environment This metric detectstransfers of data between the CPU and any of the sur-rounding devices (eg disk video card or networkinterface) Usually applications write data to deviceswhen they have finished a particular task (end of exe-cution phase) and get new data from them at the begin-ning of a new task (start of a new phase)
Figure 2 shows an example of the correlation that existsbetween an internal VM statistic and the performance of anapplication The graph shows the evolution of the IPC (in-structions per cycles) along the execution of the first 2 bil-lion instructions of the benchmarkperlbmk Each sampleor x-axis point corresponds to 1 million simulated instruc-tions and was collected over a full-timing simulation withour modified PTLsim The graph also shows the values ofone of the internal VM metrics the number of code excep-tions in the same intervals We can see that changes in thenumber of exceptions caused by the emulated code are cor-related with changes in the IPC of the application Duringthe initialization phase (leftmost fraction of the graph) weobserve several phase changes which translate into manypeaks in the number of exceptions Along the execution ofthe benchmark every major change in the behavior of thebenchmark implies a change in the measured IPC and alsoa change in the number of exceptions observed While VMstatistics are not as ldquofine-grainedrdquo as the micro-architecturalsimulation of the CPU we believe that they can still be usedeffectively to dynamically detect changes in the applicationWe will show later a methodology to use these metrics toperform dynamic sampling
42 Methodology
In order to better characterize Dynamic Sampling weanalyzed the impact that different parameters have to ouralgorithm as described in Algorithm 1 The parameterswe analyze are the variable to monitor (var ) and the phasechange sensitivity (S) The variable to monitor is one of theinternal statistics available in the VM The sensitivity indi-cates the minimum first-derivative threshold of the moni-tored variable that triggers a phase change
Dynamic Sampling employs a third parameter(max func ) that allows us to control the generationof timing samples max func indicates the maximumnumber of consecutive intervals without timing When thishappens the algorithm forces a measurement of time inthe next interval which lets assure a minimum number oftiming intervals regardless the dynamic behaviour of thesampling
The control logic of our algorithm inspects the moni-tored variables at the end of each interval Whenever therelative change between successive measurements is largerthan the sensitivity it activates full timing simulation for thenext interval During this full timing simulation interval theVM generates all necessary events for the PTLsim module(which cause it to run significantly slower) At the end ofthis simulation interval timing is deactivated and a newfast functional simulation phase begins To compute the cu-
Algorithm 1 Dynamic Sampling algorithmData var = VM statistic to monitorData S = SensitivityData max func = Max consecutive functional intervals
Data num func = consecutive functional intervalsData timing = Calculate timing
Settiming = false
Main simulation loop repeat
if (timing = false) thenFast functional simulation of this interval
elseSimulate this interval with timingSettiming = falseSetnum func = 0
if (∆var gt S) thenSettiming = true
elseSetnum func ++if (num func = max func) then
Settiming = trueelse
Settiming = false
until end of simulation
mulative IPC we weight the average IPC of the last timingphase with the duration of the current functional simulationphasea la SimPoint This process is iterated until the endof the simulation
43 Dynamic Sampling vs Conventional Sampling
Figure 3 shows an overview of how SMARTS SimPointand Dynamic Sampling determine the simulation samplesof an application
SMARTS (Figure 3a) employs systematic samplingIt makes use of statistical analysis in order to determinethe amount of instructions that need to be simulated inthe desired benchmark (number of samples and length ofsamples) As simulation samples in SMARTS are rathersmall (sim1000 instructions) it is crucial for this mechanismto keep micro-architectural structures such as caches andbranch predictors warmed-up all the time For this reasonthey perform a functional warming between sampling unitsIn our environment this means forcing the VM to produceevents all the time preventing it from running at full speed
The situation is quite similar with SimPoint (Figure 3b)SimPoint runs a full profile of benchmarks to collect Ba-sic Block Vectors [15] that are later processed using clus-tering and distance algorithms to determine the simulationpoints Figure 3b shows the IPC distribution of the execu-tion of swim with its reference input In the figure differ-ent colors visually shade the different phases and we man-ually associate them with the potential simulation pointsthat SimPoint could decide based on the profile analysis1The profiling phase of SimPoint imposes a severe overheadfor VMs since it requires a pre-execution of the completebenchmark Moreover as any other kind of profile its ldquoac-curacyrdquo is impacted when input data for the benchmarkchanges or when it is hard (or impossible) to find a rep-resentative training set
Dynamic Sampling (Figure 3c) eliminates these draw-backs by determining at emulation time when to sampleWe do not require any preprocessing ora priori knowl-edge of the characteristics of the application being simu-lated Our sampler monitors some of the internal statisticsof the VM and according to pre-established heuristics de-termines when an application is changing to a new phaseWhen the monitored variable exceeds the sensitivity thresh-old the sampler activates the timing simulator for a certainnumber of instructions in order to collect a performancemeasurement of this new phase of the application Thelower the sensitivity threshold the more the number of tim-ing samples When the timing sample terminates the sam-pler instructs the VM to stop the generation of events and
1Although this example represents a real execution simulation pointshave been artificially placed to explain SimPointrsquos profiling mechanismbut do not come from a real SimPoint profile
Functional Warming- functional simulation + cache amp branch predictor warming
Detailed Warming- microarchitectural state is updated but no timing is counted
Sampling Unit- complete functional and timing simulation 13
a Phases of SMARTS systematic sampling b SimPoint cluster ing $amp())+amp-)-0+amp 123452678
c Dynamic Sampling
Figure 3 Schemes of SMARTS SimPoint and Dynamic Sampling
return to its full speed execution mode until the next phasechange is detected
Unlike SimPoint we do not need a profile for each in-put data set since each simulation determines its own rep-resentative samples We have empirically observed that inmany cases our dynamic selection of samples is very simi-lar to what SimPoint statically selects which improves ourconfidence of the validity of our choice of monitored VMstatistics We also believe that our mechanism better inte-grates in a full system simulation setting while it is goingtobe much harder for SimPoint to determine the Basic BlockVector distribution of a complete system
Figure 4 shows an example of the correlation betweensimulation points as calculated by SimPoint and simulationpoints calculated by our Dynamic Sampling This graph isan extension of the graph shown before in Figure 2 whichshows how IPC and number of exceptions change during theexecution of benchmarkperlbmk Vertical dotted lines in-dicate six simulation points as calculated by SimPoint 32software from a real profile (labeledSP1 SP6) Thegraph also shows the six different phases discovered by Dy-namic Sampling (stars labeledP1 P6) by using thenumber of exceptions generated by the emulated softwareas the internal VM variable to monitor Note that dynamicdiscovered phases begins when there is an important changein the monitored variable
As we can see there is a strong correlation between thephases detected by SimPoint and the phases detected dy-namically by our mechanism Dynamic Sampling dividesthis execution fragment into six phases which matchesSimPointrsquos selection which also identifies a simulationpoint from each of these phases (PN asymp SPN )
The main difference between SimPoint and DynamicSampling is in the selection of the simulation point insideeach phase SimPoint not only determines the programphases but its offline profiling also allows determining andselecting the most representative interval within a phaseDynamic Sampling is not able to detect when exactly tostart measuring after a phase change and its only option isto start sampling it right away (ie at the beginning of thephase) So we simply take one sample from the beginningand run functionally until the next phase is detected
Dynamic Instructions (M)
IPC Exceptions
SP1 SP2 SP3 SP4 SP5 SP6
P1
P2
P3P4
P5P6
Figure 4 Example of correlation betweensimulation phases detected by SimPoint andby Dynamic Sampling
5 Results
This section provides simulation results We first surveyour simulation results with a comparison between the ac-curacy and speed of Dynamic Sampling compared to othermechanisms Then we provide an analysis of detailed sim-ulation results of accuracy and speed as well as results perbenchmark
For Dynamic Sampling we use the three monitoredstatistics described in Section 41 which will be denotedby CPU(for cache code invalidations)EXC(for code ex-ceptions) andIO (for IO operations) Our sampling al-gorithm uses sensitivity values of 100 300 and 500interval lengths of 1M 10M and 100M instructions and amaximum number of functional intervals of 10 andinfin (nolimit)
51 Accuracy vs Speed Results
Figure 5 shows a summary description of the speed vsaccuracy tradeoffs of the proposed Dynamic Sampling ap-proach and how it compares with conventional samplingtechniques In thex axis we plot the accuracy error vs whatwe obtain in a full-timing run (smaller is better) In the log-arithmicy axis we plot the simulation execution speedup vsthe full-timing run (larger is better) Each point representsthe accuracy error and speed of a given experiment all rel-ative to a full timing run (speed=1 accuracy error=0) Thegraph shows four squared points taken as baseline full tim-ing SMARTS and SimPoint with and without consideringprofiling and clustering time Circular points are some in-teresting results of Dynamic Sampling with various config-uration parameters The terminology used for these pointsis ldquoAA-BB-CC-DDrdquo whereAA is the monitored variableBB is the sensitivity valueCCis the interval length andDDis the maximum number of consecutive functional intervals
The dotted line shows thePareto optimality curvehigh-lighting the ldquooptimalrdquo points of the explored space A pointin the figure is considered Pareto optimal if there is no otherpoint that performs at least as well on one criterion (accu-racy error or simulation speedup) and strictly better on theother criterion
The point labeled ldquoSMARTSrdquo is a standard SMARTSrun with an error of only 05 and a small speedup of74x Here we can see how despite its extraordinary accu-racy SMARTS has to pay the cost of continuous functionalwarming as we described before SMARTS forces AMDrsquosSimNow simulator to deliver events at every instructionAs we already observed this slows down the simulatorby more than an order of magnitude The point labeledldquoSimPoint rdquo is a run of the standard SimPoint with simu-lation points calculated by off-line profiling (shown in Ta-ble 2) With a speedup of 422x SimPoint is the fastest sam-
Full timing
CPU-300-100M-10[04 85x]
SMARTS[05 74x]
CPU-300-1M-100[03 43x]
EXC-300-1M-10[39 43x]
IO-100-1M-9[19 309x]
SimPoint + prof[17 95x]
SimPoint[17 422x]
EXC-500-10M-10[67 91x]
CPU-300-1M-9[11 158x]
1
10
100
1000
0 1 2 3 4 5 6 7Accuracy Error (vs full timing)
Sim
ulat
ion
Spe
edup
(vs
ful
l tim
ing)
Figure 5 Accuracy vs Speed results
pling technique However as we pointed out previouslySimPoint is really not applicable to system-level simulationbecause of its need of a separate profiling pass and its im-possibility to provide timing feedback If we also add theoverhead of a profiling run (point ldquoSimPoint+prof rdquo)the speed advantage drops at the same level of SMARTS(95x)
Note that both SMARTS and SimPoint are in (or veryclose to) the Pareto optimality curve which implies thatthey provide two very good solutions for trading accuracyvs speed
The points marked as circles are some of the resultsof the various Dynamic Sampling experiments The fourpoints in the left part of the graph are particularly interest-ing These reach accuracy errors below 2 and as little as03 (in ldquoCPU-300-1M-100 rdquo) The difference betweenthese points is in the speedup they obtain ranging from85x (similar to SMARTS) to an impressive 309x An in-termediate point with a very good accuracyspeed tradeoffis ldquoCPU-300-1M- infinrdquo with an accuracy error of 11 anda speedup of 158x
Note however that not all Dynamic Sampling heuris-tics are equally good For example points that useEXCasmonitored variable are clearly inferior to the rest (and thesame is true for other configurations we omitted from thegraph for clarity) Hence it is very important to identify theright variable(s) to monitor and their sensitivity for phasedetection results show that there is a big payoff if we cansuccessfully do so
52 Detailed Accuracy Results
Figure 6 shows the IPC results for our simulated sce-narios averaged over all benchmarks The first bar repre-sents full timing simulation The next two bars correspondto SMARTS and SimPoint The remaining bars show dif-
12
2
24
251927
57
04
11
2211
28
1705
060
065
070
075
080
085
090
095
100
Ful
l tim
ing
SM
AR
TS
Sim
Poi
nt
1M-1
0
1M-
10
M-1
0
10M
-
10
0M-1
0
100M
-
1M
-10
1M-
10
M-1
0
10M
-
10
0M-1
0
100M
-
Timing Policy
IPC
CPU-300 IO-100
Figure 6 IPC results Numbers indicate accu-racy error () over full timing
ferent results of Dynamic Sampling a first set withCPUasmonitored variable and a sensitivity of 300 and a secondset withIO as variable and 100 as sensitivity For thesesets we combine interval lengths of 1M 10M and 100Mwith maximum number of functional intervals of 10 andinfin(no limit) Numbers on top of each bar show the accuracyerror () compared to the baseline that is full timing
SMARTS provides an IPC error of 05 over all bench-marks while SimPoint provides an IPC error of 17 Dy-namic Sampling has a wider range of results Some con-figurations such asCPU-300-100M-10 have as low as04 while others likeCPU-300-1M- infin go up to 24 Ingeneral a small interval length of 1M instructions providesgood IPC results for almost every monitored variable andsensitivity value When longer interval lengths are used itis very important to limit the maximum number of consec-utive functional intervals Using a longer interval impliesthat small changes in a monitored variable are less notice-able and so the algorithm activates timing less frequentlyWe also empirically set a maximum numbers of consecu-tive functional intervals (max func = 10) to ensure thata minimum number of measurement points is always takenThis provides a better timing characterization of the bench-mark translating into a much higher accuracy
Figure 8 shows IPC results per individual benchmarksResults are provided for full timing SMARTS SimPointand Dynamic Sampling withCPU-300-1M- infin As shownbefore in Figure 5 this configuration provides very goodresults for both accuracy and speed
Overall SMARTS provides the best accuracy results for16 out of the 26 SPEC CPU200 benchmarks with an ac-curacy error of only 01 inmcf or 022 inwupwise On the contrary it provides the worst results forcrafty with an accuracy error of 8 SimPoint provides the best
46
9
326
14
309
7522
85
84
105
158
795
422
74
1E+00
1E+01
1E+02
1E+03
1E+04
1E+05
1E+06
1E+07
1E+08
Ful
l tim
ing
SM
AR
TS
Sim
Poi
nt
Sim
Poi
nt +
prof
1M-1
0
1M-
10M
-10
10M
-
100M
-10
100M
-
1M-1
0
1M-
10M
-10
10M
-
100M
-10
100M
-
Timing Policy
Sim
ulat
ion
Tim
e (s
econ
ds)
CPU-300 IO-100
Figure 7 Simulation time results ( y axis islogarithmic) Numbers indicate speedup overfull timing
accuracy results for 9 out of the 26 benchmarks with anaccuracy error of only 037 inperlbmk and 048 ingcc However SimPoint is the worst technique forgapandammp with accuracy errors over 20
Dynamic Sampling provides the best accuracy resultsonly in two benchmarksvpr (036) and crafty(09) However the results for the rest of benchmarksare quite consistent and only exceed the 10 boundary forapplu andart
53 Detailed Speed Results
Figure 7 shows the simulation time (in seconds) of thedifferent simulated configurations Numbers shown overthe bars indicate the speedup over the baseline (full timing)
As expected SMARTS speedup is rather limited Theneed for continuous functional sampling constrains its po-tential in VM environments SimPoint on the other handprovides very fast simulation time On average simulationswith SimPoint execute around 7 of the total instructionsof the benchmark which translates in an impressive 422xspeedup
However SimPoint simulation time does not account forthe time required to calculate the profile of basic blocks andthe execution of the SimPoint 32 tool itself The fourthbar in Figure 7 shows the complete simulation time to per-form a SimPoint simulation (including determination of Ba-sic Block Vectors and calculation of simulation points andweights) The need for SimPoint to perform a full simula-tion of the benchmark requires the VM to generate eventsand limits its potential speed The total simulation time ofSimPoint increases by two orders of magnitude
Finally Figure 7 also shows simulation time of Dy-
0002040608101214161820
gzip
vpr
gcc
mcf
craf
ty
pars
er
eon
perlb
mk
gap
vort
ex
bzip
2
twol
f
wup
wis
e
swim
mgr
id
appl
u
mes
a
galg
el art
equa
ke
face
rec
amm
p
luca
s
fma3
d
sixt
rack
apsi
IPC
Full Timing SMARTS SimPoint CPU-300-1M-lt
Figure 8 IPC results per benchmark
1E+00
1E+01
1E+02
1E+03
1E+04
1E+05
1E+06
1E+07
gzip
vpr
gcc
mcf
craf
ty
pars
er
eon
perlb
mk
gap
vort
ex
bzip
2
twol
f
wup
wis
e
swim
mgr
id
appl
u
mes
a
galg
el art
equa
ke
face
rec
amm
p
luca
s
fma3
d
sixt
rack
apsi
Sim
ulat
ion
Tim
e (s
econ
ds) Full Timing SMARTS SimPoint SimPoint +prof CPU-300-1M-=
Figure 9 Simulation time per benchmark ( y axis is logarithmic)
namic Sampling The best speedup results are obtainedwith small intervals and no limits to functional simula-tion (max func = infin) On the contrary larger intervalsand limits to functional simulation lengths cause simula-tion speed to decrease at the same level of SMARTS andSimPoint+prof Our best configurations are able to providea simulation speed similar to that provided by SimPointwithout requiring any previous static analysis
Figure 9 provides simulation time per benchmark Onaverage a SPEC CPU2000 benchmark with a singleref in-put takes 6 days to be simulated with full timing in oursimulation environment with a maximum of 14 days forparser and a minimum of 23 hours forgcc SMARTSreduces simulation time required by SPEC CPU2000 to anaverage of 20 hours per benchmark SimPoint further re-duces simulation time to only 21 minutes per benchmarkon average Simulation time in SimPoint is directly pro-portional to the number of simulation points established perbenchmark For examplewupwise only has 28 simpointsand hence gets simulated in 55 minutes whilesixtrackhas 235 simpoints and gets simulated in 35 minutes
The simulation time of Dynamic Sampling also dependson the particular benchmark since the sampling selectionvaries according to the different phases dynamically de-tected Overall the simulation time of Dynamic Samplingis equivalent to that obtained with SimPoint without con-sidering its profiling time (except for few benchmarks mdashparser wupwise facerec lucas mdash) and clearlybetter than SMARTS and Simpoint+prof for every bench-mark Thus with Dynamic Samplingperlbmk is simu-lated in 67 minutes (with a 49 of accuracy error) whileparser takes 98 hours (with a 74 of accuracy error)
6 Conclusions
We believe that our approach points to a promising direc-tion for next-generation simulators In the upcoming era ofmultiple cores and ubiquitous parallelism we have to up-grade our tools and methodology so that they may be ap-plied to a complex system environment where the CPU isnothing more than a component In a complex system be-ing able to characterize the full computing environments
including OS and system tasks in the presence of variableparameters and with a reasonable accuracy is becoming amajor challenge in the industry In this world it is hardto see the applicability of techniques like SimPoint whichreach excellent accuracy but rely on a full profiling pass onrepeatable inputs
What we propose is novel in several ways to the bestof our knowledge we are the first to advocate a system thatcombines fast VMs and accurate architectural timing Ourapproach enables modeling a complete system includingperipherals running full unmodified operating system andreal applications with unmatched execution speed At thesame time we can support a timing accuracy that approxi-mates the best existing sampling mechanisms
The Dynamic Sampling techniques that we propose inthis paper represent a first step in the direction of develop-ing a full-system simulator for ldquomodernrdquo computing sys-tems They combine the outstanding speed and functionalcompleteness of fast emulators with the high accuracy ofsampled timing models We have shown that dependingon the chosen heuristics it is possible to find simulationconfigurations that excel in accuracy (85x speed and 04error vs full timing simulation) or even more interestinglyin speed (309x speedup and 19 error) At the same timeour approach is fully dynamic does not require anya prioriprofiling pass and provides timing feedback to the func-tional simulation This puts us one step closer to being ableto faithfully simulate a complete multi-core multi-socketsystem and we believe represents a major advancement inthe area of computer architecture simulation
Acknowledgments
We especially thank AMDrsquos SimNow team for helpingus and providing the necessary infrastructure to perform theexperiments presented in this paper
References
[1] T Austin E Larson and D Ernst SimpleScalar Aninfrastructure for computer system modelingComputer35(2)59ndash67 Feb 2002
[2] V Bala E Duesterwald and S Banerjia Dynamo A trans-parent dynamic optimization system InProcs of the 2000Conf on Programming Language Design and Implementa-tion pages 1ndash12 June 2000
[3] P Barham B Dragovic K Fraser S Hand T HarrisA Ho R Neugebauer I Pratt and A Warfield Xen andthe art of virtualization InProcs of the 19th Symp on Op-erating Systems Principles pages 164ndash177 Oct 2003
[4] B Barnes and J Slice SimNow A fast and functionallyaccurate AMD X86-64 system simulator Tutorial at2005Intl Symp on Workload Characterization Oct 2005
[5] F Bellard QEMU webpagehttpwwwqemuorg
[6] F Bellard QEMU a fast and portable dynamic translatorIn USENIX 2005 Annual Technical Conf FREENIX Trackpages 41ndash46 Apr 2005
[7] B Calder SimPoint webpage httpwwwcseucsdedu ˜ caldersimpoint
[8] S Chen Direct SMARTS accelerating microarchitecturalsimulation through direct execution Masterrsquos thesis Electri-cal amp Computer Engineering Carnegie Mellon UniversityJune 2004
[9] G Hamerly E Perelman J Lau B Calder and T Sher-wood Using machine learning to guide architecture simu-lation Journal of Machine Learning Research 7343ndash378Feb 2006
[10] C J Hughes V S Pai P Ranganathan and S V AdveRsim Simulating shared-memory multiprocessors with ILPprocessorsComputer 35(2)40ndash49 Feb 2002
[11] T Lafage and A Seznec Choosing representative slices ofprogram execution for microarchitecture simulations A pre-liminary application to the data streamWorkload Charactof Emerging Computer Applications pages 145ndash163 2001
[12] J Lau J Sampson E Perelman G Hamerly and B CalderThe strong correlation between code signatures and perfor-mance InProcs of the Intl Symp on Performance Analysisof Systems and Software pages 236ndash247 Mar 2005
[13] P S Magnusson M Christensson J Eskilson D Fors-gren G Hallberg J Hogberg F Larsson A Moestedt andB Werner Simics A full system simulation platformCom-puter 35(2)50ndash58 Feb 2002
[14] M Rosenblum VMWarehttpwwwvmwarecom [15] T Sherwood E Perelman G Hamerly and B Calder Au-
tomatically characterizing large scale program behaviorInProcs of the 10th Intl Conf on Architectural Support forProgramming Languages and Operating Systems pages 45ndash57 Oct 2002
[16] J E Smith and R Nair The architecture of virtual machinesComputer 38(5)32ndash38 May 2005
[17] D M Tullsen Simulation and modeling of a simultaneousmultithreading processor In22nd Annual Computer Mea-surement Group Conf pages 819ndash828 Dec 1996
[18] M Van Biesbrouck L Eeckhout and B Calder Efficientsampling startup for sampled processor simulation InProcsof the Intl Conf on High Performance Embedded Architec-tures amp Compilers Nov 2005
[19] T F Wenisch R E Wunderlich B Falsafi and J CHoe TurboSMARTS Accurate microarchitecture simula-tion sampling in minutes SIGMETRICS Perform EvalRev 33(1)408ndash409 June 2005
[20] Wikipedia Comparison of virtual machineshttpenwikipediaorgwikiComparison_of_virtual_machines
[21] R E Wunderlich T F Wenisch B Falsafi and J CHoe SMARTS Accelerating microarchitecture simulationvia rigorous statistical sampling InProcs of the 30th An-nual Intl Symp on Computer Architecture pages 84ndash97June 2003
[22] M T Yourst PTLsim userrsquos guide and referencehttpwwwptlsimorg
[23] M T Yourst PTLsim A cycle accurate full system x86-64microarchitectural simulator InProcs of the Intl Symp onPerformance Analysis of Systems and Software Apr 2007
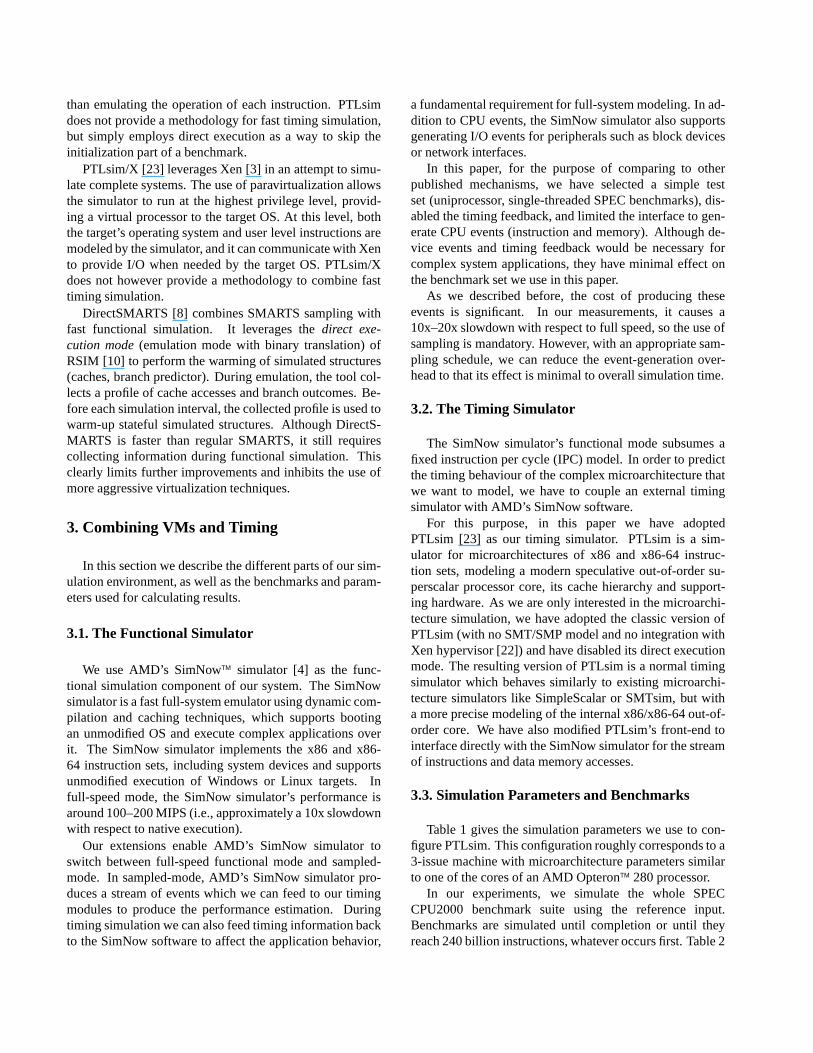
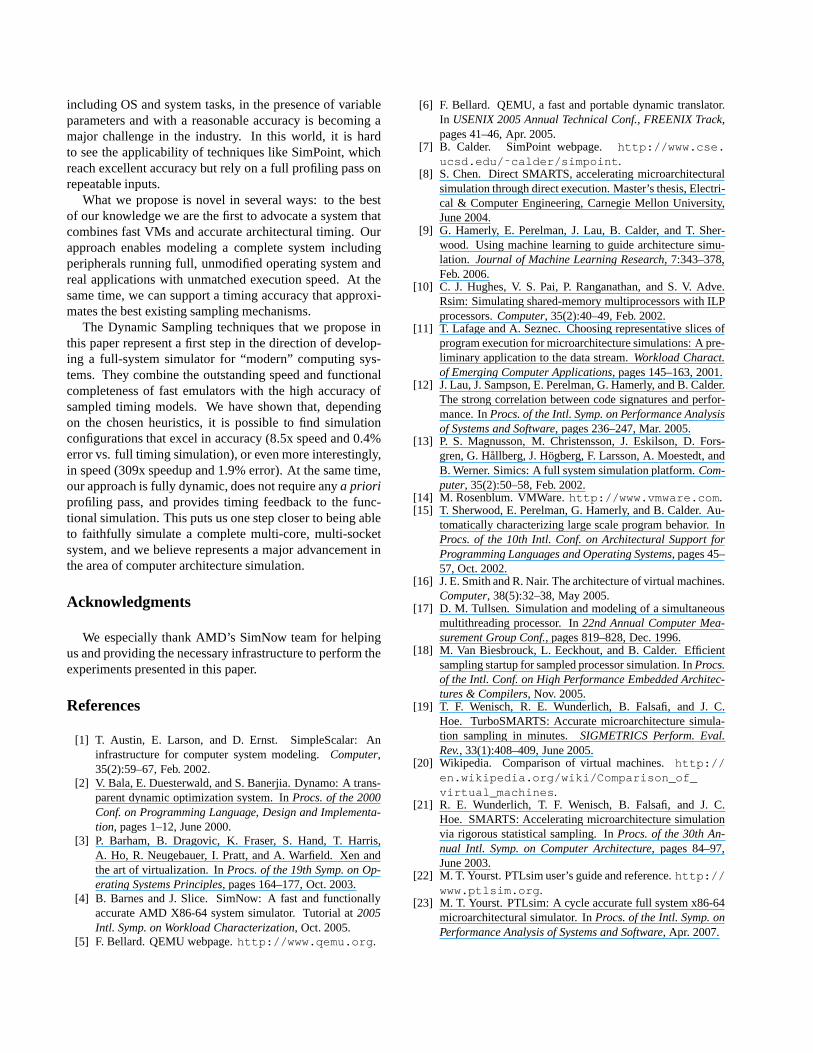