Combined use of (18)F-FDG and (18)F-FMISO in unresectable non-small cell lung cancer patients...
16
Am J Nucl Med Mol Imaging 2015;5(2):127-142 www.ajnmmi.us /ISSN:2160-8407/ajnmmi0003365 Original Article Combined use of 18 F-FDG and 18 F-FMISO in unresectable non-small cell lung cancer patients planned for radiotherapy: a dynamic PET/CT study Christos Sachpekidis 1 , Christian Thieke 2,3 , Vasileios Askoxylakis 2,3 , Nils H Nicolay 2,3 , Peter E Huber 2,3 , Michael Thomas 4 , Georgia Dimitrakopoulou 1 , Juergen Debus 2,3 , Uwe Haberkorn 1,5 , Antonia Dimitrakopoulou-Strauss 1 1 Clinical Cooperation Unit Nuclear Medicine, German Cancer Research Center, Heidelberg, Germany; 2 Clinical Cooperation Unit Radiotherapy, German Cancer Research Center, Heidelberg, Germany; 3 Department of Radiation Oncology, University Clinic Heidelberg, Germany; 4 Department Thoracic Oncology/Internal Medicine, Thoraxklinik, University of Heidelberg, Germany; 5 Division of Nuclear Medicine, University of Heidelberg, Germany Received October 24, 2014; Accepted November 19, 2014; Epub January 15, 2015; Published February 1, 2015 Abstract: Aim of this study was to evaluate and compare, by means of dynamic and static PET/CT, the distribution patterns and pharmacokinetics of fluorine-18 fluorodeoxyglucose ( 18 F-FDG) and of fluorine-18-fluoromisonidazole ( 18 F-FMISO) in non-small cell lung cancer (NSCLC) patients scheduled for intensity modulated radiation therapy (IMRT). Thirteen patients suffering from inoperable stage III NSCLC underwent PET/CTs with 18 F-FDG and 18 F-FMISO for tumor metabolism and hypoxia assessment accordingly. Evaluation of PET/CT studies was based on visual analy- sis, semi-quantitative (SUV) calculations and absolute quantitative estimations, after application of a two-tissue compartment model and a non-compartmental approach. 18 F-FDG PET/CT revealed all thirteen primary lung tumors as sites of increased 18 F-FDG uptake. Six patients demonstrated also in total 43 18 F-FDG avid metastases; these patients were excluded from radiotherapy. 18 F-MISO PET/CT demonstrated 12/13 primary lung tumors with faint tracer uptake. Only one tumor was clearly 18 F-FMISO avid, (SUV average = 3.4, SUV max = 5.0). Mean values for 18 F-FDG, as derived from dPET/CT data, were SUV average = 8.9, SUV max = 15.1, K 1 = 0.23, k 2 = 0.53, k 3 = 0.17, k 4 = 0.02, influx = 0.05 and fractal dimension (FD) = 1.25 for the primary tumors. The respective values for 18 F-FMISO were SUV average = 1.4, SUV max = 2.2, K 1 = 0.26, k 2 = 0.56, k 3 = 0.06, k 4 = 0.06, influx = 0.02 and FD = 1.14. No statistically significant correlation was observed between the two tracers. 18 F-FDG PET/CT changed therapy management in six patients, by excluding them from planned IMRT. 18 F-FMISO PET/CT revealed absence of significant tracer uptake in the majority of the 18 F-FDG avid NSCLCs. Lack of correlation between the two tracers’ kinetics indicates that they reflect different molecular mechanisms and implies the discordance between increased glycolysis and hypoxia in the malignancy. Keywords: 18 F-FDG, 18 F-FMISO, PET/CT, non-small cell lung cancer, hypoxia Introduction Lung cancer is the most common cause of can- cer mortality, with non-small cell lung cancer (NSCLC) accounting for almost 80% of all cases. In 2014 the estimated new cases of lung cancer in US are 224,210, while the esti- mated deaths attributed to the malignancy are 159,260 [1]. The treatment of choice is surgical resection of the tumor and the draining lymph nodes. This therapeutic approach applies to patients classified in stages I-IIIA of the disease [2]. However, a radical resection is possible in only 20% of all NSCLC cases [3]. In cases of advanced, unresectable NSCLC (IIIB and IV) radiotherapy, chemotherapy or their combina- tions represent the standard of care. Particularly in stage IIIB NSCLC, which is the population studied in the present paper, the application of chemotherapy combined with radiation therapy results in better results than radiation therapy alone [4-6]. However, the vast majority of patients presenting with stage IIIB NSCLC still demonstrate low survival rates with an antici- pated 5-year survival ranging from 3% to 7% [7]. In these terms, the identification of factors that can affect treatment response is highly important; on one side, it could lead to the selection only of those candidates who would
-
Upload
independent -
Category
Documents
-
view
0 -
download
0
Transcript of Combined use of (18)F-FDG and (18)F-FMISO in unresectable non-small cell lung cancer patients...

Am J Nucl Med Mol Imaging 2015;5(2):127-142www.ajnmmi.us /ISSN:2160-8407/ajnmmi0003365
Original Article Combined use of 18F-FDG and 18F-FMISO in unresectable non-small cell lung cancer patients planned for radiotherapy: a dynamic PET/CT study
Christos Sachpekidis1, Christian Thieke2,3, Vasileios Askoxylakis2,3, Nils H Nicolay2,3, Peter E Huber2,3, Michael Thomas4, Georgia Dimitrakopoulou1, Juergen Debus2,3, Uwe Haberkorn1,5, Antonia Dimitrakopoulou-Strauss1
1Clinical Cooperation Unit Nuclear Medicine, German Cancer Research Center, Heidelberg, Germany; 2Clinical Cooperation Unit Radiotherapy, German Cancer Research Center, Heidelberg, Germany; 3Department of Radiation Oncology, University Clinic Heidelberg, Germany; 4Department Thoracic Oncology/Internal Medicine, Thoraxklinik, University of Heidelberg, Germany; 5Division of Nuclear Medicine, University of Heidelberg, Germany
Received October 24, 2014; Accepted November 19, 2014; Epub January 15, 2015; Published February 1, 2015
Abstract: Aim of this study was to evaluate and compare, by means of dynamic and static PET/CT, the distribution patterns and pharmacokinetics of fluorine-18 fluorodeoxyglucose (18F-FDG) and of fluorine-18-fluoromisonidazole (18F-FMISO) in non-small cell lung cancer (NSCLC) patients scheduled for intensity modulated radiation therapy (IMRT). Thirteen patients suffering from inoperable stage III NSCLC underwent PET/CTs with 18F-FDG and 18F-FMISO for tumor metabolism and hypoxia assessment accordingly. Evaluation of PET/CT studies was based on visual analy-sis, semi-quantitative (SUV) calculations and absolute quantitative estimations, after application of a two-tissue compartment model and a non-compartmental approach. 18F-FDG PET/CT revealed all thirteen primary lung tumors as sites of increased 18F-FDG uptake. Six patients demonstrated also in total 43 18F-FDG avid metastases; these patients were excluded from radiotherapy. 18F-MISO PET/CT demonstrated 12/13 primary lung tumors with faint tracer uptake. Only one tumor was clearly 18F-FMISO avid, (SUVaverage = 3.4, SUVmax = 5.0). Mean values for 18F-FDG, as derived from dPET/CT data, were SUVaverage = 8.9, SUVmax = 15.1, K1 = 0.23, k2 = 0.53, k3 = 0.17, k4 = 0.02, influx = 0.05 and fractal dimension (FD) = 1.25 for the primary tumors. The respective values for 18F-FMISO were SUVaverage = 1.4, SUVmax = 2.2, K1 = 0.26, k2 = 0.56, k3 = 0.06, k4 = 0.06, influx = 0.02 and FD = 1.14. No statistically significant correlation was observed between the two tracers. 18F-FDG PET/CT changed therapy management in six patients, by excluding them from planned IMRT. 18F-FMISO PET/CT revealed absence of significant tracer uptake in the majority of the 18F-FDG avid NSCLCs. Lack of correlation between the two tracers’ kinetics indicates that they reflect different molecular mechanisms and implies the discordance between increased glycolysis and hypoxia in the malignancy.
Keywords: 18F-FDG, 18F-FMISO, PET/CT, non-small cell lung cancer, hypoxia
Introduction
Lung cancer is the most common cause of can-cer mortality, with non-small cell lung cancer (NSCLC) accounting for almost 80% of all cases. In 2014 the estimated new cases of lung cancer in US are 224,210, while the esti-mated deaths attributed to the malignancy are 159,260 [1]. The treatment of choice is surgical resection of the tumor and the draining lymph nodes. This therapeutic approach applies to patients classified in stages I-IIIA of the disease [2]. However, a radical resection is possible in only 20% of all NSCLC cases [3]. In cases of advanced, unresectable NSCLC (IIIB and IV)
radiotherapy, chemotherapy or their combina-tions represent the standard of care. Particularly in stage IIIB NSCLC, which is the population studied in the present paper, the application of chemotherapy combined with radiation therapy results in better results than radiation therapy alone [4-6]. However, the vast majority of patients presenting with stage IIIB NSCLC still demonstrate low survival rates with an antici-pated 5-year survival ranging from 3% to 7% [7]. In these terms, the identification of factors that can affect treatment response is highly important; on one side, it could lead to the selection only of those candidates who would

18F-FDG and 18F-FMISO PET/CT in lung cancer
128 Am J Nucl Med Mol Imaging 2015;5(2):127-142
benefit most from the applied treatment and, on the other side, it could contribute to the exclusion of those patients that are not expect-ed to benefit from certain therapeutical approaches and, thus, avoid undergoing treat-ments, many of which carry some serious side-effects.
Tumor hypoxia has been recognized as an adverse prognostic factor for many cancer types with a direct negative influence on treat-ment success [8-11]. Hypoxia limits tumor cells’ treatment response, rendering them radiore-sistant, and predisposes them towards metas-tases [12-13]. At present the methods available for assessing oxygen concentration directly in vivo are the Eppendorf electrode (Eppendorf AG, gold standard to assess tumor hypoxia) and the Oxylite probe (Oxford optronics) [11]. How- ever, these techniques are invasive, technically demanding and operator-dependent [11, 14]. Therefore, they haven’t gained wide acceptabil-ity in clinical practice. Another well-recognised factor of crucial significance in management and prognosis of NSCLC is the extent of the dis-ease resulting in different patient staging. The most important determinants of disease stage and subsequently prognosis are the size of the tumor, lymph node infiltration and metastatic disease [2]. In particular, distant metastatic involvement automatically upgrades patients to stage IV rendering them candidates only for palliative treatment.
PET is a non-invasive modality that, after appli-cation of appropriate radiotracers, enables the evaluation of specific molecular processes like cellular metabolism, glycolytic rate, tumor hypoxia, perfusion or receptor expression in tumors. Fluorine-18 fluoromisonidazole (18F- FMISO) is an extensively evaluated PET radio-tracer in visualization of tumor hypoxia that has demonstrated a correlation between oxygen measurements and tracer uptake; 18F-FMISO PET is nowadays considered a robust method in estimating the burden of hypoxia in the pO2 range of a few mm Hg [3, 15-18]. Given the piv-otal role of tumor hypoxia in cancer treatment response and prognosis, 18F-FMISO PET seems to be a very promising modality in the evalua-tion of oncological patients. Nevertheless, despite its wide application, 18F-FMISO remains a tracer, whose role in the diagnostic work-up of patients with NSCLC is still open. On the other hand, fluorine-18 fluorodeoxyglucose
(18F-FDG), the workhorse of PET imaging, is a biomarker of intracellular glucose metabolism, reflecting the tumor ‘burden’ of the malignancy. Numerous studies have highlighted the contri-bution of 18F-FDG PET and PET/CT in the diag-nostic approach, management and prognosis of lung cancer [19-22]. Dynamic PET/CT (dPET/CT) is a modality that allows registration of trac-er kinetics over time and, after application of compartment modelling, enables the extrac-tion of values of tracer kinetic parameters, which depict specific molecular processes [23]. Moreover, a non-compartment model can be applied leading to the estimation of fractal dimension (FD), a parameter reflecting hetero-geneity [24]. This information is unattainable, when the classical whole body PET/CT proto-cols are performed, in which data are collected only at one time point after tracer injection.
It is known that in malignant cells glycolysis increases in hypoxia, especially in conditions of acute hypoxia. However, PET studies in several tumor types have shown that this relationship is not governed by a simple, linear pattern [25]. The purpose of this study was to evaluate and compare, by means of dynamic and static PET/CT, the distribution patterns and pharmacoki-netics of 18F-FDG, a biomarker of tumor glyco-lytic rate and viability, and of 18F-FMISO, a bio-marker of tumor hypoxia, in patients suffering from inoperable stage IIIB NSCLC. We aimed to detect potential statistically significant correla-tion between SUVs and kinetic parameters of the two radiopharmaceuticals that would reflect an indirect correlation between the mecha-nisms of glycolysis and hypoxia in NSCLC. Correlation analysis was also performed bet- ween parameters of each tracer. To our knowl-edge, no data have been published regarding the comparison between dynamic 18F-FDG and 18F-FMISO PET/CT studies.
Materials and methods
Patients
Thirteen patients (eleven male, two female) confirmed to suffer from inoperable stage III NSCLC were enrolled in the study. The histolog-ic data of the patients was the following: four of them had adenocarcinoma while nine suffered from squamous cell carcinoma. Their mean age was 62.2 years (Tables 1 and 2). The included patients were not diabetic. None of them had
18F-FDG and 18F-FMISO PET/CT in lung cancer
129 Am J Nucl Med Mol Imaging 2015;5(2):127-142
undergone chemotherapy. Patients gave writ-ten informed consent to participate in the study and to have their medical records released. The study was approved by the Ethical Committee of the University of Heidelberg and the Federal Agency for Radiation Protection (Bundesamt für Strahlenschutz).
Data acquisition
The double-tracer study in each patient was completed in two consecutive days. The
patients were intravenously administered with a maximum of 250 MBq 18F-FDG on the first day and respectively a maximum of 250 MBq 18F-FMISO on the second day. Data acquisition consisted of two parts for each tracer: the dynamic part (dPET/CT studies) and the static part. dPET/CT studies were performed over the thorax for 60 minutes using a 28-frame proto-col (10 frames of 30 seconds, 5 frames of 60 seconds, 5 frames of 120 seconds and 8 frames of 300 seconds). Additional static imag-
Table 1. Characteristics and main results derived from PET studies with 18F-FDG of the patients inves-tigated
Patient no. Age (years) Sex (M/F) Histology Metastases (Yes/No) SUVaverage SUVmax K1 k3 influx FD
1 71 M Adeno Ca No 1.5 2.4 0.13 0.05 0.01 1.062 65 M Adeno Ca Yes 8.3 12.2 0.33 0.23 0.08 1.243 56 M SCC No 4.6 7.1 0.24 0.15 0.06 1.214 78 M SCC Yes 6.9 26.1 0.08 0.14 0.02 1.285 75 F SCC No 6.9 18.7 0.14 0.12 0.03 1.226 73 F Adeno Ca No 11.1 28.1 0.22 0.12 0.04 1.377 44 M SCC No 8.6 15.8 0.20 0.14 0.05 1.398 56 M SCC Yes 9.0 23.1 0.10 0.14 0.29 1.289 61 M Adeno Ca Yes 8.6 13.0 n.a. n.a. n.a. n.a.10 67 M SCC Yes 10.3 13.3 0.36 0.37 0.08 1.2811 70 M SCC Yes 14.9 21.4 0.22 0.30 0.07 1.3412 74 M SCC No 10.7 20.9 0.32 0.14 0.06 1.2913 70 M SCC No 3.2 5.1 0.24 0.06 0.02 1.15The quantitative values refer to mean 18F-FDG values. Adeno Ca = adenocarcinoma; SCC = squamous cell carcinoma; n.a. = not acquired quantitative data (dynamic PET/CT study not performed due to patient discomfort).
Table 2. Characteristics and main results derived from PET studies with 18F-FMISO of the patients investigated
Patient no. Age (years) Sex (M/F) Histology Metastases (Yes/No) SUVaverage SUVmax K1 k3 influx FD
1 71 M Adeno Ca No 1.0 1.3 0.16 0.09 0.03 1.162 65 M Adeno Ca Yes 2.1 2.7 0.42 0.02 0.01 1.183 56 M SCC No 1.0 1.3 0.21 0.14 0.02 1.094 78 M SCC Yes 1.3 2.0 0.35 0.04 0.02 1.325 75 F SCC No 1.0 1.9 0.31 0.03 0.01 1.116 73 F Adeno Ca No 1.6 2.8 0.20 0.04 0.01 1.147 44 M SCC No 0.9 1.8 0.05 0.10 0.02 1.118 56 M SCC Yes 1.4 2.2 0.31 0.04 0.02 1.169 61 M Adeno Ca Yes 3.4 5.1 n.a. n.a. n.a. n.a.10 67 M SCC Yes 0.8 1.1 0.45 0.03 0.02 0.9911 70 M SCC Yes 1.7 2.6 0.27 0.05 0.03 1.1712 74 M SCC No 0.9 1.5 0.19 0.07 0.02 1.0413 70 M SCC No 1.5 2.1 0.25 0.08 0.04 1.17The quantitative values refer to mean 18F-FMISO values. Adeno Ca = adenocarcinoma; SCC = squamous cell carcinoma; n.a. = not acquired quantitative data (dynamic PET/CT study not performed due to patient discomfort).

18F-FDG and 18F-FMISO PET/CT in lung cancer
130 Am J Nucl Med Mol Imaging 2015;5(2):127-142
es from the maxilla to the proximal legs were acquired in the 18F-FDG PET/CT studies and respectively from the maxilla to the pelvic entry in the 18F-FMISO PET/CT studies. The image duration was 2 minutes per bed position for the emission scans. A dedicated PET/CT system (Biograph mCT, 128 S, Siemens Co., Erlangen, Germany) with an axial field of view of 21.6 cm with TruePoint and TrueV, operated in a three-dimensional mode, was used for patient stud-ies. A low-dose attenuation CT (120 kV, 30 mA) was used for the attenuation correction of the dynamic emission PET data and for image fusion. A second low-dose CT (120 kV, 30 mA) was performed after the end of the dynamic series in order to avoid patient movement. The last images (55-60 minutes post-injection) were used for semi-quantitative analysis. All PET images were attenuation-corrected and an image matrix of 400 × 400 pixels was used for iterative image reconstruction. Iterative images reconstruction was based on the ordered sub-set expectation maximization algorithm (OS- EM) with 2 iterations and 21 subsets as well as time of flight (TOF). The reconstructed images were converted to SUV images based on the formula [26]: SUV = tissue concentration (Bq/g)/(injected dose (Bq)/body weight (g)). The SUV 55 to 60 minutes postinjection served for quantification of the 18F-FDG data.
Data analysis
Data analysis and evaluation consisted of visu-al analysis of the PET/CT scans, semi-quantita-tive evaluation based on SUV calculations, and quantitative analysis.
Qualitative analysis was based on visual asse- ssment of the foci with enhanced tracer uptake on transaxial, coronal, and sagittal images for both PET/CT studies. The results of the two tracer PET/CTs were afterwards compared.
Semi-quantitative evaluation was based on vol-umes of interest (VOIs) and on the subsequent calculation of SUVs. VOIs were drawn with a 50% isocontour over foci of increased tracer uptake (primary tumor and potential metastatic lesions), reference tissue (normal lung paren-chyma) and an arterial vessel (descending aorta). As previously mentioned, the global SUV was calculated according to the formula: SUV = tissue concentration (Bq/g)/(injected dose (Bq)/body weight (g)).
Quantitative evaluation of the dynamic PET/CT data was performed using a dedicated soft-ware [27, 28]. Time activity curves (TACs) were created using VOIs drawn with a 50% isocon-tour, placed over foci demonstrating pathologi-cal enhanced uptake. A two-tissue compart-ment model with a blood component (VB) was used for the evaluation of the rate constants (K1, k2, k3 and k4) for both radiotracers [29, 30]. The two-tissue compartment model we applied is a modification of the one proposed by Sokoloff et al, which did not take into account the parameters k4 and VB [29]. This lack of k4 and VB however leads to different values of the parameters K1 and k3, since K1 is dependent on VB and k3 on k4. The model parameters were accepted when K1, k2, k3 and k4 were less than 1 and VB exceeded zero. The unit for the rate constants K1, k2, k3 and k4 is 1/min, while VB reflects the fraction of blood within the VOI. The global influx was also calculated, after applying the transport rates derived from the two-tissue compartment model analysis and using the for-mula: influx = (K1 × k3)/(k2 + k3). The input func-tion was retrieved from the image data accord-ing to methods already reported in literature [31, 32]. One problem in patients is the accu-rate measurement of input function, which the-oretically requires arterial blood sampling. It has been shown however, that input function can be accurately enough retrieved from image data [31]. For the input function, the mean value of the VOI data from the descending aorta was used. A vessel VOI consisted of at least seven ROIs in sequential PET/CT images. The recovery coefficient is 0.65 for a diameter of 10 mm and for the system described above using 2 iterations and 21 subsets [33]. Partial vol-ume correction was not performed due to the very limited partial volume effects; this limita-tion is attributed to the high resolution, the small pixel size, the application of VOIs and the use of a large arterial vessel.
Furthermore, a non-compartment model was used in order to calculate the fractal dimension (FD). FD is a parameter for assessment of het-erogeneity of the tracer kinetics and was calcu-lated using the time activity data in each indi-vidual voxel of a VOI. The values of the FD vary from 0 to 2 showing the deterministic or chaotic distribution of the tracer activity via time in a local volume defined by a VOI. A subdivision of
18F-FDG and 18F-FMISO PET/CT in lung cancer
131 Am J Nucl Med Mol Imaging 2015;5(2):127-142
7 × 7 and a maximal SUV of 20 were applied for the calculation of FD [24].
Data were statistically evaluated using the STATA/SE 12.1 (StataCorp) software on an Intel Core (2· 3.06 GHz, 4 GB RAM) running with Mac OS X 10.8.4 (Apple Inc., Cupertino, CA, USA). The statistical evaluation was performed using descriptive statistics, box plots, Wilcoxon rank-sum test and Spearman’s rank correlation anal-
ysis. The results were considered significant for p less than 0.05 (p < 0.05).
Results
Qualitative analysis
18F-FDG PET/CT demonstrated enhanced trac-er uptake in all thirteen primary lung tumors. The mean tumor diameter was 6.7 cm (range
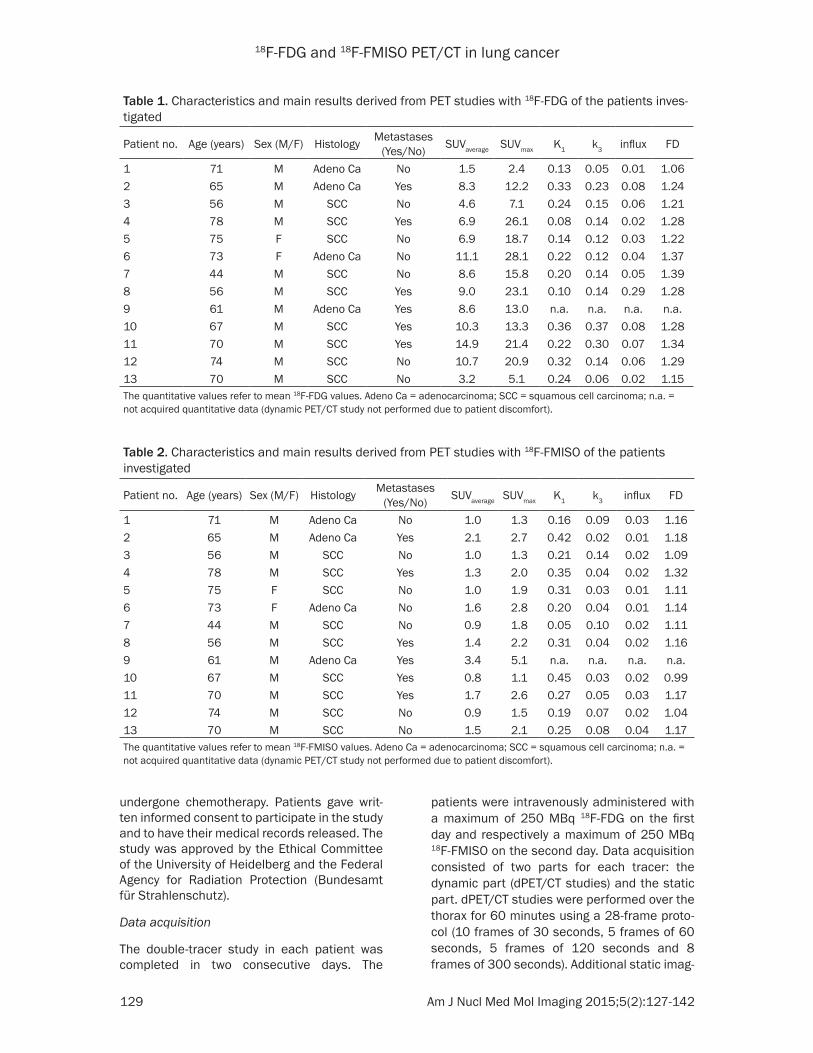
Figure 1. A 70-year-old male stage IIIB lung cancer patient referred to our department for PET/CT evaluation. Transaxial PET/CT images at the level of the lungs reveal the tumor in segment 3 of the right lung with enhanced 18F-FDG uptake (upper row, arrow; SUVaverage = 3.2, SUVmax = 5.0) but with faint 18F-FMISO accumulation (lower row; SUVaverage = 1.5, SUVmax = 2.1).
18F-FDG and 18F-FMISO PET/CT in lung cancer
132 Am J Nucl Med Mol Imaging 2015;5(2):127-142
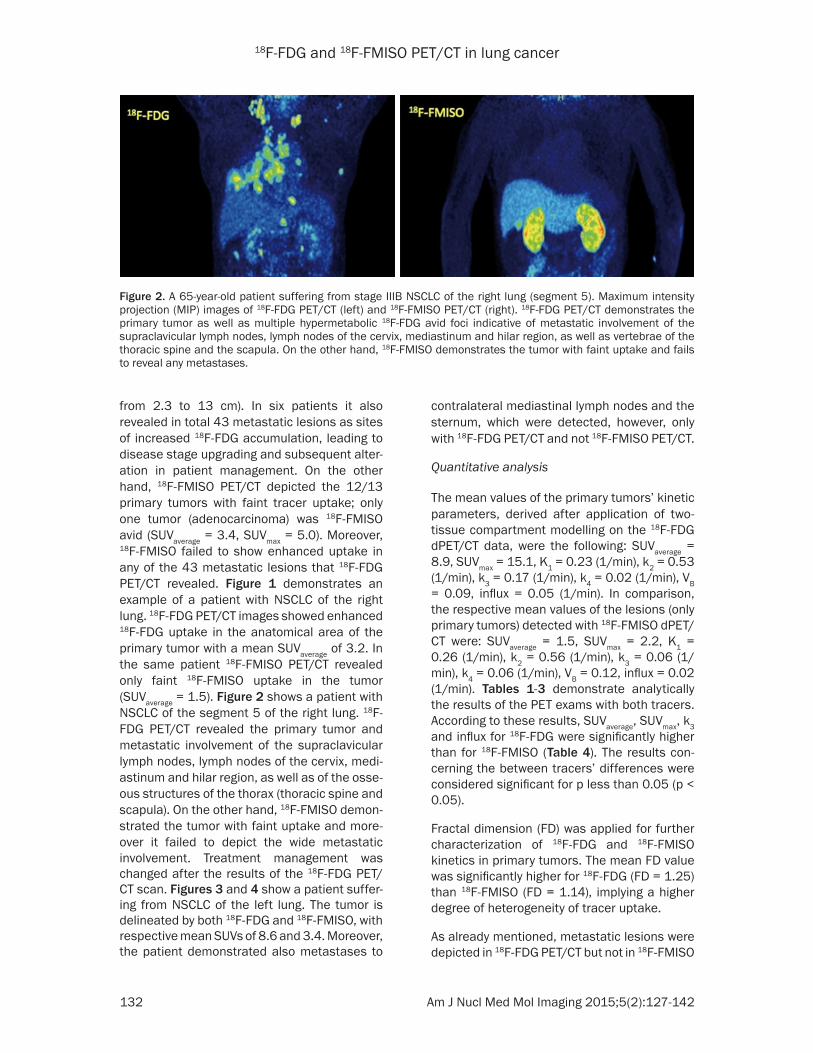
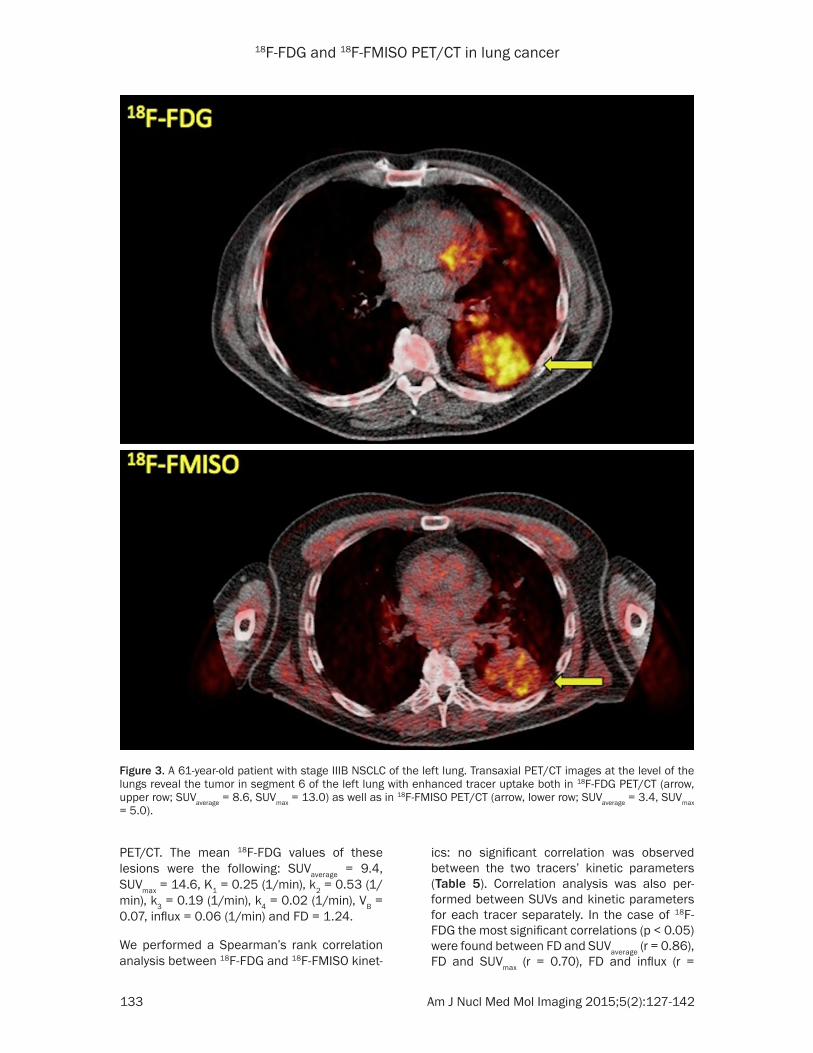
from 2.3 to 13 cm). In six patients it also revealed in total 43 metastatic lesions as sites of increased 18F-FDG accumulation, leading to disease stage upgrading and subsequent alter-ation in patient management. On the other hand, 18F-FMISO PET/CT depicted the 12/13 primary tumors with faint tracer uptake; only one tumor (adenocarcinoma) was 18F-FMISO avid (SUVaverage = 3.4, SUVmax = 5.0). Moreover, 18F-FMISO failed to show enhanced uptake in any of the 43 metastatic lesions that 18F-FDG PET/CT revealed. Figure 1 demonstrates an example of a patient with NSCLC of the right lung. 18F-FDG PET/CT images showed enhanced 18F-FDG uptake in the anatomical area of the primary tumor with a mean SUVaverage of 3.2. In the same patient 18F-FMISO PET/CT revealed only faint 18F-FMISO uptake in the tumor (SUVaverage = 1.5). Figure 2 shows a patient with NSCLC of the segment 5 of the right lung. 18F-FDG PET/CT revealed the primary tumor and metastatic involvement of the supraclavicular lymph nodes, lymph nodes of the cervix, medi-astinum and hilar region, as well as of the osse-ous structures of the thorax (thoracic spine and scapula). On the other hand, 18F-FMISO demon-strated the tumor with faint uptake and more-over it failed to depict the wide metastatic involvement. Treatment management was changed after the results of the 18F-FDG PET/CT scan. Figures 3 and 4 show a patient suffer-ing from NSCLC of the left lung. The tumor is delineated by both 18F-FDG and 18F-FMISO, with respective mean SUVs of 8.6 and 3.4. Moreover, the patient demonstrated also metastases to
contralateral mediastinal lymph nodes and the sternum, which were detected, however, only with 18F-FDG PET/CT and not 18F-FMISO PET/CT.
Quantitative analysis
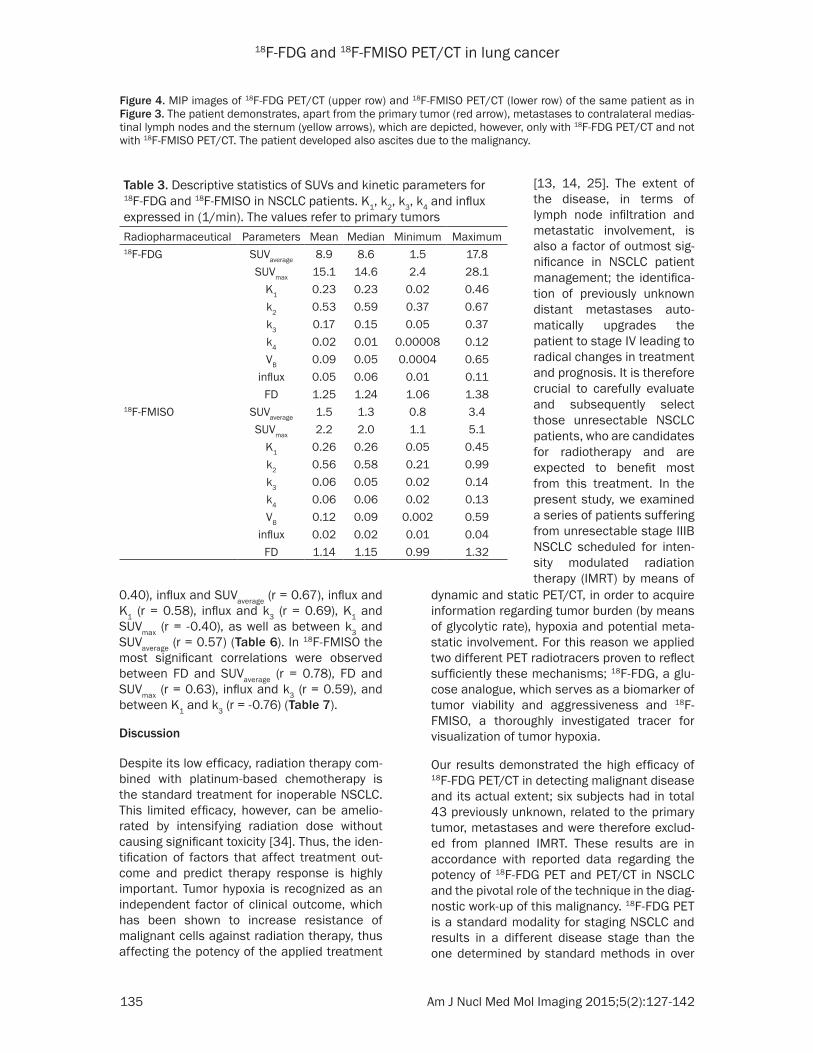
The mean values of the primary tumors’ kinetic parameters, derived after application of two-tissue compartment modelling on the 18F-FDG dPET/CT data, were the following: SUVaverage = 8.9, SUVmax = 15.1, K1 = 0.23 (1/min), k2 = 0.53 (1/min), k3 = 0.17 (1/min), k4 = 0.02 (1/min), VB = 0.09, influx = 0.05 (1/min). In comparison, the respective mean values of the lesions (only primary tumors) detected with 18F-FMISO dPET/CT were: SUVaverage = 1.5, SUVmax = 2.2, K1 = 0.26 (1/min), k2 = 0.56 (1/min), k3 = 0.06 (1/min), k4 = 0.06 (1/min), VB = 0.12, influx = 0.02 (1/min). Tables 1-3 demonstrate analytically the results of the PET exams with both tracers. According to these results, SUVaverage, SUVmax, k3 and influx for 18F-FDG were significantly higher than for 18F-FMISO (Table 4). The results con-cerning the between tracers’ differences were considered significant for p less than 0.05 (p < 0.05).
Fractal dimension (FD) was applied for further characterization of 18F-FDG and 18F-FMISO kinetics in primary tumors. The mean FD value was significantly higher for 18F-FDG (FD = 1.25) than 18F-FMISO (FD = 1.14), implying a higher degree of heterogeneity of tracer uptake.
As already mentioned, metastatic lesions were depicted in 18F-FDG PET/CT but not in 18F-FMISO
Figure 2. A 65-year-old patient suffering from stage IIIB NSCLC of the right lung (segment 5). Maximum intensity projection (MIP) images of 18F-FDG PET/CT (left) and 18F-FMISO PET/CT (right). 18F-FDG PET/CT demonstrates the primary tumor as well as multiple hypermetabolic 18F-FDG avid foci indicative of metastatic involvement of the supraclavicular lymph nodes, lymph nodes of the cervix, mediastinum and hilar region, as well as vertebrae of the thoracic spine and the scapula. On the other hand, 18F-FMISO demonstrates the tumor with faint uptake and fails to reveal any metastases.
18F-FDG and 18F-FMISO PET/CT in lung cancer
133 Am J Nucl Med Mol Imaging 2015;5(2):127-142
PET/CT. The mean 18F-FDG values of these lesions were the following: SUVaverage = 9.4, SUVmax = 14.6, K1 = 0.25 (1/min), k2 = 0.53 (1/min), k3 = 0.19 (1/min), k4 = 0.02 (1/min), VB = 0.07, influx = 0.06 (1/min) and FD = 1.24.
We performed a Spearman’s rank correlation analysis between 18F-FDG and 18F-FMISO kinet-
ics: no significant correlation was observed between the two tracers’ kinetic parameters (Table 5). Correlation analysis was also per-formed between SUVs and kinetic parameters for each tracer separately. In the case of 18F-FDG the most significant correlations (p < 0.05) were found between FD and SUVaverage (r = 0.86), FD and SUVmax (r = 0.70), FD and influx (r =
Figure 3. A 61-year-old patient with stage IIIB NSCLC of the left lung. Transaxial PET/CT images at the level of the lungs reveal the tumor in segment 6 of the left lung with enhanced tracer uptake both in 18F-FDG PET/CT (arrow, upper row; SUVaverage = 8.6, SUVmax = 13.0) as well as in 18F-FMISO PET/CT (arrow, lower row; SUVaverage = 3.4, SUVmax = 5.0).
18F-FDG and 18F-FMISO PET/CT in lung cancer
134 Am J Nucl Med Mol Imaging 2015;5(2):127-142
18F-FDG and 18F-FMISO PET/CT in lung cancer
135 Am J Nucl Med Mol Imaging 2015;5(2):127-142
0.40), influx and SUVaverage (r = 0.67), influx and K1 (r = 0.58), influx and k3 (r = 0.69), K1 and SUVmax (r = -0.40), as well as between k3 and SUVaverage (r = 0.57) (Table 6). In 18F-FMISO the most significant correlations were observed between FD and SUVaverage (r = 0.78), FD and SUVmax (r = 0.63), influx and k3 (r = 0.59), and between K1 and k3 (r = -0.76) (Table 7).
Discussion
Despite its low efficacy, radiation therapy com-bined with platinum-based chemotherapy is the standard treatment for inoperable NSCLC. This limited efficacy, however, can be amelio-rated by intensifying radiation dose without causing significant toxicity [34]. Thus, the iden-tification of factors that affect treatment out-come and predict therapy response is highly important. Tumor hypoxia is recognized as an independent factor of clinical outcome, which has been shown to increase resistance of malignant cells against radiation therapy, thus affecting the potency of the applied treatment
dynamic and static PET/CT, in order to acquire information regarding tumor burden (by means of glycolytic rate), hypoxia and potential meta-static involvement. For this reason we applied two different PET radiotracers proven to reflect sufficiently these mechanisms; 18F-FDG, a glu-cose analogue, which serves as a biomarker of tumor viability and aggressiveness and 18F- FMISO, a thoroughly investigated tracer for visualization of tumor hypoxia.
Our results demonstrated the high efficacy of 18F-FDG PET/CT in detecting malignant disease and its actual extent; six subjects had in total 43 previously unknown, related to the primary tumor, metastases and were therefore exclud-ed from planned IMRT. These results are in accordance with reported data regarding the potency of 18F-FDG PET and PET/CT in NSCLC and the pivotal role of the technique in the diag-nostic work-up of this malignancy. 18F-FDG PET is a standard modality for staging NSCLC and results in a different disease stage than the one determined by standard methods in over
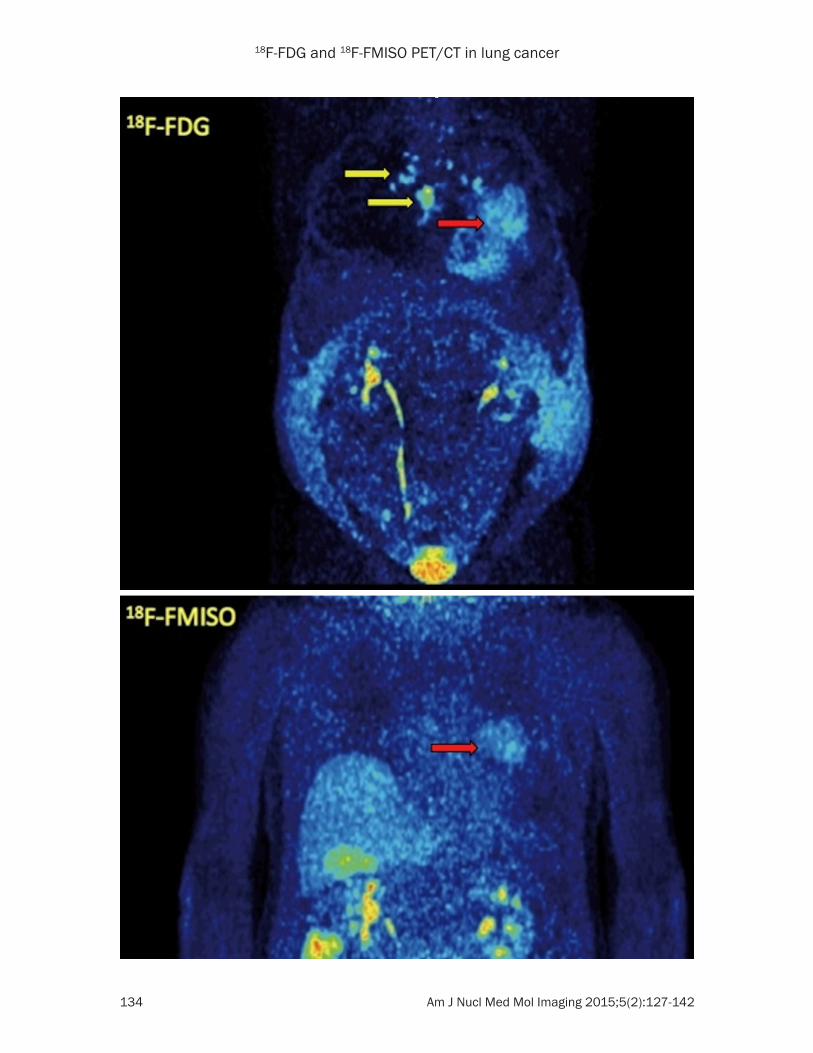
Figure 4. MIP images of 18F-FDG PET/CT (upper row) and 18F-FMISO PET/CT (lower row) of the same patient as in Figure 3. The patient demonstrates, apart from the primary tumor (red arrow), metastases to contralateral medias-tinal lymph nodes and the sternum (yellow arrows), which are depicted, however, only with 18F-FDG PET/CT and not with 18F-FMISO PET/CT. The patient developed also ascites due to the malignancy.
Table 3. Descriptive statistics of SUVs and kinetic parameters for 18F-FDG and 18F-FMISO in NSCLC patients. K1, k2, k3, k4 and influx expressed in (1/min). The values refer to primary tumorsRadiopharmaceutical Parameters Mean Median Minimum Maximum18F-FDG SUVaverage 8.9 8.6 1.5 17.8
SUVmax 15.1 14.6 2.4 28.1K1 0.23 0.23 0.02 0.46k2 0.53 0.59 0.37 0.67k3 0.17 0.15 0.05 0.37k4 0.02 0.01 0.00008 0.12VB 0.09 0.05 0.0004 0.65
influx 0.05 0.06 0.01 0.11FD 1.25 1.24 1.06 1.38
18F-FMISO SUVaverage 1.5 1.3 0.8 3.4SUVmax 2.2 2.0 1.1 5.1
K1 0.26 0.26 0.05 0.45k2 0.56 0.58 0.21 0.99k3 0.06 0.05 0.02 0.14k4 0.06 0.06 0.02 0.13VB 0.12 0.09 0.002 0.59
influx 0.02 0.02 0.01 0.04FD 1.14 1.15 0.99 1.32
[13, 14, 25]. The extent of the disease, in terms of lymph node infiltration and metastatic involvement, is also a factor of outmost sig-nificance in NSCLC patient management; the identifica-tion of previously unknown distant metastases auto-matically upgrades the patient to stage IV leading to radical changes in treatment and prognosis. It is therefore crucial to carefully evaluate and subsequently select those unresectable NSCLC patients, who are candidates for radiotherapy and are expected to benefit most from this treatment. In the present study, we examined a series of patients suffering from unresectable stage IIIB NSCLC scheduled for inten-sity modulated radiation therapy (IMRT) by means of

18F-FDG and 18F-FMISO PET/CT in lung cancer
136 Am J Nucl Med Mol Imaging 2015;5(2):127-142
Table 4. Results of the Wilcoxon rank-sum test for the probability of differences between 18F-FDG and 18F-FMISO
18F-FMISO parametersSUVaverage SUVmax K1 k3 influx FD
18F-FDG parameters SUVaverage p < 0.0001*SUVmax p < 0.0001*
K1 p = 0.218k3 p = 0.001*
influx p = 0.027*FD p = 0.007*
*Significant probabilities (p < 0.05).
half patients, leading to alterations in patient management [35]. Particularly in regard with M-staging, 18F-FDG PET demonstrates a sensi-tivity of 94% and a specificity of 97% [20].
On the other hand, 18F-FMISO, despite being the most widely used nitroimidazole imaging agent, is a tracer without a clear role yet in the diagnostic algorithm of NSCLC. 18F-FMISO PET/CT provides information on tumor hypoxia and thus, as an index of tissue oxygenation, can potentially aid in radiotherapy planning and dis-ease prognosis, given the leading role of hypox-ia in radiation resistance. FMISO enters the cells by passive diffusion, with its lipophilicity being a major determinant of the intracellular penetration. The tracer is intracellularly redu- ced by nitroreductase enzymes and becomes then trapped in cells with reduced oxygen par-tial pressure, resulting in tracer accumulation. On the other hand, in normally oxygenated cells, the parent compound is regenerated by reoxidation and no metabolite accumulation takes place [36, 37]. The results of our study revealed a high 18F-FMISO retention (by visual evaluation) in only 1/13 primary tumors and in none of the 43 metastases (mean SUVaverage = 1.5, mean SUVmax = 2.2). It is very likely, that this small tracer accumulation in the tumor area may be due to the scanning protocol fol-lowed (lack of late imaging). The lack of late imaging is the major limitation of the study (see below), since 18F-FMISO carries the inherent disadvantages of slow accumulation in the hypoxic lesions and limited normal tissue clear-ance, which limit its clinical use [38]. However, the mean and median 18F-FMISO SUV are in accordance with respective values derived from previous 18F-FMISO PET studies despite the lack of acquisition of images at 2 hours post injection (p.i.) or later. Eschmann et al. reported that in 14 NSCLC patients the mean
SUVaverage was 1.62 at 2 hours and 1.80 at 4 hours p.i.. The respective values for SUVmax were 2.09 and 2.40 [14]. In a prospective study by Cherk et al. 21 patients with suspected or biopsy-proven NSCLC underwent 18F-FDG and 18F-FMISO PET. Their results demonstrated that 18F-FMISO tumor uptake was significantly less the 18F-FDG uptake, while the mean 18F-FMISO SUVmax at 2 hours p.i. was 1.20. Moreover, no correlation was found between the two tracers’ SUVmax [39]. Further, our semi-quantitative results are similar with those derived from head and neck cancer patients, in which the highest so far experience has been gained, regarding hypoxia imaging. Thorwarth et al. performed dynamic 18F-FMISO PET scans in 15 patients and resulted in a median SUVmax of 2.25 at 4 hours p.i. [40]. Hicks et al reported a mean 18F-FMISO SUVmax of 2.5 ± 0.5 at 2 hours p.i. (range from 1.6 to 3.5) in 15 head and neck cancer patients. The authors applied a SUVmax of 1.6 as a threshold for characterizing a pri-mary tumor as hypoxic [41]. Tachibana et al. studied a group of ten cancer patients (four with head and neck cancer, four with gastroin-testinal cancers, one with lung cancer and one with uterine cancer) and concluded that mean tumor SUVmax was similar for 100 min and 180 minutes p.i. (2.33 ± 0.72 and 2.28 ± 0.61 respectively) [42].
A two-tissue compartment model was applied for evaluation of the kinetics of both tracers. The application of this model leads to the extraction of the kinetic parameters K1, k2, k3, k4, influx (Ki) and fractional blood volume (VB), also called vessel density. In the case of 18F-FDG K1 reflects the influx while k2 reflects the efflux of the tracer, and k3 represents its phos-phorylation rate while k4 its dephosphorylation rate. Influx (Ki) is derived from the equation = (K1 × k3)/(k 2 + k3). The application of the two-

18F-FDG and 18F-FMISO PET/CT in lung cancer
137 Am J Nucl Med Mol Imaging 2015;5(2):127-142
Table 5. Results of the Spearman’s rank correlation analysis between quantitative and semi-quantitative (SUVs) parameters of 18F-FDG and 18F-FMISO. Values were considered significant for p < 0.05. No statistically significant correlation between the two tracers’ parameters is demon-strated
18F-FMISO parameters
SUVaverage SUVmax K1 k3 influx FD18F-FDG parameters SUVaverage 0.201 (p = 0.555) 0.556 (p = 0.082) -0.009 (p = 0.979) -0.373 (p = 0.259) -0.373 (p = 0.259) -0.227 (p = 0.502)
SUVmax 0.173 (p = 0.611) 0.547 (p = 0.082) 0.264 (p = 0.433) -0.509 (p = 0.110) -0.310 (p = 0.235) 0.036 (p = 0.916)K1 0.173 (p = 0.611) 0.082 (p = 0.811) -0.055 (p = 0.873) 0.055 (p = 0.873) -0.082 (p = 0.811) -0.227 (p = 0.502)k3 0.292 (p = 0.384) 0.228 (p = 0.501) 0.364 (p = 0.272) -0.118 (p = 0.729) -0.127 (p = 0.709) 0.027 (p = 0.937)
influx 0.228 (p = 0.501) 0.246 (p = 0.466) 0.109 (p = 0.750) -0.118 (p = 0.729) -0.346 (p = 0.298) -0.264 (p = 0.433)FD -0.009 (p = 0.979) 0.392 (p = 0.233) -0.182 (p = 0.593) -0.146 (p = 0.670) -0.427 (p = 0.190) -0.209 (p = 0.537)

18F-FDG and 18F-FMISO PET/CT in lung cancer
138 Am J Nucl Med Mol Imaging 2015;5(2):127-142
Table 6. Results of the Spearman’s rank correlation analysis between quantitative and semi-quantitative (SUVs) parameters of 18F-FDG. Values were considered significant for p < 0.05
SUVaverage SUVmax K1 k3 VB influx FD
SUVaverage
SUVmax 0.6337*K1 0.1484 -0.3974*k3 0.5739* 0.3034 0.0580VB -0.0073 -0.2570 0.0647 0.0855influx 0.6697* 0.0421 0.5781* 0.6905* 0.2473FD 0.8596* 0.7021* -0.0220 0.3785 0.0263 0.3968**Significant correlation (p < 0.05).
Table 7. Results of the Spearman’s rank correlation analysis between quantitative and semi-quantitative (SUVs) parameters of 18F-FMISO. Values were considered significant for p < 0.05
SUVaverage SUVmax K1 k3 VB influx FD
SUVaverage
SUVmax 0.8667*K1 0.1786 0.1576k3 -0.2382 -0.4343 -0.7552*VB -0.2032 -0.1611 -0.0559 0.2378 -influx 0.0490 -0.3082 -0.1678 0.5874* 0.1678FD 0.7811* 0.6270* 0.2448 -0.1608 -0.1826 0.1259*Significant correlation (p < 0.05).
tissue compartment model in 18F-FMISO leads also to the extraction of kinetic parameters, which however reflect different molecular mechanisms than 18F-FDG. In the case of 18F-FMISO, indices K1 and k2 describe the influx and efflux of the radiopharmaceutical into out of the cells, while k3 and k4 represent the trap-ping and re-oxygenation of 18F-FMISO [3]. Our results showed that SUVaverage, SUVmax, k3 and influx were significantly higher in 18F-FDG than in 18F-FMISO. Moreover, correlation analysis performed between the tracers’ kinetic param-eters demonstrated no significant correlation. This result is of no surprise, since 18F-FMISO is a much more specific agent in comparison to the non-specific nature of 18F-FDG [18]. As already mentioned, hypoxia is a general factor affecting glucose metabolism and moreover 18F-FDG has been proposed to be a surrogate marker of tumor hypoxia [43]. However, it has been shown that tumor cell response to the phenomenon of hypoxia leads to differences between hypoxia (depicted with 18F-FMISO) and glycolytic rate (depicted with 18F-FDG), resulting in discordance in tracer uptake [18, 25]. Our
results are in accor-dance with these previ-ous findings, since, on one side, they reflect an intense glycolytic rate in the vast majority of the studied tumors and on the other side, they de- monstrate no significant correlation between the tracers’ kinetic parame-ters and SUVs.
Apart from applying a two-tissue compartme- nt model for evaluation of tracers’ kinetics, we also performed a non-compartmental appro- ach leading to the extra- ction of fractal dimen-sion (FD), an index rep-resentative of tissue heterogeneity. This para- meter is based on the box counting procedure of the chaos theory for the analysis of dPET da- ta [24]. The basic con-cept of this approach is
that an increased FD is indicative of a more chaotic tracer distribution, correlating to higher tissue heterogeneity. In the present study, the FD values in lesions showed a statistically sig-nificant difference, with a mean FD value of 1.25 for 18F-FDG and of 1.14 for 18F-FMISO. Furthermore, as already mentioned, both in 18F-FDG and 18F-FMISO, FD demonstrated a highly significant correlation with various tracer parameters: in 18F-FDG with SUVaverage (r = 0.86), SUVmax (r = 0.70) and influx (r = 0.40) and in 18F-FMISO with SUVaverage (r = 0.78) and SUVmax (r = 0.63). This high correlation between FD and SUVs is in agreement with previous results from our group, regarding 18F-FDG and 18F-NaF PET/CT studies in multiple myeloma; in this, also double-tracer, study FD from myelomatous lesions demonstrated a highly significant cor-relation with SUVaverage both in 18F-FDG (r = 0.93) as well as in 18F-NaF (r = 0.97) PET/CT exams [44]. It is our belief that the application of this non-compartment derived parameter can aid in evaluation of complicated oncological differen-tial diagnosis issues.
18F-FDG and 18F-FMISO PET/CT in lung cancer
139 Am J Nucl Med Mol Imaging 2015;5(2):127-142
Limitations
As already mentioned, the major limitation of our study is the lack, due to practical reasons, of delayed imaging (e.g. 2 h and 4 hour p.i.) con-cerning the 18F-FMISO PET/CT imaging. Our
studies involved dynamic acquisition for 60 minutes and then whole-body static imaging. This limitation may be important in 18F-FMISO, due to the slow kinetics of tracer retention resulting in high background activity over the first 60 minutes. However, due to the low FMISO
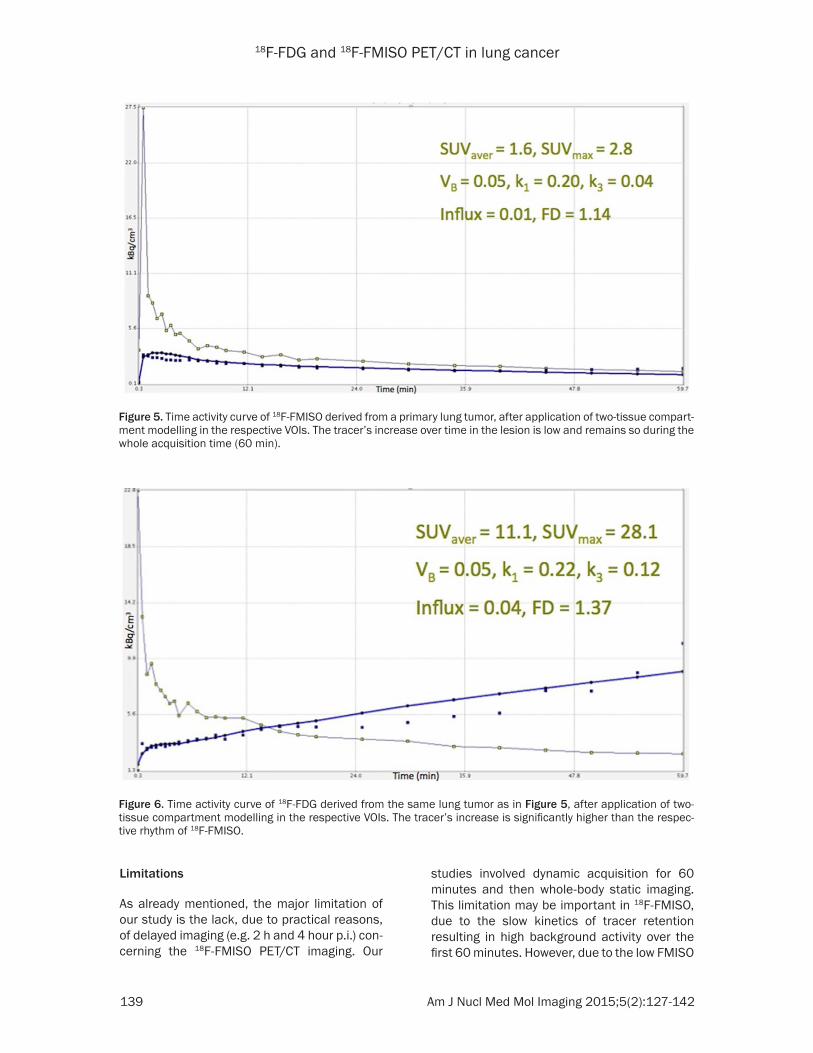
Figure 5. Time activity curve of 18F-FMISO derived from a primary lung tumor, after application of two-tissue compart-ment modelling in the respective VOIs. The tracer’s increase over time in the lesion is low and remains so during the whole acquisition time (60 min).
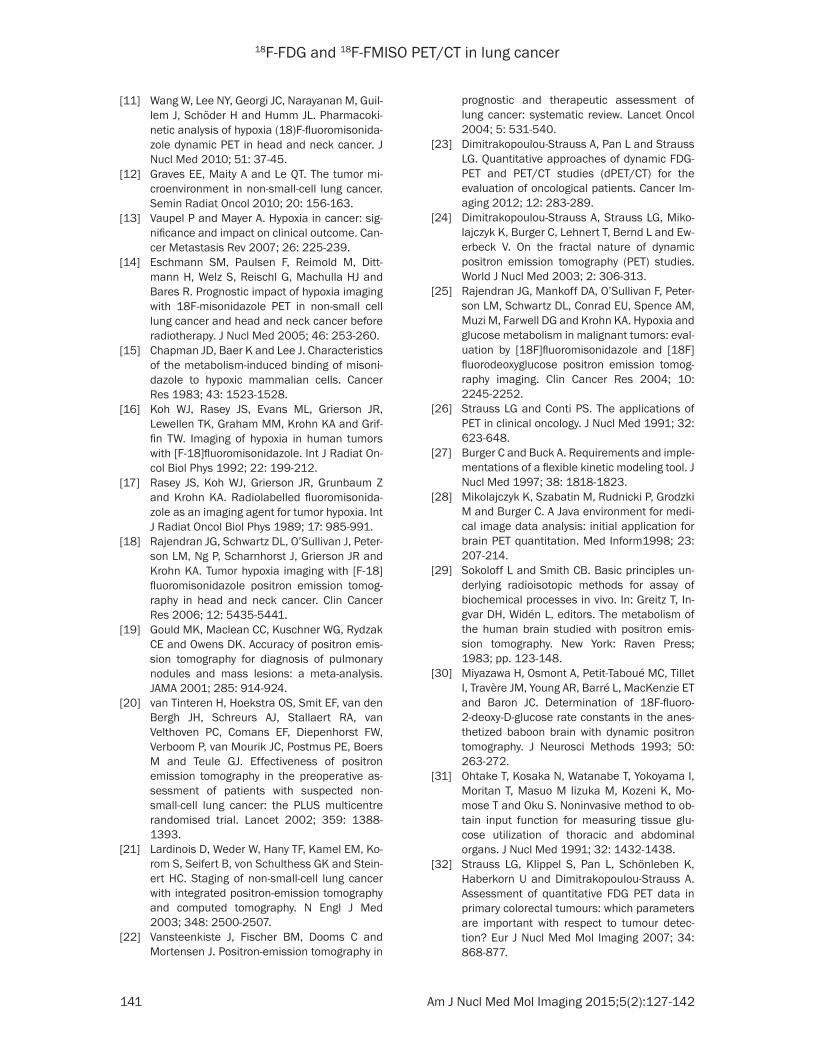
Figure 6. Time activity curve of 18F-FDG derived from the same lung tumor as in Figure 5, after application of two-tissue compartment modelling in the respective VOIs. The tracer’s increase is significantly higher than the respec-tive rhythm of 18F-FMISO.

18F-FDG and 18F-FMISO PET/CT in lung cancer
140 Am J Nucl Med Mol Imaging 2015;5(2):127-142
uptake in the normal surrounding lung paren-chyma, the uptake in the tumor was clearly vis-ible, but low. Nevertheless, we tried to over-come this obstacle with the employment of time-activity curves (TACs) derived from VOIs placed over the lung tumors after application of two-tissue compartment modelling. With the exception of one tumor that showed intense 18F-FMISO accumulation, the TACs derived from all other primary tumors demonstrated a steady low increase in which the tracer is concentrat-ed over time in the lesion (Figure 5). Based on the behaviour of the tracer during the first 60 minutes, we assume that this steady low increase of 18F-FMISO accumulation in the tumor area would not change significantly if late acquisition would be performed. This is in accordance to other studies mentioned before [14, 39-42]. In contrary to the TACs derived from 18F-FMISO, the respective TACs from 18F-FDG showed a steady increase reflecting the increase of tracer accumulation during dynam-ic PET acquisition (Figure 6). Another limitation was the small number of patients included.
Conclusion
We performed a double-tracer PET/CT study with the agents 18F-FDG and 18F-FMISO in patients with advanced NSCLC scheduled for IMRT. In terms of clinical practice, our results confirmed the utility of 18F-FDG PET/CT in the diagnostic approach of the malignancy by excluding 6/13 (46%) patients with distant metastases from radical radiation treatment. On the other hand, imaging with 18F-FMISO PET/CT didn’t significantly aid in the manage-ment of our patient group. Only one subject demonstrated increased 18F-FMISO tumor uptake, reflecting its potential sensitivity to radiotherapy. Based on the pharmacokinetic results, the lack of correlation between 18F-FDG and 18F-FMISO implies the discordance bet- ween increased glycolysis and hypoxia in the malignancy. To our knowledge this is the first study evaluating the distribution patterns and pharmacokinetics of these two tracers in NSCLC by means of dynamic PET/CT scanning. It is an undisputable fact that further studies are warranted in order to clarify the potential role of 18F-FMISO PET/CT in the diagnostic workup and management of the malignancy as already proposed [14, 45, 46].
Disclosure of conflict of interest
The authors declare that they have no conflict of interest.
Address correspondence to: Dr. Christos Sachpe- kidis, Medical PET Group - Biological Imaging, Clinical Cooperation Unit Nuclear Medicine, German Cancer Research Center, Im Neuenheimer Feld 280, D-69210 Heidelberg. E-mail: [email protected]; [email protected]
References
[1] American Cancer Society: Cancer Facts and Figures 2014. Atlanta, Ga: American Cancer Society, 2014.
[2] Sequist LV. Non-small cell lung cancer. In: Chabner BA, Lynch TJ Jr, Longo DL, editors. Harrison’s Manual of Oncology. McGraw-Hill Companies, Inc.; 2008. pp. 455-468.
[3] Askoxylakis V, Dinkel J, Eichinger M, Stieltjes B, Sommer G, Strauss LG, Dimitrakopoulou-Strauss A, Kopp-Schneider A, Haberkorn U, Hu-ber PE, Bischof M, Debus J and Thieke C. Mul-timodal hypoxia imaging and intensity modu- lated radiation therapy for unresectable non-small-cell lung cancer: the HIL trial. Radiat On-col 2012; 7: 157.
[4] Chemotherapy in non-small cell lung cancer: a meta-analysis using updated data on individu-al patients from 52 randomised clinical trials. Non-small Cell Lung Cancer Collaborative Group. BMJ 1995; 311: 899-909.
[5] Rowell NP and O’rourke NP. Concurrent chemo-radiotherapy in non-small cell lung cancer. Co-chrane Database Syst Rev 2004; 4: CD00- 2140.
[6] Anderson CS and Curran WJ. Combined modal-ity therapy for stage III non-small-cell lung can-cer. Semin Radiat Oncol 2010; 20: 186-191.
[7] National Cancer Institute. Available at: Ac-cessed March 22 2014.
[8] Brizel DM, Scully SP, Harrelson JM, Layfield LJ, Bean JM, Prosnitz LR and Dewhirst MW. Tumor oxygenation predicts for the likelihood of dis-tant metastases in human soft tissue sarco-ma. Cancer Res 1996; 56: 941-943.
[9] Movsas B, Chapman JD, Hanlon AL, Horwitz EM, Greenberg RE, Stobbe C, Hanks GE and Pollack A. Hypoxic prostate/muscle pO2 ratio predicts for biochemical failure in patients with prostate cancer: preliminary findings. Urology 2002; 60: 634-639.
[10] Brizel DM, Sibley GS, Prosnitz LR, Scher RL and Dewhirst MW. Tumor hypoxia adversely affects the prognosis of carcinoma of the head and neck. Int J Radiat Oncol Biol Phys 1997; 38: 285-289.
18F-FDG and 18F-FMISO PET/CT in lung cancer
141 Am J Nucl Med Mol Imaging 2015;5(2):127-142
[11] Wang W, Lee NY, Georgi JC, Narayanan M, Guil-lem J, Schöder H and Humm JL. Pharmacoki-netic analysis of hypoxia (18)F-fluoromisonida-zole dynamic PET in head and neck cancer. J Nucl Med 2010; 51: 37-45.
[12] Graves EE, Maity A and Le QT. The tumor mi-croenvironment in non-small-cell lung cancer. Semin Radiat Oncol 2010; 20: 156-163.
[13] Vaupel P and Mayer A. Hypoxia in cancer: sig-nificance and impact on clinical outcome. Can-cer Metastasis Rev 2007; 26: 225-239.
[14] Eschmann SM, Paulsen F, Reimold M, Ditt-mann H, Welz S, Reischl G, Machulla HJ and Bares R. Prognostic impact of hypoxia imaging with 18F-misonidazole PET in non-small cell lung cancer and head and neck cancer before radiotherapy. J Nucl Med 2005; 46: 253-260.
[15] Chapman JD, Baer K and Lee J. Characteristics of the metabolism-induced binding of misoni-dazole to hypoxic mammalian cells. Cancer Res 1983; 43: 1523-1528.
[16] Koh WJ, Rasey JS, Evans ML, Grierson JR, Lewellen TK, Graham MM, Krohn KA and Grif-fin TW. Imaging of hypoxia in human tumors with [F-18]fluoromisonidazole. Int J Radiat On-col Biol Phys 1992; 22: 199-212.
[17] Rasey JS, Koh WJ, Grierson JR, Grunbaum Z and Krohn KA. Radiolabelled fluoromisonida-zole as an imaging agent for tumor hypoxia. Int J Radiat Oncol Biol Phys 1989; 17: 985-991.
[18] Rajendran JG, Schwartz DL, O’Sullivan J, Peter-son LM, Ng P, Scharnhorst J, Grierson JR and Krohn KA. Tumor hypoxia imaging with [F-18] fluoromisonidazole positron emission tomog-raphy in head and neck cancer. Clin Cancer Res 2006; 12: 5435-5441.
[19] Gould MK, Maclean CC, Kuschner WG, Rydzak CE and Owens DK. Accuracy of positron emis-sion tomography for diagnosis of pulmonary nodules and mass lesions: a meta-analysis. JAMA 2001; 285: 914-924.
[20] van Tinteren H, Hoekstra OS, Smit EF, van den Bergh JH, Schreurs AJ, Stallaert RA, van Velthoven PC, Comans EF, Diepenhorst FW, Verboom P, van Mourik JC, Postmus PE, Boers M and Teule GJ. Effectiveness of positron emission tomography in the preoperative as-sessment of patients with suspected non-small-cell lung cancer: the PLUS multicentre randomised trial. Lancet 2002; 359: 1388-1393.
[21] Lardinois D, Weder W, Hany TF, Kamel EM, Ko-rom S, Seifert B, von Schulthess GK and Stein-ert HC. Staging of non-small-cell lung cancer with integrated positron-emission tomography and computed tomography. N Engl J Med 2003; 348: 2500-2507.
[22] Vansteenkiste J, Fischer BM, Dooms C and Mortensen J. Positron-emission tomography in
prognostic and therapeutic assessment of lung cancer: systematic review. Lancet Oncol 2004; 5: 531-540.
[23] Dimitrakopoulou-Strauss A, Pan L and Strauss LG. Quantitative approaches of dynamic FDG-PET and PET/CT studies (dPET/CT) for the evaluation of oncological patients. Cancer Im-aging 2012; 12: 283-289.
[24] Dimitrakopoulou-Strauss A, Strauss LG, Miko-lajczyk K, Burger C, Lehnert T, Bernd L and Ew-erbeck V. On the fractal nature of dynamic positron emission tomography (PET) studies. World J Nucl Med 2003; 2: 306-313.
[25] Rajendran JG, Mankoff DA, O’Sullivan F, Peter-son LM, Schwartz DL, Conrad EU, Spence AM, Muzi M, Farwell DG and Krohn KA. Hypoxia and glucose metabolism in malignant tumors: eval-uation by [18F]fluoromisonidazole and [18F]fluorodeoxyglucose positron emission tomog-raphy imaging. Clin Cancer Res 2004; 10: 2245-2252.
[26] Strauss LG and Conti PS. The applications of PET in clinical oncology. J Nucl Med 1991; 32: 623-648.
[27] Burger C and Buck A. Requirements and imple-mentations of a flexible kinetic modeling tool. J Nucl Med 1997; 38: 1818-1823.
[28] Mikolajczyk K, Szabatin M, Rudnicki P, Grodzki M and Burger C. A Java environment for medi-cal image data analysis: initial application for brain PET quantitation. Med Inform1998; 23: 207-214.
[29] Sokoloff L and Smith CB. Basic principles un-derlying radioisotopic methods for assay of biochemical processes in vivo. In: Greitz T, In-gvar DH, Widén L, editors. The metabolism of the human brain studied with positron emis-sion tomography. New York: Raven Press; 1983; pp. 123-148.
[30] Miyazawa H, Osmont A, Petit-Taboué MC, Tillet I, Travère JM, Young AR, Barré L, MacKenzie ET and Baron JC. Determination of 18F-fluoro-2-deoxy-D-glucose rate constants in the anes-thetized baboon brain with dynamic positron tomography. J Neurosci Methods 1993; 50: 263-272.
[31] Ohtake T, Kosaka N, Watanabe T, Yokoyama I, Moritan T, Masuo M Iizuka M, Kozeni K, Mo-mose T and Oku S. Noninvasive method to ob-tain input function for measuring tissue glu-cose utilization of thoracic and abdominal organs. J Nucl Med 1991; 32: 1432-1438.
[32] Strauss LG, Klippel S, Pan L, Schönleben K, Haberkorn U and Dimitrakopoulou-Strauss A. Assessment of quantitative FDG PET data in primary colorectal tumours: which parameters are important with respect to tumour detec-tion? Eur J Nucl Med Mol Imaging 2007; 34: 868-877.
18F-FDG and 18F-FMISO PET/CT in lung cancer
142 Am J Nucl Med Mol Imaging 2015;5(2):127-142
[33] Jakoby BW, Bercier Y, Conti M, Casey ME, Bendriem B and Townsend DW. Physical and clinical performance of the mCT time-of-flight PET/CT scanner. Phys Med Biol 2011; 56: 2375-2389.
[34] Bradley JD, Moughan J, Graham MV, Byhardt R, Govindan R, Fowler J, Purdy JA, Michalski JM, Gore E and Choy H. A phase I/II radiation dose escalation study with concurrent chemo-therapy for patients with inoperable stages I to III non-small-cell lung cancer: phase I results of RTOG 0117. Int J Radiat Oncol Biol Phys 2010; 77: 367-372.
[35] Pieterman RM, van Putten JW, Meuzelaar JJ, Mooyaart EL, Vaalburg W, Koëter GH, Fidler V, Pruim J and Groen HJ. Preoperative staging of non-small-cell lung cancer with positron-emis-sion tomography. N Engl J Med 2000; 343: 254-261.
[36] Nunn A, Linder K and Strauss HW. Nitroimid-azoles and imaging hypoxia. Eur J Nucl Med 1995; 22: 265-280.
[37] Lee ST and Scott AM. Hypoxia positron emis-sion tomography imaging with 18f-fluoromiso-nidazole. Semin Nucl Med 2007; 37: 451-461.
[38] van Elmpt W, Zegers CM, Das M and De Ruys-scher D. Imaging techniques for tumour delin-eation and heterogeneity quantification of lung cancer: overview of current possibilities. J Tho-rac Dis 2014; 6: 319-327.
[39] Cherk MH, Foo SS, Poon AM, Knight SR, Mur-one C, Papenfuss AT, Sachinidis JI, Saunder TH, O’Keefe GJ and Scott AM. Lack of correla-tion of hypoxic cell fraction and angiogenesis with glucose metabolic rate in non-small cell lung cancer assessed by 18F-Fluoromisonida-zole and 18F-FDG PET. J Nucl Med 2006; 47: 1921-1926.
[40] Thorwarth D, Eschmann SM, Scheiderbauer J, Paulsen F and Alber M. Kinetic analysis of dy-namic 18F-fluoromisonidazole PET correlates with radiation treatment outcome in head-and-neck cancer. BMC Cancer 2005; 5: 152.
[41] Hicks RJ, Rischin D, Fisher R, Binns D, Scott AM and Peters LJ. Utility of FMISO PET in ad-vanced head and neck cancer treated with chemoradiation incorporating a hypoxia-tar-geting chemotherapy agent. Eur J Nucl Med Mol Imaging 2005; 32: 1384-1391.
[42] Tachibana I, Nishimura Y, Shibata T, Kanamori S, Nakamatsu K, Koike R, Nishikawa T, Ishika-wa K, Tamura M and Hosono M. A prospective clinical trial of tumor hypoxia imaging with 18F-fluoromisonidazole positron emission tomog-raphy and computed tomography (F-MISO PET/CT) before and during radiation therapy. J Radiat Res 2013; 54: 1078-1084.
[43] Minn H, Clavo AC and Wahl RL. Influence of hy-poxia on tracer accumulation in squamous-cell carcinoma: in vitro evaluation for PET imaging. Nucl Med Biol 1996; 23: 941-946.
[44] Sachpekidis C, Goldschmidt H, Hose D, Pan L, Cheng C, Kopka K, Haberkorn U and Dimitrako-poulou-Strauss A. PET/CT studies of multiple myeloma using 18F-FDG and 18F-NaF: compari-son of distribution patterns and tracers’ phar-macokinetics. Eur J Nucl Med Mol Imaging 2014; 41: 1343-1353.
[45] Bollineni VR, Wiegman EM, Pruim J, Groen HJ and Langendijk JA. Hypoxia imaging using Pos-itron Emission Tomography in non-small cell lung cancer: implications for radiotherapy. Cancer Treat Rev 2012; 38: 1027-1032.
[46] Gagel B, Reinartz P, Demirel C, Kaiser HJ, Zim-ny M, Piroth M, Pinkawa M, Stanzel S, Asad-pour B, Hamacher K, Coenen HH, Buell U and Eble MJ. [18F] fluoromisonidazole and [18F] fluorodeoxyglucose positron emission tomog-raphy in response evaluation after chemo-/ra-diotherapy of non-small-cell lung cancer: a fea-sibility study. BMC Cancer 2006; 6: 51.


![Courtois, Paul (18..-18..? ; compositeur). [Les yeux noirs !]Les ...](https://static.fdokumen.com/doc/165x107/6324c645cedd78c2b50c444e/courtois-paul-18-18-compositeur-les-yeux-noirs-les-.jpg)

![18 FDG, [ 18 F]FLT, [ 18 F]FAZA, and 11 C-Methionine Are Suitable Tracers for the Diagnosis and In Vivo Follow-Up of the Efficacy of Chemotherapy by miniPET in Both Multidrug Resistant](https://static.fdokumen.com/doc/165x107/633771540026af93cb02bbe7/18-fdg-18-fflt-18-ffaza-and-11-c-methionine-are-suitable-tracers-for-the.jpg)