Combined Heat and Power Systems for New Part 3 Multi ...
53
Combined Heat and Power Systems for New Part 3 Multi-Family Residential Buildings Designed to Meet SB-10, Division 3, Chapter 1 Emissions Requirements: Final Report for Municipal Building Officials Sustainable Buildings Canada 416-752-3535 ext. 1 January 20, 2020
-
Upload
khangminh22 -
Category
Documents
-
view
2 -
download
0
Transcript of Combined Heat and Power Systems for New Part 3 Multi ...

Combined Heat and Power Systems for
New Part 3 Multi-Family Residential
Buildings
Designed to Meet
SB-10, Division 3, Chapter 1
Emissions Requirements:
Final Report for Municipal Building Officials
Sustainable Buildings Canada
416-752-3535 ext. 1
January 20, 2020

2
Foreword
The Author of this report, H.R.(Bob) Bach, P.Eng., has been involved in energy efficiency and
conservation in the Building Code for over 30 years, including these projects:
1986‐89: President, HRAI Technical Services Division Inc. Managed the development of new
mechanical systems standards and installer training delivery nationally for Energy Mines and
Resources Canada (now NRCan) for the R‐2000 program.
1991: Managed the development of the Savings By Design program for Ontario Hydro that was
based on the use of ASHRAE 90.1‐1989 as the design standard.
1992: Developed and delivered a one‐day training program for architects and engineers on
ASHRAE 90.1 – 1989 and presented this to over 450 attendees in sessions held across the
province.
1993: Assisted the Ministry of Municipal Affairs and Housing (MMAH) in the adaptation and
incorporation of ASHRAE 90.1‐1989 into the Building Code by an amendment dated July 1, 1993,
including the development of Supplementary Standard SB‐1.
1993: Developed and delivered a two‐day training program for municipal building officials to
over 600 attendees in sessions held across the province, with the assistance of the OBOA, which
included a final test.
1995: Prepared a report to MMAH on the actual cost added to MURBS due to the requirement
to meet ASHRAE 90.1‐1989. This report found that, in the two year period following the
incorporation of Standard 90.1‐1989, the cost of Low‐e fenestration had fallen by 40%. Also, as a
direct result of the competitive nature of the sub‐contractor selection process, several
innovative approaches to meet building envelope thermal performance were being provide to
the projects at little or no extra cost.
1997: Prepared a report on the impact of the introduction of the Canadian Model National
Energy Code 1997 into the Building Code. This energy code was incorporated into the Building
Code later that year.
1998 – 2005: Developed and delivered training programs for Enbridge, assisted by the Ontario
Association of Architects, that demonstrated how the energy performance requirements in the
Building Code could be exceeded using innovative approaches.
2004 – 2011: Chairman of the Mechanical Services Advisory Committee (MSAC), a
subcommittee of the Toronto Area Chief Building Officials Committee (TACBOC).
2009: Invited by MMAH to be the co‐Chair of the newly formed Building Code Energy Advisory
Council that was mandated by the Green Energy and Green Economy Act in order to advise the
Minister of MMAH on energy efficiency in new buildings and housing. In 2012, this was renamed
the Building Code Conservation Advisory Council due to the addition of water conservation to its
responsibility. Also with this change, title became vice‐Chair, Energy.
2016: Prepared, with the assistance of a sub‐committee, a report to the Minister that examined
the history of improvements in energy conservation for Part 3 buildings in the Building Code,
and projected that a consistent improvement of 15% for each new edition of Supplementary
Standard SB‐10 = assuming a 5 year schedule – could be met on a cost‐effective basis, and
would make a major contribution to reducing Ontario’s carbon footprint for Ontario to meet its
share of the national targets for 2030.

1
TableofContentsExecutive Summary
Executive Summary ............................................................................................................................... 2
1.0 Introduction ............................................................................................................................. 3
1.1 Supplementary Standard SB‐10: Background on CO2e Emissions ....................................................... 3
1.1.1 Comments on Emissions Factors ..................................................................................................... 5
1.2 What is Combined Heat and Power? .................................................................................................. 5
2.0 Consulting Components ............................................................................................................ 7
2.1 EQ Building Performance – Archetype Building .................................................................................. 7
2.2 Power Advisory LLC – Electricity Grid Emissions ............................................................................... 10
Electricity Grid Operations .................................................................................................................. 10
2.2.1 Power Advisory Methodology........................................................................................................ 10
Results ................................................................................................................................................. 11
2.3 POWER GENySYS: CHP Operational Emissions Performance ........................................................... 13
2.3.1PG Hourly CHP Simulation Model ............................................................................................... 13
3.0 Conclusions and Recommendations ........................................................................................ 15
Appendix A .........................................................................................................................................A-1
Appendix B .........................................................................................................................................A-3
Appendix C .........................................................................................................................................A-5

2
ExecutiveSummary
Sustainable Buildings Canada (“SBC”) has undertaken this project for Enbridge that provides a resolution
to the issues that have arisen from the introduction of the significant reduction in electricity grid CO2e
emissions in Supplementary Standard SB10 from a marginal factor of 0.400 kg/kWh in Division 2 to an
average factor of 0.050 kg/kWh in Division 3, and whether this should eliminate the use of Combined
Heat and Power (CHP) systems, and some other system types, that could be included in the design of a
new Part 3 multi‐unit residential building (MURB).
The total project includes the following components:
i. An hourly analysis of electricity and natural gas loads for a Part 3 energy archetype multi‐unit
residential building (MURB) that has been designed to meet the energy efficiency requirements
of Supplementary Standard SB‐10 (effective January 1, 2017) Divisions 1 and 3, derived from the
energy model used during the design process and based on the final design, and provided by EQ
Building Performance.
ii. An average hourly electricity grid emissions profile, based on data for 2014, 2015, 2016 and
2017, derived from publically available records of the operation of the electricity grid and
converted using generally accepted methods for determining grid emissions, projected forward
for the period 2018 to 2038, provided by Power Advisory LLC directly to Enbridge Gas
Distribution.
iii. A CHP simulation program that provides hourly operations data using a variety of inputs
including building loads, fuel amounts and costs, and emissions evaluation, throughout various
operating conditions, and provided by POWER GENySYS.
This report fully describes the Project, and includes the reports prepared by EQ Building Performance,
Power Advisory LLC, and POWER GENySYS, and are provided in Appendix A, Appendix B, and Appendix
C, respectively.
This report demonstrates that for this Archetype MURB, all of the CHP units and their applications
included in the simulations of the Proposed Design with CHP and the Reference Building without CHP
resulted in lower emissions for the Proposed Design over the Reference Building.
In Section 3.0, this Report concludes that, for any MURB application equipped with a CHP unit, providing
that both the electricity and the heat from the CHP unit are utilized and consumed together in the
building on an economic basis, the emissions from the building with CHP will always be lower than for
the same building without CHP.
This Report further recommends that Permit Applications for a Part 3 MURB having a CHP system that
are accompanied by this report be accepted as meeting the current CO2e emissions requirements of SB‐
10 Division 3, Chapter 1.

3
1.0 Introduction
Sustainable Buildings Canada (SBC), in conjunction with its delivery of the Enbridge Savings By Design
program, undertook an accurate evaluation of the emissions that would result from the hourly
simulation of building loads, grid emissions, and combined heat and power (CHP) operation. The three
organizations that provided specific expertise Include:
EQ Building Performance (EQBP), for the archetype hourly energy model of a typical Part 3
multi‐unit residential building (MURB), designed to meet the energy efficiency requirements of
SB‐10 (2017) Division 3.
Power Advisory LLC (PA), who undertook the determination of the hourly electricity grid
emissions for Ontario based on the years 2014 through 2017, and projected for the years 2018
through 2038,
POWER GENySYS (PG), who provided their CHP hourly operating model to determine the CO2e
emissions for the Proposed Design and the Reference Building of the archetype MURB, using the
CO2e emissions provided by PA, for a wide variety of CHP capacities, building loads, and
operating schedules, for CHP units with internal combustion engine.
1.1SupplementaryStandardSB‐10:BackgroundonCO2eEmissions
In September 2012, the Ministry of Municipal Affairs (“Ministry”) published a new edition of
Supplementary Standard SB‐10, that applies mainly to Part 3 buildings, and that was scheduled to come
into force on January 1, 2014 [SB‐10 (01/01/2014). This edition introduced Carbon Dioxide Equivalents in
Division 2, Chapter 1, subsection 1.1.2.2, ,and a requirement to evaluate CO2e (Carbon Dioxide
equivalent) emissions using the emissions factors provided in Table 1.1.2.2, with the further
requirement that emissions for the Proposed Design must be equal to or less than those from the
Reference Building. This requirement applied to both of the optional energy codes. The factor for Grid
Delivered Electricity was identified as “marginal based on natural gas” and given as 0.400 kg/kWh,
In December 2016, the Ministry published a new edition of Supplementary Standard SB‐10, (SB‐10
01/01/2017). In this document, Division 2 is unchanged from the previous version of SB‐10
(01/01/2014), and was permitted to continue to be used for buildings for which a permit had been
applied for before December 31, 2016, at the proponents option, provided the energy efficiency of the
building is increased by 5% or 25%, depending upon the energy code selected. The C02e emissions factor
for Grid delivered electricity specified in Chapter 1 remained at 0.400 kg/kWh.
SB‐10 (01/01/2017) Division 3 applies to construction for which a permit application has been submitted
after December 31, 2016, and achieves the targeted energy efficiency improvement through the use of
either the Prescriptive or Performance path of either energy code.
For purposes of this Project, the key difference between these two Divisions was the reduction of the
CO2e for Electricity, specified in Division 3, Chapter 1, Table 1.1.2.2; and based on an average value for
the year 2014, was then specified as 0.050 kg/kWh

4
When questioned on this, the reason given by the Ministry of Municipal Affairs and Housing, Building
and Development Branch, was simply that they had requested a value from the Independent Electricity
Operator (IESO), and were provided with the 2014 average value.
The following information, taken from SB‐10 (01/01/2017), highlights this change.
‐‐‐‐‐‐‐‐‐‐‐‐‐‐‐‐‐‐‐‐‐‐‐‐‐‐‐‐‐‐‐‐‐‐‐‐‐‐‐‐‐‐‐‐‐‐‐‐‐‐‐‐‐‐‐‐‐‐‐‐‐‐‐‐‐‐//‐‐‐‐‐‐‐‐‐‐‐‐‐‐‐‐‐‐‐‐‐‐‐‐‐‐‐‐‐‐‐‐‐‐‐‐‐‐‐‐‐‐‐‐‐‐‐‐‐‐‐‐‐‐‐‐‐‐‐‐‐‐‐‐
SB‐10 (01/01/2017), Division 2, Chapter 1, Article 1.1.2.2., Carbon Dioxide Equivalents
(1) The annual CO2e emission level from a building shall be determined in accordance with good
engineering practice using the CO2e emission factors listed in Table 1.1.2.2.
Table 1.1.2.2. CO2e Emission Factors Forming Part of Sentence 1.1.2.2.(1)
Building Energy Sources CO2e, (kg/kWh)
Grid Delivered Electricity (marginal based on
natural gas)
0.400
LPG or Propane 0.274
Fuel Oil 0.312
Gasoline 0.309
Natural Gas 0.191
‐‐‐‐‐‐‐‐‐‐‐‐‐‐‐‐‐‐‐‐‐‐‐‐‐‐‐‐‐‐‐‐‐‐‐‐‐‐‐‐‐‐‐‐‐‐‐‐‐‐‐‐‐‐‐‐‐‐‐‐‐‐‐ // ‐‐‐‐‐‐‐‐‐‐‐‐‐‐‐‐‐‐‐‐‐‐‐‐‐‐‐‐‐‐‐‐‐‐‐‐‐‐‐‐‐‐‐‐‐‐‐‐‐‐‐‐‐‐‐‐‐‐‐‐‐‐‐‐‐‐‐
SB‐10 (01/01/2017), Division 3, Chapter 1, Article 1.1.2.2., Carbon Dioxide Equivalents
(1) The annual CO2e emission level from a building shall be determined in accordance with good
engineering practice using the CO2e emission factors listed in Table 1.1.2.2.
Table 1.1.2.2. CO2e Emission Factors Forming Part of Sentences 1.1.2.2.(1) and (5)
Building Energy Sources Emission Factor
Electricity (average for 2014) 0.050 kgCO2e / kWh
Natural Gas 1.899 kgCO2e / m3
Propane 1.548 kgCO2e / L
Heating Oil 2.755 kgCO2e / L

5
Notes to Table 1.1.2.2.
1. Factors are expressed in units of CO2 equivalent (CO2e) so as to encompass the global warming effects
of all relevant greenhouse gases (CO2, CH4, and N2O).
2. Non‐CO2 emission components are technology dependent and vary by application; the above factors
assume the most common and likely applications.
3. Electricity emission factor is an average consumption intensity factor for the year 2014; electricity
factors are subject to change on an annual basis depending on the mix of generation in a particular year.
Use the latest available published data.
4. Factors are expressed in their native units (e.g. kWh, m3, or litre) and conversion to other common
units (e.g. kgCO2e / GJ) is possible through calculation; a suggested list of unit conversions is available
from the National Energy Board.
5. The table is not comprehensive or exhaustive and not necessarily representative of every energy
source that may be encountered in a project; other factors may be used on a case‐by‐case basis with
appropriate methodological justification.1
6. Emission factors are sourced from Environment and Climate Change Canada’s 2016 National
Inventory Report (NIR) unless otherwise noted and values have been rounded; further information on
emission factors can be found in Annex 6 of Part 2 of the 2016 NIR which can be downloaded.
‐‐‐‐‐‐‐‐‐‐‐‐‐‐‐‐‐‐‐‐‐‐‐‐‐‐‐‐‐‐‐‐‐‐‐‐‐‐‐‐‐‐‐‐‐‐‐‐‐‐‐‐‐‐‐‐‐‐‐‐‐‐‐ // ‐‐‐‐‐‐‐‐‐‐‐‐‐‐‐‐‐‐‐‐‐‐‐‐‐‐‐‐‐‐‐‐‐‐‐‐‐‐‐‐‐‐‐‐‐‐‐‐‐‐‐‐‐‐‐‐‐‐‐‐‐‐‐‐‐‐‐‐
1.1.1CommentsonEmissionsFactors
The very significant change in the CO2e Emissions Factor of 0.400 kg/kWh in Division 2 and 0.050
kg/kWh in Division 3, a reduction to one‐eighth of the original factor, reflects a difference in approach
from a factor that is based on the marginal electricity provided by natural gas powered generators used
mainly for peak generation, and the average emissions for the year 2014, respectively. Use of the former
value suggests that the electricity supplied to all new buildings will always add to the system peak load
no matter what time of day or season of the year, while the use of the latter value suggests that
emissions from the grid are constant no matter what time of day or season of the year, and that the
load of the building is at a constant level for every day of every year.
It is clear that neither emissions factor produces an accurate estimate. However, the use of Combined
Heat and Power (CHP) systems is especially penalized by using the average factor of 0.050 kg/kWh.
A careful examination of Note 5 to Table 1.1.2.2 in Division 3 suggests that emissions factors may be
developed for other energy sources and technologies, and may be used on a case‐by‐case basis with
appropriate methodological justification. This report provides such a justification for CHP units when
applied to a Part 3 MURB Building Permit application.
1.2WhatisCombinedHeatandPower?
Combined Heat and Power (CHP) is an energy efficient technology that generates electricity and
captures the heat that would otherwise be wasted to provide useful thermal energy—such as steam or
hot water—that can be used for space heating, domestic hot water, and in some application space
1 This note is in bold to emphasize its significance to this project.

cooling, a
connected
where the
Nearly tw
discharge
distributio
by avoidin
typical tec
The key is
possible, a
Design wi
both Spac
A MURB i
deemed a
througho
and applic
MURB, an
2 3 https://w
nd even indu
d to a buildin
ere is a need
wo‐thirds of th
d to the atmo
on of electric
ng distributio
chnologies (i.
Figure 1‐1: C
ssue for an ef
and to use th
ll be as low a
ce Heating an
s an ideal can
a “seasonal” l
ut the entire
cations such a
nd that if thes
www.researc
ustrial process
g, or be a dist
for both elec
he energy use
osphere or a
ity to end use
n losses, CHP
e., conventio
Combined He
fficient CHP a
is to offset th
s possible. A
nd Hot Water
ndidate for a
oad) and a Se
year. (Note a
as swimming
se are indoors
hgate.net/fig
ses. A CHP un
trict energy o
tricity and th
ed by convent
nearby lake o
ers. By captur
P can achieve
onal electricity
eat and Powe
pplication is t
hermal loads.
As can be seen
Supply (Servi
CHP applicati
ervice Water
also that Serv
pool and hot
s, their loads
gure/Combine
nit can be loca
or utility resou
ermal energy
tional electric
or river. Addit
ring and using
efficiencies o
y generation
er System Sch
to be able to
This also me
n in the Typic
ice Water He
ion because i
Heating Load
ice Water He
t tub heating,
are also cons
ed‐Heat‐Powe
ated at an ind
urce. CHP is t
y.
city generatio
tional energy
g heat that w
of over 80%, c
and an on‐sit
hematic and
capture as m
eans that CO2
al Application
ating).
t has both a S
d that is relati
ating can inc
, such as may
sistent year ro
er‐CHP‐syste
dividual facilit
typically locat
on is wasted i
y is wasted du
would otherwi
compared to
te boiler).2
Efficiency Dia
much of the he
2e emissions f
n Schematic,
Space Heating
ively consiste
lude both do
y be found in
ound).
m_fig4_2783
ty that is part
ted at facilitie
n the form of
uring the
se be wasted
less than 50%
agrams3
eat available
or the Propos
this can inclu
g load (also
ent in scale
mestic hot w
the amenitie
389893 6
t of or
es
f heat
d, and
% for
as
sed
ude
ater
s in a

2.0
The three
reports ca
2.1EQBEQ Buildin
MURBs, h
recent ex
The energ
including
Toronto, O
1 shows t
very simil
The energ
Code for B
output wa
Heating, I
broken do
The buildi
Cons
e consulting re
an be found in
BuildingPng Performan
having been fo
perience prov
gy archetype
associated am
Ontario, havi
he building g
ar load profil
gy efficiency w
Buildings (NE
as an hourly p
nterior and E
own into spec
ing annual pe
sultingCo
eports prepar
n the Append
Performannce (formerly
ounded as a d
viding energy
MURB buildin
menities, 1 st
ng a gross flo
raphic as use
es, it is offere
Fig
was modelled
CB) 2015, as
projection for
Exterior Lighti
cific building s
erformance is
omponent
red for this pr
dices.
nce–ArcheProvident En
division of Tri
y and water su
ng provided f
torey of retail
oorspace of 94
ed in the ener
ed as typical f
ure 2.1‐1: eQ
d to just meet
modified by S
r all loads, inc
ng, and Pum
spaces with t
s shown in Fig
ts
roject are des
etypeBuilnergy), is the
idel. They brin
ubmetering a
for this projec
l space and 2
437 m2 (101,5
rgy modelling
for this buildi
Quest Building
t the requirem
SB‐10 (2017)
cluding Space
ps and Fans.
their energy e
gure 2.1‐2.
scribed in this
ldingmost experie
ng this exper
and tracking,
ct has 8 store
levels of und
582 ft2) , and
g program. Sin
ng type.
g Rendering
ments of the
Division 3, Ch
e Heating, Spa
Each of these
end‐uses.
s section. The
enced energy
ience, along w
to this projec
eys of residen
derground pa
118 dwelling
nce MURBs in
Canadian Nat
hapters 1 and
ace Cooling, S
e loads has be
e complete
modelling fir
with their mo
ct.
tial space
rking, located
g units. Figure
n general hav
tional Energy
d 3. The final
Service Water
een further
7
rm for
ore
d in
e 2.1‐
e
y
r

It is intere
terms of p
Design Bu
4 Note thatemissions
Figure 2.1‐
esting to note
per cent annu
uildings, and F
Figure
Figure 2
t the GHG emisfactors for nat
‐2: eQuest En
e that the “En
ual energy use
Figure 2.1‐4 s
2.1‐3: Annua
2.1‐4: Annual
ssions are calcural gas and e
21.9%
18.3%
8.3%
EnergArc
nergy Model f
nergy Pie” cha
e by end‐ use
hows that fo
al Energy Con
Energy Cons
ulated as desclectricity.
%
4.5%
gy By Endchetype:
for Archetype
art for all MU
e. Figure 2.1‐3
r the Referen
sumption by
umption by E
cribed in SB‐10,
47.
d‐Use, EQPropose
e Building An
RBs bears a v
3 shows the E
nce Building.
y End‐Use – P
End‐Use – Re
, Division 3, Ch
1%
QBP MUed Design
nnual Perform
very close res
Energy Pie for
roposed Des
eference Build
hapter 1, using
RB n
Space Hea
Water He
Appliance
Lighting
Space Coo
mance4
semblance in
r the Propose
ign
ding
g the specified
ating
eating
es
oling
8
ed

Figure 2.1
National E
for the ye
Fig
Note that
Heating lo
two build
existing O
two loads
supplied b
5http://oeee=0
1‐5 shows the
Energy Use D
ear 2016.5
ure 2.1‐5: An
t for all three
oad ranges fro
ings are desig
Ontario MURB
s are always s
by electricity.
e.nrcan.gc.ca/c
N
e Energy Pie fo
atabase/Com
nnual Energy
charts, the Sp
om just less t
gned to the la
Bs that may ra
upplied by na
corporate/stat
29.3%
17.6%
1
NRCan NOn
or the Ontari
mprehensive E
Consumption
pace Heating
than 30% to ju
atest SB‐10 re
ange in age fr
atural gas (wh
tistics/neud/dp
.7% 2.3%
ational ntario Ap
o Apartment
Energy Use Da
n by End‐Use
load is just le
ust over 20%
equirements w
rom 5 years o
hen this is ava
pa/showTable.
49
Energy‐Upartmen
Energy Use u
atabase Table
e – Ontario Ap
ess than 50%
of the total a
while the thir
old to 25 year
ailable), and t
.cfm?type=CP&
9.1%
Use Datnts, 2016
using data fro
e 39 for Onta
partment Bui
of the total,
annual energy
rd chart is the
rs or older. In
the three oth
§or=res&ju
abase, 6
Space H
Water
Applian
Lighting
Space C
om the NRCan
ario Apartmen
ildings 2016
and the Wate
y use. The firs
e average for
n all cases, the
her loads are
uris=on&rn=39
Heating
Heating
nces
g
Cooling
9
n
nts
er
st
ese
9&pag

10
For the newer buildings, the benefits of a more energy efficient building envelope and heating plant are
contributing to a lower Space Heating load. Low‐flow fixtures and more efficient dishwashers and
clothes washers, all reduce hot water consumption, and combined with a more energy efficient water
heating plant, all contribute to a lower Service Water Heating load in the newer buildings.
The key issue is that the proportion of electrical and thermal loads in all three buildings is very similar.
More details about the archetype building and its architectural design, mechanical plant and systems,
lighting, miscellaneous design details, and energy use by end‐use, can be found in the EQ Building
Performance report in Appendix A.
2.2PowerAdvisoryLLC–ElectricityGridEmissions
Power Advisory LLC (PA) specializes in electricity market analysis and strategy, power procurement,
policy development, regulatory and litigation support, market design and project feasibility assessment.
Particular emphasis is placed on Ontario, the Northeast U.S. and the Maritime provinces.
ElectricityGridOperations
Over the past 10 years there has been a significant shift in the makeup and operation of Ontario’s electricity system due to a number of reasons:
Phase out of all coal fired generation
Increase in renewable generators across the Province.
Renegotiation of non‐utility generator contractor agreements.
Energy conservation and demand reduction or demand shift initiatives.
Time of Use Pricing shifting consumer behaviour.
Increase in embedded generation.
Refurbishment of nuclear units. Currently, natural gas is the primary, and perhaps the only, major direct greenhouse gas contributor to the operation of Ontario’s electricity grid.
2.2.1PowerAdvisoryMethodology
In 2017, Power Advisory LLC (Power Advisory) completed a Distributed Generation Combined
Heat and Power GHG Emission Impact Analysis (the report) for Enbridge, that evaluated the impact of
distributed generation combined heat and power on the operating hours of large gas‐fired generation in
the Ontario electricity market and ultimately the potential change to GHG emissions in the province. The
analysis in the report included the determination of GHG emissions factors for the Ontario electricity
market on an hourly basis based on historic energy fossil fuel generation production data from 2013 to
2016, and then using existing IESO generation data from 2015 to 2017 to determine an average hourly
marginal emission factor for electricity production during that period. In order to support this, time of
use based marginal emission factors for the years 2018 through 2038 were developed based on the
historical data as well as IESO electricity supply forecasts.

ResultsTable 2.2‐
2018 to 2
It should b
year unde
developed
follows.
In order t
reduction
hour of th
assigned t
Winter, Su
Figure 2.2
‐1 provides th
038 as calcula
be noted that
er considerati
d by PA were
o create this
n in Net Dema
he forecast pe
to one of the
ummer, and S
Table 2
2‐1 is a chart s
he forecast em
ated by the m
t this table is
ion, for each
used for the
summary em
and), the mix
eriod, with se
eight periods
Shoulder, as d
2.2‐1: Forecas
showing hour
mission facto
model.
a summary o
seasonal peri
Combined H
mission factors
of generation
eparate foreca
s, On‐Peak, O
defined in the
st Emission Fa
rly emissions
r, as well as t
of the hourly e
iod and each
eat and Powe
s (tonnes of G
n and their in
asts for each
Off‐Peak, and
e provincial R
actors by Sea
for the year 2
the average m
emissions fro
daily rate pe
er simulation
GHG emission
ndividual emis
of the Base Y
Mid‐Peak for
Regulated Pric
ason and Tim
2018.
marginal emis
om the electri
riod. The hou
s described in
n reduction pe
ssions were e
Years. Each fo
r each annul s
ce Plan.
me‐of‐Use Per
ssion factor fr
ical grid for e
urly data
n Section 2.3
er MWh of
estimated for
orecast hour w
season, includ
riod
11
rom
ach
that
each
was
ding

Figure 2‐‐2.1: Ontario Elecctricity Grid Hour
rly Emissions for 2018
122

13
From this chart, the following can be seen:
• The grid emissions vary hourly, daily, and seasonally as the generation mix changes to
meet electrical demand.
• The grid emissions rise in the summer months as the daily peak demand rises – this
requires the addition of more gas turbine generators to be brought online to meet this
demand, and these have significant CO2e emissions.
More details about the work performed by Power Advisory can be found in their report, included in
Appendix B.
2.3POWERGENySYS:CHPOperationalEmissionsPerformance
Established in 1997 and based in North York, Ontario, POWER GENySYS (PG) is a Canadian Engineering
firm specializing in privately owned generation systems. This includes Combined Heat and Power (CHP),
Combined Heat & Emergency Power (CHeP), and District Energy Systems, and these may be fueled by
any of natural gas, biogas and landfill gas.
Services include detailed engineering, equipment procurement, project and construction management,
contract administration, testing and commissioning, field review and witness testing, measurement and
verification confirmation testing and reports, operation and maintenance, automated dispatch and
system operation reports.
Applications have included greenhouses, hospitals, multi‐unit residential buildings (MURBs), district
energy systems, landfills, and a variety of other applications.
2.3.1PGHourlyCHPSimulationModelPG has, over 20 years, developed and continually improved their proprietary hourly CHP Simulation
Model to facilitate the evaluation of proposed CHP System projects. This model utilizes actual hourly
energy consumption data to accurately determine the amount of electricity and heat that can be
generated by a CHP system to offset a portion of a host building's electricity and thermal demands for
each of the 8760 hours per year, on an economic basis. For purposes of this project, PG modified their
model to be Emissions Capable, such that it could also calculate CO2e emissions for the Proposed Design
Building and the Reference Building, for each hour of the entire year.
This model was used to calculate six CHP scenarios for each of the Proposed Design and Reference
Building, with CHP units using internal combustion engines for each of these scenarios and engine
brands and capacities. The following provides more detail about the simulations that were run for each
building, and that were duplicated for every year from 2018 to 2038:
“CHP simulations sized to match 0%, 25%, 50%, 60%, 70%, and 100% of the total Space Heating
and the total Service Water Heating load, and assuming that the Service Water Heating load is less than
50% of total Thermal load.”
Table 2.3‐2 provides a summary of one set of simulations for the year 2020. Note that the PG simulation
tool included the correction for electrical transmission and distribution losses, as specified in the PA
report, Page 6.
14
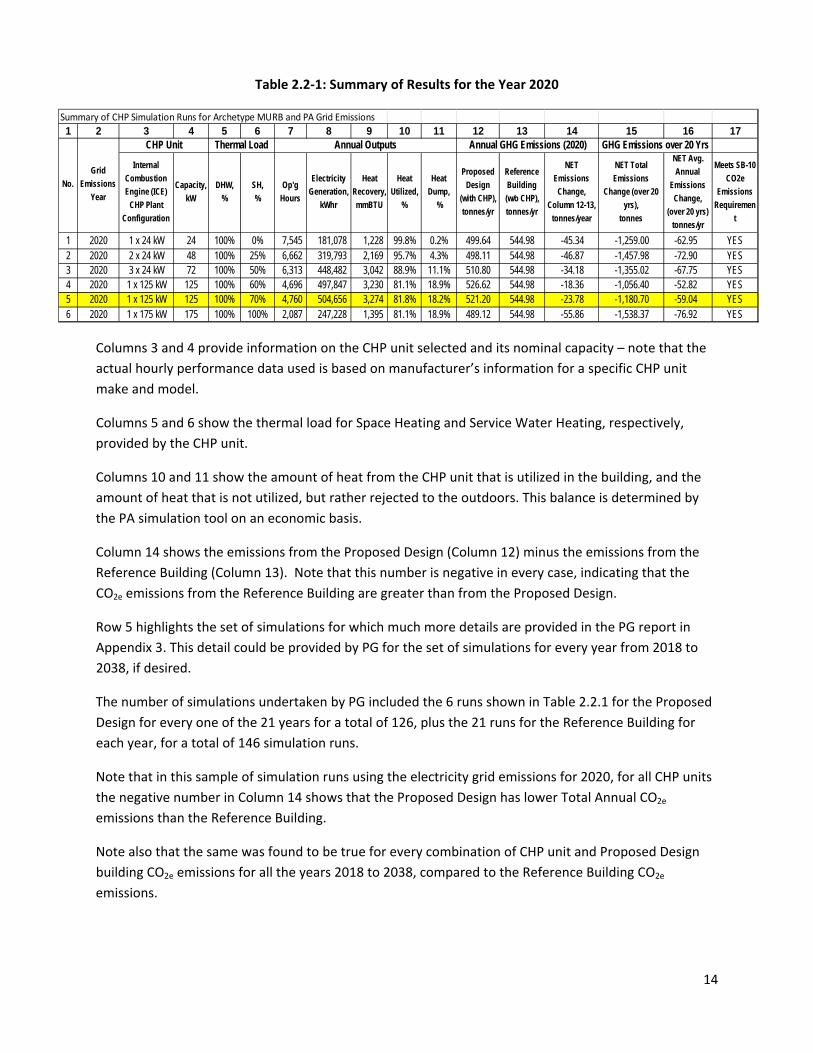
Table 2.2‐1: Summary of Results for the Year 2020
Columns 3 and 4 provide information on the CHP unit selected and its nominal capacity – note that the
actual hourly performance data used is based on manufacturer’s information for a specific CHP unit
make and model.
Columns 5 and 6 show the thermal load for Space Heating and Service Water Heating, respectively,
provided by the CHP unit.
Columns 10 and 11 show the amount of heat from the CHP unit that is utilized in the building, and the
amount of heat that is not utilized, but rather rejected to the outdoors. This balance is determined by
the PA simulation tool on an economic basis.
Column 14 shows the emissions from the Proposed Design (Column 12) minus the emissions from the
Reference Building (Column 13). Note that this number is negative in every case, indicating that the
CO2e emissions from the Reference Building are greater than from the Proposed Design.
Row 5 highlights the set of simulations for which much more details are provided in the PG report in
Appendix 3. This detail could be provided by PG for the set of simulations for every year from 2018 to
2038, if desired.
The number of simulations undertaken by PG included the 6 runs shown in Table 2.2.1 for the Proposed
Design for every one of the 21 years for a total of 126, plus the 21 runs for the Reference Building for
each year, for a total of 146 simulation runs.
Note that in this sample of simulation runs using the electricity grid emissions for 2020, for all CHP units
the negative number in Column 14 shows that the Proposed Design has lower Total Annual CO2e
emissions than the Reference Building.
Note also that the same was found to be true for every combination of CHP unit and Proposed Design
building CO2e emissions for all the years 2018 to 2038, compared to the Reference Building CO2e
emissions.
Summary of CHP Simulation Runs for Archetype MURB and PA Grid Emissions
1 2 3 4 5 6 7 8 9 10 11 12 13 14 15 16 17
Internal
Combustion
Engine (ICE)
CHP Plant
Configuration
Capacity,
kW
DHW,
%
SH,
%
Op'g
Hours
Electricity
Generation,
kWhr
Heat
Recovery,
mmBTU
Heat
Utilized,
%
Heat
Dump,
%
Proposed
Design
(with CHP),
tonnes/yr
Reference
Building
(w/o CHP),
tonnes/yr
NET
Emissions
Change,
Column 12-13,
tonnes/year
NET Total
Emissions
Change (over 20
yrs),
tonnes
NET Avg.
Annual
Emissions
Change,
(over 20 yrs)
tonnes/yr
Meets SB-10
CO2e
Emissions
Requiremen
t
1 2020 1 x 24 kW 24 100% 0% 7,545 181,078 1,228 99.8% 0.2% 499.64 544.98 -45.34 -1,259.00 -62.95 YES2 2020 2 x 24 kW 48 100% 25% 6,662 319,793 2,169 95.7% 4.3% 498.11 544.98 -46.87 -1,457.98 -72.90 YES3 2020 3 x 24 kW 72 100% 50% 6,313 448,482 3,042 88.9% 11.1% 510.80 544.98 -34.18 -1,355.02 -67.75 YES4 2020 1 x 125 kW 125 100% 60% 4,696 497,847 3,230 81.1% 18.9% 526.62 544.98 -18.36 -1,056.40 -52.82 YES5 2020 1 x 125 kW 125 100% 70% 4,760 504,656 3,274 81.8% 18.2% 521.20 544.98 -23.78 -1,180.70 -59.04 YES6 2020 1 x 175 kW 175 100% 100% 2,087 247,228 1,395 81.1% 18.9% 489.12 544.98 -55.86 -1,538.37 -76.92 YES
No.
Grid
Emissions
Year
GHG Emissions over 20 YrsCHP Unit Thermal Load Annual GHG Emissions (2020)Annual Outputs

15
3.0 ConclusionsandRecommendations
1. The determination of CO2e emissions for the Proposed Design Building and its Reference Building is
much more complicated than the procedure specified in SB‐10 (01/01/2017) would suggest.
2. Using an emissions factor either based on “marginal peak emissions based on natural gas” or “average
annual emissions” will not result in an accurate determination of annual electrical grid emissions
resulting from building operation, and especially one with a CHP system.
3. The method of determining emissions followed in this report has demonstrated that, for any MURB
application, provided the system is operated to supply both electrical and thermal loads, the emissions
from the Proposed Design will be less than for the Reference Building.
4. This method does generate a much more comprehensive and accurate emissions estimate for the
Proposed Design and the Reference Building. It does, however, require accurate hourly estimates for
annual building energy use from an energy simulation that follows SB‐10 and the selected Energy Code,
accurate hourly estimates for electricity grid emissions, and the use of these data in an accurate
simulation tool that can generate both operating results and hourly and annual emissions for the
Proposed Design with a CHP unit and the Reference Building without a CHP unit.
5. As building owners seek to achieve higher sustainability by applying more complex energy efficiency
systems, including those either internal or external to the building, to provide electricity and heat to the
building, such an emissions determination, for either electricity or any other energy supply, will become
even more complex. Combined heat and power systems represent such a system, but there are others
identified in the literature.
6. It is recommended to Municipal Building Officials that, provided a permit application for a Part 3
MURB building having a CHP system incorporated into the building operations as defined in the Building
Code Act, and that the Service Hot Water energy end‐use is at least 20% of the total annual energy
consumption, this report be accepted as demonstrating that the requirements of SB‐10, Division 3,
Chapter 1, Article 1.1.2.2 (1), including Table 1.1.2.2 and its associated Note 5, have been met.
7. It is also recommended to the IESO and the Ministry that a more realistic methodology be developed
and incorporated in Supplementary Standard SB‐10, the Building Code, or in any other appropriate or
applicable document, that offers a more capable methodology to provide a more accurate and
appropriate result.

1
AppendixA
Report by EQ Building Performance

EQ Building Performance Inc. | 20 Floral Parkway, Concord, Ontario, L4K 4R1 | 416-645-1186 | www.eqbuilding.com
PRELIMINARY ENERGY MODELING REPORT
January 22, 2018
Revision: 0
Issued for:
CHP Study
S:\Engineering\Projects\18\J180014 - CHP Study\04 Reports\18.01.22_180014_CHP Study_Report_EL.Docx
1 0 0 S u p e r t e s t R o a d
T o r o n t o , O n t a r i o , M 3 J 2 M 2
P 4 1 6 . 7 3 6 . 0 6 3 0 F 4 1 6 . 7 3 6 . 4 9 2 3
w w w . p e m i . c o m

EQ Building Performance Inc. Page 2 of 11
Contents
1. Executive Summary .................................................................................................................................. 3
2. Project Summary ...................................................................................................................................... 4
3. Background .............................................................................................................................................. 5
4. Methodology ............................................................................................................................................ 5
5. Results Summary ...................................................................................................................................... 6
6. Detailed Simulation Results ...................................................................................................................... 7
7. Responsibilities and Next Steps ................................................................................................................ 8
8. Appendix B –Model Inputs and Assumptions ........................................................................................... 9

EQ Building Performance Inc. Page 3 of 11
1. EXECUTIVE SUMMARY
EQ Building Performance has created an energy model for an 8 storey residential building, located in Toronto,
Ontario, for the purposes of SPA/TGS Tier 1.
The project is currently on track to achieve SPA/TGS Tier 1, using NECB 2015 as amended by Supplementary
Standard SB-10 Division 3 - Chapter 3.
Metric % Savings Tier 1
Compliance?
OBC
Compliance?
Energy Use 3.7% Yes Yes
Peak kW 0.4% Yes Yes
Carbon Emissions 3.8% - Yes
The key energy efficiency measures that contribute this to this performance are as follows:
- High performance glazing: low-e coating, thermally broken Al frames, Argon fill, warm edge spacers.
- Window-wall-ratio of approximately 34% (vision glass only)
- Lighting levels as per NECB 2015 as modified by SB-10
- Screw chiller serving building, COP 2.8
- 95% efficiency lead condensing heating boiler
- ECM motors on all fan coils
- VFD circulation pumps and domestic cold water booster pumps

EQ Building Performance Inc. Page 4 of 11
2. PROJECT SUMMARY
Building Description:
The CHP building is a mixed use development that will be
located in Toronto, Ontario. The consists of 8 storeys of
residential space, associated amenities, 1 storey of retail
space and 2 levels of underground parking.
Key characteristics of the energy model are as follows:
Use/Occupancy: Residential / Retail
Project Stage: SPA / Toronto Green
Standard
Nominal Size: 9,473 m2
Modeled Size: 9,548 m2*
Suite Count: 118
Climate Zone: Toronto (5A)
Weather File: Toronto, ON CWEC
Lighting Method: Space type
Key Schedules: MNECB G – residential
MNECB C – retail
MNECB B – amenities
*Modeled square footage may vary slightly from the actual GFA due to modeling rules that exclude certain non-heated or non-regulated
spaces, exclusion of some shafts and wall cavity space, and variation in measurement techniques from official site statistics. Nominal
size may equal modeled size if architectural statistics are not available.
Figure 1 - eQuest Building Rendering

EQ Building Performance Inc. Page 5 of 11
Project Goals:
The energy efficiency goals relevant to the project throughout its timeline are presented in Table 1. The intent
of this report is to analyze only goals that are highlighted in bold.
Table 1 - Project Energy Efficiency Goals
Goal Requirement / Compliance method Metric
TGS Tier 1 0% reduction over OBC SB-10 Division 3
Summer & Winter peak electricity better than OBC SB-10
GJ
kW
OBC SB-10 0% reduction over SB-10 Division 3 Division 3
Peak electricity better than OBC SB-10 Division 3
GJ / GHG emissions
kW
LEED EAp1 Minimum 23% cost reduction over MNECB 1997 Cost
3. BACKGROUND
Building energy modeling provides a means to simulate building
energy performance during the design stage of a project to quickly
and effectively evaluate the impact of various design measures on
building energy performance. In addition, building energy modeling
allows the predicted building performance to be evaluated against key
benchmarks such as the National Energy Code for Buildings (NECB),
and ASHRAE 90.1.
The use of energy simulation software for benchmark comparison is
recognized by programs such as the CaGBC’s LEED Rating System, as
well as to demonstrate compliance with Ontario Building Code SB-10,
and Toronto Green Standard Tier 1 and 2.
EQ Building Performance has been retained to assess the building energy performance using building energy
simulation software, and to suggest design alternatives to achieve optimal energy savings where appropriate.
4. METHODOLOGY
The building was modeled using eQuest 3-64 energy simulation software. EQuest is a widely-recognized hourly
energy analysis program based on the DOE-2.2 software engine. Energy modeling was performed under the
general techniques recognized in the following documents:
- National Energy Code of Canada for Buildings (NECB) 2015
Relevant Terms:
GJ: Gigajoule
ekWh/ m2: Equivalent kilowatt
hrs / square meter
Kg CO2e: Kilograms of CO2
equivalent
TGS: Toronto Green
Standard
CaGBC: Canada Green
Building Council

EQ Building Performance Inc. Page 6 of 11
- Performance Compliance for Buildings, Specifications for Calculation Procedures for Demonstrating
Compliance to the Model National Energy Code for Buildings Using Whole-Building Performance (May
1999);
- LEED Canada 2009 Supplementary Energy Modeling Guidelines; and
- ecoEnergy EE4 software modeling guide.
Additional assumptions may have been used to fill in gaps in information, based on modeling experience and
knowledge of building systems.
5. RESULTS SUMMARY
A summary of the proposed building design
performance can be seen in Table 2.
Table 3 provides an assessment of the building
performance relative to the project goals.
The results indicate that the proposed building
design is compliant with Ontario Building Code SB-
10 Division 3 and TGS Tier 1
A detailed breakdown of energy usage can be found in Appendix A, and a detailed list of model inputs is
provided in Appendix B. It is the responsibility of the design team to review these appendices and ensure all
assumptions are accurate, or represent a conservative estimate of energy use.
Table 3 - Project Performance Summary
Metric Baseline Design Proposed
Design % Savings
OBC
Compliance
Tier 1
Compliance
Energy Use (GJ) 10,595 10,208 3.7% Yes Yes
Peak kW 256.72 255.58 0.4% Yes Yes
Carbon Emissions 431,486.50 415,201.70 3.8% Yes -
Energy Use: 10,208 GJ
Energy Cost: $168,100
GHG emissions: 415,202 kg CO2e
Peak demand: 255.58 kW
Energy Use Intensity: 296.9 ekWh/m2
Table 2 - Proposed Design Summary

EQ Building Performance Inc. Page 7 of 11
6. DETAILED SIMULATION RESULTS
End Use Baseline Energy Use (GJ) Proposed Design Energy Use (GJ) Savings
Electricity Natural Gas Electricity Natural Gas
Lighting 801 801 0.0%
Misc. Equipment 812 0 781 0 3.8%
Heating 86 4,919 93 4,763 3.0%
Cooling 488 453 7.3%
Pumps 328 72 78.0%
Fans 785 992 -26.3%
Domestic Hot Water 2,340 2,218 5.2%
Exterior Lights 35 35 0.0%
Total 10,595 10,208 3.7%
Total Cost $174,100 $168,100 3.4%
Energy Use Intensity 308.2 ekWh/m2 296.9 ekWh/m2 -
Figure 2 - Detailed Annual Energy Use (GJ)
-
1,000
2,000
3,000
4,000
5,000
6,000
Lighting Misc.Equip.
Heating Cooling Pumps Fans DomesticHot Water
ExteriorLighting
An
nu
al E
ner
gy U
se (G
J)
Reference
Proposed
Table 4- Detailed Results Breakdown

EQ Building Performance Inc. Page 8 of 11
Figure 3 - Detailed Performance Analysis
7. RESPONSIBILITIES AND NEXT STEPS
A detailed breakdown of energy usage can be found in Appendix A, and a detailed list of model inputs is
provided in Appendix B.
The ability of a building design to achieve the stated project goals remains the responsibility of the design team.
The design team should review the report and appendices to ensure all inputs and assumptions are accurate,
or represent a conservative estimate of performance.
In addition, the architect, mechanical and electrical engineer must ensure the mandatory requirements of the
NECB 2015 are met with the building design. Mandatory requirements checklists will be provided by EQ Building
Performance but must be filled in and signed by the design team.
10,208
10,595
10,595
10,595
- 2,000 4,000 6,000 8,000 10,000 12,000
Energy Use (GJ)
NECB 2015 + SB-10 OBC Compliant TGS Tier 1 Proposed
415,202
431,487
431,487
431,487
- 250,000 500,000
C02e Emissions(kg)
255.6
256.7
256.7
256.7
0 100 200 300
Peak ElectricityDemand (kW)

EQ Building Performance Inc. Page 9 of 11
Review of product submittals, shop drawings and substitutions are not within the scope of this energy modeling
exercise. It is the responsibility of the project team to determine whether or not deviations from the inputs
included in this report will negatively impact Ontario Building Code SB-10 compliance.
8. APPENDIX B –MODEL INPUTS AND ASSUMPTIONS
The characteristics of the proposed design packages are listed in the following table:
Input NECB 2015 + SB-10 Proposed Design
Architectural:
Envelope As per NECB 2015 as amended by
supplementary standard SB-10:
Wall: R-20.4 (total wall)
As per NECB 2015 as amended by
supplementary standard SB-10:
Roof: Total R-36.4
Wall
Metal Panel Cladding (99% of total wall)
51 mm ACM Panel System
64 mm z-girts
64 mm semi-rigid mineral insulation board
Concrete wall
Nominal R-10.5, Total R-10.5
Spandrel Glass Panel (1% of total wall)
2” rigid insulation in spandrel backpan
64 mm fibre batt in stud wall
Nominal R-11.8, Total R-7.95
Overall Average Assembly R-value: R-10.46
Roof
4” rigid insulation,
Nominal R-20, Total R-20
Fenestration As per NECB 2015 as amended by
supplementary standard SB-10:
Total U-Value 0.33 BTU/h.ft2.F (total
assembly)
Total SHGC: 0.4 (as per LEED 2009 modeling
guide)
WWR 34%
Double Glazed, Argon Filled, Low-E glazing
U-value: 0.33 BTU/h-ft2-F (total assembly)
(U 0.21 BTU/h-ft2-F COG) SHGC: 0.40
WWR 34%

EQ Building Performance Inc. Page 10 of 11
Input NECB 2015 + SB-10 Proposed Design
Electrical:
Lighting Equal to NECB 2015 + SB-10 lighting
requirements:
Corridors = 0.66 W/ft2
Stairways = 0.69 W/ft2
Suites = 0.46 W/ft2
Parking = 0.14 W/ft2
Retail = 1.22 W/ft2
Equal to NECB 2015 + SB-10 lighting
requirements:
Corridors = 0.66 W/ft2
Stairways = 0.69 W/ft2
Suites = 0.46 W/ft2
Parking = 0.14 W/ft2
Retail = 1.22 W/ft2
Mechanical Plant:
Central Heating Condensing Boilers, Gas-fired, 90% Efficiency
OA reset
Condensing Boilers, Gas-fired, 95% Efficiency
OA reset
Central Cooling Air Cooled Screw Chiller
COP 2.8
OA reset
Air Cooled Screw Chiller
COP 2.8
OA reset
Circulation
Pumps
As per NECB 8.4.4.14.3)
Pump characteristics equal to proposed
Chilled Water – 309 W/L/s (19.5 W/gpm)
Hot Water– 249 W/L/s (15.7 W/gpm)
One Speed Pumps
Variable Speed Pumps
Autosized by eQuest
Chilled Water – 309 W/L/s (19.5 W/gpm)
Hot Water– 249 W/L/s (15.7 W/gpm)
Domestic Hot
Water Heating DHW Heater 90% efficiency DHW Heater 95% efficiency
Mechanical Systems:
HVAC System –
In Suite
Fan Coil System
Served by HW and CHW Loops
Modeled fan power: 0.23 W/cfm
Outdoor air equal to proposed building
Fan Coil System
Served by HW and CHW Loops
Modeled fan power: 0.23 W/cfm
Two way valves
Outdoor air based on ASHRAE 62.1
Outdoor air delivered from corridor MUA
HVAC System –
Amenities
As per NECB 2015 Table 8.4.4.7. –B
System 3 –Single-zone packaged rooftop unit
with baseboard heating
DX Cooling COP 3.45
Hydronic Heating
Outdoor Air: equal to baseline
Fan power: 640 Pa, 40%
Fan Coil System
Served by HW and CHW Loops
Modeled fan power: 0.23 W/cfm
Two way valves
Outdoor air based on ASHRAE 62.1
Outdoor air delivered from corridor MUA

EQ Building Performance Inc. Page 11 of 11
Input NECB 2015 + SB-10 Proposed Design
HVAC System –
Corridors
MUA Unit
Hydronic heating and cooling
Fan power: 0.755 W/cfm
Outdoor air based on ASHRAE 62.1
MUA Unit
Hydronic heating and cooling
Fan power: 0.755 W/cfm
Outdoor air based on ASHRAE 62.1
HVAC System –
Lobby
As per NECB 2015 Table 8.4.4.7. –B
System 3 –Single-zone packaged rooftop unit
with baseboard heating
DX Cooling COP 3.45
Hydronic Heating
Outdoor Air: equal to baseline
Fan power: 640 Pa, 40%
Fan Coil System
Served by HW and CHW Loops
Modeled fan power: 0.23 W/cfm
Two way valves
Outdoor air delivered through MUA unit
Outdoor air based on ASHRAE 62.1
HVAC System --
Retail
As per NECB 2015 Table 8.4.4.7. –B
System 3 –Single-zone packaged rooftop unit
with baseboard heating
DX Cooling COP 3.22
Electric heating
Outdoor Air: equal to baseline
Fan power: 640 Pa, 40%
Packaged AC unit with electric heating
Fan power: 0.755 W/cfm
DX Cooling COP 3.22
Electric heating
Outdoor air per ASHRAE 62.1
Hot Water
Fixtures
Per OBC-2012 baseline:
Kitchen Sinks: 8.35 LPM
Lavatory faucets: 8.35 LPM
Showers: 9.5 LPM
Per OBC-2012 baseline:
Kitchen Sinks: 8.35 LPM
Lavatory faucets: 8.35 LPM
Showers: 9.5 LPM
Misc / Process:
Miscellaneous
process loads
Elevators – 2.45 kW
Exhaust fans – 0.24 kW
Garage Fans – 2.95 kW
Domestic cold water boosters – 2.36 kW
Elevators – 2.45 kW
Exhaust fans – 0.24 kW
Garage Fans – 2.95 kW
Domestic cold water boosters (with VSD) – 1.38
kW

3
AppendixB
Report by Power Advisory LLC.

55 University Ave., P.O. Box 32 • Suite 605 • Toronto, Ontario, M5J 2H7
416-694-4874 • [email protected] 1
December 7, 2018
To: Aqeel Zaidi, Enbridge, Enbridge Gas Distribution
From: Travis Lusney and Wesley Stevens, Power Advisory LLC
RE: Methodology for Forecasting GHG Emission Factors for DG-CHP
In 2017, Power Advisory LLC (Power Advisory) completed a Distributed Generation Combined
Heat and Power GHG Emission Impact Analysis (the report) for Enbridge Gas Distribution
(Enbridge). The report evaluated the impact of distributed generation combined heat and
power (DG CHP) on the operating hours of large gas-fired generation in the Ontario electricity
market and ultimately the potential change to GHG emissions in the province. The analysis in
the report included the determination of GHG emissions factors for the Ontario electricity
market on an hourly basis based on historic energy fossil fuel generation production data from
2013 to 2016.
This memo details the methodology Power Advisory deployed to determine GHG emissions
factors.
Overview of Methodology
The greenhouse gas (GHG) emissions due to Ontario’s electricity system come from two main
sources: natural gas-fired generators in Ontario, and the emissions associated with electricity
imports from other jurisdictions. Gas generation and imports tend to be higher when demand is
higher and/or power from less flexible generation (e.g., nuclear and renewables) is lower. Gas
generation and imports tend to be lower when demand is lower and/or other less flexible
generation is higher. DG CHP electricity output reduces transmission-level demand (i.e., grid
demand) and therefore reduce the amount of transmission-connected generation electricity
output. As such, DG CHP can be expected to reduce transmission-connected gas-fired
generation and imports.
Power Advisory estimated and forecast the impact that increasing DG-CHP would have on
emissions from large gas generators and imports. The output is a set of emission factors
(tonnes of GHG emissions reduced per MWh of demand reduction due to DG-CHP) for different
times of day and different seasons over the forecast period. The methodology and results of this
analysis are presented here. The emission factors were used in the Enbridge report to analyze
the impact of various types of DG-CHP would have on net emissions (i.e., DG-CHP emissions less
reduction in emissions from large gas generators and imports).

55 University Ave., P.O. Box 32 • Suite 605 • Toronto, Ontario, M5J 2H7
416-694-4874 • [email protected] 2
The process for estimating emission factors involved several steps:
1. Forecast demand and baseload supply for each hour in the forecast period and calculate
the difference between the two, which is referred to as Net Demand
2. Quantify the relationship between Net Demand and generation by large gas-fired plants
3. For each hour of the forecast period, estimate the impact that a 1-MWh change in Net
Demand would have on gas generation, imports, and GHG emissions
4. Summarize these hourly GHG emission estimates by season and time-of-use period.
The following sections describe each step in more detail.
1. Net Demand
Net Demand means Ontario demand at the transmission level minus baseload generation by
transmission-connected generation. The IESO publishes hourly data on both demand and
generation. Historical demand is what the IESO calls “Ontario Demand”, which excludes exports
and demand supplied by embedded generation. Transmission-connected generation is taken
from the IESO’s “Generation Capability and Output” reports. “Baseload generation” in this report
is the sum of hourly generation by bioenergy, hydro, nuclear, solar and wind plants.
Forecasts of demand and baseload supply are taken from Power Advisory’s wholesale market
forecast model. The demand forecast takes into account:
• Organic growth in electricity demand
• Expected levels of conservation and demand management
• Growth in demand from electric vehicles and heat pumps.
The baseload generation forecast takes into account:
• Ontario’s nuclear fleet, including the planned retirement of Pickering at the end of 2024,
and the refurbishment schedule for Bruce and Darlington
• OPG’s hydro plants
• Existing transmission-connected plants in service under contract with the IESO, including
a forecast of retirements
• Committed contracts for transmission-connected plants not yet in service
• In the long term, further development of new generation to meet supply adequacy
needs
The difference between forecast demand and forecast baseload generation was then calculated
for each hour of the forecast period (separately for each of the four Base Years) to get Net
Demand.

55 University Ave., P.O. Box 32 • Suite 605 • Toronto, Ontario, M5J 2H7
416-694-4874 • [email protected] 3
2. Relationship Between Net Demand and Gas Generation
On average, electricity production by transmission-connected gas-fired generation increases as
demand increases and power from less flexible generation (such as nuclear and renewables)
decreases. To quantify this relationship, all hours from 2014 through 2017 were grouped based
on Net Demand (i.e., all hours with Net Demand less than -2,000 MW, between -2,000 and -
1,500, etc.) and average gas generation was calculated for each group. The results are shown in
Figure 1 below; the 5th and 95th percentile of fossil generation in each group are also shown.
Figure 1: Gas Generation vs. Net Demand, 2014-2017
It was found the resulting curve (of average gas generation vs. average net demand in each
group) could be approximated very closely by a series of four straight lines (shown in red on
Figure 1):
• One line for Net Demand below -1,000 MW, with a slope of 0.17 (i.e., gas generation
increases by 0.17 MW for each 1-MW increase in Net Demand);
• One line for Net Demand between -1,000 and 0 W, with a slope of 0.44;
• One line for Net Demand between 0 and 4,000 MW, with a slope of 0.74; and
• One line for Net Demand above 4,000 MW, with a slope of 0.57.
When supply greatly exceeds demand (i.e., Net Demand is less than minus 1,000 MW), the IESO
continues to dispatch some gas generation; total gas generation rarely falls below 600 MW.
(This may be due to the IESO keeping some gas generators running and ready to ramp up in
0
1,000
2,000
3,000
4,000
5,000
6,000
7,000
-3,000 -2,000 -1,000 0 1,000 2,000 3,000 4,000 5,000 6,000
Gas
Gen
erat
ion
(MW
)
Net Demand (MW)
95th Percentile
Average
Approximation
5th Percentile

55 University Ave., P.O. Box 32 • Suite 605 • Toronto, Ontario, M5J 2H7
416-694-4874 • [email protected] 4
case of outages or sudden spikes in demand.) Ontario’s electricity system adjusts to further
decreases in Net Demand with either higher exports or increased curtailment of nuclear, wind
and solar plants, and only small changes in gas generation (0.17 MW of gas generation per MW
of Net Demand). When demand and supply are in balance (with Net Demand between zero and
4,000 MW), the system responds to changes in that balance partly by adjusting gas generation
(0.74 MW per MW), partly by decreasing exports or increasing imports (0.26 MW per MW).
When demand greatly exceeds supply (with Net Demand greater than 4,000 MW), most of
Ontario’s gas fleet is already operating, so the system relies less on further increases in gas
generation (0.57 MW per MW of increase in Net Demand, down from 0.74) and more on
increases in imports (0.43 MW per MW, up from 0.26).
3. Forecasting Gas Generation, Imports and GHG Emissions
For each forecast hour, the impact of a 1-MWh change in Net Demand was estimated as follows:
• Determine Import/Export Status: Using the approximation developed in the previous
section, gas generation in each forecast hour was estimated. If Net Demand was greater
than this estimate of gas generation, the electricity system was assumed to be importing
rather than exporting. (This is used below to estimate emissions attributed to imports.)
• Estimate Change in Emissions from Large Gas Generators: Ontario’s fleet of large gas
generators is estimated to have an average heat rate of 8.50 GJ/MWh (8.05
MMBtu/MWh), and natural gas is estimated to have an emissions factor of 0.051
tonnes/GJ (0.054 tonnes/MMBtu), so each 1-MWh reduction in gas generation was
estimated to result in a 0.435-tonne reduction in emissions. Using the approximation
developed in the previous section – specifically, the slopes of the four lines – the
reduction in gas generation associated with a 1-MWh reduction in Net Demand was
estimated. For example, if Net Demand was forecast to be exceed 4,000 MW in that
forecast hour, then a 1-MWh reduction in Net Demand would mean a 0.57-MWh
reduction in gas generation, which would mean a (0.57 x 0.435 =) 0.25-tonne reduction
in emissions.
• Estimate Change in Emissions from Imports: When Net Demand in Ontario is high, it
imports electricity from other systems, including Quebec, New York, Michigan and
Manitoba. While some of that electricity (especially from Quebec and Manitoba) is from
hydro or other renewable sources, some of it (especially from the U.S.) was generated
from fossil fuels, including natural gas, coal and oil. Each MWh of imported electricity is
assumed to result in 0.6 tonnes of GHG emissions. based on the generic factor
recommended by Navigant Consulting for on-peak imports. When Net Demand exceeds
4,350 MW, Ontario is assumed to be a net importer of electricity (because at that point,
Net Demand exceeds gas generation based on the above approximation). In those
hours, each MWh of reduction in Net Demand is estimated to reduce gas generation by
0.57 MWh and imports by (1 – 0.57 =) 0.43 MWh, and therefore to reduce GHG

55 University Ave., P.O. Box 32 • Suite 605 • Toronto, Ontario, M5J 2H7
416-694-4874 • [email protected] 5
emissions due to imports by (0.43 x 0.6 =) 0.26 tonnes. The total emission reduction is
that due to the reduction in gas generation (0.25 tonnes) plus that due to the reduction
in imports (0.26 tonnes) for a total of 0.51 tonnes.
4. Average Emission Factors by Season and Time-of-Use Period
Emission factors (tonnes of GHG emission reduction per MWh of reduction in Net Demand)
were estimated for each hour of the forecast period, with separate forecasts for each of the Base
Years. Each forecast hour was assigned to one of eight periods:
• Winter (December-March)
1. On-Peak
2. Mid-Peak
3. Off-Peak
• Summer (June-September)
4. On-Peak
5. Mid-Peak
6. Off-Peak
• Shoulder (April, May, October, November)
7. On- and Mid-Peak Combined
8. Off-Peak
Time-of-Use periods are based on those used by the Regulated Price Plan, taking into account
Daylight Savings Time and the change in the on-peak/mid-peak schedule on May 1 and
November 1. Forecast hours were assigned to time-of-use periods based on the Base Year, not
the Forecast Year. (The hourly demand patterns used in these calculations reflect the weekends
and holidays in the Base Years, not the Forecast Years. For example, January 5, 2022 will be a
Wednesday, but when using the 2014 Base Year, demand on January 5, 2022 will be estimated
based on what actual hourly demand was on January 5, 2014, which was a Sunday. The emission
factors for January 5, 2022 are therefore included in the off-peak period when using the 2014
Base Year.)
Averages by season and time-of-use period were calculated separately for each Base Year, then
those were averaged across all four Base Years. The results are shown in Table 1 below.

55 University Ave., P.O. Box 32 • Suite 605 • Toronto, Ontario, M5J 2H7
416-694-4874 • [email protected] 6
Table 1: Forecast Emission Factors by Season and Time-of-Use Period
When used to estimate the impact of DG-CHP on system-wide emissions, an adjustment should
be made for transmission and distribution losses. As an approximation, each MWh of DG-CHP
reduces system-level demand by 1.06 MWh, so the above factors should be multiplied by 1.06
to estimate the impact of DG-CHP. The GHG emissions from the DG-CHP facility should also be
taken into account.
Winter Summer Shoulder AllOn-Peak Mid-Peak Off-Peak On-Peak Mid-Peak Off-Peak On&Mid Off-Peak Hours
2018 0.24 0.23 0.19 0.30 0.28 0.24 0.21 0.17 0.222019 0.25 0.23 0.18 0.28 0.28 0.19 0.20 0.14 0.192020 0.30 0.28 0.24 0.32 0.32 0.24 0.25 0.18 0.242021 0.30 0.29 0.24 0.35 0.35 0.29 0.27 0.21 0.272022 0.33 0.32 0.28 0.35 0.35 0.29 0.29 0.24 0.292023 0.36 0.34 0.32 0.37 0.37 0.32 0.31 0.28 0.322024 0.31 0.30 0.25 0.34 0.34 0.28 0.29 0.23 0.272025 0.38 0.36 0.34 0.42 0.41 0.36 0.34 0.32 0.352026 0.37 0.35 0.33 0.41 0.40 0.36 0.33 0.32 0.352027 0.37 0.35 0.33 0.39 0.39 0.35 0.33 0.31 0.342028 0.37 0.35 0.34 0.39 0.39 0.35 0.33 0.31 0.342029 0.37 0.35 0.34 0.39 0.39 0.35 0.33 0.31 0.342030 0.36 0.34 0.32 0.38 0.38 0.34 0.32 0.30 0.332031 0.38 0.35 0.34 0.39 0.39 0.35 0.32 0.31 0.342032 0.38 0.36 0.34 0.39 0.39 0.35 0.32 0.31 0.342033 0.38 0.36 0.34 0.39 0.39 0.35 0.32 0.31 0.342034 0.39 0.36 0.35 0.39 0.40 0.35 0.32 0.31 0.352035 0.39 0.37 0.35 0.39 0.40 0.36 0.32 0.31 0.352036 0.40 0.37 0.36 0.39 0.40 0.36 0.32 0.32 0.352037 0.40 0.37 0.36 0.38 0.40 0.36 0.32 0.32 0.352038 0.40 0.37 0.36 0.38 0.40 0.36 0.32 0.31 0.35All Years 0.35 0.33 0.31 0.37 0.37 0.32 0.30 0.28 0.32

5
AppendixC
Report by POWER GENYSYS

REPORT to
Sustainable Buildings Canada
on a
CHP CO2e Emissions Study
By: POWER GENySYS
Innovative Clean & Green Power Generation Solutions
January 17, 2020

Report to: Sustainable Buildings Canada POWER GENySYS Hour ly CHP Opera t ion and CO 2 e Emiss ions S imu la t ion Mode l
Report No: 1449 Rev.1 Issue Date: January 17, 2020
TABLE OF CONTENTS
1 INTRODUCTION TO POWER GENYSYS .............................................. 1
2 POWER GENYSYS: HOURLY CHP SIMULATION MODEL ...................... 2
3 EMISSION STUDY OVERVIEW ................................................................ 3
4 CONCLUSION ..................................................................................... 5
APPENDICES APPENDIX I: Summary Table of CHP Emission Scenarios APPENDIX II: CHP Emission Scenario No. 5 – Nominal 1 x 125 kW CHP System

Report to: Sustainable Buildings Canada POWER GENySYS Hour ly CHP Opera t ion and CO 2 e Emiss ions S imu la t ion Mode l
Report No: 1449 Rev.1 Issue Date: January 17, 2020
P OW E R G E N•Y •S Y S Page 1
1 Introduction to POWER GENySYS Established in 1997 and based in North York, Ontario, POWER GENySYS (PG) is a Canadian Engineering
firm specializing in Clean, Green & Emergency Generation Systems, including natural gas, biogas and
landfill gas fuelled Combined Heat and Power (CHP), Combined Heat & Emergency Power (CHeP), and
District Energy Systems from project inception to commercial operation. The company also has special
expertise in the Engineering design of mechanical systems for cement plants and other heavy industries.
Since 1992, PG has provided key services to a wide variety of clients, including Preliminary and Detailed
Feasibility Studies, Planning & Conceptual Design, Detailed Engineering, Equipment Procurement, Project
and Construction Management, Contract Administration, Testing & Commissioning, Field Review &
Witness Testing, Measurement & Verification Confirmation Testing & Reports, Operation & Maintenance,
Automated Dispatch and System Operation Reports all specifically for distributed power generation
systems.
Applications for CHP systems have included greenhouses, hospitals, multi-unit residential buildings
(MURBs), district energy systems, landfills, and a variety of other applications. More recently, PG has
been a pioneer in the design and implementation of small scale CHeP systems and larger scale CHP
systems.
Vito Mike Casola, Founder and Principal of PG, is a licensed Ontario Professional Engineer since 1990.
Over the years PG has acquired a broad wealth of industry specific knowledge and experience specifically
related to the development and implementation of CHP, CHeP and District Energy System projects and
includes the development of a unique proprietary comprehensive "Hourly CHP Simulation Model" and
Financial Analysis tool.
CHP, and more recently CHeP, systems are both well known as being highly efficient and cost-effective
alternatives for facilities to produce their own electricity and heat that can achieve both environmental and
economic benefits through energy savings, and enhance a facility's power reliability, resiliency and
sustainability during power outages.

Report to: Sustainable Buildings Canada POWER GENySYS Hour ly CHP Opera t ion and CO 2 e Emiss ions S imu la t ion Mode l
Report No: 1449 Rev.1 Issue Date: January 17, 2020
P OW E R G E N•Y •S Y S Page 2
2 POWER GENySYS: Hourly CHP Simulation Model Over the past twenty years PG developed and continually improved its’ proprietary Hourly CHP Simulation
Model to facilitate the evaluation of proposed CHP System projects.
The model is inherently superior to simplistic monthly simulations because it utilizes actual hourly energy
consumption data (electricity/gas) to accurately determine, hour by hour, the amount of electricity that can
be generated by a CHP system to offset a portion of a host building's electricity and thermal demands.
The model calculates the corresponding amount of thermal energy recovered at these varying power
output levels and then, for each hour of operation, the corresponding recovered thermal output is matched
against the building's thermal demand (established from boiler gas consumption data). The amount of
thermal energy utilized is calculated such that it does not exceed the coincident building thermal demand.
Any excess thermal energy in a given hour is not allocated as utilized energy and does not contribute to
displaced thermal energy savings, but is instead considered lost via a remote heat dump radiator.
Where a host building already has existing thermal storage or where a CHP system is equipped with new
thermal storage tanks, additional thermal energy can be considered utilized as stored energy in these
thermal storage tanks (with a corresponding increase in tank temperature equivalent to the amount of
excess thermal available). Once a storage tank temperature has reached its high temperature limit then
further excess thermal energy cannot be stored and is thus considered dumped and lost.
When utilized thermal energy levels reach a point where the CHP system can no longer achieve positive
economic operation (considering the avoided electricity price, operation and maintenance costs, value of
thermal energy utilized and other operational metrics), the simulation considers the CHP system OFF.
For each hour the system is OFF, previously stored thermal energy can then be utilized by the building and
the simulation calculates the corresponding decrease in tank temperature equivalent to the building's
thermal energy demand (gas consumption) for that specific hour. The simulation allocates the energy
retrieved from the storage tank as utilized thermal energy which contributes to displaced thermal energy
savings with corresponding GHG emission benefits calculated. Once a storage tank temperature has
reached its lower temperature limit, further thermal energy utilization of the heat recovered from CHP
operation is not possible and any additional thermal energy required by the building must be satisfied by
the existing building boiler system, and this additional gas consumption is included in the CHP model.

Report to: Sustainable Buildings Canada POWER GENySYS Hour ly CHP Opera t ion and CO 2 e Emiss ions S imu la t ion Mode l
Report No: 1449 Rev.1 Issue Date: January 17, 2020
P OW E R G E N•Y •S Y S Page 3
This mode of CHP operation is referred to as “Economic Dispatch” and is the primary methodology
employed by the PG simulation. It therefore provides a very accurate estimate of a building’s operation.
For each hour of the simulation the model determines the hourly "Marginal Cost of Generation" (MCG),
defined as follows:
MCG ($/kWhr) = CHP Fuel + Variable O&M + Major Overhaul per hour - Value of Utilized Recovered Heat Net Electricity Generated
For hours where the MCG is calculated to be less than the "Avoided Electricity Cost", (i.e. the Time of Use
Rate at the specific hour in question) then the simulation will consider the CHP as operating for that hour
and calculates the total output of electricity and the corresponding heat recovered. It also calculates and
records what amount of recovered heat is utilized by the building and whether there is any excess heat that
can be stored or must be dumped via a radiator, or if it is insufficient it calculates the additional thermal
energy needed that is to be supplemented by the building’s boiler plant, thereby calculating the remaining
gas consumption from operation of the building boilers for that hour.
The simulation calculates operation for the 8760 hours in a year, determining the economic dispatch of a
CHP, and does a complete accounting of all energy inputs/outputs and associated costs. A 20 year
financial analysis utilizes the first year of operation and applies annual inflation factors for various
parameters to determine 20 Year Life Cycle Costs, and System Payback, including Internal Rate of Return
(IRR) and Net Present Value (NPV).
3 Emission Study Overview POWER GENySYS was retained by SBC for the final phase of their CHP Emissions study. The work of
this phase is based on two earlier studies:
1. The first is an hourly energy performance simulation model for an archetype mid-rise Multi-Unit Residential Building (MURB), provided by EQ Building Performance (EQB), which is designed to meet the energy efficiency requirements of SB-10 (2017), and this included hourly energy data for both the Proposed Design Building and the Reference Building.
2. It is also based on a set of hourly Electricity Grid Emissions Factors for the 20 year period from 2018 to 2038, prepared by Power Advisory LLC (PA).
PG was retained to utilize their Hourly CHP Simulation Model to simulate the performance of one or more
“Combined Heat and Power” (CHP) units that would provide both electricity generation and heating to the
building, including both Service Water Heating” (SWH) and Space Heating (SH).

Report to: Sustainable Buildings Canada POWER GENySYS Hour ly CHP Opera t ion and CO 2 e Emiss ions S imu la t ion Mode l
Report No: 1449 Rev.1 Issue Date: January 17, 2020
P OW E R G E N•Y •S Y S Page 4
This included system selection and operation over a range of performance targets, including minimizing
CO2e emissions that could meet or exceed the requirements of SB-10 (2017).
In order to undertake this phase of the study the PG proprietary model was updated in mid-2019 to be
“Emission Capable” which would allow analysis and reporting of hourly, annual and 20 year total GHG
emissions. To do this, first the hourly energy data for both the “Proposed Building” and “Reference
Building” were incorporated into the CHP Simulation Model. Then the 20 years of hourly Ontario Grid
Emissions data were incorporated into the model, which was then adapted to make it an “Emissions
Capable” CHP Simulation Model, able to calculate total annual CO2e emissions from both a “Reference
Building” operating without a CHP system and a “Proposed Design Building” operating with a CHP System
sized to match varying specified thermal loads available to be utilized by heat recovered from the CHP.
The final phase of study included a total of 6 CHP Scenarios (see Appendix I - Summary Table). Each of
the scenarios were undertaken for a CHP applied to the Proposed Building Design SWH Load using the
electrical grid emissions developed by PA for the years from 2018 to 2038. This was done for Internal
Combustion Engine (ICE) type prime movers. Scenario No. 5 was included as a sample in this report (see
Appendix II).
Six (6) Scenarios were run for ICE systems, sized to match 0%, 25%, 50%, 60%, 70%, and 100% of the
SH load and all of the SWH load.
For each of the 6 scenarios, the total annual CO2e emissions from the Reference Building in Year 2018 was
calculated by determining emissions from the total purchased electricity in each hour using the PA Grid
Emissions Factor for the specific hour in 2018 and adding the total emissions from operation of all natural
gas boilers in each hour using a factor of 1.875 kg CO2e/m3 of gas consumed.
The total annual Reference Building emissions (from electricity imports and gas boiler operation) was
recorded and compared against the total annual emissions from the Proposed Building with a CHP System
that was selected/sized to match the available thermal loads as specified for each of the Scenarios.

Report to: Sustainable Buildings Canada POWER GENySYS Hour ly CHP Opera t ion and CO 2 e Emiss ions S imu la t ion Mode l
Report No: 1449 Rev.1 Issue Date: January 17, 2020
P OW E R G E N•Y •S Y S Page 5
The total annual Proposed Building emissions were calculated in the same way as for the Reference
Building, using PA Grid Emissions Factors (in each specific hour) for additional electricity imported beyond
the net electricity generated by the CHP system and then adding the total emissions from all hours where
the CHP was deemed to be dispatched to operate, using the same factor for gas consumed by the CHP
system, and finally adding total emissions from the operation of all natural gas boilers in each hour required
to supplement the heat load which was not satisfied by heat recovered from the CHP system or withdrawn
from any storage tank(s).
The Net CO2e emissions from the Proposed Design Building versus the Reference Building were
determined and reported for each scenario, with a negative number in Column 16 indicating a Net
Reduction in CO2e emissions from a Proposed Building with a CHP System versus the Reference Building
operating without a CHP System.
All simulations and reports where based on the operation of each selected CHP system in economic
dispatch mode (ie. CHP system deemed to operate only those hours where the “Marginal Cost of
Generation” MGC is less than or equal to the specific hourly avoided cost of electricity imported).
All of the reports include a Summary Page highlighting all of the critical assumptions and values that were
assigned to various parameters which affect the results of the simulated operation and thus GHG analysis.
It is important to note that all CHP plant revenues and emission benefits considered in the model and
presented in final reports are based on simulated “Economic Operation” that is as true to real life operation
and known to be achievable when utilizing a proven "Spot Market Automated Dispatch Algorithm"
(SMADA) system, such as was developed by POWER GENySYS for a number of successfully operational
CHP systems.
4 Conclusion This study demonstrated that a CHP System installed in a MURB, properly selected to match a balance
between the electrical and thermal loads of a Proposed Design Building in Ontario, and operating in an
appropriate manner (i.e. minimizing heat dump), will result in lower overall CO2e emissions over 20 years
(2018 to 2038) compared to the Reference Building that is operating without a CHP system. This analysis is
based on alternate CO2e emission factors with appropriate methodological justification provided by Power
Advisory LLC (PA) and as allowed in Note 5 to Table 1.1.2.2. in Supplementary Standard SB-10, Division 3,
Chapter 1.

Summary of CHP Simulation Runs for Archetype MURB using PA Grid Emissions
1 2 3 4 5 6 7 8 9 10 11 12 13 14 15 16 17
CHP Plant Configuration
Capacity, kW
Servive Water
Heating (DHW), %
Space Heating (SH), %
Operating Hours
Electricity Generation,
kWhr
Heat Recovery, mmBTU
Heat Utilized, %
Heat Dump, %
Proposed Design
(with CHP), tonnes/yr
(2020)
Reference Design
(w/o CHP), tonnes/yr
(2020)
NET Emissions Change,
Column 12-13, tonnes/year
(2020)
NET Total Emissions
Change (OVER 20 YRS)
tonnes
NET Avg. Annual Emissions Change,
(OVER 20 YRS) tonnes/yr
Meets SB-10 CO2e Emissions
Requirement
Sustainable Buildings Canada - CHP CO2e Emissions Study
APPENDIX I
GHG Emissions over 20 YrsCHP Configuration/Size Thermal Load Annual GHG Emissions (2020)Annual Outputs
No.
Grid Emissions
YR of Interest
1 2020 1 x 24 kW 24 100% 0% 7,545 181,078 1,228 99.8% 0.2% 499.64 544.98 -45.34 -1,259.00 -62.95 YES
2 2020 2 x 24 kW 48 100% 25% 6,662 319,793 2,169 95.7% 4.3% 498.11 544.98 -46.87 -1,457.98 -72.90 YES
3 2020 3 x 24 kW 72 100% 50% 6,313 448,482 3,042 88.9% 11.1% 510.80 544.98 -34.18 -1,355.02 -67.75 YES
4 2020 1 x 125 kW 125 100% 60% 4,696 497,847 3,230 81.1% 18.9% 526.62 544.98 -18.36 -1,056.40 -52.82 YES
5 2020 1 x 125 kW 125 100% 70% 4,760 504,656 3,274 81.8% 18.2% 521.20 544.98 -23.78 -1,180.70 -59.04 YES
6 2020 1 x 175 kW 175 100% 100% 2,087 247,228 1,395 81.1% 18.9% 489.12 544.98 -55.86 -1,538.37 -76.92 YES

Enbridge / SBC CHP Emissions Study
Date:
PROJECT SUMMARY
Total 954,917 kWh / yr 3,055.9 mmBTU / yr 1,806.9 mmBTU / yr 245.6 t CO2 / yr 299.4 t CO2 / yrMin. 68 kW 0 BTU/hr 33,457 BTU/hr 5.00 kG CO2 1.92 kG CO2Max. 282 kW 2,226,016 BTU/hr 601,826 BTU/hr 161.46 kG CO2 211.67 kG CO2Avg. 109 kW 349,011 BTU/hr 206,263 BTU/hr 62.21 kG CO2 8.83 kG CO2
TOTAL tonnes CO2
544.98
Electrical:GHG Emissions:Thermal:
Reference Building: (without CHP)
Seasonal Space Heating Non-Seasonal Heating [DHW] from Electricity Imports from Gas ImportsCHP HOST BUILDING:
APPENDIX IIHourly CHP Simulation & Emissions/Financial Analysis - BASE CASE November 21, 2019
File: C:\ Data \ .... \ Enbridge_CHP_Study_5. 1x125kW CHP_TOU_70pctSSH.xlsm
Avg. 109 kW 349,011 BTU/hr 206,263 BTU/hr 62.21 kG CO2 8.83 kG CO2Total 918,298 kWh / yr 2,284.6 mmBTU / yr 1,806.9 mmBTU / yr 102.9 t CO2 / yr 90.0 t CO2 / yrMin. 60 kW 0 BTU/hr 33,457 BTU/hr 0.61 kG CO2 0.00 kG CO2Max. 280 kW 1,676,807 BTU/hr 601,826 BTU/hr 95.79 kG CO2 86.67 kG CO2Avg. 105 kW 260,922 BTU/hr 206,263 BTU/hr 11.75 kG CO2 10.27 kG CO2
3,274.2 mmBTU / yr Utilized: 2,679.2 mmBTU / yr 328.3 t CO2 / yr 521.20
22.21% Dump: 595.1 mmBTU / yr -23.78
CHP SYSTEM SELECTION: for CHP Emissions Study for Enbridge / SBC: Proposed Bldg Energy Consumption: Year 2018
CHP Prime Mover: Nominal (1 x 125kW) , complete with all required ancillary equipment Electrical Consumption: 918,298 kWhBuilding Thermal Available: 100% Non-Seasonal Heating (NSH) [ie. DHW] and 70% Seasonal Space Heating (SSH) Loads Gas Consumption: 150,925 cu.m.
Nominal Electrical Output: 125.0 kW
192.90
Heat Recovery
GHG from CHP:Selected CHP System Outputs: Total 504,656 kWh / yr
NET GHG: Proposed Bldg with CHP vs REF Bldg (w/o CHP):
Proposed Building: (with CHP) &70% Seasonal Space Heating (SSH) available to CHP
Nominal Electrical Output: 125.0 kW
Nominal Thermal Output: 0.811 mmBTU 72.6% Overall System Efficiency
ANNUAL OPERATION: 4,760 genset operating hours, with 939 Genset Starts FINANCIAL SUMMARY:
Gross Electrical Output: 504,656 kWh Thermal Output: 3,274 mmBTU 100.0% Discounted Payback: 16.47 yearsNet Electrical Output: 490,378 kWh, ( 53.4% of 2018 consumption ) Thermal Utilized: 2,679 mmBTU 81.8% Project IRR: 7.99% (pre-Tax)
Parasitic Losses: 14,278 kWh Thermal Dumped: 595 mmBTU 18.2% Project NPV: $126,960 (pre-Tax)
Natural Gas Consumed: 166,339 cu.m. Thermal Utilized (in Equiv. Gas): 82,642 cu.m.
SIMULATION ASSUMPTIONS & PARAMETER SETPOINTS:1. Natural Gas Cost: Burner Tip Cost: $0.250 /cu.m. for 1st year, including Carbon Tax. ( REF. "DATA SHEET" pg. 2 of 47, under section 3. Energy Costs: B)i.) Gas Rates )
2. Natural Gas Price Inflation: The natural gas cost from year 2 - 10 is inflated based on the Natural Gas Rate Forecast table / graph (REF. "Natural Gas Rate Forecast" Sheet, page 46 of 47 - BASE CASE is Option 1 FAST INCREASE - Brown Line).
3. Electrical Rate: Electricity Consumption Charge is based on OEB Approved: Time-Of-Use (TOU) Rates [ Toronto Hydro Residential Customers: November 1, 2019 ](see 'DATA SHEET' pg. 2 of 47, under section 3. Energy Costs: A) Electrical Rate Option 2 [ Time-Of-Use (TOU) Rates ]
OFF-Peak: 7.07 cents/kWh MID-Peak: 10.08 cents/kWh ON-Peak: 14.56 cents/kWh
4. Electricity Price Inflation: The electricity cost from year 2 - 10 is inflated based on the Electricity Rate Forecast table / graph (REF. "Electricity Rate Forecast" Sheet, page 45 of 47 - BASE CASE is Option 3 High - Green Line).
5. Hourly Electrical Load Profile: The Hourly Electrical Load Profile was derived using eQuest Simulation Modelling, provided by EQ Building Performance [Appendix A] (represented graphically in the "Building Load Profile Graphs (Hourly: Semi-Annual & Hourly: 12 Months)" (see pages 25 to 38: blue graphs are the "Hourly Electrical Load Data", with the green line representing the CHP system electrical output.)
NOTE: Monthly electricity consumption values were derived using eQuest Simulation Modelling, provided by EQ Building Performance [Appendix A]
6. Hourly Thermal Load Profile: The 2016 Hourly Thermal Load Profile was derived using eQuest Simulation Modelling, provided by EQ Building Performance [Appendix A]
7. Boiler Efficiency: Set at: 90% (REF. "DATA SHEET") Thermal Load calculated as 90% of the energy in the natural gas consumed each hour.
8. Thermal Storage: Set at: 1,400 US.Gallons (REF. "DATA SHEET") The simulation assumes 1400 us.gallons of thermal storage thus any and all
9. Parasitic Loss Set at: 2.5% of Gross Electrical Output. (REF. "GENSET DATA SHEET")This means about 3 kW are considered as net losses from the 125 kWe gross electrical output of the CHP system.
10. Anticipated Availability Factor: Set at: 95% (REF. "DATA SHEET") Factor applied to each monthly CHP System Outputs, including Electrical / thermal.
11. Minimum Electricity Import Set at: 5.0 kW (REF. "DATA SHEET") This means the facility will always maintain a minimum of 5 kW of electricity importfrom the utility and if/when necessary the CHP System electrical output will be reduced to ensure this minimum import level.
thermal output in a given hour that is in excess of the "building thermal load + available storage" is considered destroyed via remote heat dump radiators and therefore not accounted as useful "utilized" thermal energy. When CHP is OFF, or cannot meet total thermal demand, then thermal energy in storage will be considered utilized first and Boilers provide heat (with additional gas consumption) only after all stored energy is consumed.
12. Minimum Genset Part Load: Set at: 40% or 50.0 kW (REF. "DATA SHEET") This means that the CHP system will shut down whenever the electrical output is required to drop below a level of 40% of its maximum nameplate capacity to maintain the minimum import level parameter.
13. Maximum Hourly Heat Dump: (MHHD) Set at: 100% (REF. "DATA SHEET") This means that the CHP system is permitted (if necessary) to dump up to100% of the recovered heat in any given hour (ie. No restriction/limitation to operate in a given hour to maintain the MHHD parameter)
14. Maximum Daily Heat Dump: (MDHD) Set at: 100% (REF. "DATA SHEET") This means that the CHP system is permitted (if necessary) to dump up to100% of recovered heat in any given day (ie. Operation limited to as many hours in a day that will ensure the MDHD parameter is maintained)
15. Fixed Operating Costs: Aux. Equipment (Materials / Labour): $0 / year Water Treatment: $0 / yearOperator, Admin., Insurance, etc.: $0 / year Dispatch, Monitoring, Reporting, etc.: $0 / year
Fixed operating costs are those that remain the same in any year whether the CHP System operates zero or multiple hours. These include:"Auxiliary Equip. Maintenance Costs" (those associated with any equipment that is not part of the Major Equipment Suppliers' OPEX Contract),"Operator, Admin., Insurance, etc.", "Dispatch, Monitoring, Reporting" (ie. Costs associated with monitoring the CHP System, determining when it should operate,
16. Variable Operating Cost: Set at: $3.30 / op.hr. (REF. "GENSET DATA SHEET") Each hour of CHP system operation will incur this Variable Operating Cost.
17. Major Overhaul Cost: Once 60,000 operating hours have been reached. (REF. "GENSET DATA SHEET") Cost/Genset: $0
18. Demand Savings Applicability: Set at: 0 or 1 (REF. "FINANCIAL ANALYSIS" Sheet - Pg.3) From actual operating experience it has been proven that achieving actual savings
of "Electrical Demand Charges" (demand savings) is not as simple as reducing from the total peak demand in each month the nominal nameplate capacity of the electrical generating equipment . To actually achieve a demand savings in a given month the electrical generating equipment must operate practically non-stop for the duration of each "ON-Peak" period (as defined by the LDC) in the billing cycle. This means that should the electrical generating equipment shut down for unscheduled maintenance during an ON-Peak period the result may be that demand savings for such a month could be lost. In addition CHP systems generally are installed in facilities where they are sized to displace the base electrical load Such sizing often results in a system which may produce far more thermal output
and for generating weekly, monthly and annual System Performance Reports).
This cost includes "Preventative Maintenance Costs" ONLY, defined as inclusive of all consumables (lubricating oil and urea for SCR, where applicable) and all "Parts and Labour" identified within the "Scheduled Maintenance Activities" of a typical OPEX Contract (from 0-60,000 operating hours). It specifically does not include any "Corrective Maintenance" associated with any Unscheduled Breakdowns or a "Major Overhaul", typically taking place at 60,000 op.hours.
19. PSUI Incentive Savings: Set at: $0.00 kWh (REF. "FINANCIAL ANALYSIS" - Pg.3) The BASE CASE simulation allows for a saveONenergy program incentive ofNOTE: The SOE PSUI Incentive Program was discontinued July 2018.
20. Discount Rate" (DR): Set at: 6% This parameter is used to determine Net Present Value (NPV) of a given project. As soon as a project's Internal Rate
21. Financing Parameters: Set at: 0% (REF. "FINANCIAL ANALYSIS" - Pg.3) This means the project is assumed to be entirely funded by the Owner and
Rate of Return (IRR) reaches a value of the designated DR then the NPV will be exactly Zero. For IRR's that exceed the designated DR the NPV will be positive and so accordingly the lower the DR is set the higher the NPV will be and the higher the DR is set the lower the NPV will be.
are installed in facilities where they are sized to displace the base electrical load. Such sizing often results in a system which may produce far more thermal output than the host facility's thermal load during shoulder and summer months. Thus operating equipment during these periods at 100% output for entire months at a time where some or most of the thermal energy is unusable can result in situations where more energy and dollars are spent than can be realized from demand savings. In such cases experience has shown that there are probably 3-4 months where demand savings cannot be achieved during summer and shoulder seasons. For simplicity however the simulation included in this report allows for all 12 months of demand savings and zero months where demand savings will be lost (which is considered highly optimistic).
0 cents/kWh for all NET electricity produced in 1st year of operation only.
21. Financing Parameters: Set at: 0% (REF. FINANCIAL ANALYSIS Pg.3) This means the project is assumed to be entirely funded by the Owner and no debt instrument is considered to be used (ie. no interest payment charges are applied.)
File: C:\ Data \ .... \ Enbridge_CHP_Study_5. 1x125kW CHP_TOU_70pctSSH.xlsm

Cogeneration Plant for Proposed Multi-Unit Residential Bldg:
Enbridge / SBC,1) IDENTIFICATION: File Name: D:\DATA\GENySYS\PROJECTS\1449 SBC - Enbridge Bldg Code Study\CHP Model\__FINAL Scenarios\[Enbridge_CHP_Study_5. 1x125kW CHP_TOU_70pctSSH.xlsm]DATA YEAR: 1 Startup
Customer: Enbridge / SBC Typ. MURB Sustainable Buildings Canada Mike Singleton POWER GENySYS Vito Mike Casola, P.Eng. Project YEAR: 2020Address: Proposed Multi-Unit Residential Bldg Enbridge / SBC Electricity Thermal Phone: 416-752-3535 ext.1 Phone: 416-995-4949 Base YEAR:Contact: Aqeel Zaidi & Terry Whitehead % of Savings 0% 0% email: [email protected] email: [email protected] Date:
2) ENERGY PROFILE:(This Energy Profile is for a Proposed Multi-Unit Residential Bldg, based on hourly consumption data provided by SBC & EQ Building (eQuest Simulation Data), and a -100% load increase from the consumption levels for the Reference facility in )
Jan Feb Mar Apr May Jun Jul Aug Sep Oct Nov Dec Totals
Unadjusted kWhr (Meter 1) 73,042 65,530 71,580 68,218 76,379 85,240 100,561 94,412 75,248 69,107 67,678 71,304 918,298
Unadjusted kWhr (Meter 2) 0 0 0 0 0 0 0 0 0 0 0 0 0Unadjusted kWhr (from 2016 Bills) 1,607,532 1,540,735 1,589,248 1,519,848 1,645,584 1,698,279 1,952,742 1,995,995 1,664,675 1,535,578 1,493,667 1,563,917 19,807,800
Unadjusted kWhr 73,042 65,530 71,580 68,218 76,379 85,240 100,561 94,412 75,248 69,107 67,678 71,304 918,298kW (Meter 1) 160.1 153.5 148.7 181.5 255.7 237.0 280.0 222.5 175.1 148.3 148.8 149.4 188.4
kW (Meter 2) 0.0 0.0 0.0 0.0 0.0 0.0 0.0 0.0 0.0 0.0 0.0 0.0 0.0
kW (Meter 3) 0.0 0.0 0.0 0.0 0.0 0.0 0.0 0.0 0.0 0.0 0.0 0.0 0
Demand: kW 160.1 153.5 148.7 181.5 255.7 237.0 280.0 222.5 175.1 148.3 148.8 149.4 188
Virtual Bill: $ (Meter 1) 9,159.04 8,318.85 8,913.45 8,896.92 10,402.01 11,002.49 12,858.12 11,730.81 9,479.02 8,682.42 8,527.51 8,894.70 116,865.33
Virtual Bill: $ (Meter 2) 0.00 0.00 0.00 0.00 0.00 0.00 0.00 0.00 0.00 0.00 0.00 0.00 0.00
Virtual Bill: $ (Meter 2) 0.00 0.00 0.00 0.00 0.00 0.00 0.00 0.00 0.00 0.00 0.00 0.00 0.00
Aggregate Cost: $ 9,159 8,319 8,913 8,897 10,402 11,002 12,858 11,731 9,479 8,682 8,528 8,895 116,865
Aggregate Gas: cu.m. 27,389.2 21,954.0 18,618.7 11,555.3 6,592.5 4,706.7 4,371.9 4,338.7 4,949.3 9,328.5 16,103.8 21,015.9 150,925
Equivalent Thermal: mmBTU 887.9 711.7 603.6 374.6 213.7 152.6 141.7 140.7 160.4 302.4 522.1 681.3 4,893
3) ENERGY COSTS: OFF-Peak Operation: (Enter: Y or N)
A) ELECTRICAL: Enter Electrical Rate Option: (1,2,4) 2 Time-Of-Use (TOU) Rates Y "OFF-Peak" - WINTER (Nov. - Apr.)Hydro Rebate Applied OPA CHPSOP Contract: (Y or N) N No CHPSOP Contract Y "OFF-Peak" - SUMMER (May - Oct.)
NOTE: for Spot Market choose Option 4 10.25214285714290 12 Y N
Fixed Block (2 Tier) Rates WINTER SUMMER Meter 1 118 4 N Y
1st Tier: Low Price (kWhrs) 8.3 first 1000 600 Meter 2 0 N
2nd Tier: High Price (kWhrs) 10.3 above 1000 600 Meter 3 0 N 0.0 $/kWh
Time of Use Rates (inc'g Rebate 7.1 OFF-Peak FALSE
(cents/kWhr) 10.1 MID-Peak GHG Analysis (SELECT): YR of Interest
(see Sheet TOU) 14.6 ON-Peak 2016 2016 C) EMISSIONS: 20202017
B) THERMAL: 1 cu.m. of Natural Gas = 70% <--- ENTER: % of Non-Seasonal (Space Heating) Load for CHP AVG. CO2 1.8750 kg/cu.m.
0.0 mmBTU
$/cu.m. $/mmBTU Value Units
Alberta Border Price - - VALUE L: LENGTH of Geothermal Exchange Field m Pollutant kg/kWhr Credit ($/kg)TCPL Charges (with fuel) - - of Thermal W: WIDTH of Geothermal Exchange Field m CO2 0.6180 0.000Enbridge Costs** - - Energy D: DEPTH of Geothermal Exchange Field (Boreholes) m NOx 0.0000 0.000
Total Cost $0.2500 $6.94 $7.71 V: Volume of Geothermal Exchange Field 0 m3
per mmBTU Storage Capacity per m3 of GeoExchange Field Volume mmBTU/°F/m3
$ / 1000 lbs - Storage Capacity per typical 500ft Borehole 3,307,500 BTU / °F 1. OPA City DR $0 0 $/kW
-{ with 100% Non-Seasonal Heating [DHW] & 70% Seasonal Space Heating (SSH) Loads }-CHP Option No. 3: Nominal (1 x 125kW) Genset
30%
Base Load Cogen (Elec/Thermal Load Following) [ reduce El. output to maintain Max. Hourly Dump of 100% ]SCHEME No. 3,
Electricity Generation Revenue from: | No saveONenergy incentive Time-Of-Use (TOU) Rates
9.80
SPOT Market4
( Engine-Generator Exhaust )
Note: Emission Credits Not Applied
PROJECT INCENTIVE FUNDING:
Emissions from CHP Prime Mover
Enter Year
Parameters of GeoExchange Field
iv.) Geothermal Exchange
Standby Charge Applicable
OPA CHPSOP Net Revenue Support Level
($/kW per Month)
Demand ($/kW)
kWhrs per Suite
Total GEOStorage:
Enter: Customer Incentives
November 21, 2019
Enter: Y or N
$/MW/mo.28900
Block
3
PRICE (cents/kWhr)
saveONenergy
CHP Emissions Study for Enbridge / SBCYEAR 1 (2020) - CHP Plant at a Proposed Multi-Unit Residential Bldg
DATA SHEET
1
i.) Gas Rates (Enbridge Rate 6 - Commercial Industrial Customers - average)
Cost Component
0.03602096 mmBTU
2
2018
6.00
GA
S
kW
hr
Pea
k kW
CO
ST
Total No. Suites Electricity Rate Options:
ii.) Purchased Steam Rate
Steam Cost Component
EL
EC
TR
ICIT
Y
no C
HP
g p y p yp
1 us.gal. water 8.34 lb/gal. Total No. of Boreholes in Geothermal Exchange Field 0 2. Enbridge $0 0 $/kW
Total Storage: 0.701 mmBTU Ground Exchanger Fluid Limit: Heating Cycle 50.0 °F 3. TAF $0 0 $/kW
US.Gal. in each Tank No. Tanks 1 Ground Exchanger Fluid Limit: Cooling Cycle /CHP Storage 75.0 °F 4. NRCan/TEAM $0 0 $/kW
Min. Tank Temp. (deg. F) Total US.Gal. 1,400 us.gallons TOTAL Storage Capacity (by volume of GeoExchange Field) 0.0 mmBTU 5. Customer $0 0 $/kW
Max. Tank Temp. (deg. F) HWH Loop 200 us.gal. (est'd) TOTAL Storage Capacity (by Total No. of Boreholes) 0.00 mmBTU Total: $0 0 $/kW
4) INFLATION: ENTER Specified Forecast Index: 2.0% ENTER the NRRIF: 0.1000 Net Revenue Requirement Indexing Factor ( Note: NRRIF must be between 0.0 & 0.20 )
OPTION 2021 2022 2023 2024 2025 2026 2027 2028 2029 2030 2031 2032 - 2039
3 3 3.00% 3.00% 4.00% 4.00% 4.00% 4.00% 4.00% 4.00% 4.00% 4.00% 4.00% 4.00%1 1 2.50% 2.50% 2.50% 2.50% 3.00% 3.00% 3.00% 3.00% 3.00% 3.00% 3.00% 3.00%
3 2.0% 2.0% 2.0% 2.0% 2.0% 2.0% 2.0% 2.0% 2.0% 2.0% 2.0% 2.0%3 2.0% 2.0% 2.0% 2.0% 2.0% 2.0% 2.0% 2.0% 2.0% 2.0% 2.0% 2.0%3 2.0% 2.0% 2.0% 2.0% 2.0% 2.0% 2.0% 2.0% 2.0% 2.0% 2.0% 2.0%
Option # UNHIDE NEXT 6 ROWS TO EDIT VALUES INFLATION OPTIONS
Nominal (1 x 125kW) Refer to "Engine Data" Sheet for Details of Option No.'s Type of Heating System (FCU or WSHP):
Option No.: 5 kW Min. Elec. Import Facility Expansion Factor:
Number of Gensets 40.0% Min. Genset Part-Load Efficiency of Displaced Boilers: 4,760 Operating Scheme 50.0 kW Min. Part Load /Genset Natural Gas Lower Heating Value (LHV): 54.3% Max. Heat Dump / Hr 3.0 kW Parasitic Loss (2.4%) No.2 Diesel Oil Heating Value:
Max. Heat Dump / DAY 1.0 Hrs Min. Dispatch / DAY $625,000 5,000 $/kW
GROSS ELEC. OUTPUT (GEO): 125.0 kW $0 0 $/kW
Fuel Consumption LHV: (Net Heat Rate) 10,745 Btu/kWhr $625,000 5,000 $/kW
IC, OC & JW - HTCC Thermal: 0.780 mmBtu/hr Aux. Equipment (Materials / Labour): $0 $/yr
Exhaust - HTCC Thermal: 0.031 mmBtu/hr 0 Operator, Admin., Insurance, etc.: $0 $/yr
LT Circuit Thermal - NOT Recovered: 0 mmBtu/hr Max. Dump Water Treatment: $0 $/yr
TOTAL HEAT RECOVERY (THR): 0.811 mmBtu/hr 100.0% Dispatch, Monitoring, Reporting, etc.: $0 $/yr
Genset Maintenance Cost (VARIABLE): $3.300 $ / op.hr
Genset GHG Emissions: 0.6180 kG CO2 / kWh Hurdle Rate IRR: 9.00% 544.98 Anticipated Availability: 95% Corporate Tax Rate: 40.00% 328.30
Electrical Efficiency Factor: 100% of Manufacturer's Rating Discount Rate (D.R.) for NPV Calc's: 6.00% 521.20Thermal Efficiency Factor: 100% of Manufacturer's Rating After Tax D.R. = D.R. x (1-Corp. Tax Rate): 3.60% -23.78
8) OPERATING SCHEME: Base Load Cogen (Elec/Thermal Load Following) [ reduce El. output to maintain Max. Hourly Dump of 100% ]Season 1
Jan Feb Mar Apr May Jun Jul Aug Sep Oct Nov Dec TotalTotal Days per month (2000) 31 28 31 30 31 30 31 31 30 31 30 31 365
Available Hours per Month 744 672 744 720 744 720 744 744 720 744 720 744 8,760
CHP PLANT Operating hours per Month 514.0 454.1 464.6 402.8 344.9 324.9 327.8 321.1 302.1 376.2 438.9 488.3 4,760
CHP PLANT Op.Hrs as % of available hrs 69.1% 67.6% 62.4% 55.9% 46.4% 45.1% 44.1% 43.2% 42.0% 50.6% 61.0% 65.6% 54.4%
CHP PLANT Operating hours / day (avg.) 16.6 16.2 15.0 13.4 11.1 10.8 10.6 10.4 10.1 12.1 14.6 15.8 Total / Avg.Gross Electricity Generated (kWhrs) 53,297 47,091 47,869 40,634 36,247 36,852 39,372 38,576 33,105 37,237 44,235 50,141 504,656
Net Electricity Used Internally (kWhrs) 51,755 45,729 46,476 39,425 35,212 35,877 38,389 37,613 32,199 36,108 42,918 48,677 490,378Net Electricity Exported (kWhrs) 0 0 0 0 0 0 0 0 0 0 0 0 0
Aggregate Thermal Load / Mo. (mmBTU) 887.93 711.72 603.60 374.61 213.72 152.59 141.73 140.66 160.45 302.42 522.07 681.31 4,893Cogen Heat Recovery / Mo. (mmBTU) 345.79 305.53 310.58 263.63 235.17 239.09 255.45 250.28 214.79 241.59 286.99 325.32 3,274Cogen Heat Utilization / Mo. (mmBTU) 345.79 304.87 301.43 224.86 159.60 135.55 133.32 132.52 136.56 203.08 276.82 324.76 2,679
Equiv. Gas Displaced / Mo. (cu.m.) 10,666.4 9,404.2 9,298.0 6,936.0 4,923.0 4,181.1 4,112.4 4,087.7 4,212.3 6,264.3 8,538.8 10,017.6 82,642
Electrical Output Capacity Utilization (%): 57.3% 56.1% 51.5% 45.1% 39.0% 40.9% 42.3% 41.5% 36.8% 40.0% 49.1% 53.9% 46.1%
Season 1 Season 2 Season 3 Season 4
THERMAL
NPVBC: (before tax)with 100% Owner's Equity,
ELECTRICAL
7.99%
90.0%
$0
ANNUAL GHG EMISSIONS
( Tonnes CO2 )
from Building (without CHP):from CHP Plant:
Δ GHG (without CHP vs with):from Building (with CHP):
FINANCIAL
$ $ F I N A N C I A L R E S U L T S $ $
RUN HOURS
COGEN PLANT OUTPUT
The PROJECT Requires: a Capital Cost Reduction incentive,
as follows:
Min. Th Load (w. Storage) to Dispatch
923 Btu/cu.ft.
37,880 Btu/L
125.0 kW
DER
ATIO
N
FAC
TOR
S
CHECK FOR EXCESSIVE HEATDUMP
100%
Contingent Support:
3
#REF!
CCRHR: ( $/kW )
IRRBC: (before tax)
To meet HURDLE RATE:
To meet Hurdle Rate of 9%
NPVHR:
BASE CASE RESULTS: $126,960& 0% LTD Financing at
4.5% interest, over 15 Years
Te
chn
ica
l S
pe
cific
atio
ns
3 1.0000
Net Installed Cost
CCR (Cap. Cost Reduction)
6) OPERATING PARAMETERS:
1
100%
Natural Gas (see Gas Rate Forecast)
Genset Maintenance/LabourEn
ter:
1-
5) COGEN PLANT SELECTION:
Aux. Eq. Maintenance & Labour
CAPITAL COST
1,200
120
180
iii.) Thermal Storage (DHW Tanks)
Fuel Oil (Diesel No.2)
Electricity (see Elec. Rate Forecast)
7) RESULTS OF SIMULATION: (Base Case & Hurdle Rate)
237.7 kW
Enter: Base Case ( 1=Low, 2=Med., 3=High )
HWH
PE
R G
EN
SE
T
OP
ER
AT
ING
F
IXE
D
Recovered Heat Utilization (%): 100.0% 99.8% 97.1% 85.3% 67.9% 56.7% 52.2% 52.9% 63.6% 84.1% 96.5% 99.8% 81.8%Heat Dump (%): 0.0% 0.2% 2.9% 14.7% 32.1% 43.3% 47.8% 47.1% 36.4% 15.9% 3.5% 0.2% 18.2%
Heat Dump (mmBTU) 0.00 0.66 9.15 38.77 75.57 103.55 122.13 117.77 78.23 38.51 10.18 0.56 595
PE
R G
EN
SE
T
OP
ER
AT
ING
F
IXE
D
File: C:\ Data \ .... \ Enbridge_CHP_Study_5. 1x125kW CHP_TOU_70pctSSH.xlsm Sheet: DATA Page: 1 of 1

Specs for CHP System Options 1 2 3 4 3Nominal Nominal Nominal Nominal Nominal
65kW 24kW 125kW 170kW 125kW BTU/hr 125kW BTU/hr
CAPITAL & OPERATING COST DATA CDN $
Containerized Primer Mover & Aux. Equipment Cost, incl'g: $ 200,000 80,000 300,000 475,000 300,000 300,000 Controls, Swithgear, Dump Rads, Pumps, Heat Recovery & HRSG., etc. $ included included included included included includedAbsorption Chiller Included? Y / N 0 0 0 0 0 0Estimated Other Equip. & Install Costs, including: $ 200,000 70,000 325,000 375,000 325,000 325,000 Civil/Structural, Mech./Elec. Installation, Eng'g, etc.
TOTAL PROJECT COST $ 400,000 150,000 625,000 850,000 625,000 625,000TOTAL PROJECT COST: $/kW (rounded) $/kW 6,154 6,250 5,000 5,000 5,000 5,000
CAPITAL COST REDUCTION (CCR) $/kW 0 0 0 0 0 0NET PROJECT COST: $/kW (rounded) $/kW 6,154 6,250 5,000 5,000 5,000 5,000Estimated Maintenance Cost w/ items included (indicated "1"): $/op.hr. 1.300 0.652 3.300 4.900 3.300 3.300 Preventatitive Maintenance 1 $/op.hr. 0.31 included included included #VALUE! Lube Oil Consumption and Changes 1 $/op.hr. 0.12 included included included #VALUE! Urea for Selective Catalytic Reduction (SCR) Unit L/op.hr. 0.08 N/A N/A N/A #VALUE! Cost of Urea for SCR (at $0.80/L) 1 $/op.hr. 0.06 N/A N/A N/A #VALUE! Corrective Maintenance 0 $/op.hr. 0.00 0.00 0.00 *Run Hours to Major Overhauls 60,000 $ 0 0 125,000 0 0
OPERATIONAL DATAAnticipated Genset Availability % 95% 95% 95% 95% 95% 95%Electrical Efficiency Factor (See Sheet "DATA") % 100% 100% 100% 100% 100% 100%Thermal Efficiency Factor (See Sheet "DATA") % 100% 100% 100% 100% 100% 100%
TECHNICAL DATA System Full Load Specifications Nm3/h
Fuel Input (Gas Volume - LHV) Nm3/kWh 0.3620 0.3350 0.3296 0.2913 0.330 0.330 Fuel Input (LHV) kW 224.7 76.8 393.6 473.0 393.6 1,343,111 393.6 1,343,111 Fuel Input (LHV) mmBTU/h 0.767 0.262 1.343 1.614 1.343 1.343 Net Heat Rate (LHV) BTU/kWhe 11,800 10,921 10,745 9,495.6 10,744.9 10,744.9 Gross Electrical Power Output kWe 65.0 24.0 125.0 170.0 125.0 125.0 System Parasitic Losses (Enter: % of Total Output) 2.5% kWe 4.0 1.0 3.0 4.0 3.0 3.0
1 genset 1 gensets
GENSET Manufacturer & Model No. Units
DATE
November 21, 2019
Available CHP SYSTEM OPTIONS Option Selected
Imperial Units
Imperial Units
CHP Plant DATA
GENSET DATA SHEET for Cogen System Options
CHP Plant in a Proposed Multi-Unit Residential BldgCHP Emissions Study for Enbridge / SBC
y ( p )
Net Electrical Output kWe 61.0 23.0 122.0 166.0 122.0 122.0
Electrical Conversion Efficiency % 28.9% 31.3% 31.8% 35.9% 31.8% 31.8% Thermal Heat Recovery Efficiency % 53.3% 62.1% 60.4% 59.4% 60.4% 60.4% Total CHP System Efficiency % 82.2% 93.4% 92.1% 95.3% 92.1% 92.1%
Heat Recovery from Genset Cooling Circuits: HTCC = High Temp. Cooling Circuit, LTCC = Low Temp. Cooling Circuit kWth HTCC - 1st Stage Intercooler (Aftercooler) kWth 0.0 0.0 0 0.0 0 HTCC - Lube Oil kWth 0.0 0 0.0 0 HTCC - Jacket Water kWth 47.7 228.6 177.0 228.6 780,000 228.6 780,000
HTCC - 1st Stage Exhaust (to 120°C / 248°F outlet) kWth 119.8 9.1 104.0 9.1 31,000 9.1 31,000
LTCC - 2nd Stage Intercooler (Aftercooler) kWth 0.0 0.0 0 0.0 0
LTCC - 2nd Stage Exhaust (to 50°C / 122°F outlet) kWth 0.0 0 0.0 0 LTCC Utilization Factor 0 or 1 0 0
TOTAL HEAT RECOVERY kWth 119.8 47.7 237.6 281.0 237.6 811,000 237.6 811,000
Cooling Circuit Data
HTCC: Water Inlet Temp. °C
HTCC: Water Outlet Temp. °C
HTCC: Water Flow Rate: Nm3/hr HWHRC 1st Stage Exhaust: Water Inlet Temp. °C
HWHRC 1st Stage Exhaust: Water Outlet Temp. °C
HWHRC 1st Stage Exhaust: Water Flow Rate Nm3/hr
Exhaust Gas Exhaust Gas Temperature (at Full Load) °C
Exhaust Gas Mass Flow Rate, wet kg/h
Exhaust Gas Volume, wet Nm3/hr Exhaust Gas Total Thermal Energy kWth
Maximum Exhaust Back Pressure mbar
Combustion Air Intake Combustion Air Intake Mass Flow Rate kg/h
Combustion Air Volume Nm3/hr
Lubricating Oil Consumption gal./bhp-hr
gal./hr
Min. Gas Supply Pressure psig 0
Emissions (at 15% O2 vol. dry) NOx g/bhp-hr NOx kg/MWhr CO g/bhp-hr
CO kg/MWhr CO kg/MWhr NMHC g/bhp-hr
File: C:\ Data \ .... \ Enbridge_CHP_Study_5. 1x125kW CHP_TOU_70pctSSH.xlsm Sheet: Engine Data Page: 1

0
4,760 54.3%4,760 54.3%
OFP hrs % Total kWhr % Total MP hrs % Total kWhr % Total ONP hrs % Total kWhr % Total Hours kWhr % mmBTU cu.m. $
JAN. 744 480 64.5% 45,836 62.8% 132 17.7% 12,666 17.3% 132 17.7% 14,540 19.9% 744 73,042 100% 888 27,389 6,847
Typ. MURB JV Partner FEB. 672 444 66.1% 41,976 64.1% 114 17.0% 11,063 16.9% 114 17.0% 12,491 19.1% 672 65,530 100% 712 21,954 5,488
MAR. 744 492 66.1% 45,862 64.1% 126 16.9% 11,983 16.7% 126 16.9% 13,735 19.2% 744 71,580 100% 604 18,619 4,655
APR. 720 468 65.0% 42,315 62.0% 126 17.5% 12,290 18.0% 126 17.5% 13,613 20.0% 720 68,218 100% 375 11,555 2,889
MAY 744 480 64.5% 44,919 58.8% 132 17.7% 15,290 20.0% 132 17.7% 16,171 21.2% 744 76,379 100% 214 6,592 1,648
JUN. 720 468 65.0% 49,812 58.4% 126 17.5% 17,591 20.6% 126 17.5% 17,837 20.9% 720 85,240 100% 153 4,707 1,177
JUL. 744 480 64.5% 58,279 58.0% 132 17.7% 21,083 21.0% 132 17.7% 21,199 21.1% 744 100,561 100% 142 4,372 1,093
AUG. 744 480 64.5% 55,486 58.8% 132 17.7% 19,491 20.6% 132 17.7% 19,435 20.6% 744 94,412 100% 141 4,339 1,085
SEP. 720 492 68.3% 47,677 63.4% 114 15.8% 13,787 18.3% 114 15.8% 13,784 18.3% 720 75,248 100% 160 4,949 1,237
# OCT. 744 480 64.5% 43,207 62.5% 132 17.7% 12,019 17.4% 132 17.7% 13,881 20.1% 744 69,107 100% 302 9,329 2,332
% TOTAL 100.0% 100.0% 0.0% NOV. 720 456 63.3% 41,639 61.5% 132 18.3% 12,248 18.1% 132 18.3% 13,791 20.4% 720 67,678 100% 522 16,104 4,026
DEC. 744 516 69.4% 48,211 67.6% 114 15.3% 10,874 15.3% 114 15.3% 12,219 17.1% 744 71,304 100% 681 21,016 5,254
# 2020 8,760 5,736 65.5% 565,219 61.6% 1,512 17.3% 170,383 18.6% 1,512 17.3% 182,697 19.9% 8,760 918,298 100% 4,893 150,925 37,731
Natural Gas Rate: 0.250 $ / cu.m. * Efficiency of Displaced Boilers: 90%
1,981 1,436 1,342
HEAT RECOVERED
November 21, 2019
CHP PLANT - OPERATING SUMMARYYEAR 1 (2020) - CHP Plant at a Proposed Multi-Unit Residential Bldg
CHP Emissions Study for Enbridge / SBC Date:
16.47 years 7.99%
Net Present Value (Base Case, after tax)
Discounted Payback ( BASE CASE )
Net Present Value (Base Case, before tax)
Base Load Cogen (Elec/Thermal Load Following) [ reduce El. output to maintain Max. Hourly Dump of 100% ]Electricity Generation Revenue from: Time-Of-Use (TOU) Rates and no saveONenergy incentive
CHP Option No. 3: Nominal (1 x 125kW) Genset : -{ with 100% Non-Seasonal Heating [DHW] & 70% Seasonal Space Heating (SSH) Loads }-
$126,960 Plant Run Hrs$126,960
Electrical Capacity Utilization
CHP Heat Utilization
46.1%THERMAL LOAD
argi
nal
ost o
f ne
ratio
n
81.8%
10,745
NATURAL GAS
72.6%BTU/kWh
BTU/kWh
CIE
NC
Y
HEA
T
RA
TE
FE
CT
IVE
Overall System Efficiency
Equipment Heat Rate:
Parasitic kWhrs included
7.26
Parasitic kWhrs deducted
7.753
Effective Heat Rate:
Gas Enegy Utilization:
6,564 kWh/cu.m.
ANNUAL AVG. MARGINAL COST of GENERATION
( cents / kWhr )
HEAT UTILIZED
ANNUAL SAVINGS $(Based on 1st Year Results)
ANNUAL COSTS
NPV of Savings
HEAT DUMPED
7.47
ON-PEAK (ONP)
126,960
0
Hours / Month
OFF-PEAK (OFP) MID-PEAK (MP) ON-PEAK (ONP)
YEAR 1 (2020): CHP PLANT OPERATING SUMMARY
Genset Starts
Enbridge / SBC DESCRIPTION: CHP PLANT OPERATING SUMMARY - MONTHLY ENERGY LOAD PROFILES: Aggregate Electrical / Thermal Load Profiles vs. Electrical / Thermal Output of selected Cogen System Operating Schemes
CHP Emissions Study PROJECT SCENARIO:
with 100% Owner's Equity
939
After-Tax Equity IRR ( BASE CASE )
7.99% & 0% LTD Financing at 4.5% interest, over 15
Years PLANT CAPACITYOFF-Peak MID-Peak
Pre-Tax Equity IRR ( BASE CASE )
AvailabilityGenset Run Hrs Availability
CHP Plant in a Proposed Multi-Unit Residential Bldg | CHP Option No. 3: Nominal (1 x 125kW) Genset | SCHEME No. 3, with Time-Of-Use (TOU) Rates, and -{ with 100% Non-Seasonal Heating [DHW] & 70% Seasonal Space Heating (SSH) Loads }-
Time-of-Use
ANNUAL ENERGY UTILIZATION
ELECTRICALON-Peak
THERMAL 237.7 kW
125.0 kW
87,974
57,031
DEMAND 10,283 0
DISPLACED GAS
TOTAL
0
20,660
ELECTRICITY
0
87,974
NATURAL GAS $
BUILDING LOAD ( Electricity Imported )
TOTALCHP
ELECTRICITY GENERATION
T E
LEC
. A
CIT
Y
CTO
R
OFF-PEAK (OFP) MID-PEAK (MP)
TOTALMonth
OFP hrs % Total kWhr % Total MP hrs % Total kWhr % Total ONP hrs % Total kWhr % Total Hours kWhr mmBTU mmBTU % cu.m. $ mmBTU % cu.m. $ Btu/kWh c / kWhr
JAN. 35 263 54.8% 28,247 53.0% 125 95.0% 11,781 22.1% 125 95.0% 13,269 24.9% 514 53,297 57.3% 345.8 345.8 100.0% 10,666 2,667 0.0 0.0% 0.0 - 82.6% 5,385 6.42
FEB. 34 238 53.5% 25,422 54.0% 108 95.0% 10,293 21.9% 108 95.0% 11,376 24.2% 454 47,091 56.1% 305.5 304.9 99.8% 9,404 2,351 0.7 0.2% 20.2 5 82.4% 5,399 6.43
MAR. 61 225 45.8% 24,210 50.6% 120 95.0% 11,144 23.3% 120 95.0% 12,515 26.1% 465 47,869 51.5% 310.6 301.4 97.1% 9,298 2,324 9.1 2.9% 282.1 71 80.9% 5,576 6.59
APR. 85 166 35.5% 17,273 42.5% 117 92.7% 10,986 27.0% 120 95.0% 12,375 30.5% 403 40,634 45.1% 263.6 224.9 85.3% 6,936 1,734 38.8 14.7% 1,196.0 299 74.5% 6,339 7.25
MAY 110 111 23.2% 11,509 31.8% 108 82.0% 11,227 31.0% 125 95.0% 13,512 37.3% 345 36,247 39.0% 235.2 159.6 67.9% 4,923 1,231 75.6 32.1% 2,331.1 583 65.0% 7,470 7.99
JUN. 104 95 20.3% 10,439 28.3% 110 87.5% 12,697 34.5% 120 95.0% 13,716 37.2% 325 36,852 40.9% 239.1 135.5 56.7% 4,181 1,045 103.5 43.3% 3,194.0 799 59.0% 8,195 8.31
JUL. 113 90 18.8% 10,405 26.4% 112 84.9% 13,749 34.9% 125 95.0% 15,218 38.7% 328 39,372 42.3% 255.4 133.3 52.2% 4,112 1,028 122.1 47.8% 3,767.2 942 56.5% 8,487 8.38
AUG. 119 91 19.0% 10,554 27.4% 105 79.2% 12,777 33.1% 125 95.0% 15,245 39.5% 321 38,576 41.5% 250.3 132.5 52.9% 4,088 1,022 117.8 47.1% 3,632.6 908 57.0% 8,438 8.34
SEP. 120 106 21.6% 11,318 34.2% 87 76.7% 9,693 29.3% 108 95.0% 12,094 36.5% 302 33,105 36.8% 214.8 136.6 63.6% 4,212 1,053 78.2 36.4% 2,413.1 603 62.7% 7,748 8.07
OCT. 108 135 28.1% 14,184 38.1% 116 87.8% 10,296 27.6% 125 95.0% 12,757 34.3% 376 37,237 40.0% 241.6 203.1 84.1% 6,264 1,566 38.5 15.9% 1,187.9 297 73.8% 6,419 7.37
NOV. 59 188 41.3% 20,085 45.4% 125 95.0% 11,384 25.7% 125 95.0% 12,765 28.9% 439 44,235 49.1% 287.0 276.8 96.5% 8,539 2,135 10.2 3.5% 313.9 78 80.6% 5,615 6.69
DEC. 40 272 52.7% 28,834 57.5% 108 95.0% 10,114 20.2% 108 95.0% 11,194 22.3% 488 50,141 53.9% 325.3 324.8 99.8% 10,018 2,504 0.6 0.2% 17.2 4 82.5% 5,396 6.46
2020 987 1,981 34.5% 212,480 42.1% 1,342 88.8% 136,141 27.0% 1,436 95.0% 156,036 30.9% 4,760 504,656 46.1% 3,274 2,679 81.8% 82,642 20,660 595.1 18.2% 18,355 4,589 72.6% 6,564 7.26
Equivalent Gas *
Ma Co
Gen
EFFI
CI H R
EF
FHEAT UTILIZEDMonth
HEAT DUMPEDON-PEAK (ONP) GENERATION Equivalent Gas *
MAINTENANCE
TOTAL
$15,708
$57,293
NATURAL GAS
ANNUAL GHG EMISSIONS ( tCO2 )
in maintenanceLUBE OIL
$41,585 TOTAL
GENERATIONCHP Plant Starts PL
AN
T C
APA
FAC
TOFF-PEAK (OFP) GENERATION
MID-PEAK (MP) GENERATION
REFERENCE BLDG. NO 544.98Proposed BLDG. with CHP 521.202020 ∆ GHG Emissions -23.78∆ GHG 20YR avg. annual -59.03∆ GHG 20YR TOTAL -1,180.67
0
20,000
40,000
60,000
80,000
100,000
120,000
JAN. FEB. MAR. APR. MAY JUN. JUL. AUG. SEP. OCT. NOV. DEC.
kWh
BUILDING ELECTRICAL LOAD vs. ELECTRICITY GENERATEDTOTAL kWh Load OFF-Peak kWh Load MID-Peak kWh Load ON-Peak kWh LoadTOTAL kWh Generated OFF-Peak kWh Generated MID-Peak kWh Generated ON-Peak kWh Generated
0
100
200
300
400
500
600
700
800
900
JAN. FEB. MAR. APR. MAY JUN. JUL. AUG. SEP. OCT. NOV. DEC.
mm
BTU
BUILDING THERMAL LOADS vs. HEAT RECOVERED ( Utilized / Dumped )SSH Load (not available to CHP) SSH Load (available to CHP) Non-Seasonal DHW LoadTOTAL Heat Recovered Heat Utilized Heat Dumped
File: C:\ Data \ ... \ Enbridge_CHP_Study_5. 1x125kW CHP_TOU_70pctSSH.xlsm, Sheet: SUMMARY CONFIDENTIAL: Property of HH Angus Associates Ltd.

DESCRIPTION:
PROJECT:
JAN FEB MAR APR MAY JUN JUL AUG SEP OCT NOV DEC
MONTHLY TOTAL DIFFERENTIAL GHG EMISSIONS ( T CO )
Enbridge / SBC CHP Emissions Study: GHG EMISSIONS SUMMARY
DATE:Enbridge / SBC - CHP Emissions Study: Proposed Multi-Unit Residential Bldg | CHP Option No. 3: Nominal (1 x 125kW) Genset
November 21, 2019 SCHEME No. 3, with Time-Of-Use (TOU) Rates, and -{ with 100% Non-Seasonal Heating [DHW] & 70% Seasonal Space Heating (SSH) Loads }-
Select YEAR
‐50.00
0.00
50.00
100.00
150.00
200.00
250.00
GHG Emissions ( kG
CO2 )
Hourly GHG Emissions for Selected Year of Interest
Hourly GHG Emissions from REF. BLDG w/o CHP Hourly GHG Emissions from Proposed BLDG with CHP
Hourly NET GHG Emissions from Proposed BLDG with CHP
‐18‐16‐14‐12‐10‐8‐6‐4‐202468
GHG Emissions ( kG
CO2 )
20 YR AVG of Monthly TOTAL Differential GHG Emissions (for a Proposed Bldg with CHP vs Reference Bldg without CHP)
Δ GHG EMISSIONS for Proposed Bldg with CHP vs Reference Bldg without CHP ( for YR of Interest )Δ GHG EMISSIONS for Proposed Bldg with CHP vs Reference Bldg without CHP ( 20YR Average )
2020 JAN FEB MAR APR MAY JUN JUL AUG SEP OCT NOV DEC
YEAR 2020 -11.00 -10.59 -6.95 1.15 3.01 5.50 4.81 4.05 0.68 -0.51 -5.01 -8.93 -23.78
2018 -9.21 -8.55 -3.85 -0.96 5.92 5.35 2.70 2.21 2.07 1.36 -3.45 -7.47 -13.872019 -8.51 -6.66 -4.57 4.11 5.94 8.08 6.66 5.78 2.26 2.45 -2.22 -5.92 7.39
YR of Interest * 2020 -11.00 -10.59 -6.95 1.15 3.01 5.50 4.81 4.05 0.68 -0.51 -5.01 -8.93 -23.782021 -10.90 -8.61 -6.86 1.17 2.96 3.07 3.15 2.33 -0.63 -2.32 -7.08 -10.98 -34.692022 -13.32 -10.67 -8.30 -1.96 1.09 2.99 3.13 2.26 -0.65 -2.38 -7.10 -11.00 -45.912023 -14.67 -12.70 -8.67 -3.17 0.48 2.08 2.26 1.42 -1.61 -2.61 -7.91 -12.09 -57.172024 -12.40 -10.11 -8.00 -1.63 1.14 3.16 3.56 3.04 -0.27 -2.23 -6.87 -8.45 -39.062025 -17.22 -13.45 -10.56 -3.68 0.17 0.82 -0.40 -0.52 -2.40 -2.95 -8.99 -12.00 -71.182026 -15.43 -12.34 -9.42 -3.70 0.16 1.68 -0.24 -0.41 -2.35 -2.89 -8.88 -13.36 -67.172027 -15.86 -12.67 -9.63 -3.70 0.16 1.65 0.79 0.61 -2.13 -2.74 -8.11 -12.55 -64.182028 -16.01 -12.98 -9.98 -3.69 0.17 1.66 0.77 0.60 -2.12 -2.80 -8.31 -12.60 -65.302029 -16.08 -12.95 -9.99 -3.71 0.16 1.59 0.78 0.51 -2.15 -2.79 -8.37 -12.70 -65.702030 -14.62 -12.18 -9.21 -3.55 0.19 1.90 0.76 0.51 -2.14 -2.79 -8.55 -12.94 -62.622031 -16.68 -13.19 -10.31 -3.70 0.15 1.56 0.77 0.49 -2.13 -2.88 -8.68 -13.12 -67.742032 -17.01 -13.20 -10.42 -3.70 0.17 1.50 0.68 0.42 -2.12 -2.94 -8.81 -13.25 -68.692033 -17.25 -13.29 -10.62 -3.75 0.22 1.42 0.57 0.33 -2.16 -2.99 -8.99 -13.43 -69.952034 -17.55 -13.41 -10.67 -3.72 0.19 1.38 0.36 0.21 -2.22 -3.05 -9.11 -13.84 -71.442035 -17.85 -13.67 -10.95 -3.72 0.05 1.32 0.15 0.10 -2.31 -3.06 -9.34 -14.16 -73.452036 -18.33 -13.80 -11.08 -3.67 -0.03 1.25 0.12 0.10 -2.26 -3.07 -9.46 -14.65 -74.882037 -18.54 -13.81 -11.03 -3.63 -0.11 1.25 0.04 0.07 -2.28 -3.13 -9.59 -14.78 -75.552038 -18.54 -13.82 -11.10 -3.73 -0.09 1.31 0.05 0.03 -2.31 -3.09 -9.65 -14.80 -75.74
#N/A
20 YR AVG. -15.1 -12.0 -9.1 -2.5 1.1 2.4 1.5 1.1 -1.4 -2.3 -7.8 -12.0 -59.0
20 YR Total -317.0 -252.7 -192.1 -52.9 22.1 50.5 31.5 24.1 -29.2 -47.4 -164.5 -253.0 -1,180.7
* The analysis is based on: A Enbridge / SBC - CHP Emissions Study: Proposed Multi-Unit Residential Bldg | CHP Option No. 3: Nominal (1 x 125kW) Genset , with
SCHEME No. 3, with Time-Of-Use (TOU) Rates, and -{ with 100% Non-Seasonal Heating [DHW] & 70% Seasonal Space Heating (SSH) Loads }-,
Time-Of-Use (TOU) Rates, and the following 'Base Case' parameters:
MONTHLY TOTAL DIFFERENTIAL GHG EMISSIONS ( Tonnes CO2 ) [ NOTE: Negative values are GHG Reductions ]
#N/A
YEAR TOTAL
Select YEAR of Interest
‐50.00
0.00
50.00
100.00
150.00
200.00
250.00
GHG Emissions ( kG
CO2 )
Hourly GHG Emissions for Selected Year of Interest
Hourly GHG Emissions from REF. BLDG w/o CHP Hourly GHG Emissions from Proposed BLDG with CHP
Hourly NET GHG Emissions from Proposed BLDG with CHP
‐18‐16‐14‐12‐10‐8‐6‐4‐202468
GHG Emissions ( kG
CO2 )
20 YR AVG of Monthly TOTAL Differential GHG Emissions (for a Proposed Bldg with CHP vs Reference Bldg without CHP)
Δ GHG EMISSIONS for Proposed Bldg with CHP vs Reference Bldg without CHP ( for YR of Interest )Δ GHG EMISSIONS for Proposed Bldg with CHP vs Reference Bldg without CHP ( 20YR Average )
Sheet: EMISSIONS

DESCRIPTION:
PROJECT:
GHG REF Bldg (no CHP) 544.98 tCO2Annual Genset
Run Hours% Space Heating
( available for CHP )Annual CHP Heat Dump
(%)GHG Proposed Bldg
(with CHP) ∆ GHG Emissions
(REF. w/o CHP vs Proposed with)
SA-GHG: 3.1-3 SENSITIVITY ANALYSIS: GHG EMISSIONS versus % SEASONAL SPACE HEATING (SSH)
DATE: Enbridge / SBC: Proposed Multi-Unit Residential Bldg | CHP Option No. 3: Nominal (1 x 125kW) Genset November 21, 2019 CHEME No. 3, with Time-Of-Use (TOU) Rates, and -{ with 100% Non-Seasonal Heating [DHW] & 70% Seasonal Space Heating (SSH) Loads }-
-40
-35
-30
-25
-20
-15
-10
-5
0
5
10
0% 10% 20% 30% 40% 50% 60% 70% 80% 90% 100%
∆ G
HG
Em
issi
ons
( tC
O2
)
SEASONAL SPACE HEATING (SSH) available to CHP ( % of Total SSH )
∆ GHG EMISSIONS vs. % SEASONAL SPACE HEATING
% SEASONAL SPACE HEATING - SENSITIVITY
BaseCase
Run Hours ( available for CHP ) (%) (with CHP) ( p )
4,884 100% 17.1% 510.8 tCO2 -34.2 tCO2
4,851 90% 17.4% 513.4 tCO2 -31.5 tCO2
4,817 80% 17.8% 517.0 tCO2 -28.0 tCO2
4,760 Base Case * 70% 18.2% 521.2 tCO2 -23.8 tCO2
4,696 60% 18.9% 526.6 tCO2 -18.4 tCO2
4,601 50% 19.9% 532.7 tCO2 -12.3 tCO2
4,466 40% 21.6% 538.5 tCO2 -6.5 tCO2
4,289 30% 24.3% 543.1 tCO2 -1.9 tCO2
4,112 20% 28.5% 547.9 tCO2 2.9 tCO2
3,851 10% 32.8% 550.4 tCO2 5.4 tCO2
3,545 0% 37.7% 552.3 tCO2 7.3 tCO2
100.0% 20.6% 41.5 tCO2 -41.5 tCO2
** The analysis is based on: Enbridge / SBC: Proposed Multi-Unit Residential Bldg | CHP Option No. 3: Nominal (1 x 125kW) Genset , with
SCHEME No. 3, with Time-Of-Use (TOU) Rates, and -{ with 100% Non-Seasonal Heating [DHW] & 70% Seasonal Space Heating (SSH) Loads }-, Time-Of-Use (TOU) Rates, and the following 'Base Case' parameters:
1. Capital Cost: $625,000 $ CDN2. Hydro Rate: (Energy Component) varies per Time-Of-Use (see OEB TOU Schedule). Inflation applied in later years.3. Hydro Demand Charge: (Equivalent) Year 1: 9.8 $ per kW (equivalent). Inflation applied in later years.
4. Natural Gas Rate: Year 1: 0.25 $ per cu.m. (average). Inflation applied in later years.
5. Hydro Inflation: HIGH (see Electrical Rate Forecast)
6. Natural Gas Inflation: FAST INCREASE (see Gas Rate Forecast)
7. Efficiency of Displaced Boilers: 90%8. Cogen Operating Scheme No.: 39. Minimum Electricity Import: 5 kW10 Maximum Hourly Heat Dump: 100%11. Maximum Daily Heat Dump: 100%12. Minimum Genset Part-Load: 40% Note: Genset shuts down below 40% Part-Load13. Genset Maintenance: Year 1: 3.3 $ per operating hr. Inflation applied in later years.14. Thermal Storage Capacity: 1,400 US Gallons15. Percentage of NSSH available for CHP: 70%
* NPV (Net Present Value) is calculated using a Discount Rate of NOTE: Results based on a CCR (Capital Cost Reduction) of $0
MAXIMUM SENSITIVITY
-40
-35
-30
-25
-20
-15
-10
-5
0
5
10
0% 10% 20% 30% 40% 50% 60% 70% 80% 90% 100%
∆ G
HG
Em
issi
ons
( tC
O2
)
SEASONAL SPACE HEATING (SSH) available to CHP ( % of Total SSH )
∆ GHG EMISSIONS vs. % SEASONAL SPACE HEATING
% SEASONAL SPACE HEATING - SENSITIVITY
BaseCase
-40
-35
-30
-25
-20
-15
-10
-5
0
5
10
0% 10% 20% 30% 40% 50% 60% 70% 80% 90% 100%
∆ G
HG
Em
issi
ons
( tC
O2
)
SEASONAL SPACE HEATING (SSH) available to CHP ( % of Total SSH )
∆ GHG EMISSIONS vs. % SEASONAL SPACE HEATING
% SEASONAL SPACE HEATING - SENSITIVITY
BaseCase
Sheet: GHG Sensitivity

0 1. RPP 0.0 Date:
1 2. TOU 0.0
4. SPOT 0.0
Enter: 1, 2 or 3 3
93
9T
OT
AL
EN
GIN
E S
TA
RT
S
Natural Gas
Meter 2 Meter 3
Electrical
Meter 1Seasonal Heating
DHW Other TOTAL
BUILDING LOAD PROFILES
OPTION No. 3 ( 1 Genset ),
SCHEME No. 3
COGEN OUTPUTS for Selected Operating Scheme
Aggreg
ate
Aggreg
ate
Heat Utilization
Max. Daily Dump:
Base Load Cogen (Elec/Thermal Load Following)
1
Base Load Cogen (Elec/Thermal Load Following)
2
OFF when TH_Storage FULL & 100% Max. Daily Dump reduce El. output to maintain Max. Hourly Dump of 100%
Thermal OutputElectrical Output
SELECTED Cogen Scenario
CHP Emissions Study for Enbridge / SBC
Simulation of OPERATING SCHEMES for
YEAR 1 (2020) - CHP Plant at a Proposed Multi-Unit Residential Bldg
Full Load Cogen (Export Excess Power)
Utilization Factor
Total Heat Recovery
Elec. for Internal Use
Electrical Output Thermal OutputElectrical OutputThermal Output Time-Of-Use (TOU) Rates
4,7
60
4,7
60
TO
TA
L E
NG
INE
RU
N H
OU
RS
Max. Hourly Dump:
November 21, 2019
Heat Dump
Excess Heat Dump when Thermal Storage Tanks Full
BU
ILD
ING
EL
ECTR
ICIT
Y C
ON
SUM
ED
BU
ILD
ING
NA
TUR
AL
GA
S C
ON
SUM
ED
ELEC
TRIC
ITY
&
NA
TUR
AL
GA
S C
ON
SUM
ED
Economic CHP
Dispatch when
cents/kWhr > MCG
cents/kWhr > MCG
cents/kWhr > MCG
TOTAL
Equiv. Thermal Including Facility Expansion Factor
32
8,3
00
CH
P
GH
G E
mis
sio
ns:
fr
om
CH
P
PLA
NT
O
pera
tion
BL
DG
GH
G E
mis
sio
ns:
w
ith
CH
P
PLA
NT
52
1,2
00
-23
,77
9N
ET
G
HG
with
C
HP
min
us v
alue
s =
GH
G R
educ
tions
Electricity Exported
24
5,5
82
29
9,3
96
54
4,9
79
ANNUAL TOTALS (above) COGEN SYSTEM OUTPUTS for Various Operating Schemes
reduce El. output to maintain Max. Hourly Dump of 100%
3
Base Load Cogen (Elec/Thermal Load Following)
Aggreg
ate
Thermal OutputElectrical Output
TO
TA
L P
LAN
T R
UN
HO
UR
S
Select Cogen Operating Scheme
Seasonal Heating
DHW Other
GHG ( REF BLDG ) kG CO2
Address Min. Import: 5.0 kW 100.0% Min. Import: 5.0 kW 100.0%
Include in Aggregate 1 0 0 1 1 0 1 1 0
No. Suites 118 0 0 1 1 0 1 1 0
Date / Time kG CO2 kG CO2 kG CO2 kWhr kWhr % mmBtu/hr % % kWhr % mmBtu/hr % % kWhr % mmBtu/hr % % kWhr kWhr % mmBtu/hr % %
TO
TA
L E
NG
INE
ST
AR
TS
Electricity ExportedAggr
egat
e
Aggreg
ate
Heat Utilization
Max. Daily Dump:
Internal UseUtilization
kWh / hr cu.m.
Utilization Factor
Total Heat Recovery
Elec. for Internal Use Utilization
Total Heat Recovery
Internal UseHeat
UtilizationHeat
UtilizationHeat
DumpTotal Heat Recovery
Heat Utilization
Heat Dump
TO
TA
L E
NG
INE
RU
N H
OU
RS
Max. Hourly Dump:
Total Heat Recovery
Heat Dump
BU
ILD
ING
EL
ECTR
ICIT
Y C
ON
SUM
ED
BU
ILD
ING
NA
TUR
AL
GA
S C
ON
SUM
ED
ELEC
TRIC
ITY
&
NA
TUR
AL
GA
S C
ON
SUM
ED
Heat Dump
CH
P
GH
G E
mis
sio
ns:
fr
om
CH
P
PLA
NT
O
pera
tion
BL
DG
GH
G E
mis
sio
ns:
w
ith
CH
P
PLA
NT
NE
T
GH
G
w
ith
CH
P
m
inus
val
ues
= G
HG
Red
uctio
ns
Electricity Exported
Aggreg
ate
mmBTU
Internal Use
Thermal OutputElectrical Output
Utilization TO
TA
L P
LAN
T R
UN
HO
UR
S
Starts
JANUARY 73,042 0 0 73,042 16,195 4,253 0 20,448 525 138 0 663 18.55 53.57 72.12 55,366 8,878 69.1% 417 68.0% 1.1% 53,297 57.3% 346 69.1% 0.0% 53,297 57.3% 346 69.1% 0.0% 51,755 0 57.3% 345.8 100.0% 0.0% 514 514 35 34.67 61.12 -11.00
FEBRUARY 65,530 0 0 65,530 12,670 3,854 0 16,524 411 125 0 536 19.88 43.04 62.91 48,901 7,861 67.6% 368 66.2% 1.4% 47,091 56.1% 306 67.4% 0.1% 47,091 56.1% 306 67.4% 0.1% 45,729 0 56.1% 305.5 99.8% 0.2% 454 454 34 30.63 52.32 -10.59
MARCH 71,580 0 0 71,580 10,051 4,260 0 14,311 326 138 0 464 20.50 36.68 57.18 49,727 8,342 62.4% 377 55.4% 7.0% 47,869 51.5% 311 60.7% 1.8% 47,869 51.5% 311 60.7% 1.8% 46,476 0 51.5% 310.6 97.1% 2.9% 465 465 61 31.14 50.23 -6.95
APRIL 68,218 0 0 68,218 5,219 4,099 0 9,318 169 133 0 302 13.67 23.07 36.74 42,309 8,041 55.9% 327 40.3% 15.7% 40,634 45.1% 264 48.1% 7.9% 40,634 45.1% 264 48.1% 7.9% 39,425 0 45.1% 263.6 85.3% 14.7% 403 403 85 26.43 37.89 1.15
MAY 76,379 0 0 76,379 1,623 4,274 0 5,897 53 139 0 191 18.14 13.49 31.63 37,553 5,553 46.4% 280 26.7% 19.6% 36,247 39.0% 235 32.3% 14.1% 36,247 39.0% 235 32.3% 14.1% 35,212 0 39.0% 235.2 67.9% 32.1% 345 345 110 23.58 34.64 3.01
JUNE 85,240 0 0 85,240 411 4,120 0 4,531 13 134 0 147 19.94 9.74 29.68 37,618 2,994 45.1% 263 23.2% 21.9% 36,852 40.9% 239 26.2% 18.9% 36,852 40.9% 239 26.2% 18.9% 35,877 0 40.9% 239.1 56.7% 43.3% 325 325 104 23.97 35.18 5.50
JULY 100,561 0 0 100,561 83 4,253 0 4,336 3 138 0 141 27.70 9.07 36.77 39,809 1,160 44.1% 266 22.1% 22.0% 39,372 42.3% 255 23.4% 20.7% 39,372 42.3% 255 23.4% 20.7% 38,389 0 42.3% 255.4 52.2% 47.8% 328 328 113 25.61 41.58 4.81
AUGUST 94,412 0 0 94,412 55 4,260 0 4,315 2 138 0 140 27.21 9.00 36.21 39,011 1,127 43.2% 260 22.0% 21.2% 38,576 41.5% 250 23.2% 20.0% 38,576 41.5% 250 23.2% 20.0% 37,613 0 41.5% 250.3 52.9% 47.1% 321 321 119 25.10 40.25 4.05
SEPTEMBER 75,248 0 0 75,248 561 4,148 0 4,709 18 134 0 153 23.71 10.18 33.89 34,114 3,649 42.0% 245 23.6% 18.4% 33,105 36.8% 215 27.3% 13.9% 33,105 36.8% 215 27.3% 14.6% 32,199 0 36.8% 214.8 63.6% 36.4% 302 302 120 21.54 34.57 0.68
OCTOBER 69,107 0 0 69,107 3,563 4,239 0 7,802 115 137 0 253 17.94 18.67 36.61 38,899 8,126 50.6% 305 34.3% 16.2% 37,237 40.0% 242 42.7% 7.9% 37,237 40.0% 242 42.7% 7.9% 36,108 0 40.0% 241.6 84.1% 15.9% 376 376 108 24.22 36.10 -0.51
NOVEMBER 67,678 0 0 67,678 8,369 4,148 0 12,517 271 134 0 406 18.05 31.69 49.73 46,032 8,831 61.0% 356 52.7% 8.3% 44,235 49.1% 287 58.8% 2.1% 44,235 49.1% 287 58.8% 2.1% 42,918 0 49.1% 287.0 96.5% 3.5% 439 439 59 28.78 44.73 -5.01
DECEMBER 71,304 0 0 71,304 11,734 4,253 0 15,987 380 138 0 518 20.30 41.22 61.52 52,094 8,943 65.6% 396 62.0% 3.6% 50,141 53.9% 325 65.5% 0.1% 50,141 53.9% 325 65.5% 0.1% 48,677 0 53.9% 325.3 99.8% 0.2% 488 488 40 32.62 52.59 -8.93
YEAR 2020 918,298 0 0 918,298 70,534 50,162 0 120,696 2,287 1,626 0 3,913 245.58 299.40 544.98 521,433 73,504 54.4% 3,860 41.4% 13.0% 504,656 46.1% 3,274 45.4% 9.0% 504,656 46.1% 3,274 45.4% 9.0% 490,378 0 46.1% 3,274.2 81.8% 18.2% 4,760 4,760 987 328.30 521.20 -23.78
FIG. Tot.-EL 3.1 - 3
DATE:JUL. 2019
DESCRIPTION:
MO
NT
HL
Y
TO
TA
LS
PROJECT SCENAR
Run HoursTonnes CO2 Tonnes CO2
MONTHLY TOTALS: Aggregate Electricity Consumption vs. Electrical Output of selected and various other Cogen System Operating Schemes
CHP Plant in a Proposed Multi-Unit Residential Bldg | CHP Option No. 3: Nominal (1 x 125kW) Genset | Base Load Cogen (Elec/Thermal Load Following) [ reduce El. output to maintain Max. Hourly Dump of 100% ]
70
75
80
100,000
110,000
Aggregate Electrical Load Profile (for buildings shown as included) COGEN SCHEME 1: Electricity Used Internally COGEN SCHEME 1: Electricity Exported
COGEN SCHEME 2: Electricity Used Internally COGEN SCHEME 3: Electricity Used Internally Selected COGEN SCHEME
Hourly GHG Emissions from BLDG with CHP Hourly GHG Emissions from BLDG w/o CHP Hourly Differential GHG Emissions [ BLDG with CHP vs without ]
-20
-15
-10
-5
0
5
10
15
20
25
30
35
40
45
50
55
60
65
70
-20,000
-10,000
0
10,000
20,000
30,000
40,000
50,000
60,000
70,000
80,000
90,000
JANUARY FEBRUARY MARCH APRIL MAY JUNE JULY AUGUST SEPTEMBER OCTOBER NOVEMBER DECEMBER
GH
G E
mis
sio
ns
(
Ton
ne
s C
O2
)
EL
EC
TR
ICIT
Y
(kW
hr)
CONFIDENTIAL: Property of POWER GENySYS Load Profiles 2 of 2

Date:
Enter: 1, 2 or 3 3
Due to Due to TOTAL
Max. Heat Dump:Total Heat Recovery
Heat Utilization
Heat Dump
Select Cogen Operating Scheme
up to Max. Heat Dump of 100%
Base Load Cogen (Electrical Load Following)
Thermal Output
COGEN OUTPUTS for Selected Operating Scheme3
Electrical Output
Base Load Cogen (Electrical Load Following)up to Max. Heat Dump of 100%
COGEN SYSTEM OUTPUTS for Various Operating Schemes
Time-Of-Use (TOU) Rates
Total Heat Recovery
Elec. for Internal UseB
UIL
DIN
G
ELEC
TRIC
ITY
CO
NSU
MED
Electrical Output Thermal Output
Meter 2
Natural Gas
Heating DHW TOTAL
Equiv. Thermal Including Facility Expansion
F t
Aggre
gate Avail. to
CHP
YEAR 1 (2020) - CHP Plant at a Proposed Multi-Unit Residential Bldg
2
SELECTED Cogen
Scenario
BUILDING LOAD PROFILES
BU
ILD
ING
N
ATU
RA
L G
AS
CO
NSU
MED
ELEC
TRIC
ITY
&
NA
TUR
AL
GA
S
Heating DHW TOTAL
Base Load Cogen (Electrical Load Following)
245,
582
299,
396
544,
979
ANNUAL TOTALS (above)
OPTION No. 3 ( 1 Genset ),
SCHEME No. 3
Avail. to CHP
Electrical
Meter 1
GHG Emissions
4,76
0
4,76
0
TO
TA
L P
LAN
T
RU
N H
OU
RS
TO
TA
L E
NG
INE
R
UN
HO
UR
S
Heat Dump
Thermal Output
Full Load CogenExport Excess Power & Dump Excess Heat
Electrical Output
Heat Utilization
Electricity Exported
Utilization Factor
with a min. of 5 kW always imported & dump excess heat
Electrical Output
1
Thermal Output
CHP Emissions Study for Enbridge / SBC
November 21, 2019 Simulation of OPERATING SCHEMES for
Building Address Min. Import: 5.0 kW Min. Import: 5.0 kW 100.0%
Include in Aggreg 1 0 1 1 1 1
No. Suites 118 1 1 1 1
Date / Time kG CO2 kG CO2 kG CO2 kWhr kWhr % mmBtu/hr % % kWhr % mmBtu/hr % % kWhr % mmBtu/hr % % kWhr kWhr % mmBtu/hr % %
Electricity Exported
UtilizationTotal Heat Recovery
Heat Utilization
Heat Dump
Max. Heat Dump:Total Heat Recovery
Heat Utilization
Heat Dump UtilizationInternal Use
Total Heat Recovery
Heat Utilization
Utilization
Total Heat Recovery
Elec. for Internal UseB
UIL
DIN
G
ELEC
TRIC
ITY
CO
NSU
MED
Internal Use
Electrical Output Thermal Output
Internal Use
Aggre
gate Avail. to
CHP
kWh / hr cu.m.
BU
ILD
ING
N
ATU
RA
L G
AS
CO
NSU
MED
ELEC
TRIC
ITY
&
NA
TUR
AL
GA
S
Heat Dump
mmBTU
Avail. to CHP
Heat Dump
Heat Utilization
Electricity Exported
Utilization Factor
JANUARY 73,042 0 73,042 16,195 4,253 20,448 525.0 138 662.9 19 54 72 55,366 8,878 69.1% 417 68.0% 1.1% 53,297 57.3% 346 69.1% 0.0% 53,297 57.3% 346 69.1% 0.0% 51,755 0 57.3% 345.8 100.0% 0.0% 199.7 6,159
FEBRUARY 65,530 0 65,530 12,670 3,854 16,524 410.8 125 535.7 20 43 63 48,901 7,861 67.6% 368 66.2% 1.4% 47,091 56.1% 306 67.4% 0.1% 47,091 56.1% 306 67.4% 0.1% 45,729 0 56.1% 305.5 99.8% 0.2% 134.1 4,136
MARCH 71,580 0 71,580 10,051 4,260 14,311 325.8 138 464.0 20 37 57 49,727 8,342 62.4% 377 55.4% 7.0% 47,869 51.5% 311 60.7% 1.8% 47,869 51.5% 311 60.7% 1.8% 46,476 0 51.5% 310.6 97.1% 2.9% 102.4 3,159
APRIL 68,218 0 68,218 5,219 4,099 9,318 169.2 133 302.1 14 23 37 42,309 8,041 55.9% 327 40.3% 15.7% 40,634 45.1% 264 48.1% 7.9% 40,634 45.1% 264 48.1% 7.9% 39,425 0 45.1% 263.6 85.3% 14.7% 53.4 1,647
MAY 76,379 0 76,379 1,623 4,274 5,897 52.6 139 191.2 18 13 32 37,553 5,553 46.4% 280 26.7% 19.6% 36,247 39.0% 235 32.3% 14.1% 36,247 39.0% 235 32.3% 14.1% 35,212 0 39.0% 235.2 67.9% 32.1% 22.5 695
JUNE 85,240 0 85,240 411 4,120 4,531 13.3 134 146.9 20 10 30 37,618 2,994 45.1% 263 23.2% 21.9% 36,852 40.9% 239 26.2% 18.9% 36,852 40.9% 239 26.2% 18.9% 35,877 0 40.9% 239.1 56.7% 43.3% 3.9 119
JULY 100,561 0 100,561 83 4,253 4,336 2.7 138 140.6 28 9 37 39,809 1,160 44.1% 266 22.1% 22.0% 39,372 42.3% 255 23.4% 20.7% 39,372 42.3% 255 23.4% 20.7% 38,389 0 42.3% 255.4 52.2% 47.8% 0.5 14
AUGUST 94,412 0 94,412 55 4,260 4,315 1.8 138 139.9 27 9 36 39,011 1,127 43.2% 260 22.0% 21.2% 38,576 41.5% 250 23.2% 20.0% 38,576 41.5% 250 23.2% 20.0% 37,613 0 41.5% 250.3 52.9% 47.1% 0.4 12
SEPTEMBER 75,248 0 75,248 561 4,148 4,709 18.2 134 152.7 24 10 34 34,114 3,649 42.0% 245 23.6% 18.4% 33,105 36.8% 215 27.3% 13.9% 33,105 36.8% 215 27.3% 14.6% 32,199 0 36.8% 214.8 63.6% 36.4% 7.5 230
OCTOBER 69,107 0 69,107 3,563 4,239 7,802 115.5 137 252.9 18 19 37 38,899 8,126 50.6% 305 34.3% 16.2% 37,237 40.0% 242 42.7% 7.9% 37,237 40.0% 242 42.7% 7.9% 36,108 0 40.0% 241.6 84.1% 15.9% 35.9 1,109
NOVEMBER 67,678 0 67,678 8,369 4,148 12,517 271.3 134 405.8 18 32 50 46,032 8,831 61.0% 356 52.7% 8.3% 44,235 49.1% 287 58.8% 2.1% 44,235 49.1% 287 58.8% 2.1% 42,918 0 49.1% 287.0 96.5% 3.5% 77.5 2,392
DECEMBER 71,304 0 71,304 11,734 4,253 15,987 380.4 138 518.3 20 41 62 52,094 8,943 65.6% 396 62.0% 3.6% 50,141 53.9% 325 65.5% 0.1% 50,141 53.9% 325 65.5% 0.1% 48,677 0 53.9% 325.3 99.8% 0.2% 110.6 3,411
YEAR 2020 918,298 0 918,298 70,534 50,162 120,696 2,287 1,626 3,913 246 299 545 521,433 73,504 54.4% 3,860 41.4% 13.0% 504,656 46.1% 3,274 45.4% 9.0% 504,656 46.1% 3,274 45.4% 9.0% 490,378 0 46.1% 3,274 81.8% 18.2% mmBtu/hr cu.m.
DATE:NOV. 2019 PROJECT S
FIG. Tot.-TH 3.1 -DESCRIPTIO MONTHLY TOTALS: Aggregate Thermal Energy Consumption vs. Heat Recovery of selected and various other Cogen System Operating Schemes
CHP Plant in a Proposed Multi-Unit Residential Bldg | CHP Option No. 3: Nominal (1 x 125kW) Genset | SCHEME No. 3, with Time-Of-Use (TOU) Rates, and -{ with 100% Non-Seasonal Heating [DHW] & 70% Seasonal Space Heating (SSH) Loads }-
MO
NT
HL
Y
TO
TA
LS
Tonnes CO2 Remaining Boiler Gas
800
900
MONTHLY TOTALS
Non-Seasonal DHW Heating Load Seasonal Space Heating (available to CHP) Seasonal Space Heating (not available to CHP)Selected COGEN SCHEME COGEN SCHEME 2: Heat Recovery COGEN SCHEME 3: Heat Recovery
0
100
200
300
400
500
600
700
JANUARY FEBRUARY MARCH APRIL MAY JUNE JULY AUGUST SEPTEMBER OCTOBER NOVEMBER DECEMBER
TH
ER
MA
L E
NE
RG
Y (
mm
Btu
)
CONFIDENTIAL: Property of POWER GENySYS Th-Load Profiles 2 of 2