Combats with VOCs - Strategies and Management in China ...
100
IN DEGREE PROJECT ENVIRONMENTAL ENGINEERING, SECOND CYCLE, 30 CREDITS , STOCKHOLM SWEDEN 2017 Combats with VOCs - Strategies and Management in China and Europe SHIYUE MAO KTH ROYAL INSTITUTE OF TECHNOLOGY SCHOOL OF ARCHITECTURE AND THE BUILT ENVIRONMENT
-
Upload
khangminh22 -
Category
Documents
-
view
3 -
download
0
Transcript of Combats with VOCs - Strategies and Management in China ...
IN DEGREE PROJECT ENVIRONMENTAL ENGINEERING,SECOND CYCLE, 30 CREDITS
, STOCKHOLM SWEDEN 2017
Combats with VOCs - Strategies and Management in China and Europe
SHIYUE MAO
KTH ROYAL INSTITUTE OF TECHNOLOGYSCHOOL OF ARCHITECTURE AND THE BUILT ENVIRONMENT

II
Combats with VOCs - Strategies and
Management in China and Europe
SHIYUE MAO
Degree Poject in Environmental Engineering and Sustainable Infrastructure
KTH Royal Institute of Technology
School of Architecture and Built Environment
Department of Sustainable Development, Environmental Science and Engineering
SE-100 44 Stockholm, Sweden

TRITA-SEED-EX-2017:29
II
Summary in Swedish
Det här arbetet syftar till att ta reda på historien och gången i försöken och bekämpa utsläpp av VOC
i Kina. Eftersom Kina är ett land som förbisedde miljöproblemen i årtionden (t ex VOC-utsläpp) har
Kinas miljöledningssystem inte varit moget och välfungerat mot nuvarande allvarlig
miljöföroreningar över Kina. Därför bör ett kraftigare och mer flexibelt system för kontroll av
VOC-utsläpp från industrin byggas upp, snabbt. I detta försök försöker man också få fram några
rimliga och praktiska förslag till förbättring av miljöledningssystemet med inspiration från
europeiska länder och marknader.
I detta dokument är "management system" och "behandlingsteknik" i Kina båda grenar som
kommer att undersökas noggrant. Skrivbordsundersökningar och intervjuer är viktiga medel för
undersökning. När det gäller viss forskning om ledningssystemet undersöks Kinas nationella politik,
provinspolitik, utsläppsstandarder etc. Dessutom har även pågående behandlingsteknik i Kina av
företag och företag utforskats, med en sammanfattning av VOCs återvinnings- och
behandlingstekniker. Europeiska länder har utforskats som pionjärer och modeller för behandling
av VOC-utsläpp. Genom att lära sig någon teknik som skapats och tillämpas på EU-marknader kan
den kinesiska marknaden också inspireras och introduceras. Slutligen har man också föreslagit en
del rekommendationer om förvaltningspolitik och teknikansökan, som en följd av denna studie om
utsläpp av VOC i både Kina och Europa.

III
Abstract This work aims to figure out the history and footpath of the trials and combats against VOCs
emission in China. As China is a country that overlooked the environmental problems for decades
(e.g. VOCs emissions), China’s environmental management system has not been mature and
well-functioned towards current severe environmental pollution over China. Hence, a sounder and
more flexible system for controlling VOCs emission from industry should be built up, urgently. This
paper also attempts to come up with some reasonable and practical suggestions for improvement of
the environmental management system with inspiration from European countries and markets.
In this paper, “management system” and “treatment technology” in China are both options that will
be explored thoroughly. Desktop research and interviewing are the major means of investigation. As
to some research on management system, China’s national policies, provincial policies, emission
standards, etc. are investigated; in addition, on-going treatment technology in China by enterprises
and companies are also explored, with a summary of VOCs recovery and treatment techniques.
European countries are explored as pioneers and models for treatment of VOCs emission. By
learning some technology created and applied in EU markets, Chinese market can also be inspired
and introduced. After that, some analysis on China’s VOCs management system coming from
several aspects, i.e. governance dilemma, technology application, economic initiative and public
participation, is made. Finally, some recommendation for management policies and technology
application have been proposed as well, as a result of this study on VOCs emission for China’s
authorities.
Key words: VOCs policy, VOCs management, VOCs treatment technology, indoor and outdoor
air quality, China, Europe,
IV
Acknowledgements This paper is for the Master degree of joint programme in Environmental Management by Technical
University of Denmark (DTU) and Royal Institute of Technology in Sweden (KTH) with duration of
two years. This topic was provided and sponsored by the Swedish Environmental Research Institute
(IVL) China Office, as a study for VOCs management situation in China and Europe, as well as some
forecasts on Chinese management trends in the near future.
In this paper, I would honestly thank my supervisors: Juanjuan Yao at IVL and Kim Pilegaard at
DTU, for their selfless assistance and help during my whole work; and I also would like thank my
ex-colleagues: Lu Fu, Huihui Cheng and Weihao Zhang at Clean Air Asia (CAA), for their favorable
support on my material and data collection about China’s VOCs management and technology.
Finally, I have to thank my family, with their long-time and forever devotion on my study and living
in my past 25 years, truly indeed.
I believe that this work may mark an end of my two-year study and living in Denmark and Sweden.
During the past couple years, I have felt and experienced a totally different society from my ever did,
and I have tried to learn to be alike an ordinary peer in both Nordic countries. I truly cherish the
past experience living in a warm community with everyone I met. I studied Danish but poor, I also
love Fika provided after each meeting and seminar. Everything that I experienced will be my
treasure, and the load of my life. OK let’s hold on and calm down, I don’t want to spoil such formal
phenomenon with my tedious expression in English. By ending this work, my career begins.

V
Content
Summary in Swedish ......................................................................................................... II
Abstract ...............................................................................................................................III
Acknowledgement ............................................................................................................. IV
Acronym and Terminology ............................................................................................... IX
List of Tables and Figures ................................................................................................ XI
Research Scope and Delimitation .................................................................................. XIII
1. Introduction ..................................................................................................................... 1 1.1 DEFINITION OF VOCS .................................................................................................................................. 1
1.2 SOURCES OF VOCS EMISSION ..................................................................................................................... 1
1.2.1 Biogenic ............................................................................................................................................. 1
1.2.2 Anthropogenic .................................................................................................................................... 2
1.3 POTENTIAL THREAT OF VOCS ...................................................................................................................... 4
1.3.1 Indoor ................................................................................................................................................. 4
1.3.2 Outdoor .............................................................................................................................................. 7
1.4 CURRENT SITUATION OF VOCS EMISSION ..................................................................................................... 7
1.4.1 Biogenic (by simulation) ..................................................................................................................... 7
1.4.2 Anthropogenic .................................................................................................................................... 9
1.4.2.1 China .......................................................................................................................................... 9
1.4.2.2 EU ............................................................................................................................................. 11
1.4.2.2.1 Overview ........................................................................................................................... 11
1.4.2.2.2 Sweden ............................................................................................................................. 12
1.4.2.2.3 Germany ............................................................................................................................ 13
1.4.2.2.4 France ............................................................................................................................... 14
2. Policies & Regulations for VOCs Monitoring and Management ................................16 2.1 CHINA ....................................................................................................................................................... 16
2.1.1 VOC Policy-making & Publication Process ...................................................................................... 16
2.1.2 National Management ...................................................................................................................... 17
2.1.2.1 National Policy .......................................................................................................................... 17
VI
2.1.2.2 Legislations ............................................................................................................................... 19
2.1.2.3 Emission Standards .................................................................................................................. 19
2.1.2.4 Monitoring Analysis Standards .................................................................................................. 20
2.1.3 Provincial Management .................................................................................................................... 21
2.1.3.1 Provincial Policy ........................................................................................................................ 21
2.1.3.2 Provincial/municipality Standards ............................................................................................. 23
2.2 EU ............................................................................................................................................................ 24
2.2.1 VOCs Management from EU-level ................................................................................................... 24
2.2.2 Sweden ............................................................................................................................................. 25
2.2.2.1 Overview ................................................................................................................................... 25
2.2.2.2 Policies on VOCs Emission Control in Sweden ........................................................................ 28
2.2.2.2.1 VOCs from Construction Products as Guided by EU-LCI ................................................. 28
2.2.2.2.2 VOCs Standards in Paints and Varnishes and Vehicle Paint Maintenance ...................... 29
2.2.2.2.3 Vapour Recovery ............................................................................................................... 30
2.2.3 Germany ........................................................................................................................................... 30
2.2.3.1 Responsible Authorities ............................................................................................................. 30
2.2.3.2 Emission Standard and Evaluation Scheme ............................................................................. 31
2.2.4 France............................................................................................................................................... 32
2.2.4.1 Overview ................................................................................................................................... 32
2.2.4.2 CMR Testing .............................................................................................................................. 33
2.2.4.3 VOCs Emission Classification ................................................................................................... 33
3. Technology for VOCs Monitoring and Control ........................................................... 35 3.1 CHINA ........................................................................................................................................................ 35
3.1.1 Overview ........................................................................................................................................... 35
3.1.2 Source Control .................................................................................................................................. 36
3.1.2.1 Remediation of Dynamic and Static Sealing Point of Device ................................................... 36
3.1.2.2 Storage and Recovery of Volatile Organic Liquid ..................................................................... 37
3.1.2.2.1 Overview ............................................................................................................................ 37
3.1.2.2.2 Storage Building ................................................................................................................ 37
3.1.2.2.3 Facilities & Paintings .......................................................................................................... 39
3.1.2.2.3 Management of Materials and Fuels ................................................................................. 41

VII
3.1.2.2.4 Control and Treatment of Collection, Storage and Processing of Wastewater ................. 43
3.1.2.2.5 Control on VOCs Emission from Stationary Combustion Sources ................................... 45
3.1.2.2.6 Control on Organized Industrial Emission ......................................................................... 46
3.1.2.2.7 Control on Fugitive Emission ............................................................................................ 47
3.1.2.2.8 Abnormal Operation Emission ........................................................................................... 47
3.1.2.2.9 Flare System ..................................................................................................................... 48
3.1.3 Process Control................................................................................................................................ 48
3.1.3.1 Leakage Detection and Repair (LDAR) .................................................................................... 48
3.1.3.1.1 Overview ........................................................................................................................... 48
3.1.3.1.2 Leak Test ........................................................................................................................... 50
3.1.3.1.3 Maintenance ...................................................................................................................... 51
3.1.3.1.4 Recordkeeping .................................................................................................................. 51
3.1.4 End-of-Pipe Control ......................................................................................................................... 52
3.1.4.1 Overview ................................................................................................................................... 52
3.1.4.2 VOCs Disposal ......................................................................................................................... 54
3.1.4.2.1 Thermal Destruction .......................................................................................................... 54
3.1.4.2.2 Plasma .............................................................................................................................. 54
3.1.4.2.3 Photo-catalysis with UV Irradiation ................................................................................... 55
3.1.4.3 VOCs Recovery with Biological Treatment ............................................................................... 55
3.2 EU ............................................................................................................................................................ 58
3.2.1 Overview .......................................................................................................................................... 58
3.2.2 VOCs Detection and Measurement Technology .............................................................................. 58
3.2.2.1 Differential Absorption LIDAR (DIAL) ....................................................................................... 59
3.2.2.2 Solar Occultation Flux (SOF) .................................................................................................... 59
3.2.2.3 Transient Current Technique (TCT) .......................................................................................... 60
3.2.3 VOCs Recovery Technology ............................................................................................................ 60
3.2.3.1 Granular Activated Carbon Adsorption ..................................................................................... 61
3.2.3.2 Condensation ............................................................................................................................ 61
4. Analysis of China’s VOCs Management System ........................................................63 4.1 OVERVIEW ................................................................................................................................................. 63
4.2 GOVERNMENT’S DILEMMA ON VOCS MANAGEMENT IN CHINA ...................................................................... 63

VIII
4.2.1 “Organizer and Judge” Dilemma ...................................................................................................... 63
4.2.2 “Rat and Vase” Dilemma .................................................................................................................. 64
4.2.3 “Wealth and Health” Dilemma .......................................................................................................... 64
4.3 TECHNOLOGY APPLICATION ......................................................................................................................... 65
4.4 ECONOMIC INITIATIVE.................................................................................................................................. 66
4.5 PUBLIC PARTICIPATION ................................................................................................................................ 67
5. Recommendation of VOCs Management for China .................................................... 69 5.1 MANAGEMENT STRATEGY ........................................................................................................................... 69
5.2 TECHNOLOGY APPLICATION ......................................................................................................................... 70
6. Conclusion ..................................................................................................................... 71
References ......................................................................................................................... 72
Appendix I. Limit on Volatile Organic Compounds (VOC) in Paints and
Varnishes ........................................................................................................................... 81
Appendix II. Volatile Organic Compounds (VOC) Limits on Vehicle Repair
Paint Products ................................................................................................................... 82
IX
Acronyms and Terminology ANSES French Agency for Food, Environmental and Occupational Health & Safety
BEIS Biogenic Emission Inventory System
CESM Community Earth System Model
CLM Community Land Model
CNS Central Nervous System
DIBt German Institute for Structural Engineering
DNA Deoxyribonucleic Acid
EEA European Environmental Agency
EPA Environmental Protection Agency (United States)
EPB Environmental Protection Bureau
EU European Union
GIS Global Information System
HCSP High Council for Public Health
IAQG Indoor Air Quality Guidelines
KISF The Code of Statute of the Swedish Chemicals Agency
LCI Lowest Concentration of Interest
LDAR Leak Detection and Repair
MBO 2-Methyl-3-buten-2-ol
MEGAN Model of Emission of Gases and Aerosols from Nature
MEP Ministry of Environmental Protection (China)
MHE Ministry of Health and Ecology (France)
MOF Ministry of Finance of (China)
NMHC Non-methane Hydrocarbon

X
NMVOCs Non-methane Volatile Organic Compounds
NO Nitric Oxide
PAH Polycyclic Aromatic Hydrocarbons
PCBs Polychlorinated Biphenyls
PM Particulate Matter
PRC People’s Republic of China
RCC Regenerative Catalytic Combustion Method
RCO Regenerative Catalytic Oxidation
REACH Registration, Evaluation, Authorisation and Restriction
RTO Regenerative Thermal Oxidation
RVP Reid Vapour Pressure
SBR Sequencing Batch Reactor
SCA Swedish Chemicals Agency
SFS Swedish Environmental Code
SMOKE Sparse Matrix Operational Kernel Emissions
SOU Swedish Government Official Reports
SVOCs Semi-volatile Organic Compounds
TVOC Total Volatile Organic Compounds
T & C Transformation & Concentration Method
U.S. United States of America
UV Ultra-Violet
VOCs Volatile Organic Compounds
WHO World Health Organization
WWFC Worldwide Fuel Charter
WWTPs Wastewater Treatment Plants
XI
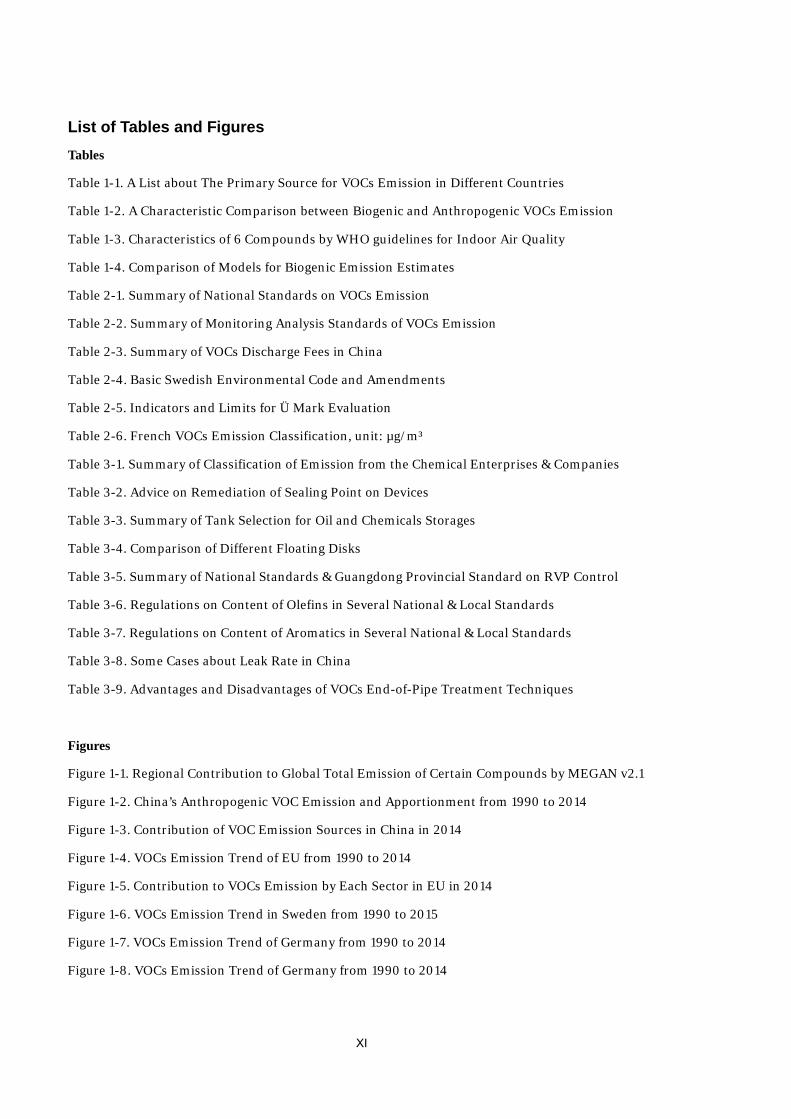
List of Tables and Figures Tables
Table 1-1. A List about The Primary Source for VOCs Emission in Different Countries
Table 1-2. A Characteristic Comparison between Biogenic and Anthropogenic VOCs Emission
Table 1-3. Characteristics of 6 Compounds by WHO guidelines for Indoor Air Quality
Table 1-4. Comparison of Models for Biogenic Emission Estimates
Table 2-1. Summary of National Standards on VOCs Emission
Table 2-2. Summary of Monitoring Analysis Standards of VOCs Emission
Table 2-3. Summary of VOCs Discharge Fees in China
Table 2-4. Basic Swedish Environmental Code and Amendments
Table 2-5. Indicators and Limits for Ü Mark Evaluation
Table 2-6. French VOCs Emission Classification, unit: µg/m³
Table 3-1. Summary of Classification of Emission from the Chemical Enterprises & Companies
Table 3-2. Advice on Remediation of Sealing Point on Devices
Table 3-3. Summary of Tank Selection for Oil and Chemicals Storages
Table 3-4. Comparison of Different Floating Disks
Table 3-5. Summary of National Standards & Guangdong Provincial Standard on RVP Control
Table 3-6. Regulations on Content of Olefins in Several National & Local Standards
Table 3-7. Regulations on Content of Aromatics in Several National & Local Standards
Table 3-8. Some Cases about Leak Rate in China
Table 3-9. Advantages and Disadvantages of VOCs End-of-Pipe Treatment Techniques
Figures
Figure 1-1. Regional Contribution to Global Total Emission of Certain Compounds by MEGAN v2.1
Figure 1-2. China’s Anthropogenic VOC Emission and Apportionment from 1990 to 2014
Figure 1-3. Contribution of VOC Emission Sources in China in 2014
Figure 1-4. VOCs Emission Trend of EU from 1990 to 2014
Figure 1-5. Contribution to VOCs Emission by Each Sector in EU in 2014
Figure 1-6. VOCs Emission Trend in Sweden from 1990 to 2015
Figure 1-7. VOCs Emission Trend of Germany from 1990 to 2014
Figure 1-8. VOCs Emission Trend of Germany from 1990 to 2014

XII
Figure 2-1. Diagram of VOC Policy-making & Publication Process
Figure 2-2. Timeline for Release of VOCs-related Policies
Figure 2-3. Counting for VOCs-related Provisions by Air Pollution Prevention and Control Action
Scheme in Several Provinces and Municipalities in China
Figure 2-4. Number of Local Standards for Each Province (part)/Municipality
Figure 2-5. Swedish New Law Enacting Procedure
Figure 2-6. Procedure of IAQG Publication in France
Figure 2-7. Label of French VOCs Emission Classification
Figure 3-1. Diagram of Roof Tanks, (a) Fixed; (b) external; (c) internal
Figure 3-2. Seal Accessories. (a) sealing lid; (b) gas-collecting hood; (c) flange
Figure 3-3. Flow Chart of VOCs Emission Control during Collection and Transportation of
Wastewater
Figure 3-4. LDAR Components Suggested by US EPA (a) and China MEP (b)
Figure 3-5. Mechanism of Ultrasonic Detection
Figure 3-6. Thermal Oxidizer (a) and Catalytic Oxidizer (b)
Figure 3-7. Decomposition of VOCs by TiO2-Based Photo-catalyst with UV Irradiation
Figure 3-8. Schematics of A Bio-filter Unit
Figure 3-9. Schematics of A Bio-trickling Filter Unit
Figure 3-10. Schematics of A Bio-scrubber Unit
Figure 3-11. Schematics of A Membrane Bioreactor Containing Microporous Hydrophobic
Membrane, A Biofilm and Suspended Cells
Figure 3-12. Principle of DIAL System
Figure 3-13. Diagram of SOF Technique: (a) overview of SOF; (b) Layout of SOF
Figure 3-14. A Typical Layout of Condensation
Figure 3-15. A Hybrid Layout of Condensation
Figure 4-1. Taxation on Supply-Demand Relationship

XIII
Research Scope and Delimitation This study has provided an overview on China’s current VOCs management system and technology
application, with inspiration from European countries’ action during past decades. However, this
study does not involve a respective from microscope level in China, in other words, only general
principles and situation have been discussed. It should therefore be aware that some individual
cases would be omitted in this study. Case study on some individual enterprises and factories should
also be carried out by other studies in the future.
This study also skips some technical details that would be critical in practical operations. In Chapter
3, some current-running facilities and applied technologies are mentioned theoretically, but it may
also be modified to meet the realistic production in each plant, which does not be considered in this
study as well. The parameters and variables in operations for calculation and calibration does not be
mentioned.

1
1. Introduction 1.1 Definition of VOCs
Volatile Organic Compounds, more well-known as VOCs, are a group of chemical compounds especially
“with carbon element, but excluding carbon monoxide, carbon dioxide, carbonic acid, metallic carbides or
carbonates and ammonium carbonate, which participates in atmospheric photochemical reactions”, according
to EPA of United States (EPA 2017a). VOCs have been commonly recognized with severe adverse effects on
human beings’ daily life (EPA 2017b; Yu & Crump 1998). Therefore the studies about VOCs emission
characteristics and modelling, as well as its management and control in different countries & regions have
also been carried out dating back to 1980s, when attention had been paid on determination of emission pattern
and characteristics of VOCs from WWTPs and building materials/products (Shen et al. 1988; Namkung &
Rittmann 1987; Wallace et al. 1987). Due to relatively high vapour pressure (typically with boiling points
between 50℃ - 260℃ (Holcomb & Seabrook 1995)) of characteristics of volatile organic compounds, VOCs
are easier than other non-organic substances to emit into atmosphere, where VOCs also have been identified
as a source for photochemical smog in metropolitan cities in U.S. (EPA 2017a). So far, hundreds of VOCs
have been recognized by previous studies, along with typical concentration degree in environment (Brown et
al. 1994; Holcomb & Seabrook 1995; Yu & Crump 1998; Bellis 1998). Commonly used organic chemicals
include propane, butane, formaldehyde, ethanol and PCBs, etc., which are usually applied for household
products, e.g. paints, wood preservatives, aerosol sprays, cleaners and detergents, etc. Besides, building
materials and office equipment are also main contributors for VOCs application in industry (Bellis 1998; EPA
2017b; WHO 1997). As most people spend their great majority of time in a day indoors (Brown et al. 1994;
Holcomb & Seabrook 1995), the health effects from indoor VOCs are therefore more serious than what of
outdoors.
1.2 Sources of VOCs Emission
1.2.1 Biogenic
From the global perspective, it has been found that biogenic emission is dominant in total VOCs emissions in
terms of volume and capability. In general, biogenic sources for VOCs emission include: marine and fresh
water, soil and sediment, microbial decomposition of organism, geological deformation and reservoir
emission, flora foliage, etc. (Guenther et al. 1995) Volcanic eruption may also contributes certain type of VOC,
such as benzene. Among all of these sources, forest ecosystem has been recognized as the main contributor
due to greater volume of VOCs evaporated from soil and decomposed organism rotted by bacteria per year, as
2
well as some directly from leaves of trees/vegetation into atmosphere (Harley et al. 1998). According to an
estimation on global budget of atmospheric VOCs in 2007 (Goldstein & Galbally 2007), biogenic sources of
VOCs emission (i.e. terrestrial and ocean ecosystem and other trivial biomass burning, etc.) contributed
around 1150 Tg C/yr1 for the total emission when methane is disregarded, several folds more than that of
anthropogenic sources (which contributed 142 Tg C/yr). The reason for exclusion of methane in the statistics
is that methane is always more linked to climate change in terms of its long lifetime in atmosphere and the
reactive role it plays in global warming, while not directly to the problems caused by VOCs, i.e.
photochemical smog, etc.
Nowadays, there have been hundreds of compounds in several families identified as the most effective species
in VOCs emission. For example, isoprene and the monoterpene family together account for 65% of total
NMVOCs emission, along with “other reactive VOCs” and “other less reactive VOCs” which take the rest 35%
of the total value (Dyer 2007). Among all, isoprene is one of the most explored compounds by previous
studies. Isoprene is a kind of compound secreted by plants and evaporated into air as VOC, its physiological
function, however, has not been finally determined yet (Sharkey et al. 2008; Sharkey & Singsaas 1995; Logan
& Monson 1999). The monoterpene family is another group of compounds with great importance for certain
plants/vegetation, the function of monoterpenes include: resistance against herbivores and pathogens,
attraction of pollinators and allelopathy effects on competing species (Dyer 2007).
1.2.2 Anthropogenic
Despite little portion the anthropogenic emission is, when compared to biogenic (natural) emission which has
been introduced above, in terms of quantity. Anthropogenic sources are still the most we are focusing on,
especially in cities and other facilities where humans will spend most time in/with. Anthropogenic sources
include, e.g. traffic-related activities (Baudic et al. 2016), fossil fuel burning (Guo et al. 2004), solvent
emission, public facilities (WWTPs, landfills) (Namkung & Rittmann 1987; Shen et al. 1988), building
materials and consumer products (Wallace et al. 1987), etc. Traffic emission has also been regarded as the
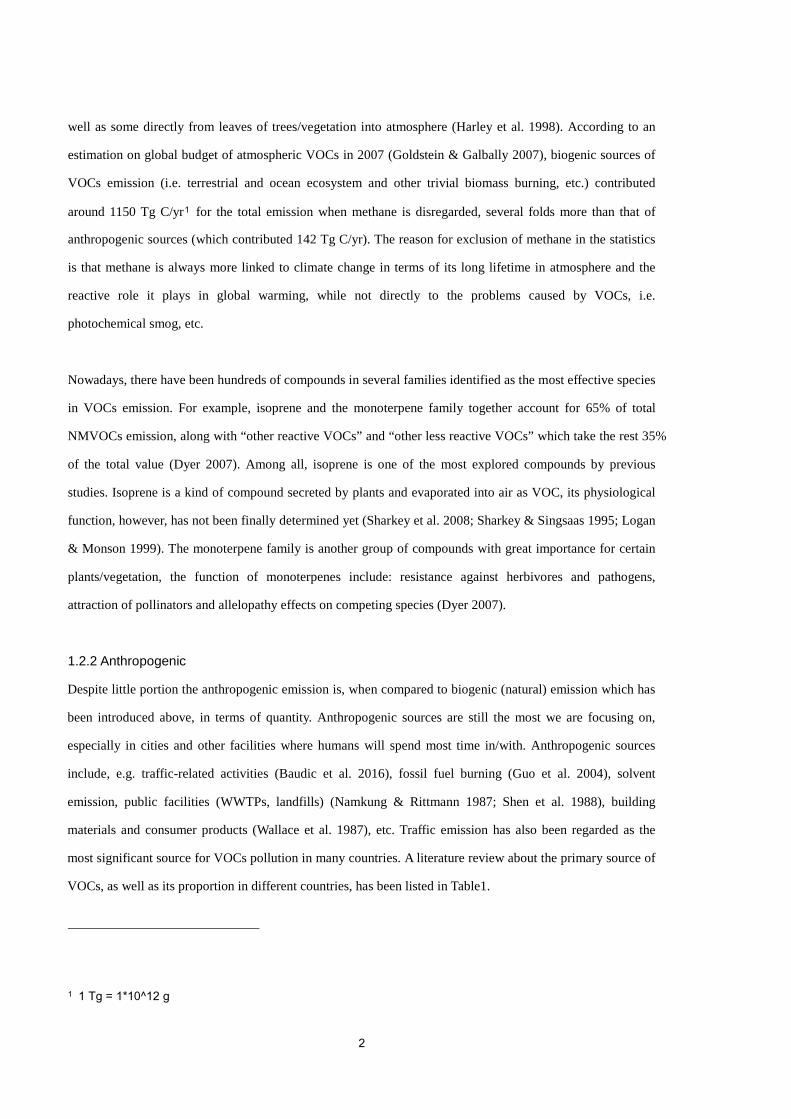
most significant source for VOCs pollution in many countries. A literature review about the primary source of
VOCs, as well as its proportion in different countries, has been listed in Table1.
1 1 Tg = 1*10^12 g
3
Table 1-1. A List about The Primary Source for VOCs Emission in Different Countries
Country Date Primary Source Proportion Ref.
Iran 2013 Vehicle emission 61% (Sarkhosh et al. 2013)
China 2004 Vehicle emission & biofuel
burning
71%∓5% (Guo et al. 2004)
2013 Vehicle emission 31% - 45% (Wang et al. 2013)
2011 Industrial source 69% (Huang et al. 2011)
2008 Industrial and domestic solvent
use
28.6% (Wei et al. 2008)
2016 Vehicle emission 23.1% (Liu et al. 2016)
2014 Vehicle emission 29% - 50% (An et al. 2014)
France 2016 Traffic-related activities 25% (Baudic et al. 2016)
Turkey 2014 Refinery and petroleum
products
56% (Dumanoglu et al. 2014)
Czech Republic 2010 Vehicle source ~30% (Zemankova & Brechler
2010)
U.S. 2013 Vehicle emission \ (Borbon et al. 2013)
According to the data presented in the Table 1-1, it normally can be found that vehicle/mobile emission
dominated among all sources of anthropogenic (NM)VOCs. However, previous studies also showed that
real-time anthropogenic VOCs emission would be affected by temperature and season, etc., as biofuel-burning
may peak in winter due to running of heating system in northern China (Baudic et al. 2016; Wang et al. 2013).
Also, in certain region where industry and manufacture thrived, traffic emission was inferior to local
industrial emission (Dumanoglu et al. 2014).
There is great discrepancy between anthropogenic and biogenic VOCs in terms of composition of chemicals.
As mentioned above, traffic emission is dominant amongst anthropogenic VOCs sources, thereby the main
components in gasoline, e.g. aromatics, alkanes play an important role in anthropogenic VOCs emission as
well (Chin & Batterman 2012). However, chemicals secreted from plant/vegetation, e.g. isoprene,
monoterpenes, etc. are instead functioning in biogenic VOCs emissions.

4
Table 1-2. A Characteristic Comparison between Biogenic and Anthropogenic VOCs Emission
Biogenic Anthropogenic
Composition Isoprene, monoterpenes… Aromatics, alkanes…
Quantity ~1150 Tg C/yr ~142 Tg C/yr
Proportion ~70% ~30%
Source
Forest evaporation, microbial
decomposition, leaves decay, volcano…
Traffic emission, fossil fuels burning,
building material emission, solvent
violation…
Scope Outdoor Indoor & outdoor
1.3 Potential Threat of VOCs
1.3.1 Indoor
VOCs exist in indoor environment ubiquitously by building materials (Uhde & Salthammer 2007),
furnishings (Zhang, J. S.; Shaw 1997) and furniture (Brown 1999), etc. VOCs are likely to emit from
materials and furniture to indoor environment continuously and last for a long time indoor before being
inhaled or decomposed. Hundreds of chemicals have already been identified in different tests (Salthammer
1997; Yu & Crump 1998), and most of which are harmful and sensitive to ordinary people’s respiratory
system. Besides, studies also have showed that indoor VOCs will greatly influence human beings’ health
status; together with ozone, another pollutant poses threats to exposure of human beings, VOCs might cause
“Sick Building Syndrome” symptoms (Baek & Jenkins 2004). Children have also been regarded to be
sensitive and susceptible by such pollution, according to some studies carried out before (Farrow et al. 2003;
Diez et al. 2000; Mendell 2007).
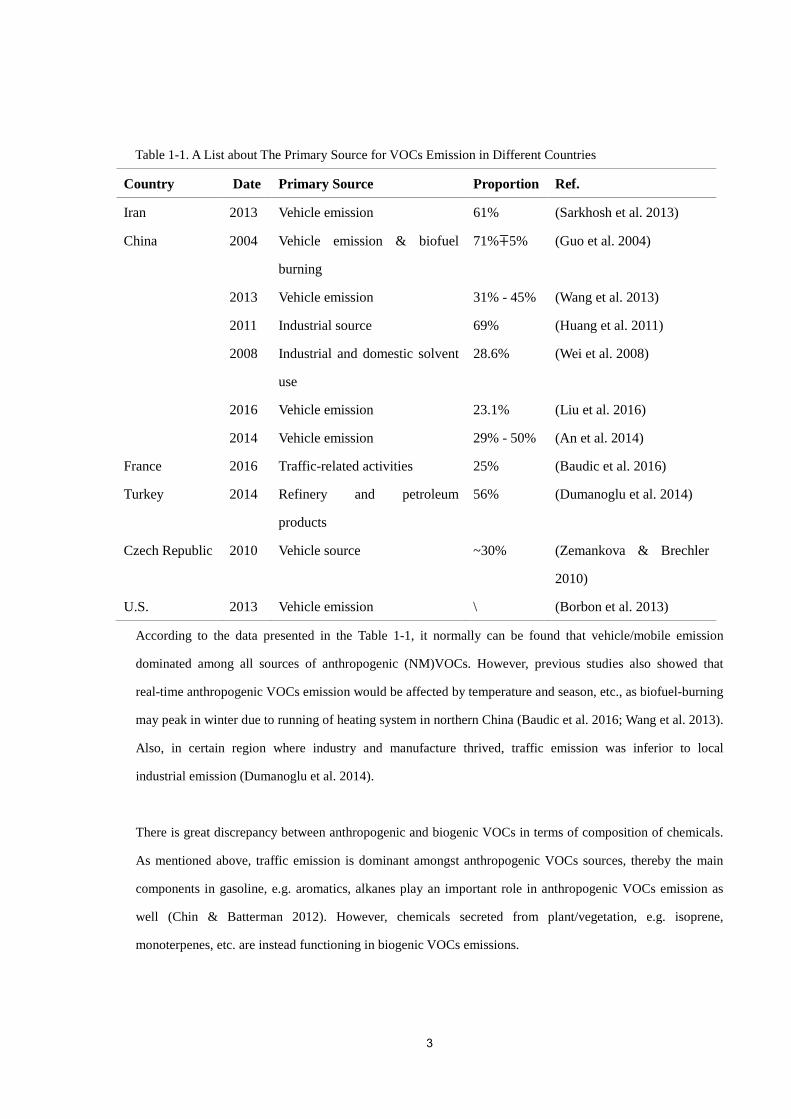
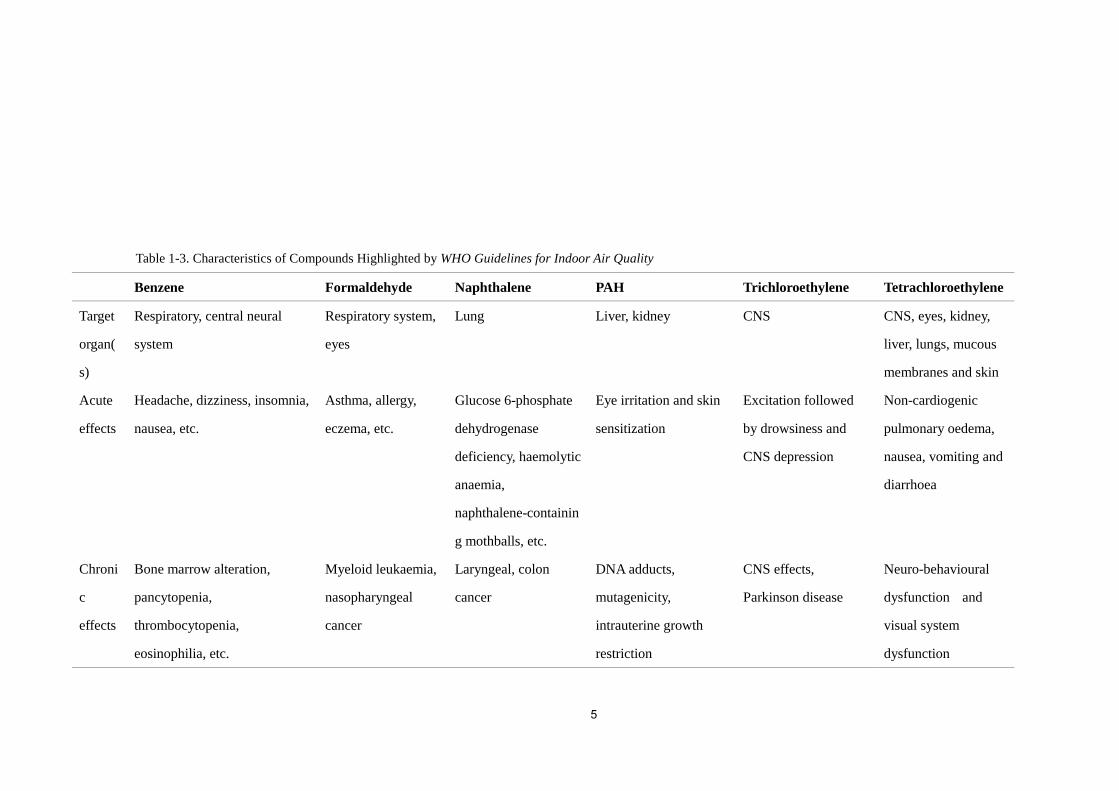
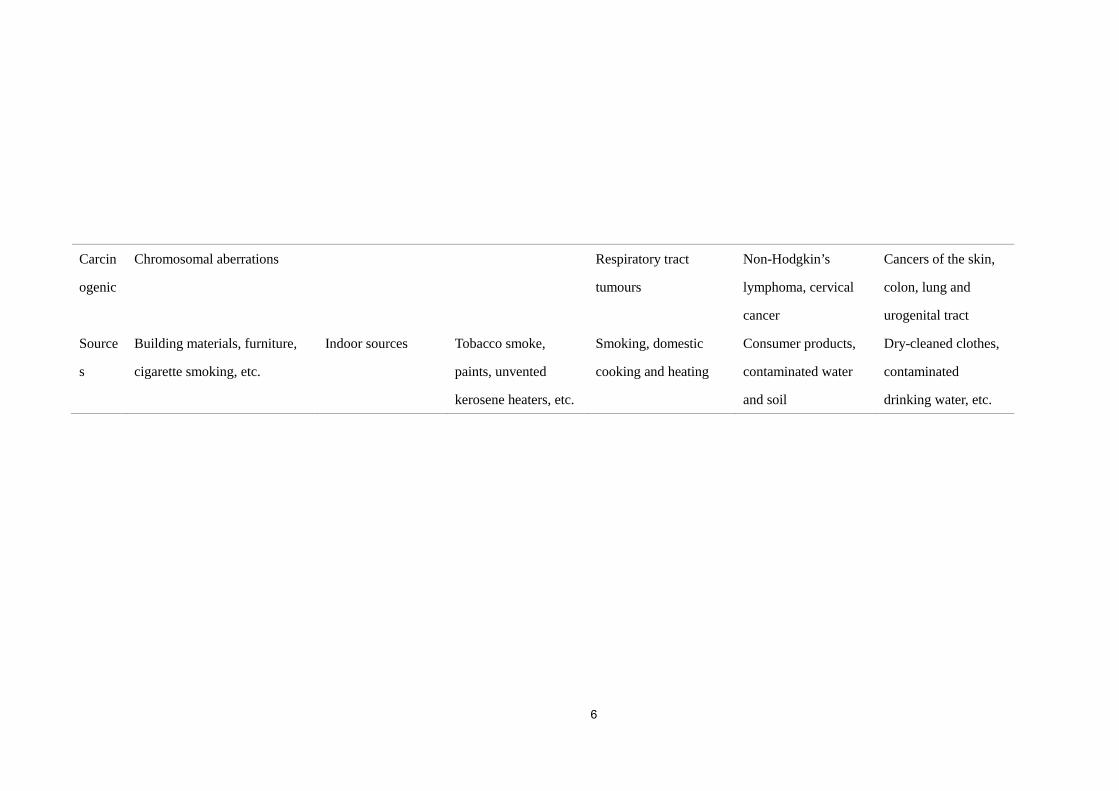
WHO guidelines on indoor air quality (Penney et al. 2010) explicitly presented 9 most common indoor
pollutants with corresponding health effects, in which 6 out of 9 were VOCs, including benzene,
formaldehyde, naphthalene, polycyclic aromatic hydrocarbons (PAH), trichloroethylene and
tetrachloroethylene. The health effects by each have been listed in Table3. It should be particularly
emphasized here that 6 volatile compounds have been highlighted above in the Table3, though, the number of
organic compounds would probably be over 100 in room circumstances.
5
Table 1-3. Characteristics of Compounds Highlighted by WHO Guidelines for Indoor Air Quality
Benzene Formaldehyde Naphthalene PAH Trichloroethylene Tetrachloroethylene
Target
organ(
s)
Respiratory, central neural
system
Respiratory system,
eyes
Lung Liver, kidney CNS CNS, eyes, kidney,
liver, lungs, mucous
membranes and skin
Acute
effects
Headache, dizziness, insomnia,
nausea, etc.
Asthma, allergy,
eczema, etc.
Glucose 6-phosphate
dehydrogenase
deficiency, haemolytic
anaemia,
naphthalene-containin
g mothballs, etc.
Eye irritation and skin
sensitization
Excitation followed
by drowsiness and
CNS depression
Non-cardiogenic
pulmonary oedema,
nausea, vomiting and
diarrhoea
Chroni
c
effects
Bone marrow alteration,
pancytopenia,
thrombocytopenia,
eosinophilia, etc.
Myeloid leukaemia,
nasopharyngeal
cancer
Laryngeal, colon
cancer
DNA adducts,
mutagenicity,
intrauterine growth
restriction
CNS effects,
Parkinson disease
Neuro-behavioural
dysfunction and
visual system
dysfunction
6
Carcin
ogenic
Chromosomal aberrations Respiratory tract
tumours
Non-Hodgkin’s
lymphoma, cervical
cancer
Cancers of the skin,
colon, lung and
urogenital tract
Source
s
Building materials, furniture,
cigarette smoking, etc.
Indoor sources Tobacco smoke,
paints, unvented
kerosene heaters, etc.
Smoking, domestic
cooking and heating
Consumer products,
contaminated water
and soil
Dry-cleaned clothes,
contaminated
drinking water, etc.

7
1.3.2 Outdoor
Even though less direct association and impact have been identified on human beings’ health over outdoor
VOCs exposure in past studies, in comparison with indoor impact, these chemicals are more viewed as a
source of smog, which occurs in many places around the globe in recent years. In 1980’s there was already a
study about outdoor distribution of VOCs in U.S., in which the authors recognized 66 chemicals in outdoor
environment to cause potential adverse impact on human beings (Field 1988). A company recently tested the
average VOCs concentration outdoor as about 180 ng/L, well below the critical standard as 500 ng/L, which
was recommended by U.S. Green Building Council a couple of years ago (Delia 2014). However, the
Environmental Protection Department in Hong Kong revealed the relationship between outdoor VOCs and
smog. It is said that VOCs would react with nitrogen dioxides which are emitted from vehicles, industrial
plants, etc., to form ozone. After accumulation of ozone in atmosphere, fine particulates and other pollutants
would be generated (EPD Hong Kong 2017). Canadian government recognized VOCs as a precursor chemical
of smog as well (Environment and Climate Change Canada 2017).
Some studies have been carried out to investigate the VOCs impact on humans, especially on sensitive groups,
e.g. infants and children. A study focused on different VOCs exposure on teenagers and it is found that the
concentration of VOCs was lowest in outdoor scenario, while the long-term impact of outdoor VOCs might
be under-estimated in this case, the authors speculated though (Adgate et al. 2004). In another test conducted
in Spain, it was found that infants living in rural area would be affected most by VOCs, by 21% exceeding the
guideline of WHO (Ferrero et al. 2017).
All in all, there were rare studies investigating particularly the outdoor impact of VOCs on certain groups of
people in the past. As being lower concentration and less important than indoor effect, outdoor studies were
always being overlooked. However, it should not be ignored when outdoor VOCs made indirect efforts by
creating smog in mega cities around the world.
1.4 Current Situation of VOCs Emission
1.4.1 Biogenic (by simulation)
Biogenic emission in nature is inevitable and dominate in terms of total volume, compared to anthropogenic
emission sources (refer to 1.2.1). To date, modelling and simulation are of great significance in accounting of
biogenic VOCs emission. One of the most commonly used is Model of Emission of Gases and Aerosols from

8
Nature (MEGAN) created by Washington State University. MEGAN, with its initial idea promoted in 1995
(Guenther et al. 1995), is able to estimate the “net emission of gases and aerosols from territorial ecosystems
into the atmosphere” with a base resolution of ~1 km, MEGAN can either be used as a stand-alone model for
estimation, or be embedded as component of earth/transport system (Alex Guenther 2017). By inputting
necessary variables, e.g. source density, weather (solar radiation, temperature and moisture), CO2
concentration and source types, the VOCs emission will be finally calculated. Community Land Model (CLM)
is another model specifically for ecological climatology for territory emission. CLM is a land model affiliated
to the main package: Community Earth System Model (CESM), of which the CLM focuses on the territory
ecosystem through the cycling of water, energy and chemicals, etc. By so far CLM has been updated to the
fourth version which includes many novel functions, such as VOCs emission, snow hydrology, vegetation
composition, etc. CLM has now been used in hundreds of papers as main method to develop more algorisms
for calculation and estimation during last decade as well. Biogenic Emission Inventory System (BEIS) was
firstly developed in 1988 to estimate VOCs emission from vegetation and nitric oxide (NO) from soil into
atmosphere. With development of nearly three decades, this model has been becoming more popular in VOCs
emission estimates. However, due to resource limitations recent BEIS versions were restricted within the
Sparse Matrix Operational Kernel Emissions (SMOKE) system, a broader framework consisting of spatial
dataset development and analysis (US EPA n.d.). A table for comparison among three mainstream biogenic
models has been made as follows:
Table 1-4. Comparison of Models for Biogenic Emission Estimates
Model Resolution Compound
types
Advantages Disadvantages
MEGAN v2.1 1km×1km 38 Flexible No generic “other
VOC” category
CLM 0.05°×0.05° 147 High accuracy on
water and energy
flux
Over predictions
on rainfall
precipitation
BEIS 1 km×1km 34 Flexible in output
data formats
Being restricted by
SMOKE system
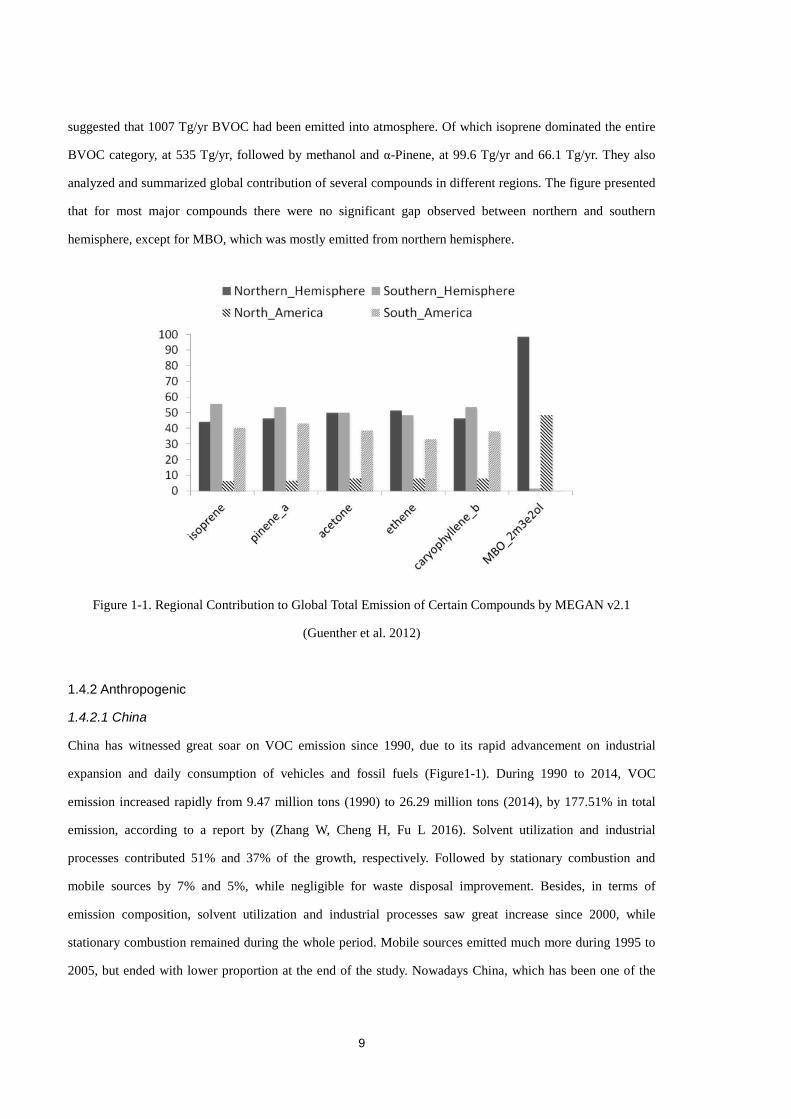
Guenther et al. (2012) calculated the global BVOC emission of the year 2000 with MEGAN v2.1, which
9
suggested that 1007 Tg/yr BVOC had been emitted into atmosphere. Of which isoprene dominated the entire
BVOC category, at 535 Tg/yr, followed by methanol and α-Pinene, at 99.6 Tg/yr and 66.1 Tg/yr. They also
analyzed and summarized global contribution of several compounds in different regions. The figure presented
that for most major compounds there were no significant gap observed between northern and southern
hemisphere, except for MBO, which was mostly emitted from northern hemisphere.
Figure 1-1. Regional Contribution to Global Total Emission of Certain Compounds by MEGAN v2.1
(Guenther et al. 2012)
1.4.2 Anthropogenic
1.4.2.1 China
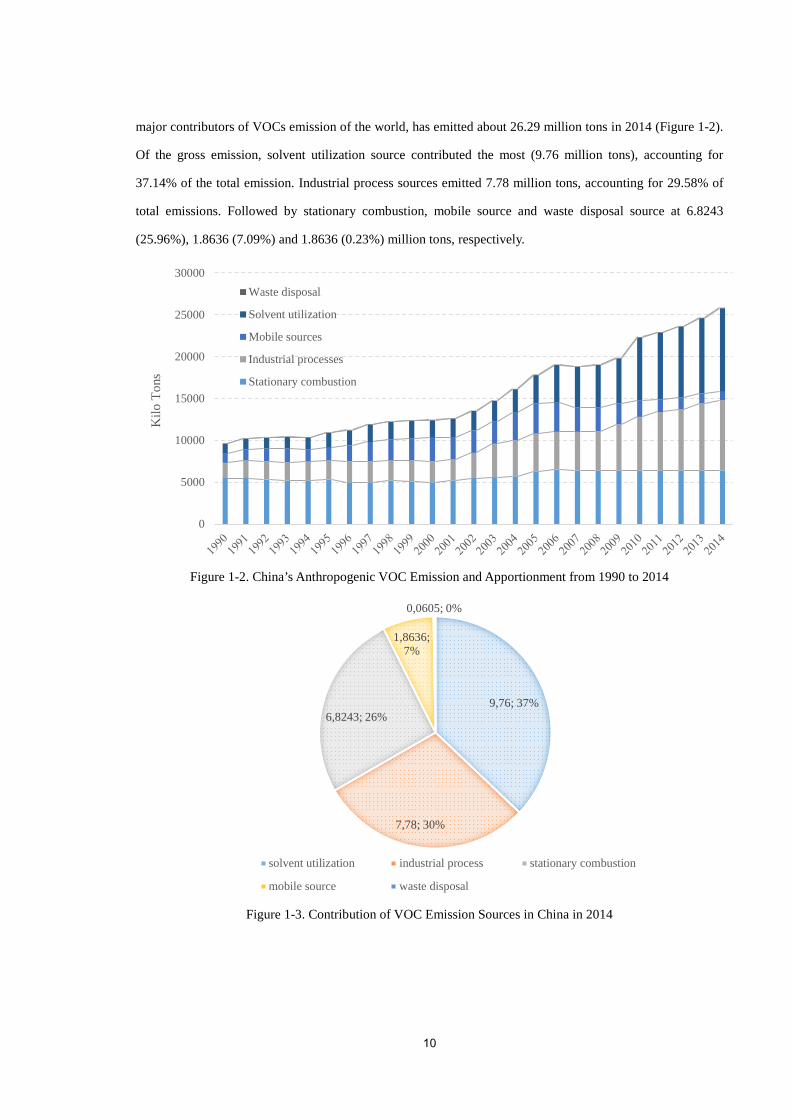
China has witnessed great soar on VOC emission since 1990, due to its rapid advancement on industrial
expansion and daily consumption of vehicles and fossil fuels (Figure1-1). During 1990 to 2014, VOC
emission increased rapidly from 9.47 million tons (1990) to 26.29 million tons (2014), by 177.51% in total
emission, according to a report by (Zhang W, Cheng H, Fu L 2016). Solvent utilization and industrial
processes contributed 51% and 37% of the growth, respectively. Followed by stationary combustion and
mobile sources by 7% and 5%, while negligible for waste disposal improvement. Besides, in terms of
emission composition, solvent utilization and industrial processes saw great increase since 2000, while
stationary combustion remained during the whole period. Mobile sources emitted much more during 1995 to
2005, but ended with lower proportion at the end of the study. Nowadays China, which has been one of the
10
major contributors of VOCs emission of the world, has emitted about 26.29 million tons in 2014 (Figure 1-2).
Of the gross emission, solvent utilization source contributed the most (9.76 million tons), accounting for
37.14% of the total emission. Industrial process sources emitted 7.78 million tons, accounting for 29.58% of
total emissions. Followed by stationary combustion, mobile source and waste disposal source at 6.8243
(25.96%), 1.8636 (7.09%) and 1.8636 (0.23%) million tons, respectively.
Figure 1-2. China’s Anthropogenic VOC Emission and Apportionment from 1990 to 2014
Figure 1-3. Contribution of VOC Emission Sources in China in 2014
0
5000
10000
15000
20000
25000
30000
Kilo
Ton
s
Waste disposal
Solvent utilization
Mobile sources
Industrial processes
Stationary combustion
9,76; 37%
7,78; 30%
6,8243; 26%
1,8636; 7%
0,0605; 0%
solvent utilization industrial process stationary combustion
mobile source waste disposal
11
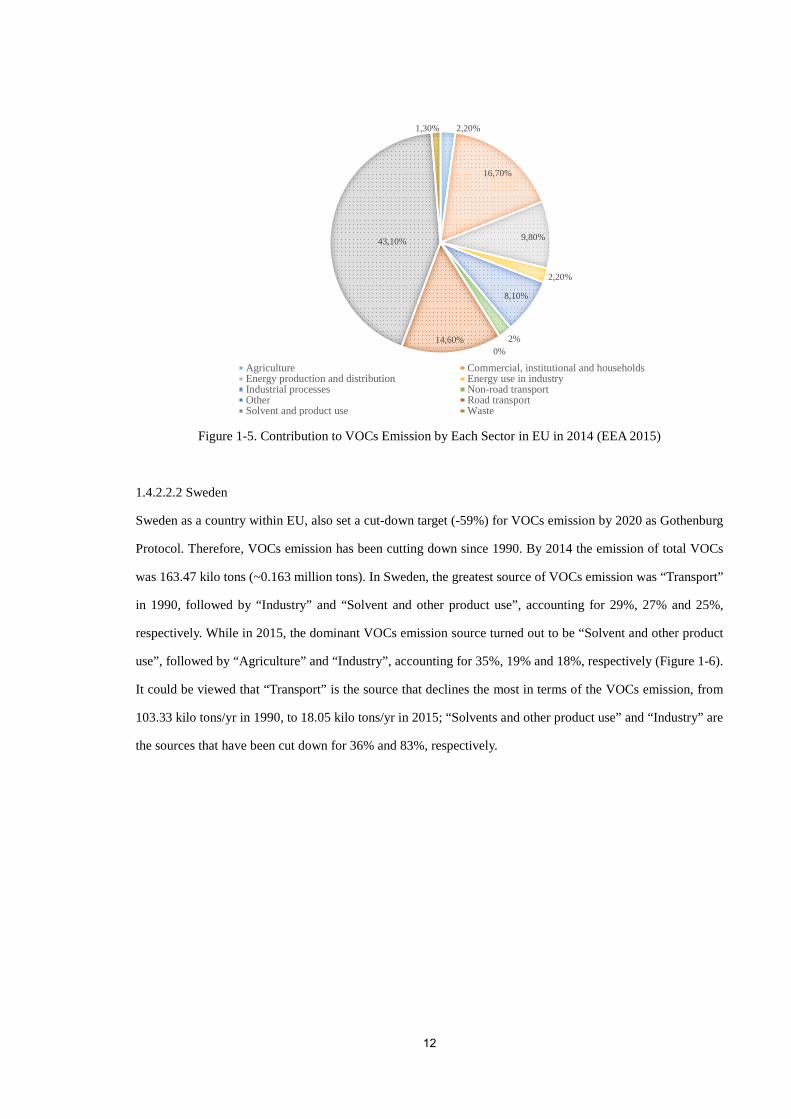
1.4.2.2 EU2
1.4.2.2.1 Overview
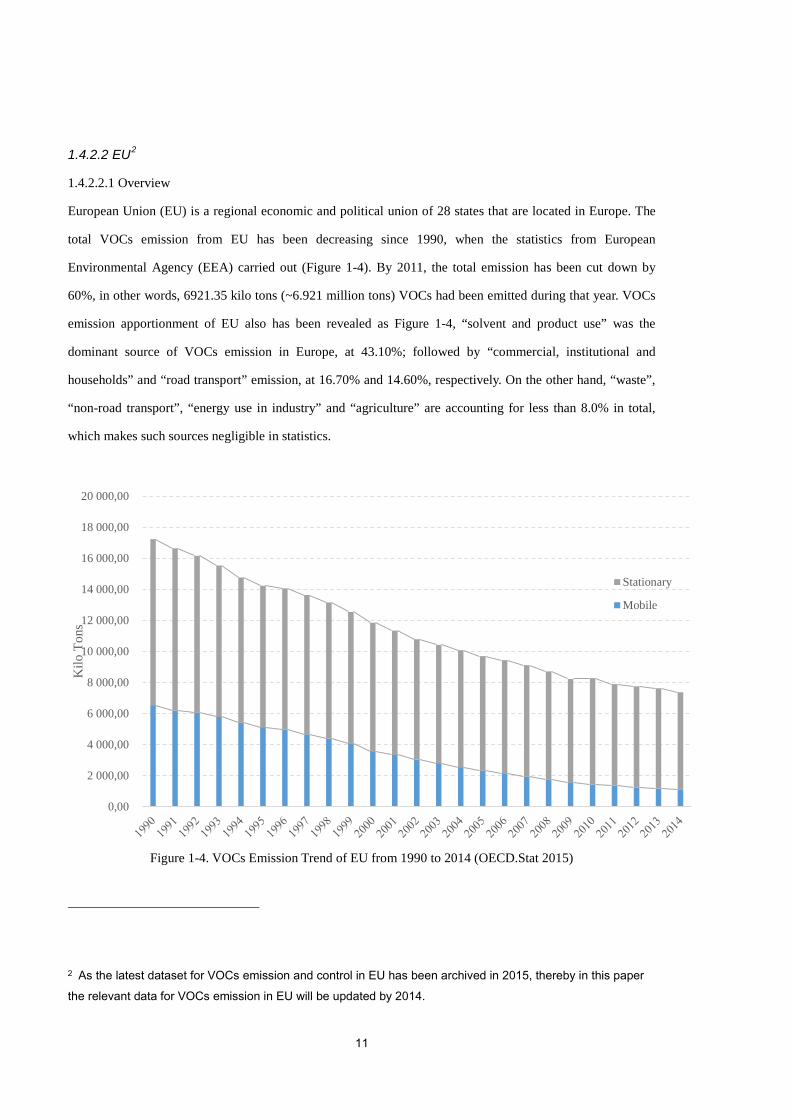
European Union (EU) is a regional economic and political union of 28 states that are located in Europe. The
total VOCs emission from EU has been decreasing since 1990, when the statistics from European
Environmental Agency (EEA) carried out (Figure 1-4). By 2011, the total emission has been cut down by
60%, in other words, 6921.35 kilo tons (~6.921 million tons) VOCs had been emitted during that year. VOCs
emission apportionment of EU also has been revealed as Figure 1-4, “solvent and product use” was the
dominant source of VOCs emission in Europe, at 43.10%; followed by “commercial, institutional and
households” and “road transport” emission, at 16.70% and 14.60%, respectively. On the other hand, “waste”,
“non-road transport”, “energy use in industry” and “agriculture” are accounting for less than 8.0% in total,
which makes such sources negligible in statistics.
Figure 1-4. VOCs Emission Trend of EU from 1990 to 2014 (OECD.Stat 2015)
2 As the latest dataset for VOCs emission and control in EU has been archived in 2015, thereby in this paper the relevant data for VOCs emission in EU will be updated by 2014.
0,00
2 000,00
4 000,00
6 000,00
8 000,00
10 000,00
12 000,00
14 000,00
16 000,00
18 000,00
20 000,00
Kilo
Ton
s
Stationary
Mobile
12
Figure 1-5. Contribution to VOCs Emission by Each Sector in EU in 2014 (EEA 2015)
1.4.2.2.2 Sweden
Sweden as a country within EU, also set a cut-down target (-59%) for VOCs emission by 2020 as Gothenburg
Protocol. Therefore, VOCs emission has been cutting down since 1990. By 2014 the emission of total VOCs
was 163.47 kilo tons (~0.163 million tons). In Sweden, the greatest source of VOCs emission was “Transport”
in 1990, followed by “Industry” and “Solvent and other product use”, accounting for 29%, 27% and 25%,
respectively. While in 2015, the dominant VOCs emission source turned out to be “Solvent and other product
use”, followed by “Agriculture” and “Industry”, accounting for 35%, 19% and 18%, respectively (Figure 1-6).
It could be viewed that “Transport” is the source that declines the most in terms of the VOCs emission, from
103.33 kilo tons/yr in 1990, to 18.05 kilo tons/yr in 2015; “Solvents and other product use” and “Industry” are
the sources that have been cut down for 36% and 83%, respectively.
2,20%
16,70%
9,80%
2,20%
8,10%
2% 0%
14,60%
43,10%
1,30%
Agriculture Commercial, institutional and householdsEnergy production and distribution Energy use in industryIndustrial processes Non-road transportOther Road transportSolvent and product use Waste

13
Figure 1-6. VOCs Emission Trend in Sweden from 1990 to 2015 (Statistics Sweden 2017)
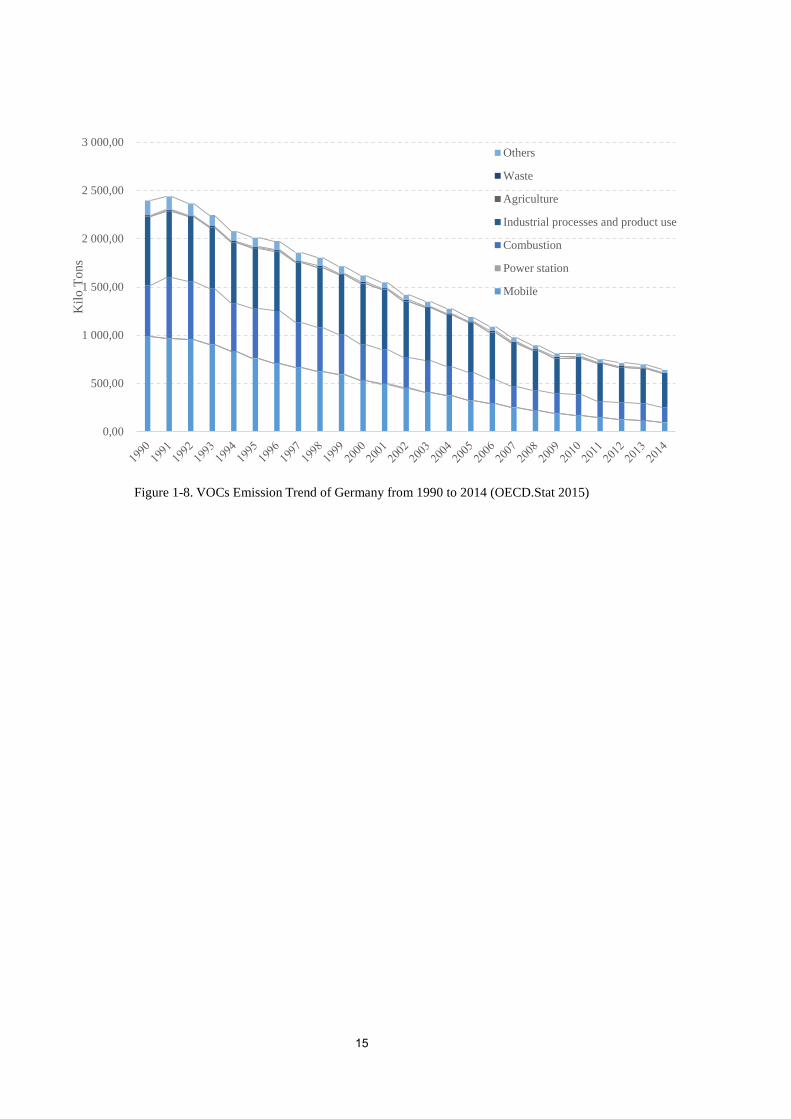
1.4.2.2.3 Germany
Alike with Sweden, Germany has also carried out measurements on control of VOCs emission in last two
decades. The total VOCs emission in Germany decreased from 3388.61 kilo tons (~3.389 million tons) to
1040.95 kilo tons (~1.041 million tons), by 69% total emission reduction during the period. The identified
most dominant source for VOCs emission in 2012 was “energy use and supply transport”, “road transport”
and “industrial processes” are the rest investigated sources for VOCs emission in Germany, accounting for
16%, 12% and 4%, respectively. Alike to the case of Sweden, Germany also has not explicitly published other
VOCs sources in detail, instead the greatest part in the Figure 1-7 has been categorised into “other”. Thereby,
an up-to-date dataset indicating VOCs emission sources is required, as well.
0
50
100
150
200
250
300
350
400
19901991199219931994199519961997199819992000200120022003200420052006200720082009201020112012201320142015
Kilo
Ton
s
Solvents and other product useTransportIndustryAgricultureMachineryHeating of local residenceElectricity and district heatingWaste
14
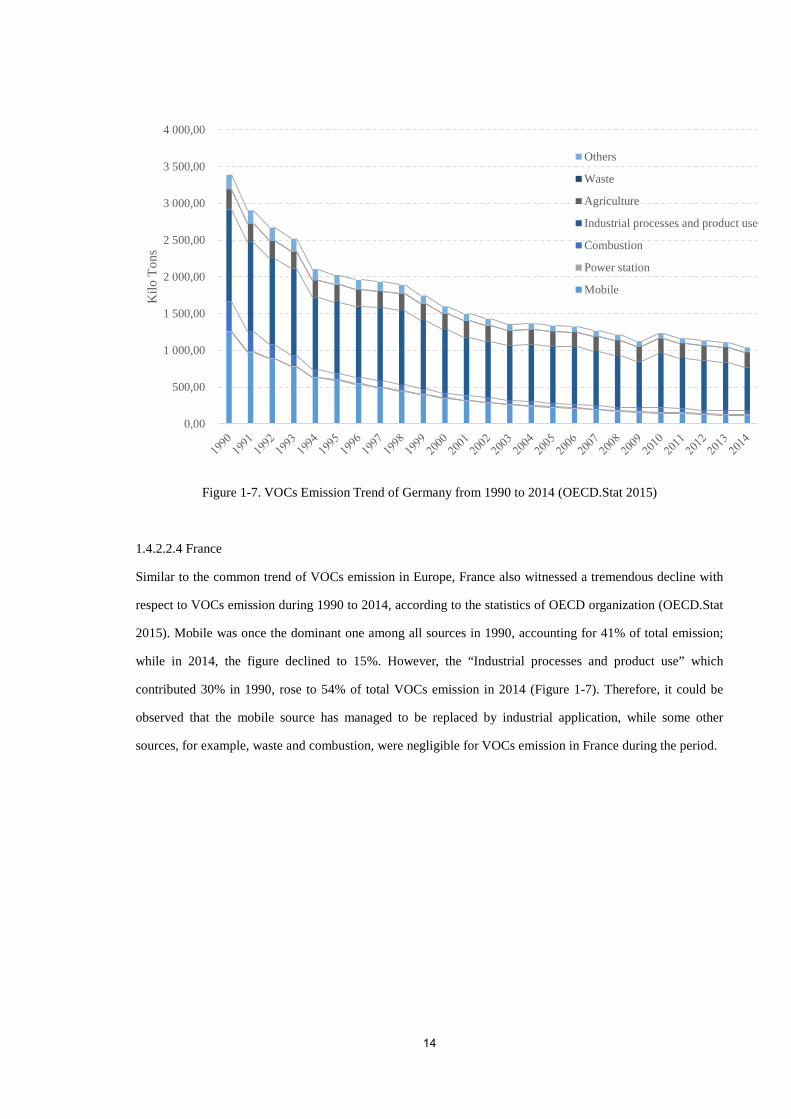
Figure 1-7. VOCs Emission Trend of Germany from 1990 to 2014 (OECD.Stat 2015)
1.4.2.2.4 France
Similar to the common trend of VOCs emission in Europe, France also witnessed a tremendous decline with
respect to VOCs emission during 1990 to 2014, according to the statistics of OECD organization (OECD.Stat
2015). Mobile was once the dominant one among all sources in 1990, accounting for 41% of total emission;
while in 2014, the figure declined to 15%. However, the “Industrial processes and product use” which
contributed 30% in 1990, rose to 54% of total VOCs emission in 2014 (Figure 1-7). Therefore, it could be
observed that the mobile source has managed to be replaced by industrial application, while some other
sources, for example, waste and combustion, were negligible for VOCs emission in France during the period.
0,00
500,00
1 000,00
1 500,00
2 000,00
2 500,00
3 000,00
3 500,00
4 000,00
Kilo
Ton
s Others
Waste
Agriculture
Industrial processes and product use
Combustion
Power station
Mobile
15
Figure 1-8. VOCs Emission Trend of Germany from 1990 to 2014 (OECD.Stat 2015)
0,00
500,00
1 000,00
1 500,00
2 000,00
2 500,00
3 000,00
Kilo
Ton
s
Others
Waste
Agriculture
Industrial processes and product use
Combustion
Power station
Mobile

16
2. Policies & Regulations for VOCs Monitoring and Management 2.1 China
2.1.1 VOC Policy-making & Publication Process
In China, legislations with different levels are able to be published by different authorities through various
processes. As VOC monitoring regulations were drafted and published by Ministry of Environmental
Protection (MEP) of PRC, VOC-related policies and regulations are treated as “Administrative Regulations”,
instead of legislations or laws, which have to been granted and published by the top-level authority: National
People’s Congress. Regarding to VOC policy-making and publication process, a diagram (Figure 2-1)
presents general steps and interaction of VOC regulations published by MEP before finally revealed to public.
First of all, the Department of Science, Technology and Standard in MEP would converse well-known experts
in related fields and set up a drafting committee to be responsible for the whole policy-making & publication
process. Upon setup of the committee, an on-site investigation would be carried out in the next few months
for collection of practical information and data. A few months later, a workshop would be organized and
information would therefore be shared with all drafting groups. Just before the formal drafting process, a
seminar which includes all stakeholders (e.g. central and local governments, entrepreneurs, scholars and
technicians, etc.) would be arranged for fully information interexchange. Then the formal drafting process
starts by engagement of scholars and experts from universities and research institutes in related fields. By
finishing the first draft, two-round revision with discussion would be held before final text to be made. Finally,
formal text would be released to public as new “Administrative Regulation” of MEP with legislative
enforcement.
Apparently, VOCs-related regulations in China are not belonging to formal legislations which should be
reviewed and permitted by the National People’s Congress, instead such regulations were mostly drafted and
discussed within the MEP framework, though a few external stakeholders were also engaged in certain stages.
Due to lacking of transparency in the policy-making & publication process, there would be concerns about
justice and disinterest of the administrative regulations to all companies. In addition, as sluggish and
inefficient the bureaucracy system in China was and will be, there would be little possibility that these VOC
regulations would be updated frequently, therefore it could be estimated that the VOC monitoring and
management regulations could not make fully effect in the future, if few amendments would be made.

17
Figure 2-1. Diagram of VOC Policy-making & Publication Process
2.1.2 National Management
2.1.2.1 National Policy
China’s national policy on VOCs management started by release of a policy Guiding Opinions on Promoting
Joint Prevention & Joint Control Work on Air Pollution and Improving Regional Air Quality, jointly drafted
and published by 9 ministries in May, 2010, and officially suggested criteria of controlling VOCs and
particulate matter (PM) at national scale. Meanwhile, this policy also asked for strengthening VOCs pollution
prevention and precautionary works of several pollutants with list of VOCs and PM as the most severe and
concerned pollutants (MEP 2010; Zhang W, Cheng H, Fu L 2016). About one year later, the National “12th
Five-year Scheme” for Environmental Protection was then issued, which came up with the idea of researching
and developing typical VOCs pollution sources control technology, as well as supporting techniques and
equipment with corresponding proprietary intellectual property rights. This official policy also appealed for
more comprehensive evaluation index system and quantitative assessment means of VOCs pollution control
technology for selection of optimum and most feasible air pollution control technology. In 2012, the National
Ambient Air Quality Standard was issued, which significantly increases the standard of 8-hour concentration
of PM2.5 and O3 by getting down the threshold of detection concentration. This action also promoted the
VOCs pollution control works and treatments. Several months later in that year, the “12th Five-year Scheme”
on Air Pollution Prevention and Control in Key Regions was then issued. In that scheme, VOCs was being
18
regarded as a very important index for evaluation of impact of construction projects to surrounding
environment, hence VOCs monitoring & treatment services were appealed by both customers and government.
In May, 2013, the MEP issued the Policy on VOCs Pollution Prevention and Control, which put forward the
idea that pollution control should be implemented according to the comprehensive control principle with
integrating sources including process control and terminal treatment. The purpose of the policy is to basically
establish VOCs pollution monitoring and control system by 2015, and to reduce VOCs emission in the whole
process thoroughly. 4 months later, in September of 2013, another new scheme Air Pollution Prevention and
Control Action Scheme (State Council (2013), No.37) was issued by the State Council of China. In that
scheme, air pollution prevention and control had been raised up to unprecedentedly concerned position, where
it asked the VOCs pollution should be disposed of, while petrochemical giant enterprises in
Beijing-Tianjin-Hebei Region, Yangtze River Delta, Pearl River Delta and other regions should finish
installation of integrated treatment facilities of waste gases. In September, 2014, the MEP issued a new
technical Guide for Compiling VOCs Emission Sources List (For Trial Implementation), which provides
technical support for compiling VOCs emission list in China. In December, the Comprehensive VOCs Control
Program in Petrochemical Industry was issued, which aims to finish holistic VOCs control works in
petrochemical industry by the end of 2017 by establishing VOCs monitoring and control system; in addition,
the total VOCs discharge in 2017 should be cut down by 30% compared with 2014. The “13th Five-year
Scheme” for National Economic and Social Development of PRC was then issued on 22nd March, 2016. As
guided and regulated by the latest scheme, key regions and key industries should promote the total VOCs
emission control, with the national total VOCs emissions to be cut down by 10% by the end of the period, i.e.
2020. Lately MEP issued Fugitive Emission Standard of Volatile Organic Compounds and Emission Standards
for Air Pollutants from Manufacture of Paint, Ink and Adhesive in April, 2017, where more detailed VOCs
standards were set. In the former standard VOCs emission under open-air circumstances were particularly
regulated, including that under conveyance and storage; while the latter one focuses on three specific
commonly-used chemicals in construction and decoration.
It could be seen that an initial framework for policy & regulation on VOCs emission control has been built up
in China. Since launched in 2010, VOCs treatment was launched firstly in petrochemical industry with Leak
Detection and Repair (LDAR) technology in 2014; VOCs treatment was also applied in printing industry one
year later with the joint application of Transformation & Concentration Method (T&C) and Regenerative
Catalytic Combustion Method (RCC). Other industries are also gradually introducing VOCs emission control
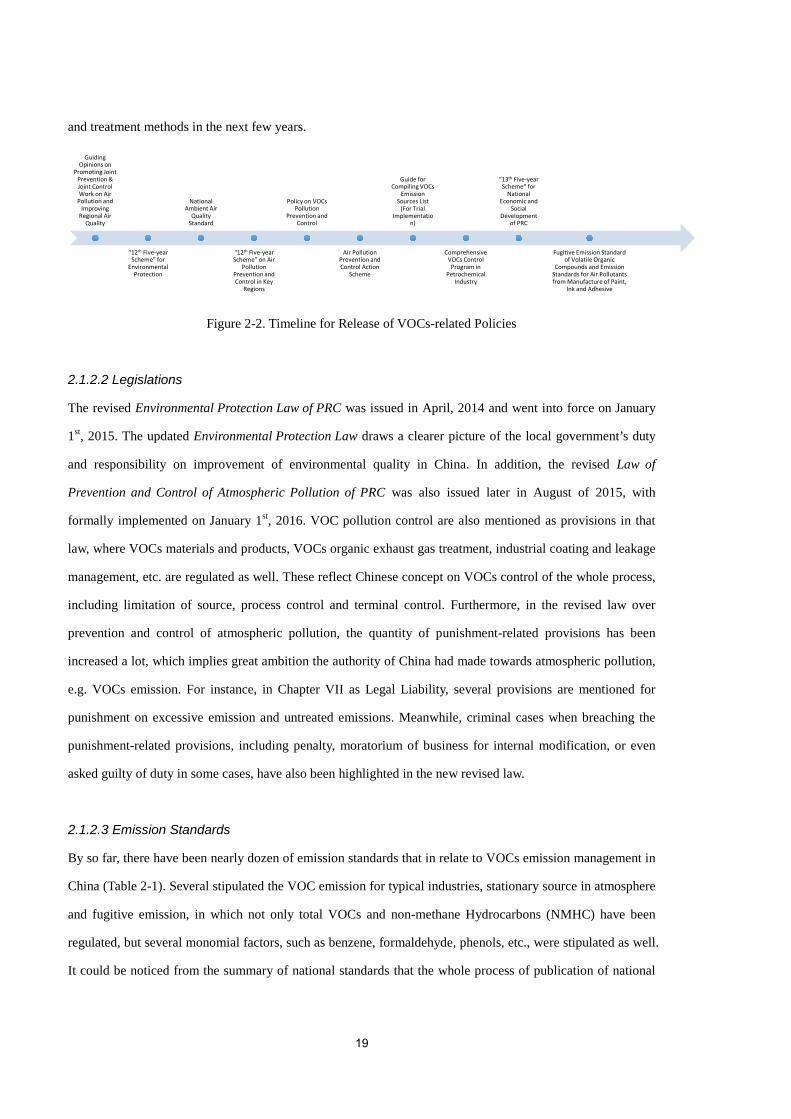
19
and treatment methods in the next few years.
Figure 2-2. Timeline for Release of VOCs-related Policies
2.1.2.2 Legislations
The revised Environmental Protection Law of PRC was issued in April, 2014 and went into force on January
1st, 2015. The updated Environmental Protection Law draws a clearer picture of the local government’s duty
and responsibility on improvement of environmental quality in China. In addition, the revised Law of
Prevention and Control of Atmospheric Pollution of PRC was also issued later in August of 2015, with
formally implemented on January 1st, 2016. VOC pollution control are also mentioned as provisions in that
law, where VOCs materials and products, VOCs organic exhaust gas treatment, industrial coating and leakage
management, etc. are regulated as well. These reflect Chinese concept on VOCs control of the whole process,
including limitation of source, process control and terminal control. Furthermore, in the revised law over
prevention and control of atmospheric pollution, the quantity of punishment-related provisions has been
increased a lot, which implies great ambition the authority of China had made towards atmospheric pollution,
e.g. VOCs emission. For instance, in Chapter VII as Legal Liability, several provisions are mentioned for
punishment on excessive emission and untreated emissions. Meanwhile, criminal cases when breaching the
punishment-related provisions, including penalty, moratorium of business for internal modification, or even
asked guilty of duty in some cases, have also been highlighted in the new revised law.
2.1.2.3 Emission Standards
By so far, there have been nearly dozen of emission standards that in relate to VOCs emission management in
China (Table 2-1). Several stipulated the VOC emission for typical industries, stationary source in atmosphere
and fugitive emission, in which not only total VOCs and non-methane Hydrocarbons (NMHC) have been
regulated, but several monomial factors, such as benzene, formaldehyde, phenols, etc., were stipulated as well.
It could be noticed from the summary of national standards that the whole process of publication of national
Guiding Opinions on
Promoting Joint Prevention & Joint Control Work on Air
Pollution and Improving
Regional Air Quality
“12th Five-year Scheme” for
Environmental Protection
National Ambient Air
Quality Standard
“12th Five-year Scheme” on Air
Pollution Prevention and Control in Key
Regions
Policy on VOCs Pollution
Prevention and Control
Air Pollution Prevention and Control Action
Scheme
Guide for Compiling VOCs
Emission Sources List
(For Trial Implementatio
n)
Comprehensive VOCs Control
Program in Petrochemical
Industry
“13th Five-year Scheme” for
National Economic and
Social Development
of PRC
Fugitive Emission Standard of Volatile Organic
Compounds and Emission Standards for Air Pollutants from Manufacture of Paint,
Ink and Adhesive

20
standards over VOCs emission took decades to establish by authority, while some more industries still have
not been involved yet. Therefore, China’s ambition with cutting down VOCs emission in the next few years
might be falling into failure due to lack of relevant obligatory national standards in certain industries. In
addition, standards issued decades ago were subject to be out-of-date by deviation of data from current
situation. So that review and update of national standards are also required in the near future.
Table 2-1. Summary of National Standards on VOCs Emission
Name No. Issue
Year
Emission Standard of Pollutants for Synthetic Resin Industry GB 31572-2015 2015
Emission Standard of Pollutants for Petroleum Chemistry Industry GB 31571-2015 2015
Emission Standard of Pollutants for Petroleum Refining Industry GB 31570-2015 2015
Emission Standard of Pollutants for Battery Industry GB 30484-2013 2013
Emission Standard of Pollutants for Coking Chemical Industry GB 16171-2012 2012
Emission Standard of Pollutants for Steel Rolling Industry GB 28665-2012 2012
Emission Standard of Pollutants for Rubber Product Industry GB 27632-2011 2011
Emission Standard of Pollutants for Synthetic Leather and Artificial
Leather Industry GB 21902-2008 2008
Emission Standard of Pollutant for Gasoline Filling Stations GB 20952-2007 2007
Emission Standard of Pollutant for Gasoline Terminal GB 20950-2007 2007
Integrated Emission Standard of Air Pollutant GB 16297-1996 1996
2.1.2.4 Monitoring Analysis Standards
During 2010 to 2015, 2-3 monitoring analysis standards related to VOCs emission were issued for each year
by MEP (Table 2-2). Totally 8 industries have been engaged in, including NMHC, VOC, Semi-volatile
Organic Compounds (SVOC), volatile halohydrocarbons, benzene series, aldehyde, ketone and phenol. Also,
sampling methods, e.g. canister sampling, adsorption, sampling bag, etc., and analysis methods, including Gas
Chromatography (GC), joint method of Gas Chromatography and Mass Spectrometry (GC-MS), as well as
High Performance Liquid Chromatography (HPLC), etc. have been stipulated in the issued standards yet.
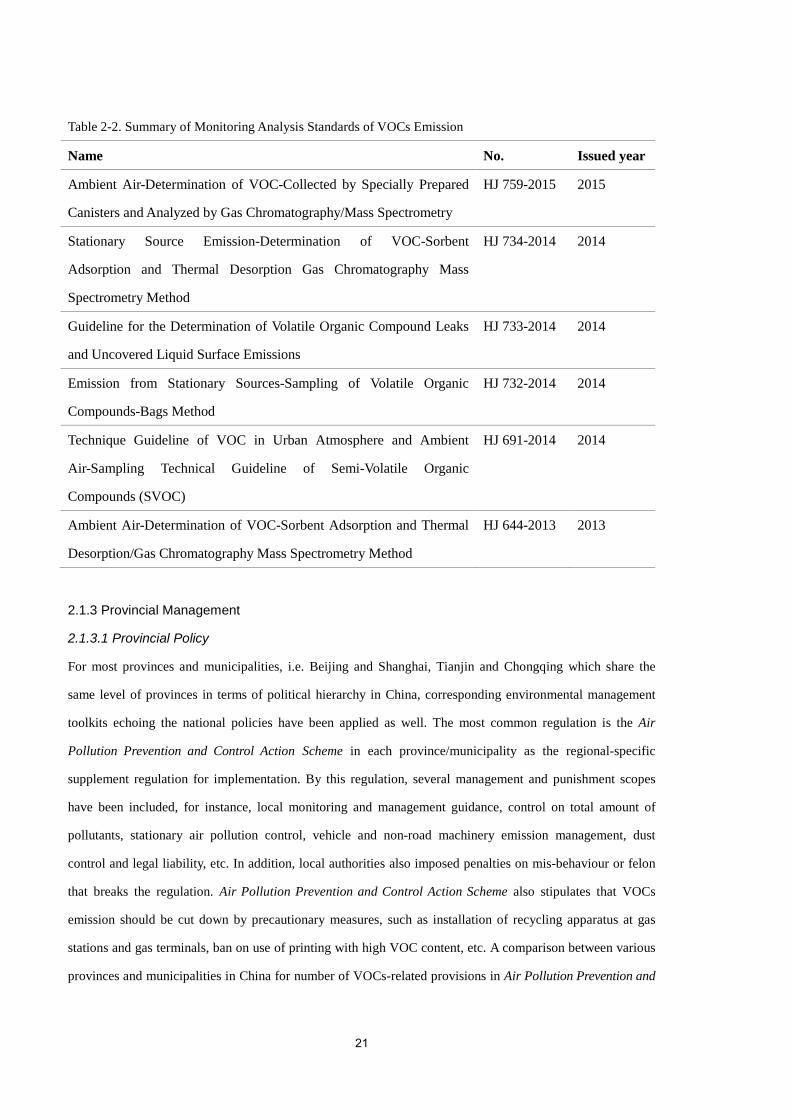
21
Table 2-2. Summary of Monitoring Analysis Standards of VOCs Emission
Name No. Issued year
Ambient Air-Determination of VOC-Collected by Specially Prepared
Canisters and Analyzed by Gas Chromatography/Mass Spectrometry
HJ 759-2015 2015
Stationary Source Emission-Determination of VOC-Sorbent
Adsorption and Thermal Desorption Gas Chromatography Mass
Spectrometry Method
HJ 734-2014 2014
Guideline for the Determination of Volatile Organic Compound Leaks
and Uncovered Liquid Surface Emissions
HJ 733-2014 2014
Emission from Stationary Sources-Sampling of Volatile Organic
Compounds-Bags Method
HJ 732-2014 2014
Technique Guideline of VOC in Urban Atmosphere and Ambient
Air-Sampling Technical Guideline of Semi-Volatile Organic
Compounds (SVOC)
HJ 691-2014 2014
Ambient Air-Determination of VOC-Sorbent Adsorption and Thermal
Desorption/Gas Chromatography Mass Spectrometry Method
HJ 644-2013 2013
2.1.3 Provincial Management
2.1.3.1 Provincial Policy
For most provinces and municipalities, i.e. Beijing and Shanghai, Tianjin and Chongqing which share the
same level of provinces in terms of political hierarchy in China, corresponding environmental management
toolkits echoing the national policies have been applied as well. The most common regulation is the Air
Pollution Prevention and Control Action Scheme in each province/municipality as the regional-specific
supplement regulation for implementation. By this regulation, several management and punishment scopes
have been included, for instance, local monitoring and management guidance, control on total amount of
pollutants, stationary air pollution control, vehicle and non-road machinery emission management, dust
control and legal liability, etc. In addition, local authorities also imposed penalties on mis-behaviour or felon
that breaks the regulation. Air Pollution Prevention and Control Action Scheme also stipulates that VOCs
emission should be cut down by precautionary measures, such as installation of recycling apparatus at gas
stations and gas terminals, ban on use of printing with high VOC content, etc. A comparison between various
provinces and municipalities in China for number of VOCs-related provisions in Air Pollution Prevention and

22
Control Action Scheme has been made as below (Figure 2-3). It can be found from the graph that
municipalities are averagely more concerned about VOCs emission management and control than other
provinces, as more VOCs-related provisions have been issued.
Figure 2-3. Counting for VOCs-related Provisions by Air Pollution Prevention and Control Action Scheme in
Several Provinces and Municipalities in China
Emission fee is another strategy that provincial and municipality government applies for VOCs management
and control in terms of enterprise and company. In June, 2015, the Ministry of Finance (MOF), the National
Development and Reform Commission (NDRC) and the MEP jointly published a new regulation called for
collection of pollution discharge fees in Measures for the Pilot Project of Collecting VOC Pollution Discharge
Fees, with formal implementation since October 1st, 2015. According to the regulation, petrochemical industry,
packaging industry and printing industry would be charged for VOCs discharge fees if the VOCs emission
requirement does not be met. For example, the enterprises located in Beijing City would be charged for 10
Yuan (~1.5 USD) to 40 Yuan (~6 USD) per Kg product since the new regulation came into force (Beijing EPB
2015); while Shanghai City authority charged 10 Yuan (~1.5 USD) since 2015, and increased the price to 20
Yuan (~6 USD) in 2017 (Shanghai EPB 2015). With the start marked by VOCs discharge fees on the first
three industries, more sectors have been involved, such as coating and ink manufacturing, automobile
manufacture and ship-building industry. The pilot attempt has been extended include 5 categories, 13 sections
by so far. By the end of 2016, there have been 14 provinces/cities, including Tianjin, Zhejiang, Guangdong
6
4
7
6
2 2
4 4 4
3
5
4
3
8
1
3
1
6
2
0
1
2
3
4
5
6
7
8
9
23
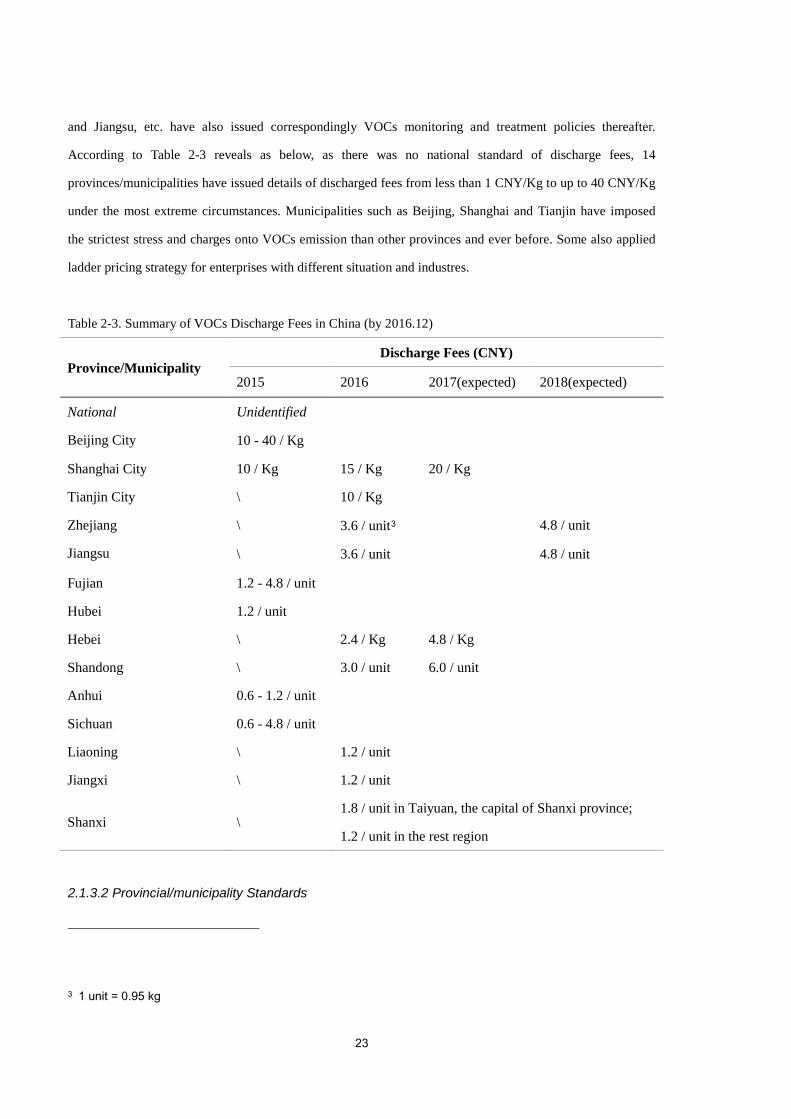
and Jiangsu, etc. have also issued correspondingly VOCs monitoring and treatment policies thereafter.
According to Table 2-3 reveals as below, as there was no national standard of discharge fees, 14
provinces/municipalities have issued details of discharged fees from less than 1 CNY/Kg to up to 40 CNY/Kg
under the most extreme circumstances. Municipalities such as Beijing, Shanghai and Tianjin have imposed
the strictest stress and charges onto VOCs emission than other provinces and ever before. Some also applied
ladder pricing strategy for enterprises with different situation and industres.
Table 2-3. Summary of VOCs Discharge Fees in China (by 2016.12)
Province/Municipality Discharge Fees (CNY)
2015 2016 2017(expected) 2018(expected)
National Unidentified
Beijing City 10 - 40 / Kg
Shanghai City 10 / Kg 15 / Kg 20 / Kg
Tianjin City \ 10 / Kg
Zhejiang \ 3.6 / unit3 4.8 / unit
Jiangsu \ 3.6 / unit 4.8 / unit
Fujian 1.2 - 4.8 / unit
Hubei 1.2 / unit
Hebei \ 2.4 / Kg 4.8 / Kg
Shandong \ 3.0 / unit 6.0 / unit
Anhui 0.6 - 1.2 / unit
Sichuan 0.6 - 4.8 / unit
Liaoning \ 1.2 / unit
Jiangxi \ 1.2 / unit
Shanxi \ 1.8 / unit in Taiyuan, the capital of Shanxi province;
1.2 / unit in the rest region
2.1.3.2 Provincial/municipality Standards
3 1 unit = 0.95 kg
24
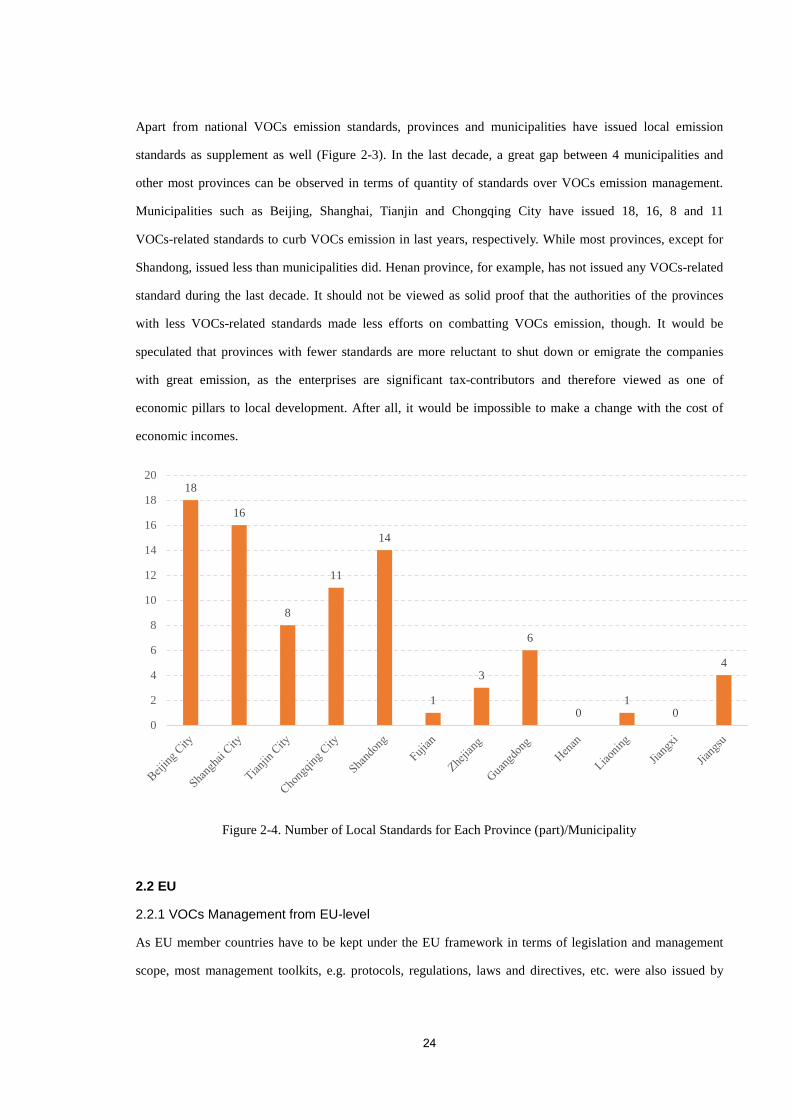
Apart from national VOCs emission standards, provinces and municipalities have issued local emission
standards as supplement as well (Figure 2-3). In the last decade, a great gap between 4 municipalities and
other most provinces can be observed in terms of quantity of standards over VOCs emission management.
Municipalities such as Beijing, Shanghai, Tianjin and Chongqing City have issued 18, 16, 8 and 11
VOCs-related standards to curb VOCs emission in last years, respectively. While most provinces, except for
Shandong, issued less than municipalities did. Henan province, for example, has not issued any VOCs-related
standard during the last decade. It should not be viewed as solid proof that the authorities of the provinces
with less VOCs-related standards made less efforts on combatting VOCs emission, though. It would be
speculated that provinces with fewer standards are more reluctant to shut down or emigrate the companies
with great emission, as the enterprises are significant tax-contributors and therefore viewed as one of
economic pillars to local development. After all, it would be impossible to make a change with the cost of
economic incomes.
Figure 2-4. Number of Local Standards for Each Province (part)/Municipality
2.2 EU
2.2.1 VOCs Management from EU-level
As EU member countries have to be kept under the EU framework in terms of legislation and management
scope, most management toolkits, e.g. protocols, regulations, laws and directives, etc. were also issued by
18
16
8
11
14
1
3
6
0 1
0
4
0
2
4
6
8
10
12
14
16
18
20
25
European Commission as the top authority. In past decades, various management toolkits and strategies
against VOCs emission have been implemented in many countries and regions, among which the EU was one
of the pioneers to curb VOCs emission.
EU’s first attempt on ambient environment control can be dated back to 7 March, 1985, when the first Council
Directive on air quality standards for nitrogen dioxide (NO2) was issued. Since then, ambient environmental
quality has been taken into consideration in the legislative procedures (European Council 1985). EU’s first
management directive on VOCs emission control was issued in December, 1994, where European Parliament
and of the Council set regulation for control of VOCs emission resulting from the storage of petrol and its
distribution from terminals to service stations (European Parliament and of the Council 1994). 5 years later, in
1999, another limitation on VOCs emission due to the use of organic solvents in certain activities and
installations was issued for further management, according to (The Council of the European Union 1999). In
2004, the Directive was updated by amendment 1999/13/EC, which specialised the application of organic
solvents as “certain paints and varnishes and vehicle refinishing products” (The European Parliament and the
Council of the European Union 2004). By so far only the two directives have been specifically issued with
EU-level bodies for management of VOCs emission in last decades. Additionally, the legal act “Directive” by
EU does not indicate detailed executive implementation and enforcement on certain affairs, in other words,
the member states should issue their own executive regulations instead (EU 2016). Therefore, more detailed
policies and regulations will be issued and published by subsidiary bodies and correspondingly national
institutions, which will be further investigated as the next sections.
2.2.2 Sweden
2.2.2.1 Overview
1) Swedish Chemicals Agency
The current main responsible authority in Sweden for management of VOCs emission is Swedish Chemicals
Agency (SCA, Kemikalieinspektionen in Swedish), which is a supervisory body under the Government of
Sweden with especially focus on creating a non-toxic and harm-free society and environment (Swedish
Chemical Agency 2017), despite some other VOCs management policies were issued by Swedish Transport
Agency (Transportstyrelsen in Swedish), etc. The SCA’s regulations were published in the Code of Statutes of
the Swedish Chemicals Agency (KIFS) in Swedish only.
26
2) Swedish Legislation Enacting Procedure
It is reported that about 200 legislative proposals proposed before handing out to the Swedish Parliament
(Riksdag in Swedish). The entire legislative procedure includes initiative, inquiry, referral process, the
Government bill, the Parliamentary approval and promulgation (The Government Offices of Sweden 2015a).
a. Initiative. Although most legislative proposals are initiated by the government, individuals, public
authorities, interest groups and other organisations are capable to put forward suggestion for bills with special
concerns on certain affairs.
b. Inquiry. Before the legislative proposal drafted, the matter in question should be analysed and evaluated
when the task assigned to officials from the subsidiary ministry. The inquiry bodies should include experts,
public officials and politicians, who are both interested or disinterested to the proposal. Then, report with
conclusion will be published in the Swedish Government Official Reports series (SOU, Statens Offentliga
Utredningar in Swedish).
c. The Referral Process
Before the Government takes up a position on the recommendations of a commission of inquiry, its report is
referred for consideration to the relevant bodies. These referral bodies may be central government agencies,
interest groups, local government authorities or other bodies with concerns on such affairs. This process
provides valuable feedback and allows the Government to measure the level of support it may receive in the
following processes and in the public. If a number of referral bodies respond unfavourably to the
recommendations, the Government may turn for an alternative solution instead.
d. The Government Bill
When the referral bodies have all managed to submit their concerns on the affair. The drafts will be hand in to
the parliament of Sweden. However, if the proposed law has great implications for individuals or the welfare
of the public, the Government should first refer the proposal to the Council of Legislation to make sure that it
does not conflict with existing legislations.
e. The Parliamentary Process
The Parliament is the supreme authority for approval of any new or amended legislation in Sweden.
Legislative proposals, whether proceeding from the Government or a private member, are dealt with by one of
the parliamentary committees. Any of the Parliament’s 349 members can table a counter-proposal to a bill
introduced by the Government, which is called a motion. If a motion is formally adopted by the Parliament,
the Government is bound to implement its provisions. When the committee has finished its deliberations, a
report will be submitted and the bill is put to the chamber of the Parliament for approval. If adopted, the bill
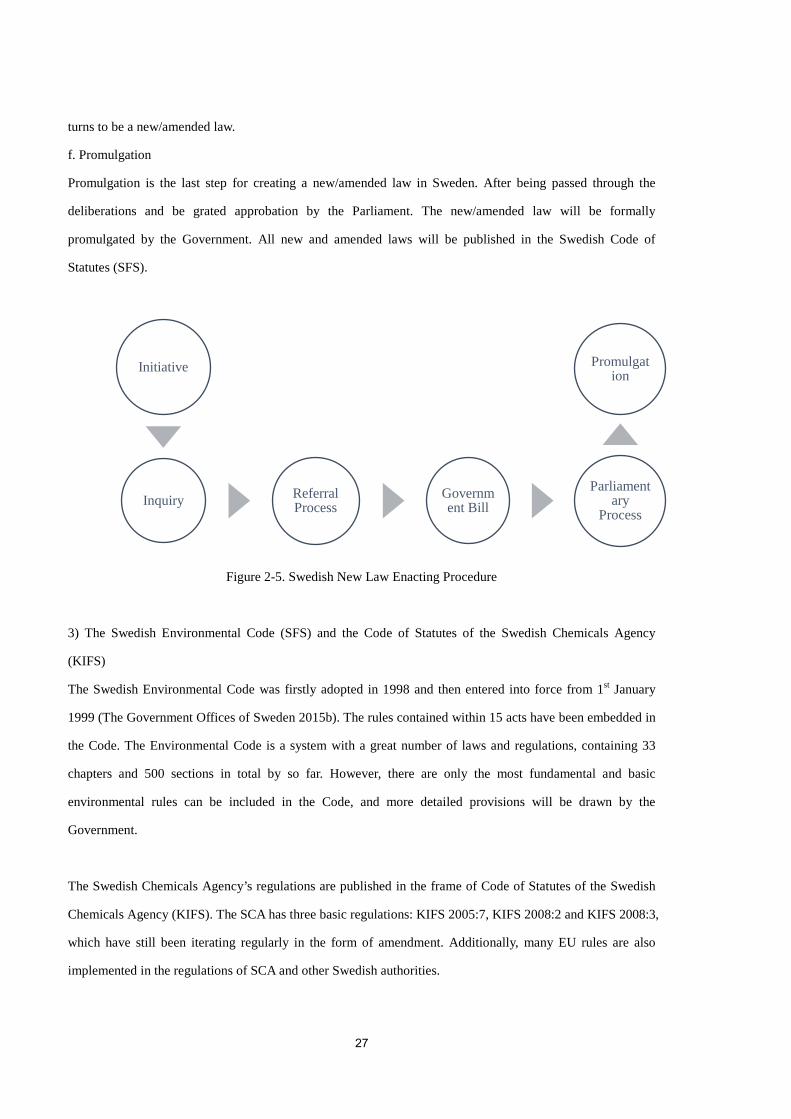
27
turns to be a new/amended law.
f. Promulgation
Promulgation is the last step for creating a new/amended law in Sweden. After being passed through the
deliberations and be grated approbation by the Parliament. The new/amended law will be formally
promulgated by the Government. All new and amended laws will be published in the Swedish Code of
Statutes (SFS).
Figure 2-5. Swedish New Law Enacting Procedure
3) The Swedish Environmental Code (SFS) and the Code of Statutes of the Swedish Chemicals Agency
(KIFS)
The Swedish Environmental Code was firstly adopted in 1998 and then entered into force from 1st January
1999 (The Government Offices of Sweden 2015b). The rules contained within 15 acts have been embedded in
the Code. The Environmental Code is a system with a great number of laws and regulations, containing 33
chapters and 500 sections in total by so far. However, there are only the most fundamental and basic
environmental rules can be included in the Code, and more detailed provisions will be drawn by the
Government.
The Swedish Chemicals Agency’s regulations are published in the frame of Code of Statutes of the Swedish
Chemicals Agency (KIFS). The SCA has three basic regulations: KIFS 2005:7, KIFS 2008:2 and KIFS 2008:3,
which have still been iterating regularly in the form of amendment. Additionally, many EU rules are also
implemented in the regulations of SCA and other Swedish authorities.
Initiative
Inquiry Referral Process
Government Bill
Parliamentary
Process
Promulgation

28
Table 2-4. Basic Swedish Environmental Code and Amendments
Code Name Amendments
KIFS 2005:7 Classification and Labelling Regulations KIFS 2006:6, 2007,5, 2008:4,
2009:3, 2010:5
KIFS 2008:2 Chemical Products and Biotechnical Organisms
Regulations
KIFS 2008:5, 2008:6, 2009:2,
2009:6, 2009:9, 2010:4, 2010:6,
2010:7, 2011:3, 2012:1, 2012:3,
2012:4, 2013:1, 2013:4, 2014:2,
2014:3, 2014:5, 2015:1, 2015:2,
2015:3, 2015:4, 2015:5, 2015:6
KIFS 2008:3 Pesticides Regulations KIFS 2009:1, 2009:5, 2009:7,
2009:8, 2010:1, 2010:2, 2010:3,
2010:8, 2011:1, 2011:2, 2011:4,
2011:5, 2012:2, 2013:2, 2013:3,
2014:1, 2014:4, 2014:6
2.2.2.2 Policies on VOCs Emission Control in Sweden
2.2.2.2.1 VOCs from Construction Products as Guided by EU-LCI
Health-based evaluation of emissions from construction products is an important part of existing national
legislation. There is harmonization of such emissions within the EU based on the LCI (Lowest Concentration
of Interest) concept (European Union Joint Research Centre 2013). The EU-LCI Advisory Board includes
experts, representatives from the Commission, member states, as well as the chemical and construction
product industry. The resulting values are called EU-LCI. The development of EU-LCI is based on existing
national evaluation systems for emissions of volatiles from construction products in Germany (the AgBB
system) and in France (ANSES). Voluntary systems in other countries, such as Denmark and Finland, as well
as existing emission data from construction products have been used as a benchmark. The purpose of the
EU-LCI values is that emission of VOCs from construction products should be evaluated on a harmonized
basis using health-based values.
At present, only volatile organic compounds (VOCs) have been assessed with EU-LCI, and neither highly
29
volatile organic compounds (VVOCs), less volatile organic compounds (SVOCs) or carcinogens have so far
been systematically included. It is also important that it is possible to revise the list of EU-LCI values, both
with regard to the type and number of substances included and their respective EU-LCI values. New
information may emerge in the future, such as data resulting from the implementation of REACH or through
national activities, which may require the list of EU-LCI values to be revised.
EU-LCI values have been developed for a number of priority topics. A total of 177 subjects divided into two
groups, the first group containing 82 subjects with agreed interim EU-LCI values and the other containing 95
subjects for which EU-LCI values are still available. The established EU-LCI values can be used to evaluate
emissions of individual substances, but also to look at the total risk quota, i.e. the sum of individual quotas
between the measured concentration of a substance and the EU-LCI value of the substance, for all substances
emitted from a product. The risk ratio is independent to the nature of the effects on the individual substances.
The presence of volatile and less volatile substances in the indoor environment may be due to emissions from
different sources, of which construction products are an important source. EU-LCI values do not take into
account emissions of substances from sources other than individual construction products, but in order to
address the problem of emissions from multiple sources, it has been suggested that individual risk quotas for
different construction products can be specified, or that emissions of individual substances may be limited to,
for example, halve the LCI value. The responsibility can also be imposed on the constructors who are going to
build without using products with the same subjects.
Working with EU-LCI is a key part of the harmonization framework for labeling of construction products that
will be used in the indoor environment and have potential to be used in the EU, thus promoting stronger
health protection of citizens related to emissions of chemical substances from construction products.
2.2.2.2.2 VOCs Standards in Paints and Varnishes and Vehicle Paint Maintenance
According to several provisions listed in the ordinance about chemical producers and biotechnical organisers
(KIFS: 1998:8)(Swedish Chemical Agency 1998), two standards have been categorized in Appendix II and III
for detailed VOCs management. The paint and varnishes listed in Appendix II may only be placed on the
market if they have VOCs emission not exceeding the limits specified in Appendix II. Likewise, those vehicle
repair paint products with lower concentration of VOCs emission than the criteria listed in Appendix III could
30
only be used.
However, the Chemical Agency may also grant exemptions for some individual cases from the requirements
of Appendix II in respect of very limited quantities of paints and varnishes as well as products for vehicle
repair lacquering for restoration and maintenance of buildings and veterans which have been deemed to have
a particular historical and cultural value.
2.2.2.2.3 Vapour Recovery
Vapour recovery is also recommended by Swedish authorities for gas terminals and other facilities involved in
petroleum industry and ship transport. The tankers that in Sweden call terminals and ports that have a gas
recycling facility for the VOCs shall be equipped with a gas recovery system to access the gas recycling
facility. The gas recovery system must comply with the safety standards specified in MSC / Circ.585 (IMO
1992). Also, other regulations and action plans for tanks with crude oil transported via voyage have been
listed by Swedish Transport Agency and IMO (IMO 1992):
1. Contain routines to minimize emissions of VOCs during loading, shipping and unloading;
2. Take into account the additional emissions of VOCs which is generated by COW (Crude Oil Washing);
3. Assign a person who is responsible for the action plan's through-Conducting;
4. For ships on international voyages, be written on the master's and Officers' languages and, if the master and
officer languages are not English, French or Spanish, include a translation into one of these languages.
2.2.3 Germany
2.2.3.1 Responsible Authorities
In Germany, VOCs emission from construction products are mostly highlighted by government. AgBB
(Committee for Health-related evaluation of Building Products; Ausschuss zur gesundheitlichen Bewertung
von Bauprodukten in German) is one of the responsible authorities for VOCs management and evaluation.
AgBB is composed of several German federal institutions and government bodies, for example, the Health
Institutes of the Federal States, the Federal Environmental Agency (UBA), The German Institute for
Structural Engineering (DIBt), the Conference of the State Ministers and Senators for Town Building,
Building and Housing Affairs, the Federal Institute for Materials Research and Testing (BAM), the Federal
Institute for Risk Assessment and the 'Co-ordinating Commitee 03 for Hygiene, Health and the Environment
of the Building and Civil Engineering Standards Committee within DIN (DIN-KOA 03). AgBB was founded

31
in 1997, aimed for testing criteria and setup of evaluation scheme for VOCs emission from construction
products specifically (ECO INSTITUT 2016).
2.2.3.2 Emission Standard and Evaluation Scheme
For VOCs emission from construction products, AgBB evaluation scheme is mostly used. In 2014, the
German Institute for Structural Engineering (DIBt) came up with the AgBB scheme for developing the
"approval principles for health-evaluation of indoor construction products". The Ü mark4 is a symbol for
construction products which have been approbated according to AgBB evaluation scheme by DIBt in
Germany (ECO INSTITUT 2016), with additional concerns on specifications out of the original EU marking
scheme. For those products entering German market, the Ü mark has to be met. However, in recent year there
were also some criticism on such action by claiming the Ü mark as a breach of EU single market with raising
barrier for trade. A VOCs emission test would be held for any product applying for Ü mark before formal
approbation by DIBt. Some critical indicators and limits for test include (Table 2-5):
Table 2-5. Indicators and Limits for Ü Mark Evaluation (ECO INSTITUT 2016)
Indicator Limit Value (3 days) Limit Value (28 days)
TVOC 10,000 µg/m3 ≤ 1000 µg/m3
TSVOC ≤ 100 µg/m3
Toloule 2900 µg/m3
Formaldehyde 100 µg/m3
Acetaldehyde 1200 µg/m3
CMR 1A & 1B 10 µg/m3 ≤ 1 µg/m3
TVOC w/o LCI ≤ 100 µg/m3
In 2016, DIBt proposed a new regulation called ABG requirement (DIBt 2017). The new ABG regulation is
developed on the basis of a modified model building regulation and has been taken into force in July, 2017.
This regulation aims to indoor air quality and health in buildings, by limiting several hazardous and toxic
compounds in terms of quantity and sources. The regulation includes requirement on less use of construction
4 Ü stands for "Übereinstimmung" (conformity)
32
products with high VOCs emission, as well as the latest AgBB 2015 requirement that has been mentioned
above. Therefore, the Ü mark would be replaced by the CE mark, which is considered as prerequisite for
products entering EU market (EUROFINS 2017).
2.2.4 France
2.2.4.1 Overview
France is the country with large amount of chemicals produced by its advanced chemical industry. Hence,
VOCs emission in France also has been taken into consideration by French government after EU’s directives
and other regulations were issued a decade ago. Generally, French regulation on VOCs emission depends on
labelling and classification, e.g. CMR testing and AFSSET guidelines, which differs from previously
mentioned countries in terms of VOCs emission control and management.
In France, the main responsible authorities for VOCs emission control and management are the French
Agency for Food, Environmental and Occupational Health & Safety (ANSES), Ministry of Health and
Ecology (MHE) and High Council for Public Health (HCSP). However, only MHE is eligible to publish
VOCs-related policies in the name of government as a form of decree. ANSES and HCSP are organizations
with capability of drafting and reviewing for preparation of regulations only. Since 2004, ANSES began to
evaluate the health risks of VOCs emission from solid building products, formally requested by Ministry of
Health and Ecology. From then on, ANSES become one of the most responsible authorities in France in terms
of VOCs management. Later in 2009, this work was also updated and extended to liquid building materials
and decorations (ANSES 2016).
The procedure for air quality regulation and guideline publication in France includes 3 steps. When issuing
the Indoor Air Quality Guidelines (IAQG), ANESES firstly proposed a draft IAQG based on health criteria
exclusively; after that, the HCSP came up with threshold values for air quality in confined space according to
ANESE’s work on IAQG, as well as other technical and social and economic concerns; finally, the official
version of IAQG modified by HCSP was published by the Ministry of Health and Ecology with decree No.
2011-1727 (ANSES 2016).

33
Figure 2-6. Procedure of IAQG Publication in France
2.2.4.2 CMR Testing
CMR testing is a VOCs-specific regulation in France that asks certain VOCs substances (e.g.
trichloroethylene, benzene, DEHP and DBP) to meet the requirement that its concentration of 28-day
emission lower than 1 µg/m³ before formal approbation of the construction products entering French market is
to be issued (EUROFINS 2012). The testing also guided by ISO 16000 and calculated for European reference
room.
2.2.4.3 VOCs Emission Classification
Each chemical product in France shall be categorized by a VOCs emission classification system since
September 1st, 2013, which issued several limit values for certain substances in French market (Table 2-6).
The VOCs emission classification system consists of 4 levels, which indicate different degrees of concern on
risks for environment and citizens’ health, i.e. A+, A, B and C. The A+ indicates lowest degree of risk, while
C otherwise indicates the greatest pollution that VOCs substances may cause. A label (Figure 2-7) shall be
printed on the package of products, with the level indicated and a sentence followed: “Information sur le
niveau d'émission de substances volatiles dans l'air intérieur, présentant un risque de toxicité par inhalation,
sur une échelle de classe allant de A+ (très faibles émissions) à C (fortes émissions)”, which can be translated
in English as “Information on the level of emission of volatile substances in indoor air, presenting a risk of
toxicity by inhalation, on a class scale ranging from A + (very low emissions) to C (high emissions).”
Table 2-6. French VOCs Emission Classification, unit: µg/m³ (EUROFINS 2012)
Classes C B A A+
TVOC >2000 <2000 <1500 <1000
Formaldehyde >120 <120 <60 <10
ANESES proposed
IAQG
HCSP proposed
threshold by IAQG
Formal IAQG
publicated by MHE
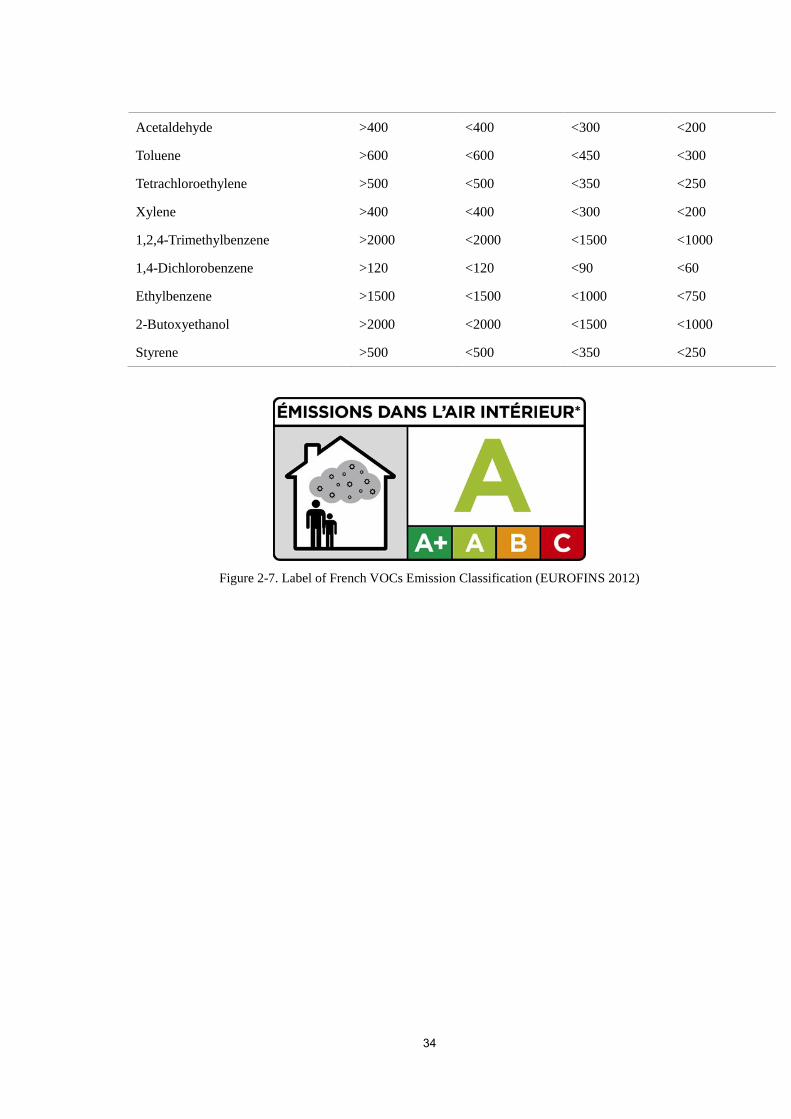
34
Acetaldehyde >400 <400 <300 <200
Toluene >600 <600 <450 <300
Tetrachloroethylene >500 <500 <350 <250
Xylene >400 <400 <300 <200
1,2,4-Trimethylbenzene >2000 <2000 <1500 <1000
1,4-Dichlorobenzene >120 <120 <90 <60
Ethylbenzene >1500 <1500 <1000 <750
2-Butoxyethanol >2000 <2000 <1500 <1000
Styrene >500 <500 <350 <250
Figure 2-7. Label of French VOCs Emission Classification (EUROFINS 2012)

35
3. Technology for VOCs Monitoring and Control 3.1 China
3.1.1 Overview
In order to control the VOCs emission from heavy industry, 3 technologies including source control, process
control and end of pipe control have been used. The emission from petro-chemical and chemical enterprises
was classified into 13 sources of emission, including 3 operating conditions and 2 forms of emission, by
previous experience of environmental protection and management. The 13 sources of emission are able to
cover most of enterprises and companies and emission with various manufacturing techniques. The major
sources of the VOCs emission contain the leakage of static and dynamic sealing point, the loss of volatility of
organic liquid during the storage and the assembling, fugitive emission during collection, transportation,
storage and the conducting process of the wastewater (Table 3-1). According to the summary of VOCs
emission source, the situation and development of VOCs control techniques could be introduced as source
control, process control and end of pipe control, etc., which will be illustrated in 3.1.2.
Table 3-1. Summary of Classification of Emission from the Chemical Enterprises & Companies
Emission Source Type of Emission Condition of
Emission
Leakage of static and dynamic sealing point fugitive/organized Normal
Loss of volatility of organic liquid during the
storage and assembling
fugitive/organized Normal
Release during the storage and assembling of solid
materials
fugitive/organized Normal
Loss of volatility of organic liquid during
assembling
fugitive/organized Normal
Fugitive emission during collection, transportation,
storage and conducting process of the wastewater
fugitive/organized Normal
Organized emission Organized Normal
Release from the cooling tower and circulating
cooling water
fugitive/organized Normal
Emission from abnormal situation including
shutdown and maintenance
fugitive/organized Abnormal

36
Emission from the flare Organized Normal/abnormal
Emission from gas of combustion Organized Normal
Fugitive emission fugitive/organized Normal
Emission during the sampling fugitive/organized Normal
Emission from the accidence of the device fugitive/organized Normal
3.1.2 Source Control
3.1.2.1 Remediation of Dynamic and Static Sealing Point of Device
Apparatus and pipelines are significant components of chemical & manufacturing industry and related
processes, which cause VOCs emission, including pump, flange, connection, pressure relief devices, valve,
pipeline, impeller and compressor, etc. These are mostly engaged in various processes such as storage,
transportation, production and disposal, etc. Thousands of potential VOCs emission sources are observed
during the reaction between the devices mentioned above and volatile organic substances. The life cycle of
the chemical & manufacturing and factories related to VOCs emission contains regional planning, project
design, device selection, construction, operation, maintenance, shut-down and pollution remediation, etc. The
control and management measures on the leakage of dynamic and static sealing point should consider the
initial stage of the process, such as project design, device selection and construction. Lessening leakage spots,
or optimizing the sealing can be therefore adopted as reasonable means to solve the problem. Some more
advice has been listed as follows:
Table 3-2. Advice on Remediation of Sealing Point on Devices
Scope Advice
Project Design 1. The connection of flange replaced by welding.
2. Valves added in the open valve or pipeline with secure condition.
3. Flare or heating device introduced to the emission point of pressure relief
apparatuses.
4. The open sampling system replaced by sealing sampling system and cut down
sampling points as greater VOCs emission due to corrosive materials. Sampling
bottles also used in the sampling point to prevent the leakage of sampling valves.
Device Selection 1. Double mechanical seal, magnetic drive or canned motor pump in replace of
single mechanical seal pump for improvement of dynamic seal performance;
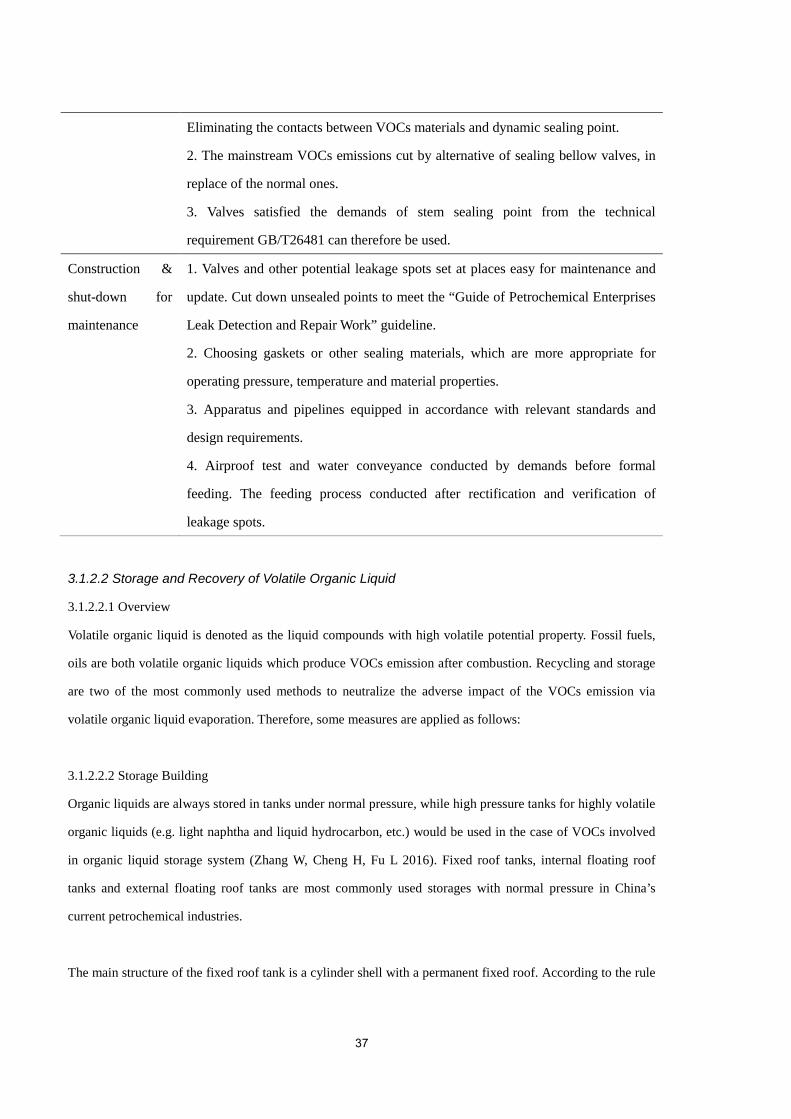
37
Eliminating the contacts between VOCs materials and dynamic sealing point.
2. The mainstream VOCs emissions cut by alternative of sealing bellow valves, in
replace of the normal ones.
3. Valves satisfied the demands of stem sealing point from the technical
requirement GB/T26481 can therefore be used.
Construction &
shut-down for
maintenance
1. Valves and other potential leakage spots set at places easy for maintenance and
update. Cut down unsealed points to meet the “Guide of Petrochemical Enterprises
Leak Detection and Repair Work” guideline.
2. Choosing gaskets or other sealing materials, which are more appropriate for
operating pressure, temperature and material properties.
3. Apparatus and pipelines equipped in accordance with relevant standards and
design requirements.
4. Airproof test and water conveyance conducted by demands before formal
feeding. The feeding process conducted after rectification and verification of
leakage spots.
3.1.2.2 Storage and Recovery of Volatile Organic Liquid
3.1.2.2.1 Overview
Volatile organic liquid is denoted as the liquid compounds with high volatile potential property. Fossil fuels,
oils are both volatile organic liquids which produce VOCs emission after combustion. Recycling and storage
are two of the most commonly used methods to neutralize the adverse impact of the VOCs emission via
volatile organic liquid evaporation. Therefore, some measures are applied as follows:
3.1.2.2.2 Storage Building
Organic liquids are always stored in tanks under normal pressure, while high pressure tanks for highly volatile
organic liquids (e.g. light naphtha and liquid hydrocarbon, etc.) would be used in the case of VOCs involved
in organic liquid storage system (Zhang W, Cheng H, Fu L 2016). Fixed roof tanks, internal floating roof
tanks and external floating roof tanks are most commonly used storages with normal pressure in China’s
current petrochemical industries.
The main structure of the fixed roof tank is a cylinder shell with a permanent fixed roof. According to the rule

38
of liquid evaporation and the structure of the storage, sufficient room exists for contact between liquid and gas
molecules. From the microscopic perspective, part of molecules is able to escape from liquid surface, by
Henry’ Law. The fixed-roof tank is therefore the ultimate choice for VOCs control.
(a) (b)
(c)
Figure 3-1. Diagram of Roof Tanks, (a) fixed; (b) external; (c) internal
(PETROL PLAZA 2000; TICO n.d.)
Internal floating roof tank would be the best choice for control of evaporation of VOCs during storage, as well
as recycling and reconciling of organic liquids. As the nature of liquid evaporation is the interphase mass
transfer produced by molecular motion, evaporation always emerges as long as free surface of gas-liquid
contact exists. Comparing to the fixed-roof tank, a disk floating on the liquid surface is added in the internal
floating roof tank. An annular space filled with sealing attachment exists between the floating disk and its
wall. A covering layer composed by the floating disk and the annular space separates the liquid phase and the
gas phase. It is able to reduce the free surface of the contact between organic liquid and gas phase, therefore
eliminating the volatile space of organic liquid. It is tested that the loss of VOCs emission by floating roof
tank could be 80% lower than the normal fixed roof tank. Internal floating roof has another fixed rood on the

39
top of floating disk, in comparison with the external roof. Such design provides better insulation, keeping the
temperature of reservoir from outside. Also it extends the durability of the material due to sunlight and
reduces the volatility of organic liquid efficiently thereafter. A summary of tank selection for storage of
several types of oil and chemicals has been shown as below (Table 3-3):
Table 3-3. Summary of Tank Selection for Oil and Chemicals Storages
Name of Fuels Organics Type Selection of Tank
Liquefied petroleum gas C1-C4 Pressure tank
Naphtha C4-C6 Pressure tank/internal floating
roof tank
Gasoline C4-C11 Internal floating roof tank
Aviation fuel C11-C16 Internal floating roof tank
Diesel fuel C10-C22 Internal floating roof tank
Paraffin oil C18-C30 Fixed roof tank
Residual oil >C20 Fixed roof tank
Benzene / Internal floating roof tank
Toluene / Internal floating roof tank
Xylene / Internal floating roof tank
3.1.2.2.3 Facilities & Paintings
a. Fixed Roof Tank
Paintings on the wall and the roof of the roof tanks also contribute to VOCs emission, according to a study in
Iran (Tavakoli & Baktash 2012). It has been found that VOCs emission from paintings mainly depends on the
colour and solar radiation at that place. Generally speaking, the darker the paint’s colour is, the lower
reflection observed, and more VOCs evaporation would be found due to higher temperature the cover would
be by receiving more heat from solar radiation. In China, the most common colours of the tanks’ walls are
green, grey, aluminium and white. In the research carried out in Iran, the tanks with light colour as painting
emitted about 170 barrel/yr, while around 370 barrel/yr for dark colours as observed (Tavakoli & Baktash
2012). Hence, the light colours, such as white and aluminium, are recommended in practical equipment and
treatment.

40
b. Floating Roof Tank
b-1. Floating Disks
The floating disk of the internal floating roof tank includes pontoon and single-board disk. The typical
structure of the pontoon (independent buoyancy element) contains tubular aluminium pontoons or other
aluminium frame, with aluminium plate which is able to floating on the surface. The main flaw of the type of
floating disk includes uniform buoyancy, unstable floating and great loss of dish seam due to volatile space
exists between the floating roof and surface of liquids. The single disk is able to eliminate the volatile space
by contacting the storage material directly. However, leakage by corrosion is a severe problem, though.
Welded floating disk and double-layer floating disk are another two major sub-structures under the category
of internal floating disk design. The former one significantly cuts down the loss of dish seam; while the latter
structure is composed of roof disk, bottom disk, edge ring disk, ring partitions and radial partitions, etc.,
which improves strength a lot, from perspective of product design. In addition, the direct contact between the
disk and the organic liquid can eliminate the volatile space and keep heat from the air. Therefore, such design
was considered to be of the best to control normal evaporation of VOCs.
Table 3-4. Comparison of Different Floating Disks
Name Advantages Disadvantages
Pontoon disk Cheap Easy to be worn
Single-board disk Cheap Maintenance required regularly
Double-layer disk Retentive against wearing Expensive
Welded disk Retentive against wearing Vulnerable to temperature change
b-2. Edge Sealing
Seals are a supplementary facility that is usually applied in the internal floating roof tank by Chinese factories.
Currently there are two types of seals, i.e. liquid-filled seal and soft foam seal. Volatile space always exists
between the edge seal and surface of organic liquid, due to the design of structure and setup. Therefore, a
secondary seal should be added in the internal floating roof tank. The secondary seal is able to control and
reduce the VOCs emission by 70-90%, in comparison with the single seal, according to (Zhang W, Cheng H,
Fu L 2016). It thereby shows that an appropriate structure and configuration can eliminate the volatile space
and VOCs loss as well.
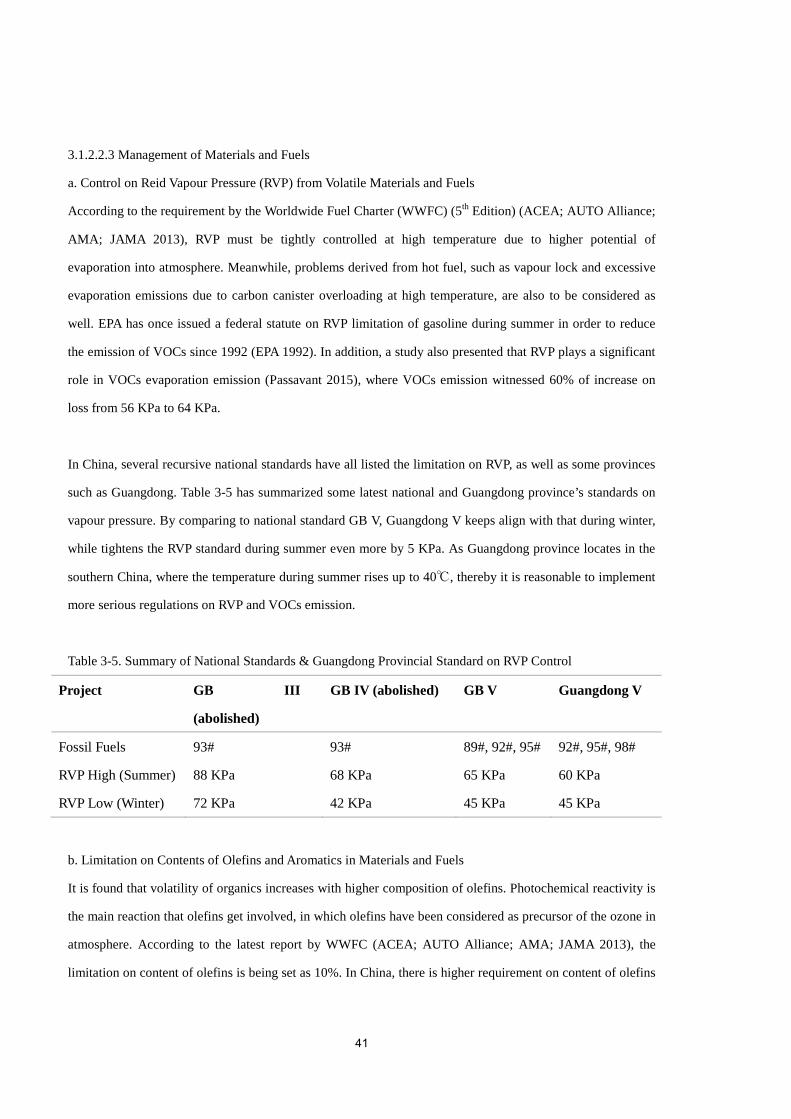
41
3.1.2.2.3 Management of Materials and Fuels
a. Control on Reid Vapour Pressure (RVP) from Volatile Materials and Fuels
According to the requirement by the Worldwide Fuel Charter (WWFC) (5th Edition) (ACEA; AUTO Alliance;
AMA; JAMA 2013), RVP must be tightly controlled at high temperature due to higher potential of
evaporation into atmosphere. Meanwhile, problems derived from hot fuel, such as vapour lock and excessive
evaporation emissions due to carbon canister overloading at high temperature, are also to be considered as
well. EPA has once issued a federal statute on RVP limitation of gasoline during summer in order to reduce
the emission of VOCs since 1992 (EPA 1992). In addition, a study also presented that RVP plays a significant
role in VOCs evaporation emission (Passavant 2015), where VOCs emission witnessed 60% of increase on
loss from 56 KPa to 64 KPa.
In China, several recursive national standards have all listed the limitation on RVP, as well as some provinces
such as Guangdong. Table 3-5 has summarized some latest national and Guangdong province’s standards on
vapour pressure. By comparing to national standard GB V, Guangdong V keeps align with that during winter,
while tightens the RVP standard during summer even more by 5 KPa. As Guangdong province locates in the
southern China, where the temperature during summer rises up to 40℃, thereby it is reasonable to implement
more serious regulations on RVP and VOCs emission.
Table 3-5. Summary of National Standards & Guangdong Provincial Standard on RVP Control
Project GB III
(abolished)
GB IV (abolished) GB V Guangdong V
Fossil Fuels 93# 93# 89#, 92#, 95# 92#, 95#, 98#
RVP High (Summer) 88 KPa 68 KPa 65 KPa 60 KPa
RVP Low (Winter) 72 KPa 42 KPa 45 KPa 45 KPa
b. Limitation on Contents of Olefins and Aromatics in Materials and Fuels
It is found that volatility of organics increases with higher composition of olefins. Photochemical reactivity is
the main reaction that olefins get involved, in which olefins have been considered as precursor of the ozone in
atmosphere. According to the latest report by WWFC (ACEA; AUTO Alliance; AMA; JAMA 2013), the
limitation on content of olefins is being set as 10%. In China, there is higher requirement on content of olefins
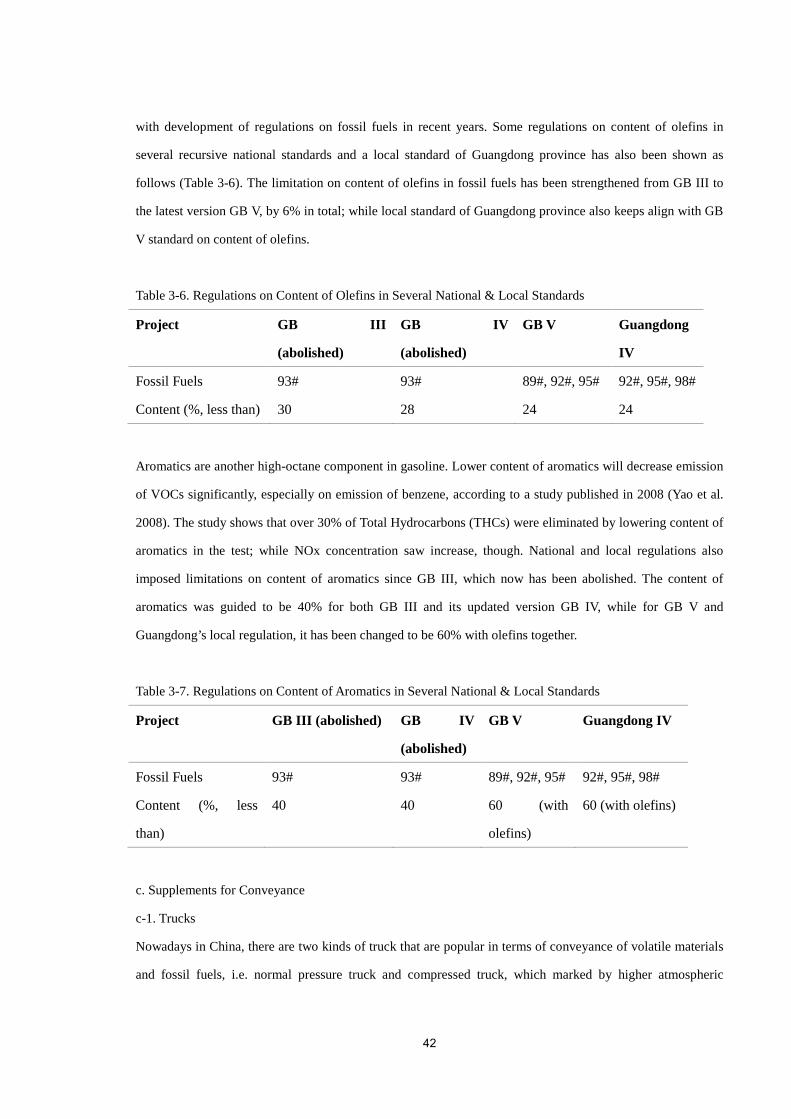
42
with development of regulations on fossil fuels in recent years. Some regulations on content of olefins in
several recursive national standards and a local standard of Guangdong province has also been shown as
follows (Table 3-6). The limitation on content of olefins in fossil fuels has been strengthened from GB III to
the latest version GB V, by 6% in total; while local standard of Guangdong province also keeps align with GB
V standard on content of olefins.
Table 3-6. Regulations on Content of Olefins in Several National & Local Standards
Project GB III
(abolished)
GB IV
(abolished)
GB V Guangdong
IV
Fossil Fuels 93# 93# 89#, 92#, 95# 92#, 95#, 98#
Content (%, less than) 30 28 24 24
Aromatics are another high-octane component in gasoline. Lower content of aromatics will decrease emission
of VOCs significantly, especially on emission of benzene, according to a study published in 2008 (Yao et al.
2008). The study shows that over 30% of Total Hydrocarbons (THCs) were eliminated by lowering content of
aromatics in the test; while NOx concentration saw increase, though. National and local regulations also
imposed limitations on content of aromatics since GB III, which now has been abolished. The content of
aromatics was guided to be 40% for both GB III and its updated version GB IV, while for GB V and
Guangdong’s local regulation, it has been changed to be 60% with olefins together.
Table 3-7. Regulations on Content of Aromatics in Several National & Local Standards
Project GB III (abolished) GB IV
(abolished)
GB V Guangdong IV
Fossil Fuels 93# 93# 89#, 92#, 95# 92#, 95#, 98#
Content (%, less
than)
40 40 60 (with
olefins)
60 (with olefins)
c. Supplements for Conveyance
c-1. Trucks
Nowadays in China, there are two kinds of truck that are popular in terms of conveyance of volatile materials
and fossil fuels, i.e. normal pressure truck and compressed truck, which marked by higher atmospheric
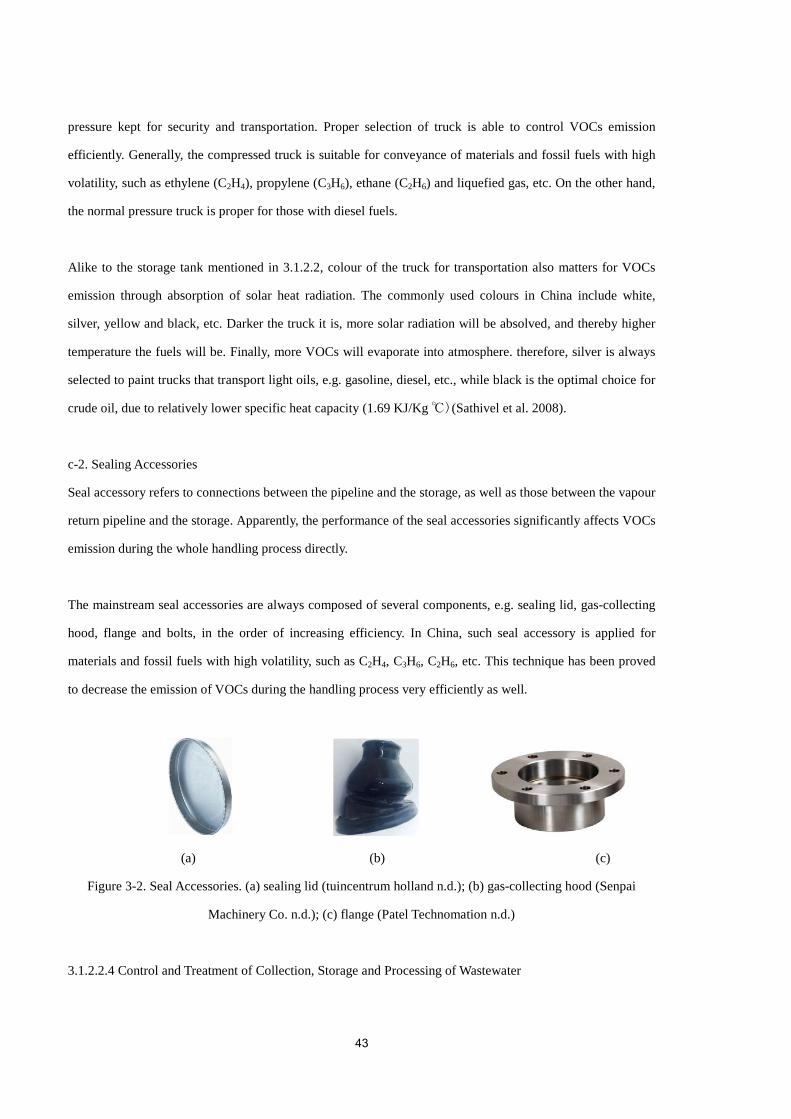
43
pressure kept for security and transportation. Proper selection of truck is able to control VOCs emission
efficiently. Generally, the compressed truck is suitable for conveyance of materials and fossil fuels with high
volatility, such as ethylene (C2H4), propylene (C3H6), ethane (C2H6) and liquefied gas, etc. On the other hand,
the normal pressure truck is proper for those with diesel fuels.
Alike to the storage tank mentioned in 3.1.2.2, colour of the truck for transportation also matters for VOCs
emission through absorption of solar heat radiation. The commonly used colours in China include white,
silver, yellow and black, etc. Darker the truck it is, more solar radiation will be absolved, and thereby higher
temperature the fuels will be. Finally, more VOCs will evaporate into atmosphere. therefore, silver is always
selected to paint trucks that transport light oils, e.g. gasoline, diesel, etc., while black is the optimal choice for
crude oil, due to relatively lower specific heat capacity (1.69 KJ/Kg ℃)(Sathivel et al. 2008).
c-2. Sealing Accessories
Seal accessory refers to connections between the pipeline and the storage, as well as those between the vapour
return pipeline and the storage. Apparently, the performance of the seal accessories significantly affects VOCs
emission during the whole handling process directly.
The mainstream seal accessories are always composed of several components, e.g. sealing lid, gas-collecting
hood, flange and bolts, in the order of increasing efficiency. In China, such seal accessory is applied for
materials and fossil fuels with high volatility, such as C2H4, C3H6, C2H6, etc. This technique has been proved
to decrease the emission of VOCs during the handling process very efficiently as well.
(a) (b) (c)
Figure 3-2. Seal Accessories. (a) sealing lid (tuincentrum holland n.d.); (b) gas-collecting hood (Senpai
Machinery Co. n.d.); (c) flange (Patel Technomation n.d.)
3.1.2.2.4 Control and Treatment of Collection, Storage and Processing of Wastewater

44
Wastewater and its treatment facilities (i.e. WWTP) are another contributor with great capacity for VOCs
emission. Some studies have suggested that 2-4 ug/m2*h during the day and 9-17 ug/m2*h during the night
(Wu et al. 2006), as well as 100-1000 ppm of CH4 emission from primary treatment facilities and
bio-treatment stages (Cheng et al. 2008) were observed, respectively. Therefore, this way of emission should
be taken into consideration as well.
The strategy of control and treatment of wastewater should be based on (a) minimization of discharge and (b)
maximization of recycling rate of wastewater. The mainstream methods of wastewater treatment include
reduction of wastewater by recognizing the emission source, usage of clearer raw materials for the sake of
minimization of discharge in wastewater treatment, application of advanced processes and apparatuses for
maximization of recycling rate of treated wastewater, as well as minimization of exhaust gas emitted into
atmosphere during the treatment processes by covering and sealing for collection, storage and treatment of
wastewater.
a. Minimizing Discharge
The enterprises have been encouraged to apply the optimized strategies for minimization of pollution in China
by so far. This is aimed to minimize the consumption of energy and added chemicals in the whole treatment
process, for achieving the most use of organics and chemicals in the wastewater and ending in “zero discharge”
of waste. Therefore, VOCs emission can be eliminated and recycled during the process. But first of all, the
fundamental mechanism of chemical and biological treatment should be investigated, followed by some
strategies that can be used, e.g. alternatives by updated cleaning techniques in WWTPs, optimization of
drainage network and discharging points, etc. For the most use of chemicals with least waste can be emitted
into air and be discharged to oceans. Some alternative cleaning techniques are therefore to be recommended.
It is estimated that downstream cleaning should be replaced by counter current cleaning; while spray cleaning
could be alternative to jet cleaning, according to (Zhang W, Cheng H, Fu L 2016). Thereby, VOCs emission
can be cut down by less contact to ambient environment. In addition, optimized drainage network should be
designed in the cases of new WWTP projects for higher efficiency of collection of wastewater during
conveyance, meanwhile decreasing the possibility of emission in the process as well. Besides, minimization
of discharge and pollution from wastewater also can be reached by updating advanced process. For example,
the hydrogenation should be used instead of alkali washing to reduce the emission of erosive and volatile
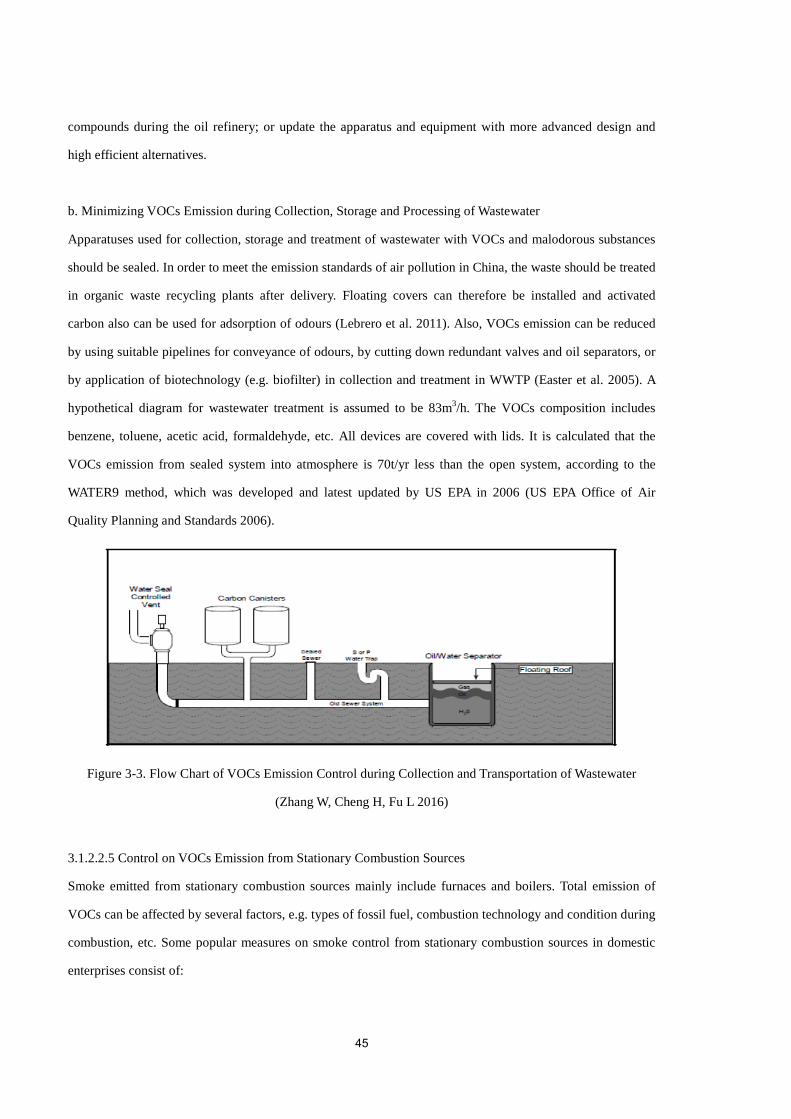
45
compounds during the oil refinery; or update the apparatus and equipment with more advanced design and
high efficient alternatives.
b. Minimizing VOCs Emission during Collection, Storage and Processing of Wastewater
Apparatuses used for collection, storage and treatment of wastewater with VOCs and malodorous substances
should be sealed. In order to meet the emission standards of air pollution in China, the waste should be treated
in organic waste recycling plants after delivery. Floating covers can therefore be installed and activated
carbon also can be used for adsorption of odours (Lebrero et al. 2011). Also, VOCs emission can be reduced
by using suitable pipelines for conveyance of odours, by cutting down redundant valves and oil separators, or
by application of biotechnology (e.g. biofilter) in collection and treatment in WWTP (Easter et al. 2005). A
hypothetical diagram for wastewater treatment is assumed to be 83m3/h. The VOCs composition includes
benzene, toluene, acetic acid, formaldehyde, etc. All devices are covered with lids. It is calculated that the
VOCs emission from sealed system into atmosphere is 70t/yr less than the open system, according to the
WATER9 method, which was developed and latest updated by US EPA in 2006 (US EPA Office of Air
Quality Planning and Standards 2006).
Figure 3-3. Flow Chart of VOCs Emission Control during Collection and Transportation of Wastewater
(Zhang W, Cheng H, Fu L 2016)
3.1.2.2.5 Control on VOCs Emission from Stationary Combustion Sources
Smoke emitted from stationary combustion sources mainly include furnaces and boilers. Total emission of
VOCs can be affected by several factors, e.g. types of fossil fuel, combustion technology and condition during
combustion, etc. Some popular measures on smoke control from stationary combustion sources in domestic
enterprises consist of:

46
a. Selection of Fossil Fuel
The fossil fuels most used for stationary combustion sources include natural gas, gasoline, coal, petroleum
coke, etc. Currently natural gas and gasoline are often used in the furnaces by industrial enterprises. Among
all gas fuels, natural gas is considered as cleaner fuel for combustion, due to its main component as methane.
Gas, liquid and solid fuels are also used in combustion of boilers, and coal burning emission has been
considered as an important source of aromatics in previous studies in China (Liu et al. 2008). Bituminous coal
and anthracite, which are both with higher content of carbon than normal raw coals, also emit less
hydrocarbon in comparison with others. Therefore, by choosing gas fuels and clean solid fuels such as
bituminous coal and anthracite can significantly reduce the emission of VOCs in practice.
b. Selection of Apparatus and Equipment
Some apparatuses are able to increase the combustion efficiency and cut down VOCs emission
simultaneously during the combustion process, for instance, high efficient atomizing nozzle that is able to
spray vaporized liquid particles can be used to improve efficiency of combustion in current industrial
processes. Besides, pulverized coal furnace and cyclone furnace can also decrease emission of VOCs as
operating conditions can be accurately modified.
3.1.2.2.6 Control on Organized Industrial Emission
Organized industrial emission, mainly refers to the emission from industrial enterprises with well-established
facilities and processes. VOCs are usually emitted into the air as exhaust gases and waste fume through
chimneys. Current control techniques in China include:
a. Use solution with low volatility and recycling device for recovery.
b. Introduce gas treatment facilities to meet the national emission standard of China:
b-1. Exhaust gas with volatile organics from the air oxidation reactor (oxychloride, ammonia oxidation, etc.)
delivered to the organic waste recycling or treatment devices.
b-2. Exhaust gas from feeding process of sequencing batch reactor (SBR), replacement process of the vapour
space protection, temperature and cleaning process of reactor delivered to the organic waste recycling or
treatment facilities.
b-3. VOCs emission from solid organics waste delivered to organic waste recycling or treatment facilities.
b-4. Emission from vacuum pumps delivered to treatment facilities.

47
b-5. Emission from safety valves under abnormal operating conditions delivered to treatment facilities.
c. Cut down emission of VOCs by choosing advanced devices and appropriate approaches of material
feeding.
c-1. Select airproof pumps and head tank for volatile materials.
c-2. Use sealed feeders for powder materials.
c-3. Use hermetic compressor to separate volatile materials.
c-4. Replace the normal pumps with oil-free reciprocating pumps, roots vacuum pumps and liquid ring pumps
for volatile materials.
c-5. Use sealed drying machine for recovery of volatile materials.
3.1.2.2.7 Control on Fugitive Emission
Fugitive emission has been a major source of VOCs total emission especially during manufacturing and
petroleum industry. Although there has not been any quantitative measurement on fugitive emission in
production in China, it was estimated that fugitive emission accounts for a great part of total emission so far.
Chinese authorities also released guidance for evaluation (Shanghai EPB n.d.; MEP 2014). Therefore, in
accordance with guidance and regulations, some control measures include:
a. Solution with low volatility should be used, in place with the high volatility counterpart.
b. Use VOCs captures over the VOCs-produced apparatuses for collection.
c. Regularly examine airtight of apparatuses and devices engaged in operation with VOCs emission.
d. Optimize the layout of pipelines & tunnels for less possibility of leakage.
e. Set stationary monitors for VOCs emission examination.
3.1.2.2.8 Abnormal Operation Emission
Abnormal operating conditions are usually occurred during startup and maintenance processes when normal
operation cannot be used in manufacturing and petroleum industries. Some measures for VOCs control
applied during the process include:
a. Shorten time of abnormal shutdown by improving reliability of materials and facilities. Improving sealing
property of relevant machinery and being refraining from unscheduled shutdown due to failure of equipment.
b. Prepare emergency plan for temporary collection, storage and treatment of VOCs emission, in case of
shutdown of the original facilities used for VOCs emission treatment.
48
3.1.2.2.9 Flare System
Flare system is commonly used to deal with the flammable organic compounds in the exhaust emission from
production processes in both manufacturing and petroleum industries. Excessive VOCs emission that not be
collected by collectors is able to be burned and converted to CO2 through flare system. Some measures and
considerations about source control by flare system are presented as follow:
a. Recycling techniques should be prioritized for treatment of VOCs emission during abnormal operating
condition. Flare system can then be used after being determined that VOCs emission cannot be collected and
stored successfully with ordinary techniques. Flare system should be used as back-up option since it still emits
great of CO2 into atmosphere as well.
b. The outflow rate of emission to the flare system should be kept slower than ordinary chimney rate, so as to
complete combustion of exhaust gases.
c. Reliable and stable ignition system for flare system. Flare system should be resistant against severe
conditions such as storming and raining, therefore reliable ignition system should be ensured.
d. Smokeless combustion should be achieved through steam or air combustion facilities.
e. Flow rate of steam injection should be managed carefully, in order to avoid incomplete combustion which
declines efficiency of treatment.
f. In some cases, additional fuels or natural gas should be added to make sure that the combustion condition
can be satisfied with total heating value of 7800 KJ/m3.
3.1.3 Process Control
3.1.3.1 Leakage Detection and Repair (LDAR)
3.1.3.1.1 Overview
LDAR is the most popularly used method for VOCs emission control for process control of VOCs emission
during industrial production. It is firstly defined as “a work practice designed to identify leaking equipment so
that emissions can be reduced through repairs” by U.S. EPA (US EPA 2007). A component that is subject to
LDAR requirements must be monitored at specified, regular intervals to determine whether or not it is leaking
and any leaking component must be repaired or replaced within a specified time frame. LDAR should be built
on comprehensive and meticulous management and treatment during production process. Generally, VOCs
leakage spots on tunnels are detected by automatic or manual operations, followed by corresponding repairs
and implementation. A holistic LDAR programme can be consisted of five components, i.e. identifying
components, leak definition, monitoring components, repairing components and recordkeeping, suggested by
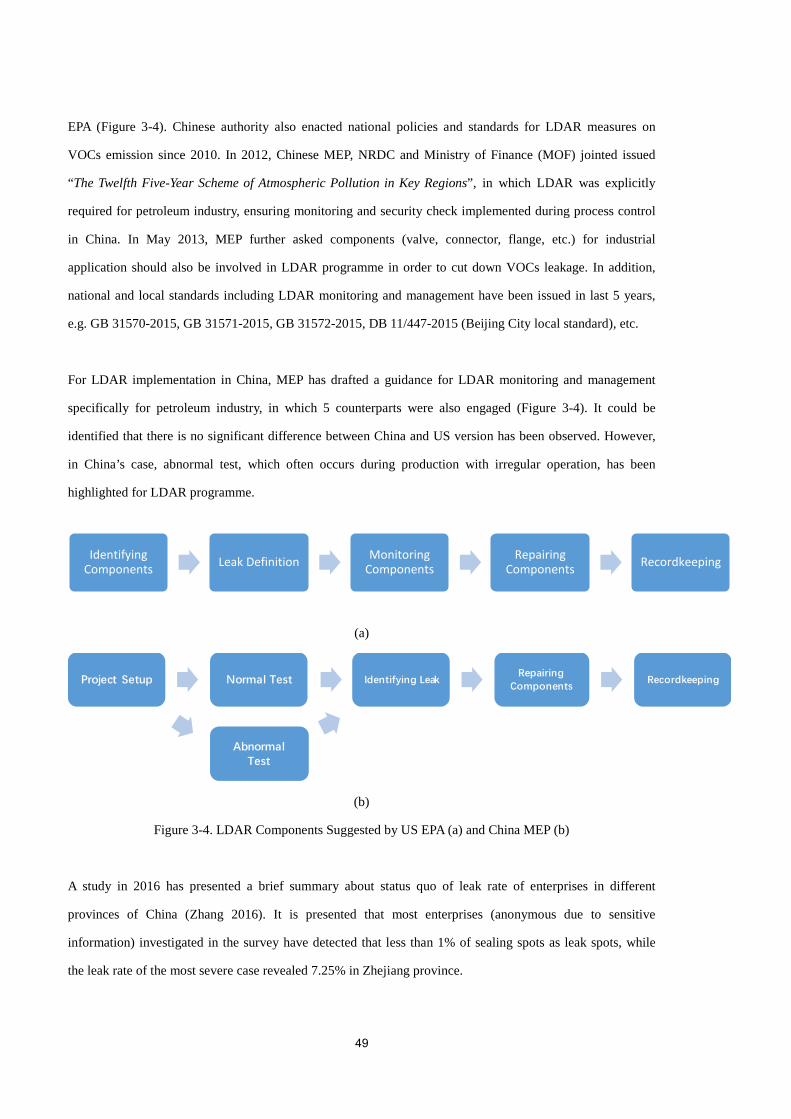
49
EPA (Figure 3-4). Chinese authority also enacted national policies and standards for LDAR measures on
VOCs emission since 2010. In 2012, Chinese MEP, NRDC and Ministry of Finance (MOF) jointed issued
“The Twelfth Five-Year Scheme of Atmospheric Pollution in Key Regions”, in which LDAR was explicitly
required for petroleum industry, ensuring monitoring and security check implemented during process control
in China. In May 2013, MEP further asked components (valve, connector, flange, etc.) for industrial
application should also be involved in LDAR programme in order to cut down VOCs leakage. In addition,
national and local standards including LDAR monitoring and management have been issued in last 5 years,
e.g. GB 31570-2015, GB 31571-2015, GB 31572-2015, DB 11/447-2015 (Beijing City local standard), etc.
For LDAR implementation in China, MEP has drafted a guidance for LDAR monitoring and management
specifically for petroleum industry, in which 5 counterparts were also engaged (Figure 3-4). It could be
identified that there is no significant difference between China and US version has been observed. However,
in China’s case, abnormal test, which often occurs during production with irregular operation, has been
highlighted for LDAR programme.
(a)
(b)
Figure 3-4. LDAR Components Suggested by US EPA (a) and China MEP (b)
A study in 2016 has presented a brief summary about status quo of leak rate of enterprises in different
provinces of China (Zhang 2016). It is presented that most enterprises (anonymous due to sensitive
information) investigated in the survey have detected that less than 1% of sealing spots as leak spots, while
the leak rate of the most severe case revealed 7.25% in Zhejiang province.
Identifying Components Leak Definition Monitoring
Components Repairing
Components Recordkeeping

50
Table 3-8. Some Cases about Leak Rate in China
Name City/Province Sealing Spots in Total Detected Leak
Spots
Leak Rate
A Shanghai City 129522 83 0.06%
B Jiangsu 10511 73 0.69%
C Beijing City 540000 2951 0.55%
D Tianjin City 142456 554 0.39%
E Tianjin City 12000 170 1.42%
F Guangdong 23803 100 0.42%
G Guangdong 23000 300 1.30%
H Jiangxi 100668 200 0.20%
I Jiangsu 7740 180 2.33%
J Zhejiang 21520 1560 7.25%
3.1.3.1.2 Leak Test
a. Normal Test
As Petroleum Refining Industry Emission Standard (GB 31570-2015) and Petrochemical Industry Emission
Standard (GB 31571-2015) stipulate that the hydrogen flame ionization detector (FID) should be used for
normal detection. It is able to satisfy the requirement of the related standards, including detection technology
guidance for VOCs emission due to leakage and open liquid system. The detected gas and auxiliary materials
should be identified based on the situation at the spot, while influence factors should be determined by
instrument, calibration, composition and concentration of VOCs emission. The field detection includes the
environmental background value of the apparatus and facilities that are used, as well as detected value of
dynamic and static sealing points that should be recorded with instruction and calibration.
b. Abnormal Test
Some abnormal test techniques could be applied in case of ordinary measures do not work out successfully.
Optical, ultrasonic, liquid soap, etc. (Figure 3-5) are commonly used alternatives for normal detection as
auxiliary detection. Such method also helps identify the leakage spots on the tunnels.

51
Figure 3-5. Mechanism of Ultrasonic Detection (NIHON DEMPA KOGYO CO. 2017)
c. Frequency of Detection
The frequency of detection has been explicitly regulated in both GB 31570-2015 and GB 31571-2015. Both
regulations propose that manufacturing enterprises and petroleum industry corporation should make sure that:
c-1. The pumps, compressors, valves, opening valves or opening pipelines, gas/vapour safety valve and
sampling connection system should be detected at least every 3 months.
c-2. Flange and other connections and sealing device should be detected at least every 6 months.
c-3. The facilities and pipelines that used for VOCs emission should be detected within 30 days after
initiative.
c-4. The possible leakage of the facilities and pipelines which are used for VOCs emission should be visually
inspected at least every week.
3.1.3.1.3 Maintenance
After confirming the leakage spots via national and local standards, the leakage spots should be repaired
within 15 days, according to the both national standards. In addition, the first attempt for repair should be no
later than 5 days after confirmation of leakage spots, and the measures should include fixation of the screws
and jet spraying under normal pressure, etc. In the case that maintenance could not be implemented within 15
days after being detected with the production unit running as usual, maintenance could be suspended for no
longer than a normal production period. The sealing points should also be re-examined and recorded after
maintenance.
3.1.3.1.4 Recordkeeping
Recordkeeping is the last element of both LDAR programme in China and U.S., as a written proof for further
investigation, recordkeeping should be following the guidance the MEP has stipulated. In China, enterprises
are asked to record ordinary detection history and incident information in 3 categories: project set-up,
detection & test, maintenance. The record should also be kept no less than 5 years.

52
a. Project Set-up
The project set-up record should include the information such as authority approbations, list of facilities
which are under monitored, analysis on internal structure of apparatus and facility, record of facilities under
exemption, the ID code of each facility, sampling history, record of unreachable sealing spots, control history
on unreachable sealing spots, and detection ledger for sealing spots. All items should be recorded either with
LDAR management system, or by manual recording on the paper in archive.
b. Detection & Test
Detection and test record also includes several items: detection mission ticket, ledger for ordinary detection of
machine, ledger for abnormal detection of machine, analysis on impact factor, record of apparatus preparation,
environmental background test, ordinary test, abnormal test, re-examine record and detection period.
c. Maintenance
Record of maintenance should include maintenance mission ticket, operation record, suspension record,
startup and shutdown and seriously leaking remediation.
3.1.4 End-of-Pipe Control
3.1.4.1 Overview
The end-of-pipe control is the technology used at the end of the entire production process. End-of-pipe control
technology includes a number of techniques with significantly different mechanism, such as adsorption
(activated carbon), absorption (non-volatile liquid), condensation, combustion oxidation (RTO, RCO),
membrane separation, biological technology (bio-scrubber, bio-filtration and bio-trickling filtration), low
temperature plasma, etc., as well as some complex composed by various techniques. Generally, the
end-of-pipe techniques can be categorized as VOCs disposal and VOCs recycling and recovery, which will be
revealed as follow.
Table 3-9. Advantages and Disadvantages of VOCs End-of-Pipe Treatment Techniques
(Guteng Env. 2016; Mudliar et al. 2010)
Advantage Disadvantage
Thermal destruction • High efficiency
• Lower budget
• Easy maintenance
• Less demand on land
• Risk of combustion
• Pre-treatment required
• Organic solvents not recycled
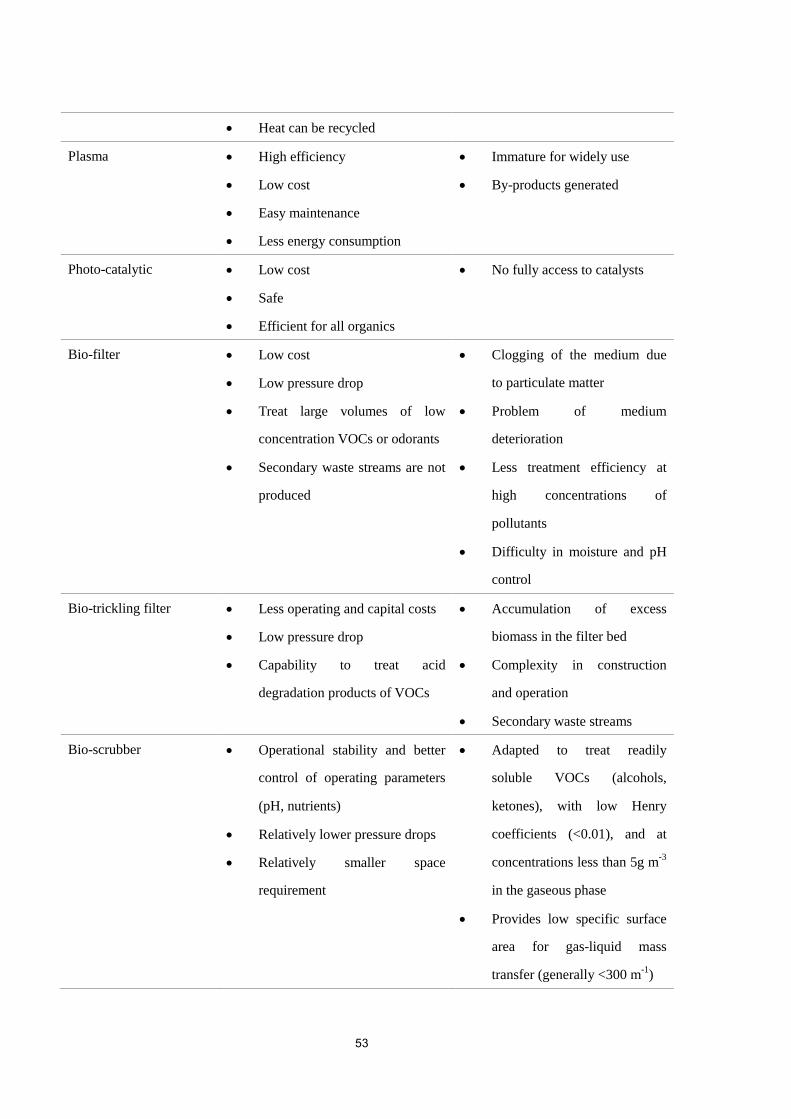
53
• Heat can be recycled
Plasma • High efficiency
• Low cost
• Easy maintenance
• Less energy consumption
• Immature for widely use
• By-products generated
Photo-catalytic • Low cost
• Safe
• Efficient for all organics
• No fully access to catalysts
Bio-filter • Low cost
• Low pressure drop
• Treat large volumes of low
concentration VOCs or odorants
• Secondary waste streams are not
produced
• Clogging of the medium due
to particulate matter
• Problem of medium
deterioration
• Less treatment efficiency at
high concentrations of
pollutants
• Difficulty in moisture and pH
control
Bio-trickling filter • Less operating and capital costs
• Low pressure drop
• Capability to treat acid
degradation products of VOCs
• Accumulation of excess
biomass in the filter bed
• Complexity in construction
and operation
• Secondary waste streams
Bio-scrubber • Operational stability and better
control of operating parameters
(pH, nutrients)
• Relatively lower pressure drops
• Relatively smaller space
requirement
• Adapted to treat readily
soluble VOCs (alcohols,
ketones), with low Henry
coefficients (<0.01), and at
concentrations less than 5g m-3
in the gaseous phase
• Provides low specific surface
area for gas-liquid mass
transfer (generally <300 m-1)
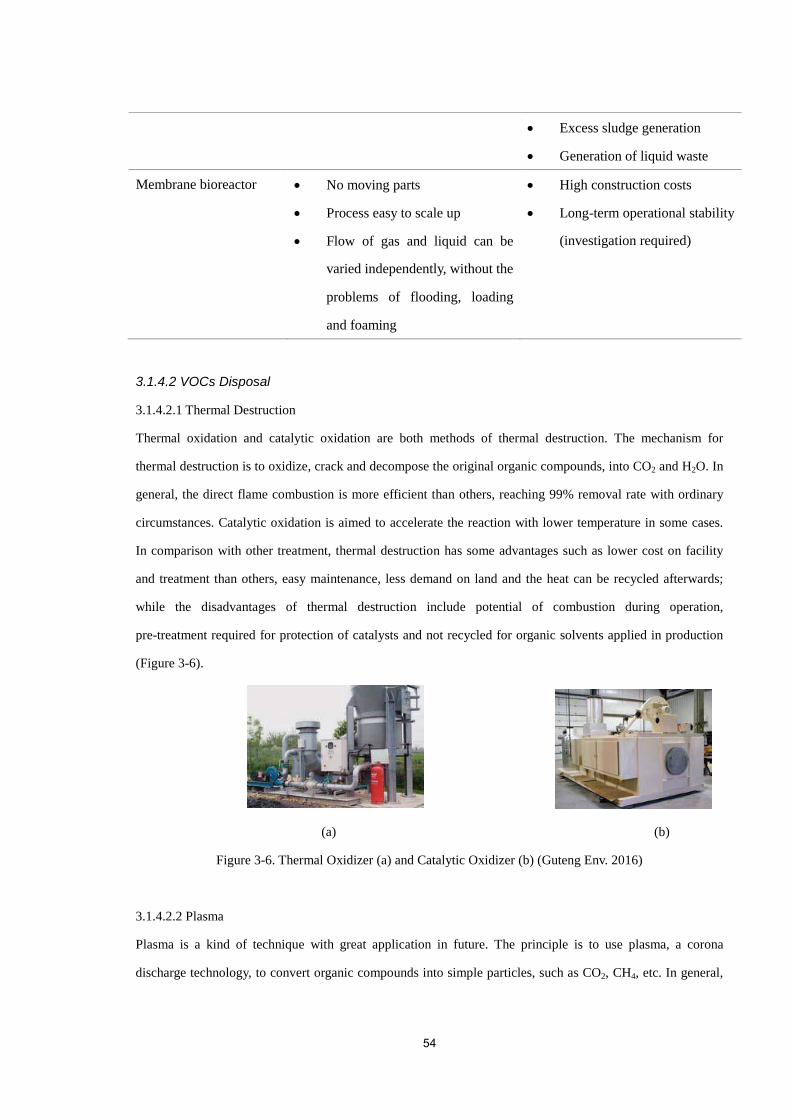
54
• Excess sludge generation
• Generation of liquid waste
Membrane bioreactor • No moving parts
• Process easy to scale up
• Flow of gas and liquid can be
varied independently, without the
problems of flooding, loading
and foaming
• High construction costs
• Long-term operational stability
(investigation required)
3.1.4.2 VOCs Disposal
3.1.4.2.1 Thermal Destruction
Thermal oxidation and catalytic oxidation are both methods of thermal destruction. The mechanism for
thermal destruction is to oxidize, crack and decompose the original organic compounds, into CO2 and H2O. In
general, the direct flame combustion is more efficient than others, reaching 99% removal rate with ordinary
circumstances. Catalytic oxidation is aimed to accelerate the reaction with lower temperature in some cases.
In comparison with other treatment, thermal destruction has some advantages such as lower cost on facility
and treatment than others, easy maintenance, less demand on land and the heat can be recycled afterwards;
while the disadvantages of thermal destruction include potential of combustion during operation,
pre-treatment required for protection of catalysts and not recycled for organic solvents applied in production
(Figure 3-6).
(a) (b)
Figure 3-6. Thermal Oxidizer (a) and Catalytic Oxidizer (b) (Guteng Env. 2016)
3.1.4.2.2 Plasma
Plasma is a kind of technique with great application in future. The principle is to use plasma, a corona
discharge technology, to convert organic compounds into simple particles, such as CO2, CH4, etc. In general,
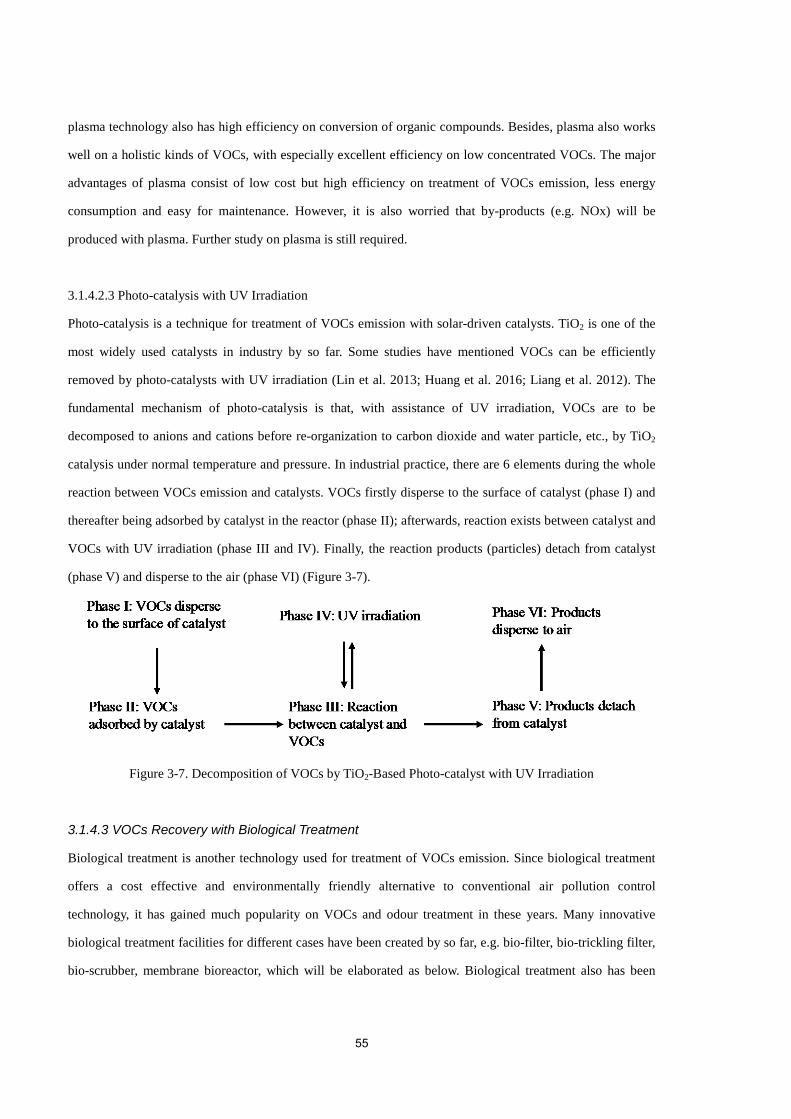
55
plasma technology also has high efficiency on conversion of organic compounds. Besides, plasma also works
well on a holistic kinds of VOCs, with especially excellent efficiency on low concentrated VOCs. The major
advantages of plasma consist of low cost but high efficiency on treatment of VOCs emission, less energy
consumption and easy for maintenance. However, it is also worried that by-products (e.g. NOx) will be
produced with plasma. Further study on plasma is still required.
3.1.4.2.3 Photo-catalysis with UV Irradiation
Photo-catalysis is a technique for treatment of VOCs emission with solar-driven catalysts. TiO2 is one of the
most widely used catalysts in industry by so far. Some studies have mentioned VOCs can be efficiently
removed by photo-catalysts with UV irradiation (Lin et al. 2013; Huang et al. 2016; Liang et al. 2012). The
fundamental mechanism of photo-catalysis is that, with assistance of UV irradiation, VOCs are to be
decomposed to anions and cations before re-organization to carbon dioxide and water particle, etc., by TiO2
catalysis under normal temperature and pressure. In industrial practice, there are 6 elements during the whole
reaction between VOCs emission and catalysts. VOCs firstly disperse to the surface of catalyst (phase I) and
thereafter being adsorbed by catalyst in the reactor (phase II); afterwards, reaction exists between catalyst and
VOCs with UV irradiation (phase III and IV). Finally, the reaction products (particles) detach from catalyst
(phase V) and disperse to the air (phase VI) (Figure 3-7).
Figure 3-7. Decomposition of VOCs by TiO2-Based Photo-catalyst with UV Irradiation
3.1.4.3 VOCs Recovery with Biological Treatment
Biological treatment is another technology used for treatment of VOCs emission. Since biological treatment
offers a cost effective and environmentally friendly alternative to conventional air pollution control
technology, it has gained much popularity on VOCs and odour treatment in these years. Many innovative
biological treatment facilities for different cases have been created by so far, e.g. bio-filter, bio-trickling filter,
bio-scrubber, membrane bioreactor, which will be elaborated as below. Biological treatment also has been
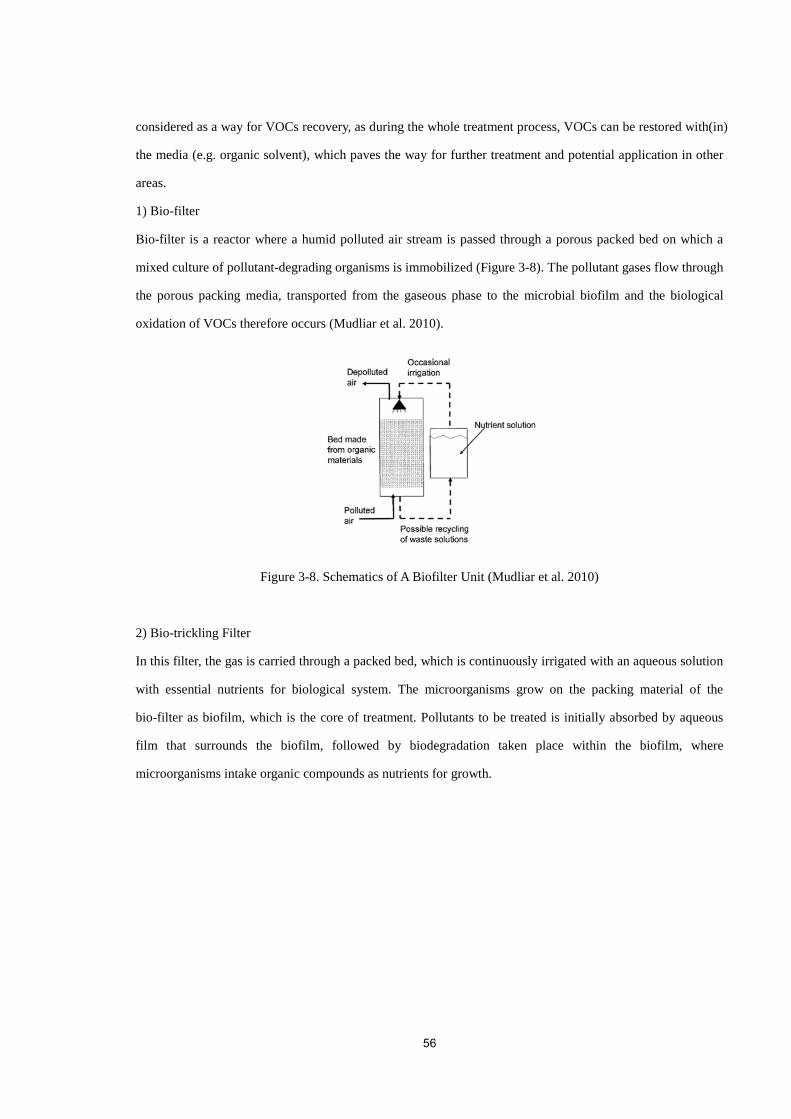
56
considered as a way for VOCs recovery, as during the whole treatment process, VOCs can be restored with(in)
the media (e.g. organic solvent), which paves the way for further treatment and potential application in other
areas.
1) Bio-filter
Bio-filter is a reactor where a humid polluted air stream is passed through a porous packed bed on which a
mixed culture of pollutant-degrading organisms is immobilized (Figure 3-8). The pollutant gases flow through
the porous packing media, transported from the gaseous phase to the microbial biofilm and the biological
oxidation of VOCs therefore occurs (Mudliar et al. 2010).
Figure 3-8. Schematics of A Biofilter Unit (Mudliar et al. 2010)
2) Bio-trickling Filter
In this filter, the gas is carried through a packed bed, which is continuously irrigated with an aqueous solution
with essential nutrients for biological system. The microorganisms grow on the packing material of the
bio-filter as biofilm, which is the core of treatment. Pollutants to be treated is initially absorbed by aqueous
film that surrounds the biofilm, followed by biodegradation taken place within the biofilm, where
microorganisms intake organic compounds as nutrients for growth.

57
Figure 3-9. Schematics of A Bio-trickling Filter Unit (Mudliar et al. 2010)
3) Bio-scrubber
A bio-scrubber unit consists of two subunits, i.e. (i) an absorption unit and (ii) a bioreactor unit. In the
absorption unit, input gaseous pollutants are transferred to the liquid phase. Therefore, gas and liquid phases
flow counter-currently in the column, which may contain the packing material. However, addition of packing
gives more transfer surface between VOCs and aqueous phase (Groenestijn Johan W. & Hesselink Paul 1993).
The washed gaseous phase can be released from the top of the column, while the contaminated liquid phase is
pumped to an aerated bioreactor. It is believed that this reactor unit contains essential nutrient solution within
aqueous phase for microorganisms’ growth as well.
Figure 3-10. Schematics of A Bio-scrubber Unit (Mudliar et al. 2010)
4) Membrane Bioreactor
Membrane bioreactor is firstly designed for substitution of conventional bioreactors for waste gas treatment.
Membrane bioreactor features selectivity of permeation of the pollutants, which differs from any of other
technique previously discussed. The idea was proposed for waste gas treatment by some studies already in last
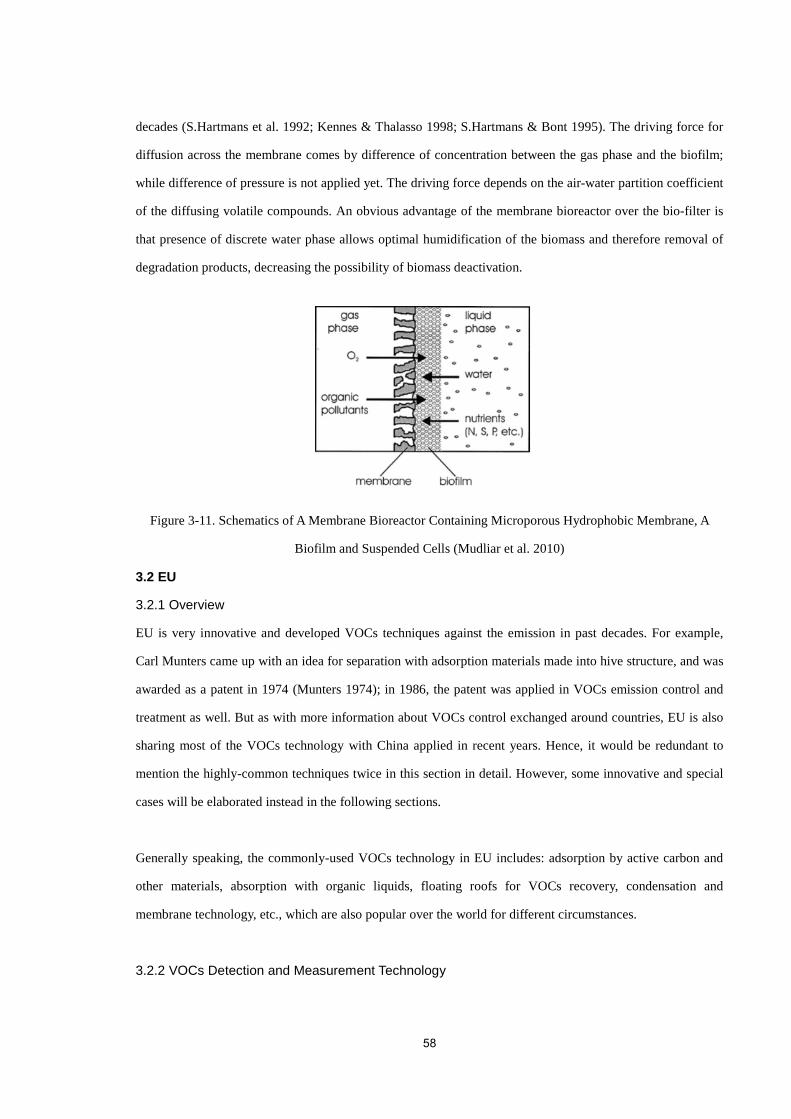
58
decades (S.Hartmans et al. 1992; Kennes & Thalasso 1998; S.Hartmans & Bont 1995). The driving force for
diffusion across the membrane comes by difference of concentration between the gas phase and the biofilm;
while difference of pressure is not applied yet. The driving force depends on the air-water partition coefficient
of the diffusing volatile compounds. An obvious advantage of the membrane bioreactor over the bio-filter is
that presence of discrete water phase allows optimal humidification of the biomass and therefore removal of
degradation products, decreasing the possibility of biomass deactivation.
Figure 3-11. Schematics of A Membrane Bioreactor Containing Microporous Hydrophobic Membrane, A
Biofilm and Suspended Cells (Mudliar et al. 2010)
3.2 EU
3.2.1 Overview
EU is very innovative and developed VOCs techniques against the emission in past decades. For example,
Carl Munters came up with an idea for separation with adsorption materials made into hive structure, and was
awarded as a patent in 1974 (Munters 1974); in 1986, the patent was applied in VOCs emission control and
treatment as well. But as with more information about VOCs control exchanged around countries, EU is also
sharing most of the VOCs technology with China applied in recent years. Hence, it would be redundant to
mention the highly-common techniques twice in this section in detail. However, some innovative and special
cases will be elaborated instead in the following sections.
Generally speaking, the commonly-used VOCs technology in EU includes: adsorption by active carbon and
other materials, absorption with organic liquids, floating roofs for VOCs recovery, condensation and
membrane technology, etc., which are also popular over the world for different circumstances.
3.2.2 VOCs Detection and Measurement Technology
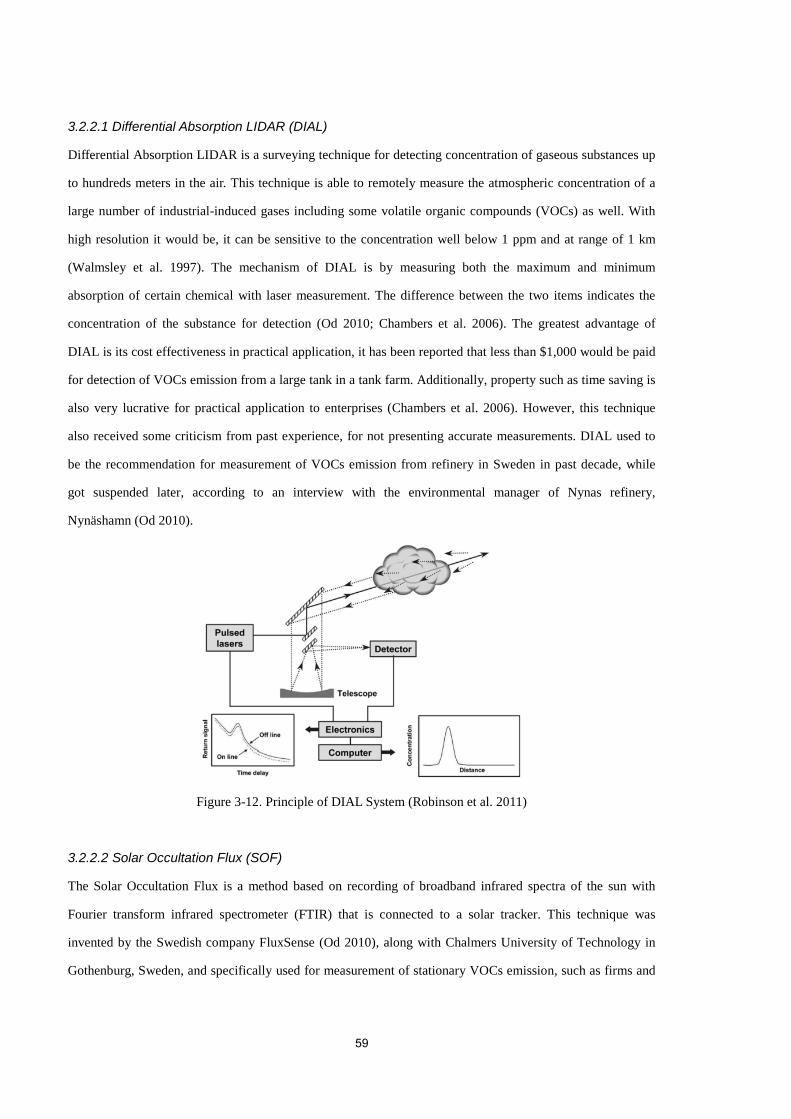
59
3.2.2.1 Differential Absorption LIDAR (DIAL)
Differential Absorption LIDAR is a surveying technique for detecting concentration of gaseous substances up
to hundreds meters in the air. This technique is able to remotely measure the atmospheric concentration of a
large number of industrial-induced gases including some volatile organic compounds (VOCs) as well. With
high resolution it would be, it can be sensitive to the concentration well below 1 ppm and at range of 1 km
(Walmsley et al. 1997). The mechanism of DIAL is by measuring both the maximum and minimum
absorption of certain chemical with laser measurement. The difference between the two items indicates the
concentration of the substance for detection (Od 2010; Chambers et al. 2006). The greatest advantage of
DIAL is its cost effectiveness in practical application, it has been reported that less than $1,000 would be paid
for detection of VOCs emission from a large tank in a tank farm. Additionally, property such as time saving is
also very lucrative for practical application to enterprises (Chambers et al. 2006). However, this technique
also received some criticism from past experience, for not presenting accurate measurements. DIAL used to
be the recommendation for measurement of VOCs emission from refinery in Sweden in past decade, while
got suspended later, according to an interview with the environmental manager of Nynas refinery,
Nynäshamn (Od 2010).
Figure 3-12. Principle of DIAL System (Robinson et al. 2011)
3.2.2.2 Solar Occultation Flux (SOF)
The Solar Occultation Flux is a method based on recording of broadband infrared spectra of the sun with
Fourier transform infrared spectrometer (FTIR) that is connected to a solar tracker. This technique was
invented by the Swedish company FluxSense (Od 2010), along with Chalmers University of Technology in
Gothenburg, Sweden, and specifically used for measurement of stationary VOCs emission, such as firms and
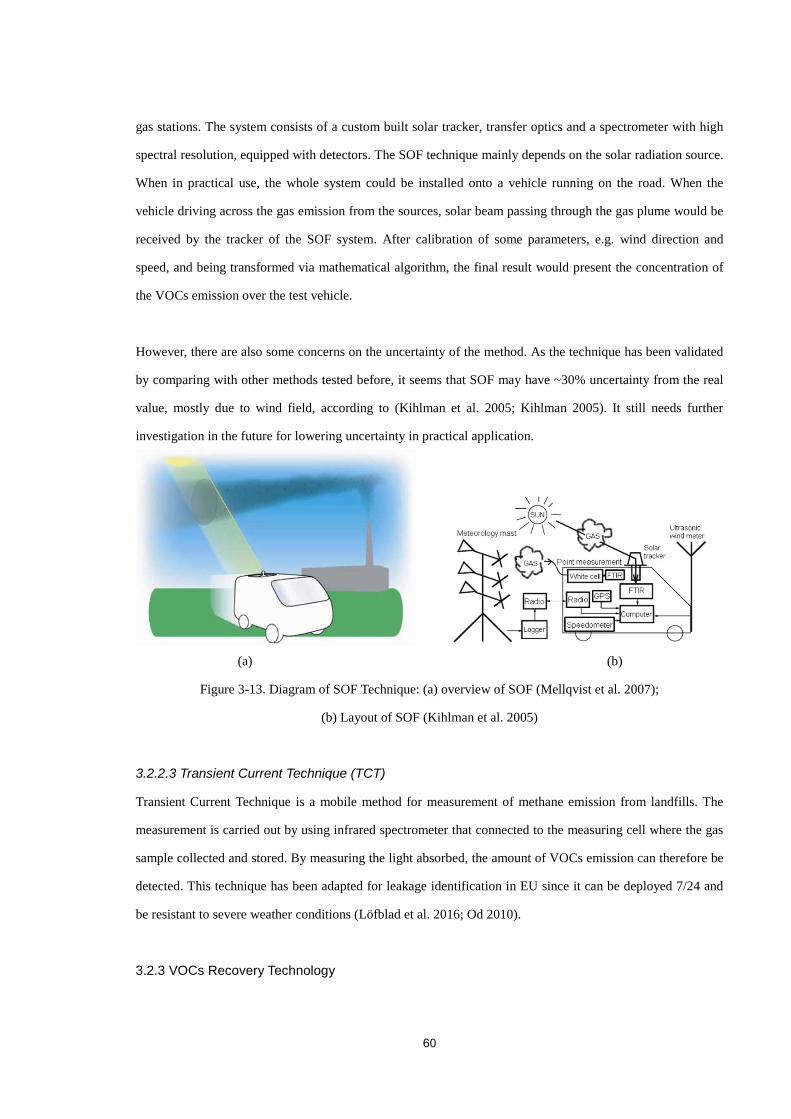
60
gas stations. The system consists of a custom built solar tracker, transfer optics and a spectrometer with high
spectral resolution, equipped with detectors. The SOF technique mainly depends on the solar radiation source.
When in practical use, the whole system could be installed onto a vehicle running on the road. When the
vehicle driving across the gas emission from the sources, solar beam passing through the gas plume would be
received by the tracker of the SOF system. After calibration of some parameters, e.g. wind direction and
speed, and being transformed via mathematical algorithm, the final result would present the concentration of
the VOCs emission over the test vehicle.
However, there are also some concerns on the uncertainty of the method. As the technique has been validated
by comparing with other methods tested before, it seems that SOF may have ~30% uncertainty from the real
value, mostly due to wind field, according to (Kihlman et al. 2005; Kihlman 2005). It still needs further
investigation in the future for lowering uncertainty in practical application.
(a) (b)
Figure 3-13. Diagram of SOF Technique: (a) overview of SOF (Mellqvist et al. 2007);
(b) Layout of SOF (Kihlman et al. 2005)
3.2.2.3 Transient Current Technique (TCT)
Transient Current Technique is a mobile method for measurement of methane emission from landfills. The
measurement is carried out by using infrared spectrometer that connected to the measuring cell where the gas
sample collected and stored. By measuring the light absorbed, the amount of VOCs emission can therefore be
detected. This technique has been adapted for leakage identification in EU since it can be deployed 7/24 and
be resistant to severe weather conditions (Löfblad et al. 2016; Od 2010).
3.2.3 VOCs Recovery Technology

61
3.2.3.1 Granular Activated Carbon Adsorption
Granular activated carbon is commonly used in Sweden for abatement and control of VOCs emission in
petrochemical industry over decades. It can be used for recovery of solvent vapour from mixture and for
fractionation of hydrocarbon gases. It has been reported that the general rule for granular activated carbon is
that the higher boiling point the activated carbon is, the stronger the adsorption capability of the activated
carbon would be for the gaseous materials (Gupta et al. 2011).
For this technique, the greatest advantage is that activated carbon provides greater specific surface area than
normal materials (~1500 m2/g). Besides, activated carbon is not specifically limited for polarized or
non-polarized gases for adsorption, in other words VOCs can be successfully treated along with e.g.
particulate matters (PM), which enhances the general performance of the adsorption. Activated carbon can
also be regenerated through inexpensive technology, e.g. back-washing, etc. However, activated carbon is
sensitive to humidity, which may greatly threaten the performance of activated carbon for adsorption as well.
Humidity of 65%-70% is recommended as a rule of thumb in practical operations in Sweden (Od 2010).
Some alternatives, for example, silica gel, zeolites, polymer adsorbents, etc., are also used after being tailored
for otherwise when activated carbon cannot be fully accessible. Even though all of the substitutions are not as
good operative performance as activated carbon, according to a comparison made by Od (2010).
3.2.3.2 Condensation
Condensation is the process of removal of VOCs by lowering temperature of the gas stream composed by
them. Condensation is also an option for treatment of VOCs emission in Sweden for years. The main principle
is that, as vapour pressure decreases with temperature, condensation is the process that can be sufficient for
cutting down VOCs emissions to meet the emission standards, especially for those compounds with high
boiling point and high enthalpy of vaporization (AIR PRODUCTS 2012). On the other hand, for those
compounds with lower boiling point, extremely low temperature should be required for condensation,
therefore it may cost a lot and not be a preferable choice for treatment.
Figure 3-14 presents the typical layout of condensation solely used in industry. The low temperature
condensator is the critically responsible facility for removal of VOCs emission to limitation. Additionally,
treatment of erratic flow of a chemical reactor, standby reactor for vessels and tanks are also included. Safety
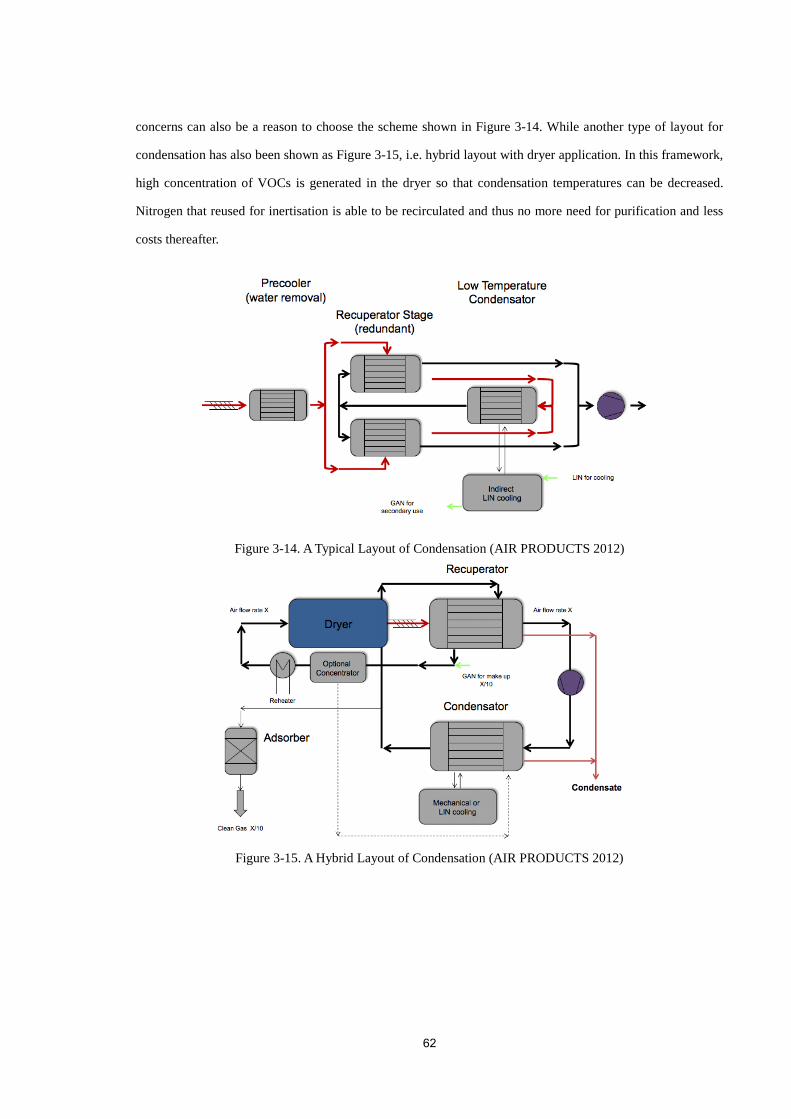
62
concerns can also be a reason to choose the scheme shown in Figure 3-14. While another type of layout for
condensation has also been shown as Figure 3-15, i.e. hybrid layout with dryer application. In this framework,
high concentration of VOCs is generated in the dryer so that condensation temperatures can be decreased.
Nitrogen that reused for inertisation is able to be recirculated and thus no more need for purification and less
costs thereafter.
Figure 3-14. A Typical Layout of Condensation (AIR PRODUCTS 2012)
Figure 3-15. A Hybrid Layout of Condensation (AIR PRODUCTS 2012)

63
4. Analysis of China’s VOCs Management System 4.1 Overview
As discussed by previous chapters, China’s VOCs management system has been built up and launched since
2007, when the first VOCs regulation on gasoline terminal was issued. Up to now, the system has been
running for a decade. It can be witnessed that some progress and remediation from practical experience in
daily management has been made. Some flaws and challenges, however, should still be addressed. In this
chapter, an analysis on China’s existing VOCs management system, in terms of government’s dilemma on
VOCs management, technology application, economic initiative and public participation, will be conducted as
insights and reviews on current running VOCs management system in China.
4.2 Government’s Dilemma on VOCs Management in China
4.2.1 “Organizer and Judge” Dilemma
As almost every regulation to curb VOCs emission in China was drafted and issued by MEP and no formal
legislation and laws were enacted, while was substituted by “administrative regulation” while does not have
legislative but administrative enforcement in practical issues. Therefore, MEP has played two roles in one, i.e.
organizer and judge in VOCs management. On the one hand, MEP creates and drafts several regulations on
VOCs control in the past decade; on the other hand, MEP also evaluates and monitors enterprises’ daily
operation. For those cannot meet the limitation issued by MEP, enterprises will also be charged for a great of
penalty with MEP’s administrative enforcement.
The “organizer and judge” dilemma indicates a common problem in China with respect to public management.
Chinese government has gone one mile too far than it should be: the government should favourably
implement administrative enforcement on enterprises’ illegal treatment and misbehaviours only, while a
committee designed by legislative body should be exclusively responsible to legislation enacting. In Chinese
context, the legislative body has been bypassed while the MEP takes both responsibilities.
This system is not fair to enterprises and easily leads to corruption of government, as well as ineffectiveness
of production. Due to overwhelming power the authority is, the enterprises have been completely falling into
a negative role without any countermeasures towards authority’s potentially unreasonable requirements.
Therefore, from a long-time respective, the enterprises would have to cost a great deal, no matter monetary or
non-monetary, on any adjustment of administrative regulations without negotiation and compromise with the
64
government. The environment for business in China would hence worsen as well.
4.2.2 “Rat and Vase” Dilemma
There is an idiom called “To throw a stone at a rat, but afraid to break the vase” in China, indicating a
dilemma that one cannot eliminate the rat with its full capability. However, as to Chinese VOCs management,
the authority also confronts such dilemma in many cases. Even though local enterprises and firms are the
main sources of VOCs emission, these companies are also major tax payers, which supports the financial
income of local government and local economy as well. Hence, it seems that the government cannot shut
down all local enterprises with great VOCs emission according to its strictest criteria, regardless the tax
income and local GDP development. The “rat and vase” dilemma indicates the ambiguity and embarrassment
of the local authority on these factories and companies with heavy pollution in current context of China, and it
can by no means be solved within existing framework in which contradiction between “local government and
central government” and “tax income and environmental protection” can be hardly mediated.
Since 2015, the more and more serious environmental problems in China had grabbed the attention of public.
The central government of China thereby attempts to break up the current interest chain in local areas with
enforced administrative measures. Such means, unfortunately, must be paid back at the cost of local financial
income and rise of local unemployment rate. “Catching the rat while not breaking the vases” looks to be
impossible by now, but the pains on economic transferring must be suffered.
4.2.3 “Wealth and Health” Dilemma
As the “rate and vase” dilemma indicated, there is conflict between cutting down VOCs emission and
damaging local economy. Ultimately, it reflects the ultimate difference between two mindsets in model
China’s context, i.e. is it the top priority to be wealthy for Chinese people without any consideration of any
other elements in society, or curb and limit the economic development for the protection of environment and
other resources as used to be?
It could be witnessed that many industrialized countries, such as the US, UK, Japan, etc. were also suffered
from past ignorance of pollution. The only question for China is, whether to follow or create a new path for its
development instead? Apparently, China chose the former one, which leads to great spreading of factories
with large volumes of VOCs emitted into atmosphere per year. But as a “reward”, China’s unemployment rate

65
was often kept quite low (3.95%5) (TRADING ECONOMICS 2017b) and therefore citizens’ disposable
income per capita (7.8% in 2016) increased faster than average of the world (TRADING ECONOMICS
2017a).
On the other hand, it is worth mentioned that the costing of environmental remediation on current
environment issues in China might be way more expensive than if not. It was reported that the total expense
for VOCs treatment might cost more than 10 billion CNY (LIU WEI 2015), which indicates the high cost of
treatment would be in the near future. All in all, by following the way with “wealth first”, China has to pay
what she owed with more; while the “wealth and health” dilemma could still thwart other countries like China,
if they fail to learn from its experience treated with surrounding environment again.
4.3 Technology Application
With recent development of testing and monitoring technology in China, as well as official momentum on
source and process control in the last years, many Chinese factories and enterprises (mainly large-scale and
state-owned) have installed well-designed monitoring devices and treatment apparatuses, therefore the gap
between China and other developed countries has been narrowed a lot. However, a number of private-owned
and middle/small-scale enterprises are still unable to afford installation of monitoring devices and operation in
practice. Besides, stationary devices prevailed but mobilized ones are needed to be developed as well.
It was officially reported that the middle/small-scale enterprises accounted for more than 90% in 2015
(NATIONAL STATISTICS BUREAU 2016). For most private owned and small-scale enterprises the
operation costs for VOCs emission control is quite expensive. According to the interviews with some local
enterprises, it has been revealed that the operation costs account for 15%-20% of total, millions of CNY per
year, therefore in realistic operation, these monitoring and treatment apparatuses are running sporadically,
usually aimed for inspection from local environmental protection authority only. The major barriers for
expensive monitoring and control consist of high operation expense on daily treatment, maintenance and
human resource, etc. Among all factors, maintenance could be the dominant contributor for today’s issue, as
each regular check & maintenance could cost a lot due to update of components and loss from shut down &
5 2017 Q2
66
restart.
Stationary devices for VOCs monitoring are popular in China’s petrochemical industry, as it can significantly
reduce the cost for conventionally manual detection in the past, in place with digital monitors and trackers
installed inside or appended upon the surface of pipelines and storages. However, stationary devices also
suffer from some disadvantages, such as specialized for certain chemicals and position, vulnerable to be
cheated by external forces, difficult for maintenance under certain circumstances, etc. Instead, mobilized
devices could overcome such problems with lighter and cheaper property. But it should be mentioned that
precision is the greatest disadvantage for mobilized device, which is normally applied by vehicle or technique
such as Global Information System (GIS). Hence, mobilized devices can be equipped for inspection and
rough detection, as well as some cases where stationary devices are not available.
4.4 Economic Initiative
In 2015, the VOCs emission fee proposed by MOF and MEP was a breakthrough for recent VOCs emission
management in China. It brought economic measures into realistic management of VOCs emission for the
first time. As the Figure 4-1 shows that several provinces have come up with the emission fee for each,
ranging from 0.6 to 40 CNY/ unit. It could be noticed that the municipalities are setting stricter regulations
and higher VOCs emission charge fee for local enterprises than those provinces with less development. As
local enterprises may be charged for more in municipalities, some have been shutting down while others
transferring to other provinces with lower requirement for VOCs emission and economic restrictions. Hence,
surrounding environment in municipalities could be estimated to be remediated and healthier for living.
However, if the enterprises relocated to other provinces were unable/unwilling to improve and equip VOCs
monitors and treatment facilities at new location, concerns on further contamination would be made, either.
Although China’s central government has been pushing more pressure on local authorities in terms of
environmental problems, including VOCs emission from industry, it may not be so optimistic to the
speculated situation in the future, due to severe corruption observed in some areas.
The emission fee applied in China can be ultimately considered as a type of tax on both producers and
customers. According to the economics principle, the additional costs will be partially transferred to and
digested by customers. Also some deadweight loss, which does not have any utility on anybody, will be
introduced (Figure 4-1). More details and analysis about the economics principle would not be interpreted
further in this paper, but it is certain that the downstream industries and products will be affected by such

67
policy, although that should be necessary and inevitable for better living.
Figure 4-1. Taxation on Supply-Demand Relationship
4.5 Public Participation and Awareness
Public participation can be defined as the degree of engagement of normal people. Generally, residents are
victims by environmental pollution, including discharge of wastewater with heavy metals, serious noise,
odorous gases emitted from factories and plants, etc. However, as to the cases of VOCs emission, there has
little to do by local residents in China yet. As for most people VOCs emission cannot be easily felt and
observed from daily life, since most of which emitted invisibly and untouchably; VOCs emission has adverse
impact on environment and health, but through indirect reaction on macro-scope influence, i.e. smog and haze,
which will destroy respiratory system of human beings seriously. On the other hand, China’s society has to be
kept “harmonious”, according to the thought from central government and the communist party which is in
charge of the power, some uproars and rivals against current situation of VOCs emission would be interpreted
as to the hierarchical system itself. Pressures derived from “harmonious society” are then converted into
stronger enforcement, which muted and swept off the controversial thoughts. As to VOCs emission coming
from vehicles, public has little to do as well. The two state-owned petroleum groups in China should be to
blame as fuels with inferior quality provided to domestic vehicles. As private capitals are not permitted to
enter the fossil fuel market, the two oligarchy corporations have few self-motivations to improve the quality
of fuels, which seriously exacerbate the status quo of VOCs emission in China. In other words, public
participation in control of outdoor VOCs emission is now still facing great pressure and difficulty from
external factors.

68
Another large contribution source of VOCs emission from people’s living, namely paintings, wallpapers and
other decorations, however, is usually overlooked by public. The awareness of public on indoor VOCs
emission should be improved in China by exposure of relevant information and propaganda, etc., therefore the
concerns on VOCs-related environmental pollution will grow as well. In current China’s context, fortunately,
healthier life with “greener” building and decoration is being discovered and pursued by more people. A
major contribution of VOCs emission from indoor decorations therefore will be reduced in the near future.
69
5. Recommendation of VOCs Management for China 5.1 Management Strategy
As being the largest emission contributor in the world by so far, China is improving its standards for VOCs
emission over the country in latest decade. However, inspired by European countries on their VOCs
management strategy, China is still able to introduce and digest the strategy and model of past experience
even more. Even though China has applied some measures such as enacting more serious legislations,
improving standards about VOCs emission and charging fees on VOCs emission from enterprises, etc. more
comprehensive management and control system should be pursued, for example:
1). China should start labelling and classifying chemicals which may be involved in VOCs emission during
industrial processes. Germany and French have already taken methods to set up criteria for VOCs
management. On the one hand, labelling and classification can explicitly identify solvents that should not be
used any more in the industrial processes against emission; on the other hand, such measure does not require
much extra efforts and costs on technical measurement. By labelling and classifying chemicals which are with
great volatility, the authorities will be managing VOCs emission with lower budget and clearer logistics for
residents.
2). According to the statistics about China’s VOCs emission sources and their apportionment (Figure 1-3),
solvent utilization has been the dominant source of VOCs emission in China. Therefore, it would be critical to
cut down use of solvent with high volatility and substitute with others with less volatility instead. For instance,
ionic liquids could be an alternative option for conventional solvents in use in industrial processes, since ionic
liquids have witnessed a lot of outstanding characteristics as solvent, e.g. low vapour pressure, low
combustibility, thermally stable, favourable solving properties, etc. (Kubisa 2004) More attention should be
paid on replacement of original solvent used in industrial processes, the government should also promote
introduction of new chemicals proactively. Subsidies on such new alternatives can be applied as well.
3). It could be estimated that a great volume of VOCs emission leaking from valves, connectors and tanks, etc.
(U.S. EPA 2015) Leakage detection criteria thereby should be drafted and followed for each enterprise and
company. Hence, local authority and government are responsible to help build up and monitor leakage
management system for every firm related to solvent utilization in industrial processes. As it may differ for
various industries in terms of application of chemicals and solvents during production, a flexible VOCs
detection system should be set up, with respect to limitation of emissions and types of pollutant. A regular
inspection by experts and technicians, who are summoned by local author, over all related companies is also
required, in case of cheating and disarrangement in practical operation.
70
4). The enterprises that newly came into VOCs-emitted industries should be required to equip comprehensive
apparatus for VOCs emission recovery and storage before formal operation. For those in operation without
meeting the criteria of VOCs emissions, development of apparatus should be asked by local monitoring
authority. If failed, the whole operation should be halted and the enterprise should be seriously charged as
penalty.
5). Some innovative technology from abroad could be introduced and pre-paid by authority. Therefore, local
small-scale enterprises are also able to equip apparatus with relatively lower cost.
6). Technicians who are responsible for VOCs emission control could be trained and assigned by local
authority for enterprises. This position could be designed as stand-alone and independent for operation and
monitoring during usual production, for precaution of internal corruption. Technicians should be able to treat
normal conditions of VOCs emission from production, as well as detect abnormal situation whereby the
enterprises manager and local authority should be notified in time.
7). For those understaff communities, digital measurement and monitoring sensors can be installed. The
greatest advantage of digital monitoring is that sensors are able to running nearly 24/7 with high precision and
stability. However, not only the outlet of whole production should be monitored, but some easy-for-leak spots
should also be taken into consideration. Fraud treatment on sensors should be especially aware.
5.2 Technology Application
1). Mobilized and portable technology for measurement and monitoring could be developed for local
authorities. If such technology, such as SOF, could be developed to be more accurate from the real value,
some fraud treatment on digital sensors and normal inspection can therefore be deterred. In addition,
mobilized technology significantly reduces the executive cost of detection and monitoring in most cases.
2). Recovery technology with higher efficiency should be paid more attention on, especially on transportation
and storage stages where VOCs emit/leaks significantly from pipes and tanks.
3). Drones with camera could be also used in certain situation untouchable for human beings, to supplement
inspection and measurement on suspicious enterprises in terms of VOCs emission data collection and
detection.
71
6. Conclusion In this paper, existing VOCs management system of China and European countries have been explored. As
China is suffering from its undeveloped VOCs emission management system for past decades, it is also worth
being discussed that what China’s authority should do in the future to curb VOCs emission in China in
inspired from European countries. Hence, this work bases on both review of China’s existing system for
VOCs management system, including policy-making, regulation and technology applied in industry, and the
potential direction for development of China.
Some analysis on current problems from four aspects: governance dilemmas in China’s context, technology
advancement, economic initiative and public participation has been involved. While this analysis is based on a
general image of China’s management system on VOCs emission, it should be aware that there would be
great difference between industrialized regions (e.g. the four municipalities) and other less-developed areas, in
which not only discharge limitation of VOCs emission, but also the will and confidence on eliminating VOCs
pollution in the regions. Due to such marvelous gap in China, it will always be abstract and arbitrary to
consider the VOCs management system conducted in every region as the uniform regulation, in terms of
emission limitation, inspection guidance and technology application. Instead, some concerns should be paid
on the problems occurred case by case, and it would be the aim of future studies.
Finally, some recommendation on both policy-making & regulation and technology application based on the
author’s personal view and thoughts have been suggested. Some highlights include: labelling and
classification system on VOCs emission-involved chemicals should be built up for more awareness of public;
stricter limitation on indoor VOCs emission from decoration materials should be adopted for residents’ health;
some exotic technology which are introduced form EU or other countries could be (partially) covered by
government as a subsidy to alleviate the burden of local enterprises on environmental protection; mobilized
and portable testing equipment could be improved and applied for monitoring and inspection conducted by
local authorities, especially for those regions understaffed; recovery and reuse of VOCs emission from some
key connectors and valves in production process should be improved even further.

72
References ACEA; AUTO Alliance; AMA; JAMA, 2013. Worldwide Fuel Charter 5th Edition,
Adgate, J.L. et al., 2004. Outdoor, indoor, and personal exposure to VOCs in children. Environmental Health
Perspectives, 112(14), pp.1386–1392.
AIR PRODUCTS, 2012. Condensation of volatile organic compounds ( VOCs ).
Alex Guenther, 2017. MEGAN Model. Available at: http://lar.wsu.edu/megan/ [Accessed June 19, 2017].
An, J. et al., 2014. Characteristics and source apportionment of VOCs measured in an industrial area of
Nanjing, Yangtze River Delta, China. Atmospheric Environment, 97, pp.206–214. Available at:
http://dx.doi.org/10.1016/j.atmosenv.2014.08.021.
ANSES, 2016. Emissions of volatile organic compounds (VOCs) by building and decoration products | Anses
- Agence nationale de sécurité sanitaire de l’alimentation, de l’environnement et du travail. Available at:
https://www.anses.fr/en/content/emissions-volatile-organic-compounds-vocs-building-and-decoration-p
roducts [Accessed August 7, 2017].
Baek, S.O. & Jenkins, R.A., 2004. Characterization of trace organic compounds associated with aged and
diluted sidestream tobacco smoke in a controlled atmosphere - Volatile organic compounds and
polycyclic aromatic hydrocarbons. Atmospheric Environment, 38(38), pp.6583–6599.
Baudic, A. et al., 2016. Seasonal variability and source apportionment of volatile organic compounds (VOCs)
in the Paris megacity (France). Atmospheric Chemistry and Physics, 16(18), pp.11961–11989.
Beijing EPB, 2015. Detail regulation of collection of VOCs discharge fees in Beijing (Chinese).
Bellis, L.D.E., 1998. Material Emission Rates Literature Review , and the Impact of Indoor Air Temperature
and Relative Humidity. , 33(5), pp.261–277.
Borbon, A. et al., 2013. Emission ratios of anthropogenic volatile organic compounds in northern mid-latitude
megacities: Observations versus emission inventories in Los Angeles and Paris. Journal of Geophysical
Research Atmospheres, 118(4), pp.2041–2057.
Brown, S.K., 1999. Chamber assessment of formaldehyde and VOC emissions from wood-based panels.
Indoor air, 9(3), pp.209–15. Available at: http://www.ncbi.nlm.nih.gov/pubmed/10439559.
Brown, S.K. et al., 1994. Concentrations of volatile organic compounds in indoor air–a review. Indoor Air,
4(2), pp.123–134.
Chambers, A.K. et al., 2006. DIAL Measurements of Fugitive Emissions from Natural Gas Plants and the
Comparison with Emission Factor Estimates. In 15th Annual Emission Inventory Conference. pp. 15–18.
Cheng, W.H., Hsu, S.K. & Chou, M.S., 2008. Volatile organic compound emissions from wastewater

73
treatment plants in Taiwan: Legal regulations and costs of control. Journal of Environmental
Management, 88(4), pp.1485–1494.
Chin, J.Y. & Batterman, S.A., 2012. VOC composition of current motor vehicle fuels and vapors, and
collinearity analyses for receptor modeling. Chemosphere, 86(9), pp.951–958. Available at:
http://dx.doi.org/10.1016/j.chemosphere.2011.11.017.
Delia, A., 2014. Outdoor VOCs. , (May), p.5088.
DIBt, 2017. Anforderungen an bauliche Anlagen bezüglich des Gesundheitsschutzes ( ABG ),
Diez, U. et al., 2000. Effects of indoor painting and smoking on airway symptoms in atopy risk children in the
first year of life results of the LARS-study. International Journal of Hygiene and Environmental Health,
203(1), pp.23–28. Available at: http://www.sciencedirect.com/science/article/pii/S1438463904700048.
Dumanoglu, Y. et al., 2014. Spatial and seasonal variation and source apportionment of volatile organic
compounds (VOCs) in a heavily industrialized region. Atmospheric Environment, 98(December),
pp.168–178. Available at: http://dx.doi.org/10.1016/j.atmosenv.2014.08.048.
Dyer, M., 2007. Characterisation of volatile organic compounds emission from grassland systems. ETH.
Easter, C. et al., 2005. Odor and air emissions control using biotechnology for both collection and wastewater
treatment systems. Chemical Engineering Journal, 113(2–3), pp.93–104.
ECO INSTITUT, 2016. AgBB scheme - Committee for Health-related evaluation of Building Products.
Available at:
http://www.eco-institut.de/en/certifications-services/national-marks-of-conformity/agbb-scheme/
[Accessed August 1, 2017].
EEA, 2015. Non-methane volatile organic compounds (NMVOC) emissions — European Environment
Agency. Available at:
https://www.eea.europa.eu/data-and-maps/indicators/eea-32-non-methane-volatile-1/assessment-4/#key
-messages [Accessed July 21, 2017].
Environment and Climate Change Canada, 2017. Volatile Organic Compounds in Consumer and Commercial
Products. Available at: http://www.ec.gc.ca/cov-voc/ [Accessed June 5, 2017].
EPA, 1992. Chapter 159: CONTROL OF VOLATILE ORGANIC COMPOUNDS FROM ADHESIVES AND
SEALANTS,
EPA, 2017a. Technical Overview of Volatile Organic Compounds. Available at:
https://www.epa.gov/indoor-air-quality-iaq/technical-overview-volatile-organic-compounds [Accessed
May 2, 2017].
74
EPA, 2017b. Volatile Organic Compounds’ Impact on Indoor Air Quality. Available at:
https://www.epa.gov/indoor-air-quality-iaq/volatile-organic-compounds-impact-indoor-air-quality
[Accessed April 27, 2017].
EPD Hong Kong, 2017. Volatile Organic Compounds and Smog | Environmental Protection Department.
Available at: http://www.epd.gov.hk/epd/english/environmentinhk/air/prob_solutions/vocs_smog.html
[Accessed June 4, 2017].
EU, 2016. EUROPA - Regulations, Directives and other acts. Available at:
https://europa.eu/european-union/eu-law/legal-acts_en#recommendations [Accessed July 22, 2017].
EUROFINS, 2017. CPR-CE Mark - Eurofins Scientific. Available at:
http://www.eurofins.com/consumer-product-testing/information/compliance-with-law/european-directiv
es-and-laws/construction-products/ce-marking-for-construction-products/ [Accessed August 1, 2017].
EUROFINS, 2012. VOC regulations in France. , pp.1–2.
European Council, 1985. COUNCIL DIRECTIVE 85/203/EEC. Official Journal of the European
Communities, (L), pp.1–7.
European Parliament and of the Council, 1994. DIRECTIVE 94/63/EC. official journal of the European
Communities, pp.24–33.
European Union Joint Research Centre, 2013. Urban Air, Indoor Environment and Human Exposure:
Harmonisation framework for health based evaluation of indoor emissions from construction products in
the European Union using the EU-LCI concept,
Farrow, A. et al., 2003. Symptoms of mothers and infants related to total volatile organic compounds in
household products. Archives of environmental health, 58(10), pp.633–641.
Ferrero, A. et al., 2017. Infants’ indoor and outdoor residential exposure to benzene and respiratory health in a
Spanish cohort. Environmental Pollution, 222, pp.486–494. Available at:
http://www.sciencedirect.com/science/article/pii/S026974911631733X [Accessed June 5, 2017].
Field, M., 1988. Distribution of volatile organic chemicals i n outdoor and indoor air. Environmental Science
and Technology, 22(12), pp.1381–1388.
Goldstein, A.H. & Galbally, I.E., 2007. Known and unexplored organic constituents in the earth’s atmosphere.
Environmental Science and Technology, 41(5), pp.1514–1521.
Groenestijn Johan W. & Hesselink Paul, 1993. Biotechniques for air pollution control Existing biotechniques.
Biodegradation, 4, pp.283–301.
Guenther, A., Hewitt, C. & Erickson, D., 1995. A global model of natural volatile organic compound

75
emissions. Journal of geophysical …, 100(94), pp.8873–8892. Available at:
http://www.agu.org/pubs/crossref/1995/94JD02950.shtml.
Guenther, A.B. et al., 2012. The model of emissions of gases and aerosols from nature version 2.1
(MEGAN2.1): An extended and updated framework for modeling biogenic emissions. Geoscientific
Model Development, 5(6), pp.1471–1492.
Guo, H. et al., 2004. Source contributions to ambient VOCs and CO at a rural site in eastern China.
Atmospheric Environment, 38(27), pp.4551–4560.
Gupta, K.N., Rao, N.J. & Agarwal, G.K., 2011. Adsorption of Toluene on Granular Activated Carbon.
International Journal of Chemical Engineering and Applications, 2(5), pp.3–6.
Guteng Env., 2016. Analysis of VOCs emission control technology (Chinese). Available at:
http://news.inggreen.com/15217.html [Accessed July 16, 2017].
Harley, P. et al., 1998. Emission of 2-methyl-3-buten-2-ol by pines: A potentially large natural source of
reactive carbon to the atmosphere. Journal of Geophysical Research, 103(D19), p.25479.
Holcomb, L.C. & Seabrook, B.S., 1995. Review : Indoor Concentrations of Volatile Organic Compounds:
Implications for Comfort, Health and Regulation. Indoor and Built Environment, 4(1), pp.7–26.
Available at: http://ibe.sagepub.com/cgi/doi/10.1177/1420326X9500400103.
Huang, C. et al., 2011. Emission inventory of anthropogenic air pollutants and VOC species in the Yangtze
River Delta region, China. Atmospheric Chemistry and Physics, 11(9), pp.4105–4120.
Huang, Y. et al., 2016. Removal of indoor volatile organic compounds via photocatalytic oxidation: A short
review and prospect. Molecules, 21(1).
IMO, 1992. STANDARDS FOR VAPOUR EMISSION CONTROL SYSTEMS,
Kennes, C. & Thalasso, F., 1998. Review Waste Gas Biotreatment Technolog y. Journal of Chemical
Technology and Biotechnology, 72(4), pp.303–319.
Kihlman, M., 2005. Application of solar FTIR spectroscopy for quantifying gas emissions. Chalmers
University of Technology.
Kihlman, M. et al., 2005. Monitoring of VOC emissions from refineries in Sweden using the Solar
Occultation Flux method. manuscript.
Kubisa, P., 2004. Application of ionic liquids as solvents for polymerization processes. Progress in Polymer
Science (Oxford), 29(1), pp.3–12.
Lebrero, R. et al., 2011. Odor Assessment and Management in Wastewater Treatment Plants: A Review.
Critical Reviews in Environmental Science and Technology, 41(10), pp.915–950. Available at:
76
http://www.tandfonline.com/doi/abs/10.1080/10643380903300000.
Liang, W., Li, J. & He, H., 2012. Photo-Catalytic Degradation of Volatile Organic Compounds ( VOCs ) over
Titanium Dioxide Thin Film. Advanced Aspects of Spectroscopy, p.341.
Lin, L. et al., 2013. Photocatalytic oxidation for degradation of VOCs. Open Journal of Inorganic Chemistry,
3(January), pp.14–25.
Liu, B. et al., 2016. Characterization and source apportionment of volatile organic compounds based on
1-year of observational data in Tianjin, China. Environmental Pollution, 218(x), pp.757–769. Available
at: http://dx.doi.org/10.1016/j.envpol.2016.07.072.
Liu, Y. et al., 2008. Source profiles of volatile organic compounds (VOCs) measured in China: Part I.
Atmospheric Environment, 42(25), pp.6247–6260.
LIU WEI, 2015. Industry report on VOCs control and management (Chinese), Available at:
http://www.szvc.com.cn/upload/20160401/20160401161232157.pdf [Accessed August 19, 2017].
Löfblad, E. et al., 2016. Miljökonsekvensbeskrivning för utökad verksamhet vid Preemraff Lysekil, Available at:
https://preem.se/globalassets/om-preem/om-oss/vad-vi-gor/raffinaderier/preemraff-lysekil/d00_mkb.pdf
.
Logan, B. a. & Monson, R.K., 1999. Thermotolerance of Leaf Discs from Four Isoprene-Emitting Species Is
Not Enhanced by Exposure to Exogenous Isoprene1. Plant physiology, 120(July), pp.821–826.
Mellqvist, J. et al., 2007. Measurements of industrial emissions of VOCs , NH3 , NO2 and SO2 in Texas using
the Solar Occultation Flux method and mobile DOAS and mobile DOAS, Available at:
http://www.fluxsense.se/wp-content/uploads/ftp-uploads/pdf/paper 2 final lic.pdf.
Mendell, M.J., 2007. Indoor residential chemical emissions as risk factors for respiratory and allergic effects
in children: A review. Indoor Air, 17(4), pp.259–277.
MEP, 2014. Fugitive emission standard of volatile organic compounds,
MEP, etc., 2010. Guiding Opinions on Promoting Joint Prevention & Joint Control Work on Air
Pollution and Improving Regional Air Quality (Chinese). Available at:
http://zfs.mep.gov.cn/fg/gwyw/201005/t20100514_189497.htm [Accessed June 28, 2017].
Mudliar, S. et al., 2010. Bioreactors for treatment of VOCs and odours - A review. Journal of Environmental
Management, 91(5), pp.1039–1054. Available at: http://dx.doi.org/10.1016/j.jenvman.2010.01.006.
Munters, C., 1974. Liquid and gas contact apparatus.
Namkung, E. & Rittmann, B.E., 1987. Estimating Volatile Organic Compound Emissions from Publicly
Owned Treatment Works. Journal (Water Pollution Control Federation), 59(7), pp.670–678. Available
77
at: http://www.jstor.org/stable/25043321.
NATIONAL STATISTICS BUREAU, 2016. 2015 年 中 小 企 业 运 行 情 况 报 告 . Available at:
http://www.lwzb.cn/pub/gjtjlwzb/sjyfx/201605/t20160525_2796.html [Accessed August 20, 2017].
NIHON DEMPA KOGYO CO., L., 2017. NDK - NIHON DEMPA KOGYO CO., LTD. Available at:
http://www.ndk.com/en/sensor/ultrasonic/aboutl.html [Accessed July 14, 2017].
Od, H., 2010. Treatment Technology for VOC Emissions from Oil Refineries. KTH, Royal Institute of
Technology.
OECD.Stat, 2015. Emissions of air pollutants. Available at:
https://stats.oecd.org/Index.aspx?DataSetCode=AIR_EMISSIONS# [Accessed July 21, 2017].
Passavant, G.W., 2015. Gasoline Vapor Pressure & US RVP Control Purpose & Overview. , (August).
Available at:
http://www.cemda.org.mx/wp-content/uploads/2015/08/MWV.-Glenn-Passavant-11agosto15.pdf.
Patel Technomation, Flange manufacturing | Patel Technomation Pvt. Ltd. Available at:
http://www.pateltech.de/flange-manufacturing/ [Accessed July 11, 2017].
Penney, D. et al., 2010. WHO Guidelines for indoor air quality,
PETROL PLAZA, 2000. Venting Aboveground Tanks: Part 1 - Tank Types and the API Standards -
PetrolPlaza - Technology corner. Available at:
http://www.petrolplaza.com/technology/articles/MiZlbiYxMDQ1NiYmMSYxJjEyNSY%3D [Accessed
August 29, 2017].
Robinson, R. et al., 2011. Infrared differential absorption Lidar ( DIAL ) measurements of hydrocarbon
emissions. Journal of Environmental Monitoring, 13, pp.2213–2220.
S.Hartmans & Bont, J.A.M. de, 1995. Membrane bioreactor for waste gas treatment,
S.Hartmans, Leenen, E.J.T.M. & Voskuilen, G.T.., 1992. Membrane bioreactor with porous hydrophobic
membranes for waste-gas treatment. Biotechniques for Air Pollution Abatement and Odour Control
Policies, 35(7), pp.103–106.
Salthammer, T., 1997. Emission of Volatile Organic Compounds from Furniture Coatings. Indoor Air, 7,
pp.189–197. Available at: http://doi.wiley.com/10.1111/j.1600-0668.1997.t01-1-00004.x.
Sarkhosh, M. et al., 2013. Source apportionment of volatile organic compounds in Tehran, Iran. Bulletin of
Environmental Contamination and Toxicology, 90(4), pp.440–445.
Sathivel, S. et al., 2008. Determination of melting points, specific heat capacity and enthalpy of catfish
visceral oil during the purification process. JAOCS, Journal of the American Oil Chemists’ Society,

78
85(3), pp.291–296.
Senpai Machinery Co., L., China Gas-Collecting Hood/Splash Guard Cover for Vapor Recovery Nozzle
Photos & Pictures - Made-in-china.com. Available at:
http://zjspjx.en.made-in-china.com/productimage/hsMxrfiPIEcJ-2f1j00bwoaMSPlLuqK/China-Gas-Col
lecting-Hood-Splash-Guard-Cover-for-Vapor-Recovery-Nozzle.html [Accessed July 11, 2017].
Shanghai EPB, Guidance for VOCs emission estimation from petroleum industry in Shanghai, Available at:
http://www.sepb.gov.cn/seicm/editor/filemanager/file/PRC_059/上海市石化行业VOCS排放量计算方
法(试行).pdf [Accessed July 12, 2017].
Shanghai EPB, 2015. Trial of collection of VOC discharge fees in Shanghai (Chinese). Available at:
http://www.sepb.gov.cn/fa/cms/shhj/shhj2272/shhj2159/2015/12/91163.htm [Accessed June 29, 2017].
Sharkey, T.D. & Singsaas, E.L., 1995. Why plants emit isoprene. Nature, 374(6525), pp.769–769.
Sharkey, T.D., Wiberley, A.E. & Donohue, A.R., 2008. Isoprene emission from plants: Why and how. Annals
of Botany, 101(1), pp.5–18.
Shen, T.T., Fellow, A. & Sewell, G.H., 1988. Control of VOC Emissions from Waste Management Facilities.
Journal of environmental engineering, 114(6), pp.1392–1400.
Statistics Sweden, 2017. Statistical database. Available at:
http://www.statistikdatabasen.scb.se/pxweb/en/ssd/START__MI__MI0108/?rxid=86abd797-7854-4564
-9150-c9b06ae3ab07 [Accessed August 7, 2017].
Swedish Chemical Agency, 1998. Kemikalieinspektionens föreskrifter (KIFS 1998:8) om kemiska produkter
och biotekniska organismer,
Swedish Chemical Agency, 2017. Our work. Available at: http://www.kemi.se/en/about-us/our-work
[Accessed July 23, 2017].
Tavakoli, A. & Baktash, M., 2012. Numerical Analysis for Effect of Envelop Color of Oil Tank Storage with
Floating Roof. , 2(5), pp.3773–3783.
The Council of the European Union, 1999. DIRECTIVE 1999/13/EC. official Journal of the European
Committee, (6), p.L85/1-L85/22. Available at:
http://eur-lex.europa.eu/LexUriServ/site/en/oj/1999/l_085/l_08519990329en00010022.pdf.
The European Parliament and the Council of the European Union, 2004. Directive 2004/42/CE of the
European Parliament and of the Council of 21 April 2004 on the limitation of emissions of volatile
organic compounds due to the use of organic solvents in certain paints and varnishes and vehicle
refinishing products and amendi. Official Journal of the European Unio, (L 143), pp.87–96. Available at:
79
http://eur-lex.europa.eu/LexUriServ/LexUriServ.do?uri=CELEX:32004L0042:EN:NOT.
The Government Offices of Sweden, 2015a. Swedish legislation - how laws are made.
The Government Offices of Sweden, 2015b. The Swedish Environmental Code. Available at:
http://www.government.se/legal-documents/2000/08/ds-200061/ [Accessed July 24, 2017].
TICO, Internal Floating Roof Tank. Available at:
http://www.ansonindustry.com/resources/internal-floating-roof-tank.html [Accessed August 29, 2017].
TRADING ECONOMICS, 2017a. China Disposable Income per Capita | 1978-2017 | Data | Chart | Calendar.
Available at: https://tradingeconomics.com/china/disposable-personal-income [Accessed August 18,
2017].
TRADING ECONOMICS, 2017b. China Unemployment Rate | 2002-2017 | Data | Chart | Calendar | Forecast.
Available at: https://tradingeconomics.com/china/unemployment-rate [Accessed August 18, 2017].
tuincentrum holland, Sealing lid 254mm | Gardencentre Holland. Available at:
http://tuincentrumholland.com/en/sealing-cap/10748-sealing-lid-254mm.html [Accessed July 11, 2017].
U.S. EPA, 2015. Emission Estimation Protocol for Petroleum Refineries,
Uhde, E. & Salthammer, T., 2007. Impact of reaction products from building materials and furnishings on
indoor air quality-A review of recent advances in indoor chemistry. Atmospheric Environment, 41(15),
pp.3111–3128.
US EPA, Biogenic Emission Inventory System (BEIS). Available at:
https://www.epa.gov/air-emissions-modeling/biogenic-emission-inventory-system-beis [Accessed June
21, 2017].
US EPA, 2007. Leak Detection and Repair. A best practice guide., Available at:
https://www.epa.gov/sites/production/files/2014-02/documents/ldarguide.pdf.
US EPA Office of Air Quality Planning and Standards, 2006. WATER9, Version 3.0. EPA. Available at:
https://www3.epa.gov/ttnchie1/software/water/water9_3/index.html [Accessed July 12, 2017].
Wallace, L.A. et al., 1987. Emissions of volatile organic compounds from building materials and consumer
products. Atmospheric Environment (1967), 21(2), pp.385–393.
Walmsley, H.L., Connor, S.J.O. & Box, P.O., 1997. The measurement of atmospheric emissions from process
units using differential absorption LIDAR. In Lidar Atmospheric Monitoring. pp. 60–72.
Wang, M. et al., 2013. Evidence of coal combustion contribution to ambient VOCs during winter in Beijing.
Chinese Chemical Letters, 24(9), pp.829–832. Available at:
http://dx.doi.org/10.1016/j.cclet.2013.05.029.

80
Wei, W. et al., 2008. Emission and speciation of non-methane volatile organic compounds from
anthropogenic sources in China. Atmospheric Environment, 42(20), pp.4976–4988.
WHO, 1997. Assessment of exposure to indoor air pollutants. WHO regional publications. European series no.
78, (78), p.139.
Wu, B.-Z. et al., 2006. Sampling and analysis of volatile organics emitted from wastewater treatment plant
and drain system of an industrial science park. Analytica Chimica Acta, 576(1), pp.100–111. Available
at: http://linkinghub.elsevier.com/retrieve/pii/S0003267006005034.
Yao, Y.C. et al., 2008. Effects of sulfur and aromatic contents in gasoline on motorcycle emissions.
Atmospheric Environment, 42(26), pp.6560–6564.
Yu, C. & Crump, D., 1998. A review of the emission of VOCs from polymeric materials used in buildings.
Building and Environment, 33(6), pp.357–374. Available at:
http://linkinghub.elsevier.com/retrieve/pii/S0360132397000553 [Accessed April 27, 2017].
Zemankova, K. & Brechler, J., 2010. Emissions of biogenic VOC from forest ecosystems in central Europe:
Estimation and comparison with anthropogenic emission inventory. Environmental Pollution, 158(2),
pp.462–469. Available at: http://dx.doi.org/10.1016/j.envpol.2009.08.032.
Zhang, J. S.; Shaw, C.Y., 1997. Modelling of Volatile Organic Compound ( VOC ) Emissions from Building
Materials / Furnishings- -A Literature Review NRC Publications Archive ( NPArC ),
Zhang, G., 2016. Application and development trend of leak detection and repair (LDAR) (Chinese). Chinese
Journal of Environmental Engineering, 10(9), pp.4621–4627.
Zhang W, Cheng H, Fu L, E., 2016. Study on the National Control of Volatile Organic Compounds Final
Report

81
Appendix I. Limit on Volatile Organic Compounds (VOC) in Paints and
Varnishes
No. Product Category Type Phase 1 (g/L) Phase 2 (g/L)
a Matt color for walls and ceiling indoors
(gloss <25 at 60 ° angle)
WC6 75 30
SC7 400 30
b Blank color for walls and ceilings
indoors (gloss> 25 at 60 ° angle)
WC 150 100
SC 400 100
c Color for surfaces of mineral material
outdoors
WC 75 40
SC 450 430
d Color for wood, metal or plastic indoor
/ outdoor
WC 150 130
SC 400 300
e
Clear lacquer, lacquer and tannic acid,
including covercloth, for
Wood, metal or plastic indoor / outdoor
WC 150 130
SC 500 400
f Glue, oil or thin layer coat for indoor
and outdoor use
WC 150 130
SC 700 700
g Insulating primer WC 50 30
SC 450 350
h Binding primer WC 50 30
SC 750 750
i Component coating WC 140 140
SC 600 500
j Two-component color for special
applications, such as floor
WC 140 140
SC 550 500
k Multicolor color WC 150 100
SC 400 100
l Color with decorative effect WC 300 200
6 WC = Waterborne Coating (coatings whose viscosity is regulated by the use of water) 7 SC = Solvent Coating (coatings whose viscosity is regulated by the use of organic solvents)
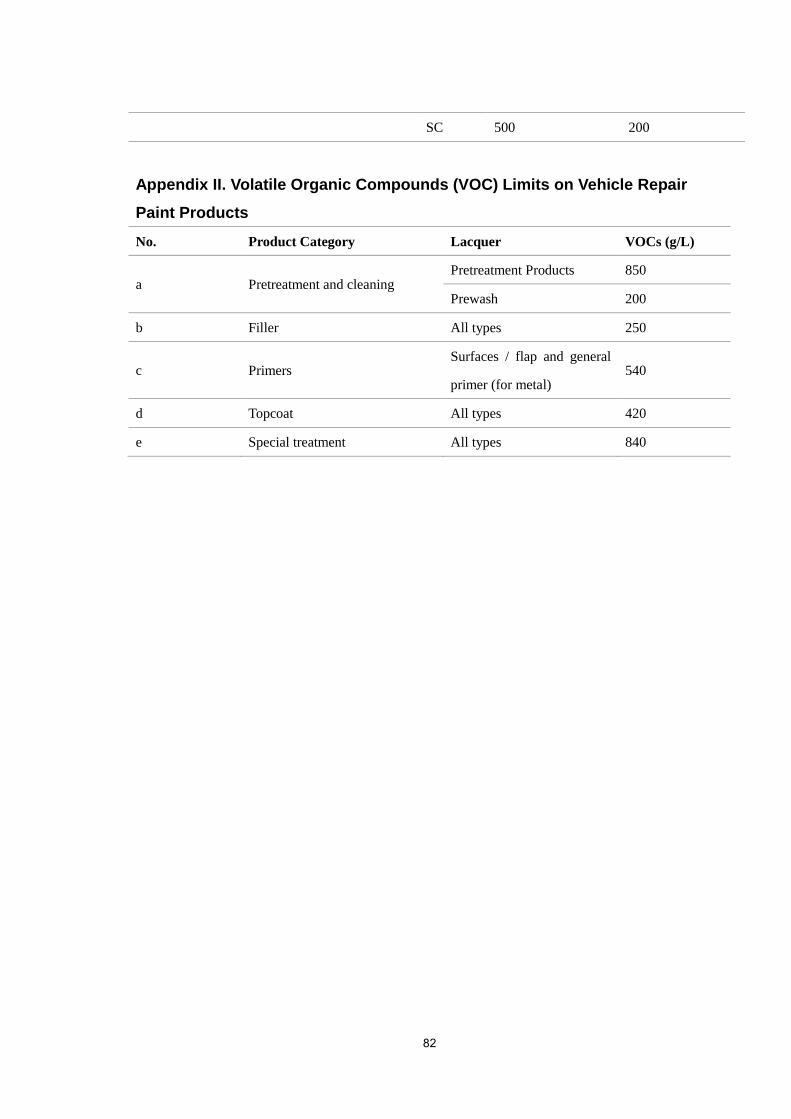
82
SC 500 200
Appendix II. Volatile Organic Compounds (VOC) Limits on Vehicle Repair
Paint Products
No. Product Category Lacquer VOCs (g/L)
a Pretreatment and cleaning Pretreatment Products 850
Prewash 200
b Filler All types 250
c Primers Surfaces / flap and general
primer (for metal) 540
d Topcoat All types 420
e Special treatment All types 840


TRITA SEED-EX 2017:29
www.kth.se