Collecting Data among Ethnic Minorities in an International Perspective
21
284 Collecting Data among Ethnic Minorities in an International Perspective REMCO FESKENS JOOP HOX GERTY LENSVELT-MULDERS Utrecht University HANS SCHMEETS Statistics Netherlands This article examines strategies to reduce nonresponse rates among ethnic minorities. The authors review nonresponse rates and data collection strategies among ethnic minorities with respect to response rates and response bias in six European countries. The national statistical institutes of these six countries use different definitions of ethnic minorities. This is why the definitions of ethnic minorities and their impact on the number of members of ethnic minorities in the six countries are compared. Nonresponse rates are usually higher among ethnic minorities than among the native population. Dissecting the nonresponse phenomenon shows that contact rates among ethnic minorities are lower,nonresponse due to an inability to produce the required information is higher, and cooperation rates are higher among ethnic minorities than among the native population. Increasing the response rates among ethnic minorities should focus on enhancing the contact rate and reducing the number of nonrespon- dents who are unable to produce the required information. Keywords: nonresponse reduction; tailored strategies; ethnic minorities In recent years, nonresponse rates in survey research have increased in almost all developed countries (De Heer and De Leeuw 2002). Nonresponse can bias estimates of the target population if nonrespondents systematically differ from respondents with respect to the studied variables. Bias is more likely if the response is not equally distributed among various societal groups. In this case, some groups are under- or overrepresented and the nonresponse is selective. To reduce nonresponse bias, it is essential to We wish to express our great appreciation to the people at the statistical agencies who care- fully filled in the questionnaire and provided the data for this study. Field Methods, Vol. 18, No. 3, August 2006 284–304 DOI: 10.1177/1525822X06288756 © 2006 Sage Publications at University Library Utrecht on February 1, 2010 http://fmx.sagepub.com Downloaded from
-
Upload
independent -
Category
Documents
-
view
1 -
download
0
Transcript of Collecting Data among Ethnic Minorities in an International Perspective
284
Collecting Data amongEthnic Minorities in an
International Perspective
REMCO FESKENSJOOP HOX
GERTY LENSVELT-MULDERSUtrecht University
HANS SCHMEETSStatistics Netherlands
This article examines strategies to reduce nonresponse rates among ethnic minorities.The authors review nonresponse rates and data collection strategies among ethnicminorities with respect to response rates and response bias in six European countries.The national statistical institutes of these six countries use different definitions ofethnic minorities. This is why the definitions of ethnic minorities and their impact onthe number of members of ethnic minorities in the six countries are compared.Nonresponse rates are usually higher among ethnic minorities than among the nativepopulation. Dissecting the nonresponse phenomenon shows that contact rates amongethnic minorities are lower, nonresponse due to an inability to produce the requiredinformation is higher, and cooperation rates are higher among ethnic minorities thanamong the native population. Increasing the response rates among ethnic minoritiesshould focus on enhancing the contact rate and reducing the number of nonrespon-dents who are unable to produce the required information.
Keywords: nonresponse reduction; tailored strategies; ethnic minorities
In recent years, nonresponse rates in survey research have increasedin almost all developed countries (De Heer and De Leeuw 2002).Nonresponse can bias estimates of the target population if nonrespondentssystematically differ from respondents with respect to the studied variables.Bias is more likely if the response is not equally distributed among varioussocietal groups. In this case, some groups are under- or overrepresented andthe nonresponse is selective. To reduce nonresponse bias, it is essential to
We wish to express our great appreciation to the people at the statistical agencies who care-fully filled in the questionnaire and provided the data for this study.
Field Methods, Vol. 18, No. 3, August 2006 284–304DOI: 10.1177/1525822X06288756© 2006 Sage Publications
at University Library Utrecht on February 1, 2010 http://fmx.sagepub.comDownloaded from
Feskens et al. / COLLECTING DATA AMONG ETHNIC MINORITIES 285
increase the response rates of societal groups with below-average responserates. Ethnic minorities tend to have below-average response rates (Snijkers2003; Schmeets 2004). The terms used to define them are not straightfor-ward: foreigners, immigrants, people of foreign descent, and ethnic minori-ties are used throughout Europe (European Commission, Employment andSocial Affairs DG 2004). These terms cover various realities, as is noted inthis article in greater detail. The term ethnic minorities is used below todescribe the specific target population.
Response rates among ethnic minorities were not always lower thanthose of the native population. In the 1980s, Bronner (1988) noted above-average response rates among ethnic minorities in the Netherlands.Nowadays, however, response rates among ethnic minorities are usuallyconsiderably lower than among the native population (Schmeets 2004).Concerns about bias in survey estimates have stimulated survey methodol-ogists to develop measures to reduce nonresponse among special groups(see Hox, De Leeuw, and Snijkers 2003). This study was motivated by thegrowing percentage of ethnic minorities, which is already considerable inWestern societies (e.g., almost 20% in the Netherlands), and the reluctanceto publish results about ethnic minorities because of their low responserates (Centraal Bureau voor de Statistiek 2005). To gain insight into theissue of collecting data among ethnic minorities, we examine strategies forcollecting data among ethnic minorities at several European national statis-tical institutes (NSIs) and semiofficial statistical bureaus. Until now, therehas been only a limited focus on response rates and potential bias and eth-nic minorities. Much of the material in this article is thus explorative andshould be interpreted as such.
This study has two aims. First, we are looking for successful strategiesfor collecting data among ethnic minorities that produce high responserates and low nonresponse bias. Second, cross-national research is becom-ing essential to support policies of international organizations and govern-ments, and there is an increasing need for valid and reliable cross-nationalsurvey data (De Heer 1999). Nonresponse is an issue in cross-nationalresearch. As Couper and De Leeuw (2003) noted, “Only if we know howdata quality is affected by nonresponse in each of the countries can weassess and improve the comparability of international and cross-culturaldata” (p. 157). This is why we also compare relevant definitions of ethnicminorities as a necessary step toward evaluating nonresponse differencesamong countries.
In the next section, we describe our methods and data. The definitions andpercentages of ethnic minorities are discussed in the third section. Nonresponserates among ethnic minorities in the six countries are examined in the fourth
at University Library Utrecht on February 1, 2010 http://fmx.sagepub.comDownloaded from
section, and strategies to reduce nonresponse rates among ethnic minoritiesand the discussion are presented in the final two sections.
METHODS AND DATA
We developed a questionnaire on response rate issues (final responserates, noncontact rates, refusal rates, and language difficulties), responsedefinitions, definitions of ethnic minorities, approach strategies, and resultsof experiments. The questionnaire was sent to informants at the nationalstatistical agencies. For practical reasons, we had to confine our analysis tosix countries. The countries are included in the analysis based on a purpo-sive sampling rationale (Creswell 1998). The selected countries all havedecreasing response rates (De Heer 1999). As developed Western Europeancountries, they constitute a homogeneous cluster. The countries in the finalsample are Belgium, France, Germany, the Netherlands, Sweden, and theUnited Kingdom. In this article, we describe successful strategies surveyorganizations used to reduce nonresponse rates among ethnic minorities.
Germany and Belgium have mandatory participation in major surveys.This makes it difficult to compare the response rates since the number ofrefusals under these survey conditions is systematically lower than in otherEU countries. In addition, the decentralized nature of the Federal Republicof Germany has resulted in sixteen state-level data-collecting institutes withtheir own far-reaching competences (Allum 1998). This federal data col-lection in Germany makes it very difficult to obtain comparable national-level data. Belgian law (Article 24) prohibits the Belgian national statisticalinstitute from giving third parties data that are classified as to ethnicity(D. Luminet, personal communication, 2004). This makes it impossible toinclude response rates classified into ethnic groups. Because of these diffi-culties in obtaining comparable data, we decided to include informationprovided by ZUMA in Germany and APS Belgium, both semipublic orga-nizations. National statistical institutes use different designs, fieldworkstrategies, and other fixed factors related to survey organization (see DeHeer 1999). With respect to these differences, the procedures at ZUMA andAPS are comparable to those at national statistical institutes.
We collected data from various surveys. Ideally, to compare trends inter-nationally, the data for analysis should contain a wide range of survey typesover years. However, it is difficult to obtain comparable data, and some-times it is simply not available. Nonetheless, informants at the statisticalinstitutes provided extensive information. We mainly focus here on the
286 FIELD METHODS
at University Library Utrecht on February 1, 2010 http://fmx.sagepub.comDownloaded from
Survey on Living Conditions and the Labor Force Survey. Labor ForceSurvey information is available for all six countries, although France, theNetherlands, and the United Kingdom could not provide statistics by ethnicminorities. Belgium, France, the Netherlands, and Sweden have providedSurvey on Living Conditions or Survey on Health information, althoughnot all of them could provide response rates classified according to ethnicgroups. The Labor Force Survey is mandatory in Germany and Belgium,so of course it gives less information on response rates and more specifi-cally on cooperation rates. The German institute ZUMA conducts theAllgemeine Bevölkerungsumfrage der Sozialwissenschaften (ALLBUS;German General Social Survey), a general social survey. Results of theALLBUS are available for the period from 1994 to 2002. We have also col-lected information on relevant definitions, sampling methods, and surveyorganizational information and can consult the rich results of several exper-iments on ethnic minorities conducted by the selected institutes.
DEFINITIONS AND NUMBERS OF ETHNIC MINORITIES
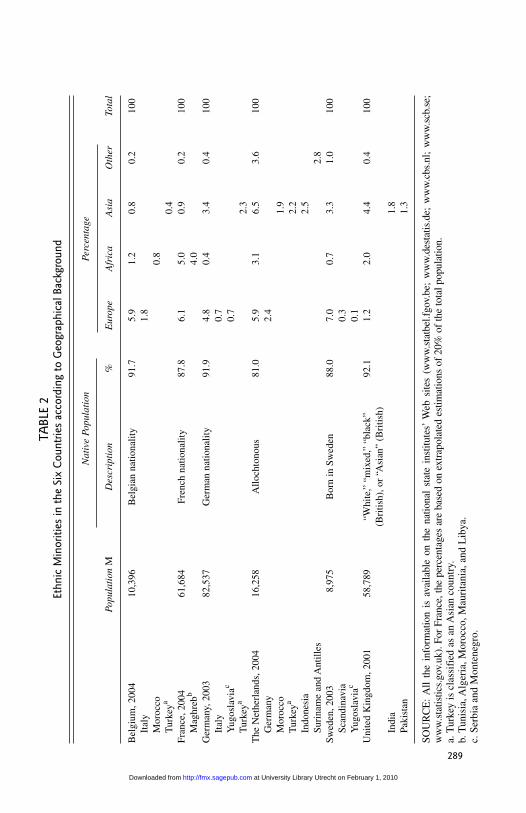
One of the most striking findings is that different definitions of ethnicminorities are used in the various countries. The size of the ethnic minori-ties and their countries of origin are among others determined by historicaldevelopments such as colonization or by specific legislation. The officialdefinition of ethnic minorities in each country also affects official estimatesof the size of its ethnic minorities, as Table 1 shows.
The official national definition in the six countries is given in the secondcolumn. Three countries (Belgium, France, and Germany) classify resi-dents as members of ethnic minorities if they have a foreign nationality.Statistics Netherlands uses the following definition: “Every person residingin the Netherlands of whom one or both parents were born abroad” (Reep2003). Statistics Sweden usually defines members of ethnic minoritiesas people who were born abroad. Residents of the United Kingdom self-identify, stating which ethnic group they belong to. Examples of questionson the ethnicity of a respondent can be found in a guide recently publishedby the Office of National Statistics (ONS; 2003). In the other countries, reg-istration in the municipal base administration or census information areused to determine how many people are members of ethnic minorities.
The percentages of ethnic minorities in the total population according tothis official national definition are shown in the third column of Table 1.According to the official definition, almost one in five residents of the
Feskens et al. / COLLECTING DATA AMONG ETHNIC MINORITIES 287
at University Library Utrecht on February 1, 2010 http://fmx.sagepub.comDownloaded from

288 FIELD METHODS
Netherlands are members of an ethnic minority, which is the largestpercentage in the six countries. The differing definitions make it difficult tocompare ethnic minorities internationally. A possible solution might be touse the citizenship criterion for all the countries. Then the percentage ofethnic minorities in the Netherlands and Sweden decreases considerably, asis shown in the fourth column. If residents of the Netherlands with a Dutchand at least one other nationality are counted as members of ethnic minori-ties, the percentage of ethnic minorities in the total population increases to10%. Unfortunately, there is no information available on double citizen-ships for Swedish citizens. If nationality is used as indicator, France has thelargest percentage of ethnic minorities (12.2%). Comparing the relative per-centages of ethnic minorities is difficult, however, even if the same defini-tion is applied to all the countries. Applying the citizenship criterion yieldsdifferent results depending on the laws for acquiring citizenship. Anotherpromising option might be the country of birth criterion. Unfortunately, therequired data are largely unavailable.
Table 2 shows where the ethnic minorities in the six countries are from.Relative percentages of the various ethnic groups are presented, and the mostimportant countries of origin are given in percentages of the total population.
Unlike the definitions of ethnic minorities, the definitions of responserates are similar in the six countries. All their national statistical institutesuse the American Association for Public Opinion Research response defin-ition 2, which includes partial interviews in the numerator and excludes
TABLE 1Percentages of Ethnic Minorities in Total National Populations
Official Ethnic Minorities Ethnic MinoritiesNational according to according to
Definition Official Definition Citizenship
Belgium, 2004 Citizenship 8.2 8.2France, 2004 Citizenship 12.2 12.2Germany, 2003 Citizenship 8.9 8.9The Netherlands, 2004 At least one parent 18.8 4.1
born abroadSweden, 2003 Born abroad 12.0 5.3United Kingdom, 2001 Self-identify 7.9 a
SOURCE: All the information is available on the national state institutes’ Web sites (www.statbel.fgov.be; www.destatis.de; www.cbs.nl; www.scb.se; www.statistics.gov.uk). For France,the percentages are based on extrapolated estimations of 20% of the total population.a. No data available.
at University Library Utrecht on February 1, 2010 http://fmx.sagepub.comDownloaded from
289
TABL
E 2
Ethn
ic M
inor
ities
in th
e Si
x C
ount
ries
acco
rdin
g to
Geo
grap
hica
l Bac
kgro
und
Nat
ive
Popu
lati
onPe
rcen
tage
Popu
lati
on M
Des
crip
tion
%E
urop
eA
fric
aA
sia
Oth
erTo
tal
Bel
gium
,200
410
,396
Bel
gian
nat
iona
lity
91.7
5.9
1.2
0.8
0.2
100
Ital
y1.
8M
oroc
co0.
8T
urke
ya0.
4Fr
ance
,200
461
,684
Fren
ch n
atio
nalit
y87
.86.
15.
00.
90.
210
0M
aghr
ebb
4.0
Ger
man
y,20
0382
,537
Ger
man
nat
iona
lity
91.9
4.8
0.4
3.4
0.4
100
Ital
y0.
7Y
ugos
lavi
ac0.
7T
urke
ya2.
3T
he N
ethe
rlan
ds,2
004
16,2
58A
lloch
tono
us81
.05.
93.
16.
53.
610
0G
erm
any
2.4
Mor
occo
1.9
Tur
keya
2.2
Indo
nesi
a2.
5Su
rina
me
and
Ant
illes
2.8
Swed
en,2
003
8,97
5B
orn
in S
wed
en88
.07.
00.
73.
31.
010
0Sc
andi
navi
a0.
3Y
ugos
lavi
ac0.
1U
nite
d K
ingd
om,2
001
58,7
89“W
hite
,”“m
ixed
,”“b
lack
”92
.11.
22.
04.
40.
410
0(B
ritis
h),o
r “A
sian
”(B
ritis
h)In
dia
1.8
Paki
stan
1.3
SOU
RC
E:
All
the
info
rmat
ion
is a
vaila
ble
on t
he n
atio
nal
stat
e in
stitu
tes’
Web
site
s (w
ww
.sta
tbel
.fgo
v.be
; w
ww
.des
tatis
.de;
ww
w.c
bs.n
l; w
ww
.scb
.se;
ww
w.s
tatis
tics.
gov.
uk).
For
Fra
nce,
the
perc
enta
ges
are
base
d on
ext
rapo
late
d es
timat
ions
of
20%
of
the
tota
l pop
ulat
ion.
a. T
urke
y is
cla
ssif
ied
as a
n A
sian
cou
ntry
.b.
Tun
isia
,Alg
eria
,Mor
occo
,Mau
rita
nia,
and
Lib
ya.
c. S
erbi
a an
d M
onte
negr
o.
at University Library Utrecht on February 1, 2010 http://fmx.sagepub.comDownloaded from
290 FIELD METHODS
noneligible sampled units from the denominator given equal inclusionprobabilities.1
NONRESPONSE AMONG ETHNIC MINORITIESAND CURRENT STRATEGIES FOR COLLECTING
DATA AMONG ETHNIC MINORITIES
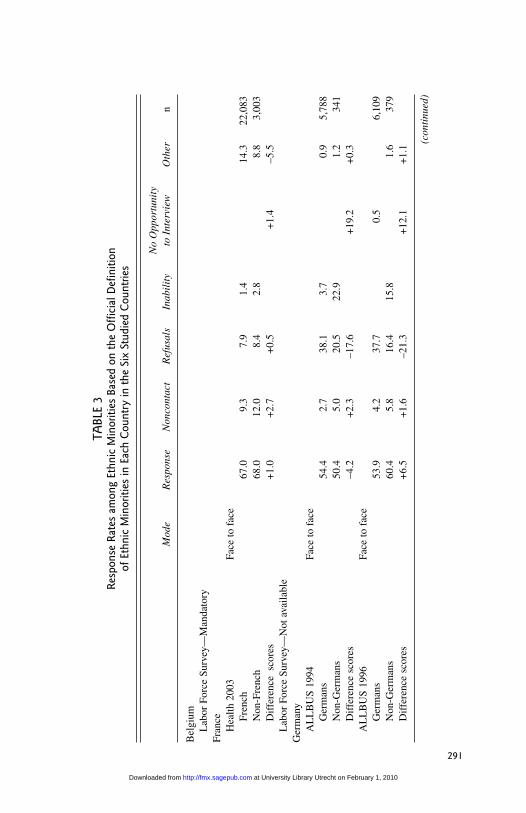
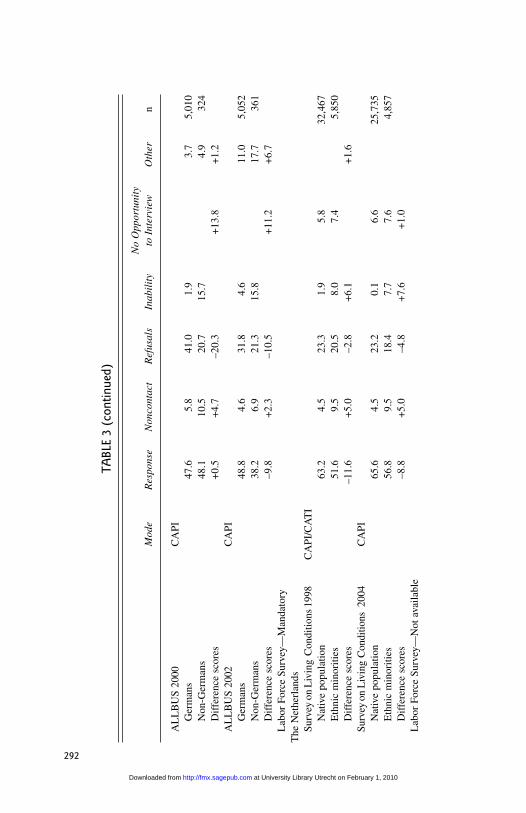
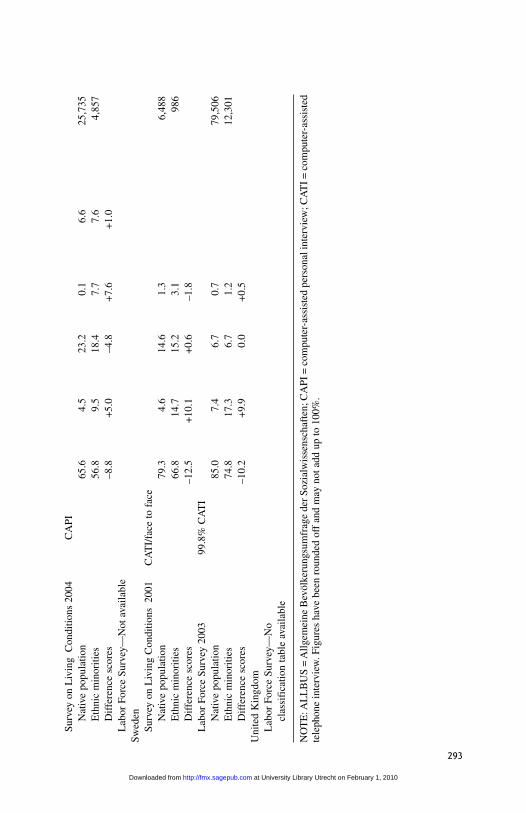
The variety in the surveys, the different definitions of ethnic minorities,and the limited data available make it difficult to compare nonresponserates directly in a meta-analysis. Nonetheless, the data corroborate theanecdotal evidence that in all six countries, the response rates for ethnicminorities are mostly lower than for the native population. The countriesvary, however, in the degree to which the ethnic minority nonresponse ratesdiffer from the native ones, as is shown in Table 3 in greater detail.
Dissecting nonresponse into noncontact, refusals, and other outcomesshows that in all six countries, ethnic minorities have lower contact rates(defined here as the ratio between the contacted sampled units and all theeligible sampled units; see the appendix) and relatively more nonrespon-dents due to inability to participate in survey research than the native pop-ulation. This might help explain why France and Sweden, countries with ahigh number of minimum contact attempts, have relatively high responserates among ethnic minorities. Unlike the lower contact rates among theethnic minorities, almost all the ethnic minority cooperation rates arehigher than the native ones. Cooperation is defined here as the ratiobetween completed interviews and completed interviews + partial inter-views + refused eligible units (Groves 1989). However, participation insome of the surveys is not voluntary, so no statements can be made aboutthe cooperation rate. Moreover, in a group in which the noncontact rate ishigher, the cooperation rate may decline if more sampled units are con-tacted. Establishing contact gives the people in the sample a first chance torefuse a request to take part in the survey. In fact, the ethnic minority refusalrates are increasing. Nonresponse due to inability to provide the requiredinformation, the third main reason for nonresponse, is always higher amongethnic minorities. Difficulty with the survey language is the main reasonwhy this form of nonresponse is higher among ethnic minorities. It is, how-ever, important to note that the three reasons for nonresponse—noncontact,refusal, and inability—are not so clearly distinguished. Sampled units whoare not contacted have no opportunity to refuse to take part in a survey (Hoxand De Leeuw 1998). Furthermore, sampled units can use their problemswith the survey language as a friendly way to refuse a request to take part
(text continues on p. 294)
at University Library Utrecht on February 1, 2010 http://fmx.sagepub.comDownloaded from
291
TABL
E 3
Resp
onse
Rat
es a
mon
g Et
hnic
Min
oriti
es B
ased
on
the
Offi
cial
Def
initi
onof
Eth
nic
Min
oriti
es in
Eac
h C
ount
ry in
the
Six
Stud
ied
Cou
ntrie
s
No
Opp
ortu
nity
M
ode
Res
pons
eN
onco
ntac
tR
efus
als
Inab
ilit
yto
Int
ervi
ewO
ther
n
Bel
gium
Lab
or F
orce
Sur
vey—
Man
dato
ryFr
ance
Hea
lth 2
003
Face
to f
ace
Fren
ch67
.09.
37.
91.
414
.322
,083
Non
-Fre
nch
68.0
12.0
8.4
2.8
8.8
3,00
3D
iffe
renc
esc
ores
+1.
0+
2.7
+0.
5+
1.4
–5.5
Lab
or F
orce
Sur
vey—
Not
ava
ilabl
eG
erm
any
AL
LB
US
1994
Face
to f
ace
Ger
man
s54
.42.
738
.13.
70.
95,
788
Non
-Ger
man
s50
.45.
020
.522
.91.
234
1D
iffe
renc
e sc
ores
–4.2
+2.
3–1
7.6
+19
.2+
0.3
AL
LB
US
1996
Face
to f
ace
Ger
man
s53
.94.
237
.70.
56,
109
Non
-Ger
man
s60
.45.
816
.415
.81.
637
9D
iffe
renc
e sc
ores
+6.
5+
1.6
–21.
3+
12.1
+1.
1
(con
tinu
ed)
at University Library Utrecht on February 1, 2010 http://fmx.sagepub.comDownloaded from
292
TABL
E 3
(con
tinue
d)
No
Opp
ortu
nity
M
ode
Res
pons
eN
onco
ntac
tR
efus
als
Inab
ilit
yto
Int
ervi
ewO
ther
n
AL
LB
US
2000
CA
PIG
erm
ans
47.6
5.8
41.0
1.9
3.7
5,01
0N
on-G
erm
ans
48.1
10.5
20.7
15.7
4.9
324
Dif
fere
nce
scor
es+
0.5
+4.
7–2
0.3
+13
.8+
1.2
AL
LB
US
2002
CA
PIG
erm
ans
48.8
4.6
31.8
4.6
11.0
5,05
2N
on-G
erm
ans
38.2
6.9
21.3
15.8
17.7
361
Dif
fere
nce
scor
es–9
.8+
2.3
–10.
5+
11.2
+6.
7L
abor
For
ce S
urve
y—M
anda
tory
The
Net
herl
ands
Surv
eyon
Liv
ing
Con
ditio
ns19
98C
API
/CA
TI
Nat
ive
popu
latio
n63
.24.
523
.31.
95.
832
,467
Eth
nic
min
oriti
es51
.69.
520
.58.
07.
45,
850
Dif
fere
nce
scor
es–1
1.6
+5.
0–2
.8+
6.1
+1.
6Su
rvey
onL
ivin
gC
ondi
tions
2004
CA
PIN
ativ
e po
pula
tion
65.6
4.5
23.2
0.1
6.6
25,7
35E
thni
c m
inor
ities
56.8
9.5
18.4
7.7
7.6
4,85
7D
iffe
renc
e sc
ores
–8.8
+5.
0–4
.8+
7.6
+1.
0L
abor
For
ce S
urve
y—N
ot a
vaila
ble
at University Library Utrecht on February 1, 2010 http://fmx.sagepub.comDownloaded from
293
Surv
ey o
n L
ivin
gC
ondi
tions
200
4C
API
Nat
ive
popu
latio
n65
.64.
523
.20.
16.
625
,735
Eth
nic
min
oriti
es56
.89.
518
.47.
77.
64,
857
Dif
fere
nce
scor
es–8
.8+
5.0
–4.8
+7.
6+
1.0
Lab
or F
orce
Sur
vey—
Not
ava
ilabl
eSw
eden
Surv
ey o
n L
ivin
g C
ondi
tions
2001
CA
TI/
face
to f
ace
Nat
ive
popu
latio
n79
.34.
614
.61.
36,
488
Eth
nic
min
oriti
es66
.814
.715
.23.
198
6D
iffe
renc
e sc
ores
–12.
5+
10.1
+0.
6–1
.8L
abor
For
ce S
urve
y 20
0399
.8%
CA
TI
Nat
ive
popu
latio
n85
.07.
46.
70.
779
,506
Eth
nic
min
oriti
es74
.817
.36.
71.
212
,301
Dif
fere
nce
scor
es–1
0.2
+9.
90.
0+
0.5
Uni
ted
Kin
gdom
Lab
or F
orce
Sur
vey—
No
clas
sifi
catio
n ta
ble
avai
labl
e
NO
TE
:AL
LB
US
= A
llgem
eine
Bev
ölke
rung
sum
frag
e de
r Soz
ialw
isse
nsch
afte
n; C
API
= c
ompu
ter-
assi
sted
per
sona
l int
ervi
ew; C
AT
I = c
ompu
ter-
assi
sted
tele
phon
e in
terv
iew
. Fig
ures
hav
e be
en r
ound
ed o
ff a
nd m
ay n
ot a
dd u
p to
100
%.
at University Library Utrecht on February 1, 2010 http://fmx.sagepub.comDownloaded from
in a survey. Members of ethnic minorities might also poorly communicatetheir reluctance in such a way that the interviewer codes it as a nonresponsedue to language problems instead of as a refusal.
Various ethnic minority response outcomes are presented in Table 3.Response outcomes are divided into response, noncontact, refusals, inabil-ity to provide the required information, and other reasons for nonresponse.As is clear from Table 3, detailed information on the various ethnic minor-ity response rates is not always available.
Except for some minor adjustments, no special strategies are currentlyin use at the NSIs for collecting data among ethnic minorities. In the UnitedKingdom, however, the ONS uses language cards that are distributed tointerviewers for use at ethnic minority households if prospective respon-dents cannot speak English (M. McConaghy, personal communication).ONS may also have relatives act as translators or use paid translators. Thismethod is described in greater detail in the Reducing Inability section. InGermany, the Federal Office of Statistics somewhat oversamples ethnicminorities (Gruber 1997).
REDUCING NONRESPONSE AMONG ETHNIC MINORITIES
Obtaining response is a process influenced by several factors. The firststep is to locate the sampled unit. The sample frame might not provide thenecessary information for locating sampled units. Second, contact has to beestablished. Once this is done, the sampled unit has to agree to take part inthe survey and has to be able to provide the required information. The fail-ure of any of these steps will lead to nonresponse. To reduce nonresponse,it is important to distinguish its potential causes. In this section, alternativecauses of nonresponse and ways to reduce nonresponse outcomes are dis-cussed, so that tailored strategies for collecting data among ethnic minori-ties can be developed. Recommendations are mainly based on the personalexperiences and judgments of practitioners from the selected survey orga-nizations. Experimental evidence of ethnic minority nonresponse reductionis rare. Some of the recommendations have already been tested in experi-mental settings. Others need to be tested in future experiments.
Reducing Noneligible Sampled Units
Because of high ethnic minority mobility and complex household struc-tures (Centraal Bureau voor de Statistiek 2004), the ethnic minority sampleframe is usually not as good as the native one. This can result in more
294 FIELD METHODS
at University Library Utrecht on February 1, 2010 http://fmx.sagepub.comDownloaded from
Feskens et al. / COLLECTING DATA AMONG ETHNIC MINORITIES 295
noneligible sampled units among ethnic minorities. Of course, researchersand survey organizations are often unable to control the quality of the sam-ple frame, and this is consequently mainly of theoretical interest. The factremains, though, that more sampled units are needed to reach a certaindesired sample size.
Reducing Noncontacts
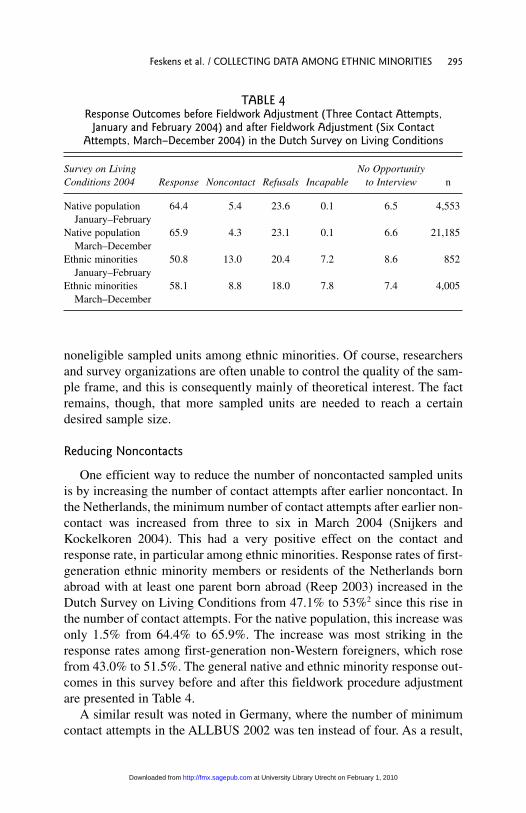
One efficient way to reduce the number of noncontacted sampled unitsis by increasing the number of contact attempts after earlier noncontact. Inthe Netherlands, the minimum number of contact attempts after earlier non-contact was increased from three to six in March 2004 (Snijkers andKockelkoren 2004). This had a very positive effect on the contact andresponse rate, in particular among ethnic minorities. Response rates of first-generation ethnic minority members or residents of the Netherlands bornabroad with at least one parent born abroad (Reep 2003) increased in theDutch Survey on Living Conditions from 47.1% to 53%2 since this rise inthe number of contact attempts. For the native population, this increase wasonly 1.5% from 64.4% to 65.9%. The increase was most striking in theresponse rates among first-generation non-Western foreigners, which rosefrom 43.0% to 51.5%. The general native and ethnic minority response out-comes in this survey before and after this fieldwork procedure adjustmentare presented in Table 4.
A similar result was noted in Germany, where the number of minimumcontact attempts in the ALLBUS 2002 was ten instead of four. As a result,
TABLE 4Response Outcomes before Fieldwork Adjustment (Three Contact Attempts,
January and February 2004) and after Fieldwork Adjustment (Six ContactAttempts, March–December 2004) in the Dutch Survey on Living Conditions
Survey on Living No Opportunity Conditions 2004 Response Noncontact Refusals Incapable to Interview n
Native population 64.4 5.4 23.6 0.1 6.5 4,553January–February
Native population 65.9 4.3 23.1 0.1 6.6 21,185March–December
Ethnic minorities 50.8 13.0 20.4 7.2 8.6 852January–February
Ethnic minorities 58.1 8.8 18.0 7.8 7.4 4,005March–December
at University Library Utrecht on February 1, 2010 http://fmx.sagepub.comDownloaded from
the contact rate among sampled units with the German nationalityincreased from 94.2% in 2000 to 95.4% in 2002. For non-Germans, thisincrease was from 89.5% in 2000 to 93.1% in 2002. Because many featuresof the design changed simultaneously in the two surveys, these resultsshould be interpreted with care.
Countries with a high minimum number of contacts, such as Sweden,where Statistics Sweden uses twelve minimum contact attempts in theLabor Force Survey, also have relatively high ethnic minority contact andresponse rates. The ethnic minority response rate in Sweden was 74.8%in the Labor Force Survey 2003 and 66.8% in the Survey on LivingConditions 2001.
Another way to reduce the number of ethnic minority noncontacted sam-pled units is by extending the data collection period in hours and days.Ethnic minorities relatively often do shift work (Seifert 1992) and are oftenin their country of origin for lengthy periods of time although officially reg-istered in the country of the survey organization (Blohm and Diehl 2001).A longer fieldwork period increases the probability of finding a sampledunit at home. The mode of data collection can also have a different andgreater impact on the contact rate among ethnic minorities than among thenative population. Telephone coverage among ethnic minorities is usuallylower; therefore, a computer-assisted personal interview contact mode ispreferred to a computer-assisted telephone interview (CATI) mode. CATIshould be at least held in a mixed-mode design.
Reducing Refusals
One common way to increase survey participation is by offering mone-tary incentives to sampled units. In the literature, references are often madeto experiments demonstrating the positive effect of incentives on responserates (see, e.g., Groves and Couper 1998; Singer 2002). With regard to eth-nic minority groups, however, the evidence is mixed. To persuade respon-dents in the 2004 Statistics Netherlands experiment “A Tailored ApproachStrategy for Young Moroccans and Turks for the Dutch Family and FertilitySurvey,” a gift voucher of €10.00 was promised in an advanced letter andby the interviewers. However, the incentive did not produce any majoreffect on the response rates (Van den Brakel, Vis-Visschers, and Schmeetsforthcoming). Unlike earlier ALLBUS surveys, the ALLBUS 2002 surveyincluded a €10.00 coin as incentive. The German cooperation rate (see theappendix) increased from 53.7% in 2000 to 60.1% in 2002, but the cooper-ation rate among non-Germans decreased in the same period from 70.0%to 64.2%.3
296 FIELD METHODS
at University Library Utrecht on February 1, 2010 http://fmx.sagepub.comDownloaded from
These figures should be interpreted with care. The incentives were notgiven in an experimental setting, and the ALLBUS 2002 was conducted bya different survey agency than the ALLBUS 2000. So the changes in non-response may also be due to differences between the survey agencies. Thismight, nonetheless, suggest that ethnic minorities are more indifferent toopportunity costs and social exchange hypotheses.
Anti Athiainen (personal communication, 2004) from Statistics Swedennoted that incentives for ethnic minorities should be used with caution,especially lottery tickets, since Muslims are forbidden by their religion togamble or bet.
Refusing to take part in a survey can also have to do with not beingfamiliar with the survey organization. This problem can be tackled byannouncing the upcoming survey in the popular ethnic minority media(A. Athiainen, personal communication, 2004). This can inform peopleabout the survey organization and the upcoming survey and decrease anxi-ety about providing personal information (Dumas and Théroux 2004).Publicly announcing the upcoming survey also increases the perceivedlegitimacy of the survey (see Cialdini 1993; Groves and Couper 1998).
Reducing Inability
This category of nonresponse is always higher among ethnic minorities,mainly because of difficulties with the survey language. There are threemain ways to reduce the number of sampled units who cannot participate ina survey due to language problems: (1) the survey organization can use ques-tionnaires in other languages, (2) respondents can be interviewed by inter-viewers with the same ethnic background, and (3) nonresponse due tolanguage problems can be reduced by allowing relatives to act as translators.
None of the NSIs in the study have questionnaires translated into ethnicminority languages. Statistics Sweden has had experience using multilin-gual surveys. There used to be survey translations in twelve languages.However, this was reported to be not worth the effort (O. Wessberg, per-sonal communication, 2004). Now only an English translation is available.ONS United Kingdom is obliged by law to have questionnaires in Welsh aswell as English. Translating questionnaires can be a very costly operation.Ethnic minorities in the six countries are extremely heterogeneous, soexcept perhaps in Germany, with a large Turkish minority, translations intomore languages are needed to cover the sampled units who cannot partici-pate because of language problems. Even if a whole ethnic minority is fromone country, there can be various regional languages. Moreover, culturaldifferences and meanings can complicate translations (Schoua-Glusberg
Feskens et al. / COLLECTING DATA AMONG ETHNIC MINORITIES 297
at University Library Utrecht on February 1, 2010 http://fmx.sagepub.comDownloaded from
and Miller 2004). Nevertheless, Blohm and Diehl (2001) noted that, at leastin Germany, using bilingual questionnaires can reduce nonresponse due tolanguage problems.
The same problems apply to interviewers with the same ethnic back-ground as the respondents. Moreover, unforeseeable problems can arise.Sensitive questions posed by interviewers with the same ethnic backgroundcan result in more traditional answers (Dotinga et al. 2005). Sometimes theinterviewer and the sampled person come from different political resistanceor guerrilla groups in the home country. Or there can be a fear of refugeespying by the translator on behalf of the home country (A. Ahtiainen, per-sonal communication, 2004). In practice, it is not usually easy to recruitqualified interviewers with the same ethnic background as potentially diffi-cult respondents (Blohm and Diehl 2001). Nevertheless, interviewers withthe same ethnic background can play a useful role in the tracing and con-tacting before the actual interview (A. Ahtiainen, personal communication,2004). But at least for general surveys with the target population consistingof all the residents of a country, using interviewers with the same ethnicbackground as the respondents would probably not be cost efficient.
Another way to reduce nonresponse due to language problems is to havea relative older than the age of fifteen translate, perhaps a nonresident. Thismethod is sometimes used by ONS United Kingdom to avoid nonresponse,provided the quality of the study does not suffer as a result. Posing ques-tions about sensitive topics with a young relative as a translator could pro-duce socially desirable answers. Another problem with relatives acting astranslators is the introduction of the measurement error involved in simul-taneous translations.
RECOMMENDATIONS AND DISCUSSION
Collecting data from ethnic minorities is not easy. Getting a sufficientresponse is particularly difficult among ethnic minorities. Nonresponse canhave serious consequences for researchers since the survey estimates may bebiased. Overall response rates have declined virtually all across the globe inrecent years (De Heer 1999). In the Netherlands as well as elsewhere, thistrend of decreasing response rates is even more troublesome among ethnicminorities. Weighting techniques can partially make up for nonresponsebias, but correcting for selectivity cannot be unlimited. This is especiallythe case if specific societal groups have very low response rates. Then theassumption that the responding segment is more or less representative of the
298 FIELD METHODS
at University Library Utrecht on February 1, 2010 http://fmx.sagepub.comDownloaded from
nonresponding segment is questionable. The only good solution to missingdata is thus not to have any (Allison 2001). Of course, this is an impossiblescenario, but it is still essential to put great effort into designing and exe-cuting research projects for minimizing missing data. To do so, we havestudied strategies for reducing nonresponse internationally. Most of the rec-ommendations in this article are best practices, as experiments in this fieldare rare. In the perspective of a growing European Union, more experimentsand better contact between the NSIs are called for.
Based on the response rates and experiences of some other Europeanstatistical offices, we have considered various ethnic minority nonresponsereduction strategies. Comparing the ethnic minorities in different countriesis quite a daunting task in itself since each country has its own history withits own ethnic minorities, and matters are complicated even more by thedifferent definitions of ethnic minorities. Ethnic minorities are not the samething in every country. Different definitions of ethnic minorities are used bydifferent governments. A resident of Germany with German nationality butborn in Turkey is classified in Germany as a German, but a Dutch residentborn in the Netherlands whose Dutch father was born in Belgium is classi-fied as an immigrant in the Netherlands. These different definitions greatlyaffect the size and structure of ethnic minorities. A recently published inter-nal document of the European DG Employment and Social Affairs givessome clear examples of the effect of using different definitions of ethnicminorities on some socioeconomic statistics (European Commission,Employment and Social Affairs DG 2004).
Low ethnic minority response rates can bias survey estimates.Depending on the definition, the ethnic minority percentage of the totalpopulation is already about 10% and increasing in all six countries. Othercountries (e.g., the United States) now already have a much higher per-centage of ethnic minorities in their population. Better ethnic minorityresponse rates are also needed to give good estimates of subpopulations. AsCouper and De Leeuw (2003) noted, differences in response rates maythreaten the validity of comparative studies. Differences between samplesmay not reflect differences between populations but might result fromresponse and definition differences.
Detailed information on ethnic minority response outcomes is notalways available, as Table 3 shows. More information on specific fieldworkprocedures (e.g., time of contact attempts) is needed to more precisely eval-uate response processes among various societal subgroups. This informa-tion is often not centrally available or not accessible to outsiders. Increasingethnic minority response rates should involve tailoring the survey design in
Feskens et al. / COLLECTING DATA AMONG ETHNIC MINORITIES 299
at University Library Utrecht on February 1, 2010 http://fmx.sagepub.comDownloaded from
such a way that the response probability is maximized under time andbudget constraints (Snijkers 2003). Of course, this also holds true of strate-gies for encouraging ethnic minorities to take part in survey research.However, this study show that, except for some small modifications, noneof the six countries had special strategies for collecting data among ethnicminorities.
Dissecting the nonresponse phenomenon into contact, refusals, and othercauses means considering alternative reasons for each outcome (Grovesand Couper 1998). Ethnic minorities seem to have lower contact rates andhigher nonresponse rates than the native population due to language prob-lems. The low contact rates are closely connected to sociodemographicand socioeconomic characteristics of ethnic minorities. For example, ethnicminorities are more likely to be urban residents, who are known to be diffi-cult to contact (Groves and Couper 1998; Feskens et al. 2004). This suggeststhat researchers should concentrate on enhancing ethnic minority contactrates to enhance ethnic minority response rates.
An efficient way to increase the ethnic minority contact rate is byincreasing the minimal number of contact attempts after earlier noncontactand using a longer data collection period. In particular, raising the minimalnumber of contact attempts can have a positive effect on the response ratesand can be tailored for use with ethnic minorities. Increasing the number ofcontact attempts in Germany and the Netherlands resulted in a relativelyhigher rise in contact and response rates among ethnic minorities thanamong the native population. This might also explain why the largest dif-ference between ethnic minority and native response rates is observed inthe Netherlands. Until March 2004, the Netherlands and Belgium were theonly ones of the six countries with a low number of contact attempts (DeHeer 1999). Unlike Belgium, contact rates cannot be increased in theNetherlands by substitution. Reducing the number of noncontacted sam-pled units can also have a positive effect on bias reduction, as Lynn, Clarke,Martin, and Sturgis (2002) noted, “It is the difficult to contact who are mostdifferent from the easy to get” (p. 142). However, establishing contact withmore ethnic minority sampled units by increasing the number of contactattempts can also lead to an increase in the measurement error by bringingin more respondents with language difficulties. This could be a possiblehypothesis for a later experimental test.
Nonresponse rates due to refusals are not as high as one might initiallythink. In fact, they are usually lower among ethnic minorities than amongthe native population. This form of nonresponse is nonetheless also grow-ing among ethnic minorities. Incentives are usually used to increase thecooperation rate among sampled units. The results of an experiment in the
300 FIELD METHODS
at University Library Utrecht on February 1, 2010 http://fmx.sagepub.comDownloaded from
Feskens et al. / COLLECTING DATA AMONG ETHNIC MINORITIES 301
Netherlands and a fieldwork adjustment in Germany show, however, thatthis had only a very limited effect if any among ethnic minorities. Futureresearch could focus on why incentives seem to be, at least in Europeancountries, less effective in raising the cooperation and response rates amongethnic minorities. Ethnic minority unfamiliarity with the survey or surveyorganization can be overcome by announcing the upcoming survey in amore tailored way.
Nonresponse due to inability to provide the required information ishigher among ethnic minorities, specifically the older members, mainly dueto language problems. Depending on the sensitivity of the survey topic, lan-guage problems can be overcome by having younger relatives act as trans-lators. Translating questionnaires or using interviewers with the sameethnic background are probably not cost effective.
Obtaining responses from ethnic minorities is not as easy as from nativepopulations, but it is not impossible. Response rates and experiments showthat special attention should be devoted to lower contact rates among eth-nic minorities. Countries with high numbers of contact attempts alreadyhave relatively high response rates among ethnic minorities, and recentdevelopments at Statistics Netherlands also reveal striking increases of con-tact and response rates among ethnic minorities.
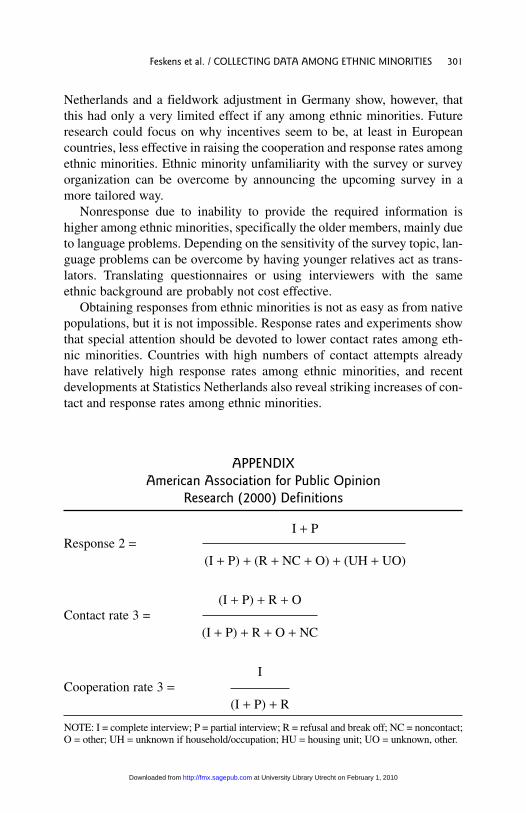
APPENDIXAmerican Association for Public Opinion
Research (2000) Definitions
I + PResponse 2 =
(I + P) + (R + NC + O) + (UH + UO)
(I + P) + R + OContact rate 3 =
(I + P) + R + O + NC
ICooperation rate 3 =
(I + P) + R
NOTE: I = complete interview; P = partial interview; R = refusal and break off; NC = noncontact;O = other; UH = unknown if household/occupation; HU = housing unit; UO = unknown, other.
at University Library Utrecht on February 1, 2010 http://fmx.sagepub.comDownloaded from

302 FIELD METHODS
NOTES
1. In the appendix, different response definitions according to American Association forPublic Opinion Research definitions are given in a more formal way.
2. A comparison is made between the response rates of the first 2 months of 2004 and inthe period from March to December 2004.
3. In 2002, all the interviews conducted in the past 4 weeks were rejected due to doubts aboutwhether all the rules had been followed (Blohm et al. 2003). This resulted in far more nonana-lyzed interviews than in Allgemeine Bevölkerungsumfrage der Sozialwissenschaften (GermanGeneral Social Survey) 2000. If the nonanalyzed interviews were interpreted as refusals, therewould be an increase in the cooperation rate from 51.5% to 52.8% among the German sampledunits and a reduction from 65.3% to 49.5% among the non-German sampled units.
REFERENCES
Allison, P. A. 2001. Missing data. Sage University Papers on Quantitative Applications in theSocial Sciences, 07-136. Thousand Oaks, CA: Sage.
Allum, P. A. 1989. State and society in Western Europe. Oxford, UK: Blackwell.American Association for Public Opinion Research. 2000. Standard definitions: Final dispo-
sitions of case codes and outcome rates for surveys. Ann Arbor, MI: American Associationfor Public Opinion Research.
Blohm, M., and C. Diehl. 2001. Wenn migranten migranten befragen. zum teilnahmeverhal-ten von einwanderern bei bevölkerungsbefragungen. Zeitschrift für Soziologie 30 (3):223–42.
Blohm, M., J. Harkness, S. Klein, and E. Scholz. 2003. Konzeption und durchführung der“Allgemeinen Bevölkerungsumfrage der Sozialwissenschaften” (ALLBUS) 2002. ZUMAMethodenbericht December 2003.
Bronner, A. E. 1988. Surveying ethnic minorities. In Sociometric research, ed. W. E. Saris andI. N. Gallhofer, 36–47. London: MacMillan.
Centraal Bureau voor de Statistiek. 2004. Allochtonen in Nederland 2003. Voorburg/Heerlen,the Netherlands: Centraal Bureau voor de Statistiek.
———. 2005. Enquêteonderzoek onder allochtonen. Problemen en oplossingen.Voorburg/Heerlen, the Netherlands: Centraal Bureau voor de Statistiek.
Cialdini, R. B. 1993. Influence: Science and practice. New York: HarperCollins.Couper, M., and E. de Leeuw. 2003. Nonresponse in cross-cultural and cross-national
surveys. In Cross-cultural survey methods, ed. J. A. Harkness, F. J. R. van de Vijver, andP. Ph. Mohler, 157–79. Hoboken, NJ: John Wiley.
Creswell, J. W. 1998. Qualitative inquiry and research design: Choosing among five tradi-tions. Thousand Oaks, CA: Sage.
de Heer, W. 1999. International response trends: Results of an international survey. Journal ofOfficial Statistics 15 (2): 129–42.
de Heer, W., and E. de Leeuw. 2002. Trends in household survey non-response: A longitudinaland international comparison. In Survey non-response, ed. R. M. Groves, D. A. Dillman,J. L. Eltinge, and R. J. A. Little, 41–54. New York: John Wiley.
at University Library Utrecht on February 1, 2010 http://fmx.sagepub.comDownloaded from
Feskens et al. / COLLECTING DATA AMONG ETHNIC MINORITIES 303
Dotinga, A., R. J. J. M van den Eijnden, W. Bosveld, and H. F. L. Garretsen. 2005. The effectof data collection mode and ethnicity of interviewer on response rates and alcohol reports:An experimental study. Alcohol & Alcoholism 40 (3): 242–48.
Dumas, L., and J. Théroux. 2004. A successful collection sometimes requires convincingpeople by informing them properly. Paper presented at Statistics Canada Symposium2004, Innovative Methods for Surveying Difficult-to-Reach Populations, Ottawa, Canada.
European Commission, Employment and Social Affairs DG. 2004. Overview of third levelindicators used in the NAP incl. relating to the social inclusion of “foreigners, immigrantsand ethnic minorities.” Brussels: European Commission.
Feskens, R. C. W., J. J. Hox, G. J. L. M. Lensvelt-Mulders, and J. J. G. Schmeets. 2004. A mul-tivariate analysis of nonresponse among ethnic minorities. Statistics Canada InternationalSymposium Series—Proceedings, 2004. Innovative Methods for Surveying Difficult-to-Reach Population. Ottawa: Statistics Canada.
Groves, R. M. 1989. Survey errors and survey costs. New York: John Wiley.Groves, R. M., and M. P. Couper. 1998. Nonresponse in household interview surveys.
New York: John Wiley.Gruber, S. 1997. The German mikrozensus. Wiesbaden, Germany: Statistisches Bundesamt.Hox, J. J., and E. de Leeuw. 1998. Nonresponse in surveys: Een overzicht. Kwantitatieve
Methoden 19 (57): 31–53.Hox, J. J., E. de Leeuw, and G. Snijkers. 2003. Nonresponse in surveys: Determining the
research agenda for the future. Bulletin de Méthodologie Sociologique 79 (79): 47–60.Lynn, P., P. Clarke, J. Martin, and P. Sturgis. 2002. The effects of extended interviewer attempts
on non-response bias. In Survey nonresponse, ed. R. Groves, D. A. Dillman, J. L. Eltinge,and R. J. A. Little, 135–48. New York: John Wiley.
Office for National Statistics. 2003. Ethnic group statistics: A guide for the collection andclassification of ethnicity data. Newport, VA: Office for National Statistics.
Reep, C. 2003. Moeilijk waarneembare groepen. Een inventarisatie (BPA-nummer H1568-03-SOO-intern, CBS-nota). Heerlen, the Netherlands: Centraal Bureau voor de Statistiek.
Schmeets, H. 2004. Respons van eerste generatie allochtonen in het POLS. Bevolkingstrends52 (4): 92–97.
Schoua-Glusberg, A., and K. Miller. 2004. Assessing comprehension of translated question-naires with qualitative methods. Paper presented at Statistics Canada Symposium 2004,Innovative Methods for Surveying Difficult-to-Reach Populations, Ottawa, Canada.
Seifert, W. 1992. Die zweite ausländergeneration in der Bundesrepublik: Längsschnit-tbeochbatungen in der Berufseinstiegsphase. Kölner Zeitschrift für Soziologie undSozialpsychologie 44 (4): 677–96.
Singer, E. 2002. The use of incentives to reduce nonresponse in household surveys. In Surveynonresponse, ed. R. Groves, D. A. Dillman, J. L. Eltinge, and R. J. A. Little, 163–77.New York: John Wiley.
Snijkers, G. 2003. Programmaplan strategisch onderzoek “Non-respons en moeilijkwaarneembare groepen: Naar een optimale meetstrategie” (CBS-report H3318-03-SOO).Heerlen, the Netherlands: Centraal Bureau voor de Statistiek.
Snijkers, G., and S. Kockelkoren. 2004. De gestandaardiseerde benaderingsstrategie 2003:Evaluatie en aanbevelingen (CBS-report H415-04-SOO). Heerlen, the Netherlands:Centraal Bureau voor de Statistiek.
van den Brakel, J., R. Vis-Visschers, and H. Schmeets. Forthcoming. Effects of data collectionmodes and incentives on the outcomes of the Dutch family and fertility survey for youngMoroccans and Turks. Field Methods.
at University Library Utrecht on February 1, 2010 http://fmx.sagepub.comDownloaded from
REMCO FESKENS is a PhD student in methods and statistics at Utrecht University, theNetherlands. He studies difficult-to-survey groups and reduction of nonresponse ratesand nonresponse bias. He has recently published “Allochtonen tellen: een kwestie vandefiniëren” [Counting ethnic minorities: A matter of defining] (Enquêteonderzoek onderAllochtonen, Problemen en Oplossingen [Survey research among ethnic minorities:Problems and solutions], 2005, Voorburg/Heerlen, the Netherlands: Centraal Bureauvoor de Statistiek) and A Multivariate Analysis of Nonresponse among EthnicMinorities, Statistics Canada International Symposium Series—Proceedings, 2004,Innovative Methods for Surveying Difficult-to-Reach Populations (with J. J. Hox,G. J. L. M. Lensvelt-Mulders, and J. J. G. Schmeets, Statistics Canada, Ottawa/Hull,Canada, 2005).
JOOP HOX is a professor of social science methodology in the faculty of social sci-ences at Utrecht University, the Netherlands. His main research interests are surveymethodology, issues of survey data quality, and the analysis of complex data with mul-tilevel and structural equation models. His current research projects are comparativeresearch on nonresponse and multilevel structural equation modeling. He has pub-lished articles on these topics in Sociological Methods and Research, Journal ofOfficial Statistics, and Structural Equation Modeling.
GERTY LENSVELT-MULDERS is an associate professor in the Department ofMethodology and Statistics at Utrecht University, the Netherlands. Her fields ofresearch are the improvement of data collection in panel studies and the developmentof instruments for the study of sensitive topics. Recent publications include (withJ. J. Hox, P. G. M. Van der Heijden, and C. J. M. Maas) “Meta-Analysis of RandomizedResponse Research: 35 Years of Validation Studies” (Sociological Methods andResearch, 2005) and (with A. D. L. van den Hout) “On a 2 by 2 Factorial Design wherethe Use of Randomized Response Is One of the Factors” (Statistica Neerlandica, 2005).
HANS SCHMEETS is currently the coordinator of the program Non-response andDifficult-to-Reach Populations at Statistics Netherlands. Apart from nonresponseresearch in social surveys, his main interests are election studies, ethnic minorities,and research on living conditions. Since 1995, he has been involved as a member ofthe core staff of many Organization for Security and Co-operation in Europe/Office forDemocratic Institutions and Human Rights election observation missions. Two recentpublications are “Free and Fair Elections in the OSCE-Region? The Development ofa Measurement Tool” (PhD thesis, Catholic University of Nijmegen, 2002) and (withJ. P. G. Janssen), Using National Registrations to Correct for Selective Non-response:Political Preference of Ethnic Groups (Proceedings of Statistics Canada Symposium2001, Achieving Data Quality in a Statistical Agency: A Methodological Perspective;Statistics Canada, Ottawa/Hull, 2002).
304 FIELD METHODS
at University Library Utrecht on February 1, 2010 http://fmx.sagepub.comDownloaded from