
Ethnic Minorities Strategies for Market Formation: The Israeli Arab Case
27
1 11 Ethnic Minorities’ Strategies for Market Formation: The Israeli Arab Case Michael Sofer, Itzhak Benenson, Izhak Schnell Introduction Inter-firm linkages and networks are often treated as indicators of business growth. Intensive linkages may generate economic multipliers along with other economic benefits to the local and the regional economy (Scott, 1991; Felsenstein, 1992; Staber and Schaefer, 1996). A key issue in network studies is the degree to which firms are embedded in various markets through their relationships with competitors, suppliers, regional and national business organisations, and public decision making forums (Best, 1990; Harrison, 1992; Markusen, 1994; Lakshmanan and Okumura, 1995). In this context, particular attention is devoted to barriers that ethnic entrepreneurs are forced to overcome in developing business linkages and networks (Aldrich and Waldinger, 1990; Barrett et al., 1996). Ethnic entrepreneurs may find themselves trapped within ethnic enclaves or they have to overcome barriers that stem from their ethnic origin and/or location in the national, regional and urban periphery. Taking into consideration the key role of entrepreneurship for minorities’ socio-economic mobility, their success in developing wide business linkages and networks is crucial for their integration into the economy as well as society. Previous research on Arab entrepreneurship in Israel has shown that up until the 1980s Arab entrepreneurs were restricted mainly to intra-ethnic and local networks. Since then, they have exhibited increasingly high motivation and determination to exploit any slight chance to enter new markets (Schnell et al., 1995). In investigating issues of purchasing and information network, we have discovered that more than three-quarters of Arab entrepreneurs continue to develop linkages with one or two types of
Transcript of Ethnic Minorities Strategies for Market Formation: The Israeli Arab Case

1
11 Ethnic Minorities’ Strategies
for Market Formation: The
Israeli Arab Case
Michael Sofer, Itzhak Benenson, Izhak Schnell
Introduction
Inter-firm linkages and networks are often treated as indicators of business
growth. Intensive linkages may generate economic multipliers along with other economic benefits to the local and the regional economy (Scott, 1991;
Felsenstein, 1992; Staber and Schaefer, 1996). A key issue in network
studies is the degree to which firms are embedded in various markets through their relationships with competitors, suppliers, regional and
national business organisations, and public decision making forums (Best,
1990; Harrison, 1992; Markusen, 1994; Lakshmanan and Okumura, 1995).
In this context, particular attention is devoted to barriers that ethnic entrepreneurs are forced to overcome in developing business linkages and
networks (Aldrich and Waldinger, 1990; Barrett et al., 1996). Ethnic
entrepreneurs may find themselves trapped within ethnic enclaves or they have to overcome barriers that stem from their ethnic origin and/or location
in the national, regional and urban periphery. Taking into consideration the
key role of entrepreneurship for minorities’ socio-economic mobility, their
success in developing wide business linkages and networks is crucial for their integration into the economy as well as society.
Previous research on Arab entrepreneurship in Israel has shown that
up until the 1980s Arab entrepreneurs were restricted mainly to intra-ethnic and local networks. Since then, they have exhibited increasingly high
motivation and determination to exploit any slight chance to enter new
markets (Schnell et al., 1995). In investigating issues of purchasing and information network, we have discovered that more than three-quarters of
Arab entrepreneurs continue to develop linkages with one or two types of

2 Promoting Local Growth
destinations (Schnell et al., 1999). In comparison, sale linkages seem to be more complex. Arab plants sell to a variety of markets ranging from limited
local to more sophisticated metropolitan markets (Schnell et al., 1999).
This chapter has three complementary goals: to analyse the way in
which individuals’ plants participate in the market; to discover major routes of expansion and contraction in markets; and to investigate the viability of
the barriers of ethnicity and peripherality. We try to investigate the set of
forces that shapes the structure of people’s opportunities by comparing different entrepreneurs’ choices. More particularly, we compare the order
of entrepreneurs’ expansion into markets using four independent variables:
religious community, generation, education and industrial branch. We
hypothesise that entrepreneurs of different religious origins, generation, education or industry within the Arab community in Israel, may have
different sets of opportunities. The Israeli Arab case can be treated as an
example of the impact of ethnicity and peripherality on the economic growth of marginal groups.
The first section of this chapter deals with the development of Arab
industry in Israel and the structural setting of this development. The second offers a conceptual framework for understanding market expansion,
followed by a discussion of the research methods employed in the study.
The fourth section analyses the participation of individual plants in the
different markets of the Israeli Arab space-economy. We conclude with a discussion of the selective impact of the two sets of structural barriers –
ethnicity and peripherality – on the chances of market expansion for ethnic
entrepreneurs.
Arab Industrialisation in Israel
The Arab population of the State of Israel (not including the Palestinian
Arabs living in the Gaza Strip and West Bank) constitutes a minority of about 1.2 million or 20% of the total national population of some 6 million.
They are concentrated in three major peripherally located regions. About
130 towns and villages are populated solely by Arabs in Israel, each with a
population of less than 30,000. The only exception is Nazareth, which has over 60,000 inhabitants. Figure 11.1 outlines two of these concentrations in
central and northern Israel.

Ethnic Minorities’ Strategies: The Israeli Arab Case 3
Figure 11.1 The distribution of Arab owned enterprises by
major settlements
Source: field work
From Israel’s independence in 1948 and until the mid 1990s, Arab
industrialisation went through two periods of restructuring. Soon after
independence the Israeli economy shifted to a state-managed capitalist
system in which national capital was channelled to the absorption of Jewish immigrants and refugees from the Holocaust and Arab countries and to
secure housing and employment in Jewish new towns. The Arab economy,
mainly rural, was almost completely excluded from national development projects. Production facilities that did exist were characterised by their
small size, low levels of capitalisation and intensive labour utilisation

4 Promoting Local Growth
drawn primarily from the extended family. Most plants were involved in traditional branches such as coal and lime production, stone quarrying,
olive oil pressing, flour milling and pottery making.
Only during the second half of the 1950s, after the government
released some martial law restrictions, did a large proportion of labour-force begin to commute to work-places outside its place of residence. Arab
labour was engaged in secondary labour market jobs, especially in
industries such as construction, personal services and other low-pay occupations.
During this period, the first restructuring stage took place.
Opportunities for industrial entrepreneurship in the Arab sector remained
severely limited for several reasons: a lack of capital and professional skills; a lack of experience in a market economy; and most particularly, the
absence of basic physical infrastructure in Arab communities (Haider,
1993). Risk minimisation strategies induced Arab entrepreneurs to imitate enterprises that had proven successful in the same economic environment
in which they operated, and to refrain from investing in areas where others
had failed (Czamanski and Taylor, 1986). Consequently, three industries – food, wood, and construction materials – showed significant growth
(Khamaisi, 1984). The combination of an increased demand for housing,
reliance on newly emerging local markets and capital accumulated by Arab
manual workers, gave rise to the establishment of construction firms producing for the local housing market (Schnell, 1994).
A new period of development started after the 1967 Six-Day War,
when the national economy restructured into a corporate dominated system (Hasson, 1981). During this period, large corporations located in the central
region of the country developed production plants in the peripheral areas
thereby creating jobs for Arab workers in neighbouring towns and villages (Gradus et al., 1993). By the late 1970s most Arab settlements had acquired
basic infrastructure. Thousands of Arab workers, through employment in
Jewish-owned firms, had gained industrial and professional experience, and
there was a rise in Arab educational levels. Under these conditions a new generation of entrepreneurs emerged and women began to join the labour
force. Selective government policies, aimed at increasing Jewish population
and economic activity, continued to ignore Arab industry, leaving the Arab periphery almost totally dependent either on growth from below or on sub-
contracting for Jewish owned corporations.
The most significant change during this period was the introduction
of textile and clothing plants. Managed by Arab sub-contractors, clothing plants employed the large Arab female labour force characterised by low
geographic mobility. With these plants rapidly becoming large industrial
Ethnic Minorities’ Strategies: The Israeli Arab Case 5
employers, internal dependency was also created, with local labour largely dependent on these plants for employment.
The expansion of indigenous Arab industries during this period was
based on regional markets and providing sub-contracting to Jewish
corporations in the textile and clothing industries. In 1983, Khamaisi (1984) counted 415 plants in Arab settlements. Only one third of them
employed more than 10 workers and most of these were sub-contractors to
Jewish-owned plants. More than 40% were allied to the construction industry, about one third were in textile and clothing and most of the rest in
food production. Arab plants (with at least three workers each) employed
that year about 3,000 workers, with 70% of them women.
By 1992, over 900 firms existed in Arab settlements with about 13,000 employees (Atrash, 1993; Schnell et al., 1995). Nevertheless, Arab-
owned enterprises employing five workers or more represented only 5.5%
of all such plants in Israel, and they employed only 3.2% of the industrial labour-force (Central Bureau of Statistics, 1995). The average size of Arab-
owned plants grew from about seven workers in 1983 (Khamaisi, 1984), to
around fifteen in 1992 (Schnell et al., 1995). Almost all were owned jointly by family members, and only about one quarter were formally organised as
corporations. Textiles became the leading industry with the largest number
of plants and workers as well as sales per plant.
The ethnic structure of the Arab population is of considerable importance in understanding their industrialisation. The Christian Arabs
and Druze communities each accounting for about 10% of the Israeli Arab
population, have certain advantages that allow them to exploit economic opportunities and break out of traditional patterns of work and
employment. The Christian community has a higher level of education,
smaller families and thus more opportunity for saving and investment, and training than the general Arab population. This allowed them easier entry
into entrepreneurship (Schnell et al., 1995).
Members of the Druze community are closer to the Moslems in
terms of demographic behaviour and education. However, they have a certain preferential status regarding government aid. The Israeli
government has assisted Druze villages and has provided basic physical
infrastructure for industry. In addition, Druze youngsters serve in the Israeli army, exposing themselves to Jewish culture, and open social networks to
Jewish society. As a result, the index of average entrepreneurship for
Muslims lags somewhat behind the index for the Christians and Druze
(Schnell et al., 1995).

6 Promoting Local Growth
Conceptual Framework
The specific form of developing markets by Israeli Arabs’ may be
explained by theories of ethnic entrepreneurship, in particular the ethnic
enclave theory. This argues that ethnic economies are self-contained
entities that generate a variety of inputs and outputs within the ethnic community. Profits and earnings remain internal, producing multiplier
effects as firms purchase mainly from intra-ethnic suppliers (Waldinger,
1993). However, there are some debates concerning the advantages of enclave economies for ethnic communities. Some studies confirm the
emergence of enclave economies and their benefits to ethnic communities
(Portes and Jensen, 1989; Jensen and Portes, 1992; Zhou and Logan, 1989).
Other studies question the benefits of limited and deprived enclave economies (Nee and Sanders, 1987; Sanders and Nee, 1992).
Studies of ethnic businesses rarely analyse the structural context in
which ethnic industries develop (Barrett et al., 1996). It is argued, however, that entrepreneurship is always embedded in socio-cultural structures
(Grabher, 1993; Kloosterman et al., 1999; Oinas, 1999; Taylor, 1999).
Aldrich and Waldinger (1990) set the foundation for a theoretical framework which incorporates structural aspects in theorising ethnic
economies. They stress three major factors. First, the importance of the
opportunity structure as it is formed in a historical context and by political
decisions. Forms of capital accumulation are an example of one key factor that may structure selective opportunities on both sides of the ethnic divide.
Second, access to enterprise ownership may channel ethnic groups either to
low rewarding enterprises, or to a segregated ethnic economy according to the degree of inter-ethnic competition. Third, ethnic group characteristics,
such as their orientation toward entrepreneurship, may influence their
forms of integration into the general economy. Exposure to racism and differences in entrepreneurial cultures seem
to affect ethnic entrepreneurs in their choice of markets. Ethnic
entrepreneurs tend to operate in different business cultures. Therefore,
members of marginal groups who seek to break out of their enclave economy are frequently forced to adapt to the dominant business culture.
This may result in mounting difficulties, which must be overcome in order
to establish business connections among bodies on the two sides of the ethnic divide (Camagni, 1991; Ratti, 1992). There is evidence that in many
cases members of a minority group are marginalised and even excluded
from certain markets as a result of racism (Miles, 1989). In response, ethnic
minorities may enhance a spirit of mutual trust, co-operation and collective self-help, as a facilitator of ethnic enterprise development (Light, 1984;
Light and Bonacich, 1988). Entrepreneurs may then use this sense of ethnic

Ethnic Minorities’ Strategies: The Israeli Arab Case 7
solidarity to enlist production factors, such as labour, capital, management, and markets, from more accessible intra-ethnic sources (Aldrich and
Waldinger, 1990)
.
With respect to ethnic barriers, we can identify four marketing categories according to the size of the market hinterland and to ethnic
boundaries (Jones et al., 1992). First, there are local intra-ethnic markets,
which follow the logic of the ‘ethnic enclave theory’ (Semyonov and Lewin-Epstein, 1993). Second, there are local inter-ethnic markets, which
follow the ‘middle man model’ (Ward, 1985; Jones et al., 1993). Third,
there are non-local intra-ethnic markets, which may develop when ethnic
barriers remain durable while economic opportunities are growing within ethnic markets elsewhere. In this case, an autonomous ethnic economy may
emerge, including possibly high-order firms and wholesalers supplying the
autonomous economy. Fourth, there are non-ethnic non-local markets, which may emerge when potential markets are unbounded (Jones et al.,
1993).
Location in peripheral regions may place an added economic burden on ethnic entrepreneurs. Distance in social and economic terms from large
markets and complementary economic activities, upon which the
functioning of the plant depends, obviously reduces opportunities.
Moreover, remoteness from the economies of scale, from information on market conditions, and from the chance to evaluate the potential of various
opportunities may block growth even further (Pred, 1977; Van Geenhuizen
and Nijkamp, 1995). Peripheral industries in the early stages of growth tend to suffer from a lack of risk reducing mechanisms. As a consequence,
entrepreneurs find it almost impossible to break the local barriers of
economic networks. In many cases, further development may only be stimulated by public intervention (Grossman, 1984). Given the lack of risk
reduction institutions, entrepreneurs may adopt a mimicking strategy which
leads to the opening of a large number of similar small enterprises that are
content to make do with the low profits afforded by limited local markets (Czamanski and Taylor, 1986).
Once such entrepreneurs gain some experience and they succeed in
breaking local barriers, their routes of development may be channelled by large corporations. Industries in the peripheral regions tend to expand into
the marketing chains in a clear spatial division of functions. The first type
are the large plants, characterised by the labour-intensive mass production
of inexpensive standardised products for national markets. Here, most sales are directed to the large markets located primarily in large metropolitan
core areas. The second type includes small businesses existing alongside
larger enterprises. These plants mainly manufacture intermediate products,

8 Promoting Local Growth
which constitute inputs for the larger enterprises in their regions, or serve the demand created by local end-users. Most products of these plants are
thus sold within the peripheral region itself (Felsenstein, 1992). Under such
conditions, the factors of ethnicity and peripherality may place cumulative
burdens on the processes of industrial growth and market expansion (Schnell et al., 1995). Schnell, Benenson and Sofer (1999) show that both
factors constitute an economic space that may be theoretically divided into
sixteen possible sub-regions having markets on four different levels: local, regional, national and international, each of them sub-divided into either
core or peripheral markets and intra- and inter-ethnic markets.
In applying this general process to the case of Arab industry in Israel,
several patterns of business development emerge. Initially, Israeli Arabs relied on mimicking behaviour strategies which channelled them into local
intra-ethnic markets. Only since the 1980s have an increasing number of
Arab entrepreneurs attempted to break into new, more demanding, and riskier markets. At present, Israeli Arab entrepreneurs have expanded into
five out of nine sub-markets (Schnell et al., 1999):
1) intra-settlement markets making up 25% of total sales; 2) intra-ethnic markets, within the home region, counting for 26% of
total sales;
3) neighbouring Jewish markets making up about 19% of total sales;
4) inter-regional, intra-ethnic markets counting for 3% of total sales; and
5) core Jewish markets to which 27% of total sales are directed.
Most Arab plants expand into new markets using two major alternative strategies. Firstly, they expand from close markets to more
distant ones, starting with local and home regional markets, then expanding
into ethnic markets and only as a last choice expanding into distant Arab markets. Secondly, they adapt a strong orientation to metropolitan markets
and expand from them to the other markets.
Research Method
Two major research questions inform our analysis of ethnic minorities’ market expansion strategies. First, is it possible to understand the disparity
in market expansion and the order of expansion or contraction of markets
using variables such as the inter-generational gap, level of education and ethnic-religious groups? Based on earlier work we assume that until the
1970s Israeli Arab industry was solely based on local sales linkages and on

Ethnic Minorities’ Strategies: The Israeli Arab Case 9
intra-settlement markets. If so, any later expansion into additional markets may indicate a change in the pattern of sales linkages. Second, to what
extent did entrepreneurs of different groups manage to break ethnic and
peripheral barriers, thus enabling them to expand into inter-ethnic and inter-
regional markets, and increasingly to exploit opportunities in the Israeli economy?
Sample
A sample of Arab settlements and enterprises was surveyed in 1992 for an extensive study of Arab industry and industrial entrepreneurship in Israel
(Schnell et al., 1995). An Arab enterprise was defined as any plant that is
Arab-owned, acting as a production unit and employing at least three
workers. Of the 900 Arab-owned enterprises operating in 1992, the managers and owners of 514 plants (57% of the total) were interviewed.
These respondents were located in 35 of the 61 Arab town and villages that
had industrial plants. This included 80% of the settlements in the mountainous Galilee and the Little Triangle regions (Figure 11.1). In most
of the 35 settlements, all plants were surveyed. In the largest settlements
(Nazareth, Shefaram, Taiyibe, and Um el Fahm) a random sample of plants was used. In Nazareth the survey covered about 25% of the plants, and
about 70% in the other three settlements. For the aggregate analysis, data
for these settlements were weighted by a factor determined by the size of
the sample. The survey was comprehensive, examining among other questions, the origin of inputs, destination of outputs, and related
characteristics such as sector and types of product (Schnell et al., 1995).
Data Analysis
The data were analysed in two stages. First, groups of plants that
participated in common configurations of the five sub-markets listed
previously, were analysed, and the relative impact of each of the two structural forces of ethnicity and space economy on the emerging pattern
was examined. Second, differences among the three generations of plants,
religious origin, and educational groups of their owners were tested.
The investigation uses Partial Ordinal Scalogram Analysis - POSA (Guttman, 1965). POSA analyses the plant profile which describes its
pattern of participation in the markets. The profile is a Boolean vector, with
the number of components equal to the number of sub-markets discerned, and a given component of a profile equals one if the plant participates in a
certain market and zero otherwise. We denote participation in a given sub-
market using symbols. Thus, instead of using a binary rotation (1.0) to
10 Promoting Local Growth
indicate sales to a metropolitan core region, we use M,0 where ‘M’ indicates sales to a metropolitan market and ‘0’ indicates sales elsewhere.
POSA begins with a graph of market inclusions. The nodes of this
graph correspond to profiles and are vertically arranged by levels, in
accordance with the number of markets in which the plant participates. The lowest level consists of nodes corresponding to profiles of one market only,
the next level those with two markets, and so on. The edges of a graph
connect nodes of adjacent levels only: two nodes are connected if the profile on the upper level includes all markets of the profile on the lower
one. The aim of POSA is to rearrange the nodes at each level in order to
obtain a planar presentation of a graph, titled a scalogram. There are no
available techniques for assessing the ‘most planar’ representation of a given graph. For the relatively simple graphs, considered below, this is
done on the basis of trial and error.
Usually a planar scalogram can be constructed for a graph with a low number of edges only, but this is not the case for the all-market inclusions
revealed for Arab industry. In this latter situation we consider the most
planar presentation of a graph of inclusions, that is, we try to arrange the nodes in a way that minimises the number of intersecting edges. The planar
or near planar scalogram displays the expansion or withdrawal of
individual plants from markets (Lingoes, 1973), thus allowing an
understanding of the evolution of the individual plants within the set of markets. The conclusions concerning markets development are based on
the assumption that decisions are made in a pre-structured milieu, and,
therefore, are repetitive. The POSA unravels common patterns of market expansion and contraction, as structured by past decisions.
In general, our interest is in the disparity between frequent and less
frequent market profiles. We begin with constructing scalograms for the more frequent profiles, and subsequently extend the analysis by adding less
frequent ones. This procedure allows the investigation of the major and
marginal routes of plants’ expansion into new markets or withdrawal from
them. We are then able to compare across scalograms constructed for entrepreneurs who belong to different generations, ethnic groups and
education levels.
According to our earlier study (Schnell et al., 1999), the structure of developing markets for textile and clothing plants differs greatly from the
plants belonging to other industries. Consequently, we always begin our
analysis with all industries taken together (aside from textile and clothing),
and test at a later stage whether the inclusion of the textile and clothing industry influences the results.
Ethnic Minorities’ Strategies: The Israeli Arab Case 11
Results
Plants Forms of Participation in Markets
The number of all possible participation profiles for plants with five
potential markets equals 25
- 1 = 31. In practice, 22 forms of participation
profiles are identified as shown in Table 11.1.
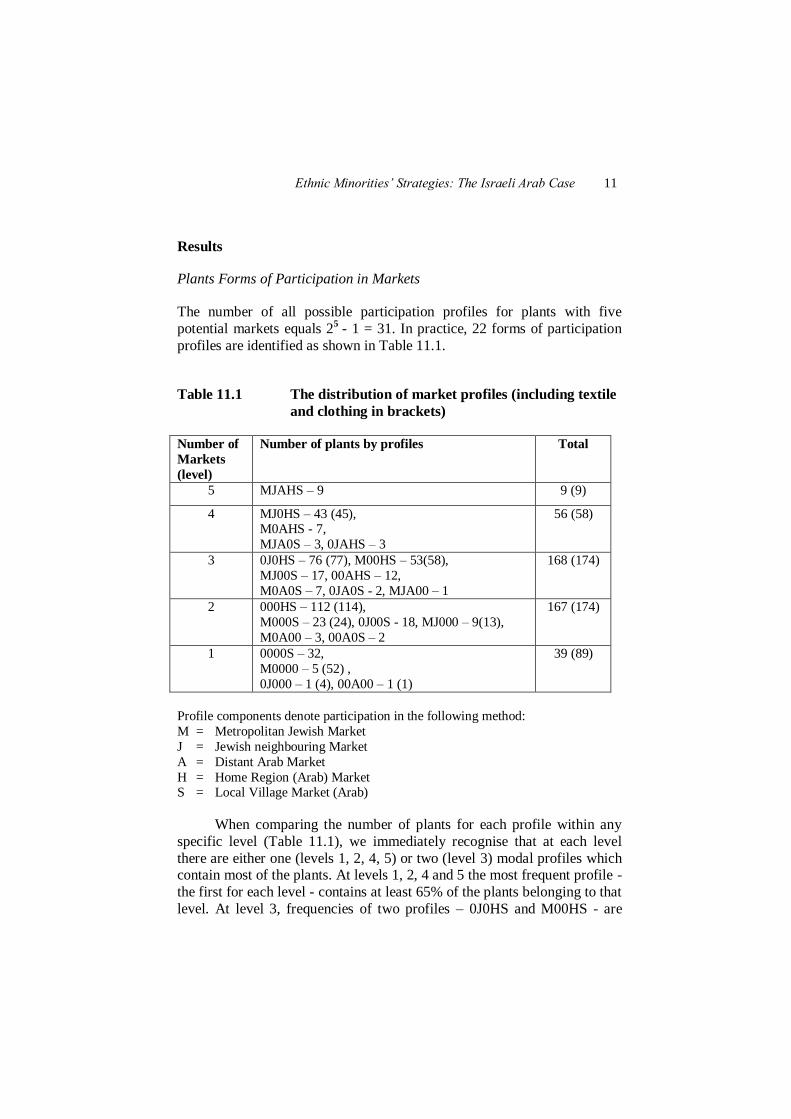
Table 11.1 The distribution of market profiles (including textile
and clothing in brackets)
Number of
Markets
(level)
Number of plants by profiles
Total
5 MJAHS – 9 9 (9)
4 MJ0HS – 43 (45), M0AHS - 7,
MJA0S – 3, 0JAHS – 3
56 (58)
3 0J0HS – 76 (77), M00HS – 53(58),
MJ00S – 17, 00AHS – 12,
M0A0S – 7, 0JA0S - 2, MJA00 – 1
168 (174)
2 000HS – 112 (114),
M000S – 23 (24), 0J00S - 18, MJ000 – 9(13),
M0A00 – 3, 00A0S – 2
167 (174)
1 0000S – 32,
M0000 – 5 (52) ,
0J000 – 1 (4), 00A00 – 1 (1)
39 (89)
Profile components denote participation in the following method:
M = Metropolitan Jewish Market
J = Jewish neighbouring Market
A = Distant Arab Market
H = Home Region (Arab) Market S = Local Village Market (Arab)
When comparing the number of plants for each profile within any
specific level (Table 11.1), we immediately recognise that at each level
there are either one (levels 1, 2, 4, 5) or two (level 3) modal profiles which contain most of the plants. At levels 1, 2, 4 and 5 the most frequent profile -
the first for each level - contains at least 65% of the plants belonging to that
level. At level 3, frequencies of two profiles – 0J0HS and M00HS - are
12 Promoting Local Growth
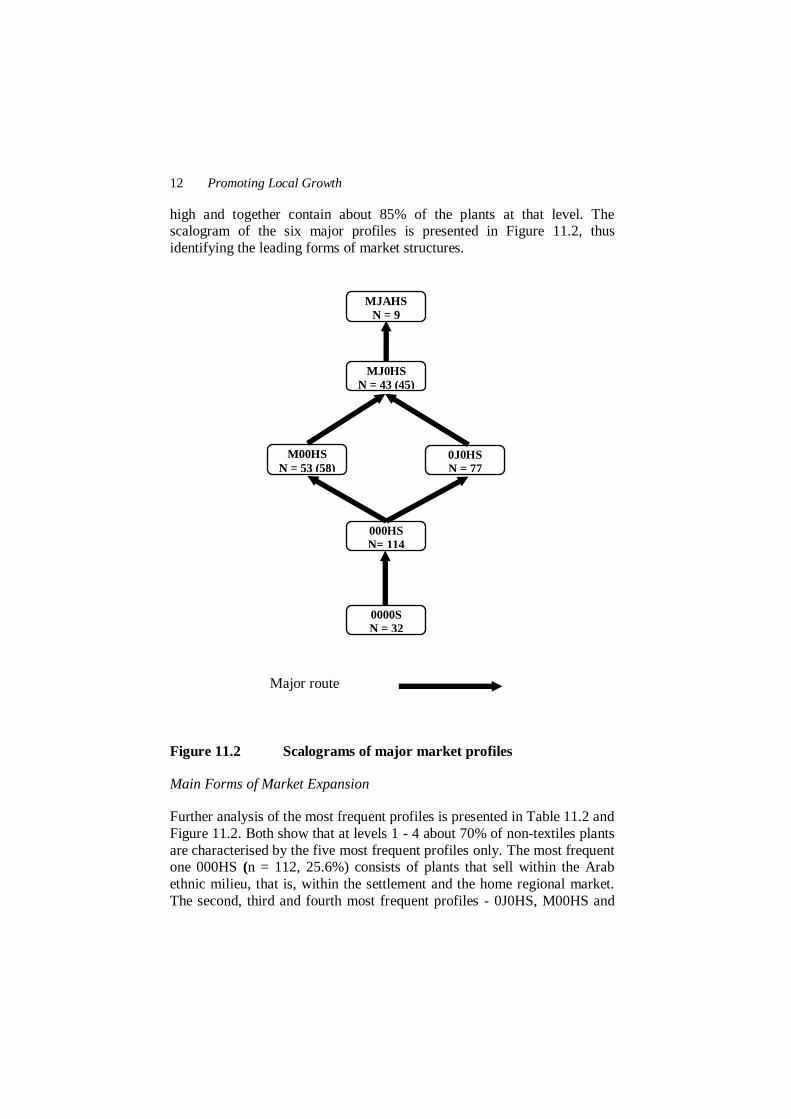
high and together contain about 85% of the plants at that level. The scalogram of the six major profiles is presented in Figure 11.2, thus
identifying the leading forms of market structures.
Figure 11.2 Scalograms of major market profiles
Main Forms of Market Expansion
Further analysis of the most frequent profiles is presented in Table 11.2 and
Figure 11.2. Both show that at levels 1 - 4 about 70% of non-textiles plants
are characterised by the five most frequent profiles only. The most frequent one 000HS (n = 112, 25.6%) consists of plants that sell within the Arab
ethnic milieu, that is, within the settlement and the home regional market.
The second, third and fourth most frequent profiles - 0J0HS, M00HS and
0000S
N = 32
MJAHS
N = 9
MJ0HS
N = 43 (45)
000HS
N= 114
M00HS
N = 53 (58) 0J0HS
N = 77
Major route
Ethnic Minorities’ Strategies: The Israeli Arab Case 13
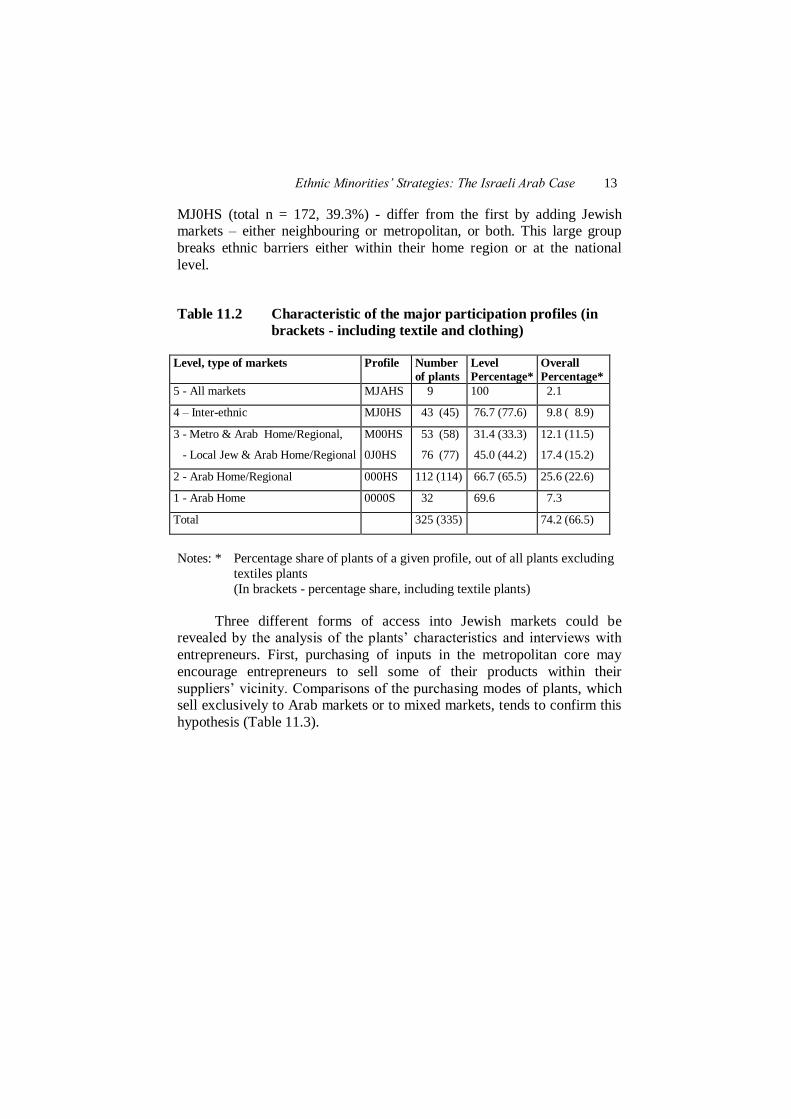
MJ0HS (total n = 172, 39.3%) - differ from the first by adding Jewish markets – either neighbouring or metropolitan, or both. This large group
breaks ethnic barriers either within their home region or at the national
level.
Table 11.2 Characteristic of the major participation profiles (in
brackets - including textile and clothing)
Level, type of markets Profile Number
of plants
Level
Percentage*
Overall
Percentage*
5 - All markets MJAHS 9 100 2.1
4 – Inter-ethnic MJ0HS 43 (45) 76.7 (77.6) 9.8 ( 8.9)
3 - Metro & Arab Home/Regional,
- Local Jew & Arab Home/Regional
M00HS
0J0HS
53 (58)
76 (77)
31.4 (33.3)
45.0 (44.2)
12.1 (11.5)
17.4 (15.2)
2 - Arab Home/Regional 000HS 112 (114) 66.7 (65.5) 25.6 (22.6)
1 - Arab Home 0000S 32 69.6 7.3
Total 325 (335) 74.2 (66.5)
Notes: * Percentage share of plants of a given profile, out of all plants excluding
textiles plants
(In brackets - percentage share, including textile plants)
Three different forms of access into Jewish markets could be revealed by the analysis of the plants’ characteristics and interviews with
entrepreneurs. First, purchasing of inputs in the metropolitan core may
encourage entrepreneurs to sell some of their products within their
suppliers’ vicinity. Comparisons of the purchasing modes of plants, which sell exclusively to Arab markets or to mixed markets, tends to confirm this
hypothesis (Table 11.3).

14 Promoting Local Growth
Table 11.3 Market profile and purchasing rate from Jewish
suppliers
Group of plants Market
profile
Purchases from Jews among
All inputs purchases
Weighted
mean
Plants that sell to
Arab markets only
0000S 45%
52.2% 000HS 55%
00AHS 45%
Plants that sell to
mixed markets
0J0HS 75%
75.3% M00HS 72%
MJ0HS 80%
Second, interviews with entrepreneurs belonging to the textile and
clothing branch reveal that they started as sub-contractors to Jewish
metropolitan-based industries and thus their dependence on Jewish markets is an inherent characteristic. Taking the textile and clothing industry into
consideration enables one more high frequent profile, M0000, which
consists of 47 textile plants and 5 plants belonging to other branches of industry (taken together, 10.3% of all plants). Combining all the surveyed
plants, the proportion that belongs to the main profiles and breaks ethnic
barrier is 45.8%.
Interviews reveal a third form of access to Jewish markets which exists amongst entrepreneurs located in settlements closer to the
metropolitan areas. This is characterised by sales linkages to occasional
Jewish customers in trading linkages that take place in Arab towns and villages.
Secondary Forms of Market Expansion
By adding the second most frequent profiles to the scalogram of the major profiles, we are able to reveal alternative market strategies that are used by
about 20% of Israeli Arab entrepreneurs, i.e. those using one or more
marginal form of expansion when trying to access new markets (Figure
11.3). Some of these strategies may represent past and residual forms of market participation, while others may represent new forms of expansion
into the market (Table 11.4).
Ethnic Minorities’ Strategies: The Israeli Arab Case 15
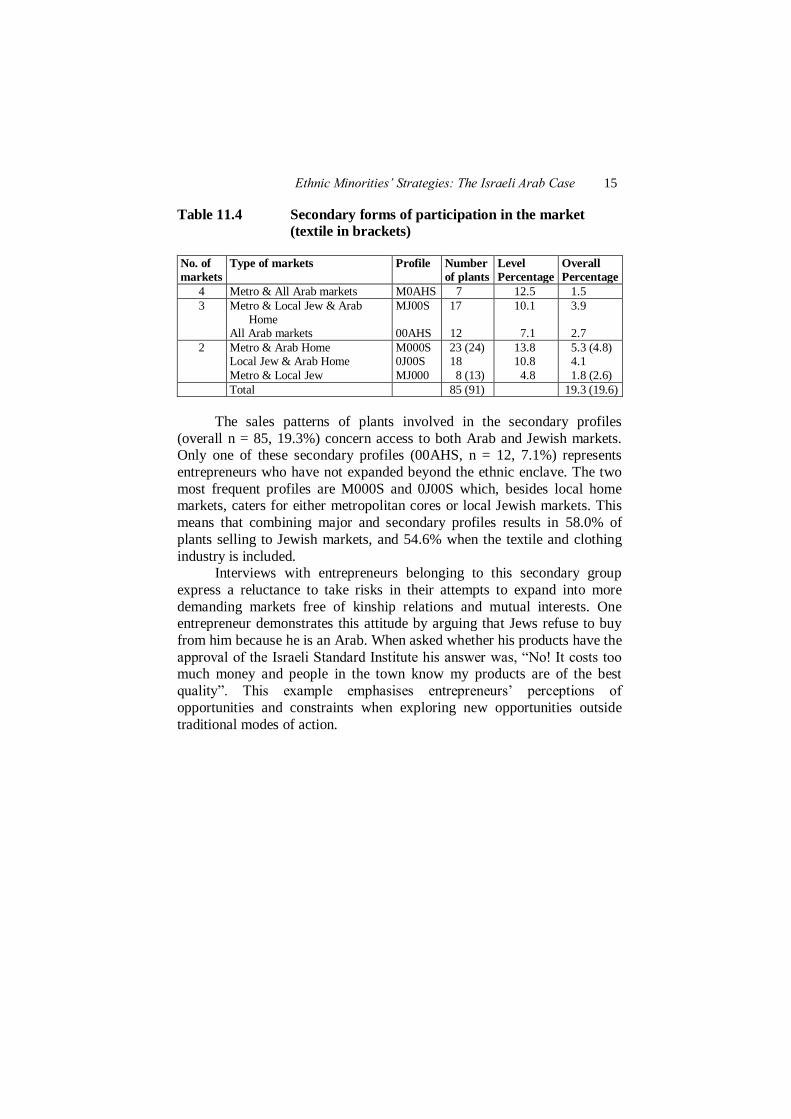
Table 11.4 Secondary forms of participation in the market
(textile in brackets)
No. of
markets
Type of markets Profile Number
of plants
Level
Percentage
Overall
Percentage
4 Metro & All Arab markets M0AHS 7 12.5 1.5
3 Metro & Local Jew & Arab Home
All Arab markets
MJ00S 00AHS
17
12
10.1
7.1
3.9
2.7
2 Metro & Arab Home Local Jew & Arab Home
Metro & Local Jew
M000S 0J00S
MJ000
23 (24) 18
8 (13)
13.8 10.8
4.8
5.3 (4.8) 4.1
1.8 (2.6)
Total 85 (91) 19.3 (19.6)
The sales patterns of plants involved in the secondary profiles
(overall n = 85, 19.3%) concern access to both Arab and Jewish markets. Only one of these secondary profiles (00AHS, n = 12, 7.1%) represents
entrepreneurs who have not expanded beyond the ethnic enclave. The two
most frequent profiles are M000S and 0J00S which, besides local home markets, caters for either metropolitan cores or local Jewish markets. This
means that combining major and secondary profiles results in 58.0% of
plants selling to Jewish markets, and 54.6% when the textile and clothing
industry is included. Interviews with entrepreneurs belonging to this secondary group
express a reluctance to take risks in their attempts to expand into more
demanding markets free of kinship relations and mutual interests. One entrepreneur demonstrates this attitude by arguing that Jews refuse to buy
from him because he is an Arab. When asked whether his products have the
approval of the Israeli Standard Institute his answer was, “No! It costs too much money and people in the town know my products are of the best
quality”. This example emphasises entrepreneurs’ perceptions of
opportunities and constraints when exploring new opportunities outside
traditional modes of action.

16 Promoting Local Growth
Figure 11.3 Scalogram of major and secondary market profiles
The Complete Scalogram
Eight of the existing 22 profiles contain four or less plants (including textile and clothing n = 19, 3.8%). These plants can be added to the scalogram of
the main and secondary profiles without multiplying non-planar relations
(Figure 11.4). According to this full scalogram, about 94% of all plants have developed markets other than within their home settlement. The
overall distribution of plants according to the numbers of markets they
accessed, shows that the tendencies revealed by the most frequent profiles
MJAHS
N = 9
M0AHS
N = 7
MJ0HS N = 43 (45)
0000S
N = 32 M0000
N = 9 (52)
MJ00S
N = 17
00AHS
N = 12
M00HS
N = 53 (58)
0J0HS
N = 77
0J00S
N = 18
000HS
N= 114 MJ000
N = 8 (13) M000S
N = 23 (24)
Major
Secondary
POSA routes
Ethnic Minorities’ Strategies: The Israeli Arab Case 17
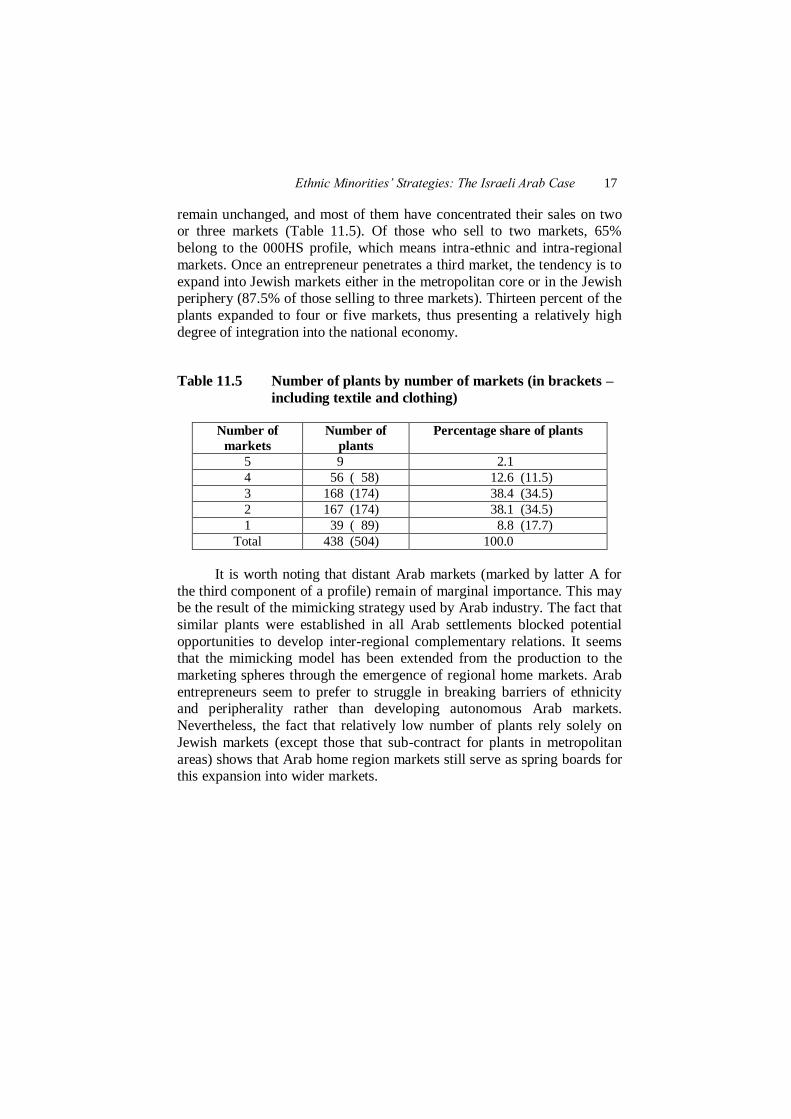
remain unchanged, and most of them have concentrated their sales on two or three markets (Table 11.5). Of those who sell to two markets, 65%
belong to the 000HS profile, which means intra-ethnic and intra-regional
markets. Once an entrepreneur penetrates a third market, the tendency is to
expand into Jewish markets either in the metropolitan core or in the Jewish periphery (87.5% of those selling to three markets). Thirteen percent of the
plants expanded to four or five markets, thus presenting a relatively high
degree of integration into the national economy.
Table 11.5 Number of plants by number of markets (in brackets –
including textile and clothing)
Number of
markets
Number of
plants
Percentage share of plants
5 9 2.1
4 56 ( 58) 12.6 (11.5)
3 168 (174) 38.4 (34.5)
2 167 (174) 38.1 (34.5)
1 39 ( 89) 8.8 (17.7)
Total 438 (504) 100.0
It is worth noting that distant Arab markets (marked by latter A for
the third component of a profile) remain of marginal importance. This may be the result of the mimicking strategy used by Arab industry. The fact that
similar plants were established in all Arab settlements blocked potential
opportunities to develop inter-regional complementary relations. It seems that the mimicking model has been extended from the production to the
marketing spheres through the emergence of regional home markets. Arab
entrepreneurs seem to prefer to struggle in breaking barriers of ethnicity and peripherality rather than developing autonomous Arab markets.
Nevertheless, the fact that relatively low number of plants rely solely on
Jewish markets (except those that sub-contract for plants in metropolitan
areas) shows that Arab home region markets still serve as spring boards for this expansion into wider markets.

E
thn
ic Min
orities’ S
trateg
ies: The Isra
eli Ara
b C
ase
18
Figure 11.4 Complete scalogram of market profiles
MJAHS
N = 9
M0AHS
N = 7
MJ0HS
N = 43 (45)
0JAHS
N = 3 MJA0S
N = 3
MJ00S
N = 17
00AHS
N = 12
M00HS
N = 53
(58)
0J0HS
N = 77 0JA0S
N = 2
M0A0S
N = 7
MJA00
N = 1
0J00S
N = 18
000HS
N= 114 MJ000
N = 8 (13) M000S
N = 23
(24)
00A0S
N = 2 M0A00
N = 3
0000S
N = 32 M0000
N = 9 (52)
00A00
N = 1 0J000
N = 4
Major Marginal
Secondary Non-planar
POSA routes

Ethnic Minorities’ Strategies: The Israeli Arab Case 19
To conclude, Arab entrepreneurs split into two major groups. The first group comprises plants operating within regional markets in the
national periphery, exhibiting a strong preference to operate in intra-ethnic
markets. Those who sell solely within the local area (village, town) may be
viewed as entrepreneurs who are unable to integrate into the regional economy. The second group of entrepreneurs comprises those able to
expand into Jewish markets once opportunities in home markets have been
exploited.
Differences Among Groups of Entrepreneurs
Three entrepreneurial characteristics seem to be of importance when
businesses choose markets: religious origin, age and education. None of
these provides significant differences between the scalograms as a whole when all profiles are accounted for. However, stratifying by religious group
and date of establishment yields some revealing results.
It can be suggested the routes of market expansion adopted by Moslem, Christian, and Druze communities may be different due to their
different reactions to ethnic barriers. Moslems may rely on larger local and
intra-ethnic markets, while Christian and Druze communities may suffer from disadvantages of being minorities within a minority. Druze may better
integrate into the Jewish economy, due to the fact that they serve in the
army and therefore gain more legitimacy by the Jewish society.
Partial Ordinal Scalogram Analysis for the three communities demonstrates considerable similarity in the forms of local market expansion
they adopt. There are, nevertheless, differences in the forms they select for
expansion beyond the settlement. More than 80% of the Moslem-owned plants expand their markets by adding the neighbouring settlements to
progress from the 0000S market to 000HS market. By contrast, half of the
Christian entrepreneurs choose the Jewish market as a second destination when expanding outside 0000S (Table 11.6, Figure 11.5). The number of
Druze-owned plants is too low for comparison, though they tend to follow
the Moslem pattern in this stage of market expansion.
It is interesting to investigate whether variables measuring the age (i.e. the generation of entrepreneurship) and education of entrepreneurs
have an impact on firm’s expansion into a third market, thus breaking
barriers of peripherality and ethnicity. We hypothesise that less educated entrepreneurs are less qualified and have greater difficulties of integrating
into a modern economy. In other words, plants founded during the last
decade have more opportunities to integrate into the larger national
economy than those established earlier.

20 Promoting Local Growth

Ethnic Minorities’ Strategies: The Israeli Arab Case 21
Figure 11.5 Scalograms of expansion from local to metropolitan
markets by religious origin
0000S
N = 21 M0000
N = 4(33)
0J00S
N = 9
000HS
N = 85(86) MJ000
N = 7(11)
M000S
N = 13(14)
0000S
N = 4 M0000
N = 8(8)
0J00S
N = 8
000HS
N= 17 MJ000
NONE
M000S
N = 8
0000S
N = 6 M0000
N = 5(5)
0J00S
N = 1
000HS
N = 10(11) MJ000
N = 2
M000S
N = 2
Muslims
Christians
Druze
Major
Secondary
POSA routes

22 Promoting Local Growth
Table 11.6 The distribution of second markets by communities
(textile and clothing data in brackets)
Religious
Origin of
Entrepreneur
Second market
exists (number of
plants having 000HS
profile)
Jews as a second
market (number of
plants having M000S,
0J00S, MJ00S profiles)
Percentage
of H as a
second
market
Moslems 85 (86) 29 (34) 74.5 (71.7)
Christians 17 16 51.5
Druze 10 (11) 5 66.7 (68.7)
Figure 11.6 shows a comparison of scalograms for three periods of
plant openings, which serves as surrogate for different generations. The figure shows that different generations expand out of the local market using
different entrepreneurial strategies. An innovative trend that started to
appear in the 1990s is the tendency to expand from markets in the home
settlement directly into neighbouring Jewish markets. The younger generation follows a pattern of expansion similar that of Christian
entrepreneurs. Owners of recently established plants select the Jewish
market as a second destination more frequently than plants established in
earlier periods (Table 11.7, where for non-textile plants 2 = 4.61, df = 2,
p ~ 0.1). We hypothesise that this tendency characterises young and highly
educated entrepreneurs, who face the low potential of local intra-ethnic
markets, and who make deliberate efforts to break ethnic barriers.
Table 11.7 The distribution of second markets by period of
establishment (textile and clothing data in brackets)
Period of
establishment
Second market
exists (number of
plants having
000HS profile)
Jews as a second
market (numbers of
plants having M000S,
0J00S, MJ00S profiles)
Percentage of
H when A
second market
Before 1976 20 5 ( 6) 80.0 (76.9)
1976 – 1985 57 (59) 21 73.1 (73.7)
After 1985 35 24 (28) 59.3 (55.5)

Ethnic Minorities’ Strategies: The Israeli Arab Case 23
Figure 11.6 Scalograms of expansion from local and
metropolitan markets by period of establishment
0000S
N = 5 M0000
N = 1(8)
0J00S
N = 2
000HS
N= 20 MJ000
N = 2(3)
M000S
N = 1 Founded before
1975
0000S
N = 11 M0000
N = 1(23)
0J00S
N = 6
000HS
N = 57(59) MJ000
N = 3
M000S
N = 12 Founded
between 1975
and 1985
0000S
N = 16 M0000
N = 3(21)
0J00S
N = 10
000HS
N= 35 MJ000
N = 4(7)
M000S
N = 10(11) Founded
after 1985
Major
Secondary
POSA routes

24 Promoting Local Growth
Conclusions
Arab industry in Israel has undergone significant restructuring.
Traditionally, Arab entrepreneurs were almost completely excluded from
the country’s more privileged, large, institutionalised markets, being
channelled either into their limited home region markets, occasional markets or secondary markets; some of which are in the vicinity of their
suppliers in the national core. The majority of Arab entrepreneurs have
made only limited efforts to expand into distant Arab markets, relying on home region markets as an anchor for further expansion into Jewish
markets. Others have used secondary metropolitan markets as a
springboard to expand into intra-regional Arab markets.
The analyses presented in this chapter demonstrate that ethnic minorities in Israel use two major routes to achieve market expansion; from
the close to the distant, and from the metropolitan to the other markets.
They represent two forms of marginal development. The dominant route is characteristic of entrepreneurship that grows from below (Falah, 1993).
Only when entrepreneurs shift into a third type of market are the intra-
regional and intra-ethnic barriers of the national periphery broken. The second route, expanding into ethnically mixed markets with emphasis on
metropolitan markets, is executed under conditions of dependency, with
Arab entrepreneurs sub-contracting for Jewish firms, or relying on
occasional (Jewish) customers. According to ethnic enclave theory, entrepreneurs can be expected to
prefer intra-ethnic market outlets and to use them as an anchor for further
expansion. The current case shows that the majority of ethnic minority entrepreneurs in Israel follow this line of development. However, small
groups of entrepreneurs tend to search for alternative routes for market
expansion. Investigation of these alternatives confirms our argument, presented in earlier research (Schnell et al., 1995), that Arab entrepreneurs
are highly motivated and willing to exploit any slight chances for market
expansion. Two significant developments are of particular interest. First,
these are those firms that anchor their market expansion on marginal metropolitan markets, and second, there is a small group of new
entrepreneurs who, in the first instance, make an effort to expand into
Jewish markets. Our results further confirm that the majority of ethnic minority plants
remain restricted to regional markets within peripheral areas, and that even
those that expand beyond the region remain subject to other barriers of
peripherality. Several results suggest the conclusion that these barriers of peripheriality are stronger than barriers of ethnicity. While more than two
Ethnic Minorities’ Strategies: The Israeli Arab Case 25
thirds of the entrepreneurs break ethnic barriers by selling to Jewish markets, less than half sell to core metropolitan markets, and a smaller
proportion sell to large corporations. In addition, we found that Druze
entrepreneurs show a tendency to expand in the earlier stages of their
enterprise development into Jewish markets, but that their pattern of sales overall does not differ significantly from that of the Moslems. This is due
to the fact that both face peripheriality constraints.
References
Aldrich, H.E. and Waldinger, R. (1990), ‘Ethnicity and Entrepreneurship’, Annual
Review of Sociology, vol. 16, pp. 111-135.
Atrash, A. (1993), ‘The Arab industry in Israel: Branch Structure, Employment and
Plant Formation’, Economics Quarterly, vol. 152 pp. 112-120 (Hebrew).
Barrett, G.A., Jones, T.V. and McEvoy, D. (1996), ‘Ethnic Minority Business:
Theoretical Discourse in Britain and North America’, Urban Studies, vol.
33, no. 4-5, pp. 783-809.
Best, M. (1990), The New Competition: Institutions of Industrial Restructuring,
Harvard University Press, Cambridge, MA.
Camagni, R. (1991), ‘Local ‘Milieu’, Uncertainty and Innovation Network:
Toward a New Dynamic Theory of Economic Space’, In R. Camagni (ed.), Innovation Networks: Spatial Perspectives, Belhaven Press, London, pp.
121-144.
Central Bureau of Statistics (1995), Statistical Abstracts of Israel, Jerusalem.
Czamanski, D. T. and Taylor, T. K. (1986), ‘Dynamic Aspects of Entrepreneurship
in Arab Settlements in Israel’, Horizons, vol. 17-18, pp. 125-144 (Hebrew).
Falah, G. (1993), ‘Trends in the Urbanization of Arab Settlements in Galilee’,
Urban Geography, vol. 14, no. 2, pp. 145-164.
Felsenstein, D. (1992), ‘Assessing the Effectiveness of Small Business Financing
Schemes: Some Evidence From Israel’, Small Business Economics, vol. 4,
pp. 273-285.
Grabher, G. (1993), The Embedded Firm, Routledge, London. Gradus, Y., Razin, E. and Krakover, S. (1993), The Industrial Geography of Israel,
Routledge, London.
Guttman, L. A. (1965), ‘A General Nonmetric Technique for Finding the Smallest
Euclidean Space for a Configuration of Points’, Psychometrika, vol. 33, pp.
469-506.
Grossman, G.M. (1984), ‘International Trade, Foreign Investment, and the
Formation of the Entrepreneurial Class’, The American Economic Review,
vol. 10, pp. 605-613.
Haidar, A. (1993), Obstacles to Economic Development in the Arab Sector in
Israel, The Israeli Arab Centre for Economic Development, Tel-Aviv
(Hebrew).

26 Promoting Local Growth
Harrison, B. (1992), ‘Industrial Districts: Old Wine in a New Bottle?’, Regional
Studies, vol. 26, pp. 469-483.
Hasson, S. (1981), ‘Social and Spatial Conflicts: The settlement Process in Israel
During the 1950s and the 1960s’, Espace Geographique, vol. 2, pp. 120-147.
Jensen, L. and Portes, A. (1992), ‘Correction to the Enclave and the Entrants:
Patterns of Economic Enterprise Before and After Mariel’, American
Sociological Review, vol. 57, pp. 411-414.
Jones, T., McEvoy, D. and Barrett, G. (1992), Ethnic Identity and Entrepreneurial
Predisposition: Business Entry, Motives of Asians, Afro-Caribbeans and
Whites. Paper to the URSC Small Business Initiative. University of
Warwick.
Jones, T., McEvoy, D. and Barrett, G. (1993), ‘Labour Intensive Practices in the
Ethnic Minority Firms’, In J. Atkinson and D. Storey (eds), Finance and the
Small Firm, Routledge, London, pp. 145-181. Khamaisi, R. (1984), Arab Industry in Israel, Unpublished Magister Thesis,
Technion, Israel (Hebrew).
Kloosterman, R., Van Der Leun, J. and Rath, J. (1999), ‘Mixed Embeddedness: In
Formal Economic Activities and Immigrant Businesses in the Netherlands’,
International Journal of Urban and Regional Research, vol. 23, no. 2, pp.
252-266.
Lakshmanan, T.R. and Okumura, M. (1995), ‘The Nature and Evolution of
Knowledge Networks in Japanese Manufacturing’, Papers in Regional
Science, vol. 74, no. 1, pp. 63-86.
Light, I. (1984), ‘Immigrant and Ethnic Enterprise in North America’, Ethnic and
Racial Studies, vol. 7, pp.195-216.
Light, I. and Bonachich, E. (1988), Immigrant entrepreneurs, University of California Press, California.
Lingoes, J. C. (1973), Guttman-Lingoes The Nonmetric Program Series, Mathesis
Press, Ann Arbor, MI.
Markusen, A. (1994), ‘Studying Regions by Studying Firms’, Professional
Geographer, vol. 46, no. 4, pp. 477-490.
Nee, V. and Sanders, J. M. (1987), ‘On Testing the Enclave-Economy Hypothesis’,
American Sociological Review, vol. 52, pp. 771-773.
Miles, R. (1989), Racism, Routledge, London.
Oinas, P. (1999), ‘Voices and Silences: the Problem of Access to Embeddedness’.
Geoforum, vol. 30, pp. 351-361.
Portes, A. and Jensen, L. (1989), ‘What’s an Ethnic Enclave? The Case for Conceptual Clarity’, American Sociological Review, vol. 76, pp. 1029-1047.
Pred, A. (1977), City Systems in Advanced Economies: Past Growth, Present
Processes and Future Options, Hutchinson, London.
Ratti, R. (1992), Innovation Technologique et Development Regional, Instituto di
Recerche Economiche, Bellinzona.
Sanders, J. M. and Nee, V. (1992), ‘Problems in Resolving the Enclave Economy
Debate’, American Sociological Review, vol. 57, pp. 415-418.
Ethnic Minorities’ Strategies: The Israeli Arab Case 27
Schnell, I. (1994), ‘Urban Restructuring in Israeli Arab Settlements’, Middle
Eastern Studies, vol. 30, no. 2, pp. 330-350.
Schnell, I., Sofer, M. and Drori, I. (1995), Arab Industrialization in Israel, Praeger,
Westport. Schnell, I., Benenson, I. and Sofer, M. (1999), ‘The Spatial Pattern of Arab
Industrial Markets in Israel’, Annals of the Association of American
Geographers, vol. 89, no. 2, pp. 311-336.
Scott, A. J. (1991), ‘The Aerospace-Electronics Industrial Complex of Southern
California: The Formative Years 1940-1960’, Research Policy, vol. 20, pp.
439-456.
Semyonov, M. and Lewin-Epstein, N. (1993), The Arab Minority in Israel’s
Economy. Westview Press, Boulder.
Staber, U. and Schaefer, N. (eds) (1996), Business Networks: Prospects for
Regional Development, Walter de Gruyer, Berlin.
Taylor, M. (1999), Enterprise Embeddedness as a Mechanism of Exclusion: The Experience in Fiji. Paper presented at the IGU Commission on the
Organization of Industrial Space, Haifa and Beer Sheba, Israel.
Van Geenhuizen, M. and Nijkamp, P. (1995), ‘Industrial Dynamics, Company Life
Histories and Core-Periphery Dilemma’, Geography Research Forum, vol.
15, pp. 49-69.
Waldinger, R. (1993), ‘The Ethnic Enclave Debate Revisited’, International
Journal of Urban and Regional Research, vol. 17, pp. 444-452.
Ward, R. (1985), ‘Minority Settlement and the Local Economy’, In B. Roberts, R.
Finnegan and D. Gallie (eds), New Approaches to Economic Life,
Manchester University Press, Manchester, pp. 198-211.
Zhou, M. and Logan, J. R. (1989), ‘New York City Chinatown’, American
Sociological Review, vol. 54, pp. 809-820.


![Government Regulation of Religious Minorities [DRAFT]](https://static.fdokumen.com/doc/165x107/631bdcfa93f371de1901292e/government-regulation-of-religious-minorities-draft.jpg)