CollaborationViz: interactive visual exploration of biomedical research collaboration networks
8
CollaborationViz: Interactive Visual Exploration of Biomedical Research Collaboration Networks Jiang Bian 1 *, Mengjun Xie 2 , Teresa J. Hudson 5,3 , Hari Eswaran 4,1 , Mathias Brochhausen 1 , Josh Hanna 6 , William R. Hogan 7,8 1 Division of Biomedical Informatics, University of Arkansas for Medical Sciences, Little Rock, AR 72205, United States of America, 2 Department of Computer Science, University of Arkansas at Little Rock, Little Rock, AR 72204, United States of America, 3 Department of Psychiatry and Behavioral Sciences, University of Arkansas for Medical Sciences, Little Rock, AR 72205, United States of America, 4 Department of Obstetrics & Gynecology Research, University of Arkansas for Medical Sciences, Little Rock, AR 72205, United States of America, 5 Department of Veterans Affairs HSR&D Center for Mental Healthcare and Outcomes Research, Central Arkansas Veterans Healthcare System, Little Rock, AR 722205, United States of America, 6 Clinical and Translational Science Informatics and Technology, University of Florida, Gainesville, FL 32610, United States of America, 7 Department of Health Outcomes & Policy, University of Florida, Gainesville, FL 32610, United States of America, 8 Clinical and Translational Science Institute, University of Florida, Gainesville, FL 32610, United States of America Abstract Social network analysis (SNA) helps us understand patterns of interaction between social entities. A number of SNA studies have shed light on the characteristics of research collaboration networks (RCNs). Especially, in the Clinical Translational Science Award (CTSA) community, SNA provides us a set of effective tools to quantitatively assess research collaborations and the impact of CTSA. However, descriptive network statistics are difficult for non-experts to understand. In this article, we present our experiences of building meaningful network visualizations to facilitate a series of visual analysis tasks. The basis of our design is multidimensional, visual aggregation of network dynamics. The resulting visualizations can help uncover hidden structures in the networks, elicit new observations of the network dynamics, compare different investigators and investigator groups, determine critical factors to the network evolution, and help direct further analyses. We applied our visualization techniques to explore the biomedical RCNs at the University of Arkansas for Medical Sciences – a CTSA institution. And, we created CollaborationViz, an open-source visual analytical tool to help network researchers and administration apprehend the network dynamics of research collaborations through interactive visualization. Citation: Bian J, Xie M, Hudson TJ, Eswaran H, Brochhausen M, et al. (2014) CollaborationViz: Interactive Visual Exploration of Biomedical Research Collaboration Networks. PLoS ONE 9(11): e111928. doi:10.1371/journal.pone.0111928 Editor: Zhong-Ke Gao, Tianjin University, China Received June 20, 2014; Accepted October 9, 2014; Published November 18, 2014 Copyright: ß 2014 Bian et al. This is an open-access article distributed under the terms of the Creative Commons Attribution License, which permits unrestricted use, distribution, and reproduction in any medium, provided the original author and source are credited. Funding: The work described in this manuscript is supported by award UL1TR000039 through National Center for Advancing Translational Sciences (i.e., formerly UL1RR029884 through the NIH National Center for Research Resources). The content is solely the responsibility of the authors and does not necessarily represent the official views of the NIH. The funders had no role in study design, data collection and analysis, decision to publish, or preparation of the manuscript. Competing Interests: The authors have declared that no competing interests exist. * Email: [email protected] Introduction Clinical translational science embraces inter-disciplinary collab- orations. One of the key objectives of the Clinical Translational Science Award (CTSA) is to promote cross-disciplinary collabo- rations that can accelerate the translation and application of biomedical research discoveries into clinical settings. To better understand, facilitate, and direct clinical and translational research efforts, it is essential to analytically assess the quality and efficiency of existing research collaborations in a CTSA institution and promptly identify those potential collaborations that are more likely to be productive and make significant impact. Social network analysis (SNA) has been deemed as an effective tool to assess inter- and intra-institution research collaborations in the CTSA community [1]. Studying different collaborative relation- ships (e.g., co-authorships in scientific publication and collabora- tions on grants), a number of studies on research collaboration networks (RCNs) [2–8] have provided insights into the networks’ topological characteristics and the network dynamics of research collaborations. For example, using various network centrality measures [8], we can identify key entities/components of the collaboration network, which enables us to allocate resources strategically and therefore boost the overall network efficiency, e.g., attract new investigators to join the network and spawn new collaborations. Although quantitative metrics of RCNs are valuable, the interpretations of descriptive network statistics are difficult for non-experts. Visualization of a RCN, e.g., through a graph where nodes in the graph represent social entities and links among them indicate their interactions, is beneficial to a layperson to understand its topology and dynamics. Visualization has been shown effective to present large amount of information and to stimulate visual thinking. And, visualizing social networks (and network visualization in general) has a rich history [9–12]. However, the majority of literature on social network visualization is based on static graph drawing. And most of the visualization tools used by social network analysts focus predominantly on automatic graph layout algorithms. Many SNA studies leverage one of the general-purpose network analysis toolkits such as iGraph [13], NetworkX [14] and Pajek [15] that provides some basic visualization capabilities. However, due to the limitation of those tools, often only static visualization of the networks are presented in those SNA studies. Our goal in this study is to create PLOS ONE | www.plosone.org 1 November 2014 | Volume 9 | Issue 11 | e111928
-
Upload
independent -
Category
Documents
-
view
2 -
download
0
Transcript of CollaborationViz: interactive visual exploration of biomedical research collaboration networks

CollaborationViz: Interactive Visual Exploration ofBiomedical Research Collaboration NetworksJiang Bian1*, Mengjun Xie2, Teresa J. Hudson5,3, Hari Eswaran4,1, Mathias Brochhausen1, Josh Hanna6,
William R. Hogan7,8
1Division of Biomedical Informatics, University of Arkansas for Medical Sciences, Little Rock, AR 72205, United States of America, 2Department of Computer Science,
University of Arkansas at Little Rock, Little Rock, AR 72204, United States of America, 3Department of Psychiatry and Behavioral Sciences, University of Arkansas for
Medical Sciences, Little Rock, AR 72205, United States of America, 4Department of Obstetrics & Gynecology Research, University of Arkansas for Medical Sciences, Little
Rock, AR 72205, United States of America, 5Department of Veterans Affairs HSR&D Center for Mental Healthcare and Outcomes Research, Central Arkansas Veterans
Healthcare System, Little Rock, AR 722205, United States of America, 6Clinical and Translational Science Informatics and Technology, University of Florida, Gainesville, FL
32610, United States of America, 7Department of Health Outcomes & Policy, University of Florida, Gainesville, FL 32610, United States of America, 8Clinical and
Translational Science Institute, University of Florida, Gainesville, FL 32610, United States of America
Abstract
Social network analysis (SNA) helps us understand patterns of interaction between social entities. A number of SNA studieshave shed light on the characteristics of research collaboration networks (RCNs). Especially, in the Clinical TranslationalScience Award (CTSA) community, SNA provides us a set of effective tools to quantitatively assess research collaborationsand the impact of CTSA. However, descriptive network statistics are difficult for non-experts to understand. In this article, wepresent our experiences of building meaningful network visualizations to facilitate a series of visual analysis tasks. The basisof our design is multidimensional, visual aggregation of network dynamics. The resulting visualizations can help uncoverhidden structures in the networks, elicit new observations of the network dynamics, compare different investigators andinvestigator groups, determine critical factors to the network evolution, and help direct further analyses. We applied ourvisualization techniques to explore the biomedical RCNs at the University of Arkansas for Medical Sciences – a CTSAinstitution. And, we created CollaborationViz, an open-source visual analytical tool to help network researchers andadministration apprehend the network dynamics of research collaborations through interactive visualization.
Citation: Bian J, Xie M, Hudson TJ, Eswaran H, Brochhausen M, et al. (2014) CollaborationViz: Interactive Visual Exploration of Biomedical Research CollaborationNetworks. PLoS ONE 9(11): e111928. doi:10.1371/journal.pone.0111928
Editor: Zhong-Ke Gao, Tianjin University, China
Received June 20, 2014; Accepted October 9, 2014; Published November 18, 2014
Copyright: � 2014 Bian et al. This is an open-access article distributed under the terms of the Creative Commons Attribution License, which permits unrestricteduse, distribution, and reproduction in any medium, provided the original author and source are credited.
Funding: The work described in this manuscript is supported by award UL1TR000039 through National Center for Advancing Translational Sciences (i.e., formerlyUL1RR029884 through the NIH National Center for Research Resources). The content is solely the responsibility of the authors and does not necessarily representthe official views of the NIH. The funders had no role in study design, data collection and analysis, decision to publish, or preparation of the manuscript.
Competing Interests: The authors have declared that no competing interests exist.
* Email: [email protected]
Introduction
Clinical translational science embraces inter-disciplinary collab-
orations. One of the key objectives of the Clinical Translational
Science Award (CTSA) is to promote cross-disciplinary collabo-
rations that can accelerate the translation and application of
biomedical research discoveries into clinical settings. To better
understand, facilitate, and direct clinical and translational research
efforts, it is essential to analytically assess the quality and efficiency
of existing research collaborations in a CTSA institution and
promptly identify those potential collaborations that are more
likely to be productive and make significant impact. Social
network analysis (SNA) has been deemed as an effective tool to
assess inter- and intra-institution research collaborations in the
CTSA community [1]. Studying different collaborative relation-
ships (e.g., co-authorships in scientific publication and collabora-
tions on grants), a number of studies on research collaboration
networks (RCNs) [2–8] have provided insights into the networks’
topological characteristics and the network dynamics of research
collaborations. For example, using various network centrality
measures [8], we can identify key entities/components of the
collaboration network, which enables us to allocate resources
strategically and therefore boost the overall network efficiency,
e.g., attract new investigators to join the network and spawn new
collaborations.
Although quantitative metrics of RCNs are valuable, the
interpretations of descriptive network statistics are difficult for
non-experts. Visualization of a RCN, e.g., through a graph where
nodes in the graph represent social entities and links among them
indicate their interactions, is beneficial to a layperson to
understand its topology and dynamics. Visualization has been
shown effective to present large amount of information and to
stimulate visual thinking. And, visualizing social networks (and
network visualization in general) has a rich history [9–12].
However, the majority of literature on social network visualization
is based on static graph drawing. And most of the visualization
tools used by social network analysts focus predominantly on
automatic graph layout algorithms. Many SNA studies leverage
one of the general-purpose network analysis toolkits such as
iGraph [13], NetworkX [14] and Pajek [15] that provides some
basic visualization capabilities. However, due to the limitation of
those tools, often only static visualization of the networks are
presented in those SNA studies. Our goal in this study is to create
PLOS ONE | www.plosone.org 1 November 2014 | Volume 9 | Issue 11 | e111928
an interactive visualization platform that can support a variety of
social network analysis tasks pertaining to studying collaborative
research relationships. Interactive network visualization tech-
niques can reinforce human recognition and have a profound
impact on how best we can represent, analyze, and communicate
network data.
In this paper, we present our experiences in exploring various
network visualization techniques to create CollaborationViz, an
open-source web-based informative and interactive visual analyt-
ical tool for studying biomedical RCNs. Specifically, we demon-
strate CollaborationViz through analyzing network dynamics and
characteristics of the biomedical RCN at the University of
Arkansas for Medical Sciences (UAMS) – a CTSA institution.
All the resources including the source code of CollaborationViz,
the scripts of our network analyses and the anonymized network
data can be found at https://github.com/bianjiang/rcna. While
in this paper we use a particular dataset to present our work,
CollabrationViz supports a set of visual analysis tasks applicable to
networks in general and may be adopted by other exploratory
visual analysis systems.
Methods and Technologies
Dataset and social network analysis of biomedicalresearch collaborationThe biomedical research collaboration networks we study are
unique in that those RCNs are formed based on collaborative
research grants rather than publication co-authorships [8]. The
Office for Research and Sponsored Programs (ORSP) at UAMS
uses an in-house developed software system to track detailed
information of research grants such as the requested budget
amount, the budget start and end dates, the funding agencies, as
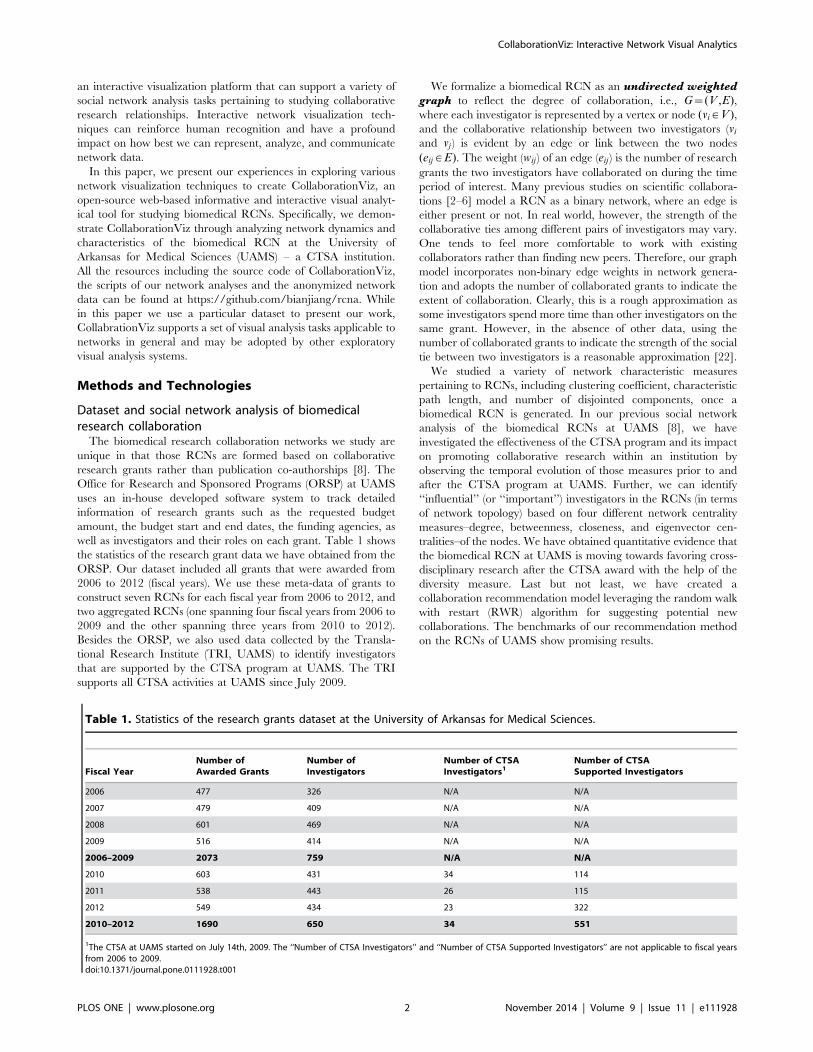
well as investigators and their roles on each grant. Table 1 shows
the statistics of the research grant data we have obtained from the
ORSP. Our dataset included all grants that were awarded from
2006 to 2012 (fiscal years). We use these meta-data of grants to
construct seven RCNs for each fiscal year from 2006 to 2012, and
two aggregated RCNs (one spanning four fiscal years from 2006 to
2009 and the other spanning three years from 2010 to 2012).
Besides the ORSP, we also used data collected by the Transla-
tional Research Institute (TRI, UAMS) to identify investigators
that are supported by the CTSA program at UAMS. The TRI
supports all CTSA activities at UAMS since July 2009.
We formalize a biomedical RCN as an undirected weightedgraph to reflect the degree of collaboration, i.e., G~(V ,E),where each investigator is represented by a vertex or node (vi [V ),and the collaborative relationship between two investigators (viand vj ) is evident by an edge or link between the two nodes
(eij [E). The weight (wij ) of an edge (eij ) is the number of research
grants the two investigators have collaborated on during the time
period of interest. Many previous studies on scientific collabora-
tions [2–6] model a RCN as a binary network, where an edge is
either present or not. In real world, however, the strength of the
collaborative ties among different pairs of investigators may vary.
One tends to feel more comfortable to work with existing
collaborators rather than finding new peers. Therefore, our graph
model incorporates non-binary edge weights in network genera-
tion and adopts the number of collaborated grants to indicate the
extent of collaboration. Clearly, this is a rough approximation as
some investigators spend more time than other investigators on the
same grant. However, in the absence of other data, using the
number of collaborated grants to indicate the strength of the social
tie between two investigators is a reasonable approximation [22].
We studied a variety of network characteristic measures
pertaining to RCNs, including clustering coefficient, characteristic
path length, and number of disjointed components, once a
biomedical RCN is generated. In our previous social network
analysis of the biomedical RCNs at UAMS [8], we have
investigated the effectiveness of the CTSA program and its impact
on promoting collaborative research within an institution by
observing the temporal evolution of those measures prior to and
after the CTSA program at UAMS. Further, we can identify
‘‘influential’’ (or ‘‘important’’) investigators in the RCNs (in terms
of network topology) based on four different network centrality
measures–degree, betweenness, closeness, and eigenvector cen-
tralities–of the nodes. We have obtained quantitative evidence that
the biomedical RCN at UAMS is moving towards favoring cross-
disciplinary research after the CTSA award with the help of the
diversity measure. Last but not least, we have created a
collaboration recommendation model leveraging the random walk
with restart (RWR) algorithm for suggesting potential new
collaborations. The benchmarks of our recommendation method
on the RCNs of UAMS show promising results.
Table 1. Statistics of the research grants dataset at the University of Arkansas for Medical Sciences.
Fiscal YearNumber ofAwarded Grants
Number ofInvestigators
Number of CTSAInvestigators1
Number of CTSASupported Investigators
2006 477 326 N/A N/A
2007 479 409 N/A N/A
2008 601 469 N/A N/A
2009 516 414 N/A N/A
2006–2009 2073 759 N/A N/A
2010 603 431 34 114
2011 538 443 26 115
2012 549 434 23 322
2010–2012 1690 650 34 551
1The CTSA at UAMS started on July 14th, 2009. The ‘‘Number of CTSA Investigators’’ and ‘‘Number of CTSA Supported Investigators’’ are not applicable to fiscal yearsfrom 2006 to 2009.doi:10.1371/journal.pone.0111928.t001
CollaborationViz: Interactive Network Visual Analytics
PLOS ONE | www.plosone.org 2 November 2014 | Volume 9 | Issue 11 | e111928

Modern Web technologies for interactive networkvisualizationAlthough static graphs are useful in presenting network
structures, they limit the amount of information that can be
conveyed and always present the network from a fixed perspective.
To deepen our understanding of RCNs and assist nontechnical
users in comprehending important network metrics and their
implications, we created CollaborationViz, a web-based interac-
tive network visual analytics tool. CollaborationViz is built using a
number of cutting-edge web-based visualization technologies,
especially the Scalable Vector Graphics (SVG)–a language for
building rich graphical content [16], d3.js–a JavaScript library for
manipulating SVG objects [17], and Bootstrap–a front-end Web
development framework [18]. Network data are stored in Java-
Script Object Notation (JSON), a lightweight web-friendly data-
store and data-interchange format [19].
Results
An important goal of our study on RCNs is to provide a set of
analytical tools for nontechnical biomedical researchers and
administration to understand the nature and evolution of
collaboration. As interactive visualization is direct, informative,
and user friendly for a person to apprehend data and derive
accurate observations and useful insights, CollaborationViz has
been created to not only better disseminate the results of our
network analyses on biomedical RCNs, but also to support visual
analytics. Figure 1 illustrates the main interface of Collaboration-
Viz. Based on our previous study on UAMS’s RCN [8], our design
of CollaborationViz starts by considering an analysis process to
support exploration and assessment of a research collaboration
network with respect to the following objectives: (1) representing
collaboration networks in a meaningful format (e.g., a force-
directed graph layout); (2) visualizing the strength of the
collaborative relationships; (3) visualizing and tracking global
and individual changes over time; (4) emphasizing relative
importance and possible correlation between nodes (investigators);
and (5) demonstrating the predictive power of our collaboration
recommendation model. A live demo of CollaborationViz can be
found at http://bianjiang.github.io/rcna/.
Informative representations and interactive networkvisualizationCollaborationViz provides an informative and intuitive user
interface with theoretically-motivated abstractions for nontechni-
cal users to interact with and study a collaboration network. As
shown in Figure 1, each circle (node) represents an investigator in
the collaboration network, and a curved line connecting two nodes
indicates the collaborative relationship between the two investiga-
tors. Nodes are colored to distinguish CTSA (green) supported
investigators from non-CTSA (gray) supported investigators. The
strength of collaboration between two investigators is represented
by the thickness of line.
To realize vivid, accurate, interactive representation, networks
in CollaborationViz are rendered using a physically-based force-
directed graph layout [17]. We can consider the network as a
particle system, and the force-directed graph layout in d3.js
implements the position Verlet integration to determine moving
trajectories of nodes (particles) in the network. Typically, in
implementations of particle systems, each particle has two main
variables–its position x and its velocity v. Vertlet integration is a
velocity-less schema, where we only store the current position xand its previous position x0 of each particle. The velocity can be
implicitly computed and consequently it is easier to keep velocity
and position in sync, which makes the simulation more stable [23].
Further, the physically-based model not only considers repulsive
charge forces that spread nodes evenly on the canvas, but also
takes into account the gravity forces that keep nodes centered in
the visible area and avoid expulsion of isolated components [25].
One immediate benefit of using a force-directed graph layout for
rendering networks is the clustering effect that manifests. A cluster
of nodes that are highly connected will naturally be grouped
together because of the gravity forces. For more details, Kobourov
has an excellent review article on force-directed graph drawing
algorithms that provides more technical background of the
implementations [24].
One of the goals in CollaborationViz is to integrate various
contextual information along with the node-edge graph. Network
characteristics such as the numbers of nodes, edges and isolated
components of a network are readily available along with the
network diagram. A user can hover her mouse cursor over each
node to see the node’s local network characteristics including its
local clustering coefficient and four centrality measures (degree,
betweenness, closeness and eigenvector centralities). These net-
work topological features help understand the structure of the
overall network as well as the importance and position of each
investigator in the RCN. A user can also drag a node to a different
position and the nodes that are incident to this node will also be
repositioned according to the physically-based graph rendering
model. The parameters (i.e., charge, gravity, and link distance) of
the force-directed layout algorithm are adjusted and the changes
will be reflected immediately on the canvas.
Temporal evolution of research collaboration networksThe ability to visually exam the research collaboration networks
at an institution is crucial to the understanding of the evolution of
the network dynamics, therefore the development direction of the
research environment under study. CollaborationViz not only
provides a timeline that shows snapshots of the overall network of
interest at different time periods, but also gives the ability to track
individual investigator’s development in the network across
different time spans.
Figure 2 shows a use case of using CollaborationViz to explore
the advancement of an investigator’s collaborative relationships
within UAMS’s RCNs from 2007 to 2010. The chosen
investigator is one of many who have received the TRI pilot
awards, which was developed as part of the CTSA program at
UAMS to ‘‘stimulate and solidify new, innovative research
collaborations and promote high-quality translational research’’.
In Figure 2, the investigator of interest is highlighted in red. The
top part of Figure 2 shows four snapshots of the RCN at UAMS
from 2007 to 2010– one of each year, and gives us a sense of the
relative positions of the particular investigator in the network;
while the bottom figures present a focused view of the
investigator’s immediate-connections and their changes over the
four year, respectively. Through analyzing these figures, we can
make the following observations. In 2007, the investigator only
collaborated with researchers in an isolated small group (four
investigators). In 2008, the size of the group and the number of
internal connections increased; however, the group was still
disconnected from other parts of the network and the particular
investigator still had very few collaborations. In 2009, in
preparation of the CTSA program, this group eventually made
connections to the largest component (i.e., connected subgraph) of
the network. We can easily see in the 2009 graph in Figure 2 that
this investigator became a bridge connecting different small
clusters. In 2010, the first year after the CTSA, the investigator
was drawn towards the center of the network, and her ‘‘influence’’
CollaborationViz: Interactive Network Visual Analytics
PLOS ONE | www.plosone.org 3 November 2014 | Volume 9 | Issue 11 | e111928

in the network increased drastically. Moreover, these visual
patterns echo our quantitative social network analysis of the
investigator’s collaboration network. Positive changes of the
investigator’s network characteristics also suggest her increased
productivity in research collaborations from 2007 to 2010. For
example, the degree of her node in the network increased from 1
in 2007 to 98 in 2010. Furthermore, all of the four centrality
measures of this investigator had increased. In particular, the
closeness centrality had risen from 1.007 in 2007 to 3.664 in 2010,
which coincides with our visual analysis that her position in the
RCN became more ‘‘central’’ from 2007 to 2010. Many of other
TRI pilot awardees exhibit similar temporal evolutions in network
dynamics with increased degree of collaboration and became more
‘‘influential’’ in the network after the awards. Further, we also
examined non-CTSA supported investigators’ network develop-
ments within the UAMS RCN, and found that their collaboration
circles (collaborative relationships) were less developed during the
same time period comparing to the CTSA-supported group.
These findings are consistent with our previous quantitative
analyses [8] which suggest that the CTSA program has a positive
effect in promoting research collaboration and such effect is more
evident within the group of investigators who are supported by the
CTSA.
Modeling influence in a social network through centralitymeasuresIn network analysis, a variety of centrality measures are used to
determine the relative importance of a node in the network.
However, each centrality measure defines the meaning of
importance from a different perspective [26]. Within the context
of research collaboration network, centrality measures of an
investigator can be interpreted as how influential or important the
person is with respect to the structure of the network. To identify
influential nodes in a comprehensive manner, we investigated four
widely used network centrality measures–degree centrality,
betweenness, closeness, and eigenvector centrality [27]–to rank
investigators’ relative influence (or importance, contribution) and
combine multiple rankings of nodes using rank aggregation
techniques [28]. An influential investigator with a high consensus
ranking is called a centrality leader who affects others in ways such
as propagating an idea or an advertisement across the network.
CollaborationViz visualizes a node’s relative influence through
adjusting the size of each node according to its ranking of relative
influence in the RCN. Combined with other visual analytical tools
in CollaborationViz, we can easily identify, analyze and reason
with investigators’ relative importance in the collaboration
network. Figure 3 (a) demonstrates a visualization of ranking
investigators’ relative importance in CollaborationViz based on
UAMS’s 2012 RCN. Further, as shown in Figure 3 (b),
CollaborationViz gives us the ability to drill down to a specific
centrality leader (id: 32923) and it is obvious that this investigator
is not only highly connected (a high degree node) but also acts as a
hub connecting three communities in the network. Such
observations are hard to make and comprehend through a
quantitative network analysis, but self-evident in CollaborationViz
through novel visualizations.
Figure 1. The main interface of CollaborationViz, an interactive visual analytical tool for exploration of biomedical researchcollaboration networks.doi:10.1371/journal.pone.0111928.g001
CollaborationViz: Interactive Network Visual Analytics
PLOS ONE | www.plosone.org 4 November 2014 | Volume 9 | Issue 11 | e111928

Exploration and interaction through highlighting,filtering and visual overlaysIt is important for a user to have the ability to narrow down the
scope and reduce the complexity of the data by filtering based on
her domain knowledge or interests. Such functionality facilitates
users in discovering patterns and data points of interest; and it
helps to focus the visual analysis process. However, it is not always
easy to translate an analysis task into proper interfaces since the
user may not have a well-defined hypothesis and simply wants to
explore and learn the data. CollaborationViz implements a
number of viewing control mechanisms–highlighting, filtering,
and visual overlays–to offer services for visual navigation and
visual analytics. For example, as shown in Figure 1, the centrality
leaders and CTSA supported investigators are highlighted in
different color and size. Highlighting helps to attract users’
attention to a small portion of highly relevant information and
nodes that is directly beneficial for their analyses [29]. Further,
transparency is an efficient transient highlighting techniques to
dissolve the context around the object of interests. In Collabor-
ationViz, we adjust objects’ alpha levels to render the focused
Figure 2. Temporal evolution of an investigator in the research collaboration network at UAMS.doi:10.1371/journal.pone.0111928.g002
Figure 3. Visualizing ‘‘centrality leaders’’: Figure 3 (a) demonstrates a visualization of the identified ‘‘centrality leaders’’ and theirrelative ‘‘importance’’ to the network based on UAMS’s 2012 research collaboration network; and Figure 3 (b) zooms in to one ofthe centrality leaders and shows her immediate collaborative relationships.doi:10.1371/journal.pone.0111928.g003
CollaborationViz: Interactive Network Visual Analytics
PLOS ONE | www.plosone.org 5 November 2014 | Volume 9 | Issue 11 | e111928

objects more obvious in the display (Figure 4). Moreover, filtering
and visual overlays are two other important information visual-
ization techniques. Through filtering, we can greatly reduce the
data complexity by narrowing down the scope of interests. As
demonstrated in Figure 3, through filtering out non-incident nodes
and edges, we can zoom in to examine the collaborative
relationships of a particular node (Figure 3b), by which it
eliminates the noises to the analysis problem in hand and reveals
hidden patterns (e.g., the bridging and clustering effects) that were
not self-evident (as in Figure 3a).
Collaboration recommendation through link predictionSocial networks such as research collaboration networks are
highly dynamic, whereas new interactions among social entities
are commonly manifested through additions and deletions of edges
in the network. One of the main questions in studying research
collaborations is how we can find promising new collaborations
(new edges in the network). Such question can be tackled through
applying link prediction techniques with network data. In this
study, using the random walks with restarts (RWRs) method, we
can accurately discover missing links (overlooked collaborations)
and the links that could appear in the future (potential new
collaborations). Despite the conceptual differences, the same
prediction model applies to both tasks [8]. In CollaborationViz,
we can depict the predicted links as dotted lines between nodes
(Figure 5), which gives the user a quick overview of the predicted
new collaborations and how it would affect the network dynamics.
Discussion and Conclusion
In this study, we presented our efforts in building meaningful
interactive network visualizations with theoretically based infor-
mation visualization approaches to support a visual analysis
process of studying research collaborations. Our result, Collabor-
ationViz, is a novel interactive visual analytical tool for under-
standing social interactions among research collaborators through
network analysis. The design of CollaborationViz is driven by the
needs of understanding the generative mechanisms of research
collaborations and helping nontechnical users in comprehending
social network analysis results of RCNs in an intuitive manner.
CollaborationViz provides a convenient mechanism for interactive
data interrogation and exploration that enables analysts to
‘‘synthesize information and derive insight from massive, dynamic,
ambiguous, and often conflicting data’’ and ‘‘detect the expected
and discover the unexpected’’ [20]. The interactive visual
representations in CollaborationViz make it easy for users to
perceive salient aspects of the dynamics and characteristics of
RCNs quickly.
CollaborationViz is designed to facilitate analytical reasoning by
helping a user understand historical and current situations and
enhancing user’s ability to recognize both expected and unex-
pected patterns in many ways. For example, as shown in Figure 2,
the centripetal trend manifests in the evolution of the investigator’s
collaborative relationship. The collaboration of the investigator
has grown significantly, which pushes the node to move towards
the center of the collaboration network at UAMS. Such a
phenomenon is difficult to perceive without a visual analytical tool.
Last but not least, the ultimate goal of studying biomedical
RCNs in the CTSA community is to assist administration and
leaderships of research institutions to strategically allocate
resources and shape policies to attain an effective, trans-
disciplinary collaboration environment. CollaborationViz facili-
tates the dissemination of a quantitative SNA of RCNs and helps a
layperson to explore, perceive, understand, and reason about
complex network dynamics of the collaborative research environ-
ment. For example, a visual representation of the collaboration
recommendation model [8] in CollaborationViz, as shown in
Figure 5, helps to quickly identify potential new collaborations
that are likely to succeed. Furthermore, the open-source nature
makes CollaborationViz highly customizable and easy to be
adopted by other CTSA institutions.
Figure 4. Using transparency to highlight areas of interests while preserving the context (e.g., a particular investigator’s directcollaborators).doi:10.1371/journal.pone.0111928.g004
CollaborationViz: Interactive Network Visual Analytics
PLOS ONE | www.plosone.org 6 November 2014 | Volume 9 | Issue 11 | e111928

Efforts to develop software libraries and frameworks for network
visualization have been underway in several different areas. A
number of general purposed network analysis tools such as iGraph
[13], NetworkX [14] and Pajek [15] have graph drawing
components that provide some basic visualization functionalities.
However, most of these including tools that are specialized in
network (or graph) visualization (e.g., Hive plots [32] and
GraphViz [30]) merely focus on graph layout algorithms to
provide a static aesthetically pleasing view of the network and few
of them can provide interactive user experiences (e.g., iGraph and
Pajek). A few of the network visualization tools (e.g., Pajek and
Gephi [31]) provide infrastructures to support time-varying and
dynamic networks. And, tools such as LaNet-vi [35], Tulip [36],
and Cytoscape [37] focus on visualizing large-scale networks.
Further, numerous efforts have also been spurred on building
domain specific network visualization to assist visual thinking and
solve domain analytical problems. For example, Cytoscape [37],
BioLayout [34] and Arean3D [33] are all well-known in the
biomedical domain for visualizing biological networks. And,
vizster [38] has been successful in allowing end-user exploration
of large-scale online social networks. CollaborationViz falls into
the category of a domain specific network visualization study.
Nevertheless, CollaborationViz is unique in the sense that it
integrates contextual information to facilitate a complete visual
analysis process (e.g., analysis tasks such as observing temporal
evolution of a network, studying relative importance of investiga-
tors, and predicting potential successful new collaborations)
pertaining to studying and understanding of research collaboration
Figure 5. A visualization of collaboration recommendations.doi:10.1371/journal.pone.0111928.g005
CollaborationViz: Interactive Network Visual Analytics
PLOS ONE | www.plosone.org 7 November 2014 | Volume 9 | Issue 11 | e111928

environment. Furthermore, CollaborationViz is important for
large-scale national efforts (e.g., CTSA) that promote interdisci-
plinary collaborations as it gives program evaluators and team
science researchers a meaningful instrument to assess the impact of
such programs on building a collaborative research environment
and incubating new multidisciplinary collaborations.
Complex networks are commonly seen in biomedical research.
Although CollaborationViz is built to specialize in exploring
research collaboration networks, the underlying network visuali-
zation methods and principles can potentially be translated to
other network studies such as brain connectivity networks and
gene networks. Future work involves further iterations of new
interactive visualization features to support more visual analysis
tasks. For example, we are exploring the possibility of labeling the
clusters (i.e., community structures [6]) in the network with
research topics through mining grant abstracts with topic
modeling methods (e.g., Latent dirichlet allocation [21]). To allow
identifying relations between these topics and identify higher-level
domains and disciplines, we can use a machine-understandable
hierarchy that allows automated inference. Additionally, we will
use more sophisticated topic relations to identify RCNs where, for
example, the researchers focus on the use of a specific drug or even
drugs with a specific mechanism of action (e.g., beta blockers or
other antihypertensive medications). To accomplish these goals,
we will use a realism-based knowledge representation system
coded in Web Ontology Language (OWL) to define the topics and
their relations to each other. These additions will benefit the
analysis of RCNs in multiple ways, among others: a) automatically
identifying existing research priorities in a network, b) identifying
larger research domains that are relevant in the network, and c)
automatically identifying unused research potential for research
collaborations within an network.
Acknowledgments
The work describe in this manuscript is supported by award
UL1TR000039 through National Center for Advancing Translational
Sciences (i.e., formerly UL1RR029884 through the NIH National Center
for Research Resources). The content is solely the responsibility of the
authors and does not necessarily represent the official views of the NIH.
Author Contributions
Conceived and designed the experiments: JB TH HE MB JH WH.
Performed the experiments: JB. Analyzed the data: JB. Contributed
reagents/materials/analysis tools: JB. Wrote the paper: JB MJX.
References
1. CTSA Consortium: Evaluation Key Function Committee (2011) Evaluation -
social network analysis. Available: https://www.ctsacentral.org/committee/evaluation-social-network-analysis. Accessed 2014 April 18.
2. Newman ME (2001) The structure of scientific collaboration networks. Proc NatlAcad Sci USA 98: 404–409.
3. Newman ME (2004) Coauthorship networks and patterns of scientificcollaboration. Proc Natl Acad Sci USA 101 Suppl 1: 5200–5205.
4. Uddin S, Hossain L, Rasmussen K (2013) Network effects on scientific
collaborations. PLoS ONE 8: e57546.5. Nagarajan R, Lowery CL, Hogan WR (2011) Temporal evolution of biomedical
research grant collaborations across multiple scales–a CTSA baseline study.AMIA Annu Symp Proc 2011: 987–993.
6. Nagarajan R, Kalinka AT, Hogan WR (2013) Evidence of community structure
in Biomedical Research Grant Collaborations. J Biomed Inform 46: 40–46.7. Bian J, Xie M, Topaloglu U, Hudson T, Hogan W (2013) Understanding
biomedicai research collaborations through social network analysis: A case study.In: Bioinformatics and Biomedicine (BIBM), 2013 IEEE International
Conference on. 9–16. doi:10.1109/BIBM.2013.6732728.8. Bian J, Xie M, Topaloglu U, Hudson T, Eswaran H, et al. (2014) Social network
analysis of biomedical research collaboration networks in a CTSA institution.
J Biomed Inform. doi:10.1016/j.jbi.2014.01.015.9. Freeman LC (2000) Visualizing social networks. Journal of Social Structure 1.
10. Heer J, Boyd D (2005) Vizster: visualizing online social networks. In:Information Visualization, 2005. INFOVIS 2005. IEEE Symposium on. 32–
39. doi:10.1109/INFVIS.2005.1532126.
11. Shen Z, Ogawa M, Teoh ST, Ma KL (2006) Biblioviz: A system for visualizingbibliography infor- mation. In: Proceedings of the 2006 Asia-Pacific Symposium
on Information Visualisation - Volume 60. Darlinghurst, Australia, Australia:Australian Computer Society, Inc., APVis ’06, 93–102.
12. Alsukhni M, Zhu Y (2012) Interactive visualization of the social network ofresearch collaborations. In: Information Reuse and Integration (IRI), 2012 IEEE
13th International Conference on. 247–254. doi:10.1109/IRI.2012.6303017.
13. Csardi G, Nepusz T (2006) The igraph software package for complex networkresearch. Inter Journal Complex Systems: 1695.
14. Hagberg AA, Schult DA, Swart PJ (2008) Exploring network structure,dynamics, and function using NetworkX. In: Proceedings of the 7th Python in
Science Conference (SciPy2008). Pasadena, CA USA, 11–15.
15. Batagelj V, Mrvar A (2003) Pajek - analysis and visualization of large networks.In: Graph Drawing Software. Springer, 77–103.
16. W3C SVG Working Group (2011) Scalable Vector Graphics (SVG) 1.1 (SecondEdition). Available: http://www.w3.org/TR/2011/REC-SVG11-20110816/.
Accessed 2014 April 18.17. Bostock M, Ogievetsky V, Heer J (2011) D3: Data-driven documents. IEEE
Trans Visualization & Comp Graphics (Proc InfoVis).
18. Twitter Inc. (2012) Bootstrap. Available: http://getbootstrap.com/. Accessed2014 April 18.
19. EMCA International (2013) The JSON Data Interchange Format, 1st Edition.Available: http://www.ecma-international.org/publications/files/ECMA-ST/
ECMA-404.pdf. Accessed 18 April 2014].
20. Thomas JJ, Cook KA (2006) A visual analytics agenda. Computer Graphics and
Applications, IEEE, 26(1), 10–13.
21. Blei DM, Ng AY, Jordan MI (2003) Latent dirichlet allocation. Journal of
machine Learning research, 3, 993–1022.
22. Newman ME (2001) Scientific collaboration networks. II. Shortest paths,weighted networks, and centrality. Physical review E. 64(1): p. 016132.
23. Verlet L (1967) Computer ‘‘experiments’’ on classical fluids. I. Thermodynam-
ical properties of Lennard-Jones molecules. Physical review,159(1), 98.
24. Kobourov SG (2012) Spring embedders and force directed graph drawing
algorithms. arXiv preprint arXiv: 1201.3011.
25. Dwyer T (2009) Scalable, versatile and simple constrained graph layout. In
Computer Graphics Forum (Vol. 28, No. 3, 991–998). Blackwell Publishing Ltd.
26. Newman ME (2010) Networks: an introduction. Oxford University Press.
27. Opsahl T, Agneessens F, Skvoretz J (2010) Node centrality in weighted
networks: Generalizing degree and shortest paths. Social Networks, 32(3), 245–
251.
28. Dwork C, Kumar R, Naor M, Sivakumar D (2001) Rank aggregation methods
for the web. In Proceedings of the 10th international conference on World Wide
Web (613–622). ACM.
29. Liang J, Huang ML (2010) Highlighting in information visualization: A survey.
In Information Visualisation (IV), 2010 14th International Conference (79–85).
IEEE.
30. Gansner ER, North SC (2000) An open graph visualization system and its
applications to software engineering. Software Practice and Experience, 30(11),
1203–1233.
31. Bastian M, Heymann S, Jacomy M (2009) Gephi: an open source software for
exploring and manipulating networks. ICWSM, 8, 361–362.
32. Krzywinski M, Birol I, Jones SJ, Marra MA (2012) Hive plots–rational approach
to visualizing networks. Briefings in bioinformatics, 13(5), 627–644.
33. Pavlopoulos GA, O’Donoghue SI, Satagopam VP, Soldatos TG, Pafilis E, et al.
(2008) Arena3D: visualization of biological networks in 3D. BMC Systems
Biology, 2, 104.
34. Enright AJ, Ouzounis CA (2001) BioLayout–an automatic graph layout
algorithm for similarity visualization. Bioinformatics, 17(9), 853–854.
35. Alvarez-Hamelin JI, Dall’Asta L, Barrat A, Vespignani A (2005) k-core
decomposition: A tool for the visualization of large scale networks. arXiv
preprint cs/0504107.
36. Auber D, Archambault D, Bourqui R, Lambert A, Mathiaut M, et al. (2012)
The tulip 3 framework: A scalable software library for information visualization
applications based on relational data.
37. Shannon P, Markiel A, Ozier O, Baliga NS, Wang JT, et al. (2003) Cytoscape: a
software environment for integrated models of biomolecular interaction
networks. Genome research, 13(11), 2498–2504.
38. Heer J, Boyd D (2005) Vizster: Visualizing online social networks. In
Information Visualization, 2005. INFOVIS 2005. IEEE Symposium on (32–
39). IEEE.
CollaborationViz: Interactive Network Visual Analytics
PLOS ONE | www.plosone.org 8 November 2014 | Volume 9 | Issue 11 | e111928